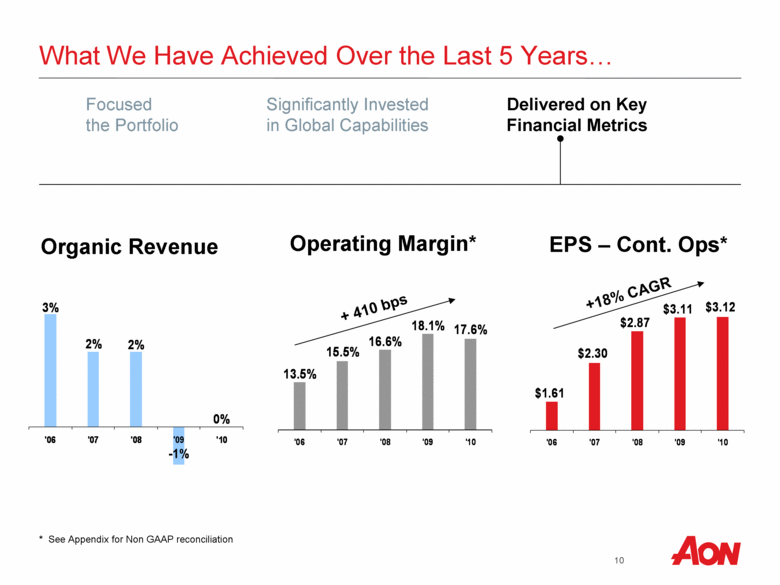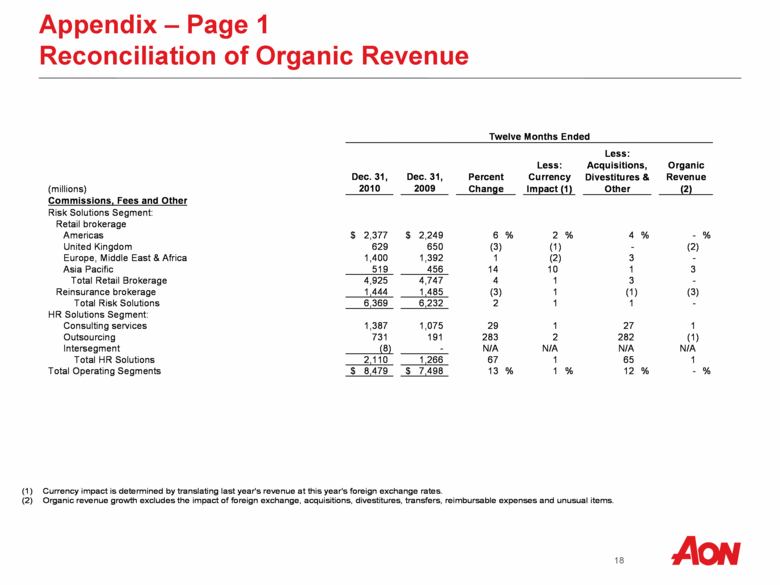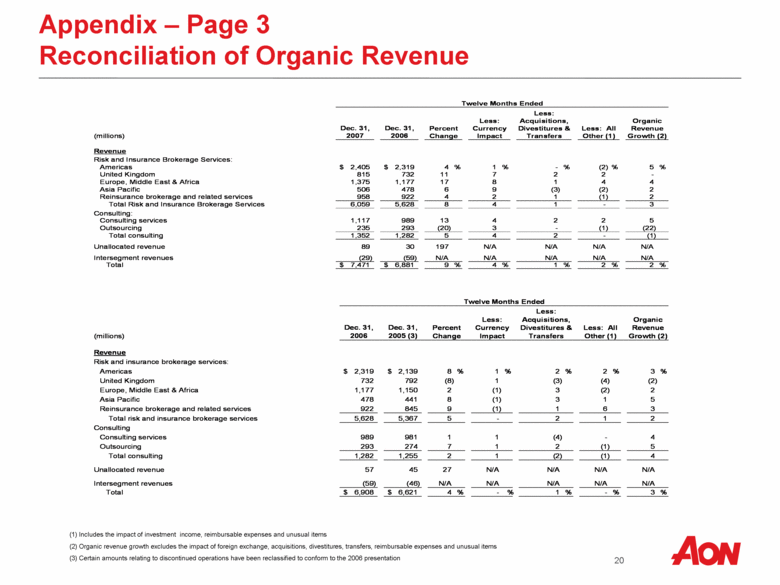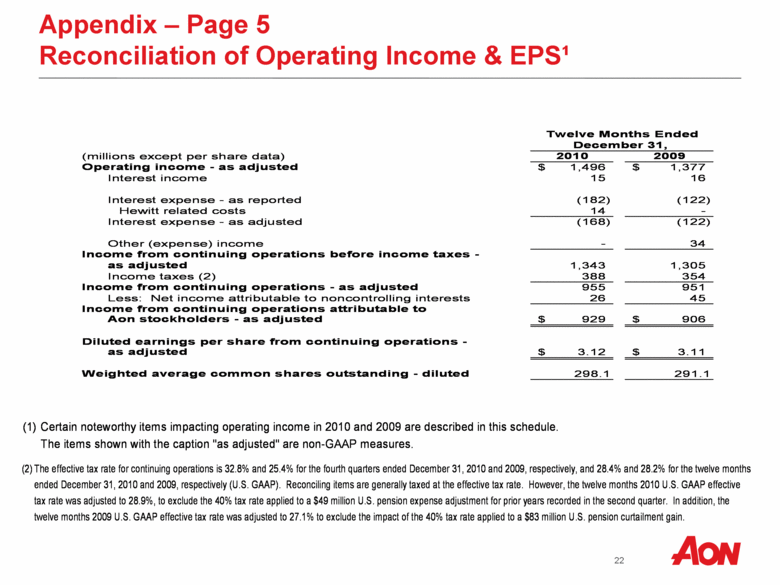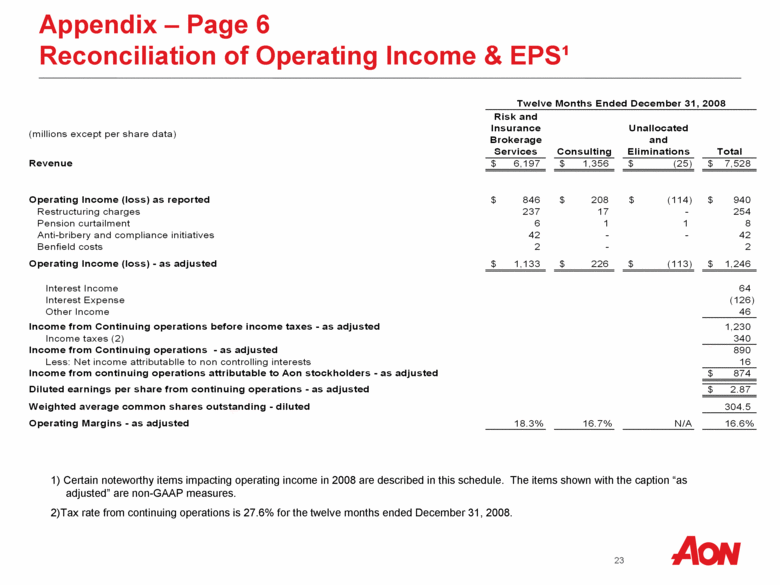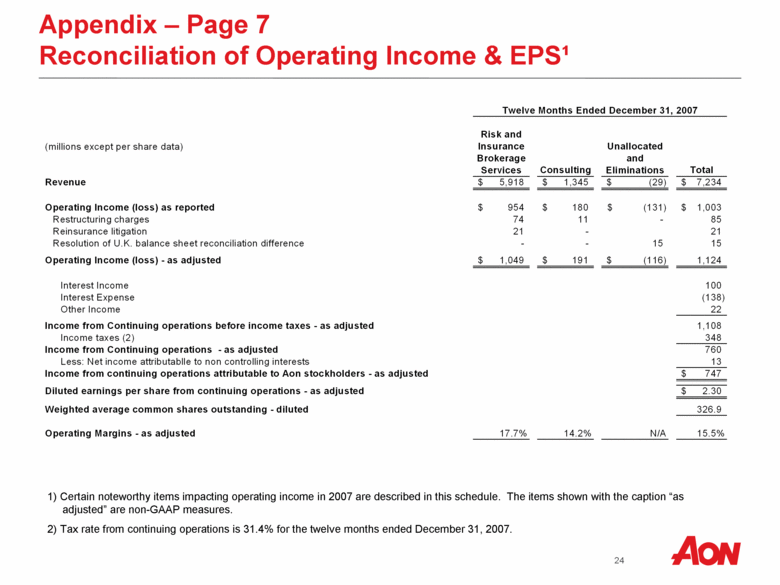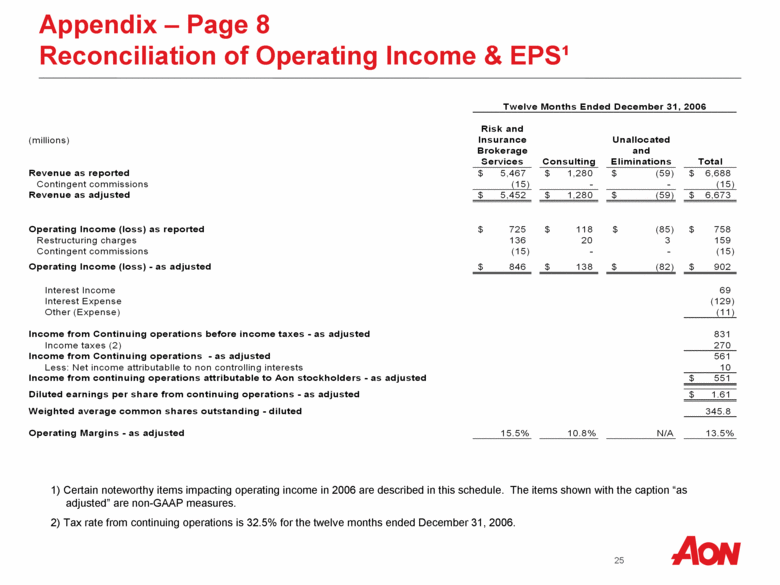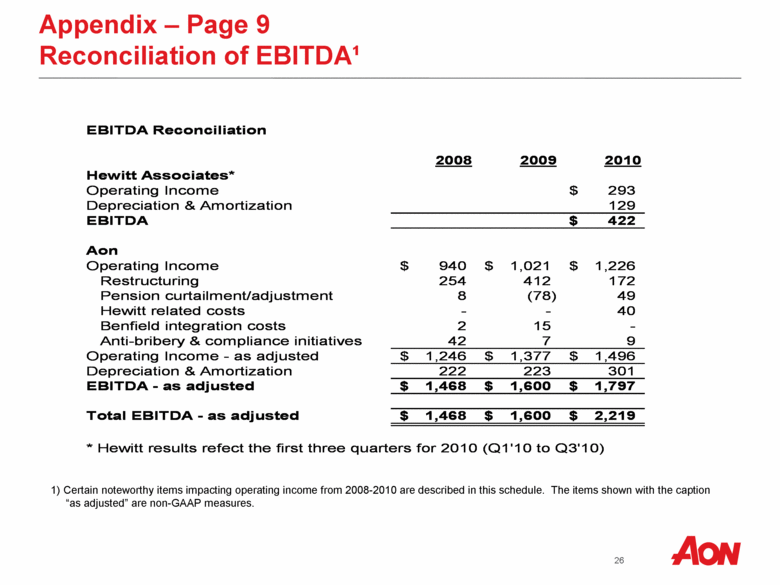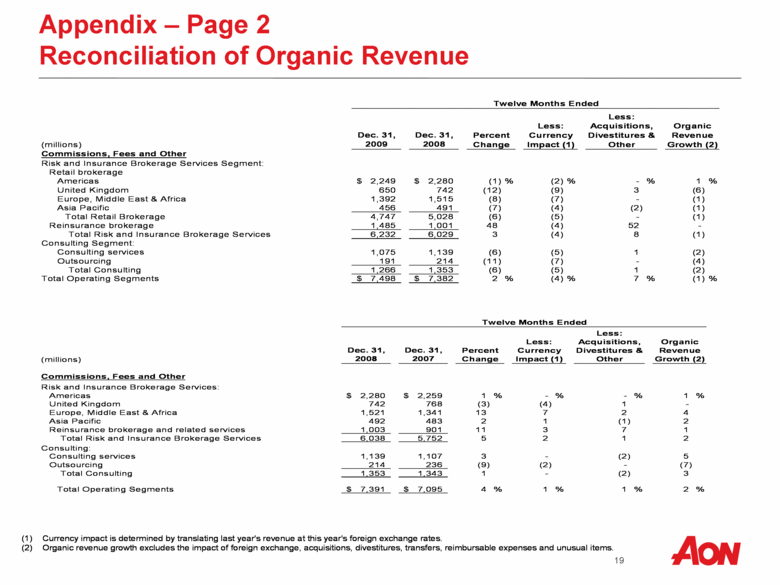
| Appendix – Page 2 Reconciliation of Organic Revenue (millions) Dec. 31, 2008 Dec. 31, 2007 Commissions, Fees and Other Risk and Insurance Brokerage Services: Americas 2,280 $ 2,259 $ 1 % - % - % 1 % United Kingdom 742 768 (3) (4) 1 - Europe, Middle East & Africa 1,521 1,341 13 7 2 4 Asia Pacific 492 483 2 1 (1) 2 Reinsurance brokerage and related services 1,003 901 11 3 7 1 Total Risk and Insurance Brokerage Services 6,038 5,752 5 2 1 2 Consulting: 1,139 1,107 3 - (2) 5 Outsourcing 214 236 (9) (2) - (7) Total Consulting 1,353 1,343 1 - (2) 3 Total Operating Segments 7,391 $ 7,095 $ 4 % 1 % 1 % 2 % Percent Change Consulting services Less: Currency Impact (1) Less: Acquisitions, Divestitures & Other Organic Revenue Growth (2) Twelve Months Ended (1) Currency impact is determined by translating last year's revenue at this year's foreign exchange rates. (2) Organic revenue growth excludes the impact of foreign exchange, acquisitions, divestitures, transfers, reimbursable expenses and unusual items. Twelve Months Ended Less: (millions) Commissions, Fees and Other Dec. 31, 2009 Dec. 31, 2008 Less: Currency Impact (1) Acquisitions, Divestitures & Other Percent Change Organic Revenue Growth (2) Risk and Insurance Brokerage Services Segment: Retail brokerage Americas 2,249 $ 2,280 $ (1) % (2) % - % 1 % United Kingdom 650 742 (12) (9) 3 (6) Europe, Middle East & Africa 1,392 1,515 (8) (7) - (1) Asia Pacific 456 491 (7) (4) (2) (1) Total Retail Brokerage 4,747 5,028 (6) (5) - (1) Reinsurance brokerage 1,485 1,001 48 (4) 52 - Total Risk and Insurance Brokerage Services 6,232 6,029 3 (4) 8 (1) Consulting Segment: Consulting services 1,075 1,139 (6) (5) 1 (2) Outsourcing 191 214 (11) (7) - (4) Total Consulting 1,266 1,353 (6) (5) 1 (2) Total Operating Segments 7,498 $ 7,382 $ 2 % (4) % 7 % (1) % |


