UNITED STATES
SECURITIES AND EXCHANGE COMMISSION
Washington, D.C. 20549
FORM N-CSR
CERTIFIED SHAREHOLDER REPORT OF REGISTERED
MANAGEMENT INVESTMENT COMPANIES
Investment Company Act file number | 811-3009 | |||||||
| ||||||||
Columbia Funds Trust II | ||||||||
(Exact name of registrant as specified in charter) | ||||||||
| ||||||||
One Financial Center, Boston, Massachusetts |
| 02111 | ||||||
(Address of principal executive offices) |
| (Zip code) | ||||||
| ||||||||
Vincent Pietropaolo, Esq. | ||||||||
(Name and address of agent for service) | ||||||||
| ||||||||
Registrant’s telephone number, including area code: | 1-617-772-3698 |
| ||||||
| ||||||||
Date of fiscal year end: | August 31, 2005 |
| ||||||
| ||||||||
Date of reporting period: | August 31, 2005 |
| ||||||
Form N-CSR is to be used by management investment companies to file reports with the Commission not later than 10 days after the transmission to stockholders of any report that is required to be transmitted to stockholders under Rule 30e-1 under the Investment Company Act of 1940 (17 CFR 270.30e-1). The Commission may use the information provided on Form N-CSR in its regulatory, disclosure review, inspection, and policymaking roles.
A registrant is required to disclose the information specified by Form N-CSR, and the Commission will make this information public. A registrant is not required to respond to the collection of information contained in Form N-CSR unless the Form displays a currently valid Office of Management and Budget ("OMB") control number. Please direct comments concerning the accuracy of the information collection burden estimate and any suggestions for reducing the burden to Secretary, Securities and Exchange Commission, 450 Fifth Street, NW, Washington, DC 20549-0609. The OMB has reviewed this collection of information under the clearance requirements of 44 U.S.C. § 3507.
Item 1. Reports to Stockholders.

Columbia
Greater China Fund
Annual Report
August 31, 2005
PRESIDENT'S MESSAGE
Columbia Greater China Fund
Table of Contents
| Fund Profile | 1 | ||||||
| Performance Information | 2 | ||||||
| Understanding Your Expenses | 3 | ||||||
| Economic Update | 4 | ||||||
| Portfolio Managers' Report | 5 | ||||||
| Investment Portfolio | 7 | ||||||
| Statement of Assets and Liabilities | 11 | ||||||
| Statement of Operations | 12 | ||||||
| Statements of Changes in Net Assets | 13 | ||||||
| Notes to Financial Statements | 15 | ||||||
| Financial Highlights | 22 | ||||||
| Report of Independent Registered Public Accounting Firm | 26 | ||||||
| Unaudited Information | 27 | ||||||
| Trustees | 28 | ||||||
| Officers | 30 | ||||||
| Columbia Funds | 31 | ||||||
| Important Information About This Report | 33 | ||||||
Dear Shareholder:
Columbia Management, the asset management division of Bank of America, is in the final stages of a significant business integration effort. Over the last year, we have been integrating various components of the Nations Funds, Galaxy Funds and Columbia Funds, which will result in a single fund family that covers a wide range of markets, sectors and asset classes. Our team of talented, seasoned investment professionals will continue to strive to achieve strong results within their investment categories. Our objective is not only to provide our shareholders with the best products but also to enhance the breadth and availability of our services. Given our ability to now leverage the size and scale of the Columbia Management business, I am pleased that these efforts will also result in substantial cost savings to the funds.
Our goal is to create a more simplified, clearly delineated product line. Through thoughtful project planning and execution, we will initially reduce the number of retail mutual funds from over 140 to fewer than 90. Earlier this year several fund mergers and liquidations were successfully completed. As we work to complete the remaining product and service provider consolidations in the coming months, we remain committed to building a mutual fund business that meets, and hopefully exceeds, your desire for personal financial solutions.We will continue to strive for the highest standards of performance and service excellence. The asset management business is in a time of transformation and we are committed to being progressive and innovative in our approach to the business.We value the confidence you have placed in us to assist you in managing your funds during these changing times. As with all businesses within Bank of America, we understand that your trust must be continuously earned and will remain focused on producing results for you.
In the pages that follow, you'll find a discussion of the economic environment during the period followed by a detailed report from the fund's manager or managers on key factors that influenced performance. We encourage you to read the manager reports carefully and discuss any questions you have with your financial advisor. As always, we thank you for choosing Columbia Management.We look forward to helping you keep your long-term financial goals on target in the years to come.
Sincerely,

Christopher L. Wilson
Head of Mutual Funds, Columbia Management
Christopher L. Wilson is Head of Mutual Funds for Columbia Management, responsible for the day-to-day delivery of mutual fund services to the firm's investors.With the exception of distribution, Chris oversees all aspects of the mutual fund services operation, including treasury, investment accounting and shareholder and broker services. Chris serves as President of Columbia Funds, President & CEO of Nations Funds and President of Galaxy Funds. Chris joined Bank of America in August 2004.

The views expressed in the President's Message and Portfolio Managers' Report reflect the current views of the respective parties. These views are not guarantees of future performance and involve certain risks, uncertainties and assumptions that are difficult to predict so actual outcomes and results may differ significantly from the views expressed. These views are subject to change at any time based upon economic, market or other conditions and the respective parties disclaim any responsibility to update such views. These views may not be relied on as investment advice and, because investment decisions for a Columbia Fund are based on numerous factors, may not be relied on as an indication of trading intent on behalf of any particular Columbia Fund. References to specific company securities should not be construed as a recommendation or investment advice.
Not FDIC
Insured
May Lose Value
No Bank Guarantee
FUND PROFILE
Columbia Greater China Fund
The information below gives you a snapshot of your fund at the end of the reporting period. Your fund is actively managed, and the composition of its portfolio will change over time.
Top 10 holdings as of 08/31/05 (%)
| China Mobile Hong Kong | 12.1 | ||||||
| PetroChina | 5.5 | ||||||
| Cosco Pacific | 4.4 | ||||||
| China Merchants Holdings International | 4.2 | ||||||
| CNOOC | 4.0 | ||||||
| Sun Hung Kai Properties | 3.8 | ||||||
| China Telecom | 3.5 | ||||||
| Taiwan Semiconductor Manufacturing | 3.5 | ||||||
| Chinatrust Financial Holding | 3.1 | ||||||
| Hutchison Whampoa | 3.1 | ||||||
Top 5 sectors as of 08/31/05 (%)
| Industrials | 19.2 | ||||||
| Financials | 19.1 | ||||||
| Telecommunication services | 16.9 | ||||||
| Energy | 12.9 | ||||||
| Information technology | 11.6 | ||||||
Performance data quoted represents past performance and current performance may be lower or higher. Past performance is no guarantee of future results. The investment return and principal value will fluctuate so that shares, when redeemed, may be worth more or less than the original cost. Please visit www.columbiafunds.com for daily and most recent month-end performance updates.
Summary
n For the 12-month period ended August 31, 2005, the fund's class A shares returned 20.66% without sales charge.
n Continued economic growth in China and the re-inflation of the Hong Kong economy helped the fund, its benchmark and peer group achieve double-digit returns.
n A focus on companies that should benefit from infrastructure development and increased consumer spending helped the fund's performance. A below-index weight in energy and telecommunications stocks detracted from the fund's return relative to its benchmark.
Class A shares | MSCI China Index | ||||||
| 20.66 | % | 28.59 | % | ||||
The Morgan Stanley Capital International (MSCI) China Index is designed to broadly and fairly represent the full diversity of business activities in China.
Objective
Seeks long-term growth
of capital by investing primarily in equity securities of companies located in the greater
China Region
Total net assets
$89.5 million
Management style
Sector breakdown and portfolio holdings are calculated as a percentage of net assets.
Management style is determined by Columbia Management and is based on the investment strategy and process as outlined in the fund's prospectus.
1
PERFORMANCE INFORMATION
Columbia Greater China Fund
Performance of a $10,000 investment
05/16/97 – 08/31/05 ($)
| sales charge: | without | with | |||||||||
| Class A | 19,308 | 18,198 | |||||||||
| Class B | 18,253 | 18,253 | |||||||||
| Class C | 18,496 | 18,496 | |||||||||
| Class Z | 20,251 | n/a | |||||||||
Performance data quoted represents past performance and current performance may be lower or higher. Past performance is no guarantee of future results. The investment return and principal value will fluctuate so that shares, when redeemed, may be worth more or less than the original cost. Please visit www.columbiafunds.com for daily and most recent month-end performance updates.
Growth of a $10,000 investment 05/16/97 – 08/31/05
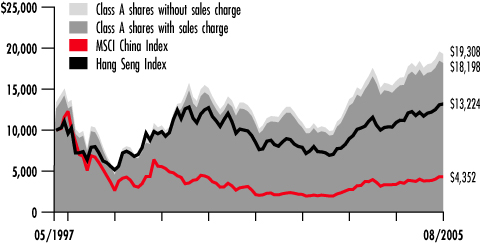
The chart above shows the growth in value of a hypothetical $10,000 investment in Class A shares of Columbia Greater China Fund during the stated time period, and does not reflect the deduction of taxes that a shareholder would pay on fund distributions or the redemption of fund shares. The Morgan Stanley Capital International (MSCI) China Index is designed to broadly and fairly represent the full diversity of business activities in China. This index aims to capture 85% of the free float adjusted market capitalization in each industry group. The Hang Seng Stock Index is an unmanaged index that tracks the performance of approximately 70% of the total market capitalization of the stock exchange of Hong Kong. Unlike the fund, indices are not investments, they do not incur fees or expenses and are not professionally managed. It is not possible to invest directly in an index. Securities in the fund may not match those in an index. Shares of the Columbia Greater China Fund were offered during a subscription period that began June 20, 199 7 and ended July 25, 1997. The subscription proceeds were invested into the fund on July 25, 1997. The fund's performance returns are calculated from its inception date of May 16, 1997. Index performance is from May 31, 1997.
Average annual total return as of 08/31/05 (%)
| Share class | A | B | C | Z | |||||||||||||||||||||||||||
| Inception | 05/16/97 | 05/16/97 | 05/16/97 | 05/16/97 | |||||||||||||||||||||||||||
| Sales charge | without | with | without | with | without | with | without | ||||||||||||||||||||||||
| 1-year | 20.66 | 13.72 | 19.77 | 14.77 | 19.75 | 18.75 | 21.00 | ||||||||||||||||||||||||
| 5-year | 4.95 | 3.71 | 4.17 | 3.83 | 4.15 | 4.15 | 5.76 | ||||||||||||||||||||||||
| Life | 8.26 | 7.49 | 7.53 | 7.53 | 7.70 | 7.70 | 8.88 | ||||||||||||||||||||||||
Average annual total return as of 06/30/05 (%)
| Share class | A | B | C | Z | |||||||||||||||||||||||||||
| Sales charge | without | with | without | with | without | with | without | ||||||||||||||||||||||||
| 1-year | 19.21 | 12.36 | 18.37 | 13.37 | 18.38 | 17.38 | 19.52 | ||||||||||||||||||||||||
| 5-year | 4.49 | 3.26 | 3.70 | 3.36 | 3.68 | 3.68 | 5.28 | ||||||||||||||||||||||||
| Life | 8.01 | 7.22 | 7.28 | 7.28 | 7.46 | 7.46 | 8.64 | ||||||||||||||||||||||||
The "with sales charge" returns include the maximum initial sales charge of 5.75% for class A shares and maximum contingent deferred sales charge of 5.00% for class B shares and 1.00% for class C shares for the first year only. The "without sales charge" returns do not include the effect of sales charges. If they had, returns would be lower.
Performance results reflect any voluntary waivers or reimbursement of fund expenses by the advisor or its affiliates. Absent these waivers or reimbursement arrangements, performance results would have been lower.
All results shown assume reinvestment of distributions. Class Z shares are sold at net asset value with no Rule 12b-1 fees. Class Z shares have limited eligibility and the investment minimum requirement may vary. Please see the fund's prospectus for details.
Performance for different share classes will vary based on differences in sales charges and fees associated with each class.
2
UNDERSTANDING YOUR EXPENSES
Columbia Greater China Fund
Estimating your actual expenses
To estimate the expenses that you paid over the period, first you will need your account balance at the end of the period:
n For shareholders who receive their account statements from Columbia Management Services, Inc., your account balance is available online at www.columbiafunds.com or by calling Shareholder Services at 800.345.6611
n For shareholders who receive their account statements from their brokerage firm, contact your brokerage firm to obtain your account balance
1. Divide your ending account balance by $1,000. For example, if an account balance was $8,600 at the end of the period, the result would be 8.6
2. In the section of the table below titled "Expenses paid during the period," locate the amount for your share class. You will find this number is in the column labeled "actual." Multiply this number by the result from step 1. Your answer is an estimate of the expenses you paid on your account during the period
03/01/05 – 08/31/05
| Account value at the | Account value at the | Expenses paid | Fund's annualized | ||||||||||||||||||||||||||||
| beginning of the period ($) | end of the period ($) | during the period ($) | expense ratio (%) | ||||||||||||||||||||||||||||
| Actual | Hypothetical | Actual | Hypothetical | Actual | Hypothetical | ||||||||||||||||||||||||||
| Class A | 1,000.00 | 1,000.00 | 1,045.97 | 1,016.38 | 9.02 | 8.89 | 1.75 | ||||||||||||||||||||||||
| Class B | 1,000.00 | 1,000.00 | 1,042.29 | 1,012.60 | 12.87 | 12.68 | 2.50 | ||||||||||||||||||||||||
| Class C | 1,000.00 | 1,000.00 | 1,042.60 | 1,012.60 | 12.87 | 12.68 | 2.50 | ||||||||||||||||||||||||
| Class Z | 1,000.00 | 1,000.00 | 1,047.39 | 1,017.64 | 7.74 | 7.63 | 1.50 | ||||||||||||||||||||||||
Expenses paid during the period are equal to the fund's annualized expense ratio, multiplied by the average account value over the period, then multiplied by the number of days in the fund's most recent fiscal half-year and divided by 365.
It is important to note that the expense amounts shown in the table are meant to highlight only ongoing costs of investing in the fund and do not reflect any transactional costs, such as sales charges, redemption or exchange fees. Therefore, the hypothetical examples provided will not help you determine the relative total costs of owning shares of different funds. If these transactional costs were included, your costs would have been higher.
As a fund shareholder, you incur two types of costs. There are transaction costs, which generally include sales charges on purchases and may include redemption or exchange fees. There are also ongoing costs, which generally include investment advisory, Rule 12b-1 fees and other fund expenses. The information on this page is intended to help you understand your ongoing costs of investing in the fund and to compare these costs with the ongoing costs of investing in other mutual funds.
Analyzing your fund's expenses by share class
To illustrate these ongoing costs, we have provided an example and calculated the expenses paid by investors in each share class during the reporting period. The information in the following table is based on an initial investment of $1,000, which is invested at the beginning of the reporting period and held for the entire period. Expense information is calculated two ways and each method provides you with different information. The amount listed in the "actual" column is calculated using the fund's actual operating expenses and total return for the period. The amount listed in the "hypothetical" column for each share class assumes that the return each year is 5% before expenses and includes the fund's actual expense ratio. You should not use the hypothetical account values and expenses to estimate either your actual account balance at the end of the period or the expenses you paid during this reportin g period.
Compare with other funds
Since all mutual funds are required to include the same hypothetical calculations about expenses in shareholder reports, you can use this information to compare the ongoing cost of investing in the fund with other funds. To do so, compare the 5% hypothetical example with the 5% hypothetical examples that appear in the shareholder reports of other funds. As you compare hypothetical examples of other fund companies, it is important to note that hypothetical examples are meant to highlight the continuing cost of investing in a fund and do not reflect any transactional costs, such as sales charges or redemption or exchange fees.
3
ECONOMIC UPDATE
Columbia Greater China Fund
Summary:
For the 12-month period ended August 31, 2005
n Strong economic growth helped China's stock market generate double-digit gains. The MSCI China Index returned 28.59%.
n Hong Kong stocks, as measured by the Hang Seng Index, gained 20.78%.
n The pace of investment activity in China and the direction of energy prices are expected to be key factors in economic and market performance in 2005.
| MSCI China Index | Hang Seng Index | ||||||
| 28.59 | % | 20.78 | % | ||||
The Morgan Stanley Capital International (MSCI) China Index is designed to broadly and fairly represent the full diversity of business activities in China. This index aims to capture 85% of the free float adjusted market capitalization in each industry group.
The Hang Seng Stock Index is an unmanaged index that tracks the performance of approximately 70% of the total market capitalization of the stock exchange of Hong Kong.
The MSCI All Country Asia ex Japan Index is an unmanaged index that tracks the performance of equity securities in eleven countries in Asia, excluding Japan, and takes into account local market restrictions on share ownership by foreigners.
While the global economy appears to be on track to grow at a rate of 4.3% in 2005, most of greater China has been growing at a faster pace. Mainland China has expanded at an estimated annualized rate of 9.5% for the 12-month period from September 1, 2004, through August 31, 2005. Hong Kong's economy grew at a rate of 6.8%. The pace of economic growth in Taiwan has tracked well below mainland China and Hong Kong, at approximately 3.0%.
Stock markets record strong gains
In general, strong economic growth continued to translate into substantial gains for the region's stock markets. The MSCI China Index rose 28.59% for the 12-month period. Hong Kong stocks returned 20.78%, as measured by the Hang Seng Index. The MSCI All Country Asia ex Japan Index, which measures a wider range of markets, including the smaller and emerging markets of Southeast Asia, rose 28.63% for the period.
China switched gears
During the period, China's exports and domestic consumption kept up their fast pace of growth. China's government continued to take steps to address concerns about the rapid pace of investment growth, but economic statistics indicated that it has recently adopted a more neutral economic policy with an emphasis on balanced growth. Although steps to revalue its currency in July 2005 are not likely to have any material immediate impact on China's economy, the currency's gradual appreciation should provide further support for its consumption-oriented economic growth.
Exports fueled growth in Hong Kong
The pace of economic growth in Hong Kong quickened in the last three months of the period compared to the same period one year ago. Hong Kong's exports rose an estimated 8.1% while private consumption growth started to pick up. Business investment in the region was also strong. Hong Kong's Census and Statistics Department reports show that real estate has made something of a comeback, reflecting relatively low lending rates.
Domestic spending helped Taiwan advance
A relatively low unemployment rate helped Taiwan's economy bounce back from a weak start in 2005. Domestic consumption increased at twice the pace of export growth, which fell sharply in the second half of this reporting period. A weak technology sector accounted for the lackluster export figures for this technology-dependent economy. Rising energy prices have also figured into Taiwan's subdued growth, since Taiwan imports nearly all of its oil.
Looking ahead
For mainland China, concerns persist regarding the level of investment activity in the country's business sector. In Hong Kong, the economic trend appears to be positive, especially with the potential for the newly-opened Disney theme park to boost tourism. In Taiwan, energy prices remain a big question mark going forward. If higher commodity prices push domestic goods prices higher, consumers could pull back on spending. Since consumer spending was the linchpin of economic growth in the first half of 2005, it could take an upturn in the technology sector to offset the impact of higher energy prices.
Past performance is no guarantee of future results.
4
PORTFOLIO MANAGERS' REPORT
Columbia Greater China Fund
Performance data quoted represents past performance and current performance may be lower or higher. Past performance is no guarantee of future results. The investment return and principal value will fluctuate so that shares, when redeemed, may be worth more or less than the original cost. Please visit www.columbiafunds.com for daily and most recent month-end performance updates.
Net asset value per share
as of 08/31/05 ($)
| Class A | 24.68 | ||||||
| Class B | 24.11 | ||||||
| Class C | 24.43 | ||||||
| Class Z | 25.59 | ||||||
Distributions declared per share
09/01/04 – 08/31/05 ($)
| Class A | 0.21 | ||||||
| Class B | 0.06 | ||||||
| Class C | 0.06 | ||||||
| Class Z | 0.26 | ||||||
Holdings discussed in this report
as of 08/31/05 (%)
| China Mobile Hong Kong | 12.1 | ||||||
| PetroChina | 5.5 | ||||||
| CNOOC | 4.0 | ||||||
| China Merchants Holdings International | 4.2 | ||||||
| Shanghai Electric Group | 2.0 | ||||||
| Shenzhen Chiwan Wharf Holdings | 0.5 | ||||||
| Hutchison Whampoa | 3.1 | ||||||
| Li & Fung | 2.6 | ||||||
| Esprit Holdings | 2.6 | ||||||
| Swire Pacific | 2.0 | ||||||
| Sun Hung Kai Properties | 3.8 | ||||||
| Henderson Land Development | 2.0 | ||||||
Your fund is actively managed and the composition of its portfolio will change over time. Information provided is calculated as a percentage of net assets.
For the 12-month period ended August 31, 2005, class A shares of Columbia Greater China Fund returned 20.66% without sales charge. This was less than the 28.59% return of the MSCI China Index, the fund's benchmark. The fund's return was in line with the 20.78% return of the Hang Seng Stock Index, an index that tracks the performance of Hong Kong stocks, which are not included in the MSCI China Index. The fund outperformed the 17.83% average of its peer group, the Lipper China Region Funds Category.1
Energy and telecommunications stocks were top contributors
Energy and telecommunications were two of the largest contributors to the fund's absolute return. We added to the fund's energy and telecommunications stocks, the two largest sector components of the MSCI China Index. This turned out to be a good move, as the energy and telecommunications sectors rose approximately 50% each during the 12-month period. However, the fund's exposure to both sectors was lower than their weight in the MSCI China Index, which accounted for some of its shortfall compared to that benchmark.
The fund's relative return was also affected by its positions in Hong Kong and Taiwan, which underperformed China's stock market. China benefited by the prospects of a more flexible currency, especially in the last months of the period after China's government widened the yuan's trading band against the US dollar. However, we believe that the fund's positions outside mainland China provided an important element of diversification for the fund as well as potential longer-term opportunities.
Domestic consumption and infrastructure development fueled China's economy
We believe that rising consumer spending and the build-out of the infrastructure are likely to have a positive impact on economic growth in China over the long term. In response, we have added to positions that should benefit from these trends. We doubled our weight in China Mobile Hong Kong, the dominant company in China's telecommunications industry. The company was a top contributor to performance. We boosted investments in energy companies, such as PetroChina and CNOOC, for two reasons: 1) China's robust demand for energy to fuel its economic growth and 2) oil prices have continued to rise due to a structural change in its supply/demand dynamics. Both stocks aided the fund's results.
Industrial stocks made up a substantial portion of the fund, and certain companies were helpful. China Merchants Holdings International, a port operator, and Shanghai Electric Group a diversified industrial equipment manufacturer, benefited from China's continued economic expansion. These gains were more than enough to offset minor disappointments from Shenzhen Chiwan Wharf Holdings and Johnson Electric, both of which lost ground during the period. We sold our position in Johnson Electric.
The substantial return of the MSCI China Index masked a serious problem of deteriorating profitability in many other sectors, such as aviation and raw materials, including cement, steel and aluminum, in which we did not invest. We reduced exposure to utility companies, as rising oil and coal prices began to erode profit margins.
Hong Kong real estate and consumer companies were attractive
In Hong Kong, we focused on companies that offered growth potential either in Asia or around the world. For example, we invested in Hutchison Whampoa, which rose by 30%. The company's 3G mobile phone business turned around in Europe and its global port operation experienced strong traffic. Li & Fung, a global supplier of consumer products, rose more than 50% and Esprit Holdings, which is expanding into Europe, gained more than 61% for the fund. As economic growth and domestic demand picked up in Hong Kong, selected real estate companies, such as Swire Pacific, performed well. However, Sun Hung Kai Properties and Henderson Land Development lagged due to concerns about rising interest rates.
Technology investments in Taiwan were mixed
Early in the period, we built a position in technology companies in Taiwan, as valuations were attractive after a difficult 2004. The technology sector turned out to be more volatile than we expected, and investments in the sector produced mixed returns. As a result, we are re-assessing investments in Taiwan.
1 Lipper Inc., a widely respected data provider in the industry, calculates an average total return (assuming reinvestment of distributions) for mutual funds with investment objectives similar to those of the fund. Lipper makes no adjustment for the effect of sales loads.
5
Columbia Greater China Fund
We plan to continue to focus on companies with the potential to benefit from the domestic consumption and infrastructure development trends that are in place in China.
Steady economic growth should benefit China and Hong Kong
We plan to continue to focus on companies with the potential to benefit from the domestic consumption and infrastructure development trends that are in place in China. Over the long term, we believe that China's more flexible currency policy will support these trends. In Hong Kong, we think that the opening of a local Disneyland and the rise in the consumer price index are indicative of an economy that has recovered from a period of deflation. Increased demand for consumer goods and services should continue to underpin the Hong Kong economy. We are comfortable with our selective exposure to the Hong Kong real estate sector in a relatively low real interest rate environment. However, rising US interest rates are likely to be a headwind for this sector in the near term. Taiwan is struggling, primarily because much of its economy is tied to the global technology market. As mentioned above, we are re-e valuating our strategy in Taiwan.
Eric Sandlund has managed Columbia Greater China Fund since March 2004 and has been with the advisor and its predecessors or affiliate organizations since June 2002. Effective September 30, 2005, Eric Sandlund is no longer the portfolio manager of this fund.

Penny L. Burgess has co-managed the fund since May 2005. Ms. Burgess has been with the advisor and its predecessors or affiliate organizations since November 1993.

Deborah F. Snee has co-managed the fund since May 2005. Ms. Snee has been with the advisor and its predecessors or affiliate organizations since March 1999.

Jasmine Huang has co-managed the fund since May 2005. Ms. Huang has been with the advisor and its predecessors or affiliate organizations since September 2003.

Equity investments are affected by stock market fluctuations that occur in response to economic and business developments.
International investing may involve certain risks, including foreign taxation, currency fluctuations, risks associated with possible differences in financial standards and other monetary and political risks. A portfolio of stocks from a single region poses additional risks due to limited diversification.
Some of the countries the fund invests in are considered emerging economies, which means there may be greater risks associated with investing there than in more developed countries. In addition, concentration of investments in a single region may result in greater volatility.
6
INVESTMENT PORTFOLIO
August 31, 2005 Columbia Greater China Fund
Common Stocks – 94.1%
| CONSUMER DISCRETIONARY – 6.9% | Shares | Value ($) | |||||||||||||
| Distributors – 4.3% | China Resources Enterprise Ltd. | 948,000 | 1,527,344 | ||||||||||||
| Li & Fung Ltd. | 1,136,000 | 2,302,820 | |||||||||||||
| Distributors Total | 3,830,164 | ||||||||||||||
| Specialty Retail – 2.6% | Esprit Holdings Ltd. | 315,000 | 2,324,948 | ||||||||||||
| Specialty Retail Total | 2,324,948 | ||||||||||||||
| CONSUMER DISCRETIONARY TOTAL | 6,155,112 | ||||||||||||||
| CONSUMER STAPLES – 2.6% | |||||||||||||||
| Beverages – 1.1% | Dynasty Fine Wines Group Ltd. (a) | 2,490,000 | 966,431 | ||||||||||||
| Beverages Total | 966,431 | ||||||||||||||
| Food & Staples Retailing – 0.4% | Convenience Retail Asia Ltd. | 1,176,000 | 359,388 | ||||||||||||
| Food & Staples Retailing Total | 359,388 | ||||||||||||||
| Food Products – 1.1% | China Mengniu Dairy Co., Ltd. | 1,311,000 | 1,031,055 | ||||||||||||
| Food Products Total | 1,031,055 | ||||||||||||||
| CONSUMER STAPLES TOTAL | 2,356,874 | ||||||||||||||
| ENERGY – 12.9% | |||||||||||||||
| Oil, Gas & Consumable Fuels – 12.9% | China Shenhua Energy Co., Ltd., Class H (a) | 1,531,000 | 1,702,134 | ||||||||||||
| CNOOC Ltd. | 4,991,500 | 3,590,689 | |||||||||||||
| PetroChina Co., Ltd., Class H (b) | 6,378,000 | 4,924,114 | |||||||||||||
| Yanzhou Coal Mining Co., Ltd., Class H | 1,801,600 | 1,331,641 | |||||||||||||
| Oil, Gas & Consumable Fuels Total | 11,548,578 | ||||||||||||||
| ENERGY TOTAL | 11,548,578 | ||||||||||||||
| FINANCIALS – 19.1% | |||||||||||||||
| Commercial Banks – 4.8% | Chinatrust Financial Holding Co., Ltd. | 2,990,283 | 2,787,977 | ||||||||||||
| Dah Sing Financial Group | 224,800 | 1,479,292 | |||||||||||||
| Commercial Banks Total | 4,267,269 | ||||||||||||||
| Consumer Finance – 0.9% | Aeon Credit Service Co., Ltd. | 524,000 | 397,499 | ||||||||||||
| JCG Holdings Ltd. | 424,000 | 437,053 | |||||||||||||
| Consumer Finance Total | 834,552 | ||||||||||||||
| Diversified Financial Services – 0.7% | Guoco Group Ltd. | 63,000 | 628,728 | ||||||||||||
| Diversified Financial Services Total | 628,728 | ||||||||||||||
| Insurance – 3.1% | Cathay Financial Holding Co., Ltd. | 1,143,000 | 2,143,120 | ||||||||||||
| China Insurance International Holdings Co., Ltd. (a) | 1,726,000 | 584,798 | |||||||||||||
| Insurance Total | 2,727,918 | ||||||||||||||
| Real Estate – 9.6% | Cheung Kong Holdings Ltd. | 114,000 | 1,240,982 | ||||||||||||
| Henderson Land Development Co., Ltd. | 360,000 | 1,799,442 | |||||||||||||
| Shanghai Forte Land Co., Ltd. , Class H | 1,522,000 | 452,822 | |||||||||||||
| Sun Hung Kai Properties Ltd. | 332,000 | 3,364,868 | |||||||||||||
| Swire Pacific Ltd., Class A | 185,000 | 1,762,828 | |||||||||||||
| Real Estate Total | 8,620,942 | ||||||||||||||
| FINANCIALS TOTAL | 17,079,409 | ||||||||||||||
See Accompanying Notes to Financial Statements.
7
August 31, 2005 Columbia Greater China Fund
Common Stocks – (continued)
| HEALTH CARE – 0.0% | Shares | Value ($) | |||||||||||||
| Health Care Equipment & Supplies – 0.0% | Pihsiang Machinery Manufacturing Co., Ltd. | 165 | 321 | ||||||||||||
| Health Care Equipment & Supplies Total | 321 | ||||||||||||||
| HEALTH CARE TOTAL | 321 | ||||||||||||||
| INDUSTRIALS – 19.2% | |||||||||||||||
| Electrical Equipment – 2.0% | Shanghai Electric Group Co., Ltd., (a) | 5,860,000 | 1,789,935 | ||||||||||||
| Electrical Equipment Total | 1,789,935 | ||||||||||||||
| Industrial Conglomerates – 3.1% | Hutchison Whampoa Ltd. | 278,200 | 2,750,007 | ||||||||||||
| Industrial Conglomerates Total | 2,750,007 | ||||||||||||||
| Transportation Infrastructure – 14.1% | Anhui Expressway Co., Ltd., Class H | 1,442,000 | 861,110 | ||||||||||||
| China Merchants Holdings International Co., Ltd. | 1,778,000 | 3,760,366 | |||||||||||||
| Cosco Pacific Ltd. | 1,986,000 | 3,942,906 | |||||||||||||
| Jiangsu Expressway Co., Ltd., Class H | 2,198,000 | 1,151,643 | |||||||||||||
| Shenzhen Chiwan Wharf Holdings Ltd., Class B | 267,389 | 444,655 | |||||||||||||
| Zhejiang Expressway Co., Ltd., Class H | 3,628,000 | 2,460,526 | |||||||||||||
| Transportation Infrastructure Total | 12,621,206 | ||||||||||||||
| INDUSTRIALS TOTAL | 17,161,148 | ||||||||||||||
| INFORMATION TECHNOLOGY – 11.6% | |||||||||||||||
| Computers & Peripherals – 4.3% | Acer, Inc. | 1,259,896 | 2,398,334 | ||||||||||||
| Lite-On Technology Corp. | 1,375,706 | 1,425,903 | |||||||||||||
| Computers & Peripherals Total | 3,824,237 | ||||||||||||||
| Electronic Equipment & Instruments – 3.9% | Hon Hai Precision Industry Co., Ltd. | 477,226 | 2,468,801 | ||||||||||||
| Synnex Technology International Corp. | 879,670 | 1,046,949 | |||||||||||||
| Electronic Equipment & Instruments Total | 3,515,750 | ||||||||||||||
| Semiconductors & Semiconductor Equipment – 3.4% | Taiwan Semiconductor Manufacturing Co., Ltd. | 1,867,469 | 3,091,173 | ||||||||||||
| Semiconductors & Semiconductor Equipment Total | 3,091,173 | ||||||||||||||
| INFORMATION TECHNOLOGY TOTAL | 10,431,160 | ||||||||||||||
| TELECOMMUNICATION SERVICES – 16.9% | |||||||||||||||
| Communications Equipment – 0.4% | Comba Telecom Systems Holdings Ltd. | 1,058,000 | 313,976 | ||||||||||||
| Communications Equipment Total | 313,976 | ||||||||||||||
| Diversified Telecommunication Services – 3.5% | China Telecom Corp., Ltd., Class H | 8,388,000 | 3,130,396 | ||||||||||||
| Diversified Telecommunication Services Total | 3,130,396 | ||||||||||||||
| Wireless Telecommunication Services – 13.0% | China Mobile Hong Kong Ltd. | 2,484,000 | 10,800,705 | ||||||||||||
| Taiwan Mobile Co., Ltd. | 917,000 | 855,032 | |||||||||||||
| Wireless Telecommunication Services Total | 11,655,737 | ||||||||||||||
| TELECOMMUNICATION SERVICES TOTAL | 15,100,109 | ||||||||||||||
| UTILITIES – 4.9% | |||||||||||||||
| Gas Utilities – 3.9% | Hong Kong & China Gas Co., Ltd. | 952,304 | 1,913,951 | ||||||||||||
| Xinao Gas Holdings Ltd. | 2,292,000 | 1,607,549 | |||||||||||||
| Gas Utilities Total | 3,521,500 | ||||||||||||||
See Accompanying Notes to Financial Statements.
8
August 31, 2005 Columbia Greater China Fund
Common Stocks – (continued)
| UTILITIES – (continued) | Shares | Value ($) | |||||||||||||
| Independent Power Producers & Energy Traders – 1.0% | Datang International Power Generation Co., Ltd., Class H | 1,190,000 | 891,251 | ||||||||||||
| Independent Power Producers & Energy Traders Total | 891,251 | ||||||||||||||
| UTILITIES TOTAL | 4,412,751 | ||||||||||||||
| Total Common Stocks (cost of $61,126,781) | 84,245,462 | ||||||||||||||
| Short-Term Obligation – 1.7% | Par ($) | ||||||||||||||
| Repurchase agreement with State Street Bank & Trust Co., dated 08/31/05, due 09/01/05 at 3.430%, collateralized by a U.S. Treasury Bond maturing 05/15/17, market value of $1,592,581 (repurchase proceeds $1,556,148) | 1,556,000 | 1,556,000 | |||||||||||||
| Total Short-Term Obligation (cost of $1,556,000) | 1,556,000 | ||||||||||||||
| Total Investments – 95.8% (cost of $62,682,781)(c) | 85,801,462 | ||||||||||||||
| Other Assets & Liabilities, Net – 4.2% | 3,718,097 | ||||||||||||||
| Net Assets – 100.0% | 89,519,559 | ||||||||||||||
Notes to Investment Portfolio:
(a) Non-income producing security.
(b) Represents fair value as determined in good faith under procedures approved by the Board of Trustees.
(c) Cost for federal income tax purposes is $62,843,072.
See Accompanying Notes to Financial Statements.
9
August 31, 2005 Columbia Greater China Fund
| Summary of Securities by Country | Value ($) | % of Total Investments | |||||||||
| Hong Kong | 47,280,076 | 55.1 | |||||||||
| China | 20,747,776 | 24.2 | |||||||||
| Taiwan | 16,217,610 | 18.9 | |||||||||
| United States* | 1,556,000 | 1.8 | |||||||||
| 85,801,462 | 100.0 | ||||||||||
* Represents short-term obligation.
Certain securities are listed by country of underlying exposure but may trade predominantly on other exchanges.
At August 31, 2005, the Fund held investments in the following sectors:
| Sector (Unaudited) | % of Net Assets | ||||||
| Industrials | 19.2 | ||||||
| Financials | 19.1 | ||||||
| Telecommunication Services | 16.9 | ||||||
| Energy | 12.9 | ||||||
| Information Technology | 11.6 | ||||||
| Consumer Discretionary | 6.9 | ||||||
| Utilities | 4.9 | ||||||
| Consumer Staples | 2.6 | ||||||
| Health Care | 0.0 | ** | |||||
| Short-Term Obligation | 1.7 | ||||||
| Other Assets & Liabilities, Net | 4.2 | ||||||
| 100.0 | |||||||
** Rounds to less than 0.1%.
See Accompanying Notes to Financial Statements.
10
STATEMENT OF ASSETS AND LIABILITIES
August 31, 2005 Columbia Greater China Fund
| ($) | |||||||||||
| Assets | Investments, at cost | 62,682,781 | |||||||||
| Investments, at value | 85,801,462 | ||||||||||
| Cash | 289 | ||||||||||
| Foreign currency (cost of $106,369) | 104,753 | ||||||||||
| Receivable for: | |||||||||||
| Investments sold | 5,040,664 | ||||||||||
| Fund shares sold | 455,722 | ||||||||||
| Interest | 148 | ||||||||||
| Dividends | 263,574 | ||||||||||
| Deferred Trustees' compensation plan | 7,228 | ||||||||||
| Total Assets | 91,673,840 | ||||||||||
| Liabilities | Payable for: | ||||||||||
| Investments purchased | 1,862,840 | ||||||||||
| Fund shares repurchased | 115,210 | ||||||||||
| Investment advisory fee | 73,519 | ||||||||||
| Transfer agent fee | 23,123 | ||||||||||
| Pricing and bookkeeping fees | 4,584 | ||||||||||
| Chief compliance officer expenses and fees | 568 | ||||||||||
| Audit fee | 21,684 | ||||||||||
| Custody fee | 4,840 | ||||||||||
| Distribution and service fees | 34,557 | ||||||||||
| Deferred Trustees' fees | 7,228 | ||||||||||
| Other liabilities | 6,128 | ||||||||||
| Total Liabilities | 2,154,281 | ||||||||||
| Net Assets | 89,519,559 | ||||||||||
| Composition of Net Assets | Paid-in capital | 96,336,187 | |||||||||
| Undistributed net investment income | 868,300 | ||||||||||
| Accumulated net realized loss | (30,798,471 | ) | |||||||||
| Net unrealized appreciation (depreciation) on: | |||||||||||
| Investments | 23,118,681 | ||||||||||
| Foreign currency translations | (5,138 | ) | |||||||||
| Net Assets | 89,519,559 | ||||||||||
| Class A | Net assets | 53,974,890 | |||||||||
| Shares outstanding | 2,186,747 | ||||||||||
| Net asset value per share | 24.68 | (a)(b) | |||||||||
| Maximum offering price per share ($24.68/0.9425) | 26.19 | (c) | |||||||||
| Class B | Net assets | 12,679,785 | |||||||||
| Shares outstanding | 525,871 | ||||||||||
| Net asset value and offering price per share | 24.11 | (a)(b) | |||||||||
| Class C | Net assets | 13,852,519 | |||||||||
| Shares outstanding | 567,071 | ||||||||||
| Net asset value and offering price per share | 24.43 | (a)(b) | |||||||||
| Class Z | Net assets | 9,012,365 | |||||||||
| Shares outstanding | 352,154 | ||||||||||
| Net asset value, offering and redemption price per share | 25.59 | (b) | |||||||||
(a) Redemption price per share is equal to net asset value less any applicable contingent deferred sales charge.
(b) Redemption price per share is equal to net asset value less any applicable redemption fee.
(c) On sales of $50,000 or more the offering price is reduced.
See Accompanying Notes to Financial Statements.
11
STATEMENT OF OPERATIONS
For the Year Ended August 31, 2005 Columbia Greater China Fund
| ($) | |||||||||||
| Investment Income | Dividends | 2,479,458 | |||||||||
| Interest | 42,095 | ||||||||||
| Total Investment Income (net of foreign taxes withheld of $132,919) | 2,521,553 | ||||||||||
| Expenses | Investment advisory fee | 767,883 | |||||||||
| Distribution fee: | |||||||||||
| Class B | 87,926 | ||||||||||
| Class C | 86,113 | ||||||||||
| Service fee: | |||||||||||
| Class A | 125,304 | ||||||||||
| Class B | 29,309 | ||||||||||
| Class C | 28,704 | ||||||||||
| Transfer agent fee | 206,340 | ||||||||||
| Pricing and bookkeeping fees | 33,994 | ||||||||||
| Trustees' fees | 8,292 | ||||||||||
| Custody fee | 75,108 | ||||||||||
| Chief compliance officer expenses and fees (See Note 4) | 2,893 | ||||||||||
| Non-recurring costs (See Note 9) | 1,466 | ||||||||||
| Other expenses | 125,029 | ||||||||||
| Total Expenses | 1,578,361 | ||||||||||
| Non-recurring costs assumed by Investment Advisor (See Note 9) | (1,466 | ) | |||||||||
| Custody earnings credit | (193 | ) | |||||||||
| Net Expenses | 1,576,702 | ||||||||||
| Net Investment Income | 944,851 | ||||||||||
| Net Realized and Unrealized Gain (Loss) on Investments and Foreign Currency | Net realized gain (loss) on: | ||||||||||
| Investments | 4,646,330 | ||||||||||
| Foreign currency transactions | (7,895 | ) | |||||||||
| Net realized gain | 4,638,435 | ||||||||||
| Net change in unrealized appreciation (depreciation) on: | |||||||||||
| Investments | 9,104,241 | ||||||||||
| Foreign currency translations | (5,364 | ) | |||||||||
| Net change in unrealized appreciation (depreciation) | 9,098,877 | ||||||||||
| Net Gain | 13,737,312 | ||||||||||
| Net Increase in Net Assets from Operations | 14,682,163 | ||||||||||
See Accompanying Notes to Financial Statements.
12
STATEMENT OF CHANGES IN NET ASSETS
Columbia Greater China Fund
| Year Ended August 31, | |||||||||||||||
| Increase (Decrease) in Net Assets: | 2005 ($) | 2004 ($) | |||||||||||||
| Operations | Net investment income | 944,851 | 490,889 | ||||||||||||
| Net realized gain on investments and foreign currency transactions | 4,638,435 | 3,011,456 | |||||||||||||
| Net change in unrealized appreciation (depreciation) on investments and foreign currency translations | 9,098,877 | 4,744,596 | |||||||||||||
| Net Increase from Operations | 14,682,163 | 8,246,941 | |||||||||||||
| Distributions Declared to Shareholders | From net investment income: | ||||||||||||||
| Class A | (470,125 | ) | (271,209 | ) | |||||||||||
| Class B | (28,877 | ) | - | ||||||||||||
| Class C | (26,795 | ) | - | ||||||||||||
| Class Z | (73,253 | ) | (33,006 | ) | |||||||||||
| Total Distributions Declared to Shareholders | (599,050 | ) | (304,215 | ) | |||||||||||
| Share Transactions | Class A: | ||||||||||||||
| Subscriptions | 11,335,289 | 11,934,006 | |||||||||||||
| Distributions reinvested | 375,691 | 202,579 | |||||||||||||
| Redemptions | (13,860,380 | ) | (13,899,730 | ) | |||||||||||
| Net Decrease | (2,149,400 | ) | (1,763,145 | ) | |||||||||||
| Class B: | |||||||||||||||
| Subscriptions | 2,584,509 | 8,194,945 | |||||||||||||
| Distributions reinvested | 20,937 | - | |||||||||||||
| Redemptions | (2,445,536 | ) | (3,513,395 | ) | |||||||||||
| Net Increase | 159,910 | 4,681,550 | |||||||||||||
| Class C: | |||||||||||||||
| Subscriptions | 4,564,146 | 10,274,672 | |||||||||||||
| Distributions reinvested | 21,479 | - | |||||||||||||
| Redemptions | (2,110,445 | ) | (4,715,322 | ) | |||||||||||
| Net Increase | 2,475,180 | 5,559,350 | |||||||||||||
| Class Z: | |||||||||||||||
| Subscriptions | 3,799,173 | 6,509,751 | |||||||||||||
| Distributions reinvested | 60,969 | 19,453 | |||||||||||||
| Redemptions | (1,282,989 | ) | (3,704,101 | ) | |||||||||||
| Net Increase | 2,577,153 | 2,825,103 | |||||||||||||
| Net Increase from Share Transactions | 3,062,843 | 11,302,858 | |||||||||||||
| Redemption fees | 3,370 | 7,435 | |||||||||||||
| Total Increase in Net Assets | 17,149,326 | 19,253,019 | |||||||||||||
| Net Assets | Beginning of period | 72,370,233 | 53,117,214 | ||||||||||||
| End of period | 89,519,559 | 72,370,233 | |||||||||||||
| Undistributed net investment income, at end of period | 868,300 | 464,770 | |||||||||||||
See Accompanying Notes to Financial Statements.
13
Columbia Greater China Fund
| Year Ended August 31, | |||||||||||||||
| 2005 | 2004 | ||||||||||||||
| Changes in Shares | Class A: | ||||||||||||||
| Subscriptions | 488,532 | 587,185 | |||||||||||||
| Issued for distributions reinvested | 16,264 | 10,373 | |||||||||||||
| Redemptions | (609,193 | ) | (693,251 | ) | |||||||||||
| Net Decrease | (104,397 | ) | (95,693 | ) | |||||||||||
| Class B: | |||||||||||||||
| Subscriptions | 114,739 | 402,492 | |||||||||||||
| Issued for distributions reinvested | 922 | - | |||||||||||||
| Redemptions | (108,633 | ) | (176,010 | ) | |||||||||||
| Net Increase | 7,028 | 226,482 | |||||||||||||
| Class C: | |||||||||||||||
| Subscriptions | 197,242 | 507,747 | |||||||||||||
| Issued for distributions reinvested | 934 | - | |||||||||||||
| Redemptions | (92,593 | ) | (232,916 | ) | |||||||||||
| Net Increase | 105,583 | 274,831 | |||||||||||||
| Class Z: | |||||||||||||||
| Subscriptions | 160,742 | 308,478 | |||||||||||||
| Issued for distributions reinvested | 2,550 | 963 | |||||||||||||
| Redemptions | (53,455 | ) | (174,971 | ) | |||||||||||
| Net Increase | 109,837 | 134,470 | |||||||||||||
See Accompanying Notes to Financial Statements.
14
NOTES TO FINANCIAL STATEMENTS
August 31, 2005 Columbia Greater China Fund
Note 1. Organization
Columbia Greater China Fund (the "Fund"), a series of Columbia Funds Trust II (the "Trust"), is a non-diversified portfolio. The Trust is a Massachusetts business trust registered under the Investment Company Act of 1940, as amended, as an open-end management investment company.
Effective October 10, 2005, Columbia Newport Greater China Fund was renamed Columbia Greater China Fund.
Investment Goal
The Fund seeks long-term growth of capital by investing primarily in equity securities of companies located in the Greater China region.
Fund Shares
The Fund may issue an unlimited number of shares and offers four classes of shares: Class A, Class B, Class C and Class Z. Each share class has its own sales charge and expense structure.
Class A shares are subject to a maximum front-end sales charge of 5.75% based on the amount of initial investment. Class A shares purchased without an initial sales charge are subject to a 1.00% contingent deferred sales charge ("CDSC") on shares sold within twelve months on an original purchase in accounts aggregating up to $50 million. Class B shares are subject to a maximum CDSC of 5.00% based upon the holding period after purchase. Class B shares will convert to Class A shares in eight years after purchase. Class C shares are subject to a 1.00% CDSC on shares sold within one year after purchase. Class Z shares are offered continuously at net asset value. There are certain restrictions on the purchase of Class Z shares, as described in the Fund's prospectus.
Note 2. Significant Accounting Policies
Use of Estimates
The preparation of financial statements in conformity with accounting principles generally accepted in the United States of America ("GAAP") requires management to make estimates and assumptions that affect the reported amounts of assets and liabilities, the disclosure of contingent assets and liabilities at the date of the financial statements and the reported amounts of revenue and expenses during the reporting period. Actual results could differ from those estimates. The following is a summary of significant accounting policies consistently followed by the Fund in the preparation of its financial statements.
Security Valuation
Equity securities are valued at the last sale price on the principal exchange on which they trade, except for securities traded on the NASDAQ, which are valued at the NASDAQ official close price. Unlisted securities or listed securities for which there were no sales during the day are valued at the closing bid price on such exchanges or over-the-counter markets.
Short-term debt obligations maturing within 60 days are valued at amortized cost, which approximates market value.
Foreign securities are generally valued at the last sale price on the foreign exchange or market on which they trade. If any foreign share prices are not readily available as a result of limited share activity, the securities are valued at the last sale price of the local shares in the principal market in which such securities are normally traded.
Generally, trading in foreign securities is substantially completed each day at various times prior to the close of the New York Stock Exchange ("NYSE"). The values of such securities used in computing the net asset value of the Fund's shares are determined as of such times. Foreign currency exchange rates are generally determined at 2:00 p.m. Eastern (U.S.) time. Occasionally, events affecting the values of such foreign securities and such exchange rates may occur between the times at which they are determined and the close of the customary trading session of the NYSE, which would not be reflected in the computation of the Fund's net asset value. If events materially affecting the values of such foreign securities occur and it is determined that market quotations are not reliable, then these foreign securities will be valued at their fair value using procedures approved by the Board of Trustees. The Fund may use a systematic fair valuation model provided by an independent third party to value securities principally traded in foreign markets in order to adjust for possible stale pricing that may occur between the close of the foreign exchanges and the time for valuation. If a security is valued at a "fair value", such value is likely to be different from the last quoted market price for the security.
15
August 31, 2005 Columbia Greater China Fund
Investments for which market quotations are not readily available, or that have quotations which management believes are not appropriate, are valued at fair value as determined in good faith under consistently applied procedures established by and under the general supervision of the Board of Trustees.
Security Transactions
Security transactions are accounted for on the trade date. Cost is determined and gains (losses) are based upon the specific identification method for both financial statement and federal income tax purposes.
Repurchase Agreements
The Fund may engage in repurchase agreement transactions with institutions that the Fund's investment advisor has determined are creditworthy. The Fund, through its custodian, receives delivery of underlying securities collateralizing a repurchase agreement. Collateral is at least equal, at all times, to the value of the repurchase obligation including interest. A repurchase agreement transaction involves certain risks in the event of default or insolvency of the counterparty. These risks include possible delays or restrictions upon the Fund's ability to dispose of the underlying securities and a possible decline in the value of the underlying securities during the period while the Fund seeks to assert its rights.
Income Recognition
Interest income is recorded on the accrual basis. Corporate actions and dividend income are recorded on the ex-date, except for certain foreign securities which are recorded as soon after ex-date as the Fund becomes aware of such, net of non-reclaimable tax withholdings.
Foreign Currency Transactions
The values of all assets and liabilities quoted in foreign currencies are translated into U.S. dollars at that day's exchange rates. Net realized and unrealized gains (losses) on foreign currency transactions include gains (losses) arising from the fluctuation in exchange rates between trade and settlement dates on securities transactions, gains (losses) arising from the disposition of foreign currency and currency gains (losses) between the accrual and payment dates on dividends, interest income and foreign withholding taxes.
For financial statement purposes, the Fund does not distinguish that portion of gains (losses) on investments which is due to changes in foreign exchange rates from that which is due to changes in market prices of the investments. Such fluctuations are included with the net realized and unrealized gains (losses) on investments.
Determination of Class Net Asset Values
All income, expenses (other than class-specific expenses, as shown on the Statement of Operations), and realized and unrealized gains (losses), are allocated to each class of the Fund on a daily basis, based on the relative net assets of each class, for purposes of determining the net asset value of each class.
Federal Income Tax Status
The Fund intends to qualify each year as a "regulated investment company" under Subchapter M of the Internal Revenue Code, as amended, and will distribute substantially all of its taxable income, if any, for its tax year, and as such will not be subject to federal income taxes. In addition, the Fund intends to distribute in each calendar year substantially all of its net investment income, capital gains and certain other amounts, if any, such that the Fund should not be subject to federal excise tax. Therefore, no federal income or excise tax provision is recorded.
Distributions to Shareholders
Distributions to shareholders are recorded on ex-date. Net realized capital gains, if any, are distributed at least annually.
Note 3. Federal Tax Information
The timing and character of income and capital gain distributions are determined in accordance with income tax regulations, which may differ from GAAP. Reclassifications are made to the Fund's capital accounts for permanent tax differences to reflect income and gains available for distribution (or available capital loss carryforwards) under income tax regulations.
For the year ended August 31, 2005, permanent book and tax basis differences resulting primarily from differing treatments for foreign currency transactions and
16
August 31, 2005 Columbia Greater China Fund
Passive Foreign Investment Company (PFIC) adjustments were identified and reclassified among the components of the Fund's net assets as follows:
| Undistributed Net Investment Income | Accumulated Net Realized Loss | Paid-In Capital | |||||||||
| $ | 57,729 | $ | (57,729 | ) | $ | - | |||||
Net investment income and net realized gains (losses), as disclosed on the Statement of Operations, and net assets were not affected by this reclassification.
The tax character of distributions paid during the years ended August 31, 2005 and August 31, 2004 was as follows:
| August 31, 2005 | August 31, 2004 | ||||||||||
| Distributions paid from: | |||||||||||
| Ordinary income | $ | 599,050 | $ | 304,215 | |||||||
As of August 31, 2005, the components of distributable earnings on a tax basis were as follows:
| Undistributed Ordinary Income | Undistributed Long-Term Capital Gains | Net Unrealized Appreciation* | |||||||||
| $ | 1,036,144 | $ | - | $ | 22,958,390 | ||||||
*The differences between book-basis and tax-basis net unrealized appreciation are primarily due to Passive Foreign Investment Company (PFIC) adjustments, capital loss carryforwards and non-deductible deferred trustees fees.
Unrealized appreciation and depreciation at August 31, 2005, based on cost of investments for federal income tax purposes and excluding any unrealized appreciation and depreciation from changes in the value of other assets and liabilities resulting from changes in exchange rates, was:
| Unrealized appreciation | $ | 25,313,998 | |||||
| Unrealized depreciation | (2,355,608 | ) | |||||
| Net unrealized appreciation | $ | 22,958,390 | |||||
The following capital loss carryforwards, determined as of August 31, 2005, may be available to reduce taxable income arising from future net realized gains on investments, if any, to the extent permitted by the Internal Revenue Code:
| Year of Expiration | Capital Loss Carryforward | ||||||
| 2007 | $ | 25,046,844 | |||||
| 2008 | 703,958 | ||||||
| 2010 | 5,047,669 | ||||||
| $ | 30,798,471 | ||||||
Capital loss carryforwards of $4,580,706 were utilized during the year ended August 31, 2005. Expired capital loss carryforwards are recorded as a reduction of paid-in capital.
Note 4. Fees and Compensation Paid to Affiliates
Investment Advisory Fee
Columbia Management Advisors, Inc. ("Columbia"), an indirect wholly owned subsidiary of Bank of America Corporation ("BOA"), is the investment advisor to the Fund. On September 30, 2005, Columbia Management Advisors, Inc. had a name change to Columbia Management Advisors, LLC. Columbia receives a monthly investment advisory fee based on the Fund's average daily net assets at the following annual rates:
| Average Daily Net Assets | Annual Fee Rate | ||||||
| First $1 billion | 0.95 | % | |||||
| $1 billion to $1.5 billion | 0.87 | % | |||||
| $1.5 billion to $3 billion | 0.82 | % | |||||
| $3 billion to $6 billion | 0.77 | % | |||||
| Over $6 billion | 0.72 | % | |||||
Prior to November 1, 2004, Columbia received a monthly investment advisory fee based on the Fund's average daily net assets at the following annual rates:
| Average Daily Net Assets | Annual Fee Rate | ||||||
| First $1 billion | 0.95 | % | |||||
| $1 billion to $1.5 billion | 0.90 | % | |||||
| Over $1.5 billion | 0.85 | % | |||||
For the year ended August 31, 2005, the Fund's effective investment advisory fee rate was 0.95%.
Administration Fees
Columbia provides administrative and other services to the Fund. The Fund is not charged a fee for these services.
Pricing and Bookkeeping Fees
Columbia is responsible for providing pricing and bookkeeping services to the Fund under a pricing and bookkeeping agreement. Under a separate agreement (the "Outsourcing Agreement"), Columbia has delegated those functions to State Street Corporation ("State Street"). As a result, Columbia pays the total fees collected to State Street under the Outsourcing Agreement.
17
August 31, 2005 Columbia Greater China Fund
Under its pricing and bookkeeping agreement with the Fund, Columbia receives from the Fund an annual fee of $10,000 paid monthly, and in any month that the Fund's average daily net assets exceed $50 million, an additional monthly fee. The additional fee rate is calculated by taking into account the fees payable to State Street under the Outsourcing Agreement. This rate is applied to the average daily net assets of the Fund for that month. The Fund also pays additional fees for pricing services based on the number of securities held by the Fund. For the year ended August 31, 2005, the Fund's effective pricing and bookkeeping fee rate, inclusive of out-of-pocket expenses, was 0.042%.
Transfer Agent Fees
Columbia Management Services, Inc. (the "Transfer Agent"), formerly Columbia Funds Services, Inc., an affiliate of Columbia, provides shareholder services to the Fund and has contracted with Boston Financial Data Services ("BFDS") to serve as sub-transfer agent. For such services, the Transfer Agent receives a fee, paid monthly, at the annual rate of $28.00 per open account. The Transfer Agent also receives reimbursement for certain out-of-pocket expenses.
For the year ended August 31, 2005, the Fund's effective transfer agent fee rate, inclusive of out-of-pocket expenses, was 0.26%.
Underwriting Discounts, Service and Distribution Fees
Columbia Management Distributors, Inc. (the "Distributor"), formerly Columbia Funds Distributor, Inc., an affiliate of Columbia, is the principal underwriter of the Fund. For the year ended August 31, 2005, the Distributor has retained net underwriting discounts of $34,824 on sales of the Fund's Class A shares and received net CDSC fees of $20,636 and $3,222 on Class B and Class C share redemptions, respectively.
The Fund has adopted a 12b-1 plan (the "Plan") which allows the payment of a monthly service fee to the Distributor at the annual rate of 0.25% of the average daily net assets attributable to Class A, Class B and Class C shares of the Fund. The Plan also requires the payment of a monthly distribution fee to the Distributor at the annual rate of 0.75% of the average daily net assets attributable to Class B and Class C shares only.
The CDSC and the fees received from the Plan are used principally as repayment to the Distributor for amounts paid by the Distributor to dealers who sold such shares.
Expense Limits and Fee Reimbursements
Columbia has voluntarily agreed to waive fees and reimburse certain expenses to the extent that total expenses (exclusive of distribution and service fees, brokerage commissions, interest, taxes and extraordinary expenses, if any) will not exceed 1.90% annually of the Fund's average daily net assets. This arrangement may be revised or discontinued by Columbia at any time.
Custody Credits
The Fund has an agreement with its custodian bank under which custody fees may be reduced by balance credits. These credits are recorded as a reduction of total expenses on the Statement of Operations. The Fund could have invested a portion of the assets utilized in connection with the expense offset arrangement in an income-producing asset if it had not entered into such an agreement.
Fees Paid to Officers and Trustees
With the exception of one officer, all officers of the Fund are employees of Columbia or its affiliates and receive no compensation from the Fund. The Board of Trustees appointed a Chief Compliance Officer to the Fund in accordance with federal securities regulations. The Fund, along with other affiliated funds, will pay its pro-rata share of the expenses associated with the Chief Compliance Officer position. The Fund's fee will not exceed $15,000 per year.
The Fund's Trustees may participate in a deferred compensation plan which may be terminated at any time. Obligations of the plan will be paid solely out of the Fund's assets.
Other
Columbia provides certain services to the Fund related to Sarbanes-Oxley compliance. For the year ended August 31, 2005, the Fund paid $1,582 to Columbia for such services. This amount is included in "Other expenses" on the Statement of Operations.
18
August 31, 2005 Columbia Greater China Fund
Note 5. Portfolio Information
For the year ended August 31, 2005, the cost of purchases and proceeds from sales of securities, excluding short-term obligations, were $18,717,017 and $19,473,602, respectively.
Note 6. Redemption Fees
The Fund imposes a 2.00% redemption fee to shareholders of the Fund who redeem shares held for 60 days or less. Redemption fees, which are retained by the Fund, are accounted for as an addition to paid-in capital and are allocated to each class proportionately for purposes of determining the net asset value of each class. For the year ended August 31, 2005, the redemption fees for the Class A, Class B, Class C and Class Z shares of the Fund amounted to $2,065, $488, $488, and $329, respectively.
Note 7. Line of Credit
The Fund and other affiliated funds participate in a $350,000,000 committed unsecured revolving line of credit provided by State Street Bank and Trust Company. Borrowings are used for temporary or emergency purposes to facilitate portfolio liquidity. Interest is charged to each participating fund based on its borrowings at a rate per annum equal to the Federal Funds rate plus 0.50%. In addition, a commitment fee of 0.10% per annum is accrued and apportioned among the participating funds based on their pro-rata portion of the unutilized line of credit. The commitment fee is included in "Other expenses" on the Statement of Operations. For the year ended August 31, 2005, the Fund did not borrow under these arrangements.
Note 8. Shares of Beneficial Interest
As of August 31, 2005, Bank of America and/or its affiliates held 1.4% of the shares outstanding of the Fund. Subscription and redemption activity of this account may have a significant effect on the operations of the Fund.
As of August 31, 2005, the Fund had a shareholder that held 10.1% of the shares outstanding. Subscription and redemption activity of this account may have a significant effect on the operations of the Fund.
Note 9. Disclosure of Significant Risks and Contingencies
Foreign Securities
There are certain additional risks involved when investing in foreign securities that are not inherent with investments in domestic securities. These risks may involve foreign currency exchange rate fluctuations, adverse political and economic developments and the possible prevention of currency exchange or other foreign governmental laws or restrictions. In addition, the liquidity of foreign securities may be more limited than that of domestic securities.
Investments in emerging market countries are subject to additional risk. The risk of foreign investments is typically increased in less developed countries. These countries are also more likely to experience high levels of inflation, deflation or currency devaluation which could hurt their economies and securities markets.
Geographic Concentration
Because the Fund's investments are concentrated in the Greater China Region, events within the region will have a greater effect on the Fund than if the Fund were more geographically diversified. In addition, events in any one country within the region may impact the other countries or the region as a whole. Markets in the region can experience significant volatility due to social, regulatory and political uncertainties.
Industry Focus
As a non-diversified fund, the Fund may invest a greater percentage of its total assets in the securities of fewer issuers than a diversified fund. The Fund may, therefore, have a greater risk of loss from a few issuers than a similar fund that invests more broadly.
Legal Proceedings
On February 9, 2005, Columbia Management Advisors, Inc. which has since merged into Banc of America Capital Management, LLC) ("Columbia") and Columbia Funds Distributor, Inc. (which has been renamed Columbia Management Distributors, Inc. (the "Distributor") (collectively, the "Columbia Group") entered into an Assurance of Discontinuance with the New York Attorney General ("NYAG")
19
August 31, 2005 Columbia Greater China Fund
(the "NYAG Settlement") and consented to the entry of a cease-and-desist order by the Securities and Exchange Commission ("SEC") (the "SEC Order"). The SEC Order and the NYAG Settlement are referred to collectively as the "Settlements". The Settlements contain substantially the same terms and conditions as outlined in the agreements in principle which Columbia Group entered into with the SEC and NYAG in March 2004.
Under the terms of the SEC Order, the Columbia Group has agreed among other things, to: pay $70 million in disgorgement and $70 million in civil money penalties; cease and desist from violations of the antifraud provisions and certain other provisions of the federal securities laws; maintain certain compliance and ethics oversight structures; retain an independent consultant to review the Columbia Group's applicable supervisory, compliance, control and other policies and procedures; and retain an independent distribution consultant (see below). The Columbia Funds have also voluntarily undertaken to implement certain governance measures designed to maintain the independence of their boards of trustees. The NYAG Settlement also, among other things, requires Columbia and its affiliates to reduce certain Columbia Funds (including the former Nations Funds) and other mutual funds management fees collect ively by $32 million per year for five years, for a projected total of $160 million in management fee reductions.
Pursuant to the procedures set forth in the SEC Order, the $140 million in settlement amounts described above will be distributed in accordance with a distribution plan to be developed by an independent distribution consultant who is acceptable to the SEC staff and the Columbia Funds' independent trustees. The distribution plan must be based on a methodology developed in consultation with the Columbia Group and the Fund's independent trustees and not unacceptable to the staff of the SEC. At this time, the distribution plan is still under development. As such, any gain to the Fund or its shareholders can not currently be determined.
As a result of these matters or any adverse publicity or other developments resulting from them, there may be increased redemptions or reduced sales of fund shares, which could increase transaction costs or operating expenses, or have other adverse consequences for the Funds.
A copy of the SEC Order is available on the SEC website at http://www.sec.gov. A copy of the NYAG Settlement is available as part of the Bank of America Corporation Form 8-K filing on February 10, 2005.
In connection with the events described in detail above, various parties have filed suit against certain funds, the Trustees of the Columbia Funds, FleetBoston Financial Corporation and its affiliated entities and/or Bank of America Corporation and its affiliated entities. More than 300 cases including those filed against entities unaffiliated with the funds, their Boards, FleetBoston Financial Corporation and its affiliated entities and/or Bank of America Corporation and its affiliated entities have been transferred to the Federal District Court in Maryland and consolidated in a multi-district proceeding (the "MDL").
The derivative cases purportedly brought on behalf of the Columbia Funds in the MDL have been consolidated under the lead case. The fund derivative plaintiffs allege that the funds were harmed by market timing and late trading activity and seek, among other things, removal of the trustees of the Columbia Funds, removal of the Columbia Group, disgorgement of all management fees and monetary damages. The MDL is ongoing. Accordingly, an estimate of the financial impact of this litigation on any Fund, if any, can not currently be made.
On March 21, 2005 purported class action plaintiffs filed suit in Massachusetts state court alleging that the conduct, including market timing, entitles Class B shareholders in certain Columbia funds to an exemption from contingent deferred sales charges upon early redemption ("the CDSC Lawsuit"). The CDSC Lawsuit has been removed to federal court in Massachusetts and the federal Judicial Panel has transferred the CDSC Lawsuit to the MDL.
On January 11, 2005, a putative class action lawsuit was filed in federal district court in Massachusetts against, among others, the Trustees of the Columbia Funds and Columbia. The lawsuit alleges that defendants violated common law duties to fund shareholders as well as sections of the Investment Company Act of 1940, by failing to ensure that the Fund and other affiliated funds participated in securities class action settlements for which the funds were eligible. Specifically, plaintiffs allege that defendants failed to submit proof of claims in connection with settlements of securities class action lawsuits filed against companies in which the funds held positions.
20
August 31, 2005 Columbia Greater China Fund
In 2004, certain Columbia Funds, the Trustees of the Columbia Funds, advisers and affiliated entities were named as defendants in certain purported shareholder class and derivative actions making claims, including claims under the Investment Company and the Investment Advisers Acts of 1940 and state law. The suits seek damages and allege, inter alia, that the fees and expenses paid by the funds are excessive and that the advisers and their affiliates inappropriately used fund assets to distribute the funds and for other improper purpose. On March 2, 2005, the actions were consolidated in the Massachusetts federal court as In re Columbia Entities Litigation. The plaintiffs filed a consolidated amended complaint on June 9, 2005.
The Fund and the other defendants to these actions, including Columbia and various of its affiliates, certain other mutual funds advised by Columbia and its affiliates, and various directors of such funds, have denied these allegations and are contesting the plaintiffs' claims. These proceedings are ongoing, however, based on currently available information, Columbia believes that these lawsuits are without merit, that the likelihood they will have a material adverse impact on any fund is remote, and that the lawsuits are not likely to materially affect its ability to provide investment management services to its clients, including the Fund.
For the year ended August 31, 2005, Columbia has assumed $1,466 of legal, consulting services and Trustees' fees incurred by the Fund in connection with these matters.
21
FINANCIAL HIGHLIGHTS
Columbia Greater China Fund
Selected data for a share outstanding throughout each period is as follows:
| Year Ended August 31, | |||||||||||||||||||||||
| Class A Shares | 2005 | 2004 | 2003(a) | 2002(a) | 2001(a) | ||||||||||||||||||
| Net Asset Value, Beginning of Period | $ | 20.64 | $ | 17.88 | $ | 14.29 | $ | 14.91 | $ | 19.98 | |||||||||||||
| Income from Investment Operations: | |||||||||||||||||||||||
| Net investment income (b) | 0.31 | 0.17 | 0.14 | 0.10 | 0.12 | ||||||||||||||||||
| Net realized and unrealized gain (loss) on investments and foreign currency | 3.94 | 2.70 | 3.53 | (0.57 | ) | (5.19 | ) | ||||||||||||||||
| Total from Investment Operations | 4.25 | 2.87 | 3.67 | (0.47 | ) | (5.07 | ) | ||||||||||||||||
| Less Distributions Declared to Shareholders: | |||||||||||||||||||||||
| From net investment income | (0.21 | ) | (0.11 | ) | (0.08 | ) | (0.15 | ) | - | ||||||||||||||
| Redemption fees: | |||||||||||||||||||||||
| Redemption fees added to paid-in-capital | - | (b)(c) | - | (b)(c) | - | - | - | ||||||||||||||||
| Net Asset Value, End of Period | $ | 24.68 | $ | 20.64 | $ | 17.88 | $ | 14.29 | $ | 14.91 | |||||||||||||
| Total return (d) | 20.66 | % | 16.11 | % | 25.84 | %(e) | (3.22 | )%(e) | (25.38 | )%(e) | |||||||||||||
| Ratios to Average Net Assets/ Supplemental Data: | |||||||||||||||||||||||
| Operating expenses (f) | 1.76 | % | 1.89 | % | 2.15 | % | 2.15 | % | 2.15 | % | |||||||||||||
| Interest expense | - | - | - | %(g) | - | %(g) | - | ||||||||||||||||
| Expenses (f) | 1.76 | % | 1.89 | % | 2.15 | % | 2.15 | % | 2.15 | % | |||||||||||||
| Net investment income (f) | 1.35 | % | 0.84 | % | 0.97 | % | 0.65 | % | 0.68 | % | |||||||||||||
| Waiver/reimbursement | - | - | 0.37 | % | 0.29 | % | 0.21 | % | |||||||||||||||
| Portfolio turnover rate | 24 | % | 25 | % | 33 | % | 16 | % | 14 | % | |||||||||||||
| Net assets, end of period (000's) | $ | 53,975 | $ | 47,282 | $ | 42,685 | $ | 33,201 | $ | 37,652 | |||||||||||||
(a) For the years ended August 31, 2003, 2002 and 2001, the Fund was audited by Ernst & Young LLP.
(b) Per share data was calculated using average shares outstanding during the period.
(c) Rounds to less than $0.01 per share.
(d) Total return at net asset value assuming all distributions reinvested and no initial sales charge or contingent deferred sales charge.
(e) Had the Investment Advisor/Administrator not waived or reimbursed a portion of expenses, total return would have been reduced.
(f) The benefits derived from custody credits and directed brokerage arrangements, if applicable, had an impact of less than 0.01%.
(g) Rounds to less than 0.01%.
22
Columbia Greater China Fund
Selected data for a share outstanding throughout each period is as follows:
| Year Ended August 31, | |||||||||||||||||||||||
| Class B Shares | 2005 | 2004 | 2003(a) | 2002(a) | 2001(a) | ||||||||||||||||||
| Net Asset Value, Beginning of Period | $ | 20.18 | $ | 17.51 | $ | 14.02 | $ | 14.63 | $ | 19.75 | |||||||||||||
| Income from Investment Operations: | |||||||||||||||||||||||
| Net investment income (loss) (b) | 0.14 | 0.05 | 0.04 | (0.02 | ) | (0.01 | ) | ||||||||||||||||
| Net realized and unrealized gain (loss) on investments and foreign currency | 3.85 | 2.62 | 3.45 | (0.55 | ) | (5.11 | ) | ||||||||||||||||
| Total from Investment Operations | 3.99 | 2.67 | 3.49 | (0.57 | ) | (5.12 | ) | ||||||||||||||||
| Less Distributions Declared to Shareholders: | |||||||||||||||||||||||
| From net investment income | (0.06 | ) | - | - | (0.04 | ) | - | ||||||||||||||||
| Redemption fees: | |||||||||||||||||||||||
| Redemption fees added to paid-in-capital | - | (b)(c) | - | (b)(c) | - | - | - | ||||||||||||||||
| Net Asset Value, End of Period | $ | 24.11 | $ | 20.18 | $ | 17.51 | $ | 14.02 | $ | 14.63 | |||||||||||||
| Total return (d) | 19.77 | % | 15.25 | % | 24.89 | %(e) | (3.93 | )%(e) | (25.92 | )%(e) | |||||||||||||
| Ratios to Average Net Assets/ Supplemental Data: | |||||||||||||||||||||||
| Operating expenses (f) | 2.51 | % | 2.64 | % | 2.90 | % | 2.90 | % | 2.90 | % | |||||||||||||
| Interest expense | - | - | - | %(g) | - | %(g) | - | ||||||||||||||||
| Expenses (f) | 2.51 | % | 2.64 | % | 2.90 | % | 2.90 | % | 2.90 | % | |||||||||||||
| Net investment income (loss) (f) | 0.60 | % | 0.23 | % | 0.30 | % | (0.10 | )% | (0.07 | )% | |||||||||||||
| Waiver/reimbursement | - | - | 0.37 | % | 0.29 | % | 0.21 | % | |||||||||||||||
| Portfolio turnover rate | 24 | % | 25 | % | 33 | % | 16 | % | 14 | % | |||||||||||||
| Net assets, end of period (000's) | $ | 12,680 | $ | 10,471 | $ | 5,121 | $ | 3,850 | $ | 4,151 | |||||||||||||
(a) For the years ended August 31, 2003, 2002 and 2001 the Fund was audited by Ernst & Young LLP.
(b) Per share data was calculated using average shares outstanding during the period.
(c) Rounds to less than $0.01 per share.
(d) Total return at net asset value assuming all distributions reinvested and no contingent deferred sales charge.
(e) Had the Investment Advisor/Administrator not waived or reimbursed a portion of expenses, total return would have been reduced.
(f) The benefits derived from custody credits and directed brokerage arrangements, if applicable, had an impact of less than 0.01%.
(g) Rounds to less than 0.01%.
23
Columbia Greater China Fund
Selected data for a share outstanding throughout each period is as follows:
| Year Ended August 31, | |||||||||||||||||||||||
| Class C Shares | 2005 | 2004 | 2003(a) | 2002(a) | 2001(a) | ||||||||||||||||||
| Net Asset Value, Beginning of Period | $ | 20.45 | $ | 17.76 | $ | 14.22 | $ | 14.84 | $ | 20.03 | |||||||||||||
| Income from Investment Operations: | |||||||||||||||||||||||
| Net investment income (loss) (b) | 0.14 | 0.04 | 0.05 | (0.02 | ) | (0.01 | ) | ||||||||||||||||
| Net realized and unrealized gain (loss) on investments and foreign currency | 3.90 | 2.65 | 3.49 | (0.56 | ) | (5.18 | ) | ||||||||||||||||
| Total from Investment Operations | 4.04 | 2.69 | 3.54 | (0.58 | ) | (5.19 | ) | ||||||||||||||||
| Less Distributions Declared to Shareholders: | |||||||||||||||||||||||
| From net investment income | (0.06 | ) | - | - | (0.04 | ) | - | ||||||||||||||||
| Redemption fees: | |||||||||||||||||||||||
| Redemption fees added to paid-in-capital | - | (b)(c) | - | (b)(c) | - | - | - | ||||||||||||||||
| Net Asset Value, End of Period | $ | 24.43 | $ | 20.45 | $ | 17.76 | $ | 14.22 | $ | 14.84 | |||||||||||||
| Total return (d) | 19.75 | % | 15.15 | % | 24.89 | %(e) | (3.94 | )%(e) | (25.91 | )%(e) | |||||||||||||
| Ratios to Average Net Assets/ Supplemental Data: | |||||||||||||||||||||||
| Operating expenses (f) | 2.51 | % | 2.64 | % | 2.90 | % | 2.90 | % | 2.90 | % | |||||||||||||
| Interest expense | - | - | - | %(g) | - | %(g) | - | ||||||||||||||||
| Expenses (f) | 2.51 | % | 2.64 | % | 2.90 | % | 2.90 | % | 2.90 | % | |||||||||||||
| Net investment income (loss) (f) | 0.60 | % | 0.20 | % | 0.35 | % | (0.10 | )% | (0.07 | )% | |||||||||||||
| Waiver/reimbursement | - | - | 0.37 | % | 0.29 | % | 0.21 | % | |||||||||||||||
| Portfolio turnover rate | 24 | % | 25 | % | 33 | % | 16 | % | 14 | % | |||||||||||||
| Net assets, end of period (000's) | $ | 13,853 | $ | 9,436 | $ | 3,316 | $ | 1,812 | $ | 1,352 | |||||||||||||
(a) For the years ended August 31, 2003, 2002 and 2001, the Fund was audited by Ernst & Young LLP.
(b) Per share data was calculated using average shares outstanding during the period.
(c) Rounds to less than $0.01 per share.
(d) Total return at net asset value assuming all distributions reinvested and no contingent deferred sales charge.
(e) Had the Investment Advisor/Administrator not waived or reimbursed a portion of expenses, total return would have been reduced.
(f) The benefits derived from custody credits and directed brokerage arrangements, if applicable, had an impact of less than 0.01%.
(g) Rounds to less than 0.01%.
24
Columbia Greater China Fund
Selected data for a share outstanding throughout each period is as follows:
| Year Ended August 31, | |||||||||||||||||||||||
| Class Z Shares | 2005 | 2004 | 2003(a) | 2002(a) | 2001(a) | ||||||||||||||||||
| Net Asset Value, Beginning of Period | $ | 21.38 | $ | 18.51 | $ | 14.41 | $ | 15.05 | $ | 20.11 | |||||||||||||
| Income from Investment Operations: | |||||||||||||||||||||||
| Net investment income (b) | 0.40 | 0.22 | 0.11 | 0.14 | 0.16 | ||||||||||||||||||
| Net realized and unrealized gain (loss) on investments and foreign currency | 4.07 | 2.81 | 4.10 | (0.59 | ) | (5.22 | ) | ||||||||||||||||
| Total from Investment Operations | 4.47 | 3.03 | 4.21 | (0.45 | ) | (5.06 | ) | ||||||||||||||||
| Less Distributions Declared to Shareholders: | |||||||||||||||||||||||
| From net investment income | (0.26 | ) | (0.16 | ) | (0.12 | ) | (0.19 | ) | - | ||||||||||||||
| Redemption fees: | |||||||||||||||||||||||
| Redemption fees added to paid-in-capital | - | (b)(c) | - | (b)(c) | 0.01 | - | - | ||||||||||||||||
| Net Asset Value, End of Period | $ | 25.59 | $ | 21.38 | $ | 18.51 | $ | 14.41 | $ | 15.05 | |||||||||||||
| Total return (d) | 21.00 | % | 16.44 | % | 29.51 | %(e) | (3.10 | )%(e) | (25.16 | )%(e) | |||||||||||||
| Ratios to Average Net Assets/ Supplemental Data: | |||||||||||||||||||||||
| Operating expenses (f) | 1.51 | % | 1.64 | % | 1.90 | % | 1.90 | % | 1.90 | % | |||||||||||||
| Interest expense | - | - | - | %(g) | - | %(g) | - | ||||||||||||||||
| Expenses (f) | 1.51 | % | 1.64 | % | 1.90 | % | 1.90 | % | 1.90 | % | |||||||||||||
| Net investment income (f) | 1.69 | % | 1.06 | % | 0.70 | % | 0.90 | % | 0.93 | % | |||||||||||||
| Waiver/reimbursement | - | - | 0.37 | % | 0.29 | % | 0.21 | % | |||||||||||||||
| Portfolio turnover rate | 24 | % | 25 | % | 33 | % | 16 | % | 14 | % | |||||||||||||
| Net assets, end of period (000's) | $ | 9,012 | $ | 5,182 | $ | 1,996 | $ | 138 | $ | 145 | |||||||||||||
(a) For the years ended August 31, 2003, 2002 and 2001, the Fund was audited by Ernst & Young LLP.
(b) Per share data was calculated using average shares outstanding during the period.
(c) Rounds to less than $0.01 per share.
(d) Total return at net asset value assuming all distributions reinvested.
(e) Had the Investment Advisor/Administrator not waived or reimbursed a portion of expenses, total return would have been reduced.
(f) The benefits derived from custody credits and directed brokerage arrangements, if applicable, had an impact of less than 0.01%.
(g) Rounds to less than 0.01%.
25
REPORT OF INDEPENDENT REGISTERED PUBLIC ACCOUNTING FIRM
Columbia Greater China Fund
To the Trustees of Columbia Funds Trust II and the Shareholders of Columbia Greater China Fund
In our opinion, the accompanying statement of assets and liabilities, including the investment portfolio, and the related statements of operations and of changes in net assets and the financial highlights present fairly, in all material respects, the financial position of Columbia Greater China Fund (the "Fund") (a series of Columbia Funds Trust II) at August 31, 2005, and the results of its operations for the year ended August 31, 2005, and the changes in its net assets and financial highlights for the years ended August 31, 2005 and 2004, in conformity with accounting principles generally accepted in the United States of America. These financial statements and financial highlights (hereafter referred to as "financial statements") are the responsibility of the Fund's management; our responsibility is to express an opinion on these financial statements based on our audits. We conducted our au dits of these financial statements in accordance with auditing standards of the Public Company Accounting Oversight Board (United States), which require that we plan and perform the audit to obtain reasonable assurance about whether the financial statements are free of material misstatement. An audit includes examining, on a test basis, evidence supporting the amounts and disclosures in the financial statements, assessing the accounting principles used and significant estimates made by management, and evaluating the overall financial statement presentation. We believe that our audits, which included confirmation of securities at August 31, 2005 by correspondence with the custodian and brokers, provide a reasonable basis for our opinion.
The financial highlights of the Fund for the three fiscal years ending August 31, 2003 were audited by other independent accountants whose report dated October 17, 2003 expressed an unqualifed opinion on those highlights.
PricewaterhouseCoopers LLP
Boston, Massachusetts
October 26, 2005
26
UNAUDITED INFORMATION
Columbia Greater China Fund
Federal Income Tax Information
Foreign taxes paid during the fiscal year ended August 31, 2005, amounting to $132,919 ($0.04 per share) are expected to be passed through to shareholders as 100% allowable foreign tax credits on Form 1099-DIV for the year ending December 31, 2005.
Gross income derived from sources within foreign countries amounted to $2,612,377 ($0.72 per share) for the fiscal year ended August 31, 2005.
For non-corporate shareholders, 30.67% or the maximum amount allowable under the Jobs and Growth Tax Relief Reconciliation Act of 2003, of income earned by the Fund for the period September 1, 2004 to August 31, 2005 may represent qualified dividend income. Final information will be provided in your 2005 1099-Div Form.
27
TRUSTEES
Columbia Greater China Fund
The Trustees/Directors serve terms of indefinite duration. The names, addresses and ages of the Trustees/Directors and officers of the Funds in the Columbia Funds Complex, the year each was first elected or appointed to office, their principal business occupations during at least the last five years, the number of portfolios overseen by each Trustee/Director and other directorships they hold are shown below. Each officer listed below serves as an officer of each Fund in the Columbia Funds Complex.
| Name, address and age, Position with funds, Year first elected or appointed to office1 | Principal occupation(s) during past five years, Number of portfolios in Columbia Funds Complex overseen by trustee/director, Other directorships held | ||||||
| Disinterested Trustees | |||||||
| Douglas A. Hacker (age 49) P.O. Box 66100 Chicago, IL 60666 Trustee (since 1996) | Executive Vice President-Strategy of United Airlines (airline) since December, 2002 (formerly President of UAL Loyalty Services (airline) from September, 2001 to December, 2002; Executive Vice President and Chief Financial Officer of United Airlines from July, 1999 to September, 2001; Senior Vice President-Finance from March, 1993 to July, 1999). Oversees 90, Nash Finch Company (food distributor) | ||||||
| Janet Langford Kelly (age 47) 9534 W. Gull Lake Drive Richland, MI 49083-8530 Trustee (since 1996) | Partner, Zelle, Hofmann, Voelbel, Mason & Gette LLP (law firm); Adjunct Professor of Law, Northwestern University, since September, 2004 (formerly Chief Administrative Officer and Senior Vice President, Kmart Holding Corporation (consumer goods), from September, 2003 to March, 2004; Executive Vice President-Corporate Development and Administration, General Counsel and Secretary, Kellogg Company (food manufacturer), from September, 1999 to August, 2003; Senior Vice President, Secretary and General Counsel, Sara Lee Corporation (branded, packaged, consumer-products manufacturer) from January, 1995 to September, 1999). Oversees 90, None | ||||||
| Richard W. Lowry (age 69) 10701 Charleston Drive Vero Beach, FL 32963 Trustee (since 1995) | Private Investor since August, 1987 (formerly Chairman and Chief Executive Officer, U.S. Plywood Corporation (building products manufacturer)). Oversees 923, None | ||||||
| Charles R. Nelson (age 62) Department of Economics University of Washington Seattle, WA 98195 Trustee (since 1981) | Professor of Economics, University of Washington, since January, 1976; Ford and Louisa Van Voorhis Professor of Political Economy, University of Washington, since September, 1993 (formerly Director, Institute for Economic Research, University of Washington from September, 2001 to June, 2003) Adjunct Professor of Statistics, University of Washington, since September, 1980; Associate Editor, Journal of Money Credit and Banking, since September, 1993; consultant on econometric and statistical matters. Oversees 90, None | ||||||
| John J. Neuhauser (age 63) 84 College Road Chestnut Hill, MA 02467-3838 Trustee (since 1985) | Academic Vice President and Dean of Faculties since August, 1999, Boston College (formerly Dean Boston College School of Management from September, 1977 to August, 1999). Oversees 923, Saucony, Inc. (athletic footwear) | ||||||
| Patrick J. Simpson (age 61) 1120 N.W. Couch Street Tenth Floor Portland, OR 97209-4128 Trustee (since 2000) | Partner, Perkins Coie L.L.P. (law firm). Oversees 90, None | ||||||
28
Columbia Greater China Fund
| Name, address and age, Position with funds, Year first elected or appointed to office1 | Principal occupation(s) during past five years, Number of portfolios in Columbia Funds Complex overseen by trustee/director, Other directorships held | ||||||
| Disinterested Trustees | |||||||
| Thomas E. Stitzel (age 69) 2208 Tawny Woods Place Boise, ID 83706 Trustee (since 1998) | Business Consultant since 1999 (formerly Professor of Finance from 1975 to 1999, College of Business, Boise State University); Chartered Financial Analyst. Oversees 90, None | ||||||
| Thomas C. Theobald (age 68) 8 Sound Shore Drive, Suite 285 Greenwich, CT 06830 Trustee and Chairman of the Board4 | Partner and Senior Advisor, Chicago Growth Partners (private equity investing) since September, 2004 (formerly Managing Director, William Blair Capital Partners (private equity investing) from September, 1994 to September, 2004). Oversees 90, Anixter International (network support equipment distributor); Ventas, Inc. (real estate investment trust); Jones Lang LaSalle (real estate (since 1996) management services) and Ambac Financial Group (financial guaranty insurance) | ||||||
| Anne-Lee Verville (age 59) 359 Stickney Hill Road Hopkinton, NH 03229 Trustee (since 1998) | Retired since 1997 (formerly General Manager, Global Education Industry, IBM Corporation (computer and technology) from 1994 to 1997). Oversees 90, Chairman of the Board of Directors, Enesco Group, Inc. (designer, importer and distributor of giftware and collectibles) | ||||||
| Richard L. Woolworth (age 64) 100 S.W. Market Street #1500 Portland, OR 97207 Trustee (since 1991) | Retired since December 2003 (formerly Chairman and Chief Executive Officer, The Regence Group (regional health insurer); Chairman and Chief Executive Officer, BlueCross BlueShield of Oregon; Certified Public Accountant, Arthur Young & Company). Oversees 90, Northwest Natural Gas Co. (natural gas service provider) | ||||||
| Interested Trustee | |||||||
| William E. Mayer2 (age 65) 399 Park Avenue Suite 3204 New York, NY 10022 Trustee (since 1994) | Partner, Park Avenue Equity Partners (private equity) since February, 1999 (formerly Partner, Development Capital LLC from November, 1996 to February, 1999). Oversees 923, Lee Enterprises (print media), WR Hambrecht + Co. (financial service provider); Reader's Digest (publishing); OPENFIELD Solutions (retail industry technology provider) | ||||||
1 In December 2000, the boards of each of the former Liberty Funds and former Stein Roe Funds were combined into one board of trustees responsible for the oversight of both fund groups (collectively, the "Liberty Board"). In October 2003, the trustees on the Liberty Board were elected to the boards of the Columbia Funds (the "Columbia Board") and of the CMG Fund Trust (the "CMG Funds Board"); simultaneous with that election, Patrick J. Simpson and Richard L. Woolworth, who had been directors on the Columbia Board and trustees on the CMG Funds Board, were appointed to serve as trustees of the Liberty Board. The date shown is the earliest date on which a trustee/director was elected or appointed to the board of a Fund in the Columbia Funds Complex.
2 Mr. Mayer is an "interested person" (as defined in the Investment Company Act of 1940 (1940 Act)) by reason of his affiliation with WR Hambrecht + Co.
3 Messrs. Lowry, Neuhauser and Mayer also serve as directors/trustees of the Liberty All-Star Funds, currently consisting of 3 funds, which are advised by an affiliate of the Advisor.
4 Mr. Theobald was appointed as Chairman of the Board effective December 10, 2003.
The Statement of Additional Information Includes additional information about the Trustees of the Funds and is available, without charge, upon request by calling 800-426-3750.
29
OFFICERS
Columbia Greater China Fund
| Name, address and age, Position with Columbia Funds, Year first elected or appointed to office | Principal occupation(s) during past five years | ||||||
| Christopher L. Wilson (age 48) One Financial Center Boston, MA 02111 President (since 2004) | Head of Mutual Funds since August, 2004 and Managing Director of the Advisor since January, 2005; President of the Columbia Funds, Liberty Funds and Stein Roe Funds since October, 2004; President and Chief Executive Officer of the Nations Funds since January, 2005; President of the Galaxy Funds since April 2005; Director of Bank of America Global Liquidity Funds, plc since May 2005; Director of Banc of America Capital Management (Ireland), Limited since May 2005; Director of FIM Funding, Inc. since January, 2005; Senior Vice President of Columbia Management Distributor, Inc. since January, 2005; Director of Columbia Management Services, Inc. since January, 2005 (formerly Senior Vice President of Columbia Management from January, 2005 to August, 2005; Senior Vice President of BACAP Distributors LLC from January 2005 to July, 2005; President and Chief Executive Officer, CDC IXIS Asset Management Services, Inc. from September, 1998 to August, 2004). | ||||||
| J. Kevin Connaughton (age 41) One Financial Center Boston, MA 02111 Treasurer (since 2000) | Treasurer of the Columbia Funds since October, 2003 and of the Liberty Funds, Stein Roe Funds and All-Star Funds since December, 2000; Managing Director of the Advisor since September, 2005 (formerly Vice President of Columbia Management from April, 2003 to August, 2005; President of the Columbia Funds, Liberty Funds and Stein Roe Funds from February, 2004 to October, 2004; Chief Accounting Officer and Controller of the Liberty Funds and All-Star Funds from February, 1998 to October, 2000); Treasurer of the Galaxy Funds since September, 2002 (formerly Treasurer from December, 2002 to December, 2004 and President from February, 2004 to December, 2004 of the Columbia Management Multi-Strategy Hedge Fund, LLC; Vice President of Colonial Management Associates, Inc. from February, 1998 to October, 2000). | ||||||
| Mary Joan Hoene (age 54) 40 West 57th Street New York, NY 10005 Senior Vice President and Chief Compliance Officer (since 2004) | Senior Vice President and Chief Compliance Officer of the Columbia Funds, Liberty Funds, Stein Roe Funds and All-Star Funds since August, 2004 ; Chief Compliance Officer of the Columbia Management Multi Strategy Hedge Fund since August, 2004. Chief Compliance Officer of the BACAP Alternative Multi-Strategy Hedge Fund LLC since October 2004 (formerly Partner, Carter, Ledyard & Milburn LLP from January, 2001 to August, 2004; Counsel, Carter, Ledyard & Milburn LLP from November, 1999 to December, 2000; Vice President and Counsel, Equitable Life Assurance Society of the United States from April, 1998 to November, 1999). | ||||||
| Michael G. Clarke (age 35) One Financial Center Boston, MA 02111 Chief Accounting Officer (since 2004) | Chief Accounting Officer of the Columbia Funds, Liberty Funds, Stein Roe Funds and All-Star Funds since October, 2004; Managing Director of the Advisor since September, 2005 (formerly Controller of the Columbia Funds, Liberty Funds, Stein Roe Funds and All-Star Funds from May, 2004 to October, 2004; Assistant Treasurer from June, 2002 to May, 2004; Vice President, Product Strategy & Development of the Liberty Funds and Stein Roe Funds from February, 2001 to June, 2002; Assistant Treasurer of the Liberty Funds, Stein Roe Funds and the All-Star Funds from August, 1999 to February, 2001; Audit Manager, Deloitte & Touche LLP from May, 1997 to August, 1999). | ||||||
| Jeffrey R. Coleman (age 35) One Financial Center Boston, MA 02111 Controller (since 2004) | Controller of the Columbia Funds, Liberty Funds, Stein Roe Funds and All-Star Funds since October, 2004 (formerly Vice President of CDC IXIS Asset Management Services, Inc. and Deputy Treasurer of the CDC Nvest Funds and Loomis Sayles Funds from February, 2003 to September, 2004; Assistant Vice President of CDC IXIS Asset Management Services, Inc. and Assistant Treasurer of the CDC Nvest Funds from August, 2000 to February, 2003; Tax Manager of PFPC, Inc. from November, 1996 to August, 2000). | ||||||
| R. Scott Henderson (age 46) One Financial Center Boston, MA 02111 Secretary (since 2004) | Secretary of the Columbia Funds, Liberty Funds and Stein Roe Funds since December, 2004 (formerly Of Counsel, Bingham McCutchen from April, 2001 to September, 2004; Executive Director and General Counsel, Massachusetts Pension Reserves Investment Management Board from September, 1997 to March, 2001). | ||||||
30
COLUMBIA FUNDS
Columbia Greater China Fund
| Growth Funds | Columbia Acorn Fund | ||||||
| Columbia Acorn Select | |||||||
| Columbia Acorn USA | |||||||
| Columbia Growth Stock Fund | |||||||
| Columbia Large Cap Growth Fund | |||||||
| Columbia Marsico 21st Century Fund | |||||||
| Columbia Marsico Focused Equities Fund | |||||||
| Columbia Marsico Growth Fund | |||||||
| Columbia Marsico Mid Cap Fund | |||||||
| Columbia Mid Cap Growth Fund | |||||||
| Columbia Small Cap Growth Fund I | |||||||
| Columbia Small Cap Growth Fund II | |||||||
| Columbia Small Company Equity Fund | |||||||
| Core Funds | Columbia Common Stock Fund | ||||||
| Columbia Large Cap Core Fund | |||||||
| Columbia Small Cap Core Fund | |||||||
| Columbia Young Investor Fund | |||||||
| Value Funds | Columbia Disciplined Value Fund | ||||||
| Columbia Dividend Income Fund | |||||||
| Columbia Large Cap Value Fund | |||||||
| Columbia Mid Cap Value Fund | |||||||
| Columbia Small Cap Value Fund I | |||||||
| Columbia Small Cap Value Fund II | |||||||
| Columbia Strategic Investor Fund | |||||||
| Asset Allocation/Hybrid Funds | Columbia Asset Allocation Fund | ||||||
| Columbia Asset Allocation Fund II | |||||||
| Columbia Balanced Fund | |||||||
| Columbia Liberty Fund | |||||||
| Columbia LifeGoalTM Balanced Growth Portfolio | |||||||
| Columbia LifeGoalTM Growth Portfolio | |||||||
| Columbia LifeGoalTM Income Portfolio | |||||||
| Columbia LifeGoalTM Income and Growth Portfolio | |||||||
| Columbia Thermostat Fund | |||||||
| Index Funds | Columbia Large Cap Enhanced Core Fund | ||||||
| Columbia Large Cap Index Fund | |||||||
| Columbia Mid Cap Index Fund | |||||||
| Columbia Small Cap Index Fund | |||||||
| Tax-Managed Fund | Columbia Tax-Managed Growth Fund | ||||||
| Specialty Funds | Columbia Convertible Securities Fund | ||||||
| Columbia Real Estate Equity Fund | |||||||
| Columbia Technology Fund | |||||||
| Columbia Utilities Fund | |||||||
| Global/International Funds | Columbia Acorn International | ||||||
| Columbia Acorn International Select | |||||||
| Columbia Global Value Fund | |||||||
| Columbia Greater China Fund | |||||||
| Columbia International Stock Fund | |||||||
| Columbia International Value Fund | |||||||
| Columbia Marsico International Opportunities Fund | |||||||
| Columbia Multi-Advisor International Equity Fund | |||||||
| Columbia World Equity Fund | |||||||
31
Columbia Greater China Fund
| Taxable Bond Funds | Columbia Conservative High Yield Fund | ||||||
| Columbia Core Bond Fund | |||||||
| Columbia Federal Securities Fund | |||||||
| Columbia High Income Fund | |||||||
| Columbia High Yield Opportunity Fund | |||||||
| Columbia Income Fund | |||||||
| Columbia Intermediate Bond Fund | |||||||
| Columbia Intermediate Core Bond Fund | |||||||
| Columbia Short Term Bond Fund | |||||||
| Columbia Strategic Income Fund | |||||||
| Columbia Total Return Bond Fund | |||||||
| Columbia U.S. Treasury Index Fund | |||||||
| Tax-Exempt Bond Funds | Columbia California Tax-Exempt Fund | ||||||
| Columbia CA Intermediate Municipal Bond Fund | |||||||
| Columbia Connecticut Tax-Exempt Fund | |||||||
| Columbia CT Intermediate Municipal Bond Fund | |||||||
| Columbia FL Intermediate Municipal Bond Fund | |||||||
| Columbia GA Intermediate Municipal Bond Fund | |||||||
| Columbia High Yield Municipal Fund | |||||||
| Columbia Intermediate Municipal Bond Fund | |||||||
| Columbia MA Intermediate Municipal Bond Fund | |||||||
| Columbia Massachusetts Tax-Exempt Fund | |||||||
| Columbia MD Intermediate Municipal Bond Fund | |||||||
| Columbia Municipal Income Fund | |||||||
| Columbia NC Intermediate Municipal Bond Fund | |||||||
| Columbia New York Tax-Exempt Fund | |||||||
| Columbia NJ Intermediate Municipal Bond Fund | |||||||
| Columbia NY Intermediate Municipal Bond Fund | |||||||
| Columbia OR Intermediate Municipal Bond Fund | |||||||
| Columbia RI Intermediate Municipal Bond Fund | |||||||
| Columbia SC Intermediate Municipal Bond Fund | |||||||
| Columbia Short Term Municipal Income Fund | |||||||
| Columbia Tax-Exempt Fund | |||||||
| Columbia Tax-Exempt Insured Fund | |||||||
| Columbia TX Intermediate Municipal Bond Fund | |||||||
| Columbia VA Intermediate Municipal Bond Fund | |||||||
| Money Market Funds | Columbia Government Plus Reserves | ||||||
| Columbia Treasury Reserves | |||||||
| Columbia Money Market Reserves | |||||||
| Columbia Government Reserves | |||||||
| Columbia Tax-Exempt Reserves | |||||||
| Columbia New York Tax-Exempt Reserves | |||||||
| Columbia Municipal Reserves | |||||||
| Columbia Cash Reserves | |||||||
Please consider the investment objectives, risks, charges and expenses of a mutual fund carefully before investing. Contact us at 800-345-6611 for a prospectus which contains this and other important information about the fund. Read it carefully before you invest.
For complete product information on any Columbia fund, visit our website at www.columbiafunds.com.
Columbia Management is the primary investment management division of Bank of America Corporation. Columbia Management entities furnish investment management services and advise institutional and mutual fund portfolios. Columbia Management Advisors, Inc. and Banc of America Capital Management, LLC, both SEC registered investment advisors and wholly owned subsidiaries of Bank of America, N.A, merged on September 30, 2005. At that time, the newly combined advisor changed its name to Columbia Management Advisors, LLC ("CMA"). CMA will continue to operate as a SEC-registered investment advisor, wholly owned subsidiary of Bank of America, N.A. and part of Columbia Management.
32
IMPORTANT INFORMATION ABOUT THIS REPORT
Columbia Greater China Fund
Transfer Agent
Columbia Management Services, Inc.
P.O. Box 8081
Boston MA 02266-8081
800.345.6611
Distributor
Columbia Management Distributors, Inc.
One Financial Center
Boston MA 02111
Investment Advisor
Columbia Management Advisors, LLC 100 Federal Street
Boston MA 02110
Independent Registered Public Accounting Firm
PricewaterhouseCoopers LLP
125 High Street
Boston, MA 02110
The fund mails one shareholder report to each shareholder address. If you would like more than one report, please call shareholder services at 800-345-6611 and additional reports will be sent to you.
This report has been prepared for shareholders of Columbia Greater China Fund. This report may also be used as sales literature when preceded or accompanied by the current prospectus which provides details of sales charges, investment objectives and operating policies of the fund and with the most recent copy of the Columbia Funds Performance Update.
A description of the fund's proxy voting policies and procedures is available (i) on the fund's website, www.columbiamanagement.com; (ii) on the Securities and Exchange Commission's website at www.sec.gov, and (iii) without charge, upon request, by calling 800-368-0346. Information regarding how the fund voted proxies relating to portfolio securities during the 12-month period ended June 30 is available from the SEC's website. Information regarding how the fund voted proxies relating to portfolio securities is also available from the fund's website.
The fund files a complete schedule of portfolio holdings with the SEC for the first and third quarters of each fiscal year on Form N-Q. The fund's Form N-Q is available on the SEC's website at www.sec.gov and may be reviewed and copied at the SEC's Public Reference Room in Washington, DC. Information on the operation of the Public Reference Room may be obtained by calling 1-800-SEC-0330.
Columbia Management is the primary investment management division of Bank of America Corporation. Columbia Management entities furnish investment management services and advise institutional and mutual fund portfolios. Columbia Management Advisors, Inc. and Banc of America Capital Management, LLC, both SEC registered investment advisors and wholly owned subsidiaries of Bank of America, N.A, merged on September 30, 2005. At that time, the newly combined advisor changed its name to Columbia Management Advisors, LLC ("CMA"). CMA will continue to operate as a SEC-registered investment advisor, wholly owned subsidiary of Bank of America, N.A. and part of Columbia Management.
33

Help your fund reduce printing and postage costs! Elect to get your shareholder reports by eletronic delivery. With Columbia's eDelivery program, you receive an
e-mail message when your shareholder report becomes available online. If your fund account is registered with Columbia Funds, you can sign up quickly and easily on our website at www.columbiafunds.com.
Please note - if you own your fund shares through a financial institution, contact the institution to see if it offers electronic delivery. If you own your fund shares through a retirement plan, electronic delivery may not be available to you.
Columbia Greater China Fund Annual Report, August 31, 2005

PRSRT STD
U.S. Postage
PAID
Holliston, MA
Permit NO. 20

SHC-42/90371-0805 (10/05) 05/7958
Item 2. Code of Ethics.
(a) The registrant has, as of the end of the period covered by this report, adopted a code of ethics that applies to the registrant’s principal executive officer, principal financial officer, principal accounting officer or controller, or persons performing similar functions, regardless of whether these individuals are employed by the registrant or a third party.
(b) During the period covered by this report, there were not any amendments to a provision of the code of ethics adopted in 2(a) above.
(c) During the period covered by this report, there were not any waivers or implicit waivers to a provision of the code of ethics adopted in 2(a) above.
Item 3. Audit Committee Financial Expert.
The registrant’s Board of Trustees has determined that Douglas A. Hacker, Thomas E. Stitzel, Anne-Lee Verville and Richard L. Woolworth, each of whom are members of the registrant’s Board of Trustees and Audit Committee, each qualify as an audit committee financial expert. Mr. Hacker, Mr. Stitzel, Ms. Verville and Mr. Woolworth are each independent trustees, as defined in paragraph (a)(2) of this item’s instructions and collectively constitute the entire Audit Committee.
Item 4. Principal Accountant Fees and Services.
Fee information below is disclosed for the single series of the registrant whose report to stockholders is included in this annual filing. Effective March 1, 2004, the single series of the registrant included in this filing engaged new independent accountants. Unless otherwise noted, fees disclosed below represent fees paid or accrued to the current and predecessor principal accountants while each was engaged by the registrant.
(a) Aggregate Audit Fees billed by the principal accountant for professional services rendered during the fiscal years ended August 31, 2005 and August 31, 2004 are approximately as follows:
2005 |
| 2004 |
| ||
$ | 21,800 |
| $ | 19,800 |
|
Audit Fees include amounts related to the audit of the registrant’s annual financial statements or services that are normally provided by the accountant in connection with statutory and regulatory filings or engagements for those fiscal years.
(b) Aggregate Audit-Related Fees billed by the principal accountant for professional services rendered during the fiscal years ended August 31, 2005 and August 31, 2004 are approximately as follows:
2005 |
| 2004 |
| ||
$ | 3,800 |
| $ | 3,500 |
|
Audit-Related Fees include amounts for assurance and related services by the principal accountant that are reasonably related to the performance of the audit of the registrant’s financial statements and are not reported in Audit Fees above. In both fiscal years 2005 and 2004, Audit-Related Fees include certain agreed-upon procedures performed for semi-annual shareholder reports. In fiscal year 2005 Audit-Related Fees also include certain agreed-upon procedures related to the review of the registrant’s anti-money laundering program.
(c) Aggregate Tax Fees billed by the principal accountant for professional services rendered during the fiscal years ended August 31, 2005 and August 31, 2004 are approximately as follows:
2005 |
| 2004 |
| ||
$ | 2,700 |
| $ | 2,500 |
|
Tax Fees in both fiscal years 2005 and 2004 consist primarily of the review of annual tax returns and include amounts for professional services by the principal accountant for tax compliance, tax advice and tax planning.
(d) Aggregate All Other Fees billed by the principal accountant for professional services rendered during the fiscal years ended August 31, 2005 and August 31, 2004 are approximately as follows:
2005 |
| 2004 |
| ||
$ | 0 |
| $ | 0 |
|
All Other Fees include amounts for products and services provided by the principal accountant, other than the services reported in paragraphs (a) through (c) above.
None of the amounts described in paragraphs (a) through (d) above were approved pursuant to the “de minimis” exception under paragraph (c)(7)(i)(C) of Rule 2-01 of Regulation S-X.
(e)(1) Audit Committee Pre-Approval Policies and Procedures
I. General Overview
The Audit Committee of the registrant has adopted a formal policy (the “Policy”) which sets forth the procedures and the conditions pursuant to which the Audit Committee will pre-approve (i) all audit and non-audit (including audit related, tax and all other) services provided by the registrant’s independent auditor to the registrant and individual funds (collectively “Fund Services”), and (ii) all non-audit services provided by the registrant’s independent auditor to the funds’ adviser or a control affiliate of the adviser, that relate directly to the funds’ operations and financial reporting (collectively “Fund-related Adviser Services”). A “control affiliate” is an entity controlling, controlled by, or under common control with the adviser that provides ongoing services to the funds, and the term “adviser” is deemed to exclude any unaffiliated sub-adviser whose role is primarily portfolio management and is sub-contracted or overseen by another investment adviser. The adviser and control affiliates are collectively referred to as “Adviser Entities.”
The Audit Committee uses a combination of specific (on a case-by-case basis as potential services are contemplated) and general (pre-determined list of permitted services) pre-approvals. Unless a type of service has received general pre-approval, it will require specific pre-approval by the Audit Committee if it is to be provided by the independent auditor.
The Policy does not delegate the Audit Committee’s responsibilities to pre-approve services performed by the independent auditor to management.
II. General Procedures
On an annual basis, the Fund Treasurer and/or Director of Trustee Administration shall submit to the Audit Committee a schedule of the types of Fund Services and Fund-related Adviser Services that are subject to general pre-approval.
These schedules will provide a description of each type of service that is subject to general pre-approval and, where possible, will provide estimated fees for each instance of providing each service. This general pre-approval and related fees (where provided) will generally cover a one-year period (for example, from June 1 through May 31 of the following year). The Audit Committee will review and approve the types of services and review the projected fees for the next one-year period and may add to, or subtract from, the list of general pre-approved services from time to time, based on subsequent determinations. This approval acknowledges that the Audit Committee is in agreement with the specific types of services that the independent auditor will be permitted to perform. The fee amounts will be updated to the extent necessary at other regularly scheduled meetings of the Audit Committee.
In addition to the fees for each individual service, the Audit Committee has the authority to implement a fee cap on the aggregate amount of non-audit services provided to an individual fund.
If, subsequent to general pre-approval, a fund, its investment adviser or a control affiliate determines that it would like to engage the independent auditor to perform a service that requires pre-approval and that is not included in the general pre-approval list, the specific pre-approval procedure shall be as follows:
• A brief written request shall be prepared by management detailing the proposed engagement with explanation as to why the work is proposed to be performed by the independent auditor;
• The request should be addressed to the Audit Committee with copies to the Fund Treasurer and/or Director of Trustee Administration;
• The Fund Treasurer and/or Director of Trustee Administration will arrange for a discussion of the service to be included on the agenda for the next regularly scheduled Audit Committee meeting, when the Committee will discuss the proposed engagement and approve or deny the request.
• If the timing of the project is critical and the project needs to commence before the next regularly scheduled meeting, the Chairperson of the Audit Committee may approve or deny the request on behalf of the Audit Committee, or, in the Chairperson’s discretion, determine to call a special meeting of the Audit Committee for the purpose of considering the proposal. Should the Chairperson of the Audit Committee be unavailable, any other member of the Audit Committee may serve as an alternate for the purpose of approving or denying the request. Discussion with the Chairperson (or alternate, if necessary) will be arranged by the Fund Treasurer and/or Director of Trustee Administration. The independent auditor will not commence any such project unless and until specific approval has been given.
III. Certain Other Services Provided to Adviser Entities
The Audit Committee recognizes that there are cases where services proposed to be provided by the independent auditor to the adviser or control affiliates are not Fund-related Adviser Services within the meaning of the Policy, but nonetheless may be relevant to the Audit Committee’s ongoing evaluation of the auditor’s independence and objectivity with respect to its audit services to the funds. As a result, in all cases where an Adviser Entity engages the independent auditor to provide audit or non-audit services that are not Fund Services or Fund-related Adviser Services, were not subject to pre-approval by the Audit Committee, and the projected fees for any such engagement (or the aggregate of all such engagements during the period covered by the Policy) exceeds a pre-determined threshold established by the Audit Committee; the independent auditor, Fund Treasurer and/or Director of Trustee Administration will notify the Audit Committee not later than its next meeting. Such notification shall include a general description of the services provided, the entity that is to be the recipient of such services, the timing of the engagement, the entity’s reasons for selecting the independent auditor, and the projected fees. Such information will allow the Audit Committee to consider whether non-audit services provided to the adviser and Adviser Entities, which were not subject to Audit Committee pre-approval, are compatible with maintaining the auditor’s independence with respect to the Funds.
IV. Reporting to the Audit Committee
The Fund Treasurer or Director of Trustee Administration shall report to the Audit Committee at each of its regular meetings regarding all Fund Services or Fund-related Adviser Services initiated since the last such report was rendered, including:
• A general description of the services, and
• Actual billed and projected fees, and
• The means by which such Fund Services or Fund-related Adviser Services were pre-approved by the Audit Committee.
In addition, the independent auditor shall report to the Audit Committee annually, and no more than 90 days prior to the filing of audit reports with the SEC, all non-audit services provided to entities in the funds’ “investment company complex,” as defined by SEC rules, that did not require pre-approval under the Policy.
V. Amendments; Annual Approval by Audit Committee
The Policy may be amended from time to time by the Audit Committee. Prompt notice of any amendments will be provided to the independent auditor, Fund Treasurer and Director of Trustee Administration. The Policy shall be reviewed and approved at least annually by the Audit Committee.
*****
(e)(2) The percentage of services described in paragraphs (b) through (d) of this Item approved pursuant to the “de minimis” exception under paragraph (c)(7)(i)(C) of Rule 2-01 of Regulation S-X during both fiscal years ended August 31, 2005 and August 31, 2004 was zero.
(f) Not applicable.
(g) All non-audit fees billed by the registrant’s accountant for services rendered to the registrant for the fiscal years ended August 31, 2005 and August 31, 2004 are disclosed in (b) through (d) of this Item.
During the fiscal years ended August 31, 2005 and August 31, 2004, there were no Audit-Related Fees or Tax Fees that were approved for services to the investment adviser (not including any sub-adviser whose role is primarily portfolio management and is subcontracted with or overseen by another investment adviser) and any entity controlling, controlled by, or under common control with the adviser that provides ongoing services to the registrant under paragraph (c)(7)(ii) of Rule 2-01 of Regulation S-X. During the fiscal years ended August 31, 2005 and August 31, 2004, All Other Fees that were approved pursuant to paragraph (c)(7)(ii) of Rule 2-01 of Regulation S-X were
approximately $95,500 and $95,000, respectively. For both fiscal years, All Other Fees consist primarily of internal controls reviews of the registrant’s transfer agent.
The percentage of Audit-Related Fees, Tax Fees and All Other Fees required to be approved under paragraph (c)(7)(ii) of Rule 2-01 of Regulation S-X that were approved under the “de minimis” exception during both fiscal years ended August 31, 2005 and August 31, 2004 was zero.
(h) The registrant’s Audit Committee of the Board of Directors has considered whether the provision of non-audit services that were rendered to the registrant’s adviser (not including any sub-adviser whose role is primarily portfolio management and is subcontracted with or overseen by another investment adviser), and any entity controlling, controlled by, or under common control with the investment adviser that provides ongoing services to the registrant that were not pre-approved pursuant to paragraph (c)(7)(ii) of Rule 2-01 of Regulation S-X, is compatible with maintaining the principal accountant’s independence. The Audit Committee determined that the provision of such services is compatible with maintaining the principal accountant’s independence.
Item 5. Audit Committee of Listed Registrants.
Not applicable.
Item 6. Schedule of Investments
The registrant’s “Schedule I – Investments in securities of unaffiliated issuers” (as set forth in 17 CFR 210.12-12) is included in Item 1 of this Form N-CSR.
Item 7. Disclosure of Proxy Voting Policies and Procedures for Closed-End Management Investment Companies.
Not applicable.
Item 8. Portfolio Managers of Closed-End Management Investment Companies.
Not applicable.
Item 9. Purchases of Equity Securities by Closed-End Management Investment Company and Affiliated Purchasers.
Not applicable.
Item 10. Submission of Matters to a Vote of Security Holders.
There have not been any material changes to the procedures by which shareholders may recommend nominees to the registrant’s board of directors, since those procedures were
last disclosed in response to requirements of Item 7(d)(2)(ii)(G) of Schedule 14A or this Item.
Item 11. Controls and Procedures.
(a) The registrant’s principal executive officer and principal financial officers, based on their evaluation of the registrant’s disclosure controls and procedures as of a date within 90 days of the filing of this report, has concluded that such controls and procedures are adequately designed to ensure that information required to be disclosed by the registrant in Form N-CSR is accumulated and communicated to the registrant’s management, including the principal executive officer and principal financial officer, or persons performing similar functions, as appropriate to allow timely decisions regarding required disclosure.
(b) There were no changes in the registrant’s internal control over financial reporting that occurred during the registrant’s second fiscal quarter of the period covered by this report that has materially affected, or is reasonably likely to materially affect, the registrant’s internal control over financial reporting.
Item 12. Exhibits.
(a)(1) Code of ethics required to be disclosed under Item 2 of Form N-CSR attached hereto as Exhibit 99.CODE ETH.
(a)(2) Certifications pursuant to Rule 30a-2(a) under the Investment Company Act of 1940 (17 CFR 270.30a-2(a)) attached hereto as Exhibit 99.CERT.
(a)(3) Not applicable.
(b) Certification pursuant to Rule 30a-2(b) under the Investment Company Act of 1940 (17 CFR 270.30a-2(b)) attached hereto as Exhibit 99.906CERT.
SIGNATURES
Pursuant to the requirements of the Securities Exchange Act of 1934 and the Investment Company Act of 1940, the registrant has duly caused this report to be signed on its behalf by the undersigned, thereunto duly authorized.
(registrant) |
| Columbia Funds Trust II |
| |||
| ||||||
| ||||||
By (Signature and Title) |
| /s/ Christopher L. Wilson |
| |||
|
| Christopher L. Wilson, President |
| |||
| ||||||
| ||||||
Date |
| October 27, 2005 |
| |||
Pursuant to the requirements of the Securities Exchange Act of 1934 and the Investment Company Act of 1940, this report has been signed below by the following persons on behalf of the registrant and in the capacities and on the dates indicated.
By (Signature and Title) |
| /s/ Christopher L. Wilson |
| |||
|
| Christopher L. Wilson, President |
| |||
|
| |||||
| ||||||
Date |
| October 27, 2005 |
| |||
|
|
|
| |||
|
|
|
| |||
By (Signature and Title) |
| /s/ J. Kevin Connaughton |
| |||
|
| J. Kevin Connaughton, Treasurer |
| |||
|
|
|
| |||
|
|
|
| |||
Date |
| October 27, 2005 |
| |||