UNITED STATES
SECURITIES AND EXCHANGE COMMISSION
Washington, D.C. 20549
FORM N-CSR
CERTIFIED SHAREHOLDER REPORT OF REGISTERED
MANAGEMENT INVESTMENT COMPANIES
Investment Company Act file number | 811-3009 |
|
Columbia Funds Trust II |
(Exact name of registrant as specified in charter) |
|
One Financial Center, Boston, Massachusetts | | 02111 |
(Address of principal executive offices) | | (Zip code) |
|
James R. Bordewick, Jr., Esq.
Columbia Management Advisors, LLC
One Financial Center
Boston, MA 02111 |
(Name and address of agent for service) |
|
Registrant’s telephone number, including area code: | 1-617-426-3750 | |
|
Date of fiscal year end: | August 31, 2006 | |
|
Date of reporting period: | February 28, 2006 | |
| | | | | | | | |
Form N-CSR is to be used by management investment companies to file reports with the Commission not later than 10 days after the transmission to stockholders of any report that is required to be transmitted to stockholders under Rule 30e-1 under the Investment Company Act of 1940 (17 CFR 270.30e-1). The Commission may use the information provided on Form N-CSR in its regulatory, disclosure review, inspection, and policymaking roles.
A registrant is required to disclose the information specified by Form N-CSR, and the Commission will make this information public. A registrant is not required to respond to the collection of information contained in Form N-CSR unless the Form displays a currently valid Office of Management and Budget (“OMB”) control number. Please direct comments concerning the accuracy of the information collection burden estimate and any suggestions for reducing the burden to Secretary, Securities and Exchange Commission, 450 Fifth Street, NW, Washington, DC 20549-0609. The OMB has reviewed this collection of information under the clearance requirements of 44 U.S.C. § 3507.
Item 1. Reports to Stockholders.

Columbia
Greater China Fund
Semiannual Report
February 28, 2006
Table of Contents
| Performance Information | | | 1 | | |
|
| Fund Profile | | | 2 | | |
|
| Understanding Your Expenses | | | 3 | | |
|
| Financial Statements | | | 4 | | |
|
| Investment Portfolio | | | 5 | | |
|
| Statement of Assets and Liabilities | | | 9 | | |
|
| Statement of Operations | | | 10 | | |
|
| Statements of Changes in Net Assets | | | 11 | | |
|
| Financial Highlights | | | 13 | | |
|
| Notes to Financial Statements | | | 17 | | |
|
Board Consideration and Approval of
Investment Advisory Agreements | | | 24 | | |
|
| Summary of Management Fee Evaluation by Independent Fee Consultant | | | 27 | | |
|
| Columbia Funds | | | 31 | | |
|
Important Information
About This Report | | | 33 | | |
|
PRESIDENT'S MESSAGE
Columbia Greater China Fund

A message to our valued clients
In the mutual fund business, success can be measured a number of different ways. Performance is a key measure—the one that gains most attention. But fees and service are also important. In that regard, we are pleased to report that Columbia Management has experienced success on all three fronts over the past year. Even more important, our shareholders have benefited from this success.
Because performance ultimately determines investment success, we have devoted considerable energy to improving the performance of all Columbia funds. And we are happy to report that we have made considerable progress toward this important goal.1
Columbia has also taken great strides toward making fund operations more cost effective, which has translated into lower expense ratios on many Columbia funds. In this regard, we believe we still have more work to do, and we will continue to explore opportunities for reining in expenses to the benefit of all our shareholders.
On the service front, we have made it easy and convenient for shareholders to do business with us both on the web at www.columbiafunds.com or over the phone at 800.345.6611. In fact, we've recently upgraded our automated phone system with an advanced speech recognition system that allows callers to interact with the system using natural spoken commands.
After secure login, shareholders can buy, sell or exchange funds either online or over the phone. (Buying shares requires that a link has been established between the shareholder's bank account and Columbia.) Up-to-date performance and pricing information is available online and over the phone. At www.columbiafunds.com, shareholders can also update important personal information and get access to prospectuses and fund reports, which reduces paper clutter for shareholders and translates into a reduction of costs for the funds.
At Columbia Management, we think that you'll like what you see as you read the reports for the period ended February 28, 2006. We are committed to continued improvements in an effort to help our shareholders reach their long-term financial goals. And we look forward to continuing to work with you, our valued financial clients, in the years to come.
Sincerely,

Christopher L. Wilson
President, Columbia Funds
1Past performance is no guarantee of future results.
The views expressed in the President's Message reflect the current views of Columbia Funds. These views are not guarantees of future performance and involve certain risks, uncertainties and assumptions that are difficult to predict so actual outcomes and results may differ significantly from the views expressed. These views are subject to change at any time based upon economic, market or other conditions and Columbia Funds disclaims any responsibility to update such views. These views may not be relied on as investment advice and, because investment decisions for a Columbia Fund are based on numerous factors, may not be relied on as an indication of trading intent on behalf of any particular Columbia Fund. References to specific company securities should not be construed as a recommendation or investment advice.
Not FDIC
Insured
May Lose Value
No Bank Guarantee
PERFORMANCE INFORMATION
Columbia Greater China Fund
Performance data quoted represents past performance and current performance may be lower or higher. Past performance is no guarantee of future results. The investment return and principal value will fluctuate so that shares, when redeemed, may be worth more or less than the original cost. Please visit www.columbiafunds.com for daily and most recent month-end performance updates.
Growth of a $10,000 investment 05/16/97 – 02/28/06 ($)
| Share class | |
| Sales charge | | without | | with | |
| Class A | | | 22,462 | | | | 21,170 | | |
| Class B | | | 21,154 | | | | 21,154 | | |
| Class C | | | 21,435 | | | | 21,435 | | |
| Class Z | | | 23,581 | | | | n/a | | |
The table above shows the growth in value of a hypothetical $10,000 investment in each share class of Columbia Greater China Fund during the stated time, and does not reflect the deduction of taxes that a shareholder would pay on fund distributions or the redemption of fund shares.
Average annual total return as of 02/28/06 (%)
| Share class | | A | | B | | C | | Z | |
| Inception | | 05/16/97 | | 05/16/97 | | 05/16/97 | | 05/16/97 | |
| Sales charge | | without | | with | | without | | with | | without | | with | | without | |
| 6-month (cumulative) | | | 16.33 | | | | 9.65 | | | | 15.89 | | | | 10.89 | | | | 15.89 | | | | 14.89 | | | | 16.44 | | |
| 1-year | | | 21.61 | | | | 14.61 | | | | 20.70 | | | | 15.70 | | | | 20.73 | | | | 19.73 | | | | 21.87 | | |
| 5-year | | | 10.47 | | | | 9.17 | | | | 9.65 | | | | 9.37 | | | | 9.63 | | | | 9.63 | | | | 11.31 | | |
| Life | | | 9.64 | | | | 8.91 | | | | 8.90 | | | | 8.90 | | | | 9.06 | | | | 9.06 | | | | 10.25 | | |
Average annual total return as of 12/31/05 (%)
| Share class | | A | | B | | C | | Z | |
| Sales charge | | without | | with | | without | | with | | without | | with | | without | |
| 6-month (cumulative) | | | 6.16 | | | | 0.06 | | | | 5.76 | | | | 0.76 | | | | 5.77 | | | | 4.77 | | | | 6.30 | | |
| 1-year | | | 9.04 | | | | 2.77 | | | | 8.22 | | | | 3.22 | | | | 8.24 | | | | 7.24 | | | | 9.31 | | |
| 5-year | | | 8.63 | | | | 7.35 | | | | 7.83 | | | | 7.53 | | | | 7.80 | | | | 7.80 | | | | 9.47 | | |
| Life | | | 8.27 | | | | 7.53 | | | | 7.54 | | | | 7.54 | | | | 7.70 | | | | 7.70 | | | | 8.88 | | |
The "with sales charge" returns include the maximum initial sales charge of 5.75% for class A shares, maximum contingent deferred sales charge of 5.00% for class B shares and 1.00% for class C shares for the first year only. The "without sales charge" returns do not include the effect of sales charges. If they had, returns would be lower.
Performance for different share classes will vary based on differences in sales charges and fees associated with each class.
All results shown assume reinvestment of distributions. Class Z shares are sold at net asset value with no Rule 12b-1 fees. Class Z shares have limited eligibility and the investment minimum requirement may vary. Please see the fund's prospectus for details.
Performance results reflect any voluntary waivers or reimbursement of fund expenses by the advisor or its affiliates. Absent these waivers or reimbursement arrangements, performance results would have been lower.
| Net asset value per share | |
| as of 02/28/06 ($) | | | | | |
| Class A | | | 28.21 | | |
| Class B | | | 27.64 | | |
| Class C | | | 28.01 | | |
| Class Z | | | 29.23 | | |
| Distributions declared per share | |
| 09/01/05 – 02/28/06 ($) | | | | | |
| Class A | | | 0.45 | | |
| Class B | | | 0.27 | | |
| Class C | | | 0.27 | | |
| Class Z | | | 0.51 | | |
1
FUND PROFILE
Columbia Greater China Fund
Performance data quoted represents past performance and current performance may be lower or higher. Past performance is no guarantee of future results. The investment return and principal value will fluctuate so that shares, when redeemed, may be worth more or less than the original cost. Please visit www.columbiafunds.com for daily and most recent month-end performance updates.
Summary
+16.33%
 Class A Shares
+24.15%
 MSCI China Index
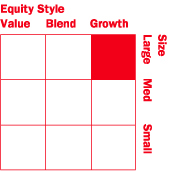
Management Style
Summary
n For the six-month period ended February 28, 2006, the Columbia Greater China Fund's Class A Shares returned 16.33% without sales charge. The fund's return fell between the returns of its two benchmarks. It was lower than the 24.15% return of the MSCI China Index, which does not include the full range of Greater China markets represented in the fund. It was higher than the 8.02% return of the Hang Seng Stock Index, which measures the performance of Hong Kong stocks.1 The fund's return was less than the average return of the Lipper China Region Funds Category, which was 18.24%.2
n The fund enjoyed strong gains from its investments in China, which soared as high economic growth continued and liquidity flowed into Chinese equities in anticipation of further currency appreciation. The fund's investments in Hong Kong and Taiwan did not keep pace with Chinese equities for the period. The recent run-up in China's equities has led the fund's management team to tilt towards a more defensive positioning, in general, for the near term.
n Financials and energy stocks were the strongest contributors to performance. An underweight in banking stocks and in the materials sector, which rebounded late in the period, detracted from performance. The fund remains underweight in materials because excess capacity remains a concern for the sector going forward.
1 The Morgan Stanley Capital International (MSCI) China Index is designed to broadly and fairly represent the full diversity of business activities in China. This index aims to capture 85% of the free float adjusted market capitalization in each industry group. The Hang Seng Stock Index is an index that tracks the performance of approximately 70% of the total market capitalization of the stock exchange of Hong Kong. Unlike the fund, indices are not investments, do not incur fees or expenses and are not professionally managed. It is not possible to invest directly in an index. Securities in the fund may not match those in an index.
2 Lipper Inc., a widely respected data provider in the industry, calculates an average total return (assuming reinvestment of distributions) for mutual funds with investment objectives similar to those of the fund. Lipper makes no adjustment for the effect of sales loads.
Portfolio Management
Jasmine Huang, CFA, CPA
n With the fund since 2005
n MBA, Williamette University; BA, Shenzhen University
Fred Copper, CFA
n With the fund since 2005
n MBA, University of Chicago; BS, Boston College
Equity investments are affected by stock market fluctuations that occur in response to economic and business developments.
International investing may involve certain risks, including foreign taxation, currency fluctuations, risks associated with possible differences in financial standards and other monetary and political risks. A portfolio of stocks from a single region poses additional risks due to limited diversification.
Some of the countries the fund invests in are considered emerging economies, which means there may be greater risks associated with investing there than in more developed countries. In addition, concentration of investments in a single region may result in greater volatility.
Management style is determined by Columbia Management and is based on the investment strategy and process as outlined in the fund's prospectus.
2
UNDERSTANDING YOUR EXPENSES
Columbia Greater China Fund
Estimating your actual expenses
To estimate the expenses that you paid over the period, first you will need your account balance at the end of the period:
g For shareholders who receive their account statements from Columbia Management Services, Inc., your account balance is available online at www.columbiafunds.com or by calling Shareholder Services at 800.345.6611.
g For shareholders who receive their account statements from their brokerage firm, contact your brokerage firm to obtain your account balance.
1. Divide your ending account balance by $1,000. For example, if an account balance was $8,600 at the end of the period, the result would be 8.6.
2. In the section of the table below titled "Expenses paid during the period," locate the amount for your share class. You will find this number is in the column labeled "actual." Multiply this number by the result from step 1. Your answer is an estimate of the expenses you paid on your account during the period.
As a fund shareholder, you incur two types of costs. There are transaction costs, which generally include sales charges on purchases and may include redemption or exchange fees. There are also ongoing costs, which generally include investment advisory, Rule 12b-1 fees and other fund expenses. The information on this page is intended to help you understand your ongoing costs of investing in the fund and to compare these costs with the ongoing costs of investing in other mutual funds.
Analyzing your fund's expenses by share class
To illustrate these ongoing costs, we have provided an example and calculated the expenses paid by investors in each share class during the reporting period. The information in the following table is based on an initial investment of $1,000, which is invested at the beginning of the reporting period and held for the entire period. Expense information is calculated two ways and each method provides you with different information. The amount listed in the "actual" column is calculated using the fund's actual operating expenses and total return for the period. The amount listed in the "hypothetical" column for each share class assumes that the return each year is 5% before expenses and includes the fund's actual expense ratio. You should not use the hypothetical account values and expenses to estimate either your actual account balance at the end of the period or the expenses you paid during this reporting period.
09/01/05 – 02/28/06
| | | Account value at the
beginning of the period ($) | | Account value at the
end of the period ($) | | Expenses paid
during the period ($) | | Fund's annualized
expense ratio (%) | |
| | | | Actual | | | | Hypothetical | | | | Actual | | | | Hypothetical | | | | Actual | | | | Hypothetical | | | | | | |
| Class A | | | 1,000.00 | | | | 1,000.00 | | | | 1,163.30 | | | | 1,024.79 | | | | 8.85 | | | | 8.28 | | | | 1.65 | | |
| Class B | | | 1,000.00 | | | | 1,000.00 | | | | 1,158.88 | | | | 1,012.89 | | | | 12.85 | | | | 11.98 | | | | 2.40 | | |
| Class C | | | 1,000.00 | | | | 1,000.00 | | | | 1,158.88 | | | | 1,012.89 | | | | 12.85 | | | | 11.98 | | | | 2.40 | | |
| Class Z | | | 1,000.00 | | | | 1,000.00 | | | | 1,164.39 | | | | 1,017.85 | | | | 7.51 | | | | 7.00 | | | | 1.40 | | |
Expenses paid during the period are equal to the fund's respective class annualized expense ratio, multiplied by the average account value over the period, then multiplied by the number of days in the fund's most recent fiscal half-year and divided by 365.
Had the transfer agent not waived or reimbursed a portion of expenses, total return would have been reduced.
It is important to note that the expense amounts shown in the table are meant to highlight only ongoing costs of investing in the fund and do not reflect any transaction costs, such as sales charges, redemption or exchange fees. Therefore, the hypothetical examples provided will not help you determine the relative total costs of owning shares of different funds. If these transaction costs were included, your costs would have been higher.
Compare with other funds
Since all mutual funds are required to include the same hypothetical calculations about expenses in shareholder reports, you can use this information to compare the ongoing cost of investing in the fund with other funds. To do so, compare the 5% hypothetical example with the 5% hypothetical examples that appear in the shareholder reports of other funds. As you compare hypothetical examples of other fund companies, it is important to note that hypothetical examples are meant to highlight the continuing cost of investing in a fund and do not reflect any transaction costs, such as sales charges or redemption or exchange fees.
3
FINANCIAL STATEMENTS
February 28, 2006 (Unaudited) Columbia Greater China Fund
A guide to understanding your fund's financial statements
| Investment Portfolio | | The investment portfolio details all of the fund's holdings and their market value as of the last day of the reporting period. Portfolio holdings are organized by type of asset, industry, country or geographic region (if applicable) to demonstrate areas of concentration and diversification. | |
|
| Statement of Assets and Liabilities | | This statement details the fund's assets, liabilities, net assets and share price for each share class as of the last day of the reporting period. Net assets are calculated by subtracting all the fund's liabilities (including any unpaid expenses) from the total of the fund's investment and non-investment assets. The share price for each class is calculated by dividing net assets for that class by the number of shares outstanding in that class as of the last day of the reporting period. | |
|
| Statement of Operations | | This statement details income earned by the fund and the expenses accrued by the fund during the reporting period. The Statement of Operations also shows any net gain or loss the fund realized on the sales of its holdings during the period, as well as any unrealized gains or losses recognized over the period. The total of these results represents the fund's net increase or decrease in net assets from operations. | |
|
| Statement of Changes in Net Assets | | This statement demonstrates how the fund's net assets were affected by its operating results, distributions to shareholders and shareholder transactions (e.g., subscriptions, redemptions and dividend reinvestments) during the reporting period. The Statement of Changes in Net Assets also details changes in the number of shares outstanding. | |
|
| Notes to Financial Statements | | These notes disclose the organizational background of the fund, its significant accounting policies (including those surrounding security valuation, income recognition and distributions to shareholders), federal tax information, fees and compensation paid to affiliates and significant risks and contingencies. | |
|
| Financial Highlights | | The financial highlights demonstrate how the fund's net asset value per share was affected by the fund's operating results. The financial highlights table also discloses the classes' performance and certain key ratios (e.g., class expenses and net investment income as a percentage of average net assets). | |
|
4
INVESTMENT PORTFOLIO
February 28, 2006 (Unaudited) Columbia Greater China Fund
Common Stocks – 96.8%
| CONSUMER DISCRETIONARY – 7.4% | | | | Shares | | Value ($) | |
| Distributors – 3.9% | | China Resources Enterprise Ltd. | | | 948,000 | | | | 2,082,208 | | |
| | | Li & Fung Ltd. | | | 1,136,000 | | | | 2,290,621 | | |
| | | | | | Distributors Total | | | | 4,372,829 | | |
| Hotels, Restaurants & Leisure – 1.3% | | Cafe de Coral Holdings Ltd. | | | 950,000 | | | | 1,199,078 | | |
| | | Shanghai Jinjiang International Hotels
Development Co., Ltd., Class B | | | 362,600 | | | | 267,635 | | |
| | | | | | Hotels, Restaurants & Leisure Total | | | | 1,466,713 | | |
| Specialty Retail – 2.2% | | Esprit Holdings Ltd. | | | 315,000 | | | | 2,417,890 | | |
| | | | | | Specialty Retail Total | | | | 2,417,890 | | |
| | | | | | CONSUMER DISCRETIONARY TOTAL | | | | 8,257,432 | | |
| CONSUMER STAPLES – 3.0% | |
| Beverages – 1.4% | | Dynasty Fine Wines Group Ltd. | | | 2,490,000 | | | | 1,006,091 | | |
| | | Yantai Changyu Pioneer Wine Co., Class B | | | 244,800 | | | | 588,389 | | |
| | | | | | Beverages Total | | | | 1,594,480 | | |
| Food Products – 1.6% | | China Mengniu Dairy Co., Ltd. | | | 1,740,000 | | | | 1,786,193 | | |
| | | | | | Food Products Total | | | | 1,786,193 | | |
| | | | | | CONSUMER STAPLES TOTAL | | | | 3,380,673 | | |
| ENERGY – 21.8% | |
| Oil, Gas & Consumable Fuels – 21.8% | | China Shenhua Energy Co., Ltd., Class H (a) | | | 1,531,000 | | | | 2,297,142 | | |
| | | CNOOC Ltd. | | | 8,616,500 | | | | 7,159,522 | | |
| | | PetroChina Co., Ltd., Class H | | | 14,146,000 | | | | 13,782,608 | | |
| | | Yanzhou Coal Mining Co., Ltd., Class H | | | 1,418,000 | | | | 1,160,829 | | |
| | | | | | Oil, Gas & Consumable Fuels Total | | | | 24,400,101 | | |
| | | | | | ENERGY TOTAL | | | | 24,400,101 | | |
| FINANCIALS – 15.3% | |
| Commercial Banks – 0.8% | | Dah Sing Financial Holdings Ltd. | | | 134,400 | | | | 939,732 | | |
| | | | | | Commercial Banks Total | | | | 939,732 | | |
| Consumer Finance – 0.4% | | Aeon Credit Service Co., Ltd. | | | 524,000 | | | | 415,396 | | |
| | | | | | Consumer Finance Total | | | | 415,396 | | |
| Insurance – 7.4% | | China Life Insurance Co., Ltd., Class H (a) | | | 5,233,000 | | | | 5,917,819 | | |
| | | Ping An Insurance (Group) Co., Ltd., Class H | | | 1,043,500 | | | | 2,405,005 | | |
| | | | | | Insurance Total | | | | 8,322,824 | | |
| Real Estate – 6.7% | | Cheung Kong Holdings Ltd. | | | 114,000 | | | | 1,197,537 | | |
| | | Guangzhou R&F Properties Co., Ltd., Class H (a) | | | 319,200 | | | | 1,346,490 | | |
| | | Shanghai Forte Land Co., Ltd., Class H | | | 1,522,000 | | | | 653,377 | | |
| | | Sun Hung Kai Properties Ltd. | | | 240,000 | | | | 2,495,985 | | |
| | | Swire Pacific Ltd., Class A | | | 185,000 | | | | 1,764,975 | | |
| | | | | | Real Estate Total | | | | 7,458,364 | | |
| | | | | | FINANCIALS TOTAL | | | | 17,136,316 | | |
See Accompanying Notes to Financial Statements.
5
February 28, 2006 (Unaudited) Columbia Greater China Fund
Common Stocks – (continued)
| HEALTH CARE – 0.6% | | | | Shares | | Value ($) | |
| Health Care Equipment & Supplies – 0.0% | | Pihsiang Machinery Manufacturing Co., Ltd. | | | 1 | | | | 2 | | |
| | | | | | Health Care Equipment & Supplies Total | | | | 2 | | |
| Pharmaceuticals – 0.6% | | Tong Ren Tang Technologies Co., Ltd., Class H | | | 289,000 | | | | 604,494 | | |
| | | | | | Pharmaceuticals Total | | | | 604,494 | | |
| | | | | | HEALTH CARE TOTAL | | | | 604,496 | | |
| INDUSTRIALS – 19.8% | |
| Electrical Equipment – 3.9% | | Dongfang Electrical Machinery Co., Ltd., Class H | | | 486,000 | | | | 726,662 | | |
| | | Harbin Power Equipment Co., Ltd., Class H | | | 1,504,000 | | | | 1,231,519 | | |
| | | Shanghai Electric Group Co., Ltd., Class H (a) | | | 5,480,000 | | | | 2,411,175 | | |
| | | | | | Electrical Equipment Total | | | | 4,369,356 | | |
| Industrial Conglomerates – 2.3% | | Hutchison Whampoa Ltd. | | | 278,200 | | | | 2,636,226 | | |
| | | | | | Industrial Conglomerates Total | | | | 2,636,226 | | |
| Transportation Infrastructure – 13.6% | | Anhui Expressway Co., Ltd., Class H | | | 1,442,000 | | | | 865,732 | | |
| | | Beijing Capital International Airport Co., Ltd., Class H | | | 1,080,000 | | | | 605,515 | | |
| | | China Merchants Holdings International Co., Ltd. | | | 1,568,000 | | | | 4,436,210 | | |
| | | Cosco Pacific Ltd. | | | 1,986,000 | | | | 4,143,329 | | |
| | | Hainan Meilan International Airport Co., Ltd., Class H | | | 1,701,000 | | | | 1,158,810 | | |
| | | Jiangsu Expressway Co., Ltd., Class H | | | 2,198,000 | | | | 1,408,979 | | |
| | | Zhejiang Expressway Co., Ltd., Class H | | | 3,628,000 | | | | 2,559,881 | | |
| | | | | | Transportation Infrastructure Total | | | | 15,178,456 | | |
| | | | | | INDUSTRIALS TOTAL | | | | 22,184,038 | | |
| INFORMATION TECHNOLOGY – 3.2% | |
| Communications Equipment – 0.4% | | Comba Telecom Systems Holdings Ltd. | | | 1,058,000 | | | | 412,195 | | |
| | | | | | Communications Equipment Total | | | | 412,195 | | |
| Computers & Peripherals – 1.0% | | Lenovo Group Ltd. | | | 2,654,000 | | | | 1,088,752 | | |
| | | | | | Computers & Peripherals Total | | | | 1,088,752 | | |
| Electronic Equipment & Instruments – 0.5% | | Hon Hai Precision Industry Co., Ltd. | | | 93,427 | | | | 590,133 | | |
| | | | | | Electronic Equipment & Instruments Total | | | | 590,133 | | |
| Semiconductors & Semiconductor Equipment – 1.3% | | Taiwan Semiconductor Manufacturing Co., Ltd. | | | 821,469 | | | | 1,530,847 | | |
| | | | | | Semiconductors & Semiconductor Equipment Total | | | | 1,530,847 | | |
| | | | | | INFORMATION TECHNOLOGY TOTAL | | | | 3,621,927 | | |
| TELECOMMUNICATION SERVICES – 20.4% | |
| Diversified Telecommunication Services – 3.7% | | China Telecom Corp., Ltd., Class H | | | 8,388,000 | | | | 3,059,923 | | |
| | | Chunghwa Telecom Co. Ltd. | | | 591,000 | | | | 1,078,945 | | |
| | | | | | Diversified Telecommunication Services Total | | | | 4,138,868 | | |
| Wireless Telecommunication Services – 16.7% | | China Mobile Hong Kong Ltd. | | | 3,639,500 | | | | 17,621,619 | | |
| | | Taiwan Mobile Co., Ltd | | | 1,154,000 | | | | 1,064,246 | | |
| | | | | | Wireless Telecommunication Services Total | | | | 18,685,865 | | |
| | | | | | TELECOMMUNICATION SERVICES TOTAL | | | | 22,824,733 | | |
See Accompanying Notes to Financial Statements.
6
February 28, 2006 (Unaudited) Columbia Greater China Fund
Common Stocks – (continued)
| UTILITIES – 5.3% | | | | Shares | | Value ($) | |
| Electric Utilities – 0.4% | | Guangdong Electric Power Development Co. Ltd., Class B | | | 1,014,300 | | | | 459,840 | | |
| | | | | | Electric Utilities Total | | | | 459,840 | | |
| Gas Utilities – 4.2% | | Hong Kong & China Gas Co., Ltd. | | | 952,304 | | | | 2,276,517 | | |
| | | Xinao Gas Holdings Ltd. | | | 2,832,000 | | | | 2,397,042 | | |
| | | | | | Gas Utilities Total | | | | 4,673,559 | | |
Independent Power Producers &
Energy Traders – 0.7% | | Datang International Power Generation Co., Ltd., Class H | | | 1,190,000 | | | | 844,438 | | |
| | | | | | Independent Power Producers & Energy Traders Total | | | | 844,438 | | |
| | | | | | UTILITIES TOTAL | | | | 5,977,837 | | |
| | | Total Common Stocks
(cost of $75,759,976) | | | | | | | 108,387,553 | | |
Investment Company – 1.4%
| | iShares FTSE/Xinhua China 25 Index Fund | | | 22,500 | | | | 1,633,500 | | |
| | | Total Investment Company
(cost of $1,551,008) | | | | | 1,633,500 | | |
| Short-Term Obligation – 1.1% | | | | Par ($) | | | |
| | | Repurchase agreement with State Street Bank &
Trust Co., dated 02/28/06, due 03/01/06 at 4.440%,
collateralized by a U.S. Treasury Note maturing
04/15/09, market value of $1,248,075 (repurchase
proceeds $1,221,151) | | | 1,221,000 | | | | 1,221,000 | | |
| | | Total Short-Term Obligation
(cost of $1,221,000) | | | | | 1,221,000 | | |
| | | Total Investments – 99.3%
(cost of $78,531,984)(b) | | | | | 111,242,053 | | |
| | | Other Assets & Liabilities, Net – 0.7% | | | | | 736,134 | | |
| | | Net Assets – 100.0% | | | | | 111,978,187 | | |
Notes to Investment Portfolio:
(a) Non-income producing security.
(b) Cost for federal income tax purposes is $78,531,984.
See Accompanying Notes to Financial Statements.
7
February 28, 2006 (Unaudited) Columbia Greater China Fund
The Fund was invested in the following countries at February 28, 2006:
| Country | | Value ($) | | % of Total
Investments | |
| Hong Kong | | | 57,370,076 | | | | 51.6 | | |
| China | | | 48,386,804 | | | | 43.5 | | |
| Taiwan | | | 4,264,173 | | | | 3.8 | | |
| Untied States* | | | 1,221,000 | | | | 1.1 | | |
| | | | 111,242,053 | | | | 100.0 | | |
* Represents short-term obligation.
Certain Securities are listed by country of underlying exposure but may trade predominantly on other exchange.
At February 28, 2006, the Fund held investments in the following sectors:
| Sector | | % of Net Assets | |
| Energy | | | 21.8 | | |
| Telecommunication Services | | | 20.4 | | |
| Industrials | | | 19.8 | | |
| Financials | | | 15.3 | | |
| Consumer Discretionary | | | 7.4 | | |
| Utilities | | | 5.3 | | |
| Information Technology | | | 3.2 | | |
| Consumer Staples | | | 3.0 | | |
| Health Care | | | 0.6 | | |
| Investment Company | | | 1.4 | | |
| Short-Term Obligation | | | 1.1 | | |
| Other Assets & Liabilities, Net | | | 0.7 | | |
| | | | 100.0 | | |
See Accompanying Notes to Financial Statements.
8
STATEMENT OF ASSETS AND LIABILITIES
February 28, 2006 (Unaudited) Columbia Greater China Fund
| | | | | ($) | |
| Assets | | Investments, at cost | | | 78,531,984 | | |
| | | Investments, at value | | | 111,242,053 | | |
| | | Cash | | | 247 | | |
| | | Receivable for: | | | | | |
| | | Investments sold | | | 418,314 | | |
| | | Fund shares sold | | | 751,949 | | |
| | | Interest | | | 151 | | |
| | | Deferred Trustees' compensation plan | | | 9,450 | | |
| | | Other assets | | | 10,103 | | |
| | | Total Assets | | | 112,432,267 | | |
| Liabilities | | Payable for: | | | | | |
| | | Fund shares repurchased | | | 301,870 | | |
| | | Investment advisory fee | | | 79,169 | | |
| | | Transfer agent fee | | | 14,015 | | |
| | | Pricing and bookkeeping fees | | | 7,785 | | |
| | | Trustees' fees | | | 142 | | |
| | | Custody fee | | | 4,173 | | |
| | | Distribution and service fees | | | 36,752 | | |
| | | Chief compliance officer expenses | | | 724 | | |
| | | Deferred Trustees' fees | | | 9,450 | | |
| | | Total Liabilities | | | 454,080 | | |
| | | Net Assets | | | 111,978,187 | | |
| Composition of Net Assets | | Paid-in capital | | | 105,528,314 | | |
| | | Overdistributed net investment income | | | (592,122 | ) | |
| | | Accumulated net realized loss | | | (25,668,028 | ) | |
| | | Net unrealized appreciation (depreciation) on: | | | | | |
| | | Investments | | | 32,710,069 | | |
| | | Foreign currency translations | | | (46 | ) | |
| | | Net Assets | | | 111,978,187 | | |
| Class A | | Net assets | | | 66,206,390 | | |
| | | Shares outstanding | | | 2,347,093 | | |
| | | Net asset value per share | | | 28.21 | (a)(b) | |
| | | Maximum offering price per share ($28.21/0.9425) | | | 29.93 | (c) | |
| Class B | | Net assets | | | 14,697,137 | | |
| | | Shares outstanding | | | 531,723 | | |
| | | Net asset value and offering price per share | | | 27.64 | (a)(b) | |
| Class C | | Net assets | | | 17,844,763 | | |
| | | Shares outstanding | | | 637,124 | | |
| | | Net asset value and offering price per share | | | 28.01 | (a)(b) | |
| Class Z | | Net assets | | | 13,229,897 | | |
| | | Shares outstanding | | | 452,557 | | |
| | | Net asset value, offering and redemption price per share | | | 29.23 | (b) | |
(a) Redemption price per share is equal to net asset value less any applicable contingent deferred sales charge.
(b) Redemption price per share is equal to net asset value less any applicable redemption fee.
(c) On sales of $50,000 or more the offering price is reduced.
See Accompanying Notes to Financial Statements.
9
STATEMENT OF OPERATIONS
For the Six Months Ended February 28, 2006 (Unaudited) Columbia Greater China Fund
| | | | | ($) | |
| Investment Income | | Dividends | | | 848,762 | | |
| | | Interest | | | 40,260 | | |
| | | Total Investment Income (net of foreign taxes withheld of $6,456) | | | 889,022 | | |
| Expenses | | Investment advisory fee | | | 449,240 | | |
| | | Distribution fee: | | | | | |
| | | Class B | | | 48,809 | | |
| | | Class C | | | 56,841 | | |
| | | Service fee: | | | | | |
| | | Class A | | | 70,874 | | |
| | | Class B | | | 16,270 | | |
| | | Class C | | | 18,947 | | |
| | | Transfer agent fee | | | 74,734 | | |
| | | Pricing and bookkeeping fees | | | 30,999 | | |
| | | Trustees' fees | | | 6,730 | | |
| | | Custody fee | | | 45,386 | | |
| | | Chief compliance officer expenses (See Note 4) | | | 2,590 | | |
| | | Non-recurring costs (See Note 9) | | | 561 | | |
| | | Other expenses | | | 64,082 | | |
| | | Total Expenses | | | 886,063 | | |
| | | Fees and expenses waived or reimbursed by Transfer Agent | | | (11,386 | ) | |
| | | Non-recurring costs assumed by Investment Advisor (See Note 9) | | | (561 | ) | |
| | | Custody earnings credit | | | (143 | ) | |
| | | Net Expenses | | | 873,973 | | |
| | | Net Investment Income | | | 15,049 | | |
| Net Realized and Unrealized Gain (Loss) on Investments and Foreign Currency | | Net realized gain on: | | | | | |
| | | Investments | | | 5,120,960 | | |
| | | Foreign currency transactions | | | 9,483 | | |
| | | Net realized gain | | | 5,130,443 | | |
| | | Net change in unrealized appreciation (depreciation) on: | | | | | |
| | | Investments | | | 9,591,388 | | |
| | | Foreign currency translations | | | 5,092 | | |
| | | Net change in unrealized appreciation (depreciation) | | | 9,596,480 | | |
| | | Net Gain | | | 14,726,923 | | |
| | | Net Increase in Net Assets from Operations | | | 14,741,972 | | |
See Accompanying Notes to Financial Statements.
10
STATEMENT OF CHANGES IN NET ASSETS
Columbia Greater China Fund
| Increase (Decrease) in Net Assets: | | | | (Unaudited)
Six Months
Ended
February 28,
2006 ($) | | Year Ended
August 31,
2005 ($) | |
| Operations | | Net investment income | | | 15,049 | | | | 944,851 | | |
| | | Net realized gain on investments and
foreign currency transactions | | | 5,130,443 | | | | 4,638,435 | | |
| | | Net change in unrealized appreciation (depreciation)
on investments and foreign currency translations | | | 9,596,480 | | | | 9,098,877 | | |
| | | Net Increase from Operations | | | 14,741,972 | | | | 14,682,163 | | |
| Distributions Declared to Shareholders | | From net investment income: | | | | | | | | | |
| | | Class A | | | (989,712 | ) | | | (470,125 | ) | |
| | | Class B | | | (139,342 | ) | | | (28,877 | ) | |
| | | Class C | | | (164,859 | ) | | | (26,795 | ) | |
| | | Class Z | | | (181,558 | ) | | | (73,253 | ) | |
| | | Total Distributions Declared to Shareholders | | | (1,475,471 | ) | | | (599,050 | ) | |
| Share Transactions | | Class A: | | | | | | | | | |
| | | Subscriptions | | | 10,879,574 | | | | 11,335,289 | | |
| | | Distributions reinvested | | | 790,711 | | | | 375,691 | | |
| | | Redemptions | | | (7,327,935 | ) | | | (13,860,380 | ) | |
| | | Net Increase (Decrease) | | | 4,342,350 | | | | (2,149,400 | ) | |
| | | Class B: | | | | | | | | | |
| | | Subscriptions | | | 1,502,266 | | | | 2,584,509 | | |
| | | Distributions reinvested | | | 98,809 | | | | 20,937 | | |
| | | Redemptions | | | (1,425,261 | ) | | | (2,445,536 | ) | |
| | | Net Increase | | | 175,814 | | | | 159,910 | | |
| | | Class C: | | | | | | | | | |
| | | Subscriptions | | | 3,072,420 | | | | 4,564,146 | | |
| | | Distributions reinvested | | | 121,526 | | | | 21,479 | | |
| | | Redemptions | | | (1,381,048 | ) | | | (2,110,445 | ) | |
| | | Net Increase | | | 1,812,898 | | | | 2,475,180 | | |
| | | Class Z: | | | | | | | | | |
| | | Subscriptions | | | 3,967,063 | | | | 3,799,173 | | |
| | | Distributions reinvested | | | 133,297 | | | | 60,969 | | |
| | | Redemptions | | | (1,249,352 | ) | | | (1,282,989 | ) | |
| | | Net Increase | | | 2,851,008 | | | | 2,577,153 | | |
| | | Net Increase from Share Transactions | | | 9,182,070 | | | | 3,062,843 | | |
| | | Redemption fees | | | 10,057 | | | | 3,370 | | |
| | | Total Increase in Net Assets | | | 22,458,628 | | | | 17,149,326 | | |
| Net Assets | | Beginning of period | | | 89,519,559 | | | | 72,370,233 | | |
| | | End of period | | | 111,978,187 | | | | 89,519,559 | | |
| | | Undistributed (overdistributed) net investment
income, at end of period | | | (592,122 | ) | | | 868,300 | | |
See Accompanying Notes to Financial Statements.
11
Columbia Greater China Fund
| | | | | (Unaudited)
Six Months
Ended
February 28,
2006 | | Year Ended
August 31,
2005 | |
| Changes in Shares | | Class A: | | | | | | | | | |
| | | Subscriptions | | | 416,567 | | | | 488,532 | | |
| | | Issued for distributions reinvested | | | 31,130 | | | | 16,264 | | |
| | | Redemptions | | | (287,351 | ) | | | (609,193 | ) | |
| | | Net Increase (Decrease) | | | 160,346 | | | | (104,397 | ) | |
| | | Class B: | | | | | | | | | |
| | | Subscriptions | | | 58,569 | | | | 114,739 | | |
| | | Issued for distributions reinvested | | | 3,964 | | | | 922 | | |
| | | Redemptions | | | (56,681 | ) | | | (108,633 | ) | |
| | | Net Increase | | | 5,852 | | | | 7,028 | | |
| | | Class C: | | | | | | | | | |
| | | Subscriptions | | | 118,113 | | | | 197,242 | | |
| | | Issued for distributions reinvested | | | 4,811 | | | | 934 | | |
| | | Redemptions | | | (52,871 | ) | | | (92,593 | ) | |
| | | Net Increase | | | 70,053 | | | | 105,583 | | |
| | | Class Z: | | | | | | | | | |
| | | Subscriptions | | | 142,549 | | | | 160,742 | | |
| | | Issued for distributions reinvested | | | 5,065 | | | | 2,550 | | |
| | | Redemptions | | | (47,211 | ) | | | (53,455 | ) | |
| | | Net Increase | | | 100,403 | | | | 109,837 | | |
See Accompanying Notes to Financial Statements.
12
FINANCIAL HIGHLIGHTS
Columbia Greater China Fund
Selected data for a share outstanding throughout each period is as follows:
| | | (Unaudited)
Six Months
Ended
February 28, | | Year Ended August 31, | |
| Class A Shares | | 2006 | | 2005 | | 2004 | | 2003(a) | | 2002(a) | | 2001(a) | |
Net Asset Value,
Beginning of Period | | $ | 24.68 | | | $ | 20.64 | | | $ | 17.88 | | | $ | 14.29 | | | $ | 14.91 | | | $ | 19.98 | | |
Income from Investment
Operations: | |
| Net investment income (b) | | | 0.03 | | | | 0.31 | | | | 0.17 | | | | 0.14 | | | | 0.10 | | | | 0.12 | | |
Net realized and unrealized
gain (loss) on investments
and foreign currency | | | 3.95 | | | | 3.94 | | | | 2.70 | | | | 3.53 | | | | (0.57 | ) | | | (5.19 | ) | |
Total from Investment
Operations | | | 3.98 | | | | 4.25 | | | | 2.87 | | | | 3.67 | | | | (0.47 | ) | | | (5.07 | ) | |
Less Distributions Declared to
Shareholders: | |
From net investment
income | | | (0.45 | ) | | | (0.21 | ) | | | (0.11 | ) | | | (0.08 | ) | | | (0.15 | ) | | | — | | |
| Redemption fees: | |
Redemption fees
added to paid-in-capital | | | — | (b)(c) | | | — | (b)(c) | | | — | (b)(c) | | | — | | | | — | | | | — | | |
| Net Asset Value, End of Period | | $ | 28.21 | | | $ | 24.68 | | | $ | 20.64 | | | $ | 17.88 | | | $ | 14.29 | | | $ | 14.91 | | |
| Total return (d) | | | 16.33 | %(e)(f) | | | 20.66 | % | | | 16.11 | % | | | 25.84 | %(f) | | | (3.22 | )%(f) | | | (25.38 | )%(f) | |
Ratios to Average Net Assets/
Supplemental Data: | |
| Operating expenses (g) | | | 1.65 | %(h) | | | 1.76 | % | | | 1.89 | % | | | 2.15 | % | | | 2.15 | % | | | 2.15 | % | |
| Interest expense | | | — | | | | — | | | | — | | | | — | %(i) | | | — | %(i) | | | — | | |
| Expenses (g) | | | 1.65 | %(h) | | | 1.76 | % | | | 1.89 | % | | | 2.15 | % | | | 2.15 | % | | | 2.15 | % | |
| Net investment income (g) | | | 0.24 | %(h) | | | 1.35 | % | | | 0.84 | % | | | 0.97 | % | | | 0.65 | % | | | 0.68 | % | |
| Waiver/reimbursement | | | 0.02 | %(h) | | | — | | | | — | | | | 0.37 | % | | | 0.29 | % | | | 0.21 | % | |
| Portfolio turnover rate | | | 26 | %(e) | | | 24 | % | | | 25 | % | | | 33 | % | | | 16 | % | | | 14 | % | |
Net assets, end of
period (000's) | | $ | 66,206 | | | $ | 53,975 | | | $ | 47,282 | | | $ | 42,685 | | | $ | 33,201 | | | $ | 37,652 | | |
(a) For the years ended August 31, 2003, 2002 and 2001, the Fund was audited by Ernst & Young LLP.
(b) Per share data was calculated using average shares outstanding during the period.
(c) Rounds to less than $0.01 per share.
(d) Total return at net asset value assuming all distributions reinvested and no initial sales charge or contingent deferred sales charge.
(e) Not annualized.
(f) Had the Investment Advisor/Administrator and/or Transfer Agent not waived or reimbursed a portion of expenses, total return would have been reduced.
(g) The benefits derived from custody credits had an impact of less than 0.01%.
(h) Annualized.
(i) Rounds to less than 0.01%.
See Accompanying Notes to Financial Statements.
13
Columbia Greater China Fund
Selected data for a share outstanding throughout each period is as follows:
| | | (Unaudited)
Six Months
Ended
February 28, | | Year Ended August 31, | |
| Class B Shares | | 2006 | | 2005 | | 2004 | | 2003(a) | | 2002(a) | | 2001(a) | |
Net Asset Value,
Beginning of Period | | $ | 24.11 | | | $ | 20.18 | | | $ | 17.51 | | | $ | 14.02 | | | $ | 14.63 | | | $ | 19.75 | | |
Income from Investment
Operations: | |
Net investment
income (loss) (b) | | | (0.06 | ) | | | 0.14 | | | | 0.05 | | | | 0.04 | | | | (0.02 | ) | | | (0.01 | ) | |
Net realized and unrealized
gain (loss) on investments
and foreign currency | | | 3.86 | | | | 3.85 | | | | 2.62 | | | | 3.45 | | | | (0.55 | ) | | | (5.11 | ) | |
Total from Investment
Operations | | | 3.80 | | | | 3.99 | | | | 2.67 | | | | 3.49 | | | | (0.57 | ) | | | (5.12 | ) | |
Less Distributions Declared to
Shareholders: | |
| From net investment income | | | (0.27 | ) | | | (0.06 | ) | | | — | | | | — | | | | (0.04 | ) | | | — | | |
| Redemption fees: | |
Redemption fees added to
paid-in-capital | | | — | (b)(c) | | | — | (b)(c) | | | — | (b)(c) | | | — | | | | — | | | | — | | |
| Net Asset Value, End of Period | | $ | 27.64 | | | $ | 24.11 | | | $ | 20.18 | | | $ | 17.51 | | | $ | 14.02 | | | $ | 14.63 | | |
| Total return (d) | | | 15.89 | %(e)(f) | | | 19.77 | % | | | 15.25 | % | | | 24.89 | %(f) | | | (3.93 | )%(f) | | | (25.92 | )%(f) | |
Ratios to Average Net Assets/
Supplemental Data: | |
| Operating expenses (g) | | | 2.40 | %(h) | | | 2.51 | % | | | 2.64 | % | | | 2.90 | % | | | 2.90 | % | | | 2.90 | % | |
| Interest expense | | | — | | | | — | | | | — | | | | — | %(i) | | | — | %(i) | | | — | | |
| Expenses (g) | | | 2.40 | %(h) | | | 2.51 | % | | | 2.64 | % | | | 2.90 | % | | | 2.90 | % | | | 2.90 | % | |
Net investment
income (loss) (g) | | | (0.47 | )%(h) | | | 0.60 | % | | | 0.23 | % | | | 0.30 | % | | | (0.10 | )% | | | (0.07 | )% | |
| Waiver/reimbursement | | | 0.02 | %(h) | | | — | | | | — | | | | 0.37 | % | | | 0.29 | % | | | 0.21 | % | |
| Portfolio turnover rate | | | 26 | %(e) | | | 24 | % | | | 25 | % | | | 33 | % | | | 16 | % | | | 14 | % | |
Net assets, end of
period (000's) | | $ | 14,697 | | | $ | 12,680 | | | $ | 10,471 | | | $ | 5,121 | | | $ | 3,850 | | | $ | 4,151 | | |
(a) For the years ended August 31, 2003, 2002 and 2001 the Fund was audited by Ernst & Young LLP.
(b) Per share data was calculated using average shares outstanding during the period.
(c) Rounds to less than $0.01 per share.
(d) Total return at net asset value assuming all distributions reinvested and no contingent deferred sales charge.
(e) Not annualized.
(f) Had the Investment Advisor/Administrator and/or Transfer Agent not waived or reimbursed a portion of expenses, total return would have been reduced.
(g) The benefits derived from custody credits had an impact of less than 0.01%.
(h) Annualized.
(i) Rounds to less than 0.01%.
See Accompanying Notes to Financial Statements.
14
Columbia Greater China Fund
Selected data for a share outstanding throughout each period is as follows:
| | | (Unaudited)
Six Months
Ended
February 28, | | Year Ended August 31, | |
| Class C Shares | | 2006 | | 2005 | | 2004 | | 2003(a) | | 2002(a) | | 2001(a) | |
Net Asset Value,
Beginning of Period | | $ | 24.43 | | | $ | 20.45 | | | $ | 17.76 | | | $ | 14.22 | | | $ | 14.84 | | | $ | 20.03 | | |
Income from Investment
Operations: | |
Net investment
income (loss) (b) | | | (0.07 | ) | | | 0.14 | | | | 0.04 | | | | 0.05 | | | | (0.02 | ) | | | (0.01 | ) | |
Net realized and unrealized
gain (loss) on investments
and foreign currency | | | 3.92 | | | | 3.90 | | | | 2.65 | | | | 3.49 | | | | (0.56 | ) | | | (5.18 | ) | |
Total from Investment
Operations | | | 3.85 | | | | 4.04 | | | | 2.69 | | | | 3.54 | | | | (0.58 | ) | | | (5.19 | ) | |
Less Distributions Declared to
Shareholders: | |
From net investment
income | | | (0.27 | ) | | | (0.06 | ) | | | — | | | | — | | | | (0.04 | ) | | | — | | |
| Redemption fees: | |
Redemption fees added to
paid-in-capital | | | — | (b)(c) | | | — | (b)(c) | | | — | (b)(c) | | | — | | | | — | | | | — | | |
| Net Asset Value, End of Period | | $ | 28.01 | | | $ | 24.43 | | | $ | 20.45 | | | $ | 17.76 | | | $ | 14.22 | | | $ | 14.84 | | |
| Total return (d) | | | 15.89 | %(e)(f) | | | 19.75 | % | | | 15.15 | % | | | 24.89 | %(f) | | | (3.94 | )%(f) | | | (25.91 | )%(f) | |
Ratios to Average Net Assets/
Supplemental Data: | |
| Operating expenses (g) | | | 2.40 | %(h) | | | 2.51 | % | | | 2.64 | % | | | 2.90 | % | | | 2.90 | % | | | 2.90 | % | |
| Interest expense | | | — | | | | — | | | | — | | | | — | %(i) | | | — | %(i) | | | — | | |
| Expenses (g) | | | 2.40 | %(h) | | | 2.51 | % | | | 2.64 | % | | | 2.90 | % | | | 2.90 | % | | | 2.90 | % | |
Net investment
income (loss) (g) | | | (0.56 | )%(h) | | | 0.60 | % | | | 0.20 | % | | | 0.35 | % | | | (0.10 | )% | | | (0.07 | )% | |
| Waiver/reimbursement | | | 0.02 | %(h) | | | — | | | | — | | | | 0.37 | % | | | 0.29 | % | | | 0.21 | % | |
| Portfolio turnover rate | | | 26 | %(e) | | | 24 | % | | | 25 | % | | | 33 | % | | | 16 | % | | | 14 | % | |
Net assets, end of
period (000's) | | $ | 17,845 | | | $ | 13,853 | | | $ | 9,436 | | | $ | 3,316 | | | $ | 1,812 | | | $ | 1,352 | | |
(a) For the years ended August 31, 2003, 2002 and 2001, the Fund was audited by Ernst & Young LLP.
(b) Per share data was calculated using average shares outstanding during the period.
(c) Rounds to less than $0.01 per share.
(d) Total return at net asset value assuming all distributions reinvested and no contingent deferred sales charge.
(e) Not annualized.
(f) Had the Investment Advisor/Administrator and/or Transfer Agent not waived or reimbursed a portion of expenses, total return would have been reduced.
(g) The benefits derived from custody credits had an impact of less than 0.01%.
(h) Annualized.
(i) Rounds to less than 0.01%.
See Accompanying Notes to Financial Statements.
15
Columbia Greater China Fund
Selected data for a share outstanding throughout each period is as follows:
| | | (Unaudited)
Six Months
Ended
February 28, | | Year Ended August 31, | |
| Class Z Shares | | 2006 | | 2005 | | 2004 | | 2003(a) | | 2002(a) | | 2001(a) | |
Net Asset Value,
Beginning of Period | | $ | 25.59 | | | $ | 21.38 | | | $ | 18.51 | | | $ | 14.41 | | | $ | 15.05 | | | $ | 20.11 | | |
Income from Investment
Operations: | |
| Net investment income (b) | | | 0.06 | | | | 0.40 | | | | 0.22 | | | | 0.11 | | | | 0.14 | | | | 0.16 | | |
Net realized and unrealized
gain (loss) on investments
and foreign currency | | | 4.09 | | | | 4.07 | | | | 2.81 | | | | 4.10 | | | | (0.59 | ) | | | (5.22 | ) | |
Total from Investment
Operations | | | 4.15 | | | | 4.47 | | | | 3.03 | | | | 4.21 | | | | (0.45 | ) | | | (5.06 | ) | |
Less Distributions Declared to
Shareholders: | |
| From net investment income | | | (0.51 | ) | | | (0.26 | ) | | | (0.16 | ) | | | (0.12 | ) | | | (0.19 | ) | | | — | | |
| Redemption fees: | |
Redemption fees added to
paid-in-capital | | | — | (b)(c) | | | — | (b)(c) | | | — | (b)(c) | | | 0.01 | | | | — | | | | — | | |
| Net Asset Value, End of Period | | $ | 29.23 | | | $ | 25.59 | | | $ | 21.38 | | | $ | 18.51 | | | $ | 14.41 | | | $ | 15.05 | | |
| Total return (d) | | | 16.44 | %(e)(f) | | | 21.00 | % | | | 16.44 | % | | | 29.51 | %(f) | | | (3.10 | )%(f) | | | (25.16 | )%(f) | |
Ratios to Average Net Assets/
Supplemental Data: | |
| Operating expenses (g) | | | 1.40 | %(h) | | | 1.51 | % | | | 1.64 | % | | | 1.90 | % | | | 1.90 | % | | | 1.90 | % | |
| Interest expense | | | — | | | | — | | | | — | | | | — | %(i) | | | — | %(i) | | | — | | |
| Expenses (g) | | | 1.40 | %(h) | | | 1.51 | % | | | 1.64 | % | | | 1.90 | % | | | 1.90 | % | | | 1.90 | % | |
| Net investment income (g) | | | 0.43 | %(h) | | | 1.69 | % | | | 1.06 | % | | | 0.70 | % | | | 0.90 | % | | | 0.93 | % | |
| Waiver/reimbursement | | | 0.02 | %(h) | | | — | | | | — | | | | 0.37 | % | | | 0.29 | % | | | 0.21 | % | |
| Portfolio turnover rate | | | 26 | %(e) | | | 24 | % | | | 25 | % | | | 33 | % | | | 16 | % | | | 14 | % | |
Net assets, end of
period (000's) | | $ | 13,230 | | | $ | 9,012 | | | $ | 5,182 | | | $ | 1,996 | | | $ | 138 | | | $ | 145 | | |
(a) For the years ended August 31, 2003, 2002 and 2001, the Fund was audited by Ernst & Young LLP.
(b) Per share data was calculated using average shares outstanding during the period.
(c) Rounds to less than $0.01 per share.
(d) Total return at net asset value assuming all distributions reinvested.
(e) Not annualized.
(f) Had the Investment Advisor/Administrator and/or Transfer Agent not waived or reimbursed a portion of expenses, total return would have been reduced.
(g) The benefits derived from custody credits had an impact of less than 0.01%.
(h) Annualized.
(i) Rounds to less than 0.01%.
See Accompanying Notes to Financial Statements.
16
NOTES TO FINANCIAL STATEMENTS
February 28, 2006 (Unaudited) Columbia Greater China Fund
Note 1. Organization
Columbia Greater China Fund (the "Fund"), a series of Columbia Funds Trust II (the "Trust"), is a non-diversified portfolio. The Trust is a Massachusetts business trust registered under the Investment Company Act of 1940, as amended, as an open-end management investment company.
Effective October 10, 2005, Columbia Newport Greater China Fund was renamed Columbia Greater China Fund.
Investment Goal
The Fund seeks long-term growth of capital. Under normal market conditions, the Fund invests at least 80% of its net assets in stocks of companies whose principal activities are in the Greater China Region.
Fund Shares
The Fund may issue an unlimited number of shares and offers four classes of shares: Class A, Class B, Class C and Class Z. Each share class has its own sales charge and expense structure.
Class A shares are subject to a maximum front-end sales charge of 5.75% based on the amount of initial investment. Class A shares purchased without an initial sales charge in accounts aggregating up to $50 million at the time of purchase are subject to a 1.00% contingent deferred sales charge ("CDSC") on shares sold within twelve months of the time of purchase. Class B shares are subject to a maximum CDSC of 5.00% based upon the holding period after purchase. Class B shares will convert to Class A shares in eight years after purchase. Class C shares are subject to a 1.00% CDSC on shares sold within one year after purchase. Class Z shares are offered continuously at net asset value. There are certain restrictions on the purchase of Class Z shares, as described in the Fund's prospectus.
Note 2. Significant Accounting Policies
Use of Estimates
The preparation of financial statements in conformity with accounting principles generally accepted in the United States of America ("GAAP") requires management to make estimates and assumptions that affect the reported amounts of assets and liabilities, the disclosure of contingent assets and liabilities at the date of the financial statements and the reported amounts of revenue and expenses during the reporting period. Actual results could differ from those estimates. The following is a summary of significant accounting policies consistently followed by the Fund in the preparation of its financial statements.
Security Valuation
Equity securities are valued at the last sale price on the principal exchange on which they trade, except for securities traded on the NASDAQ, which are valued at the NASDAQ official close price. Unlisted securities or listed securities for which there were no sales during the day are valued at the closing bid price on such exchanges or over-the-counter markets.
Short-term debt obligations maturing within 60 days are valued at amortized cost, which approximates market value.
Foreign securities are generally valued at the last sale price on the foreign exchange or market on which they trade. If any foreign share prices are not readily available as a result of limited share activity, the securities are valued at the last sale price of the local shares in the principal market in which such securities are normally traded.
Generally, trading in foreign securities is substantially completed each day at various times prior to the close of the New York Stock Exchange ("NYSE"). The values of such securities used in computing the net asset value of the Fund's shares are determined as of such times. Foreign currency exchange rates are generally determined at 4:00 p.m. Eastern (U.S.) time. Occasionally, events affecting the values of such foreign securities and such exchange rates may occur between the times at which they are determined and the close of the customary trading session of the NYSE, which would not be reflected in the computation of the Fund's net asset value. If events materially affecting the values of such foreign securities occur and it is determined that market quotations are not reliable, then these foreign securities will be valued at their fair value using procedures approved by the Board of Trustees. The Fund may use a systematic fa ir valuation model provided by an independent third party to value securities principally traded in foreign markets in order to adjust for possible stale pricing that may occur between the close of the foreign exchanges and the time for valuation. If a security is valued at a
17
February 28, 2006 (Unaudited) Columbia Greater China Fund
"fair value", such value is likely to be different from the last quoted market price for the security.
Investments for which market quotations are not readily available, or that have quotations which management believes are not appropriate, are valued at fair value as determined in good faith under consistently applied procedures established by and under the general supervision of the Board of Trustees.
Security Transactions
Security transactions are accounted for on the trade date. Cost is determined and gains (losses) are based upon the specific identification method for both financial statement and federal income tax purposes.
Repurchase Agreements
The Fund may engage in repurchase agreement transactions with institutions that the Fund's investment advisor has determined are creditworthy. The Fund, through its custodian, receives delivery of underlying securities collateralizing a repurchase agreement. Collateral is at least equal, at all times, to the value of the repurchase obligation including interest. A repurchase agreement transaction involves certain risks in the event of default or insolvency of the counterparty. These risks include possible delays or restrictions upon the Fund's ability to dispose of the underlying securities and a possible decline in the value of the underlying securities during the period while the Fund seeks to assert its rights.
Income Recognition
Interest income is recorded on the accrual basis. Corporate actions and dividend income are recorded on the ex-date, except for certain foreign securities which are recorded as soon after ex-date as the Fund becomes aware of such, net of non-reclaimable tax withholdings.
Foreign Currency Transactions
The values of all assets and liabilities quoted in foreign currencies are translated into U.S. dollars at that day's exchange rates. Net realized and unrealized gains (losses) on foreign currency transactions include gains (losses) arising from the fluctuation in exchange rates between trade and settlement dates on securities transactions, gains (losses) arising from the disposition of foreign currency and currency gains (losses) between the accrual and payment dates on dividends, interest income and foreign withholding taxes.
For financial statement purposes, the Fund does not distinguish that portion of gains (losses) on investments which is due to changes in foreign exchange rates from that which is due to changes in market prices of the investments. Such fluctuations are included with the net realized and unrealized gains (losses) on investments.
Determination of Class Net Asset Values
All income, expenses (other than class-specific expenses, as shown on the Statement of Operations), and realized and unrealized gains (losses), are allocated to each class of the Fund on a daily basis, based on the relative net assets of each class, for purposes of determining the net asset value of each class.
Federal Income Tax Status
The Fund intends to qualify each year as a "regulated investment company" under Subchapter M of the Internal Revenue Code, as amended, and will distribute substantially all of its taxable income, if any, for its tax year, and as such will not be subject to federal income taxes. In addition, the Fund intends to distribute in each calendar year substantially all of its net investment income, capital gains and certain other amounts, if any, such that the Fund should not be subject to federal excise tax. Therefore, no federal income or excise tax provision is recorded.
Distributions to Shareholders
Distributions to shareholders are recorded on ex-date. Net realized capital gains, if any, are distributed at least annually.
Note 3. Federal Tax Information
The tax character of distributions paid during the year ended August 31, 2005 was as follows:
| Distributions paid from: | |
| Ordinary income | | $ | 599,050 | | |
Unrealized appreciation and depreciation at February 28, 2006, based on cost of investments for federal income tax purposes and excluding any unrealized appreciation and depreciation from changes
18
February 28, 2006 (Unaudited) Columbia Greater China Fund
in the value of other assets and liabilities resulting from changes in exchange rates, was:
| Unrealized appreciation | | $ | 34,262,852 | | |
| Unrealized depreciation | | | (1,552,783 | ) | |
| Net unrealized appreciation | | $ | 32,710,069 | | |
The following capital loss carryforwards, determined as of August 31, 2005, may be available to reduce taxable income arising from future net realized gains on investments, if any, to the extent permitted by the Internal Revenue Code:
Year of
Expiration | | Capital Loss
Carryforward | |
| | 2007 | | | $ | 25,046,844 | | |
| | 2008 | | | | 703,958 | | |
| | 2010 | | | | 5,047,669 | | |
| | | | | $ | 30,798,471 | | |
Note 4. Fees and Compensation Paid to Affiliates
Investment Advisory Fee
Columbia Management Advisors, LLC ("Columbia"), an indirect wholly-owned subsidiary of Bank of America Corporation ("BOA"), is the investment advisor to the Fund. Prior to September 30, 2005, Columbia Management Advisors, Inc. was the investment advisor to the Fund under the same fee structure. On September 30, 2005, Columbia Management Advisors, Inc. merged into Banc of America Capital Management, LLC. At that time, the investment advisor was then renamed Columbia Management Advisors, LLC.
Columbia receives a monthly investment advisory fee based on the Fund's average daily net assets at the following annual rates:
| Average Daily Net Assets | | Annual Fee Rate | |
| First $1 billion | | | 0.95 | % | |
| $1 billion to $1.5 billion | | | 0.87 | % | |
| $1.5 billion to $3 billion | | | 0.82 | % | |
| $3 billion to $6 billion | | | 0.77 | % | |
| Over $6 billion | | | 0.72 | % | |
For the six months ended February 28, 2006, the Fund's annualized effective investment advisory fee rate was 0.95% of the Fund's average daily net assets.
Pricing and Bookkeeping Fees
Columbia is responsible for providing pricing and bookkeeping services to the Fund under a pricing and bookkeeping agreement. Under a separate agreement (the "Outsourcing Agreement"), Columbia has delegated those functions to State Street Corporation ("State Street"). As a result, the total fees payable under the pricing and bookkeeping agreement are paid to State Street.
Under its pricing and bookkeeping agreement with the Fund, Columbia receives an annual fee of $38,000 paid monthly plus an additional monthly fee based on the level of average daily net assets for the month; provided that during any 12-month period, the aggregate fee shall not exceed $140,000.
Prior to November 1, 2005, Columbia received from the Fund an annual fee of $10,000 paid monthly, and in any month that the Fund's average daily net assets exceeded $50 million, an additional monthly fee, calculated by taking into account the fees payable to State Street under the Outsourcing Agreement.
The Fund also reimburses Columbia and State Street for out-of-pocket expenses and charges, including fees payable to third parties for pricing the Fund's portfolio securities and direct internal costs incurred by Columbia in connection with providing fund accounting oversight and monitoring and certain other services. For the six months ended February 28, 2006, the annualized effective pricing and bookkeeping fee rate for the Fund, inclusive of out-of-pocket expenses, was 0.065% of the Fund's average daily net assets.
Transfer Agent Fees
Columbia Management Services, Inc. (formerly Columbia Funds Services, Inc.) (the "Transfer Agent"), an affiliate of Columbia and an indirect, wholly-owned subsidiary of BOA, provides shareholder services to the Fund and has contracted with Boston Financial Data Services ("BFDS") to serve as sub-transfer agent. The Transfer Agent is entitled to receive a fee, paid monthly, at the annual rate of $15.23 per open account plus sub-transfer agent fees (exclusive of BFDS fees) calculated based on assets held in omnibus accounts and intended to recover the cost of payments to third parties for services to those accounts. The Transfer Agent, may also retain as additional compensation for its services, fees for wire, telephone and redemption orders, IRA trustee agent fees and account transcript fees due the
19
February 28, 2006 (Unaudited) Columbia Greater China Fund
Transfer Agent from shareholders of the Fund and credits (net of bank charges) earned with respect to balances in accounts the Transfer Agent maintains in connection with its services to the Fund. The Transfer Agent also receives reimbursement for certain out-of-pocket expenses. Prior to November 1, 2005, the Transfer Agent received a monthly fee at the annual rate of $28.00 per open account and was reimbursed for certain out-of-pocket expenses.
For the period September 1, 2005 through October 31, 2005, the Transfer Agent voluntarily waived a portion of its fees to reflect the reduced contractual fees charged to the Fund effective November 1, 2005. For the six months ended February 28, 2006, the Transfer Agent waived fees of $11,386 for the Fund.
For the six months ended February 28, 2006, the Fund's annualized effective transfer agent fee rate, inclusive of out-of-pocket expenses and net of fee waivers, was 0.13% of the Fund's average daily net assets.
Underwriting Discounts, Service and Distribution Fees
Columbia Management Distributors, Inc. (the "Distributor"), a subsidiary of Columbia and an indirect, wholly-owned subsidiary of BOA, is the principal underwriter of the Fund. For the six months ended February 28, 2006, the Distributor has retained net underwriting discounts of $22,509 on sales of the Fund's Class A shares and received net CDSC fees of $2, $12,333 and $1,411 on Class A, Class B and Class C share redemptions, respectively.
The Fund has adopted a 12b-1 plan (the "Plan") which allows the payment of a monthly service fee to the Distributor at the annual rate of 0.25% of the average daily net assets attributable to Class A, Class B and Class C shares of the Fund. The Plan also requires the payment of a monthly distribution fee to the Distributor at the annual rate of 0.75% of the average daily net assets attributable to Class B and Class C shares only.
The CDSC and the distribution fees received from the Plan are used principally as repayment to the Distributor for amounts paid by the Distributor to dealers who sold such shares.
Expense Limits and Fee Reimbursements
Columbia has voluntarily agreed to waive fees and reimburse certain expenses to the extent that total expenses (exclusive of distribution and service fees, brokerage commissions, interest, taxes and extraordinary expenses, if any) will not exceed 1.90% annually of the Fund's average daily net assets. This arrangement may be revised or discontinued by Columbia at any time.
Custody Credits
The Fund has an agreement with its custodian bank under which custody fees may be reduced by balance credits. These credits are recorded as a reduction of total expenses on the Statement of Operations. The Fund could have invested a portion of the assets utilized in connection with the expense offset arrangement in an income-producing asset if it had not entered into such an agreement.
Fees Paid to Officers and Trustees
All officers of the Fund, with the exception of the Fund's Chief Compliance Officer, are employees of Columbia or its affiliates and receive no compensation from the Fund. The Board of Trustees has appointed a Chief Compliance Officer to the Fund in accordance with federal securities regulations. The Fund, along with other affiliated funds, pays its pro-rata share of the expenses associated with the Chief Compliance Officer. The Fund's expenses for the Chief Compliance Officer will not exceed $15,000 per year.
The Fund's Trustees may participate in a deferred compensation plan which may be terminated at any time. Obligations of the plan will be paid solely out of the Fund's assets.
Other
Columbia provides certain services to the Fund related to Sarbanes-Oxley compliance. For the six months ended February 28, 2006, the Fund paid $741 to Columbia for such services. This amount is included in "Other expenses" on the Statement of Operations.
Note 5. Portfolio Information
For the six months ended February 28, 2006, the cost of purchases and proceeds from sales of securities, excluding short-term obligations, were $35,275,824 and $24,238,340, respectively.
Note 6. Redemption Fees
The Fund imposes a 2.00% redemption fee to shareholders of the Fund who redeem shares held for
20
February 28, 2006 (Unaudited) Columbia Greater China Fund
60 days or less. Redemption fees, which are retained by the Fund, are accounted for as an addition to paid-in capital and are allocated to each class proportionately for purposes of determining the net asset value of each class. For the six months ended February 28, 2006, the redemption fees for the Class A, Class B, Class C and Class Z shares of the Fund amounted to $6,027, $1,395, $1,611 and $1,024, respectively.
Note 7. Line of Credit
The Fund and other affiliated funds participate in a $350,000,000 committed unsecured revolving line of credit provided by State Street Bank and Trust Company. Borrowings are used for temporary or emergency purposes to facilitate portfolio liquidity. Interest is charged to each participating fund based on its borrowings at a rate per annum equal to the Federal Funds rate plus 0.50%. In addition, a commitment fee of 0.10% per annum is accrued and apportioned among the participating funds based on their pro-rata portion of the unutilized line of credit. The commitment fee is included in "Other expenses" on the Statement of Operations. For the six months ended February 28, 2006, the Fund did not borrow under this arrangement.
Note 8. Shares of Beneficial Interest
As of February 28, 2006, the Fund had a shareholder that held 10.5% of the shares outstanding. Subscription and redemption activity of this shareholder may have a material effect on the Fund.
Note 9. Disclosure of Significant Risks and Contingencies
Foreign Securities
There are certain additional risks involved when investing in foreign securities that are not inherent with investments in domestic securities. These risks may involve foreign currency exchange rate fluctuations, adverse political and economic developments and the possible prevention of currency exchange or other foreign governmental laws or restrictions. In addition, the liquidity of foreign securities may be more limited than that of domestic securities.
Investments in emerging market countries are subject to additional risk. The risk of foreign investments is typically increased in less developed countries. These countries are also more likely to experience high levels of inflation, deflation or currency devaluation which could hurt their economies and securities markets.
Geographic Concentration
Because the Fund's investments are concentrated in the Greater China Region, events within the region will have a greater effect on the Fund than if the Fund were more geographically diversified. In addition, events in any one country within the region may impact the other countries or the region as a whole. Markets in the region can experience significant volatility due to social, regulatory and political uncertainties.
Industry Focus
As a non-diversified fund, the Fund may invest a greater percentage of its total assets in the securities of fewer issuers than a diversified fund. The Fund may, therefore, have a greater risk of loss from a few issuers than a similar fund that invests more broadly.
Legal Proceedings
On February 9, 2005, Columbia Management Advisors, Inc. (which has since merged into Banc of America Capital Management, LLC (now named Columbia Management Advisors, LLC) ("Columbia") and Columbia Funds Distributor, Inc. (which has been renamed Columbia Management Distributors, Inc. (the "Distributor") (collectively, the "Columbia Group") entered into an Assurance of Discontinuance with the New York Attorney General ("NYAG") (the "NYAG Settlement") and consented to the entry of a cease-and-desist order by the Securities and Exchange Commission ("SEC") (the "SEC Order"). The SEC Order and the NYAG Settlement are referred to collectively as the "Settlements". The Settlements contain substantially the same terms and conditions as outlined in the agreements in principle which Columbia Group entered into with the SEC and NYAG in March 2004.
Under the terms of the SEC Order, the Columbia Group has agreed among other things, to: pay $70 million in disgorgement and $70 million in civil money penalties; cease and desist from violations of the antifraud provisions and certain other provisions of the federal securities laws; maintain certain compliance and ethics oversight structures; retain an independent consultant to review the Columbia Group's applicable
21
February 28, 2006 (Unaudited) Columbia Greater China Fund
supervisory, compliance, control and other policies and procedures; and retain an independent distribution consultant (see below). The Columbia Funds have also voluntarily undertaken to implement certain governance measures designed to maintain the independence of their boards of trustees. The NYAG Settlement also, among other things, requires Columbia and its affiliates to reduce certain Columbia Funds (including former Nations Funds) and other mutual funds management fees collectively by $32 million per year for five years, for a projected total of $160 million in management fee reductions.
Pursuant to the procedures set forth in the SEC order, the $140 million in settlement amounts described above will be distributed in accordance with a distribution plan developed by an independent distribution consultant and agreed to by the staff of the SEC. The independent distribution consultant has been in consultation with the Staff, and has submitted a draft proposed plan of distribution, but has not yet submitted a final proposed plan of distribution.
As a result of these matters or any adverse publicity or other developments resulting from them, there may be increased redemptions or reduced sales of fund shares, which could increase transaction costs or operating expenses, or have other adverse consequences for the funds.
A copy of the SEC Order is available on the SEC website at http://www.sec.gov. A copy of the NYAG Settlement is available as part of the Bank of America Corporation Form 8-K filing on February 10, 2005.
In connection with the events described in detail above, various parties have filed suit against certain funds, the Trustees of the Columbia Funds, FleetBoston Financial Corporation and its affiliated entities and/or Bank of America and its affiliated entities.
On February 20, 2004, the Judicial Panel on Multidistrict Litigation transferred these cases and cases against several other mutual fund companies based on similar allegations to the United States District Court in Maryland for consolidated or coordinated pretrial proceedings (the "MDL"). Subsequently, additional related cases were transferred to the MDL. On September 29, 2004, the plaintiffs in the MDL filed amended and consolidated complaints. One of these amended complaints is a putative class action that includes claims under the federal securities laws and state common law, and that names Columbia, the Distributor, the Trustees of the Columbia Funds, Bank of America Corporation and others as defendants. Another of the amended complaints is a derivative action purportedly on behalf of the Columbia Funds that asserts claims under federal securities laws a nd state common law.
On February 25, 2005, Columbia and other defendants filed motions to dismiss the claims in the pending cases. On March 1, 2006, for reasons stated in the court's memoranda dated November 3, 2005, the U.S. District Court for the District of Maryland granted in part and denied in part the defendants' motions to dismiss. The court dismissed all of the class action claims pending against the Columbia Funds. As to Columbia, the Distributor and the Trustees of the Columbia Funds, the claims under the Securities Act of 1933, the claims under Sections 34(b) and 36(a) of the Investment Company Act of 1940 (ICA) and the state law claims were dismissed. The claims under Sections 10(b) and 20(a) of the Securities Exchange Act of 1934 and claims under Section 36(b) of the ICA along with related claims under Section 48(a) of the ICA were not dismissed.
On March 21, 2005 purported class action plaintiffs filed suit in Massachusetts state court alleging that the conduct, including market timing, entitles Class B shareholders in certain Columbia funds to an exemption from contingent deferred sales charges upon early redemption ("the CDSC Lawsuit"). The CDSC Lawsuit has been removed to federal court in Massachusetts and the federal Judicial Panel has transferred the CDSC Lawsuit to the MDL.
The MDL is ongoing. Accordingly, an estimate of the financial impact of this litigation on any fund, if any, cannot currently be made.
In 2004, certain Columbia funds, the Trustees of the Columbia Funds, advisers and affiliated entities were named as defendants in certain purported shareholder class and derivative actions making claims, including claims under the Investment Company and the Investment Advisers Acts of 1940 and state law. The suits allege, inter alia, that the fees and expenses paid by the funds are excessive and that the advisers and their affiliates inappropriately used fund assets to distribute the funds and for other improper purpose. On March 2, 2005, the actions were consolidated in the Massachusetts federal court as In re Columbia Entities Litigation. The plaintiffs filed a consolidated amended
22
February 28, 2006 (Unaudited) Columbia Greater China Fund
complaint on June 9, 2005. On November 30, 2005, the judge dismissed all claims by plaintiffs and ordered that the case be closed. The plaintiffs filed a notice of appeal on December 30, 2005 and this appeal is pending.
For the six months ended February 28, 2006, Columbia has assumed $561 of legal, consulting services and Trustees' fees incurred by the Fund in connection with these matters.
Note 10. Subsequent Event
Effective March 27, 2006, the Fund was re-domiciled into a new series of the Columbia Funds Series Trust I. Columbia Funds Series Trust I is a Massachusetts business trust registered under the Investment Company Act of 1940, as amended, as an open-end management investment company.
23
BOARD CONSIDERATION AND APPROVAL OF INVESTMENT ADVISORY AGREEMENTS
Columbia Greater China Fund
The Advisory Fees and Expenses Committee of the Board of Trustees meets one or more times annually, usually in late summer, to review the advisory agreements (collectively, the "Agreements") of the funds for which the Trustees serve as trustees or directors (each a "fund") and determine whether to recommend that the full Board approve the continuation of the Agreements for an additional one-year period. After the Committee has made its recommendation, the full Board, including the Independent Trustees, determines whether to approve the continuation of the Agreements. In addition, the Board, including the Independent Trustees, considers matters bearing on the Agreements at most of its other meetings throughout the year and meets regularly with the heads of each investment area within Columbia. The Trustees also meet with selected fund portfolio managers at various times throughout the year.
The Trustees receive and review all materials that they, their legal counsel or Columbia, the funds' investment adviser, believe to be reasonably necessary for the Trustees to evaluate the Agreements and determine whether to approve the continuation of the Agreements. Those materials generally include, among other items, (i) information on the investment performance of each fund relative to the performance of peer groups of mutual funds and the fund's performance benchmarks, (ii) information on each fund's advisory fees and other expenses, including information comparing the fund's expenses to those of peer groups of mutual funds and information about any applicable expense caps and fee "breakpoints," (iii) sales and redemption data, (iv) information about the profitability of the Agreements to Columbia, and potential "fall-out" or ancillary benefits that Columbia and its affiliates may receive as a result of their relationships with the funds and (v) information obtained through Columbia's response to a questionnaire prepared at the request of the Trustees by counsel to the funds and independent legal counsel to the Independent Trustees. The Trustees also consider other information such as (vi) Columbia's financial results and financial condition, (vii) each fund's investment objective and strategies and the size, education and experience of Columbia's investment staffs and their use of technology, external research and trading cost measurement tools, (viii) the allocation of the funds' brokerage, if any, including allocations to brokers affiliated with Columbia and the use of "soft" commission dollars to pay fund expenses and to pay for research products and services, (ix) Columbia's resources devoted to, and its record of compliance with, the funds' investment policies and restrictions, policies on personal securities transactions and other compliance polici es, (x) Columbia's response to various legal and regulatory proceedings since 2003 and (xi) the economic outlook generally and for the mutual fund industry in particular. In addition, the Trustees confer with their independent fee consultant and review materials relating to the Agreements that the independent fee consultant provides. Throughout the process, the Trustees have the opportunity to ask questions of and request additional materials from Columbia and to consult independent legal counsel to the Independent Trustees.
The Board of Trustees most recently approved the continuation of the Agreements at its October, 2005 meeting, following meetings of the Advisory Fees and Expenses Committee held in August, September, and October, 2005. In considering whether to approve the continuation of the Agreements, the Trustees, including the Independent Trustees, did not identify any single factor as determinative, and each weighed various factors as he or she deemed appropriate. The Trustees considered the following matters in connection with their approval of the continuation of the Agreements:
The nature, extent and quality of the services provided to the funds under the Agreements. The Trustees considered the nature, extent and quality of the services provided by Columbia and its affiliates to the funds and the resources dedicated to the funds by Columbia and its affiliates. Among other things, the Trustees considered (i) Columbia's ability, including its resources, compensation programs for personnel involved in fund management, reputation and other attributes, to attract and retain highly qualified research, advisory and supervisory investment professionals; (ii) the portfolio management services provided by those investment professionals; and (iii) the trade execution services provided on behalf of the funds. For each fund, the Trustees also considered the benefits to shareholders of investing in a mutual fund that is part of a family o f funds offering exposure to a variety of asset classes and investment disciplines and providing for a variety of fund and shareholder services. After reviewing those and related factors, the Trustees concluded, within the context of their overall conclusions regarding each of the Agreements, that the
24
Columbia Greater China Fund
nature, extent and quality of services provided supported the continuation of the Agreements.
Investment performance of the funds and Columbia. The Trustees reviewed information about the performance of each fund over various time periods, including information prepared by an independent third party that compared the performance of each fund to the performance of peer groups of mutual funds and performance benchmarks. The Trustees also reviewed a description of the third party's methodology for identifying each fund's peer group for purposes of performance and expense comparisons. The Trustees also considered additional information that the Advisory Fees and Expenses Committee requested from Columbia relating to funds that presented relatively weaker performance and/or relatively higher expenses.
In the case of each fund that had performance that lagged that of a relevant peer group for certain (although not necessarily all) periods, the Trustees concluded that other factors relevant to performance were sufficient, in light of other considerations, to warrant continuation of the fund's Agreements. Those factors varied from fund to fund, but included one or more of the following: (i) that the fund's performance, although lagging in certain recent periods, was stronger over the longer term; (ii) that the underperformance was attributable, to a significant extent, to investment decisions that were reasonable and consistent with the fund's investment strategy and policies and that the fund was performing as expected, given market conditions and the fund's investment strategy; (iii) that the fund's performance was competitive when compared to other relevant performance benchmarks or peer groups; (iv) that Columbia had taken o r was taking steps designed to help improve the fund's investment performance, including, but not limited to, replacing portfolio managers or modifying investment strategies; (v) that the fund's advisory fee had recently been, or was proposed to be, reduced, with the goal of helping the fund's net return to shareholders become more competitive; and (vi) that other fund expenses, such as transfer agency or fund accounting fees, have recently been reduced, with the goal of helping the fund's net return to shareholders become more competitive.
The Trustees also considered Columbia's performance and reputation generally, the funds' performance as a fund family generally, and Columbia's historical responsiveness to Trustee concerns about performance and Columbia's willingness to take steps intended to improve performance.
After reviewing those and related factors, the Trustees concluded, within the context of their overall conclusions regarding each of the Agreements, that the performance of each fund and Columbia was sufficient, in light of other considerations, to warrant the continuation of the Agreements.
The costs of the services provided and profits realized by Columbia and its affiliates from their relationships with the funds. The Trustees considered the fees charged to the funds for advisory services as well as the total expense levels of the funds. That information included comparisons (provided both by management and by an independent third party) of the funds' advisory fees and total expense levels to those of their peer groups and information about the advisory fees charged by Columbia to comparable accounts. In considering the fees charged to comparable accounts, the Trustees took into account, among other things, management's representations about the differences between managing mutual funds as compared to other types of accounts, including the additional resources required to effectively manage mutual funds and distribute mutual fund share s. In evaluating each fund's advisory fees, the Trustees also took into account the demands, complexity and quality of the investment management of the fund. The Trustees considered reductions in advisory fee rates, implementation of advisory fee breakpoints, institution of advisory fee waivers, and changes to expense caps, which benefited a number of the funds. Furthermore, the Trustees considered the projected impact on expenses resulting from the overall cost reductions that management anticipated would result from the shift to a common group of service providers for transfer agency, fund accounting and custody services for mutual funds advised by Bank of America affiliates. The Trustees also noted management's stated justification for the fees charged to the funds, which included information about the performance of the funds, the services provided to the funds and management's view as to why it was appropriate that some funds bear advisory fees or total expenses greater than their peer group medians.
The Trustees also considered the compensation directly or indirectly received by Columbia and its affiliates from their relationships with the funds. The Trustees reviewed information provided by management as to
25
Columbia Greater China Fund
the profitability to Columbia and its affiliates of their relationships with the funds, and information about the allocation of expenses used to calculate profitability. When reviewing profitability, the Trustees also considered court cases in which adviser profitability was an issue in whole or in part, the performance of the relevant funds, the expense levels of the funds, and whether Columbia had implemented breakpoints and/or expense caps with respect to the funds.
After reviewing those and related factors, the Trustees concluded, within the context of their overall conclusions regarding each of the Agreements, that the advisory fees charged to each of the funds were fair and reasonable, and that the costs of the advisory services generally, and the related profitability to Columbia and its affiliates of their relationships with the funds, supported the continuation of the Agreements.
Economies of Scale. The Trustees considered the existence of any economies of scale in the provision of services by Columbia to each fund and whether those economies were shared with the fund through breakpoints in the investment advisory fees or other means, such as expense waivers. The Trustees noted that many of the funds benefited from breakpoints, expense caps, or both. In considering those issues, the Trustees also took note of the costs of the services provided (both on an absolute and a relative basis) and the profitability to Columbia and its affiliates of their relationships with the funds, as discussed above.
After reviewing those and related factors, the Trustees concluded, within the context of their overall conclusions regarding each of the Agreements, that the extent to which economies of scale were shared with the funds supported the continuation of the Agreements.
Other Factors. The Trustees also considered other factors, which included but were not limited to the following:
• the extent to which each fund had operated in accordance with its investment objective and its record of compliance with its investment restrictions, and the compliance programs of the funds and Columbia. They also considered the compliance-related resources that Columbia and its affiliates were providing to the funds.
• the nature, quality, cost and extent of administrative and shareholder services performed by Columbia and its affiliates, both under the Agreements and under separate agreements for the provision of transfer agency and administrative services.
• so-called "fall-out benefits" to Columbia, such as the engagement of its affiliates to provide distribution, brokerage and transfer agency services to the funds, and the benefits of research made available to Columbia by reason of brokerage commissions generated by the funds' securities transactions, as well as possible conflicts of interest associated with those fall-out and other benefits, and the reporting, disclosure and other processes in place to disclose and monitor those possible conflicts of interest.
• the draft report provided by the independent fee consultant, which included information about and analysis of the funds' fees, expenses and performance.
Based on their evaluation of all factors that they deemed to be material, including those factors described above, and assisted by the advice of independent counsel and the independent fee consultant, the Trustees, including the Independent Trustees, approved the continuance of each of the Agreements through October 31, 2006.
26
SUMMARY OF MANAGEMENT FEE EVALUATION
BY INDEPENDENT FEE CONSULTANT
Columbia Greater China Fund
Prepared Pursuant to the February 9, 2005
Assurance of Discontinuance
between the Office of
Attorney General of New York State and
Columbia Management Advisors, Inc. and
Columbia Funds Distributor, Inc.
October 11, 2005
I. Overview
Columbia Management Advisors, Inc. ("CMA") and Columbia Funds Distributors, Inc. ("CFD") (CFD together with CMA referred to herein as Columbia Management Group or "CMG1"), entered into an agreement with the New York Attorney General's Office in the form of an Assurance of Discontinuance (the "AOD"). The AOD stipulated that CMA would be permitted to manage or advise the Columbia Funds only if the Independent Members (as such term is defined in the AOD) of the Columbia Funds' Board of Trustees/Directors (collectively the "Trustees") appointed a Senior Officer or an Independent Fee Consultant ("IFC") who, among other things, is to manage the process by which management fees are negotiated. On May 15, 2005, the Independent Members of the Board appointed me as the IFC for the Columbia Funds. This report is the annual written evaluation of the Columbia Funds for 2005 that I have prepared in my capacity as IFC, as required b y the AOD.
A. Duties of the Independent Fee Consultant
As part of the AOD, the Independent Members of the Columbia Funds' Board of Trustees/Directors agreed to retain an independent fee consultant who was to participate in the management fee negotiation process. The IFC is charged with "... duties and responsibilities [that] include managing the process by which proposed management fees (including, but not limited to, advisory fees) to be charged the Columbia Fund[s] are negotiated so that they are negotiated in a manner which is at arms length and reasonable and consistent with this Assurance of Discontinuance." However, the IFC does not replace the Trustees in their role of negotiating management and other fees with CMG and its affiliates. In particular, the AOD states that "Columbia Advisors may manage or advise a Columbia Fund only if the reasonableness of the proposed management fees is determined by the Bo ard of Trustees of the Columbia Fund using ... an annual independent written evaluation prepared by or under the direction of the ... Independent Fee Consultant...." This report, pursuant to the AOD, constitutes the "annual independent written evaluation prepared by or under the direction of the... Independent Fee Consultant."
The AOD requires the IFC report to consider at least the following:
a) Management fees (including any components thereof) charged by other mutual fund companies for like services;
b) Management fees (including any components thereof) charged to institutional and other clients of CMA for like services;
c) Costs to CMA and its affiliates of supplying services pursuant to the management fee agreements, excluding any intra-corporate profit;
d) Profit margins of CMA and its affiliates from supplying such services;
e) Possible economies of scale as the CMA fund grows larger; and
f) The nature and quality of CMA services, including Columbia Funds' performance.
This report is designed to assist the Board in evaluating the 2005 contract renewal for Columbia Funds. In addition, this report points out areas where the Board may deem additional information and analysis to be appropriate over time.
B. Sources of Information Used in My Evaluation
I have requested data from CMG and various third party industry data sources or independent research companies that work in the mutual fund arena. The following list generally describes the types of information I requested.
1. I collected data on performance, management fees, and expense ratios of both Columbia Funds and
1 Prior to the date of this report, CMA merged into an affiliated entity, Banc of America Capital Management, LLC ("BACAP"), and BACAP then changed its name to Columbia Management Advisors, LLC which carries on the business of CMA, and CFD changed its name to Columbia Management Distributors, Inc.
27
Columbia Greater China Fund
comparable non-Columbia Funds. The sources of this information were CMG, Lipper Inc. ("Lipper") and Morningstar Inc. ("Morningstar"). While Lipper and Morningstar each selected a different group of peer funds it deemed appropriate against which to measure the relative performance and fees of Columbia Funds, I conducted an independent review of the appropriateness of each peer group.
2. I reviewed data on CMG's expense and profitability that I obtained from CMA directly.
3. I have reviewed data on the organizational structure of CMG in general.
4. I collected information on profitability from Strategic Insight Mutual Fund Research and Consulting, LLC ("Strategic Insight"). I used this third-party independent research as an additional method to gauge the accuracy of the data collected in (2) above.
5. I conducted interviews with various CMG staff, including members of the senior management team, legal staff, heads of affiliates, portfolio managers, and financial personnel.
6. I reviewed current 2005 Section 15(c) material provided to the Board and material presented to the Board in the 2004 fee and performance evaluation.
7. I have reviewed various academic research papers, industry publications, and other available literature dealing with mutual fund operations, profitability, and other issues. In addition, I have reviewed SEC releases and studies of mutual fund expenses.
8. I have reviewed documents pertaining to recent mutual fund litigation in general and publicly available information about litigation where CMG has been involved.
In addition, I have engaged NERA Economic Consulting ("NERA") and independent consultant Dr. John Rea to assist me in data management and analysis. Both NERA and Dr. Rea have extensive experience in the mutual fund industry through consulting, government positions, or industry trade groups that provide unique insights and special knowledge pertaining to my independent analysis of fees, performance, and profitability. I have also retained Shearman & Sterling LLP as outside counsel to advise me in connection with my review.
C. Qualifications and Independence
I am the Walter H. Carpenter Chair and Professor of Finance at Babson College. Before this I was the Chief Economist of the U.S. Securities and Exchange Commission. I have no material relationship with Bank of America or CMG aside from acting as IFC, and am aware of no relationship with any of their affiliates. [Resume omitted]
II. EVALUATION OF THE GENERAL PROCESS USED TO NEGOTIATE THE ADVISORY CONTRACT
A. General Considerations
My analysis considered all factors and information I reviewed on the finances and operations of Columbia Funds. I gave each factor an appropriate weight in my overall findings, and no single factor was in itself the sole criterion for a finding or conclusion. My objective was to assess all of the information provided and conduct a robust evaluation of Columbia Funds' operations, fees, and performance.
My analysis and thought processes will and, I believe, should, differ in certain ways from the processes used by Trustees in their evaluation of the management agreements. In particular, because of my technical and quantitative background, I may use techniques and data that Trustees have not previously felt would be useful. I view this supplemental analysis as appropriate because my role is to assist Trustees in their decisions, and to the extent that I bring new ideas or analysis to the evaluation, I believe this improves the process by which management fees for the Columbia Funds may be negotiated in accordance with the AOD.
Finally, as part of my role as IFC, I have, from time to time, sent to Trustees additional papers and reports produced by third parties that I felt had bearing on the fee negotiation process. I viewed these materials as educational in nature and felt they would aid Trustees in placing their work in context.
B. CMG Management Interviews
As a starting point of my analysis, I have met with members of CMG staff to gain an understanding of the organizational structure and personnel involved in running the Columbia fund family.
I have had general discussions and have received information about the management structure of CMG.
28
Columbia Greater China Fund
My conversations with management have been informative. In addition, I have participated in Board meetings where Trustees and management have discussed issues relating to management agreements and performance of Columbia Funds. When I felt it was appropriate, I added my opinions on particular matters, such as fund performance or fee levels, to the discussion.
C. Trustees' Fee and Performance Evaluation Process
After making initial requests for information, members of the Trustees of the Columbia Funds met in advance of the October Section 15(c) contract approval meeting to review certain fee, performance and other data for the Columbia Funds and to ask questions and make requests of management. Trustees have developed a process to evaluate the fee and expense levels and performance of Columbia Funds. This process is used to highlight those funds that have been performing poorly, may have had higher management fees or expense ratios, or both.
The process involves providing instructions to Lipper to prepare specific data analyses tailored to the Trustees review framework. These instructions include highlighting funds that hit one or more fee performance "screens." The six screens the Trustees use are as follows:
a. 5th Lipper quintile in actual management fee;
b. 5th Lipper quintile in total expense ratio;
c. Three or more 5th Lipper quintile rankings in the 1-, 3-, 5- or 10-year performance rankings;
d. Sum of the Lipper Quintile Rank (1-year performance) and the Lipper Quintile Rank (actual management fee) totals a number equal to or higher than 8;
e. Sum of the Lipper Quintile Rank (1-year performance) and the Lipper Quintile Rank (total expense ratio) totals a number equal to or higher than 8; and
f. Sum of the Lipper Quintile Rank (3-year performance) and the Lipper Quintile Rank (total expense ratio) totals a number equal to or higher than 8.
If a fund hits one or more of these screens, it is highlighted for additional review by the Trustees. This method is only used as an aid for Trustees to highlight funds and is not the sole test of whether the Board will determine to take particular actions concerning fees or performance. Funds that have not been flagged by this screen also may be singled out for fee and performance reasons, and the Trustees may determine not to take action with respect to the fees or performance of funds that have been flagged by the screen. These screens contribute to the basis for discussions on Trustees' views on the Columbia Funds.
III. FINDINGS
My findings based on my work as IFC are as follows:
1. The Trustees have the relevant information necessary to form an opinion on the reasonableness of fees and evaluate the performance of the Columbia Funds. The process the Trustees used in preparing to reach their determination has been open and informative. In my view, the 2005 process by which the management fees of the Columbia Funds have been negotiated thus far has been, to the extent practicable, at arm's length and reasonable and consistent with the AOD.
2. Columbia Funds demonstrated a range of performance relative to their peers. I find that across the fund complex, 54.26 percent of Columbia Funds have performance higher than the median of their respective Lipper performance universe, and 42.55 percent of Columbia Funds have performance higher than the median of their respective Lipper performance group. In addition, Lipper performance universe and group comparison showed that Columbia Funds were distributed roughly evenly across these quintiles. The Trustees have worked with management to address issues of funds that have demonstrated consistent or significant underperformance.
3. Columbia Funds demonstrate a range of management fees and expense ratios relative to their peers. I find that across the fund complex, 58.51 percent of Columbia Funds have expenses below the median of their Lipper expense universe, and 53.19 percent of Columbia Funds have expenses below the median of their Lipper expense group. In addition, Lipper expense universe and group comparisons show that Columbia Funds are distributed roughly evenly across these quintiles. The Trustees have taken steps to limit shareholder expenses for certain funds having management fees significantly above their peers, often though the use of fee waivers to which CMG has agreed.
29
Columbia Greater China Fund
Consolidation of various funds and fund families managed by CMG has resulted in substantial savings in non-advisory expenses.
4. Profitability to CMG of the individual funds ranges widely, but the overall profitability to CMG of its relationship with the Columbia Funds appears to fall within a reasonable range. The method of cost allocation to funds is addressed in the material provided by CMG to the Trustees, but additional information may be necessary to make a judgment on fund level profitability. My review of profitability and cost allocation is ongoing, and I plan to continue to develop my views with regard to fund level profitability.
5. Columbia Funds have instituted fee schedules with breakpoints designed to enable investors to benefit from fund economies of scale, although 71% of the funds have not yet reached their first breakpoint. My analysis of the appropriateness of the breakpoint levels, which I expect will take into account the cost and profitability of the individual funds, is ongoing.
My work is ongoing and my views may develop over time in light of new information and analysis.
Respectfully submitted,
Erik R. Sirri
30
COLUMBIA FUNDS
Columbia Greater China Fund
| Growth Funds | | Columbia Acorn Fund | |
|
| | | Columbia Acorn Select | |
|
| | | Columbia Acorn USA | |
|
| | | Columbia Growth Stock Fund | |
|
| | | Columbia Large Cap Growth Fund | |
|
| | | Columbia Marsico 21st Century Fund | |
|
| | | Columbia Marsico Focused Equities Fund | |
|
| | | Columbia Marsico Growth Fund | |
|
| | | Columbia Marsico Mid Cap Growth Fund | |
|
| | | Columbia Mid Cap Growth Fund | |
|
| | | Columbia Small Cap Growth Fund I | |
|
| | | Columbia Small Cap Growth Fund II | |
|
| | | Columbia Small Company Equity Fund | |
|
| Core Funds | | Columbia Common Stock Fund | |
|
| | | Columbia Large Cap Core Fund | |
|
| | | Columbia Small Cap Core Fund | |
|
| | | Columbia Young Investor Fund | |
|
| Value Funds | | Columbia Disciplined Value Fund | |
|
| | | Columbia Dividend Income Fund | |
|
| | | Columbia Large Cap Value Fund | |
|
| | | Columbia Mid Cap Value Fund | |
|
| | | Columbia Small Cap Value Fund I | |
|
| | | Columbia Small Cap Value Fund II | |
|
| | | Columbia Strategic Investor Fund | |
|
| Asset Allocation/Hybrid Funds | | Columbia Asset Allocation Fund | |
|
| | | Columbia Asset Allocation Fund II | |
|
| | | Columbia Balanced Fund | |
|
| | | Columbia Liberty Fund | |
|
| | | Columbia LifeGoalTM Balanced Growth Portfolio | |
|
| | | Columbia LifeGoalTM Growth Portfolio | |
|
| | | Columbia LifeGoalTM Income Portfolio | |
|
| | | Columbia LifeGoalTM Income and Growth Portfolio | |
|
| | | Columbia Thermostat Fund | |
|
| Index Funds | | Columbia Large Cap Enhanced Core Fund | |
|
| | | Columbia Large Cap Index Fund | |
|
| | | Columbia Mid Cap Index Fund | |
|
| | | Columbia Small Cap Index Fund | |
|
| Tax-Managed Fund | | Columbia Tax-Managed Growth Fund | |
|
| Specialty Funds | | Columbia Convertible Securities Fund | |
|
| | | Columbia Real Estate Equity Fund | |
|
| | | Columbia Technology Fund | |
|
| | | Columbia Utilities Fund | |
|
| Global/International Funds | | Columbia Acorn International | |
|
| | | Columbia Acorn International Select | |
|
| | | Columbia Global Value Fund | |
|
| | | Columbia Greater China Fund | |
|
| | | Columbia International Stock Fund | |
|
| | | Columbia International Value Fund | |
|
| | | Columbia Marsico International Opportunities Fund | |
|
| | | Columbia Multi-Advisor International Equity Fund | |
|
| | | Columbia World Equity Fund | |
|
31
Columbia Greater China Fund
| Taxable Bond Funds | | Columbia Conservative High Yield Fund | |
|
| | | Columbia Core Bond Fund | |
|
| | | Columbia Federal Securities Fund | |
|
| | | Columbia High Income Fund | |
|
| | | Columbia High Yield Opportunity Fund | |
|
| | | Columbia Income Fund | |
|
| | | Columbia Intermediate Bond Fund | |
|
| | | Columbia Intermediate Core Bond Fund | |
|
| | | Columbia Short Term Bond Fund | |
|
| | | Columbia Strategic Income Fund | |
|
| | | Columbia Total Return Bond Fund | |
|
| | | Columbia U.S. Treasury Index Fund | |
|
| Tax-Exempt Bond Funds | | Columbia California Tax-Exempt Fund | |
|
| | | Columbia California Intermediate Municipal Bond Fund | |
|
| | | Columbia Connecticut Tax-Exempt Fund | |
|
| | | Columbia Connecticut Intermediate Municipal Bond Fund | |
|
| | | Columbia Florida Intermediate Municipal Bond Fund | |
|
| | | Columbia Georgia Intermediate Municipal Bond Fund | |
|
| | | Columbia High Yield Municipal Fund | |
|
| | | Columbia Intermediate Municipal Bond Fund | |
|
| | | Columbia Massachusetts Intermediate Municipal Bond Fund | |
|
| | | Columbia Massachusetts Tax-Exempt Fund | |
|
| | | Columbia Maryland Intermediate Municipal Bond Fund | |
|
| | | Columbia Municipal Income Fund | |
|
| | | Columbia North Carolina Intermediate Municipal Bond Fund | |
|
| | | Columbia New York Tax-Exempt Fund | |
|
| | | Columbia New Jersey Intermediate Municipal Bond Fund | |
|
| | | Columbia New York Intermediate Municipal Bond Fund | |
|
| | | Columbia Oregon Intermediate Municipal Bond Fund | |
|
| | | Columbia Rhode Island Intermediate Municipal Bond Fund | |
|
| | | Columbia South Carolina Intermediate Municipal Bond Fund | |
|
| | | Columbia Short Term Municipal Bond Fund | |
|
| | | Columbia Tax-Exempt Fund | |
|
| | | Columbia Tax-Exempt Insured Fund | |
|
| | | Columbia Texas Intermediate Municipal Bond Fund | |
|
| | | Columbia Virginia Intermediate Municipal Bond Fund | |
|
| Money Market Funds | | Columbia California Tax-Exempt Reserves | |
|
| | | Columbia Cash Reserves | |
|
| | | Columbia Connecticut Municipal Reserves | |
|
| | | Columbia Government Plus Reserves | |
|
| | | Columbia Government Reserves | |
|
| | | Columbia Massachusetts Municipal Reserves | |
|
| | | Columbia Money Market Reserves | |
|
| | | Columbia Municipal Reserves | |
|
| | | Columbia New York Tax-Exempt Reserves | |
|
| | | Columbia Prime Reserves | |
|
| | | Columbia Tax-Exempt Reserves | |
|
| | | Columbia Treasury Reserves | |
|
For complete product information on any Columbia fund, visit our website at www.columbiafunds.com.
Columbia Management is the primary investment management division of Bank of America Corporation. Columbia Management entities furnish investment management services and advise institutional and mutual fund portfolios. Columbia Funds are distributed by Columbia Management Distributors, Inc., member of NASD, SIPC, part of Columbia Management and an affiliate of Bank of America Corporation.
32
IMPORTANT INFORMATION ABOUT THIS REPORT
Columbia Greater China Fund
Transfer Agent
Columbia Management Services, Inc.
P.O. Box 8081
Boston MA 02266-8081
800.345.6611
Distributor
Columbia Management Distributors, Inc.
One Financial Center
Boston MA 02111
Investment Advisor
Columbia Management Advisors, LLC 100 Federal Street
Boston MA 02110
The fund mails one shareholder report to each shareholder address. If you would like more than one report, please call shareholder services at 800-345-6611 and additional reports will be sent to you.
This report has been prepared for shareholders of Columbia Greater China Fund. This report may also be used as sales literature when preceded or accompanied by the current prospectus which provides details of sales charges, investment objectives and operating policies of the fund and with the most recent copy of the Columbia Funds Performance Update.
A description of the policies and procedures that the fund uses to determine how to vote proxies and a copy of the fund's voting record are available (i) at www.columbiamanagement.com; (ii) on the Securities and Exchange Commission's website at www.sec.gov, and (iii) without charge, upon request, by calling 800-368-0346. Information regarding how the fund voted proxies relating to portfolio securities during the 12-month period ended June 30 is available from the SEC's website. Information regarding how the fund voted proxies relating to portfolio securities is also available from the fund's website.
The fund files a complete schedule of portfolio holdings with the SEC for the first and third quarters of each fiscal year on Form N-Q. The fund's Form N-Q is available on the SEC's website at www.sec.gov and may be reviewed and copied at the SEC's Public Reference Room in Washington, DC. Information on the operation of the Public Reference Room may be obtained by calling 1-800-SEC-0330.
Columbia Management is the primary investment management division of Bank of America Corporation. Columbia Management entities furnish investment management services and advise institutional and mutual fund portfolios. Columbia Funds are distributed by Columbia Management Distributors, Inc., member of NASD, SIPC, part of Columbia Management and an affiliate of Bank of America Corporation.
33

Help your fund reduce printing and postage costs! Elect to get your shareholder reports by electronic delivery. With Columbia's eDelivery program, you receive an
e-mail message when your shareholder report becomes available online. If your fund account is registered with Columbia Funds, you can sign up quickly and easily on our website at www.columbiafunds.com.
Please note — if you own your fund shares through a financial institution, contact the institution to see if it offers electronic delivery. If you own your fund shares through a retirement plan, electronic delivery may not be available to you.
Columbia Greater China Fund Semiannual Report, February 28, 2006

PRSRT STD
U.S. Postage
PAID
Holliston, MA
Permit NO. 20
SHC-44/107436-0206 (04/06) 06/10743
Item 2. Code of Ethics.
Not applicable at this time.
Item 3. Audit Committee Financial Expert.
Not applicable at this time.
Item 4. Principal Accountant Fees and Services.
Not applicable at this time.
Item 5. Audit Committee of Listed Registrants.
Not applicable.
Item 6. Schedule of Investments
The registrant’s “Schedule I – Investments in securities of unaffiliated issuers” (as set forth in 17 CFR 210.12-12) is included in Item 1 of this Form N-CSR.
Item 7. Disclosure of Proxy Voting Policies and Procedures for Closed-End Management Investment Companies.
Not applicable.
Item 8. Portfolio Managers of Closed-End Management Investment Companies.
Not applicable.
Item 9. Purchases of Equity Securities by Closed-End Management Investment Company and Affiliated Purchasers.
Not applicable.
Item 10. Submission of Matters to a Vote of Security Holders.
There have not been any material changes to the procedures by which shareholders may recommend nominees to the registrant’s board of directors, since those procedures were
last disclosed in response to the requirements of Item 7(d)(2)(ii)(G) of Schedule 14A or this Item.
Item 11. Controls and Procedures.
(a) The registrant’s principal executive officer and principal financial officers, based on their evaluation of the registrant’s disclosure controls and procedures as of a date within 90 days of the filing of this report, have concluded that such controls and procedures are adequately designed to ensure that information required to be disclosed by the registrant in Form N-CSR is accumulated and communicated to the registrant’s management, including the principal executive officer and principal financial officer, or persons performing similar functions, as appropriate to allow timely decisions regarding required disclosure.
(b) There were no changes in the registrant’s internal control over financial reporting that occurred during the registrant’s second fiscal quarter of the period covered by this report that has materially affected, or is reasonably likely to materially affect, the registrant’s internal control over financial reporting.
Item 12. Exhibits.
(a)(1) Code of ethics required to be disclosed under Item 2 of Form N-CSR: Not applicable at this time.
(a)(2) Certifications pursuant to Rule 30a-2(a) under the Investment Company Act of 1940 (17 CFR 270.30a-2(a)) attached hereto as Exhibit 99.CERT.
(a)(3) Not applicable.
(b) Certification pursuant to Rule 30a-2(b) under the Investment Company Act of 1940 (17 CFR 270.30a-2(b)) attached hereto as Exhibit 99.906CERT.
SIGNATURES
Pursuant to the requirements of the Securities Exchange Act of 1934 and the Investment Company Act of 1940, the registrant has duly caused this report to be signed on its behalf by the undersigned, thereunto duly authorized.
(registrant) | | Columbia Funds Trust II | | |
| | | | |
| | | | |
By (Signature and Title) | | /S/ Christopher L. Wilson | | |
| Christopher L. Wilson, President |
| | | | |
| | | | |
Date | | April 26, 2006 | | |
| | | | | | | |
Pursuant to the requirements of the Securities Exchange Act of 1934 and the Investment Company Act of 1940, this report has been signed below by the following persons on behalf of the registrant and in the capacities and on the dates indicated.
By (Signature and Title) | | /S/ Christopher L. Wilson | | |
| Christopher L. Wilson, President | | |
| | | | |
| | | | |
Date | | April 26, 2006 | | |
| | | | |
| | | | |
By (Signature and Title) | | /S/ J. Kevin Connaughton | | |
| J. Kevin Connaughton, Treasurer | | |
| | | | |
| | | | |
Date | | April 26, 2006 | | |
| | | | | | |