UNITED STATES
SECURITIES AND EXCHANGE COMMISSION
Washington, D.C. 20549
FORM N-CSR
CERTIFIED SHAREHOLDER REPORT OF REGISTERED
MANAGEMENT INVESTMENT COMPANIES
Investment Company Act file number 811-3010
Fidelity Advisor Series VII
(Exact name of registrant as specified in charter)
82 Devonshire St., Boston, Massachusetts 02109
(Address of principal executive offices) (Zip code)
Eric D. Roiter, Secretary
82 Devonshire St.
Boston, Massachusetts 02109
(Name and address of agent for service)
Registrant's telephone number, including area code: 617-563-7000
Date of fiscal year end:
| July 31
|
|
|
Date of reporting period:
| July 31, 2005
|
Item 1. Reports to Stockholders

Fidelity Advisor Focus Funds®
Class A, Class T, Class B and Class C
Biotechnology
Consumer Industries
Cyclical Industries
Developing Communications
Electronics
Financial Services
Health Care
Natural Resources
Technology
Telecommunications & Utilities Growth
Annual Report
July 31, 2005

Contents
| Biotechnology | | A-4 | | Performance |
| | | A-5 | | Management’s Discussion |
| | | A-6 | | Shareholder Expense Example |
| | | A-7 | | Investment Changes |
| | | A-8 | | Investments |
| | | A-10 | | Financial Statements |
| | | A-14 | | Notes to the Financial Statements |
| |
| Consumer Industries | | A-18 | | Performance |
| | | A-19 | | Management’s Discussion |
| | | A-20 | | Shareholder Expense Example |
| | | A-21 | | Investment Changes |
| | | A-22 | | Investments |
| | | A-25 | | Financial Statements |
| | | A-29 | | Notes to the Financial Statements |
| |
| Cyclical Industries | | A-34 | | Performance |
| | | A-35 | | Management’s Discussion |
| | | A-36 | | Shareholder Expense Example |
| | | A-37 | | Investment Changes |
| | | A-38 | | Investments |
| | | A-42 | | Financial Statements |
| | | A-46 | | Notes to the Financial Statements |
| |
| Developing Communications | | A-51 | | Performance |
| | | A-52 | | Management’s Discussion |
| | | A-53 | | Shareholder Expense Example |
| | | A-54 | | Investment Changes |
| | | A-55 | | Investments |
| | | A-57 | | Financial Statements |
| | | A-61 | | Notes to the Financial Statements |
| |
| Electronics | | A-65 | | Performance |
| | | A-66 | | Management’s Discussion |
| | | A-67 | | Shareholder Expense Example |
| | | A-68 | | Investment Changes |
| | | A-69 | | Investments |
| | | A-70 | | Financial Statements |
| | | A-74 | | Notes to the Financial Statements |
| |
| Financial Services | | A-78 | | Performance |
| | | A-79 | | Management’s Discussion |
| | | A-80 | | Shareholder Expense Example |
| | | A-81 | | Investment Changes |
| | | A-82 | | Investments |
| | | A-85 | | Financial Statements |
| | | A-89 | | Notes to the Financial Statements |
| |
| Health Care | | A-94 | | Performance |
| | | A-95 | | Management’s Discussion |
| | | A-96 | | Shareholder Expense Example |
| | | A-97 | | Investment Changes |
| | | A-98 | | Investments |
| | | A-101 | | Financial Statements |
| | | A-105 | | Notes to the Financial Statements |
Annual Report A-2
A-2
| Natural Resources | | A-109 | | Performance |
| | | A-110 | | Management’s Discussion |
| | | A-111 | | Shareholder Expense Example |
| | | A-112 | | Investment Changes |
| | | A-113 | | Investments |
| | | A-116 | | Financial Statements |
| | | A-120 | | Notes to the Financial Statements |
| |
| Technology | | A-125 | | Performance |
| | | A-126 | | Management’s Discussion |
| | | A-127 | | Shareholder Expense Example |
| | | A-128 | | Investment Changes |
| | | A-129 | | Investments |
| | | A-132 | | Financial Statements |
| | | A-136 | | Notes to the Financial Statements |
| |
| Telecommunications & | | | | |
| Utilities Growth | | A-141 | | Performance |
| | | A-142 | | Management’s Discussion |
| | | A-143 | | Shareholder Expense Example |
| | | A-144 | | Investment Changes |
| | | A-145 | | Investments |
| | | A-147 | | Financial Statements |
| | | A-151 | | Notes to the Financial Statements |
| |
| Report of Independent | | A-156 | | |
| Registered Public | | | | |
| Accounting Firm | | | | |
| Trustees and Officers | | A-157 | | |
| |
| Distributions | | A-163 | | |
| |
| Board Approval of | | A-166 | | |
| Investment Advisory | | | | |
| Contracts and | | | | |
| Management Fees | | | | |
To view a fund’s proxy voting guidelines and proxy voting record for the 12-month period ended June 30, visit www.fidelity.com/proxyvotingresults or visit the Securities and Exchange Commission’s (SEC) web site at www.sec.gov. You may also call 1-877-208-0098 to request a free copy of the proxy voting guidelines.
Standard & Poor’s, S&P and S&P 500 are registered service marks of The McGraw-Hill Companies, Inc. and have been licensed for use by Fidelity Distributors Corporation.
Other third party marks appearing herein are the property of their respective owners.
All other marks appearing herein are registered or unregistered trademarks or service marks of FMR Corp. or an affiliated company.
This report and the financial statements contained herein are submitted for the general information of the shareholders of the funds. This report is not authorized for distribution to prospective investors in the funds unless preceded or accompanied by an effective prospectus.
A fund files its complete schedule of portfolio holdings with the SEC for the first and third quarters of each fiscal year on Form N-Q. Forms N-Q are available on the SEC’s web site at http://www.sec.gov. A fund’s Forms N-Q may be reviewed and copied at the SEC’s Public Reference Room in Wash-ington, DC. Information regarding the operation of the SEC’s Public Reference Room may be obtained by calling 1-800-SEC-0330. For a complete list of a fund’s portfolio holdings, view the most recent quarterly holdings report, semiannual report, or annual report on Fidelity’s web site at http://www.advisor.fidelity.com.
NOT FDIC INSURED · MAY LOSE VALUE · NO BANK GUARANTEE
Neither the funds nor Fidelity Distributors Corporation is a bank.
A-3 Annual Report
Advisor Biotechnology Fund — Class A, T, B, and C
Performance
Average annual total return reflects the change in the value of an investment, assuming reinvestment of the class’ dividend income and capital gains (the profits earned upon the sale of securities that have grown in value) and assuming a constant rate of performance each year. The $10,000 table and the fund’s returns do not reflect the deduction of taxes that a shareholder would pay on fund distributions or the redemption of fund shares. During periods of reimbursement by Fidelity, a fund’s total return will be greater than it would be had the reimbursement not occurred. How a fund did yesterday is no guarantee of how it will do tomorrow.
| Average Annual Total Returns | | | | |
| Periods ended July 31, 2005 | | Past 1 | | Life of |
| | | year | | fundA |
| Class A (incl. 5.75% sales charge) | | 6.82% | | --9.23% |
| Class T (incl. 3.50% sales charge) | | 8.99% | | --9.00% |
| Class B (incl. contingent deferred | | | | |
| sales charge)B | | 7.33% | | --9.17% |
| Class C (incl. contingent deferred | | | | |
| sales charge)C | | 11.50% | | --8.74% |
A From December 27, 2000.
B Class B shares’ contingent deferred sales charges included in the past one year and life of fund total return figures are 5% and 2%, respectively.
C Class C shares’ contingent deferred sales charges included in the past one year and life of fund total return figures are 1% and 0%, respectively.
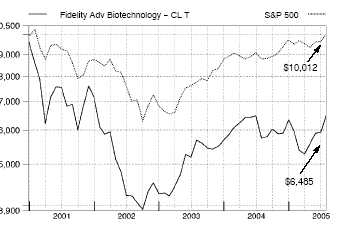
$10,000 Over Life of Fund
Let’s say hypothetically that $10,000 was invested in Fidelity® Advisor Biotechnology Fund — Class T on December 27, 2000, when the fund started, and the current 3.50% sales charge was paid. The chart shows how the value of your investment would have changed, and also shows how the S&P 500® Index performed over the same period.
Biotechnology A-4
A-4
Advisor Biotechnology Fund
|
Management’s Discussion of Fund Performance
Comments from Harlan Carere, Portfolio Manager of Fidelity® Advisor Biotechnology Fund
A late-inning rally on Wall Street helped push some key U.S. equity indexes to four-year highs by the conclusion of the 12-month period ending July 31, 2005. Spurred on by bullish economic data and strong corporate earnings, investors enjoyed a stellar month of July, capping off a turbulent 12-month period for U.S. equity markets. Stock prices bounced up and down during most of the year, moving in cadence with gyrations in the price of crude oil and investors’ gathering and ebbing concerns about inflation. The Federal Reserve Board raised short-term interest rates eight times during the period, also affecting overall market sentiment. Despite their fluctuations, the major equity indexes finished on a high note, with the Standard & Poor’s 500SM Index and the NASDAQ Composite® Index posting gains of 14.05% and 16.51%, respectively, for the period. The small-cap Russell 2000® Index rose 24.78% and the Russell Midcapr Index jumped 28.93%, while the blue-chips’ Dow Jones Industrial AverageSM advanced only 7.29% .
For the 12-month period ending July 31, 2005, the fund’s Class A, Class T, Class B and Class C shares returned 13.33%, 12.94%, 12.33% and 12.50%, respectively, trailing both the Goldman Sachs® Health Care Index, which rose 18.58%, and the S&P 500®. The fund lagged the sector index largely because of unfavorable stock selection in the biotechnology and pharmaceuticals industries, even though its positioning in those industries produced strongly positive results. The fund also fell short because — given its narrow focus on biotech and pharma — it missed the upside of other stronger-performing segments within the sector, such as managed care. Biotech pioneer Biogen Idec and Irish pharmaceuticals manufacturer Elan saw their share prices fall sharply in response to the voluntary recall of a jointly developed multiple sclerosis drug with dangerous unforeseen side effects. The stocks of certain other drug makers — among them ImClone and Cephalon — also disappointed by not living up to investors’ expectations. On the plus side, performance was helped by the fund’s large stakes in such biotech leaders as Genentech and Celgene, whose stocks did well on strong sales of their flagship cancer drugs, as well as by its holding in Invitrogen.
The views expressed in this statement reflect those of the portfolio manager only through the end of the period of the report as stated on the cover and do not necessarily represent the views of Fidelity or any other person in the Fidelity organization. Any such views are subject to change at any time based upon market or other conditions and Fidelity disclaims any responsibility to update such views. These views may not be relied on as investment advice and, because investment decisions for a Fidelity fund are based on numerous factors, may not be relied on as an indication of trading intent on behalf of any Fidelity fund.
Advisor Biotechnology Fund
Shareholder Expense Example
|
As a shareholder of the Fund, you incur two types of costs: (1) transaction costs, including sales charges (loads) on purchase payments or redemption proceeds, redemption fees, and (2) ongoing costs, including management fees, distribution and/or service (12b-1) fees and other Fund expenses. This Example is intended to help you understand your ongoing costs (in dollars) of investing in the Fund and to compare these costs with the ongoing costs of investing in other mutual funds.
The Example is based on an investment of $1,000 invested at the beginning of the period and held for the entire period (February 1, 2005 to July 31, 2005).
The first line of the table below for each class of the Fund provides information about actual account values and actual expenses. You may use the information in this line, together with the amount you invested, to estimate the expenses that you paid over the period. Simply divide your account value by $1,000.00 (for example, an $8,600 account value divided by $1,000.00 = 8.6), then multiply the result by the number in the first line for a class of the Fund under the heading entitled “Expenses Paid During Period” to estimate the expenses you paid on your account during this period.
Hypothetical Example for Comparison Purposes
|
The second line of the table below for each class of the Fund provides information about hypothetical account values and hypothetical expenses based on a Class’ actual expense ratio and an assumed rate of return of 5% per year before expenses, which is not the Class’ actual return. The hypothetical account values and expenses may not be used to estimate the actual ending account balance or expenses you paid for the period. You may use this information to compare the ongoing costs of investing in the Fund and other funds. To do so, compare this 5% hypothetical example with the 5% hypothetical examples that appear in the shareholder reports of the other funds.
Please note that the expenses shown in the table are meant to highlight your ongoing costs only and do not reflect any transaction costs. Therefore, the second line of the table is useful in comparing ongoing costs only, and will not help you determine the relative total costs of owning different funds. In addition, if these transactional costs were included, your costs would have been higher.
| | | | | | | | | Expenses Paid |
| | | Beginning | | | | Ending | | During Period* |
| | | Account Value | | | | Account Value | | February 1, 2005 |
| | | February 1, 2005 | | | | July 31, 2005 | | to July 31, 2005 |
| Class A | | | | | | | | | | |
| Actual | | $ 1,000.00 | | $ | | 1,093.20 | | $ | | 7.27 |
| HypotheticalA | | $ 1,000.00 | | $ | | 1,017.85 | | $ | | 7.00 |
| Class T | | | | | | | | | | |
| Actual | | $ 1,000.00 | | $ | | 1,092.70 | | $ | | 8.56 |
| HypotheticalA | | $ 1,000.00 | | $ | | 1,016.61 | | $ | | 8.25 |
| Class B | | | | | | | | | | |
| Actual | | $ 1,000.00 | | $ | | 1,089.70 | | $ | | 11.14 |
| HypotheticalA | | $ 1,000.00 | | $ | | 1,014.13 | | $ | | 10.74 |
| Class C | | | | | | | | | | |
| Actual | | $ 1,000.00 | | $ | | 1,091.40 | | $ | | 11.15 |
| HypotheticalA | | $ 1,000.00 | | $ | | 1,014.13 | | $ | | 10.74 |
| Institutional Class | | | | | | | | | | |
| Actual | | $ 1,000.00 | | $ | | 1,097.10 | | $ | | 5.41 |
| HypotheticalA | | $ 1,000.00 | | $ | | 1,019.64 | | $ | | 5.21 |
| |
| A 5% return per year before expenses | | | | | | | | | | |
* Expenses are equal to each Class’ annualized expense ratio (shown in the table below); multiplied by the average account value over the period, multiplied by 181/365 (to reflect the one-half year period).
| | | Annualized |
| | | Expense Ratio |
| Class A | | 1.40% |
| Class T | | 1.65% |
| Class B | | 2.15% |
| Class C | | 2.15% |
| Institutional Class | | 1.04% |
| | Advisor Biotechnology Fund
Investment Changes
|
| Top Ten Stocks as of July 31, 2005 | | |
| | | % of fund’s | | % of fund’s net assets |
| | | net assets | | 6 months ago |
| Genentech, Inc. | | 11.7 | | 9.2 |
| Celgene Corp. | | 7.1 | | 7.0 |
| Amgen, Inc. | | 6.3 | | 2.9 |
| Genzyme Corp. | | 5.0 | | 4.7 |
| Biogen Idec, Inc. | | 5.0 | | 11.0 |
| Gilead Sciences, Inc. | | 4.9 | | 4.0 |
| MedImmune, Inc. | | 4.4 | | 5.5 |
| Sepracor, Inc. | | 4.2 | | 4.8 |
| Invitrogen Corp. | | 4.0 | | 4.0 |
| Cephalon, Inc. | | 4.0 | | 5.2 |
| | | 56.6 | | |
* Includes short term investments and net other assets.
Prior period industry classifications reflect the categories in place as of the date indicated and have not been adjusted to reflect current industry classifications.
A-7 A-7 Annual Report
Advisor Biotechnology Fund
Investments July 31, 2005
Showing Percentage of Net Assets
|
| Common Stocks — 98.2% | | | | | | |
| | | Shares | | Value (Note 1) |
| |
| BIOTECHNOLOGY – 83.3% | | | | | | |
| Biotechnology – 83.3% | | | | | | |
| Abgenix, Inc. (a) | | 10,900 | | $ | | 113,033 |
| Actelion Ltd. (Reg.) (a) | | 12,478 | | | | 1,338,399 |
| Affymetrix, Inc. (a) | | 41,300 | | | | 1,928,297 |
| Alkermes, Inc. (a) | | 42,740 | | | | 662,470 |
| Alnylam Pharmaceuticals, Inc. (a) | | 300 | | | | 2,925 |
| Amgen, Inc. (a) | | 44,210 | | | | 3,525,748 |
| Amylin Pharmaceuticals, Inc. (a) | | 7,600 | | | | 141,816 |
| Biogen Idec, Inc. (a) | | 71,434 | | | | 2,806,642 |
| BioMarin Pharmaceutical, Inc. (a) | | 4,800 | | | | 40,800 |
| Celgene Corp. (a) | | 82,741 | | | | 3,959,157 |
| Cephalon, Inc. (a) | | 52,899 | | | | 2,216,468 |
| Chiron Corp. (a) | | 13,800 | | | | 499,974 |
| Curis, Inc. (a) | | 40,700 | | | | 191,494 |
| CV Therapeutics, Inc. (a) | | 500 | | | | 14,085 |
| Dendreon Corp. (a) | | 100 | | | | 588 |
| DOV Pharmaceutical, Inc. (a) | | 43,900 | | | | 928,485 |
| Dyax Corp. (a) | | 4,200 | | | | 25,662 |
| Enzon Pharmaceuticals, Inc. (a) | | 25,200 | | | | 198,576 |
| Exelixis, Inc. (a) | | 11,200 | | | | 99,232 |
| Genentech, Inc. (a) | | 73,000 | | | | 6,521,087 |
| Genta, Inc. (a) | | 13,700 | | | | 16,440 |
| Genzyme Corp. (a) | | 37,720 | | | | 2,806,745 |
| Gilead Sciences, Inc. (a) | | 60,900 | | | | 2,728,929 |
| Harvard Bioscience, Inc. (a) | | 300 | | | | 975 |
| Human Genome Sciences, Inc. (a) | | 51,900 | | | | 760,335 |
| Icagen, Inc. | | 10,700 | | | | 85,493 |
| ICOS Corp. (a) | | 23,600 | | | | 594,956 |
| Idenix Pharmaceuticals, Inc. | | 5,600 | | | | 142,576 |
| ImClone Systems, Inc. (a) | | 44,364 | | | | 1,539,431 |
| ImmunoGen, Inc. (a) | | 53,500 | | | | 374,500 |
| Immunomedics, Inc. (a) | | 8,600 | | | | 15,394 |
| Incyte Corp. (a) | | 3,100 | | | | 24,707 |
| Invitrogen Corp. (a) | | 26,250 | | | | 2,251,463 |
| Ligand Pharmaceuticals, Inc. Class B (a) . | | 1,300 | | | | 10,140 |
| Medarex, Inc. (a) | | 27,590 | | | | 269,003 |
| MedImmune, Inc. (a) | | 86,700 | | | | 2,463,147 |
| Millennium Pharmaceuticals, Inc. (a) | | 205,071 | | | | 2,118,383 |
| Myogen, Inc. (a) | | 13,500 | | | | 147,690 |
| Neurocrine Biosciences, Inc. (a) | | 19,000 | | | | 942,020 |
| NPS Pharmaceuticals, Inc. (a) | | 400 | | | | 4,348 |
| Oscient Pharmaceuticals Corp. (a) | | 2,600 | | | | 6,942 |
| OSI Pharmaceuticals, Inc. (a) | | 12,000 | | | | 495,600 |
| Pharmion Corp. (a) | | 14,304 | | | | 352,451 |
| Protein Design Labs, Inc. (a) | | 46,400 | | | | 1,057,456 |
| | | Shares | | Value (Note 1) |
| Regeneron Pharmaceuticals, Inc. (a) | | 23,622 | | $ | | 227,716 |
| Seattle Genetics, Inc. (a) | | 24,600 | | | | 148,092 |
| Serologicals Corp. (a) | | 23,900 | | | | 549,700 |
| Tanox, Inc. (a) | | 10,700 | | | | 149,693 |
| Techne Corp. (a) | | 16,010 | | | | 785,611 |
| Tercica, Inc. (a) | | 17,300 | | | | 171,097 |
| Threshold Pharmaceuticals, Inc. | | 1,408 | | | | 14,291 |
| ViaCell, Inc. | | 500 | | | | 4,270 |
| XOMA Ltd. (a) | | 49,300 | | | | 81,838 |
| | | | | | | 46,556,370 |
| |
| HEALTH CARE EQUIPMENT & SUPPLIES – 0.4% | | | | | | |
| Health Care Equipment – 0.3% | | | | | | |
| Aspect Medical Systems, Inc. (a) | | 200 | | | | 6,600 |
| Cholestech Corp. (a) | | 3,800 | | | | 42,788 |
| Cyberonics, Inc. (a) | | 500 | | | | 19,310 |
| Epix Pharmaceuticals, Inc. (a) | | 3,100 | | | | 27,373 |
| IntraLase Corp. | | 300 | | | | 6,255 |
| Syneron Medical Ltd. | | 1,000 | | | | 38,550 |
| | | | | | | 140,876 |
| Health Care Supplies – 0.1% | | | | | | |
| Gen-Probe, Inc. (a) | | 1,400 | | | | 61,726 |
| |
| TOTAL HEALTH CARE EQUIPMENT & SUPPLIES | | | | 202,602 |
| |
| HEALTH CARE PROVIDERS & SERVICES – 0.0% | | | | | | |
| Health Care Facilities – 0.0% | | | | | | |
| Corporacion Dermoestetica SA | | 2,000 | | | | 26,675 |
| PHARMACEUTICALS – 14.5% | | | | | | |
| Pharmaceuticals – 14.5% | | | | | | |
| Adams Respiratory Therapeutics, Inc. | | 100 | | | | 2,950 |
| Connetics Corp. (a) | | 200 | | | | 3,742 |
| Cypress Bioscience, Inc. (a) | | 2,600 | | | | 35,620 |
| Guilford Pharmaceuticals, Inc. (a) | | 28,300 | | | | 99,616 |
| IVAX Corp. (a) | | 4,800 | | | | 122,304 |
| Kos Pharmaceuticals, Inc. (a) | | 23,400 | | | | 1,673,100 |
| Medicines Co. (a) | | 16,300 | | | | 355,829 |
| Merck KGaA | | 10,826 | | | | 964,012 |
| MGI Pharma, Inc. (a) | | 34,900 | | | | 952,770 |
| NitroMed, Inc. (a) | | 7,500 | | | | 174,300 |
| Novartis AG sponsored ADR | | 7,400 | | | | 360,454 |
| Roche Holding AG (participation | | | | | | |
| certificate) | | 5,648 | | | | 768,000 |
| Salix Pharmaceuticals Ltd. (a) | | 8,200 | | | | 158,260 |
| Sanofi-Aventis sponsored ADR | | 100 | | | | 4,330 |
| Sepracor, Inc. (a) | | 44,896 | | | | 2,350,306 |
| SkyePharma PLC (a) | | 80,613 | | | | 84,300 |
| | | | | | | 8,109,893 |
| |
| TOTAL COMMON STOCKS | | | | | | |
| (Cost $48,439,037) | | | | 54,895,540 |
See accompanying notes which are an integral part of the financial statements.
Biotechnology A-8
| Money Market Funds — 1.6% | | | | | | |
| | | Shares | | | | Value (Note 1) |
| Fidelity Cash Central Fund, 3.31% (b) | | | | | | |
| (Cost $868,635) | | 868,635 | | | | $ 868,635 |
| TOTAL INVESTMENT PORTFOLIO - 99.8% | | | | |
| (Cost $49,307,672) | | | | | | 55,764,175 |
| |
| NET OTHER ASSETS – 0.2% | | | | | | 136,549 |
| NET ASSETS – 100% | | | | $ | | 55,900,724 |
Legend
(a) Non-income producing
(b) Affiliated fund that is available only to investment companies and other accounts managed by Fidelity Investments. The rate quoted is the annualized seven-day yield of the fund at period end. A complete listing of the fund’s holdings as of its most recent quarter end is available upon request.
Income Tax Information
At July 31, 2005, the fund had a capital loss carryforward of approximately $8,849,791 all of which will expire on July 31, 2011.
See accompanying notes which are an integral part of the financial statements.
A-9 A-9 Annual Report
Advisor Biotechnology Fund
Financial Statements
|
| Statement of Assets and Liabilities | | |
| | | | | | | July 31, 2005 |
| |
| Assets | | | | | | |
| Investment in securities, at value (cost | | | | |
| $49,307,672) — See accompany- | | | | |
| ing schedule | | | | $ | | 55,764,175 |
| Receivable for investments sold | | | | | | 292,300 |
| Receivable for fund shares sold | | | | | | 145,593 |
| Dividends receivable | | | | | | 986 |
| Interest receivable | | | | | | 1,510 |
| Prepaid expenses | | | | | | 92 |
| Receivable from investment adviser for | | | | |
| expense reductions | | | | | | 7,686 |
| Other receivables | | | | | | 7,490 |
| Total assets | | | | | | 56,219,832 |
| |
| Liabilities | | | | | | |
| Payable to custodian bank | | $ | | 42,806 | | |
| Payable for investments purchased | | | | 58,259 | | |
| Payable for fund shares redeemed | | | | 105,132 | | |
| Accrued management fee | | | | 25,694 | | |
| Transfer agent fee payable | | | | 18,336 | | |
| Distribution fees payable | | | | 31,628 | | |
| Other affiliated payables | | | | 1,851 | | |
| Other payables and accrued expenses | | 35,402 | | |
| Total liabilities | | | | | | 319,108 |
| |
| Net Assets | | | | $ | | 55,900,724 |
| Net Assets consist of: | | | | | | |
| Paid in capital | | | | $ | | 58,876,674 |
| Accumulated undistributed net realized | | | | |
| gain (loss) on investments and for- | | | | |
| eign currency transactions | | | | | | (9,432,385) |
| Net unrealized appreciation (depreci- | | | | |
| ation) on investments and assets and | | | | |
| liabilities in foreign currencies | | | | | | 6,456,435 |
| Net Assets | | | | $ | | 55,900,724 |
| Calculation of Maximum Offering Price | | | | |
| Class A: | | | | | | |
| Net Asset Value and redemption | | | | | | |
| price per share ($11,022,278 ÷ | | | | |
| 1,620,043 shares) | | | | $ | | 6.80 |
| Maximum offering price per share | | | | | | |
| (100/94.25 of $6.80) | | | | $ | | 7.21 |
| Class T: | | | | | | |
| Net Asset Value and redemption | | | | | | |
| price per share ($14,176,708 ÷ | | | | |
| 2,108,651 shares) | | | | $ | | 6.72 |
| Maximum offering price per share | | | | | | |
| (100/96.50 of $6.72) | | | | $ | | 6.96 |
| Class B: | | | | | | |
| Net Asset Value and offering price | | | | |
| per share ($16,920,801 ÷ | | | | | | |
| 2,577,536 shares)A | | | | $ | | 6.56 |
| Class C: | | | | | | |
| Net Asset Value and offering price | | | | |
| per share ($12,538,171 ÷ | | | | | | |
| 1,909,300 shares)A | | | | $ | | 6.57 |
| Institutional Class: | | | | | | |
| Net Asset Value, offering price and | | | | |
| redemption price per share | | | | | | |
| ($1,242,766 ÷ 180,455 shares) . | | $ | | 6.89 |
| Statement of Operations | | | | |
| | | | | Year ended July 31, 2005 |
| |
| Investment Income | | | | | | |
| Dividends | | | | $ | | 15,541 |
| Special Dividends | | | | | | 3,455 |
| Interest | | | | | | 11,544 |
| Security lending | | | | | | 11,707 |
| | | | | | | 42,247 |
| Less foreign taxes withheld | | | | | | (2,833) |
| Total income | | | | | | 39,414 |
| |
| Expenses | | | | | | |
| Management fee | | $ | | 300,662 | | |
| Transfer agent fees | | | | 257,402 | | |
| Distribution fees | | | | 373,191 | | |
| Accounting and security lending | | | | | | |
| fees | | | | 27,759 | | |
| Independent trustees’ compensation | | 277 | | |
| Custodian fees and expenses | | | | 8,069 | | |
| Registration fees | | | | 56,077 | | |
| Audit | | | | 44,163 | | |
| Legal | | | | 189 | | |
| Miscellaneous | | | | 804 | | |
| Total expenses before reductions | | 1,068,593 | | |
| Expense reductions | | | | (76,505) | | 992,088 |
| |
| Net investment income (loss) | | | | | | (952,674) |
| Realized and Unrealized Gain (Loss) | | | | |
| Net realized gain (loss) on: | | | | | | |
| Investment securities | | | | 3,413,981 | | |
| Foreign currency transactions | | | | 1,175 | | |
| Total net realized gain (loss) | | | | | | 3,415,156 |
| Change in net unrealized appreci- | | | | |
| ation (depreciation) on: | | | | | | |
| Investment securities | | | | 3,818,042 | | |
| Assets and liabilities in foreign | | | | | | |
| currencies | | | | (68) | | |
| Total change in net unrealized | | | | | | |
| appreciation (depreciation) | | | | | | 3,817,974 |
| Net gain (loss) | | | | | | 7,233,130 |
| Net increase (decrease) in net as- | | | | |
| sets resulting from operations | | | | $ | | 6,280,456 |
A Redemption price per share is equal to net asset value less any applicable contingent deferred sales charge.
See accompanying notes which are an integral part of the financial statements.
|
Biotechnology A-10
| Statement of Changes in Net Assets | | | | | | |
| | | Year ended | | | | Year ended |
| | | July 31, | | | | July 31, |
| | | 2005 | | | | 2004 |
| Increase (Decrease) in Net Assets | | | | | | |
| Operations | | | | | | |
| Net investment income (loss) | | $ (952,674) | | $ | | (954,269) |
| Net realized gain (loss) | | 3,415,156 | | | | 2,867,187 |
| Change in net unrealized appreciation (depreciation) | | 3,817,974 | | | | (2,278,403) |
| Net increase (decrease) in net assets resulting from operations | | 6,280,456 | | | | (365,485) |
| Share transactions -- net increase (decrease) | | (5,129,068) | | | | 10,289,718 |
| Redemption fees | | 6,345 | | | | 18,272 |
| Total increase (decrease) in net assets | | 1,157,733 | | | | 9,942,505 |
| |
| Net Assets | | | | �� | | |
| Beginning of period | | 54,742,991 | | | | 44,800,486 |
| End of period | | $ 55,900,724 | | $ | | 54,742,991 |
| Financial Highlights — Class A | | | | | | | | | | |
| Years ended July 31, | | 2005 | | 2004 | | 2003 | | 2002 | | 2001G |
| Selected Per-Share Data | | | | | | | | | | |
| Net asset value, beginning of period | | $ 6.00 | | $ 5.94 | | $ 4.39 | | $ 7.09 | | $ 10.00 |
| Income from Investment Operations | | | | | | | | | | |
| Net investment income (loss)E | | (.08)F | | (.09) | | (.05) | | (.07) | | (.04) |
| Net realized and unrealized gain (loss) | | 88 | | .15 | | 1.60 | | (2.64) | | (2.88) |
| Total from investment operations | | 80 | | .06 | | 1.55 | | (2.71) | | (2.92) |
| Redemption fees added to paid in capitalE | | —I | | —I | | —I | | .01 | | .01 |
| Net asset value, end of period | | $ 6.80 | | $ 6.00 | | $ 5.94 | | $ 4.39 | | $ 7.09 |
| Total ReturnB, C, D | | 13.33% | | 1.01% | | 35.31% | | (38.08)% | | (29.10)% |
| Ratios to Average Net AssetsH | | | | | | | | | | |
| Expenses before expense reductions | | 1.56% | | 1.68% | | 2.04% | | 1.99% | | 3.07%A |
| Expenses net of voluntary waivers, if any | | 1.45% | | 1.50% | | 1.50% | | 1.50% | | 1.50%A |
| Expenses net of all reductions | | 1.43% | | 1.48% | | 1.47% | | 1.46% | | 1.49%A |
| Net investment income (loss) | | (1.36)%F | | (1.38)% | | (1.11)% | | (1.19)% | | (.94)%A |
| Supplemental Data | | | | | | | | | | |
| Net assets, end of period (000 omitted) | | $ 11,022 | | $ 10,197 | | $ 7,718 | | $ 4,657 | | $ 4,232 |
| Portfolio turnover rate | | 30% | | 50% | | 71% | | 113% | | 64%A |
| | A Annualized
B Total returns for periods of less than one year are not annualized.
C Total returns would have been lower had certain expenses not been reduced during the periods shown.
D Total returns do not include the effect of the sales charges.
E Calculated based on average shares outstanding during the period.
F Investment income per share reflects a special dividend which amounted to $.0004 per share. Excluding the special dividend, the ratio of net investment income to average net assets would have been (1.37)% .
G For the period December 27, 2000 (commencement of operations) to July 31, 2001.
H Expense ratios reflect operating expenses of the class. Expenses before reductions do not reflect amounts reimbursed by the investment adviser or reductions from brokerage service arrangements or other expense offset arrangements and do not
represent the amount paid by the class during periods when reimbursements or reductions occur. Expense ratios before reductions for start up periods may not be representative of longer term operating periods. Expenses net of any voluntary
waivers reflect expenses after reimbursement by the investment adviser but prior to reductions from brokerage service arrangements or other expense offset arrangements. Expenses net of all reductions represent the net expenses paid by the class.
I Amount represents less than $.01 per share.
|
See accompanying notes which are an integral part of the financial statements.
A-11 Annual Report
| Financial Highlights — Class T | | | | | | | | | | |
| Years ended July 31, | | 2005 | | 2004 | | 2003 | | 2002 | | 2001G |
| Selected Per-Share Data | | | | | | | | | | |
| Net asset value, beginning of period | | $ 5.95 | | $ 5.90 | | $ 4.37 | | $ 7.07 | | $ 10.00 |
| Income from Investment Operations | | | | | | | | | | |
| Net investment income (loss)E | | (.10)F | | (.10) | | (.06) | | (.09) | | (.05) |
| Net realized and unrealized gain (loss) | | 87 | | .15 | | 1.59 | | (2.62) | | (2.89) |
| Total from investment operations | | 77 | | .05 | | 1.53 | | (2.71) | | (2.94) |
| Redemption fees added to paid in capitalE | | —I | | —I | | —I | | .01 | | .01 |
| Net asset value, end of period | | $ 6.72 | | $ 5.95 | | $ 5.90 | | $ 4.37 | | $ 7.07 |
| Total ReturnB, C, D | | 12.94% | | .85% | | 35.01% | | (38.19)% | | (29.30)% |
| Ratios to Average Net AssetsH | | | | | | | | | | |
| Expenses before expense reductions | | 1.93% | | 2.10% | | 2.39% | | 2.27% | | 3.29%A |
| Expenses net of voluntary waivers, if any | | 1.70% | | 1.75% | | 1.75% | | 1.75% | | 1.75%A |
| Expenses net of all reductions | | 1.68% | | 1.73% | | 1.72% | | 1.72% | | 1.74%A |
| Net investment income (loss) | | (1.61)%F | | (1.63)% | | (1.36)% | | (1.45)% | | (1.19)%A |
| Supplemental Data | | | | | | | | | | |
| Net assets, end of period (000 omitted) | | $ 14,177 | | $ 13,367 | | $ 10,281 | | $ 6,861 | | $ 7,721 |
| Portfolio turnover rate | | 30% | | 50% | | 71% | | 113% | | 64%A |
| | | | | | | | | | |
A Annualized
B Total returns for periods of less than one year are not annualized.
C Total returns would have been lower had certain expenses not been reduced during the periods shown.
D Total returns do not include the effect of the sales charges.
E Calculated based on average shares outstanding during the period.
F Investment income per share reflects a special dividend which amounted to $.0004 per share. Excluding the special dividend, the ratio of net investment income to average net assets would have been (1.61)% .
G For the period December 27, 2000 (commencement of operations) to July 31, 2001.
H Expense ratios reflect operating expenses of the class. Expenses before reductions do not reflect amounts reimbursed by the investment adviser or reductions from brokerage service arrangements or other expense offset arrangements and do not
represent the amount paid by the class during periods when reimbursements or reductions occur. Expense ratios before reductions for start up periods may not be representative of longer term operating periods. Expenses net of any voluntary
waivers reflect expenses after reimbursement by the investment adviser but prior to reductions from brokerage service arrangements or other expense offset arrangements. Expenses net of all reductions represent the net expenses paid by the class.
I Amount represents less than $.01 per share.
|
| Financial Highlights — Class B | | | | | | | | | | |
| Years ended July 31, | | 2005 | | 2004 | | 2003 | | 2002 | | 2001G |
| Selected Per-Share Data | | | | | | | | | | |
| Net asset value, beginning of period | | $ 5.84 | | $ 5.82 | | $ 4.33 | | $ 7.05 | | $ 10.00 |
| Income from Investment Operations | | | | | | | | | | |
| Net investment income (loss)E | | (.13)F | | (.13) | | (.09) | | (.12) | | (.07) |
| Net realized and unrealized gain (loss) | | 85 | | .15 | | 1.58 | | (2.61) | | (2.89) |
| Total from investment operations | | 72 | | .02 | | 1.49 | | (2.73) | | (2.96) |
| Redemption fees added to paid in capitalE | | —I | | —I | | —I | | .01 | | .01 |
| Net asset value, end of period | | $ 6.56 | | $ 5.84 | | $ 5.82 | | $ 4.33 | | $ 7.05 |
| Total ReturnB, C, D | | 12.33% | | .34% | | 34.41% | | (38.58)% | | (29.50)% |
| Ratios to Average Net AssetsH | | | | | | | | | | |
| Expenses before expense reductions | | 2.33% | | 2.46% | | 2.78% | | 2.74% | | 3.83%A |
| Expenses net of voluntary waivers, if any | | 2.19% | | 2.25% | | 2.25% | | 2.25% | | 2.25%A |
| Expenses net of all reductions | | 2.18% | | 2.22% | | 2.22% | | 2.22% | | 2.24%A |
| Net investment income (loss) | | (2.11)%F | | (2.12)% | | (1.86)% | | (1.95)% | | (1.69)%A |
| Supplemental Data | | | | | | | | | | |
| Net assets, end of period (000 omitted) | | $ 16,921 | | $ 16,819 | | $ 15,154 | | $ 10,218 | | $ 8,875 |
| Portfolio turnover rate | | 30% | | 50% | | 71% | | 113% | | 64%A |
| A | | | | | | | | | | |
| | Annualized
B Total returns for periods of less than one year are not annualized.
C Total returns would have been lower had certain expenses not been reduced during the periods shown.
D Total returns do not include the effect of the contingent deferred sales charge.
E Calculated based on average shares outstanding during the period.
F Investment income per share reflects a special dividend which amounted to $.0004 per share. Excluding the special dividend, the ratio of net investment income to average net assets would have been (2.11)% .
G For the period December 27, 2000 (commencement of operations) to July 31, 2001.
H Expense ratios reflect operating expenses of the class. Expenses before reductions do not reflect amounts reimbursed by the investment adviser or reductions from brokerage service arrangements or other expense offset arrangements and do not
represent the amount paid by the class during periods when reimbursements or reductions occur. Expense ratios before reductions for start up periods may not be representative of longer term operating periods. Expenses net of any voluntary
waivers reflect expenses after reimbursement by the investment adviser but prior to reductions from brokerage service arrangements or other expense offset arrangements. Expenses net of all reductions represent the net expenses paid by the class.
I Amount represents less than $.01 per share.
|
See accompanying notes which are an integral part of the financial statements.
Biotechnology A-12
| Financial Highlights — Class C | | | | | | | | | | |
| Years ended July 31, | | 2005 | | 2004 | | 2003 | | 2002 | | 2001G |
| Selected Per-Share Data | | | | | | | | | | |
| Net asset value, beginning of period | | $ 5.84 | | $ 5.82 | | $ 4.33 | | $ 7.05 | | $ 10.00 |
| Income from Investment Operations | | | | | | | | | | |
| Net investment income (loss)E | | (.13)F | | (.13) | | (.09) | | (.12) | | (.07) |
| Net realized and unrealized gain (loss) | | 86 | | .15 | | 1.58 | | (2.61) | | (2.89) |
| Total from investment operations | | 73 | | .02 | | 1.49 | | (2.73) | | (2.96) |
| Redemption fees added to paid in capitalE | | —I | | —I | | —I | | .01 | | .01 |
| Net asset value, end of period | | $ 6.57 | | $ 5.84 | | $ 5.82 | | $ 4.33 | | $ 7.05 |
| Total ReturnB, C, D | | 12.50% | | .34% | | 34.41% | | (38.58)% | | (29.50)% |
| Ratios to Average Net AssetsH | | | | | | | | | | |
| Expenses before expense reductions | | 2.24% | | 2.31% | | 2.58% | | 2.57% | | 3.73%A |
| Expenses net of voluntary waivers, if any | | 2.19% | | 2.25% | | 2.25% | | 2.25% | | 2.25%A |
| Expenses net of all reductions | | 2.18% | | 2.23% | | 2.22% | | 2.22% | | 2.24%A |
| Net investment income (loss) | | (2.11)%F | | (2.13)% | | (1.86)% | | (1.95)% | | (1.69)%A |
| Supplemental Data | | | | | | | | | | |
| Net assets, end of period (000 omitted) | | $ 12,538 | | $ 13,215 | | $ 10,493 | | $ 8,204 | | $ 6,321 |
| Portfolio turnover rate | | 30% | | 50% | | 71% | | 113% | | 64%A |
A Annualized
B Total returns for periods of less than one year are not annualized.
C Total returns would have been lower had certain expenses not been reduced during the periods shown.
D Total returns do not include the effect of the contingent deferred sales charge.
E Calculated based on average shares outstanding during the period.
F Investment income per share reflects a special dividend which amounted to $.0004 per share. Excluding the special dividend, the ratio of net investment income to average net assets would have been (2.11)% .
G For the period December 27, 2000 (commencement of operations) to July 31, 2001.
H Expense ratios reflect operating expenses of the class. Expenses before reductions do not reflect amounts reimbursed by the investment adviser or reductions from brokerage service arrangements or other expense offset arrangements and do not
represent the amount paid by the class during periods when reimbursements or reductions occur. Expense ratios before reductions for start up periods may not be representative of longer term operating periods. Expenses net of any voluntary
waivers reflect expenses after reimbursement by the investment adviser but prior to reductions from brokerage service arrangements or other expense offset arrangements. Expenses net of all reductions represent the net expenses paid by the class.
I Amount represents less than $.01 per share.
|
| Financial Highlights — Institutional Class | | | | | | | | | | |
| Years ended July 31, | | 2005 | | 2004 | | 2003 | | 2002 | | 2001F |
| Selected Per-Share Data | | | | | | | | | | |
| Net asset value, beginning of period | | $ 6.06 | | $ 5.97 | | $ 4.40 | | $ 7.09 | | $ 10.00 |
| Income from Investment Operations | | | | | | | | | | |
| Net investment income (loss)D | | (.06)E | | (.06) | | (.04) | | (.06) | | (.03) |
| Net realized and unrealized gain (loss) | | 89 | | .15 | | 1.61 | | (2.64) | | (2.89) |
| Total from investment operations | | 83 | | .09 | | 1.57 | | (2.70) | | (2.92) |
| Redemption fees added to paid in capitalD | | —H | | —H | | —H | | .01 | | .01 |
| Net asset value, end of period | | $ 6.89 | | $ 6.06 | | $ 5.97 | | $ 4.40 | | $ 7.09 |
| Total ReturnB, C | | 13.70% | | 1.51% | | 35.68% | | (37.94)% | | (29.10)% |
| Ratios to Average Net AssetsG | | | | | | | | | | |
| Expenses before expense reductions | | 1.10% | | 1.16% | | 1.37% | | 1.41% | | 2.58%A |
| Expenses net of voluntary waivers, if any | | 1.10% | | 1.16% | | 1.25% | | 1.25% | | 1.25%A |
| Expenses net of all reductions | | 1.09% | | 1.14% | | 1.22% | | 1.22% | | 1.24%A |
| Net investment income (loss) | | (1.02)%E | | (1.04)% | | (.86)% | | (.94)% | | (.69)%A |
| Supplemental Data | | | | | | | | | | |
| Net assets, end of period (000 omitted) | | $ 1,243 | | $ 1,146 | | $ 1,153 | | $ 857 | | $ 911 |
| Portfolio turnover rate | | 30% | | 50% | | 71% | | 113% | | 64%A |
A Annualized
B Total returns for periods of less than one year are not annualized.
C Total returns would have been lower had certain expenses not been reduced during the periods shown.
D Calculated based on average shares outstanding during the period.
E Investment income per share reflects a special dividend which amounted to $.0004 per share. Excluding the special dividend, the ratio of net investment income to average net assets would have been (1.02)% .
F For the period December 27, 2000 (commencement of operations) to July 31, 2001.
G Expense ratios reflect operating expenses of the class. Expenses before reductions do not reflect amounts reimbursed by the investment adviser or reductions from brokerage service arrangements or other expense offset arrangements and do not
represent the amount paid by the class during periods when reimbursements or reductions occur. Expense ratios before reductions for start up periods may not be representative of longer term operating periods. Expenses net of any voluntary
waivers reflect expenses after reimbursement by the investment adviser but prior to reductions from brokerage service arrangements or other expense offset arrangements. Expenses net of all reductions represent the net expenses paid by the class.
H Amount represents less than $.01 per share.
|
See accompanying notes which are an integral part of the financial statements.
A-13 Annual Report
Notes to Financial Statements
For the period ended July 31, 2005
|
1. Significant Accounting Policies.
|
Fidelity Advisor Biotechnology Fund (the fund) is a non-diversified fund of Fidelity Advisor Series VII (the trust) and is authorized to issue an unlimited number of shares. The trust is registered under the Investment Company Act of 1940, as amended (the 1940 Act), as an open-end management investment company organized as a Massachusetts business trust.
The fund offers Class A, Class T, Class B, Class C and Institutional Class shares, each of which has equal rights as to assets and voting privileges. Each class has exclusive voting rights with respect to matters that affect that class. Class B shares will automatically convert to Class A shares after a holding period of seven years from the initial date of purchase. Investment income, realized and unrealized capital gains and losses, the common expenses of the fund, and certain fund-level expense reductions, if any, are allocated on a pro rata basis to each class based on the relative net assets of each class to the total net assets of the fund. Each class differs with respect to transfer agent and distribution and service plan fees incurred. Certain expense reductions also differ by class.
The financial statements have been prepared in conformity with accounting principles generally accepted in the United States of America, which require management to make certain estimates and assumptions at the date of the financial statements. The following summarizes the significant accounting policies of the fund:
Security Valuation. Net asset value per share (NAV calculation) is calculated as of the close of business of the New York Stock Exchange, normally 4:00 p.m. Eastern time. Equity securities, including restricted securities, for which market quotations are available are valued at the last sale price or official closing price (closing bid price or last evaluated quote if no sale has occurred) on the primary market or exchange on which they trade. If prices are not readily available or do not accurately reflect fair value for a security, or if a security’s value has been materially affected by events occurring after the close of the exchange or market on which the security is principally traded, that security may be valued by another method that the Board of Trustees believes accurately reflects fair value. A security’s valuation may differ depending on the method used for determining value. Price movements in futures contracts and ADRs, market and trading trends, the bid/ask quotes of brokers and off-exchange institutional trading may be reviewed in the course of making a good faith determination of a security’s fair value. Short-term securities with remaining maturities of sixty days or less for which quotations are not readily available are valued on the basis of amortized cost. Investments in open-end investment companies are valued at their net asset value each business day.
Foreign Currency. The fund uses foreign currency contracts to facilitate transactions in foreign-denominated securities. Losses from these transactions may arise from changes in the value of the foreign currency or if the counterparties do not perform under the contracts’ terms.
Foreign-denominated assets, including investment securities, and liabilities are translated into U.S. dollars at the exchange rate at period end. Purchases and sales of investment securities, income and dividends received and expenses denominated in foreign currencies are translated into U.S. dollars at the exchange rate in effect on the transaction date.
The effects of exchange rate fluctuations on investments are included with the net realized and unrealized gain (loss) on investment securities. Other foreign currency transactions resulting in realized and unrealized gain (loss) are disclosed separately.
Investment Transactions and Income. Security transactions are accounted for as of trade date. Gains and losses on securities sold are determined on the basis of identified cost. Dividend income is recorded on the ex-dividend date, except for certain dividends from foreign securities where the ex-dividend date may have passed, which are recorded as soon as the fund is informed of the ex-dividend date. Non-cash dividends included in dividend income, if any, are recorded at the fair market value of the securities received. Large, non-recurring dividends recognized by the fund are presented separately on the Statement of Operations as “Special Dividends” and the impact of these dividends is presented in the Financial Highlights. Interest income is accrued as earned. Interest income includes coupon interest and amortization of premium and accretion of discount on debt securities. Investment income is recorded net of foreign taxes withheld where recovery of such taxes is uncertain.
Expenses. Most expenses of the trust can be directly attributed to a fund. Expenses which cannot be directly attributed are apportioned among each fund in the trust.
Income Tax Information and Distributions to Shareholders. Each year, the fund intends to qualify as a regulated investment company by distributing all of its taxable income and realized gains under Subchapter M of the Internal Revenue Code. As a result, no provision for income taxes is required in the accompanying financial statements. Foreign taxes are provided for based on the fund’s understanding of the tax rules and rates that exist in the foreign markets in which it invests.
Distributions are recorded on the ex-dividend date. Income dividends and capital gain distributions are declared separately for each class. Income and capital gain distributions are determined in accordance with income tax regulations, which may differ from generally accepted accounting principles. Capital accounts within the financial statements are adjusted for permanent book-tax differences. These adjustments have no impact on net assets or the results of operations. Temporary book-tax differences will reverse in a subsequent period.
| | 1. Significant Accounting Policies - continued
Income Tax Information and Distributions to Shareholders - continued
Book-tax differences are primarily due to foreign currency transactions, capital loss carryforwards and losses deferred due to wash sales.
The tax-basis components of distributable earnings and the federal tax cost as of period end were as follows:
|
| Unrealized appreciation | | $ 13,476,712 |
| Unrealized depreciation | | (7,602,876) |
| Net unrealized appreciation (depreciation) | | 5,873,836 |
| Capital loss carryforward | | (8,849,791) |
| |
| Cost for federal income tax purposes | | $ 49,890,339 |
| | Short-Term Trading (Redemption) Fees. Shares held in the fund less than 60 days are subject to a redemption fee equal to 1.00% of the proceeds of
the redeemed shares. All redemption fees, including any estimated redemption fees paid by Fidelity Management & Research Company (FMR), are
retained by the fund and accounted for as an addition to paid in capital.
2. Operating Policies.
Repurchase Agreements. FMR has received an Exemptive Order from the Securities and Exchange Commission (the SEC) which permits the fund
and other affiliated entities of FMR to transfer uninvested cash balances into joint trading accounts which are then invested in repurchase agreements.
The fund may also invest directly with institutions in repurchase agreements. Repurchase agreements are collateralized by government or non-
government securities. Collateral is held in segregated accounts with custodian banks and may be obtained in the event of a default of the counterparty.
The fund monitors, on a daily basis, the value of the collateral to ensure it is at least equal to the principal amount of the repurchase agreement (in-
cluding accrued interest). In the event of a default by the counterparty, realization of the collateral proceeds could be delayed, during which time the
value of the collateral may decline.
3. Purchases and Sales of Investments.
Purchases and sales of securities, other than short-term securities and U.S. government securities, aggregated $15,702,703 and $20,996,789,
respectively.
4. Fees and Other Transactions with Affiliates.
Management Fee. FMR and its affiliates provide the fund with investment management related services for which the fund pays a monthly manage-
ment fee. The management fee is the sum of an individual fund fee rate that is based on an annual rate of .30% of the fund’s average net assets and a
group fee rate that averaged .27% during the period. The group fee rate is based upon the average net assets of all the mutual funds advised by FMR.
The group fee rate decreases as assets under management increase and increases as assets under management decrease. For the period, the total
annual management fee rate was .57% of the fund’s average net assets.
Distribution and Service Plan. In accordance with Rule 12b-1 of the 1940 Act, the fund has adopted separate Distribution and Service Plans for each
class of shares. Certain classes pay Fidelity Distributors Corporation (FDC), an affiliate of FMR, separate Distribution and Service Fees, each of which
is based on an annual percentage of each class’ average net assets. In addition, FDC may pay financial intermediaries for selling shares of the fund and
providing shareholder support services. For the period, the Distribution and Service Fee rates and the total amounts paid to and retained by FDC were
as follows:
|
| | | Distribution | | Service | | | | Paid to | | | | Retained |
| | | Fee | | Fee | | | | FDC | | | | by FDC |
| Class A | | 0% | | .25% | | $ | | 25,177 | | $ | | 33 |
| Class T | | 25% | | .25% | | | | 65,020 | | | | 62 |
| Class B | | 75% | | .25% | | | | 159,674 | | | | 119,826 |
| Class C | | 75% | | .25% | | | | 123,320 | | | | 23,648 |
| |
| | | | | | | $ | | 373,191 | | $ | | 143,569 |
Sales Load. FDC receives a front-end sales charge of up to 5.75% for selling Class A shares, and 3.50% for selling Class T shares, some of which is paid to financial intermediaries for selling shares of the fund. FDC receives the proceeds of contingent deferred sales charges levied on Class A, Class T, Class B, and Class C redemptions. These charges depend on the holding period. The deferred sales charges range from 5% to 1% for Class B, 1% for Class C, and .25% for certain purchases of Class A and Class T shares.
A-15 Annual Report
Notes to Financial Statements - continued
4. Fees and Other Transactions with Affiliates - continued
Sales Load - continued
|
| For the period, sales charge amounts retained by FDC were as follows: | | | | |
| | | | | Retained |
| | | | | by FDC |
| Class A | | $ | | 12,047 |
| Class T | | | | 10,155 |
| Class B* | | | | 61,464 |
| Class C* | | | | 3,776 |
| | | $ | | 87,442 |
* When Class B and Class C shares are initially sold, FDC pays commissions from its own resources to financial intermediaries through which the sales are made.
Transfer Agent Fees. Fidelity Investments Institutional Operations Company, Inc. (FIIOC), an affiliate of FMR, is the transfer, dividend disbursing and shareholder servicing agent for each class of the fund. FIIOC receives account fees and asset-based fees that vary according to the account size and type of account of the shareholders of the respective classes of the fund. FIIOC pays for typesetting, printing and mailing of shareholder reports, except proxy statements. For the period the total transfer agent fees paid by each class to FIIOC, were as follows:
| | | | | | | % of |
| | | | | | | Average |
| | | | | Amount | | Net Assets |
| Class A | | $ | | 47,844 | | .48 |
| Class T | | | | 77,635 | | .60 |
| Class B | | | | 79,137 | | .50 |
| Class C | | | | 49,905 | | .40 |
| Institutional Class | | | | 2,881 | | .27 |
| |
| | | $ | | 257,402 | | |
Accounting and Security Lending Fees. Fidelity Service Company, Inc. (FSC), an affiliate of FMR, maintains the fund’s accounting records. The
accounting fee is based on the level of average net assets for the month. Under a separate contract, FSC administers the security lending program. The
security lending fee is based on the number and duration of lending transactions.
Central Funds. The fund may invest in affiliated Central Funds managed by Fidelity Investments Money Management, Inc. (FIMM), an affiliate of
FMR. The Central Funds are open-end investment companies available only to investment companies and other accounts managed by FMR and its
affiliates. The Money Market Central Funds seek preservation of capital and current income. The Central Funds do not pay a management fee. Income
distributions earned by the fund are recorded as income in the accompanying financial statements and totaled $40,321 for the period.
Brokerage Commissions. The fund placed a portion of its portfolio transactions with brokerage firms which are affiliates of the investment adviser.
The commissions paid to these affiliated firms were $2,231 for the period.
5. Committed Line of Credit.
The fund participates with other funds managed by FMR in a $4.2 billion credit facility (the “line of credit”) to be utilized for temporary or emergency
purposes to fund shareholder redemptions or for other short-term liquidity purposes. The fund has agreed to pay commitment fees on its pro rata
portion of the line of credit. During the period, there were no borrowings on this line of credit.
6. Security Lending.
The fund lends portfolio securities from time to time in order to earn additional income. The fund receives collateral (in the form of U.S. Treasury
obligations, letters of credit and/or cash) against the loaned securities and maintains collateral in an amount not less than 100% of the market value of
the loaned securities during the period of the loan. The market value of the loaned securities is determined at the close of business of the fund and any
additional required collateral is delivered to the fund on the next business day. If the borrower defaults on its obligation to return the securities loaned
because of insolvency or other reasons, a fund could experience delays and costs in recovering the securities loaned or in gaining access to the
collateral. Cash collateral is invested in the Fidelity Securities Lending Cash Central Fund. At period end there were no security loans outstanding.
|
Biotechnology A-16
FMR voluntarily agreed to reimburse each class to the extent annual operating expenses exceeded certain levels of average net assets as noted in the table below. Some expenses, for example interest expense, are excluded from this reimbursement.
| The following classes were in reimbursement during the period: | | | | | | | | |
| | | Expense | | Reimbursement |
| | | Limitations | | from adviser |
| Class A | | 1.50% | | -- 1.40%* | | $ | | 11,540 |
| Class T | | 1.75% | | -- 1.65%* | | | | 30,869 |
| Class B | | 2.25% | | -- 2.15%* | | | | 22,104 |
| Class C | | 2.25% | | -- 2.15%* | | | | 5,763 |
| |
| | | | | | | $ | | 70,276 |
| |
| * Expense limitation in effect at period end. | | | | | | | | |
Many of the brokers with whom FMR places trades on behalf of the fund provided services to the fund in addition to trade execution. These services included payments of certain expenses on behalf of the fund totaling $6,229 for the period.
The fund’s organizational documents provide former and current trustees and officers with a limited indemnification against liabilities arising in connection with the performance of their duties to the fund. In the normal course of business, the fund may also enter into contracts that provide general indemnifications. The fund’s maximum exposure under these arrangements is unknown as this would be dependent on future claims that may be made against the fund. The risk of material loss from such claims is considered remote.
| 9. Share Transactions. | | | | | | | | | | | | |
| |
| Transactions for each class of shares were as follows: | | | | | | | | | | | | |
| | | | | Shares | | | | | | Dollars | | |
| Years ended July 31, | | 2005 | | | | 2004 | | 2005 | | | | 2004 |
| Class A | | | | | | | | | | | | |
| Shares sold | | 550,671 | | | | 878,734 | | $ 3,418,022 | | $ | | 5,475,076 |
| Shares redeemed | | (629,006) | | | | (480,064) | | (3,853,963) | | | | (2,905,863) |
| Net increase (decrease) | | (78,335) | | | | 398,670 | | $ (435,941) | | $ | | 2,569,213 |
| Class T | | | | | | | | | | | | |
| Shares sold | | 621,575 | | | | 1,105,179 | | $ 3,773,646 | | $ | | 6,864,105 |
| Shares redeemed | | (760,267) | | | | (601,131) | | (4,599,360) | | | | (3,678,218) |
| Net increase (decrease) | | (138,692) | | | | 504,048 | | $ (825,714) | | $ | | 3,185,887 |
| Class B | | | | | | | | | | | | |
| Shares sold | | 527,483 | | | | 951,709 | | $ 3,194,512 | | $ | | 5,766,243 |
| Shares redeemed | | (831,184) | | | | (675,608) | | (4,925,475) | | | | (4,063,659) |
| Net increase (decrease) | | (303,701) | | | | 276,101 | | $ (1,730,963) | | $ | | 1,702,584 |
| Class C | | | | | | | | | | | | |
| Shares sold | | 395,212 | | | | 962,707 | | $ 2,374,238 | | $ | | 5,865,287 |
| Shares redeemed | | (749,216) | | | | (502,895) | | (4,454,466) | | | | (3,048,910) |
| Net increase (decrease) | | (354,004) | | | | 459,812 | | $ (2,080,228) | | $ | | 2,816,377 |
| Institutional Class | | | | | | | | | | | | |
| Shares sold | | 56,540 | | | | 64,860 | | $ 351,953 | | $ | | 427,262 |
| Shares redeemed | | (65,245) | | | | (68,780) | | (408,175) | | | | (411,605) |
| Net increase (decrease) | | (8,705) | | | | (3,920) | | $ (56,222) | | $ | | 15,657 |
Advisor Consumer Industries Fund — Class A, T, B, and C
Performance
Average annual total return reflects the change in the value of an investment, assuming reinvestment of the class’ dividend income and capital gains (the profits earned upon the sale of securities that have grown in value) and assuming a constant rate of performance each year. The $10,000 table and the fund’s returns do not reflect the deduction of taxes that a shareholder would pay on fund distributions or the redemption of fund shares. During periods of reimbursement by Fidelity, a fund’s total return will be greater than it would be had the reimbursement not occurred. How a fund did yesterday is no guarantee of how it will do tomorrow. Returns may reflect the conversion of Class B shares to Class A shares after a maximum of seven years.
| Average Annual Total Returns | | | | |
| Periods ended July 31, 2005 | | Past 1 | | Past 5 | | Life of |
| | | year | | years | | fundA |
| Class A (incl. 5.75% sales charge) | | 12.01% | | 2.06% | | 8.55% |
| Class T (incl. 3.50% sales charge) | | 14.37% | | 2.30% | | 8.54% |
| Class B (incl. contingent deferred | | | | | | |
| sales charge)B | | 12.97% | | 2.16% | | 8.58% |
| Class C (incl. contingent deferred | | | | | | |
| sales charge)C | | 16.94% | | 2.52% | | 8.47% |
A From September 3, 1996.
B Class B shares bear a 1.00% 12b-1 fee. The initial offering of Class B shares took place
on March 3, 1997. Returns prior to March 3, 1997 are those of Class T and reflect a 0.50%
12b-1 fee. Had Class B shares’ 12b-1 fee been reflected, returns prior to March 3, 1997
would have been lower. Class B shares’ contingent deferred sales charges included in the
past one year, five year, and life of fund total return figures are 5%, 2% and 0%,
respectively.
C Class C shares bear a 1.00% 12b-1 fee. The initial offering of Class C shares took place
on November 3, 1997. Returns between March 3, 1997 and November 3, 1997 are those of
Class B shares and reflect Class B shares’ 1.00% 12b-1 fee. Returns prior to March 3, 1997
are those of Class T and reflect a 0.50% 12b-1 fee. Had Class C shares’ 12b-1 fee been
reflected, returns prior to March 3, 1997 would have been lower. Class C shares’ contin-
gent deferred sales charges included in the past one year, five year, and life of fund total
return figures are 1%, 0% and 0%, respectively.
|
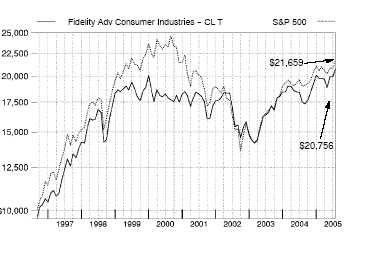
$10,000 Over Life of Fund
Let’s say hypothetically that $10,000 was invested in Fidelity Advisor Consumer Industries Fund — Class T on September 3, 1996, when the fund started, and the current 3.50% sales charge was paid. The chart shows how the value of your investment would have changed, and also shows how the S&P 500 Index performed over the same period.
Advisor Consumer Industries Fund — Class A, T, B, and C
Management’s Discussion of Fund Performance
Comments from John Roth, Portfolio Manager of Fidelity® Advisor Consumer Industries Fund
A late-inning rally on Wall Street helped push some key U.S. equity indexes to four-year highs by the conclusion of the 12-month period ending July 31, 2005. Spurred on by bullish economic data and strong corporate earnings, investors enjoyed a stellar month of July, capping off a turbulent 12-month period for U.S. equity markets. Stock prices bounced up and down during most of the year, moving in cadence with gyrations in the price of crude oil and investors’ gathering and ebbing concerns about inflation. The Federal Reserve Board raised short-term interest rates eight times during the period, also affecting overall market sentiment. Despite their fluctuations, the major equity indexes finished on a high note, with the Standard & Poor’s 500SM Index and the NASDAQ Composite® Index posting gains of 14.05% and 16.51%, respectively, for the period. The small-cap Russell 2000® Index rose 24.78% and the Russell Midcap® Index jumped 28.93%, while the blue-chips’ Dow Jones Industrial AverageSM advanced only 7.29% .
For the 12-month period ending July 31, 2005, the fund’s Class A, Class T, Class B and Class C shares returned 18.85%, 18.52%, 17.97% and 17.94%, respectively, solidly outperforming the Goldman Sachs® Consumer Industries Index, which rose 14.96%, and the S&P 500® index. During the period, advertisers continued to shift spending out of traditional media such as radio, television and print, and into Internet media such as search engines and portals. The fund benefited from that trend, relative to the sector index, by overweighting Internet firms such as Google and underweighting more-traditional media stocks such as Time Warner, which was sold out of the portfolio. In the retail area, performance was helped by an emphasis on smaller specialty apparel retailers that I believed offered superior growth potential — such as American Eagle Outfitters — and an underweighting in mega-retailers, particularly Wal-Mart. I avoided tobacco and food conglomerate Altria, a large component of the Goldman Sachs index, because of the firm’s tobacco-related legal problems. That decision hurt relative results during the period, as investors assumed the litigation would be resolved favorably and the stock climbed sharply. The fund’s positions in Krispy Kreme Doughnuts, which I sold, and in Avon Products hurt relative performance as well.
The views expressed in this statement reflect those of the portfolio manager only through the end of the period of the report as stated on the cover and do not necessarily represent the views of Fidelity or any other person in the Fidelity organization. Any such views are subject to change at any time based upon market or other conditions and Fidelity disclaims any responsibility to update such views. These views may not be relied on as investment advice and, because investment decisions for a Fidelity fund are based on numerous factors, may not be relied on as an indication of trading intent on behalf of any Fidelity fund.
Advisor Consumer Industries Fund
Shareholder Expense Example
|
As a shareholder of the Fund, you incur two types of costs: (1) transaction costs, including sales charges (loads) on purchase payments or redemption proceeds, redemption fees, and (2) ongoing costs, including management fees, distribution and/or service (12b-1) fees and other Fund expenses. This Example is intended to help you understand your ongoing costs (in dollars) of investing in the Fund and to compare these costs with the ongoing costs of investing in other mutual funds.
The Example is based on an investment of $1,000 invested at the beginning of the period and held for the entire period (February 1, 2005 to July 31, 2005).
The first line of the table below for each class of the Fund provides information about actual account values and actual expenses. You may use the information in this line, together with the amount you invested, to estimate the expenses that you paid over the period. Simply divide your account value by $1,000.00 (for example, an $8,600 account value divided by $1,000.00 = 8.6), then multiply the result by the number in the first line for a class of the Fund under the heading entitled “Expenses Paid During Period” to estimate the expenses you paid on your account during this period.
Hypothetical Example for Comparison Purposes
|
The second line of the table below for each class of the Fund provides information about hypothetical account values and hypothetical expenses based on a Class’ actual expense ratio and an assumed rate of return of 5% per year before expenses, which is not the Class’ actual return. The hypothetical account values and expenses may not be used to estimate the actual ending account balance or expenses you paid for the period. You may use this information to compare the ongoing costs of investing in the Fund and other funds. To do so, compare this 5% hypothetical example with the 5% hypothetical examples that appear in the shareholder reports of the other funds.
Please note that the expenses shown in the table are meant to highlight your ongoing costs only and do not reflect any transaction costs. Therefore, the second line of the table is useful in comparing ongoing costs only, and will not help you determine the relative total costs of owning different funds. In addition, if these transactional costs were included, your costs would have been higher.
| | | | | | | | | Expenses Paid |
| | | Beginning | | | | Ending | | During Period* |
| | | Account Value | | | | Account Value | | February 1, 2005 |
| | | February 1, 2005 | | | | July 31, 2005 | | to July 31, 2005 |
| Class A | | | | | | | | | | |
| Actual | | $ 1,000.00 | | $ | | 1,050.60 | | $ | | 7.12 |
| HypotheticalA | | $ 1,000.00 | | $ | | 1,017.85 | | $ | | 7.00 |
| Class T | | | | | | | | | | |
| Actual | | $ 1,000.00 | | $ | | 1,048.90 | | $ | | 8.38 |
| HypotheticalA | | $ 1,000.00 | | $ | | 1,016.61 | | $ | | 8.25 |
| Class B | | | | | | | | | | |
| Actual | | $ 1,000.00 | | $ | | 1,047.00 | | $ | | 10.91 |
| HypotheticalA | | $ 1,000.00 | | $ | | 1,014.13 | | $ | | 10.74 |
| Class C | | | | | | | | | | |
| Actual | | $ 1,000.00 | | $ | | 1,046.20 | | $ | | 10.91 |
| HypotheticalA | | $ 1,000.00 | | $ | | 1,014.13 | | $ | | 10.74 |
| Institutional Class | | | | | | | | | | |
| Actual | | $ 1,000.00 | | $ | | 1,051.30 | | $ | | 5.85 |
| HypotheticalA | | $ 1,000.00 | | $ | | 1,019.09 | | $ | | 5.76 |
| |
| A 5% return per year before expenses | | | | | | | | | | |
* Expenses are equal to each Class’ annualized expense ratio (shown in the table below); multiplied by the average account value over the period, multiplied by 181/365 (to reflect the one-half year period).
| | | Annualized |
| | | Expense Ratio |
| Class A | | 1.40% |
| Class T | | 1.65% |
| Class B | | 2.15% |
| Class C | | 2.15% |
| Institutional Class | | 1.15% |
| | Advisor Consumer Industries Fund
Investment Changes
|
| Top Ten Stocks as of July 31, 2005 | | |
| | | % of fund’s | | % of fund’s net assets |
| | | net assets | | 6 months ago |
| Procter & Gamble Co. | | 5.8 | | 3.5 |
| Google, Inc. Class A (sub. vtg.) | | 4.3 | | 2.8 |
| Wal-Mart Stores, Inc. | | 3.6 | | 2.9 |
| The Coca-Cola Co. | | 3.2 | | 2.0 |
| Target Corp. | | 3.2 | | 2.5 |
| eBay, Inc. | | 2.9 | | 2.0 |
| Yahoo!, Inc. | | 2.8 | | 2.4 |
| News Corp. Class A | | 2.2 | | 3.8 |
| McDonald’s Corp. | | 2.1 | | 3.0 |
| Brunswick Corp. | | 2.0 | | 1.7 |
| | | 32.1 | | |
* Includes short term investments and net other assets.
Prior period industry classifications reflect the categories in place as of the date indicated and have not been adjusted to reflect current industry classifications.
A-21 A-21 Annual Report
| | Advisor Consumer Industries Fund
Investments July 31, 2005
Showing Percentage of Net Assets
|
| Common Stocks — 98.2% | | | | | | |
| Shares | | Value (Note 1) |
| |
| AUTOMOBILES – 1.2% | | | | | | |
| Automobile Manufacturers – 0.5% | | | | | | |
| Thor Industries, Inc. | | 8,200 | | $ | | 293,560 |
| Motorcycle Manufacturers – 0.7% | | | | | | |
| Harley-Davidson, Inc. | | 9,000 | | | | 478,710 |
| TOTAL AUTOMOBILES | | | | | | 772,270 |
| |
| BEVERAGES – 6.5% | | | | | | |
| Distillers & Vintners – 1.1% | | | | | | |
| Brown-Forman Corp. Class B (non-vtg.) . | | 2,000 | | | | 116,900 |
| Diageo PLC sponsored ADR | | 10,400 | | | | 578,968 |
| | | | | | | 695,868 |
| Soft Drinks – 5.4% | | | | | | |
| Coca-Cola Enterprises, Inc. | | 19,700 | | | | 462,950 |
| PepsiCo, Inc. | | 16,500 | | | | 899,745 |
| The Coca-Cola Co. | | 46,500 | | | | 2,034,840 |
| | | | | | | 3,397,535 |
| |
| TOTAL BEVERAGES | | | | | | 4,093,403 |
| |
| COMMERCIAL SERVICES & SUPPLIES – 0.7% | | | | | | |
| Commercial Printing – 0.2% | | | | | | |
| R.R. Donnelley & Sons Co. | | 4,200 | | | | 151,410 |
| Diversified Commercial & Professional Services – 0.5% | | | | |
| Cendant Corp. | | 14,100 | | | | 301,176 |
| TOTAL COMMERCIAL SERVICES & SUPPLIES | | | | | | 452,586 |
| |
| DIVERSIFIED CONSUMER SERVICES – 2.7% | | | | | | |
| Education Services – 1.6% | | | | | | |
| Apollo Group, Inc. Class A (a) | | 10,800 | | | | 811,620 |
| Bright Horizons Family Solutions, Inc. (a) | | 4,854 | | | | 222,216 |
| | | | | | | 1,033,836 |
| Specialized Consumer Services – 1.1% | | | | | | |
| Steiner Leisure Ltd. (a) | | 10,972 | | | | 379,192 |
| Weight Watchers International, Inc. (a) . | | 5,200 | | | | 295,464 |
| | | | | | | 674,656 |
| |
| TOTAL DIVERSIFIED CONSUMER SERVICES | | | | | | 1,708,492 |
| |
| ELECTRICAL EQUIPMENT – 0.3% | | | | | | |
| Electrical Components & Equipment – 0.3% | | | | | | |
| Evergreen Solar, Inc. (a) | | 27,000 | | | | 190,350 |
| FOOD & STAPLES RETAILING – 8.2% | | | | | | |
| Drug Retail – 2.5% | | | | | | |
| CVS Corp. | | 19,000 | | | | 589,570 |
| Walgreen Co. | | 20,800 | | | | 995,488 |
| | | | | | | 1,585,058 |
| Food Retail – 1.1% | | | | | | |
| Whole Foods Market, Inc. | | 4,900 | | | | 668,899 |
| | | Shares | | Value (Note 1) |
| Hypermarkets & Super Centers – 4.6% | | | | | | |
| Costco Wholesale Corp. | | 13,700 | | $ | | 629,789 |
| Wal-Mart Stores, Inc. | | 46,580 | | | | 2,298,723 |
| | | | | | | 2,928,512 |
| |
| TOTAL FOOD & STAPLES RETAILING | | | | | | 5,182,469 |
| |
| FOOD PRODUCTS – 4.1% | | | | | | |
| Agricultural Products – 1.2% | | | | | | |
| Bunge Ltd. | | 10,900 | | | | 669,151 |
| Corn Products International, Inc. | | 5,100 | | | | 122,757 |
| | | | | | | 791,908 |
| Packaged Foods & Meats – 2.9% | | | | | | |
| Diamond Foods, Inc. | | 7,900 | | | | 174,985 |
| Lindt & Spruengli AG (participation | | | | | | |
| certificate) | | 188 | | | | 291,532 |
| Nestle SA sponsored ADR | | 9,150 | | | | 626,318 |
| Smithfield Foods, Inc. (a) | | 21,400 | | | | 558,968 |
| The J.M. Smucker Co. | | 4,000 | | | | 190,280 |
| | | | | | | 1,842,083 |
| |
| TOTAL FOOD PRODUCTS | | | | | | 2,633,991 |
| |
| HOTELS, RESTAURANTS & LEISURE – 14.0% | | | | | | |
| Casinos & Gaming – 2.3% | | | | | | |
| Aristocrat Leisure Ltd. | | 26,200 | | | | 246,744 |
| Harrah’s Entertainment, Inc. | | 2,233 | | | | 175,826 |
| International Game Technology | | 8,300 | | | | 227,088 |
| MGM MIRAGE (a) | | 11,400 | | | | 518,130 |
| Station Casinos, Inc. | | 1,800 | | | | 132,210 |
| WMS Industries, Inc. (a) | | 4,200 | | | | 136,878 |
| | | | | | | 1,436,876 |
| Hotels, Resorts & Cruise Lines – 5.4% | | | | | | |
| Carnival Corp. unit | | 16,000 | | | | 838,400 |
| Hilton Hotels Corp. | | 14,100 | | | | 348,975 |
| Kerzner International Ltd. (a) | | 3,000 | | | | 179,250 |
| Royal Caribbean Cruises Ltd. | | 11,800 | | | | 536,310 |
| Starwood Hotels & Resorts Worldwide, | | | | | | |
| Inc. unit | | 19,700 | | | | 1,247,404 |
| Wyndham International, Inc. Class A (a) | | 262,500 | | | | 299,250 |
| | | | | | | 3,449,589 |
| Leisure Facilities – 0.2% | | | | | | |
| International Speedway Corp. Class A | | 1,600 | | | | 93,024 |
| Restaurants – 6.1% | | | | | | |
| Brinker International, Inc. (a) | | 9,700 | | | | 396,730 |
| Buffalo Wild Wings, Inc. (a) | | 20,100 | | | | 658,677 |
| CBRL Group, Inc. | | 3,700 | | | | 144,929 |
| Domino’s Pizza, Inc. | | 8,300 | | | | 207,666 |
| McDonald’s Corp. | | 41,600 | | | | 1,296,672 |
| Outback Steakhouse, Inc. | | 13,000 | | | | 605,540 |
See accompanying notes which are an integral part of the financial statements.
Consumer Industries A-22
| Common Stocks – continued | | | | | | |
| | | Shares | | Value (Note 1) |
| |
| HOTELS, RESTAURANTS & LEISURE – CONTINUED | | | | |
| Restaurants – continued | | | | | | |
| Starbucks Corp. (a) | | 4,800 | | $ | | 252,240 |
| Wendy’s International, Inc. | | 6,140 | | | | 317,438 |
| | | | | | | 3,879,892 |
| |
| TOTAL HOTELS, RESTAURANTS & LEISURE | | | | | | 8,859,381 |
| |
| HOUSEHOLD PRODUCTS – 7.7% | | | | | | |
| Household Products – 7.7% | | | | | | |
| Colgate-Palmolive Co. | | 22,500 | | | | 1,191,150 |
| Procter & Gamble Co. | | 66,070 | | | | 3,675,472 |
| | | | | | | 4,866,622 |
| |
| INTERNET & CATALOG RETAIL – 3.3% | | | | | | |
| Catalog Retail – 0.4% | | | | | | |
| Coldwater Creek, Inc. (a) | | 10,400 | | | | 287,976 |
| Internet Retail – 2.9% | | | | | | |
| eBay, Inc. (a) | | 43,800 | | | | 1,829,964 |
| |
| TOTAL INTERNET & CATALOG RETAIL | | | | | | 2,117,940 |
| |
| INTERNET SOFTWARE & SERVICES – 7.4% | | | | | | |
| Internet Software & Services – 7.4% | | | | | | |
| Google, Inc. Class A (sub. vtg.) | | 9,500 | | | | 2,733,720 |
| Sina Corp. (a) | | 6,100 | | | | 169,641 |
| Yahoo!, Inc. (a) | | 53,570 | | | | 1,786,024 |
| | | | | | | 4,689,385 |
| |
| LEISURE EQUIPMENT & PRODUCTS – 4.4% | | | | | | |
| Leisure Products – 4.4% | | | | | | |
| Brunswick Corp. | | 27,100 | | | | 1,261,776 |
| K2, Inc. (a) | | 9,800 | | | | 130,340 |
| MarineMax, Inc. (a) | | 11,200 | | | | 372,512 |
| Polaris Industries, Inc. | | 4,900 | | | | 270,970 |
| RC2 Corp. (a) | | 2,700 | | | | 110,187 |
| SCP Pool Corp. | | 17,350 | | | | 632,234 |
| | | | | | | 2,778,019 |
| |
| MEDIA – 10.1% | | | | | | |
| Advertising – 2.5% | | | | | | |
| Harte-Hanks, Inc. | | 4,400 | | | | 119,680 |
| JC Decaux SA (a) | | 23,000 | | | | 536,556 |
| Omnicom Group, Inc. | | 10,900 | | | | 925,083 |
| | | | | | | 1,581,319 |
| Broadcasting & Cable TV – 1.5% | | | | | | |
| E.W. Scripps Co. Class A | | 7,700 | | | | 389,081 |
| SBS Broadcasting SA (a) | | 3,900 | | | | 186,381 |
| Univision Communications, Inc. | | | | | | |
| Class A (a) | | 13,000 | | | | 367,640 |
| | | | | | | 943,102 |
| | | Shares | | Value (Note 1) |
| Movies & Entertainment – 4.0% | | | | |
| News Corp. Class A | | 85,584 | | $ 1,401,866 |
| Walt Disney Co. | | 45,600 | | 1,169,184 |
| | | | | 2,571,050 |
| Publishing – 2.1% | | | | |
| Gannett Co., Inc. | | 2,580 | | 188,237 |
| McGraw-Hill Companies, Inc. | | 10,400 | | 478,504 |
| Reuters Group PLC sponsored ADR | | 3,800 | | 155,192 |
| Washington Post Co. Class B | | 560 | | 497,728 |
| | | | | 1,319,661 |
| |
| TOTAL MEDIA | | | | 6,415,132 |
| |
| MULTILINE RETAIL – 7.7% | | | | |
| Department Stores – 4.1% | | | | |
| Federated Department Stores, Inc. | | 9,600 | | 728,352 |
| JCPenney Co., Inc. | | 7,400 | | 415,436 |
| Nordstrom, Inc. | | 9,000 | | 333,090 |
| Saks, Inc. | | 10,100 | | 214,322 |
| Sears Holdings Corp. (a) | | 5,900 | | 909,957 |
| | | | | 2,601,157 |
| General Merchandise Stores – 3.6% | | | | |
| Family Dollar Stores, Inc. | | 9,000 | | 232,200 |
| Target Corp. | | 34,400 | | 2,021,000 |
| | | | | 2,253,200 |
| |
| TOTAL MULTILINE RETAIL | | | | 4,854,357 |
| |
| PERSONAL PRODUCTS – 2.7% | | | | |
| Personal Products – 2.7% | | | | |
| Avon Products, Inc. | | 22,400 | | 732,704 |
| Gillette Co. | | 18,900 | | 1,014,363 |
| | | | | 1,747,067 |
| |
| REAL ESTATE – 0.3% | | | | |
| Real Estate Investment Trusts – 0.3% | | | | |
| MeriStar Hospitality Corp. (a) | | 24,700 | | 220,324 |
| SOFTWARE – 0.7% | | | | |
| Home Entertainment Software – 0.7% | | | | |
| Activision, Inc. (a) | | 3,700 | | 75,258 |
| Electronic Arts, Inc. (a) | | 6,100 | | 351,360 |
| | | | | 426,618 |
| |
| SPECIALTY RETAIL – 11.4% | | | | |
| Apparel Retail – 4.0% | | | | |
| Aeropostale, Inc. (a) | | 8,500 | | 253,725 |
| American Eagle Outfitters, Inc. | | 19,200 | | 632,640 |
| bebe Stores, Inc. | | 8,700 | | 247,602 |
| Chico’s FAS, Inc. (a) | | 11,800 | | 473,298 |
| DSW, Inc. Class A | | 100 | | 2,650 |
| Foot Locker, Inc. | | 14,500 | | 362,500 |
See accompanying notes which are an integral part of the financial statements.
A-23 A-23 Annual Report
Advisor Consumer Industries Fund
Investments - continued
|
| Common Stocks – continued | | | | | | |
| | | Shares | | Value (Note 1) |
| |
| SPECIALTY RETAIL – CONTINUED | | | | | | |
| Apparel Retail – continued | | | | | | |
| Hot Topic, Inc. (a) | | 7,650 | | $ | | 130,356 |
| Urban Outfitters, Inc. (a) | | 7,500 | | | | 455,325 |
| | | | | | | 2,558,096 |
| Computer & Electronics Retail – 1.9% | | | | | | |
| Best Buy Co., Inc. | | 12,500 | | | | 957,500 |
| GameStop Corp.: | | | | | | |
| Class A (a) | | 5,500 | | | | 188,925 |
| Class B (a) | | 1,400 | | | | 44,800 |
| | | | | | | 1,191,225 |
| Home Improvement Retail – 1.9% | | | | | | |
| Lowe’s Companies, Inc. | | 18,200 | | | | 1,205,204 |
| Homefurnishing Retail – 0.1% | | | | | | |
| Bed Bath & Beyond, Inc. (a) | | 2,200 | | | | 100,980 |
| Specialty Stores – 3.5% | | | | | | |
| AC Moore Arts & Crafts, Inc. (a) | | 12,200 | | | | 350,506 |
| Guitar Center, Inc. (a) | | 6,100 | | | | 394,030 |
| Michaels Stores, Inc. | | 4,800 | | | | 196,800 |
| Office Depot, Inc. (a) | | 15,900 | | | | 451,242 |
| PETsMART, Inc. | | 4,500 | | | | 133,875 |
| Sports Authority, Inc. (a) | | 1,400 | | | | 44,520 |
| Staples, Inc. | | 27,450 | | | | 625,037 |
| | | | | | | 2,196,010 |
| |
| TOTAL SPECIALTY RETAIL | | | | | | 7,251,515 |
| |
| TEXTILES, APPAREL & LUXURY GOODS – 4.8% | | | | | | |
| Apparel, Accessories & Luxury Goods – 3.5% | | | | |
| Carter’s, Inc. (a) | | 11,200 | | | | 681,520 |
| Coach, Inc. (a) | | 10,800 | | | | 379,188 |
| Kenneth Cole Productions, Inc. Class A | | | | | | |
| (sub. vtg.) | | 3,200 | | | | 95,264 |
| Liz Claiborne, Inc. | | 13,100 | | | | 545,091 |
| Polo Ralph Lauren Corp. Class A | | 7,600 | | | | 374,224 |
| Quiksilver, Inc. (a) | | 9,800 | | | | 164,542 |
| | | | | | | 2,239,829 |
| Footwear – 1.3% | | | | | | |
| NIKE, Inc. Class B | | 9,500 | | | | 796,100 |
| |
| TOTAL TEXTILES, APPAREL & LUXURY GOODS | | | | 3,035,929 |
| |
| TOTAL COMMON STOCKS | | | | | | |
| (Cost $51,722,891) | | | | 62,295,850 |
| Money Market Funds — 2.2% | | | | |
| | | Shares | | | | Value (Note 1) |
| Fidelity Cash Central Fund, 3.31% (b) | | | | |
| (Cost $1,386,664) | | 1,386,664 | | $ | | 1,386,664 |
| TOTAL INVESTMENT PORTFOLIO - 100.4% | | | | |
| (Cost $53,109,555) | | | | | | 63,682,514 |
| |
| NET OTHER ASSETS – (0.4)% | | | | | | (274,919) |
| NET ASSETS – 100% | | | | $ | | 63,407,595 |
Legend
(a) Non-income producing
(b) Affiliated fund that is available only to investment companies and other
accounts managed by Fidelity Investments. The rate quoted is the
annualized seven-day yield of the fund at period end. A complete listing
of the fund’s holdings as of its most recent quarter end is available upon
request.
|
See accompanying notes which are an integral part of the financial statements.
Consumer Industries A-24
Advisor Consumer Industries Fund
Financial Statements
| Statement of Assets and Liabilities | | |
| | | | | | | July 31, 2005 |
| |
| Assets | | | | | | |
| Investment in securities, at value (cost | | | | |
| $53,109,555) — See accompany- | | | | |
| ing schedule | | | | $ | | 63,682,514 |
| Receivable for investments sold | | | | | | 33,081 |
| Receivable for fund shares sold | | | | | | 55,179 |
| Dividends receivable | | | | | | 35,113 |
| Interest receivable | | | | | | 3,390 |
| Prepaid expenses | | | | | | 87 |
| Receivable from investment adviser for | | | | |
| expense reductions | | | | | | 1,865 |
| Other affiliated receivables | | | | | | 68 |
| Other receivables | | | | | | 7,298 |
| Total assets | | | | | | 63,818,595 |
| |
| Liabilities | | | | | | |
| Payable for investments purchased | | $ | | 215,462 | | |
| Payable for fund shares redeemed | | | | 77,696 | | |
| Accrued management fee | | | | 29,700 | | |
| Distribution fees payable | | | | 33,014 | | |
| Other affiliated payables | | | | 22,126 | | |
| Other payables and accrued expenses | | 33,002 | | |
| Total liabilities | | | | | | 411,000 |
| |
| Net Assets | | | | $ | | 63,407,595 |
| Net Assets consist of: | | | | | | |
| Paid in capital | | | | $ | | 52,773,368 |
| Accumulated net investment loss | | | | | | (28) |
| Accumulated undistributed net realized | | | | |
| gain (loss) on investments and for- | | | | |
| eign currency transactions | | | | | | 61,324 |
| Net unrealized appreciation (depreci- | | | | |
| ation) on investments and assets and | | | | |
| liabilities in foreign currencies | | | | | | 10,572,931 |
| Net Assets | | | | $ | | 63,407,595 |
| Calculation of Maximum Offering Price | | | | |
| Class A: | | | | | | |
| Net Asset Value and redemption | | | | | | |
| price per share ($17,887,437 ÷ | | | | |
| 1,076,295 shares) | | | | $ | | 16.62 |
| Maximum offering price per share | | | | | | |
| (100/94.25 of $16.62) | | | | $ | | 17.63 |
| Class T: | | | | | | |
| Net Asset Value and redemption | | | | | | |
| price per share ($16,782,188 ÷ | | | | |
| 1,029,930 shares) | | | | $ | | 16.29 |
| Maximum offering price per share | | | | | | |
| (100/96.50 of $16.29) | | | | $ | | 16.88 |
| Class B: | | | | | | |
| Net Asset Value and offering price | | | | |
| per share ($18,862,461 ÷ | | | | | | |
| 1,209,417 shares)A | | | | $ | | 15.60 |
| Class C: | | | | | | |
| Net Asset Value and offering price | | | | |
| per share ($8,505,000 ÷ | | | | | | |
| 544,524 shares)A | | | | $ | | 15.62 |
| Institutional Class: | | | | | | |
| Net Asset Value, offering price and | | | | |
| redemption price per share | | | | | | |
| ($1,370,509 ÷ 80,548 shares) | | $ | | 17.01 |
| Statement of Operations | | | | |
| | | | | Year ended July 31, 2005 |
| |
| Investment Income | | | | | | |
| Dividends | | | | $ | | 488,719 |
| Interest | | | | | | 34,382 |
| Security lending | | | | | | 14,716 |
| Total income | | | | | | 537,817 |
| |
| Expenses | | | | | | |
| Management fee | | $ | | 320,552 | | |
| Transfer agent fees | | | | 231,833 | | |
| Distribution fees | | | | 365,996 | | |
| Accounting and security lending | | | | | | |
| fees | | | | 27,860 | | |
| Independent trustees’ compensation | | 286 | | |
| Custodian fees and expenses | | | | 6,745 | | |
| Registration fees | | | | 54,596 | | |
| Audit | | | | 42,044 | | |
| Legal | | | | 201 | | |
| Miscellaneous | | | | 2,896 | | |
| Total expenses before reductions | | 1,053,009 | | |
| Expense reductions | | | | (37,462) | | 1,015,547 |
| |
| Net investment income (loss) | | | | | | (477,730) |
| Realized and Unrealized Gain (Loss) | | | | |
| Net realized gain (loss) on: | | | | | | |
| Investment securities | | | | 169,313 | | |
| Foreign currency transactions | | | | 2,412 | | |
| Total net realized gain (loss) | | | | | | 171,725 |
| Change in net unrealized appreci- | | | | |
| ation (depreciation) on: | | | | | | |
| Investment securities | | | | 9,733,469 | | |
| Assets and liabilities in foreign | | | | | | |
| currencies | | | | (28) | | |
| Total change in net unrealized | | | | | | |
| appreciation (depreciation) | | | | | | 9,733,441 |
| Net gain (loss) | | | | | | 9,905,166 |
| Net increase (decrease) in net as- | | | | |
| sets resulting from operations | | | | $ | | 9,427,436 |
See accompanying notes which are an integral part of the financial statements.
A-25 Annual Report
Advisor Consumer Industries Fund Financial Statements - continued
| Statement of Changes in Net Assets | | | | | | |
| | | Year ended | | | | Year ended |
| | | July 31, | | | | July 31, |
| | | 2005 | | | | 2004 |
| Increase (Decrease) in Net Assets | | | | | | |
| Operations | | | | | | |
| Net investment income (loss) | | $ (477,730) | | $ | | (483,848) |
| Net realized gain (loss) | | 171,725 | | | | 5,966,105 |
| Change in net unrealized appreciation (depreciation) | | 9,733,441 | | | | (3,103,656) |
| Net increase (decrease) in net assets resulting from operations | | 9,427,436 | | | | 2,378,601 |
| Distributions to shareholders from net realized gain | | (1,957,955) | | | | — |
| Share transactions — net increase (decrease) | | 3,323,070 | | | | 3,962,592 |
| Redemption fees | | 3,279 | | | | 7,430 |
| Total increase (decrease) in net assets | | 10,795,830 | | | | 6,348,623 |
| |
| Net Assets | | | | | | |
| Beginning of period | | 52,611,765 | | | | 46,263,142 |
| End of period (including accumulated net investment loss of $28 and accumulated net investment loss of $36, | | | | | | |
| respectively) | | $ 63,407,595 | | $ | | 52,611,765 |
| Financial Highlights — Class A | | | | | | | | | | |
| Years ended July 31, | | 2005 | | 2004 | | 2003 | | 2002 | | 2001 |
| Selected Per-Share Data | | | | | | | | | | |
| Net asset value, beginning of period | | $ 14.51 | | $ 13.71 | | $ 12.71 | | $ 15.20 | | $ 15.04 |
| Income from Investment Operations | | | | | | | | | | |
| Net investment income (loss)C | | (.07) | | (.07) | | (.04) | | (.05) | | .01 |
| Net realized and unrealized gain (loss) | | 2.71 | | .87 | | 1.04 | | (2.09) | | .15 |
| Total from investment operations | | 2.64 | | .80 | | 1.00 | | (2.14) | | .16 |
| Distributions from net realized gain | | (.53) | | — | | — | | (.35) | | — |
| Redemption fees added to paid in capitalC | | —E | | —E | | —E | | —E | | —E |
| Net asset value, end of period | | $ 16.62 | | $ 14.51 | | $ 13.71 | | $ 12.71 | | $ 15.20 |
| Total ReturnA, B | | 18.85% | | 5.84% | | 7.87% | | (14.30)% | | 1.06% |
| Ratios to Average Net AssetsD | | | | | | | | | | |
| Expenses before expense reductions | | 1.47% | | 1.55% | | 1.70% | | 1.69% | | 1.71% |
| Expenses net of voluntary waivers, if any | | 1.44% | | 1.50% | | 1.53% | | 1.50% | | 1.50% |
| Expenses net of all reductions | | 1.42% | | 1.45% | | 1.48% | | 1.47% | | 1.49% |
| Net investment income (loss) | | (.45)% | | (.50)% | | (.33)% | | (.36)% | | .08% |
| Supplemental Data | | | | | | | | | | |
| Net assets, end of period (000 omitted) | | $ 17,887 | | $ 11,856 | | $ 9,101 | | $ 7,209 | | $ 4,648 |
| Portfolio turnover rate | | 66% | | 152% | | 88% | | 136% | | 77% |
| | A Total returns would have been lower had certain expenses not been reduced during the periods shown.
B Total returns do not include the effect of the sales charges.
C Calculated based on average shares outstanding during the period.
D Expense ratios reflect operating expenses of the class. Expenses before reductions do not reflect amounts reimbursed by the investment adviser or reductions from brokerage service arrangements or other expense offset arrangements and do not
represent the amount paid by the class during periods when reimbursements or reductions occur. Expenses net of any voluntary waivers reflect expenses after reimbursement by the investment adviser but prior to reductions from brokerage service
arrangements or other expense offset arrangements. Expenses net of all reductions represent the net expenses paid by the class.
E Amount represents less than $.01 per share.
|
See accompanying notes which are an integral part of the financial statements.
Consumer Industries A-26
| Financial Highlights — Class T | | | | | | | | | | |
| Years ended July 31, | | 2005 | | 2004 | | 2003 | | 2002 | | 2001 |
| Selected Per-Share Data | | | | | | | | | | |
| Net asset value, beginning of period | | $ 14.27 | | $ 13.51 | | $ 12.57 | | $ 15.06 | | $ 14.93 |
| Income from Investment Operations | | | | | | | | | | |
| Net investment income (loss)C | | (.11) | | (.11) | | (.07) | | (.09) | | (.02) |
| Net realized and unrealized gain (loss) | | 2.66 | | .87 | | 1.01 | | (2.05) | | .15 |
| Total from investment operations | | 2.55 | | .76 | | .94 | | (2.14) | | .13 |
| Distributions from net realized gain | | (.53) | | — | | — | | (.35) | | — |
| Redemption fees added to paid in capitalC | | —E | | —E | | —E | | —E | | —E |
| Net asset value, end of period | | $ 16.29 | | $ 14.27 | | $ 13.51 | | $ 12.57 | | $ 15.06 |
| Total ReturnA,B | | 18.52% | | 5.63% | | 7.48% | | (14.44)% | | .87% |
| Ratios to Average Net AssetsD | | | | | | | | | | |
| Expenses before expense reductions | | 1.75% | | 1.81% | | 1.87% | | 1.89% | | 1.98% |
| Expenses net of voluntary waivers, if any | | 1.69% | | 1.75% | | 1.78% | | 1.75% | | 1.75% |
| Expenses net of all reductions | | 1.67% | | 1.70% | | 1.73% | | 1.72% | | 1.73% |
| Net investment income (loss) | | (.70)% | | (.74)% | | (.58)% | | (.61)% | | (.17)% |
| Supplemental Data | | | | | | | | | | |
| Net assets, end of period (000 omitted) | | $ 16,782 | | $ 15,555 | | $ 13,693 | | $ 12,132 | | $ 12,899 |
| Portfolio turnover rate | | 66% | | 152% | | 88% | | 136% | | 77% |
A Total returns would have been lower had certain expenses not been reduced during the periods shown.
B Total returns do not include the effect of the sales charges.
C Calculated based on average shares outstanding during the period.
D Expense ratios reflect operating expenses of the class. Expenses before reductions do not reflect amounts reimbursed by the investment adviser or reductions from brokerage service arrangements or other expense offset arrangements and do not
represent the amount paid by the class during periods when reimbursements or reductions occur. Expenses net of any voluntary waivers reflect expenses after reimbursement by the investment adviser but prior to reductions from brokerage service
arrangements or other expense offset arrangements. Expenses net of all reductions represent the net expenses paid by the class.
E Amount represents less than $.01 per share.
|
| Financial Highlights — Class B | | | | | | | | | | |
| Years ended July 31, | | 2005 | | 2004 | | 2003 | | 2002 | | 2001 |
| Selected Per-Share Data | | | | | | | | | | |
| Net asset value, beginning of period | | $ 13.75 | | $ 13.08 | | $ 12.22 | | $ 14.73 | | $ 14.69 |
| Income from Investment Operations | | | | | | | | | | |
| Net investment income (loss)C | | (.17) | | (.18) | | (.13) | | (.15) | | (.10) |
| Net realized and unrealized gain (loss) | | 2.55 | | .85 | | .99 | | (2.01) | | .14 |
| Total from investment operations | | 2.38 | | .67 | | .86 | | (2.16) | | .04 |
| Distributions from net realized gain | | (.53) | | — | | — | | (.35) | | — |
| Redemption fees added to paid in capitalC | | —E | | —E | | —E | | —E | | —E |
| Net asset value, end of period | | $ 15.60 | | $ 13.75 | | $ 13.08 | | $ 12.22 | | $ 14.73 |
| Total ReturnA,B | | 17.97% | | 5.12% | | 7.04% | | (14.91)% | | .27% |
| Ratios to Average Net AssetsD | | | | | | | | | | |
| Expenses before expense reductions | | 2.24% | | 2.29% | | 2.37% | | 2.39% | | 2.51% |
| Expenses net of voluntary waivers, if any | | 2.19% | | 2.25% | | 2.25% | | 2.25% | | 2.25% |
| Expenses net of all reductions | | 2.16% | | 2.20% | | 2.19% | | 2.22% | | 2.24% |
| Net investment income (loss) | | (1.20)% | | (1.25)% | | (1.05)% | | (1.11)% | | (.67)% |
| Supplemental Data | | | | | | | | | | |
| Net assets, end of period (000 omitted) | | $ 18,862 | | $ 17,302 | | $ 15,944 | | $ 13,807 | | $ 13,483 |
| Portfolio turnover rate | | 66% | | 152% | | 88% | | 136% | | 77% |
| | A Total returns would have been lower had certain expenses not been reduced during the periods shown.
B Total returns do not include the effect of the contingent deferred sales charge.
C Calculated based on average shares outstanding during the period.
D Expense ratios reflect operating expenses of the class. Expenses before reductions do not reflect amounts reimbursed by the investment adviser or reductions from brokerage service arrangements or other expense offset arrangements and do not
represent the amount paid by the class during periods when reimbursements or reductions occur. Expenses net of any voluntary waivers reflect expenses after reimbursement by the investment adviser but prior to reductions from brokerage service
arrangements or other expense offset arrangements. Expenses net of all reductions represent the net expenses paid by the class.
E Amount represents less than $.01 per share.
|
See accompanying notes which are an integral part of the financial statements.
A-27 Annual Report
| Financial Highlights — Class C | | | | | | | | | | |
| Years ended July 31, | | 2005 | | 2004 | | 2003 | | 2002 | | 2001 |
| Selected Per-Share Data | | | | | | | | | | |
| Net asset value, beginning of period | | $ 13.77 | | $ 13.10 | | $ 12.24 | | $ 14.75 | | $ 14.71 |
| Income from Investment Operations | | | | | | | | | | |
| Net investment income (loss)C | | (.17) | | (.18) | | (.13) | | (.15) | | (.10) |
| Net realized and unrealized gain (loss) | | 2.55 | | .85 | | .99 | | (2.01) | | .14 |
| Total from investment operations | | 2.38 | | .67 | | .86 | | (2.16) | | .04 |
| Distributions from net realized gain | | (.53) | | — | | — | | (.35) | | — |
| Redemption fees added to paid in capitalC | | —E | | —E | | —E | | —E | | —E |
| Net asset value, end of period | | $ 15.62 | | $ 13.77 | | $ 13.10 | | $ 12.24 | | $ 14.75 |
| Total ReturnA,B | | 17.94% | | 5.11% | | 7.03% | | (14.89)% | | .27% |
| Ratios to Average Net AssetsD | | | | | | | | | | |
| Expenses before expense reductions | | 2.17% | | 2.24% | | 2.33% | | 2.35% | | 2.49% |
| Expenses net of voluntary waivers, if any | | 2.17% | | 2.24% | | 2.25% | | 2.25% | | 2.25% |
| Expenses net of all reductions | | 2.14% | | 2.19% | | 2.19% | | 2.22% | | 2.24% |
| Net investment income (loss) | | (1.18)% | | (1.24)% | | (1.05)% | | (1.11)% | | (.67)% |
| Supplemental Data | | | | | | | | | | |
| Net assets, end of period (000 omitted) | | $ 8,505 | | $ 6,992 | | $ 6,759 | | $ 5,391 | | $ 5,504 |
| Portfolio turnover rate | | 66% | | 152% | | 88% | | 136% | | 77% |
A Total returns would have been lower had certain expenses not been reduced during the periods shown.
B Total returns do not include the effect of the contingent deferred sales charge.
C Calculated based on average shares outstanding during the period.
D Expense ratios reflect operating expenses of the class. Expenses before reductions do not reflect amounts reimbursed by the investment adviser or reductions from brokerage service arrangements or other expense offset arrangements and do not
represent the amount paid by the class during periods when reimbursements or reductions occur. Expenses net of any voluntary waivers reflect expenses after reimbursement by the investment adviser but prior to reductions from brokerage service
arrangements or other expense offset arrangements. Expenses net of all reductions represent the net expenses paid by the class.
E Amount represents less than $.01 per share.
|
| Financial Highlights — Institutional Class | | | | | | | | | | |
| Years ended July 31, | | 2005 | | 2004 | | 2003 | | 2002 | | 2001 |
| Selected Per-Share Data | | | | | | | | | | |
| Net asset value, beginning of period | | $ 14.81 | | $ 13.95 | | $ 12.91 | | $ 15.38 | | $ 15.18 |
| Income from Investment Operations | | | | | | | | | | |
| Net investment income (loss)B | | (.03) | | (.04) | | (.01) | | (.02) | | .05 |
| Net realized and unrealized gain (loss) | | 2.76 | | .90 | | 1.05 | | (2.10) | | .15 |
| Total from investment operations | | 2.73 | | .86 | | 1.04 | | (2.12) | | .20 |
| Distributions from net realized gain | | (.53) | | — | | — | | (.35) | | — |
| Redemption fees added to paid in capitalB | | —D | | —D | | —D | | —D | | —D |
| Net asset value, end of period | | $ 17.01 | | $ 14.81 | | $ 13.95 | | $ 12.91 | | $ 15.38 |
| Total ReturnA | | 19.08% | | 6.16% | | 8.06% | | (14.00)% | | 1.32% |
| Ratios to Average Net AssetsC | | | | | | | | | | |
| Expenses before expense reductions | | 1.26% | | 1.34% | | 1.49% | | 1.39% | | 1.57% |
| Expenses net of voluntary waivers, if any | | 1.20% | | 1.25% | | 1.25% | | 1.25% | | 1.25% |
| Expenses net of all reductions | | 1.17% | | 1.20% | | 1.19% | | 1.22% | | 1.24% |
| Net investment income (loss) | | (.21)% | | (.25)% | | (.05)% | | (.11)% | | .33% |
| Supplemental Data | | | | | | | | | | |
| Net assets, end of period (000 omitted) | | $ 1,371 | | $ 907 | | $ 766 | | $ 1,215 | | $ 1,249 |
| Portfolio turnover rate | | 66% | | 152% | | 88% | | 136% | | 77% |
| | A Total returns would have been lower had certain expenses not been reduced during the periods shown.
B Calculated based on average shares outstanding during the period.
C Expense ratios reflect operating expenses of the class. Expenses before reductions do not reflect amounts reimbursed by the investment adviser or reductions from brokerage service arrangements or other expense offset arrangements and do not
represent the amount paid by the class during periods when reimbursements or reductions occur. Expenses net of any voluntary waivers reflect expenses after reimbursement by the investment adviser but prior to reductions from brokerage service
arrangements or other expense offset arrangements. Expenses net of all reductions represent the net expenses paid by the class.
D Amount represents less than $.01 per share.
|
See accompanying notes which are an integral part of the financial statements.
Consumer Industries A-28
Notes to Financial Statements
For the period ended July 31, 2005
|
1. Significant Accounting Policies.
|
Fidelity Advisor Consumer Industries Fund (the fund) is a non-diversified fund of Fidelity Advisor Series VII (the trust) and is authorized to issue an unlimited number of shares. The trust is registered under the Investment Company Act of 1940, as amended (the 1940 Act), as an open-end management investment company organized as a Massachusetts business trust.
The fund offers Class A, Class T, Class B, Class C, and Institutional Class shares, each of which has equal rights as to assets and voting privileges. Each class has exclusive voting rights with respect to matters that affect that class. Class B shares will automatically convert to Class A shares after a holding period of seven years from the initial date of purchase. Investment income, realized and unrealized capital gains and losses, the common expenses of the fund, and certain fund-level expense reductions, if any, are allocated on a pro rata basis to each class based on the relative net assets of each class to the total net assets of the fund. Each class differs with respect to transfer agent and distribution and service plan fees incurred. Certain expense reductions also differ by class.
The financial statements have been prepared in conformity with accounting principles generally accepted in the United States of America, which require management to make certain estimates and assumptions at the date of the financial statements. The following summarizes the significant accounting policies of the fund:
Security Valuation. Net asset value per share (NAV calculation) is calculated as of the close of business of the New York Stock Exchange, normally 4:00 p.m. Eastern time. Equity securities, including restricted securities, for which market quotations are available are valued at the last sale price or official closing price (closing bid price or last evaluated quote if no sale has occurred) on the primary market or exchange on which they trade. If prices are not readily available or do not accurately reflect fair value for a security, or if a security’s value has been materially affected by events occurring after the close of the exchange or market on which the security is principally traded, that security may be valued by another method that the Board of Trustees believes accurately reflects fair value. A security’s valuation may differ depending on the method used for determining value. Price movements in futures contracts and ADRs, market and trading trends, the bid/ask quotes of brokers and off-exchange institutional trading may be reviewed in the course of making a good faith determination of a security’s fair value. Short-term securities with remaining maturities of sixty days or less for which quotations are not readily available are valued on the basis of amortized cost. Investments in open-end investment companies are valued at their net asset value each business day.
Foreign Currency. The fund uses foreign currency contracts to facilitate transactions in foreign-denominated securities. Losses from these transactions may arise from changes in the value of the foreign currency or if the counterparties do not perform under the contracts’ terms.
Foreign-denominated assets, including investment securities, and liabilities are translated into U.S. dollars at the exchange rate at period end. Purchases and sales of investment securities, income and dividends received and expenses denominated in foreign currencies are translated into U.S. dollars at the exchange rate in effect on the transaction date.
The effects of exchange rate fluctuations on investments are included with the net realized and unrealized gain (loss) on investment securities. Other foreign currency transactions resulting in realized and unrealized gain (loss) are disclosed separately.
Investment Transactions and Income. Security transactions are accounted for as of trade date. Gains and losses on securities sold are determined on the basis of identified cost and may include proceeds received from litigation. Dividend income is recorded on the ex-dividend date, except for certain dividends from foreign securities where the ex-dividend date may have passed, which are recorded as soon as the fund is informed of the ex-dividend date. Non-cash dividends included in dividend income, if any, are recorded at the fair market value of the securities received. Distributions received on securities that represent a return of capital or capital gain are recorded as a reduction of cost of investments and/or as a realized gain. The fund estimates the components of distributions received that may be considered return of capital distributions or capital gain distributions. Interest income is accrued as earned. Interest income includes coupon interest and amortization of premium and accretion of discount on debt securities. Investment income is recorded net of foreign taxes withheld where recovery of such taxes is uncertain.
Expenses. Most expenses of the trust can be directly attributed to a fund. Expenses which cannot be directly attributed are apportioned among each fund in the trust.
Income Tax Information and Distributions to Shareholders. Each year, the fund intends to qualify as a regulated investment company by distributing all of its taxable income and realized gains under Subchapter M of the Internal Revenue Code. As a result, no provision for income taxes is required in the accompanying financial statements. Foreign taxes are provided for based on the fund’s understanding of the tax rules and rates that exist in the foreign markets in which it invests.
Distributions are recorded on the ex-dividend date. Income dividends and capital gain distributions are declared separately for each class. Income and capital gain distributions are determined in accordance with income tax regulations, which may differ from generally accepted accounting principles. Capital accounts within the financial statements are adjusted for permanent book-tax differences. These adjustments have no impact on net assets or the results of operations. Temporary book-tax differences will reverse in a subsequent period.
Notes to Financial Statements - continued
| | 1. Significant Accounting Policies - continued
Income Tax Information and Distributions to Shareholders - continued
Book-tax differences are primarily due to foreign currency transactions, net operating losses, and losses deferred due to wash sales.
The tax-basis components of distributable earnings and the federal tax cost as of period end were as follows:
|
| Unrealized appreciation | | $ 11,354,269 |
| Unrealized depreciation | | (792,037) |
| Net unrealized appreciation (depreciation) | | 10,562,232 |
| Undistributed long-term capital gain | | 72,024 |
| |
| Cost for federal income tax purposes | | $ 53,120,282 |
The tax character of distributions paid was as follows:
| | | July 31, 2005 | | July 31, 2004 |
| Long-term Capital Gains | | 1,957,955 | | — |
| | Short-Term Trading (Redemption) Fees. Shares held in the fund less than 60 days are subject to a redemption fee equal to 1.00% of the proceeds of
the redeemed shares. All redemption fees, including any estimated redemption fees paid by Fidelity Management & Research Company (FMR), are
retained by the fund and accounted for as an addition to paid in capital.
2. Operating Policies.
Repurchase Agreements. FMR has received an Exemptive Order from the Securities and Exchange Commission (the SEC) which permits the fund
and other affiliated entities of FMR to transfer uninvested cash balances into joint trading accounts which are then invested in repurchase agreements.
The fund may also invest directly with institutions in repurchase agreements. Repurchase agreements are collateralized by government or non-
government securities. Collateral is held in segregated accounts with custodian banks and may be obtained in the event of a default of the counterparty.
The fund monitors, on a daily basis, the value of the collateral to ensure it is at least equal to the principal amount of the repurchase agreement (in-
cluding accrued interest). In the event of a default by the counterparty, realization of the collateral proceeds could be delayed, during which time the
value of the collateral may decline.
3. Purchases and Sales of Investments.
Purchases and sales of securities, other than short-term securities and U.S. government securities, aggregated $36,749,282 and $36,324,562,
respectively.
4. Fees and Other Transactions with Affiliates.
Management Fee. FMR and its affiliates provide the fund with investment management related services for which the fund pays a monthly manage-
ment fee. The management fee is the sum of an individual fund fee rate that is based on an annual rate of .30% of the fund’s average net assets and a
group fee rate that averaged .27% during the period. The group fee rate is based upon the average net assets of all the mutual funds advised by FMR.
The group fee rate decreases as assets under management increase and increases as assets under management decrease. For the period, the total
annual management fee rate was .57% of the fund’s average net assets.
Distribution and Service Plan. In accordance with Rule 12b-1 of the 1940 Act, the fund has adopted separate Distribution and Service Plans for each
class of shares. Certain classes pay Fidelity Distributors Corporation (FDC), an affiliate of FMR, separate Distribution and Service Fees, each of which
is based on an annual percentage of each class’ average net assets. In addition, FDC may pay financial intermediaries for selling shares of the fund and
providing shareholder support services. For the period, the Distribution and Service Fee rates and the total amounts paid to and retained by FDC were
as follows:
|
| | | Distribution | | Service | | | | Paid to | | | | Retained |
| | | Fee | | Fee | | | | FDC | | | | by FDC |
| Class A | | 0% | | .25% | | $ | | 34,179 | | $ | | 37 |
| Class T | | 25% | | .25% | | | | 80,146 | | | | 172 |
| Class B | | 75% | | .25% | | | | 178,659 | | | | 134,081 |
| Class C | | 75% | | .25% | | | | 73,012 | | | | 11,003 |
| |
| | | | | | | $ | | 365,996 | | $ | | 145,293 |
Consumer Industries A-30
| | 4. Fees and Other Transactions with Affiliates - continued
Sales Load. FDC receives a front-end sales charge of up to 5.75% for selling Class A shares, and 3.50% for selling Class T shares, some of which is paid
to financial intermediaries for selling shares of the fund. FDC receives the proceeds of contingent deferred sales charges levied on Class A, Class T,
Class B, and Class C redemptions. These charges depend on the holding period. The deferred sales charges range from 5% to 1% for Class B, 1% for
Class C, and .25% for certain purchases of Class A and Class T shares.
For the period, sales charge amounts retained by FDC were as follows:
|
| | | | | Retained |
| | | | | by FDC |
| Class A | | $ | | 27,118 |
| Class T | | | | 4,512 |
| Class B* | | | | 40,399 |
| Class C* | | | | 723 |
| | | $ | | 72,752 |
* When Class B and Class C shares are initially sold, FDC pays commissions from its own resources to financial intermediaries through which the sales are made.
Transfer Agent Fees. Fidelity Investments Institutional Operations Company, Inc. (FIIOC), an affiliate of FMR, is the transfer, dividend disbursing and shareholder servicing agent for each class of the fund. FIIOC receives account fees and asset-based fees that vary according to the account size and type of account of the shareholders of the respective classes of the fund. FIIOC pays for typesetting, printing and mailing of shareholder reports, except proxy statements. For the period the total transfer agent fees paid by each class to FIIOC, were as follows:
| | | | | | | % of |
| | | | | | | Average |
| | | | | Amount | | Net Assets |
| Class A | | $ | | 55,054 | | .40 |
| Class T | | | | 69,351 | | .43 |
| Class B | | | | 76,798 | | .43 |
| Class C | | | | 25,922 | | .36 |
| Institutional Class | | | | 4,708 | | .45 |
| |
| | | $ | | 231,833 | | |
Accounting and Security Lending Fees. Fidelity Service Company, Inc. (FSC), an affiliate of FMR, maintains the fund’s accounting records. The
accounting fee is based on the level of average net assets for the month. Under a separate contract, FSC administers the security lending program. The
security lending fee is based on the number and duration of lending transactions.
Central Funds. The fund may invest in affiliated Central Funds managed by Fidelity Investments Money Management, Inc. (FIMM), affiliate of FMR.
The Central Funds are open-end investment companies available only to investment companies and other accounts managed by FMR and its affiliates.
The Money Market Central Funds seek preservation of capital and current income. The Central Funds do not pay a management fee. Income distribu-
tions earned by the fund are recorded as income in the accompanying financial statements and totaled $45,795 for the period.
Brokerage Commissions. The fund placed a portion of its portfolio transactions with brokerage firms which are affiliates of the investment adviser.
The commissions paid to these affiliated firms were $2,405 for the period.
5. Committed Line of Credit.
The fund participates with other funds managed by FMR in a $4.2 billion credit facility (the “line of credit”) to be utilized for temporary or emergency
purposes to fund shareholder redemptions or for other short-term liquidity purposes. The fund has agreed to pay commitment fees on its pro rata
portion of the line of credit. During the period, there were no borrowings on this line of credit.
6. Security Lending.
The fund lends portfolio securities from time to time in order to earn additional income. The fund receives collateral (in the form of U.S. Treasury
obligations, letters of credit and/or cash) against the loaned securities and maintains collateral in an amount not less than 100% of the market value of
the loaned securities during the period of the loan. The market value of the loaned securities is determined at the close of business of the fund and any
additional required collateral is delivered to the fund on the next business day. If the borrower defaults on its obligation to return the securities loaned
because of insolvency or other reasons, a fund could experience delays and costs in recovering the securities loaned or in gaining access to the
collateral. Cash collateral is invested in the Fidelity Securities Lending Cash Central Fund. At period end there were no security loans outstanding.
|
A-31 Annual Report
| | Notes to Financial Statements - continued
7. Expense Reductions.
FMR voluntarily agreed to reimburse each class to the extent annual operating expenses exceeded certain levels of average net assets as noted in the
table below. Some expenses, for example interest expense, are excluded from this reimbursement.
The following classes were in reimbursement during the period:
|
| | | Expense | | | | Reimbursement |
| | | Limitations | | | | from adviser |
| Class A | | 1.50% | | -- 1.40%* | | $ | | 3,375 |
| Class T | | 1.75% | | -- 1.65%* | | | | 8,638 |
| Class B | | 2.25% | | -- 2.15%* | | | | 9,451 |
| Class C | | 2.25% | | -- 2.15%* | | | | 130 |
| Institutional Class | | 1.25% | | -- 1.15%* | | | | 684 |
| |
| | | | | | | $ | | 22,278 |
* Expense limitation in effect at period end.
| | Many of the brokers with whom FMR places trades on behalf of the fund provided services to the fund in addition to trade execution. These services
included payments of certain expenses on behalf of the fund totaling $15,179 for the period. In addition, through arrangements with the fund’s custo-
dian, credits realized as a result of uninvested cash balances were used to reduce the fund’s expenses. During the period, these credits reduced the
fund’s custody expenses by $5.
8. Other.
The fund’s organizational documents provide former and current trustees and officers with a limited indemnification against liabilities arising in
connection with the performance of their duties to the fund. In the normal course of business, the fund may also enter into contracts that provide
general indemnifications. The fund’s maximum exposure under these arrangements is unknown as this would be dependent on future claims that may
be made against the fund. The risk of material loss from such claims is considered remote.
9. Distributions to Shareholders.
Distributions to shareholders of each class were as follows:
|
| Years ended July 31, | | 2005 | | | | 2004 | | |
| From net realized gain | | | | | | | | |
| Class A | | $ 428,722 | | $ | | | | — |
| Class T | | 574,417 | | | | | | — |
| Class B | | 656,667 | | | | | | — |
| Class C | | 265,179 | | | | | | — |
| Institutional Class | | 32,970 | | | | | | — |
| Total | | $ 1,957,955 | | $ | | | | — |
Consumer Industries A-32
10. Share Transactions.
Transactions for each class of shares were as follows:
|
| | | | | Shares | | | | | | Dollars | | |
| Years ended July 31, | | 2005 | | | | 2004 | | 2005 | | | | 2004 |
| Class A | | | | | | | | | | | | |
| Shares sold | | 482,465 | | | | 362,299 | | $ 7,543,570 | | $ | | 5,424,551 |
| Reinvestment of distributions | | 26,992 | | | | — | | 380,585 | | | | — |
| Shares redeemed | | (250,204) | | | | (209,272) | | (3,816,608) | | | | (3,099,528) |
| Net increase (decrease) | | 259,253 | | | | 153,027 | | $ 4,107,547 | | $ | | 2,325,023 |
| Class T | | | | | | | | | | | | |
| Shares sold | | 253,353 | | | | 372,905 | | $ 3,867,037 | | $ | | 5,380,121 |
| Reinvestment of distributions | | 38,833 | | | | — | | 538,224 | | | | — |
| Shares redeemed | | (352,192) | | | | (296,211) | | (5,340,776) | | | | (4,343,994) |
| Net increase (decrease) | | (60,006) | | | | 76,694 | | $ (935,515) | | $ | | 1,036,127 |
| Class B | | | | | | | | | | | | |
| Shares sold | | 244,951 | | | | 317,001 | | $ 3,583,578 | | $ | | 4,519,412 |
| Reinvestment of distributions | | 43,290 | | | | — | | 576,619 | | | | — |
| Shares redeemed | | (337,303) | | | | (277,375) | | (4,889,935) | | | | (3,946,551) |
| Net increase (decrease) | | (49,062) | | | | 39,626 | | $ (729,738) | | $ | | 572,861 |
| Class C | | | | | | | | | | | | |
| Shares sold | | 159,223 | | | | 145,559 | | $ 2,344,716 | | $ | | 2,089,237 |
| Reinvestment of distributions | | 16,994 | | | | — | | 226,706 | | | | — |
| Shares redeemed | | (139,563) | | | | (153,637) | | (2,002,889) | | | | (2,161,430) |
| Net increase (decrease) | | 36,654 | | | | (8,078) | | $ 568,533 | | $ | | (72,193) |
| Institutional Class | | | | | | | | | | | | |
| Shares sold | | 26,159 | | | | 20,688 | | $ 423,819 | | $ | | 317,524 |
| Reinvestment of distributions | | 1,868 | | | | — | | 26,919 | | | | — |
| Shares redeemed | | (8,711) | | | | (14,366) | | (138,495) | | | | (216,750) |
| Net increase (decrease) | | 19,316 | | | | 6,322 | | $ 312,243 | | $ | | 100,774 |
A-33 Annual Report
| | Advisor Cyclical Industries Fund — Class A, T, B, and C
Performance
|
Average annual total return reflects the change in the value of an investment, assuming reinvestment of the class’ dividend income and capital gains (the profits earned upon the sale of securities that have grown in value) and assuming a constant rate of performance each year. The $10,000 table and the fund’s returns do not reflect the deduction of taxes that a shareholder would pay on fund distributions or the redemption of fund shares. During periods of reimbursement by Fidelity, a fund’s total return will be greater than it would be had the reimbursement not occurred. How a fund did yesterday is no guarantee of how it will do tomorrow. Returns may reflect the conversion of Class B shares to Class A shares after a maximum of seven years.
| Average Annual Total Returns | | | | |
| Periods ended July 31, 2005 | | Past 1 | | Past 5 | | Life of |
| | | year | | years | | fundA |
| Class A (incl. 5.75% sales charge) | | 17.85% | | 10.21% | | 11.32% |
| Class T (incl. 3.50% sales charge) | | 20.41% | | 10.49% | | 11.37% |
| Class B (incl. contingent deferred | | | | | | |
| sales charge)B | | 19.12% | | 10.42% | | 11.40% |
| Class C (incl. contingent deferred | | | | | | |
| sales charge)C | | 23.16% | | 10.76% | | 11.26% |
A From September 3, 1996.
B Class B shares bear a 1.00% 12b-1 fee. The initial offering of Class B shares took place
on March 3, 1997. Returns prior to March 3, 1997 are those of Class T and reflect a 0.50%
12b-1 fee. Had Class B shares’ 12b-1 fee been reflected, returns prior to March 3, 1997
would have been lower. Class B shares contingent deferred sales charges included in the
past one year, five year and life of fund total return figures are 5%, 2%, and 0%,
respectively.
C Class C shares bear a 1.00% 12b-1 fee. The initial offering of Class C shares took place
on November 3, 1997. Returns between March 3, 1997 and November 3, 1997 are those of
Class B shares and reflect Class B shares’ 1.00% 12b-1 fee. Returns prior to March 3, 1997
are those of Class T and reflect a 0.50% 12b-1 fee. Had Class C shares’ 12b-1 fee been
reflected, returns prior to March 3, 1997 would have been lower. Class C shares’ contin-
gent deferred sales charges included in the past one year, five year and life of fund total
return figures are 1%, 0%, and 0%, respectively.
|
$10,000 Over Life of Fund
Let’s say hypothetically that $10,000 was invested in Fidelity Advisor
Cyclical Industries Fund — Class T on September 3, 1996, when the
fund started, and the current 3.50% sales charge was paid. The chart
shows how the value of your investment would have changed, and also
shows how the S&P 500 Index performed over the same period.
|
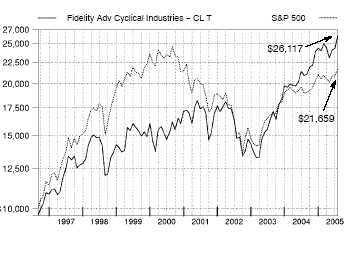
Cyclical Industries A-34
A-34
Advisor Cyclical Industries Fund
|
Management’s Discussion of Fund Performance
Comments from Matthew Friedman, Portfolio Manager of Fidelity® Advisor Cyclical Industries Fund
A late-inning rally on Wall Street helped push some key U.S. equity indexes to four-year highs by the conclusion of the 12-month period ending July 31, 2005. Spurred on by bullish economic data and strong corporate earnings, investors enjoyed a stellar month of July, capping off a turbulent 12-month period for U.S. equity markets. Stock prices bounced up and down during most of the year, moving in cadence with gyrations in the price of crude oil and investors’ gathering and ebbing concerns about inflation. The Federal Reserve Board raised short-term interest rates eight times during the period, also affecting overall market sentiment. Despite their fluctuations, the major equity indexes finished on a high note, with the Standard & Poor’s 500SM Index and the NASDAQ Composite® Index posting gains of 14.05% and 16.51%, respectively, for the period. The small-cap Russell 2000® Index rose 24.78% and the Russell Midcap® Index jumped 28.93%, while the blue-chips’ Dow Jones Industrial AverageSM advanced only 7.29% .
For the 12 months that ended July 31, 2005, the fund’s Class A, Class T, Class B and Class C shares returned 25.04%, 24.78%, 24.12% and 24.16%, respectively, topping the Goldman Sachs® Cyclical Industries Index, which returned 17.16%, and the S&P 500®. Stock selection was key to the fund’s outperformance of the sector index. Among the top contributors were Lyondell Chemical and Millennium Chemicals, both of which enjoyed robust profits. The stocks rose further when the companies merged in December 2004. Investments in homebuilders KB Home, Ryland Group and Toll Brothers helped returns when the group generated strong earnings. Aerospace companies BE Aerospace and Precision Castparts benefited from pent-up demand for new aircraft. The fund’s lack of exposure to poorly performing U.S. auto manufacturers — a large component of the sector index — also was positive. Conversely, a sizable position in Dycom Industries, which supplies video cable trenches for telephone companies, underperformed in response to lackluster demand. Also, the fund wasn’t invested in other homebuilders — including index components Centex, Pulte and Lennar —that performed well. Elsewhere, Honeywell and Maytag underperformed in response to margin pressures.
The views expressed in this statement reflect those of the portfolio manager only through the end of the period of the report as stated on the cover and do not necessarily represent the views of Fidelity or any other person in the Fidelity organization. Any such views are subject to change at any time based upon market or other conditions and Fidelity disclaims any responsibility to update such views. These views may not be relied on as investment advice and, because investment decisions for a Fidelity fund are based on numerous factors, may not be relied on as an indication of trading intent on behalf of any Fidelity fund.
Advisor Cyclical Industries Fund
Shareholder Expense Example
|
As a shareholder of the Fund, you incur two types of costs: (1) transaction costs, including sales charges (loads) on purchase payments or redemption proceeds, redemption fees, and (2) ongoing costs, including management fees, distribution and/or service (12b-1) fees and other Fund expenses. This Example is intended to help you understand your ongoing costs (in dollars) of investing in the Fund and to compare these costs with the ongoing costs of investing in other mutual funds.
The Example is based on an investment of $1,000 invested at the beginning of the period and held for the entire period (February 1, 2005 to July 31, 2005).
The first line of the table below for each class of the Fund provides information about actual account values and actual expenses. You may use the information in this line, together with the amount you invested, to estimate the expenses that you paid over the period. Simply divide your account value by $1,000.00 (for example, an $8,600 account value divided by $1,000.00 = 8.6), then multiply the result by the number in the first line for a class of the Fund under the heading entitled “Expenses Paid During Period” to estimate the expenses you paid on your account during this period.
Hypothetical Example for Comparison Purposes
|
The second line of the table below for each class of the Fund provides information about hypothetical account values and hypothetical expenses based on a Class’ actual expense ratio and an assumed rate of return of 5% per year before expenses, which is not the Class’ actual return. The hypothetical account values and expenses may not be used to estimate the actual ending account balance or expenses you paid for the period. You may use this information to compare the ongoing costs of investing in the Fund and other funds. To do so, compare this 5% hypothetical example with the 5% hypothetical examples that appear in the shareholder reports of the other funds.
Please note that the expenses shown in the table are meant to highlight your ongoing costs only and do not reflect any transaction costs. Therefore, the second line of the table is useful in comparing ongoing costs only, and will not help you determine the relative total costs of owning different funds. In addition, if these transactional costs were included, your costs would have been higher.
| | | | | | | | | Expenses Paid |
| | | Beginning | | | | Ending | | During Period* |
| | | Account Value | | | | Account Value | | February 1, 2005 |
| | | February 1, 2005 | | | | July 31, 2005 | | to July 31, 2005 |
| Class A | | | | | | | | | | |
| Actual | | $ 1,000.00 | | $ | | 1,089.00 | | $ | | 6.73 |
| HypotheticalA | | $ 1,000.00 | | $ | | 1,018.35 | | $ | | 6.51 |
| Class T | | | | | | | | | | |
| Actual | | $ 1,000.00 | | $ | | 1,088.00 | | $ | | 7.92 |
| HypotheticalA | | $ 1,000.00 | | $ | | 1,017.21 | | $ | | 7.65 |
| Class B | | | | | | | | | | |
| Actual | | $ 1,000.00 | | $ | | 1,084.40 | | $ | | 10.70 |
| HypotheticalA | | $ 1,000.00 | | $ | | 1,014.53 | | $ | | 10.34 |
| Class C | | | | | | | | | | |
| Actual | | $ 1,000.00 | | $ | | 1,085.00 | | $ | | 10.49 |
| HypotheticalA | | $ 1,000.00 | | $ | | 1,014.73 | | $ | | 10.14 |
| Institutional Class | | | | | | | | | | |
| Actual | | $ 1,000.00 | | $ | | 1,090.50 | | $ | | 5.24 |
| HypotheticalA | | $ 1,000.00 | | $ | | 1,019.79 | | $ | | 5.06 |
| |
| A 5% return per year before expenses | | | | | | | | | | |
* Expenses are equal to each Class’ annualized expense ratio (shown in the table below); multiplied by the average account value over the period, multiplied by 181/365 (to reflect the one-half year period).
| | | Annualized |
| | | Expense Ratio |
| Class A | | 1.30% |
| Class T | | 1.53% |
| Class B | | 2.07% |
| Class C | | 2.03% |
| Institutional Class | | 1.01% |
| | Advisor Cyclical Industries Fund
Investment Changes
|
| Top Ten Stocks as of July 31, 2005 | | |
| | | % of fund’s | | % of fund’s net assets |
| | | net assets | | 6 months ago |
| Honeywell International, Inc. | | 3.3 | | 3.1 |
| Tyco International Ltd. | | 3.3 | | 4.9 |
| General Electric Co. | | 2.6 | | 4.6 |
| Dow Chemical Co. | | 2.5 | | 1.7 |
| The Boeing Co. | | 2.4 | | 2.3 |
| Caterpillar, Inc. | | 2.1 | | 0.5 |
| 3M Co. | | 2.1 | | 2.7 |
| Fluor Corp. | | 1.9 | | 0.2 |
| Toll Brothers, Inc. | | 1.9 | | 1.5 |
| Burlington Northern Santa Fe Corp. | | 1.8 | | 1.1 |
| | | 23.9 | | |
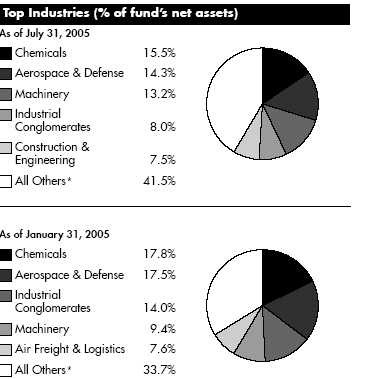
* Includes short term investments and net other assets.
Prior period industry classifications reflect the categories in place as of the date
indicated and have not been adjusted to reflect current industry classifications.
|
A-37 A-37 Annual Report
| | Advisor Cyclical Industries Fund
Investments July 31, 2005
Showing Percentage of Net Assets
|
| Common Stocks — 99.0% | | | | | | |
| | | Shares | | Value (Note 1) |
| |
| AEROSPACE & DEFENSE – 14.3% | | | | | | |
| Aerospace & Defense – 14.3% | | | | | | |
| BE Aerospace, Inc. (a) | | 57,000 | | $ | | 999,210 |
| EADS NV | | 8,879 | | | | 298,535 |
| EDO Corp. | | 24,040 | | | | 741,634 |
| Embraer – Empresa Brasileira de | | | | | | |
| Aeronautica SA sponsored ADR | | 300 | | | | 9,702 |
| Essex Corp. (a) | | 2,700 | | | | 56,565 |
| General Dynamics Corp. | | 2,800 | | | | 322,532 |
| Goodrich Corp. | | 9,200 | | | | 407,008 |
| Hexcel Corp. (a) | | 50,700 | | | | 876,096 |
| Honeywell International, Inc. | | 116,600 | | | | 4,580,047 |
| L-3 Communications Holdings, Inc. | | 11,400 | | | | 891,822 |
| Lockheed Martin Corp. | | 14,514 | | | | 905,674 |
| Precision Castparts Corp. | | 12,700 | | | | 1,142,746 |
| Raytheon Co. | | 33,300 | | | | 1,309,689 |
| Rockwell Collins, Inc. | | 33,040 | | | | 1,612,352 |
| Rolls-Royce Group PLC | | 383 | | | | 2,252 |
| The Boeing Co. | | 50,100 | | | | 3,307,101 |
| United Technologies Corp. | | 43,100 | | | | 2,185,170 |
| | | | | | | 19,648,135 |
| |
| AIR FREIGHT & LOGISTICS – 6.0% | | | | | | |
| Air Freight & Logistics – 6.0% | | | | | | |
| C.H. Robinson Worldwide, Inc. | | 13,900 | | | | 869,723 |
| EGL, Inc. (a) | | 36,500 | | | | 734,745 |
| Expeditors International of Washington, | | | | | | |
| Inc. | | 12,800 | | | | 704,640 |
| FedEx Corp. | | 29,800 | | | | 2,505,882 |
| Forward Air Corp. | | 12,020 | | | | 418,897 |
| Hub Group, Inc. Class A (a) | | 25,636 | | | | 794,203 |
| Park-Ohio Holdings Corp. (a) | | 17,700 | | | | 359,664 |
| United Parcel Service, Inc. Class B | | 15,300 | | | | 1,116,441 |
| UTI Worldwide, Inc. | | 10,000 | | | | 713,600 |
| | | | | | | 8,217,795 |
| |
| AIRLINES – 1.8% | | | | | | |
| Airlines – 1.8% | | | | | | |
| AirTran Holdings, Inc. (a) | | 141,600 | | | | 1,619,904 |
| Alaska Air Group, Inc. (a) | | 4,400 | | | | 153,912 |
| AMR Corp. (a) | | 32,900 | | | | 462,245 |
| JetBlue Airways Corp. (a) | | 14,600 | | | | 306,600 |
| | | | | | | 2,542,661 |
| |
| AUTO COMPONENTS – 2.8% | | | | | | |
| Auto Parts & Equipment – 2.8% | | | | | | |
| American Axle & Manufacturing | | | | | | |
| Holdings, Inc. | | 23,500 | | | | 647,425 |
| Amerigon, Inc. (a) | | 21,800 | | | | 96,792 |
| BorgWarner, Inc. | | 7,800 | | | | 453,726 |
| Delphi Corp. | | 66,200 | | | | 350,860 |
| Johnson Controls, Inc. | | 7,400 | | | | 425,056 |
| Lear Corp. | | 24,300 | | | | 1,039,311 |
| | | Shares | | Value (Note 1) |
| Midas, Inc. (a) | | 15,700 | | $ | | 363,141 |
| Tenneco Automotive, Inc. (a) | | 22,100 | | | | 416,806 |
| | | | | | | 3,793,117 |
| |
| AUTOMOBILES – 0.9% | | | | | | |
| Automobile Manufacturers – 0.9% | | | | | | |
| Honda Motor Co. Ltd. sponsored ADR | | 10,300 | | | | 265,431 |
| National R.V. Holdings, Inc. (a) | | 27,800 | | | | 212,670 |
| Renault SA | | 4,700 | | | | 430,826 |
| Toyota Motor Corp. sponsored ADR | | 3,500 | | | | 265,510 |
| | | | | | | 1,174,437 |
| |
| BUILDING PRODUCTS – 1.7% | | | | | | |
| Building Products – 1.7% | | | | | | |
| American Standard Companies, Inc. | | 8,600 | | | | 380,808 |
| Masco Corp. | | 30,200 | | | | 1,024,082 |
| Quixote Corp. | | 18,951 | | | | 385,274 |
| Trex Co., Inc. (a) | | 8,200 | | | | 241,080 |
| York International Corp. | | 7,700 | | | | 329,021 |
| | | | | | | 2,360,265 |
| |
| CHEMICALS – 15.5% | | | | | | |
| Commodity Chemicals – 1.9% | | | | | | |
| Celanese Corp. Class A | | 25,900 | | | | 487,438 |
| Georgia Gulf Corp. | | 9,600 | | | | 304,608 |
| Lyondell Chemical Co. | | 428 | | | | 11,958 |
| NOVA Chemicals Corp. | | 22,700 | | | | 796,127 |
| Pioneer Companies, Inc. (a) | | 22,800 | | | | 553,356 |
| Spartech Corp. | | 22,400 | | | | 419,552 |
| | | | | | | 2,573,039 |
| Diversified Chemicals – 4.5% | | | | | | |
| Ashland, Inc. | | 14,600 | | | | 897,170 |
| Dow Chemical Co. | | 72,100 | | | | 3,457,195 |
| Eastman Chemical Co. | | 5,400 | | | | 299,106 |
| FMC Corp. (a) | | 25,700 | | | | 1,554,336 |
| | | | | | | 6,207,807 |
| Fertilizers & Agricultural Chemicals – 2.6% | | | | | | |
| Agrium, Inc. | | 22,300 | | | | 509,985 |
| Monsanto Co. | | 18,200 | | | | 1,226,134 |
| Mosaic Co. (a) | | 59,251 | | | | 1,030,967 |
| Potash Corp. of Saskatchewan | | 8,400 | | | | 893,891 |
| | | | | | | 3,660,977 |
| Industrial Gases – 3.6% | | | | | | |
| Air Products & Chemicals, Inc. | | 33,900 | | | | 2,025,864 |
| Airgas, Inc. | | 42,400 | | | | 1,250,800 |
| Praxair, Inc. | | 33,800 | | | | 1,669,382 |
| | | | | | | 4,946,046 |
| Specialty Chemicals – 2.9% | | | | | | |
| Albemarle Corp. | | 13,700 | | | | 521,970 |
| Chemtura Corp. | | 58,594 | | | | 922,270 |
| Cytec Industries, Inc. | | 8,800 | | | | 399,344 |
| Ecolab, Inc. | | 21,300 | | | | 715,254 |
| Ferro Corp. | | 4,100 | | | | 92,250 |
See accompanying notes which are an integral part of the financial statements.
Cyclical Industries A-38
| Common Stocks – continued | | | | | | |
| | | Shares | | Value (Note 1) |
| |
| CHEMICALS – CONTINUED | | | | | | |
| Specialty Chemicals – continued | | | | | | |
| H.B. Fuller Co. | | 19,000 | | $ | | 656,070 |
| Lubrizol Corp. | | 13,100 | | | | 576,400 |
| Minerals Technologies, Inc. | | 1,500 | | | | 93,360 |
| Rohm & Haas Co. | | 200 | | | | 9,212 |
| | | | | | | 3,986,130 |
| |
| TOTAL CHEMICALS | | | | | | 21,373,999 |
| |
| COMMERCIAL SERVICES & SUPPLIES – 2.2% | | | | | | |
| Diversified Commercial & Professional Services – 0.5% | | | | |
| CRA International, Inc. (a) | | 5,700 | | | | 303,240 |
| LECG Corp. (a) | | 15,900 | | | | 343,679 |
| | | | | | | 646,919 |
| Environmental & Facility Services – 0.8% | | | | | | |
| Waste Connections, Inc. (a) | | 15,050 | | | | 541,800 |
| Waste Management, Inc. | | 2,000 | | | | 56,240 |
| Waste Services, Inc. (a) | | 120,100 | | | | 468,390 |
| | | | | | | 1,066,430 |
| Human Resource & Employment Services – 0.8% | | | | |
| CDI Corp. | | 14,200 | | | | 348,894 |
| Robert Half International, Inc. | | 22,400 | | | | 759,136 |
| | | | | | | 1,108,030 |
| Office Services & Supplies – 0.1% | | | | | | |
| Herman Miller, Inc. | | 6,800 | | | | 217,124 |
| |
| TOTAL COMMERCIAL SERVICES & SUPPLIES | | | | 3,038,503 |
| |
| COMMUNICATIONS EQUIPMENT – 0.6% | | | | | | |
| Communications Equipment – 0.6% | | | | | | |
| Harris Corp. | | 21,200 | | | | 785,884 |
| CONSTRUCTION & ENGINEERING – 7.5% | | | | | | |
| Construction & Engineering – 7.5% | | | | | | |
| Chicago Bridge & Iron Co. NV (NY | | | | | | |
| Shares) | | 39,400 | | | | 1,101,230 |
| Comfort Systems USA, Inc. (a) | | 43,400 | | | | 336,350 |
| Dycom Industries, Inc. (a) | | 40,800 | | | | 995,520 |
| Fluor Corp. | | 41,800 | | | | 2,666,840 |
| Foster Wheeler Ltd. (a) | | 32,920 | | | | 760,452 |
| Granite Construction, Inc. | | 21,600 | | | | 739,152 |
| Jacobs Engineering Group, Inc. (a) | | 12,700 | | | | 747,776 |
| Perini Corp. (a) | | 38,400 | | | | 676,224 |
| Shaw Group, Inc. (a) | | 65,600 | | | | 1,254,272 |
| SNC-Lavalin Group, Inc. | | 11,700 | | | | 672,271 |
| URS Corp. (a) | | 1,000 | | | | 37,450 |
| Washington Group International, Inc. (a) | | 5,800 | | | | 312,852 |
| | | | | | | 10,300,389 |
| | | Shares | | Value (Note 1) |
| |
| CONSTRUCTION MATERIALS – 1.5% | | | | | | |
| Construction Materials – 1.5% | | | | | | |
| Lafarge North America, Inc. | | 24 | | $ | | 1,675 |
| Martin Marietta Materials, Inc. | | 14,400 | | | | 1,046,736 |
| Texas Industries, Inc. | | 179 | | | | 13,180 |
| Vulcan Materials Co. | | 14,700 | | | | 1,032,528 |
| | | | | | | 2,094,119 |
| |
| CONTAINERS & PACKAGING – 0.8% | | | | | | |
| Metal & Glass Containers – 0.8% | | | | | | |
| Owens-Illinois, Inc. (a) | | 40,200 | | | | 1,031,130 |
| DIVERSIFIED CONSUMER SERVICES – 0.1% | | | | | | |
| Education Services – 0.1% | | | | | | |
| Education Management Corp. (a) | | 5,200 | | | | 180,700 |
| ELECTRICAL EQUIPMENT – 1.9% | | | | | | |
| Electrical Components & Equipment – 1.4% | | | | | | |
| AMETEK, Inc. | | 5,900 | | | | 243,080 |
| C&D Technologies, Inc. | | 20,100 | | | | 202,407 |
| Emerson Electric Co. | | 100 | | | | 6,580 |
| NEOMAX Co. Ltd. | | 15,000 | | | | 318,156 |
| Rockwell Automation, Inc. | | 9,800 | | | | 504,798 |
| Roper Industries, Inc. | | 8,600 | | | | 660,050 |
| | | | | | | 1,935,071 |
| Heavy Electrical Equipment – 0.5% | | | | | | |
| ABB Ltd. sponsored ADR (a) | | 43,200 | | | | 294,192 |
| Shanghai Electric (Group) Corp. | | | | | | |
| (H Shares) | | 1,748,000 | | | | 436,235 |
| | | | | | | 730,427 |
| |
| TOTAL ELECTRICAL EQUIPMENT | | | | | | 2,665,498 |
| |
| ELECTRONIC EQUIPMENT & INSTRUMENTS – 0.1% | | | | |
| Electronic Equipment & Instruments – 0.1% | | | | | | |
| FARO Technologies, Inc. (a) | | 4,000 | | | | 94,720 |
| HEALTH CARE EQUIPMENT & SUPPLIES – 0.1% | | | | |
| Health Care Equipment – 0.1% | | | | | | |
| Varian, Inc. (a) | | 2,700 | | | | 101,169 |
| HOUSEHOLD DURABLES – 7.0% | | | | | | |
| Consumer Electronics – 0.2% | | | | | | |
| Harman International Industries, Inc. | | 3,200 | | | | 275,040 |
| Home Furnishings – 1.1% | | | | | | |
| Interface, Inc. Class A (a) | | 115,440 | | | | 1,178,642 |
| Tempur-Pedic International, Inc. (a)(d) | | 18,700 | | | | 321,827 |
| | | | | | | 1,500,469 |
| Homebuilding – 5.7% | | | | | | |
| Champion Enterprises, Inc. (a) | | 31,800 | | | | 383,508 |
| D.R. Horton, Inc. | | 30,700 | | | | 1,261,156 |
| KB Home | | 26,100 | | | | 2,137,851 |
See accompanying notes which are an integral part of the financial statements.
A-39 A-39 Annual Report
Advisor Cyclical Industries Fund
Investments - continued
|
| Common Stocks – continued | | | | |
| | | Shares | | Value (Note 1) |
| |
| HOUSEHOLD DURABLES – CONTINUED | | | | |
| Homebuilding – continued | | | | |
| Ryland Group, Inc. | | 19,400 | | $ 1,567,520 |
| Toll Brothers, Inc. (a) | | 46,400 | | 2,571,488 |
| | | | | 7,921,523 |
| |
| TOTAL HOUSEHOLD DURABLES | | | | 9,697,032 |
| |
| INDUSTRIAL CONGLOMERATES – 8.0% | | | | |
| Industrial Conglomerates – 8.0% | | | | |
| 3M Co. | | 38,260 | | 2,869,500 |
| General Electric Co. | | 102,400 | | 3,532,800 |
| Tyco International Ltd. | | 149,900 | | 4,567,453 |
| | | | | 10,969,753 |
| |
| IT SERVICES – 0.2% | | | | |
| IT Consulting & Other Services – 0.2% | | | | |
| Anteon International Corp. (a) | | 5,000 | | 234,750 |
| SI International, Inc. (a) | | 700 | | 22,057 |
| | | | | 256,807 |
| |
| MACHINERY – 13.2% | | | | |
| Construction & Farm Machinery & Heavy Trucks – 8.9% | | |
| A.S.V., Inc. (a) | | 3,500 | | 167,825 |
| Astec Industries, Inc. (a) | | 2,200 | | 63,778 |
| Bucyrus International, Inc. Class A | | 24,100 | | 1,027,142 |
| Caterpillar, Inc. | | 54,000 | | 2,911,140 |
| Daewoo Shipbuilding & Marine | | | | |
| Engineering Co. Ltd. | | 18,310 | | 347,126 |
| Deere & Co. | | 31,300 | | 2,301,489 |
| Freightcar America, Inc. | | 27,500 | | 881,650 |
| Joy Global, Inc. | | 52,600 | | 2,160,282 |
| Manitowoc Co., Inc. | | 20,800 | | 949,520 |
| Navistar International Corp. (a) | | 16,140 | | 551,181 |
| PACCAR, Inc. | | 150 | | 10,833 |
| Samsung Heavy Industries Ltd. | | 33,670 | | 386,615 |
| Toro Co. | | 3,400 | | 136,816 |
| Wabash National Corp | | 12,300 | | 264,573 |
| | | | | 12,159,970 |
| Industrial Machinery – 4.3% | | | | |
| Actuant Corp. Class A (a) | | 9,500 | | 442,035 |
| Albany International Corp. Class A | | 10,100 | | 353,904 |
| Briggs & Stratton Corp. | | 3,000 | | 112,110 |
| Danaher Corp. | | 17,000 | | 942,650 |
| Dover Corp. | | 24,700 | | 1,019,122 |
| Hardinge, Inc. | | 13,570 | | 207,621 |
| ITT Industries, Inc. | | 12,700 | | 1,351,280 |
| Kennametal, Inc. | | 3 | | 143 |
| Pall Corp. | | 200 | | 6,194 |
| Pentair, Inc. | | 7,000 | | 281,190 |
| | | Shares | | Value (Note 1) |
| Timken Co. | | 21,500 | | $ | | 569,105 |
| Watts Water Technologies, Inc. Class A . | | 18,500 | | | | 675,250 |
| | | | | | | 5,960,604 |
| |
| TOTAL MACHINERY | | | | | | 18,120,574 |
| |
| MARINE – 2.6% | | | | | | |
| Marine – 2.6% | | | | | | |
| Alexander & Baldwin, Inc. | | 7,920 | | | | 423,562 |
| Camillo Eitzen & Co. ASA | | 700 | | | | 7,226 |
| Diana Shipping, Inc. | | 19,500 | | | | 253,305 |
| DryShips, Inc. | | 900 | | | | 12,870 |
| Excel Maritime Carriers Ltd. (a) | | 700 | | | | 9,002 |
| Golden Ocean Group Ltd. (a) | | 1,400 | | | | 854 |
| Odfjell ASA (A Shares) | | 71,300 | | | | 1,461,144 |
| Stolt-Nielsen SA | | 41,000 | | | | 1,408,772 |
| | | | | | | 3,576,735 |
| |
| METALS & MINING – 0.2% | | | | | | |
| Steel – 0.2% | | | | | | |
| Carpenter Technology Corp. | | 5,300 | | | | 331,992 |
| OIL, GAS & CONSUMABLE FUELS – 0.9% | | | | | | |
| Coal & Consumable Fuels – 0.2% | | | | | | |
| Massey Energy Co. | | 5,100 | | | | 220,575 |
| Oil & Gas Storage & Transport – 0.7% | | | | | | |
| General Maritime Corp. | | 9,200 | | | | 358,708 |
| OMI Corp. | | 36,800 | | | | 663,504 |
| | | | | | | 1,022,212 |
| |
| TOTAL OIL, GAS & CONSUMABLE FUELS | | | | | | 1,242,787 |
| |
| ROAD & RAIL – 6.7% | | | | | | |
| Railroads – 5.4% | | | | | | |
| Burlington Northern Santa Fe Corp. | | 46,500 | | | | 2,522,625 |
| Canadian National Railway Co. | | 21,600 | | | | 1,431,649 |
| Canadian Pacific Railway Ltd. | | 25,600 | | | | 993,180 |
| Norfolk Southern Corp. | | 66,000 | | | | 2,455,860 |
| | | | | | | 7,403,314 |
| Trucking – 1.3% | | | | | | |
| Laidlaw International, Inc. | | 39,300 | | | | 1,010,010 |
| Landstar System, Inc. (a) | | 22,608 | | | | 753,299 |
| | | | | | | 1,763,309 |
| |
| TOTAL ROAD & RAIL | | | | | | 9,166,623 |
| |
| SPECIALTY RETAIL – 0.4% | | | | | | |
| Home Improvement Retail – 0.4% | | | | | | |
| Sherwin-Williams Co. | | 12,800 | | | | 609,408 |
| TRADING COMPANIES & DISTRIBUTORS – 2.0% | | | | |
| Trading Companies & Distributors – 2.0% | | | | | | |
| Finning International, Inc. | | 10,800 | | | | 335,022 |
| MSC Industrial Direct Co., Inc. Class A | | 29,900 | | | | 1,156,831 |
See accompanying notes which are an integral part of the financial statements.
Cyclical Industries A-40
| Common Stocks – continued | | | | |
| | | Shares | | Value (Note 1) |
| |
| TRADING COMPANIES & DISTRIBUTORS – CONTINUED | | |
| Trading Companies & Distributors – continued | | |
| United Rentals, Inc. (a) | | 15,100 | | $ 280,860 |
| WESCO International, Inc. (a) | | 30,600 | | 1,042,236 |
| | | | | 2,814,949 |
| |
| TOTAL COMMON STOCKS | | | | |
| (Cost $117,344,133) | | | | 136,189,181 |
| |
| Nonconvertible Preferred Stocks — 0.2% |
| |
| AUTOMOBILES – 0.2% | | | | |
| Automobile Manufacturers – 0.2% | | | | |
| Porsche AG (non-vtg.) | | | | |
| (Cost $295,648) | | 400 | | 317,195 |
| |
| Money Market Funds — 1.2% | | |
| |
| Fidelity Cash Central Fund, | | | | |
| 3.31% (b) | | 1,362,247 | | 1,362,247 |
| Fidelity Securities Lending Cash | | | | |
| Central Fund, 3.32% (b)(c) | | 317,900 | | 317,900 |
| TOTAL MONEY MARKET FUNDS | | | | |
| (Cost $1,680,147) | | | | 1,680,147 |
| |
| TOTAL INVESTMENT PORTFOLIO - 100.4% | | |
| (Cost $119,319,828) | | | | 138,186,523 |
| |
| NET OTHER ASSETS – (0.4)% | | | | (579,145) |
| NET ASSETS – 100% | | $ | | 137,607,378 |
Legend
(a) Non-income producing
(b) Affiliated fund that is available only to investment companies and other
accounts managed by Fidelity Investments. The rate quoted is the
annualized seven-day yield of the fund at period end. A complete listing
of the fund’s holdings as of its most recent quarter end is available upon
request.
(c) Investment made with cash collateral received from securities on loan.
(d) Security or a portion of the security is on loan at period end.
Other Information
Distribution of investments by country of issue, as a percentage of total net
assets, is as follows:
|
| United States of America | | 88.6% |
| Canada | | 4.1% |
| Norway | | 1.1% |
| Luxembourg | | 1.0% |
| Netherlands | | 1.0% |
| Others (individually less than 1%) | | 4.2% |
| | | 100.0% |
See accompanying notes which are an integral part of the financial statements.
A-41 A-41 Annual Report
| | Advisor Cyclical Industries Fund
Financial Statements
|
| Statement of Assets and Liabilities | | | | |
| | | | | | | | | July 31, 2005 |
| |
| Assets | | | | | | | | |
| Investment in securities, at value (in- | | | | | | |
| cluding securities loaned of | | | | | | | | |
| $321,827) (cost $119,319,928) — | | | | | | |
| See accompanying schedule | | | | | | $ | | 138,186,523 |
| Cash | | | | | | | | 2,939 |
| Receivable for investments sold | | | | | | | | 1,634,317 |
| Receivable for fund shares sold | | | | | | | | 692,753 |
| Dividends receivable | | | | | | | | 71,046 |
| Interest receivable | | | | | | | | 5,231 |
| Prepaid expenses | | | | | | | | 102 |
| Other affiliated receivables | | | | | | | | 27 |
| Other receivables | | | | | | | | 29,770 |
| Total assets | | | | | | | | 140,622,708 |
| Liabilities | | | | | | | | |
| Payable for investments purchased | | $ | | 2,331,130 | | | | |
| Payable for fund shares redeemed | | | | 163,761 | | | | |
| Accrued management fee | | | | 62,738 | | | | |
| Distribution fees payable | | | | 66,296 | | | | |
| Other affiliated payables | | | | 38,336 | | | | |
| Other payables and accrued expenses | | 35,169 | | | | |
| Collateral on securities loaned, at value | | 317,900 | | | | |
| Total liabilities | | | | | | | | 3,015,330 |
| Net Assets | | | | | | $ | | 137,607,378 |
| Net Assets consist of: | | | | | | | | |
| Paid in capital | | | | | | $ | | 112,161,586 |
| Accumulated net investment loss | | | | | | | | (15) |
| Accumulated undistributed net realized | | | | | | |
| gain (loss) on investments and for- | | | | | | |
| eign currency transactions | | | | | | | | 6,579,112 |
| Net unrealized appreciation (depreci- | | | | | | |
| ation) on investments and assets and | | | | | | |
| liabilities in foreign currencies | | | | | | | | 18,866,695 |
| Net Assets | | | | | | $ | | 137,607,378 |
| Calculation of Maximum Offering Price | | | | | | |
| Class A: | | | | | | | | |
| Net Asset Value and redemption | | | | | | | | |
| price per share ($40,264,044 ÷ | | | | | | |
| 1,870,031 shares) | | | | | | $ | | 21.53 |
| Maximum offering price per share | | | | | | | | |
| (100/94.25 of $21.53) | | | | | | $ | | 22.84 |
| Class T: | | | | | | | | |
| Net Asset Value and redemption | | | | | | | | |
| price per share ($40,126,357 ÷ | | | | | | |
| 1,886,791 shares) | | | | | | $ | | 21.27 |
| Maximum offering price per share | | | | | | | | |
| (100/96.50 of $21.27) | | | | | | $ | | 22.04 |
| Class B: | | | | | | | | |
| Net Asset Value and offering price | | | | | | |
| per share ($32,242,125 ÷ | | | | | | | | |
| 1,568,874 shares)A | | | | | | $ | | 20.55 |
| Class C: | | | | | | | | |
| Net Asset Value and offering price | | | | | | |
| per share ($20,595,499 ÷ | | | | | | | | |
| 995,982 shares)A | | | | | | $ | | 20.68 |
| Institutional Class: | | | | | | | | |
| Net Asset Value, offering price and | | | | | | |
| redemption price per share | | | | | | | | |
| ($4,379,353 ÷ 198,535 shares) | | | | $ | | 22.06 |
| Statement of Operations | | | | |
| | | | | Year ended July 31, 2005 |
| |
| Investment Income | | | | | | |
| Dividends | | | | $ | | 1,312,393 |
| Interest | | | | | | 66,594 |
| Security lending | | | | | | 7,432 |
| Total income | | | | | | 1,386,419 |
| |
| Expenses | | | | | | |
| Management fee | | $ | | 575,398 | | |
| Transfer agent fees | | | | 326,458 | | |
| Distribution fees | | | | 612,732 | | |
| Accounting and security lending | | | | | | |
| fees | | | | 43,053 | | |
| Independent trustees’ compensation | | 468 | | |
| Custodian fees and expenses | | | | 19,134 | | |
| Registration fees | | | | 75,710 | | |
| Audit | | | | 42,253 | | |
| Legal | | | | 283 | | |
| Miscellaneous | | | | 2,030 | | |
| Total expenses before reductions | | 1,697,519 | | |
| Expense reductions | | | | (47,581) | | 1,649,938 |
| |
| Net investment income (loss) | | | | | | (263,519) |
| Realized and Unrealized Gain (Loss) | | | | |
| Net realized gain (loss) on: | | | | | | |
| Investment securities | | | | 8,604,224 | | |
| Investment not meeting investment | | | | |
| restrictions | | | | (5,191) | | |
| Foreign currency transactions | | | | (4,999) | | |
| Payment from investment advisor | | | | |
| for loss on investment not meet- | | | | |
| ing investment restrictions | | | | 5,191 | | |
| Total net realized gain (loss) | | | | | | 8,599,225 |
| Change in net unrealized appreci- | | | | |
| ation (depreciation) on: | | | | | | |
| Investment securities | | | | 12,830,685 | | |
| Assets and liabilities in foreign | | | | | | |
| currencies | | | | 98 | | |
| Total change in net unrealized ap- | | | | |
| preciation (depreciation) | | | | | | 12,830,783 |
| Net gain (loss) | | | | | | 21,430,008 |
| Net increase (decrease) in net as- | | | | |
| sets resulting from operations | | | | $ | | 21,166,489 |
| | A Redemption price per share is equal to net asset value less any applicable contingent deferred sales charge.
See accompanying notes which are an integral part of the financial statements.
|
Cyclical Industries A-42
| Statement of Changes in Net Assets | | | | | | |
| | | Year ended | | | | Year ended |
| | | July 31, | | | | July 31, |
| | | 2005 | | | | 2004 |
| Increase (Decrease) in Net Assets | | | | | | |
| Operations | | | | | | |
| Net investment income (loss) | | $ (263,519) | | $ | | (212,310) |
| Net realized gain (loss) | | 8,599,225 | | | | 3,763,095 |
| Change in net unrealized appreciation (depreciation) | | 12,830,783 | | | | 4,474,838 |
| Net increase (decrease) in net assets resulting from operations | | 21,166,489 | | | | 8,025,623 |
| Distributions to shareholders from net realized gain | | (3,376,455) | | | | — |
| Share transactions -- net increase (decrease) | | 68,385,639 | | | | 18,136,365 |
| Redemption fees | | 12,053 | | | | 24,255 |
| Total increase (decrease) in net assets | | 86,187,726 | | | | 26,186,243 |
| |
| Net Assets | | | | | | |
| Beginning of period | | 51,419,652 | | | | 25,233,409 |
| End of period (including accumulated net investment loss of $15 and accumulated net investment loss of $20, | | | | | | |
| respectively) | | $ 137,607,378 | | $ | | 51,419,652 |
| Financial Highlights — Class A | | | | | | | | | | |
| Years ended July 31, | | 2005 | | 2004 | | 2003 | | 2002 | | 2001 |
| Selected Per-Share Data | | | | | | | | | | |
| Net asset value, beginning of period | | $ 18.10 | | $ 14.15 | | $ 12.75 | | $ 15.15 | | $ 13.56 |
| Income from Investment Operations | | | | | | | | | | |
| Net investment income (loss)C | | 02 | | (.02) | | .06 | | (.04) | | .04 |
| Net realized and unrealized gain (loss) | | 4.35 | | 3.96 | | 1.36 | | (2.37) | | 1.98 |
| Total from investment operations | | 4.37 | | 3.94 | | 1.42 | | (2.41) | | 2.02 |
| Distributions from net investment income | | — | | — | | (.02) | | — | | (.04) |
| Distributions from net realized gain | | (.94) | | — | | — | | — | | (.40) |
| Total distributions | | (.94) | | — | | (.02) | | — | | (.44) |
| Redemption fees added to paid in capitalC | | —E | | .01 | | —E | | .01 | | .01 |
| Net asset value, end of period | | $ 21.53 | | $ 18.10 | | $ 14.15 | | $ 12.75 | | $ 15.15 |
| Total ReturnA,B | | 25.04% | | 27.92% | | 11.16% | | (15.84)% | | 15.27% |
| Ratios to Average Net AssetsD | | | | | | | | | | |
| Expenses before expense reductions | | 1.34% | | 1.65% | | 1.99% | | 1.83% | | 2.59% |
| Expenses net of voluntary waivers, if any | | 1.34% | | 1.50% | | 1.53% | | 1.50% | | 1.50% |
| Expenses net of all reductions | | 1.29% | | 1.47% | | 1.46% | | 1.49% | | 1.49% |
| Net investment income (loss) | | 09% | | (.12)% | | .46% | | (.25)% | | .28% |
| Supplemental Data | | | | | | | | | | |
| Net assets, end of period (000 omitted) | | $ 40,264 | | $ 12,612 | | $ 4,272 | | $ 3,160 | | $ 2,270 |
| Portfolio turnover rate | | 116% | | 106% | | 149% | | 45% | | 78% |
| | A Total returns would have been lower had certain expenses not been reduced during the periods shown.
B Total returns do not include the effect of the sales charges.
C Calculated based on average shares outstanding during the period.
D Expense ratios reflect operating expenses of the class. Expenses before reductions do not reflect amounts reimbursed by the investment adviser or reductions from brokerage service arrangements or other expense offset arrangements and do
not represent the amount paid by the class during periods when reimbursements or reductions occur. Expenses net of any voluntary waivers reflect expenses after reimbursement by the investment adviser but prior to reductions from broker
age service arrangements or other expense offset arrangements. Expenses net of all reductions represent the net expenses paid by the class.
E Amount represents less than $.01 per share.
|
See accompanying notes which are an integral part of the financial statements.
A-43 Annual Report
| Financial Highlights — Class T | | | | | | | | | | |
| Years ended July 31, | | 2005 | | 2004 | | 2003 | | 2002 | | 2001 |
| Selected Per-Share Data | | | | | | | | | | |
| Net asset value, beginning of period | | $ 17.90 | | $ 14.02 | | $ 12.66 | | $ 15.09 | | $ 13.48 |
| Income from Investment Operations | | | | | | | | | | |
| Net investment income (loss)C | | (.03) | | (.06) | | .03 | | (.07) | | —E |
| Net realized and unrealized gain (loss) | | 4.31 | | 3.93 | | 1.34 | | (2.36) | | 2.00 |
| Total from investment operations | | 4.28 | | 3.87 | | 1.37 | | (2.43) | | 2.00 |
| Distributions from net investment income | | — | | — | | (.01) | | — | | (.01) |
| Distributions from net realized gain | | (.91) | | — | | — | | — | | (.39) |
| Total distributions | | (.91) | | — | | (.01) | | — | | (.40) |
| Redemption fees added to paid in capitalC | | —E | | .01 | | —E | | —E | | .01 |
| Net asset value, end of period | | $ 21.27 | | $ 17.90 | | $ 14.02 | | $ 12.66 | | $ 15.09 |
| Total ReturnA,B | | 24.78% | | 27.67% | | 10.84% | | (16.10)% | | 15.18% |
| Ratios to Average Net AssetsD | | | | | | | | | | |
| Expenses before expense reductions | | 1.57% | | 1.90% | | 2.25% | | 2.07% | | 2.85% |
| Expenses net of voluntary waivers, if any | | 1.57% | | 1.75% | | 1.78% | | 1.75% | | 1.75% |
| Expenses net of all reductions | | 1.52% | | 1.72% | | 1.71% | | 1.74% | | 1.74% |
| Net investment income (loss) | | (.14)% | | (.36)% | | .22% | | (.50)% | | .03% |
| Supplemental Data | | | | | | | | | | |
| Net assets, end of period (000 omitted) | | $ 40,126 | | $ 13,089 | | $ 5,493 | | $ 6,216 | | $ 5,654 |
| Portfolio turnover rate | | 116% | | 106% | | 149% | | 45% | | 78% |
| | A Total returns would have been lower had certain expenses not been reduced during the periods shown.
B Total returns do not include the effect of the sales charges.
C Calculated based on average shares outstanding during the period.
D Expense ratios reflect operating expenses of the class. Expenses before reductions do not reflect amounts reimbursed by the investment adviser or reductions from brokerage service arrangements or other expense offset arrangements and do not
represent the amount paid by the class during periods when reimbursements or reductions occur. Expenses net of any voluntary waivers reflect expenses after reimbursement by the investment adviser but prior to reductions from brokerage service
arrangements or other expense offset arrangements. Expenses net of all reductions represent the net expenses paid by the class.
E Amount represents less than $.01 per share.
|
| Financial Highlights — Class B | | | | | | | | | | |
| Years ended July 31, | | 2005 | | 2004 | | 2003 | | 2002 | | 2001 |
| Selected Per-Share Data | | | | | | | | | | |
| Net asset value, beginning of period | | $ 17.27 | | $ 13.61 | | $ 12.33 | | $ 14.77 | | $ 13.25 |
| Income from Investment Operations | | | | | | | | | | |
| Net investment income (loss)C | | (.13) | | (.14) | | (.03) | | (.14) | | (.07) |
| Net realized and unrealized gain (loss) | | 4.17 | | 3.79 | | 1.31 | | (2.30) | | 1.95 |
| Total from investment operations | | 4.04 | | 3.65 | | 1.28 | | (2.44) | | 1.88 |
| Distributions from net realized gain | | (.76) | | — | | — | | — | | (.37) |
| Redemption fees added to paid in capitalC | | —E | | .01 | | —E | | —E | | .01 |
| Net asset value, end of period | | $ 20.55 | | $ 17.27 | | $ 13.61 | | $ 12.33 | | $ 14.77 |
| Total ReturnA,B | | 24.12% | | 26.89% | | 10.38% | | (16.52)% | | 14.51% |
| Ratios to Average Net AssetsD | | | | | | | | | | |
| Expenses before expense reductions | | 2.11% | | 2.37% | | 2.68% | | 2.58% | | 3.39% |
| Expenses net of voluntary waivers, if any | | 2.11% | | 2.25% | | 2.25% | | 2.25% | | 2.25% |
| Expenses net of all reductions | | 2.07% | | 2.22% | | 2.18% | | 2.24% | | 2.24% |
| Net investment income (loss) | | (.68)% | | (.87)% | | (.26)% | | (1.00)% | | (.47)% |
| Supplemental Data | | | | | | | | | | |
| Net assets, end of period (000 omitted) | | $ 32,242 | | $ 14,722 | | $ 9,005 | | $ 9,008 | | $ 5,674 |
| Portfolio turnover rate | | 116% | | 106% | | 149% | | 45% | | 78% |
A Total returns would have been lower had certain expenses not been reduced during the periods shown.
B Total returns do not include the effect of the contingent deferred sales charge.
C Calculated based on average shares outstanding during the period.
D Expense ratios reflect operating expenses of the class. Expenses before reductions do not reflect amounts reimbursed by the investment adviser or reductions from brokerage service arrangements or other expense offset arrangements and do not
represent the amount paid by the class during periods when reimbursements or reductions occur. Expenses net of any voluntary waivers reflect expenses after reimbursement by the investment adviser but prior to reductions from brokerage service
arrangements or other expense offset arrangements. Expenses net of all reductions represent the net expenses paid by the class.
E Amount represents less than $.01 per share.
|
See accompanying notes which are an integral part of the financial statements.
Cyclical Industries A-44
| Financial Highlights — Class C | | | | | | | | | | |
| Years ended July 31, | | 2005 | | 2004 | | 2003 | | 2002 | | 2001 |
| Selected Per-Share Data | | | | | | | | | | |
| Net asset value, beginning of period | | $ 17.36 | | $ 13.67 | | $ 12.39 | | $ 14.84 | | $ 13.26 |
| Income from Investment Operations | | | | | | | | | | |
| Net investment income (loss)C | | (.12) | | (.14) | | (.03) | | (.14) | | (.07) |
| Net realized and unrealized gain (loss) | | 4.19 | | 3.82 | | 1.31 | | (2.31) | | 2.00 |
| Total from investment operations | | 4.07 | | 3.68 | | 1.28 | | (2.45) | | 1.93 |
| Distributions from net realized gain | | (.75) | | — | | — | | — | | (.35) |
| Redemption fees added to paid in capitalC | | —E | | .01 | | —E | | —E | | —E |
| Net asset value, end of period | | $ 20.68 | | $ 17.36 | | $ 13.67 | | $ 12.39 | | $ 14.84 |
| Total ReturnA,B | | 24.16% | | 26.99% | | 10.33% | | (16.51)% | | 14.78% |
| Ratios to Average Net AssetsD | | | | | | | | | | |
| Expenses before expense reductions | | 2.07% | | 2.28% | | 2.57% | | 2.49% | | 3.36% |
| Expenses net of voluntary waivers, if any | | 2.07% | | 2.25% | | 2.25% | | 2.25% | | 2.25% |
| Expenses net of all reductions | | 2.02% | | 2.22% | | 2.18% | | 2.24% | | 2.24% |
| Net investment income (loss) | | (.64)% | | (.87)% | | (.26)% | | (1.00)% | | (.47)% |
| Supplemental Data | | | | | | | | | | |
| Net assets, end of period (000 omitted) | | $ 20,595 | | $ 9,507 | | $ 5,307 | | $ 5,143 | | $ 2,847 |
| Portfolio turnover rate | | 116% | | 106% | | 149% | | 45% | | 78% |
| | A Total returns would have been lower had certain expenses not been reduced during the periods shown.
B Total returns do not include the effect of the contingent deferred sales charge.
C Calculated based on average shares outstanding during the period.
D Expense ratios reflect operating expenses of the class. Expenses before reductions do not reflect amounts reimbursed by the investment adviser or reductions from brokerage service arrangements or other expense offset arrangements and do not
represent the amount paid by the class during periods when reimbursements or reductions occur. Expenses net of any voluntary waivers reflect expenses after reimbursement by the investment adviser but prior to reductions from brokerage service
arrangements or other expense offset arrangements. Expenses net of all reductions represent the net expenses paid by the class.
E Amount represents less than $.01 per share.
|
| Financial Highlights — Institutional Class | | | | | | | | | | |
| Years ended July 31, | | 2005 | | 2004 | | 2003 | | 2002 | | 2001 |
| Selected Per-Share Data | | | | | | | | | | |
| Net asset value, beginning of period | | $ 18.48 | | $ 14.41 | | $ 12.96 | | $ 15.37 | | $ 13.70 |
| Income from Investment Operations | | | | | | | | | | |
| Net investment income (loss)B | | 07 | | .02 | | .09 | | —D | | .08 |
| Net realized and unrealized gain (loss) | | 4.46 | | 4.04 | | 1.39 | | (2.41) | | 2.05 |
| Total from investment operations | | 4.53 | | 4.06 | | 1.48 | | (2.41) | | 2.13 |
| Distributions from net investment income | | — | | — | | (.03) | | — | | (.07) |
| Distributions from net realized gain | | (.95) | | — | | — | | — | | (.40) |
| Total distributions | | (.95) | | — | | (.03) | | — | | (.47) |
| Redemption fees added to paid in capitalB | | —D | | .01 | | —D | | —D | | .01 |
| Net asset value, end of period | | $ 22.06 | | $ 18.48 | | $ 14.41 | | $ 12.96 | | $ 15.37 |
| Total ReturnA | | 25.41% | | 28.24% | | 11.46% | | (15.68)% | | 15.95% |
| Ratios to Average Net AssetsC | | | | | | | | | | |
| Expenses before expense reductions | | 1.06% | | 1.38% | | 1.55% | | 1.45% | | 2.27% |
| Expenses net of voluntary waivers, if any | | 1.06% | | 1.25% | | 1.25% | | 1.25% | | 1.25% |
| Expenses net of all reductions | | 1.01% | | 1.22% | | 1.18% | | 1.24% | | 1.24% |
| Net investment income (loss) | | 37% | | .13% | | .74% | | — % | | .53% |
| Supplemental Data | | | | | | | | | | |
| Net assets, end of period (000 omitted) | | $ 4,379 | | $ 1,490 | | $ 1,156 | | $ 2,104 | | $ 1,751 |
| Portfolio turnover rate | | 116% | | 106% | | 149% | | 45% | | 78% |
| | A Total returns would have been lower had certain expenses not been reduced during the periods shown.
B Calculated based on average shares outstanding during the period.
C Expense ratios reflect operating expenses of the class. Expenses before reductions do not reflect amounts reimbursed by the investment adviser or reductions from brokerage service arrangements or other expense offset arrangements and do not
represent the amount paid by the class during periods when reimbursements or reductions occur. Expenses net of any voluntary waivers reflect expenses after reimbursement by the investment adviser but prior to reductions from brokerage service
arrangements or other expense offset arrangements. Expenses net of all reductions represent the net expenses paid by the class.
D Amount represents less than $.01 per share.
|
See accompanying notes which are an integral part of the financial statements.
A-45 Annual Report
Notes to Financial Statements
For the period ended July 31, 2005
|
1. Significant Accounting Policies.
|
Fidelity Advisor Cyclical Industries Fund (the fund) is a non-diversified fund of Fidelity Advisor Series VII (the trust) and is authorized to issue an unlimited number of shares. The trust is registered under the Investment Company Act of 1940, as amended (the 1940 Act), as an open-end management investment company organized as a Massachusetts business trust.
The fund offers Class A, Class T, Class B, Class C, and Institutional Class shares, each of which has equal rights as to assets and voting privileges. Each class has exclusive voting rights with respect to matters that affect that class. Class B shares will automatically convert to Class A shares after a holding period of seven years from the initial date of purchase. Investment income, realized and unrealized capital gains and losses, the common expenses of the fund, and certain fund-level expense reductions, if any, are allocated on a pro rata basis to each class based on the relative net assets of each class to the total net assets of the fund. Each class differs with respect to transfer agent and distribution and service plan fees incurred. Certain expense reductions also differ by class.
The financial statements have been prepared in conformity with accounting principles generally accepted in the United States of America, which require management to make certain estimates and assumptions at the date of the financial statements. The following summarizes the significant accounting policies of the fund:
Security Valuation. Net asset value per share (NAV calculation) is calculated as of the close of business of the New York Stock Exchange, normally 4:00 p.m. Eastern time. Equity securities, including restricted securities, for which market quotations are available are valued at the last sale price or official closing price (closing bid price or last evaluated quote if no sale has occurred) on the primary market or exchange on which they trade. If prices are not readily available or do not accurately reflect fair value for a security, or if a security’s value has been materially affected by events occurring after the close of the exchange or market on which the security is principally traded, that security may be valued by another method that the Board of Trustees believes accurately reflects fair value. A security’s valuation may differ depending on the method used for determining value. Price movements in futures contracts and ADRs, market and trading trends, the bid/ask quotes of brokers and off-exchange institutional trading may be reviewed in the course of making a good faith determination of a security’s fair value. Short-term securities with remaining maturities of sixty days or less for which quotations are not readily available are valued on the basis of amortized cost. Investments in open-end investment companies are valued at their net asset value each business day.
Foreign Currency. The fund uses foreign currency contracts to facilitate transactions in foreign-denominated securities. Losses from these transactions may arise from changes in the value of the foreign currency or if the counterparties do not perform under the contracts’ terms.
Foreign-denominated assets, including investment securities, and liabilities are translated into U.S. dollars at the exchange rate at period end. Purchases and sales of investment securities, income and dividends received and expenses denominated in foreign currencies are translated into U.S. dollars at the exchange rate in effect on the transaction date.
The effects of exchange rate fluctuations on investments are included with the net realized and unrealized gain (loss) on investment securities. Other foreign currency transactions resulting in realized and unrealized gain (loss) are disclosed separately.
Investment Transactions and Income. Security transactions are accounted for as of trade date. Gains and losses on securities sold are determined on the basis of identified cost. Dividend income is recorded on the ex-dividend date, except for certain dividends from foreign securities where the ex-dividend date may have passed, which are recorded as soon as the fund is informed of the ex-dividend date. Non-cash dividends included in dividend income, if any, are recorded at the fair market value of the securities received. Distributions received on securities that represent a return of capital or capital gain are recorded as a reduction of cost of investments and/or as a realized gain. The fund estimates the components of distributions received that may be considered return of capital distributions or capital gain distributions. Interest income is accrued as earned. Interest income includes coupon interest and amortization of premium and accretion of discount on debt securities. Investment income is recorded net of foreign taxes withheld where recovery of such taxes is uncertain.
Expenses. Most expenses of the trust can be directly attributed to a fund. Expenses which cannot be directly attributed are apportioned among each fund in the trust.
Income Tax Information and Distributions to Shareholders. Each year, the fund intends to qualify as a regulated investment company by distributing all of its taxable income and realized gains under Subchapter M of the Internal Revenue Code. As a result, no provision for income taxes is required in the accompanying financial statements. Foreign taxes are provided for based on the fund’s understanding of the tax rules and rates that exist in the foreign markets in which it invests.
Distributions are recorded on the ex-dividend date. Income dividends and capital gain distributions are declared separately for each class. Income and capital gain distributions are determined in accordance with income tax regulations, which may differ from generally accepted accounting principles. In addition, the fund will claim a portion of the payment made to redeeming shareholders as a distribution for income tax purposes. Capital accounts within the financial statements are adjusted for permanent book-tax differences. These adjustments have no impact on net assets or the results of operations. Temporary book-tax differences will reverse in a subsequent period. Book-tax differences are primarily due to foreign currency transactions, deferred trustees compensation, net operating losses, and losses deferred due to wash sales.
| | 1. Significant Accounting Policies - continued
Income Tax Information and Distributions to Shareholders - continued
The tax-basis components of distributable earnings and the federal tax cost as of period end were as follows:
|
| Unrealized appreciation | | $ 20,443,387 |
| Unrealized depreciation | | (2,153,034) |
| Net unrealized appreciation (depreciation) | | 18,290,353 |
| Undistributed ordinary income | | 2,641,076 |
| Undistributed long-term capital gain | | 3,738,864 |
| |
| Cost for federal income tax purposes | | $ 119,896,170 |
The tax character of distributions paid was as follows:
| | | July 31, 2005 | | | | July 31, 2004 |
| Ordinary Income | | $ | | 1,163,274 | | $ | | — |
| Long-term Capital Gains | | | | 2,213,181 | | | | — |
| Total | | $ | | 3,376,455 | | $ | | — |
Short-Term Trading (Redemption) Fees. Shares held in the fund less than 60 days are subject to a redemption fee equal to 1.00% of the proceeds of
the redeemed shares. All redemption fees, including any estimated redemption fees paid by Fidelity Management & Research Company (FMR), are
retained by the fund and accounted for as an addition to paid in capital.
2. Operating Policies.
Repurchase Agreements. FMR has received an Exemptive Order from the Securities and Exchange Commission (the SEC) which permits the fund
and other affiliated entities of FMR to transfer uninvested cash balances into joint trading accounts which are then invested in repurchase agreements.
The fund may also invest directly with institutions in repurchase agreements. Repurchase agreements are collateralized by government or non-
government securities. Collateral is held in segregated accounts with custodian banks and may be obtained in the event of a default of the counterparty.
The fund monitors, on a daily basis, the value of the collateral to ensure it is at least equal to the principal amount of the repurchase agreement (in-
cluding accrued interest). In the event of a default by the counterparty, realization of the collateral proceeds could be delayed, during which time the
value of the collateral may decline.
3. Purchases and Sales of Investments.
Purchases and sales of securities, other than short-term securities and U.S. government securities, aggregated $179,445,823 and $113,166,082,
respectively. The Fund realized a loss on the sale of an investment not meeting the investment restrictions of the fund. The loss was fully reimbursed by
the Fund’s investment advisor.
4. Fees and Other Transactions with Affiliates.
Management Fee. FMR and its affiliates provide the fund with investment management related services for which the fund pays a monthly manage-
ment fee. The management fee is the sum of an individual fund fee rate that is based on an annual rate of .30% of the fund’s average net assets and a
group fee rate that averaged .27% during the period. The group fee rate is based upon the average net assets of all the mutual funds advised by FMR.
The group fee rate decreases as assets under management increase and increases as assets under management decrease. For the period, the total
annual management fee rate was .57% of the fund’s average net assets.
|
A-47 Annual Report
| | Notes to Financial Statements - continued
4. Fees and Other Transactions with Affiliates - continued
Distribution and Service Plan. In accordance with Rule 12b-1 of the 1940 Act, the fund has adopted separate Distribution and Service Plans for each
class of shares. Certain classes pay Fidelity Distributors Corporation (FDC), an affiliate of FMR, separate Distribution and Service Fees, each of which
is based on an annual percentage of each class’ average net assets. In addition, FDC may pay financial intermediaries for selling shares of the fund and
providing shareholder support services. For the period, the Distribution and Service Fee rates and the total amounts paid to and retained by FDC were
as follows:
|
| | | Distribution | | Service | | | | Paid to | | | | Retained |
| | | Fee | | Fee | | | | FDC | | | | by FDC |
| Class A | | 0% | | .25% | | $ | | 69,461 | | $ | | — |
| Class T | | 25% | | .25% | | | | 153,994 | | | | 46 |
| Class B | | 75% | | .25% | | | | 240,771 | | | | 180,579 |
| Class C | | 75% | | .25% | | | | 148,506 | | | | 57,658 |
| |
| | | | | | | $ | | 612,732 | | $ | | 238,283 |
Sales Load. FDC receives a front-end sales charge of up to 5.75% for selling Class A shares, and 3.50% for selling Class T shares, some of which is paid to financial intermediaries for selling shares of the fund. FDC receives the proceeds of contingent deferred sales charges levied on Class A, Class T, Class B, and Class C redemptions. These charges depend on the holding period. The deferred sales charges range from 5% to 1% for Class B, 1% for Class C, and .25% for certain purchases of Class A and Class T shares.
For the period, sales charge amounts retained by FDC were as follows:
| | | | | Retained |
| | | | | by FDC |
| Class A | | $ | | 117,642 |
| Class T | | | | 14,748 |
| Class B* | | | | 63,970 |
| Class C* | | | | 2,023 |
| | | $ | | 198,383 |
* When Class B and Class C shares are initially sold, FDC pays commissions from its own resources to financial intermediaries through which the sales are made.
Transfer Agent Fees. Fidelity Investments Institutional Operations Company, Inc. (FIIOC), an affiliate of FMR, is the transfer, dividend disbursing
and shareholder servicing agent for each class of the fund. FIIOC receives account fees and asset-based fees that vary according to the account size and
type of account of the shareholders of the respective classes of the fund. FIIOC pays for typesetting, printing and mailing of shareholder reports, except
proxy statements. For the period the total transfer agent fees paid by each class to FIIOC, were as follows:
|
| | | | | | | % of |
| | | | | | | Average |
| | | | | Amount | | Net Assets |
| Class A | | $ | | 91,503 | | .33 |
| Class T | | | | 94,933 | | .31 |
| Class B | | | | 85,414 | | .36 |
| Class C | | | | 45,817 | | .31 |
| Institutional Class | | | | 8,791 | | .30 |
| |
| | | $ | | 326,458 | | |
Accounting and Security Lending Fees. Fidelity Service Company, Inc. (FSC), an affiliate of FMR, maintains the fund’s accounting records. The accounting fee is based on the level of average net assets for the month. Under a separate contract, FSC administers the security lending program. The security lending fee is based on the number and duration of lending transactions.
Central Funds. The fund may invest in affiliated Central Funds managed by Fidelity Investments Money Management, Inc. (FIMM) an affiliate of FMR. The Central Funds are open-end investment companies available only to investment companies and other accounts managed by FMR and its affiliates. The Money Market Central Funds seek preservation of capital and current income. The Central Funds do not pay a management fee. Income distributions earned by the fund are recorded as income in the accompanying financial statements and totaled $80,717 for the period.
Brokerage Commissions. The fund placed a portion of its portfolio transactions with brokerage firms which are affiliates of the investment adviser. The commissions paid to these affiliated firms were $13,770 for the period.
Cyclical Industries A-48
5. Committed Line of Credit.
The fund participates with other funds managed by FMR in a $4.2 billion credit facility (the “line of credit”) to be utilized for temporary or emergency purposes to fund shareholder redemptions or for other short-term liquidity purposes. The fund has agreed to pay commitment fees on its pro rata portion of the line of credit. During the period, there were no borrowings on this line of credit.
6. Security Lending.
The fund lends portfolio securities from time to time in order to earn additional income. The fund receives collateral (in the form of U.S. Treasury obligations, letters of credit and/or cash) against the loaned securities and maintains collateral in an amount not less than 100% of the market value of the loaned securities during the period of the loan. The market value of the loaned securities is determined at the close of business of the fund and any additional required collateral is delivered to the fund on the next business day. If the borrower defaults on its obligation to return the securities loaned because of insolvency or other reasons, a fund could experience delays and costs in recovering the securities loaned or in gaining access to the collateral. Cash collateral is invested in the Fidelity Securities Lending Cash Central Fund. The value of loaned securities and cash collateral at period end are disclosed on the fund’s Statement of Assets and Liabilities.
7. Expense Reductions.
Many of the brokers with whom FMR places trades on behalf of the fund provided services to the fund in addition to trade execution. These services included payments of certain expenses on behalf of the fund totaling $47,481 for the period. In addition, through arrangements with the fund’s custodian, credits realized as a result of uninvested cash balances were used to reduce the fund’s expenses. During the period, these credits reduced the fund’s custody expenses by $100, respectively.
8. Other.
The fund’s organizational documents provide former and current trustees and officers with a limited indemnification against liabilities arising in connection with the performance of their duties to the fund. In the normal course of business, the fund may also enter into contracts that provide general indemnifications. The fund’s maximum exposure under these arrangements is unknown as this would be dependent on future claims that may be made against the fund. The risk of material loss from such claims is considered remote.
9. Distributions to Shareholders.
Distributions to shareholders of each class were as follows:
| Years ended July 31, | | 2005 | | | | 2004 | | |
| From net realized gain | | | | | | | | |
| Class A | | $ 1,008,608 | | $ | | | | — |
| Class T | | 1,078,512 | | | | | | — |
| Class B | | 740,358 | | | | | | — |
| Class C | | 457,235 | | | | | | — |
| Institutional Class | | 91,742 | | | | | | — |
| Total | | $ 3,376,455 | | $ | | | | — |
A-49 Annual Report
Notes to Financial Statements - continued
10. Share Transactions.
Transactions for each class of shares were as follows:
| | | | | Shares | | | | | | Dollars | | |
| Years ended July 31, | | 2005 | | | | 2004 | | 2005 | | | | 2004 |
| Class A | | | | | | | | | | | | |
| Shares sold | | 1,834,275 | | | | 906,243 | | $ 35,637,759 | | $ 15,361,054 |
| Reinvestment of distributions | | 37,514 | | | | — | | 702,375 | | | | — |
| Shares redeemed | | (698,605) | | | | (511,353) | | (13,721,410) | | | | (8,642,465) |
| Net increase (decrease) | | 1,173,184 | | | | 394,890 | | $ 22,618,724 | | $ | | 6,718,589 |
| Class T | | | | | | | | | | | | |
| Shares sold | | 1,414,958 | | | | 524,204 | | $ 26,674,948 | | $ | | 8,942,910 |
| Reinvestment of distributions | | 55,963 | | | | — | | 1,036,099 | | | | — |
| Shares redeemed | | (315,493) | | | | (184,575) | | (6,149,352) | | | | (3,062,075) |
| Net increase (decrease) | | 1,155,428 | | | | 339,629 | | $ 21,561,695 | | $ | | 5,880,835 |
| Class B | | | | | | | | | | | | |
| Shares sold | | 1,024,205 | | | | 439,402 | | $ 19,088,560 | | $ | | 7,031,675 |
| Reinvestment of distributions | | 34,674 | | | | — | | 620,788 | | | | — |
| Shares redeemed | | (342,241) | | | | (249,000) | | (6,386,553) | | | | (4,000,080) |
| Net increase (decrease) | | 716,638 | | | | 190,402 | | $ 13,322,795 | | $ | | 3,031,595 |
| Class C | | | | | | | | | | | | |
| Shares sold | | 649,529 | | | | 350,466 | | $ 12,242,436 | | $ | | 5,537,878 |
| Reinvestment of distributions | | 19,147 | | | | — | | 344,742 | | | | — |
| Shares redeemed | | (220,294) | | | | (191,062) | | (4,110,203) | | | | (3,095,385) |
| Net increase (decrease) | | 448,382 | | | | 159,404 | | $ 8,476,975 | | $ | | 2,442,493 |
| Institutional Class | | | | | | | | | | | | |
| Shares sold | | 168,340 | | | | 56,561 | | $ 3,418,465 | | $ | | 991,073 |
| Reinvestment of distributions | | 3,419 | | | | — | | 65,261 | | | | — |
| Shares redeemed | | (53,860) | | | | (56,142) | | (1,078,276) | | | | (928,220) |
| Net increase (decrease) | | 117,899 | | | | 419 | | $ 2,405,450 | | $ | | 62,853 |
Cyclical Industries A-50
Advisor Developing Communications Fund — Class A, T, B, and C
Performance
Average annual total return reflects the change in the value of an investment, assuming reinvestment of the class’ dividend income and capital gains (the profits earned upon the sale of securities that have grown in value) and assuming a constant rate of performance each year. The $10,000 table and the fund’s returns do not reflect the deduction of taxes that a shareholder would pay on fund distributions or the redemption of fund shares. During periods of reimbursement by Fidelity, a fund’s total return will be greater than it would be had the reimbursement not occurred. How a fund did yesterday is no guarantee of how it will do tomorrow.
| Average Annual Total Returns | | | | |
| Periods ended July 31, 2005 | | Past 1 | | Life of |
| | | year | | fundA |
| Class A (incl. 5.75% sales charge) | | 11.14% | | --6.74% |
| Class T (incl. 3.50% sales charge) | | 13.33% | | --6.50% |
| Class B (incl. contingent deferred | | | | |
| sales charge)B | | 11.98% | | --6.64% |
| Class C (incl. contingent deferred | | | | |
| sales charge)C | | 15.98% | | --6.23% |
A From December 27, 2000.
B Class B shares’ contingent deferred sales charges included in the past one year and
life of fund total return figures are 5% and 2%, respectively.
C Class C shares’ contingent deferred sales charges included in the past one year and
life of fund total return figures are 1% and 0%, respectively.
|
$10,000 Over Life of Fund
| Let’s say hypothetically that $10,000 was invested in Fidelity Advisor |
| Developing Communications Fund — Class T on December 27, |
| 2000, when the fund started, and the current 3.50% sales charge was |
| paid. The chart shows how the value of your investment would have |
| changed, and also shows how the S&P 500 Index performed over the |
| same period. |

A-51 Annual Report
A-51
Advisor Developing Communications Fund — Class A, T, B, and C
Management’s Discussion of Fund Performance
Comments from Charlie Chai, Portfolio Manager of Fidelity® Advisor Developing Communications Fund
A late-inning rally on Wall Street helped push some key U.S. equity indexes to four-year highs by the conclusion of the 12-month period ending July 31, 2005. Spurred on by bullish economic data and strong corporate earnings, investors enjoyed a stellar month of July, capping off a turbulent 12-month period for U.S. equity markets. Stock prices bounced up and down during most of the year, moving in cadence with gyrations in the price of crude oil and investors’ gathering and ebbing concerns about inflation. The Federal Reserve Board raised short-term interest rates eight times during the period, also affecting overall market sentiment. Despite their fluctuations, the major equity indexes finished on a high note, with the Standard & Poor’s 500SM Index and the NASDAQ Composite® Index posting gains of 14.05% and 16.51%, respectively, for the period. The small-cap Russell 2000® Index rose 24.78% and the Russell Midcap® Index jumped 28.93%, while the blue-chips’ Dow Jones Industrial AverageSM advanced only 7.29% .
For the 12 months ending July 31, 2005, the fund’s Class A, Class T, Class B and Class C shares returned 17.92%, 17.44%, 16.98% and 16.98%, respectively, beating the 11.63% gain of the Goldman Sachs® Technology Index. The fund also bested the S&P 500®. A significant overweighting in wireless telecommunications equipment provided the biggest boost. However, the top contributor both in absolute terms and versus the sector index was Internet search engine provider Google. Strong growth in paid-search revenues forced analysts to boost their earnings estimates for the company, driving its stock price sharply higher. Comverse Technology — a holding I reduced for valuation reasons during the period — was the second-best contributor to both absolute and relative performance. The company saw particularly strong growth in wireless services such as IP (Internet Protocol) voice mail, picture messaging and ring tones. Conversely, the fund was hampered by a relatively heavy exposure to communications equipment. Two holdings with ties to the VoIP (Voice over Internet Protocol) market turned in disappointing performances — equipment providers Avaya and Mindspeed Technologies. Slower-than-expected adoption of VoIP hurt both stocks.
The views expressed in this statement reflect those of the portfolio manager only through the end of the period of the report as stated on the cover and do not necessarily represent the views of Fidelity or any other person in the Fidelity organization. Any such views are subject to change at any time based upon market or other conditions and Fidelity disclaims any responsibility to update such views. These views may not be relied on as investment advice and, because investment decisions for a Fidelity fund are based on numerous factors, may not be relied on as an indication of trading intent on behalf of any Fidelity fund.
Developing Communications
|
Advisor Developing Communications Fund
Shareholder Expense Example
|
As a shareholder of the Fund, you incur two types of costs: (1) transaction costs, including sales charges (loads) on purchase payments or redemption proceeds, redemption fees, and (2) ongoing costs, including management fees, distribution and/or service (12b-1) fees and other Fund expenses. This Example is intended to help you understand your ongoing costs (in dollars) of investing in the Fund and to compare these costs with the ongoing costs of investing in other mutual funds.
The Example is based on an investment of $1,000 invested at the beginning of the period and held for the entire period (February 1, 2005 to July 31, 2005).
The first line of the table below for each class of the Fund provides information about actual account values and actual expenses. You may use the information in this line, together with the amount you invested, to estimate the expenses that you paid over the period. Simply divide your account value by $1,000.00 (for example, an $8,600 account value divided by $1,000.00 = 8.6), then multiply the result by the number in the first line for a class of the Fund under the heading entitled “Expenses Paid During Period” to estimate the expenses you paid on your account during this period.
Hypothetical Example for Comparison Purposes
|
The second line of the table below for each class of the Fund provides information about hypothetical account values and hypothetical expenses based on a Class’ actual expense ratio and an assumed rate of return of 5% per year before expenses, which is not the Class’ actual return. The hypothetical account values and expenses may not be used to estimate the actual ending account balance or expenses you paid for the period. You may use this information to compare the ongoing costs of investing in the Fund and other funds. To do so, compare this 5% hypothetical example with the 5% hypothetical examples that appear in the shareholder reports of the other funds.
Please note that the expenses shown in the table are meant to highlight your ongoing costs only and do not reflect any transaction costs. Therefore, the second line of the table is useful in comparing ongoing costs only, and will not help you determine the relative total costs of owning different funds. In addition, if these transactional costs were included, your costs would have been higher.
| | | | | | | | | Expenses Paid |
| | | Beginning | | | | Ending | | During Period* |
| | | Account Value | | | | Account Value | | February 1, 2005 |
| | | February 1, 2005 | | | | July 31, 2005 | | to July 31, 2005 |
| Class A | | | | | | | | | | |
| Actual | | $ 1,000.00 | | $ | | 1,044.80 | | $ | | 7.10 |
| HypotheticalA | | $ 1,000.00 | | $ | | 1,017.85 | | $ | | 7.00 |
| Class T | | | | | | | | | | |
| Actual | | $ 1,000.00 | | $ | | 1,042.50 | | $ | | 8.36 |
| HypotheticalA | | $ 1,000.00 | | $ | | 1,016.61 | | $ | | 8.25 |
| Class B | | | | | | | | | | |
| Actual | | $ 1,000.00 | | $ | | 1,040.60 | | $ | | 10.88 |
| HypotheticalA | | $ 1,000.00 | | $ | | 1,014.13 | | $ | | 10.74 |
| Class C | | | | | | | | | | |
| Actual | | $ 1,000.00 | | $ | | 1,040.60 | | $ | | 10.88 |
| HypotheticalA | | $ 1,000.00 | | $ | | 1,014.13 | | $ | | 10.74 |
| Institutional Class | | | | | | | | | | |
| Actual | | $ 1,000.00 | | $ | | 1,045.60 | | $ | | 5.83 |
| HypotheticalA | | $ 1,000.00 | | $ | | 1,019.09 | | $ | | 5.76 |
| |
| A 5% return per year before expenses | | | | | | | | | | |
* Expenses are equal to each Class’ annualized expense ratio (shown in the table below); multiplied by the average account value over the period, multiplied by 181/365 (to reflect the one-half year period).
| | | Annualized |
| | | Expense Ratio |
| Class A | | 1.40% |
| Class T | | 1.65% |
| Class B | | 2.15% |
| Class C | | 2.15% |
| Institutional Class | | 1.15% |
Advisor Developing Communications Fund
Investment Changes
| Top Ten Stocks as of July 31, 2005 | | |
| | | % of fund’s | | % of fund’s net assets |
| | | net assets | | 6 months ago |
| Nokia Corp. sponsored ADR | | 9.8 | | 5.4 |
| Research In Motion Ltd. | | 9.0 | | 3.5 |
| Juniper Networks, Inc. | | 8.4 | | 7.9 |
| QUALCOMM, Inc. | | 8.1 | | 7.0 |
| Corning, Inc. | | 6.2 | | 0.0 |
| Google, Inc. Class A (sub. vtg.) | | 5.2 | | 0.4 |
| Freescale Semiconductor, Inc. | | | | |
| Class A | | 3.4 | | 2.5 |
| Motorola, Inc. | | 2.9 | | 4.5 |
| Photon Dynamics, Inc. | | 2.7 | | 0.7 |
| AU Optronics Corp. | | | | |
| sponsored ADR | | 2.5 | | 1.5 |
| | | 58.2 | | |
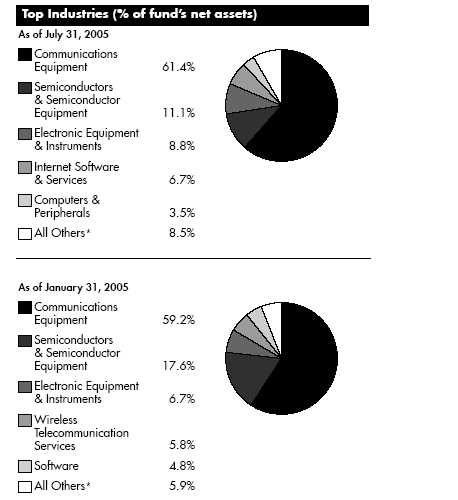
* Includes short term investments and net other assets.
Prior period industry classifications reflect the categories in place as of the date indicated and have not been adjusted to reflect current industry classifications.
Developing Communications A-54
|
Advisor Developing Communications Fund
Investments July 31, 2005
Showing Percentage of Net Assets
| Common Stocks — 99.2% | | | | | | |
| | | Shares | | Value (Note 1) |
| |
| COMMUNICATIONS EQUIPMENT – 61.4% | | | | | | |
| Communications Equipment – 61.4% | | | | | | |
| ADC Telecommunications, Inc. (a) | | 4,400 | | $ | | 115,016 |
| Adva AG Optical Networking (a) | | 9,420 | | | | 55,852 |
| Andrew Corp. (a) | | 6,500 | | | | 71,435 |
| AudioCodes Ltd. (a) | | 11,600 | | | | 105,444 |
| Avaya, Inc. (a) | | 15,450 | | | | 159,599 |
| Bookham, Inc. (a) | | 372 | | | | 1,179 |
| C-COR, Inc. (a) | | 800 | | | | 6,664 |
| Carrier Access Corp. (a) | | 4,400 | | | | 23,320 |
| CIENA Corp. (a) | | 92,650 | | | | 207,536 |
| Comtech Group, Inc. (a) | | 2,200 | | | | 12,232 |
| Comverse Technology, Inc. (a) | | 5,460 | | | | 138,083 |
| Corning, Inc. (a) | | 34,100 | | | | 649,605 |
| EMS Technologies, Inc. (a) | | 1,400 | | | | 21,350 |
| F5 Networks, Inc. (a) | | 4,900 | | | | 206,682 |
| Foundry Networks, Inc. (a) | | 900 | | | | 10,656 |
| Foxconn International Holdings Ltd. | | 2,000 | | | | 1,647 |
| Harmonic, Inc. (a) | | 4,700 | | | | 25,051 |
| InterDigital Communication Corp. (a) | | 100 | | | | 1,795 |
| Ixia (a) | | 3,500 | | | | 69,090 |
| Juniper Networks, Inc. (a) | | 36,550 | | | | 876,835 |
| Motorola, Inc. | | 14,100 | | | | 298,638 |
| MRV Communications, Inc. (a) | | 19,165 | | | | 40,821 |
| NMS Communications Corp. (a) | | 30,000 | | | | 101,100 |
| Nokia Corp. sponsored ADR | | 64,600 | | | | 1,030,367 |
| Powerwave Technologies, Inc. (a) | | 6,940 | | | | 79,602 |
| QUALCOMM, Inc. | | 21,600 | | | | 852,984 |
| Redback Networks, Inc. (a) | | 6,683 | | | | 55,402 |
| Research In Motion Ltd. (a) | | 13,340 | | | | 943,339 |
| Riverstone Networks, Inc. (a) | | 82,300 | | | | 52,672 |
| Scientific-Atlanta, Inc. | | 1,100 | | | | 42,350 |
| SiRF Technology Holdings, Inc. (a) | | 1,000 | | | | 21,850 |
| Sonus Networks, Inc. (a) | | 25,404 | | | | 122,955 |
| Telefonaktiebolaget LM Ericsson | | | | | | |
| (B Shares) sponsored ADR | | 22 | | | | 756 |
| Telson Electronics Co. Ltd. (a) | | 16,942 | | | | 0 |
| Terayon Communication Systems, Inc. (a) | | 6,500 | | | | 20,410 |
| Tut Systems, Inc. (a) | | 2,400 | | | | 8,400 |
| | | | | | | 6,430,717 |
| |
| COMPUTERS & PERIPHERALS – 3.5% | | | | | | |
| Computer Hardware – 1.8% | | | | | | |
| Compal Electronics, Inc. | | 5,509 | | | | 5,065 |
| Concurrent Computer Corp. (a) | | 35,817 | | | | 81,663 |
| NEC Corp. sponsored ADR | | 90 | | | | 461 |
| Palm, Inc. (a) | | 3,600 | | | | 102,744 |
| | | | | | | 189,933 |
| Computer Storage & Peripherals – 1.7% | | | | | | |
| EMC Corp. (a) | | 1,100 | | | | 15,059 |
| | | Shares | | Value (Note 1) |
| M-Systems Flash Disk Pioneers Ltd. (a) | | 2,100 | | $ | | 54,285 |
| SanDisk Corp. (a) | | 3,200 | | | | 108,224 |
| | | | | | | 177,568 |
| |
| TOTAL COMPUTERS & PERIPHERALS | | | | | | 367,501 |
| |
| DIVERSIFIED TELECOMMUNICATION SERVICES – 0.4% | | | | |
| Integrated Telecommunication Services – 0.4% | | | | |
| Philippine Long Distance Telephone Co. | | | | | | |
| sponsored ADR | | 1,300 | | | | 37,791 |
| ELECTRONIC EQUIPMENT & INSTRUMENTS – 8.8% | | | | |
| Electronic Equipment & Instruments – 7.5% | | | | | | |
| Aeroflex, Inc. (a) | | 13,000 | | | | 125,840 |
| Applied Films Corp. (a) | | 2,200 | | | | 57,794 |
| AU Optronics Corp. sponsored ADR | | 16,566 | | | | 262,737 |
| LG.Philips LCD Co. Ltd. sponsored ADR . | | 1,100 | | | | 25,322 |
| Photon Dynamics, Inc. (a) | | 14,900 | | | | 282,132 |
| Planar Systems, Inc. (a) | | 3,900 | | | | 30,498 |
| | | | | | | 784,323 |
| Electronic Manufacturing Services – 1.1% | | | | | | |
| KEMET Corp. (a) | | 6,900 | | | | 57,822 |
| M-Flex Electronix, Inc. (a) | | 200 | | | | 4,196 |
| Molex, Inc. | | 900 | | | | 25,416 |
| TTM Technologies, Inc. (a) | | 3,200 | | | | 22,688 |
| | | | | | | 110,122 |
| Technology Distributors – 0.2% | | | | | | |
| Brightpoint, Inc. (a) | | 900 | | | | 21,825 |
| CellStar Corp. (a) | | 7,104 | | | | 2,700 |
| | | | | | | 24,525 |
| |
| TOTAL ELECTRONIC EQUIPMENT & INSTRUMENTS | | | | 918,970 |
| |
| HOUSEHOLD DURABLES – 0.3% | | | | | | |
| Consumer Electronics – 0.3% | | | | | | |
| Thomson SA | | 1,500 | | | | 34,011 |
| INTERNET SOFTWARE & SERVICES – 6.7% | | | | | | |
| Internet Software & Services – 6.7% | | | | | | |
| Akamai Technologies, Inc. (a) | | 1,500 | | | | 22,905 |
| Google, Inc. Class A (sub. vtg.) | | 1,870 | | | | 538,111 |
| Openwave Systems, Inc. (a) | | 5,207 | | | | 96,590 |
| RADVision Ltd. (a) | | 3,400 | | | | 40,834 |
| | | | | | | 698,440 |
| |
| OFFICE ELECTRONICS – 0.2% | | | | | | |
| Office Electronics – 0.2% | | | | | | |
| Zebra Technologies Corp. Class A (a) | | 400 | | | | 15,600 |
| SEMICONDUCTORS & SEMICONDUCTOR EQUIPMENT – 11.1% | | |
| Semiconductor Equipment – 0.4% | | | | | | |
| Amkor Technology, Inc. (a) | | 3,700 | | | | 17,242 |
| Teradyne, Inc. (a) | | 1,200 | | | | 18,636 |
| | | | | | | 35,878 |
See accompanying notes which are an integral part of the financial statements.
A-55 A-55 Annual Report
Advisor Developing Communications Fund
Investments - continued
|
| Common Stocks – continued | | | | | | |
| | | Shares | | Value (Note 1) |
| |
| SEMICONDUCTORS & SEMICONDUCTOR EQUIPMENT – CONTINUED |
| Semiconductors – 10.7% | | | | | | |
| Agere Systems, Inc. (a) | | 1,665 | | $ | | 18,631 |
| AMIS Holdings, Inc. (a) | | 800 | | | | 10,208 |
| Applied Micro Circuits Corp. (a) | | 16,432 | | | | 49,460 |
| ARM Holdings PLC sponsored ADR | | 5,900 | | | | 37,465 |
| Exar Corp. (a) | | 700 | | | | 11,148 |
| Fairchild Semiconductor International, | | | | | | |
| Inc. (a) | | 1,300 | | | | 21,918 |
| Freescale Semiconductor, Inc. Class A | | 14,100 | | | | 359,832 |
| Intersil Corp. Class A | | 2,651 | | | | 51,350 |
| Linear Technology Corp. | | 600 | | | | 23,316 |
| Marvell Technology Group Ltd. (a) | | 1,300 | | | | 56,797 |
| Maxim Integrated Products, Inc. | | 600 | | | | 25,122 |
| Microchip Technology, Inc. | | 1,300 | | | | 40,391 |
| Microtune, Inc. (a) | | 6,200 | | | | 37,758 |
| Mindspeed Technologies, Inc. (a) | | 76,375 | | | | 109,216 |
| O2Micro International Ltd. (a) | | 7,000 | | | | 120,120 |
| Sigma Designs, Inc. (a) | | 4,224 | | | | 36,411 |
| Silicon Image, Inc. (a) | | 1,600 | | | | 18,912 |
| STATS ChipPAC Ltd. sponsored ADR (a) . | | 2,700 | | | | 18,495 |
| Vitesse Semiconductor Corp. (a) | | 28,300 | | | | 62,826 |
| Volterra Semiconductor Corp. | | 1,200 | | | | 13,932 |
| | | | | | | 1,123,308 |
| |
| TOTAL SEMICONDUCTORS | | | | | | |
| & SEMICONDUCTOR EQUIPMENT | | | | | | 1,159,186 |
| |
| SOFTWARE – 3.3% | | | | | | |
| Application Software – 2.6% | | | | | | |
| JAMDAT Mobile, Inc. | | 2,410 | | | | 68,974 |
| Portal Software, Inc. (a) | | 5,000 | | | | 10,850 |
| TIBCO Software, Inc. (a) | | 3,200 | | | | 24,608 |
| Ulticom, Inc. (a) | | 13,898 | | | | 170,251 |
| | | | | | | 274,683 |
| Home Entertainment Software – 0.3% | | | | | | |
| UBI Soft Entertainment SA (a) | | 500 | | | | 27,742 |
| Systems Software – 0.4% | | | | | | |
| Macrovision Corp. (a) | | 2,136 | | | | 46,629 |
| |
| TOTAL SOFTWARE | | | | | | 349,054 |
| |
| WIRELESS TELECOMMUNICATION SERVICES – 3.5% | | | | |
| Wireless Telecommunication Services – 3.5% | | | | | | |
| Nextel Partners, Inc. Class A (a) | | 4,600 | | | | 114,540 |
| NII Holdings, Inc. (a) | | 1,000 | | | | 74,440 |
| Wireless Facilities, Inc. (a) | | 27,833 | | | | 179,245 |
| | | | | | | 368,225 |
| |
| TOTAL COMMON STOCKS | | | | | | |
| (Cost $9,733,958) | | | | 10,379,495 |
| Money Market Funds — 1.8% | | | | |
| | | Shares | | | | Value (Note 1) |
| Fidelity Cash Central Fund, 3.31% (b) | | | | | | |
| (Cost $189,754) | | 189,754 | | $ | | 189,754 |
| TOTAL INVESTMENT PORTFOLIO - 101.0% | | | | |
| (Cost $9,923,712) | | | | | | 10,569,249 |
| |
| NET OTHER ASSETS – (1.0)% | | | | | | (100,286) |
| NET ASSETS – 100% | | | | $ | | 10,468,963 |
| | Legend
(a) Non-income producing
(b) Affiliated fund that is available only to investment companies and other
accounts managed by Fidelity Investments. The rate quoted is the
annualized seven-day yield of the fund at period end. A complete listing
of the fund’s holdings as of its most recent quarter end is available upon
request.
Other Information
Distribution of investments by country of issue, as a percentage of total net
assets, is as follows:
|
| United States of America | | 72.9% |
| Finland | | 9.8% |
| Canada | | 9.0% |
| Taiwan | | 2.5% |
| Israel | | 1.9% |
| Cayman Islands | | 1.1% |
| Others (individually less than 1%) | | 2.8% |
| | | 100.0% |
Income Tax Information
At July 31, 2005, the fund had a capital loss carryforward of approximately
$1,987,794 of which $479,787 and $1,508,007 will expire on July 31,
2011 and 2013, respectively.
|
See accompanying notes which are an integral part of the financial statements.
Developing Communications A-56
| | Advisor Developing Communications Fund
Financial Statements
|
| Statement of Assets and Liabilities | | | | |
| | | | | | | | | July 31, 2005 |
| Assets | | | | | | | | |
| Investment in securities, at value (cost | | | | | | |
| $9,923,712) — See accompanying | | | | | | |
| schedule | | | | | | $ | | 10,569,249 |
| Foreign currency held at value (cost | | | | | | |
| $52,549) | | | | | | | | 55,928 |
| Receivable for investments sold | | | | | | | | 365,719 |
| Receivable for fund shares sold | | | | | | | | 10,908 |
| Dividends receivable | | | | | | | | 4,183 |
| Interest receivable | | | | | | | | 663 |
| Prepaid expenses | | | | | | | | 24 |
| Receivable from investment adviser for | | | | | | |
| expense reductions | | | | | | | | 7,426 |
| Other receivables | | | | | | | | 8,856 |
| Total assets | | | | | | | | 11,022,956 |
| |
| Liabilities | | | | | | | | |
| Payable to custodian bank | | $ | | 39,591 | | | | |
| Payable for investments purchased | | | | 250,432 | | | | |
| Payable for fund shares redeemed | | | | 213,033 | | | | |
| Accrued management fee | | | | 5,063 | | | | |
| Distribution fees payable | | | | 5,712 | | | | |
| Other affiliated payables | | | | 4,195 | | | | |
| Other payables and accrued expenses | | 35,967 | | | | |
| Total liabilities | | | | | | | | 553,993 |
| |
| Net Assets | | | | | | $ | | 10,468,963 |
| Net Assets consist of: | | | | | | | | |
| Paid in capital | | | | | | $ | | 12,352,214 |
| Accumulated undistributed net real- | | | | | | |
| ized gain (loss) on investments and | | | | | | |
| foreign currency transactions | | | | | | | | (2,532,167) |
| Net unrealized appreciation (depreci- | | | | | | |
| ation) on investments and assets | | | | | | | | |
| and liabilities in foreign currencies . | | | | | | 648,916 |
| Net Assets | | | | | | $ | | 10,468,963 |
| Calculation of Maximum Offering Price | | | | | | |
| Class A: | | | | | | | | |
| Net Asset Value and redemption | | | | | | |
| price per share ($2,406,032 | | | | | | |
| ÷ 312,536 shares) | | | | | | $ | | 7.70 |
| Maximum offering price per share | | | | | | | | |
| (100/94.25 of $7.70) | | | | | | $ | | 8.17 |
| Class T: | | | | | | | | |
| Net Asset Value and redemption | | | | | | |
| price per share ($3,033,867 ÷ | | | | | | |
| 398,469 shares) | | | | | | $ | | 7.61 |
| Maximum offering price per share | | | | | | | | |
| (100/96.50 of $7.61) | | | | | | $ | | 7.89 |
| Class B: | | | | | | | | |
| Net Asset Value and offering price | | | | | | |
| per share ($2,864,193 ÷ | | | | | | | | |
| 384,883 shares)A | | | | | | $ | | 7.44 |
| Class C: | | | | | | | | |
| Net Asset Value and offering price | | | | | | |
| per share ($1,846,017 ÷ | | | | | | | | |
| 248,107 shares)A | | | | | | $ | | 7.44 |
| Institutional Class: | | | | | | | | |
| Net Asset Value, offering price and | | | | | | |
| redemption price per share | | | | | | | | |
| ($318,854 ÷ 40,924 shares) | | | | $ | | 7.79 |
| Statement of Operations | | | | |
| | | | | Year ended July 31, 2005 |
| Investment Income | | | | | | |
| Dividends | | | | $ | | 45,173 |
| Interest | | | | | | 7,531 |
| | | | | | | 52,704 |
| Less foreign taxes withheld | | | | | | (7,113) |
| Total income | | | | | | 45,591 |
| |
| Expenses | | | | | | |
| Management fee | | $ | | 72,715 | | |
| Transfer agent fees | | | | 63,697 | | |
| Distribution fees | | | | 81,485 | | |
| Accounting fees and expenses | | | | 16,532 | | |
| Independent trustees’ compensation | | 69 | | |
| Custodian fees and expenses | | | | 17,742 | | |
| Registration fees | | | | 54,742 | | |
| Audit | | | | 44,609 | | |
| Legal | | | | 50 | | |
| Miscellaneous | | | | 148 | | |
| Total expenses before reductions | | 351,789 | | |
| Expense reductions | | | | (139,266) | | 212,523 |
| |
| Net investment income (loss) | | | | | | (166,932) |
| Realized and Unrealized Gain (Loss) | | | | |
| Net realized gain (loss) on: | | | | | | |
| Investment securities | | | | (1,572,837) | | |
| Foreign currency transactions | | | | 7,932 | | |
| Total net realized gain (loss) | | | | | | (1,564,905) |
| Change in net unrealized appreci- | | | | |
| ation (depreciation) on: | | | | | | |
| Investment securities | | | | 3,597,519 | | |
| Assets and liabilities in foreign | | | | | | |
| currencies | | | | 3,478 | | |
| Total change in net unrealized | | | | | | |
| appreciation (depreciation) | | | | | | 3,600,997 |
| Net gain (loss) | | | | | | 2,036,092 |
| Net increase (decrease) in net as- | | | | |
| sets resulting from operations | | | | $ | | 1,869,160 |
| | A Redemption price per share is equal to net asset value less any applicable contingent deferred sales charge.
See accompanying notes which are an integral part of the financial statements.
|
A-57 Annual Report
| | Advisor Developing Communications Fund
Financial Statements - continued
|
| Statement of Changes in Net Assets | | | | | | |
| | | Year ended | | | | Year ended |
| | | July 31, | | | | July 31, |
| | | 2005 | | | | 2004 |
| Increase (Decrease) in Net Assets | | | | | | |
| Operations | | | | | | |
| Net investment income (loss) | | $ (166,932) | | $ | | (212,872) |
| Net realized gain (loss) | | (1,564,905) | | | | 3,031,717 |
| Change in net unrealized appreciation (depreciation) | | 3,600,997 | | | | (3,435,275) |
| Net increase (decrease) in net assets resulting from operations | | 1,869,160 | | | | (616,430) |
| Share transactions -- net increase (decrease) | | (4,921,642) | | | | 8,358,921 |
| Redemption fees | | 6,207 | | | | 70,726 |
| Total increase (decrease) in net assets | | (3,046,275) | | | | 7,813,217 |
| |
| Net Assets | | | | | | |
| Beginning of period | | 13,515,238 | | | | 5,702,021 |
| End of period | | $ 10,468,963 | | $ | | 13,515,238 |
| Financial Highlights – Class A | | | | | | | | | | |
| Years ended July 31, | | 2005 | | 2004 | | 2003 | | 2002 | | 2001F |
| Selected Per-Share Data | | | | | | | | | | |
| Net asset value, beginning of period | | $ 6.53 | | $ 5.57 | | $ 3.96 | | $ 8.40 | | $ 10.00 |
| Income from Investment Operations | | | | | | | | | | |
| Net investment income (loss)E | | (.07) | | (.09) | | (.04) | | (.05) | | (.04) |
| Net realized and unrealized gain (loss) | | 1.24 | | 1.01 | | 1.65 | | (4.40) | | (1.57) |
| Total from investment operations | | 1.17 | | .92 | | 1.61 | | (4.45) | | (1.61) |
| Redemption fees added to paid in capitalE | | —H | | .04 | | —H | | .01 | | .01 |
| Net asset value, end of period | | $ 7.70 | | $ 6.53 | | $ 5.57 | | $ 3.96 | | $ 8.40 |
| Total ReturnB,C D | | 17.92% | | 17.24% | | 40.66% | | (52.86)% | | (16.00)% |
| Ratios to Average Net AssetsG | | | | | | | | | | |
| Expenses before expense reductions | | 2.32% | | 2.38% | | 6.13% | | 4.97% | | 6.46%A |
| Expenses net of voluntary waivers, if any | | 1.45% | | 1.50% | | 1.50% | | 1.50% | | 1.50%A |
| Expenses net of all reductions | | 1.28% | | 1.35% | | 1.36% | | 1.40% | | 1.45%A |
| Net investment income (loss) | | (.92)% | | (1.18)% | | (.82)% | | (.85)% | | (.74)%A |
| Supplemental Data | | | | | | | | | | |
| Net assets, end of period (000 omitted) | | $ 2,406 | | $ 3,480 | | $ 970 | | $ 371 | | $ 934 |
| Portfolio turnover rate | | 250% | | 306% | | 167% | | 305% | | 644%A |
| | A Annualized
B Total returns for periods of less than one year are not annualized.
C Total returns would have been lower had certain expenses not been reduced during the periods shown.
D Total returns do not include the effect of the sales charges.
E Calculated based on average shares outstanding during the period.
F For the period December 27, 2000 (commencement of operations) to July 31, 2001.
G Expense ratios reflect operating expenses of the class. Expenses before reductions do not reflect amounts reimbursed by the investment adviser or reductions from brokerage service arrangements or other expense offset arrangements and do not
represent the amount paid by the class during periods when reimbursements or reductions occur. Expense ratios before reductions for start up periods may not be representative of longer term operating periods. Expenses net of any voluntary
waivers reflect expenses after reimbursement by the investment adviser but prior to reductions from brokerage service arrangements or other expense offset arrangements. Expenses net of all reductions represent the net expenses paid by the class.
H Amount represents less than $.01 per share.
|
See accompanying notes which are an integral part of the financial statements.
Developing Communications A-58
| Financial Highlights – Class T | | | | | | | | | | |
| Years ended July 31, | | 2005 | | 2004 | | 2003 | | 2002 | | 2001F |
| Selected Per-Share Data | | | | | | | | | | |
| Net asset value, beginning of period | | $ 6.48 | | $ 5.54 | | $ 3.95 | | $ 8.40 | | $ 10.00 |
| Income from Investment Operations | | | | | | | | | | |
| Net investment income (loss)E | | (.08) | | (.10) | | (.05) | | (.07) | | (.05) |
| Net realized and unrealized gain (loss) | | 1.21 | | 1.00 | | 1.64 | | (4.39) | | (1.56) |
| Total from investment operations | | 1.13 | | .90 | | 1.59 | | (4.46) | | (1.61) |
| Redemption fees added to paid in capitalE | | —H | | .04 | | —H | | .01 | | .01 |
| Net asset value, end of period | | $ 7.61 | | $ 6.48 | | $ 5.54 | | $ 3.95 | | $ 8.40 |
| Total ReturnB,C,D | | 17.44% | | 16.97% | | 40.25% | | (52.98)% | | (16.00)% |
| Ratios to Average Net AssetsG | | | | | | | | | | |
| Expenses before expense reductions | | 2.78% | | 3.06% | | 6.82% | | 5.36% | | 6.66%A |
| Expenses net of voluntary waivers, if any | | 1.71% | | 1.75% | | 1.75% | | 1.75% | | 1.75%A |
| Expenses net of all reductions | | 1.54% | | 1.60% | | 1.61% | | 1.64% | | 1.70%A |
| Net investment income (loss) | | (1.18)% | | (1.43)% | | (1.07)% | | (1.10)% | | (.99)%A |
| Supplemental Data | | | | | | | | | | |
| Net assets, end of period (000 omitted) | | $ 3,034 | | $ 3,250 | | $ 1,723 | | $ 775 | | $ 2,131 |
| Portfolio turnover rate | | 250% | | 306% | | 167% | | 305% | | 644%A |
| | A Annualized
B Total returns for periods of less than one year are not annualized.
C Total returns would have been lower had certain expenses not been reduced during the periods shown.
D Total returns do not include the effect of the sales charges.
E Calculated based on average shares outstanding during the period.
F For the period December 27, 2000 (commencement of operations) to July 31, 2001.
G Expense ratios reflect operating expenses of the class. Expenses before reductions do not reflect amounts reimbursed by the investment adviser or reductions from brokerage service arrangements or other expense offset arrangements and do not
represent the amount paid by the class during periods when reimbursements or reductions occur. Expense ratios before reductions for start up periods may not be representative of longer term operating periods. Expenses net of any voluntary
waivers reflect expenses after reimbursement by the investment adviser but prior to reductions from brokerage service arrangements or other expense offset arrangements. Expenses net of all reductions represent the net expenses paid by the class.
H Amount represents less than $.01 per share.
|
| Financial Highlights – Class B | | | | | | | | | | |
| Years ended July 31, | | 2005 | | 2004 | | 2003 | | 2002 | | 2001F |
| Selected Per-Share Data | | | | | | | | | | |
| Net asset value, beginning of period | | $ 6.36 | | $ 5.47 | | $ 3.92 | | $ 8.37 | | $ 10.00 |
| Income from Investment Operations | | | | | | | | | | |
| Net investment income (loss)E | | (.12) | | (.13) | | (.07) | | (.10) | | (.07) |
| Net realized and unrealized gain (loss) | | 1.20 | | .98 | | 1.62 | | (4.36) | | (1.57) |
| Total from investment operations | | 1.08 | | .85 | | 1.55 | | (4.46) | | (1.64) |
| Redemption fees added to paid in capitalE | | —H | | .04 | | —H | | .01 | | .01 |
| Net asset value, end of period | | $ 7.44 | | $ 6.36 | | $ 5.47 | | $ 3.92 | | $ 8.37 |
| Total ReturnB,C,D | | 16.98% | | 16.27% | | 39.54% | | (53.17)% | | (16.30)% |
| Ratios to Average Net AssetsG | | | | | | | | | | |
| Expenses before expense reductions | | 3.14% | | 3.48% | | 6.88% | | 5.62% | | 7.21%A |
| Expenses net of voluntary waivers, if any | | 2.20% | | 2.25% | | 2.25% | | 2.25% | | 2.25%A |
| Expenses net of all reductions | | 2.04% | | 2.11% | | 2.11% | | 2.14% | | 2.20%A |
| Net investment income (loss) | | (1.68)% | | (1.93)% | | (1.56)% | | (1.60)% | | (1.49)%A |
| Supplemental Data | | | | | | | | | | |
| Net assets, end of period (000 omitted) | | $ 2,864 | | $ 2,998 | | $ 1,846 | | $ 1,162 | | $ 2,236 |
| Portfolio turnover rate | | 250% | | 306% | | 167% | | 305% | | 644%A |
| | A Annualized
B Total returns for periods of less than one year are not annualized.
C Total returns would have been lower had certain expenses not been reduced during the periods shown.
D Total returns do not include the effect of the contingent deferred sales charge.
E Calculated based on average shares outstanding during the period.
F For the period December 27, 2000 (commencement of operations) to July 31, 2001.
G Expense ratios reflect operating expenses of the class. Expenses before reductions do not reflect amounts reimbursed by the investment adviser or reductions from brokerage service arrangements or other expense offset arrangements and do not
represent the amount paid by the class during periods when reimbursements or reductions occur. Expense ratios before reductions for start up periods may not be representative of longer term operating periods. Expenses net of any voluntary
waivers reflect expenses after reimbursement by the investment adviser but prior to reductions from brokerage service arrangements or other expense offset arrangements. Expenses net of all reductions represent the net expenses paid by the class.
H Amount represents less than $.01 per share.
|
See accompanying notes which are an integral part of the financial statements.
A-59 Annual Report
| Financial Highlights – Class C | | | | | | | | | | |
| Years ended July 31, | | 2005 | | 2004 | | 2003 | | 2002 | | 2001F |
| Selected Per-Share Data | | | | | | | | | | |
| Net asset value, beginning of period | | $ 6.36 | | $ 5.47 | | $ 3.92 | | $ 8.37 | | $ 10.00 |
| Income from Investment Operations | | | | | | | | | | |
| Net investment income (loss)E | | (.12) | | (.14) | | (.07) | | (.10) | | (.07) |
| Net realized and unrealized gain (loss) | | 1.20 | | .99 | | 1.62 | | (4.36) | | (1.57) |
| Total from investment operations | | 1.08 | | .85 | | 1.55 | | (4.46) | | (1.64) |
| Redemption fees added to paid in capitalE | | —H | | .04 | | —H | | .01 | | .01 |
| Net asset value, end of period | | $ 7.44 | | $ 6.36 | | $ 5.47 | | $ 3.92 | | $ 8.37 |
| Total ReturnB,C,D | | 16.98% | | 16.27% | | 39.54% | | (53.17)% | | (16.30)% |
| Ratios to Average Net AssetsG | | | | | | | | | | |
| Expenses before expense reductions | | 3.07% | | 3.19% | | 6.81% | | 5.49% | | 7.09%A |
| Expenses net of voluntary waivers, if any | | 2.19% | | 2.25% | | 2.25% | | 2.25% | | 2.25%A |
| Expenses net of all reductions | | 2.02% | | 2.10% | | 2.11% | | 2.14% | | 2.20%A |
| Net investment income (loss) | | (1.66)% | | (1.93)% | | (1.57)% | | (1.60)% | | (1.49)%A |
| Supplemental Data | | | | | | | | | | |
| Net assets, end of period (000 omitted) | | $ 1,846 | | $ 3,180 | | $ 1,009 | | $ 667 | | $ 1,566 |
| Portfolio turnover rate | | 250% | | 306% | | 167% | | 305% | | 644%A |
A Annualized
B Total returns for periods of less than one year are not annualized.
C Total returns would have been lower had certain expenses not been reduced during the periods shown.
D Total returns do not include the effect of the contingent deferred sales charge.
E Calculated based on average shares outstanding during the period.
F For the period December 27, 2000 (commencement of operations) to July 31, 2001.
G Expense ratios reflect operating expenses of the class. Expenses before reductions do not reflect amounts reimbursed by the investment adviser or reductions from brokerage service arrangements or other expense offset arrangements and do not
represent the amount paid by the class during periods when reimbursements or reductions occur. Expense ratios before reductions for start up periods may not be representative of longer term operating periods. Expenses net of any voluntary
waivers reflect expenses after reimbursement by the investment adviser but prior to reductions from brokerage service arrangements or other expense offset arrangements. Expenses net of all reductions represent the net expenses paid by the class.
H Amount represents less than $.01 per share.
|
| Financial Highlights – Institutional Class | | | | | | | | | | |
| Years ended July 31, | | 2005 | | 2004 | | 2003 | | 2002 | | 2001E |
| Selected Per-Share Data | | | | | | | | | | |
| Net asset value, beginning of period | | $ 6.60 | | $ 5.61 | | $ 3.98 | | $ 8.42 | | $ 10.00 |
| Income from Investment Operations | | | | | | | | | | |
| Net investment income (loss)D | | (.05) | | (.07) | | (.03) | | (.04) | | (.03) |
| Net realized and unrealized gain (loss) | | 1.24 | | 1.02 | | 1.66 | | (4.41) | | (1.56) |
| Total from investment operations | | 1.19 | | .95 | | 1.63 | | (4.45) | | (1.59) |
| Redemption fees added to paid in capitalD | | —G | | .04 | | —G | | .01 | | .01 |
| Net asset value, end of period | | $ 7.79 | | $ 6.60 | | $ 5.61 | | $ 3.98 | | $ 8.42 |
| Total ReturnB,C | | 18.03% | | 17.65% | | 40.95% | | (52.73)% | | (15.80)% |
| Ratios to Average Net AssetsF | | | | | | | | | | |
| Expenses before expense reductions | | 1.85% | | 1.55% | | 5.34% | | 4.24% | | 5.95%A |
| Expenses net of voluntary waivers, if any | | 1.18% | | 1.25% | | 1.25% | | 1.25% | | 1.25%A |
| Expenses net of all reductions | | 1.01% | | 1.11% | | 1.11% | | 1.14% | | 1.20%A |
| Net investment income (loss) | | (.65)% | | (.93)% | | (.57)% | | (.60)% | | (.49)%A |
| Supplemental Data | | | | | | | | | | |
| Net assets, end of period (000 omitted) | | $ 319 | | $ 607 | | $ 154 | | $ 100 | | $ 283 |
| Portfolio turnover rate | | 250% | | 306% | | 167% | | 305% | | 644%A |
| | A Annualized
B Total returns for periods of less than one year are not annualized.
C Total returns would have been lower had certain expenses not been reduced during the periods shown.
D Calculated based on average shares outstanding during the period.
E For the period December 27, 2000 (commencement of operations) to July 31, 2001.
F Expense ratios reflect operating expenses of the class. Expenses before reductions do not reflect amounts reimbursed by the investment adviser or reductions from brokerage service arrangements or other expense offset arrangements and do not
represent the amount paid by the class during periods when reimbursements or reductions occur. Expense ratios before reductions for start up periods may not be representative of longer term operating periods. Expenses net of any voluntary
waivers reflect expenses after reimbursement by the investment adviser but prior to reductions from brokerage service arrangements or other expense offset arrangements. Expenses net of all reductions represent the net expenses paid by the class.
G Amount represents less than $.01 per share.
|
See accompanying notes which are an integral part of the financial statements.
Developing Communications A-60
Notes to Financial Statements
For the period ended July 31, 2005
|
1. Significant Accounting Policies.
|
Fidelity Advisor Developing Communications Fund (the fund) is a non-diversified fund of Fidelity Advisor Series VII (the trust) and is authorized to issue an unlimited number of shares. The trust is registered under the Investment Company Act of 1940, as amended (the 1940 Act), as an open-end management investment company organized as a Massachusetts business trust.
The fund offers Class A, Class T, Class B, Class C, and Institutional Class shares, each of which has equal rights as to assets and voting privileges. Each class has exclusive voting rights with respect to matters that affect that class. Class B shares will automatically convert to Class A shares after a holding period of seven years from the initial date of purchase. Investment income, realized and unrealized capital gains and losses, the common expenses of the fund, and certain fund-level expense reductions, if any, are allocated on a pro rata basis to each class based on the relative net assets of each class to the total net assets of the fund. Each class differs with respect to transfer agent and distribution and service plan fees incurred. Certain expense reductions also differ by class.
The financial statements have been prepared in conformity with accounting principles generally accepted in the United States of America, which require management to make certain estimates and assumptions at the date of the financial statements. The following summarizes the significant accounting policies of the fund:
Security Valuation. Net asset value per share (NAV calculation) is calculated as of the close of business of the New York Stock Exchange, normally 4:00 p.m. Eastern time. Equity securities, including restricted securities, for which market quotations are available are valued at the last sale price or official closing price (closing bid price or last evaluated quote if no sale has occurred) on the primary market or exchange on which they trade. If prices are not readily available or do not accurately reflect fair value for a security, or if a security’s value has been materially affected by events occurring after the close of the exchange or market on which the security is principally traded, that security may be valued by another method that the Board of Trustees believes accurately reflects fair value. A security’s valuation may differ depending on the method used for determining value. Price movements in futures contracts and ADRs, market and trading trends, the bid/ask quotes of brokers and off-exchange institutional trading may be reviewed in the course of making a good faith determination of a security’s fair value. Short-term securities with remaining maturities of sixty days or less for which quotations are not readily available are valued on the basis of amortized cost. Investments in open-end investment companies are valued at their net asset value each business day.
Foreign Currency. The fund uses foreign currency contracts to facilitate transactions in foreign-denominated securities. Losses from these transactions may arise from changes in the value of the foreign currency or if the counterparties do not perform under the contracts’ terms.
Foreign-denominated assets, including investment securities, and liabilities are translated into U.S. dollars at the exchange rate at period end. Purchases and sales of investment securities, income and dividends received and expenses denominated in foreign currencies are translated into U.S. dollars at the exchange rate in effect on the transaction date.
The effects of exchange rate fluctuations on investments are included with the net realized and unrealized gain (loss) on investment securities. Other foreign currency transactions resulting in realized and unrealized gain (loss) are disclosed separately.
Investment Transactions and Income. Security transactions are accounted for as of trade date. Gains and losses on securities sold are determined on the basis of identified cost and may include proceeds received from litigation. Dividend income is recorded on the ex-dividend date, except for certain dividends from foreign securities where the ex-dividend date may have passed, which are recorded as soon as the fund is informed of the ex-dividend date. Non-cash dividends included in dividend income, if any, are recorded at the fair market value of the securities received. Distributions received on securities that represent a return of capital or capital gain are recorded as a reduction of cost of investments and/or as a realized gain. The fund estimates the components of distributions received that may be considered return of capital distributions or capital gain distributions. Interest income is accrued as earned. Interest income includes coupon interest and amortization of premium and accretion of discount on debt securities. Investment income is recorded net of foreign taxes withheld where recovery of such taxes is uncertain.
Expenses. Most expenses of the trust can be directly attributed to a fund. Expenses which cannot be directly attributed are apportioned among each fund in the trust.
Income Tax Information and Distributions to Shareholders. Each year, the fund intends to qualify as a regulated investment company by distributing all of its taxable income and realized gains under Subchapter M of the Internal Revenue Code. As a result, no provision for income taxes is required in the accompanying financial statements. Foreign taxes are provided for based on the fund’s understanding of the tax rules and rates that exist in the foreign markets in which it invests.
Distributions are recorded on the ex-dividend date. Income dividends and capital gain distributions are declared separately for each class. Income and capital gain distributions are determined in accordance with income tax regulations, which may differ from generally accepted accounting principles. Capital accounts within the financial statements are adjusted for permanent book-tax differences. These adjustments have no impact on net assets or the results of operations. Temporary book-tax differences will reverse in a subsequent period.
| | Notes to Financial Statements - continued
1. Significant Accounting Policies - continued
Income Tax Information and Distributions to Shareholders - continued
Book-tax differences are primarily due to foreign currency transactions, net operating losses, capital loss carryforwards and losses deferred due to wash
sales and excise tax regulations.
The tax-basis components of distributable earnings and the federal tax cost as of period end were as follows:
|
| Unrealized appreciation | | $ 1,354,701 |
| Unrealized depreciation | | (877,334) |
| Net unrealized appreciation (depreciation) | | 477,367 |
| Capital loss carryforward | | (1,987,794) |
| |
| Cost for federal income tax purposes | | $ 10,091,882 |
| | Short-Term Trading (Redemption) Fees. Shares held in the fund less than 60 days are subject to a redemption fee equal to 1.00% of the proceeds of
the redeemed shares. All redemption fees, including any estimated redemption fees paid by Fidelity Management & Research Company (FMR), are
retained by the fund and accounted for as an addition to paid in capital.
2. Operating Policies.
Repurchase Agreements. FMR has received an Exemptive Order from the Securities and Exchange Commission (the SEC) which permits the fund
and other affiliated entities of FMR to transfer uninvested cash balances into joint trading accounts which are then invested in repurchase agreements.
The fund may also invest directly with institutions in repurchase agreements. Repurchase agreements are collateralized by government or non-
government securities. Collateral is held in segregated accounts with custodian banks and may be obtained in the event of a default of the counterparty.
The fund monitors, on a daily basis, the value of the collateral to ensure it is at least equal to the principal amount of the repurchase agreement (in-
cluding accrued interest). In the event of a default by the counterparty, realization of the collateral proceeds could be delayed, during which time the
value of the collateral may decline.
3. Purchases and Sales of Investments.
Purchases and sales of securities, other than short-term securities and U.S. government securities, aggregated $30,430,741 and $34,804,168,
respectively.
4. Fees and Other Transactions with Affiliates.
Management Fee. FMR and its affiliates provide the fund with investment management related services for which the fund pays a monthly manage-
ment fee. The management fee is the sum of an individual fund fee rate that is based on an annual rate of .30% of the fund’s average net assets and a
group fee rate that averaged .27% during the period. The group fee rate is based upon the average net assets of all the mutual funds advised by FMR.
The group fee rate decreases as assets under management increase and increases as assets under management decrease. For the period, the total
annual management fee rate was .57% of the fund’s average net assets.
Distribution and Service Plan. In accordance with Rule 12b-1 of the 1940 Act, the fund has adopted separate Distribution and Service Plans for each
class of shares. Certain classes pay Fidelity Distributors Corporation (FDC), an affiliate of FMR, separate Distribution and Service Fees, each of which
is based on an annual percentage of each class’ average net assets. In addition, FDC may pay financial intermediaries for selling shares of the fund and
providing shareholder support services. For the period, the Distribution and Service Fee rates and the total amounts paid to and retained by FDC were
as follows:
|
| | | Distribution | | Service | | | | Paid to | | | | Retained |
| | | Fee | | Fee | | | | FDC | | | | by FDC |
| Class A | | 0% | | .25% | | $ | | 8,386 | | $ | | 71 |
| Class T | | 25% | | .25% | | | | 15,752 | | | | 120 |
| Class B | | 75% | | .25% | | | | 31,380 | | | | 23,601 |
| Class C | | 75% | | .25% | | | | 25,967 | | | | 10,222 |
| |
| | | | | | | $ | | 81,485 | | $ | | 34,014 |
Sales Load. FDC receives a front-end sales charge of up to 5.75% for selling Class A shares, and 3.50% for selling Class T shares, some of which is paid to financial intermediaries for selling shares of the fund. FDC receives the proceeds of contingent deferred sales charges levied on Class A, Class T, Class B, and Class C redemptions. These charges depend on the holding period. The deferred sales charges range from 5% to 1% for Class B, 1% for Class C, and .25% for certain purchases of Class A and Class T shares.
Developing Communications A-62
| | 4. Fees and Other Transactions with Affiliates - continued
Sales Load - continued
For the period, sales charge amounts retained by FDC were as follows:
|
| | | | | Retained |
| | | | | by FDC |
| Class A | | $ | | 3,113 |
| Class T | | | | 2,230 |
| Class B* | | | | 18,971 |
| Class C* | | | | 7,224 |
| Institutional Class | | | | — |
| | | $ | | 31,538 |
* When Class B and Class C shares are initially sold, FDC pays commissions from its own resources to financial intermediaries through which the sales are made.
Transfer Agent Fees. Fidelity Investments Institutional Operations Company, Inc. (FIIOC), an affiliate of FMR, is the transfer, dividend disbursing and shareholder servicing agent for each class of the fund. FIIOC receives account fees and asset-based fees that vary according to the account size and type of account of the shareholders of the respective classes of the fund. FIIOC pays for typesetting, printing and mailing of shareholder reports, except proxy statements. For the period the total transfer agent fees paid by each class to FIIOC, were as follows:
| | | | | | | % of |
| | | | | | | Average |
| | | | | Amount | | Net Assets |
| Class A | | $ | | 14,815 | | .44 |
| Class T | | | | 20,585 | | .65 |
| Class B | | | | 15,935 | | .51 |
| Class C | | | | 11,392 | | .44 |
| Institutional Class | | | | 970 | | .22 |
| | | $ | | 63,697 | | |
Accounting Fees. Fidelity Service Company, Inc. (FSC), an affiliate of FMR, maintains the fund’s accounting records. The fee is based on the level of
average net assets for the month.
Central Funds. The fund may invest in affiliated Central Funds managed by Fidelity Investments Money Management, Inc. (FIMM) an affiliate of
FMR. The Central Funds are open-end investment companies available only to investment companies and other accounts managed by FMR and its
affiliates. The Money Market Central Funds seek preservation of capital and current income. The Central Funds do not pay a management fee. Income
distributions earned by the fund are recorded as income in the accompanying financial statements and totaled $7,283 for the period.
Brokerage Commissions. The fund placed a portion of its portfolio transactions with brokerage firms which are affiliates of the investment adviser.
The commissions paid to these affiliated firms were $3,162 for the period.
5. Committed Line of Credit.
The fund participates with other funds managed by FMR in a $4.2 billion credit facility (the “line of credit”) to be utilized for temporary or emergency
purposes to fund shareholder redemptions or for other short-term liquidity purposes. The fund has agreed to pay commitment fees on its pro rata
portion of the line of credit. During the period, there were no borrowings on this line of credit.
|
A-63 Annual Report
Notes to Financial Statements - continued
6. Expense Reductions.
FMR voluntarily agreed to reimburse each class to the extent annual operating expenses exceeded certain levels of average net assets as noted in the
table below. Some expenses, for example interest expense, are excluded from this reimbursement.
The following classes were in reimbursement during the period:
|
| | | Expense | | | | Reimbursement |
| | | Limitations | | | | from adviser |
| Class A | | 1.50% | | -- 1.40%* | | $ | | 29,260 |
| Class T | | 1.75% | | -- 1.65%* | | | | 33,777 |
| Class B | | 2.25% | | -- 2.15%* | | | | 29,212 |
| Class C | | 2.25% | | -- 2.15%* | | | | 22,792 |
| Institutional Class | | 1.25% | | -- 1.15%* | | | | 2,973 |
| | | | | | | $ | | 118,014 |
* Expense limitation in effect at period end.
Many of the brokers with whom FMR places trades on behalf of the fund provided services to the fund in addition to trade execution. These services
included payments of certain expenses on behalf of the fund totaling $21,252 for the period.
7. Other.
The fund’s organizational documents provide former and current trustees and officers with a limited indemnification against liabilities arising in
connection with the performance of their duties to the fund. In the normal course of business, the fund may also enter into contracts that provide
general indemnifications. The fund’s maximum exposure under these arrangements is unknown as this would be dependent on future claims that may
be made against the fund. The risk of material loss from such claims is considered remote.
8. Share Transactions.
Transactions for each class of shares were as follows:
|
| | | | | Shares | | | | | | Dollars | | |
| Years ended July 31, | | 2005 | | | | 2004 | | 2005 | | | | 2004 |
| Class A | | | | | | | | | | | | |
| Shares sold | | 416,894 | | | | 856,040 | | $ 3,024,999 | | $ | | 6,688,889 |
| Shares redeemed | | (636,989) | | | | (497,414) | | (4,589,727) | | | | (3,670,051) |
| Net increase (decrease) | | (220,095) | | | | 358,626 | | $ (1,564,728) | | $ | | 3,018,838 |
| Class T | | | | | | | | | | | | |
| Shares sold | | 174,922 | | | | 608,342 | | $ 1,257,919 | | $ | | 4,433,681 |
| Shares redeemed | | (277,992) | | | | (417,749) | | (1,946,912) | | | | (2,928,626) |
| Net increase (decrease) | | (103,070) | | | | 190,593 | | $ (688,993) | | $ | | 1,505,055 |
| Class B | | | | | | | | | | | | |
| Shares sold | | 193,607 | | | | 592,476 | | $ 1,369,993 | | $ | | 4,376,737 |
| Shares redeemed | | (279,761) | | | | (458,816) | | (1,968,809) | | | | (3,282,550) |
| Net increase (decrease) | | (86,154) | | | | 133,660 | | $ (598,816) | | $ | | 1,094,187 |
| Class C | | | | | | | | | | | | |
| Shares sold | | 114,060 | | | | 580,072 | | $ 812,760 | | $ | | 4,396,643 |
| Shares redeemed | | (365,782) | | | | (264,829) | | (2,486,084) | | | | (1,922,022) |
| Net increase (decrease) | | (251,722) | | | | 315,243 | | $ (1,673,324) | | $ | | 2,474,621 |
| Institutional Class | | | | | | | | | | | | |
| Shares sold | | 11,594 | | | | 609,795 | | $ 84,651 | | $ | | 4,639,769 |
| Shares redeemed | | (62,684) | | | | (545,179) | | (480,432) | | | | (4,373,549) |
| Net increase (decrease) | | (51,090) | | | | 64,616 | | $ (395,781) | | $ | | 266,220 |
Developing Communications A-64
| | Advisor Electronics Fund — Class A, T, B, and C
Performance
Average annual total return reflects the change in the value of an
investment, assuming reinvestment of the class’ dividend income and
capital gains (the profits earned upon the sale of securities that have
grown in value) and assuming a constant rate of performance each
year. The $10,000 table and the fund’s returns do not reflect the
deduction of taxes that a shareholder would pay on fund distributions
or the redemption of fund shares. During periods of reimbursement by
Fidelity, a fund’s total return will be greater than it would be had the
reimbursement not occurred. How a fund did yesterday is no guaran-
tee of how it will do tomorrow.
|
| Average Annual Total Returns | | | | |
| Periods ended July 31, 2005 | | Past 1 | | Life of |
| | | year | | fundA |
| Class A (incl. 5.75% sales charge) | | 15.16% | | --5.86% |
| Class T (incl. 3.50% sales charge) | | 17.63% | | --5.58% |
| Class B (incl. contingent deferred sales charge)B | | 16.18% | | --5.73% |
| Class C (incl. contingent deferred sales charge)C | | 20.22% | | --5.34% |
A From December 27, 2000.
B Class B shares’ contingent deferred sales charges included in the past one year and
life of fund total return figures are 5% and 2%, respectively.
C Class C shares’ contingent deferred sales charges included in the past one year and
life of fund total return figures are 1% and 0%, respectively.
|
$10,000 Over Life of Fund
Let’s say hypothetically that $10,000 was invested in Fidelity Advisor
Electronics Fund — Class T on December 27, 2000, when the fund
started, and the current 3.50% sales charge was paid. The chart shows
how the value of your investment would have changed, and also shows
how the S&P 500 Index performed over the same period.
|
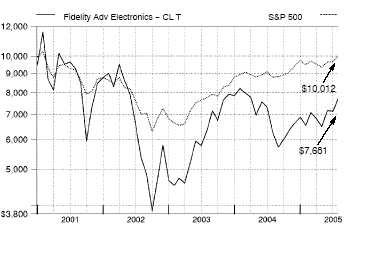
| | Advisor Electronics Fund — Class A, T, B, and C
Management’s Discussion of Fund Performance
Comments from Jim Morrow, Portfolio Manager of Fidelity® Advisor Electronics Fund
A late-inning rally on Wall Street helped push some key U.S. equity indexes to four-year highs by the conclusion of the 12-month period ending July 31,
2005. Spurred on by bullish economic data and strong corporate earnings, investors enjoyed a stellar month of July, capping off a turbulent 12-month
period for U.S. equity markets. Stock prices bounced up and down during most of the year, moving in cadence with gyrations in the price of crude oil
and investors’ gathering and ebbing concerns about inflation. The Federal Reserve Board raised short-term interest rates eight times during the period,
also affecting overall market sentiment. Despite their fluctuations, the major equity indexes finished on a high note, with the Standard & Poor’s 500SM
Index and the NASDAQ Composite® Index posting gains of 14.05% and 16.51%, respectively, for the period. The small-cap Russell 2000® Index rose
24.78% and the Russell Midcap® Index jumped 28.93%, while the blue-chips’ Dow Jones Industrial AverageSM advanced only 7.29% .
For the 12 months ending July 31, 2005, the fund’s Class A, Class T, Class B and Class C shares returned 22.19%, 21.90%, 21.18% and 21.22%,
respectively, beating the S&P 500® and the 11.63% return of the Goldman Sachs® Technology Index. Favorable stock selection in semiconductors and a
significant overweighting in the group were the main factors boosting the fund’s performance versus the sector benchmark. National Semiconductor
was the fund’s top contributor both in absolute and relative terms. The company makes high-performance analog semiconductors for cellular handsets
and flat-panel displays — end markets that enjoyed strong demand during the period. The second-best contributor was Marvell Technology Group, a
maker of high-speed controllers for disk drives. The stock benefited from robust demand for laptop and notebook computers. I sold Marvell for valua-
tion reasons as the period progressed. As a result of its foreign holdings, favorable currency movements helped boost the fund’s overall returns during
the period. Factors that held back the fund’s performance included unfavorable stock picking in wireless telecommunications equipment. In absolute
terms and relative to the sector index, Micron Technology was the biggest detractor. Weak pricing for DRAM (dynamic random access memory) due to
stiff competition from Asian rivals hurt the stock. Canada-based ATI Technologies, a supplier of graphics chips for computer gaming and related
applications, also held back performance, as a delayed product cycle hampered the stock.
The views expressed in this statement reflect those of the portfolio manager only through the end of the period of the report as stated on the cover and
do not necessarily represent the views of Fidelity or any other person in the Fidelity organization. Any such views are subject to change at any time
based upon market or other conditions and Fidelity disclaims any responsibility to update such views. These views may not be relied on as invest-
ment advice and, because investment decisions for a Fidelity fund are based on numerous factors, may not be relied on as an indication of trading
intent on behalf of any Fidelity fund.
|
Electronics A-66
Shareholder Expense Example
|
As a shareholder of the Fund, you incur two types of costs: (1) transaction costs, including sales charges (loads) on purchase payments or redemption proceeds, redemption fees, and (2) ongoing costs, including management fees, distribution and/or service (12b-1) fees and other Fund expenses. This Example is intended to help you understand your ongoing costs (in dollars) of investing in the Fund and to compare these costs with the ongoing costs of investing in other mutual funds.
The Example is based on an investment of $1,000 invested at the beginning of the period and held for the entire period (February 1, 2005 to July 31, 2005).
The first line of the table below for each class of the Fund provides information about actual account values and actual expenses. You may use the information in this line, together with the amount you invested, to estimate the expenses that you paid over the period. Simply divide your account value by $1,000.00 (for example, an $8,600 account value divided by $1,000.00 = 8.6), then multiply the result by the number in the first line for a class of the Fund under the heading entitled “Expenses Paid During Period” to estimate the expenses you paid on your account during this period.
Hypothetical Example for Comparison Purposes
|
The second line of the table below for each class of the Fund provides information about hypothetical account values and hypothetical expenses based on a Class’ actual expense ratio and an assumed rate of return of 5% per year before expenses, which is not the Class’ actual return. The hypothetical account values and expenses may not be used to estimate the actual ending account balance or expenses you paid for the period. You may use this information to compare the ongoing costs of investing in the Fund and other funds. To do so, compare this 5% hypothetical example with the 5% hypothetical examples that appear in the shareholder reports of the other funds.
Please note that the expenses shown in the table are meant to highlight your ongoing costs only and do not reflect any transaction costs. Therefore, the second line of the table is useful in comparing ongoing costs only, and will not help you determine the relative total costs of owning different funds. In addition, if these transactional costs were included, your costs would have been higher.
| | | | | | | | | | | Expenses Paid |
| | | Beginning | | | | Ending | | | | During Period* |
| | | Account Value | | | | Account Value | | | | February 1, 2005 |
| | | February 1, 2005 | | | | July 31, 2005 | | | | to July 31, 2005 |
| Class A | | | | | | | | | | |
| Actual | | $ 1,000.00 | | $ | | 1,175.40 | | $ | | 7.55 |
| HypotheticalA | | $ 1,000.00 | | $ | | 1,017.85 | | $ | | 7.00 |
| Class T | | | | | | | | | | |
| Actual | | $ 1,000.00 | | $ | | 1,174.00 | | $ | | 8.89 |
| HypotheticalA | | $ 1,000.00 | | $ | | 1,016.61 | | $ | | 8.25 |
| Class B | | | | | | | | | | |
| Actual | | $ 1,000.00 | | $ | | 1,169.90 | | $ | | 11.57 |
| HypotheticalA | | $ 1,000.00 | | $ | | 1,014.13 | | $ | | 10.74 |
| Class C | | | | | | | | | | |
| Actual | | $ 1,000.00 | | $ | | 1,170.20 | | $ | | 11.57 |
| HypotheticalA | | $ 1,000.00 | | $ | | 1,014.13 | | $ | | 10.74 |
| Institutional Class | | | | | | | | | | |
| Actual | | $ 1,000.00 | | $ | | 1,176.00 | | $ | | 6.20 |
| HypotheticalA | | $ 1,000.00 | | $ | | 1,019.09 | | $ | | 5.76 |
| |
| A 5% return per year before expenses | | | | | | | | | | |
* Expenses are equal to each Class’ annualized expense ratio (shown in the table below); multiplied by the average account value over the period, multiplied by 181/365 (to reflect the one-half year period).
| | | Annualized |
| | | Expense Ratio |
| Class A | | 1.40% |
| Class T | | 1.65% |
| Class B | | 2.15% |
| Class C | | 2.15% |
| Institutional Class | | 1.15% |
Advisor Electronics Fund
Investment Changes
|
| Top Ten Stocks as of July 31, 2005 | | |
| | | % of fund’s | | % of fund’s net assets |
| | | net assets | | 6 months ago |
| Maxim Integrated Products, Inc. | | 10.3 | | 3.3 |
| Intel Corp. | | 9.8 | | 10.5 |
| Analog Devices, Inc. | | 8.8 | | 8.7 |
| National Semiconductor Corp. | | 8.4 | | 9.4 |
| Arrow Electronics, Inc. | | 6.8 | | 1.9 |
| Nokia Corp. sponsored ADR | | 4.5 | | 0.0 |
| Hon Hai Precision Industries Co. | | | | |
| Ltd. | | 3.5 | | 3.8 |
| Flextronics International Ltd. | | 3.1 | | 3.9 |
| KLA-Tencor Corp. | | 2.9 | | 4.2 |
| Cohu, Inc. | | 2.8 | | 0.0 |
| | | 60.9 | | |
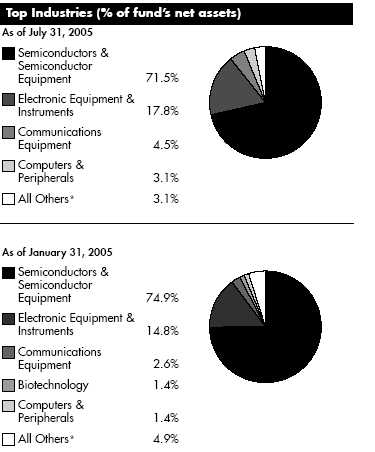
* Includes short term investments and net other assets.
Prior period industry classifications reflect the categories in place as of the date
indicated and have not been adjusted to reflect current industry classifications.
|
Electronics A-68
Advisor Electronics Fund
Investments July 31, 2005
Showing Percentage of Net Assets
|
| Common Stocks — 96.9% | | | | |
| | | Shares | | Value (Note 1) |
| |
| COMMUNICATIONS EQUIPMENT – 4.5% | | | | |
| Communications Equipment – 4.5% | | | | |
| Nokia Corp. sponsored ADR | | 125,000 | | $ 1,993,750 |
| COMPUTERS & PERIPHERALS – 3.1% | | | | |
| Computer Hardware – 0.9% | | | | |
| Quanta Computer, Inc. | | 224,274 | | 413,081 |
| Computer Storage & Peripherals – 2.2% | | | | |
| Mobility Electronics, Inc. (a) | | 25,000 | | 290,000 |
| SanDisk Corp. (a) | | 20,000 | | 676,400 |
| | | | | 966,400 |
| |
| TOTAL COMPUTERS & PERIPHERALS | | | | 1,379,481 |
| |
| ELECTRONIC EQUIPMENT & INSTRUMENTS – 17.8% | | |
| Electronic Equipment & Instruments – 1.3% | | | | |
| Amphenol Corp. Class A | | 13,360 | | 595,054 |
| Electronic Manufacturing Services – 6.6% | | | | |
| Flextronics International Ltd. (a) | | 100,000 | | 1,354,000 |
| Hon Hai Precision Industries Co. Ltd. | | 277,949 | | 1,561,119 |
| | | | | 2,915,119 |
| Technology Distributors – 9.9% | | | | |
| Arrow Electronics, Inc. (a) | | 100,000 | | 3,002,000 |
| Avnet, Inc. (a) | | 35,000 | | 916,300 |
| Wolfson Microelectronics PLC (a) | | 150,000 | | 456,084 |
| | | | | 4,374,384 |
| |
| TOTAL ELECTRONIC EQUIPMENT & INSTRUMENTS | | 7,884,557 |
| |
| SEMICONDUCTORS & SEMICONDUCTOR EQUIPMENT – 71.5% |
| Semiconductor Equipment – 14.3% | | | | |
| ATMI, Inc. (a) | | 10,000 | | 318,300 |
| Cohu, Inc. | | 50,000 | | 1,230,500 |
| FormFactor, Inc. (a) | | 19,000 | | 496,660 |
| KLA-Tencor Corp. | | 24,990 | | 1,291,983 |
| Lam Research Corp. (a) | | 30,030 | | 854,354 |
| MEMC Electronic Materials, Inc. (a) | | 15,400 | | 261,646 |
| Tessera Technologies, Inc. (a) | | 20,000 | | 702,400 |
| Varian Semiconductor Equipment | | | | |
| Associates, Inc. (a) | | 10,000 | | 415,200 |
| Veeco Instruments, Inc. (a) | | 40,000 | | 808,800 |
| | | | | 6,379,843 |
| Semiconductors – 57.2% | | | | |
| Agere Systems, Inc. (a) | | 46,720 | | 522,797 |
| AMIS Holdings, Inc. (a) | | 22,500 | | 287,100 |
| Analog Devices, Inc. | | 99,950 | | 3,918,040 |
| Applied Micro Circuits Corp. (a) | | 150,000 | | 451,500 |
| ATI Technologies, Inc. (a) | | 65,000 | | 818,638 |
| Freescale Semiconductor, Inc. Class A | | 40,000 | | 1,020,800 |
| Holtek Semiconductor, Inc. | | 104,996 | | 119,261 |
| Integrated Silicon Solution, Inc. (a) | | 50,000 | | 431,250 |
| Intel Corp. | | 159,990 | | 4,342,129 |
| International Rectifier Corp. (a) | | 5,000 | | 235,250 |
| | | Shares | | Value (Note 1) |
| Intersil Corp. Class A | | 25,000 | | $ 484,250 |
| Linear Technology Corp. | | 20,000 | | 777,200 |
| Maxim Integrated Products, Inc. | | 108,900 | | 4,559,643 |
| Microchip Technology, Inc. | | 30,000 | | 932,100 |
| National Semiconductor Corp. | | 150,020 | | 3,706,994 |
| NVIDIA Corp. (a) | | 20,000 | | 541,200 |
| O2Micro International Ltd. (a) | | 60,000 | | 1,029,600 |
| Rambus, Inc. (a) | | 20,000 | | 262,800 |
| Texas Instruments, Inc. | | 29,980 | | 952,165 |
| | | | | 25,392,717 |
| |
| TOTAL SEMICONDUCTORS & SEMICONDUCTOR | | |
| EQUIPMENT | | | | 31,772,560 |
| |
| TOTAL COMMON STOCKS | | | | |
| (Cost $40,213,920) | | | | 43,030,348 |
| |
| Money Market Funds — 2.0% | | | | |
| |
| Fidelity Cash Central Fund, 3.31% (b) | | | | |
| (Cost $897,887) | | 897,887 | | 897,887 |
| |
| TOTAL INVESTMENT PORTFOLIO - 98.9% | | |
| (Cost $41,111,807) | | | | 43,928,235 |
| |
| NET OTHER ASSETS – 1.1% | | | | 473,845 |
| NET ASSETS – 100% | | $ | | 44,402,080 |
Legend
(a) Non-income producing
(b) Affiliated fund that is available only to investment companies and other
accounts managed by Fidelity Investments. The rate quoted is the
annualized seven-day yield of the fund at period end. A complete listing
of the fund’s holdings as of its most recent quarter end is available upon
request.
Other Information
Distribution of investments by country of issue, as a percentage of total net
assets, is as follows:
|
| United States of America | | 82.6% |
| Taiwan | | 4.7% |
| Finland | | 4.5% |
| Singapore | | 3.1% |
| Cayman Islands | | 2.3% |
| Canada | | 1.8% |
| United Kingdom | | 1.0% |
| | | 100.0% |
Income Tax Information
At July 31, 2005, the fund had a capital loss carryforward of approximately
$14,245,984 of which $5,872,965, $5,827,947, $2,265,871 and
$279,201 will expire on July 31, 2010, 2011, 2012 and 2013, respectively.
The fund intends to elect to defer to its fiscal year ending July 31, 2006
approximately $1,416,124 of losses recognized during the period
November 1, 2004 to July 31, 2005.
|
See accompanying notes which are an integral part of the financial statements.
A-69 Annual Report
Advisor Electronics Fund
Financial Statements
|
| Statement of Assets and Liabilities | | |
| | | | | | | July 31, 2005 |
| Assets | | | | | | |
| Investment in securities, at value (cost | | | | |
| $41,111,807) — See accompanying | | | | |
| schedule | | | | $ | | 43,928,235 |
| Cash | | | | | | 242,702 |
| Foreign currency held at value (cost | | | | | | |
| $434,470) | | | | | | 430,879 |
| Receivable for investments sold | | | | | | 198,244 |
| Receivable for fund shares sold | | | | | | 36,004 |
| Interest receivable | | | | | | 2,286 |
| Receivable from investment adviser for | | | | |
| expense reductions | | | | | | 7,132 |
| Other receivables | | | | | | 16,166 |
| Total assets | | | | | | 44,861,648 |
| Liabilities | | | | | | |
| Payable for investments purchased | | $ | | 242,702 | | |
| Payable for fund shares redeemed | | | | 121,391 | | |
| Accrued management fee | | | | 21,375 | | |
| Distribution fees payable | | | | 24,679 | | |
| Other affiliated payables | | | | 16,727 | | |
| Other payables and accrued expenses . | | 32,694 | | |
| Total liabilities | | | | | | 459,568 |
| Net Assets | | | | $ | | 44,402,080 |
| Net Assets consist of: | | | | | | |
| Paid in capital | | | | $ | | 57,385,516 |
| Accumulated undistributed net realized | | | | |
| gain (loss) on investments and foreign | | | | |
| currency transactions | | | | | | (15,796,280) |
| Net unrealized appreciation (depreci- | | | | |
| ation) on investments and assets and | | | | |
| liabilities in foreign currencies | | | | | | 2,812,844 |
| Net Assets | | | | $ | | 44,402,080 |
| Calculation of Maximum Offering Price | | | | |
| Class A: | | | | | | |
| Net Asset Value and redemption price | | | | |
| per share ($11,397,298 ÷ | | | | | | |
| 1,418,398 shares) | | | | $ | | 8.04 |
| Maximum offering price per share | | | | | | |
| (100/94.25 of $8.04) | | | | $ | | 8.53 |
| Class T: | | | | | | |
| Net Asset Value and redemption price | | | | |
| per share ($12,085,071 ÷ | | | | | | |
| 1,518,872 shares) | | | | $ | | 7.96 |
| Maximum offering price per share | | | | | | |
| (100/96.50 of $7.96) | | | | $ | | 8.25 |
| Class B: | | | | | | |
| Net Asset Value and offering price per | | | | |
| share ($8,962,606 ÷ 1,151,527 | | | | |
| shares)A | | | | $ | | 7.78 |
| Class C: | | | | | | |
| Net Asset Value and offering price per | | | | |
| share ($11,058,277 ÷ 1,422,513 | | | | |
| shares)A | | | | $ | | 7.77 |
| Institutional Class: | | | | | | |
| Net Asset Value, offering price and | | | | |
| redemption price per share | | | | | | |
| ($898,828 ÷ 110,262 shares) | | | | $ | | 8.15 |
A Redemption price per share is equal to net asset value less any applicable contingent deferred sales charge.
| Statement of Operations | | | | |
| | | | | Year ended July 31, 2005 |
| Investment Income | | | | | | |
| Dividends | | | | $ | | 164,293 |
| Interest | | | | | | 30,477 |
| Security lending | | | | | | 2,287 |
| | | | | | | 197,057 |
| Less foreign taxes withheld | | | | | | (19,259) |
| Total income | | | | | | 177,798 |
| Expenses | | | | | | |
| Management fee | | $ | | 246,173 | | |
| Transfer agent fees | | | | 197,824 | | |
| Distribution fees | | | | 289,329 | | |
| Accounting and security lending | | | | | | |
| fees | | | | 24,837 | | |
| Independent trustees’ compensation | | 226 | | |
| Custodian fees and expenses | | | | 12,122 | | |
| Registration fees | | | | 55,855 | | |
| Audit | | | | 45,079 | | |
| Legal | | | | 118 | | |
| Miscellaneous | | | | 993 | | |
| Total expenses before reductions | | 872,556 | | |
| Expense reductions | | | | (103,341) | | 769,215 |
| |
| Net investment income (loss) | | | | | | (591,417) |
| Realized and Unrealized Gain (Loss) | | | | |
| Net realized gain (loss) on: | | | | | | |
| Investment securities | | | | (805,922) | | |
| Foreign currency transactions | | | | (2,040) | | |
| Total net realized gain (loss) | | | | | | (807,962) |
| Change in net unrealized appreci- | | | | |
| ation (depreciation) on: | | | | | | |
| Investment securities | | | | 9,646,750 | | |
| Assets and liabilities in foreign | | | | | | |
| currencies | | | | (3,057) | | |
| Total change in net unrealized ap- | | | | |
| preciation (depreciation) | | | | | | 9,643,693 |
| Net gain (loss) | | | | | | 8,835,731 |
| Net increase (decrease) in net as- | | | | |
| sets resulting from operations | | | | $ | | 8,244,314 |
See accompanying notes which are an integral part of the financial statements.
Electronics A-70
| Statement of Changes in Net Assets | | | | | | |
| | | Year ended | | | | Year ended |
| | | July 31, | | | | July 31, |
| | | 2005 | | | | 2004 |
| Increase (Decrease) in Net Assets | | | | | | |
| Operations | | | | | | |
| Net investment income (loss) | | $ (591,417) | | $ | | (914,183) |
| Net realized gain (loss) | | (807,962) | | | | 5,034,435 |
| Change in net unrealized appreciation (depreciation) | | 9,643,693 | | | | (4,664,426) |
| Net increase (decrease) in net assets resulting from operations | | 8,244,314 | | | | (544,174) |
| Share transactions -- net increase (decrease) | | (9,174,490) | | | | (1,655,023) |
| Redemption fees | | 6,058 | | | | 26,533 |
| Total increase (decrease) in net assets | | (924,118) | | | | (2,172,664) |
| |
| Net Assets | | | | | | |
| Beginning of period | | 45,326,198 | | | | 47,498,862 |
| End of period | | $ 44,402,080 | | $ | | 45,326,198 |
| Financial Highlights — Class A | | | | | | | | | | |
| Years ended July 31, | | 2005 | | 2004 | | 2003 | | 2002 | | 2001F |
| Selected Per-Share Data | | | | | | | | | | |
| Net asset value, beginning of period | | $ 6.58 | | $ 6.59 | | $ 5.57 | | $ 9.62 | | $ 10.00 |
| Income from Investment Operations | | | | | | | | | | |
| Net investment income (loss)E | | (.07) | | (.09) | | (.06) | | (.10) | | (.04) |
| Net realized and unrealized gain (loss) | | 1.53 | | .08 | | 1.07 | | (3.96) | | (.35) |
| Total from investment operations | | 1.46 | | (.01) | | 1.01 | | (4.06) | | (.39) |
| Redemption fees added to paid in capitalE | | —H | | —H | | .01 | | .01 | | .01 |
| Net asset value, end of period | | $ 8.04 | | $ 6.58 | | $ 6.59 | | $ 5.57 | | $ 9.62 |
| Total ReturnB,C,D | | 22.19% | | (.15)% | | 18.31% | | (42.10)% | | (3.80)% |
| Ratios to Average Net AssetsG | | | | | | | | | | |
| Expenses before expense reductions | | 1.59% | | 1.55% | | 1.89% | | 1.68% | | 2.57%A |
| Expenses net of voluntary waivers, if any | | 1.45% | | 1.50% | | 1.50% | | 1.50% | | 1.50%A |
| Expenses net of all reductions | | 1.38% | | 1.48% | | 1.46% | | 1.49% | | 1.49%A |
| Net investment income (loss) | | (.96)% | | (1.15)% | | (1.09)% | | (1.14)% | | (.77)%A |
| Supplemental Data | | | | | | | | | | |
| Net assets, end of period (000 omitted) | | $ 11,397 | | $ 8,374 | | $ 8,116 | | $ 4,912 | | $ 3,400 |
| Portfolio turnover rate | | 128% | | 84% | | 66% | | 58% | | 98%A |
A Annualized
B Total returns for periods of less than one year are not annualized.
C Total returns would have been lower had certain expenses not been reduced during the periods shown.
D Total returns do not include the effect of the sales charges.
E Calculated based on average shares outstanding during the period.
F For the period December 27, 2000 (commencement of operations) to July 31, 2001.
G Expense ratios reflect operating expenses of the class. Expenses before reductions do not reflect amounts reimbursed by the investment adviser or reductions from brokerage service arrangements or other expense offset arrangements and do not
represent the amount paid by the class during periods when reimbursements or reductions occur. Expense ratios before reductions for start up periods may not be representative of longer term operating periods. Expenses net of any voluntary
waivers reflect expenses after reimbursement by the investment adviser but prior to reductions from brokerage service arrangements or other expense offset arrangements. Expenses net of all reductions represent the net expenses paid by the class.
H Amount represents less than $.01 per share.
|
See accompanying notes which are an integral part of the financial statements.
A-71 Annual Report
| Financial Highlights — Class T | | | | | | | | | | |
| Years ended July 31, | | 2005 | | 2004 | | 2003 | | 2002 | | 2001F |
| Selected Per-Share Data | | | | | | | | | | |
| Net asset value, beginning of period | | $ 6.53 | | $ 6.56 | | $ 5.55 | | $ 9.62 | | $ 10.00 |
| Income from Investment Operations | | | | | | | | | | |
| Net investment income (loss)E | | (.08) | | (.11) | | (.07) | | (.12) | | (.06) |
| Net realized and unrealized gain (loss) | | 1.51 | | .08 | | 1.07 | | (3.96) | | (.33) |
| Total from investment operations | | 1.43 | | (.03) | | 1.00 | | (4.08) | | (.39) |
| Redemption fees added to paid in capitalE | | —H | | —H | | .01 | | .01 | | .01 |
| Net asset value, end of period | | $ 7.96 | | $ 6.53 | | $ 6.56 | | $ 5.55 | | $ 9.62 |
| Total ReturnB,C,D | | 21.90% | | (.46)% | | 18.20% | | (42.31)% | | (3.80)% |
| Ratios to Average Net AssetsG | | | | | | | | | | |
| Expenses before expense reductions | | 1.89% | | 1.83% | | 2.14% | | 1.91% | | 2.81%A |
| Expenses net of voluntary waivers, if any | | 1.69% | | 1.75% | | 1.75% | | 1.75% | | 1.75%A |
| Expenses net of all reductions | | 1.61% | | 1.72% | | 1.71% | | 1.74% | | 1.74%A |
| Net investment income (loss) | | (1.20)% | | (1.39)% | | (1.33)% | | (1.39)% | | (1.02)%A |
| Supplemental Data | | | | | | | | | | |
| Net assets, end of period (000 omitted) | | $ 12,085 | | $ 15,445 | | $ 14,362 | | $ 11,615 | | $ 11,493 |
| Portfolio turnover rate | | 128% | | 84% | | 66% | | 58% | | 98%A |
| | A Annualized
B Total returns for periods of less than one year are not annualized.
C Total returns would have been lower had certain expenses not been reduced during the periods shown.
D Total returns do not include the effect of the sales charges.
E Calculated based on average shares outstanding during the period.
F For the period December 27, 2000 (commencement of operations) to July 31, 2001.
G Expense ratios reflect operating expenses of the class. Expenses before reductions do not reflect amounts reimbursed by the investment adviser or reductions from brokerage service arrangements or other expense offset arrangements and do not
represent the amount paid by the class during periods when reimbursements or reductions occur. Expense ratios before reductions for start up periods may not be representative of longer term operating periods. Expenses net of any voluntary
waivers reflect expenses after reimbursement by the investment adviser but prior to reductions from brokerage service arrangements or other expense offset arrangements. Expenses net of all reductions represent the net expenses paid by the class.
H Amount represents less than $.01 per share.
|
| Financial Highlights — Class B | | | | | | | | | | |
| Years ended July 31, | | 2005 | | 2004 | | 2003 | | 2002 | | 2001F |
| Selected Per-Share Data | | | | | | | | | | |
| Net asset value, beginning of period | | $ 6.42 | | $ 6.48 | | $ 5.52 | | $ 9.60 | | $ 10.00 |
| Income from Investment Operations | | | | | | | | | | |
| Net investment income (loss)E | | (.12) | | (.14) | | (.10) | | (.16) | | (.08) |
| Net realized and unrealized gain (loss) | | 1.48 | | .08 | | 1.06 | | (3.93) | | (.33) |
| Total from investment operations | | 1.36 | | (.06) | | .96 | | (4.09) | | (.41) |
| Redemption fees added to paid in capitalE | | —H | | —H | | —H | | .01 | | .01 |
| Net asset value, end of period | | $ 7.78 | | $ 6.42 | | $ 6.48 | | $ 5.52 | | $ 9.60 |
| Total ReturnB,C,D | | 21.18% | | (.93)% | | 17.39% | | (42.50)% | | (4.00)% |
| Ratios to Average Net AssetsG | | | | | | | | | | |
| Expenses before expense reductions | | 2.41% | | 2.41% | | 2.76% | | 2.43% | | 3.34%A |
| Expenses net of voluntary waivers, if any | | 2.21% | | 2.25% | | 2.25% | | 2.25% | | 2.25%A |
| Expenses net of all reductions | | 2.13% | | 2.23% | | 2.21% | | 2.24% | | 2.24%A |
| Net investment income (loss) | | (1.72)% | | (1.90)% | | (1.83)% | | (1.89)% | | (1.52)%A |
| Supplemental Data | | | | | | | | | | |
| Net assets, end of period (000 omitted) | | $ 8,963 | | $ 8,498 | | $ 11,335 | | $ 8,362 | | $ 10,941 |
| Portfolio turnover rate | | 128% | | 84% | | 66% | | 58% | | 98%A |
A Annualized
B Total returns for periods of less than one year are not annualized.
C Total returns would have been lower had certain expenses not been reduced during the periods shown.
D Total returns do not include the effect of the contingent deferred sales charge.
E Calculated based on average shares outstanding during the period.
F For the period December 27, 2000 (commencement of operations) to July 31, 2001.
G Expense ratios reflect operating expenses of the class. Expenses before reductions do not reflect amounts reimbursed by the investment adviser or reductions from brokerage service arrangements or other expense offset arrangements and do not
represent the amount paid by the class during periods when reimbursements or reductions occur. Expense ratios before reductions for start up periods may not be representative of longer term operating periods. Expenses net of any voluntary
waivers reflect expenses after reimbursement by the investment adviser but prior to reductions from brokerage service arrangements or other expense offset arrangements. Expenses net of all reductions represent the net expenses paid by the class.
H Amount represents less than $.01 per share.
|
See accompanying notes which are an integral part of the financial statements.
Electronics A-72
| Financial Highlights — Class C | | | | | | | | | | |
| Years ended July 31, | | 2005 | | 2004 | | 2003 | | 2002 | | 2001F |
| Selected Per-Share Data | | | | | | | | | | |
| Net asset value, beginning of period | | $ 6.41 | | $ 6.47 | | $ 5.51 | | $ 9.59 | | $ 10.00 |
| Income from Investment Operations | | | | | | | | | | |
| Net investment income (loss)E | | (.11) | | (.14) | | (.10) | | (.16) | | (.09) |
| Net realized and unrealized gain (loss) | | 1.47 | | .08 | | 1.06 | | (3.93) | | (.33) |
| Total from investment operations | | 1.36 | | (.06) | | .96 | | (4.09) | | (.42) |
| Redemption fees added to paid in capitalE | | —H | | —H | | —H | | .01 | | .01 |
| Net asset value, end of period | | $ 7.77 | | $ 6.41 | | $ 6.47 | | $ 5.51 | | $ 9.59 |
| Total ReturnB,C,D | | 21.22% | | (.93)% | | 17.42% | | (42.54)% | | (4.10)% |
| Ratios to Average Net AssetsG | | | | | | | | | | |
| Expenses before expense reductions | | 2.31% | | 2.24% | | 2.52% | | 2.34% | | 3.25%A |
| Expenses net of voluntary waivers, if any | | 2.18% | | 2.24% | | 2.25% | | 2.25% | | 2.25%A |
| Expenses net of all reductions | | 2.11% | | 2.21% | | 2.21% | | 2.24% | | 2.24%A |
| Net investment income (loss) | | (1.69)% | | (1.88)% | | (1.83)% | | (1.89)% | | (1.52)%A |
| Supplemental Data | | | | | | | | | | |
| Net assets, end of period (000 omitted) | | $ 11,058 | | $ 12,322 | | $ 13,061 | | $ 9,921 | | $ 10,782 |
| Portfolio turnover rate | | 128% | | 84% | | 66% | | 58% | | 98%A |
A Annualized
B Total returns for periods of less than one year are not annualized.
C Total returns would have been lower had certain expenses not been reduced during the periods shown.
D Total returns do not include the effect of the contingent deferred sales charge.
E Calculated based on average shares outstanding during the period.
F For the period December 27, 2000 (commencement of operations) to July 31, 2001.
G Expense ratios reflect operating expenses of the class. Expenses before reductions do not reflect amounts reimbursed by the investment adviser or reductions from brokerage service arrangements or other expense offset arrangements and do not
represent the amount paid by the class during periods when reimbursements or reductions occur. Expense ratios before reductions for start up periods may not be representative of longer term operating periods. Expenses net of any voluntary
waivers reflect expenses after reimbursement by the investment adviser but prior to reductions from brokerage service arrangements or other expense offset arrangements. Expenses net of all reductions represent the net expenses paid by the class.
H Amount represents less than $.01 per share.
|
| Financial Highlights — Institutional Class | | | | | | | | | | |
| Years ended July 31, | | 2005 | | 2004 | | 2003 | | 2002 | | 2001E |
| Selected Per-Share Data | | | | | | | | | | |
| Net asset value, beginning of period | | $ 6.65 | | $ 6.64 | | $ 5.60 | | $ 9.64 | | $ 10.00 |
| Income from Investment Operations | | | | | | | | | | |
| Net investment income (loss)D | | (.05) | | (.06) | | (.04) | | (.08) | | (.03) |
| Net realized and unrealized gain (loss) | | 1.55 | | .07 | | 1.07 | | (3.97) | | (.34) |
| Total from investment operations | | 1.50 | | .01 | | 1.03 | | (4.05) | | (.37) |
| Redemption fees added to paid in capitalD | | —G | | —G | | .01 | | .01 | | .01 |
| Net asset value, end of period | | $ 8.15 | | $ 6.65 | | $ 6.64 | | $ 5.60 | | $ 9.64 |
| Total ReturnB,C | | 22.56% | | .15% | | 18.57% | | (41.91)% | | (3.60)% |
| Ratios to Average Net AssetsF | | | | | | | | | | |
| Expenses before expense reductions | | 1.16% | | 1.12% | | 1.46% | | 1.31% | | 2.16%A |
| Expenses net of voluntary waivers, if any | | 1.16% | | 1.12% | | 1.25% | | 1.25% | | 1.25%A |
| Expenses net of all reductions | | 1.08% | | 1.09% | | 1.21% | | 1.24% | | 1.24%A |
| Net investment income (loss) | | (.67)% | | (.76)% | | (.84)% | | (.89)% | | (.52)%A |
| Supplemental Data | | | | | | | | | | |
| Net assets, end of period (000 omitted) | | $ 899 | | $ 687 | | $ 625 | | $ 1,184 | | $ 622 |
| Portfolio turnover rate | | 128% | | 84% | | 66% | | 58% | | 98%A |
A Annualized
B Total returns for periods of less than one year are not annualized.
C Total returns would have been lower had certain expenses not been reduced during the periods shown.
D Calculated based on average shares outstanding during the period.
E For the period December 27, 2000 (commencement of operations) to July 31, 2001.
F Expense ratios reflect operating expenses of the class. Expenses before reductions do not reflect amounts reimbursed by the investment adviser or reductions from brokerage service arrangements or other expense offset arrangements and do not
represent the amount paid by the class during periods when reimbursements or reductions occur. Expense ratios before reductions for start up periods may not be representative of longer term operating periods. Expenses net of any voluntary
waivers reflect expenses after reimbursement by the investment adviser but prior to reductions from brokerage service arrangements or other expense offset arrangements. Expenses net of all reductions represent the net expenses paid by the class.
G Amount represents less than $.01 per share.
|
See accompanying notes which are an integral part of the financial statements.
A-73 Annual Report
Notes to Financial Statements
For the period ended July 31, 2005
|
1. Significant Accounting Policies.
|
Fidelity Advisor Electronics Fund (the fund) is a non-diversified fund of Fidelity Advisor Series VII (the trust) and is authorized to issue an unlimited number of shares. The trust is registered under the Investment Company Act of 1940, as amended (the 1940 Act), as an open-end management investment company organized as a Massachusetts business trust.
The fund offers Class A, Class T, Class B, Class C and Institutional Class shares, each of which has equal rights as to assets and voting privileges. Each class has exclusive voting rights with respect to matters that affect that class. Class B shares will automatically convert to Class A shares after a holding period of seven years from the initial date of purchase. Investment income, realized and unrealized capital gains and losses, the common expenses of the fund, and certain fund-level expense reductions, if any, are allocated on a pro rata basis to each class based on the relative net assets of each class to the total net assets of the fund. Each class differs with respect to transfer agent and distribution and service plan fees incurred. Certain expense reductions also differ by class.
The financial statements have been prepared in conformity with accounting principles generally accepted in the United States of America, which require management to make certain estimates and assumptions at the date of the financial statements. The following summarizes the significant accounting policies of the fund:
Security Valuation. Net asset value per share (NAV calculation) is calculated as of the close of business of the New York Stock Exchange, normally 4:00 p.m. Eastern time. Equity securities, including restricted securities, for which market quotations are available are valued at the last sale price or official closing price (closing bid price or last evaluated quote if no sale has occurred) on the primary market or exchange on which they trade. If prices are not readily available or do not accurately reflect fair value for a security, or if a security’s value has been materially affected by events occurring after the close of the exchange or market on which the security is principally traded, that security may be valued by another method that the Board of Trustees believes accurately reflects fair value. A security’s valuation may differ depending on the method used for determining value. Price movements in futures contracts and ADRs, market and trading trends, the bid/ask quotes of brokers and off-exchange institutional trading may be reviewed in the course of making a good faith determination of a security’s fair value. Short-term securities with remaining maturities of sixty days or less for which quotations are not readily available are valued on the basis of amortized cost. Investments in open-end investment companies are valued at their net asset value each business day.
Foreign Currency. The fund uses foreign currency contracts to facilitate transactions in foreign-denominated securities. Losses from these transactions may arise from changes in the value of the foreign currency or if the counterparties do not perform under the contracts’ terms.
Foreign-denominated assets, including investment securities, and liabilities are translated into U.S. dollars at the exchange rate at period end. Purchases and sales of investment securities, income and dividends received and expenses denominated in foreign currencies are translated into U.S. dollars at the exchange rate in effect on the transaction date.
The effects of exchange rate fluctuations on investments are included with the net realized and unrealized gain (loss) on investment securities. Other foreign currency transactions resulting in realized and unrealized gain (loss) are disclosed separately.
Investment Transactions and Income. Security transactions are accounted for as of trade date. Gains and losses on securities sold are determined on the basis of identified cost and may include proceeds received from litigation. Dividend income is recorded on the ex-dividend date, except for certain dividends from foreign securities where the ex-dividend date may have passed, which are recorded as soon as the fund is informed of the ex-dividend date. Non-cash dividends included in dividend income, if any, are recorded at the fair market value of the securities received. Interest income is accrued as earned. Interest income includes coupon interest and amortization of premium and accretion of discount on debt securities. Investment income is recorded net of foreign taxes withheld where recovery of such taxes is uncertain.
Expenses. Most expenses of the trust can be directly attributed to a fund. Expenses which cannot be directly attributed are apportioned among each fund in the trust.
Income Tax Information and Distributions to Shareholders. Each year, the fund intends to qualify as a regulated investment company by distributing all of its taxable income and realized gains under Subchapter M of the Internal Revenue Code. As a result, no provision for income taxes is required in the accompanying financial statements. Foreign taxes are provided for based on the fund’s understanding of the tax rules and rates that exist in the foreign markets in which it invests.
Distributions are recorded on the ex-dividend date. Income dividends and capital gain distributions are declared separately for each class. Income and capital gain distributions are determined in accordance with income tax regulations, which may differ from generally accepted accounting principles. Capital accounts within the financial statements are adjusted for permanent book-tax differences. These adjustments have no impact on net assets or the results of operations. Temporary book-tax differences will reverse in a subsequent period.
Book-tax differences are primarily due to foreign currency transactions, capital loss carryforwards and losses deferred due to wash sales and excise tax regulations.
| | 1. Significant Accounting Policies - continued
Income Tax Information and Distributions to Shareholders - continued
The tax-basis components of distributable earnings and the federal tax cost as of period end were as follows:
|
| Unrealized appreciation | | $ 4,286,621 |
| Unrealized depreciation | | (1,607,945) |
| Net unrealized appreciation (depreciation)�� | | 2,678,676 |
| Capital loss carryforward | | (14,245,984) |
| |
| Cost for federal income tax purposes | | $ 41,249,559 |
| | Short-Term Trading (Redemption) Fees. Shares held in the fund less than 60 days are subject to a redemption fee equal to 1.00% of the proceeds of
the redeemed shares. All redemption fees, including any estimated redemption fees paid by Fidelity Management & Research Company (FMR), are
retained by the fund and accounted for as an addition to paid in capital.
2. Operating Policies.
Repurchase Agreements. FMR has received an Exemptive Order from the Securities and Exchange Commission (the SEC) which permits the fund
and other affiliated entities of FMR to transfer uninvested cash balances into joint trading accounts which are then invested in repurchase agreements.
The fund may also invest directly with institutions in repurchase agreements. Repurchase agreements are collateralized by government or non-govern-
ment securities. Collateral is held in segregated accounts with custodian banks and may be obtained in the event of a default of the counterparty. The
fund monitors, on a daily basis, the value of the collateral to ensure it is at least equal to the principal amount of the repurchase agreement (including
accrued interest). In the event of a default by the counterparty, realization of the collateral proceeds could be delayed, during which time the value of
the collateral may decline.
3. Purchases and Sales of Investments.
Purchases and sales of securities, other than short-term securities and U.S. government securities, aggregated $53,086,584 and $61,948,413,
respectively.
4. Fees and Other Transactions with Affiliates.
Management Fee. FMR and its affiliates provide the fund with investment management related services for which the fund pays a monthly manage-
ment fee. The management fee is the sum of an individual fund fee rate that is based on an annual rate of .30% of the fund’s average net assets and a
group fee rate that averaged .27% during the period. The group fee rate is based upon the average net assets of all the mutual funds advised by FMR.
The group fee rate decreases as assets under management increase and increases as assets under management decrease. For the period, the total
annual management fee rate was .57% of the fund’s average net assets.
Distribution and Service Plan. In accordance with Rule 12b-1 of the 1940 Act, the fund has adopted separate Distribution and Service Plans for each
class of shares. Certain classes pay Fidelity Distributors Corporation (FDC), an affiliate of FMR, separate Distribution and Service Fees, each of which
is based on an annual percentage of each class’ average net assets. In addition, FDC may pay financial intermediaries for selling shares of the fund and
providing shareholder support services. For the period, the Distribution and Service Fee rates and the total amounts paid to and retained by FDC were
as follows:
|
| | | Distribution | | Service | | | | Paid to | | | | Retained |
| | | Fee | | Fee | | | | FDC | | | | by FDC |
| Class A | | 0% | | .25% | | $ | | 21,342 | | $ | | 73 |
| Class T | | 25% | | .25% | | | | 68,576 | | | | 170 |
| Class B | | 75% | | .25% | | | | 89,990 | | | | 67,543 |
| Class C | | 75% | | .25% | | | | 109,421 | | | | 16,312 |
| |
| | | | | | | $ | | 289,329 | | $ | | 84,098 |
Sales Load. FDC receives a front-end sales charge of up to 5.75% for selling Class A shares, and 3.50% for selling Class T shares, some of which is paid to financial intermediaries for selling shares of the fund. FDC receives the proceeds of contingent deferred sales charges levied on Class A, Class T, Class B, and Class C redemptions. These charges depend on the holding period. The deferred sales charges range from 5% to 1% for Class B, 1% for Class C, and .25% for certain purchases of Class A and Class T shares.
A-75 Annual Report
| | Notes to Financial Statements - continued
4. Fees and Other Transactions with Affiliates - continued
Sales Load - continued
For the period, sales charge amounts retained by FDC were as follows:
|
| | | | | Retained |
| | | | | by FDC |
| Class A | | $ | | 5,196 |
| Class T | | | | 4,930 |
| Class B* | | | | 50,880 |
| Class C* | | | | 3,634 |
| | | $ | | 64,640 |
* When Class B and Class C shares are initially sold, FDC pays commissions from its own resources to financial intermediaries through which the sales are made.
Transfer Agent Fees. Fidelity Investments Institutional Operations Company, Inc. (FIIOC), an affiliate of FMR, is the transfer, dividend disbursing
and shareholder servicing agent for each class of the fund. FIIOC receives account fees and asset-based fees that vary according to the account size and
type of account of the shareholders of the respective classes of the fund. FIIOC pays for typesetting, printing and mailing of shareholder reports, except
proxy statements. For the period the total transfer agent fees paid by each class to FIIOC, were as follows:
|
| | | | | | | % of |
| | | | | | | Average |
| | | | | Amount | | Net Assets |
| Class A | | $ | | 37,796 | | .44 |
| Class T | | | | 67,154 | | .49 |
| Class B | | | | 45,992 | | .51 |
| Class C | | | | 44,906 | | .41 |
| Institutional Class | | | | 1,976 | | .26 |
| |
| | | $ | | 197,824 | | |
| | Accounting and Security Lending Fees. Fidelity Service Company, Inc. (FSC), an affiliate of FMR, maintains the fund’s accounting records. The
accounting fee is based on the level of average net assets for the month. Under a separate contract, FSC administers the security lending program. The
security lending fee is based on the number and duration of lending transactions.
Central Funds. The fund may invest in affiliated Central Funds managed by Fidelity Investments Money Management, Inc. (FIMM), an affiliate of
FMR. The Central Funds are open-end investment companies available only to investment companies and other accounts managed by FMR and its
affiliates. The Money Market Central Funds seek preservation of capital and current income. The Central Funds do not pay a management fee. Income
distributions earned by the fund are recorded as income in the accompanying financial statements and totaled $32,059 for the period.
Brokerage Commissions. The fund placed a portion of its portfolio transactions with brokerage firms which are affiliates of the investment adviser.
The commissions paid to these affiliated firms were $9,910 for the period.
5. Committed Line of Credit.
The fund participates with other funds managed by FMR in a $4.2 billion credit facility (the “line of credit”) to be utilized for temporary or emergency
purposes to fund shareholder redemptions or for other short-term liquidity purposes. The fund has agreed to pay commitment fees on its pro rata
portion of the line of credit. During the period, there were no borrowings on this line of credit.
6. Security Lending.
The fund lends portfolio securities from time to time in order to earn additional income. The fund receives collateral (in the form of U.S. Treasury
obligations, letters of credit and/or cash) against the loaned securities and maintains collateral in an amount not less than 100% of the market value of
the loaned securities during the period of the loan. The market value of the loaned securities is determined at the close of business of the fund and any
additional required collateral is delivered to the fund on the next business day. If the borrower defaults on its obligation to return the securities loaned
because of insolvency or other reasons, a fund could experience delays and costs in recovering the securities loaned or in gaining access to the
collateral. Cash collateral is invested in the Fidelity Securities Lending Cash Central Fund. At period end there were no security loans outstanding.
|
Electronics A-76
| | 7. Expense Reductions.
FMR voluntarily agreed to reimburse each class to the extent annual operating expenses exceeded certain levels of average net assets as noted in the
table below. Some expenses, for example interest expense, are excluded from this reimbursement.
The following classes were in reimbursement during the period:
|
| | | Expense | | | | Reimbursement |
| | | Limitations | | | | from adviser |
| Class A | | 1.50 | | -- 1.40%* | | $ | | 11,754 |
| Class T | | 1.75 | | -- 1.65%* | | | | 27,318 |
| Class B | | 2.25 | | -- 2.15%* | | | | 18,231 |
| Class C | | 2.25 | | -- 2.15%* | | | | 13,396 |
| Institutional Class | | 1.25 | | -- 1.15%* | | | | 21 |
| |
| | | | | | | $ | | 70,720 |
* Expense limitation in effect at period end.
Many of the brokers with whom FMR places trades on behalf of the fund provided services to the fund in addition to trade execution. These services
included payments of certain expenses on behalf of the fund totaling $32,202 for the period. In addition, through arrangements with the fund’s custo-
dian, credits realized as a result of uninvested cash balances were used to reduce the fund’s expenses. During the period, these credits reduced the
fund’s custody expenses by $419.
8. Other.
The fund’s organizational documents provide former and current trustees and officers with a limited indemnification against liabilities arising in
connection with the performance of their duties to the fund. In the normal course of business, the fund may also enter into contracts that provide
general indemnifications. The fund’s maximum exposure under these arrangements is unknown as this would be dependent on future claims that may
be made against the fund. The risk of material loss from such claims is considered remote.
9. Share Transactions.
Transactions for each class of shares were as follows:
|
| | | | | Shares | | | | Dollars |
| Years ended July 31, | | 2005 | | 2004 | | 2005 | | | | 2004 |
| Class A | | | | | | | | | | |
| Shares sold | | 810,216 | | 1,163,033 | | $ 5,985,601 | | $ | | 9,193,928 |
| Shares redeemed | | (665,267) | | (1,121,519) | | (4,709,912) | | | | (8,464,153) |
| Net increase (decrease) | | 144,949 | | 41,514 | | $ 1,275,689 | | $ | | 729,775 |
| Class T | | | | | | | | | | |
| Shares sold | | 393,825 | | 880,005 | | $ 2,720,747 | | $ | | 6,765,488 |
| Shares redeemed | | (1,240,792) | | (704,477) | | (8,651,718) | | | | (5,391,404) |
| Net increase (decrease) | | (846,967) | | 175,528 | | $ (5,930,971) | | $ | | 1,374,084 |
| Class B | | | | | | | | | | |
| Shares sold | | 424,624 | | 538,613 | | $ 2,916,025 | | $ | | 4,191,366 |
| Shares redeemed | | (596,931) | | (963,986) | | (4,165,250) | | | | (7,331,908) |
| Net increase (decrease) | | (172,307) | | (425,373) | | $ (1,249,225) | | $ | | (3,140,542) |
| Class C | | | | | | | | | | |
| Shares sold | | 482,588 | | 604,856 | | $ 3,305,584 | | $ | | 4,611,449 |
| Shares redeemed | | (982,233) | | (701,380) | | (6,627,459) | | | | (5,302,803) |
| Net increase (decrease) | | (499,645) | | (96,524) | | $ (3,321,875) | | $ | | (691,354) |
| Institutional Class | | | | | | | | | | |
| Shares sold | | 28,776 | | 63,253 | | $ 204,413 | | $ | | 495,615 |
| Shares redeemed | | (21,842) | | (54,003) | | (152,521) | | | | (422,601) |
| Net increase (decrease) | | 6,934 | | 9,250 | | $ 51,892 | | $ | | 73,014 |
A-77 Annual Report
| | Advisor Financial Services Fund — Class A, T, B, and C
Performance
|
Average annual total return reflects the change in the value of an investment, assuming reinvestment of the class’ dividend income and capital gains (the profits earned upon the sale of securities that have grown in value) and assuming a constant rate of performance each year. The $10,000 table and the fund’s returns do not reflect the deduction of taxes that a shareholder would pay on fund distributions or the redemption of fund shares. During periods of reimbursement by Fidelity, a fund’s total return will be greater than it would be had the reimbursement not occurred. How a fund did yesterday is no guarantee of how it will do tomorrow. Returns may reflect the conversion of Class B shares to Class A shares after a maximum of seven years.
| Average Annual Total Returns | | | | |
| Periods ended July 31, 2005 | | Past 1 | | Past 5 | | Life of |
| | | year | | years | | fundA |
| Class A (incl. 5.75% sales charge) | | 6.12% | | 5.77% | | 11.69% |
| Class T (incl. 3.50% sales charge) | | 8.43% | | 6.04% | | 11.73% |
| Class B (incl. contingent deferred | | | | | | |
| sales charge)B | | 6.78% | | 5.93% | | 11.76% |
| Class C (incl. contingent deferred | | | | | | |
| sales charge)C | | 10.88% | | 6.30% | | 11.65% |
A From September 3, 1996.
B Class B shares bear a 1.00% 12b-1 fee. The initial offering of Class B shares took place
on March 3, 1997. Returns prior to March 3, 1997 are those of Class T and reflect a 0.50%
12b-1 fee. Had Class B shares’ 12b-1 fee been reflected, returns prior to March 3, 1997
would have been lower. Class B shares’ contingent deferred sales charges included in the
past one year, five year, and life of fund total return figures are 5%, 2% and 0%,
respectively.
C Class C shares bear a 1.00% 12b-1 fee. The initial offering of Class C shares took place
on November 3, 1997. Returns between March 3, 1997 and November 3, 1997 are those of
Class B shares and reflect Class B shares’ 1.00% 12b-1 fee. Returns prior to March 3, 1997
are those of Class T and reflect a 0.50% 12b-1 fee. Had Class C shares’ 12b-1 fee been
reflected, returns prior to March 3, 1997 would have been lower. Class C shares’ contin-
gent deferred sales charges included in the past one year, five year, and life of fund total
return figures are 1%, 0% and 0%, respectively.
|
| | $10,000 Over Life of Fund
Let’s say hypothetically that $10,000 was invested in Fidelity Advisor
Financial Services Fund — Class T on September 3, 1996, when the
fund started, and the current 3.50% sales charge was paid. The chart
shows how the value of your investment would have changed, and also
shows how the S&P 500 Index performed over the same period.
|
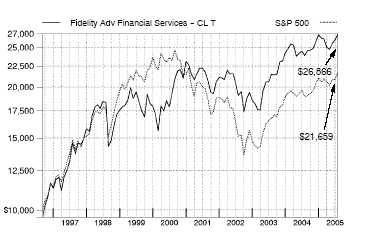
Financial Services A-78
A-78
Advisor Financial Services Fund
|
Management’s Discussion of Fund Performance
Comments from Charles Hebard, who became Portfolio Manager of Fidelity® Advisor Financial Services Fund on May 2, 2005
A late-inning rally on Wall Street helped push some key U.S. equity indexes to four-year highs by the conclusion of the 12-month period ending July 31, 2005. Spurred on by bullish economic data and strong corporate earnings, investors enjoyed a stellar month of July, capping off a turbulent 12-month period for U.S. equity markets. Stock prices bounced up and down during most of the year, moving in cadence with gyrations in the price of crude oil and investors’ gathering and ebbing concerns about inflation. The Federal Reserve Board raised short-term interest rates eight times during the period, also affecting overall market sentiment. Despite their fluctuations, the major equity indexes finished on a high note, with the Standard & Poor’s 500SM Index and the NASDAQ Composite® Index posting gains of 14.05% and 16.51%, respectively, for the period. The small-cap Russell 2000® Index rose 24.78% and the Russell Midcap® Index jumped 28.93%, while the blue-chips’ Dow Jones Industrial AverageSM advanced only 7.29% .
For the 12 months that ended July 31, 2005, Fidelity Advisor Financial Services Fund’s Class A, Class T, Class B and Class C shares had total returns of 12.60%, 12.37%, 11.78% and 11.88%, respectively, trailing the S&P 500® and the 14.33% return of the Goldman Sachs® Financial Services Index. The fund trailed the Goldman Sachs index largely because it was underweighted in real estate investment trusts (REITs), which strongly outperformed other financials. We continued to avoid this industry because of concerns about the vulnerability of REITs to potential interest rate increases. In terms of individual holdings, Asset Acceptance Capital, a company that specializes in buying consumer receivables from banks and other institutions and then collecting on the balances, reported excellent earnings and was a significant positive contributor relative to the sector index. Also supporting performance was our investment in Archipelago Holdings, which operates an electronic trading system and which announced a merger with the New York Stock Exchange. We no longer held the position at the end of the period. Another boost came from timely trading in brokerage firm Morgan Stanley, while an investment in Endurance Specialty Holdings, a Bermuda-based reinsurance company, also helped. By contrast, a leading detractor from relative performance was First Marblehead. While its student-loan securitizing business continued to produce good earnings growth, investors were concerned about its longer-term outlook. Insurance giant American International Group, which we overweighted, retreated because of regulatory investigations into its accounting. Underweighting or not owning auto insurers Allstate and Progressive — two components of the index — also held back performance as they exceeded earnings estimates because of better-than-expected claims trends.
The views expressed in this statement reflect those of the portfolio manager only through the end of the period of the report as stated on the cover and do not necessarily represent the views of Fidelity or any other person in the Fidelity organization. Any such views are subject to change at any time based upon market or other conditions and Fidelity disclaims any responsibility to update such views. These views may not be relied on as investment advice and, because investment decisions for a Fidelity fund are based on numerous factors, may not be relied on as an indication of trading intent on behalf of any Fidelity fund.
Advisor Financial Services Fund
Shareholder Expense Example
|
As a shareholder of the Fund, you incur two types of costs: (1) transaction costs, including sales charges (loads) on purchase payments or redemption proceeds, redemption fees, and (2) ongoing costs, including management fees, distribution and/or service (12b-1) fees and other Fund expenses. This Example is intended to help you understand your ongoing costs (in dollars) of investing in the Fund and to compare these costs with the ongoing costs of investing in other mutual funds.
The Example is based on an investment of $1,000 invested at the beginning of the period and held for the entire period (February 1, 2005 to July 31, 2005).
The first line of the table below for each class of the Fund provides information about actual account values and actual expenses. You may use the information in this line, together with the amount you invested, to estimate the expenses that you paid over the period. Simply divide your account value by $1,000.00 (for example, an $8,600 account value divided by $1,000.00 = 8.6), then multiply the result by the number in the first line for a class of the Fund under the heading entitled “Expenses Paid During Period” to estimate the expenses you paid on your account during this period.
Hypothetical Example for Comparison Purposes
|
The second line of the table below for each class of the Fund provides information about hypothetical account values and hypothetical expenses based on a Class’ actual expense ratio and an assumed rate of return of 5% per year before expenses, which is not the Class’ actual return. The hypothetical account values and expenses may not be used to estimate the actual ending account balance or expenses you paid for the period. You may use this information to compare the ongoing costs of investing in the Fund and other funds. To do so, compare this 5% hypothetical example with the 5% hypothetical examples that appear in the shareholder reports of the other funds.
Please note that the expenses shown in the table are meant to highlight your ongoing costs only and do not reflect any transaction costs. Therefore, the second line of the table is useful in comparing ongoing costs only, and will not help you determine the relative total costs of owning different funds. In addition, if these transactional costs were included, your costs would have been higher.
| | | | | | | | | | | Expenses Paid |
| | | Beginning | | | | Ending | | | | During Period* |
| | | Account Value | | | | Account Value | | | | February 1, 2005 |
| | | February 1, 2005 | | | | July 31, 2005 | | | | to July 31, 2005 |
| Class A | | | | | | | | | | |
| Actual | | $ 1,000.00 | | $ | | 1,021.30 | | $ | | 6.31 |
| HypotheticalA | | $ 1,000.00 | | $ | | 1,018.55 | | $ | | 6.31 |
| Class T | | | | | | | | | | |
| Actual | | $ 1,000.00 | | $ | | 1,020.10 | | $ | | 7.46 |
| HypotheticalA | | $ 1,000.00 | | $ | | 1,017.41 | | $ | | 7.45 |
| Class B | | | | | | | | | | |
| Actual | | $ 1,000.00 | | $ | | 1,017.80 | | $ | | 10.01 |
| HypotheticalA | | $ 1,000.00 | | $ | | 1,014.88 | | $ | | 9.99 |
| Class C | | | | | | | | | | |
| Actual | | $ 1,000.00 | | $ | | 1,017.80 | | $ | | 9.76 |
| HypotheticalA | | $ 1,000.00 | | $ | | 1,015.12 | | $ | | 9.74 |
| Institutional Class | | | | | | | | | | |
| Actual | | $ 1,000.00 | | $ | | 1,023.30 | | $ | | 4.31 |
| HypotheticalA | | $ 1,000.00 | | $ | | 1,020.53 | | $ | | 4.31 |
| |
| A 5% return per year before expenses | | | | | | | | | | |
* Expenses are equal to each Class’ annualized expense ratio (shown in the table below); multiplied by the average account value over the period, multiplied by 181/365 (to reflect the one-half year period).
| | | Annualized |
| | | Expense Ratio |
| Class A | | 1.26% |
| Class T | | 1.49% |
| Class B | | 2.00% |
| Class C | | 1.95% |
| Institutional Class | | 86% |
| | Advisor Financial Services Fund
Investment Changes
|
| Top Ten Stocks as of July 31, 2005 | | |
| | | % of fund’s | | % of fund’s net assets |
| | | net assets | | 6 months ago |
| American International Group, | | | | |
| Inc. | | 9.3 | | 8.5 |
| Bank of America Corp. | | 5.7 | | 9.2 |
| JPMorgan Chase & Co. | | 4.8 | | 3.8 |
| Merrill Lynch & Co., Inc. | | 4.6 | | 4.8 |
| Wells Fargo & Co. | | 4.6 | | 2.7 |
| American Express Co. | | 4.4 | | 3.7 |
| Wachovia Corp. | | 3.0 | | 4.4 |
| General Electric Co. | | 2.2 | | 1.4 |
| Citigroup, Inc. | | 2.1 | | 2.3 |
| ACE Ltd. | | 2.0 | | 1.7 |
| | | 42.7 | | |
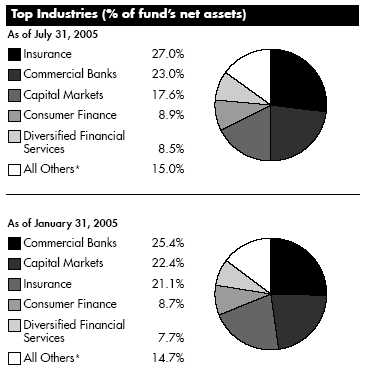
| | * Includes short term investments and net other assets.
Prior period industry classifications reflect the categories in place as of the date
indicated and have not been adjusted to reflect current industry classifications.
|
A-81 Annual Report
| | Advisor Financial Services Fund
Investments July 31, 2005
Showing Percentage of Net Assets
|
| Common Stocks — 99.6% | | | | | | |
| | | Shares | | Value (Note 1) |
| |
| CAPITAL MARKETS – 17.6% | | | | | | |
| Asset Management & Custody Banks – 4.3% | | | | | | |
| American Capital Strategies Ltd. | | 12,100 | | $ | | 455,323 |
| Bank of New York Co., Inc. | | 45,760 | | | | 1,408,493 |
| Calamos Asset Management, Inc. | | | | | | |
| Class A | | 15,400 | | | | 444,136 |
| Federated Investors, Inc. Class B | | | | | | |
| (non-vtg.) | | 20,200 | | | | 645,188 |
| FirstCity Financial Corp. (a) | | 27,900 | | | | 339,264 |
| Franklin Resources, Inc. | | 44,000 | | | | 3,556,080 |
| Investors Financial Services Corp. (d) | | 63,000 | | | | 2,168,460 |
| Legg Mason, Inc. | | 18,900 | | | | 1,930,635 |
| National Financial Partners Corp. | | 21,200 | | | | 959,300 |
| Northern Trust Corp. | | 53,500 | | | | 2,717,800 |
| Nuveen Investments, Inc. Class A | | 25,300 | | | | 961,400 |
| State Street Corp. | | 53,200 | | | | 2,646,168 |
| | | | | | | 18,232,247 |
| Diversified Capital Markets – 1.7% | | | | | | |
| Deutsche Bank AG (NY Shares) | | 4,900 | | | | 423,850 |
| UBS AG (NY Shares) | | 83,000 | | | | 6,802,680 |
| | | | | | | 7,226,530 |
| Investment Banking & Brokerage – 11.6% | | | | | | |
| Ameritrade Holding Corp. (a) | | 37,700 | | | | 736,281 |
| Bear Stearns Companies, Inc. | | 21,500 | | | | 2,195,365 |
| Charles Schwab Corp. | | 229,500 | | | | 3,144,150 |
| E*TRADE Financial Corp. (a) | | 327,400 | | | | 5,077,974 |
| Goldman Sachs Group, Inc. | | 70,000 | | | | 7,523,600 |
| LaBranche & Co., Inc. (a) | | 31,500 | | | | 239,085 |
| Lazard Ltd. Class A | | 47,900 | | | | 1,142,894 |
| Lehman Brothers Holdings, Inc. | | 40,100 | | | | 4,215,713 |
| Merrill Lynch & Co., Inc. | | 334,400 | | | | 19,656,032 |
| Morgan Stanley | | 73,700 | | | | 3,909,785 |
| Piper Jaffray Companies (a) | | 2,479 | | | | 85,302 |
| TradeStation Group, Inc. (a) | | 159,361 | | | | 1,528,272 |
| | | | | | | 49,454,453 |
| |
| TOTAL CAPITAL MARKETS | | | | | | 74,913,230 |
| |
| COMMERCIAL BANKS – 23.0% | | | | | | |
| Diversified Banks – 19.5% | | | | | | |
| Banco Popolare di Verona e Novara | | 103,500 | | | | 1,849,652 |
| Bangkok Bank Ltd. PCL (For. Reg.) | | 346,100 | | | | 880,725 |
| Bank of America Corp. | | 558,702 | | | | 24,359,407 |
| HDFC Bank Ltd. sponsored ADR | | 68,500 | | | | 3,479,800 |
| HSBC Holdings PLC sponsored ADR | | 2,948 | | | | 238,759 |
| Korea Exchange Bank (a) | | 99,100 | | | | 968,436 |
| Mitsubishi Tokyo Financial Group, Inc. | | | | | | |
| (MTFG) sponsored ADR | | 1,200 | | | | 9,960 |
| National Bank of Canada | | 67,300 | | | | 3,149,663 |
| Royal Bank of Canada | | 48,900 | | | | 3,091,322 |
| | | Shares | | Value (Note 1) |
| Standard Chartered PLC (United | | | | |
| Kingdom) | | 166,700 | | $ 3,252,118 |
| State Bank of India | | 100,607 | | 2,130,464 |
| U.S. Bancorp, Delaware | | 257,900 | | 7,752,474 |
| Wachovia Corp. | | 251,677 | | 12,679,487 |
| Wells Fargo & Co. | | 316,500 | | 19,414,110 |
| | | | | 83,256,377 |
| Regional Banks – 3.5% | | | | |
| Cathay General Bancorp | | 62,820 | | 2,232,623 |
| Center Financial Corp., California | | 57,600 | | 1,471,680 |
| City National Corp. | | 10,100 | | 738,007 |
| East West Bancorp, Inc. | | 11,977 | | 413,207 |
| M&T Bank Corp. | | 8,600 | | 933,186 |
| Nara Bancorp, Inc. | | 4,700 | | 73,038 |
| North Fork Bancorp, Inc., New York | | 55,334 | | 1,515,598 |
| SVB Financial Group (a) | | 29,500 | | 1,514,530 |
| Synovus Financial Corp. | | 1,100 | | 32,527 |
| UCBH Holdings, Inc. | | 44,200 | | 807,534 |
| UnionBanCal Corp. | | 23,500 | | 1,676,490 |
| Valley National Bancorp | | 257 | | 6,052 |
| Westcorp | | 58,200 | | 3,372,690 |
| | | | | 14,787,162 |
| |
| TOTAL COMMERCIAL BANKS | | | | 98,043,539 |
| |
| COMMERCIAL SERVICES & SUPPLIES – 0.8% | | | | |
| Diversified Commercial & Professional Services – 0.8% | | |
| Asset Acceptance Capital Corp. (a) | | 125,261 | | 3,424,636 |
| CONSUMER FINANCE – 8.9% | | | | |
| Consumer Finance – 8.9% | | | | |
| Advanta Corp. Class B | | 21,600 | | 646,056 |
| American Express Co. | | 344,000 | | 18,920,000 |
| Capital One Financial Corp. (d) | | 52,600 | | 4,339,500 |
| Dollar Financial Corp. | | 247,333 | | 3,225,222 |
| First Marblehead Corp. (a)(d) | | 107,500 | | 3,735,625 |
| MBNA Corp. | | 162,175 | | 4,080,323 |
| SLM Corp. | | 59,900 | | 3,084,251 |
| | | | | 38,030,977 |
| |
| DIVERSIFIED CONSUMER SERVICES – 0.9% | | | | |
| Specialized Consumer Services – 0.9% | | | | |
| Jackson Hewitt Tax Service, Inc. | | 148,900 | | 3,768,659 |
| DIVERSIFIED FINANCIAL SERVICES – 8.5% | | | | |
| Other Diversifed Financial Services – 7.0% | | | | |
| CapitalSource, Inc. (a)(d) | | 22,000 | | 430,760 |
| Citigroup, Inc. | | 208,669 | | 9,077,102 |
| Infrastructure Development Finance Co. | | | | |
| Ltd. (a) | | 36,274 | | 28,391 |
| JPMorgan Chase & Co. | | 578,294 | | 20,321,251 |
| | | | | 29,857,504 |
| Specialized Finance – 1.5% | | | | |
| Chicago Mercantile Exchange Holdings, | | | | |
| Inc. Class A | | 400 | | 120,420 |
See accompanying notes which are an integral part of the financial statements.
Financial Services A-82
| Common Stocks – continued | | | | |
| | | Shares | | Value (Note 1) |
| |
| DIVERSIFIED FINANCIAL SERVICES – CONTINUED | | |
| Specialized Finance – continued | | | | |
| CIT Group, Inc. | | 119,700 | | $ 5,283,558 |
| Encore Capital Group, Inc. (a) | | 19,500 | | 343,200 |
| Marlin Business Services Corp. (a) | | 36,749 | | 817,665 |
| | | | | 6,564,843 |
| |
| TOTAL DIVERSIFIED FINANCIAL SERVICES | | | | 36,422,347 |
| |
| INDUSTRIAL CONGLOMERATES – 2.2% | | | | |
| Industrial Conglomerates – 2.2% | | | | |
| General Electric Co. | | 274,500 | | 9,470,250 |
| INSURANCE – 27.0% | | | | |
| Insurance Brokers – 0.3% | | | | |
| Hilb Rogal & Hobbs Co. | | 5,500 | | 186,395 |
| Marsh & McLennan Companies, Inc. | | 35,600 | | 1,031,332 |
| | | | | 1,217,727 |
| Life & Health Insurance – 5.1% | | | | |
| AFLAC, Inc. | | 109,100 | | 4,920,410 |
| Lincoln National Corp. | | 6,500 | | 313,950 |
| MetLife, Inc. | | 126,100 | | 6,196,554 |
| Protective Life Corp. | | 17,200 | | 749,232 |
| Prudential Financial, Inc. | | 53,400 | | 3,572,460 |
| Sun Life Financial, Inc. | | 138,000 | | 4,966,129 |
| Torchmark Corp. | | 17,500 | | 914,725 |
| | | | | 21,633,460 |
| Multi-Line Insurance – 11.2% | | | | |
| American International Group, Inc. | | 658,160 | | 39,621,232 |
| Genworth Financial, Inc. Class A | | | | |
| (non-vtg.) | | 17,800 | | 558,208 |
| Hartford Financial Services Group, Inc. | | 74,000 | | 5,962,180 |
| HCC Insurance Holdings, Inc. | | 42,150 | | 1,168,398 |
| Unitrin, Inc. | | 8,100 | | 431,325 |
| | | | | 47,741,343 |
| Property & Casualty Insurance – 7.0% | | | | |
| ACE Ltd. | | 187,700 | | 8,673,617 |
| AMBAC Financial Group, Inc. | | 38,350 | | 2,755,064 |
| Aspen Insurance Holdings Ltd. | | 69,400 | | 1,971,654 |
| Axis Capital Holdings Ltd. | | 46,800 | | 1,347,840 |
| Berkshire Hathaway, Inc. Class B (a) | | 1,444 | | 4,017,208 |
| Fidelity National Financial, Inc. | | 32,350 | | 1,274,590 |
| MBIA, Inc. | | 17,700 | | 1,075,098 |
| The St. Paul Travelers Companies, Inc. | | 108,800 | | 4,789,376 |
| XL Capital Ltd. Class A | | 57,000 | | 4,093,740 |
| | | | | 29,998,187 |
| | | Shares | | Value (Note 1) |
| Reinsurance – 3.4% | | | | |
| Endurance Specialty Holdings Ltd. | | 162,470 | | $ 6,336,330 |
| Max Re Capital Ltd. | | 70,562 | | 1,619,398 |
| Montpelier Re Holdings Ltd. | | 24,500 | | 880,040 |
| PartnerRe Ltd. | | 44,000 | | 2,852,080 |
| Platinum Underwriters Holdings Ltd. | | 40,200 | | 1,393,734 |
| Scottish Re Group Ltd. | | 62,800 | | 1,510,340 |
| | | | | 14,591,922 |
| |
| TOTAL INSURANCE | | | | 115,182,639 |
| |
| IT SERVICES – 0.0% | | | | |
| Data Processing & Outsourced Services – 0.0% | | |
| First Data Corp. | | 200 | | 8,228 |
| REAL ESTATE – 3.3% | | | | |
| Real Estate Investment Trusts – 3.3% | | | | |
| Apartment Investment & Management | | | | |
| Co. Class A | | 33,200 | | 1,460,800 |
| CBL & Associates Properties, Inc. | | 24,292 | | 1,114,517 |
| Digital Realty Trust, Inc. | | 34,300 | | 649,642 |
| Duke Realty Corp. | | 23,000 | | 781,080 |
| Equity Lifestyle Properties, Inc. | | 14,200 | | 625,794 |
| Equity Residential (SBI) | | 29,600 | | 1,195,840 |
| Federal Realty Investment Trust (SBI) | | 7,400 | | 483,294 |
| Healthcare Realty Trust, Inc. | | 47,000 | | 1,920,420 |
| Reckson Associates Realty Corp. | | 25,400 | | 892,048 |
| Simon Property Group, Inc. | | 52,800 | | 4,210,272 |
| The Mills Corp. | | 9,500 | | 618,070 |
| Vornado Realty Trust | | 300 | | 26,592 |
| | | | | 13,978,369 |
| |
| THRIFTS & MORTGAGE FINANCE – 7.4% | | | | |
| Thrifts & Mortgage Finance – 7.4% | | | | |
| Countrywide Financial Corp. | | 104,329 | | 3,755,844 |
| Doral Financial Corp. | | 24,300 | | 374,949 |
| Downey Financial Corp. | | 7,500 | | 580,800 |
| Fannie Mae | | 139,335 | | 7,783,253 |
| Freddie Mac | | 17,700 | | 1,120,056 |
| Golden West Financial Corp., Delaware | | 63,300 | | 4,122,096 |
| Housing Development Finance Corp. Ltd. | | 66,594 | | 1,419,262 |
| Hudson City Bancorp, Inc. | | 220,075 | | 2,603,487 |
| Hypo Real Estate Holding AG | | 27,300 | | 1,108,892 |
| MGIC Investment Corp. | | 16,900 | | 1,159,002 |
| Radian Group, Inc. | | 20,655 | | 1,065,385 |
| Sovereign Bancorp, Inc. | | 75,900 | | 1,820,841 |
| The PMI Group, Inc. | | 28,200 | | 1,154,790 |
| W Holding Co., Inc. | | 109,774 | | 1,173,484 |
| Washington Mutual, Inc. | | 49,500 | | 2,102,760 |
| | | | | 31,344,901 |
| |
| TOTAL COMMON STOCKS | | | | |
| (Cost $331,553,582) | | | | 424,587,775 |
See accompanying notes which are an integral part of the financial statements.
A-83 Annual Report
| | Advisor Financial Services Fund
Investments - continued
|
| Money Market Funds — 2.4% | | | | |
| | | Shares | | | | Value (Note 1) |
| Fidelity Cash Central Fund, 3.31% (b) | | 233,116 | | $ | | 233,116 |
| Fidelity Securities Lending Cash | | | | | | |
| Central Fund, 3.32% (b)(c) | | 9,845,400 | | | | 9,845,400 |
| TOTAL MONEY MARKET FUNDS | | | | | | |
| (Cost $10,078,516) | | | | | | 10,078,516 |
| TOTAL INVESTMENT PORTFOLIO - 102.0% | | 434,666,291 |
| (Cost $341,632,098) | | | | | | |
| |
| NET OTHER ASSETS – (2.0)% | | | | | | (8,411,362) |
| NET ASSETS – 100% | | | | 426,254,929 |
Legend
(a) Non-income producing
(b) Affiliated fund that is available only to investment companies and other
accounts managed by Fidelity Investments. The rate quoted is the
annualized seven-day yield of the fund at period end. A complete listing
of the fund’s holdings as of its most recent quarter end is available upon
request.
(c) Investment made with cash collateral received from securities on loan.
(d) Security or a portion of the security is on loan at period end.
Other Information
Distribution of investments by country of issue, as a percentage of total net
assets, is as follows:
|
| United States of America | | 85.6% |
| Bermuda | | 6.2% |
| Canada | | 2.6% |
| India | | 1.6% |
| Switzerland | | 1.6% |
| Others (individually less than 1%) | | 2.4% |
| | | 100.0% |
See accompanying notes which are an integral part of the financial statements.
Financial Services A-84
Advisor Financial Services Fund
Financial Statements
|
| Statement of Assets and Liabilities | | |
| | | | | | | July 31, 2005 |
| Assets | | | | | | |
| Investment in securities, at value (including | | | | |
| securities loaned of $9,488,478) (cost | | | | |
| $341,632,098) — See accompanying | | | | |
| schedule | | | | $ | | 434,666,291 |
| Receivable for investments sold | | | | | | 8,583,747 |
| Receivable for fund shares sold | | | | | | 87,071 |
| Dividends receivable | | | | | | 575,878 |
| Interest receivable | | | | | | 3,572 |
| Prepaid expenses | | | | | | 794 |
| Other receivables | | | | | | 58,755 |
| Total assets | | | | | | 443,976,108 |
| Liabilities | | | | | | |
| Payable for investments purchased | | $ | | 5,970,741 | | |
| Payable for fund shares redeemed | | | | 1,189,786 | | |
| Accrued management fee | | | | 203,992 | | |
| Distribution fees payable | | | | 250,107 | | |
| Other affiliated payables | | | | 135,709 | | |
| Other payables and accrued expenses | | | | 125,444 | | |
| Collateral on securities loaned, at value | | | | 9,845,400 | | |
| Total liabilities | | | | | | 17,721,179 |
| Net Assets | | | | $ | | 426,254,929 |
| Net Assets consist of: | | | | | | |
| Paid in capital | | | | $ | | 304,961,464 |
| Undistributed net investment income | | | | | | 1,342,292 |
| Accumulated undistributed net realized | | | | | | |
| gain (loss) on investments and foreign | | | | |
| currency transactions | | | | | | 27,006,388 |
| Net unrealized appreciation (depreciation) | | | | |
| on investments and assets and liabilities | | | | |
| in foreign currencies | | | | | | 92,944,785 |
| Net Assets | | | | $ | | 426,254,929 |
| Calculation of Maximum Offering Price | | | | |
| Class A: | | | | | | |
| Net Asset Value and redemption price | | | | |
| per share ($68,011,723 ÷ 2,955,518 | | | | |
| shares) | | | | $ | | 23.01 |
| Maximum offering price per share | | | | | | |
| (100/94.25 of $23.01) | | | | $ | | 24.41 |
| Class T: | | | | | | |
| Net Asset Value and redemption price | | | | |
| per share ($128,387,962 ÷ | | | | | | |
| 5,613,688 shares) | | | | $ | | 22.87 |
| Maximum offering price per share | | | | | | |
| (100/96.50 of $22.87) | | | | $ | | 23.70 |
| Class B: | | | | | | |
| Net Asset Value and offering price per | | | | |
| share ($145,045,526 ÷ 6,496,655 | | | | |
| shares)A | | | | $ | | 22.33 |
| Class C: | | | | | | |
| Net Asset Value and offering price per | | | | |
| share ($72,180,734 ÷ 3,231,531 | | | | | | |
| shares)A | | | | $ | | 22.34 |
| Institutional Class: | | | | | | |
| Net Asset Value, offering price and | | | | | | |
| redemption price per share | | | | | | |
| ($12,628,984 ÷ 542,150 shares) | | | | $ | | 23.29 |
| A Redemption price per share is equal to net asset value less any applicable contingent deferred sales charge. |
| Statement of Operations | | | | |
| | | | | Year ended July 31, 2005 |
| Investment Income | | | | | | |
| Dividends | | | | $ | | 9,409,732 |
| Interest | | | | | | 256,286 |
| Security lending | | | | | | 62,393 |
| Total income | | | | | | 9,728,411 |
| Expenses | | | | | | |
| Management fee | | $ | | 2,637,887 | | |
| Transfer agent fees | | | | 1,560,451 | | |
| Distribution fees | | | | 3,309,641 | | |
| Accounting and security lending | | | | | | |
| fees | | | | 190,345 | | |
| Independent trustees’ compensation | | 2,442 | | |
| Custodian fees and expenses | | | | 18,548 | | |
| Registration fees | | | | 61,852 | | |
| Audit | | | | 44,595 | | |
| Legal | | | | 1,734 | | |
| Miscellaneous | | | | 7,547 | | |
| Total expenses before reductions | | 7,835,042 | | |
| Expense reductions | | | | (111,140) | | 7,723,902 |
| |
| Net investment income (loss) | | | | | | 2,004,509 |
| Realized and Unrealized Gain | | | | | | |
| (Loss) | | | | | | |
| Net realized gain (loss) on: | | | | | | |
| Investment securities | | | | 35,580,505 | | |
| Foreign currency transactions | | | | 4,184 | | |
| Total net realized gain (loss) | | | | | | 35,584,689 |
| Change in net unrealized appreci- | | | | |
| ation (depreciation) on: | | | | | | |
| Investment securities (net of in- | | | | | | |
| crease in deferred foreign taxes | | | | |
| of $89,524) | | | | 15,327,599 | | |
| Assets and liabilities in foreign | | | | | | |
| currencies | | | | (178) | | |
| Total change in net unrealized ap- | | | | |
| preciation (depreciation) | | | | | | 15,327,421 |
| Net gain (loss) | | | | | | 50,912,110 |
| Net increase (decrease) in net as- | | | | |
| sets resulting from operations | | | | $ | | 52,916,619 |
See accompanying notes which are an integral part of the financial statements.
A-85 Annual Report
| | Advisor Financial Services Fund
Financial Statements - continued
|
| Statement of Changes in Net Assets | | | | | | |
| | | Year ended | | | | Year ended |
| | | July 31, | | | | July 31, |
| | | 2005 | | | | 2004 |
| Increase (Decrease) in Net Assets | | | | | | |
| Operations | | | | | | |
| Net investment income (loss) | | $ 2,004,509 | | $ | | 887,555 |
| Net realized gain (loss) | | 35,584,689 | | | | 60,089,042 |
| Change in net unrealized appreciation (depreciation) | | 15,327,421 | | | | (3,464,721) |
| Net increase (decrease) in net assets resulting from operations | | 52,916,619 | | | | 57,511,876 |
| Distributions to shareholders from net investment income | | (623,607) | | | | (1,712,624) |
| Distributions to shareholders from net realized gain | | (38,323,892) | | | | — |
| Total distributions | | (38,947,499) | | | | (1,712,624) |
| Share transactions -- net increase (decrease) | | (69,921,968) | | | | (93,511,617) |
| Redemption fees | | 19,265 | | | | 62,072 |
| Total increase (decrease) in net assets | | (55,933,583) | | | | (37,650,293) |
| |
| Net Assets | | | | | | |
| Beginning of period | | 482,188,512 | | | | 519,838,805 |
| End of period (including undistributed net investment income of $1,342,292 and undistributed net investment income of | | | | | | |
| $1,503, respectively) | | $ 426,254,929 | | $ | | 482,188,512 |
| Financial Highlights — Class A | | | | | | | | | | |
| Years ended July 31, | | 2005 | | 2004 | | 2003 | | 2002 | | 2001 |
| Selected Per-Share Data | | | | | | | | | | |
| Net asset value, beginning of period | | $ 22.17 | | $ 19.98 | | $ 17.83 | | $ 20.45 | | $ 18.29 |
| Income from Investment Operations | | | | | | | | | | |
| Net investment income (loss)C | | 19 | | .14 | | .16 | | .12 | | .15 |
| Net realized and unrealized gain (loss) | | 2.48 | | 2.20 | | 2.07 | | (2.60) | | 2.20 |
| Total from investment operations | | 2.67 | | 2.34 | | 2.23 | | (2.48) | | 2.35 |
| Distributions from net investment income | | (.07) | | (.15) | | (.08) | | (.14) | | (.19) |
| Distributions from net realized gain | | (1.76) | | — | | — | | — | | — |
| Total distributions | | (1.83) | | (.15) | | (.08) | | (.14) | | (.19) |
| Redemption fees added to paid in capitalC | | —E | | —E | | —E | | —E | | —E |
| Net asset value, end of period | | $ 23.01 | | $ 22.17 | | $ 19.98 | | $ 17.83 | | $ 20.45 |
| Total ReturnA,B | | 12.60% | | 11.76% | | 12.57% | | (12.16)% | | 12.86% |
| Ratios to Average Net AssetsD | | | | | | | | | | |
| Expenses before expense reductions | | 1.26% | | 1.27% | | 1.31% | | 1.27% | | 1.20% |
| Expenses net of voluntary waivers, if any | | 1.26% | | 1.27% | | 1.31% | | 1.27% | | 1.20% |
| Expenses net of all reductions | | 1.23% | | 1.25% | | 1.27% | | 1.23% | | 1.18% |
| Net investment income (loss) | | 88% | | .63% | | .89% | | .60% | | .77% |
| Supplemental Data | | | | | | | | | | |
| Net assets, end of period (000 omitted) | | $ 68,012 | | $ 58,222 | | $ 57,255 | | $ 60,475 | | $ 78,115 |
| Portfolio turnover rate | | 61% | | 74% | | 60% | | 125% | | 110% |
A Total returns would have been lower had certain expenses not been reduced during the periods shown.
B Total returns do not include the effect of the sales charges.
C Calculated based on average shares outstanding during the period.
D Expense ratios reflect operating expenses of the class. Expenses before reductions do not reflect amounts reimbursed by the investment adviser or reductions from brokerage service arrangements or other expense offset arrangements and do not
represent the amount paid by the class during periods when reimbursements or reductions occur. Expenses net of any voluntary waivers reflect expenses after reimbursement by the investment adviser but prior to reductions from brokerage service
arrangements or other expense offset arrangements. Expenses net of all reductions represent the net expenses paid by the class.
E Amount represents less than $.01 per share.
|
See accompanying notes which are an integral part of the financial statements.
Financial Services A-86
| Financial Highlights — Class T | | | | | | | | | | |
| Years ended July 31, | | 2005 | | 2004 | | 2003 | | 2002 | | 2001 |
| Selected Per-Share Data | | | | | | | | | | |
| Net asset value, beginning of period | | $ 22.07 | | $ 19.90 | | $ 17.77 | | $ 20.38 | | $ 18.21 |
| Income from Investment Operations | | | | | | | | | | |
| Net investment income (loss)C | | 14 | | .09 | | .12 | | .07 | | .11 |
| Net realized and unrealized gain (loss) | | 2.47 | | 2.19 | | 2.07 | | (2.59) | | 2.19 |
| Total from investment operations | | 2.61 | | 2.28 | | 2.19 | | (2.52) | | 2.30 |
| Distributions from net investment income | | (.05) | | (.11) | | (.06) | | (.09) | | (.13) |
| Distributions from net realized gain | | (1.76) | | — | | — | | — | | — |
| Total distributions | | (1.81) | | (.11) | | (.06) | | (.09) | | (.13) |
| Redemption fees added to paid in capitalC | | —E | | —E | | —E | | —E | | —E |
| Net asset value, end of period | | $ 22.87 | | $ 22.07 | | $ 19.90 | | $ 17.77 | | $ 20.38 |
| Total ReturnA,B | | 12.37% | | 11.49% | | 12.37% | | (12.39)% | | 12.64% |
| Ratios to Average Net AssetsD | | | | | | | | | | |
| Expenses before expense reductions | | 1.48% | | 1.50% | | 1.53% | | 1.49% | | 1.43% |
| Expenses net of voluntary waivers, if any | | 1.48% | | 1.50% | | 1.53% | | 1.49% | | 1.43% |
| Expenses net of all reductions | | 1.46% | | 1.48% | | 1.49% | | 1.45% | | 1.41% |
| Net investment income (loss) | | 66% | | .41% | | .67% | | .38% | | .54% |
| Supplemental Data | | | | | | | | | | |
| Net assets, end of period (000 omitted) | | $ 128,388 | | $ 144,887 | | $ 157,238 | | $ 169,429 | | $ 234,268 |
| Portfolio turnover rate | | 61% | | 74% | | 60% | | 125% | | 110% |
| | A Total returns would have been lower had certain expenses not been reduced during the periods shown.
B Total returns do not include the effect of the sales charges.
C Calculated based on average shares outstanding during the period.
D Expense ratios reflect operating expenses of the class. Expenses before reductions do not reflect amounts reimbursed by the investment adviser or reductions from brokerage service arrangements or other expense offset arrangements and do not
represent the amount paid by the class during periods when reimbursements or reductions occur. Expenses net of any voluntary waivers reflect expenses after reimbursement by the investment adviser but prior to reductions from brokerage service
arrangements or other expense offset arrangements. Expenses net of all reductions represent the net expenses paid by the class.
E Amount represents less than $.01 per share.
|
| Financial Highlights — Class B | | | | | | | | | | |
| Years ended July 31, | | 2005 | | 2004 | | 2003 | | 2002 | | 2001 |
| Selected Per-Share Data | | | | | | | | | | |
| Net asset value, beginning of period | | $ 21.65 | | $ 19.53 | | $ 17.50 | | $ 20.08 | | $ 17.95 |
| Income from Investment Operations | | | | | | | | | | |
| Net investment income (loss)C | | 03 | | (.02) | | .03 | | (.03) | | —E |
| Net realized and unrealized gain (loss) | | 2.41 | | 2.16 | | 2.03 | | (2.55) | | 2.16 |
| Total from investment operations | | 2.44 | | 2.14 | | 2.06 | | (2.58) | | 2.16 |
| Distributions from net investment income | | — | | (.02) | | (.03) | | — | | (.03) |
| Distributions from net realized gain | | (1.76) | | — | | — | | — | | — |
| Total distributions | | (1.76) | | (.02) | | (.03) | | — | | (.03) |
| Redemption fees added to paid in capitalC | | —E | | —E | | —E | | —E | | —E |
| Net asset value, end of period | | $ 22.33 | | $ 21.65 | | $ 19.53 | | $ 17.50 | | $ 20.08 |
| Total ReturnA,B | | 11.78% | | 10.96% | | 11.80% | | (12.85)% | | 12.03% |
| Ratios to Average Net AssetsD | | | | | | | | | | |
| Expenses before expense reductions | | 2.00% | | 2.02% | | 2.03% | | 2.01% | | 1.96% |
| Expenses net of voluntary waivers, if any | | 2.00% | | 2.02% | | 2.03% | | 2.01% | | 1.96% |
| Expenses net of all reductions | | 1.98% | | 2.00% | | 1.99% | | 1.97% | | 1.94% |
| Net investment income (loss) | | 14% | | (.11)% | | .17% | | (.14)% | | .01% |
| Supplemental Data | | | | | | | | | | |
| Net assets, end of period (000 omitted) | | $ 145,046 | | $ 179,873 | | $ 193,373 | | $ 206,460 | | $ 269,612 |
| Portfolio turnover rate | | 61% | | 74% | | 60% | | 125% | | 110% |
A Total returns would have been lower had certain expenses not been reduced during the periods shown.
B Total returns do not include the effect of the contingent deferred sales charge.
C Calculated based on average shares outstanding during the period.
D Expense ratios reflect operating expenses of the class. Expenses before reductions do not reflect amounts reimbursed by the investment adviser or reductions from brokerage service arrangements or other expense offset arrangements and do not
represent the amount paid by the class during periods when reimbursements or reductions occur. Expenses net of any voluntary waivers reflect expenses after reimbursement by the investment adviser but prior to reductions from brokerage service
arrangements or other expense offset arrangements. Expenses net of all reductions represent the net expenses paid by the class.
E Amount represents less than $.01 per share.
|
See accompanying notes which are an integral part of the financial statements.
A-87 Annual Report
| Financial Highlights — Class C | | | | | | | | | | |
| Years ended July 31, | | 2005 | | 2004 | | 2003 | | 2002 | | 2001 |
| Selected Per-Share Data | | | | | | | | | | |
| Net asset value, beginning of period | | $ 21.65 | | $ 19.53 | | $ 17.49 | | $ 20.05 | | $ 17.96 |
| Income from Investment Operations | | | | | | | | | | |
| Net investment income (loss)C | | 04 | | (.01) | | .04 | | (.02) | | .01 |
| Net realized and unrealized gain (loss) | | 2.42 | | 2.15 | | 2.03 | | (2.54) | | 2.15 |
| Total from investment operations | | 2.46 | | 2.14 | | 2.07 | | (2.56) | | 2.16 |
| Distributions from net investment income | | (.01) | | (.02) | | (.03) | | — | | (.07) |
| Distributions from net realized gain | | (1.76) | | — | | — | | — | | — |
| Total distributions | | (1.77) | | (.02) | | (.03) | | — | | (.07) |
| Redemption fees added to paid in capitalC | | —E | | —E | | —E | | —E | | —E |
| Net asset value, end of period | | $ 22.34 | | $ 21.65 | | $ 19.53 | | $ 17.49 | | $ 20.05 |
| Total ReturnA,B | | 11.88% | | 10.96% | | 11.86% | | (12.77)% | | 12.03% |
| Ratios to Average Net AssetsD | | | | | | | | | | |
| Expenses before expense reductions | | 1.95% | | 1.97% | | 1.99% | | 1.96% | | 1.92% |
| Expenses net of voluntary waivers, if any | | 1.95% | | 1.97% | | 1.99% | | 1.96% | | 1.92% |
| Expenses net of all reductions | | 1.92% | | 1.95% | | 1.95% | | 1.92% | | 1.90% |
| Net investment income (loss) | | 19% | | (.06) % | | .22% | | (.09) % | | .05% |
| Supplemental Data | | | | | | | | | | |
| Net assets, end of period (000 omitted) | | $ 72,181 | | $ 86,199 | | $ 97,434 | | $ 107,899 | | $ 149,160 |
| Portfolio turnover rate | | 61% | | 74% | | 60% | | 125% | | 110% |
A Total returns would have been lower had certain expenses not been reduced during the periods shown.
B Total returns do not include the effect of the contingent deferred sales charge.
C Calculated based on average shares outstanding during the period.
D Expense ratios reflect operating expenses of the class. Expenses before reductions do not reflect amounts reimbursed by the investment adviser or reductions from brokerage service arrangements or other expense offset arrangements and do not
represent the amount paid by the class during periods when reimbursements or reductions occur. Expenses net of any voluntary waivers reflect expenses after reimbursement by the investment adviser but prior to reductions from brokerage service
arrangements or other expense offset arrangements. Expenses net of all reductions represent the net expenses paid by the class.
E Amount represents less than $.01 per share.
|
| Financial Highlights — Institutional Class | | | | | | | | | | |
| Years ended July 31, | | 2005 | | 2004 | | 2003 | | 2002 | | 2001 |
| Selected Per-Share Data | | | | | | | | | | |
| Net asset value, beginning of period | | $ 22.37 | | $ 20.17 | | $ 17.95 | | $ 20.59 | | $ 18.39 |
| Income from Investment Operations | | | | | | | | | | |
| Net investment income (loss)B | | 29 | | .23 | | .24 | | .19 | | .22 |
| Net realized and unrealized gain (loss) | | 2.50 | | 2.21 | | 2.09 | | (2.62) | | 2.22 |
| Total from investment operations | | 2.79 | | 2.44 | | 2.33 | | (2.43) | | 2.44 |
| Distributions from net investment income | | (.11) | | (.24) | | (.11) | | (.21) | | (.24) |
| Distributions from net realized gain | | (1.76) | | — | | — | | — | | — |
| Total distributions | | (1.87) | | (.24) | | (.11) | | (.21) | | (.24) |
| Redemption fees added to paid in capitalB | | —D | | —D | | —D | | —D | | —D |
| Net asset value, end of period | | $ 23.29 | | $ 22.37 | | $ 20.17 | | $ 17.95 | | $ 20.59 |
| Total ReturnA | | 13.06% | | 12.18% | | 13.07% | | (11.84)% | | 13.29% |
| Ratios to Average Net AssetsC | | | | | | | | | | |
| Expenses before expense reductions | | 86% | | .88% | | .88% | | .89% | | .87% |
| Expenses net of voluntary waivers, if any | | 86% | | .88% | | .88% | | .89% | | .87% |
| Expenses net of all reductions | | 84% | | .85% | | .84% | | .85% | | .84% |
| Net investment income (loss) | | 1.28% | | 1.03% | | 1.32% | | .98% | | 1.10% |
| Supplemental Data | | | | | | | | | | |
| Net assets, end of period (000 omitted) | | $ 12,629 | | $ 13,008 | | $ 14,539 | | $ 15,283 | | $ 17,966 |
| Portfolio turnover rate | | 61% | | 74% | | 60% | | 125% | | 110% |
A Total returns would have been lower had certain expenses not been reduced during the periods shown.
B Calculated based on average shares outstanding during the period.
C Expense ratios reflect operating expenses of the class. Expenses before reductions do not reflect amounts reimbursed by the investment adviser or reductions from brokerage service arrangements or other expense offset arrangements and do not
represent the amount paid by the class during periods when reimbursements or reductions occur. Expenses net of any voluntary waivers reflect expenses after reimbursement by the investment adviser but prior to reductions from brokerage service
arrangements or other expense offset arrangements. Expenses net of all reductions represent the net expenses paid by the class.
D Amount represents less than $.01 per share.
|
See accompanying notes which are an integral part of the financial statements.
Financial Services A-88
|
Notes to Financial Statements
For the period ended July 31, 2005
|
1. Significant Accounting Policies.
|
Fidelity Advisor Financial Services Fund (the fund) is a fund of Fidelity Advisor Series VII (the trust) and is authorized to issue an unlimited number of shares. The trust is registered under the Investment Company Act of 1940, as amended (the 1940 Act), as an open-end management investment company organized as a Massachusetts business trust.
The fund offers Class A, Class T, Class B, Class C and Institutional Class shares, each of which has equal rights as to assets and voting privileges. Each class has exclusive voting rights with respect to matters that affect that class. Class B shares will automatically convert to Class A shares after a holding period of seven years from the initial date of purchase. Investment income, realized and unrealized capital gains and losses, the common expenses of the fund, and certain fund-level expense reductions, if any, are allocated on a pro rata basis to each class based on the relative net assets of each class to the total net assets of the fund. Each class differs with respect to transfer agent and distribution and service plan fees incurred. Certain expense reductions also differ by class.
The financial statements have been prepared in conformity with accounting principles generally accepted in the United States of America, which require management to make certain estimates and assumptions at the date of the financial statements. The following summarizes the significant accounting policies of the fund:
Security Valuation. Net asset value per share (NAV calculation) is calculated as of the close of business of the New York Stock Exchange, normally 4:00 p.m. Eastern time. Equity securities, including restricted securities, for which market quotations are available are valued at the last sale price or official closing price (closing bid price or last evaluated quote if no sale has occurred) on the primary market or exchange on which they trade. If prices are not readily available or do not accurately reflect fair value for a security, or if a security’s value has been materially affected by events occurring after the close of the exchange or market on which the security is principally traded, that security may be valued by another method that the Board of Trustees believes accurately reflects fair value. A security’s valuation may differ depending on the method used for determining value. Price movements in futures contracts and ADRs, market and trading trends, the bid/ask quotes of brokers and off-exchange institutional trading may be reviewed in the course of making a good faith determination of a security’s fair value. Short-term securities with remaining maturities of sixty days or less for which quotations are not readily available are valued on the basis of amortized cost. Investments in open-end investment companies are valued at their net asset value each business day.
Foreign Currency. The fund uses foreign currency contracts to facilitate transactions in foreign-denominated securities. Losses from these transactions may arise from changes in the value of the foreign currency or if the counterparties do not perform under the contracts’ terms.
Foreign-denominated assets, including investment securities, and liabilities are translated into U.S. dollars at the exchange rate at period end. Purchases and sales of investment securities, income and dividends received and expenses denominated in foreign currencies are translated into U.S. dollars at the exchange rate in effect on the transaction date.
The effects of exchange rate fluctuations on investments are included with the net realized and unrealized gain (loss) on investment securities. Other foreign currency transactions resulting in realized and unrealized gain (loss) are disclosed separately.
Investment Transactions and Income. Security transactions are accounted for as of trade date. Gains and losses on securities sold are determined on the basis of identified cost and may include proceeds received from litigation. Dividend income is recorded on the ex-dividend date, except for certain dividends from foreign securities where the ex-dividend date may have passed, which are recorded as soon as the fund is informed of the ex-dividend date. Non-cash dividends included in dividend income, if any, are recorded at the fair market value of the securities received. Distributions received on securities that represent a return of capital or capital gain are recorded as a reduction of cost of investments and/or as a realized gain. The fund estimates the components of distributions received that may be considered return of capital distributions or capital gain distributions. Interest income is accrued as earned. Interest income includes coupon interest and amortization of premium and accretion of discount on debt securities. Investment income is recorded net of foreign taxes withheld where recovery of such taxes is uncertain.
Expenses. Most expenses of the trust can be directly attributed to a fund. Expenses which cannot be directly attributed are apportioned among each fund in the trust.
Income Tax Information and Distributions to Shareholders. Each year, the fund intends to qualify as a regulated investment company by distributing all of its taxable income and realized gains under Subchapter M of the Internal Revenue Code. As a result, no provision for income taxes is required in the accompanying financial statements. Foreign taxes are provided for based on the fund’s understanding of the tax rules and rates that exist in the foreign markets in which it invests.
Distributions are recorded on the ex-dividend date. Income dividends and capital gain distributions are declared separately for each class. Income and capital gain distributions are determined in accordance with income tax regulations, which may differ from generally accepted accounting principles. In addition, the fund will claim a portion of the payment made to redeeming shareholders as a distribution for income tax purposes. Capital accounts within the financial statements are adjusted for permanent book-tax differences. These adjustments have no impact on net assets or the results of operations. Temporary book-tax differences will reverse in a subsequent period.
| | Notes to Financial Statements - continued
1. Significant Accounting Policies - continued
Income Tax Information and Distributions to Shareholders - continued
Book-tax differences are primarily due to foreign currency transactions, passive foreign investment companies (PFIC), and losses deferred due to wash
sales.
The tax-basis components of distributable earnings and the federal tax cost as of period end were as follows:
|
| Unrealized appreciation | | $ 97,330,451 |
| Unrealized depreciation | | (6,232,419) |
| Net unrealized appreciation (depreciation) | | 91,098,032 |
| Undistributed ordinary income | | 3,234,012 |
| Undistributed long-term capital gain | | 22,659,058 |
| |
| Cost for federal income tax purposes | | $ 343,568,259 |
The tax character of distributions paid was as follows:
| | | July 31, 2005 | | | | July 31, 2004 |
| Ordinary Income | | $ 2,154,145 | | $ | | 1,674,060 |
| Long-term Capital Gains | | 36,793,354 | | | | 38,564 |
| Total | | $ 38,947,499 | | $ | | 1,712,624 |
Short-Term Trading (Redemption) Fees. Shares held in the fund less than 60 days are subject to a redemption fee equal to 1.00% of the proceeds of
the redeemed shares. All redemption fees, including any estimated redemption fees paid by Fidelity Management & Research Company (FMR), are
retained by the fund and accounted for as an addition to paid in capital.
2. Operating Policies.
Repurchase Agreements. FMR has received an Exemptive Order from the Securities and Exchange Commission (the SEC) which permits the fund
and other affiliated entities of FMR to transfer uninvested cash balances into joint trading accounts which are then invested in repurchase agreements.
The fund may also invest directly with institutions in repurchase agreements. Repurchase agreements are collateralized by government or non-
government securities. Collateral is held in segregated accounts with custodian banks and may be obtained in the event of a default of the counterparty.
The fund monitors, on a daily basis, the value of the collateral to ensure it is at least equal to the principal amount of the repurchase agreement (in-
cluding accrued interest). In the event of a default by the counterparty, realization of the collateral proceeds could be delayed, during which time the
value of the collateral may decline.
3. Purchases and Sales of Investments.
Purchases and sales of securities, other than short-term securities and U.S. government securities, aggregated $273,730,322 and $371,782,892,
respectively.
4. Fees and Other Transactions with Affiliates.
Management Fee. FMR and its affiliates provide the fund with investment management related services for which the fund pays a monthly manage-
ment fee. The management fee is the sum of an individual fund fee rate that is based on an annual rate of .30% of the fund’s average net assets and a
group fee rate that averaged .27% during the period. The group fee rate is based upon the average net assets of all the mutual funds advised by FMR.
The group fee rate decreases as assets under management increase and increases as assets under management decrease. For the period, the total
annual management fee rate was .57% of the fund’s average net assets.
Distribution and Service Plan. In accordance with Rule 12b-1 of the 1940 Act, the fund has adopted separate Distribution and Service Plans for each
class of shares. Certain classes pay Fidelity Distributors Corporation (FDC), an affiliate of FMR, separate Distribution and Service Fees, each of which
is based on an annual percentage of each class’ average net assets. In addition, FDC may pay financial intermediaries for selling shares of the fund and
providing shareholder support services. For the period, the Distribution and Service Fee rates and the total amounts paid to and retained by FDC were
as follows:
|
| | | Distribution | | Service | | | | Paid to | | | | Retained |
| | | Fee | | Fee | | | | FDC | | | | by FDC |
| Class A | | 0% | | .25% | | $ | | 157,105 | | $ | | 400 |
| Class T | | 25% | | .25% | | | | 690,352 | | | | 3,856 |
| Class B | | 75% | | .25% | | | | 1,661,090 | | | | 1,247,510 |
| Class C | | 75% | | .25% | | | | 801,094 | | | | 50,427 |
| |
| | | | | | | $ | | 3,309,641 | | $ | | 1,302,193 |
Financial Services A-90
4. Fees and Other Transactions with Affiliates - continued
Sales Load. FDC receives a front-end sales charge of up to 5.75% for selling Class A shares, and 3.50% for selling Class T shares, some of which is paid to financial intermediaries for selling shares of the fund. FDC receives the proceeds of contingent deferred sales charges levied on Class A, Class T, Class B, and Class C redemptions. These charges depend on the holding period. The deferred sales charges range from 5% to 1% for Class B, 1% for Class C, and .25% for certain purchases of Class A and Class T shares.
For the period, sales charge amounts retained by FDC were as follows:
| | | | | Retained |
| | | | | by FDC |
| Class A | | $ | | 20,261 |
| Class T | | | | 11,108 |
| Class B* | | | | 410,846 |
| Class C* | | | | 4,432 |
| | | $ | | 446,647 |
* When Class B and Class C shares are initially sold, FDC pays commissions from its own resources to financial intermediaries through which the sales are made.
Transfer Agent Fees. Fidelity Investments Institutional Operations Company, Inc. (FIIOC), an affiliate of FMR, is the transfer, dividend disbursing and shareholder servicing agent for each class of the fund. FIIOC receives account fees and asset-based fees that vary according to the account size and type of account of the shareholders of the respective classes of the fund. FIIOC pays for typesetting, printing and mailing of shareholder reports, except proxy statements. For the period the total transfer agent fees paid by each class to FIIOC, were as follows:
| | | | | | | % of |
| | | | | | | Average |
| | | | | Amount | | Net Assets |
| Class A | | $ | | 228,184 | | .36 |
| Class T | | | | 467,917 | | .34 |
| Class B | | | | 592,505 | | .36 |
| Class C | | | | 243,893 | | .30 |
| Institutional Class | | | | 27,952 | | .22 |
| |
| | | $ | | 1,560,451 | | |
Accounting and Security Lending Fees. Fidelity Service Company, Inc. (FSC), an affiliate of FMR, maintains the fund’s accounting records. The accounting fee is based on the level of average net assets for the month. Under a separate contract, FSC administers the security lending program. The security lending fee is based on the number and duration of lending transactions.
Central Funds. The fund may invest in affiliated Central Funds managed by Fidelity Investments Money Management, Inc. (FIMM), an affiliate of FMR. The Central Funds are open-end investment companies available only to investment companies and other accounts managed by FMR and its affiliates. The Money Market Central Funds seek preservation of capital and current income. The Central Funds do not pay a management fee. Income distributions earned by the fund are recorded as income in the accompanying financial statements and totaled $350,732 for the period.
Brokerage Commissions. The fund placed a portion of its portfolio transactions with brokerage firms which are affiliates of the investment adviser. The commissions paid to these affiliated firms were $32,677 for the period.
5. Committed Line of Credit.
The fund participates with other funds managed by FMR in a $4.2 billion credit facility (the “line of credit”) to be utilized for temporary or emergency purposes to fund shareholder redemptions or for other short-term liquidity purposes. The fund has agreed to pay commitment fees on its pro rata portion of the line of credit. During the period, there were no borrowings on this line of credit.
A-91 Annual Report
Notes to Financial Statements - continued
6. Security Lending.
The fund lends portfolio securities from time to time in order to earn additional income. The fund receives collateral (in the form of U.S. Treasury obligations, letters of credit and/or cash) against the loaned securities and maintains collateral in an amount not less than 100% of the market value of the loaned securities during the period of the loan. The market value of the loaned securities is determined at the close of business of the fund and any additional required collateral is delivered to the fund on the next business day. If the borrower defaults on its obligation to return the securities loaned because of insolvency or other reasons, a fund could experience delays and costs in recovering the securities loaned or in gaining access to the collateral. Cash collateral is invested in the Fidelity Securities Lending Cash Central Fund. The value of loaned securities and cash collateral at period end are disclosed on the fund’s Statement of Assets and Liabilities.
7. Expense Reductions.
Many of the brokers with whom FMR places trades on behalf of the fund provided services to the fund in addition to trade execution. These services included payments of certain expenses on behalf of the fund totaling $110,873 for the period. In addition, through arrangements with the fund’s custodian, credits realized as a result of uninvested cash balances were used to reduce the fund’s expenses. During the period, these credits reduced the fund’s custody expenses by $267.
8. Other.
The fund’s organizational documents provide former and current trustees and officers with a limited indemnification against liabilities arising in connection with the performance of their duties to the fund. In the normal course of business, the fund may also enter into contracts that provide general indemnifications. The fund’s maximum exposure under these arrangements is unknown as this would be dependent on future claims that may be made against the fund. The risk of material loss from such claims is considered remote.
9. Distributions to Shareholders.
Distributions to shareholders of each class were as follows:
| Years ended July 31, | | 2005 | | | | 2004 |
| From net investment income | | | | | | |
| Class A | | $ 192,609 | | $ | | 420,433 |
| Class T | | 326,696 | | | | 838,212 |
| Class B | | — | | | | 192,478 |
| Class C | | 38,785 | | | | 96,077 |
| Institutional Class | | 65,517 | | | | 165,424 |
| Total | | $ 623,607 | | $ | | 1,712,624 |
| From net realized gain | | | | | | |
| Class A | | $ 4,769,034 | | $ | | — |
| Class T | | 11,388,557 | | | | — |
| Class B | | 14,295,898 | | | | — |
| Class C | | 6,852,951 | | | | — |
| Institutional Class | | 1,017,452 | | | | — |
| Total | | $ 38,323,892 | | $ | | — |
Financial Services A-92
10. Share Transactions.
Transactions for each class of shares were as follows:
|
| | | | | Shares | | | | | | Dollars |
| Years ended July 31, | | 2005 | | | | 2004 | | 2005 | | | | 2004 |
| Class A | | | | | | | | | | | | |
| Shares sold | | 1,159,503 | | | | 614,653 | | $ 25,692,274 | | $ | | 13,695,749 |
| Reinvestment of distributions | | 198,478 | | | | 18,128 | | 4,334,590 | | | | 378,140 |
| Shares redeemed | | (1,028,419) | | | | (872,521) | | (22,675,155) | | | | (19,145,577) |
| Net increase (decrease) | | 329,562 | | | | (239,740) | | $ 7,351,709 | | $ | | (5,071,688) |
| Class T | | | | | | | | | | | | |
| Shares sold | | 420,019 | | | | 658,242 | | $ 9,262,219 | | $ | | 14,430,306 |
| Reinvestment of distributions | | 504,911 | | | | 37,421 | | 10,965,915 | | | | 777,299 |
| Shares redeemed | | (1,875,686) | | | | (2,033,778) | | (41,342,266) | | | | (44,388,616) |
| Net increase (decrease) | | (950,756) | | | | (1,338,115) | | $ (21,114,132) | | $ (29,181,011) |
| Class B | | | | | | | | | | | | |
| Shares sold | | 283,236 | | | | 461,768 | | $ 6,103,430 | | $ | | 9,850,610 |
| Reinvestment of distributions | | 574,588 | | | | 7,853 | | 12,205,894 | | | | 162,959 |
| Shares redeemed | | (2,670,965) | | | | (2,060,890) | | (57,380,601) | | | | (44,422,627) |
| Net increase (decrease) | | (1,813,141) | | | | (1,591,269) | | $ (39,071,277) | | $ (34,409,058) |
| Class C | | | | | | | | | | | | |
| Shares sold | | 213,518 | | | | 653,543 | | $ 4,587,619 | | $ | | 13,848,576 |
| Reinvestment of distributions | | 257,099 | | | | 3,576 | | 5,464,805 | | | | 74,185 |
| Shares redeemed | | (1,219,971) | | | | (1,665,874) | | (26,243,393) | | | | (35,686,628) |
| Net increase (decrease) | | (749,354) | | | | (1,008,755) | | $ (16,190,969) | | $ (21,763,867) |
| Institutional Class | | | | | | | | | | | | |
| Shares sold | | 62,760 | | | | 67,364 | | $ 1,387,106 | | $ | | 1,519,011 |
| Reinvestment of distributions | | 37,434 | | | | 5,506 | | 826,042 | | | | 115,490 |
| Shares redeemed | | (139,433) | | | | (212,405) | | (3,110,447) | | | | (4,720,494) |
| Net increase (decrease) | | (39,239) | | | | (139,535) | | $ (897,299) | | $ | | (3,085,993) |
A-93 Annual Report
Advisor Health Care Fund — Class A, T, B, and C
Average annual total return reflects the change in the value of an investment, assuming reinvestment of the class’ dividend income and capital gains (the profits earned upon the sale of securities that have grown in value) and assuming a constant rate of performance each year. The $10,000 table and the fund’s returns do not reflect the deduction of taxes that a shareholder would pay on fund distributions or the redemption of fund shares. During periods of reimbursement by Fidelity, a fund’s total return will be greater than it would be had the reimbursement not occurred. How a fund did yesterday is no guarantee of how it will do tomorrow. Returns may reflect the conversion of Class B shares to Class A shares after a maximum of seven years.
| Average Annual Total Returns | | | | |
| Periods ended July 31, 2005 | | Past 1 | | Past 5 | | Life of |
| | | year | | years | | fundA |
| Class A (incl. 5.75% sales charge) | | 14.34% | | 0.65% | | 11.05% |
| Class T (incl. 3.50% sales charge) | | 16.73% | | 0.88% | | 11.06% |
| Class B (incl. contingent deferred | | | | | | |
| sales charge)B | | 15.32% | | 0.70% | | 11.08% |
| Class C (incl. contingent deferred | | | | | | |
| sales charge)C | | 19.46% | | 1.15% | | 10.98% |
A From September 3, 1996.
B Class B shares bear a 1.00% 12b-1 fee. The initial offering of Class B shares took place
|
on March 3, 1997. Returns prior to March 3, 1997 are those of Class T and reflect a 0.50% 12b-1 fee. Had Class B shares’ 12b-1 fee been reflected, returns prior to March 3, 1997 would have been lower. Class B shares’ contingent deferred sales charges included in the past one year, five year and life of fund total return figures are 5%, 2%, and 0%, respectively.
C Class C shares bear a 1.00% 12b-1 fee. The initial offering of Class C shares took place on November 3, 1997. Returns between March 3, 1997 and November 3, 1997 are those of Class B shares and reflect Class B shares’ 1.00% 12b-1 fee. Returns prior to March 3, 1997 are those of Class T and reflect a 0.50% 12b-1 fee. Had Class C shares’ 12b-1 fee been reflected, returns prior to March 3, 1997 would have been lower. Class C shares’ contingent deferred sales charges included in the past one year, five year and life of fund total return figures are 1%, 0%, and 0%, respectively.
| | $10,000 Over Life of Fund
|
Let’s say hypothetically that $10,000 was invested in Fidelity Advisor Health Care Fund — Class T on September 3, 1996, when the fund started, and the current 3.50% sales charge was paid. The chart shows how the value of your investment would have changed, and also shows how the S&P 500 Index performed over the same period.
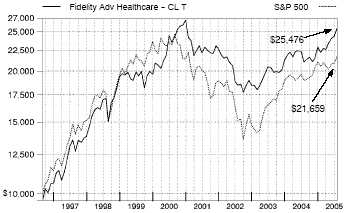
Health Care A-94
A-94
Advisor Health Care Fund — Class A, T, B, and C
|
Management’s Discussion of Fund Performance
Comments from Harlan Carere, who became Portfolio Manager of Fidelity® Advisor Health Care Fund on March 23, 2005
A late-inning rally on Wall Street helped push some key U.S. equity indexes to four-year highs by the conclusion of the 12-month period ending July 31, 2005. Spurred on by bullish economic data and strong corporate earnings, investors enjoyed a stellar month of July, capping off a turbulent 12-month period for U.S. equity markets. Stock prices bounced up and down during most of the year, moving in cadence with gyrations in the price of crude oil and investors’ gathering and ebbing concerns about inflation. The Federal Reserve Board raised short-term interest rates eight times during the period, also affecting overall market sentiment. Despite their fluctuations, the major equity indexes finished on a high note, with the Standard & Poor’s 500SM Index and the NASDAQ Composite® Index posting gains of 14.05% and 16.51%, respectively, for the period. The small-cap Russell 2000® Index rose 24.78% and the Russell Midcap® Index jumped 28.93%, while the blue-chips’ Dow Jones Industrial AverageSM advanced only 7.29% .
For the 12 months ending July 31, 2005, Fidelity Advisor Health Care Fund’s Class A, Class T, Class B and Class C shares returned 21.31%, 20.97%, 20.32% and 20.46%, respectively, outperforming the Goldman Sachs® Health Care Index, which had a total return of 18.58%, and the S&P 500®. Opportune security selection and an underweighting in branded pharmaceuticals, as well as favorable positioning in the rallying biotechnology segment and strong stock picking in health care equipment, provided the biggest lifts to the fund’s performance relative to its sector index. Biotech pioneer Genen-tech performed well, as did drug distributor McKesson. Underweighting such large pharma names as Merck, Eli Lilly and Pfizer — all components of the sector index — also helped, as the industry continued to suffer from drug safety concerns, among other issues. Conversely, although the fund was helped by owning large positions in two managed care companies — UnitedHealth Group and PacifiCare Health Systems — underweighting or not owning several strong-performing names in that segment, among them Aetna, WellPoint Health Networks and Cigna, was the biggest drag on relative performance.
The views expressed in this statement reflect those of the portfolio manager only through the end of the period of the report as stated on the cover and do not necessarily represent the views of Fidelity or any other person in the Fidelity organization. Any such views are subject to change at any time based upon market or other conditions and Fidelity disclaims any responsibility to update such views. These views may not be relied on as investment advice and, because investment decisions for a Fidelity fund are based on numerous factors, may not be relied on as an indication of trading intent on behalf of any Fidelity fund.
Shareholder Expense Example
|
As a shareholder of the Fund, you incur two types of costs: (1) transaction costs, including sales charges (loads) on purchase payments or redemption proceeds, redemption fees, and (2) ongoing costs, including management fees, distribution and/or service (12b-1) fees and other Fund expenses. This Example is intended to help you understand your ongoing costs (in dollars) of investing in the Fund and to compare these costs with the ongoing costs of investing in other mutual funds.
The Example is based on an investment of $1,000 invested at the beginning of the period and held for the entire period (February 1, 2005 to July 31, 2005).
The first line of the table below for each class of the Fund provides information about actual account values and actual expenses. You may use the information in this line, together with the amount you invested, to estimate the expenses that you paid over the period. Simply divide your account value by $1,000.00 (for example, an $8,600 account value divided by $1,000.00 = 8.6), then multiply the result by the number in the first line for a class of the Fund under the heading entitled “Expenses Paid During Period” to estimate the expenses you paid on your account during this period.
Hypothetical Example for Comparison Purposes
|
The second line of the table below for each class of the Fund provides information about hypothetical account values and hypothetical expenses based on a Class’ actual expense ratio and an assumed rate of return of 5% per year before expenses, which is not the Class’ actual return. The hypothetical account values and expenses may not be used to estimate the actual ending account balance or expenses you paid for the period. You may use this information to compare the ongoing costs of investing in the Fund and other funds. To do so, compare this 5% hypothetical example with the 5% hypothetical examples that appear in the shareholder reports of the other funds.
Please note that the expenses shown in the table are meant to highlight your ongoing costs only and do not reflect any transaction costs. Therefore, the second line of the table is useful in comparing ongoing costs only, and will not help you determine the relative total costs of owning different funds. In addition, if these transactional costs were included, your costs would have been higher.
| | | | | | | | | | | Expenses Paid |
| | | Beginning | | | | Ending | | | | During Period* |
| | | Account Value | | | | Account Value | | | | February 1, 2005 |
| | | February 1, 2005 | | | | July 31, 2005 | | | | to July 31, 2005 |
| Class A | | | | | | | | | | |
| Actual | | $ 1,000.00 | | $ | | 1,147.00 | | $ | | 6.81 |
| HypotheticalA | | $ 1,000.00 | | $ | | 1,018.45 | | $ | | 6.41 |
| Class T | | | | | | | | | | |
| Actual | | $ 1,000.00 | | $�� | | 1,145.60 | | $ | | 8.14 |
| HypotheticalA | | $ 1,000.00 | | $ | | 1,017.21 | | $ | | 7.65 |
| Class B | | | | | | | | | | |
| Actual | | $ 1,000.00 | | $ | | 1,142.60 | | $ | | 10.78 |
| HypotheticalA | | $ 1,000.00 | | $ | | 1,014.73 | | $ | | 10.14 |
| Class C | | | | | | | | | | |
| Actual | | $ 1,000.00 | | $ | | 1,143.40 | | $ | | 10.42 |
| HypotheticalA | | $ 1,000.00 | | $ | | 1,015.08 | | $ | | 9.79 |
| Institutional Class | | | | | | | | | | |
| Actual | | $ 1,000.00 | | $ | | 1,149.30 | | $ | | 4.64 |
| HypotheticalA | | $ 1,000.00 | | $ | | 1,020.48 | | $ | | 4.36 |
| |
| A 5% return per year before expenses | | | | | | | | | | |
* Expenses are equal to each Class’ annualized expense ratio (shown in the table below); multiplied by the average account value over the period, multiplied by 181/365 (to reflect the one-half year period).
| | | Annualized |
| | | Expense Ratio |
| Class A | | 1.28% |
| Class T | | 1.53% |
| Class B | | 2.03% |
| Class C | | 1.96% |
| Institutional Class | | 87% |
| | Advisor Health Care Fund
Investment Changes
|
| Top Ten Stocks as of July 31, 2005 | | |
| | | % of fund’s | | % of fund’s net assets |
| | | net assets | | 6 months ago |
| UnitedHealth Group, Inc. | | 7.6 | | 7.2 |
| Johnson & Johnson | | 7.0 | | 10.8 |
| Genentech, Inc. | | 6.5 | | 4.7 |
| Amgen, Inc. | | 5.8 | | 5.3 |
| Abbott Laboratories | | 4.3 | | 6.2 |
| Wyeth | | 3.6 | | 3.3 |
| Medtronic, Inc. | | 2.8 | | 7.4 |
| Alcon, Inc. | | 2.6 | | 2.3 |
| WellPoint, Inc. | | 2.5 | | 0.0 |
| McKesson Corp. | | 2.4 | | 2.3 |
| | | 45.1 | | |
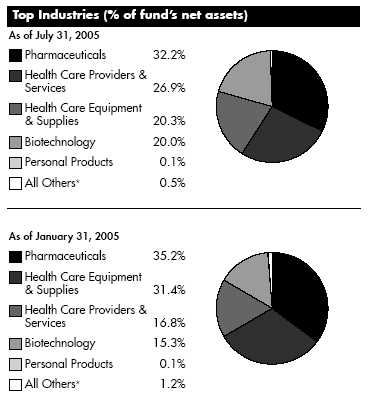
| | * Includes short term investments and net other assets.
Prior period industry classifications reflect the categories in place as of the date
indicated and have not been adjusted to reflect current industry classifications.
|
A-97 Annual Report
| | Advisor Health Care Fund
Investments July 31, 2005
Showing Percentage of Net Assets
|
| Common Stocks — 99.5% | | | | | | |
| | | Shares | | Value (Note 1) |
| |
| BIOTECHNOLOGY – 20.0% | | | | | | |
| Biotechnology – 20.0% | | | | | | |
| Affymetrix, Inc. (a) | | 47,400 | | $ | | 2,213,106 |
| Alkermes, Inc. (a) | | 110,864 | | | | 1,718,392 |
| Amgen, Inc. (a)(d) | | 576,400 | | | | 45,967,900 |
| Biogen Idec, Inc. (a) | | 159,800 | | | | 6,278,542 |
| Celgene Corp. (a) | | 1,500 | | | | 71,775 |
| Cephalon, Inc. (a) | | 25,200 | | | | 1,055,880 |
| Charles River Laboratories International, | | | | | | |
| Inc. (a) | | 30,300 | | | | 1,475,610 |
| Chiron Corp. (a) | | 85,000 | | | | 3,079,550 |
| DOV Pharmaceutical, Inc. (a) | | 2,000 | | | | 42,300 |
| Genentech, Inc. (a) | | 583,600 | | | | 52,132,988 |
| Genzyme Corp. (a) | | 125,800 | | | | 9,360,778 |
| Gilead Sciences, Inc. (a) | | 237,800 | | | | 10,655,818 |
| Human Genome Sciences, Inc. (a) | | 128,200 | | | | 1,878,130 |
| ImClone Systems, Inc. (a) | | 39,100 | | | | 1,356,770 |
| Invitrogen Corp. (a) | | 25,400 | | | | 2,178,558 |
| Martek Biosciences (a) | | 15,400 | | | | 671,286 |
| MedImmune, Inc. (a) | | 170,530 | | | | 4,844,757 |
| Millennium Pharmaceuticals, Inc. (a) | | 422,400 | | | | 4,363,392 |
| Neurocrine Biosciences, Inc. (a) | | 110,300 | | | | 5,468,674 |
| OSI Pharmaceuticals, Inc. (a) | | 22,600 | | | | 933,380 |
| Protein Design Labs, Inc. (a) | | 47,200 | | | | 1,075,688 |
| Serologicals Corp. (a) | | 54,500 | | | | 1,253,500 |
| Techne Corp. (a) | | 18,700 | | | | 917,609 |
| Vertex Pharmaceuticals, Inc. (a) | | 42,500 | | | | 677,875 |
| | | | | 159,672,258 |
| |
| HEALTH CARE EQUIPMENT & SUPPLIES – 20.3% | | | | |
| Health Care Equipment – 16.1% | | | | | | |
| Advanced Medical Optics, Inc. (a) | | 102,000 | | | | 4,240,140 |
| Animas Corp. (a)(d) | | 52,500 | | | | 1,098,825 |
| Aspect Medical Systems, Inc. (a) | | 120,000 | | | | 3,960,000 |
| Baxter International, Inc. | | 365,030 | | | | 14,334,728 |
| Beckman Coulter, Inc. | | 67,600 | | | | 3,673,384 |
| Becton, Dickinson & Co. | | 46,600 | | | | 2,580,242 |
| Biomet, Inc. | | 97,575 | | | | 3,720,535 |
| Boston Scientific Corp. (a) | | 66,400 | | | | 1,922,280 |
| C.R. Bard, Inc. | | 31,800 | | | | 2,123,922 |
| Cyberonics, Inc. (a) | | 94,400 | | | | 3,645,728 |
| Cytyc Corp. (a) | | 236,600 | | | | 5,905,536 |
| Dade Behring Holdings, Inc. | | 35,700 | | | | 2,706,060 |
| Epix Pharmaceuticals, Inc. (a) | | 101,700 | | | | 898,011 |
| Fisher Scientific International, Inc. (a) | | 12,400 | | | | 831,420 |
| GN Store Nordic AS | | 277,000 | | | | 3,084,031 |
| Guidant Corp. | | 150,500 | | | | 10,354,400 |
| Hillenbrand Industries, Inc. | | 7,800 | | | | 400,998 |
| Hospira, Inc. (a) | | 3,482 | | | | 133,187 |
| IDEXX Laboratories, Inc. (a) | | 13,300 | | | | 844,018 |
| IntraLase Corp. | | 1,100 | | | | 22,935 |
| Invacare Corp. | | 35,100 | | | | 1,479,465 |
| Kinetic Concepts, Inc. (a) | | 66,900 | | | | 4,011,993 |
| | | Shares | | Value (Note 1) |
| Medtronic, Inc. | | 410,896 | | $ 22,163,730 |
| Novoste Corp. (a)(e) | | 12,500 | | 11,000 |
| ResMed, Inc. (a) | | 80,700 | | 5,406,900 |
| Respironics, Inc. (a) | | 99,400 | | 3,767,260 |
| St. Jude Medical, Inc. (a) | | 261,500 | | 12,397,715 |
| Stereotaxis, Inc. | | 146,224 | | 1,484,174 |
| Syneron Medical Ltd. (d) | | 38,400 | | 1,480,320 |
| Synthes, Inc. | | 33,730 | | 3,659,788 |
| Waters Corp. (a) | | 132,379 | | 5,994,121 |
| Zimmer Holdings, Inc. (a) | | 9,600 | | 790,656 |
| | | | | 129,127,502 |
| Health Care Supplies – 4.2% | | | | |
| Alcon, Inc. | | 177,400 | | 20,321,170 |
| Bausch & Lomb, Inc. | | 31,300 | | 2,649,545 |
| Cooper Companies, Inc. | | 59,700 | | 4,101,390 |
| DENTSPLY International, Inc. | | 36,900 | | 2,057,175 |
| DJ Orthopedics, Inc. (a) | | 69,000 | | 1,692,570 |
| Edwards Lifesciences Corp. (a) | | 100 | | 4,587 |
| Gen-Probe, Inc. (a) | | 22,300 | | 983,207 |
| Millipore Corp. (a) | | 23,700 | | 1,452,099 |
| | | | | 33,261,743 |
| |
| TOTAL HEALTH CARE EQUIPMENT & SUPPLIES | | 162,389,245 |
| |
| HEALTH CARE PROVIDERS & SERVICES – 26.9% | | | | |
| Health Care Distributors & Services – 3.5% | | | | |
| AmerisourceBergen Corp. | | 28,300 | | 2,031,657 |
| Andrx Corp. (a) | | 33,200 | | 615,860 |
| Cardinal Health, Inc. | | 40,000 | | 2,383,200 |
| Henry Schein, Inc. (a) | | 40,900 | | 1,765,653 |
| McKesson Corp. | | 433,800 | | 19,521,000 |
| Patterson Companies, Inc. (a) | | 40,800 | | 1,819,680 |
| | | | | 28,137,050 |
| Health Care Facilities – 2.0% | | | | |
| Community Health Systems, Inc. (a) | | 100,600 | | 3,884,166 |
| HCA, Inc. | | 45,400 | | 2,235,950 |
| LifePoint Hospitals, Inc. (a) | | 22,800 | | 1,066,128 |
| United Surgical Partners International, | | | | |
| Inc. (a) | | 72,388 | | 2,606,692 |
| Universal Health Services, Inc. Class B | | 24,700 | | 1,285,388 |
| VCA Antech, Inc. (a) | | 208,900 | | 4,959,286 |
| | | | | 16,037,610 |
| Health Care Services – 5.6% | | | | |
| American Healthways, Inc. (a) | | 45,500 | | 2,027,935 |
| Caremark Rx, Inc. (a) | | 217,300 | | 9,687,234 |
| Cerner Corp. (a) | | 43,000 | | 3,243,060 |
| Covance, Inc. (a) | | 44,100 | | 2,185,155 |
| DaVita, Inc. (a) | | 61,050 | | 2,884,002 |
| Express Scripts, Inc. (a) | | 68,100 | | 3,561,630 |
| IMS Health, Inc. | | 103,900 | | 2,829,197 |
| Laboratory Corp. of America | | | | |
| Holdings (a) | | 86,100 | | 4,362,687 |
| Lifeline Systems, Inc. (a) | | 16,500 | | 565,950 |
See accompanying notes which are an integral part of the financial statements.
Health Care A-98
| Common Stocks – continued | | | | | | |
| | | Shares | | Value (Note 1) |
| |
| HEALTH CARE PROVIDERS & SERVICES – CONTINUED | | | | |
| Health Care Services – continued | | | | | | |
| Lincare Holdings, Inc. (a) | | 18,300 | | $ | | 738,222 |
| Omnicare, Inc. | | 48,900 | | | | 2,254,290 |
| Pediatrix Medical Group, Inc. (a) | | 29,700 | | | | 2,329,074 |
| Pharmaceutical Product Development, | | | | | | |
| Inc. (a) | | 13,300 | | | | 761,159 |
| Quest Diagnostics, Inc. | | 94,400 | | | | 4,846,496 |
| VistaCare, Inc. Class A (a) | | 85,800 | | | | 1,794,936 |
| WebMD Corp. (a) | | 87,200 | | | | 925,192 |
| | | | | | | 44,996,219 |
| Managed Health Care – 15.8% | | | | | | |
| Aetna, Inc. | | 47,800 | | | | 3,699,720 |
| AMERIGROUP Corp. (a) | | 17,900 | | | | 620,235 |
| Health Net, Inc. (a) | | 393,700 | | | | 15,275,560 |
| Humana, Inc. (a) | | 148,500 | | | | 5,917,725 |
| Molina Healthcare, Inc. (a) | | 41,000 | | | | 981,540 |
| PacifiCare Health Systems, Inc. (a) | | 169,190 | | | | 12,892,278 |
| Sierra Health Services, Inc. (a) | | 23,800 | | | | 1,605,072 |
| UnitedHealth Group, Inc. | | 1,160,700 | | | | 60,704,608 |
| WellChoice, Inc. (a) | | 68,600 | | | | 4,527,600 |
| WellPoint, Inc. (a) | | 284,900 | | | | 20,153,826 |
| | | | | 126,378,164 |
| |
| TOTAL HEALTH CARE PROVIDERS & SERVICES | | 215,549,043 |
| |
| PERSONAL PRODUCTS – 0.1% | | | | | | |
| Personal Products – 0.1% | | | | | | |
| NBTY, Inc. (a) | | 34,800 | | | | 842,160 |
| PHARMACEUTICALS – 32.2% | | | | | | |
| Pharmaceuticals – 32.2% | | | | | | |
| Abbott Laboratories | | 742,620 | | | | 34,628,371 |
| Adams Respiratory Therapeutics, Inc. | | 1,300 | | | | 38,350 |
| Allergan, Inc. | | 145,800 | | | | 13,030,146 |
| American Pharmaceutical Partners, | | | | | | |
| Inc. (a)(d) | | 34,000 | | | | 1,543,260 |
| AstraZeneca PLC sponsored ADR | | 135,300 | | | | 6,148,032 |
| Barr Pharmaceuticals, Inc. (a) | | 47,300 | | | | 2,242,966 |
| Bristol-Myers Squibb Co. | | 22,000 | | | | 549,560 |
| Eli Lilly & Co. | | 28,100 | | | | 1,582,592 |
| Endo Pharmaceuticals Holdings, Inc. (a) . | | 61,400 | | | | 1,747,444 |
| Forest Laboratories, Inc. (a) | | 229,300 | | | | 9,153,656 |
| Hollis-Eden Pharmaceuticals, Inc. (a)(d) . | | 136,500 | | | | 1,235,325 |
| Ista Pharmaceuticals, Inc. (a) | | 72,700 | | | | 725,546 |
| IVAX Corp. (a) | | 220,000 | | | | 5,605,600 |
| Johnson & Johnson | | 871,662 | | | | 55,751,502 |
| King Pharmaceuticals, Inc. (a) | | 96,600 | | | | 1,077,090 |
| Kos Pharmaceuticals, Inc. (a) | | 41,633 | | | | 2,976,760 |
| Medicis Pharmaceutical Corp. Class A | | 24,600 | | | | 834,432 |
| Merck & Co., Inc. | | 252,100 | | | | 7,830,226 |
| MGI Pharma, Inc. (a) | | 31,400 | | | | 857,220 |
| Mylan Laboratories, Inc. | | 61,000 | | | | 1,058,960 |
| | | Shares | | Value (Note 1) |
| Novartis AG sponsored ADR | | 275,900 | | $ 13,439,089 |
| Par Pharmaceutical Companies, Inc. (a) . 15,700 | | 367,694 |
| Pfizer, Inc. | | 562,820 | | 14,914,730 |
| Ranbaxy Laboratories Ltd. sponsored | | | | |
| GDR | | 58,418 | | 654,282 |
| Roche Holding AG (participation | | | | |
| certificate) | | 93,338 | | 12,691,853 |
| Salix Pharmaceuticals Ltd. (a) | | 489,600 | | 9,449,280 |
| Sanofi-Aventis sponsored ADR | | 86,900 | | 3,762,770 |
| Schering-Plough Corp. | | 766,100 | | 15,950,202 |
| Sepracor, Inc. (a) | | 71,700 | | 3,753,495 |
| Taro Pharmaceutical Industries Ltd. (a) | | 3,800 | | 89,262 |
| Teva Pharmaceutical Industries Ltd. | | | | |
| sponsored ADR | | 72,600 | | 2,279,640 |
| Watson Pharmaceuticals, Inc. (a) | | 77,300 | | 2,581,820 |
| Wyeth | | 627,320 | | 28,699,890 |
| | | | | 257,251,045 |
| |
| TOTAL COMMON STOCKS | | | | |
| (Cost $624,171,290) | | | | 795,703,751 |
| |
| Nonconvertible Preferred Stocks — 0.0% | | |
| |
| BIOTECHNOLOGY – 0.0% | | | | |
| Biotechnology – 0.0% | | | | |
| GeneProt, Inc. Series A (a)(f) | | | | |
| (Cost $236,500) | | 43,000 | | 2,365 |
| |
| Money Market Funds — 1.0% | | |
| |
| Fidelity Cash Central Fund, 3.31% (b) | | 3,811,309 | | 3,811,309 |
| Fidelity Securities Lending Cash | | | | |
| Central Fund, 3.32% (b)(c) | | 4,604,700 | | 4,604,700 |
| TOTAL MONEY MARKET FUNDS | | | | |
| (Cost $8,416,009) | | | | 8,416,009 |
| |
| TOTAL INVESTMENT PORTFOLIO - 100.5% | | |
| (Cost $632,823,799) | | 804,122,125 |
| |
| NET OTHER ASSETS – (0.5)% | | | | (4,315,442) |
| NET ASSETS – 100% | | $ 799,806,683 |
| | Legend
(a) Non-income producing
(b) Affiliated fund that is available only to investment companies and other
accounts managed by Fidelity Investments. The rate quoted is the
annualized seven-day yield of the fund at period end. A complete listing
of the fund’s holdings as of its most recent quarter end is available upon
request.
(c) Includes investment made with cash collateral received from securities on
loan.
(d) Security or a portion of the security is on loan at period end.
|
See accompanying notes which are an integral part of the financial statements.
A-99 Annual Report
Investments - continued
(e) Security exempt from registration under Rule 144A of the Securities Act of
1933. These securities may be resold in transactions exempt from
registration, normally to qualified institutional buyers. At the period end,
the value of these securities amounted to $11,000 or 0.0% of net assets.
(f) Restricted securities – Investment in securities not registered under the
Securities Act of 1933 (excluding 144A issues). At the end of the period,
the value of restricted securities (excluding 144A issues) amounted to
$2,365 or 0.0% of net assets.
|
Additional information on each holding is as follows:
| Security | | Acquisition Date | | | | Acquisition Cost |
| GeneProt, Inc. Series A | | 7/7/00 | | $ | | 236,500 |
At July 31, 2005, the fund had a capital loss carryforward of approximately $25,340,648 of which $11,940,350 and $13,400,298 will expire on July 31, 2010 and 2011, respectively.
See accompanying notes which are an integral part of the financial statements.
Health Care A-100
|
Advisor Health Care Fund
Financial Statements
|
| Statement of Assets and Liabilities | | |
| | | | | | | July 31, 2005 |
| Assets | | | | | | |
| Investment in securities, at value (in- | | | | |
| cluding securities loaned of | | | | | | |
| $4,486,423) (cost $632,823,799) | | | | |
| — See accompanying schedule | | | | $ | | 804,122,125 |
| Receivable for investments sold | | | | | | 18,366,601 |
| Receivable for fund shares sold | | | | | | 651,819 |
| Dividends receivable | | | | | | 251,356 |
| Interest receivable | | | | | | 18,643 |
| Prepaid expenses | | | | | | 1,298 |
| Other affiliated receivables | | | | | | 2 |
| Other receivables | | | | | | 143,244 |
| Total assets | | | | | | 823,555,088 |
| Liabilities | | | | | | |
| Payable for investments purchased | | $ | | 16,351,283 | | |
| Payable for fund shares redeemed | | | | 1,657,170 | | |
| Accrued management fee | | | | 375,282 | | |
| Distribution fees payable | | | | 455,399 | | |
| Other affiliated payables | | | | 265,459 | | |
| Other payables and accrued expenses | | 39,112 | | |
| Collateral on securities loaned, at value | | 4,604,700 | | |
| Total liabilities | | | | | | 23,748,405 |
| Net Assets | | | | $ | | 799,806,683 |
| Net Assets consist of: | | | | | | |
| Paid in capital | | | | $ | | 658,653,822 |
| Accumulated net investment loss | | | | | | (458) |
| Accumulated undistributed net realized | | | | |
| gain (loss) on investments and for- | | | | |
| eign currency transactions | | | | | | (30,145,511) |
| Net unrealized appreciation (depreci- | | | | |
| ation) on investments and assets and | | | | |
| liabilities in foreign currencies | | | | | | 171,298,830 |
| Net Assets | | | | $ | | 799,806,683 |
| Calculation of Maximum Offering Price | | | | |
| Class A: | | | | | | |
| Net Asset Value and redemption | | | | | | |
| price per share ($139,158,345 ÷ | | | | |
| 6,067,435 shares) | | | | $ | | 22.94 |
| Maximum offering price per share | | | | | | |
| (100/94.25 of $22.94) | | | | $ | | 24.34 |
| Class T: | | | | | | |
| Net Asset Value and redemption | | | | | | |
| price per share ($243,353,498 ÷ | | | | |
| 10,816,836 shares) | | | | $ | | 22.50 |
| Maximum offering price per share | | | | | | |
| (100/96.50 of $22.50) | | | | $ | | 23.32 |
| Class B: | | | | | | |
| Net Asset Value and offering price | | | | |
| per share ($266,319,223 ÷ | | | | | | |
| 12,355,425 shares)A | | | | $ | | 21.55 |
| Class C: | | | | | | |
| Net Asset Value and offering price | | | | |
| per share ($131,277,330 ÷ | | | | | | |
| 6,075,551 shares)A | | | | $ | | 21.61 |
| Institutional Class: | | | | | | |
| Net Asset Value, offering price and | | | | |
| redemption price per share | | | | | | |
| ($19,698,287 ÷ 839,004 shares) | | $ | | 23.48 |
A Redemption price per share is equal to net asset value less any applicable contingent deferred sales charge.
| Statement of Operations | | | | |
| | | | | Year ended July 31, 2005 |
| Investment Income | | | | | | |
| Dividends | | | | $ | | 7,697,400 |
| Interest | | | | | | 181,289 |
| Security lending | | | | | | 24,222 |
| Total income | | | | | | 7,902,911 |
| Expenses | | | | | | |
| Management fee | | $ | | 4,383,043 | | |
| Transfer agent fees | | | | 2,974,563 | | |
| Distribution fees | | | | 5,422,220 | | |
| Accounting and security lending | | | | | | |
| fees | | | | 284,017 | | |
| Independent trustees’ compensation | | 4,013 | | |
| Custodian fees and expenses | | | | 18,728 | | |
| Registration fees | | | | 71,099 | | |
| Audit | | | | 47,193 | | |
| Legal | | | | 2,889 | | |
| Miscellaneous | | | | 23,550 | | |
| Total expenses before reductions | | 13,231,315 | | |
| Expense reductions | | | | (211,590) | | 13,019,725 |
| |
| Net investment income (loss) | | | | | | (5,116,814) |
| Realized and Unrealized Gain (Loss) | | | | |
| Net realized gain (loss) on: | | | | | | |
| Investment securities | | | | 26,779,783 | | |
| Foreign currency transactions | | | | 12,468 | | |
| Total net realized gain (loss) | | | | | | 26,792,251 |
| Change in net unrealized appreci- | | | | |
| ation (depreciation) on: | | | | | | |
| Investment securities | | | | 122,599,208 | | |
| Assets and liabilities in foreign | | | | | | |
| currencies | | | | 504 | | |
| Total change in net unrealized ap- | | | | |
| preciation (depreciation) | | | | | | 122,599,712 |
| Net gain (loss) | | | | | | 149,391,963 |
| Net increase (decrease) in net as- | | | | |
| sets resulting from operations | | | | $ | | 144,275,149 |
See accompanying notes which are an integral part of the financial statements.
A-101 Annual Report
Advisor Health Care Fund
Financial Statements - continued
| Statement of Changes in Net Assets | | | | | | |
| | | Year ended | | | | Year ended |
| | | July 31, | | | | July 31, |
| | | 2005 | | | | 2004 |
| Increase (Decrease) in Net Assets | | | | | | |
| Operations | | | | | | |
| Net investment income (loss) | | $ (5,116,814) | | $ | | (6,048,059) |
| Net realized gain (loss) | | 26,792,251 | | | | 55,619,069 |
| Change in net unrealized appreciation (depreciation) | | 122,599,712 | | | | (24,655,778) |
| Net increase (decrease) in net assets resulting from operations | | 144,275,149 | | | | 24,915,232 |
| Share transactions -- net increase (decrease) | | (127,767,624) | | | | (106,348,165) |
| Redemption fees | | 24,114 | | | | 55,534 |
| Total increase (decrease) in net assets | | 16,531,639 | | | | (81,377,399) |
| |
| Net Assets | | | | | | |
| Beginning of period | | 783,275,044 | | | | 864,652,443 |
| End of period (including accumulated net investment loss of $458 and accumulated net investment loss of $581, | | | | | | |
| respectively) | | $ 799,806,683 | | $ | | 783,275,044 |
| Financial Highlights — Class A | | | | | | | | | | |
| Years ended July 31, | | 2005 | | 2004 | | 2003 | | 2002 | | 2001 |
| Selected Per-Share Data | | | | | | | | | | |
| Net asset value, beginning of period | | $ 18.91 | | $ 18.29 | | $ 16.51 | | $ 20.41 | | $ 22.02 |
| Income from Investment Operations | | | | | | | | | | |
| Net investment income (loss)C | | (.05) | | (.05) | | —E | | (.04) | | .01 |
| Net realized and unrealized gain (loss) | | 4.08 | | .67 | | 1.78 | | (3.86) | | (.50) |
| Total from investment operations | | 4.03 | | .62 | | 1.78 | | (3.90) | | (.49) |
| Distributions from net realized gain | | — | | — | | — | | — | | (1.12) |
| Redemption fees added to paid in capitalC | | —E | | —E | | —E | | —E | | —E |
| Net asset value, end of period | | $ 22.94 | | $ 18.91 | | $ 18.29 | | $ 16.51 | | $ 20.41 |
| Total ReturnA,B | | 21.31% | | 3.39% | | 10.78% | | (19.11)% | | (2.50)% |
| Ratios to Average Net AssetsD | | | | | | | | | | |
| Expenses before expense reductions | | 1.28% | | 1.32% | | 1.34% | | 1.29% | | 1.19% |
| Expenses net of voluntary waivers, if any | | 1.28% | | 1.32% | | 1.34% | | 1.29% | | 1.19% |
| Expenses net of all reductions | | 1.26% | | 1.29% | | 1.27% | | 1.24% | | 1.17% |
| Net investment income (loss) | | (.22)% | | (.26)% | | (.01)% | | (.23)% | | .05% |
| Supplemental Data | | | | | | | | | | |
| Net assets, end of period (000 omitted) | | $ 139,158 | | $ 104,258 | | $ 108,692 | | $ 103,292 | | $ 136,304 |
| Portfolio turnover rate | | 71% | | 60% | | 120% | | 167% | | 71% |
A Total returns would have been lower had certain expenses not been reduced during the periods shown.
B Total returns do not include the effect of the sales charges.
C Calculated based on average shares outstanding during the period.
D Expense ratios reflect operating expenses of the class. Expenses before reductions do not reflect amounts reimbursed by the investment adviser or reductions from brokerage service arrangements or other expense offset arrangements and do
not represent the amount paid by the class during periods when reimbursements or reductions occur. Expenses net of any voluntary waivers reflect expenses after reimbursement by the investment adviser but prior to reductions from broker
age service arrangements or other expense offset arrangements. Expenses net of all reductions represent the net expenses paid by the class.
E Amount represents less than $.01 per share.
|
See accompanying notes which are an integral part of the financial statements.
Health Care A-102
| Financial Highlights — Class T | | | | | | | | | | |
| Years ended July 31, | | 2005 | | 2004 | | 2003 | | 2002 | | 2001 |
| Selected Per-Share Data | | | | | | | | | | |
| Net asset value, beginning of period | | $ 18.60 | | $ 18.03 | | $ 16.31 | | $ 20.22 | | $ 21.87 |
| Income from Investment Operations | | | | | | | | | | |
| Net investment income (loss)C | | (.09) | | (.09) | | (.04) | | (.09) | | (.04) |
| Net realized and unrealized gain (loss) | | 3.99 | | .66 | | 1.76 | | (3.82) | | (.49) |
| Total from investment operations | | 3.90 | | .57 | | 1.72 | | (3.91) | | (.53) |
| Distributions from net realized gain | | — | | — | | — | | — | | (1.12) |
| Redemption fees added to paid in capitalC | | —E | | —E | | —E | | —E | | —E |
| Net asset value, end of period | | $ 22.50 | | $ 18.60 | | $ 18.03 | | $ 16.31 | | $ 20.22 |
| Total ReturnA,B | | 20.97% | | 3.16% | | 10.55% | | (19.34)% | | (2.71)% |
| Ratios to Average Net AssetsD | | | | | | | | | | |
| Expenses before expense reductions | | 1.53% | | 1.56% | | 1.59% | | 1.52% | | 1.43% |
| Expenses net of voluntary waivers, if any | | 1.53% | | 1.56% | | 1.59% | | 1.52% | | 1.43% |
| Expenses net of all reductions | | 1.51% | | 1.53% | | 1.51% | | 1.47% | | 1.41% |
| Net investment income (loss) | | (.47)% | | (.51)% | | (.26)% | | (.46)% | | (.18)% |
| Supplemental Data | | | | | | | | | | |
| Net assets, end of period (000 omitted) | | $ 243,353 | | $ 243,176 | | $ 264,115 | | $ 274,243 | | $ 383,643 |
| Portfolio turnover rate | | 71% | | 60% | | 120% | | 167% | | 71% |
A Total returns would have been lower had certain expenses not been reduced during the periods shown.
B Total returns do not include the effect of the sales charges.
C Calculated based on average shares outstanding during the period.
D Expense ratios reflect operating expenses of the class. Expenses before reductions do not reflect amounts reimbursed by the investment adviser or reductions from brokerage service arrangements or other expense offset arrangements and do not
represent the amount paid by the class during periods when reimbursements or reductions occur. Expenses net of any voluntary waivers reflect expenses after reimbursement by the investment adviser but prior to reductions from brokerage service
arrangements or other expense offset arrangements. Expenses net of all reductions represent the net expenses paid by the class.
E Amount represents less than $.01 per share.
|
| Financial Highlights — Class B | | | | | | | | | | |
| Years ended July 31, | | 2005 | | 2004 | | 2003 | | 2002 | | 2001 |
| Selected Per-Share Data | | | | | | | | | | |
| Net asset value, beginning of period | | $ 17.91 | | $ 17.45 | | $ 15.86 | | $ 19.76 | | $ 21.50 |
| Income from Investment Operations | | | | | | | | | | |
| Net investment income (loss)C | | (.19) | | (.18) | | (.12) | | (.18) | | (.14) |
| Net realized and unrealized gain (loss) | | 3.83 | | .64 | | 1.71 | | (3.72) | | (.48) |
| Total from investment operations | | 3.64 | | .46 | | 1.59 | | (3.90) | | (.62) |
| Distributions from net realized gain | | — | | — | | — | | — | | (1.12) |
| Redemption fees added to paid in capitalC | | —E | | —E | | —E | | —E | | —E |
| Net asset value, end of period | | $ 21.55 | | $ 17.91 | | $ 17.45 | | $ 15.86 | | $ 19.76 |
| Total ReturnA,B | | 20.32% | | 2.64% | | 10.03% | | (19.74)% | | (3.20)% |
| Ratios to Average Net AssetsD | | | | | | | | | | |
| Expenses before expense reductions | | 2.04% | | 2.06% | | 2.05% | | 2.02% | | 1.95% |
| Expenses net of voluntary waivers, if any | | 2.04% | | 2.06% | | 2.05% | | 2.02% | | 1.95% |
| Expenses net of all reductions | | 2.01% | | 2.03% | | 1.98% | | 1.98% | | 1.93% |
| Net investment income (loss) | | (.98)% | | (1.01)% | | (.73)% | | (.97)% | | (.70)% |
| Supplemental Data | | | | | | | | | | |
| Net assets, end of period (000 omitted) | | $ 266,319 | | $ 285,299 | | $ 317,906 | | $ 334,056 | | $ 456,851 |
| Portfolio turnover rate | | 71% | | 60% | | 120% | | 167% | | 71% |
A Total returns would have been lower had certain expenses not been reduced during the periods shown.
B Total returns do not include the effect of the contingent deferred sales charge.
C Calculated based on average shares outstanding during the period.
D Expense ratios reflect operating expenses of the class. Expenses before reductions do not reflect amounts reimbursed by the investment adviser or reductions from brokerage service arrangements or other expense offset arrangements and do not
represent the amount paid by the class during periods when reimbursements or reductions occur. Expenses net of any voluntary waivers reflect expenses after reimbursement by the investment adviser but prior to reductions from brokerage service
arrangements or other expense offset arrangements. Expenses net of all reductions represent the net expenses paid by the class.
E Amount represents less than $.01 per share.
|
See accompanying notes which are an integral part of the financial statements.
|
| Financial Highlights — Class C | | | | | | | | | | |
| Years ended July 31, | | 2005 | | 2004 | | 2003 | | 2002 | | 2001 |
| Selected Per-Share Data | | | | | | | | | | |
| Net asset value, beginning of period | | $ 17.94 | | $ 17.47 | | $ 15.87 | | $ 19.76 | | $ 21.50 |
| Income from Investment Operations | | | | | | | | | | |
| Net investment income (loss)C | | (.17) | | (.17) | | (.11) | | (.17) | | (.14) |
| Net realized and unrealized gain (loss) | | 3.84 | | .64 | | 1.71 | | (3.72) | | (.48) |
| Total from investment operations | | 3.67 | | .47 | | 1.60 | | (3.89) | | (.62) |
| Distributions from net realized gain | | — | | — | | — | | — | | (1.12) |
| Redemption fees added to paid in capitalC | | —E | | —E | | —E | | —E | | —E |
| Net asset value, end of period | | $ 21.61 | | $ 17.94 | | $ 17.47 | | $ 15.87 | | $ 19.76 |
| Total ReturnA,B | | 20.46% | | 2.69% | | 10.08% | | (19.69)% | | (3.20)% |
| Ratios to Average Net AssetsD | | | | | | | | | | |
| Expenses before expense reductions | | 1.97% | | 2.00% | | 2.00% | | 1.97% | | 1.91% |
| Expenses net of voluntary waivers, if any | | 1.97% | | 2.00% | | 2.00% | | 1.97% | | 1.91% |
| Expenses net of all reductions | | 1.94% | | 1.97% | | 1.92% | | 1.93% | | 1.89% |
| Net investment income (loss) | | (.91)% | | (.95)% | | (.67)% | | (.92)% | | (.66)% |
| Supplemental Data | | | | | | | | | | |
| Net assets, end of period (000 omitted) | | $ 131,277 | | $ 130,184 | | $ 150,576 | | $ 160,877 | | $ 229,494 |
| Portfolio turnover rate | | 71% | | 60% | | 120% | | 167% | | 71% |
A Total returns would have been lower had certain expenses not been reduced during the periods shown.
B Total returns do not include the effect of the contingent deferred sales charge.
C Calculated based on average shares outstanding during the period.
D Expense ratios reflect operating expenses of the class. Expenses before reductions do not reflect amounts reimbursed by the investment adviser or reductions from brokerage service arrangements or other expense offset arrangements and do not
represent the amount paid by the class during periods when reimbursements or reductions occur. Expenses net of any voluntary waivers reflect expenses after reimbursement by the investment adviser but prior to reductions from brokerage service
arrangements or other expense offset arrangements. Expenses net of all reductions represent the net expenses paid by the class.
E Amount represents less than $.01 per share.
|
| Financial Highlights — Institutional Class | | | | | | | | | | |
| Years ended July 31, | | 2005 | | 2004 | | 2003 | | 2002 | | 2001 |
| Selected Per-Share Data | | | | | | | | | | |
| Net asset value, beginning of period | | $ 19.28 | | $ 18.58 | | $ 16.70 | | $ 20.58 | | $ 22.13 |
| Income from Investment Operations | | | | | | | | | | |
| Net investment income (loss)B | | 04 | | .03 | | .06 | | .02 | | .07 |
| Net realized and unrealized gain (loss) | | 4.16 | | .67 | | 1.82 | | (3.90) | | (.50) |
| Total from investment operations | | 4.20 | | .70 | | 1.88 | | (3.88) | | (.43) |
| Distributions from net realized gain | | — | | — | | — | | — | | (1.12) |
| Total distributions | | — | | — | | — | | — | | (1.12) |
| Redemption fees added to paid in capitalB | | —D | | —D | | —D | | —D | | —D |
| Net asset value, end of period | | $ 23.48 | | $ 19.28 | | $ 18.58 | | $ 16.70 | | $ 20.58 |
| Total ReturnA | | 21.78% | | 3.77% | | 11.26% | | (18.85)% | | (2.21)% |
| Ratios to Average Net AssetsC | | | | | | | | | | |
| Expenses before expense reductions | | 88% | | .91% | | .96% | | .95% | | .91% |
| Expenses net of voluntary waivers, if any | | 88% | | .91% | | .96% | | .95% | | .91% |
| Expenses net of all reductions | | 85% | | .88% | | .88% | | .90% | | .89% |
| Net investment income (loss) | | 18% | | .14% | | .37% | | .11% | | .33% |
| Supplemental Data | | | | | | | | | | |
| Net assets, end of period (000 omitted) | | $ 19,698 | | $ 20,358 | | $ 23,364 | | $ 35,923 | | $ 45,200 |
| Portfolio turnover rate | | 71% | | 60% | | 120% | | 167% | | 71% |
A Total returns would have been lower had certain expenses not been reduced during the periods shown.
B Calculated based on average shares outstanding during the period.
C Expense ratios reflect operating expenses of the class. Expenses before reductions do not reflect amounts reimbursed by the investment adviser or reductions from brokerage service arrangements or other expense offset arrangements and do not
represent the amount paid by the class during periods when reimbursements or reductions occur. Expenses net of any voluntary waivers reflect expenses after reimbursement by the investment adviser but prior to reductions from brokerage service
arrangements or other expense offset arrangements. Expenses net of all reductions represent the net expenses paid by the class.
D Amount represents less than $.01 per share.
|
See accompanying notes which are an integral part of the financial statements.
Health Care A-104
|
Notes to Financial Statements
For the period ended July 31, 2005
|
1. Significant Accounting Policies.
|
Fidelity Advisor Health Care Fund (the fund) is a non-diversified fund of Fidelity Advisor Series VII (the trust) and is authorized to issue an unlimited number of shares. The trust is registered under the Investment Company Act of 1940, as amended (the 1940 Act), as an open-end management investment company organized as a Massachusetts business trust.
The fund offers Class A, Class T, Class B, Class C, and Institutional Class shares, each of which has equal rights as to assets and voting privileges. Each class has exclusive voting rights with respect to matters that affect that class. Class B shares will automatically convert to Class A shares after a holding period of seven years from the initial date of purchase. Investment income, realized and unrealized capital gains and losses, the common expenses of the fund, and certain fund-level expense reductions, if any, are allocated on a pro rata basis to each class based on the relative net assets of each class to the total net assets of the fund. Each class differs with respect to transfer agent and distribution and service plan fees incurred. Certain expense reductions also differ by class.
The financial statements have been prepared in conformity with accounting principles generally accepted in the United States of America, which require management to make certain estimates and assumptions at the date of the financial statements. The following summarizes the significant accounting policies of the fund:
Security Valuation. Net asset value per share (NAV calculation) is calculated as of the close of business of the New York Stock Exchange, normally 4:00 p.m. Eastern time. Equity securities, including restricted securities, for which market quotations are available are valued at the last sale price or official closing price (closing bid price or last evaluated quote if no sale has occurred) on the primary market or exchange on which they trade. If prices are not readily available or do not accurately reflect fair value for a security, or if a security’s value has been materially affected by events occurring after the close of the exchange or market on which the security is principally traded, that security may be valued by another method that the Board of Trustees believes accurately reflects fair value. A security’s valuation may differ depending on the method used for determining value. Price movements in futures contracts and ADRs, market and trading trends, the bid/ask quotes of brokers and off-exchange institutional trading may be reviewed in the course of making a good faith determination of a security’s fair value. Short-term securities with remaining maturities of sixty days or less for which quotations are not readily available are valued on the basis of amortized cost. Investments in open-end investment companies are valued at their net asset value each business day.
Foreign Currency. The fund uses foreign currency contracts to facilitate transactions in foreign-denominated securities. Losses from these transactions may arise from changes in the value of the foreign currency or if the counterparties do not perform under the contracts’ terms.
Foreign-denominated assets, including investment securities, and liabilities are translated into U.S. dollars at the exchange rate at period end. Purchases and sales of investment securities, income and dividends received and expenses denominated in foreign currencies are translated into U.S. dollars at the exchange rate in effect on the transaction date.
The effects of exchange rate fluctuations on investments are included with the net realized and unrealized gain (loss) on investment securities. Other foreign currency transactions resulting in realized and unrealized gain (loss) are disclosed separately.
Investment Transactions and Income. Security transactions are accounted for as of trade date. Gains and losses on securities sold are determined on the basis of identified cost and may include proceeds received from litigation. Dividend income is recorded on the ex-dividend date, except for certain dividends from foreign securities where the ex-dividend date may have passed, which are recorded as soon as the fund is informed of the ex-dividend date. Non-cash dividends included in dividend income, if any, are recorded at the fair market value of the securities received. Interest income is accrued as earned. Interest income includes coupon interest and amortization of premium and accretion of discount on debt securities. Investment income is recorded net of foreign taxes withheld where recovery of such taxes is uncertain.
Expenses. Most expenses of the trust can be directly attributed to a fund. Expenses which cannot be directly attributed are apportioned among each fund in the trust.
Income Tax Information and Distributions to Shareholders. Each year, the fund intends to qualify as a regulated investment company by distributing all of its taxable income and realized gains under Subchapter M of the Internal Revenue Code. As a result, no provision for income taxes is required in the accompanying financial statements. Foreign taxes are provided for based on the fund’s understanding of the tax rules and rates that exist in the foreign markets in which it invests.
Distributions are recorded on the ex-dividend date. Income dividends and capital gain distributions are declared separately for each class. Income and capital gain distributions are determined in accordance with income tax regulations, which may differ from generally accepted accounting principles. Capital accounts within the financial statements are adjusted for permanent book-tax differences. These adjustments have no impact on net assets or the results of operations. Temporary book-tax differences will reverse in a subsequent period.
Book-tax differences are primarily due to foreign currency transactions, deferred trustees compensation, net operating losses, capital loss carryfor-wards and losses deferred due to wash sales and excise tax regulations.
Notes to Financial Statements - continued
1. Significant Accounting Policies - continued
Income Tax Information and Distributions to Shareholders - continued
The tax-basis components of distributable earnings and the federal tax cost as of period end were as follows:
| Unrealized appreciation | | $ 180,660,922 |
| Unrealized depreciation | | (12,288,783) |
| Net unrealized appreciation (depreciation) | | 168,372,139 |
| Capital loss carryforward | | (25,340,648) |
| |
| Cost for federal income tax purposes | | $ 635,749,986 |
Short-Term Trading (Redemption) Fees. Shares held in the fund less than 60 days are subject to a redemption fee equal to 1.00% of the proceeds of the redeemed shares. All redemption fees, including any estimated redemption fees paid by Fidelity Management & Research Company (FMR), are retained by the fund and accounted for as an addition to paid in capital.
2. Operating Policies.
Repurchase Agreements. FMR has received an Exemptive Order from the Securities and Exchange Commission (the SEC) which permits the fund and other affiliated entities of FMR to transfer uninvested cash balances into joint trading accounts which are then invested in repurchase agreements. The fund may also invest directly with institutions in repurchase agreements. Repurchase agreements are collateralized by government or non-government securities. Collateral is held in segregated accounts with custodian banks and may be obtained in the event of a default of the counterparty. The fund monitors, on a daily basis, the value of the collateral to ensure it is at least equal to the principal amount of the repurchase agreement (including accrued interest). In the event of a default by the counterparty, realization of the collateral proceeds could be delayed, during which time the value of the collateral may decline.
Restricted Securities. The fund may invest in securities that are subject to legal or contractual restrictions on resale. These securities generally may be resold in transactions exempt from registration or to the public if the securities are registered. Disposal of these securities may involve time-consuming negotiations and expense, and prompt sale at an acceptable price may be difficult. Information regarding restricted securities is included at the end of the fund’s Schedule of Investments.
3. Purchases and Sales of Investments.
Purchases and sales of securities, other than short-term securities and U.S. government securities, aggregated $537,295,495 and $668,685,843, respectively.
4. Fees and Other Transactions with Affiliates.
Management Fee. FMR and its affiliates provide the fund with investment management related services for which the fund pays a monthly management fee. The management fee is the sum of an individual fund fee rate that is based on an annual rate of .30% of the fund’s average net assets and a group fee rate that averaged .27% during the period. The group fee rate is based upon the average net assets of all the mutual funds advised by FMR. The group fee rate decreases as assets under management increase and increases as assets under management decrease. For the period, the total annual management fee rate was .57% of the fund’s average net assets.
Distribution and Service Plan. In accordance with Rule 12b-1 of the 1940 Act, the fund has adopted separate Distribution and Service Plans for each class of shares. Certain classes pay Fidelity Distributors Corporation (FDC), an affiliate of FMR, separate Distribution and Service Fees, each of which is based on an annual percentage of each class’ average net assets. In addition, FDC may pay financial intermediaries for selling shares of the fund and providing shareholder support services. For the period, the Distribution and Service Fee rates and the total amounts paid to and retained by FDC were as follows:
| | | Distribution | | Service | | | | Paid to | | | | Retained |
| | | Fee | | Fee | | | | FDC | | | | by FDC |
| Class A | | 0% | | .25% | | $ | | 283,018 | | $ | | 520 |
| Class T | | 25% | | .25% | | | | 1,181,016 | | | | 7,912 |
| Class B | | 75% | | .25% | | | | 2,707,471 | | | | 2,032,380 |
| Class C | | 75% | | .25% | | | | 1,250,715 | | | | 102,040 |
| |
| | | | | | | $ | | 5,422,220 | | $ | | 2,142,852 |
Health Care A-106
4. Fees and Other Transactions with Affiliates - continued
Sales Load. FDC receives a front-end sales charge of up to 5.75% for selling Class A shares, and 3.50% for selling Class T shares, some of which is paid to financial intermediaries for selling shares of the fund. FDC receives the proceeds of contingent deferred sales charges levied on Class A, Class T, Class B, and Class C redemptions. These charges depend on the holding period. The deferred sales charges range from 5% to 1% for Class B, 1% for Class C, and .25% for certain purchases of Class A and Class T shares.
For the period, sales charge amounts retained by FDC were as follows:
| | | | | Retained |
| | | | | by FDC |
| Class A | | $ | | 45,779 |
| Class T | | | | 30,312 |
| Class B* | | | | 683,940 |
| Class C* | | | | 18,704 |
| | | $ | | 778,735 |
* When Class B and Class C shares are initially sold, FDC pays commissions from its own resources to financial intermediaries through which the sales are made.
Transfer Agent Fees. Fidelity Investments Institutional Operations Company, Inc. (FIIOC), an affiliate of FMR, is the transfer, dividend disbursing and shareholder servicing agent for each class of the fund. FIIOC receives account fees and asset-based fees that vary according to the account size and type of account of the shareholders of the respective classes of the fund. FIIOC pays for typesetting, printing and mailing of shareholder reports, except proxy statements. For the period the total transfer agent fees paid by each class to FIIOC, were as follows:
| | | | | | | % of |
| | | | | | | Average |
| | | | | Amount | | Net Assets |
| Class A | | $ | | 455,830 | | .40 |
| Class T | | | | 950,840 | | .40 |
| Class B | | | | 1,100,688 | | .41 |
| Class C | | | | 419,992 | | .34 |
| Institutional Class | | | | 47,213 | | .24 |
| |
| | | $ | | 2,974,563 | | |
Accounting and Security Lending Fees. Fidelity Service Company, Inc. (FSC), an affiliate of FMR, maintains the fund’s accounting records. The accounting fee is based on the level of average net assets for the month. Under a separate contract, FSC administers the security lending program. The security lending fee is based on the number and duration of lending transactions.
Central Funds. The fund may invest in affiliated Central Funds managed by Fidelity Investments Money Management, Inc. (FIMM) an affiliate of FMR. The Central Funds are open-end investment companies available only to investment companies and other accounts managed by FMR and its affiliates. The Money Market Central Funds seek preservation of capital and current income. The Central Funds do not pay a management fee. Income distributions earned by the fund are recorded as income in the accompanying financial statements and totaled $261,668 for the period.
Brokerage Commissions. The fund placed a portion of its portfolio transactions with brokerage firms which are affiliates of the investment adviser. The commissions paid to these affiliated firms were $9,896 for the period.
5. Committed Line of Credit.
The fund participates with other funds managed by FMR in a $4.2 billion credit facility (the “line of credit”) to be utilized for temporary or emergency purposes to fund shareholder redemptions or for other short-term liquidity purposes. The fund has agreed to pay commitment fees on its pro rata portion of the line of credit. During the period, there were no borrowings on this line of credit.
6. Security Lending.
The fund lends portfolio securities from time to time in order to earn additional income. The fund receives collateral (in the form of U.S. Treasury obligations, letters of credit and/or cash) against the loaned securities and maintains collateral in an amount not less than 100% of the market value of the loaned securities during the period of the loan. The market value of the loaned securities is determined at the close of business of the fund and any additional required collateral is delivered to the fund on the next business day. If the borrower defaults on its obligation to return the securities loaned because of insolvency or other reasons, a fund could experience delays and costs in recovering the securities loaned or in gaining access to the collateral. Cash collateral is invested in the Fidelity Securities Lending Cash Central Fund. The value of loaned securities and cash collateral at period end are disclosed on the fund’s Statement of Assets and Liabilities.
A-107 Annual Report
Notes to Financial Statements - continued
7. Expense Reductions.
Many of the brokers with whom FMR places trades on behalf of the fund provided services to the fund in addition to trade execution. These services included payments of certain expenses on behalf of the fund totaling $209,473 for the period. In addition, through arrangements with the fund’s transfer agent, credits realized as a result of uninvested cash balances were used to reduce the fund’s expenses. During the period, credits reduced each class’ transfer agent expense as noted in the table below.
| | | Transfer Agent |
| | | expense reduction |
| Class A | | $ 2,117 |
8. Other.
The fund’s organizational documents provide former and current trustees and officers with a limited indemnification against liabilities arising in connection with the performance of their duties to the fund. In the normal course of business, the fund may also enter into contracts that provide general indemnifications. The fund’s maximum exposure under these arrangements is unknown as this would be dependent on future claims that may be made against the fund. The risk of material loss from such claims is considered remote.
9. Share Transactions.
Transactions for each class of shares were as follows:
| | | | | Shares | | | | | | Dollars |
| Years ended July 31, | | 2005 | | | | 2004 | | 2005 | | | | 2004 |
| Class A | | | | | | | | | | | | |
| Shares sold | | 2,249,275 | | | | 1,326,830 | | $ 46,669,256 | | $ | | 25,583,854 |
| Shares redeemed | | (1,695,541) | | | | (1,754,987) | | (34,388,787) | | | | (33,233,576) |
| Net increase (decrease) | | 553,734 | | | | (428,157) | | $ 12,280,469 | | $ | | (7,649,722) |
| Class T | | | | | | | | | | | | |
| Shares sold | | 1,442,910 | | | | 2,113,234 | | $ 29,136,425 | | $ | | 40,035,265 |
| Shares redeemed | | (3,703,075) | | | | (3,681,338) | | (73,845,453) | | | | (68,961,682) |
| Net increase (decrease) | | (2,260,165) | | | | (1,568,104) | | $ (44,709,028) | | $ | | (28,926,417) |
| Class B | | | | | | | | | | | | |
| Shares sold | | 688,188 | | | | 1,131,221 | | $ 13,318,322 | | $ | | 20,552,323 |
| Shares redeemed | | (4,265,630) | | | | (3,413,291) | | (81,968,667) | | | | (61,904,937) |
| Net increase (decrease) | | (3,577,442) | | | | (2,282,070) | | $ (68,650,345) | | $ | | (41,352,614) |
| Class C | | | | | | | | | | | | |
| Shares sold | | 718,291 | | | | 865,725 | | $ 14,077,610 | | $ | | 15,749,574 |
| Shares redeemed | | (1,900,462) | | | | (2,225,887) | | (36,319,943) | | | | (40,266,820) |
| Net increase (decrease) | | (1,182,171) | | | | (1,360,162) | | $ (22,242,333) | | $ | | (24,517,246) |
| Institutional Class | | | | | | | | | | | | |
| Shares sold | | 80,685 | | | | 122,545 | | $ 1,707,265 | | $ | | 2,394,261 |
| Shares redeemed | | (297,641) | | | | (324,350) | | (6,153,652) | | | | (6,296,427) |
| Net increase (decrease) | | (216,956) | | | | (201,805) | | $ (4,446,387) | | $ | | (3,902,166) |
Health Care A-108
Advisor Natural Resources Fund — Class A, T, B, and C
Performance
|
Average annual total return reflects the change in the value of an investment, assuming reinvestment of the dividend income and capital gains (the profits earned upon the sale of securities that have grown in value) and assuming a constant rate of performance each year. The $10,000 table and the fund’s returns do not reflect the deduction of taxes that a shareholder would pay on fund distributions or the redemption of fund shares. During periods of reimbursement by Fidelity, a fund’s total return will be greater than it would be had the reimbursement not occurred. How a fund did yesterday is no guarantee of how it will do tomorrow. Returns may reflect the conversion of Class B shares to Class A shares after a maximum of seven years.
| Average Annual Total Returns | | | | |
| Periods ended July 31, 2005 | | Past 1 | | Past 5 | | Past 10 |
| | | year | | years | | years |
| Class A (incl. 5.75% sales charge)A | | 34.48% | | 12.31% | | 11.63% |
| Class T (incl. 3.50% sales charge) | | 37.43% | | 12.63% | | 11.76% |
| Class B (incl. contingent deferred | | | | | | |
| sales charge)B | | 36.66% | | 12.57% | | 11.77% |
| Class C (incl. contingent deferred | | | | | | |
| sales charge)C | | 40.70% | | 12.85% | | 11.52% |
A Class A’s 12b-1 fee may range over time between 0.25% and 0.35%, as an amount of
brokerage commissions equivalent to up to 0.10% of the class’s average net assets may be
used to promote the sale of class shares. This practice has been discontinued and no
commissions incurred after June 30, 2003 have been used to pay distribution expenses.
The initial offering of Class A shares took place on September 3, 1996. Returns prior to
September 3, 1996 are those of Class T, the original class of the fund, and reflect a 0.50%
12b-1 fee (0.65% prior to January 1, 1996).
B Class B shares bear a 1.00% 12b-1 fee. The initial offering of Class B shares took place
on July 3, 1995. Returns prior to July 3, 1995 are those of Class T and reflect a 0.65%
12b-1 fee. Had Class B shares’ 12b-1 fee been reflected, returns prior to July 3, 1995 would
have been lower. Class B shares’ contingent deferred sales charges included in the past
one year, five year, and ten year total return figures are 5%, 2% and 0%, respectively.
C Class C shares bear a 1.00% 12b-1 fee. The initial offering of Class C shares took place
on November 3, 1997. Returns between July 3, 1995 and November 3, 1997 are those of
Class B shares and reflect Class B shares’ 1.00% 12b-1 fee. Returns prior to July 3, 1995
are those of Class T and reflect a 0.65% 12b-1 fee. Had Class C shares’ 12b-1 fee been
reflected, returns prior to July 3, 1995 would have been lower. Class C shares’ contingent
deferred sales charges included in the past one year, five year, and ten year total return
figures are 1%, 0% and 0%, respectively.
|
$10,000 Over 10 Years
Let’s say hypothetically that $10,000 was invested in Fidelity Advisor
Natural Resources Fund — Class T on July 31, 1995, and the current
3.50% sales charge was paid. The chart shows how the value of your
investment would have changed, and also shows how the S&P 500
Index performed over the same period.
|
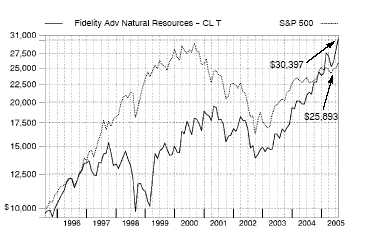
A-109 Annual Report
A-109
Advisor Natural Resources Fund
|
Management’s Discussion of Fund Performance
Comments from Matthew Friedman, Portfolio Manager of Fidelity® Advisor Natural Resources Fund
A late-inning rally on Wall Street helped push some key U.S. equity indexes to four-year highs by the conclusion of the 12-month period ending July 31, 2005. Spurred on by bullish economic data and strong corporate earnings, investors enjoyed a stellar month of July, capping off a turbulent 12-month period for U.S. equity markets. Stock prices bounced up and down during most of the year, moving in cadence with gyrations in the price of crude oil and investors’ gathering and ebbing concerns about inflation. The Federal Reserve Board raised short-term interest rates eight times during the period, also affecting overall market sentiment. Despite their fluctuations, the major equity indexes finished on a high note, with the Standard & Poor’s 500SM Index and the NASDAQ Composite® Index posting gains of 14.05% and 16.51%, respectively, for the period. The small-cap Russell 2000® Index rose 24.78% and the Russell Midcap® Index jumped 28.93%, while the blue-chips’ Dow Jones Industrial AverageSM advanced only 7.29% .
For the 12 months that ended July 31, 2005, the fund’s Class A, Class T, Class B and Class C shares returned 42.69%, 42.41%, 41.66% and 41.70%, respectively, beating the Goldman Sachs® Natural Resources Index, which returned 40.48%, and the S&P 500®. The fund’s outperformance was driven by oil prices, which remained historically high throughout the period. Overweighting refining stocks compared to the sector index helped quite a bit, led by positions in Premcor, Holly Corporation and Valero Energy, the latter of which I sold. Also, oil rig equipment supplier Varco International, which merged with National Oilwell during the period, benefited from increased rig construction. Relatively large positions in oil and gas exploration companies Frontier Oil, Quicksilver Resources and Range Resources generated gains versus the sector index as well. Finally, the fund experienced significantly increased turnover during the period as a larger-than-usual number of attractive trading opportunities arose in response to the market’s volatility. On the other hand, investments in gold producer Newmont Mining and Apex Silver Mines were disappointing. Also, our holdings in Smurfit-Stone Container underperformed in response to margin pressures. Lastly, underweighting exploration and production stocks Unocal, EOG Resources, Talisman Energy and Burlington Resources — all index components — detracted from relative performance when margin pressures failed to materialize and the stocks performed well.
The views expressed in this statement reflect those of the portfolio manager only through the end of the period of the report as stated on the cover and do not necessarily represent the views of Fidelity or any other person in the Fidelity organization. Any such views are subject to change at any time based upon market or other conditions and Fidelity disclaims any responsibility to update such views. These views may not be relied on as investment advice and, because investment decisions for a Fidelity fund are based on numerous factors, may not be relied on as an indication of trading intent on behalf of any Fidelity fund.
Advisor Natural Resources Fund
Shareholder Expense Example
|
As a shareholder of the Fund, you incur two types of costs: (1) transaction costs, including sales charges (loads) on purchase payments or redemption proceeds, redemption fees, and (2) ongoing costs, including management fees, distribution and/or service (12b-1) fees and other Fund expenses. This Example is intended to help you understand your ongoing costs (in dollars) of investing in the Fund and to compare these costs with the ongoing costs of investing in other mutual funds.
The Example is based on an investment of $1,000 invested at the beginning of the period and held for the entire period (February 1, 2005 to July 31, 2005).
The first line of the table below for each class of the Fund provides information about actual account values and actual expenses. You may use the information in this line, together with the amount you invested, to estimate the expenses that you paid over the period. Simply divide your account value by $1,000.00 (for example, an $8,600 account value divided by $1,000.00 = 8.6), then multiply the result by the number in the first line for a class of the Fund under the heading entitled “Expenses Paid During Period” to estimate the expenses you paid on your account during this period.
Hypothetical Example for Comparison Purposes
|
The second line of the table below for each class of the Fund provides information about hypothetical account values and hypothetical expenses based on a Class’ actual expense ratio and an assumed rate of return of 5% per year before expenses, which is not the Class’ actual return. The hypothetical account values and expenses may not be used to estimate the actual ending account balance or expenses you paid for the period. You may use this information to compare the ongoing costs of investing in the Fund and other funds. To do so, compare this 5% hypothetical example with the 5% hypothetical examples that appear in the shareholder reports of the other funds.
Please note that the expenses shown in the table are meant to highlight your ongoing costs only and do not reflect any transaction costs. Therefore, the second line of the table is useful in comparing ongoing costs only, and will not help you determine the relative total costs of owning different funds. In addition, if these transactional costs were included, your costs would have been higher.
| | | | | | | | | | | Expenses Paid |
| | | Beginning | | | | Ending | | | | During Period* |
| | | Account Value | | | | Account Value | | | | February 1, 2005 |
| | | February 1, 2005 | | | | July 31, 2005 | | | | to July 31, 2005 |
| Class A | | | | | | | | | | |
| Actual | | $ 1,000.00 | | $ | | 1,255.50 | | $ | | 6.88 |
| HypotheticalA | | $ 1,000.00 | | $ | | 1,018.70 | | $ | | 6.16 |
| Class T | | | | | | | | | | |
| Actual | | $ 1,000.00 | | $ | | 1,254.50 | | $ | | 7.99 |
| HypotheticalA | | $ 1,000.00 | | $ | | 1,017.70 | | $ | | 7.15 |
| Class B | | | | | | | | | | |
| Actual | | $ 1,000.00 | | $ | | 1,251.30 | | $ | | 11.00 |
| HypotheticalA | | $ 1,000.00 | | $ | | 1,015.03 | | $ | | 9.84 |
| Class C | | | | | | | | | | |
| Actual | | $ 1,000.00 | | $ | | 1,251.20 | | $ | | 10.83 |
| HypotheticalA | | $ 1,000.00 | | $ | | 1,015.17 | | $ | | 9.69 |
| Institutional Class | | | | | | | | | | |
| Actual | | $ 1,000.00 | | $ | | 1,257.80 | | $ | | 4.98 |
| HypotheticalA | | $ 1,000.00 | | $ | | 1,020.38 | | $ | | 4.46 |
| |
| A 5% return per year before expenses | | | | | | | | | | |
* Expenses are equal to each Class’ annualized expense ratio (shown in the table below); multiplied by the average account value over the period, multiplied by 181/365 (to reflect the one-half year period).
| | | Annualized |
| | | Expense Ratio |
| Class A | | 1.23% |
| Class T | | 1.43% |
| Class B | | 1.97% |
| Class C | | 1.94% |
| Institutional Class | | 89% |
| | Advisor Natural Resources Fund
Investment Changes
|
| Top Ten Stocks as of July 31, 2005 | | |
| | | % of fund’s | | % of fund’s net assets |
| | | net assets | | 6 months ago |
| National Oilwell Varco, Inc. | | 5.2 | | 0.9 |
| ConocoPhillips | | 5.1 | | 6.3 |
| Schlumberger Ltd. (NY Shares) | | 5.0 | | 3.7 |
| BP PLC sponsored ADR | | 4.9 | | 7.5 |
| Halliburton Co. | | 4.3 | | 4.8 |
| Premcor, Inc. | | 3.8 | | 0.9 |
| Newmont Mining Corp. | | 3.4 | | 3.7 |
| Smith International, Inc. | | 3.3 | | 2.7 |
| Exxon Mobil Corp. | | 2.7 | | 7.8 |
| Alcoa, Inc. | | 2.2 | | 2.3 |
| | | 39.9 | | |
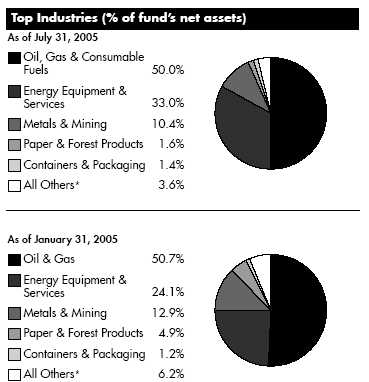
| | * Includes short term investments and net other assets.
Prior period industry classifications reflect the categories in place as of the date
indicated and have not been adjusted to reflect current industry classifications.
|
Natural Resources A-112
Advisor Natural Resources Fund
Investments July 31, 2005
Showing Percentage of Net Assets
|
| Common Stocks — 99.5% | | | | |
| | | Shares | | Value (Note 1) |
| |
| CHEMICALS – 0.5% | | | | |
| Diversified Chemicals – 0.5% | | | | |
| Ashland, Inc. | | 43,000 | | $ 2,642,350 |
| COMMERCIAL SERVICES & SUPPLIES – 0.3% | | | | |
| Human Resource & Employment Services – 0.3% | | |
| CDI Corp. | | 58,300 | | 1,432,431 |
| CONSTRUCTION & ENGINEERING – 1.0% | | | | |
| Construction & Engineering – 1.0% | | | | |
| Chicago Bridge & Iron Co. NV (NY | | | | |
| Shares) | | 207,200 | | 5,791,240 |
| CONTAINERS & PACKAGING – 1.4% | | | | |
| Paper Packaging – 1.4% | | | | |
| Packaging Corp. of America | | 2,000 | | 42,500 |
| Smurfit-Stone Container Corp. (a) | | 635,175 | | 7,704,673 |
| | | | | 7,747,173 |
| |
| ELECTRICAL EQUIPMENT – 0.2% | | | | |
| Electrical Components & Equipment – 0.2% | | | | |
| Hydrogenics Corp. (a) | | 310,576 | | 1,105,984 |
| Heavy Electrical Equipment – 0.0% | | | | |
| Areva (investment certificates) | | 100 | | 46,803 |
| |
| TOTAL ELECTRICAL EQUIPMENT | | | | 1,152,787 |
| |
| ENERGY EQUIPMENT & SERVICES – 33.0% | | | | |
| Oil & Gas Drilling – 6.2% | | | | |
| Cathedral Energy Services Income Trust . | | 45,900 | | 315,285 |
| Diamond Offshore Drilling, Inc. | | 23,300 | | 1,329,498 |
| ENSCO International, Inc. | | 2,100 | | 84,798 |
| GlobalSantaFe Corp. | | 218,400 | | 9,825,816 |
| Helmerich & Payne, Inc. | | 200 | | 11,424 |
| Nabors Industries Ltd. (a) | | 50,200 | | 3,285,590 |
| Noble Corp. | | 108,300 | | 7,275,594 |
| Patterson-UTI Energy, Inc. | | 17,500 | | 574,525 |
| Precision Drilling Corp. (a) | | 114,500 | | 4,846,155 |
| Pride International, Inc. (a) | | 157,000 | | 4,085,140 |
| Rowan Companies, Inc. | | 32,100 | | 1,096,536 |
| Transocean, Inc. (a) | | 26,100 | | 1,472,823 |
| | | | | 34,203,184 |
| Oil & Gas Equipment & Services – 26.8% | | | | |
| Baker Hughes, Inc. | | 213,450 | | 12,068,463 |
| BJ Services Co. | | 155,800 | | 9,502,242 |
| Cooper Cameron Corp. (a) | | 53,700 | | 3,811,626 |
| Grant Prideco, Inc. (a) | | 246,500 | | 7,912,650 |
| Halliburton Co. | | 426,800 | | 23,922,140 |
| Hornbeck Offshore Services, Inc. (a) | | 53,800 | | 1,608,620 |
| Hydril Co. (a) | | 8,900 | | 571,024 |
| Lone Star Technologies, Inc. (a) | | 22,800 | | 1,163,484 |
| Maverick Tube Corp. (a) | | 76,800 | | 2,547,456 |
| National Oilwell Varco, Inc. (a) | | 552,932 | | 28,945,990 |
| Newpark Resources, Inc. (a) | | 67,900 | | 574,434 |
| | | Shares | | Value (Note 1) |
| NS Group, Inc. (a) | | 124,000 | | $ 5,263,800 |
| Pason Systems, Inc. | | 35,800 | | 704,684 |
| RPC, Inc. | | 2,500 | | 48,725 |
| Schlumberger Ltd. (NY Shares) | | 333,700 | | 27,944,038 |
| Smith International, Inc. | | 269,000 | | 18,275,860 |
| Superior Well Services, Inc. | | 1,800 | | 32,976 |
| Weatherford International Ltd. (a) | | 64,200 | | 4,062,576 |
| | | | | 148,960,788 |
| |
| TOTAL ENERGY EQUIPMENT & SERVICES | | | | 183,163,972 |
| |
| FOOD PRODUCTS – 0.0% | | | | |
| Agricultural Products – 0.0% | | | | |
| Global Bio-Chem Technology Group Co. | | | | |
| Ltd. | | 102,000 | | 51,173 |
| GAS UTILITIES – 0.5% | | | | |
| Gas Utilities – 0.5% | | | | |
| Questar Corp. | | 36,400 | | 2,554,552 |
| IT SERVICES – 0.0% | | | | |
| IT Consulting & Other Services – 0.0% | | | | |
| Telvent GIT SA | | 28,300 | | 306,461 |
| MACHINERY – 0.6% | | | | |
| Construction & Farm Machinery & Heavy Trucks – 0.6% | | |
| Bucyrus International, Inc. Class A | | 76,700 | | 3,268,954 |
| MARINE – 0.0% | | | | |
| Marine – 0.0% | | | | |
| Odfjell ASA (A Shares) | | 6,850 | | 140,376 |
| METALS & MINING – 10.4% | | | | |
| Aluminum – 2.3% | | | | |
| Alcan, Inc. | | 1,300 | | 43,958 |
| Alcoa, Inc. | �� | 443,200 | | 12,431,760 |
| Aleris International, Inc. (a) | | 21,200 | | 484,844 |
| Century Aluminum Co. (a) | | 2,500 | | 61,175 |
| | | | | 13,021,737 |
| Diversified Metals & Mining – 2.4% | | | | |
| Falconbridge Ltd. | | 115,100 | | 2,373,729 |
| Freeport-McMoRan Copper & Gold, Inc. | | | | |
| Class B | | 1,997 | | 80,439 |
| Grupo Mexico SA de CV Series B | | 618,415 | | 1,057,539 |
| Phelps Dodge Corp. | | 19,500 | | 2,075,775 |
| RTI International Metals, Inc. (a) | | 44,000 | | 1,514,480 |
| Teck Cominco Ltd. Class B (sub. vtg.) | | 100,500 | | 3,843,190 |
| Titanium Metals Corp. (a)(d) | | 33,000 | | 2,113,650 |
| | | | | 13,058,802 |
| Gold – 4.1% | | | | |
| Alamos Gold, Inc. (a) | | 253,700 | | 938,670 |
| Goldcorp, Inc. | | 117,500 | | 1,909,789 |
| Kinross Gold Corp. (a) | | 200,400 | | 1,106,468 |
| Newmont Mining Corp. | | 506,900 | | 19,034,095 |
| | | | | 22,989,022 |
See accompanying notes which are an integral part of the financial statements.
A-113 Annual Report
| | Advisor Natural Resources Fund
Investments - continued
|
| Common Stocks – continued | | | | |
| | | Shares | | Value (Note 1) |
| |
| METALS & MINING – CONTINUED | | | | |
| Precious Metals & Minerals – 1.2% | | | | |
| Apex Silver Mines Ltd. (a)(d) | | 197,800 | | $ 2,745,464 |
| Industrias Penoles SA de CV | | 674,800 | | 3,153,652 |
| Stillwater Mining Co. (a) | | 71,600 | | 584,256 |
| | | | | 6,483,372 |
| Steel – 0.4% | | | | |
| Companhia Vale do Rio Doce sponsored | | | | |
| ADR | | 2,400 | | 78,144 |
| IPSCO, Inc. | | 5,900 | | 317,757 |
| Usinas Siderurgicas de Minas Gerais SA | | | | |
| (Usiminas) (PN-A) | | 93,500 | | 1,670,413 |
| | | | | 2,066,314 |
| |
| TOTAL METALS & MINING | | | | 57,619,247 |
| |
| OIL, GAS & CONSUMABLE FUELS – 50.0% | | | | |
| Coal & Consumable Fuels – 6.5% | | | | |
| Arch Coal, Inc. | | 21,100 | | 1,201,012 |
| Cameco Corp. | | 184,800 | | 8,677,381 |
| CONSOL Energy, Inc. | | 158,100 | | 10,649,616 |
| Massey Energy Co. | | 117,400 | | 5,077,550 |
| Peabody Energy Corp. | | 155,700 | | 10,235,718 |
| USEC, Inc. | | 2,300 | | 36,087 |
| | | | | 35,877,364 |
| Integrated Oil & Gas – 17.7% | | | | |
| Amerada Hess Corp. | | 58,400 | | 6,883,024 |
| BG Group PLC sponsored ADR | | 99,100 | | 4,129,497 |
| BP PLC sponsored ADR | | 412,948 | | 27,205,014 |
| Chevron Corp. | | 1,336 | | 77,501 |
| ConocoPhillips | | 453,398 | | 28,378,181 |
| ENI Spa sponsored ADR | | 300 | | 42,420 |
| Exxon Mobil Corp. | | 255,160 | | 14,990,650 |
| Marathon Oil Corp. | | 11,527 | | 672,716 |
| Occidental Petroleum Corp. | | 123,800 | | 10,186,264 |
| OMV AG | | 25,000 | | 1,164,000 |
| Total SA sponsored ADR | | 37,400 | | 4,675,000 |
| | | | | 98,404,267 |
| Oil & Gas Exploration & Production – 17.0% | | |
| Apache Corp. | | 33,600 | | 2,298,240 |
| Blackrock Ventures, Inc. (a) | | 95,100 | | 755,767 |
| Burlington Resources, Inc. | | 91,300 | | 5,853,243 |
| Cabot Oil & Gas Corp. | | 45,500 | | 1,843,660 |
| Canadian Natural Resources Ltd. | | 258,000 | | 10,746,927 |
| Chesapeake Energy Corp. | | 197,400 | | 5,154,114 |
| Comstock Resources, Inc. (a) | | 44,400 | | 1,229,436 |
| Denbury Resources, Inc. (a) | | 26,800 | | 1,254,240 |
| EnCana Corp. | | 262,564 | | 10,823,380 |
| Encore Acquisition Co. (a) | | 51,300 | | 1,618,002 |
| | | Shares | | Value (Note 1) |
| Energy Partners Ltd. (a) | | 1,500 | | $ | | 39,690 |
| Forest Oil Corp. (a) | | 184,000 | | | | 8,235,840 |
| Gastar Exploration Ltd. (a) | | 294,900 | | | | 794,846 |
| Newfield Exploration Co. (a) | | 66,800 | | | | 2,838,332 |
| Nexen, Inc. | | 1,800 | | | | 66,716 |
| Noble Energy, Inc. | | 5,200 | | | | 429,052 |
| Norsk Hydro ASA sponsored ADR | | 20,600 | | | | 1,951,644 |
| Petroleum Development Corp. (a) | | 44,700 | | | | 1,673,568 |
| Pioneer Natural Resources Co. | | 124,300 | | | | 5,385,919 |
| Plains Exploration & Production Co. (a) . | | 246,400 | | | | 9,498,720 |
| Pogo Producing Co. | | 1,600 | | | | 88,048 |
| Quicksilver Resources, Inc. (a) | | 133,950 | | | | 5,674,122 |
| Range Resources Corp. | | 200,300 | | | | 6,117,162 |
| Southwestern Energy Co. (a) | | 6,100 | | | | 336,171 |
| Talisman Energy, Inc. | | 14,000 | | | | 613,926 |
| Ultra Petroleum Corp. (a) | | 208,900 | | | | 7,921,488 |
| Unocal Corp. | | 19,700 | | | | 1,277,545 |
| | | | | | | 94,519,798 |
| Oil & Gas Refining & Marketing – 7.8% | | | | | | |
| Frontier Oil Corp. | | 163,500 | | | | 4,581,270 |
| Giant Industries, Inc. (a) | | 45,900 | | | | 1,800,198 |
| Holly Corp. | | 53,100 | | | | 2,486,142 |
| Neste Oil Oyj | | 81,100 | | | | 2,254,793 |
| Polski Koncern Naftowy Orlen SA | | 68,500 | | | | 1,104,592 |
| Premcor, Inc. | | 276,300 | | | | 21,175,632 |
| Sunoco, Inc. | | 42,900 | | | | 5,393,817 |
| Tesoro Corp. | | 83,000 | | | | 4,002,260 |
| Tupras-Turkiye Petrol Rafinerileri AS | | 30,000 | | | | 438,947 |
| | | | | | | 43,237,651 |
| Oil & Gas Storage & Transport – 1.0% | | | | | | |
| El Paso Corp. | | 210,500 | | | | 2,526,000 |
| OMI Corp. | | 113,700 | | | | 2,050,011 |
| Williams Companies, Inc. | | 40,500 | | | | 860,220 |
| | | | | | | 5,436,231 |
| |
| TOTAL OIL, GAS & CONSUMABLE FUELS | | | | 277,475,311 |
| |
| PAPER & FOREST PRODUCTS – 1.6% | | | | | | |
| Forest Products – 0.0% | | | | | | |
| Canfor Corp. (a) | | 2,629 | | | | 30,706 |
| Sino-Forest Corp. (a) | | 151,600 | | | | 340,507 |
| | | | | | | 371,213 |
| Paper Products – 1.6% | | | | | | |
| Georgia-Pacific Corp. | | 84,500 | | | | 2,885,675 |
| MeadWestvaco Corp. | | 88,000 | | | | 2,571,360 |
| Votorantim Celulose e Papel SA | | | | | | |
| sponsored ADR (non-vtg.) | | 269,900 | | | | 3,252,295 |
| | | | | | | 8,709,330 |
| |
| TOTAL PAPER & FOREST PRODUCTS | | | | | | 9,080,543 |
| |
| TOTAL COMMON STOCKS | | | | | | |
| (Cost $394,778,298) | | | | 552,426,570 |
See accompanying notes which are an integral part of the financial statements.
Natural Resources A-114
| Money Market Funds — 3.1% | | |
| | | Shares | | Value (Note |
| Fidelity Cash Central Fund, 3.31% (b) | | 14,125,070 | | $ 14,125,070 |
| Fidelity Securities Lending Cash | | | | |
| Central Fund, 3.32% (b)(c) | | 3,173,750 | | 3,173,750 |
| TOTAL MONEY MARKET FUNDS | | | | |
| (Cost $17,298,820) | | | | 17,298,820 |
| TOTAL INVESTMENT PORTFOLIO - 102.6% | | |
| (Cost $412,077,118) | | | | 569,725,390 |
| |
| NET OTHER ASSETS – (2.6)% | | | | (14,295,721) |
| NET ASSETS – 100% | | | | $ 555,429,669 |
Legend
(a) Non-income producing
(b) Affiliated fund that is available only to investment companies and other
accounts managed by Fidelity Investments. The rate quoted is the
annualized seven-day yield of the fund at period end. A complete listing
of the fund’s holdings as of its most recent quarter end is available upon
request.
(c) Investment made with cash collateral received from securities on loan.
(d) Security or a portion of the security is on loan at period end.
|
Distribution of investments by country of issue, as a percentage of total net assets, is as follows:
| United States of America | | 69.9% |
| Canada | | 10.5% |
| United Kingdom | | 5.7% |
| Netherlands Antilles | | 5.0% |
| Cayman Islands | | 3.6% |
| Netherlands | | 1.0% |
| Others (individually less than 1%) | | 4.3% |
| | | 100.0% |
See accompanying notes which are an integral part of the financial statements.
Advisor Natural Resources Fund
Financial Statements
| Statement of Assets and Liabilities | | |
| | | | | | | July 31, 2005 |
| Assets | | | | | | |
| Investment in securities, at value (includ- | | | | | | |
| ing securities loaned of $3,202,875) | | | | | | |
| (cost $412,077,118) — See accompa- | | | | |
| nying schedule | | | | $ | | 569,725,390 |
| Cash | | | | | | 1,498 |
| Receivable for investments sold | | | | | | 1,211,795 |
| Receivable for fund shares sold | | | | | | 1,251,961 |
| Dividends receivable | | | | | | 192,255 |
| Interest receivable | | | | | | 29,893 |
| Prepaid expenses | | | | | | 586 |
| Other affiliated receivables | | | | | | 50,036 |
| Other receivables | | | | | | 156,132 |
| Total assets | | | | | | 572,619,546 |
| Liabilities | | | | | | |
| Payable for investments purchased | | $ | | 5,152,799 | | |
| Payable for fund shares redeemed | | | | 8,146,391 | | |
| Accrued management fee | | | | 257,822 | | |
| Distribution fees payable | | | | 273,402 | | |
| Other affiliated payables | | | | 141,407 | | |
| Other payables and accrued expenses | | | | 44,306 | | |
| Collateral on securities loaned, at value | | . | | 3,173,750 | | |
| Total liabilities | | | | | | 17,189,877 |
| Net Assets | | | | $ | | 555,429,669 |
| Net Assets consist of: | | | | | | |
| Paid in capital | | | | $ | | 339,114,603 |
| Accumulated net investment loss | | | | | | (1,571) |
| Accumulated undistributed net realized | | | | | | |
| gain (loss) on investments and foreign | | | | | | |
| currency transactions | | | | | | 58,668,704 |
| Net unrealized appreciation (depreci- | | | | | | |
| ation) on investments and assets and | | | | | | |
| liabilities in foreign currencies | | | | | | 157,647,933 |
| Net Assets | | | | $ | | 555,429,669 |
| Calculation of Maximum Offering Price | | | | | | |
| Class A: | | | | | | |
| Net Asset Value and redemption price | | | | | | |
| per share ($90,342,018 ÷ | | | | | | |
| 2,207,045 shares) | | | | $ | | 40.93 |
| Maximum offering price per share | | | | | | |
| (100/94.25 of $40.93) | | | | $ | | 43.43 |
| Class T: | | | | | | |
| Net Asset Value and redemption price | | | | | | |
| per share ($280,820,453 ÷ | | | | | | |
| 6,772,961 shares) | | | | $ | | 41.46 |
| Maximum offering price per share | | | | | | |
| (100/96.50 of $41.46) | | | | $ | | 42.96 |
| Class B: | | | | | | |
| Net Asset Value and offering price per | | | | | | |
| share ($102,002,599 ÷ 2,557,242 | | | | | | |
| shares)A | | | | $ | | 39.89 |
| Class C: | | | | | | |
| Net Asset Value and offering price per | | | | | | |
| share ($72,831,974 ÷ 1,816,197 | | | | | | |
| shares)A | | | | $ | | 40.10 |
| Institutional Class: | | | | | | |
| Net Asset Value, offering price and | | | | | | |
| redemption price per share | | | | | | |
| ($9,432,625 ÷ 225,858 shares) | | | | $ | | 41.76 |
| A Redemption price per share is equal to net asset value less any applicable contingent deferred sales charge. |
| Statement of Operations | | | | |
| | | | | Year ended July 31, 2005 |
| Investment Income | | | | | | |
| Dividends | | | | $ | | 5,686,172 |
| Interest | | | | | | 219,270 |
| Security lending | | | | | | 48,874 |
| Total income | | | | | | 5,954,316 |
| Expenses | | | | | | |
| Management fee | | $ | | 2,474,768 | | |
| Transfer agent fees | | | | 1,288,005 | | |
| Distribution fees | | | | 2,633,663 | | |
| Accounting and security lending | | | | | | |
| fees | | | | 178,657 | | |
| Independent trustees’ compensation | | 2,280 | | |
| Custodian fees and expenses | | | | 42,678 | | |
| Registration fees | | | | 75,213 | | |
| Audit | | | | 45,494 | | |
| Legal | | | | 1,403 | | |
| Interest | | | | 572 | | |
| Miscellaneous | | | | 7,930 | | |
| Total expenses before reductions | | 6,750,663 | | |
| Expense reductions | | | | (224,870) | | 6,525,793 |
| |
| Net investment income (loss) | | | | | | (571,477) |
| Realized and Unrealized Gain (Loss) | | | | |
| Net realized gain (loss) on: | | | | | | |
| Investment securities | | | | 75,630,265 | | |
| Investment not meeting investment | | | | |
| restrictions | | | | (32,785) | | |
| Foreign currency transactions | | | | (94,327) | | |
| Payment from investment advisor | | | | |
| for loss on investment not meet- | | | | |
| ing investment restrictions | | | | 32,785 | | |
| Total net realized gain (loss) | | | | | | 75,535,938 |
| Change in net unrealized appreci- | | | | |
| ation (depreciation) on: | | | | | | |
| Investment securities | | | | 81,246,405 | | |
| Assets and liabilities in foreign | | | | | | |
| currencies | | | | (334) | | |
| Total change in net unrealized ap- | | | | |
| preciation (depreciation) | | | | | | 81,246,071 |
| Net gain (loss) | | | | | | 156,782,009 |
| Net increase (decrease) in net as- | | | | |
| sets resulting from operations | | | | $ | | 156,210,532 |
See accompanying notes which are an integral part of the financial statements.
Natural Resources A-116
| Statement of Changes in Net Assets | | | | | | | | | | | | | | | | | | | | |
| | | | | | | | | | | | | Year ended | | Year ended |
| | | | | | | | | | | | | July 31, | | July 31, |
| | | | | | | | | | | | | 2005 | | 2004 |
| Increase (Decrease) in Net Assets | | | | | | | | | | | | | | | | | | | | |
| Operations | | | | | | | | | | | | | | | �� | | | | | |
| Net investment income (loss) | | | | | | | | | | | | $ | | (571,477) $ | | | | (91,145) |
| Net realized gain (loss) | | | | | | | | | | | | | | 75,535,938 | | 23,859,151 |
| Change in net unrealized appreciation (depreciation) | | | | | | | | | | | | | | 81,246,071 | | 63,349,686 |
| Net increase (decrease) in net assets resulting from operations | | | | | | | | | | | | 156,210,532 | | 87,117,692 |
| Distributions to shareholders from net investment income | | | | | | | | | | | | | | (316,454) | | | | (681,969) |
| Distributions to shareholders from net realized gain | | | | | | | | | | | | | | (5,002,969) | | | | — |
| Total distributions | | | | | | | | | | | | | | (5,319,423) | | | | (681,969) |
| Share transactions -- net increase (decrease) | | | | | | | | | | | | | | 49,200,390 | | 16,197,507 |
| Redemption fees | | | | | | | | | | | | | | | | 77,479 | | | | 51,991 |
| Total increase (decrease) in net assets | | | | | | | | | | | | 200,168,978 | | 102,685,221 |
| |
| Net Assets | | | | | | | | | | | | | | | | | | | | |
| Beginning of period | | | | | | | | | | | | 355,260,691 | | 252,575,470 |
| End of period (including accumulated net investment loss of $1,571 and accumulated net investment loss of $82,794, | | | | | | | | | | |
| respectively) | | | | | | | | | | | | $ 555,429,669 $ | | 355,260,691 |
| |
| Financial Highlights — Class A | | | | | | | | | | | | | | | | | | | | |
| Years ended July 31, | | 2005 | | | | 2004 | | 2003 | | | | 2002 | | | | 2001 |
| Selected Per-Share Data | | | | | | | | | | | | | | | | | | | | |
| Net asset value, beginning of period | | $ | | 29.12 | | $ | | 21.65 | | $ | | 20.33 | | $ | | 26.42 | | $ | | 24.07 |
| Income from Investment Operations | | | | | | | | | | | | | | | | | | | | |
| Net investment income (loss)C | | | | 06 | | | | .07 | | | | .13 | | | | .15 | | | | .19 |
| Net realized and unrealized gain (loss) | | | | 12.21 | | | | 7.50 | | | | 1.30 | | | | (4.36) | | | | 2.34 |
| Total from investment operations | | | | 12.27 | | | | 7.57 | | | | 1.43 | | | | (4.21) | | | | 2.53 |
| Distributions from net investment income | | | | (.06) | | | | (.10) | | | | (.11) | | | | (.18) | | | | (.19) |
| Distributions from net realized gain | | | | (.41) | | | | — | | | | — | | | | (1.70) | | | | — |
| Total distributions | | | | (.47) | | | | (.10) | | | | (.11) | | | | (1.88) | | | | (.19) |
| Redemption fees added to paid in capitalC | | | | 01 | | | | —E | | | | —E | | | | —E | | | | .01 |
| Net asset value, end of period | | $ | | 40.93 | | $ | | 29.12 | | $ | | 21.65 | | $ | | 20.33 | | $ | | 26.42 |
| Total ReturnA,B | | | | 42.69% | | | | 35.08% | | | | 7.07% | | | | (16.92)% | | | | 10.56% |
| Ratios to Average Net AssetsD | | | | | | | | | | | | | | | | | | | | |
| Expenses before expense reductions | | | | 1.25% | | | | 1.30% | | | | 1.36% | | | | 1.28% | | | | 1.23% |
| Expenses net of voluntary waivers, if any | | | | 1.25% | | | | 1.30% | | | | 1.36% | | | | 1.28% | | | | 1.23% |
| Expenses net of all reductions | | | | 1.19% | | | | 1.29% | | | | 1.32% | | | | 1.24% | | | | 1.18% |
| Net investment income (loss) | | | | 19% | | | | .28% | | | | .63% | | | | .64% | | | | .69% |
| Supplemental Data | | | | | | | | | | | | | | | | | | | | |
| Net assets, end of period (000 omitted) | | $ 90,342 | | $ | | 44,315 | | $ 21,798 | | $ | | 21,993 | | $ | | 21,849 |
| Portfolio turnover rate | | | | 125% | | | | 40% | | | | 41% | | | | 85% | | | | 130% |
A Total returns would have been lower had certain expenses not been reduced during the periods shown.
B Total returns do not include the effect of the sales charges.
C Calculated based on average shares outstanding during the period.
D Expense ratios reflect operating expenses of the class. Expenses before reductions do not reflect amounts reimbursed by the investment adviser or reductions from brokerage service arrangements or other expense offset arrangements and do not
represent the amount paid by the class during periods when reimbursements or reductions occur. Expenses net of any voluntary waivers reflect expenses after reimbursement by the investment adviser but prior to reductions from brokerage service
arrangements or other expense offset arrangements. Expenses net of all reductions represent the net expenses paid by the class.
E Amount represents less than $.01 per share.
|
See accompanying notes which are an integral part of the financial statements.
|
| Financial Highlights — Class T | | | | | | | | | | |
| Years ended July 31, | | 2005 | | 2004 | | 2003 | | 2002 | | 2001 |
| Selected Per-Share Data | | | | | | | | | | |
| Net asset value, beginning of period | | $ 29.52 | | $ 21.97 | | $ 20.61 | | $ 26.73 | | $ 24.35 |
| Income from Investment Operations | | | | | | | | | | |
| Net investment income (loss)C | | —E | | .03 | | .10 | | .11 | | .14 |
| Net realized and unrealized gain (loss) | | 12.37 | | 7.60 | | 1.32 | | (4.42) | | 2.36 |
| Total from investment operations | | 12.37 | | 7.63 | | 1.42 | | (4.31) | | 2.50 |
| Distributions from net investment income | | (.03) | | (.08) | | (.06) | | (.11) | | (.13) |
| Distributions from net realized gain | | (.41) | | — | | — | | (1.70) | | — |
| Total distributions | | (.44) | | (.08) | | (.06) | | (1.81) | | (.13) |
| Redemption fees added to paid in capitalC | | 01 | | —E | | —E | | —E | | .01 |
| Net asset value, end of period | | $ 41.46 | | $ 29.52 | | $ 21.97 | | $ 20.61 | | $ 26.73 |
| Total ReturnA,B | | 42.41% | | 34.82% | | 6.91% | | (17.07)% | | 10.32% |
| Ratios to Average Net AssetsD | | | | | | | | | | |
| Expenses before expense reductions | | 1.44% | | 1.48% | | 1.50% | | 1.45% | | 1.41% |
| Expenses net of voluntary waivers, if any | | 1.44% | | 1.48% | | 1.50% | | 1.45% | | 1.41% |
| Expenses net of all reductions | | 1.39% | | 1.47% | | 1.47% | | 1.41% | | 1.37% |
| Net investment income (loss) | | (.01)% | | .10% | | .48% | | .47% | | .51% |
| Supplemental Data | | | | | | | | | | |
| Net assets, end of period (000 omitted) | | $ 280,820 | | $ 201,187 | | $ 155,249 | | $ 174,670 | | $ 253,062 |
| Portfolio turnover rate | | 125% | | 40% | | 41% | | 85% | | 130% |
A Total returns would have been lower had certain expenses not been reduced during the periods shown.
B Total returns do not include the effect of the sales charges.
C Calculated based on average shares outstanding during the period.
D Expense ratios reflect operating expenses of the class. Expenses before reductions do not reflect amounts reimbursed by the investment adviser or reductions from brokerage service arrangements or other expense offset arrangements and do not
represent the amount paid by the class during periods when reimbursements or reductions occur. Expenses net of any voluntary waivers reflect expenses after reimbursement by the investment adviser but prior to reductions from brokerage service
arrangements or other expense offset arrangements. Expenses net of all reductions represent the net expenses paid by the class.
E Amount represents less than $.01 per share.
|
| Financial Highlights — Class B | | | | | | | | | | |
| Years ended July 31, | | 2005 | | 2004 | | 2003 | | 2002 | | 2001 |
| Selected Per-Share Data | | | | | | | | | | |
| Net asset value, beginning of period | | $ 28.54 | | $ 21.28 | | $ 20.02 | | $ 26.04 | | $ 23.77 |
| Income from Investment Operations | | | | | | | | | | |
| Net investment income (loss)C | | (.18) | | (.11) | | (.01) | | (.02) | | (.01) |
| Net realized and unrealized gain (loss) | | 11.93 | | 7.37 | | 1.27 | | (4.29) | | 2.31 |
| Total from investment operations | | 11.75 | | 7.26 | | 1.26 | | (4.31) | | 2.30 |
| Distributions from net investment income | | — | | — | | — | | (.01) | | (.04) |
| Distributions from net realized gain | | (.41) | | — | | — | | (1.70) | | — |
| Total distributions | | (.41) | | — | | — | | (1.71) | | (.04) |
| Redemption fees added to paid in capitalC | | 01 | | —E | | —E | | —E | | .01 |
| Net asset value, end of period | | $ 39.89 | | $ 28.54 | | $ 21.28 | | $ 20.02 | | $ 26.04 |
| Total ReturnA,B | | 41.66% | | 34.12% | | 6.29% | | (17.51)% | | 9.72% |
| Ratios to Average Net AssetsD | | | | | | | | | | |
| Expenses before expense reductions | | 1.98% | | 2.02% | | 2.06% | | 2.00% | | 1.95% |
| Expenses net of voluntary waivers, if any | | 1.98% | | 2.02% | | 2.06% | | 2.00% | | 1.95% |
| Expenses net of all reductions | | 1.93% | | 2.01% | | 2.02% | | 1.95% | | 1.91% |
| Net investment income (loss) | | (.55)% | | (.44)% | | (.07)% | | (.07)% | | (.03)% |
| Supplemental Data | | | | | | | | | | |
| Net assets, end of period (000 omitted) | | $ 102,003 | | $ 68,347 | | $ 50,833 | | $ 58,656 | | $ 83,243 |
| Portfolio turnover rate | | 125% | | 40% | | 41% | | 85% | | 130% |
A Total returns would have been lower had certain expenses not been reduced during the periods shown.
B Total returns do not include the effect of the contingent deferred sales charge.
C Calculated based on average shares outstanding during the period.
D Expense ratios reflect operating expenses of the class. Expenses before reductions do not reflect amounts reimbursed by the investment adviser or reductions from brokerage service arrangements or other expense offset arrangements and do not
represent the amount paid by the class during periods when reimbursements or reductions occur. Expenses net of any voluntary waivers reflect expenses after reimbursement by the investment adviser but prior to reductions from brokerage service
arrangements or other expense offset arrangements. Expenses net of all reductions represent the net expenses paid by the class.
E Amount represents less than $.01 per share.
|
See accompanying notes which are an integral part of the financial statements.
Natural Resources A-118
|
| Financial Highlights — Class C | | | | | | | | | | |
| Years ended July 31, | | 2005 | | 2004 | | 2003 | | 2002 | | 2001 |
| Selected Per-Share Data | | | | | | | | | | |
| Net asset value, beginning of period | | $ 28.68 | | $ 21.38 | | $ 20.10 | | $ 26.15 | | $ 23.88 |
| Income from Investment Operations | | | | | | | | | | |
| Net investment income (loss)C | | (.17) | | (.10) | | —E | | (.01) | | —E |
| Net realized and unrealized gain (loss) | | 11.99 | | 7.40 | | 1.28 | | (4.32) | | 2.32 |
| Total from investment operations | | 11.82 | | 7.30 | | 1.28 | | (4.33) | | 2.32 |
| Distributions from net investment income | | — | | — | | — | | (.02) | | (.06) |
| Distributions from net realized gain | | (.41) | | — | | — | | (1.70) | | — |
| Total distributions | | (.41) | | — | | — | | (1.72) | | (.06) |
| Redemption fees added to paid in capitalC | | 01 | | —E | | —E | | —E | | .01 |
| Net asset value, end of period | | $ 40.10 | | $ 28.68 | | $ 21.38 | | $ 20.10 | | $ 26.15 |
| Total ReturnA,B | | 41.70% | | 34.14% | | 6.37% | | (17.52)% | | 9.76% |
| Ratios to Average Net AssetsD | | | | | | | | | | |
| Expenses before expense reductions | | 1.94% | | 1.99% | | 2.01% | | 1.96% | | 1.92% |
| Expenses net of voluntary waivers, if any | | 1.94% | | 1.99% | | 2.01% | | 1.96% | | 1.92% |
| Expenses net of all reductions | | 1.89% | | 1.97% | | 1.97% | | 1.92% | | 1.87% |
| Net investment income (loss) | | (.51)% | | (.41)% | | (.02)% | | (.03)% | | — % |
| Supplemental Data | | | | | | | | | | |
| Net assets, end of period (000 omitted) | | $ 72,832 | | $ 37,206 | | $ 22,044 | | $ 24,201 | | $ 29,699 |
| Portfolio turnover rate | | 125% | | 40% | | 41% | | 85% | | 130% |
A Total returns would have been lower had certain expenses not been reduced during the periods shown.
B Total returns do not include the effect of the contingent deferred sales charge.
C Calculated based on average shares outstanding during the period.
D Expense ratios reflect operating expenses of the class. Expenses before reductions do not reflect amounts reimbursed by the investment adviser or reductions from brokerage service arrangements or other expense offset arrangements and do not
represent the amount paid by the class during periods when reimbursements or reductions occur. Expenses net of any voluntary waivers reflect expenses after reimbursement by the investment adviser but prior to reductions from brokerage service
arrangements or other expense offset arrangements. Expenses net of all reductions represent the net expenses paid by the class.
E Amount represents less than $.01 per share.
|
| Financial Highlights — Institutional Class | | | | | | | | | | |
| Years ended July 31, | | 2005 | | 2004 | | 2003 | | 2002 | | 2001 |
| Selected Per-Share Data | | | | | | | | | | |
| Net asset value, beginning of period | | $ 29.64 | | $ 22.03 | | $ 20.67 | | $ 26.82 | | $ 24.43 |
| Income from Investment Operations | | | | | | | | | | |
| Net investment income (loss)B | | 19 | | .18 | | .22 | | .23 | | .28 |
| Net realized and unrealized gain (loss) | | 12.44 | | 7.62 | | 1.32 | | (4.43) | | 2.37 |
| Total from investment operations | | 12.63 | | 7.80 | | 1.54 | | (4.20) | | 2.65 |
| Distributions from net investment income | | (.11) | | (.19) | | (.18) | | (.25) | | (.27) |
| Distributions from net realized gain | | (.41) | | — | | — | | (1.70) | | — |
| Total distributions | | (.52) | | (.19) | | (.18) | | (1.95) | | (.27) |
| Redemption fees added to paid in capitalB | | 01 | | —D | | —D | | —D | | .01 |
| Net asset value, end of period | | $ 41.76 | | $ 29.64 | | $ 22.03 | | $ 20.67 | | $ 26.82 |
| Total ReturnA | | 43.21% | | 35.60% | | 7.51% | | (16.64)% | | 10.90% |
| Ratios to Average Net AssetsC | | | | | | | | | | |
| Expenses before expense reductions | | 89% | | .90% | | .95% | | .93% | | .88% |
| Expenses net of voluntary waivers, if any | | 89% | | .90% | | .95% | | .93% | | .88% |
| Expenses net of all reductions | | 84% | | .89% | | .91% | | .89% | | .84% |
| Net investment income (loss) | | 54% | | .68% | | 1.04% | | .99% | | 1.04% |
| Supplemental Data | | | | | | | | | | |
| Net assets, end of period (000 omitted) | | $ 9,433 | | $ 4,206 | | $ 2,652 | | $ 4,938 | | $ 6,960 |
| Portfolio turnover rate | | 125% | | 40% | | 41% | | 85% | | 130% |
A Total returns would have been lower had certain expenses not been reduced during the periods shown.
B Calculated based on average shares outstanding during the period.
C Expense ratios reflect operating expenses of the class. Expenses before reductions do not reflect amounts reimbursed by the investment adviser or reductions from brokerage service arrangements or other expense offset arrangements and do not
represent the amount paid by the class during periods when reimbursements or reductions occur. Expenses net of any voluntary waivers reflect expenses after reimbursement by the investment adviser but prior to reductions from brokerage service
arrangements or other expense offset arrangements. Expenses net of all reductions represent the net expenses paid by the class.
D Amount represents less than $.01 per share.
|
See accompanying notes which are an integral part of the financial statements.
|
Notes to Financial Statements
For the period ended July 31, 2005
|
1. Significant Accounting Policies.
|
Fidelity Advisor Natural Resources Fund (the fund) is a non-diversified fund of Fidelity Advisor Series VII (the trust) and is authorized to issue an unlimited number of shares. The trust is registered under the Investment Company Act of 1940, as amended (the 1940 Act), as an open-end management investment company organized as a Massachusetts business trust.
The fund offers Class A, Class T, Class B, Class C, and Institutional Class shares, each of which has equal rights as to assets and voting privileges. Each class has exclusive voting rights with respect to matters that affect that class. Class B shares will automatically convert to Class A shares after a holding period of seven years from the initial date of purchase. Investment income, realized and unrealized capital gains and losses, the common expenses of the fund, and certain fund-level expense reductions, if any, are allocated on a pro rata basis to each class based on the relative net assets of each class to the total net assets of the fund. Each class differs with respect to transfer agent and distribution and service plan fees incurred. Certain expense reductions also differ by class.
The financial statements have been prepared in conformity with accounting principles generally accepted in the United States of America, which require management to make certain estimates and assumptions at the date of the financial statements. The following summarizes the significant accounting policies of the fund:
Security Valuation. Net asset value per share (NAV calculation) is calculated as of the close of business of the New York Stock Exchange, normally 4:00 p.m. Eastern time. Equity securities, including restricted securities, for which market quotations are available are valued at the last sale price or official closing price (closing bid price or last evaluated quote if no sale has occurred) on the primary market or exchange on which they trade. If prices are not readily available or do not accurately reflect fair value for a security, or if a security’s value has been materially affected by events occurring after the close of the exchange or market on which the security is principally traded, that security may be valued by another method that the Board of Trustees believes accurately reflects fair value. A security’s valuation may differ depending on the method used for determining value. Price movements in futures contracts and ADRs, market and trading trends, the bid/ask quotes of brokers and off-exchange institutional trading may be reviewed in the course of making a good faith determination of a security’s fair value. Short-term securities with remaining maturities of sixty days or less for which quotations are not readily available are valued on the basis of amortized cost. Investments in open-end investment companies are valued at their net asset value each business day.
Foreign Currency. The fund uses foreign currency contracts to facilitate transactions in foreign-denominated securities. Losses from these transactions may arise from changes in the value of the foreign currency or if the counterparties do not perform under the contracts’ terms.
Foreign-denominated assets, including investment securities, and liabilities are translated into U.S. dollars at the exchange rate at period end. Purchases and sales of investment securities, income and dividends received and expenses denominated in foreign currencies are translated into U.S. dollars at the exchange rate in effect on the transaction date.
The effects of exchange rate fluctuations on investments are included with the net realized and unrealized gain (loss) on investment securities. Other foreign currency transactions resulting in realized and unrealized gain (loss) are disclosed separately.
Investment Transactions and Income. Security transactions are accounted for as of trade date. Gains and losses on securities sold are determined on the basis of identified cost and may include proceeds received from litigation. Dividend income is recorded on the ex-dividend date, except for certain dividends from foreign securities where the ex-dividend date may have passed, which are recorded as soon as the fund is informed of the ex-dividend date. Non-cash dividends included in dividend income, if any, are recorded at the fair market value of the securities received. Interest income is accrued as earned. Interest income includes coupon interest and amortization of premium and accretion of discount on debt securities. Investment income is recorded net of foreign taxes withheld where recovery of such taxes is uncertain.
Expenses. Most expenses of the trust can be directly attributed to a fund. Expenses which cannot be directly attributed are apportioned among each fund in the trust.
Income Tax Information and Distributions to Shareholders. Each year, the fund intends to qualify as a regulated investment company by distributing all of its taxable income and realized gains under Subchapter M of the Internal Revenue Code. As a result, no provision for income taxes is required in the accompanying financial statements. Foreign taxes are provided for based on the fund’s understanding of the tax rules and rates that exist in the foreign markets in which it invests.
Distributions are recorded on the ex-dividend date. Income dividends and capital gain distributions are declared separately for each class. Income and capital gain distributions are determined in accordance with income tax regulations, which may differ from generally accepted accounting principles. In addition, the fund will claim a portion of the payment made to redeeming shareholders as a distribution for income tax purposes. Capital accounts within the financial statements are adjusted for permanent book-tax differences. These adjustments have no impact on net assets or the results of operations. Temporary book-tax differences will reverse in a subsequent period.
1. Significant Accounting Policies - continued
Income Tax Information and Distributions to Shareholders - continued
|
Book-tax differences are primarily due to foreign currency transactions, passive foreign investment companies (PFIC), capital loss carryforwards and losses deferred due to wash sales.
The tax-basis components of distributable earnings and the federal tax cost as of period end were as follows:
| Unrealized appreciation | | $ 161,536,802 | | | | |
| Unrealized depreciation | | | | (4,781,166) | | | | |
| Net unrealized appreciation (depreciation) | | 156,755,636 | | | | |
| Undistributed ordinary income | | 14,986,118 | | | | |
| Undistributed long-term capital gain | | 38,055,302 | | | | |
| |
| Cost for federal income tax purposes | | $ 412,969,754 | | | | |
| |
| The tax character of distributions paid was as follows: | | | | | | | | |
| | | July 31, 2005 | | | | July 31, 2004 |
| Ordinary Income | | $ | | 316,454 | | $ | | 681,969 |
| Long-term Capital Gains | | | | 5,002,969 | | | | — |
| Total | | $ | | 5,319,423 | | $ | | 681,969 |
Short-Term Trading (Redemption) Fees. Shares held in the fund less than 60 days are subject to a redemption fee equal to 1.00% of the proceeds of the redeemed shares. All redemption fees, including any estimated redemption fees paid by Fidelity Management & Research Company (FMR), are retained by the fund and accounted for as an addition to paid in capital.
Repurchase Agreements. FMR has received an Exemptive Order from the Securities and Exchange Commission (the SEC) which permits the fund and other affiliated entities of FMR to transfer uninvested cash balances into joint trading accounts which are then invested in repurchase agreements. The fund may also invest directly with institutions in repurchase agreements. Repurchase agreements are collateralized by government or non-government securities. Collateral is held in segregated accounts with custodian banks and may be obtained in the event of a default of the counterparty. The fund monitors, on a daily basis, the value of the collateral to ensure it is at least equal to the principal amount of the repurchase agreement (including accrued interest). In the event of a default by the counterparty, realization of the collateral proceeds could be delayed, during which time the value of the collateral may decline.
3. Purchases and Sales of Investments.
|
Purchases and sales of securities, other than short-term securities and U.S. government securities, aggregated $581,829,842 and $530,005,208, respec tively. The fund realized a loss on the sale of an investment not meeting the investment restrictions of the fund. The loss was fully reimbursed by the fund’s investment advisor.
4. Fees and Other Transactions with Affiliates.
|
Management Fee. FMR and its affiliates provide the fund with investment management related services for which the fund pays a monthly manage ment fee. The management fee is the sum of an individual fund fee rate that is based on an annual rate of .30% of the fund’s average net assets and a group fee rate that averaged .27% during the period. The group fee rate is based upon the average net assets of all the mutual funds advised by FMR. The group fee rate decreases as assets under management increase and increases as assets under management decrease. For the period, the total annual management fee rate was ..57% of the fund’s average net assets.
Notes to Financial Statements - continued
4. Fees and Other Transactions with Affiliates - continued
Distribution and Service Plan. In accordance with Rule 12b-1 of the 1940 Act, the fund has adopted separate Distribution and Service Plans for each class of shares. Certain classes pay Fidelity Distributors Corporation (FDC), an affiliate of FMR, separate Distribution and Service Fees, each of which is based on an annual percentage of each class’ average net assets. In addition, FDC may pay financial intermediaries for selling shares of the fund and providing shareholder support services. For the period, the Distribution and Service Fee rates and the total amounts paid to and retained by FDC were as follows:
| | | Distribution | | Service | | | | Paid to | | | | Retained |
| | | Fee | | Fee | | | | FDC | | | | by FDC |
| Class A | | 0% | | .25% | | $ | | 153,254 | | $ | | 165 |
| Class T | | 25% | | .25% | | | | 1,158,870 | | | | 14,728 |
| Class B | | 75% | | .25% | | | | 808,847 | | | | 606,708 |
| Class C | | 75% | | .25% | | | | 512,692 | | | | 148,221 |
| |
| | | | | | | $ | | 2,633,663 | | $ | | 769,822 |
Sales Load. FDC receives a front-end sales charge of up to 5.75% for selling Class A shares, and 3.50% for selling Class T shares, some of which is paid to financial intermediaries for selling shares of the fund. FDC receives the proceeds of contingent deferred sales charges levied on Class A, Class T, Class B, and Class C redemptions. These charges depend on the holding period. The deferred sales charges range from 5% to 1% for Class B, 1% for Class C, and .25% for certain purchases of Class A and Class T shares.
| For the period, sales charge amounts retained by FDC were as follows: | | | | |
| |
| | | | | Retained |
| | | | | by FDC |
| Class A | | $ | | 119,277 |
| Class T | | | | 54,948 |
| Class B* | | | | 176,691 |
| Class C* | | | | 10,805 |
| | | $ | | 361,721 |
* When Class B and Class C shares are initially sold, FDC pays commissions from its own resources to financial intermediaries through which the sales are made.
Transfer Agent Fees. Fidelity Investments Institutional Operations Company, Inc. (FIIOC), an affiliate of FMR, is the transfer, dividend disbursing and shareholder servicing agent for each class of the fund. FIIOC receives account fees and asset-based fees that vary according to the account size and type of account of the shareholders of the respective classes of the fund. FIIOC pays for typesetting, printing and mailing of shareholder reports, except proxy statements. For the period the total transfer agent fees paid by each class to FIIOC, were as follows:
| | | | | | | % of |
| | | | | | | Average |
| | | | | Amount | | Net Assets |
| Class A | | $ | | 207,874 | | .34 |
| Class T | | | | 655,816 | | .28 |
| Class B | | | | 262,058 | | .32 |
| Class C | | | | 146,762 | | .29 |
| Institutional Class | | | | 15,495 | | .24 |
| |
| | | $ | | 1,288,005 | | |
Accounting and Security Lending Fees. Fidelity Service Company, Inc. (FSC), an affiliate of FMR, maintains the fund’s accounting records. The accounting fee is based on the level of average net assets for the month. Under a separate contract, FSC administers the security lending program. The security lending fee is based on the number and duration of lending transactions.
Central Funds. The fund may invest in affiliated Central Funds managed by Fidelity Investments Money Management, Inc. (FIMM), an affiliate of FMR. The Central Funds are open-end investment companies available only to investment companies and other accounts managed by FMR and its affiliates. The Money Market Central Funds seek preservation of capital and current income. The Central Funds do not pay a management fee. Income distributions earned by the fund are recorded as income in the accompanying financial statements and totaled $326,287 for the period.
Brokerage Commissions. The fund placed a portion of its portfolio transactions with brokerage firms which are affiliates of the investment adviser. The commissions paid to these affiliated firms were $26,202 for the period.
4. Fees and Other Transactions with Affiliates - continued
Interfund Lending Program. Pursuant to an Exemptive Order issued by the SEC, the fund, along with other registered investment companies having management contracts with FMR, may participate in an interfund lending program. This program provides an alternative credit facility allowing the funds to borrow from, or lend money to, other participating affiliated funds. At period end, there were no interfund loans outstanding. The fund’s activity in this program during the period for which loans were outstanding was as follows:
| | | | | | | Interest Earned | | | | |
| | | Average Daily Loan | | Weighted Average | | (included in | | | | |
| Borrower or Lender | | Balance | | Interest Rate | | interest income) | | | | Interest Expense |
| Borrower | | $ 1,718,800 | | 2.40% | | — | | $ | | 572 |
5. Committed Line of Credit.
The fund participates with other funds managed by FMR in a $4.2 billion credit facility (the “line of credit”) to be utilized for temporary or emergency purposes to fund shareholder redemptions or for other short-term liquidity purposes. The fund has agreed to pay commitment fees on its pro rata portion of the line of credit. During the period, there were no borrowings on this line of credit.
The fund lends portfolio securities from time to time in order to earn additional income. The fund receives collateral (in the form of U.S. Treasury obligations, letters of credit and/or cash) against the loaned securities and maintains collateral in an amount not less than 100% of the market value of the loaned securities during the period of the loan. The market value of the loaned securities is determined at the close of business of the fund and any additional required collateral is delivered to the fund on the next business day. If the borrower defaults on its obligation to return the securities loaned because of insolvency or other reasons, a fund could experience delays and costs in recovering the securities loaned or in gaining access to the collateral. Cash collateral is invested in the Fidelity Securities Lending Cash Central Fund. The value of loaned securities and cash collateral at period end are disclosed on the fund’s Statement of Assets and Liabilities.
Many of the brokers with whom FMR places trades on behalf of the fund provided services to the fund in addition to trade execution. These services included payments of certain expenses on behalf of the fund totaling $224,498 for the period. In addition, through arrangements with the fund’s custodian, credits realized as a result of uninvested cash balances were used to reduce the fund’s expenses. During the period, these credits reduced the fund’s custody expenses by $372.
The fund’s organizational documents provide former and current trustees and officers with a limited indemnification against liabilities arising in connection with the performance of their duties to the fund. In the normal course of business, the fund may also enter into contracts that provide general indemnifications. The fund’s maximum exposure under these arrangements is unknown as this would be dependent on future claims that may be made against the fund. The risk of material loss from such claims is considered remote.
9. Distributions to Shareholders.
Distributions to shareholders of each class were as follows:
| Years ended July 31, | | 2005 | | | | 2004 |
| From net investment income | | | | | | |
| Class A | | $ 99,736 | | $ | | 99,224 |
| Class T | | 195,831 | | | | 560,230 |
| Institutional Class | | 20,887 | | | | 22,515 |
| Total | | $ 316,454 | | $ | | 681,969 |
| From net realized gain | | | | | | |
| Class A | | $ 681,527 | | $ | | — |
| Class T | | 2,676,352 | | | | — |
| Class B | | 974,727 | | | | — |
| Class C | | 592,512 | | | | — |
| Institutional Class | | 77,851 | | | | — |
| Total | | $ 5,002,969 | | $ | | — |
Notes to Financial Statements - continued
10. Share Transactions.
Transactions for each class of shares were as follows:
| | | | | Shares | | | | Dollars |
| Years ended July 31, | | 2005 | | 2004 | | 2005 | | | | 2004 |
| Class A | | | | | | | | | | |
| Shares sold | | 1,253,753 | | 879,939 | | $ 43,103,050 | | $ 23,517,820 |
| Reinvestment of distributions | | 23,046 | | 3,715 | | 714,182 | | | | 87,332 |
| Shares redeemed | | (591,542) | | (368,575) | | (19,723,914) | | | | (9,483,597) |
| Net increase (decrease) | | 685,257 | | 515,079 | | $ 24,093,318 | | $ 14,121,555 |
| Class T | | | | | | | | | | |
| Shares sold | | 1,803,813 | | 1,119,622 | | $ 62,397,322 | | $ 29,514,297 |
| Reinvestment of distributions | | 85,233 | | 22,018 | | 2,678,882 | | | | 522,475 |
| Shares redeemed | | (1,932,106) | | (1,393,256) | | (66,301,961) | | (36,120,583) |
| Net increase (decrease) | | (43,060) | | (251,616) | | $ (1,225,757) | | $ (6,083,811) |
| Class B | | | | | | | | | | |
| Shares sold | | 949,870 | | 634,362 | | $ 31,871,038 | | $ 16,119,361 |
| Reinvestment of distributions | | 27,043 | | — | | 820,469 | | | | — |
| Shares redeemed | | (814,770) | | (627,931) | | (26,808,279) | | (16,075,114) |
| Net increase (decrease) | | 162,143 | | 6,431 | | $ 5,883,228 | | $ | | 44,247 |
| Class C | | | | | | | | | | |
| Shares sold | | 999,959 | | 581,963 | | $ 33,826,711 | | $ 15,409,819 |
| Reinvestment of distributions | | 15,581 | | — | | 475,225 | | | | — |
| Shares redeemed | | (496,487) | | (315,706) | | (16,702,359) | | | | (7,916,650) |
| Net increase (decrease) | | 519,053 | | 266,257�� | | $ 17,599,577 | | $ | | 7,493,169 |
| Institutional Class | | | | | | | | | | |
| Shares sold | | 134,272 | | 62,791 | | $ 4,562,121 | | $ | | 1,688,343 |
| Reinvestment of distributions | | 2,107 | | 613 | | 66,476 | | | | 14,771 |
| Shares redeemed | | (52,414) | | (41,908) | | (1,778,573) | | | | (1,080,767) |
| Net increase (decrease) | | 83,965 | | 21,496 | | $ 2,850,024 | | $ | | 622,347 |
Average annual total return reflects the change in the value of an investment, assuming reinvestment of the class’ dividend income and capital gains (the profits earned upon the sale of securities that have grown in value) and assuming a constant rate of performance each year. The $10,000 table and the fund’s returns do not reflect the deduction of taxes that a shareholder would pay on fund distributions or the redemption of fund shares. During periods of reimbursement by Fidelity, a fund’s total return will be greater than it would be had the reimbursement not occurred. How a fund did yesterday is no guarantee of how it will do tomorrow. Returns may reflect the conversion of Class B shares to Class A shares after a maximum of seven years.
| Average Annual Total Returns | | | | |
| Periods ended July 31, 2005 | | Past 1 | | Past 5 | | Life of |
| | | year | | years | | fundA |
| Class A (incl. 5.75% sales charge) | | 9.51% | | --15.10% | | 7.49% |
| Class T (incl. 3.50% sales charge) | | 11.88% | | --14.89% | | 7.51% |
| Class B (incl. contingent deferred | | | | | | |
| sales charge)B | | 10.33% | | --15.07% | | 7.52% |
| Class C (incl. contingent deferred | | | | | | |
| sales charge)C | | 14.34% | | --14.69% | | 7.42% |
A From September 3, 1996.
B Class B shares bear a 1.00% 12b-1 fee. The initial offering of Class B shares took place
|
on March 3, 1997. Returns prior to March 3, 1997 are those of Class T and reflect a 0.50%
12b-1 fee. Had Class B shares’ 12b-1 fee been reflected, returns prior to March 3, 1997
would have been lower. Class B shares’ contingent deferred sales charges included in the
past one year, five year, and life of fund total return figures are 5%, 2% and 0%,
respectively.
C Class C shares bear a 1.00% 12b-1 fee. The initial offering of Class C shares took place
on November 3, 1997. Returns between March 3, 1997 and November 3, 1997 are those of
Class B shares and reflect Class B shares’ 1.00% 12b-1 fee. Returns prior to March 3, 1997
are those of Class T and reflect a 0.50% 12b-1 fee. Had Class C shares’ 12b-1 fee been
reflected, returns prior to March 3, 1997 would have been lower. Class C shares’ contin-
gent deferred sales charges included in the past one year, five year, and life of fund total
return figures are 1%, 0% and 0%, respectively.
|
| | $10,000 Over Life of Fund
|
Let’s say hypothetically that $10,000 was invested in Fidelity Advisor Technology Fund — Class T on September 3, 1996, when the fund started, and the current 3.50% sales charge was paid. The chart shows how the value of your investment would have changed, and also shows how the S&P 500 Index performed over the same period.
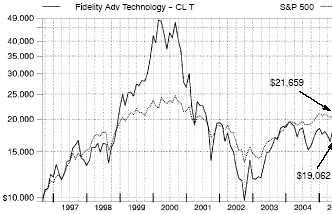
A-125 Annual Report
A-125
Management’s Discussion of Fund Performance
Comments from Charlie Chai, Portfolio Manager of Fidelity® Advisor Technology Fund
A late-inning rally on Wall Street helped push some key U.S. equity indexes to four-year highs by the conclusion of the 12-month period ending July 31, 2005. Spurred on by bullish economic data and strong corporate earnings, investors enjoyed a stellar month of July, capping off a turbulent 12-month period for U.S. equity markets. Stock prices bounced up and down during most of the year, moving in cadence with gyrations in the price of crude oil and investors’ gathering and ebbing concerns about inflation. The Federal Reserve Board raised short-term interest rates eight times during the period, also affecting overall market sentiment. Despite their fluctuations, the major equity indexes finished on a high note, with the Standard & Poor’s 500SM Index and the NASDAQ Composite® Index posting gains of 14.05% and 16.51%, respectively, for the period. The small-cap Russell 2000® Index rose 24.78% and the Russell Midcap® Index jumped 28.93%, while the blue-chips’ Dow Jones Industrial AverageSM advanced only 7.29% .
For the 12 months ending July 31, 2005, the fund’s Class A, Class T, Class B and Class C shares returned 16.20%, 15.94%, 15.33% and 15.34%, respectively, beating the 11.63% gain of the Goldman Sachs® Technology Index. The fund also bested the S&P 500®. My stock selection in computer hardware, Internet portals/content, and computer storage and peripherals was particularly helpful to performance. Internet search engine provider Google was the top contributor in absolute terms and relative to the sector index, as analysts kept raising their earnings estimates for the company. In the case of Apple Computer, investors were attracted primarily by the continued strong sales of the company’s iPod portable digital music player. EMC also provided a nice boost to both absolute and relative returns. Holding back the fund’s performance to some extent was unfavorable stock selection in communications equipment, where the fund’s position in Avaya hurt both absolute and relative performance. The purveyor of VoIP (Voice over Internet Protocol) infrastructure equipment experienced difficulties in executing a recent sales reorganization and badly missed earnings targets for its fiscal second quarter ending March 31, 2005. Semiconductor maker Integrated Circuit Systems also hurt performance by both absolute and relative measures. Weak demand in the company’s digital consumer electronics and communications business hampered its financial results.
The views expressed in this statement reflect those of the portfolio manager only through the end of the period of the report as stated on the cover and do not necessarily represent the views of Fidelity or any other person in the Fidelity organization. Any such views are subject to change at any time based upon market or other conditions and Fidelity disclaims any responsibility to update such views. These views may not be relied on as investment advice and, because investment decisions for a Fidelity fund are based on numerous factors, may not be relied on as an indication of trading intent on behalf of any Fidelity fund.
| | Shareholder Expense Example
|
As a shareholder of the Fund, you incur two types of costs: (1) transaction costs, including sales charges (loads) on purchase payments or redemption proceeds, redemption fees, and (2) ongoing costs, including management fees, distribution and/or service (12b-1) fees and other Fund expenses. This Example is intended to help you understand your ongoing costs (in dollars) of investing in the Fund and to compare these costs with the ongoing costs of investing in other mutual funds.
The Example is based on an investment of $1,000 invested at the beginning of the period and held for the entire period (February 1, 2005 to July 31, 2005).
The first line of the table below for each class of the Fund provides information about actual account values and actual expenses. You may use the information in this line, together with the amount you invested, to estimate the expenses that you paid over the period. Simply divide your account value by $1,000.00 (for example, an $8,600 account value divided by $1,000.00 = 8.6), then multiply the result by the number in the first line for a class of the Fund under the heading entitled “Expenses Paid During Period” to estimate the expenses you paid on your account during this period.
| | Hypothetical Example for Comparison Purposes
|
The second line of the table below for each class of the Fund provides information about hypothetical account values and hypothetical expenses based on a Class’ actual expense ratio and an assumed rate of return of 5% per year before expenses, which is not the Class’ actual return. The hypothetical account values and expenses may not be used to estimate the actual ending account balance or expenses you paid for the period. You may use this information to compare the ongoing costs of investing in the Fund and other funds. To do so, compare this 5% hypothetical example with the 5% hypothetical examples that appear in the shareholder reports of the other funds.
Please note that the expenses shown in the table are meant to highlight your ongoing costs only and do not reflect any transaction costs. Therefore, the second line of the table is useful in comparing ongoing costs only, and will not help you determine the relative total costs of owning different funds. In addition, if these transactional costs were included, your costs would have been higher.
| | | | | | | | | | | Expenses Paid |
| | | Beginning | | | | Ending | | | | During Period* |
| | | Account Value | | | | Account Value | | | | February 1, 2005 |
| | | February 1, 2005 | | | | July 31, 2005 | | | | to July 31, 2005 |
| Class A | | | | | | | | | | |
| Actual | | $ 1,000.00 | | $ | | 1,089.70 | | $ | | 6.84 |
| HypotheticalA | | $ 1,000.00 | | $ | | 1,018.25 | | $ | | 6.61 |
| Class T | | | | | | | | | | |
| Actual | | $ 1,000.00 | | $ | | 1,088.40 | | $ | | 8.18 |
| HypotheticalA | | $ 1,000.00 | | $ | | 1,016.96 | | $ | | 7.90 |
| Class B | | | | | | | | | | |
| Actual | | $ 1,000.00 | | $ | | 1,086.20 | | $ | | 10.66 |
| HypotheticalA | | $ 1,000.00 | | $ | | 1,014.58 | | $ | | 10.29 |
| Class C | | | | | | | | | | |
| Actual | | $ 1,000.00 | | $ | | 1,085.80 | | $ | | 10.71 |
| HypotheticalA | | $ 1,000.00 | | $ | | 1,014.53 | | $ | | 10.34 |
| Institutional Class | | | | | | | | | | |
| Actual | | $ 1,000.00 | | $ | | 1,092.80 | | $ | | 4.83 |
| HypotheticalA | | $ 1,000.00 | | $ | | 1,020.18 | | $ | | 4.66 |
A 5% return per year before expenses
* Expenses are equal to each Class’ annualized expense ratio (shown in the table below); multiplied by the average account value over the
period, multiplied by 181/365 (to reflect the one-half year period).
|
| | | Annualized |
| | | Expense Ratio |
| Class A | | 1.32% |
| Class T | | 1.58% |
| Class B | | 2.06% |
| Class C | | 2.07% |
| Institutional Class | | 93% |
Advisor Technology Fund
Investment Changes
|
| Top Ten Stocks as of July 31, 2005 | | |
| | | % of fund’s | | % of fund’s net assets |
| | | net assets | | 6 months ago |
| Juniper Networks, Inc. | | 7.1 | | 3.1 |
| Research In Motion Ltd. | | 6.8 | | 1.4 |
| QUALCOMM, Inc. | | 6.6 | | 4.3 |
| Nokia Corp. sponsored ADR | | 6.3 | | 1.9 |
| EMC Corp. | | 4.7 | | 3.9 |
| eBay, Inc. | | 3.0 | | 1.2 |
| Google, Inc. Class A (sub. vtg.) | | 2.9 | | 1.6 |
| Microsoft Corp. | | 2.7 | | 1.5 |
| Apple Computer, Inc. | | 2.4 | | 3.0 |
| AU Optronics Corp. sponsored | | | | |
| ADR | | 2.0 | | 0.5 |
| | | 44.5 | | |
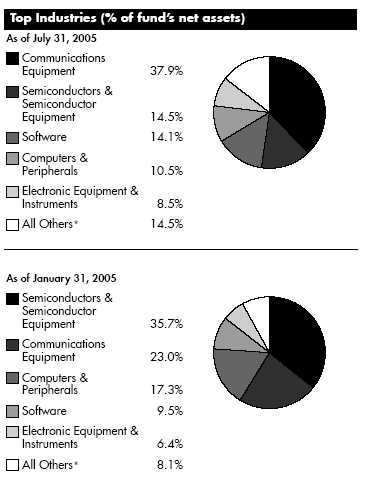
| | * Includes short term investments and net other assets.
Prior period industry classifications reflect the categories in place as of the date
indicated and have not been adjusted to reflect current industry classifications.
|
Technology A-128
Advisor Technology Fund
Investments July 31, 2005
Showing Percentage of Net Assets
| Common Stocks — 98.9% | | | | |
| | | Shares | | Value (Note 1) |
| |
| COMMUNICATIONS EQUIPMENT – 37.9% | | | | |
| Communications Equipment – 37.9% | | | | |
| ADC Telecommunications, Inc. (a) | | 159,614 | | $ 4,172,310 |
| Andrew Corp. (a) | | 562,500 | | 6,181,875 |
| AudioCodes Ltd. (a) | | 1,055,300 | | 9,592,677 |
| Avaya, Inc. (a) | | 506,100 | | 5,228,013 |
| Carrier Access Corp. (a) | | 161,100 | | 853,830 |
| CIENA Corp. (a) | | 3,157,200 | | 7,072,128 |
| Comverse Technology, Inc. (a) | | 264,300 | | 6,684,147 |
| Corning, Inc. (a) | | 606,500 | | 11,553,825 |
| Extreme Networks, Inc. (a) | | 155,000 | | 740,900 |
| F5 Networks, Inc. (a) | | 398,800 | | 16,821,384 |
| Foxconn International Holdings Ltd. | | 130,000 | | 107,029 |
| Harris Corp. | | 3,200 | | 118,624 |
| ITF Optical Technologies, Inc. Series A (e) | | 34,084 | | 0 |
| Ixia (a) | | 202,900 | | 4,005,246 |
| Juniper Networks, Inc. (a) | | 2,626,846 | | 63,018,035 |
| Motorola, Inc. | | 638,300 | | 13,519,194 |
| MRV Communications, Inc. (a) | | 584,600 | | 1,245,198 |
| NMS Communications Corp. (a) | | 151,180 | | 509,477 |
| Nokia Corp. sponsored ADR | | 3,516,200 | | 56,083,390 |
| OZ Optics Ltd. unit (a)(e) | | 68,000 | | 1,003,000 |
| Powerwave Technologies, Inc. (a) | | 335,300 | | 3,845,891 |
| QUALCOMM, Inc. | | 1,483,700 | | 58,591,313 |
| Redback Networks, Inc. (a) | | 177,818 | | 1,474,111 |
| Research In Motion Ltd. (a) | | 856,700 | | 60,581,603 |
| Sonus Networks, Inc. (a) | | 887,500 | | 4,295,500 |
| | | | | 337,298,700 |
| |
| COMPUTERS & PERIPHERALS – 10.5% | | | | |
| Computer Hardware – 2.9% | | | | |
| Apple Computer, Inc. (a) | | 495,500 | | 21,133,075 |
| Avid Technology, Inc. (a) | | 110,700 | | 4,555,305 |
| Palm, Inc. (a) | | 14,600 | | 416,684 |
| | | | | 26,105,064 |
| Computer Storage & Peripherals – 7.6% | | | | |
| Advanced Digital Information Corp. (a) . | | 228,000 | | 1,819,440 |
| Brocade Communications Systems, | | | | |
| Inc. (a) | | 4,200 | | 18,816 |
| EMC Corp. (a) | | 3,028,172 | | 41,455,675 |
| McDATA Corp. Class A (a) | | 365,900 | | 1,770,956 |
| Network Appliance, Inc. (a) | | 474,900 | | 12,114,699 |
| SanDisk Corp. (a) | | 268,200 | | 9,070,524 |
| Synaptics, Inc. (a) | | 85,500 | | 1,355,175 |
| | | | | 67,605,285 |
| |
| TOTAL COMPUTERS & PERIPHERALS | | | | 93,710,349 |
| |
| ELECTRICAL EQUIPMENT – 0.6% | | | | |
| Electrical Components & Equipment – 0.6% | | | | |
| Evergreen Solar, Inc. (a)(d) | | 738,800 | | 5,208,540 |
| | | Shares | | Value (Note 1) |
| |
| ELECTRONIC EQUIPMENT & INSTRUMENTS – 8.5% | | |
| Electronic Equipment & Instruments – 5.5% | | | | |
| Aeroflex, Inc. (a) | | 123,300 | | $ 1,193,544 |
| Agilent Technologies, Inc. (a) | | 183,000 | | 4,801,920 |
| Applied Films Corp. (a) | | 99,100 | | 2,603,357 |
| AU Optronics Corp.: | | | | |
| ADR (a) | | 91,600 | | 1,452,776 |
| sponsored ADR (d) | | 1,144,064 | | 18,144,855 |
| LG.Philips LCD Co. Ltd. sponsored ADR . | | 85,100 | | 1,959,002 |
| Photon Dynamics, Inc. (a) | | 705,400 | | 13,356,749 |
| Samsung SDI Co. Ltd. | | 22,100 | | 2,202,874 |
| Vishay Intertechnology, Inc. (a) | | 244,200 | | 3,423,684 |
| | | | | 49,138,761 |
| Electronic Manufacturing Services – 1.7% | | | | |
| Hon Hai Precision Industries Co. Ltd. | | 1,252,713 | | 7,035,947 |
| KEMET Corp. (a) | | 336,700 | | 2,821,546 |
| Molex, Inc. | | 81,600 | | 2,304,384 |
| TTM Technologies, Inc. (a) | | 204,900 | | 1,452,741 |
| Xyratex Ltd. (a) | | 93,027 | | 1,558,202 |
| | | | | 15,172,820 |
| Technology Distributors – 1.3% | | | | |
| Arrow Electronics, Inc. (a) | | 145,100 | | 4,355,902 |
| Avnet, Inc. (a) | | 173,400 | | 4,539,612 |
| Ingram Micro, Inc. Class A (a) | | 112,400 | | 2,095,136 |
| | | | | 10,990,650 |
| |
| TOTAL ELECTRONIC EQUIPMENT & INSTRUMENTS | | 75,302,231 |
| |
| HOUSEHOLD DURABLES – 0.2% | | | | |
| Consumer Electronics – 0.2% | | | | |
| ReignCom Ltd. | | 24,592 | | 370,094 |
| Thomson SA | | 68,900 | | 1,562,221 |
| | | | | 1,932,315 |
| |
| INTERNET & CATALOG RETAIL – 3.3% | | | | |
| Internet Retail – 3.3% | | | | |
| eBay, Inc. (a) | | 647,200 | | 27,040,016 |
| Overstock.com, Inc. (a)(d) | | 49,100 | | 2,125,539 |
| | | | | 29,165,555 |
| |
| INTERNET SOFTWARE & SERVICES – 7.1% | | | | |
| Internet Software & Services – 7.1% | | | | |
| Akamai Technologies, Inc. (a) | | 155,700 | | 2,377,539 |
| AsiaInfo Holdings, Inc. (a) | | 120,000 | | 655,200 |
| Google, Inc. Class A (sub. vtg.) | | 88,700 | | 25,524,312 |
| Marchex, Inc. Class B (a)(d) | | 300,700 | | 4,940,501 |
| Openwave Systems, Inc. (a) | | 661,166 | | 12,264,629 |
| VeriSign, Inc. (a) | | 157,400 | | 4,141,194 |
| Yahoo!, Inc. (a) | | 405,660 | | 13,524,704 |
| | | | | 63,428,079 |
See accompanying notes which are an integral part of the financial statements.
A-129 Annual Report
Advisor Technology Fund Investments - continued
| Common Stocks – continued | | | | | | |
| | | Shares | | Value (Note 1) |
| |
| IT SERVICES – 1.8% | | | | | | |
| Data Processing & Outsourced Services – 1.0% | | | | |
| Affiliated Computer Services, Inc. | | | | | | |
| Class A (a) | | 66,500 | | $ | | 3,323,005 |
| Paychex, Inc. | | 156,700 | | | | 5,470,397 |
| | | | | | | 8,793,402 |
| IT Consulting & Other Services – 0.8% | | | | | | |
| Accenture Ltd. Class A (a) | | 189,900 | | | | 4,755,096 |
| Kanbay International, Inc. | | 116,000 | | | | 2,570,560 |
| | | | | | | 7,325,656 |
| |
| TOTAL IT SERVICES | | | | | | 16,119,058 |
| |
| OFFICE ELECTRONICS – 0.2% | | | | | | |
| Office Electronics – 0.2% | | | | | | |
| Zebra Technologies Corp. Class A (a) | | 49,700 | | | | 1,938,300 |
| SEMICONDUCTORS & SEMICONDUCTOR EQUIPMENT – 14.5% | | |
| Semiconductor Equipment – 2.8% | | | | | | |
| Amkor Technology, Inc. (a) | | 564,700 | | | | 2,631,502 |
| ASE Test Ltd. (a) | | 804,900 | | | | 5,594,055 |
| ASML Holding NV (NY Shares) (a) | | 190,300 | | | | 3,349,280 |
| ATMI, Inc. (a) | | 87,300 | | | | 2,778,759 |
| Axcelis Technologies, Inc. (a) | | 94,600 | | | | 653,686 |
| Credence Systems Corp. (a) | | 274,300 | | | | 2,987,127 |
| Lam Research Corp. (a) | | 30,200 | | | | 859,190 |
| Teradyne, Inc. (a) | | 324,900 | | | | 5,045,697 |
| Varian Semiconductor Equipment | | | | | | |
| Associates, Inc. (a) | | 23,700 | | | | 984,024 |
| | | | | | | 24,883,320 |
| Semiconductors – 11.7% | | | | | | |
| Altera Corp. (a) | | 298,200 | | | | 6,521,634 |
| Analog Devices, Inc. | | 109,700 | | | | 4,300,240 |
| Applied Micro Circuits Corp. (a) | | 1,576,800 | | | | 4,746,168 |
| ATI Technologies, Inc. (a) | | 406,400 | | | | 5,118,380 |
| Atmel Corp. (a) | | 648,794 | | | | 1,518,178 |
| Cambridge Display Technologies, Inc. | | 61,700 | | | | 510,876 |
| Cypress Semiconductor Corp. (a) | | 323,000 | | | | 4,638,280 |
| Exar Corp. (a) | | 61,000 | | | | 971,425 |
| Fairchild Semiconductor International, | | | | | | |
| Inc. (a) | | 271,800 | | | | 4,582,548 |
| Freescale Semiconductor, Inc.: | | | | | | |
| Class A | | 205,100 | | | | 5,234,152 |
| Class B | | 87,180 | | | | 2,244,885 |
| Intel Corp. | | 73,100 | | | | 1,983,934 |
| Intersil Corp. Class A | | 237,100 | | | | 4,592,627 |
| Linear Technology Corp. | | 164,600 | | | | 6,396,356 |
| Marvell Technology Group Ltd. (a) | | 92,200 | | | | 4,028,218 |
| Maxim Integrated Products, Inc. | | 155,400 | | | | 6,506,598 |
| Microchip Technology, Inc. | | 56,500 | | | | 1,755,455 |
| Micron Technology, Inc. (a) | | 76,600 | | | | 910,008 |
| Mindspeed Technologies, Inc. (a) | | 2,272,400 | | | | 3,249,532 |
| National Semiconductor Corp. | | 249,100 | | | | 6,155,261 |
| | | Shares | | Value (Note 1) |
| O2Micro International Ltd. (a) | | 115,200 | | $ 1,976,832 |
| ON Semiconductor Corp. (a) | | 320,300 | | 1,841,725 |
| Semiconductor Manufacturing | | | | |
| International Corp. | | | | |
| sponsored ADR (a)(d) | | 126,600 | | 1,354,620 |
| Silicon Image, Inc. (a) | | 40,600 | | 479,892 |
| Siliconware Precision Industries Co. Ltd. | | | | |
| sponsored ADR (d) | | 270,067 | | 1,407,049 |
| STATS ChipPAC Ltd. sponsored | | | | |
| ADR (a)(d) | | 1,178,300 | | 8,071,355 |
| Trident Microsystems, Inc. (a) | | 146,800 | | 4,791,552 |
| Vitesse Semiconductor Corp. (a) | | 974,600 | | 2,163,612 |
| Zoran Corp. (a) | | 386,477 | | 5,565,269 |
| | | | | 103,616,661 |
| |
| TOTAL SEMICONDUCTORS & SEMICONDUCTOR | | |
| EQUIPMENT | | | | 128,499,981 |
| |
| SOFTWARE – 14.1% | | | | |
| Application Software – 5.6% | | | | |
| Citrix Systems, Inc. (a) | | 284,300 | | 6,774,869 |
| Cognos, Inc. (a) | | 25,200 | | 981,778 |
| FileNET Corp. (a) | | 33,800 | | 955,526 |
| Hyperion Solutions Corp. (a) | | 61,200 | | 2,880,072 |
| JAMDAT Mobile, Inc. (d) | | 113,100 | | 3,236,922 |
| Kronos, Inc. (a) | | 22,100 | | 1,038,700 |
| Mercury Interactive Corp. (a) | | 101,300 | | 3,988,181 |
| Monterey Design Systems (a)(e) | | 34,200 | | 0 |
| Quest Software, Inc. (a) | | 501,700 | | 7,149,225 |
| Salesforce.com, Inc. (a) | | 102,900 | | 2,423,295 |
| Siebel Systems, Inc. | | 372,200 | | 3,126,480 |
| TIBCO Software, Inc. (a) | | 263,400 | | 2,025,546 |
| Ulticom, Inc. (a) | | 1,218,798 | | 14,930,276 |
| | | | | 49,510,870 |
| Home Entertainment Software – 1.1% | | | | |
| Activision, Inc. (a) | | 98,200 | | 1,997,388 |
| Take-Two Interactive Software, Inc. (a) | | 104,600 | | 2,574,206 |
| THQ, Inc. (a) | | 104,500 | | 3,655,410 |
| UBI Soft Entertainment SA (a)(d) | | 33,400 | | 1,853,166 |
| | | | | 10,080,170 |
| Systems Software – 7.4% | | | | |
| Adobe Systems, Inc. | | 154,700 | | 4,585,308 |
| Macrovision Corp. (a) | | 30,100 | | 657,083 |
| Microsoft Corp. | | 959,900 | | 24,583,039 |
| Oracle Corp. (a) | | 964,800 | | 13,101,984 |
| Red Hat, Inc. (a) | | 574,100 | | 8,749,284 |
| Symantec Corp. (a) | | 654,291 | | 14,374,773 |
| | | | | 66,051,471 |
| |
| TOTAL SOFTWARE | | | | 125,642,511 |
See accompanying notes which are an integral part of the financial statements.
Technology A-130
| Common Stocks – continued | | | | | | |
| | | | | Shares | | Value (Note 1) |
| WIRELESS TELECOMMUNICATION SERVICES – 0.2% | | |
| Wireless Telecommunication Services – 0.2% | | |
| Wireless Facilities, Inc. (a) | | | | 289,300 | | $ 1,863,092 |
| TOTAL COMMON STOCKS | | | | | | |
| (Cost $842,625,183) | | | | | | 880,108,711 |
| Convertible Preferred Stocks — 0.0% | | |
| |
| COMMUNICATIONS EQUIPMENT – 0.0% | | | | | | |
| Communications Equipment – 0.0% | | | | | | |
| Chorum Technologies, Inc. Series E (a)(e) | | 17,200 | | 0 |
| Procket Networks, Inc. Series C (a)(e) | | | | 276,000 | | 3 |
| TOTAL CONVERTIBLE PREFERRED STOCKS | | |
| (Cost $2,983,808) | | | | | | 3 |
| Money Market Funds — 3.6% | | | | |
| Fidelity Cash Central Fund, 3.31% (b) | | 4,341,769 | | 4,341,769 |
| Fidelity Securities Lending Cash | | | | | | |
| Central Fund, 3.32% (b)(c) | | 27,376,650 | | 27,376,650 |
| TOTAL MONEY MARKET FUNDS | | | | | | |
| (Cost $31,718,419) | | | | | | 31,718,419 |
| TOTAL INVESTMENT PORTFOLIO | | - 102.5% | | |
| (Cost $877,327,410) | | | | 911,827,133 |
| |
| NET OTHER ASSETS – (2.5)% | | | | | | (21,980,095) |
| NET ASSETS – 100% | | | | $ 889,847,038 |
Legend
(a) Non-income producing
(b) Affiliated fund that is available only to investment companies and other accounts managed by Fidelity Investments. The rate quoted is the annualized seven-day yield of the fund at period end. A complete listing of the fund’s holdings as of its most recent quarter end is available upon request.
(c) Investment made with cash collateral received from securities on loan. (d) Security or a portion of the security is on loan at period end.
(e) Restricted securities – Investment in securities not registered under the Securities Act of 1933 (excluding 144A issues). At the end of the period, the value of restricted securities (excluding 144A issues) amounted to $1,003,003 or 0.1% of net assets.
Additional information on each holding is as follows:
| Security | | Acquisition Date | | Acquisition Cost |
| Chorum Technologies, Inc. Series E | | 9/19/00 | | $ | | 296,528 |
| ITF Optical Technologies, Inc. Series A | | 10/11/00 | | $ | | 1,711,500 |
| Monterey Design Systems | | 11/1/00 | | $ | | 1,795,500 |
| OZ Optics Ltd. unit | | 8/18/00 | | $ | | 1,003,680 |
| | | 11/15/00 -- | | | | |
| Procket Networks, Inc. Series C | | 12/26/00 | | $ | | 2,725,776 |
Other Information
Distribution of investments by country of issue, as a percentage of total net assets, is as follows:
| United States of America | | 77.4% |
| Canada | | 7.6% |
| Finland | | 6.3% |
| Taiwan | | 3.8% |
| Bermuda | | 1.2% |
| Israel | | 1.1% |
| Others (individually less than 1%) | | 2.6% |
| | | 100.0% |
Income Tax Information
At July 31, 2005, the fund had a capital loss carryforward of approximately $1,678,030,880 of which $1,178,224,097 and $499,806,783 will expire on July 31, 2010 and 2011, respectively.
See accompanying notes which are an integral part of the financial statements.
A-131 Annual Report
Advisor Technology Fund
Financial Statements
| Statement of Assets and Liabilities | | |
| | | | | | | July 31, 2005 |
| Assets | | | | | | |
| Investment in securities, at value (in- | | | | |
| cluding securities loaned of | | | | | | |
| $26,248,878) (cost $877,327,410) | | | | |
| — See accompanying schedule | | | | $ | | 911,827,133 |
| Foreign currency held at value (cost | | | | | | |
| $5,367,455) | | | | | | 5,274,354 |
| Receivable for investments sold | | | | | | 21,741,742 |
| Receivable for fund shares sold | | | | | | 543,084 |
| Dividends receivable | | | | | | 298,737 |
| Interest receivable | | | | | | 52,681 |
| Prepaid expenses | | | | | | 1,626 |
| Other affiliated receivables | | | | | | 42 |
| Other receivables | | | | | | 733,699 |
| Total assets | | | | | | 940,473,098 |
| Liabilities | | | | | | |
| Payable for investments purchased | | $ | | 19,264,741 | | |
| Payable for fund shares redeemed | | | | 2,668,253 | | |
| Accrued management fee | | | | 422,831 | | |
| Distribution fees payable | | | | 508,421 | | |
| Other affiliated payables | | | | 344,941 | | |
| Other payables and accrued expenses | | 40,223 | | |
| Collateral on securities loaned, at value | | 27,376,650 | | |
| Total liabilities | | | | | | 50,626,060 |
| Net Assets | | | | $ | | 889,847,038 |
| Net Assets consist of: | | | | | | |
| Paid in capital | | | | $2,514,888,463 |
| Undistributed net investment income | | | | (658) |
| Accumulated undistributed net realized | | | | |
| gain (loss) on investments and for- | | | | |
| eign currency transactions | | | | (1,659,447,405) |
| Net unrealized appreciation (depreci- | | | | |
| ation) on investments and assets and | | | | |
| liabilities in foreign currencies | | | | | | 34,406,638 |
| Net Assets | | | | $ | | 889,847,038 |
| Calculation of Maximum Offering Price | | | | |
| Class A: | | | | | | |
| Net Asset Value and redemption price | | | | |
| per share ($144,969,918 ÷ | | | | | | |
| 8,971,067 shares) | | | | $ | | 16.16 |
| Maximum offering price per share | | | | | | |
| (100/94.25 of $16.16) | | | | $ | | 17.15 |
| Class T: | | | | | | |
| Net Asset Value and redemption price | | | | |
| per share ($315,929,739 ÷ | | | | | | |
| 19,896,633 shares) | | | | $ | | 15.88 |
| Maximum offering price per share | | | | | | |
| (100/96.50 of $15.88) | | | | $ | | 16.46 |
| Class B: | | | | | | |
| Net Asset Value and offering price | | | | |
| per share ($309,020,411 ÷ | | | | | | |
| 20,274,503 shares)A | | | | $ | | 15.24 |
| Class C: | | | | | | |
| Net Asset Value and offering price | | | | |
| per share ($108,287,424 ÷ | | | | | | |
| 7,073,073 shares)A | | | | $ | | 15.31 |
| Institutional Class: | | | | | | |
| Net Asset Value, offering price and | | | | |
| redemption price per share | | | | | | |
| ($11,639,546 ÷ 701,323 shares) | | $ | | 16.60 |
| A Redemption price per share is equal to net asset value less any applicable contingent deferred sales charge. |
| Statement of Operations | | | | |
| | | | | Year ended July 31, 2005 |
| Investment Income | | | | | | |
| Dividends | | | | $ | | 2,963,949 |
| Special Dividends | | | | | | 9,090,900 |
| Interest | | | | | | 307,864 |
| Security lending | | | | | | 261,092 |
| Total income | | | | | | 12,623,805 |
| Expenses | | | | | | |
| Management fee | | $ | | 5,255,678 | | |
| Transfer agent fees | | | | 4,372,246 | | |
| Distribution fees | | | | 6,420,787 | | |
| Accounting and security lending | | | | | | |
| fees | | | | 330,405 | | |
| Independent trustees’ compensation | | 4,866 | | |
| Custodian fees and expenses | | | | 52,520 | | |
| Registration fees | | | | 73,387 | | |
| Audit | | | | 50,222 | | |
| Legal | | | | 4,595 | | |
| Miscellaneous | | | | 47,749 | | |
| Total expenses before reductions | | 16,612,455 | | |
| Expense reductions | | | | (1,024,783) | | 15,587,672 |
| |
| Net investment income (loss) | | | | | | (2,963,867) |
| Realized and Unrealized Gain (Loss) | | | | |
| Net realized gain (loss) on: | | | | | | |
| Investment securities | | | | 53,251,775 | | |
| Foreign currency transactions | | | | 66,895 | | |
| Total net realized gain (loss) | | | | | | 53,318,670 |
| Change in net unrealized appreci- | | | | |
| ation (depreciation) on: | | | | | | |
| Investment securities | | | | 82,493,965 | | |
| Assets and liabilities in foreign | | | | | | |
| currencies | | | | (69,452) | | |
| Total change in net unrealized ap- | | | | |
| preciation (depreciation) | | | | | | 82,424,513 |
| Net gain (loss) | | | | | | 135,743,183 |
| Net increase (decrease) in net as- | | | | |
| sets resulting from operations | | | | $ | | 132,779,316 |
See accompanying notes which are an integral part of the financial statements.
Technology A-132
| Statement of Changes in Net Assets | | | | | | | | | | | | | | | | | | |
| | | | | | | | | Year ended | | | | Year ended |
| | | | | | | | | July 31, | | | | July 31, |
| | | | | | | | | 2005 | | | | 2004 |
| Increase (Decrease) in Net Assets | | | | | | | | | | | | | | | | | | |
| Operations | | | | | | | | | | | | | | | | | | |
| Net investment income (loss) | | | | | | | | $ | | (2,963,867) | | $ | | (17,700,644) |
| Net realized gain (loss) | | | | | | | | 53,318,670 | | | | 172,486,507 |
| Change in net unrealized appreciation (depreciation) | | | | | | | | 82,424,513 | | | | (101,951,521) |
| Net increase (decrease) in net assets resulting from operations | | | | | | | | 132,779,316 | | | | 52,834,342 |
| Distributions to shareholders from net investment income | | | | | | | | | | (3,825,456) | | | | | | — |
| Share transactions -- net increase (decrease) | | | | | | | | (218,784,694) | | | | (107,215,077) |
| Redemption fees | | | | | | | | | | | | 52,561 | | | | | | 148,216 |
| Total increase (decrease) in net assets | | | | | | | | (89,778,273) | | | | (54,232,519) |
| |
| Net Assets | | | | | | | | | | | | | | | | | | |
| Beginning of period | | | | | | | | 979,625,311 | | 1,033,857,830 |
| End of period (including accumulated net investment loss of $658 and accumulated net investment loss of $843, | | | | | | | | | | | | |
| respectively) | | | | | | | | $ 889,847,038 | | $ | | 979,625,311 |
| |
| Financial Highlights — Class A | | | | | | | | | | | | | | | | | | |
| Years ended July 31, | | | | 2005 | | 2004 | | 2003 | | | | 2002 | | | | | | 2001 |
| Selected Per-Share Data | | | | | | | | | | | | | | | | | | |
| Net asset value, beginning of period | | $ | | 13.98 | | $ 13.36 | | $ 10.03 | | $ | | 17.76 | | | | $ | | 36.23 |
| Income from Investment Operations | | | | | | | | | | | | | | | | | | |
| Net investment income (loss)C | | | | 02D | | (.17) | | (.11) | | | | (.15) | | | | (.17) |
| Net realized and unrealized gain (loss) | | | | 2.24 | | .79 | | 3.44 | | | | (7.58) | | | | (16.67) |
| Total from investment operations | | | | 2.26 | | .62 | | 3.33 | | | | (7.73) | | | | (16.84) |
| Distributions from net investment income | | | | (.08) | | — | | — | | | | — | | | | | | — |
| Distributions from net realized gain | | | | — | | — | | — | | | | — | | | | | | (1.63) |
| Total distributions | | | | (.08) | | — | | — | | | | — | | | | | | (1.63) |
| Redemption fees added to paid in capitalC | | | | —F | | —F | | —F | | | | —F | | | | —F |
| Net asset value, end of period | | $ | | 16.16 | | $ 13.98 | | $ 13.36 | | $ | | 10.03 | | | | $ | | 17.76 |
| Total ReturnA,B | | | | 16.20% | | 4.64% | | 33.20% | | | | (43.52)% | | | | (48.83)% |
| Ratios to Average Net AssetsE | | | | | | | | | | | | | | | | | | |
| Expenses before expense reductions | | | | 1.37% | | 1.44% | | 1.70% | | | | 1.53% | | | | 1.23% |
| Expenses net of voluntary waivers, if any | | | | 1.37% | | 1.44% | | 1.59% | | | | 1.51% | | | | 1.23% |
| Expenses net of all reductions | | | | 1.26% | | 1.35% | | 1.38% | | | | 1.43% | | | | 1.21% |
| Net investment income (loss) | | | | 12%D | | (1.10)% | | (1.03)% | | | | (1.07)% | | | | (.68)% |
| Supplemental Data | | | | | | | | | | | | | | | | | | |
| Net assets, end of period (000 omitted) | | $ 144,970 | | $ 123,389 | | $ 123,604 | | $ 101,649 | | | | $ 211,429 |
| Portfolio turnover rate | | | | 180% | | 105% | | 140% | | | | 164% | | | | 181% |
A Total returns would have been lower had certain expenses not been reduced during the periods shown.
B Total returns do not include the effect of the sales charges.
C Calculated based on average shares outstanding during the period.
D Investment income per share reflects a special dividend which amounted to $.14 per share. Excluding the special dividend, the ratio of net investment income to average net assets would have been (.87)%.
E Expense ratios reflect operating expenses of the class. Expenses before reductions do not reflect amounts reimbursed by the investment adviser or reductions from brokerage service arrangements or other expense offset arrangements and do
not represent the amount paid by the class during periods when reimbursements or reductions occur. Expenses net of any voluntary waivers reflect expenses after reimbursement by the investment adviser but prior to reductions from broker
age service arrangements or other expense offset arrangements. Expenses net of all reductions represent the net expenses paid by the class.
F Amount represents less than $.01 per share.
|
See accompanying notes which are an integral part of the financial statements.
|
| Financial Highlights — Class T | | | | | | | | | | |
| Years ended July 31, | | 2005 | | 2004 | | 2003 | | 2002 | | 2001 |
| Selected Per-Share Data | | | | | | | | | | |
| Net asset value, beginning of period | | $ 13.76 | | $ 13.17 | | $ 9.91 | | $ 17.59 | | $ 35.95 |
| Income from Investment Operations | | | | | | | | | | |
| Net investment income (loss)C | | (.02)D | | (.19) | | (.14) | | (.18) | | (.22) |
| Net realized and unrealized gain (loss) | | 2.21 | | .78 | | 3.40 | | (7.50) | | (16.55) |
| Total from investment operations | | 2.19 | | .59 | | 3.26 | | (7.68) | | (16.77) |
| Distributions from net investment income | | (.07) | | — | | — | | — | | — |
| Distributions from net realized gain | | — | | — | | — | | — | | (1.59) |
| Total distributions | | (.07) | | — | | — | | — | | (1.59) |
| Redemption fees added to paid in capitalC | | —F | | —F | | —F | | —F | | —F |
| Net asset value, end of period | | $ 15.88 | | $ 13.76 | | $ 13.17 | | $ 9.91 | | $ 17.59 |
| Total ReturnA,B | | 15.94% | | 4.48% | | 32.90% | | (43.66) % | | (48.96)% |
| Ratios to Average Net AssetsE | | | | | | | | | | |
| Expenses before expense reductions | | 1.60% | | 1.62% | | 1.85% | | 1.70% | | 1.43% |
| Expenses net of voluntary waivers, if any | | 1.60% | | 1.62% | | 1.83% | | 1.70% | | 1.43% |
| Expenses net of all reductions | | 1.48% | | 1.53% | | 1.63% | | 1.62% | | 1.41% |
| Net investment income (loss) | | (.11)%D | | (1.28)% | | (1.28)% | | (1.26)% | | (.88)% |
| Supplemental Data | | | | | | | | | | |
| Net assets, end of period (000 omitted) | | $ 315,930 | | $ 363,399 | | $ 367,257 | | $ 302,657 | | $ 645,015 |
| Portfolio turnover rate | | 180% | | 105% | | 140% | | 164% | | 181% |
A Total returns would have been lower had certain expenses not been reduced during the periods shown.
B Total returns do not include the effect of the sales charges.
C Calculated based on average shares outstanding during the period.
D Investment income per share reflects a special dividend which amounted to $.14 per share. Excluding the special dividend, the ratio of net investment income to average net assets would have been (1.10)% .
E Expense ratios reflect operating expenses of the class. Expenses before reductions do not reflect amounts reimbursed by the investment adviser or reductions from brokerage service arrangements or other expense offset arrangements and do
not represent the amount paid by the class during periods when reimbursements or reductions occur. Expenses net of any voluntary waivers reflect expenses after reimbursement by the investment adviser but prior to reductions from broker
age service arrangements or other expense offset arrangements. Expenses net of all reductions represent the net expenses paid by the class.
F Amount represents less than $.01 per share.
|
| Financial Highlights — Class B | | | | | | | | | | |
| Years ended July 31, | | 2005 | | 2004 | | 2003 | | 2002 | | 2001 |
| Selected Per-Share Data | | | | | | | | | | |
| Net asset value, beginning of period | | $ 13.25 | | $ 12.76 | | $ 9.64 | | $ 17.21 | | $ 35.33 |
| Income from Investment Operations | | | | | | | | | | |
| Net investment income (loss)C | | (.09)D | | (.27) | | (.17) | | (.25) | | (.35) |
| Net realized and unrealized gain (loss) | | 2.12 | | .76 | | 3.29 | | (7.32) | | (16.27) |
| Total from investment operations | | 2.03 | | .49 | | 3.12 | | (7.57) | | (16.62) |
| Distributions from net investment income | | (.04) | | — | | — | | — | | — |
| Distributions from net realized gain | | — | | — | | — | | — | | (1.50) |
| Total distributions | | (.04) | | — | | — | | — | | (1.50) |
| Redemption fees added to paid in capitalC | | —F | | —F | | —F | | —F | | —F |
| Net asset value, end of period | | $ 15.24 | | $ 13.25 | | $ 12.76 | | $ 9.64 | | $ 17.21 |
| Total ReturnA,B | | 15.33% | | 3.84% | | 32.37% | | (43.99)% | | (49.28)% |
| Ratios to Average Net AssetsE | | | | | | | | | | |
| Expenses before expense reductions | | 2.13% | | 2.21% | | 2.38% | | 2.28% | | 1.98% |
| Expenses net of voluntary waivers, if any | | 2.13% | | 2.21% | | 2.25% | | 2.25% | | 1.98% |
| Expenses net of all reductions | | 2.02% | | 2.12% | | 2.05% | | 2.18% | | 1.96% |
| Net investment income (loss) | | (.65)%D | | (1.87)% | | (1.69)% | | (1.81)% | | (1.43)% |
| Supplemental Data | | | | | | | | | | |
| Net assets, end of period (000 omitted) | | $ 309,020 | | $ 355,927 | | $ 391,832 | | $ 337,976 | | $ 729,518 |
| Portfolio turnover rate | | 180% | | 105% | | 140% | | 164% | | 181% |
A Total returns would have been lower had certain expenses not been reduced during the periods shown.
B Total returns do not include the effect of the contingent deferred sales charge.
C Calculated based on average shares outstanding during the period.
D Investment income per share reflects a special dividend which amounted to $.14 per share. Excluding the special dividend, the ratio of net investment income to average net assets would have been (1.64)% .
E Expense ratios reflect operating expenses of the class. Expenses before reductions do not reflect amounts reimbursed by the investment adviser or reductions from brokerage service arrangements or other expense offset arrangements and do
not represent the amount paid by the class during periods when reimbursements or reductions occur. Expenses net of any voluntary waivers reflect expenses after reimbursement by the investment adviser but prior to reductions from broker
age service arrangements or other expense offset arrangements. Expenses net of all reductions represent the net expenses paid by the class.
F Amount represents less than $.01 per share.
|
See accompanying notes which are an integral part of the financial statements.
Technology A-134
|
| Financial Highlights — Class C | | | | | | | | | | |
| Years ended July 31, | | 2005 | | 2004 | | 2003 | | 2002 | | 2001 |
| Selected Per-Share Data | | | | | | | | | | |
| Net asset value, beginning of period | | $ 13.31 | | $ 12.80 | | $ 9.67 | | $ 17.25 | | $ 35.39 |
| Income from Investment Operations | | | | | | | | | | |
| Net investment income (loss)C | | (.08)D | | (.26) | | (.17) | | (.24) | | (.33) |
| Net realized and unrealized gain (loss) | | 2.12 | | .77 | | 3.30 | | (7.34) | | (16.30) |
| Total from investment operations | | 2.04 | | .51 | | 3.13 | | (7.58) | | (16.63) |
| Distributions from net investment income | | (.04) | | — | | — | | — | | — |
| Distributions from net realized gain | | — | | — | | — | | — | | (1.51) |
| Total distributions | | (.04) | | — | | — | | — | | (1.51) |
| Redemption fees added to paid in capitalC | | —F | | —F | | —F | | —F | | —F |
| Net asset value, end of period | | $ 15.31 | | $ 13.31 | | $ 12.80 | | $ 9.67 | | $ 17.25 |
| Total ReturnA,B | | 15.34% | | 3.98% | | 32.37% | | (43.94)% | | (49.24)% |
| Ratios to Average Net AssetsE | | | | | | | | | | |
| Expenses before expense reductions | | 2.10% | | 2.13% | | 2.28% | | 2.18% | | 1.94% |
| Expenses net of voluntary waivers, if any | | 2.10% | | 2.13% | | 2.25% | | 2.18% | | 1.94% |
| Expenses net of all reductions | | 1.99% | | 2.04% | | 2.05% | | 2.11% | | 1.91% |
| Net investment income (loss) | | (.61)%D | | (1.79)% | | (1.69)% | | (1.74)% | | (1.38)% |
| Supplemental Data | | | | | | | | | | |
| Net assets, end of period (000 omitted) | | $ 108,287 | | $ 125,926 | | $ 139,654 | | $ 123,034 | | $ 269,563 |
| Portfolio turnover rate | | 180% | | 105% | | 140% | | 164% | | 181% |
A Total returns would have been lower had certain expenses not been reduced during the periods shown.
B Total returns do not include the effect of the contingent deferred sales charge.
C Calculated based on average shares outstanding during the period.
D Investment income per share reflects a special dividend which amounted to $.14 per share. Excluding the special dividend, the ratio of net investment income to average net assets would have been (1.60)% .
E Expense ratios reflect operating expenses of the class. Expenses before reductions do not reflect amounts reimbursed by the investment adviser or reductions from brokerage service arrangements or other expense offset arrangements and do
not represent the amount paid by the class during periods when reimbursements or reductions occur. Expenses net of any voluntary waivers reflect expenses after reimbursement by the investment adviser but prior to reductions from broker
age service arrangements or other expense offset arrangements. Expenses net of all reductions represent the net expenses paid by the class.
F Amount represents less than $.01 per share.
|
| Financial Highlights — Institutional Class | | | | | | | | | | |
| Years ended July 31, | | 2005 | | 2004 | | 2003 | | 2002 | | 2001 |
| Selected Per-Share Data | | | | | | | | | | |
| Net asset value, beginning of period | | $ 14.32 | | $ 13.61 | | $ 10.15 | | $ 17.90 | | $ 36.43 |
| Income from Investment Operations | | | | | | | | | | |
| Net investment income (loss)B | | 09C | | (.09) | | (.05) | | (.08) | | (.08) |
| Net realized and unrealized gain (loss) | | 2.30 | | .80 | | 3.51 | | (7.67) | | (16.78) |
| Total from investment operations | | 2.39 | | .71 | | 3.46 | | (7.75) | | (16.86) |
| Distributions from net investment income | | (.11) | | — | | — | | — | | — |
| Distributions from net realized gain | | — | | — | | — | | — | | (1.67) |
| Total distributions | | (.11) | | — | | — | | — | | (1.67) |
| Redemption fees added to paid in capitalB | | —E | | —E | | —E | | —E | | —E |
| Net asset value, end of period | | $ 16.60 | | $ 14.32 | | $ 13.61 | | $ 10.15 | | $ 17.90 |
| Total ReturnA | | 16.73% | | 5.22% | | 34.09% | | (43.30)% | | (48.67)% |
| Ratios to Average Net AssetsD | | | | | | | | | | |
| Expenses before expense reductions | | 92% | | .93% | | .99% | | 1.00% | | .86% |
| Expenses net of voluntary waivers, if any | | 92% | | .93% | | .99% | | 1.00% | | .86% |
| Expenses net of all reductions | | 81% | | .84% | | .79% | | .92% | | .84% |
| Net investment income (loss) | | 57%C | | (.59)% | | (.43)% | | (.56)% | | (.31)% |
| Supplemental Data | | | | | | | | | | |
| Net assets, end of period (000 omitted) | | $ 11,640 | | $ 10,984 | | $ 11,511 | | $ 10,495 | | $ 24,084 |
| Portfolio turnover rate | | 180% | | 105% | | 140% | | 164% | | 181% |
A Total returns would have been lower had certain expenses not been reduced during the periods shown.
B Calculated based on average shares outstanding during the period.
C Investment income per share reflects a special dividend which amounted to $.14 per share. Excluding the special dividend, the ratio of net investment income to average net assets would have been (.42)%.
D Expense ratios reflect operating expenses of the class. Expenses before reductions do not reflect amounts reimbursed by the investment adviser or reductions from brokerage service arrangements or other expense offset arrangements and do
not represent the amount paid by the class during periods when reimbursements or reductions occur. Expenses net of any voluntary waivers reflect expenses after reimbursement by the investment adviser but prior to reductions from broker
age service arrangements or other expense offset arrangements. Expenses net of all reductions represent the net expenses paid by the class.
E Amount represents less than $.01 per share.
|
See accompanying notes which are an integral part of the financial statements.
|
Notes to Financial Statements
For the period ended July 31, 2005
|
1. Significant Accounting Policies.
|
Fidelity Advisor Technology Fund (the fund) is a non-diversified fund of Fidelity Advisor Series VII (the trust) and is authorized to issue an unlimited number of shares. The trust is registered under the Investment Company Act of 1940, as amended (the 1940 Act), as an open-end management investment company organized as a Massachusetts business trust.
The fund offers Class A, Class T, Class B, Class C and Institutional Class shares, each of which has equal rights as to assets and voting privileges. Each class has exclusive voting rights with respect to matters that affect that class. Class B shares will automatically convert to Class A shares after a holding period of seven years from the initial date of purchase. Investment income, realized and unrealized capital gains and losses, the common expenses of the fund, and certain fund-level expense reductions, if any, are allocated on a pro rata basis to each class based on the relative net assets of each class to the total net assets of the fund. Each class differs with respect to transfer agent and distribution and service plan fees incurred. Certain expense reductions also differ by class.
The financial statements have been prepared in conformity with accounting principles generally accepted in the United States of America, which require management to make certain estimates and assumptions at the date of the financial statements. The following summarizes the significant accounting policies of the fund:
Security Valuation. Net asset value per share (NAV calculation) is calculated as of the close of business of the New York Stock Exchange, normally 4:00 p.m. Eastern time. Equity securities, including restricted securities, for which market quotations are available are valued at the last sale price or official closing price (closing bid price or last evaluated quote if no sale has occurred) on the primary market or exchange on which they trade. If prices are not readily available or do not accurately reflect fair value for a security, or if a security’s value has been materially affected by events occurring after the close of the exchange or market on which the security is principally traded, that security may be valued by another method that the Board of Trustees believes accurately reflects fair value. A security’s valuation may differ depending on the method used for determining value. Price movements in futures contracts and ADRs, market and trading trends, the bid/ask quotes of brokers and off-exchange institutional trading may be reviewed in the course of making a good faith determination of a security’s fair value. Short-term securities with remaining maturities of sixty days or less for which quotations are not readily available are valued on the basis of amortized cost. Investments in open-end investment companies are valued at their net asset value each business day.
Foreign Currency. The fund uses foreign currency contracts to facilitate transactions in foreign-denominated securities. Losses from these transactions may arise from changes in the value of the foreign currency or if the counterparties do not perform under the contracts’ terms.
Foreign-denominated assets, including investment securities, and liabilities are translated into U.S. dollars at the exchange rate at period end. Purchases and sales of investment securities, income and dividends received and expenses denominated in foreign currencies are translated into U.S. dollars at the exchange rate in effect on the transaction date.
The effects of exchange rate fluctuations on investments are included with the net realized and unrealized gain (loss) on investment securities. Other foreign currency transactions resulting in realized and unrealized gain (loss) are disclosed separately.
Investment Transactions and Income. Security transactions are accounted for as of trade date. Gains and losses on securities sold are determined on the basis of identified cost and may include proceeds received from litigation. Dividend income is recorded on the ex-dividend date, except for certain dividends from foreign securities where the ex-dividend date may have passed, which are recorded as soon as the fund is informed of the ex-dividend date. Non-cash dividends included in dividend income, if any, are recorded at the fair market value of the securities received. Distributions received on securities that represent a return of capital or capital gain are recorded as a reduction of cost of investments and/or as a realized gain. The fund estimates the components of distributions received that may be considered return of capital distributions or capital gain distributions. Large, non-recurring dividends recognized by the fund are presented separately on the Statement of Operations as “Special Dividends” and the impact of these dividends is presented in the Financial Highlights. Interest income is accrued as earned. Interest income includes coupon interest and amortization of premium and accretion of discount on debt securities. Investment income is recorded net of foreign taxes withheld where recovery of such taxes is uncertain.
Expenses. Most expenses of the trust can be directly attributed to a fund. Expenses which cannot be directly attributed are apportioned among each fund in the trust.
Income Tax Information and Distributions to Shareholders. Each year, the fund intends to qualify as a regulated investment company by distributing all of its taxable income and realized gains under Subchapter M of the Internal Revenue Code. As a result, no provision for income taxes is required in the accompanying financial statements. Foreign taxes are provided for based on the fund’s understanding of the tax rules and rates that exist in the foreign markets in which it invests.
1. Significant Accounting Policies - continued
Income Tax Information and Distributions to Shareholders - continued
Distributions are recorded on the ex-dividend date. Income dividends and capital gain distributions are declared separately for each class. Income and capital gain distributions are determined in accordance with income tax regulations, which may differ from generally accepted accounting principles. Capital accounts within the financial statements are adjusted for permanent book-tax differences. These adjustments have no impact on net assets or the results of operations. Temporary book-tax differences will reverse in a subsequent period.
Book-tax differences are primarily due to foreign currency transactions, net operating losses, capital loss carryforwards, and losses deferred due to wash sales and excise tax regulations.
The tax-basis components of distributable earnings and the federal tax cost as of period end were as follows:
| Unrealized appreciation | | $ | | 87,313,991 | | | | |
| Unrealized depreciation | | | | (32,858,593) | | | | |
| Net unrealized appreciation (depreciation) | | | | 54,455,398 | | | | |
| Capital loss carryforward | | | | (1,678,030,880) | | | | |
| |
| Cost for federal income tax purposes | | $ | | 857,371,735 | | | | |
| |
| The tax character of distributions paid was as follows: | | | | | | | | |
| | | | | July 31, 2005 | | | | July 31, 2004 |
| Ordinary Income | | $ | | 3,825,456 | | $ | | — |
Short-Term Trading (Redemption) Fees. Shares held in the fund less than 60 days are subject to a redemption fee equal to 1.00% of the proceeds of the redeemed shares. All redemption fees, including any estimated redemption fees paid by Fidelity Management & Research Company (FMR), are retained by the fund and accounted for as an addition to paid in capital.
Repurchase Agreements. FMR has received an Exemptive Order from the Securities and Exchange Commission (the SEC) which permits the fund and other affiliated entities of FMR to transfer uninvested cash balances into joint trading accounts which are then invested in repurchase agreements. The fund may also invest directly with institutions in repurchase agreements. Repurchase agreements are collateralized by government or non-government securities. Collateral is held in segregated accounts with custodian banks and may be obtained in the event of a default of the counterparty. The fund monitors, on a daily basis, the value of the collateral to ensure it is at least equal to the principal amount of the repurchase agreement (including accrued interest). In the event of a default by the counterparty, realization of the collateral proceeds could be delayed, during which time the value of the collateral may decline.
Restricted Securities. The fund may invest in securities that are subject to legal or contractual restrictions on resale. These securities generally may be resold in transactions exempt from registration or to the public if the securities are registered. Disposal of these securities may involve time-consuming negotiations and expense, and prompt sale at an acceptable price may be difficult. Information regarding restricted securities is included at the end of the fund’s Schedule of Investments.
3. Purchases and Sales of Investments.
Purchases and sales of securities, other than short-term securities and U.S. government securities, aggregated $1,627,200,740 and $1,844,231,997, respectively.
4. Fees and Other Transactions with Affiliates.
Management Fee. FMR and its affiliates provide the fund with investment management related services for which the fund pays a monthly management fee. The management fee is the sum of an individual fund fee rate that is based on an annual rate of .30% of the fund’s average net assets and a group fee rate that averaged .27% during the period. The group fee rate is based upon the average net assets of all the mutual funds advised by FMR. The group fee rate decreases as assets under management increase and increases as assets under management decrease. For the period, the total annual management fee rate was .57% of the fund’s average net assets.
Notes to Financial Statements - continued
4. Fees and Other Transactions with Affiliates - continued
Distribution and Service Plan. In accordance with Rule 12b-1 of the 1940 Act, the fund has adopted separate Distribution and Service Plans for each class of shares. Certain classes pay Fidelity Distributors Corporation (FDC), an affiliate of FMR, separate Distribution and Service Fees, each of which is based on an annual percentage of each class’ average net assets. In addition, FDC may pay financial intermediaries for selling shares of the fund and providing shareholder support services. For the period, the Distribution and Service Fee rates and the total amounts paid to and retained by FDC were as follows:
| | | Distribution | | Service | | | | Paid to | | | | Retained |
| | | Fee | | Fee | | | | FDC | | | | by FDC |
| Class A | | 0% | | .25% | | $ | | 319,926 | | $ | | 1,190 |
| Class T | | 25% | | .25% | | | | 1,676,053 | | | | 6,551 |
| Class B | | 75% | | .25% | | | | 3,272,936 | | | | 2,456,923 |
| Class C | | 75% | | .25% | | | | 1,151,872 | | | | 72,187 |
| |
| | | | | | | $ | | 6,420,787 | | $ | | 2,536,851 |
Sales Load. FDC receives a front-end sales charge of up to 5.75% for selling Class A shares, and 3.50% for selling Class T shares, some of which is paid to financial intermediaries for selling shares of the fund. FDC receives the proceeds of contingent deferred sales charges levied on Class A, Class T, Class B, and Class C redemptions. These charges depend on the holding period. The deferred sales charges range from 5% to 1% for Class B, 1% for Class C, and .25% for certain purchases of Class A and Class T shares.
| For the period, sales charge amounts retained by FDC were as follows: | | | | |
| | | | | Retained |
| | | | | by FDC |
| Class A | | $ | | 29,738 |
| Class T | | | | 38,715 |
| Class B* | | | | 862,387 |
| Class C* | | | | 11,549 |
| | | $ | | 942,389 |
* When Class B and Class C shares are initially sold, FDC pays commissions from its own resources to financial intermediaries through which the sales are made.
Transfer Agent Fees. Fidelity Investments Institutional Operations Company, Inc. (FIIOC), an affiliate of FMR, is the transfer, dividend disbursing and shareholder servicing agent for each class of the fund. FIIOC receives account fees and asset-based fees that vary according to the account size and type of account of the shareholders of the respective classes of the fund. FIIOC pays for typesetting, printing and mailing of shareholder reports, except proxy statements. For the period the total transfer agent fees paid by each class to FIIOC, were as follows:
| | | | | | | % of |
| | | | | | | Average |
| | | | | Amount | | Net Assets |
| Class A | | $ | | 623,348 | | .49 |
| Class T | | | | 1,548,292 | | .46 |
| Class B | | | | 1,634,038 | | .50 |
| Class C | | | | 534,657 | | .46 |
| Institutional Class | | | | 31,911 | | .29 |
| |
| | | $ | | 4,372,246 | | |
Accounting and Security Lending Fees. Fidelity Service Company, Inc. (FSC), an affiliate of FMR, maintains the fund’s accounting records. The accounting fee is based on the level of average net assets for the month. Under a separate contract, FSC administers the security lending program. The security lending fee is based on the number and duration of lending transactions.
Central Funds. The fund may invest in affiliated Central Funds managed by Fidelity Investments Money Management, Inc. (FIMM), an affiliate of FMR. The Central Funds are open-end investment companies available only to investment companies and other accounts managed by FMR and its affiliates. The Money Market Central Funds seek preservation of capital and current income. The Central Funds do not pay a management fee. Income distributions earned by the fund are recorded as income in the accompanying financial statements and totaled $581,032 for the period.
Brokerage Commissions. The fund placed a portion of its portfolio transactions with brokerage firms which are affiliates of the investment adviser. The commissions paid to these affiliated firms were $165,174 for the period.
| | 5. Committed Line of Credit.
|
The fund participates with other funds managed by FMR in a $4.2 billion credit facility (the “line of credit”) to be utilized for temporary or emergency purposes to fund shareholder redemptions or for other short-term liquidity purposes. The fund has agreed to pay commitment fees on its pro rata portion of the line of credit. During the period, there were no borrowings on this line of credit.
The fund lends portfolio securities from time to time in order to earn additional income. The fund receives collateral (in the form of U.S. Treasury obligations, letters of credit and/or cash) against the loaned securities and maintains collateral in an amount not less than 100% of the market value of the loaned securities during the period of the loan. The market value of the loaned securities is determined at the close of business of the fund and any additional required collateral is delivered to the fund on the next business day. If the borrower defaults on its obligation to return the securities loaned because of insolvency or other reasons, a fund could experience delays and costs in recovering the securities loaned or in gaining access to the collateral. Cash collateral is invested in the Fidelity Securities Lending Cash Central Fund. The value of loaned securities and cash collateral at period end are disclosed on the fund’s Statement of Assets and Liabilities.
Many of the brokers with whom FMR places trades on behalf of the fund provided services to the fund in addition to trade execution. These services included payments of certain expenses on behalf of the fund totaling $1,024,495 for the period. In addition, through arrangements with the fund’s custodian, credits realized as a result of uninvested cash balances were used to reduce the fund’s expenses. During the period, these credits reduced the fund’s custody expenses by $288.
The fund’s organizational documents provide former and current trustees and officers with a limited indemnification against liabilities arising in connection with the performance of their duties to the fund. In the normal course of business, the fund may also enter into contracts that provide general indemnifications. The fund’s maximum exposure under these arrangements is unknown as this would be dependent on future claims that may be made against the fund. The risk of material loss from such claims is considered remote.
9. Distributions to Shareholders.
Distributions to shareholders of each class were as follows:
| Years ended July 31, | | 2005 | | | | 2004 | | |
| From net investment income | | | | | | | | |
| Class A | | $ 693,969 | | $ | | | | — |
| Class T | | 1,715,027 | | | | | | — |
| Class B | | 986,706 | | | | | | — |
| Class C | | 351,015 | | | | | | — |
| Institutional Class | | 78,739 | | | | | | — |
| Total | | $ 3,825,456 | | $ | | | | — |
| | Notes to Financial Statements - continued
10. Share Transactions.
Transactions for each class of shares were as follows:
|
| | | | | Shares | | | | | | Dollars |
| Years ended July 31, | | 2005 | | | | 2004 | | 2005 | | | | 2004 |
| Class A | | | | | | | | | | | | |
| Shares sold | | 2,937,144 | | | | 1,949,432 | | $ 43,834,461 | | $ | | 30,174,313 |
| Reinvestment of distributions | | 41,796 | | | | — | | 642,405 | | | | — |
| Shares redeemed | | (2,834,081) | | | | (2,376,787) | | (41,983,001) | | | | (36,367,643) |
| Net increase (decrease) | | 144,859 | | | | (427,355) | | $ 2,493,865 | | $ | | (6,193,330) |
| Class T | | | | | | | | | | | | |
| Shares sold | | 3,595,175 | | | | 6,284,281 | | $ 51,527,367 | | $ | | 95,617,905 |
| Reinvestment of distributions | | 108,716 | | | | — | | 1,643,786 | | | | — |
| Shares redeemed | | (10,218,806) | | | | (7,757,438) | | (148,664,787) | | | | (117,704,082) |
| Net increase (decrease) | | (6,514,915) | | | | (1,473,157) | | $ (95,493,634) | | $ | | (22,086,177) |
| Class B | | | | | | | | | | | | |
| Shares sold | | 690,525 | | | | 1,611,188 | | $ 9,551,506 | | $ | | 23,596,499 |
| Reinvestment of distributions | | 61,748 | | | | — | | 899,051 | | | | — |
| Shares redeemed | | (7,334,481) | | | | (5,460,468) | | (101,949,576) | | | | (80,101,949) |
| Net increase (decrease) | | (6,582,208) | | | | (3,849,280) | | $ (91,499,019) | | $ | | (56,505,450) |
| Class C | | | | | | | | | | | | |
| Shares sold | | 609,017 | | | | 1,207,664 | | $ 8,508,174 | | $ | | 17,854,754 |
| Reinvestment of distributions | | 20,786 | | | | — | | 304,101 | | | | -- |
| Shares redeemed | | (3,019,680) | | | | (2,652,498) | | (42,215,602) | | | | (39,082,309) |
| Net increase (decrease) | | (2,389,877) | | | | (1,444,834) | | $ (33,403,327) | | $ | | (21,227,555) |
| Institutional Class | | | | | | | | | | | | |
| Shares sold | | 203,821 | | | | 171,199 | | $ 3,156,844 | | $ | | 2,734,772 |
| Reinvestment of distributions | | 3,961 | | | | — | | 62,341 | | | | — |
| Shares redeemed | | (273,671) | | | | (249,741) | | (4,101,764) | | | | (3,937,337) |
| Net increase (decrease) | | (65,889) | | | | (78,542) | | $ (882,579) | | $ | | (1,202,565) |
Advisor Telecommunications & Utilities Growth Fund
Average annual total return reflects the change in the value of an investment, assuming reinvestment of the class’ dividend income and capital gains (the profits earned upon the sale of securities that have grown in value) and assuming a constant rate of performance each year. The $10,000 table and the fund’s returns do not reflect the deduction of taxes that a shareholder would pay on fund distributions or the redemption of fund shares. During periods of reimbursement by Fidelity, a fund’s total return will be greater than it would be had the reimbursement not occurred. How a fund did yesterday is no guarantee of how it will do tomorrow. Returns may reflect the conversion of Class B shares to Class A shares after a maximum of seven years.
| Average Annual Total Returns | | | | |
| Periods ended July 31, 2005 | | Past 1 | | Past 5 | | Life of |
| | | year | | years | | fundA |
| Class A (incl. 5.75% sales charge) | | 20.15% | | --6.12% | | 7.89% |
| Class T (incl. 3.50% sales charge) | | 22.59% | | --5.92% | | 7.90% |
| Class B (incl. contingent deferred | | | | | | |
| sales charge)B | | 21.51% | | --6.06% | | 7.95% |
| Class C (incl. contingent deferred | | | | | | |
| sales charge)C | | 25.48% | | --5.65% | | 7.87% |
A From September 3, 1996.
B Class B shares bear a 1.00% 12b-1 fee. The initial offering of Class B shares took place
|
on March 3, 1997. Returns prior to March 3, 1997 are those of Class T and reflect a 0.50% 12b-1 fee. Had Class B shares’ 12b-1 fee been reflected, returns prior to March 3, 1997 would have been lower. Class B shares’ contingent deferred sales charges included in the past one year, five year, and life of fund total return figures are 5%, 2% and 0%, respectively.
C Class C shares bear a 1.00% 12b-1 fee. The initial offering of Class C shares took place on November 3, 1997. Returns between March 3, 1997 and November 3, 1997 are those of Class B shares and reflect Class B shares’ 1.00% 12b-1 fee. Returns prior to March 3, 1997 are those of Class T and reflect a 0.50% 12b-1 fee. Had Class C shares’ 12b-1 fee been reflected, returns prior to March 3, 1997 would have been lower. Class C shares’ contingent deferred sales charges included in the past one year, five year, and life of fund total return figures are 1%, 0% and 0%, respectively.
| | $10,000 Over Life of Fund
|
Let’s say hypothetically that $10,000 was invested in Fidelity Advisor Telecommunications & Utilities Growth Fund — Class T on September 3, 1996, when the fund started, and the current 3.50% sales charge was paid. The chart shows how the value of your investment would have changed, and also shows how the S&P 500 Index performed over the same period.
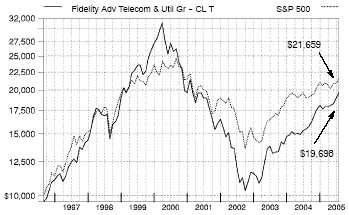
Advisor Telecommunications & Utilities Growth Fund
|
Management’s Discussion of Fund Performance
Comments from Brian Younger, Portfolio Manager of Fidelity® Advisor Telecommunications & Utilities Growth Fund
A late-inning rally on Wall Street helped push some key U.S. equity indexes to four-year highs by the conclusion of the 12-month period ending July 31, 2005. Spurred on by bullish economic data and strong corporate earnings, investors enjoyed a stellar month of July, capping off a turbulent 12-month period for U.S. equity markets. Stock prices bounced up and down during most of the year, moving in cadence with gyrations in the price of crude oil and investors’ gathering and ebbing concerns about inflation. The Federal Reserve Board raised short-term interest rates eight times during the period, also affecting overall market sentiment. Despite their fluctuations, the major equity indexes finished on a high note, with the Standard & Poor’s 500SM Index and the NASDAQ Composite® Index posting gains of 14.05% and 16.51%, respectively, for the period. The small-cap Russell 2000® Index rose 24.78% and the Russell Midcap® Index jumped 28.93%, while the blue-chips’ Dow Jones Industrial AverageSM advanced only 7.29% .
For the 12 months that ended July 31, 2005, the fund’s Class A, Class T, Class B and Class C shares returned 27.48%, 27.03%, 26.51% and 26.48%, respectively. These returns were roughly in line with the Goldman Sachs® Utilities Index, which gained 27.74%, but beat the S&P 500®. Electric utilities and wireless telecommunications stocks were top gainers. Electric utilities benefited from lower-than-expected interest rates and rising energy prices, while wireless stocks climbed amid strong subscriber, revenue and earnings growth. The biggest boost versus the Goldman Sachs index came from sizable stakes in TXU, a regulated utility in Texas; Nextel Communications and NII Holdings, wireless service providers in the United States and Latin America, respectively; and American Tower, a leading wireless tower company, all of which rose sharply in value. Overweightings on the wireline side of telecom hampered returns, as concerns about recent industry consolidation pressured performance. Among the detractors were Verizon Communications and Qwest Communications International, regional Bell operating companies (RBOCs) that suffered during the bidding war over MCI. The fund lost additional ground from having little exposure to Sirius Satellite Radio, an index component that posted steep gains. It instead owned EchoStar Communications, a satellite television stock that turned in disappointing returns as cable competition increased.
The views expressed in this statement reflect those of the portfolio manager only through the end of the period of the report as stated on the cover and do not necessarily represent the views of Fidelity or any other person in the Fidelity organization. Any such views are subject to change at any time based upon market or other conditions and Fidelity disclaims any responsibility to update such views. These views may not be relied on as investment advice and, because investment decisions for a Fidelity fund are based on numerous factors, may not be relied on as an indication of trading intent on behalf of any Fidelity fund.
Telecommunications & Utilities Growth
Advisor Telecommunications & Utilities Growth Fund
Shareholder Expense Example
|
As a shareholder of the Fund, you incur two types of costs: (1) transaction costs, including sales charges (loads) on purchase payments or redemption proceeds, redemption fees, and (2) ongoing costs, including management fees, distribution and/or service (12b-1) fees and other Fund expenses. This Example is intended to help you understand your ongoing costs (in dollars) of investing in the Fund and to compare these costs with the ongoing costs of investing in other mutual funds.
The Example is based on an investment of $1,000 invested at the beginning of the period and held for the entire period (February 1, 2005 to July 31, 2005).
The first line of the table below for each class of the Fund provides information about actual account values and actual expenses. You may use the information in this line, together with the amount you invested, to estimate the expenses that you paid over the period. Simply divide your account value by $1,000.00 (for example, an $8,600 account value divided by $1,000.00 = 8.6), then multiply the result by the number in the first line for a class of the Fund under the heading entitled “Expenses Paid During Period” to estimate the expenses you paid on your account during this period.
Hypothetical Example for Comparison Purposes
|
The second line of the table below for each class of the Fund provides information about hypothetical account values and hypothetical expenses based on a Class’ actual expense ratio and an assumed rate of return of 5% per year before expenses, which is not the Class’ actual return. The hypothetical account values and expenses may not be used to estimate the actual ending account balance or expenses you paid for the period. You may use this information to compare the ongoing costs of investing in the Fund and other funds. To do so, compare this 5% hypothetical example with the 5% hypothetical examples that appear in the shareholder reports of the other funds.
Please note that the expenses shown in the table are meant to highlight your ongoing costs only and do not reflect any transaction costs. Therefore, the second line of the table is useful in comparing ongoing costs only, and will not help you determine the relative total costs of owning different funds. In addition, if these transactional costs were included, your costs would have been higher.
| | | | | | | | | | | Expenses Paid |
| | | Beginning | | | | Ending | | | | During Period* |
| | | Account Value | | | | Account Value | | | | February 1, 2005 |
| | | February 1, 2005 | | | | July 31, 2005 | | | | to July 31, 2005 |
| Class A | | | | | | | | | | |
| Actual | | $ 1,000.00 | | $ | | 1,120.40 | | $ | | 7.20 |
| HypotheticalA | | $ 1,000.00 | | $ | | 1,018.00 | | $ | | 6.85 |
| Class T | | | | | | | | | | |
| Actual | | $ 1,000.00 | | $ | | 1,118.50 | | $ | | 8.56 |
| HypotheticalA | | $ 1,000.00 | | $ | | 1,016.71 | | $ | | 8.15 |
| Class B | | | | | | | | | | |
| Actual | | $ 1,000.00 | | $ | | 1,115.90 | | $ | | 11.12 |
| HypotheticalA | | $ 1,000.00 | | $ | | 1,014.28 | | $ | | 10.59 |
| Class C | | | | | | | | | | |
| Actual | | $ 1,000.00 | | $ | | 1,115.80 | | $ | | 10.81 |
| HypotheticalA | | $ 1,000.00 | | $ | | 1,014.58 | | $ | | 10.29 |
| Institutional Class | | | | | | | | | | |
| Actual | | $ 1,000.00 | | $ | | 1,122.40 | | $ | | 5.05 |
| HypotheticalA | | $ 1,000.00 | | $ | | 1,020.03 | | $ | | 4.81 |
| |
| A 5% return per year before expenses | | | | | | | | | | |
* Expenses are equal to each Class’ annualized expense ratio (shown in the table below); multiplied by the average account value over the period, multiplied by 181/365 (to reflect the one-half year period).
| | | Annualized |
| | | Expense Ratio |
| Class A | | 1.37% |
| Class T | | 1.63% |
| Class B | | 2.12% |
| Class C | | 2.06% |
| Institutional Class | | 96% |
Advisor Telecommunications & Utilities Growth Fund
Investment Changes
| Top Ten Stocks as of July 31, 2005 | | |
| | | % of fund’s | | % of fund’s net assets |
| | | net assets | | 6 months ago |
| SBC Communications, Inc. | | 9.6 | | 9.4 |
| Nextel Communications, Inc. | | | | |
| Class A | | 9.4 | | 7.8 |
| Verizon Communications, Inc. | | 9.4 | | 9.8 |
| BellSouth Corp. | | 9.3 | | 8.9 |
| Exelon Corp. | | 5.3 | | 5.0 |
| Citizens Communications Co. | | 4.1 | | 4.3 |
| Public Service Enterprise Group, | | | | |
| Inc. | | 3.7 | | 0.0 |
| Edison International | | 3.5 | | 0.0 |
| Entergy Corp. | | 3.2 | | 2.6 |
| AES Corp. | | 2.9 | | 1.4 |
| | | 60.4 | | |
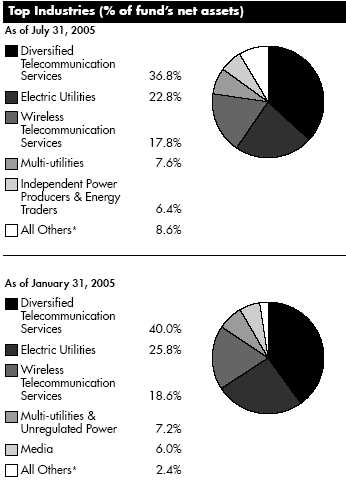
| | * Includes short term investments and net other assets.
Prior period industry classifications reflect the categories in place as of the date
indicated and have not been adjusted to reflect current industry classifications.
|
Telecommunications & Utilities Growth
| | Advisor Telecommunications & Utilities Growth Fund
Investments July 31, 2005
Showing Percentage of Net Assets
|
| Common Stocks — 99.7% | | | | |
| | | Shares | | Value (Note 1) |
| |
| DIVERSIFIED TELECOMMUNICATION SERVICES – 36.8% | | |
| Integrated Telecommunication Services – 36.8% | | |
| ALLTEL Corp. | | 20,700 | | $ 1,376,551 |
| BellSouth Corp. | | 689,300 | | 19,024,680 |
| Citizens Communications Co. | | 645,300 | | 8,479,242 |
| FairPoint Communications, Inc. | | 125,300 | | 2,054,920 |
| Qwest Communications International, | | | | |
| Inc. (a) | | 1,422,000 | | 5,432,040 |
| SBC Communications, Inc. | | 801,600 | | 19,599,119 |
| Verizon Communications, Inc. | | 558,000 | | 19,100,340 |
| | | | | 75,066,892 |
| |
| ELECTRIC UTILITIES – 22.8% | | | | |
| Electric Utilities – 22.8% | | | | |
| Allegheny Energy, Inc. (a) | | 142,600 | | 4,064,100 |
| Cinergy Corp. | | 13,800 | | 609,270 |
| Edison International | | 173,900 | | 7,109,032 |
| El Paso Electric Co. (a) | | 23,300 | | 504,212 |
| Entergy Corp. | | 85,600 | | 6,671,664 |
| Exelon Corp. | | 202,700 | | 10,848,504 |
| FirstEnergy Corp. | | 97,200 | | 4,838,616 |
| FPL Group, Inc. | | 93,500 | | 4,031,720 |
| Northeast Utilities | | 18,900 | | 407,862 |
| PG&E Corp. | | 42,600 | | 1,603,038 |
| PPL Corp. | | 92,100 | | 5,671,518 |
| Westar Energy, Inc. | | 10,200 | | 248,166 |
| | | | | 46,607,702 |
| |
| GAS UTILITIES – 2.4% | | | | |
| Gas Utilities – 2.4% | | | | |
| ONEOK, Inc. | | 54,200 | | 1,894,290 |
| Questar Corp. | | 33,700 | | 2,365,066 |
| Southern Union Co. | | 7,900 | | 200,976 |
| UGI Corp. | | 12,400 | | 363,816 |
| | | | | 4,824,148 |
| |
| INDEPENDENT POWER PRODUCERS & ENERGY TRADERS – 6.4% |
| Independent Power & Energy Trade – 6.4% | | | | |
| AES Corp. (a) | | 365,200 | | 5,861,460 |
| NRG Energy, Inc. (a) | | 60,600 | | 2,324,010 |
| TXU Corp. | | 55,300 | | 4,791,192 |
| | | | | 12,976,662 |
| |
| MEDIA – 4.8% | | | | |
| Broadcasting & Cable TV – 4.8% | | | | |
| EchoStar Communications Corp. Class A | | 137,100 | | 3,937,512 |
| Sirius Satellite Radio, Inc. (a)(d) | | 303,000 | | 2,066,460 |
| XM Satellite Radio Holdings, Inc. | | | | |
| Class A (a) | | 108,000 | | 3,848,040 |
| | | | | 9,852,012 |
| | | | | Shares | | Value (Note 1) |
| |
| MULTI-UTILITIES – 7.6% | | | | | | |
| Multi-Utilities – 7.6% | | | | | | |
| Aquila, Inc. (a) | | | | 99,900 | | $ 371,628 |
| CMS Energy Corp. (a) | | | | 85,190 | | 1,349,410 |
| Dominion Resources, Inc. | | | | 69,800 | | 5,155,428 |
| Public Service Enterprise Group, Inc. | | 117,700 | | 7,568,110 |
| Sempra Energy | | | | 24,500 | | 1,041,250 |
| Wisconsin Energy Corp. | | | | 600 | | 24,090 |
| | | | | | | 15,509,916 |
| |
| OIL, GAS & CONSUMABLE FUELS – 0.9% | | | | |
| Oil & Gas Exploration & Production – 0.8% | | |
| Cheniere Energy, Inc. (a) | | | | 46,200 | | 1,570,338 |
| Oil & Gas Refining & Marketing – 0.1% | | | | |
| Western Gas Resources, Inc. | | | | 5,600 | | 224,224 |
| |
| TOTAL OIL, GAS & CONSUMABLE FUELS | | 1,794,562 |
| |
| WATER UTILITIES – 0.2% | | | | | | |
| Water Utilities – 0.2% | | | | | | |
| Aqua America, Inc. | | | | 13,765 | | 441,444 |
| WIRELESS TELECOMMUNICATION SERVICES – 17.8% | | |
| Wireless Telecommunication Services – 17.8% | | |
| Alamosa Holdings, Inc. (a) | | | | 66,500 | | 1,067,990 |
| American Tower Corp. Class A (a) | | | | 93,100 | | 2,139,438 |
| Crown Castle International Corp. (a) | | 41,300 | | 898,688 |
| Nextel Communications, Inc. Class A (a) | | 550,100 | | 19,143,480 |
| Nextel Partners, Inc. Class A (a) | | | | 198,900 | | 4,952,610 |
| NII Holdings, Inc. (a) | | | | 76,200 | | 5,672,328 |
| SpectraSite, Inc. (a) | | | | 5,600 | | 457,520 |
| Western Wireless Corp. Class A (a) | | 46,340 | | 2,070,008 |
| | | | | | | 36,402,062 |
| |
| TOTAL COMMON STOCKS | | | | | | |
| (Cost $176,698,130) | | | | | | 203,475,400 |
| |
| Money Market Funds — 0.8% | | | | |
| |
| |
| Fidelity Cash Central Fund, | | | | | | |
| 3.31% (b) | | | | 79,711 | | 79,711 |
| Fidelity Securities Lending Cash | | | | | | |
| Central Fund, 3.32% (b)(c) | | 1,529,750 | | 1,529,750 |
| TOTAL MONEY MARKET FUNDS | | | | |
| (Cost $1,609,461) | | | | | | 1,609,461 |
| |
| TOTAL INVESTMENT PORTFOLIO - 100.5% | | |
| (Cost $178,307,591) | | | | | | 205,084,861 |
| |
| NET OTHER ASSETS – (0.5)% | | | | | | (1,081,294) |
| NET ASSETS – 100% | | | | $ | | 204,003,567 |
See accompanying notes which are an integral part of the financial statements.
A-145 Annual Report
Advisor Telecommunications & Utilities Growth Fund Investments - continued
(a) Non-income producing
(b) Affiliated fund that is available only to investment companies and other
accounts managed by Fidelity Investments. The rate quoted is the
annualized seven-day yield of the fund at period end. A complete listing
of the fund’s holdings as of its most recent quarter end is available upon
request.
(c) Investment made with cash collateral received from securities on loan.
(d) Security or a portion of the security is on loan at period end.
|
At July 31, 2005, the fund had a capital loss carryforward of approximately $315,578,610 of which $20,422,782, $140,743,296 and $154,412,532 will expire on July 31, 2009, 2010 and 2011, respectively.
See accompanying notes which are an integral part of the financial statements.
Telecommunications & Utilities Growth A-146
|
Advisor Telecommunications & Utilities Growth Fund
Financial Statements
|
| Statement of Assets and Liabilities | | |
| | | | | | | July 31, 2005 |
| Assets | | | | | | |
| Investment in securities, at value (in- | | | | |
| cluding securities loaned of | | | | | | |
| $1,439,020) (cost $178,307,591) | | | | |
| — See accompanying schedule | | | | $ | | 205,084,861 |
| Receivable for investments sold | | | | | | 605,067 |
| Receivable for fund shares sold | | | | | | 94,530 |
| Dividends receivable | | | | | | 741,733 |
| Interest receivable | | | | | | 1,448 |
| Prepaid expenses | | | | | | 325 |
| Other affiliated receivables | | | | | | 109 |
| Other receivables | | | | | | 39,308 |
| Total assets | | | | | | 206,567,381 |
| Liabilities | | | | | | |
| Payable for investments purchased | | $ | | 170,519 | | |
| Payable for fund shares redeemed | | | | 529,538 | | |
| Accrued management fee | | | | 95,968 | | |
| Distribution fees payable | | | | 125,557 | | |
| Other affiliated payables | | | | 79,670 | | |
| Other payables and accrued expenses | | 32,812 | | |
| Collateral on securities loaned, at value | | 1,529,750 | | |
| Total liabilities | | | | | | 2,563,814 |
| Net Assets | | | | $ | | 204,003,567 |
| Net Assets consist of: | | | | | | |
| Paid in capital | | | | $ | | 495,447,767 |
| Undistributed net investment income | | | | 1,351,200 |
| Accumulated undistributed net realized | | | | |
| gain (loss) on investments and for- | | | | |
| eign currency transactions | | | | | | (319,572,670) |
| Net unrealized appreciation (depreci- | | | | |
| ation) on investments | | | | | | 26,777,270 |
| Net Assets | | | | $ | | 204,003,567 |
| Calculation of Maximum Offering Price | | | | |
| Class A: | | | | | | |
| Net Asset Value and redemption | | | | | | |
| price per share ($29,149,944 ÷ | | | | |
| 1,922,146 shares) | | | | $ | | 15.17 |
| Maximum offering price per share | | | | | | |
| (100/94.25 of $15.17) | | | | $ | | 16.10 |
| Class T: | | | | | | |
| Net Asset Value and redemption | | | | | | |
| price per share ($55,683,199 ÷ | | | | |
| 3,686,987 shares) | | | | $ | | 15.10 |
| Maximum offering price per share | | | | | | |
| (100/96.50 of $15.10) | | | | $ | | 15.65 |
| Class B: | | | | | | |
| Net Asset Value and offering price | | | | |
| per share ($82,577,183 ÷ | | | | | | |
| 5,569,246 shares)A | | | | $ | | 14.83 |
| Class C: | | | | | | |
| Net Asset Value and offering price | | | | |
| per share ($34,827,085 ÷ | | | | | | |
| 2,346,232 shares)A | | | | $ | | 14.84 |
| Institutional Class: | | | | | | |
| Net Asset Value, offering price and | | | | |
| redemption price per share | | | | | | |
| ($1,766,156 ÷ 115,336 shares) . | | $ | | 15.31 |
A Redemption price per share is equal to net asset value less any applicable contingent deferred sales charge.
| Statement of Operations | | | | |
| | | | | Year ended July 31, 2005 |
| Investment Income | | | | | | |
| Dividends | | | | $ | | 5,524,646 |
| Special Dividends | | | | | | 1,290,600 |
| Interest | | | | | | 24,823 |
| Security lending | | | | | | 17,474 |
| Total income | | | | | | 6,857,543 |
| |
| Expenses | | | | | | |
| Management fee | | $ | | 1,158,757 | | |
| Transfer agent fees | | | | 933,522 | | |
| Distribution fees | | | | 1,540,158 | | |
| Accounting and security lending | | | | | | |
| fees | | | | 83,757 | | |
| Independent trustees’ compensation | | 1,052 | | |
| Custodian fees and expenses | | | | 5,594 | | |
| Registration fees | | | | 55,086 | | |
| Audit | | | | 42,771 | | |
| Legal | | | | 1,959 | | |
| Miscellaneous | | | | 5,699 | | |
| Total expenses before reductions | | 3,828,355 | | |
| Expense reductions | | | | (59,784) | | 3,768,571 |
| |
| Net investment income (loss) | | | | | | 3,088,972 |
| Realized and Unrealized Gain (Loss) | | | | |
| Net realized gain (loss) on: | | | | | | |
| Investment securities | | | | 37,510,316 | | |
| Foreign currency transactions | | | | 10,126 | | |
| Total net realized gain (loss) | | | | | | 37,520,442 |
| Change in net unrealized appreci- | | | | |
| ation (depreciation) on investment | | | | |
| securities | | | | | | 7,253,242 |
| Net gain (loss) | | | | | | 44,773,684 |
| Net increase (decrease) in net as- | | | | |
| sets resulting from operations | | | | $ | | 47,862,656 |
See accompanying notes which are an integral part of the financial statements.
A-147 Annual Report
| | Advisor Telecommunications & Utilities Growth Fund
Financial Statements - continued
|
| Statement of Changes in Net Assets | | | | | | |
| | | Year ended | | | | Year ended |
| | | July 31, | | | | July 31, |
| | | 2005 | | | | 2004 |
| Increase (Decrease) in Net Assets | | | | | | |
| Operations | | | | | | |
| Net investment income (loss) | | $ 3,088,972 | | $ | | 757,542 |
| Net realized gain (loss) | | 37,520,442 | | | | 26,016,597 |
| Change in net unrealized appreciation (depreciation) | | 7,253,242 | | | | 5,705,831 |
| Net increase (decrease) in net assets resulting from operations | | 47,862,656 | | | | 32,479,970 |
| Distributions to shareholders from net investment income | | (2,204,610) | | | | (1,058,918) |
| Share transactions -- net increase (decrease) | | (38,936,571) | | | | (39,718,704) |
| Redemption fees | | 6,117 | | | | 13,588 |
| Total increase (decrease) in net assets | | 6,727,592 | | | | (8,284,064) |
| |
| Net Assets | | | | | | |
| Beginning of period | | 197,275,975 | | | | 205,560,039 |
| End of period (including undistributed net investment income of $1,351,200 and undistributed net investment income of | | | | | | |
| $473,223, respectively) | | $ 204,003,567 | | $ | | 197,275,975 |
| Financial Highlights — Class A | | | | | | | | | | |
| Years ended July 31, | | 2005 | | 2004 | | 2003 | | 2002 | | 2001 |
| Selected Per-Share Data | | | | | | | | | | |
| Net asset value, beginning of period | | $ 12.09 | | $ 10.37 | | $ 8.74 | | $ 15.18 | | $ 21.08 |
| Income from Investment Operations | | | | | | | | | | |
| Net investment income (loss)C | | 28D | | .10 | | .13 | | .10 | | .05 |
| Net realized and unrealized gain (loss) | | 3.01 | | 1.72 | | 1.69 | | (6.54) | | (5.41) |
| Total from investment operations | | 3.29 | | 1.82 | | 1.82 | | (6.44) | | (5.36) |
| Distributions from net investment income | | (.21) | | (.10) | | (.19) | | — | | (.28) |
| Distributions from net realized gain | | — | | — | | — | | — | | (.26) |
| Total distributions | | (.21) | | (.10) | | (.19) | | — | | (.54) |
| Redemption fees added to paid in capitalC | | —F | | —F | | —F | | —F | | —F |
| Net asset value, end of period | | $ 15.17 | | $ 12.09 | | $ 10.37 | | $ 8.74 | | $ 15.18 |
| Total ReturnA,B | | 27.48% | | 17.67% | | 21.22% | | (42.42)% | | (26.09)% |
| Ratios to Average Net AssetsE | | | | | | | | | | |
| Expenses before expense reductions | | 1.39% | | 1.51% | | 1.67% | | 1.45% | | 1.25% |
| Expenses net of voluntary waivers, if any | | 1.39% | | 1.50% | | 1.58% | | 1.45% | | 1.25% |
| Expenses net of all reductions | | 1.36% | | 1.45% | | 1.47% | | 1.36% | | 1.20% |
| Net investment income (loss) | | 2.03%D | | .87% | | 1.46% | | .79% | | .32% |
| Supplemental Data | | | | | | | | | | |
| Net assets, end of period (000 omitted) | | $ 29,150 | | $ 21,987 | | $ 21,761 | | $ 22,377 | | $ 54,265 |
| Portfolio turnover rate | | 44% | | 38% | | 81% | | 116% | | 220% |
A Total returns would have been lower had certain expenses not been reduced during the periods shown.
B Total returns do not include the effect of the sales charges.
C Calculated based on average shares outstanding during the period.
D Investment income per share reflects a special dividend which amounted to $.09 per share. Excluding the special dividend, the ratio of net investment income to average net assets would have been 1.39% .
E Expense ratios reflect operating expenses of the class. Expenses before reductions do not reflect amounts reimbursed by the investment adviser or reductions from brokerage service arrangements or other expense offset arrangements and do
not represent the amount paid by the class during periods when reimbursements or reductions occur. Expenses net of any voluntary waivers reflect expenses after reimbursement by the investment adviser but prior to reductions from broker
age service arrangements or other expense offset arrangements. Expenses net of all reductions represent the net expenses paid by the class.
F Amount represents less than $.01 per share.
|
See accompanying notes which are an integral part of the financial statements.
Telecommunications & Utilities Growth A-148
| Financial Highlights — Class T | | | | | | | | | | |
| Years ended July 31, | | 2005 | | 2004 | | 2003 | | 2002 | | 2001 |
| Selected Per-Share Data | | | | | | | | | | |
| Net asset value, beginning of period | | $ 12.04 | | $ 10.33 | | $ 8.68 | | $ 15.11 | | $ 21.01 |
| Income from Investment Operations | | | | | | | | | | |
| Net investment income (loss)C | | 24D | | .07 | | .11 | | .07 | | .01 |
| Net realized and unrealized gain (loss) | | 2.99 | | 1.72 | | 1.68 | | (6.50) | | (5.40) |
| Total from investment operations | | 3.23 | | 1.79 | | 1.79 | | (6.43) | | (5.39) |
| Distributions from net investment income | | (.17) | | (.08) | | (.14) | | — | | (.25) |
| Distributions from net realized gain | | — | | — | | — | | — | | (.26) |
| Total distributions | | (.17) | | (.08) | | (.14) | | — | | (.51) |
| Redemption fees added to paid in capitalC | | —F | | —F | | —F | | —F | | —F |
| Net asset value, end of period | | $ 15.10 | | $ 12.04 | | $ 10.33 | | $ 8.68 | | $ 15.11 |
| Total ReturnA,B | | 27.03% | | 17.42% | | 20.91% | | (42.55)% | | (26.29)% |
| Ratios to Average Net AssetsE | | | | | | | | | | |
| Expenses before expense reductions | | 1.67% | | 1.79% | | 1.94% | | 1.71% | | 1.49% |
| Expenses net of voluntary waivers, if any | | 1.67% | | 1.75% | | 1.83% | | 1.71% | | 1.49% |
| Expenses net of all reductions | | 1.64% | | 1.70% | | 1.72% | | 1.62% | | 1.44% |
| Net investment income (loss) | | 1.76%D | | .62% | | 1.21% | | .53% | | .08% |
| Supplemental Data | | | | | | | | | | |
| Net assets, end of period (000 omitted) | | $ 55,683 | | $ 53,255 | | $ 55,510 | | $ 59,306 | | $ 149,618 |
| Portfolio turnover rate | | 44% | | 38% | | 81% | | 116% | | 220% |
A Total returns would have been lower had certain expenses not been reduced during the periods shown.
B Total returns do not include the effect of the sales charges.
C Calculated based on average shares outstanding during the period.
D Investment income per share reflects a special dividend which amounted to $.09 per share. Excluding the special dividend, the ratio of net investment income to average net assets would have been 1.12% .
E Expense ratios reflect operating expenses of the class. Expenses before reductions do not reflect amounts reimbursed by the investment adviser or reductions from brokerage service arrangements or other expense offset arrangements and do
not represent the amount paid by the class during periods when reimbursements or reductions occur. Expenses net of any voluntary waivers reflect expenses after reimbursement by the investment adviser but prior to reductions from broker
age service arrangements or other expense offset arrangements. Expenses net of all reductions represent the net expenses paid by the class.
F Amount represents less than $.01 per share.
|
| Financial Highlights — Class B | | | | | | | | | | |
| Years ended July 31, | | 2005 | | 2004 | | 2003 | | 2002 | | 2001 |
| Selected Per-Share Data | | | | | | | | | | |
| Net asset value, beginning of period | | $ 11.82 | | $ 10.15 | | $ 8.49 | | $ 14.85 | | $ 20.72 |
| Income from Investment Operations | | | | | | | | | | |
| Net investment income (loss)C | | 17D | | .01 | | .07 | | .01 | | (.07) |
| Net realized and unrealized gain (loss) | | 2.95 | | 1.69 | | 1.65 | | (6.37) | | (5.33) |
| Total from investment operations | | 3.12 | | 1.70 | | 1.72 | | (6.36) | | (5.40) |
| Distributions from net investment income | | (.11) | | (.03) | | (.06) | | — | | (.21) |
| Distributions from net realized gain | | — | | — | | — | | — | | (.26) |
| Total distributions | | (.11) | | (.03) | | (.06) | | — | | (.47) |
| Redemption fees added to paid in capitalC | | —F | | —F | | —F | | —F | | —F |
| Net asset value, end of period | | $ 14.83 | | $ 11.82 | | $ 10.15 | | $ 8.49 | | $ 14.85 |
| Total ReturnA,B | | 26.51% | | 16.79% | | 20.37% | | (42.83)% | | (26.66)% |
| Ratios to Average Net AssetsE | | | | | | | | | | |
| Expenses before expense reductions | | 2.14% | | 2.25% | | 2.32% | | 2.20% | | 2.01% |
| Expenses net of voluntary waivers, if any | | 2.14% | | 2.25% | | 2.25% | | 2.20% | | 2.01% |
| Expenses net of all reductions | | 2.11% | | 2.20% | | 2.13% | | 2.11% | | 1.96% |
| Net investment income (loss) | | 1.28%D | | .12% | | .79% | | .04% | | (.44)% |
| Supplemental Data | | | | | | | | | | |
| Net assets, end of period (000 omitted) | | $ 82,577 | | $ 84,742 | | $ 87,868 | | $ 91,517 | | $ 213,767 |
| Portfolio turnover rate | | 44% | | 38% | | 81% | | 116% | | 220% |
A Total returns would have been lower had certain expenses not been reduced during the periods shown.
B Total returns do not include the effect of the contingent deferred sales charge.
C Calculated based on average shares outstanding during the period.
D Investment income per share reflects a special dividend which amounted to $.09 per share. Excluding the special dividend, the ratio of net investment income to average net assets would have been .64%.
E Expense ratios reflect operating expenses of the class. Expenses before reductions do not reflect amounts reimbursed by the investment adviser or reductions from brokerage service arrangements or other expense offset arrangements and do
not represent the amount paid by the class during periods when reimbursements or reductions occur. Expenses net of any voluntary waivers reflect expenses after reimbursement by the investment adviser but prior to reductions from broker
age service arrangements or other expense offset arrangements. Expenses net of all reductions represent the net expenses paid by the class.
F Amount represents less than $.01 per share.
|
See accompanying notes which are an integral part of the financial statements.
|
| Financial Highlights — Class C | | | | | | | | | | |
| Years ended July 31, | | 2005 | | 2004 | | 2003 | | 2002 | | 2001 |
| Selected Per-Share Data | | | | | | | | | | |
| Net asset value, beginning of period | | $ 11.84 | | $ 10.16 | | $ 8.50 | | $ 14.85 | | $ 20.71 |
| Income from Investment Operations | | | | | | | | | | |
| Net investment income (loss)C | | 18D | | .02 | | .07 | | .02 | | (.06) |
| Net realized and unrealized gain (loss) | | 2.94 | | 1.70 | | 1.65 | | (6.37) | | (5.33) |
| Total from investment operations | | 3.12 | | 1.72 | | 1.72 | | (6.35) | | (5.39) |
| Distributions from net investment income | | (.12) | | (.04) | | (.06) | | — | | (.21) |
| Distributions from net realized gain | | — | | — | | — | | — | | (.26) |
| Total distributions | | (.12) | | (.04) | | (.06) | | — | | (.47) |
| Redemption fees added to paid in capitalC | | —F | | —F | | —F | | —F | | —F |
| Net asset value, end of period | | $ 14.84 | | $ 11.84 | | $ 10.16 | | $ 8.50 | | $ 14.85 |
| Total ReturnA,B | | 26.48% | | 16.98% | | 20.35% | | (42.76)% | | (26.62)% |
| Ratios to Average Net AssetsE | | | | | | | | | | |
| Expenses before expense reductions | | 2.07% | | 2.17% | | 2.23% | | 2.11% | | 1.96% |
| Expenses net of voluntary waivers, if any | | 2.07% | | 2.17% | | 2.23% | | 2.11% | | 1.96% |
| Expenses net of all reductions | | 2.04% | | 2.12% | | 2.12% | | 2.02% | | 1.91% |
| Net investment income (loss) | | 1.36%D | | .21% | | .80% | | .13% | | (.39)% |
| Supplemental Data | | | | | | | | | | |
| Net assets, end of period (000 omitted) | | $ 34,827 | | $ 35,038 | | $ 37,530 | | $ 41,496 | | $ 104,628 |
| Portfolio turnover rate | | 44% | | 38% | | 81% | | 116% | | 220% |
A Total returns would have been lower had certain expenses not been reduced during the periods shown.
B Total returns do not include the effect of the contingent deferred sales charge.
C Calculated based on average shares outstanding during the period.
D Investment income per share reflects a special dividend which amounted to $.09 per share. Excluding the special dividend, the ratio of net investment income to average net assets would have been .72%.
E Expense ratios reflect operating expenses of the class. Expenses before reductions do not reflect amounts reimbursed by the investment adviser or reductions from brokerage service arrangements or other expense offset arrangements and do not
represent the amount paid by the class during periods when reimbursements or reductions occur. Expenses net of any voluntary waivers reflect expenses after reimbursement by the investment adviser but prior to reductions from brokerage service
arrangements or other expense offset arrangements. Expenses net of all reductions represent the net expenses paid by the class.
F Amount represents less than $.01 per share.
|
| Financial Highlights — Institutional Class | | | | | | | | | | |
| Years ended July 31, | | 2005 | | 2004 | | 2003 | | 2002 | | 2001 |
| Selected Per-Share Data | | | | | | | | | | |
| Net asset value, beginning of period | | $ 12.20 | | $ 10.47 | | $ 8.86 | | $ 15.31 | | $ 21.19 |
| Income from Investment Operations | | | | | | | | | | |
| Net investment income (loss)B | | 33C | | .15 | | .18 | | .16 | | .12 |
| Net realized and unrealized gain (loss) | | 3.03 | | 1.73 | | 1.71 | | (6.61) | | (5.44) |
| Total from investment operations | | 3.36 | | 1.88 | | 1.89 | | (6.45) | | (5.32) |
| Distributions from net investment income | | (.25) | | (.15) | | (.28) | | — | | (.30) |
| Distributions from net realized gain | | — | | — | | — | | — | | (.26) |
| Total distributions | | (.25) | | (.15) | | (.28) | | — | | (.56) |
| Redemption fees added to paid in capitalB | | —E | | —E | | —E | | —E | | —E |
| Net asset value, end of period | | $ 15.31 | | $ 12.20 | | $ 10.47 | | $ 8.86 | | $ 15.31 |
| Total ReturnA | | 27.88% | | 18.14% | | 21.94% | | (42.13)% | | (25.78)% |
| Ratios to Average Net AssetsD | | | | | | | | | | |
| Expenses before expense reductions | | 99% | | 1.09% | | 1.06% | | .96% | | .85% |
| Expenses net of voluntary waivers, if any | | 99% | | 1.09% | | 1.06% | | .96% | | .85% |
| Expenses net of all reductions | | 96% | | 1.04% | | .94% | | .87% | | .80% |
| Net investment income (loss) | | 2.44%C | | 1.29% | | 1.98% | | 1.28% | | .72% |
| Supplemental Data | | | | | | | | | | |
| Net assets, end of period (000 omitted) | | $ 1,766 | | $ 2,254 | | $ 2,891 | | $ 2,939 | | $ 8,945 |
| Portfolio turnover rate | | 44% | | 38% | | 81% | | 116% | | 220% |
A Total returns would have been lower had certain expenses not been reduced during the periods shown.
B Calculated based on average shares outstanding during the period.
C Investment income per share reflects a special dividend which amounted to $.09 per share. Excluding the special dividend, the ratio of net investment income to average net assets would have been 1.80% .
D Expense ratios reflect operating expenses of the class. Expenses before reductions do not reflect amounts reimbursed by the investment adviser or reductions from brokerage service arrangements or other expense offset arrangements and do not
represent the amount paid by the class during periods when reimbursements or reductions occur. Expenses net of any voluntary waivers reflect expenses after reimbursement by the investment adviser but prior to reductions from brokerage service
arrangements or other expense offset arrangements. Expenses net of all reductions represent the net expenses paid by the class.
E Amount represents less than $.01 per share.
|
See accompanying notes which are an integral part of the financial statements.
Telecommunications &Utilities Growth A-150
|
Notes to Financial Statements
For the period ended July 31, 2005
|
1. Significant Accounting Policies.
|
Fidelity Advisor Telecommunications & Utilities Growth Fund (the fund) is a non-diversified fund of Fidelity Advisor Series VII (the trust) and is authorized to issue an unlimited number of shares. The trust is registered under the Investment Company Act of 1940, as amended (the 1940 Act), as an open-end management investment company organized as a Massachusetts business trust.
The fund offers Class A, Class T, Class B, Class C and Institutional Class shares, each of which has equal rights as to assets and voting privileges. Each class has exclusive voting rights with respect to matters that affect that class. Class B shares will automatically convert to Class A shares after a holding period of seven years from the initial date of purchase. Investment income, realized and unrealized capital gains and losses, the common expenses of the fund, and certain fund-level expense reductions, if any, are allocated on a pro rata basis to each class based on the relative net assets of each class to the total net assets of the fund. Each class differs with respect to transfer agent and distribution and service plan fees incurred. Certain expense reductions also differ by class.
The financial statements have been prepared in conformity with accounting principles generally accepted in the United States of America, which require management to make certain estimates and assumptions at the date of the financial statements. The following summarizes the significant accounting policies of the fund:
Security Valuation. Net asset value per share (NAV calculation) is calculated as of the close of business of the New York Stock Exchange, normally 4:00 p.m. Eastern time. Equity securities, including restricted securities, for which market quotations are available are valued at the last sale price or official closing price (closing bid price or last evaluated quote if no sale has occurred) on the primary market or exchange on which they trade. If prices are not readily available or do not accurately reflect fair value for a security, or if a security’s value has been materially affected by events occurring after the close of the exchange or market on which the security is principally traded, that security may be valued by another method that the Board of Trustees believes accurately reflects fair value. A security’s valuation may differ depending on the method used for determining value. Price movements in futures contracts and ADRs, market and trading trends, the bid/ask quotes of brokers and off-exchange institutional trading may be reviewed in the course of making a good faith determination of a security’s fair value. Short-term securities with remaining maturities of sixty days or less for which quotations are not readily available are valued on the basis of amortized cost. Investments in open-end investment companies are valued at their net asset value each business day.
Foreign Currency. The fund uses foreign currency contracts to facilitate transactions in foreign-denominated securities. Losses from these transactions may arise from changes in the value of the foreign currency or if the counterparties do not perform under the contracts’ terms.
Foreign-denominated assets, including investment securities, and liabilities are translated into U.S. dollars at the exchange rate at period end. Purchases and sales of investment securities, income and dividends received and expenses denominated in foreign currencies are translated into U.S. dollars at the exchange rate in effect on the transaction date.
The effects of exchange rate fluctuations on investments are included with the net realized and unrealized gain (loss) on investment securities. Other foreign currency transactions resulting in realized and unrealized gain (loss) are disclosed separately.
Investment Transactions and Income. Security transactions are accounted for as of trade date. Gains and losses on securities sold are determined on the basis of identified cost and may include proceeds received from litigation. Dividend income is recorded on the ex-dividend date, except for certain dividends from foreign securities where the ex-dividend date may have passed, which are recorded as soon as the fund is informed of the ex-dividend date. Non-cash dividends included in dividend income, if any, are recorded at the fair market value of the securities received. Distributions received on securities that represent a return of capital or capital gain are recorded as a reduction of cost of investments and/or as a realized gain. The fund estimates the components of distributions received that may be considered return of capital distributions or capital gain distributions. Large, non-recurring dividends recognized by the fund are presented separately on the Statement of Operations as “Special Dividends” and the impact of these dividends is presented in the Financial Highlights. Interest income is accrued as earned. Interest income includes coupon interest and amortization of premium and accretion of discount on debt securities. Investment income is recorded net of foreign taxes withheld where recovery of such taxes is uncertain.
Expenses. Most expenses of the trust can be directly attributed to a fund. Expenses which cannot be directly attributed are apportioned among each fund in the trust.
Income Tax Information and Distributions to Shareholders. Each year, the fund intends to qualify as a regulated investment company by distributing all of its taxable income and realized gains under Subchapter M of the Internal Revenue Code. As a result, no provision for income taxes is required in the accompanying financial statements. Foreign taxes are provided for based on the fund’s understanding of the tax rules and rates that exist in the foreign markets in which it invests.
1. Significant Accounting Policies - continued
Income Tax Information and Distributions to Shareholders - continued
Distributions are recorded on the ex-dividend date. Income dividends and capital gain distributions are declared separately for each class. Income and capital gain distributions are determined in accordance with income tax regulations, which may differ from generally accepted accounting principles. Capital accounts within the financial statements are adjusted for permanent book-tax differences. These adjustments have no impact on net assets or the results of operations. Temporary book-tax differences will reverse in a subsequent period.
Book-tax differences are primarily due to foreign currency transactions, capital loss carryforwards and losses deferred due to wash sales.
The tax-basis components of distributable earnings and the federal tax cost as of period end were as follows:
| Unrealized appreciation | | $ 36,563,126 |
| Unrealized depreciation | | (13,779,832) |
| Net unrealized appreciation (depreciation) | | 22,783,294 |
| Undistributed ordinary income | | 1,351,315 |
| Capital loss carryforward | | (315,578,610) |
| |
| Cost for federal income tax purposes | | $ 182,301,567 |
The tax character of distributions paid was as follows:
| | | July 31, 2005 | | | | July 31, 2004 |
| Ordinary Income | | $ 2,204,610 | | $ | | 1,058,918 |
Short-Term Trading (Redemption) Fees. Shares held in the fund less than 60 days are subject to a redemption fee equal to 1.00% of the proceeds of the redeemed shares. All redemption fees, including any estimated redemption fees paid by Fidelity Management & Research Company (FMR), are retained by the fund and accounted for as an addition to paid in capital.
2. Operating Policies.
Repurchase Agreements. FMR has received an Exemptive Order from the Securities and Exchange Commission (the SEC) which permits the fund and other affiliated entities of FMR to transfer uninvested cash balances into joint trading accounts which are then invested in repurchase agreements. The fund may also invest directly with institutions in repurchase agreements. Repurchase agreements are collateralized by government or non-government securities. Collateral is held in segregated accounts with custodian banks and may be obtained in the event of a default of the counterparty. The fund monitors, on a daily basis, the value of the collateral to ensure it is at least equal to the principal amount of the repurchase agreement (including accrued interest). In the event of a default by the counterparty, realization of the collateral proceeds could be delayed, during which time the value of the collateral may decline.
3. Purchases and Sales of Investments.
Purchases and sales of securities, other than short-term securities and U.S. government securities, aggregated $87,703,693 and $124,116,711, respectively.
4. Fees and Other Transactions with Affiliates.
Management Fee. FMR and its affiliates provide the fund with investment management related services for which the fund pays a monthly management fee. The management fee is the sum of an individual fund fee rate that is based on an annual rate of .30% of the fund’s average net assets and a group fee rate that averaged .27% during the period. The group fee rate is based upon the average net assets of all the mutual funds advised by FMR. The group fee rate decreases as assets under management increase and increases as assets under management decrease. For the period, the total annual management fee rate was .57% of the fund’s average net assets.
Telecommunications & Utilities Growth A-152
4. Fees and Other Transactions with Affiliates - continued
Distribution and Service Plan. In accordance with Rule 12b-1 of the 1940 Act, the fund has adopted separate Distribution and Service Plans for each class of shares. Certain classes pay Fidelity Distributors Corporation (FDC), an affiliate of FMR, separate Distribution and Service Fees, each of which is based on an annual percentage of each class’ average net assets. In addition, FDC may pay financial intermediaries for selling shares of the fund and providing shareholder support services. For the period, the Distribution and Service Fee rates and the total amounts paid to and retained by FDC were as follows:
| | | Distribution | | Service | | | | Paid to | | | | Retained |
| | | Fee | | Fee | | | | FDC | | | | by FDC |
| Class A | | 0% | | .25% | | $ | | 61,780 | | $ | | 139 |
| Class T | | 25% | | .25% | | | | 274,860 | | | | 778 |
| Class B | | 75% | | .25% | | | | 848,148 | | | | 636,630 |
| Class C | | 75% | | .25% | | | | 355,370 | | | | 20,223 |
| |
| | | | | | | $ | | 1,540,158 | | $ | | 657,770 |
Sales Load. FDC receives a front-end sales charge of up to 5.75% for selling Class A shares, and 3.50% for selling Class T shares, some of which is paid to financial intermediaries for selling shares of the fund. FDC receives the proceeds of contingent deferred sales charges levied on Class A, Class T, Class B, and Class C redemptions. These charges depend on the holding period. The deferred sales charges range from 5% to 1% for Class B, 1% for Class C, and .25% for certain purchases of Class A and Class T shares.
| | | | | Retained |
| | | | | by FDC |
| Class A | | $ | | 11,820 |
| Class T | | | | 8,973 |
| Class B* | | | | 255,926 |
| Class C* | | | | 1,858 |
| | | $ | | 278,577 |
* When Class B and Class C shares are initially sold, FDC pays commissions from its own resources to financial intermediaries through which the sales are made.
Transfer Agent Fees. Fidelity Investments Institutional Operations Company, Inc. (FIIOC), an affiliate of FMR, is the transfer, dividend disbursing and shareholder servicing agent for each class of the fund. FIIOC receives account fees and asset-based fees that vary according to the account size and type of account of the shareholders of the respective classes of the fund. FIIOC pays for typesetting, printing and mailing of shareholder reports, except proxy statements. For the period the total transfer agent fees paid by each class to FIIOC, were as follows:
| | | | | | | % of |
| | | | | | | Average |
| | | | | Amount | | Net Assets |
| Class A | | $ | | 116,083 | | .47 |
| Class T | | | | 272,389 | | .50 |
| Class B | | | | 397,839 | | .47 |
| Class C | | | | 140,545 | | .40 |
| Institutional Class | | | | 6,666 | | .32 |
| |
| | | $ | | 933,522 | | |
Accounting and Security Lending Fees. Fidelity Service Company, Inc. (FSC), an affiliate of FMR, maintains the fund’s accounting records. The accounting fee is based on the level of average net assets for the month. Under a separate contract, FSC administers the security lending program. The security lending fee is based on the number and duration of lending transactions.
Central Funds. The fund may invest in affiliated Central Funds managed by Fidelity Investments Money Management, Inc. (FIMM), an affiliate of FMR. The Central Funds are open-end investment companies available only to investment companies and other accounts managed by FMR and its affiliates. The Money Market Central Funds seek preservation of capital and current income. The Central Funds do not pay a management fee. Income distributions earned by the fund are recorded as income in the accompanying financial statements and totaled $61,023 for the period.
Brokerage Commissions. The fund placed a portion of its portfolio transactions with brokerage firms which are affiliates of the investment adviser. The commissions paid to these affiliated firms were $1,832 for the period.
Notes to Financial Statements - continued
5. Committed Line of Credit.
The fund participates with other funds managed by FMR in a $4.2 billion credit facility (the “line of credit”) to be utilized for temporary or emergency purposes to fund shareholder redemptions or for other short-term liquidity purposes. The fund has agreed to pay commitment fees on its pro rata portion of the line of credit. During the period, there were no borrowings on this line of credit.
The fund lends portfolio securities from time to time in order to earn additional income. The fund receives collateral (in the form of U.S. Treasury obligations, letters of credit and/or cash) against the loaned securities and maintains collateral in an amount not less than 100% of the market value of the loaned securities during the period of the loan. The market value of the loaned securities is determined at the close of business of the fund and any additional required collateral is delivered to the fund on the next business day. If the borrower defaults on its obligation to return the securities loaned because of insolvency or other reasons, a fund could experience delays and costs in recovering the securities loaned or in gaining access to the collateral. Cash collateral is invested in the Fidelity Securities Lending Cash Central Fund. The value of loaned securities and cash collateral at period end are disclosed on the fund’s Statement of Assets and Liabilities.
Many of the brokers with whom FMR places trades on behalf of the fund provided services to the fund in addition to trade execution. These services included payments of certain expenses on behalf of the fund totaling $59,784 for the period.
The fund’s organizational documents provide former and current trustees and officers with a limited indemnification against liabilities arising in connection with the performance of their duties to the fund. In the normal course of business, the fund may also enter into contracts that provide general indemnifications. The fund’s maximum exposure under these arrangements is unknown as this would be dependent on future claims that may be made against the fund. The risk of material loss from such claims is considered remote.
9. Distributions to Shareholders.
Distributions to shareholders of each class were as follows:
| Years ended July 31, | | 2005 | | | | 2004 |
| From net investment income | | | | | | |
| Class A | | $ 379,843 | | $ | | 201,967 |
| Class T | | 719,068 | | | | 417,451 |
| Class B | | 727,725 | | | | 256,606 |
| Class C | | 334,204 | | | | 143,592 |
| Institutional Class | | 43,770 | | | | 39,302 |
| Total | | $ 2,204,610 | | $ | | 1,058,918 |
Telecommunications & Utilities Growth
10. Share Transactions.
Transactions for each class of shares were as follows:
| | | | | Shares | | | | | | Dollars |
| Years ended July 31, | | 2005 | | | | 2004 | | 2005 | | | | 2004 |
| Class A | | | | | | | | | | | | |
| Shares sold | | 617,343 | | | | 298,298 | | $ 8,551,655 | | $ | | 3,438,753 |
| Reinvestment of distributions | | 25,986 | | | | 17,065 | | 343,477 | | | | 183,774 |
| Shares redeemed | | (539,379) | | | | (595,057) | | (7,330,607) | | | | (6,759,275) |
| Net increase (decrease) | | 103,950 | | | | (279,694) | | $ 1,564,525 | | $ | | (3,136,748) |
| Class T | | | | | | | | | | | | |
| Shares sold | | 578,539 | | | | 494,942 | | $ 7,880,368 | | $ | | 5,575,654 |
| Reinvestment of distributions | | 51,235 | | | | 36,573 | | 676,884 | | | | 392,232 |
| Shares redeemed | | (1,366,525) | | | | (1,480,100) | | (18,576,683) | | | | (16,736,309) |
| Net increase (decrease) | | (736,751) | | | | (948,585) | | $ (10,019,431) | | $ (10,768,423) |
| Class B | | | | | | | | | | | | |
| Shares sold | | 216,806 | | | | 312,692 | | $ 2,882,532 | | $ | | 3,435,209 |
| Reinvestment of distributions | | 47,675 | | | | 21,061 | | 631,927 | | | | 219,667 |
| Shares redeemed | | (1,863,609) | | | | (1,821,311) | | (24,817,850) | | | | (20,266,895) |
| Net increase (decrease) | | (1,599,128) | | | | (1,487,558) | | $ (21,303,391) | | $ (16,612,019) |
| Class C | | | | | | | | | | | | |
| Shares sold | | 270,120 | | | | 267,567 | | $ 3,555,440 | | $ | | 2,967,003 |
| Reinvestment of distributions | | 19,593 | | | | 10,338 | | 258,067 | | | | 108,777 |
| Shares redeemed | | (903,829) | | | | (1,009,938) | | (12,032,784) | | | | (11,224,441) |
| Net increase (decrease) | | (614,116) | | | | (732,033) | | $ (8,219,277) | | $ | | (8,148,661) |
| Institutional Class | | | | | | | | | | | | |
| Shares sold | | 17,262 | | | | 23,573 | | $ 232,429 | | $ | | 273,182 |
| Reinvestment of distributions | | 2,019 | | | | 2,128 | | 26,680 | | | | 22,996 |
| Shares redeemed | | (88,732) | | | | (117,098) | | (1,218,106) | | | | (1,349,031) |
| Net increase (decrease) | | (69,451) | | | | (91,397) | | $ (958,997) | | $ | | (1,052,853) |
Report of Independent Registered Public Accounting Firm
To the Trustees of Fidelity Advisor Series VII and Shareholders of Fidelity Advisor Biotechnology Fund, Fidelity Advisor Consumer Industries Fund, Fidelity Advisor Cyclical Industries Fund, Fidelity Advisor Developing Communications Fund, Fidelity Advisor Electronics Fund, Fidelity Advisor Financial Services Fund, Fidelity Advisor Health Care Fund, Fidelity Advisor Natural Resources Fund, Fidelity Advisor Technology Fund, and Fidelity Advisor Telecommunications & Utilities Growth Fund:
We have audited the accompanying statements of assets and liabilities of Fidelity Advisor Biotechnology Fund, Fidelity Advisor Consumer Industries Fund, Fidelity Advisor Cyclical Industries Fund, Fidelity Advisor Developing Communications Fund, Fidelity Advisor Electronics Fund, Fidelity Advisor Financial Services Fund, Fidelity Advisor Health Care Fund, Fidelity Advisor Natural Resources Fund, Fidelity Advisor Technology Fund, and Fidelity Advisor Telecommunications & Utilities Growth Fund, (collectively, the “Funds”), including the portfolios of investments, as of July 31, 2005, and the related statements of operations for the year then ended, the statements of changes in net assets for each of the two years in the period then ended, and the financial highlights for the respective stated periods. These financial statements and financial highlights are the responsibility of the Funds’ management. Our responsibility is to express an opinion on these financial statements and financial highlights based on our audits.
We conducted our audits in accordance with standards of the Public Company Accounting Oversight Board (United States). Those standards require that we plan and perform the audit to obtain reasonable assurance about whether the financial statements and financial highlights are free of material misstatement. The funds are not required to have, nor were we engaged to perform, an audit of their internal control over financial reporting. Our audits included consideration of internal control over financial reporting as a basis for designing audit procedures that are appropriate in the circumstances, but not for the purpose of expressing an opinion on the effectiveness of the Funds’ internal control over financial reporting. Accordingly, we express no such opinion. An audit also includes examining, on a test basis, evidence supporting the amounts and disclosures in the financial statements, assessing the accounting principles used and significant estimates made by management, as well as evaluating the overall financial statement presentation. Our procedures included confirmation of securities owned as of July 31, 2005, by correspondence with the custodians and brokers; where replies were not received from brokers, we performed other auditing procedures. We believe that our audits provide a reasonable basis for our opinion.
In our opinion, the financial statements and financial highlights referred to above present fairly, in all material respects, the financial position of Fidelity Advisor Biotechnology Fund, Fidelity Advisor Consumer Industries Fund, Fidelity Advisor Cyclical Industries Fund, Fidelity Advisor Developing Communications Fund, Fidelity Advisor Electronics Fund, Fidelity Advisor Financial Services Fund, Fidelity Advisor Health Care Fund, Fidelity Advisor Natural Resources Fund, Fidelity Advisor Technology Fund, and Fidelity Advisor Telecommunications & Utilities Growth Fund, as of July 31, 2005, the results of their operations for the year then ended, the changes in their net assets for each of the two years in the period then ended, and their financial highlights for the respective stated periods, in conformity with accounting principles generally accepted in the United States of America.
/s/DELOITTE & TOUCHE LLP
DELOITTE & TOUCHE LLP
Boston, Massachusetts
September 22, 2005
|
Trustees and Officers
The Trustees, Members of the Advisory Board, and executive officers of the trust and funds, as applicable, are listed below. The Board of Trustees governs each fund and is responsible for protecting the interests of shareholders. The Trustees are experienced executives who meet periodically throughout the year to oversee each fund’s activities, review contractual arrangements with companies that provide services to each fund, and review each fund’s performance. Except for William O. McCoy, Stephen P. Jonas, and Kenneth L. Wolfe, each of the Trustees oversees 320 funds advised by FMR or an affiliate. Mr. McCoy oversees 322 funds advised by FMR or an affiliate. Mr. Jonas and Mr. Wolfe oversee 311 funds advised by FMR or an affiliate.
The Trustees hold office without limit in time except that (a) any Trustee may resign; (b) any Trustee may be removed by written instrument, signed by at least two-thirds of the number of Trustees prior to such removal; (c) any Trustee who requests to be retired or who has become incapac itated by illness or injury may be retired by written instrument signed by a majority of the other Trustees; and (d) any Trustee may be removed at any special meeting of shareholders by a two-thirds vote of the outstanding voting securities of the trust. Each Trustee who is not an interested person (as defined in the 1940 Act) (Independent Trustee), shall retire not later than the last day of the calendar year in which his or her 72nd birthday occurs. The Independent Trustees may waive this mandatory retirement age policy with respect to individual Trustees. The executive officers and Advisory Board Members hold office without limit in time, except that any officer and Advisory Board Member may resign or may be removed by a vote of a majority of the Trustees at any regular meeting or any special meeting of the Trustees. Except as indicated, each individual has held the office shown or other offices in the same company for the past five years.
The fund’s Statement of Additional Information (SAI) includes more information about the Trustees. To request a free copy, call Fidelity at 1-877-208-0098.
Interested Trustees*:
Correspondence intended for each Trustee who is an interested person may be sent to Fidelity Investments, 82 Devonshire Street, Boston, Massa-chusetts 02109.
| Name, Age; Principal Occupation |
| |
| Edward C. Johnson 3d (75)** |
| |
| Year of Election or Appointment: 1980 |
| Mr. Johnson is Chairman of the Board of Trustees. Mr. Johnson serves as Chief Executive Officer, Chairman, and a Director of FMR |
| Corp.; a Director and Chairman of the Board and of the Executive Committee of FMR; Chairman and a Director of Fidelity Man- |
| agement & Research (Far East) Inc.; Chairman and a Director of Fidelity Investments Money Management, Inc.; and Chairman |
| (2001-present) and a Director (2000-present) of FMR Co., Inc. |
| |
| Abigail P. Johnson (43)** |
| |
| Year of Election or Appointment: 2001 |
| Ms. Johnson serves as President of Fidelity Employer Services Company (FESCO) (2005-present). She is President and a Director |
| of Fidelity Investments Money Management, Inc. (2001-present), FMR Co., Inc. (2001-present), and a Director of FMR Corp. Pre- |
| viously, Ms. Johnson served as President and a Director of FMR (2001-2005), Senior Vice President of the Fidelity funds |
| (2001-2005), and managed a number of Fidelity funds. |
| |
| Stephen P. Jonas (52) |
| |
| Year of Election or Appointment: 2005 |
| Mr. Jonas is Senior Vice President of Advisor Biotechnology (2005-present), Advisor Consumer Industries (2005-present), Advisor |
| Cyclical Industries (2005-present), Advisor Developing Communications (2005-present), Advisor Electronics (2005-present), Advi- |
| sor Financial Services (2005-present), Advisor Health Care (2005-present), Advisor Natural Resources (2005-present), Advisor |
| Technology (2005-present), and Advisor Telecommunications & Utilities Growth (2005-present). He also serves as Senior Vice |
| President of other Fidelity funds (2005-present). Mr. Jonas is Executive Director of FMR (2005-present). Previously, Mr. Jonas |
| served as President of Fidelity Enterprise Operations and Risk Services (2004-2005), Chief Administrative Officer (2002-2004), |
| and Chief Financial Officer of FMR Co. (1998-2000). Mr. Jonas has been with Fidelity Investments since 1987 and has held vari- |
| ous financial and management positions including Chief Financial Officer of FMR. In addition, he serves on the Boards of Boston |
| Ballet (2003-present) and Simmons College (2003-present). |
| |
| Robert L. Reynolds (53) |
| |
| Year of Election or Appointment: 2003 |
| Mr. Reynolds is a Director (2003-present) and Chief Operating Officer (2002-present) of FMR Corp. He also serves on the Board |
| at Fidelity Investments Canada, Ltd. (2000-present). Previously, Mr. Reynolds served as President of Fidelity Investments Institutional |
| Retirement Group (1996-2000). |
* Trustees have been determined to be “Interested Trustees” by virtue of, among other things, their affiliation with the trust or various entities under common control with FMR.
** Edward C. Johnson 3d, Trustee, is Abigail P. Johnson’s father.
A-157 Annual Report
Trustees and Officers - continued
Independent Trustees:
Correspondence intended for each Independent Trustee (that is, the Trustees other than the Interested Trustees) may be sent to Fidelity Investments, P.O. Box 55235, Boston, Massachusetts 02205-5235.
| Name, Age; Principal Occupation |
| |
| Dennis J. Dirks (57) |
| |
| Year of Election or Appointment: 2005 |
| Prior to his retirement in May 2003, Mr. Dirks was Chief Operating Officer and a member of the Board of The Depository Trust & |
| Clearing Corporation (DTCC) (1999-2003). He also served as President, Chief Operating Officer, and Board member of The De- |
| pository Trust Company (DTC) (1999-2003) and President and Board member of the National Securities Clearing Corporation |
| (NSCC) (1999-2003). In addition, Mr. Dirks served as Chief Executive Officer and Board member of the Government Securities |
| Clearing Corporation (2001-2003) and Chief Executive Officer and Board member of the Mortgage-Backed Securities Clearing |
| Corporation (2001-2003). Mr. Dirks also serves as a Trustee of Manhattan College (2005-present). |
| |
| Robert M. Gates (61) |
| |
| Year of Election or Appointment: 1997 |
| Dr. Gates is Vice Chairman of the Independent Trustees (2005-present). Dr. Gates is President of Texas A&M University |
| (2002-present). He was Director of the Central Intelligence Agency (CIA) from 1991 to 1993. From 1989 to 1991, Dr. Gates |
| served as Assistant to the President of the United States and Deputy National Security Advisor. Dr. Gates is a Director of NACCO |
| Industries, Inc. (mining and manufacturing), Parker Drilling Co., Inc. (drilling and rental tools for the energy industry, 2001- |
| present), and Brinker International (restaurant management, 2003-present). Previously, Dr. Gates served as a Director of |
| LucasVarity PLC (automotive components and diesel engines), a Director of TRW Inc. (automotive, space, defense, and information |
| technology), and Dean of the George Bush School of Government and Public Service at Texas A&M University (1999-2001). |
| Dr. Gates also is a Trustee of the Forum for International Policy. |
| |
| George H. Heilmeier (69) |
| |
| Year of Election or Appointment: 2004 |
| Dr. Heilmeier is Chairman Emeritus of Telcordia Technologies (communication software and systems), where prior to his retirement, |
| he served as company Chairman and Chief Executive Officer. He currently serves on the Boards of Directors of The Mitre Corpo- |
| ration (systems engineering and information technology support for the government), and HRL Laboratories (private research and |
| development, 2004-present). He is Chairman of the General Motors Science & Technology Advisory Board and a Life Fellow of |
| the Institute of Electrical and Electronics Engineers (IEEE) (2000-present). Dr. Heilmeier is a member of the Defense Science Board |
| and the National Security Agency Advisory Board. He is also a member of the National Academy of Engineering, the American |
| Academy of Arts and Sciences, and the Board of Overseers of the School of Engineering and Applied Science of the University of |
| Pennsylvania. Previously, Dr. Heilmeier served as a Director of TRW Inc. (automotive, space, defense, and information technology, |
| 1992-2002), Compaq (1994-2002), Automatic Data Processing, Inc. (ADP) (technology-based business outsourcing, 1995-2002), |
| INET Technologies Inc. (telecommunications network surveillance, 2001-2004), and Teletech Holdings (customer management ser- |
| vices). He is the recipient of the 2005 Kyoto Prize in Advanced Technology for his invention of the liquid display. |
| |
| Marie L. Knowles (58) |
| |
| Year of Election or Appointment: 2001 |
| Prior to Ms. Knowles’ retirement in June 2000, she served as Executive Vice President and Chief Financial Officer of Atlantic Rich- |
| field Company (ARCO) (diversified energy, 1996-2000). From 1993 to 1996, she was a Senior Vice President of ARCO and |
| President of ARCO Transportation Company. She served as a Director of ARCO from 1996 to 1998. She currently serves as a |
| Director of Phelps Dodge Corporation (copper mining and manufacturing) and McKesson Corporation (healthcare service, |
| 2002-present). Ms. Knowles is a Trustee of the Brookings Institution and the Catalina Island Conservancy and also serves as a |
| member of the Advisory Board for the School of Engineering of the University of Southern California. |
| |
| Ned C. Lautenbach (61) |
| |
| Year of Election or Appointment: 2000 |
| Mr. Lautenbach has been a partner of Clayton, Dubilier & Rice, Inc. (private equity investment firm) since September 1998. Pre- |
| viously, Mr. Lautenbach was with the International Business Machines Corporation (IBM) from 1968 until his retirement in 1998. |
| Mr. Lautenbach serves as a Director of Italtel Holding S.p.A. (telecommunications (Milan, Italy), 2004-present) and Eaton Corpora- |
| tion (diversified industrial) as well as the Philharmonic Center for the Arts in Naples, Florida. He also is a member of the Board of |
| Trustees of Fairfield University (2005-present), as well as a member of the Council on Foreign Relations. |
Annual Report A-158
| Name, Age; Principal Occupation |
| |
| Marvin L. Mann (72) |
| |
| Year of Election or Appointment: 1993 |
| Mr. Mann is Chairman of the Independent Trustees (2001-present). He is Chairman Emeritus of Lexmark International, Inc. (com- |
| puter peripherals), where he served as CEO until April 1998, retired as Chairman May 1999, and remains a member of the |
| Board. Prior to 1991, he held the positions of Vice President of International Business Machines Corporation (IBM) and President |
| and General Manager of various IBM divisions and subsidiaries. He is a member of the Executive Committee of the Independent |
| Director’s Council of the Investment Company Institute. In addition, Mr. Mann is a member of the President’s Cabinet at the Univer- |
| sity of Alabama and the Board of Visitors of the Culverhouse College of Commerce and Business Administration at the University |
| of Alabama. |
| |
| William O. McCoy (71) |
| |
| Year of Election or Appointment: 1997 |
| Prior to his retirement in December 1994, Mr. McCoy was Vice Chairman of the Board of BellSouth Corporation (telecommunica- |
| tions) and President of BellSouth Enterprises. He is currently a Director of Liberty Corporation (holding company), Duke Realty Cor- |
| poration (real estate), and Progress Energy, Inc. (electric utility). He is also a partner of Franklin Street Partners (private investment |
| management firm) and a member of the Research Triangle Foundation Board. In addition, Mr. McCoy served as the Interim Chan- |
| cellor (1999-2000) and a member of the Board of Visitors for the University of North Carolina at Chapel Hill and currently serves |
| on the Board of Directors of the University of North Carolina Health Care System and the Board of Visitors of the Kenan-Flagler |
| Business School (University of North Carolina at Chapel Hill). He also served as Vice President of Finance for the University of |
| North Carolina (16-school system). |
| |
| Cornelia M. Small (61) |
| |
| Year of Election or Appointment: 2005 |
| Ms. Small is a member (2000-present) and Chairperson (2002-present) of the Investment Committee, and a member |
| (2002-present) of the Board of Trustees of Smith College. Previously, she served as Chief Investment Officer (1999-2000), Director |
| of Global Equity Investments (1996-1999), and a member of the Board of Directors of Scudder, Stevens & Clark (1990-1997) and |
| Scudder Kemper Investments (1997-1998). In addition, Ms. Small served as Co-Chair (2000-2003) of the Annual Fund for the |
| Fletcher School of Law and Diplomacy. |
| |
| William S. Stavropoulos (66) |
| |
| Year of Election or Appointment: 2001 |
| Mr. Stavropoulos is Chairman of the Board (2000-present) and a Member of the Board of Directors of The Dow Chemical Com- |
| pany. Since joining The Dow Chemical Company in 1967, Mr. Stavropoulos served in numerous senior management positions, |
| including President (1993-2000; 2002-2003), CEO (1995-2000; 2002-2004), and Chairman of the Executive Committee |
| (2000-2004). Currently, he is a Director of NCR Corporation (data warehousing and technology solutions), BellSouth Corporation |
| (telecommunications), Chemical Financial Corporation, Maersk Inc. (industrial conglomerate, 2002-present), and Metalmark Capi- |
| tal (private equity investment firm, 2005-present). He also serves as a member of the Board of Trustees of the American Enterprise |
| Institute for Public Policy Research. In addition, Mr. Stavropoulos is a member of The Business Council, J.P. Morgan International |
| Council and the University of Notre Dame Advisory Council for the College of Science. |
| |
| Kenneth L. Wolfe (66) |
| |
| Year of Election or Appointment: 2005 |
| Mr. Wolfe also serves as a Trustee (2005-present) or Member of the Advisory Board (2004-present) of other investment companies |
| advised by FMR. Prior to his retirement in 2001, Mr. Wolfe was Chairman and Chief Executive Officer of Hershey Foods Corpora- |
| tion (1993-2001). He currently serves as a member of the boards of Adelphia Communications Corporation (2003-present), |
| Bausch & Lomb, Inc., and Revlon Inc. (2004-present). |
Advisory Board Members and Executive Officers:
Correspondence intended for Mr. Gamper may be sent to Fidelity Investments, P.O. Box 55235, Boston, Massachusetts 02205-5235. Correspondence intended for each executive officer and Mr. Lynch may be sent to Fidelity Investments, 82 Devonshire Street, Boston, Massachusetts 02109.
| Name, Age; Principal Occupation |
| |
| Albert R. Gamper, Jr. (63) |
| |
| Year of Election or Appointment: 2005 |
| Member of the Advisory Board of Fidelity Advisor Series VII. Prior to his retirement in December 2004, Mr. Gamper served as |
| Chairman of the Board of CIT Group Inc. (commercial finance). During his tenure with CIT Group Inc. Mr. Gamper served in nu- |
| merous senior management positions, including Chairman (1987-1989; 1999-2001; 2002-2004), Chief Executive Officer |
| (1987-2004), and President (1989-2002). He currently serves as a member of the Board of Directors of Public Service Enterprise |
| Group (utilities, 2001-present), Chairman of the Board of Governors, Rutgers University (2004-present), and Chairman of the |
| Board of Saint Barnabas Health Care System. |
A-159 Annual Report
Trustees and Officers - continued
| Name, Age; Principal Occupation |
| |
| Peter S. Lynch (61) |
| |
| Year of Election or Appointment: 2003 |
| Member of the Advisory Board of Fidelity Advisor Series VII. Vice Chairman and a Director of FMR, and Vice Chairman |
| (2001-present) and a Director (2000-present) of FMR Co., Inc. Previously, Mr. Lynch served as a Trustee of the Fidelity funds |
| (1990-2003). In addition, he serves as a Trustee of Boston College, Massachusetts Eye & Ear Infirmary, Historic Deerfield, John F. |
| Kennedy Library, and the Museum of Fine Arts of Boston. |
| |
| Eric D. Roiter (56) |
| |
| Year of Election or Appointment: 1998 or 2000 |
| Secretary of Advisor Biotechnology (2000), Advisor Consumer Industries (1998), Advisor Cyclical Industries (1998), Advisor De- |
| veloping Communications (2000), Advisor Electronics (2000), Advisor Financial Services (1998), Advisor Health Care (1998), |
| Advisor Natural Resources (1998), Advisor Technology (1998), and Advisor Telecommunications & Utilities Growth (1998). He |
| also serves as Secretary of other Fidelity funds; Vice President, General Counsel, and Secretary of FMR Co., Inc. (2001-present) |
| and FMR; Assistant Secretary of Fidelity Management & Research (U.K.) Inc. (2001-present), Fidelity Management & Research (Far |
| East) Inc. (2001-present), and Fidelity Investments Money Management, Inc. (2001-present). Mr. Roiter is an Adjunct Member, |
| Faculty of Law, at Boston College Law School (2003-present).Previously, Mr. Roiter served as Vice President and Secretary of |
| Fidelity Distributors Corporation (FDC) (1998-2005). |
| |
| Stuart Fross (45) |
| |
| Year of Election or Appointment: 2003 |
| Assistant Secretary of Advisor Biotechnology, Advisor Consumer Industries, Advisor Cyclical Industries, Advisor Developing Com- |
| munications, Advisor Electronics, Advisor Financial Services, Advisor Health Care, Advisor Natural Resources, Advisor Technology, |
| and Advisor Telecommunications & Utilities Growth. Mr. Fross also serves as Assistant Secretary of other Fidelity funds |
| (2003-present), Vice President and Secretary of FDC (2005-present), and is an employee of FMR. |
| |
| Christine Reynolds (46) |
| |
| Year of Election or Appointment: 2004 |
| President, Treasurer, and Anti-Money Laundering (AML) officer of Advisor Biotechnology, Advisor Consumer Industries, Advisor |
| Cyclical Industries, Advisor Developing Communications, Advisor Electronics, Advisor Financial Services, Advisor Health Care, |
| Advisor Natural Resources, Advisor Technology, and Advisor Telecommunications & Utilities Growth. Ms. Reynolds also serves as |
| President, Treasurer, and AML officer of other Fidelity funds (2004) and is a Vice President (2003) and an employee (2002) of |
| FMR. Before joining Fidelity Investments, Ms. Reynolds worked at PricewaterhouseCoopers LLP (PwC) (1980-2002), where she was |
| most recently an audit partner with PwC’s investment management practice. |
| |
| Timothy F. Hayes (54) |
| |
| Year of Election or Appointment: 2002 |
| Chief Financial Officer of Advisor Biotechnology, Advisor Consumer Industries, Advisor Cyclical Industries, Advisor Developing |
| Communications, Advisor Electronics, Advisor Financial Services, Advisor Health Care, Advisor Natural Resources, Advisor |
| Technology, and Advisor Telecommunications & Utilities Growth. Mr. Hayes also serves as Chief Financial Officer of other Fidelity |
| funds (2002-present) and President of Fidelity Investment Operations (2005-present) which includes Fidelity Pricing and Cash Man- |
| agement Services Group (FPCMS), where he served as President (1998-2005). Mr. Hayes serves as President of Fidelity Service |
| Company (2003-present) where he also serves as a Director. Mr. Hayes also served as President of Fidelity Investments Operations |
| Group (FIOG, 2002-2005). |
| |
| Kenneth A. Rathgeber (58) |
| |
| Year of Election or Appointment: 2004 |
| Chief Compliance Officer of Advisor Biotechnology, Advisor Consumer Industries, Advisor Cyclical Industries, Advisor Developing |
| Communications, Advisor Electronics, Advisor Financial Services, Advisor Health Care, Advisor Natural Resources, Advisor |
| Technology, and Advisor Telecommunications & Utilities Growth. Mr. Rathgeber also serves as Chief Compliance Officer of other |
| Fidelity funds (2004) and Executive Vice President of Risk Oversight for Fidelity Investments (2002). Previously, he served as Execu- |
| tive Vice President and Chief Operating Officer for Fidelity Investments Institutional Services Company, Inc. (1998-2002). |
| |
| John R. Hebble (47) |
| |
| Year of Election or Appointment: 2003 |
| Deputy Treasurer of Advisor Biotechnology, Advisor Consumer Industries, Advisor Cyclical Industries, Advisor Developing Commu- |
| nications, Advisor Electronics, Advisor Financial Services, Advisor Health Care, Advisor Natural Resources, Advisor Technology, |
| and Advisor Telecommunications & Utilities Growth. Mr. Hebble also serves as Deputy Treasurer of other Fidelity funds (2003), and |
| is an employee of FMR. Before joining Fidelity Investments, Mr. Hebble worked at Deutsche Asset Management where he served as |
| Director of Fund Accounting (2002-2003) and Assistant Treasurer of the Scudder Funds (1998-2003). |
Annual Report A-160
| Name, Age; Principal Occupation |
| |
| Bryan A. Mehrmann (44) |
| |
| Year of Election or Appointment: 2005 |
| Deputy Treasurer of Advisor Biotechnology, Advisor Consumer Industries, Advisor Cyclical Industries, Advisor Developing Commu- |
| nications, Advisor Electronics, Advisor Financial Services, Advisor Health Care, Advisor Natural Resources, Advisor Technology, |
| and Advisor Telecommunications & Utilities Growth. Mr. Mehrmann also serves as Deputy Treasurer of other Fidelity funds |
| (2005-present) and is an employee of FMR. Previously, Mr. Mehrmann served as Vice President of Fidelity Investments Institutional |
| Services Group (FIIS)/Fidelity Investments Institutional Operations Corporation, Inc. (FIIOC) Client Services (1998-2004). |
| |
| Kimberley H. Monasterio (41) |
| |
| Year of Election or Appointment: 2004 |
| Deputy Treasurer of Advisor Biotechnology, Advisor Consumer Industries, Advisor Cyclical Industries, Advisor Developing Commu- |
| nications, Advisor Electronics, Advisor Financial Services, Advisor Health Care, Advisor Natural Resources, Advisor Technology, |
| and Advisor Telecommunications & Utilities Growth. Ms. Monasterio also serves as Deputy Treasurer of other Fidelity funds (2004) |
| and is an employee of FMR (2004). Before joining Fidelity Investments, Ms. Monasterio served as Treasurer (2000-2004) and |
| Chief Financial Officer (2002-2004) of the Franklin Templeton Funds and Senior Vice President of Franklin Templeton Services, LLC |
| (2000-2004). |
| |
| Kenneth B. Robins (35) |
| |
| Year of Election or Appointment: 2005 |
| Deputy Treasurer of Advisor Biotechnology, Advisor Consumer Industries, Advisor Cyclical Industries, Advisor Developing Commu- |
| nications, Advisor Electronics, Advisor Financial Services, Advisor Health Care, Advisor Natural Resources, Advisor Technology, |
| and Advisor Telecommunications & Utilities Growth. Mr. Robins also serves as Deputy Treasurer of other Fidelity funds (2005- |
| present) and is an employee of FMR (2004-present). Before joining Fidelity Investments, Mr. Robins worked at KPMG LLP, where he |
| was a partner in KPMG’s department of professional practice (2002-2004) and a Senior Manager (1999-2000). In addition, Mr. |
| Robins served as Assistant Chief Accountant, United States Securities and Exchange Commission (2000-2002). |
| |
| Robert G. Byrnes (38) |
| |
| Year of Election or Appointment: 2005 |
| Assistant Treasurer of Advisor Biotechnology, Advisor Consumer Industries, Advisor Cyclical Industries, Advisor Developing Com- |
| munications, Advisor Electronics, Advisor Financial Services, Advisor Health Care, Advisor Natural Resources, Advisor Technology, |
| and Advisor Telecommunications & Utilities Growth. Mr. Byrnes also serves as Assistant Treasurer of other Fidelity funds |
| (2005-present) and is an employee of FMR (2005-present). Previously, Mr. Byrnes served as Vice President of FPCMS |
| (2003-2005). Before joining Fidelity Investments, Mr. Byrnes worked at Deutsche Asset Management where he served as Vice |
| President of the Investment Operations Group (2000-2003). |
| |
| John H. Costello (58) |
| |
| Year of Election or Appointment: 1987, 1996, or 2000 |
| Assistant Treasurer of Advisor Biotechnology (2000), Advisor Consumer Industries (1996), Advisor Cyclical Industries (1996), Ad- |
| visor Developing Communications (2000), Advisor Electronics (2000), Advisor Financial Services (1996), Advisor Health Care |
| (1996), Advisor Natural Resources (1987), Advisor Technology (1996), and Advisor Telecommunications & Utilities Growth |
| (1996). Mr. Costello also serves as Assistant Treasurer of other Fidelity funds and is an employee of FMR. |
| |
| Peter L. Lydecker (51) |
| |
| Year of Election or Appointment: 2004 |
| Assistant Treasurer of Advisor Biotechnology, Advisor Consumer Industries, Advisor Cyclical Industries, Advisor Developing Com- |
| munications, Advisor Electronics, Advisor Financial Services, Advisor Health Care, Advisor Natural Resources, Advisor Technology, |
| and Advisor Telecommunications & Utilities Growth. Mr. Lydecker also serves as Assistant Treasurer of other Fidelity funds (2004) |
| and is an employee of FMR. |
| |
| Mark Osterheld (50) |
| |
| Year of Election or Appointment: 2002 |
| Assistant Treasurer of Advisor Biotechnology, Advisor Consumer Industries, Advisor Cyclical Industries, Advisor Developing Com- |
| munications, Advisor Electronics, Advisor Financial Services, Advisor Health Care, Advisor Natural Resources, Advisor Technology, |
| and Advisor Telecommunications & Utilities Growth. Mr. Osterheld also serves as Assistant Treasurer of other Fidelity funds (2002) |
| and is an employee of FMR. |
A-161 Annual Report
Trustees and Officers - continued
| Name, Age; Principal Occupation |
| |
| Gary W. Ryan (46) |
| |
| Year of Election or Appointment: 2005 |
| Assistant Treasurer of Advisor Biotechnology, Advisor Consumer Industries, Advisor Cyclical Industries, Advisor Developing Com- |
| munications, Advisor Electronics, Advisor Financial Services, Advisor Health Care, Advisor Natural Resources, Advisor Technology, |
| and Advisor Telecommunications & Utilities Growth. Mr. Ryan also serves as Assistant Treasurer of other Fidelity funds (2005- |
| present) and is an employee of FMR (2005-present). Previously, Mr. Ryan served as Vice President of Fund Reporting in FPCMS |
| (1999-2005). |
| |
| Salvatore Schiavone (39) |
| |
| Year of Election or Appointment: 2005 |
| Assistant Treasurer of Advisor Biotechnology, Advisor Consumer Industries, Advisor Cyclical Industries, Advisor Developing Com- |
| munications, Advisor Electronics, Advisor Financial Services, Advisor Health Care, Advisor Natural Resources, Advisor Technology, |
| and Advisor Telecommunications & Utilities Growth. Mr. Schiavone also serves as Assistant Treasurer of other Fidelity funds |
| (2005-present) and is an employee of FMR (2005-present). Before joining Fidelity Investments, Mr. Schiavone worked at Deutsche |
| Asset Management, where he most recently served as Assistant Treasurer (2003-2005) of the Scudder Funds and Vice President |
| and Head of Fund Reporting (1996-2003). |
Annual Report A-162
The Board of Trustees of each fund voted to pay to shareholders of record at the opening of business on record date, the following distributions per share derived from capital gains realized from sales of portfolio securities, and dividends derived from net investment income:
| Consumer Industries | | Pay Date | | Record Date | | | | Dividends | | Capital Gains |
| Class A | | 09/19/05 | | 09/16/05 | | $ | | — | | $ | | .02 |
| Class T | | 09/19/05 | | 09/16/05 | | $ | | — | | $ | | .02 |
| Class B | | 09/19/05 | | 09/16/05 | | $ | | — | | $ | | .02 |
| Class C | | 09/19/05 | | 09/16/05 | | $ | | — | | $ | | .02 |
| Cyclical Industries | | Pay Date | | Record Date | | | | Dividends | | Capital Gains |
| Class A | | 09/19/05 | | 09/16/05 | | $ | | — | | $ | | .978 |
| Class T | | 09/19/05 | | 09/16/05 | | $ | | — | | $ | | .944 |
| Class B | | 09/19/05 | | 09/16/05 | | $ | | — | | $ | | .894 |
| Class C | | 09/19/05 | | 09/16/05 | | $ | | — | | $ | | .903 |
| Financial Services | | Pay Date | | Record Date | | | | Dividends | | Capital Gains |
| Class A | | 09/19/05 | | 09/16/05 | | $ | | .179 | | $ | | 1.39 |
| Class T | | 09/19/05 | | 09/16/05 | | $ | | .09 | | $ | | 1.39 |
| Class B | | 09/19/05 | | 09/16/05 | | $ | | — | | $ 1.332 |
| Class C | | 09/19/05 | | 09/16/05 | | $ | | — | | $ | | 1.36 |
| Natural Resources | | Pay Date | | Record Date | | | | Dividends | | Capital Gains |
| Class A | | 09/12/05 | | 09/09/05 | | $ | | — | | $ | | 3.93 |
| Class T | | 09/12/05 | | 09/09/05 | | $ | | — | | $ | | 3.81 |
| Class B | | 09/12/05 | | 09/09/05 | | $ | | — | | $ | | 3.67 |
| Class C | | 09/12/05 | | 09/09/05 | | $ | | — | | $ | | 3.73 |
| Telecommunications & Utilities Growth | | Pay Date | | Record Date | | | | Dividends | | Capital Gains |
| Class A | | 09/19/05 | | 09/16/05 | | $ | | .195 | | $ | | — |
| Class T | | 09/19/05 | | 09/16/05 | | $ | | .137 | | $ | | — |
| Class B | | 09/19/05 | | 09/16/05 | | $ | | .056 | | $ | | — |
| Class C | | 09/19/05 | | 09/16/05 | | $ | | .071 | | $ | | — |
The funds hereby designate as capital gain dividends the amounts noted below for the taxable year indicated or for dividends for the taxable year ended 2005, if subsequently determined to be different, the net capital gain of such year; and for dividends for the taxable year ended 2004, if subsequently determined to be different, the excess of: (a) the net capital gain of such year, over (b) amounts previously designated as capital gain dividends with respect to such year.
| Fund | | July 31, 2005 | | July 31, 2004 |
| Consumer Industries | | 101,875 | | 1,928,104 |
| Cyclical Industries | | 4,639,975 | | 1,346,098 |
| Financial Services | | 27,457,198 | | 32,085,929 |
| Natural Resources | | 43,058,271 | | 0 |
A percentage of the dividends distributed during the fiscal year for the following funds qualifies for the dividends-received deduction for cor porate shareholders:
| Cyclical Industries | | September 2004 | | December 2004 |
| Class A | | 31% | | 78% |
| Class T | | 34% | | 85% |
| Class B | | 60% | | 100% |
| Class C | | 65% | | 100% |
| Financial Services | | | | |
| Class A | | — | | 100% |
| Class T | | — | | 100% |
| Class B | | — | | 100% |
| Class C | | — | | 100% |
Distributions - continued
|
| Natural Resources | | September 2004 | | December 2004 |
| Class A | | — | | 100% |
| Class T | | — | | 100% |
| Class B | | — | | — |
| Class C | | — | | — |
| Technology | | | | |
| Class A | | — | | 100% |
| Class T | | — | | 100% |
| Class B | | — | | 100% |
| Class C | | — | | 100% |
| Telecommunications & Utilities Growth | | | | |
| Class A | | 100% | | 100% |
| Class T | | 100% | | 100% |
| Class B | | 100% | | 100% |
| Class C | | 100% | | 100% |
A percentage of the dividends distributed during the fiscal year for the following funds as amounts which may be taken into account as a dividend for purposes of the maximum rate under section 1(h)(11) of the Internal Revenue Code.
| Cyclical Industries | | September 2004 | | December 2004 |
| Class A | | 53% | | 48% |
| Class T | | 57% | | 53% |
| Class B | | 100% | | 88% |
| Class C | | 100% | | 88% |
| Financial Services | | | | |
| Class A | | — | | 100% |
| Class T | | — | | 100% |
| Class B | | — | | 100% |
| Class C | | — | | 100% |
| Natural Resources | | | | |
| Class A | | — | | 100% |
| Class T | | — | | 100% |
| Class B | | — | | — |
| Class C | | — | | — |
| Technology | | September 2004 | | December 2004 |
| Class A | | — | | 100% |
| Class T | | — | | 100% |
| Class B | | — | | 100% |
| Class C | | — | | 100% |
| Telecommunications & Utilities Growth | | | | |
| Class A | | 100% | | 100% |
| Class T | | 100% | | 100% |
| Class B | | 100% | | 100% |
| Class C | | 100% | | 100% |
The funds will notify shareholders in January 2006 of amounts for use in preparing 2005 income tax returns.
Board Approval of Investment Advisory Contracts and Management Fees
Each year, typically in July, the Board of Trustees, including the independent Trustees (together, the Board), votes on the renewal of the management contract and sub-advisory agreements (together, the Advisory Contracts) for each fund. The Board, assisted by the advice of fund counsel and independent Trustees’ counsel, requests and considers a broad range of information throughout the year.
The Board meets regularly each month except August and takes into account throughout the year matters bearing on Advisory Contracts. The Board, acting directly and through its separate committees, considers at each of its meetings factors that are relevant to the annual renewal of each fund’s Advisory Contracts, including the services and support provided to each fund and its shareholders by Fidelity. At the time of the renewal, the Board had 11 standing committees, each composed of independent Trustees with varying backgrounds, to which the Board has assigned specific subject matter responsibilities in order to enhance effective decision-making by the Board. Each committee has adopted a written charter outlining the structure and purposes of the committee. One such committee, the Equity Contract Committee, meets periodically during the first six months of each year and as necessary to consider matters specifically related to the annual renewal of Advisory Contracts. The committee requests and receives information on, and makes recommendations to the independent Trustees concerning, the approval and annual review of the Advisory Contracts.
At its July 2005 meeting, the Board of Trustees, including the independent Trustees, unanimously determined to renew the Advisory Contracts for each fund. In reaching its determination, the Board considered all factors it believed relevant, including (1) the nature, extent, and quality of the services to be provided to each fund and its shareholders by Fidelity (including the investment performance of each fund); (2) the competitiveness of the management fee and total expenses of each fund; (3) the total costs of the services to be provided by and the profits to be realized by the investment adviser and its affiliates from the relationship with each fund; (4) the extent to which economies of scale would be realized as each fund grows; and (5) whether fee levels reflect these economies of scale, if any, for the benefit of fund shareholders.
In determining whether to renew the Advisory Contracts for each fund, the Board ultimately reached a determination, with the assistance of fund counsel and independent Trustees’ counsel, that the renewal of the Advisory Contracts and the compensation to be received by Fidelity under the management contracts is consistent with Fidelity’s fiduciary duty under applicable law. In addition to evaluating the specific factors noted above, the Board, in reaching its determination, is aware that shareholders in each fund have a broad range of investment choices available to them, including a wide choice among mutual funds offered by competitors to Fidelity, and that each fund’s shareholders, with the opportunity to review and weigh the disclosure provided by the fund in its prospectus and other public disclosures, have chosen to invest in that fund, managed by Fidelity.
Nature, Extent, and Quality of Services Provided by Fidelity. The Board considered staffing within the investment adviser, FMR, and the sub-advisers (together, the Investment Advisers), including the backgrounds of the funds’ portfolio managers and the funds’ investment objectives and disciplines. The independent Trustees also had discussions with senior management of Fidelity’s investment operations and investment groups. The Board considered the structure of the portfolio manager compensation program and whether this structure provides appropriate incentives.
Fidelity Resources Dedicated to Investment Management and Support Services. The Board reviewed the size, education, and experience of the Investment Advisers’ investment staff, their use of technology, and the Investment Advisers’ approach to recruiting, training, and retaining portfolio managers and other research, advisory, and management personnel. The Board considered Fidelity’s extensive global research capabilities that enable the Investment Advisers to aggregate data from various sources in an effort to produce positive investment results. The Board noted that Fidelity’s analysts have access to a variety of technological tools that enable them to perform both fundamental and quantitative analysis and to specialize in various disciplines. The Board also considered that Fidelity’s portfolio managers and analysts have access to daily portfolio attribution that allows for monitoring of a fund’s portfolio, as well as an electronic communication system that provides immediate real-time access to research concerning issuers and credit enhancers.
Shareholder and Administrative Services. The Board considered the nature, extent, quality, and cost of administrative, distribution, and shareholder services performed by the Investment Advisers and their affiliates under the Advisory Contracts and under separate agreements covering transfer agency, pricing and bookkeeping, and securities lending services for each fund. The Board also considered the nature and extent of the Investment Advisers’ supervision of third party service providers, principally custodians and subcustodians. The Board reviewed the allocation of fund brokerage, including allocations to brokers affiliated with the Investment Advisers, the use of brokerage commissions to pay fund expenses, and the use of “soft” commission dollars to pay for research services. The Board also considered that Fidelity voluntarily decided in 2004 to stop using “soft” commission dollars to pay for market data and, instead, to pay for that data out of its own resources. The Board also considered the resources devoted to, and the record of compliance with, each fund’s compliance policies and procedures.
The Board noted that the growth of fund assets across the complex allows Fidelity to reinvest in the development of services designed to enhance the value or convenience of the Fidelity funds as investment vehicles. These services include 24-hour access to account information and market information through phone representatives and over the Internet, and investor education materials and asset allocation tools.
Investment in a Large Fund Family. The Board considered the benefits to shareholders of investing in a Fidelity fund, including the benefits of investing in a fund that is part of a large family of funds offering a variety of investment disciplines and providing for a large variety of mutual fund investor services. For example, fund shareholders are offered the privilege of exchanging shares of a fund for shares of other Fidelity funds, as set forth in the
fund’s prospectus, without paying an additional sales charge. The Board noted that, since the last Advisory Contract renewals in July 2004, Fidelity has taken a number of actions that benefited particular funds, including (i) voluntarily deciding in 2004 to stop using “soft” commission dollars to pay for market data and, instead, to pay for that data out of its own resources, (ii) contractually agreeing to impose management fee reductions and expense limitations on its five Spartan stock index funds and its stock index fund available through variable insurance products, (iii) contractually agreeing to eliminate the management fees on the Fidelity Freedom Funds and the Fidelity Advisor Freedom Funds, (iv) contractually agreeing to reduce the management fees on most of its investment-grade taxable bond funds, and (v) contractually agreeing to impose expense limitations on its retail and Spartan investment-grade taxable bond funds.
Investment Performance and Compliance. The Board considered whether each fund has operated within its investment objective, as well as its record of compliance with its investment restrictions. It also reviewed each fund’s absolute investment performance for each class, as well as each fund’s relative investment performance for each class measured against (i) a Goldman Sachs index that reflects the market sector in which the fund invests (Advisor Consumer Industries, Advisor Cyclical Industries, Advisor Financial Services, Advisor Health Care, Advisor Natural Resources, and Advisor Technology) or a proprietary custom index (Advisor Biotechnology, Advisor Developing Communications, Advisor Electronics, and Advisor Telecommunications & Utilities Growth), and (ii) a peer group of mutual funds over multiple periods. Because each of Advisor Biotechnology, Advisor Developing Communications, and Advisor Electronics had been in existence less than five calendar years, for each fund the following charts considered by the Board show, over the one- and three-year periods ended December 31, 2004, the returns of Class C and Institutional Class of the fund, the returns of a proprietary custom index (“benchmark”), and a range of returns of a peer group of mutual funds identified by Lipper Inc. as having an investment objective similar to that of the fund. For each of Advisor Consumer Industries, Advisor Cyclical Industries, Advisor Financial Services, Advisor Health Care, Advisor Natural Resources, Advisor Technology, and Advisor Telecommunications & Utilities Growth, the following charts considered by the Board show, over the one-, three-, and five-year periods ended December 31, 2004, the returns of Class C and Institutional Class of the fund, the returns of a Goldman Sachs index (or a proprietary custom index, in the case of Telecommunications & Utilities Growth) (“benchmark”), and a range of returns of a peer group of mutual funds identified by Lipper Inc. as having an investment objective similar to that of the fund. The returns of Class C and Institutional Class represent the performance of classes with the highest and lowest 12b-1 fees, respectively (not necessarily with the highest and lowest total expenses). The box within each chart shows the 25th percentile return (bottom of box) and the 75th percentile return (top of box) of the Lipper peer group. Returns shown above the box are in the first quartile and returns shown below the box are in the fourth quartile. The percentage beaten numbers noted below each chart correspond to the percentile box and represent the percentage of funds in the Lipper peer group whose performance was equal to or lower than that of the class indicated. For each of Advisor Biotechnology, Advisor Developing Communications, Advisor Electronics, and Advisor Telecommunications & Utilities Growth, the fund’s proprietary custom index is an index developed and periodically revised by FMR that is a market-capitalization weighted index of securities that meet the fund’s 80% name test.

The Board reviewed the fund’s relative investment performance against its Lipper peer group and stated that the performance of Institutional Class of the fund was in the first quartile for the one-year period and the fourth quartile for the three-year period. The Board noted that FMR does not consider that Lipper peer group to be a meaningful comparison for the fund, however, because the funds in the peer group typically have broader investment mandates than the fund, which focuses on a particular subset of companies within the health and biotechnology industries. The Board also stated that the relative investment performance of the fund was lower than its benchmark over time. The Board considered that the variations in performance among the fund’s classes reflect the variations in class expenses, which result in lower performance for higher expense classes. In the absence of a meaningful peer group comparison for the fund and in consideration of the fund’s exposure to a narrow market sector, the Board focused its review on
Board Approval of Investment Advisory Contracts and Management Fees - continued
the fund’s relative investment performance measured against its benchmark. In light of that comparison, the Board discussed with FMR actions to be taken by FMR to improve the fund’s below-benchmark performance.
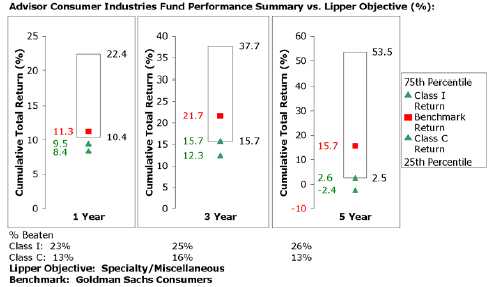
The Board reviewed the fund’s relative investment performance against its Lipper peer group and stated that the performance of Institutional Class of the fund was in the fourth quartile for the one-year period and the third quartile for the three- and five-year periods. The Board noted that FMR does not consider that Lipper peer group to be a meaningful comparison for the fund, however, because the peer group includes funds that focus on different industries and sectors than the fund. The Board also stated that the relative investment performance of the fund was lower than its benchmark over time. The Board considered that the variations in performance among the fund’s classes reflect the variations in class expenses, which result in lower performance for higher expense classes. In the absence of a meaningful peer group comparison for the fund and in consideration of the fund’s exposure to a narrow market sector, the Board focused its review on the fund’s relative investment performance measured against its benchmark. In light of that comparison, the Board discussed with FMR actions to be taken by FMR to improve the fund’s below-benchmark performance.

The Board reviewed the fund’s relative investment performance against its Lipper peer group and stated that the performance of Institutional Class of the fund was in the first quartile for the one-, three-, and five-year periods. The Board noted that FMR does not consider that Lipper peer group to be a meaningful comparison for the fund, however, because the peer group includes funds that focus on different industries and sectors than the fund. The Board also stated that the relative investment performance of Institutional Class of the fund has compared favorably to its benchmark over time. The Board considered that the variations in performance among the fund’s classes reflect the variations in class expenses, which result in lower performance for higher expense classes.

The Board reviewed the fund’s relative investment performance against its Lipper peer group and stated that the performance of Institutional Class of the fund was in the first quartile for the one- and three-year periods. The Board noted that FMR does not consider that Lipper peer group to be a meaningful comparison for the fund, however, because the funds in the peer group typically have broader investment mandates than the fund, which focuses on a particular subset of companies within the science and technology industries. The Board also stated that the relative investment performance of the fund was lower than its benchmark over time. The Board considered that the variations in performance among the fund’s classes reflect the variations in class expenses, which result in lower performance for higher expense classes. In the absence of a meaningful peer group comparison for the fund and in consideration of the fund’s exposure to a narrow market sector, the Board focused its review on the fund’s relative investment performance measured against its benchmark. In light of that comparison, the Board discussed with FMR actions to be taken by FMR to improve the fund’s below-benchmark performance.
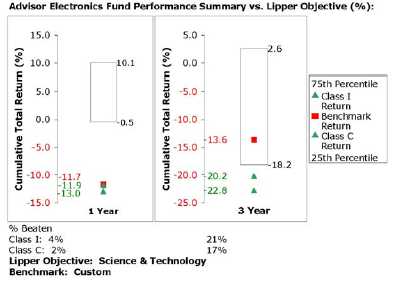
The Board reviewed the fund’s relative investment performance against its Lipper peer group and stated that the performance of Institutional Class of the fund was in the fourth quartile for the one- and three-year periods. The Board noted that FMR does not consider that Lipper peer group to be a meaningful comparison for the fund, however, because the funds in the peer group typically have broader investment mandates than the fund, which focuses on a particular subset of companies within the science and technology industries. The Board also stated that the relative investment performance of the fund was lower than its benchmark over time. The Board considered that the variations in performance among the fund’s classes reflect the variations in class expenses, which result in lower performance for higher expense classes. In the absence of a meaningful peer group comparison for the fund and in consideration of the fund’s exposure to a narrow market sector, the Board focused its review on the fund’s relative investment
Board Approval of Investment Advisory Contracts and Management Fees - continued
performance measured against its benchmark. In light of that comparison, the Board discussed with FMR actions to be taken by FMR to improve the fund’s below-benchmark performance.
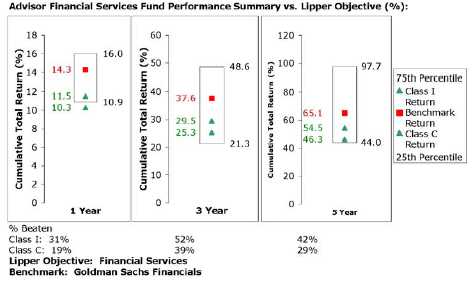
The Board reviewed the fund’s relative investment performance against its Lipper peer group and stated that the performance of Institutional Class of the fund was in the third quartile for the one- and five-year periods and the second quartile for the three-year period. The Board also stated that the relative investment performance of the fund was lower than its benchmark over time. The Board considered that the variations in performance among the fund’s classes reflect the variations in class expenses, which result in lower performance for higher expense classes.

The Board reviewed the fund’s relative investment performance against its Lipper peer group and stated that the performance of Institutional Class of the fund was in the second quartile for the one- and three-year periods and the third quartile for the five-year period. The Board also stated that the relative investment performance of the fund was lower than its benchmark over time, although the one-year cumulative total return of Institutional Class of the fund compared favorably to its benchmark. The Board considered that the variations in performance among the fund’s classes reflect the variations in class expenses, which result in lower performance for higher expense classes.

The Board reviewed the fund’s relative investment performance against its Lipper peer group and stated that the performance of Institutional Class of the fund was in the fourth quartile for the one-year period and the third quartile for the three- and five-year periods. The Board also stated that the relative investment performance of the fund was lower than its benchmark for certain periods, although the five-year cumulative total return of Institutional Class of the fund was higher than its benchmark. The Board considered that the variations in performance among the fund’s classes reflect the variations in class expenses, which result in lower performance for higher expense classes. The Board discussed with FMR actions to be taken by FMR to improve the fund’s disappointing performance.
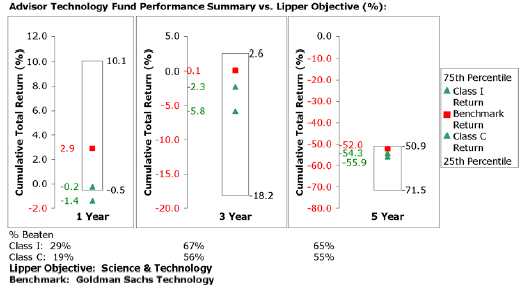
The Board reviewed the fund’s relative investment performance against its Lipper peer group and stated that the performance of Institutional Class of the fund was in the third quartile for the one-year period and the second quartile for the three- and five-year periods. The Board also stated that the relative investment performance of the fund was lower than its benchmark over time. The Board considered that the variations in performance among the fund’s classes reflect the variations in class expenses, which result in lower performance for higher expense classes.
Board Approval of Investment Advisory Contracts and Management Fees - continued
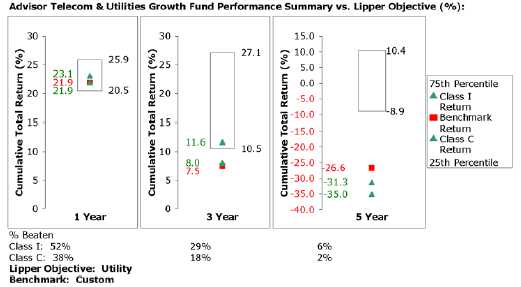
The Board reviewed the fund’s relative investment performance against its Lipper peer group and stated that the performance of Institutional Class of the fund was in the second quartile for the one-year period, the third quartile for the three-year period, and the fourth quartile for the five-year period. The Board also stated that the relative investment performance of Institutional Class of the fund has compared favorably to its benchmark for certain periods, although the fund’s five-year cumulative total return was lower than its benchmark. The Board considered that the variations in performance among the fund’s classes reflect the variations in class expenses, which result in lower performance for higher expense classes.
The Board has had thorough discussions with FMR throughout the year about the Board’s and FMR’s concerns about equity research, equity fund performance, and compliance with internal policies governing gifts and entertainment. FMR has taken steps that it believes will refocus and strengthen equity research and equity portfolio management and compliance. The Board noted with favor FMR’s recent reorganization of its senior management team and FMR’s plans to dedicate additional resources to investment research, and participated in the process that led to those changes.
Based on its review, and giving particular weight to the nature and quality of the resources dedicated by the Investment Advisers to maintain and improve relative performance, the Board concluded that the nature, extent, and quality of the services provided by Fidelity will benefit each fund’s shareholders, particularly in light of the Board’s view that each fund’s shareholders benefit from investing in a fund that is part of a large family of funds offering a variety of investment disciplines and services.
Competitiveness of Management Fee and Total Fund Expenses. The Board considered each fund’s management fee and total expenses compared to “mapped groups” of competitive funds and classes. Fidelity creates “mapped groups” by combining similar Lipper investment objective categories that have comparable management fee characteristics. Combining Lipper investment objective categories aids the Board’s management fee and total expense comparisons by broadening the competitive group used for comparison and by reducing the number of universes to which various Fidelity funds are compared.
The Board considered two proprietary management fee comparisons for the 12-month periods shown in the charts below. The group of Lipper funds used by the Board for management fee comparisons is referred to below as the “Total Mapped Group” and, for the reasons explained above, is broader than the Lipper peer group used by the Board for performance comparisons. The Total Mapped Group comparison focuses on a fund’s standing relative to the total universe of comparable funds available to investors, in terms of gross management fees before expense reimbursements or caps. “TMG %” represents the percentage of funds in the Total Mapped Group that had management fees that were lower than a fund’s. For example, a TMG % of 31% would mean that 69% of the funds in the Total Mapped Group had higher management fees than a fund. The “Asset-Size Peer Group” (ASPG) comparison focuses on a fund’s standing relative to non-Fidelity funds similar in size to the fund within the Total Mapped Group. The ASPG represents at least 15% of the funds in the Total Mapped Group with comparable asset size and management fee characteristics, subject to a minimum of 50 funds (or all funds in the Total Mapped Group if fewer than 50). Additional information, such as the ASPG quartile (“quadrant”) in which a fund’s management fee ranked, is also included in the charts and considered by the Board.
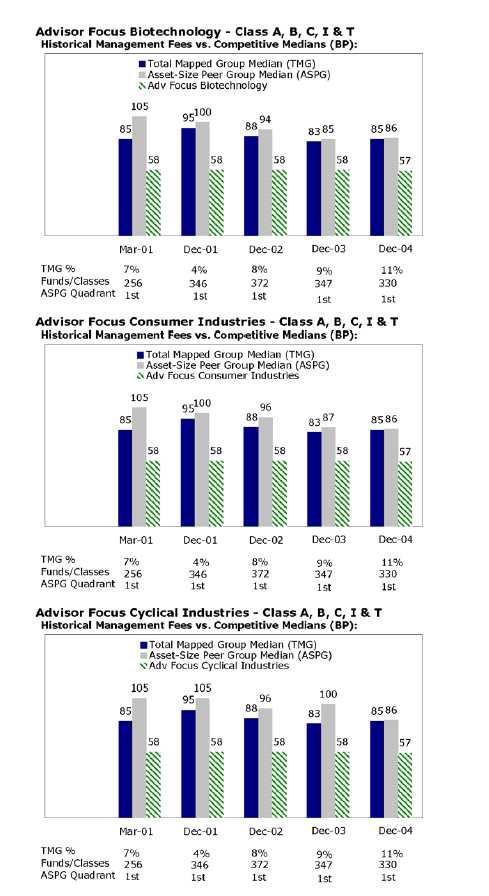
A-173 Annual Report
Board Approval of Investment Advisory Contracts and Management Fees - continued
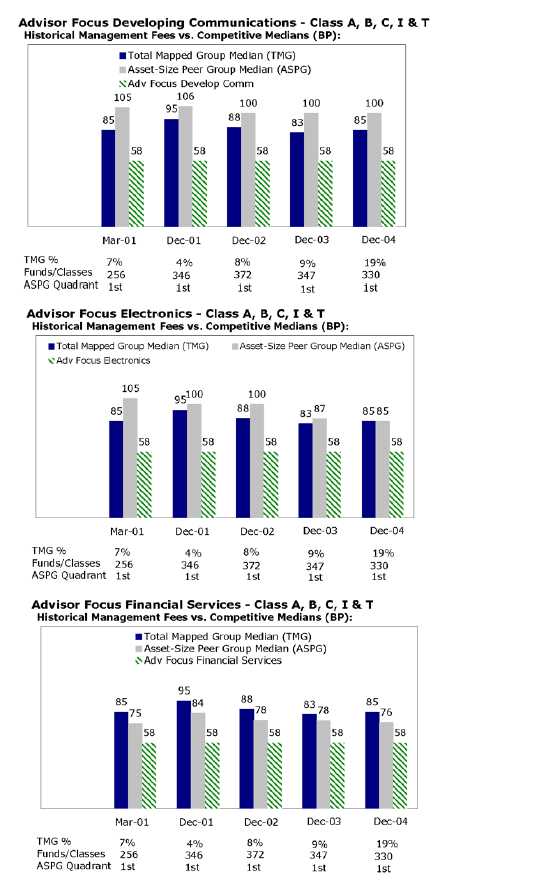
Annual Report A-174
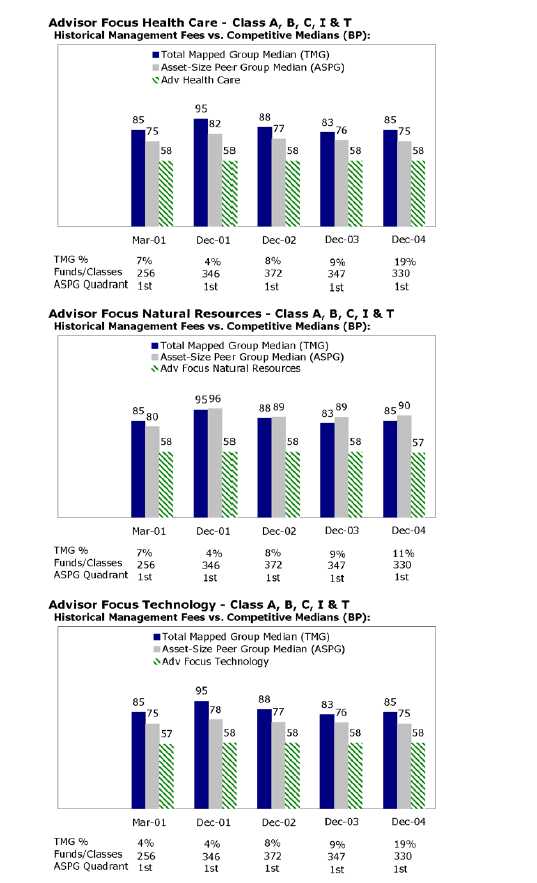
A-175 Annual Report
Board Approval of Investment Advisory Contracts and Management Fees - continued

The Board noted that each fund’s management fee ranked below the median of its Total Mapped Group and below the median of its ASPG for 2004.
Based on its review, the Board concluded that each fund’s management fee was fair and reasonable in light of the services that the fund receives and the other factors considered.
In its review of each class’s total expenses, the Board considered the fund’s management fee as well as other fund or class expenses, as applicable, such as transfer agent fees, pricing and bookkeeping fees, fund-paid 12b-1 fees, and custodial, legal, and audit fees. The Board also noted the effects of any waivers and reimbursements on fees and expenses. As part of its review, the Board also considered current and historical total expenses of each class of each fund compared to competitive fund median expenses. Each class of each fund is compared to those funds and classes in the Total Mapped Group (used by the Board for management fee comparisons) that have a similar sales load structure.
The Board noted that each fund offers multiple classes, each of which has a different sales load and 12b-1 fee structure, and that the multiple structures are intended to offer a range of pricing options for the intermediary market. The Board also noted that the total expenses of the classes of each fund vary primarily by the level of their 12b-1 fees, although differences in transfer agent fees may also cause expenses to vary from class to class.
The Board noted that the total expenses of each of Class A, Class B, Class C and Institutional Class of Advisor Biotechnology Fund ranked below its competitive median for 2004, and the total expenses of Class T of the fund ranked above its competitive median for 2004.
The Board noted that the total expenses of each of Class A, Class B and Class C of Advisor Consumer Industries Fund ranked below its competitive median for 2004, and the total expenses of each of Class T and Institutional Class of the fund ranked above its competitive median for 2004.
The Board noted that the total expenses of each of Class A, Class B and Class C of Advisor Cyclical Industries Fund ranked below its competitive median for 2004, and the total expenses of each of Class T and Institutional Class of the fund ranked above its competitive median for 2004.
The Board noted that the total expenses of each of Class A, Class B and Class C of Advisor Developing Communications Fund ranked below its competitive median for 2004, and the total expenses of each of Class T and Institutional Class of the fund ranked above its competitive median for 2004.
The Board noted that the total expenses of each of Class A, Class B and Class C of Advisor Electronics Fund ranked below its competitive median for 2004, and the total expenses of each of Class T and Institutional Class of the fund ranked above its competitive median for 2004.
The Board noted that the total expenses of each class of Advisor Financial Services Fund ranked below its competitive median for 2004. The Board noted that the total expenses of each class of Advisor Health Care Fund ranked below its competitive median for 2004. The Board noted that the total expenses of each class of Advisor Natural Resources Fund ranked below its competitive median for 2004.
The Board noted that the total expenses of each of Class A, Class B, Class C and Institutional Class of Advisor Technology Fund ranked below its competitive median for 2004, and the total expenses of Class T of the fund ranked above its competitive median for 2004.
The Board noted that the total expenses of each class of Advisor Telecommunications & Utilities Growth Fund ranked above its competitive median for 2004.
In its review of total expenses, the Board also considered Fidelity fee structures and other information on clients that FMR and its affiliates service in other competitive markets, such as other mutual funds advised or subadvised by FMR or its affiliates, pension plan clients, and other institutional clients.
Based on its review, the Board concluded that the total expenses for each class of each fund were reasonable, although in some cases above the median of the universe presented for comparison, in light of the services that the fund and its shareholders receive and the other factors considered.
Costs of the Services and Profitability. The Board considered the revenues earned and the expenses incurred by Fidelity in conducting the business of developing, marketing, distributing, managing, administering and servicing each fund and its shareholders. The Board also considered the level of Fidelity’s profits in respect of all the Fidelity funds.
On an annual basis, FMR presents to the Board Fidelity’s profitability for each fund. Fidelity calculates the profitability for each fund, as well as aggregate profitability for groups of Fidelity funds and all Fidelity funds, using a series of detailed revenue and cost allocation methodologies which originate with the audited books and records of Fidelity. The Audit Committee of the Board reviews any significant changes from the prior year’s methodologies.
PricewaterhouseCoopers LLP (PwC), independent registered accounting firm and auditor to Fidelity and certain Fidelity funds, has been engaged annually by the Board as part of the Board’s assessment of the results of Fidelity’s profitability analysis. PwC’s engagement includes the review and assessment of Fidelity’s methodologies used in determining the revenues and expenses attributable to Fidelity’s mutual fund business, and completion of agreed-upon procedures surrounding the mathematical accuracy of fund profitability and its conformity to allocation methodologies. After considering PwC’s reports issued under the engagement and information provided by Fidelity, the Board believes that while other allocation methods may also be reasonable, Fidelity’s profitability methodologies are reasonable in all material respects.
The Board has also reviewed Fidelity’s non-fund businesses and any fall-out benefits related to the mutual fund business as well as cases where Fidelity’s affiliates may benefit from or be related to the funds’ business. In addition, a special committee of the Board reviewed services provided to Fidelity by its affiliates and determined that the fees that Fidelity paid for such services were reasonable.
The Board considered the costs of the services provided by and the profits realized by Fidelity in connection with the operation of each fund and determined that the amount of profit is a fair entrepreneurial profit for the management of each fund.
Economies of Scale. The Board considered whether there have been economies of scale in respect of the management of the Fidelity funds, whether the Fidelity funds (including each fund) have appropriately benefited from any such economies of scale, and whether there is potential for realization of any further economies of scale. The Board considered the extent to which each fund will benefit from economies of scale through increased services to the fund, through waivers or reimbursements, or through fee or expense reductions, including reductions that occur through operation of the transfer agent agreement. The transfer agent fee varies in part based on the number of accounts in each fund. If the number of accounts decreases or the average account size increases, the overall transfer agent fee rate decreases.
The Board recognized that each fund’s management contract incorporates a “group fee” structure, which provides for lower fee rates as total fund assets under FMR’s management increase, and for higher fee rates as total fund assets under FMR’s management decrease. The Board considered that the group fee is designed to deliver the benefits of economies of scale to fund shareholders when total fund assets increase, even if assets of any particular fund are unchanged or have declined, because some portion of Fidelity’s costs are attributable to services provided to all Fidelity funds, and all funds benefit if those costs can be allocated among more assets. The Board concluded that, given the group fee structure, fund shareholders will achieve a certain level of economies of scale as assets under FMR’s management increase at the fund complex level, regardless of whether Fidelity achieves any such economies of scale.
The Board further concluded that any potential economies of scale are being shared between fund shareholders and Fidelity in an appropriate manner.
Additional Information Requested by the Board. In order to develop fully the factual basis for consideration of the Advisory Contracts, the Board requested additional information regarding (i) equity fund transfer agency fees; (ii) Fidelity’s fund profitability methodology and the impact of various changes in the methodology over time; (iii) benefits to shareholders from economies of scale; (iv) composition and characteristics of various fund and industry data used in comparisons; and (v) compensation of portfolio managers and research analysts.
Based on its evaluation of all of the conclusions noted above, and after considering all material factors, the Board ultimately concluded that the existing advisory fee structures are fair and reasonable, and that each fund’s existing Advisory Contracts should be renewed.
Fidelity Management & Research Company Boston, MA
FMR Co., Inc.
Fidelity Management & Research (U.K.) Inc. Fidelity Management & Research (Far East) Inc. Fidelity Investments Japan Limited Fidelity International Investment Advisors
Fidelity International Investment Advisors (U.K.) Limited
Fidelity Distributors Corporation Boston, MA
Transfer and Service Agents
Fidelity Investments Institutional Operations Company, Inc. Boston, MA
Fidelity Service Company, Inc. Boston, MA
Custodians
JPMorgan Chase Bank
New York, NY
|
Brown Brothers Harriman & Co.† Boston, MA
State Street Bank and Trust††
Quincy, MA
|
†
Custodian for Fidelity Advisor Natural Resources Fund only.
†† Custodian for Fidelity Advisor Biotechnology Fund, Fidelity Advisor Developing Communications Fund, and Fidelity Advisor Electronics Fund only.
AFOC-UANNPRO-0905
1.789241.102

Fidelity Advisor
Focus Funds®
Institutional Class
|
| | Biotechnology
Consumer Industries
Cyclical Industries
Developing Communications
Electronics
Financial Services
Health Care
Natural Resources
Technology
Telecommunications &
Utilities Growth
|
Annual Report
July 31, 2005
|

Contents
| Biotechnology | | A-4 | | Performance |
| | | A-5 | | Management’s Discussion |
| | | A-6 | | Shareholder Expense Example |
| | | A-7 | | Investment Changes |
| | | A-8 | | Investments |
| | | A-10 | | Financial Statements |
| | | A-14 | | Notes to the Financial Statements |
| |
| Consumer Industries | | A-18 | | Performance |
| | | A-19 | | Management’s Discussion |
| | | A-20 | | Shareholder Expense Example |
| | | A-21 | | Investment Changes |
| | | A-22 | | Investments |
| | | A-25 | | Financial Statements |
| | | A-29 | | Notes to the Financial Statements |
| |
| Cyclical Industries | | A-34 | | Performance |
| | | A-35 | | Management’s Discussion |
| | | A-36 | | Shareholder Expense Example |
| | | A-37 | | Investment Changes |
| | | A-38 | | Investments |
| | | A-42 | | Financial Statements |
| | | A-46 | | Notes to the Financial Statements |
| |
| Developing Communications | | A-51 | | Performance |
| | | A-52 | | Management’s Discussion |
| | | A-53 | | Shareholder Expense Example |
| | | A-54 | | Investment Changes |
| | | A-55 | | Investments |
| | | A-57 | | Financial Statements |
| | | A-61 | | Notes to the Financial Statements |
| |
| Electronics | | A-65 | | Performance |
| | | A-66 | | Management’s Discussion |
| | | A-67 | | Shareholder Expense Example |
| | | A-68 | | Investment Changes |
| | | A-69 | | Investments |
| | | A-70 | | Financial Statements |
| | | A-74 | | Notes to the Financial Statements |
| |
| Financial Services | | A-78 | | Performance |
| | | A-79 | | Management’s Discussion |
| | | A-80 | | Shareholder Expense Example |
| | | A-81 | | Investment Changes |
| | | A-82 | | Investments |
| | | A-85 | | Financial Statements |
| | | A-89 | | Notes to the Financial Statements |
| |
| Health Care | | A-94 | | Performance |
| | | A-95 | | Management’s Discussion |
| | | A-96 | | Shareholder Expense Example |
| | | A-97 | | Investment Changes |
| | | A-98 | | Investments |
| | | A-101 | | Financial Statements |
| | | A-105 | | Notes to the Financial Statements |
| Natural Resources | | A-109 | | Performance |
| | | A-110 | | Management’s Discussion |
| | | A-111 | | Shareholder Expense Example |
| | | A-112 | | Investment Changes |
| | | A-113 | | Investments |
| | | A-116 | | Financial Statements |
| | | A-120 | | Notes to the Financial Statements |
| |
| Technology | | A-125 | | Performance |
| | | A-126 | | Management’s Discussion |
| | | A-127 | | Shareholder Expense Example |
| | | A-128 | | Investment Changes |
| | | A-129 | | Investments |
| | | A-132 | | Financial Statements |
| | | A-136 | | Notes to the Financial Statements |
| |
| Telecommunications & | | | | |
| Utilities Growth | | A-141 | | Performance |
| | | A-142 | | Management’s Discussion |
| | | A-143 | | Shareholder Expense Example |
| | | A-144 | | Investment Changes |
| | | A-145 | | Investments |
| | | A-147 | | Financial Statements |
| | | A-151 | | Notes to the Financial Statements |
| |
| Report of Independent | | A-156 | | |
| Registered Public | | | | |
| Accounting Firm | | | | |
| Trustees and Officers | | A-157 | | |
| |
| Distributions | | A-163 | | |
| |
| Board Approval of | | A-164 | | |
| Investment Advisory | | | | |
| Contracts and | | | | |
| Management Fees | | | | |
To view a fund’s proxy voting guidelines and proxy voting record for the 12-month period ended June 30, visit www.fidelity.com/proxyvotingresults or visit the Securities and Exchange Commission’s (SEC) web site at www.sec.gov. You may also call 1-877-208-0098 to request a free copy of the proxy voting guidelines. Standard & Poor’s, S&P and S&P 500 are registered service marks of The McGraw-Hill Companies, Inc. and have been licensed for use by Fidelity Distributors Corporation.
Other third party marks appearing herein are the property of their respective owners.
All other marks appearing herein are registered or unregistered trademarks or service marks of FMR Corp. or an affiliated company.
This report and the financial statements contained herein are submitted for the general information of the shareholders of the funds. This report is not authorized for distribution to prospective investors in the funds unless preceded or accompanied by an effective prospectus.
A fund files its complete schedule of portfolio holdings with the SEC for the first and third quarters of each fiscal year on Form N-Q. Forms N-Q are available on the SEC’s web site at http://www.sec.gov. A fund’s Forms N-Q may be reviewed and copied at the SEC’s Public Reference Room in Wash-ington, DC. Information regarding the operation of the SEC’s Public Reference Room may be obtained by calling 1-800-SEC-0330. For a complete list of a fund’s portfolio holdings, view the most recent quarterly holdings report, semiannual report, or annual report on Fidelity’s web site at http://www.advisor.fidelity.com.
NOT FDIC INSURED · MAY LOSE VALUE · NO BANK GUARANTEE
Neither the funds nor Fidelity Distributors Corporation is a bank.
|
Advisor Biotechnology Fund — Institutional Class
Average annual total return reflects the change in the value of an investment, assuming reinvestment of the class’ dividend income and capital gains (the profits earned upon the sale of securities that have grown in value) and assuming a constant rate of performance each year. The $10,000 table and the fund’s returns do not reflect the deduction of taxes that a shareholder would pay on fund distributions or the redemption of fund shares. During periods of reimbursement by Fidelity, a fund’s total return will be greater than it would be had the reimbursement not occurred. How a fund did yesterday is no guarantee of how it will do tomorrow.
| Average Annual Total Returns | | | | |
| Periods ended July 31, 2005 | | Past 1 | | Life of |
| | | year | | fundA |
| Institutional Class | | 13.70% | | --7.79% |
| |
| A From December 27, 2000. | | | | |
| | $10,000 Over Life of Fund
|
Let’s say hypothetically that $10,000 was invested in Fidelity® Advisor Biotechnology Fund — Institutional Class on December 27, 2000, when the fund started. The chart shows how the value of your investment would have changed, and also shows how the S&P 500® Index performed over the same period.
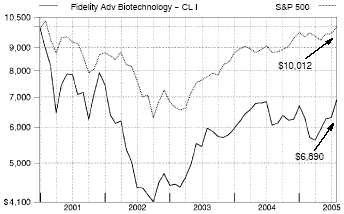
Advisor Biotechnology Fund — Institutional Class
Management’s Discussion of Fund Performance
Comments from Harlan Carere, Portfolio Manager of Fidelity® Advisor Biotechnology Fund
A late-inning rally on Wall Street helped push some key U.S. equity indexes to four-year highs by the conclusion of the 12-month period ending July 31, 2005. Spurred on by bullish economic data and strong corporate earnings, investors enjoyed a stellar month of July, capping off a turbulent 12-month period for U.S. equity markets. Stock prices bounced up and down during most of the year, moving in cadence with gyrations in the price of crude oil and investors’ gathering and ebbing concerns about inflation. The Federal Reserve Board raised short-term interest rates eight times during the period, also affecting overall market sentiment. Despite their fluctuations, the major equity indexes finished on a high note, with the Standard & Poor’s 500SM Index and the NASDAQ Composite® Index posting gains of 14.05% and 16.51%, respectively, for the period. The small-cap Russell 2000® Index rose 24.78% and the Russell Midcap® Index jumped 28.93%, while the blue-chips’ Dow Jones Industrial AverageSM advanced only 7.29% .
For the 12-month period ending July 31, 2005, the fund’s Institutional Class shares returned 13.70%, trailing both the Goldman Sachs® Health Care Index, which rose 18.58%, and the S&P 500®. The fund lagged the sector index largely because of unfavorable stock selection in the biotechnology and pharmaceuticals industries, even though its positioning in those industries produced strongly positive results. The fund also fell short because — given its narrow focus on biotech and pharma — it missed the upside of other stronger-performing segments within the sector, such as managed care. Biotech pioneer Biogen Idec and Irish pharmaceuticals manufacturer Elan saw their share prices fall sharply in response to the voluntary recall of a jointly developed multiple sclerosis drug with dangerous unforeseen side effects. The stocks of certain other drug makers — among them ImClone and Cephalon — also disappointed by not living up to investors’ expectations. On the plus side, performance was helped by the fund’s large stakes in such biotech leaders as Genentech and Celgene, whose stocks did well on strong sales of their flagship cancer drugs, as well as by its holding in Invitrogen.
The views expressed in this statement reflect those of the portfolio manager only through the end of the period of the report as stated on the cover and do not necessarily represent the views of Fidelity or any other person in the Fidelity organization. Any such views are subject to change at any time based upon market or other conditions and Fidelity disclaims any responsibility to update such views. These views may not be relied on as investment advice and, because investment decisions for a Fidelity fund are based on numerous factors, may not be relied on as an indication of trading intent on behalf of any Fidelity fund.
A-5 A-5 Annual Report
Advisor Biotechnology Fund
Shareholder Expense Example
|
As a shareholder of the Fund, you incur two types of costs: (1) transaction costs, including sales charges (loads) on purchase payments or redemption proceeds, redemption fees, and (2) ongoing costs, including management fees, distribution and/or service (12b-1) fees and other Fund expenses. This Example is intended to help you understand your ongoing costs (in dollars) of investing in the Fund and to compare these costs with the ongoing costs of investing in other mutual funds.
The Example is based on an investment of $1,000 invested at the beginning of the period and held for the entire period (February 1, 2005 to July 31, 2005).
The first line of the table below for each class of the Fund provides information about actual account values and actual expenses. You may use the information in this line, together with the amount you invested, to estimate the expenses that you paid over the period. Simply divide your account value by $1,000.00 (for example, an $8,600 account value divided by $1,000.00 = 8.6), then multiply the result by the number in the first line for a class of the Fund under the heading entitled “Expenses Paid During Period” to estimate the expenses you paid on your account during this period.
Hypothetical Example for Comparison Purposes
|
The second line of the table below for each class of the Fund provides information about hypothetical account values and hypothetical expenses based on a Class’ actual expense ratio and an assumed rate of return of 5% per year before expenses, which is not the Class’ actual return. The hypothetical account values and expenses may not be used to estimate the actual ending account balance or expenses you paid for the period. You may use this information to compare the ongoing costs of investing in the Fund and other funds. To do so, compare this 5% hypothetical example with the 5% hypothetical examples that appear in the shareholder reports of the other funds.
Please note that the expenses shown in the table are meant to highlight your ongoing costs only and do not reflect any transaction costs. Therefore, the second line of the table is useful in comparing ongoing costs only, and will not help you determine the relative total costs of owning different funds. In addition, if these transactional costs were included, your costs would have been higher.
| | | | | | | | | Expenses Paid |
| | | Beginning | | | | Ending | | During Period* |
| | | Account Value | | | | Account Value | | February 1, 2005 |
| | | February 1, 2005 | | | | July 31, 2005 | | to July 31, 2005 |
| Class A | | | | | | | | | | |
| Actual | | $ 1,000.00 | | $ | | 1,093.20 | | $ | | 7.27 |
| HypotheticalA | | $ 1,000.00 | | $ | | 1,017.85 | | $ | | 7.00 |
| Class T | | | | | | | | | | |
| Actual | | $ 1,000.00 | | $ | | 1,092.70 | | $ | | 8.56 |
| HypotheticalA | | $ 1,000.00 | | $ | | 1,016.61 | | $ | | 8.25 |
| Class B | | | | | | | | | | |
| Actual | | $ 1,000.00 | | $ | | 1,089.70 | | $ | | 11.14 |
| HypotheticalA | | $ 1,000.00 | | $ | | 1,014.13 | | $ | | 10.74 |
| Class C | | | | | | | | | | |
| Actual | | $ 1,000.00 | | $ | | 1,091.40 | | $ | | 11.15 |
| HypotheticalA | | $ 1,000.00 | | $ | | 1,014.13 | | $ | | 10.74 |
| Institutional Class | | | | | | | | | | |
| Actual | | $ 1,000.00 | | $ | | 1,097.10 | | $ | | 5.41 |
| HypotheticalA | | $ 1,000.00 | | $ | | 1,019.64 | | $ | | 5.21 |
| |
| A 5% return per year before expenses | | | | | | | | | | |
* Expenses are equal to each Class’ annualized expense ratio (shown in the table below); multiplied by the average account value over the period, multiplied by 181/365 (to reflect the one-half year period).
| | | Annualized |
| | | Expense Ratio |
| Class A | | 1.40% |
| Class T | | 1.65% |
| Class B | | 2.15% |
| Class C | | 2.15% |
| Institutional Class | | 1.04% |
Advisor Biotechnology Fund
Investment Changes
|
| Top Ten Stocks as of July 31, 2005 | | |
| | | % of fund’s | | % of fund’s net assets |
| | | net assets | | 6 months ago |
| Genentech, Inc. | | 11.7 | | 9.2 |
| Celgene Corp. | | 7.1 | | 7.0 |
| Amgen, Inc. | | 6.3 | | 2.9 |
| Genzyme Corp. | | 5.0 | | 4.7 |
| Biogen Idec, Inc. | | 5.0 | | 11.0 |
| Gilead Sciences, Inc. | | 4.9 | | 4.0 |
| MedImmune, Inc. | | 4.4 | | 5.5 |
| Sepracor, Inc. | | 4.2 | | 4.8 |
| Invitrogen Corp. | | 4.0 | | 4.0 |
| Cephalon, Inc. | | 4.0 | | 5.2 |
| | | 56.6 | | |
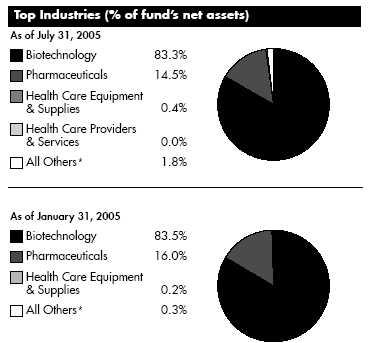
* Includes short term investments and net other assets.
Prior period industry classifications reflect the categories in place as of the date indicated and have not been adjusted to reflect current industry classifications.
A-7 A-7 Annual Report
Advisor Biotechnology Fund
Investments July 31, 2005
Showing Percentage of Net Assets
| Common Stocks — 98.2% | | | | | | |
| | | Shares | | Value (Note 1) |
| |
| BIOTECHNOLOGY – 83.3% | | | | | | |
| Biotechnology – 83.3% | | | | | | |
| Abgenix, Inc. (a) | | 10,900 | | $ | | 113,033 |
| Actelion Ltd. (Reg.) (a) | | 12,478 | | | | 1,338,399 |
| Affymetrix, Inc. (a) | | 41,300 | | | | 1,928,297 |
| Alkermes, Inc. (a) | | 42,740 | | | | 662,470 |
| Alnylam Pharmaceuticals, Inc. (a) | | 300 | | | | 2,925 |
| Amgen, Inc. (a) | | 44,210 | | | | 3,525,748 |
| Amylin Pharmaceuticals, Inc. (a) | | 7,600 | | | | 141,816 |
| Biogen Idec, Inc. (a) | | 71,434 | | | | 2,806,642 |
| BioMarin Pharmaceutical, Inc. (a) | | 4,800 | | | | 40,800 |
| Celgene Corp. (a) | | 82,741 | | | | 3,959,157 |
| Cephalon, Inc. (a) | | 52,899 | | | | 2,216,468 |
| Chiron Corp. (a) | | 13,800 | | | | 499,974 |
| Curis, Inc. (a) | | 40,700 | | | | 191,494 |
| CV Therapeutics, Inc. (a) | | 500 | | | | 14,085 |
| Dendreon Corp. (a) | | 100 | | | | 588 |
| DOV Pharmaceutical, Inc. (a) | | 43,900 | | | | 928,485 |
| Dyax Corp. (a) | | 4,200 | | | | 25,662 |
| Enzon Pharmaceuticals, Inc. (a) | | 25,200 | | | | 198,576 |
| Exelixis, Inc. (a) | | 11,200 | | | | 99,232 |
| Genentech, Inc. (a) | | 73,000 | | | | 6,521,087 |
| Genta, Inc. (a) | | 13,700 | | | | 16,440 |
| Genzyme Corp. (a) | | 37,720 | | | | 2,806,745 |
| Gilead Sciences, Inc. (a) | | 60,900 | | | | 2,728,929 |
| Harvard Bioscience, Inc. (a) | | 300 | | | | 975 |
| Human Genome Sciences, Inc. (a) | | 51,900 | | | | 760,335 |
| Icagen, Inc. | | 10,700 | | | | 85,493 |
| ICOS Corp. (a) | | 23,600 | | | | 594,956 |
| Idenix Pharmaceuticals, Inc. | | 5,600 | | | | 142,576 |
| ImClone Systems, Inc. (a) | | 44,364 | | | | 1,539,431 |
| ImmunoGen, Inc. (a) | | 53,500 | | | | 374,500 |
| Immunomedics, Inc. (a) | | 8,600 | | | | 15,394 |
| Incyte Corp. (a) | | 3,100 | | | | 24,707 |
| Invitrogen Corp. (a) | | 26,250 | | | | 2,251,463 |
| Ligand Pharmaceuticals, Inc. Class B (a) . | | 1,300 | | | | 10,140 |
| Medarex, Inc. (a) | | 27,590 | | | | 269,003 |
| MedImmune, Inc. (a) | | 86,700 | | | | 2,463,147 |
| Millennium Pharmaceuticals, Inc. (a) | | 205,071 | | | | 2,118,383 |
| Myogen, Inc. (a) | | 13,500 | | | | 147,690 |
| Neurocrine Biosciences, Inc. (a) | | 19,000 | | | | 942,020 |
| NPS Pharmaceuticals, Inc. (a) | | 400 | | | | 4,348 |
| Oscient Pharmaceuticals Corp. (a) | | 2,600 | | | | 6,942 |
| OSI Pharmaceuticals, Inc. (a) | | 12,000 | | | | 495,600 |
| Pharmion Corp. (a) | | 14,304 | | | | 352,451 |
| Protein Design Labs, Inc. (a) | | 46,400 | | | | 1,057,456 |
| | | Shares | | Value (Note 1) |
| Regeneron Pharmaceuticals, Inc. (a) | | 23,622 | | $ | | 227,716 |
| Seattle Genetics, Inc. (a) | | 24,600 | | | | 148,092 |
| Serologicals Corp. (a) | | 23,900 | | | | 549,700 |
| Tanox, Inc. (a) | | 10,700 | | | | 149,693 |
| Techne Corp. (a) | | 16,010 | | | | 785,611 |
| Tercica, Inc. (a) | | 17,300 | | | | 171,097 |
| Threshold Pharmaceuticals, Inc. | | 1,408 | | | | 14,291 |
| ViaCell, Inc. | | 500 | | | | 4,270 |
| XOMA Ltd. (a) | | 49,300 | | | | 81,838 |
| | | | | | | 46,556,370 |
| |
| HEALTH CARE EQUIPMENT & SUPPLIES – 0.4% | | | | | | |
| Health Care Equipment – 0.3% | | | | | | |
| Aspect Medical Systems, Inc. (a) | | 200 | | | | 6,600 |
| Cholestech Corp. (a) | | 3,800 | | | | 42,788 |
| Cyberonics, Inc. (a) | | 500 | | | | 19,310 |
| Epix Pharmaceuticals, Inc. (a) | | 3,100 | | | | 27,373 |
| IntraLase Corp. | | 300 | | | | 6,255 |
| Syneron Medical Ltd. | | 1,000 | | | | 38,550 |
| | | | | | | 140,876 |
| Health Care Supplies – 0.1% | | | | | | |
| Gen-Probe, Inc. (a) | | 1,400 | | | | 61,726 |
| |
| TOTAL HEALTH CARE EQUIPMENT & SUPPLIES | | | | 202,602 |
| |
| HEALTH CARE PROVIDERS & SERVICES – 0.0% | | | | | | |
| Health Care Facilities – 0.0% | | | | | | |
| Corporacion Dermoestetica SA | | 2,000 | | | | 26,675 |
| PHARMACEUTICALS – 14.5% | | | | | | |
| Pharmaceuticals – 14.5% | | | | | | |
| Adams Respiratory Therapeutics, Inc. | | 100 | | | | 2,950 |
| Connetics Corp. (a) | | 200 | | | | 3,742 |
| Cypress Bioscience, Inc. (a) | | 2,600 | | | | 35,620 |
| Guilford Pharmaceuticals, Inc. (a) | | 28,300 | | | | 99,616 |
| IVAX Corp. (a) | | 4,800 | | | | 122,304 |
| Kos Pharmaceuticals, Inc. (a) | | 23,400 | | | | 1,673,100 |
| Medicines Co. (a) | | 16,300 | | | | 355,829 |
| Merck KGaA | | 10,826 | | | | 964,012 |
| MGI Pharma, Inc. (a) | | 34,900 | | | | 952,770 |
| NitroMed, Inc. (a) | | 7,500 | | | | 174,300 |
| Novartis AG sponsored ADR | | 7,400 | | | | 360,454 |
| Roche Holding AG (participation | | | | | | |
| certificate) | | 5,648 | | | | 768,000 |
| Salix Pharmaceuticals Ltd. (a) | | 8,200 | | | | 158,260 |
| Sanofi-Aventis sponsored ADR | | 100 | | | | 4,330 |
| Sepracor, Inc. (a) | | 44,896 | | | | 2,350,306 |
| SkyePharma PLC (a) | | 80,613 | | | | 84,300 |
| | | | | | | 8,109,893 |
| |
| TOTAL COMMON STOCKS | | | | | | |
| (Cost $48,439,037) | | | | 54,895,540 |
See accompanying notes which are an integral part of the financial statements.
Biotechnology A-8
|
| Money Market Funds — 1.6% | | | | | | |
| | | Shares | | | | Value (Note 1) |
| Fidelity Cash Central Fund, 3.31% (b) | | | | | | |
| (Cost $868,635) | | 868,635 | | | | $ 868,635 |
| TOTAL INVESTMENT PORTFOLIO - 99.8% | | | | |
| (Cost $49,307,672) | | | | | | 55,764,175 |
| |
| NET OTHER ASSETS – 0.2% | | | | | | 136,549 |
| NET ASSETS – 100% | | | | $ | | 55,900,724 |
(a) Non-income producing
(b) Affiliated fund that is available only to investment companies and other accounts managed by Fidelity Investments. The rate quoted is the annualized seven-day yield of the fund at period end. A complete listing of the fund’s holdings as of its most recent quarter end is available upon request.
At July 31, 2005, the fund had a capital loss carryforward of approximately $8,849,791 all of which will expire on July 31, 2011.
See accompanying notes which are an integral part of the financial statements.
Advisor Biotechnology Fund
Financial Statements
|
| Statement of Assets and Liabilities | | |
| | | | | | | July 31, 2005 |
| |
| Assets | | | | | | |
| Investment in securities, at value (cost | | | | |
| $49,307,672) — See accompany- | | | | |
| ing schedule | | | | $ | | 55,764,175 |
| Receivable for investments sold | | | | | | 292,300 |
| Receivable for fund shares sold | | | | | | 145,593 |
| Dividends receivable | | | | | | 986 |
| Interest receivable | | | | | | 1,510 |
| Prepaid expenses | | | | | | 92 |
| Receivable from investment adviser for | | | | |
| expense reductions | | | | | | 7,686 |
| Other receivables | | | | | | 7,490 |
| Total assets | | | | | | 56,219,832 |
| |
| Liabilities | | | | | | |
| Payable to custodian bank | | $ | | 42,806 | | |
| Payable for investments purchased | | | | 58,259 | | |
| Payable for fund shares redeemed | | | | 105,132 | | |
| Accrued management fee | | | | 25,694 | | |
| Transfer agent fee payable | | | | 18,336 | | |
| Distribution fees payable | | | | 31,628 | | |
| Other affiliated payables | | | | 1,851 | | |
| Other payables and accrued expenses | | 35,402 | | |
| Total liabilities | | | | | | 319,108 |
| |
| Net Assets | | | | $ | | 55,900,724 |
| Net Assets consist of: | | | | | | |
| Paid in capital | | | | $ | | 58,876,674 |
| Accumulated undistributed net realized | | | | |
| gain (loss) on investments and for- | | | | |
| eign currency transactions | | | | | | (9,432,385) |
| Net unrealized appreciation (depreci- | | | | |
| ation) on investments and assets and | | | | |
| liabilities in foreign currencies | | | | | | 6,456,435 |
| Net Assets | | | | $ | | 55,900,724 |
| Calculation of Maximum Offering Price | | | | |
| Class A: | | | | | | |
| Net Asset Value and redemption | | | | | | |
| price per share ($11,022,278 ÷ | | | | |
| 1,620,043 shares) | | | | $ | | 6.80 |
| Maximum offering price per share | | | | | | |
| (100/94.25 of $6.80) | | | | $ | | 7.21 |
| Class T: | | | | | | |
| Net Asset Value and redemption | | | | | | |
| price per share ($14,176,708 ÷ | | | | |
| 2,108,651 shares) | | | | $ | | 6.72 |
| Maximum offering price per share | | | | | | |
| (100/96.50 of $6.72) | | | | $ | | 6.96 |
| Class B: | | | | | | |
| Net Asset Value and offering price | | | | |
| per share ($16,920,801 ÷ | | | | | | |
| 2,577,536 shares)A | | | | $ | | 6.56 |
| Class C: | | | | | | |
| Net Asset Value and offering price | | | | |
| per share ($12,538,171 ÷ | | | | | | |
| 1,909,300 shares)A | | | | $ | | 6.57 |
| Institutional Class: | | | | | | |
| Net Asset Value, offering price and | | | | |
| redemption price per share | | | | | | |
| ($1,242,766 ÷ 180,455 shares) . | | $ | | 6.89 |
A Redemption price per share is equal to net asset value less any applicable contingent deferred sales charge.
See accompanying notes which are an integral part of the financial statements.
| Statement of Operations | | | | |
| | | | | Year ended July 31, 2005 |
| |
| Investment Income | | | | | | |
| Dividends | | | | $ | | 15,541 |
| Special Dividends | | | | | | 3,455 |
| Interest | | | | | | 11,544 |
| Security lending | | | | | | 11,707 |
| | | | | | | 42,247 |
| Less foreign taxes withheld | | | | | | (2,833) |
| Total income | | | | | | 39,414 |
| |
| Expenses | | | | | | |
| Management fee | | $ | | 300,662 | | |
| Transfer agent fees | | | | 257,402 | | |
| Distribution fees | | | | 373,191 | | |
| Accounting and security lending | | | | | | |
| fees | | | | 27,759 | | |
| Independent trustees’ compensation | | 277 | | |
| Custodian fees and expenses | | | | 8,069 | | |
| Registration fees | | | | 56,077 | | |
| Audit | | | | 44,163 | | |
| Legal | | | | 189 | | |
| Miscellaneous | | | | 804 | | |
| Total expenses before reductions | | 1,068,593 | | |
| Expense reductions | | | | (76,505) | | 992,088 |
| |
| Net investment income (loss) | | | | | | (952,674) |
| Realized and Unrealized Gain (Loss) | | | | |
| Net realized gain (loss) on: | | | | | | |
| Investment securities | | | | 3,413,981 | | |
| Foreign currency transactions | | | | 1,175 | | |
| Total net realized gain (loss) | | | | | | 3,415,156 |
| Change in net unrealized appreci- | | | | |
| ation (depreciation) on: | | | | | | |
| Investment securities | | | | 3,818,042 | | |
| Assets and liabilities in foreign | | | | | | |
| currencies | | | | (68) | | |
| Total change in net unrealized | | | | | | |
| appreciation (depreciation) | | | | | | 3,817,974 |
| Net gain (loss) | | | | | | 7,233,130 |
| Net increase (decrease) in net as- | | | | |
| sets resulting from operations | | | | $ | | 6,280,456 |
| Statement of Changes in Net Assets | | | | | | |
| | | Year ended | | | | Year ended |
| | | July 31, | | | | July 31, |
| | | 2005 | | | | 2004 |
| Increase (Decrease) in Net Assets | | | | | | |
| Operations | | | | | | |
| Net investment income (loss) | | $ (952,674) | | $ | | (954,269) |
| Net realized gain (loss) | | 3,415,156 | | | | 2,867,187 |
| Change in net unrealized appreciation (depreciation) | | 3,817,974 | | | | (2,278,403) |
| Net increase (decrease) in net assets resulting from operations | | 6,280,456 | | | | (365,485) |
| Share transactions -- net increase (decrease) | | (5,129,068) | | | | 10,289,718 |
| Redemption fees | | 6,345 | | | | 18,272 |
| Total increase (decrease) in net assets | | 1,157,733 | | | | 9,942,505 |
| |
| Net Assets | | | | | | |
| Beginning of period | | 54,742,991 | | | | 44,800,486 |
| End of period | | $ 55,900,724 | | $ | | 54,742,991 |
| Financial Highlights — Class A | | | | | | | | | | | | | | | | | | | | |
| Years ended July 31, | | | | 2005 | | | | 2004 | | | | 2003 | | | | 2002 | | | | 2001G |
| Selected Per-Share Data | | | | | | | | | | | | | | | | | | | | |
| Net asset value, beginning of period | | $ | | 6.00 | | $ | | 5.94 | | $ | | 4.39 | | $ | | 7.09 | | $ | | 10.00 |
| Income from Investment Operations | | | | | | | | | | | | | | | | | | | | |
| Net investment income (loss)E | | | | (.08)F | | | | (.09) | | | | (.05) | | | | (.07) | | | | (.04) |
| Net realized and unrealized gain (loss) | | | | 88 | | | | .15 | | | | 1.60 | | | | (2.64) | | | | (2.88) |
| Total from investment operations | | | | 80 | | | | .06 | | | | 1.55 | | | | (2.71) | | | | (2.92) |
| Redemption fees added to paid in capitalE | | | | —I | | | | —I | | | | —I | | | | .01 | | | | .01 |
| Net asset value, end of period | | $ | | 6.80 | | $ | | 6.00 | | $ | | 5.94 | | $ | | 4.39 | | $ | | 7.09 |
| Total ReturnB, C, D | | | | 13.33% | | | | 1.01% | | | | 35.31% | | | | (38.08)% | | | | (29.10)% |
| Ratios to Average Net AssetsH | | | | | | | | | | | | | | | | | | | | |
| Expenses before expense reductions | | | | 1.56% | | | | 1.68% | | | | 2.04% | | | | 1.99% | | | | 3.07%A |
| Expenses net of voluntary waivers, if any | | | | 1.45% | | | | 1.50% | | | | 1.50% | | | | 1.50% | | | | 1.50%A |
| Expenses net of all reductions | | | | 1.43% | | | | 1.48% | | | | 1.47% | | | | 1.46% | | | | 1.49%A |
| Net investment income (loss) | | | | (1.36)%F | | | | (1.38)% | | | | (1.11)% | | | | (1.19)% | | | | (.94)%A |
| Supplemental Data | | | | | | | | | | | | | | | | | | | | |
| Net assets, end of period (000 omitted) | | $ 11,022 | | $ | | 10,197 | | $ | | 7,718 | | $ | | 4,657 | | $ | | 4,232 |
| Portfolio turnover rate | | | | 30% | | | | 50% | | | | 71% | | | | 113% | | | | 64%A |
| A | | Annualized | | | | | | | | | | | | | | | | | | | | |
| B | | Total returns for periods of less than one year are not annualized. | | | | | | | | | | | | | | | | | | | | |
| C | | Total returns would have been lower had certain expenses not been reduced during the periods shown. | | | | | | | | | | | | | | | | | | | | |
| D | | Total returns do not include the effect of the sales charges. | | | | | | | | | | | | | | | | | | | | |
| E | | Calculated based on average shares outstanding during the period. | | | | | | | | | | | | | | | | | | | | |
| F | | Investment income per share reflects a special dividend which amounted to $.0004 per share. Excluding the special dividend, the ratio of net investment income to average net assets would have been (1.37)%. | | | | |
| G | | For the period December 27, 2000 (commencement of operations) to July 31, 2001. | | | | | | | | | | | | | | | | | | | | |
| H | | Expense ratios reflect operating expenses of the class. Expenses before reductions do not reflect amounts reimbursed by the investment adviser or reductions from brokerage service arrangements or other expense offset arrangements and do not |
| | | represent the amount paid by the class during periods when reimbursements or reductions occur. Expense ratios before reductions for start up periods may not be representative of longer term operating periods. Expenses net of any voluntary |
| | | waivers reflect expenses after reimbursement by the investment adviser but prior to reductions from brokerage service arrangements or other expense offset arrangements. Expenses net of all reductions represent the net expenses paid by the class. |
| I | | Amount represents less than $.01 per share. | | | | | | | | | | | | | | | | | | | | |
See accompanying notes which are an integral part of the financial statements.
A-11 Annual Report
| Financial Highlights — Class T | | | | | | | | | | |
| Years ended July 31, | | 2005 | | 2004 | | 2003 | | 2002 | | 2001G |
| Selected Per-Share Data | | | | | | | | | | |
| Net asset value, beginning of period | | $ 5.95 | | $ 5.90 | | $ 4.37 | | $ 7.07 | | $ 10.00 |
| Income from Investment Operations | | | | | | | | | | |
| Net investment income (loss)E | | (.10)F | | (.10) | | (.06) | | (.09) | | (.05) |
| Net realized and unrealized gain (loss) | | 87 | | .15 | | 1.59 | | (2.62) | | (2.89) |
| Total from investment operations | | 77 | | .05 | | 1.53 | | (2.71) | | (2.94) |
| Redemption fees added to paid in capitalE | | —I | | —I | | —I | | .01 | | .01 |
| Net asset value, end of period | | $ 6.72 | | $ 5.95 | | $ 5.90 | | $ 4.37 | | $ 7.07 |
| Total ReturnB, C, D | | 12.94% | | .85% | | 35.01% | | (38.19)% | | (29.30)% |
| Ratios to Average Net AssetsH | | | | | | | | | | |
| Expenses before expense reductions | | 1.93% | | 2.10% | | 2.39% | | 2.27% | | 3.29%A |
| Expenses net of voluntary waivers, if any | | 1.70% | | 1.75% | | 1.75% | | 1.75% | | 1.75%A |
| Expenses net of all reductions | | 1.68% | | 1.73% | | 1.72% | | 1.72% | | 1.74%A |
| Net investment income (loss) | | (1.61)%F | | (1.63)% | | (1.36)% | | (1.45)% | | (1.19)%A |
| Supplemental Data | | | | | | | | | | |
| Net assets, end of period (000 omitted) | | $ 14,177 | | $ 13,367 | | $ 10,281 | | $ 6,861 | | $ 7,721 |
| Portfolio turnover rate | | 30% | | 50% | | 71% | | 113% | | 64%A |
A Annualized
B Total returns for periods of less than one year are not annualized.
C Total returns would have been lower had certain expenses not been reduced during the periods shown.
D Total returns do not include the effect of the sales charges.
E Calculated based on average shares outstanding during the period.
F Investment income per share reflects a special dividend which amounted to $.0004 per share. Excluding the special dividend, the ratio of net investment income to average net assets would have been (1.61)% .
G For the period December 27, 2000 (commencement of operations) to July 31, 2001.
H Expense ratios reflect operating expenses of the class. Expenses before reductions do not reflect amounts reimbursed by the investment adviser or reductions from brokerage service arrangements or other expense offset arrangements and do not
represent the amount paid by the class during periods when reimbursements or reductions occur. Expense ratios before reductions for start up periods may not be representative of longer term operating periods. Expenses net of any voluntary
waivers reflect expenses after reimbursement by the investment adviser but prior to reductions from brokerage service arrangements or other expense offset arrangements. Expenses net of all reductions represent the net expenses paid by the class.
I Amount represents less than $.01 per share.
|
| Financial Highlights — Class B | | | | | | | | | | |
| Years ended July 31, | | 2005 | | 2004 | | 2003 | | 2002 | | 2001G |
| Selected Per-Share Data | | | | | | | | | | |
| Net asset value, beginning of period | | $ 5.84 | | $ 5.82 | | $ 4.33 | | $ 7.05 | | $ 10.00 |
| Income from Investment Operations | | | | | | | | | | |
| Net investment income (loss)E | | (.13)F | | (.13) | | (.09) | | (.12) | | (.07) |
| Net realized and unrealized gain (loss) | | 85 | | .15 | | 1.58 | | (2.61) | | (2.89) |
| Total from investment operations | | 72 | | .02 | | 1.49 | | (2.73) | | (2.96) |
| Redemption fees added to paid in capitalE | | —I | | —I | | —I | | .01 | | .01 |
| Net asset value, end of period | | $ 6.56 | | $ 5.84 | | $ 5.82 | | $ 4.33 | | $ 7.05 |
| Total ReturnB, C, D | | 12.33% | | .34% | | 34.41% | | (38.58)% | | (29.50)% |
| Ratios to Average Net AssetsH | | | | | | | | | | |
| Expenses before expense reductions | | 2.33% | | 2.46% | | 2.78% | | 2.74% | | 3.83%A |
| Expenses net of voluntary waivers, if any | | 2.19% | | 2.25% | | 2.25% | | 2.25% | | 2.25%A |
| Expenses net of all reductions | | 2.18% | | 2.22% | | 2.22% | | 2.22% | | 2.24%A |
| Net investment income (loss) | | (2.11)%F | | (2.12)% | | (1.86)% | | (1.95)% | | (1.69)%A |
| Supplemental Data | | | | | | | | | | |
| Net assets, end of period (000 omitted) | | $ 16,921 | | $ 16,819 | | $ 15,154 | | $ 10,218 | | $ 8,875 |
| Portfolio turnover rate | | 30% | | 50% | | 71% | | 113% | | 64%A |
A Annualized
B Total returns for periods of less than one year are not annualized.
C Total returns would have been lower had certain expenses not been reduced during the periods shown.
D Total returns do not include the effect of the contingent deferred sales charge.
E Calculated based on average shares outstanding during the period.
F Investment income per share reflects a special dividend which amounted to $.0004 per share. Excluding the special dividend, the ratio of net investment income to average net assets would have been (2.11)% .
G For the period December 27, 2000 (commencement of operations) to July 31, 2001.
H Expense ratios reflect operating expenses of the class. Expenses before reductions do not reflect amounts reimbursed by the investment adviser or reductions from brokerage service arrangements or other expense offset arrangements and do not
represent the amount paid by the class during periods when reimbursements or reductions occur. Expense ratios before reductions for start up periods may not be representative of longer term operating periods. Expenses net of any voluntary
waivers reflect expenses after reimbursement by the investment adviser but prior to reductions from brokerage service arrangements or other expense offset arrangements. Expenses net of all reductions represent the net expenses paid by the class.
I Amount represents less than $.01 per share.
|
| See accompanying notes which are an integral part of the financial statements. | | |
| Biotechnology | | A-12 |
| Financial Highlights — Class C | | | | | | | | | | |
| Years ended July 31, | | 2005 | | 2004 | | 2003 | | 2002 | | 2001G |
| Selected Per-Share Data | | | | | | | | | | |
| Net asset value, beginning of period | | $ 5.84 | | $ 5.82 | | $ 4.33 | | $ 7.05 | | $ 10.00 |
| Income from Investment Operations | | | | | | | | | | |
| Net investment income (loss)E | | (.13)F | | (.13) | | (.09) | | (.12) | | (.07) |
| Net realized and unrealized gain (loss) | | 86 | | .15 | | 1.58 | | (2.61) | | (2.89) |
| Total from investment operations | | 73 | | .02 | | 1.49 | | (2.73) | | (2.96) |
| Redemption fees added to paid in capitalE | | —I | | —I | | —I | | .01 | | .01 |
| Net asset value, end of period | | $ 6.57 | | $ 5.84 | | $ 5.82 | | $ 4.33 | | $ 7.05 |
| Total ReturnB, C, D | | 12.50% | | .34% | | 34.41% | | (38.58)% | | (29.50)% |
| Ratios to Average Net AssetsH | | | | | | | | | | |
| Expenses before expense reductions | | 2.24% | | 2.31% | | 2.58% | | 2.57% | | 3.73%A |
| Expenses net of voluntary waivers, if any | | 2.19% | | 2.25% | | 2.25% | | 2.25% | | 2.25%A |
| Expenses net of all reductions | | 2.18% | | 2.23% | | 2.22% | | 2.22% | | 2.24%A |
| Net investment income (loss) | | (2.11)%F | | (2.13)% | | (1.86)% | | (1.95)% | | (1.69)%A |
| Supplemental Data | | | | | | | | | | |
| Net assets, end of period (000 omitted) | | $ 12,538 | | $ 13,215 | | $ 10,493 | | $ 8,204 | | $ 6,321 |
| Portfolio turnover rate | | 30% | | 50% | | 71% | | 113% | | 64%A |
A Annualized
B Total returns for periods of less than one year are not annualized.
C Total returns would have been lower had certain expenses not been reduced during the periods shown.
D Total returns do not include the effect of the contingent deferred sales charge.
E Calculated based on average shares outstanding during the period.
F Investment income per share reflects a special dividend which amounted to $.0004 per share. Excluding the special dividend, the ratio of net investment income to average net assets would have been (2.11)% .
G For the period December 27, 2000 (commencement of operations) to July 31, 2001.
H Expense ratios reflect operating expenses of the class. Expenses before reductions do not reflect amounts reimbursed by the investment adviser or reductions from brokerage service arrangements or other expense offset arrangements and do not
represent the amount paid by the class during periods when reimbursements or reductions occur. Expense ratios before reductions for start up periods may not be representative of longer term operating periods. Expenses net of any voluntary
waivers reflect expenses after reimbursement by the investment adviser but prior to reductions from brokerage service arrangements or other expense offset arrangements. Expenses net of all reductions represent the net expenses paid by the class.
I Amount represents less than $.01 per share.
|
| Financial Highlights — Institutional Class | | | | | | | | | | |
| Years ended July 31, | | 2005 | | 2004 | | 2003 | | 2002 | | 2001F |
| Selected Per-Share Data | | | | | | | | | | |
| Net asset value, beginning of period | | $ 6.06 | | $ 5.97 | | $ 4.40 | | $ 7.09 | | $ 10.00 |
| Income from Investment Operations | | | | | | | | | | |
| Net investment income (loss)D | | (.06)E | | (.06) | | (.04) | | (.06) | | (.03) |
| Net realized and unrealized gain (loss) | | 89 | | .15 | | 1.61 | | (2.64) | | (2.89) |
| Total from investment operations | | 83 | | .09 | | 1.57 | | (2.70) | | (2.92) |
| Redemption fees added to paid in capitalD | | —H | | —H | | —H | | .01 | | .01 |
| Net asset value, end of period | | $ 6.89 | | $ 6.06 | | $ 5.97 | | $ 4.40 | | $ 7.09 |
| Total ReturnB, C | | 13.70% | | 1.51% | | 35.68% | | (37.94)% | | (29.10)% |
| Ratios to Average Net AssetsG | | | | | | | | | | |
| Expenses before expense reductions | | 1.10% | | 1.16% | | 1.37% | | 1.41% | | 2.58%A |
| Expenses net of voluntary waivers, if any | | 1.10% | | 1.16% | | 1.25% | | 1.25% | | 1.25%A |
| Expenses net of all reductions | | 1.09% | | 1.14% | | 1.22% | | 1.22% | | 1.24%A |
| Net investment income (loss) | | (1.02)%E | | (1.04)% | | (.86)% | | (.94)% | | (.69)%A |
| Supplemental Data | | | | | | | | | | |
| Net assets, end of period (000 omitted) | | $ 1,243 | | $ 1,146 | | $ 1,153 | | $ 857 | | $ 911 |
| Portfolio turnover rate | | 30% | | 50% | | 71% | | 113% | | 64%A |
A Annualized
B Total returns for periods of less than one year are not annualized.
C Total returns would have been lower had certain expenses not been reduced during the periods shown.
D Calculated based on average shares outstanding during the period.
E Investment income per share reflects a special dividend which amounted to $.0004 per share. Excluding the special dividend, the ratio of net investment income to average net assets would have been (1.02)% .
F For the period December 27, 2000 (commencement of operations) to July 31, 2001.
G Expense ratios reflect operating expenses of the class. Expenses before reductions do not reflect amounts reimbursed by the investment adviser or reductions from brokerage service arrangements or other expense offset arrangements and do not
represent the amount paid by the class during periods when reimbursements or reductions occur. Expense ratios before reductions for start up periods may not be representative of longer term operating periods. Expenses net of any voluntary
waivers reflect expenses after reimbursement by the investment adviser but prior to reductions from brokerage service arrangements or other expense offset arrangements. Expenses net of all reductions represent the net expenses paid by the class.
H Amount represents less than $.01 per share.
|
See accompanying notes which are an integral part of the financial statements.
|
Notes to Financial Statements
For the period ended July 31, 2005
|
1. Significant Accounting Policies.
|
Fidelity Advisor Biotechnology Fund (the fund) is a non-diversified fund of Fidelity Advisor Series VII (the trust) and is authorized to issue an unlimited number of shares. The trust is registered under the Investment Company Act of 1940, as amended (the 1940 Act), as an open-end management investment company organized as a Massachusetts business trust.
The fund offers Class A, Class T, Class B, Class C and Institutional Class shares, each of which has equal rights as to assets and voting privileges. Each class has exclusive voting rights with respect to matters that affect that class. Class B shares will automatically convert to Class A shares after a holding period of seven years from the initial date of purchase. Investment income, realized and unrealized capital gains and losses, the common expenses of the fund, and certain fund-level expense reductions, if any, are allocated on a pro rata basis to each class based on the relative net assets of each class to the total net assets of the fund. Each class differs with respect to transfer agent and distribution and service plan fees incurred. Certain expense reductions also differ by class.
The financial statements have been prepared in conformity with accounting principles generally accepted in the United States of America, which require management to make certain estimates and assumptions at the date of the financial statements. The following summarizes the significant accounting policies of the fund:
Security Valuation. Net asset value per share (NAV calculation) is calculated as of the close of business of the New York Stock Exchange, normally 4:00 p.m. Eastern time. Equity securities, including restricted securities, for which market quotations are available are valued at the last sale price or official closing price (closing bid price or last evaluated quote if no sale has occurred) on the primary market or exchange on which they trade. If prices are not readily available or do not accurately reflect fair value for a security, or if a security’s value has been materially affected by events occurring after the close of the exchange or market on which the security is principally traded, that security may be valued by another method that the Board of Trustees believes accurately reflects fair value. A security’s valuation may differ depending on the method used for determining value. Price movements in futures contracts and ADRs, market and trading trends, the bid/ask quotes of brokers and off-exchange institutional trading may be reviewed in the course of making a good faith determination of a security’s fair value. Short-term securities with remaining maturities of sixty days or less for which quotations are not readily available are valued on the basis of amortized cost. Investments in open-end investment companies are valued at their net asset value each business day.
Foreign Currency. The fund uses foreign currency contracts to facilitate transactions in foreign-denominated securities. Losses from these transactions may arise from changes in the value of the foreign currency or if the counterparties do not perform under the contracts’ terms.
Foreign-denominated assets, including investment securities, and liabilities are translated into U.S. dollars at the exchange rate at period end. Purchases and sales of investment securities, income and dividends received and expenses denominated in foreign currencies are translated into U.S. dollars at the exchange rate in effect on the transaction date.
The effects of exchange rate fluctuations on investments are included with the net realized and unrealized gain (loss) on investment securities. Other foreign currency transactions resulting in realized and unrealized gain (loss) are disclosed separately.
Investment Transactions and Income. Security transactions are accounted for as of trade date. Gains and losses on securities sold are determined on the basis of identified cost. Dividend income is recorded on the ex-dividend date, except for certain dividends from foreign securities where the ex-dividend date may have passed, which are recorded as soon as the fund is informed of the ex-dividend date. Non-cash dividends included in dividend income, if any, are recorded at the fair market value of the securities received. Large, non-recurring dividends recognized by the fund are presented separately on the Statement of Operations as “Special Dividends” and the impact of these dividends is presented in the Financial Highlights. Interest income is accrued as earned. Interest income includes coupon interest and amortization of premium and accretion of discount on debt securities. Investment income is recorded net of foreign taxes withheld where recovery of such taxes is uncertain.
Expenses. Most expenses of the trust can be directly attributed to a fund. Expenses which cannot be directly attributed are apportioned among each fund in the trust.
Income Tax Information and Distributions to Shareholders. Each year, the fund intends to qualify as a regulated investment company by distributing all of its taxable income and realized gains under Subchapter M of the Internal Revenue Code. As a result, no provision for income taxes is required in the accompanying financial statements. Foreign taxes are provided for based on the fund’s understanding of the tax rules and rates that exist in the foreign markets in which it invests.
Distributions are recorded on the ex-dividend date. Income dividends and capital gain distributions are declared separately for each class. Income and capital gain distributions are determined in accordance with income tax regulations, which may differ from generally accepted accounting principles. Capital accounts within the financial statements are adjusted for permanent book-tax differences. These adjustments have no impact on net assets or the results of operations. Temporary book-tax differences will reverse in a subsequent period.
1. Significant Accounting Policies - continued
Income Tax Information and Distributions to Shareholders - continued
Book-tax differences are primarily due to foreign currency transactions, capital loss carryforwards and losses deferred due to wash sales.
The tax-basis components of distributable earnings and the federal tax cost as of period end were as follows:
| Unrealized appreciation | | $ 13,476,712 |
| Unrealized depreciation | | (7,602,876) |
| Net unrealized appreciation (depreciation) | | 5,873,836 |
| Capital loss carryforward | | (8,849,791) |
| |
| Cost for federal income tax purposes | | $ 49,890,339 |
Short-Term Trading (Redemption) Fees. Shares held in the fund less than 60 days are subject to a redemption fee equal to 1.00% of the proceeds of the redeemed shares. All redemption fees, including any estimated redemption fees paid by Fidelity Management & Research Company (FMR), are retained by the fund and accounted for as an addition to paid in capital.
Repurchase Agreements. FMR has received an Exemptive Order from the Securities and Exchange Commission (the SEC) which permits the fund and other affiliated entities of FMR to transfer uninvested cash balances into joint trading accounts which are then invested in repurchase agreements. The fund may also invest directly with institutions in repurchase agreements. Repurchase agreements are collateralized by government or non-government securities. Collateral is held in segregated accounts with custodian banks and may be obtained in the event of a default of the counterparty. The fund monitors, on a daily basis, the value of the collateral to ensure it is at least equal to the principal amount of the repurchase agreement (including accrued interest). In the event of a default by the counterparty, realization of the collateral proceeds could be delayed, during which time the value of the collateral may decline.
3. Purchases and Sales of Investments.
Purchases and sales of securities, other than short-term securities and U.S. government securities, aggregated $15,702,703 and $20,996,789, respectively.
4. Fees and Other Transactions with Affiliates.
Management Fee. FMR and its affiliates provide the fund with investment management related services for which the fund pays a monthly management fee. The management fee is the sum of an individual fund fee rate that is based on an annual rate of .30% of the fund’s average net assets and a group fee rate that averaged .27% during the period. The group fee rate is based upon the average net assets of all the mutual funds advised by FMR. The group fee rate decreases as assets under management increase and increases as assets under management decrease. For the period, the total annual management fee rate was .57% of the fund’s average net assets.
Distribution and Service Plan. In accordance with Rule 12b-1 of the 1940 Act, the fund has adopted separate Distribution and Service Plans for each class of shares. Certain classes pay Fidelity Distributors Corporation (FDC), an affiliate of FMR, separate Distribution and Service Fees, each of which is based on an annual percentage of each class’ average net assets. In addition, FDC may pay financial intermediaries for selling shares of the fund and providing shareholder support services. For the period, the Distribution and Service Fee rates and the total amounts paid to and retained by FDC were as follows:
| | | Distribution | | Service | | | | Paid to | | | | Retained |
| | | Fee | | Fee | | | | FDC | | | | by FDC |
| Class A | | 0% | | .25% | | $ | | 25,177 | | $ | | 33 |
| Class T | | 25% | | .25% | | | | 65,020 | | | | 62 |
| Class B | | 75% | | .25% | | | | 159,674 | | | | 119,826 |
| Class C | | 75% | | .25% | | | | 123,320 | | | | 23,648 |
| |
| | | | | | | $ | | 373,191 | | $ | | 143,569 |
Sales Load. FDC receives a front-end sales charge of up to 5.75% for selling Class A shares, and 3.50% for selling Class T shares, some of which is paid to financial intermediaries for selling shares of the fund. FDC receives the proceeds of contingent deferred sales charges levied on Class A, Class T, Class B, and Class C redemptions. These charges depend on the holding period. The deferred sales charges range from 5% to 1% for Class B, 1% for Class C, and .25% for certain purchases of Class A and Class T shares.
Notes to Financial Statements - continued
4. Fees and Other Transactions with Affiliates - continued
Sales Load - continued
For the period, sales charge amounts retained by FDC were as follows:
| | | | | Retained |
| | | | | by FDC |
| Class A | | $ | | 12,047 |
| Class T | | | | 10,155 |
| Class B* | | | | 61,464 |
| Class C* | | | | 3,776 |
| | | $ | | 87,442 |
| * When Class B and Class C shares are initially sold, FDC pays commissions from its own resources to financial intermediaries through which the sales are made. | | | | |
Transfer Agent Fees. Fidelity Investments Institutional Operations Company, Inc. (FIIOC), an affiliate of FMR, is the transfer, dividend disbursing and shareholder servicing agent for each class of the fund. FIIOC receives account fees and asset-based fees that vary according to the account size and type of account of the shareholders of the respective classes of the fund. FIIOC pays for typesetting, printing and mailing of shareholder reports, except proxy statements. For the period the total transfer agent fees paid by each class to FIIOC, were as follows:
| | | | | | | % of |
| | | | | | | Average |
| | | | | Amount | | Net Assets |
| Class A | | $ | | 47,844 | | .48 |
| Class T | | | | 77,635 | | .60 |
| Class B | | | | 79,137 | | .50 |
| Class C | | | | 49,905 | | .40 |
| Institutional Class | | | | 2,881 | | .27 |
| |
| | | $ | | 257,402 | | |
Accounting and Security Lending Fees. Fidelity Service Company, Inc. (FSC), an affiliate of FMR, maintains the fund’s accounting records. The accounting fee is based on the level of average net assets for the month. Under a separate contract, FSC administers the security lending program. The security lending fee is based on the number and duration of lending transactions.
Central Funds. The fund may invest in affiliated Central Funds managed by Fidelity Investments Money Management, Inc. (FIMM), an affiliate of FMR. The Central Funds are open-end investment companies available only to investment companies and other accounts managed by FMR and its affiliates. The Money Market Central Funds seek preservation of capital and current income. The Central Funds do not pay a management fee. Income distributions earned by the fund are recorded as income in the accompanying financial statements and totaled $40,321 for the period.
Brokerage Commissions. The fund placed a portion of its portfolio transactions with brokerage firms which are affiliates of the investment adviser. The commissions paid to these affiliated firms were $2,231 for the period.
5. Committed Line of Credit.
|
The fund participates with other funds managed by FMR in a $4.2 billion credit facility (the “line of credit”) to be utilized for temporary or emergency purposes to fund shareholder redemptions or for other short-term liquidity purposes. The fund has agreed to pay commitment fees on its pro rata portion of the line of credit. During the period, there were no borrowings on this line of credit.
The fund lends portfolio securities from time to time in order to earn additional income. The fund receives collateral (in the form of U.S. Treasury obligations, letters of credit and/or cash) against the loaned securities and maintains collateral in an amount not less than 100% of the market value of the loaned securities during the period of the loan. The market value of the loaned securities is determined at the close of business of the fund and any additional required collateral is delivered to the fund on the next business day. If the borrower defaults on its obligation to return the securities loaned because of insolvency or other reasons, a fund could experience delays and costs in recovering the securities loaned or in gaining access to the collateral. Cash collateral is invested in the Fidelity Securities Lending Cash Central Fund. At period end there were no security loans outstanding.
FMR voluntarily agreed to reimburse each class to the extent annual operating expenses exceeded certain levels of average net assets as noted in the table below. Some expenses, for example interest expense, are excluded from this reimbursement.
| The following classes were in reimbursement during the period: | | | | | | | | |
| | | Expense | | Reimbursement |
| | | Limitations | | from adviser |
| Class A | | 1.50% | | -- 1.40%* | | $ | | 11,540 |
| Class T | | 1.75% | | -- 1.65%* | | | | 30,869 |
| Class B | | 2.25% | | -- 2.15%* | | | | 22,104 |
| Class C | | 2.25% | | -- 2.15%* | | | | 5,763 |
| |
| | | | | | | $ | | 70,276 |
| |
| * Expense limitation in effect at period end. | | | | | | | | |
Many of the brokers with whom FMR places trades on behalf of the fund provided services to the fund in addition to trade execution. These services included payments of certain expenses on behalf of the fund totaling $6,229 for the period.
The fund’s organizational documents provide former and current trustees and officers with a limited indemnification against liabilities arising in connection with the performance of their duties to the fund. In the normal course of business, the fund may also enter into contracts that provide general indemnifications. The fund’s maximum exposure under these arrangements is unknown as this would be dependent on future claims that may be made against the fund. The risk of material loss from such claims is considered remote.
9. Share Transactions.
Transactions for each class of shares were as follows:
| | | | | Shares | | | | | | Dollars | | |
| Years ended July 31, | | 2005 | | | | 2004 | | 2005 | | | | 2004 |
| Class A | | | | | | | | | | | | |
| Shares sold | | 550,671 | | | | 878,734 | | $ 3,418,022 | | $ | | 5,475,076 |
| Shares redeemed | | (629,006) | | | | (480,064) | | (3,853,963) | | | | (2,905,863) |
| Net increase (decrease) | | (78,335) | | | | 398,670 | | $ (435,941) | | $ | | 2,569,213 |
| Class T | | | | | | | | | | | | |
| Shares sold | | 621,575 | | | | 1,105,179 | | $ 3,773,646 | | $ | | 6,864,105 |
| Shares redeemed | | (760,267) | | | | (601,131) | | (4,599,360) | | | | (3,678,218) |
| Net increase (decrease) | | (138,692) | | | | 504,048 | | $ (825,714) | | $ | | 3,185,887 |
| Class B | | | | | | | | | | | | |
| Shares sold | | 527,483 | | | | 951,709 | | $ 3,194,512 | | $ | | 5,766,243 |
| Shares redeemed | | (831,184) | | | | (675,608) | | (4,925,475) | | | | (4,063,659) |
| Net increase (decrease) | | (303,701) | | | | 276,101 | | $ (1,730,963) | | $ | | 1,702,584 |
| Class C | | | | | | | | | | | | |
| Shares sold | | 395,212 | | | | 962,707 | | $ 2,374,238 | | $ | | 5,865,287 |
| Shares redeemed | | (749,216) | | | | (502,895) | | (4,454,466) | | | | (3,048,910) |
| Net increase (decrease) | | (354,004) | | | | 459,812 | | $ (2,080,228) | | $ | | 2,816,377 |
| Institutional Class | | | | | | | | | | | | |
| Shares sold | | 56,540 | | | | 64,860 | | $ 351,953 | | $ | | 427,262 |
| Shares redeemed | | (65,245) | | | | (68,780) | | (408,175) | | | | (411,605) |
| Net increase (decrease) | | (8,705) | | | | (3,920) | | $ (56,222) | | $ | | 15,657 |
Advisor Consumer Industries Fund
Average annual total return reflects the change in the value of an investment, assuming reinvestment of the class’ dividend income and capital gains (the profits earned upon the sale of securities that have grown in value) and assuming a constant rate of performance each year. The $10,000 table and the fund’s returns do not reflect the deduction of taxes that a shareholder would pay on fund distributions or the redemption of fund shares. During periods of reimbursement by Fidelity, a fund’s total return will be greater than it would be had the reimbursement not occurred. How a fund did yesterday is no guarantee of how it will do tomorrow.
| Average Annual Total Returns | | | | |
| Periods ended July 31, 2005 | | Past 1 | | Past 5 | | Life of |
| | | year | | years | | fundA |
| Institutional Class | | 19.08% | | 3.55% | | 9.55% |
| |
| A From September 3, 1996. | | | | | | |
| | $10,000 Over Life of Fund
|
Let’s say hypothetically that $10,000 was invested in Fidelity Advisor Consumer Industries Fund — Institutional Class on September 3, 1996, when the fund started. The chart shows how the value of your investment would have changed, and also shows how the S&P 500 Index performed over the same period.
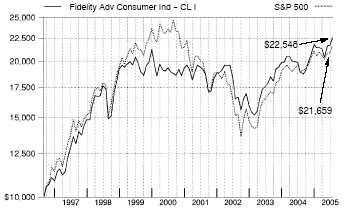
Advisor Consumer Industries Fund
|
Management’s Discussion of Fund Performance
Comments from John Roth, Portfolio Manager of Fidelity® Advisor Consumer Industries Fund
A late-inning rally on Wall Street helped push some key U.S. equity indexes to four-year highs by the conclusion of the 12-month period ending July 31, 2005. Spurred on by bullish economic data and strong corporate earnings, investors enjoyed a stellar month of July, capping off a turbulent 12-month period for U.S. equity markets. Stock prices bounced up and down during most of the year, moving in cadence with gyrations in the price of crude oil and investors’ gathering and ebbing concerns about inflation. The Federal Reserve Board raised short-term interest rates eight times during the period, also affecting overall market sentiment. Despite their fluctuations, the major equity indexes finished on a high note, with the Standard & Poor’s 500SM Index and the NASDAQ Composite® Index posting gains of 14.05% and 16.51%, respectively, for the period. The small-cap Russell 2000® Index rose 24.78% and the Russell Midcap® Index jumped 28.93%, while the blue-chips’ Dow Jones Industrial AverageSM advanced only 7.29% .
For the 12-month period ending July 31, 2005, the fund’s Institutional Class shares returned 19.08%, solidly outperforming the Goldman Sachs® Consumer Industries Index, which rose 14.96%, and the S&P 500® index. During the period, advertisers continued to shift spending out of traditional media such as radio, television and print, and into Internet media such as search engines and portals. The fund benefited from that trend, relative to the sector index, by overweighting Internet firms such as Google and underweighting more-traditional media stocks such as Time Warner, which was sold out of the portfolio. In the retail area, performance was helped by an emphasis on smaller specialty apparel retailers that I believed offered superior growth potential — such as American Eagle Outfitters — and an underweighting in mega-retailers, particularly Wal-Mart. I avoided tobacco and food conglomerate Altria, a large component of the Goldman Sachs index, because of the firm’s tobacco-related legal problems. That decision hurt relative results during the period, as investors assumed the litigation would be resolved favorably and the stock climbed sharply. The fund’s positions in Krispy Kreme Doughnuts, which I sold, and in Avon Products hurt relative performance as well.
The views expressed in this statement reflect those of the portfolio manager only through the end of the period of the report as stated on the cover and do not necessarily represent the views of Fidelity or any other person in the Fidelity organization. Any such views are subject to change at any time based upon market or other conditions and Fidelity disclaims any responsibility to update such views. These views may not be relied on as investment advice and, because investment decisions for a Fidelity fund are based on numerous factors, may not be relied on as an indication of trading intent on behalf of any Fidelity fund.
Advisor Consumer Industries Fund
Shareholder Expense Example
|
As a shareholder of the Fund, you incur two types of costs: (1) transaction costs, including sales charges (loads) on purchase payments or redemption proceeds, redemption fees, and (2) ongoing costs, including management fees, distribution and/or service (12b-1) fees and other Fund expenses. This Example is intended to help you understand your ongoing costs (in dollars) of investing in the Fund and to compare these costs with the ongoing costs of investing in other mutual funds.
The Example is based on an investment of $1,000 invested at the beginning of the period and held for the entire period (February 1, 2005 to July 31, 2005).
The first line of the table below for each class of the Fund provides information about actual account values and actual expenses. You may use the information in this line, together with the amount you invested, to estimate the expenses that you paid over the period. Simply divide your account value by $1,000.00 (for example, an $8,600 account value divided by $1,000.00 = 8.6), then multiply the result by the number in the first line for a class of the Fund under the heading entitled “Expenses Paid During Period” to estimate the expenses you paid on your account during this period.
Hypothetical Example for Comparison Purposes
|
The second line of the table below for each class of the Fund provides information about hypothetical account values and hypothetical expenses based on a Class’ actual expense ratio and an assumed rate of return of 5% per year before expenses, which is not the Class’ actual return. The hypothetical account values and expenses may not be used to estimate the actual ending account balance or expenses you paid for the period. You may use this information to compare the ongoing costs of investing in the Fund and other funds. To do so, compare this 5% hypothetical example with the 5% hypothetical examples that appear in the shareholder reports of the other funds.
Please note that the expenses shown in the table are meant to highlight your ongoing costs only and do not reflect any transaction costs. Therefore, the second line of the table is useful in comparing ongoing costs only, and will not help you determine the relative total costs of owning different funds. In addition, if these transactional costs were included, your costs would have been higher.
| | | | | | | | | Expenses Paid |
| | | Beginning | | | | Ending | | During Period* |
| | | Account Value | | | | Account Value | | February 1, 2005 |
| | | February 1, 2005 | | | | July 31, 2005 | | to July 31, 2005 |
| Class A | | | | | | | | | | |
| Actual | | $ 1,000.00 | | $ | | 1,050.60 | | $ | | 7.12 |
| HypotheticalA | | $ 1,000.00 | | $ | | 1,017.85 | | $ | | 7.00 |
| Class T | | | | | | | | | | |
| Actual | | $ 1,000.00 | | $ | | 1,048.90 | | $ | | 8.38 |
| HypotheticalA | | $ 1,000.00 | | $ | | 1,016.61 | | $ | | 8.25 |
| Class B | | | | | | | | | | |
| Actual | | $ 1,000.00 | | $ | | 1,047.00 | | $ | | 10.91 |
| HypotheticalA | | $ 1,000.00 | | $ | | 1,014.13 | | $ | | 10.74 |
| Class C | | | | | | | | | | |
| Actual | | $ 1,000.00 | | $ | | 1,046.20 | | $ | | 10.91 |
| HypotheticalA | | $ 1,000.00 | | $ | | 1,014.13 | | $ | | 10.74 |
| Institutional Class | | | | | | | | | | |
| Actual | | $ 1,000.00 | | $ | | 1,051.30 | | $ | | 5.85 |
| HypotheticalA | | $ 1,000.00 | | $ | | 1,019.09 | | $ | | 5.76 |
| |
| A 5% return per year before expenses | | | | | | | | | | |
* Expenses are equal to each Class’ annualized expense ratio (shown in the table below); multiplied by the average account value over the period, multiplied by 181/365 (to reflect the one-half year period).
| | | Annualized |
| | | Expense Ratio |
| Class A | | 1.40% |
| Class T | | 1.65% |
| Class B | | 2.15% |
| Class C | | 2.15% |
| Institutional Class | | 1.15% |
| | Advisor Consumer Industries Fund
Investment Changes
|
| Top Ten Stocks as of July 31, 2005 | | |
| | | % of fund’s | | % of fund’s net assets |
| | | net assets | | 6 months ago |
| Procter & Gamble Co. | | 5.8 | | 3.5 |
| Google, Inc. Class A (sub. vtg.) | | 4.3 | | 2.8 |
| Wal-Mart Stores, Inc. | | 3.6 | | 2.9 |
| The Coca-Cola Co. | | 3.2 | | 2.0 |
| Target Corp. | | 3.2 | | 2.5 |
| eBay, Inc. | | 2.9 | | 2.0 |
| Yahoo!, Inc. | | 2.8 | | 2.4 |
| News Corp. Class A | | 2.2 | | 3.8 |
| McDonald’s Corp. | | 2.1 | | 3.0 |
| Brunswick Corp. | | 2.0 | | 1.7 |
| | | 32.1 | | |
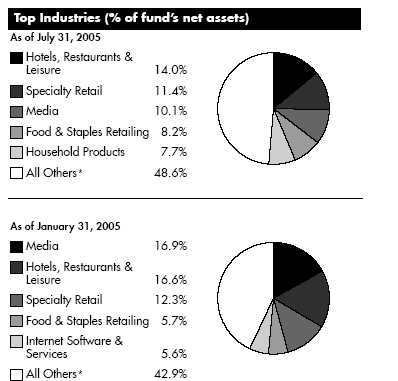
| | * Includes short term investments and net other assets.
Prior period industry classifications reflect the categories in place as of the date
indicated and have not been adjusted to reflect current industry classifications.
|
A-21 A-21 Annual Report
Advisor Consumer Industries Fund
Investments July 31, 2005
Showing Percentage of Net Assets
|
| Common Stocks — 98.2% | | | | | | |
| Shares | | Value (Note 1) |
| |
| AUTOMOBILES – 1.2% | | | | | | |
| Automobile Manufacturers – 0.5% | | | | | | |
| Thor Industries, Inc. | | 8,200 | | $ | | 293,560 |
| Motorcycle Manufacturers – 0.7% | | | | | | |
| Harley-Davidson, Inc. | | 9,000 | | | | 478,710 |
| TOTAL AUTOMOBILES | | | | | | 772,270 |
| |
| BEVERAGES – 6.5% | | | | | | |
| Distillers & Vintners – 1.1% | | | | | | |
| Brown-Forman Corp. Class B (non-vtg.) . | | 2,000 | | | | 116,900 |
| Diageo PLC sponsored ADR | | 10,400 | | | | 578,968 |
| | | | | | | 695,868 |
| Soft Drinks – 5.4% | | | | | | |
| Coca-Cola Enterprises, Inc. | | 19,700 | | | | 462,950 |
| PepsiCo, Inc. | | 16,500 | | | | 899,745 |
| The Coca-Cola Co. | | 46,500 | | | | 2,034,840 |
| | | | | | | 3,397,535 |
| |
| TOTAL BEVERAGES | | | | | | 4,093,403 |
| |
| COMMERCIAL SERVICES & SUPPLIES – 0.7% | | | | | | |
| Commercial Printing – 0.2% | | | | | | |
| R.R. Donnelley & Sons Co. | | 4,200 | | | | 151,410 |
| Diversified Commercial & Professional Services – 0.5% | | | | |
| Cendant Corp. | | 14,100 | | | | 301,176 |
| TOTAL COMMERCIAL SERVICES & SUPPLIES | | | | | | 452,586 |
| |
| DIVERSIFIED CONSUMER SERVICES – 2.7% | | | | | | |
| Education Services – 1.6% | | | | | | |
| Apollo Group, Inc. Class A (a) | | 10,800 | | | | 811,620 |
| Bright Horizons Family Solutions, Inc. (a) | | 4,854 | | | | 222,216 |
| | | | | | | 1,033,836 |
| Specialized Consumer Services – 1.1% | | | | | | |
| Steiner Leisure Ltd. (a) | | 10,972 | | | | 379,192 |
| Weight Watchers International, Inc. (a) . | | 5,200 | | | | 295,464 |
| | | | | | | 674,656 |
| |
| TOTAL DIVERSIFIED CONSUMER SERVICES | | | | | | 1,708,492 |
| |
| ELECTRICAL EQUIPMENT – 0.3% | | | | | | |
| Electrical Components & Equipment – 0.3% | | | | | | |
| Evergreen Solar, Inc. (a) | | 27,000 | | | | 190,350 |
| FOOD & STAPLES RETAILING – 8.2% | | | | | | |
| Drug Retail – 2.5% | | | | | | |
| CVS Corp. | | 19,000 | | | | 589,570 |
| Walgreen Co. | | 20,800 | | | | 995,488 |
| | | | | | | 1,585,058 |
| Food Retail – 1.1% | | | | | | |
| Whole Foods Market, Inc. | | 4,900 | | | | 668,899 |
| | | Shares | | Value (Note 1) |
| Hypermarkets & Super Centers – 4.6% | | | | | | |
| Costco Wholesale Corp. | | 13,700 | | $ | | 629,789 |
| Wal-Mart Stores, Inc. | | 46,580 | | | | 2,298,723 |
| | | | | | | 2,928,512 |
| |
| TOTAL FOOD & STAPLES RETAILING | | | | | | 5,182,469 |
| |
| FOOD PRODUCTS – 4.1% | | | | | | |
| Agricultural Products – 1.2% | | | | | | |
| Bunge Ltd. | | 10,900 | | | | 669,151 |
| Corn Products International, Inc. | | 5,100 | | | | 122,757 |
| | | | | | | 791,908 |
| Packaged Foods & Meats – 2.9% | | | | | | |
| Diamond Foods, Inc. | | 7,900 | | | | 174,985 |
| Lindt & Spruengli AG (participation | | | | | | |
| certificate) | | 188 | | | | 291,532 |
| Nestle SA sponsored ADR | | 9,150 | | | | 626,318 |
| Smithfield Foods, Inc. (a) | | 21,400 | | | | 558,968 |
| The J.M. Smucker Co. | | 4,000 | | | | 190,280 |
| | | | | | | 1,842,083 |
| |
| TOTAL FOOD PRODUCTS | | | | | | 2,633,991 |
| |
| HOTELS, RESTAURANTS & LEISURE – 14.0% | | | | | | |
| Casinos & Gaming – 2.3% | | | | | | |
| Aristocrat Leisure Ltd. | | 26,200 | | | | 246,744 |
| Harrah’s Entertainment, Inc. | | 2,233 | | | | 175,826 |
| International Game Technology | | 8,300 | | | | 227,088 |
| MGM MIRAGE (a) | | 11,400 | | | | 518,130 |
| Station Casinos, Inc. | | 1,800 | | | | 132,210 |
| WMS Industries, Inc. (a) | | 4,200 | | | | 136,878 |
| | | | | | | 1,436,876 |
| Hotels, Resorts & Cruise Lines – 5.4% | | | | | | |
| Carnival Corp. unit | | 16,000 | | | | 838,400 |
| Hilton Hotels Corp. | | 14,100 | | | | 348,975 |
| Kerzner International Ltd. (a) | | 3,000 | | | | 179,250 |
| Royal Caribbean Cruises Ltd. | | 11,800 | | | | 536,310 |
| Starwood Hotels & Resorts Worldwide, | | | | | | |
| Inc. unit | | 19,700 | | | | 1,247,404 |
| Wyndham International, Inc. Class A (a) | | 262,500 | | | | 299,250 |
| | | | | | | 3,449,589 |
| Leisure Facilities – 0.2% | | | | | | |
| International Speedway Corp. Class A | | 1,600 | | | | 93,024 |
| Restaurants – 6.1% | | | | | | |
| Brinker International, Inc. (a) | | 9,700 | | | | 396,730 |
| Buffalo Wild Wings, Inc. (a) | | 20,100 | | | | 658,677 |
| CBRL Group, Inc. | | 3,700 | | | | 144,929 |
| Domino’s Pizza, Inc. | | 8,300 | | | | 207,666 |
| McDonald’s Corp. | | 41,600 | | | | 1,296,672 |
| Outback Steakhouse, Inc. | | 13,000 | | | | 605,540 |
See accompanying notes which are an integral part of the financial statements.
Consumer Industries A-22
|
| Common Stocks – continued | | | | | | |
| | | Shares | | Value (Note 1) |
| |
| HOTELS, RESTAURANTS & LEISURE – CONTINUED | | | | |
| Restaurants – continued | | | | | | |
| Starbucks Corp. (a) | | 4,800 | | $ | | 252,240 |
| Wendy’s International, Inc. | | 6,140 | | | | 317,438 |
| | | | | | | 3,879,892 |
| |
| TOTAL HOTELS, RESTAURANTS & LEISURE | | | | | | 8,859,381 |
| |
| HOUSEHOLD PRODUCTS – 7.7% | | | | | | |
| Household Products – 7.7% | | | | | | |
| Colgate-Palmolive Co. | | 22,500 | | | | 1,191,150 |
| Procter & Gamble Co. | | 66,070 | | | | 3,675,472 |
| | | | | | | 4,866,622 |
| |
| INTERNET & CATALOG RETAIL – 3.3% | | | | | | |
| Catalog Retail – 0.4% | | | | | | |
| Coldwater Creek, Inc. (a) | | 10,400 | | | | 287,976 |
| Internet Retail – 2.9% | | | | | | |
| eBay, Inc. (a) | | 43,800 | | | | 1,829,964 |
| |
| TOTAL INTERNET & CATALOG RETAIL | | | | | | 2,117,940 |
| |
| INTERNET SOFTWARE & SERVICES – 7.4% | | | | | | |
| Internet Software & Services – 7.4% | | | | | | |
| Google, Inc. Class A (sub. vtg.) | | 9,500 | | | | 2,733,720 |
| Sina Corp. (a) | | 6,100 | | | | 169,641 |
| Yahoo!, Inc. (a) | | 53,570 | | | | 1,786,024 |
| | | | | | | 4,689,385 |
| |
| LEISURE EQUIPMENT & PRODUCTS – 4.4% | | | | | | |
| Leisure Products – 4.4% | | | | | | |
| Brunswick Corp. | | 27,100 | | | | 1,261,776 |
| K2, Inc. (a) | | 9,800 | | | | 130,340 |
| MarineMax, Inc. (a) | | 11,200 | | | | 372,512 |
| Polaris Industries, Inc. | | 4,900 | | | | 270,970 |
| RC2 Corp. (a) | | 2,700 | | | | 110,187 |
| SCP Pool Corp. | | 17,350 | | | | 632,234 |
| | | | | | | 2,778,019 |
| |
| MEDIA – 10.1% | | | | | | |
| Advertising – 2.5% | | | | | | |
| Harte-Hanks, Inc. | | 4,400 | | | | 119,680 |
| JC Decaux SA (a) | | 23,000 | | | | 536,556 |
| Omnicom Group, Inc. | | 10,900 | | | | 925,083 |
| | | | | | | 1,581,319 |
| Broadcasting & Cable TV – 1.5% | | | | | | |
| E.W. Scripps Co. Class A | | 7,700 | | | | 389,081 |
| SBS Broadcasting SA (a) | | 3,900 | | | | 186,381 |
| Univision Communications, Inc. | | | | | | |
| Class A (a) | | 13,000 | | | | 367,640 |
| | | | | | | 943,102 |
| | | Shares | | Value (Note 1) |
| Movies & Entertainment – 4.0% | | | | |
| News Corp. Class A | | 85,584 | | $ 1,401,866 |
| Walt Disney Co. | | 45,600 | | 1,169,184 |
| | | | | 2,571,050 |
| Publishing – 2.1% | | | | |
| Gannett Co., Inc. | | 2,580 | | 188,237 |
| McGraw-Hill Companies, Inc. | | 10,400 | | 478,504 |
| Reuters Group PLC sponsored ADR | | 3,800 | | 155,192 |
| Washington Post Co. Class B | | 560 | | 497,728 |
| | | | | 1,319,661 |
| |
| TOTAL MEDIA | | | | 6,415,132 |
| |
| MULTILINE RETAIL – 7.7% | | | | |
| Department Stores – 4.1% | | | | |
| Federated Department Stores, Inc. | | 9,600 | | 728,352 |
| JCPenney Co., Inc. | | 7,400 | | 415,436 |
| Nordstrom, Inc. | | 9,000 | | 333,090 |
| Saks, Inc. | | 10,100 | | 214,322 |
| Sears Holdings Corp. (a) | | 5,900 | | 909,957 |
| | | | | 2,601,157 |
| General Merchandise Stores – 3.6% | | | | |
| Family Dollar Stores, Inc. | | 9,000 | | 232,200 |
| Target Corp. | | 34,400 | | 2,021,000 |
| | | | | 2,253,200 |
| |
| TOTAL MULTILINE RETAIL | | | | 4,854,357 |
| |
| PERSONAL PRODUCTS – 2.7% | | | | |
| Personal Products – 2.7% | | | | |
| Avon Products, Inc. | | 22,400 | | 732,704 |
| Gillette Co. | | 18,900 | | 1,014,363 |
| | | | | 1,747,067 |
| |
| REAL ESTATE – 0.3% | | | | |
| Real Estate Investment Trusts – 0.3% | | | | |
| MeriStar Hospitality Corp. (a) | | 24,700 | | 220,324 |
| SOFTWARE – 0.7% | | | | |
| Home Entertainment Software – 0.7% | | | | |
| Activision, Inc. (a) | | 3,700 | | 75,258 |
| Electronic Arts, Inc. (a) | | 6,100 | | 351,360 |
| | | | | 426,618 |
| |
| SPECIALTY RETAIL – 11.4% | | | | |
| Apparel Retail – 4.0% | | | | |
| Aeropostale, Inc. (a) | | 8,500 | | 253,725 |
| American Eagle Outfitters, Inc. | | 19,200 | | 632,640 |
| bebe Stores, Inc. | | 8,700 | | 247,602 |
| Chico’s FAS, Inc. (a) | | 11,800 | | 473,298 |
| DSW, Inc. Class A | | 100 | | 2,650 |
| Foot Locker, Inc. | | 14,500 | | 362,500 |
See accompanying notes which are an integral part of the financial statements.
Advisor Consumer Industries Fund
Investments - continued
|
| Common Stocks – continued | | | | | | |
| | | Shares | | Value (Note 1) |
| |
| SPECIALTY RETAIL – CONTINUED | | | | | | |
| Apparel Retail – continued | | | | | | |
| Hot Topic, Inc. (a) | | 7,650 | | $ | | 130,356 |
| Urban Outfitters, Inc. (a) | | 7,500 | | | | 455,325 |
| | | | | | | 2,558,096 |
| Computer & Electronics Retail – 1.9% | | | | | | |
| Best Buy Co., Inc. | | 12,500 | | | | 957,500 |
| GameStop Corp.: | | | | | | |
| Class A (a) | | 5,500 | | | | 188,925 |
| Class B (a) | | 1,400 | | | | 44,800 |
| | | | | | | 1,191,225 |
| Home Improvement Retail – 1.9% | | | | | | |
| Lowe’s Companies, Inc. | | 18,200 | | | | 1,205,204 |
| Homefurnishing Retail – 0.1% | | | | | | |
| Bed Bath & Beyond, Inc. (a) | | 2,200 | | | | 100,980 |
| Specialty Stores – 3.5% | | | | | | |
| AC Moore Arts & Crafts, Inc. (a) | | 12,200 | | | | 350,506 |
| Guitar Center, Inc. (a) | | 6,100 | | | | 394,030 |
| Michaels Stores, Inc. | | 4,800 | | | | 196,800 |
| Office Depot, Inc. (a) | | 15,900 | | | | 451,242 |
| PETsMART, Inc. | | 4,500 | | | | 133,875 |
| Sports Authority, Inc. (a) | | 1,400 | | | | 44,520 |
| Staples, Inc. | | 27,450 | | | | 625,037 |
| | | | | | | 2,196,010 |
| |
| TOTAL SPECIALTY RETAIL | | | | | | 7,251,515 |
| |
| TEXTILES, APPAREL & LUXURY GOODS – 4.8% | | | | | | |
| Apparel, Accessories & Luxury Goods – 3.5% | | | | |
| Carter’s, Inc. (a) | | 11,200 | | | | 681,520 |
| Coach, Inc. (a) | | 10,800 | | | | 379,188 |
| Kenneth Cole Productions, Inc. Class A | | | | | | |
| (sub. vtg.) | | 3,200 | | | | 95,264 |
| Liz Claiborne, Inc. | | 13,100 | | | | 545,091 |
| Polo Ralph Lauren Corp. Class A | | 7,600 | | | | 374,224 |
| Quiksilver, Inc. (a) | | 9,800 | | | | 164,542 |
| | | | | | | 2,239,829 |
| Footwear – 1.3% | | | | | | |
| NIKE, Inc. Class B | | 9,500 | | | | 796,100 |
| |
| TOTAL TEXTILES, APPAREL & LUXURY GOODS | | | | 3,035,929 |
| |
| TOTAL COMMON STOCKS | | | | | | |
| (Cost $51,722,891) | | | | 62,295,850 |
| Money Market Funds — 2.2% | | | | |
| | | Shares | | | | Value (Note 1) |
| Fidelity Cash Central Fund, 3.31% (b) | | | | |
| (Cost $1,386,664) | | 1,386,664 | | $ | | 1,386,664 |
| TOTAL INVESTMENT PORTFOLIO - 100.4% | | | | |
| (Cost $53,109,555) | | | | | | 63,682,514 |
| |
| NET OTHER ASSETS – (0.4)% | | | | | | (274,919) |
| NET ASSETS – 100% | | | | $ | | 63,407,595 |
Legend
(a) Non-income producing
(b) Affiliated fund that is available only to investment companies and other
accounts managed by Fidelity Investments. The rate quoted is the
annualized seven-day yield of the fund at period end. A complete listing
of the fund’s holdings as of its most recent quarter end is available upon
request.
|
See accompanying notes which are an integral part of the financial statements.
Consumer Industries A-24
Advisor Consumer Industries Fund
Financial Statements
| Statement of Assets and Liabilities | | |
| | | | | | | July 31, 2005 |
| |
| Assets | | | | | | |
| Investment in securities, at value (cost | | | | |
| $53,109,555) — See accompany- | | | | |
| ing schedule | | | | $ | | 63,682,514 |
| Receivable for investments sold | | | | | | 33,081 |
| Receivable for fund shares sold | | | | | | 55,179 |
| Dividends receivable | | | | | | 35,113 |
| Interest receivable | | | | | | 3,390 |
| Prepaid expenses | | | | | | 87 |
| Receivable from investment adviser for | | | | |
| expense reductions | | | | | | 1,865 |
| Other affiliated receivables | | | | | | 68 |
| Other receivables | | | | | | 7,298 |
| Total assets | | | | | | 63,818,595 |
| |
| Liabilities | | | | | | |
| Payable for investments purchased | | $ | | 215,462 | | |
| Payable for fund shares redeemed | | | | 77,696 | | |
| Accrued management fee | | | | 29,700 | | |
| Distribution fees payable | | | | 33,014 | | |
| Other affiliated payables | | | | 22,126 | | |
| Other payables and accrued expenses | | 33,002 | | |
| Total liabilities | | | | | | 411,000 |
| |
| Net Assets | | | | $ | | 63,407,595 |
| Net Assets consist of: | | | | | | |
| Paid in capital | | | | $ | | 52,773,368 |
| Accumulated net investment loss | | | | | | (28) |
| Accumulated undistributed net realized | | | | |
| gain (loss) on investments and for- | | | | |
| eign currency transactions | | | | | | 61,324 |
| Net unrealized appreciation (depreci- | | | | |
| ation) on investments and assets and | | | | |
| liabilities in foreign currencies | | | | | | 10,572,931 |
| Net Assets | | | | $ | | 63,407,595 |
| Calculation of Maximum Offering Price | | | | |
| Class A: | | | | | | |
| Net Asset Value and redemption | | | | | | |
| price per share ($17,887,437 ÷ | | | | |
| 1,076,295 shares) | | | | $ | | 16.62 |
| Maximum offering price per share | | | | | | |
| (100/94.25 of $16.62) | | | | $ | | 17.63 |
| Class T: | | | | | | |
| Net Asset Value and redemption | | | | | | |
| price per share ($16,782,188 ÷ | | | | |
| 1,029,930 shares) | | | | $ | | 16.29 |
| Maximum offering price per share | | | | | | |
| (100/96.50 of $16.29) | | | | $ | | 16.88 |
| Class B: | | | | | | |
| Net Asset Value and offering price | | | | |
| per share ($18,862,461 ÷ | | | | | | |
| 1,209,417 shares)A | | | | $ | | 15.60 |
| Class C: | | | | | | |
| Net Asset Value and offering price | | | | |
| per share ($8,505,000 ÷ | | | | | | |
| 544,524 shares)A | | | | $ | | 15.62 |
| Institutional Class: | | | | | | |
| Net Asset Value, offering price and | | | | |
| redemption price per share | | | | | | |
| ($1,370,509 ÷ 80,548 shares) | | $ | | 17.01 |
| A Redemption price per share is equal to net asset value less any applicable contingent deferred sales charge. |
| Statement of Operations | | | | |
| | | | | Year ended July 31, 2005 |
| |
| Investment Income | | | | | | |
| Dividends | | | | $ | | 488,719 |
| Interest | | | | | | 34,382 |
| Security lending | | | | | | 14,716 |
| Total income | | | | | | 537,817 |
| |
| Expenses | | | | | | |
| Management fee | | $ | | 320,552 | | |
| Transfer agent fees | | | | 231,833 | | |
| Distribution fees | | | | 365,996 | | |
| Accounting and security lending | | | | | | |
| fees | | | | 27,860 | | |
| Independent trustees’ compensation | | 286 | | |
| Custodian fees and expenses | | | | 6,745 | | |
| Registration fees | | | | 54,596 | | |
| Audit | | | | 42,044 | | |
| Legal | | | | 201 | | |
| Miscellaneous | | | | 2,896 | | |
| Total expenses before reductions | | 1,053,009 | | |
| Expense reductions | | | | (37,462) | | 1,015,547 |
| |
| Net investment income (loss) | | | | | | (477,730) |
| Realized and Unrealized Gain (Loss) | | | | |
| Net realized gain (loss) on: | | | | | | |
| Investment securities | | | | 169,313 | | |
| Foreign currency transactions | | | | 2,412 | | |
| Total net realized gain (loss) | | | | | | 171,725 |
| Change in net unrealized appreci- | | | | |
| ation (depreciation) on: | | | | | | |
| Investment securities | | | | 9,733,469 | | |
| Assets and liabilities in foreign | | | | | | |
| currencies | | | | (28) | | |
| Total change in net unrealized | | | | | | |
| appreciation (depreciation) | | | | | | 9,733,441 |
| Net gain (loss) | | | | | | 9,905,166 |
| Net increase (decrease) in net as- | | | | |
| sets resulting from operations | | | | $ | | 9,427,436 |
See accompanying notes which are an integral part of the financial statements.
A-25 Annual Report
Advisor Consumer Industries Fund Financial Statements - continued
| Statement of Changes in Net Assets | | | | | | |
| | | Year ended | | | | Year ended |
| | | July 31, | | | | July 31, |
| | | 2005 | | | | 2004 |
| Increase (Decrease) in Net Assets | | | | | | |
| Operations | | | | | | |
| Net investment income (loss) | | $ (477,730) | | $ | | (483,848) |
| Net realized gain (loss) | | 171,725 | | | | 5,966,105 |
| Change in net unrealized appreciation (depreciation) | | 9,733,441 | | | | (3,103,656) |
| Net increase (decrease) in net assets resulting from operations | | 9,427,436 | | | | 2,378,601 |
| Distributions to shareholders from net realized gain | | (1,957,955) | | | | — |
| Share transactions — net increase (decrease) | | 3,323,070 | | | | 3,962,592 |
| Redemption fees | | 3,279 | | | | 7,430 |
| Total increase (decrease) in net assets | | 10,795,830 | | | | 6,348,623 |
| |
| Net Assets | | | | | | |
| Beginning of period | | 52,611,765 | | | | 46,263,142 |
| End of period (including accumulated net investment loss of $28 and accumulated net investment loss of $36, | | | | | | |
| respectively) | | $ 63,407,595 | | $ | | 52,611,765 |
| Financial Highlights — Class A | | | | | | | | | | |
| Years ended July 31, | | 2005 | | 2004 | | 2003 | | 2002 | | 2001 |
| Selected Per-Share Data | | | | | | | | | | |
| Net asset value, beginning of period | | $ 14.51 | | $ 13.71 | | $ 12.71 | | $ 15.20 | | $ 15.04 |
| Income from Investment Operations | | | | | | | | | | |
| Net investment income (loss)C | | (.07) | | (.07) | | (.04) | | (.05) | | .01 |
| Net realized and unrealized gain (loss) | | 2.71 | | .87 | | 1.04 | | (2.09) | | .15 |
| Total from investment operations | | 2.64 | | .80 | | 1.00 | | (2.14) | | .16 |
| Distributions from net realized gain | | (.53) | | — | | — | | (.35) | | — |
| Redemption fees added to paid in capitalC | | —E | | —E | | —E | | —E | | —E |
| Net asset value, end of period | | $ 16.62 | | $ 14.51 | | $ 13.71 | | $ 12.71 | | $ 15.20 |
| Total ReturnA, B | | 18.85% | | 5.84% | | 7.87% | | (14.30)% | | 1.06% |
| Ratios to Average Net AssetsD | | | | | | | | | | |
| Expenses before expense reductions | | 1.47% | | 1.55% | | 1.70% | | 1.69% | | 1.71% |
| Expenses net of voluntary waivers, if any | | 1.44% | | 1.50% | | 1.53% | | 1.50% | | 1.50% |
| Expenses net of all reductions | | 1.42% | | 1.45% | | 1.48% | | 1.47% | | 1.49% |
| Net investment income (loss) | | (.45)% | | (.50)% | | (.33)% | | (.36)% | | .08% |
| Supplemental Data | | | | | | | | | | |
| Net assets, end of period (000 omitted) | | $ 17,887 | | $ 11,856 | | $ 9,101 | | $ 7,209 | | $ 4,648 |
| Portfolio turnover rate | | 66% | | 152% | | 88% | | 136% | | 77% |
A Total returns would have been lower had certain expenses not been reduced during the periods shown. B Total returns do not include the effect of the sales charges.
C Calculated based on average shares outstanding during the period.
D Expense ratios reflect operating expenses of the class. Expenses before reductions do not reflect amounts reimbursed by the investment adviser or reductions from brokerage service arrangements or other expense offset arrangements and do not represent the amount paid by the class during periods when reimbursements or reductions occur. Expenses net of any voluntary waivers reflect expenses after reimbursement by the investment adviser but prior to reductions from brokerage service arrangements or other expense offset arrangements. Expenses net of all reductions represent the net expenses paid by the class.
E Amount represents less than $.01 per share.
See accompanying notes which are an integral part of the financial statements.
Consumer Industries A-26
| Financial Highlights — Class T | | | | | | | | | | |
| Years ended July 31, | | 2005 | | 2004 | | 2003 | | 2002 | | 2001 |
| Selected Per-Share Data | | | | | | | | | | |
| Net asset value, beginning of period | | $ 14.27 | | $ 13.51 | | $ 12.57 | | $ 15.06 | | $ 14.93 |
| Income from Investment Operations | | | | | | | | | | |
| Net investment income (loss)C | | (.11) | | (.11) | | (.07) | | (.09) | | (.02) |
| Net realized and unrealized gain (loss) | | 2.66 | | .87 | | 1.01 | | (2.05) | | .15 |
| Total from investment operations | | 2.55 | | .76 | | .94 | | (2.14) | | .13 |
| Distributions from net realized gain | | (.53) | | — | | — | | (.35) | | — |
| Redemption fees added to paid in capitalC | | —E | | —E | | —E | | —E | | —E |
| Net asset value, end of period | | $ 16.29 | | $ 14.27 | | $ 13.51 | | $ 12.57 | | $ 15.06 |
| Total ReturnA,B | | 18.52% | | 5.63% | | 7.48% | | (14.44)% | | .87% |
| Ratios to Average Net AssetsD | | | | | | | | | | |
| Expenses before expense reductions | | 1.75% | | 1.81% | | 1.87% | | 1.89% | | 1.98% |
| Expenses net of voluntary waivers, if any | | 1.69% | | 1.75% | | 1.78% | | 1.75% | | 1.75% |
| Expenses net of all reductions | | 1.67% | | 1.70% | | 1.73% | | 1.72% | | 1.73% |
| Net investment income (loss) | | (.70)% | | (.74)% | | (.58)% | | (.61)% | | (.17)% |
| Supplemental Data | | | | | | | | | | |
| Net assets, end of period (000 omitted) | | $ 16,782 | | $ 15,555 | | $ 13,693 | | $ 12,132 | | $ 12,899 |
| Portfolio turnover rate | | 66% | | 152% | | 88% | | 136% | | 77% |
A Total returns would have been lower had certain expenses not been reduced during the periods shown.
B Total returns do not include the effect of the sales charges.
C Calculated based on average shares outstanding during the period.
D Expense ratios reflect operating expenses of the class. Expenses before reductions do not reflect amounts reimbursed by the investment adviser or reductions from brokerage service arrangements or other expense offset arrangements and do not
represent the amount paid by the class during periods when reimbursements or reductions occur. Expenses net of any voluntary waivers reflect expenses after reimbursement by the investment adviser but prior to reductions from brokerage service
arrangements or other expense offset arrangements. Expenses net of all reductions represent the net expenses paid by the class.
E Amount represents less than $.01 per share.
|
| Financial Highlights — Class B | | | | | | | | | | |
| Years ended July 31, | | 2005 | | 2004 | | 2003 | | 2002 | | 2001 |
| Selected Per-Share Data | | | | | | | | | | |
| Net asset value, beginning of period | | $ 13.75 | | $ 13.08 | | $ 12.22 | | $ 14.73 | | $ 14.69 |
| Income from Investment Operations | | | | | | | | | | |
| Net investment income (loss)C | | (.17) | | (.18) | | (.13) | | (.15) | | (.10) |
| Net realized and unrealized gain (loss) | | 2.55 | | .85 | | .99 | | (2.01) | | .14 |
| Total from investment operations | | 2.38 | | .67 | | .86 | | (2.16) | | .04 |
| Distributions from net realized gain | | (.53) | | — | | — | | (.35) | | — |
| Redemption fees added to paid in capitalC | | —E | | —E | | —E | | —E | | —E |
| Net asset value, end of period | | $ 15.60 | | $ 13.75 | | $ 13.08 | | $ 12.22 | | $ 14.73 |
| Total ReturnA,B | | 17.97% | | 5.12% | | 7.04% | | (14.91)% | | .27% |
| Ratios to Average Net AssetsD | | | | | | | | | | |
| Expenses before expense reductions | | 2.24% | | 2.29% | | 2.37% | | 2.39% | | 2.51% |
| Expenses net of voluntary waivers, if any | | 2.19% | | 2.25% | | 2.25% | | 2.25% | | 2.25% |
| Expenses net of all reductions | | 2.16% | | 2.20% | | 2.19% | | 2.22% | | 2.24% |
| Net investment income (loss) | | (1.20)% | | (1.25)% | | (1.05)% | | (1.11)% | | (.67)% |
| Supplemental Data | | | | | | | | | | |
| Net assets, end of period (000 omitted) | | $ 18,862 | | $ 17,302 | | $ 15,944 | | $ 13,807 | | $ 13,483 |
| Portfolio turnover rate | | 66% | | 152% | | 88% | | 136% | | 77% |
A Total returns would have been lower had certain expenses not been reduced during the periods shown.
B Total returns do not include the effect of the contingent deferred sales charge.
C Calculated based on average shares outstanding during the period.
D Expense ratios reflect operating expenses of the class. Expenses before reductions do not reflect amounts reimbursed by the investment adviser or reductions from brokerage service arrangements or other expense offset arrangements and do not
represent the amount paid by the class during periods when reimbursements or reductions occur. Expenses net of any voluntary waivers reflect expenses after reimbursement by the investment adviser but prior to reductions from brokerage service
arrangements or other expense offset arrangements. Expenses net of all reductions represent the net expenses paid by the class.
E Amount represents less than $.01 per share.
|
See accompanying notes which are an integral part of the financial statements.
|
| Financial Highlights — Class C | | | | | | | | | | |
| Years ended July 31, | | 2005 | | 2004 | | 2003 | | 2002 | | 2001 |
| Selected Per-Share Data | | | | | | | | | | |
| Net asset value, beginning of period | | $ 13.77 | | $ 13.10 | | $ 12.24 | | $ 14.75 | | $ 14.71 |
| Income from Investment Operations | | | | | | | | | | |
| Net investment income (loss)C | | (.17) | | (.18) | | (.13) | | (.15) | | (.10) |
| Net realized and unrealized gain (loss) | | 2.55 | | .85 | | .99 | | (2.01) | | .14 |
| Total from investment operations | | 2.38 | | .67 | | .86 | | (2.16) | | .04 |
| Distributions from net realized gain | | (.53) | | — | | — | | (.35) | | — |
| Redemption fees added to paid in capitalC | | —E | | —E | | —E | | —E | | —E |
| Net asset value, end of period | | $ 15.62 | | $ 13.77 | | $ 13.10 | | $ 12.24 | | $ 14.75 |
| Total ReturnA,B | | 17.94% | | 5.11% | | 7.03% | | (14.89)% | | .27% |
| Ratios to Average Net AssetsD | | | | | | | | | | |
| Expenses before expense reductions | | 2.17% | | 2.24% | | 2.33% | | 2.35% | | 2.49% |
| Expenses net of voluntary waivers, if any | | 2.17% | | 2.24% | | 2.25% | | 2.25% | | 2.25% |
| Expenses net of all reductions | | 2.14% | | 2.19% | | 2.19% | | 2.22% | | 2.24% |
| Net investment income (loss) | | (1.18)% | | (1.24)% | | (1.05)% | | (1.11)% | | (.67)% |
| Supplemental Data | | | | | | | | | | |
| Net assets, end of period (000 omitted) | | $ 8,505 | | $ 6,992 | | $ 6,759 | | $ 5,391 | | $ 5,504 |
| Portfolio turnover rate | | 66% | | 152% | | 88% | | 136% | | 77% |
A Total returns would have been lower had certain expenses not been reduced during the periods shown.
B Total returns do not include the effect of the contingent deferred sales charge.
C Calculated based on average shares outstanding during the period.
D Expense ratios reflect operating expenses of the class. Expenses before reductions do not reflect amounts reimbursed by the investment adviser or reductions from brokerage service arrangements or other expense offset arrangements and do not
represent the amount paid by the class during periods when reimbursements or reductions occur. Expenses net of any voluntary waivers reflect expenses after reimbursement by the investment adviser but prior to reductions from brokerage service
arrangements or other expense offset arrangements. Expenses net of all reductions represent the net expenses paid by the class.
E Amount represents less than $.01 per share.
|
| Financial Highlights — Institutional Class | | | | | | | | | | |
| Years ended July 31, | | 2005 | | 2004 | | 2003 | | 2002 | | 2001 |
| Selected Per-Share Data | | | | | | | | | | |
| Net asset value, beginning of period | | $ 14.81 | | $ 13.95 | | $ 12.91 | | $ 15.38 | | $ 15.18 |
| Income from Investment Operations | | | | | | | | | | |
| Net investment income (loss)B | | (.03) | | (.04) | | (.01) | | (.02) | | .05 |
| Net realized and unrealized gain (loss) | | 2.76 | | .90 | | 1.05 | | (2.10) | | .15 |
| Total from investment operations | | 2.73 | | .86 | | 1.04 | | (2.12) | | .20 |
| Distributions from net realized gain | | (.53) | | — | | — | | (.35) | | — |
| Redemption fees added to paid in capitalB | | —D | | —D | | —D | | —D | | —D |
| Net asset value, end of period | | $ 17.01 | | $ 14.81 | | $ 13.95 | | $ 12.91 | | $ 15.38 |
| Total ReturnA | | 19.08% | | 6.16% | | 8.06% | | (14.00)% | | 1.32% |
| Ratios to Average Net AssetsC | | | | | | | | | | |
| Expenses before expense reductions | | 1.26% | | 1.34% | | 1.49% | | 1.39% | | 1.57% |
| Expenses net of voluntary waivers, if any | | 1.20% | | 1.25% | | 1.25% | | 1.25% | | 1.25% |
| Expenses net of all reductions | | 1.17% | | 1.20% | | 1.19% | | 1.22% | | 1.24% |
| Net investment income (loss) | | (.21)% | | (.25)% | | (.05)% | | (.11)% | | .33% |
| Supplemental Data | | | | | | | | | | |
| Net assets, end of period (000 omitted) | | $ 1,371 | | $ 907 | | $ 766 | | $ 1,215 | | $ 1,249 |
| Portfolio turnover rate | | 66% | | 152% | | 88% | | 136% | | 77% |
A Total returns would have been lower had certain expenses not been reduced during the periods shown.
B Calculated based on average shares outstanding during the period.
C Expense ratios reflect operating expenses of the class. Expenses before reductions do not reflect amounts reimbursed by the investment adviser or reductions from brokerage service arrangements or other expense offset arrangements and do not
represent the amount paid by the class during periods when reimbursements or reductions occur. Expenses net of any voluntary waivers reflect expenses after reimbursement by the investment adviser but prior to reductions from brokerage service
arrangements or other expense offset arrangements. Expenses net of all reductions represent the net expenses paid by the class.
D Amount represents less than $.01 per share.
|
See accompanying notes which are an integral part of the financial statements.
Consumer Industries A-28
|
Notes to Financial Statements
For the period ended July 31, 2005
|
1. Significant Accounting Policies.
|
Fidelity Advisor Consumer Industries Fund (the fund) is a non-diversified fund of Fidelity Advisor Series VII (the trust) and is authorized to issue an unlimited number of shares. The trust is registered under the Investment Company Act of 1940, as amended (the 1940 Act), as an open-end management investment company organized as a Massachusetts business trust.
The fund offers Class A, Class T, Class B, Class C, and Institutional Class shares, each of which has equal rights as to assets and voting privileges. Each class has exclusive voting rights with respect to matters that affect that class. Class B shares will automatically convert to Class A shares after a holding period of seven years from the initial date of purchase. Investment income, realized and unrealized capital gains and losses, the common expenses of the fund, and certain fund-level expense reductions, if any, are allocated on a pro rata basis to each class based on the relative net assets of each class to the total net assets of the fund. Each class differs with respect to transfer agent and distribution and service plan fees incurred. Certain expense reductions also differ by class.
The financial statements have been prepared in conformity with accounting principles generally accepted in the United States of America, which require management to make certain estimates and assumptions at the date of the financial statements. The following summarizes the significant accounting policies of the fund:
Security Valuation. Net asset value per share (NAV calculation) is calculated as of the close of business of the New York Stock Exchange, normally 4:00 p.m. Eastern time. Equity securities, including restricted securities, for which market quotations are available are valued at the last sale price or official closing price (closing bid price or last evaluated quote if no sale has occurred) on the primary market or exchange on which they trade. If prices are not readily available or do not accurately reflect fair value for a security, or if a security’s value has been materially affected by events occurring after the close of the exchange or market on which the security is principally traded, that security may be valued by another method that the Board of Trustees believes accurately reflects fair value. A security’s valuation may differ depending on the method used for determining value. Price movements in futures contracts and ADRs, market and trading trends, the bid/ask quotes of brokers and off-exchange institutional trading may be reviewed in the course of making a good faith determination of a security’s fair value. Short-term securities with remaining maturities of sixty days or less for which quotations are not readily available are valued on the basis of amortized cost. Investments in open-end investment companies are valued at their net asset value each business day.
Foreign Currency. The fund uses foreign currency contracts to facilitate transactions in foreign-denominated securities. Losses from these transactions may arise from changes in the value of the foreign currency or if the counterparties do not perform under the contracts’ terms.
Foreign-denominated assets, including investment securities, and liabilities are translated into U.S. dollars at the exchange rate at period end. Purchases and sales of investment securities, income and dividends received and expenses denominated in foreign currencies are translated into U.S. dollars at the exchange rate in effect on the transaction date.
The effects of exchange rate fluctuations on investments are included with the net realized and unrealized gain (loss) on investment securities. Other foreign currency transactions resulting in realized and unrealized gain (loss) are disclosed separately.
Investment Transactions and Income. Security transactions are accounted for as of trade date. Gains and losses on securities sold are determined on the basis of identified cost and may include proceeds received from litigation. Dividend income is recorded on the ex-dividend date, except for certain dividends from foreign securities where the ex-dividend date may have passed, which are recorded as soon as the fund is informed of the ex-dividend date. Non-cash dividends included in dividend income, if any, are recorded at the fair market value of the securities received. Distributions received on securities that represent a return of capital or capital gain are recorded as a reduction of cost of investments and/or as a realized gain. The fund estimates the components of distributions received that may be considered return of capital distributions or capital gain distributions. Interest income is accrued as earned. Interest income includes coupon interest and amortization of premium and accretion of discount on debt securities. Investment income is recorded net of foreign taxes withheld where recovery of such taxes is uncertain.
Expenses. Most expenses of the trust can be directly attributed to a fund. Expenses which cannot be directly attributed are apportioned among each fund in the trust.
Income Tax Information and Distributions to Shareholders. Each year, the fund intends to qualify as a regulated investment company by distributing all of its taxable income and realized gains under Subchapter M of the Internal Revenue Code. As a result, no provision for income taxes is required in the accompanying financial statements. Foreign taxes are provided for based on the fund’s understanding of the tax rules and rates that exist in the foreign markets in which it invests.
Distributions are recorded on the ex-dividend date. Income dividends and capital gain distributions are declared separately for each class. Income and capital gain distributions are determined in accordance with income tax regulations, which may differ from generally accepted accounting principles. Capital accounts within the financial statements are adjusted for permanent book-tax differences. These adjustments have no impact on net assets or the results of operations. Temporary book-tax differences will reverse in a subsequent period.
Notes to Financial Statements - continued
1. Significant Accounting Policies - continued
Income Tax Information and Distributions to Shareholders - continued
Book-tax differences are primarily due to foreign currency transactions, net operating losses, and losses deferred due to wash sales.
The tax-basis components of distributable earnings and the federal tax cost as of period end were as follows:
| Unrealized appreciation | | $ 11,354,269 | | |
| Unrealized depreciation | | (792,037) | | |
| Net unrealized appreciation (depreciation) | | 10,562,232 | | |
| Undistributed long-term capital gain | | 72,024 | | |
| |
| Cost for federal income tax purposes | | $ 53,120,282 | | |
| |
| The tax character of distributions paid was as follows: | | | | |
| | | July 31, 2005 | | July 31, 2004 |
| Long-term Capital Gains | | 1,957,955 | | — |
Short-Term Trading (Redemption) Fees. Shares held in the fund less than 60 days are subject to a redemption fee equal to 1.00% of the proceeds of the redeemed shares. All redemption fees, including any estimated redemption fees paid by Fidelity Management & Research Company (FMR), are retained by the fund and accounted for as an addition to paid in capital.
Repurchase Agreements. FMR has received an Exemptive Order from the Securities and Exchange Commission (the SEC) which permits the fund and other affiliated entities of FMR to transfer uninvested cash balances into joint trading accounts which are then invested in repurchase agreements. The fund may also invest directly with institutions in repurchase agreements. Repurchase agreements are collateralized by government or non-government securities. Collateral is held in segregated accounts with custodian banks and may be obtained in the event of a default of the counterparty. The fund monitors, on a daily basis, the value of the collateral to ensure it is at least equal to the principal amount of the repurchase agreement (including accrued interest). In the event of a default by the counterparty, realization of the collateral proceeds could be delayed, during which time the value of the collateral may decline.
3. Purchases and Sales of Investments.
Purchases and sales of securities, other than short-term securities and U.S. government securities, aggregated $36,749,282 and $36,324,562, respectively.
4. Fees and Other Transactions with Affiliates.
Management Fee. FMR and its affiliates provide the fund with investment management related services for which the fund pays a monthly management fee. The management fee is the sum of an individual fund fee rate that is based on an annual rate of .30% of the fund’s average net assets and a group fee rate that averaged .27% during the period. The group fee rate is based upon the average net assets of all the mutual funds advised by FMR. The group fee rate decreases as assets under management increase and increases as assets under management decrease. For the period, the total annual management fee rate was .57% of the fund’s average net assets.
Distribution and Service Plan. In accordance with Rule 12b-1 of the 1940 Act, the fund has adopted separate Distribution and Service Plans for each class of shares. Certain classes pay Fidelity Distributors Corporation (FDC), an affiliate of FMR, separate Distribution and Service Fees, each of which is based on an annual percentage of each class’ average net assets. In addition, FDC may pay financial intermediaries for selling shares of the fund and providing shareholder support services. For the period, the Distribution and Service Fee rates and the total amounts paid to and retained by FDC were as follows:
| | | Distribution | | Service | | | | Paid to | | | | Retained |
| | | Fee | | Fee | | | | FDC | | | | by FDC |
| Class A | | 0% | | .25% | | $ | | 34,179 | | $ | | 37 |
| Class T | | 25% | | .25% | | | | 80,146 | | | | 172 |
| Class B | | 75% | | .25% | | | | 178,659 | | | | 134,081 |
| Class C | | 75% | | .25% | | | | 73,012 | | | | 11,003 |
| |
| | | | | | | $ | | 365,996 | | $ | | 145,293 |
4. Fees and Other Transactions with Affiliates - continued
Sales Load. FDC receives a front-end sales charge of up to 5.75% for selling Class A shares, and 3.50% for selling Class T shares, some of which is paid to financial intermediaries for selling shares of the fund. FDC receives the proceeds of contingent deferred sales charges levied on Class A, Class T, Class B, and Class C redemptions. These charges depend on the holding period. The deferred sales charges range from 5% to 1% for Class B, 1% for Class C, and .25% for certain purchases of Class A and Class T shares.
| For the period, sales charge amounts retained by FDC were as follows: | | | | |
| | | | | Retained |
| | | | | by FDC |
| Class A | | $ | | 27,118 |
| Class T | | | | 4,512 |
| Class B* | | | | 40,399 |
| Class C* | | | | 723 |
| | | $ | | 72,752 |
| |
| * When Class B and Class C shares are initially sold, FDC pays commissions from its own resources to financial intermediaries through which the sales are made. | | | | |
Transfer Agent Fees. Fidelity Investments Institutional Operations Company, Inc. (FIIOC), an affiliate of FMR, is the transfer, dividend disbursing and shareholder servicing agent for each class of the fund. FIIOC receives account fees and asset-based fees that vary according to the account size and type of account of the shareholders of the respective classes of the fund. FIIOC pays for typesetting, printing and mailing of shareholder reports, except proxy statements. For the period the total transfer agent fees paid by each class to FIIOC, were as follows:
| | | | | | | % of |
| | | | | | | Average |
| | | | | Amount | | Net Assets |
| Class A | | $ | | 55,054 | | .40 |
| Class T | | | | 69,351 | | .43 |
| Class B | | | | 76,798 | | .43 |
| Class C | | | | 25,922 | | .36 |
| Institutional Class | | | | 4,708 | | .45 |
| |
| | | $ | | 231,833 | | |
Accounting and Security Lending Fees. Fidelity Service Company, Inc. (FSC), an affiliate of FMR, maintains the fund’s accounting records. The accounting fee is based on the level of average net assets for the month. Under a separate contract, FSC administers the security lending program. The security lending fee is based on the number and duration of lending transactions.
Central Funds. The fund may invest in affiliated Central Funds managed by Fidelity Investments Money Management, Inc. (FIMM), affiliate of FMR. The Central Funds are open-end investment companies available only to investment companies and other accounts managed by FMR and its affiliates. The Money Market Central Funds seek preservation of capital and current income. The Central Funds do not pay a management fee. Income distributions earned by the fund are recorded as income in the accompanying financial statements and totaled $45,795 for the period.
Brokerage Commissions. The fund placed a portion of its portfolio transactions with brokerage firms which are affiliates of the investment adviser. The commissions paid to these affiliated firms were $2,405 for the period.
5. Committed Line of Credit.
|
The fund participates with other funds managed by FMR in a $4.2 billion credit facility (the “line of credit”) to be utilized for temporary or emergency purposes to fund shareholder redemptions or for other short-term liquidity purposes. The fund has agreed to pay commitment fees on its pro rata portion of the line of credit. During the period, there were no borrowings on this line of credit.
The fund lends portfolio securities from time to time in order to earn additional income. The fund receives collateral (in the form of U.S. Treasury obligations, letters of credit and/or cash) against the loaned securities and maintains collateral in an amount not less than 100% of the market value of the loaned securities during the period of the loan. The market value of the loaned securities is determined at the close of business of the fund and any additional required collateral is delivered to the fund on the next business day. If the borrower defaults on its obligation to return the securities loaned because of insolvency or other reasons, a fund could experience delays and costs in recovering the securities loaned or in gaining access to the collateral. Cash collateral is invested in the Fidelity Securities Lending Cash Central Fund. At period end there were no security loans outstanding.
Notes to Financial Statements - continued
7. Expense Reductions.
|
FMR voluntarily agreed to reimburse each class to the extent annual operating expenses exceeded certain levels of average net assets as noted in the
table below. Some expenses, for example interest expense, are excluded from this reimbursement.
The following classes were in reimbursement during the period:
|
| | | Expense | | | | Reimbursement |
| | | Limitations | | | | from adviser |
| Class A | | 1.50% | | -- 1.40%* | | $ | | 3,375 |
| Class T | | 1.75% | | -- 1.65%* | | | | 8,638 |
| Class B | | 2.25% | | -- 2.15%* | | | | 9,451 |
| Class C | | 2.25% | | -- 2.15%* | | | | 130 |
| Institutional Class | | 1.25% | | -- 1.15%* | | | | 684 |
| |
| | | | | | | $ | | 22,278 |
| |
| * Expense limitation in effect at period end. | | | | | | | | |
Many of the brokers with whom FMR places trades on behalf of the fund provided services to the fund in addition to trade execution. These services included payments of certain expenses on behalf of the fund totaling $15,179 for the period. In addition, through arrangements with the fund’s custo dian, credits realized as a result of uninvested cash balances were used to reduce the fund’s expenses. During the period, these credits reduced the fund’s custody expenses by $5.
The fund’s organizational documents provide former and current trustees and officers with a limited indemnification against liabilities arising in
connection with the performance of their duties to the fund. In the normal course of business, the fund may also enter into contracts that provide
general indemnifications. The fund’s maximum exposure under these arrangements is unknown as this would be dependent on future claims that may
be made against the fund. The risk of material loss from such claims is considered remote.
9. Distributions to Shareholders.
Distributions to shareholders of each class were as follows:
|
| Years ended July 31, | | 2005 | | | | 2004 | | |
| From net realized gain | | | | | | | | |
| Class A | | $ 428,722 | | $ | | | | — |
| Class T | | 574,417 | | | | | | — |
| Class B | | 656,667 | | | | | | — |
| Class C | | 265,179 | | | | | | — |
| Institutional Class | | 32,970 | | | | | | — |
| Total | | $ 1,957,955 | | $ | | | | — |
10. Share Transactions.
Transactions for each class of shares were as follows:
|
| | | | | Shares | | | | | | Dollars | | |
| Years ended July 31, | | 2005 | | | | 2004 | | 2005 | | | | 2004 |
| Class A | | | | | | | | | | | | |
| Shares sold | | 482,465 | | | | 362,299 | | $ 7,543,570 | | $ | | 5,424,551 |
| Reinvestment of distributions | | 26,992 | | | | — | | 380,585 | | | | — |
| Shares redeemed | | (250,204) | | | | (209,272) | | (3,816,608) | | | | (3,099,528) |
| Net increase (decrease) | | 259,253 | | | | 153,027 | | $ 4,107,547 | | $ | | 2,325,023 |
| Class T | | | | | | | | | | | | |
| Shares sold | | 253,353 | | | | 372,905 | | $ 3,867,037 | | $ | | 5,380,121 |
| Reinvestment of distributions | | 38,833 | | | | — | | 538,224 | | | | — |
| Shares redeemed | | (352,192) | | | | (296,211) | | (5,340,776) | | | | (4,343,994) |
| Net increase (decrease) | | (60,006) | | | | 76,694 | | $ (935,515) | | $ | | 1,036,127 |
| Class B | | | | | | | | | | | | |
| Shares sold | | 244,951 | | | | 317,001 | | $ 3,583,578 | | $ | | 4,519,412 |
| Reinvestment of distributions | | 43,290 | | | | — | | 576,619 | | | | — |
| Shares redeemed | | (337,303) | | | | (277,375) | | (4,889,935) | | | | (3,946,551) |
| Net increase (decrease) | | (49,062) | | | | 39,626 | | $ (729,738) | | $ | | 572,861 |
| Class C | | | | | | | | | | | | |
| Shares sold | | 159,223 | | | | 145,559 | | $ 2,344,716 | | $ | | 2,089,237 |
| Reinvestment of distributions | | 16,994 | | | | — | | 226,706 | | | | — |
| Shares redeemed | | (139,563) | | | | (153,637) | | (2,002,889) | | | | (2,161,430) |
| Net increase (decrease) | | 36,654 | | | | (8,078) | | $ 568,533 | | $ | | (72,193) |
| Institutional Class | | | | | | | | | | | | |
| Shares sold | | 26,159 | | | | 20,688 | | $ 423,819 | | $ | | 317,524 |
| Reinvestment of distributions | | 1,868 | | | | — | | 26,919 | | | | — |
| Shares redeemed | | (8,711) | | | | (14,366) | | (138,495) | | | | (216,750) |
| Net increase (decrease) | | 19,316 | | | | 6,322 | | $ 312,243 | | $ | | 100,774 |
Advisor Cyclical Industries Fund — Institutional Class
Average annual total return reflects the change in the value of an investment, assuming reinvestment of the class’ dividend income and capital gains (the profits earned upon the sale of securities that have grown in value) and assuming a constant rate of performance each year. The $10,000 table and the fund’s returns do not reflect the deduction of taxes that a shareholder would pay on fund distributions or the redemption of fund shares. During periods of reimbursement by Fidelity, a fund’s total return will be greater than it would be had the reimbursement not occurred. How a fund did yesterday is no guarantee of how it will do tomorrow.
| Average Annual Total Returns | | | | |
| Periods ended July 31, 2005 | | Past 1 | | Past 5 | | Life of |
| | | year | | years | | fundA |
| Institutional Class | | 25.41% | | 11.88% | | 12.40% |
| |
| A From September 3, 1996. | | | | | | |
| | $10,000 Over Life of Fund
|
Let’s say hypothetically that $10,000 was invested in Fidelity Advisor Cyclical Industries Fund — Institutional Class on September 3, 1996, when the fund started. The chart shows how the value of your investment would have changed, and also shows how the S&P 500 Index performed over the same period.
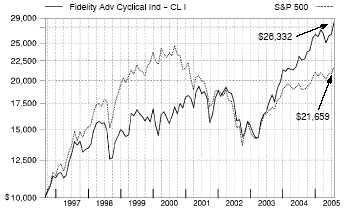
Advisor Cyclical Industries Fund — Institutional Class
|
Management’s Discussion of Fund Performance
Comments from Matthew Friedman, Portfolio Manager of Fidelity® Advisor Cyclical Industries Fund
A late-inning rally on Wall Street helped push some key U.S. equity indexes to four-year highs by the conclusion of the 12-month period ending July 31, 2005. Spurred on by bullish economic data and strong corporate earnings, investors enjoyed a stellar month of July, capping off a turbulent 12-month period for U.S. equity markets. Stock prices bounced up and down during most of the year, moving in cadence with gyrations in the price of crude oil and investors’ gathering and ebbing concerns about inflation. The Federal Reserve Board raised short-term interest rates eight times during the period, also affecting overall market sentiment. Despite their fluctuations, the major equity indexes finished on a high note, with the Standard & Poor’s 500SM Index and the NASDAQ Composite® Index posting gains of 14.05% and 16.51%, respectively, for the period. The small-cap Russell 2000® Index rose 24.78% and the Russell Midcap® Index jumped 28.93%, while the blue-chips’ Dow Jones Industrial AverageSM advanced only 7.29% .
For the 12 months that ended July 31, 2005, the fund’s Institutional Class shares returned 25.41%, strongly outpacing the Goldman Sachs® Cyclical Industries Index, which returned 17.16%, and the S&P 500®. Stock selection was key to the fund’s outperformance of the sector index. Among the top contributors were Lyondell Chemical and Millennium Chemicals, both of which enjoyed robust profits. The stocks rose further when the companies merged in December 2004. Investments in homebuilders KB Home, Ryland Group and Toll Brothers helped returns when the group generated strong earnings. Aerospace companies BE Aerospace and Precision Castparts benefited from pent-up demand for new aircraft. The fund’s lack of exposure to poorly performing U.S. auto manufacturers — a large component of the sector index — also was positive. Conversely, a sizable position in Dycom Industries, which supplies video cable trenches for telephone companies, underperformed in response to lackluster demand. Also, the fund wasn’t invested in other homebuilders — including index components Centex, Pulte and Lennar — that performed well. Elsewhere, Honeywell and Maytag underperformed in response to margin pressures.
The views expressed in this statement reflect those of the portfolio manager only through the end of the period of the report as stated on the cover and do not necessarily represent the views of Fidelity or any other person in the Fidelity organization. Any such views are subject to change at any time based upon market or other conditions and Fidelity disclaims any responsibility to update such views. These views may not be relied on as investment advice and, because investment decisions for a Fidelity fund are based on numerous factors, may not be relied on as an indication of trading intent on behalf of any Fidelity fund.
Advisor Cyclical Industries Fund
Shareholder Expense Example
|
As a shareholder of the Fund, you incur two types of costs: (1) transaction costs, including sales charges (loads) on purchase payments or redemption proceeds, redemption fees, and (2) ongoing costs, including management fees, distribution and/or service (12b-1) fees and other Fund expenses. This Example is intended to help you understand your ongoing costs (in dollars) of investing in the Fund and to compare these costs with the ongoing costs of investing in other mutual funds.
The Example is based on an investment of $1,000 invested at the beginning of the period and held for the entire period (February 1, 2005 to July 31, 2005).
The first line of the table below for each class of the Fund provides information about actual account values and actual expenses. You may use the information in this line, together with the amount you invested, to estimate the expenses that you paid over the period. Simply divide your account value by $1,000.00 (for example, an $8,600 account value divided by $1,000.00 = 8.6), then multiply the result by the number in the first line for a class of the Fund under the heading entitled “Expenses Paid During Period” to estimate the expenses you paid on your account during this period.
Hypothetical Example for Comparison Purposes
|
The second line of the table below for each class of the Fund provides information about hypothetical account values and hypothetical expenses based on a Class’ actual expense ratio and an assumed rate of return of 5% per year before expenses, which is not the Class’ actual return. The hypothetical account values and expenses may not be used to estimate the actual ending account balance or expenses you paid for the period. You may use this information to compare the ongoing costs of investing in the Fund and other funds. To do so, compare this 5% hypothetical example with the 5% hypothetical examples that appear in the shareholder reports of the other funds.
Please note that the expenses shown in the table are meant to highlight your ongoing costs only and do not reflect any transaction costs. Therefore, the second line of the table is useful in comparing ongoing costs only, and will not help you determine the relative total costs of owning different funds. In addition, if these transactional costs were included, your costs would have been higher.
| | | | | | | | | Expenses Paid |
| | | Beginning | | | | Ending | | During Period* |
| | | Account Value | | | | Account Value | | February 1, 2005 |
| | | February 1, 2005 | | | | July 31, 2005 | | to July 31, 2005 |
| Class A | | | | | | | | | | |
| Actual | | $ 1,000.00 | | $ | | 1,089.00 | | $ | | 6.73 |
| HypotheticalA | | $ 1,000.00 | | $ | | 1,018.35 | | $ | | 6.51 |
| Class T | | | | | | | | | | |
| Actual | | $ 1,000.00 | | $ | | 1,088.00 | | $ | | 7.92 |
| HypotheticalA | | $ 1,000.00 | | $ | | 1,017.21 | | $ | | 7.65 |
| Class B | | | | | | | | | | |
| Actual | | $ 1,000.00 | | $ | | 1,084.40 | | $ | | 10.70 |
| HypotheticalA | | $ 1,000.00 | | $ | | 1,014.53 | | $ | | 10.34 |
| Class C | | | | | | | | | | |
| Actual | | $ 1,000.00 | | $ | | 1,085.00 | | $ | | 10.49 |
| HypotheticalA | | $ 1,000.00 | | $ | | 1,014.73 | | $ | | 10.14 |
| Institutional Class | | | | | | | | | | |
| Actual | | $ 1,000.00 | | $ | | 1,090.50 | | $ | | 5.24 |
| HypotheticalA | | $ 1,000.00 | | $ | | 1,019.79 | | $ | | 5.06 |
| |
| A 5% return per year before expenses | | | | | | | | | | |
* Expenses are equal to each Class’ annualized expense ratio (shown in the table below); multiplied by the average account value over the period, multiplied by 181/365 (to reflect the one-half year period).
| | | Annualized |
| | | Expense Ratio |
| Class A | | 1.30% |
| Class T | | 1.53% |
| Class B | | 2.07% |
| Class C | | 2.03% |
| Institutional Class | | 1.01% |
| | Advisor Cyclical Industries Fund
Investment Changes
|
| Top Ten Stocks as of July 31, 2005 | | |
| | | % of fund’s | | % of fund’s net assets |
| | | net assets | | 6 months ago |
| Honeywell International, Inc. | | 3.3 | | 3.1 |
| Tyco International Ltd. | | 3.3 | | 4.9 |
| General Electric Co. | | 2.6 | | 4.6 |
| Dow Chemical Co. | | 2.5 | | 1.7 |
| The Boeing Co. | | 2.4 | | 2.3 |
| Caterpillar, Inc. | | 2.1 | | 0.5 |
| 3M Co. | | 2.1 | | 2.7 |
| Fluor Corp. | | 1.9 | | 0.2 |
| Toll Brothers, Inc. | | 1.9 | | 1.5 |
| Burlington Northern Santa Fe Corp. | | 1.8 | | 1.1 |
| | | 23.9 | | |
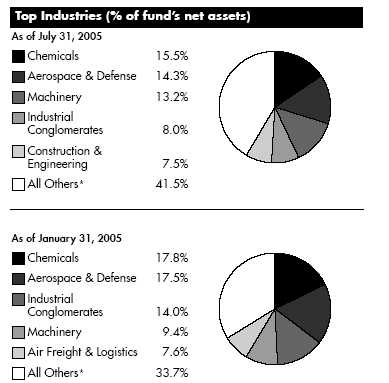
| | * Includes short term investments and net other assets.
Prior period industry classifications reflect the categories in place as of the date
indicated and have not been adjusted to reflect current industry classifications.
|
A-37 A-37 Annual Report
Advisor Cyclical Industries Fund
Investments July 31, 2005
Showing Percentage of Net Assets
| Common Stocks — 99.0% | | | | | | |
| | | Shares | | Value (Note 1) |
| |
| AEROSPACE & DEFENSE – 14.3% | | | | | | |
| Aerospace & Defense – 14.3% | | | | | | |
| BE Aerospace, Inc. (a) | | 57,000 | | $ | | 999,210 |
| EADS NV | | 8,879 | | | | 298,535 |
| EDO Corp. | | 24,040 | | | | 741,634 |
| Embraer – Empresa Brasileira de | | | | | | |
| Aeronautica SA sponsored ADR | | 300 | | | | 9,702 |
| Essex Corp. (a) | | 2,700 | | | | 56,565 |
| General Dynamics Corp. | | 2,800 | | | | 322,532 |
| Goodrich Corp. | | 9,200 | | | | 407,008 |
| Hexcel Corp. (a) | | 50,700 | | | | 876,096 |
| Honeywell International, Inc. | | 116,600 | | | | 4,580,047 |
| L-3 Communications Holdings, Inc. | | 11,400 | | | | 891,822 |
| Lockheed Martin Corp. | | 14,514 | | | | 905,674 |
| Precision Castparts Corp. | | 12,700 | | | | 1,142,746 |
| Raytheon Co. | | 33,300 | | | | 1,309,689 |
| Rockwell Collins, Inc. | | 33,040 | | | | 1,612,352 |
| Rolls-Royce Group PLC | | 383 | | | | 2,252 |
| The Boeing Co. | | 50,100 | | | | 3,307,101 |
| United Technologies Corp. | | 43,100 | | | | 2,185,170 |
| | | | | | | 19,648,135 |
| |
| AIR FREIGHT & LOGISTICS – 6.0% | | | | | | |
| Air Freight & Logistics – 6.0% | | | | | | |
| C.H. Robinson Worldwide, Inc. | | 13,900 | | | | 869,723 |
| EGL, Inc. (a) | | 36,500 | | | | 734,745 |
| Expeditors International of Washington, | | | | | | |
| Inc. | | 12,800 | | | | 704,640 |
| FedEx Corp. | | 29,800 | | | | 2,505,882 |
| Forward Air Corp. | | 12,020 | | | | 418,897 |
| Hub Group, Inc. Class A (a) | | 25,636 | | | | 794,203 |
| Park-Ohio Holdings Corp. (a) | | 17,700 | | | | 359,664 |
| United Parcel Service, Inc. Class B | | 15,300 | | | | 1,116,441 |
| UTI Worldwide, Inc. | | 10,000 | | | | 713,600 |
| | | | | | | 8,217,795 |
| |
| AIRLINES – 1.8% | | | | | | |
| Airlines – 1.8% | | | | | | |
| AirTran Holdings, Inc. (a) | | 141,600 | | | | 1,619,904 |
| Alaska Air Group, Inc. (a) | | 4,400 | | | | 153,912 |
| AMR Corp. (a) | | 32,900 | | | | 462,245 |
| JetBlue Airways Corp. (a) | | 14,600 | | | | 306,600 |
| | | | | | | 2,542,661 |
| |
| AUTO COMPONENTS – 2.8% | | | | | | |
| Auto Parts & Equipment – 2.8% | | | | | | |
| American Axle & Manufacturing | | | | | | |
| Holdings, Inc. | | 23,500 | | | | 647,425 |
| Amerigon, Inc. (a) | | 21,800 | | | | 96,792 |
| BorgWarner, Inc. | | 7,800 | | | | 453,726 |
| Delphi Corp. | | 66,200 | | | | 350,860 |
| Johnson Controls, Inc. | | 7,400 | | | | 425,056 |
| Lear Corp. | | 24,300 | | | | 1,039,311 |
| | | Shares | | Value (Note 1) |
| Midas, Inc. (a) | | 15,700 | | $ | | 363,141 |
| Tenneco Automotive, Inc. (a) | | 22,100 | | | | 416,806 |
| | | | | | | 3,793,117 |
| |
| AUTOMOBILES – 0.9% | | | | | | |
| Automobile Manufacturers – 0.9% | | | | | | |
| Honda Motor Co. Ltd. sponsored ADR | | 10,300 | | | | 265,431 |
| National R.V. Holdings, Inc. (a) | | 27,800 | | | | 212,670 |
| Renault SA | | 4,700 | | | | 430,826 |
| Toyota Motor Corp. sponsored ADR | | 3,500 | | | | 265,510 |
| | | | | | | 1,174,437 |
| |
| BUILDING PRODUCTS – 1.7% | | | | | | |
| Building Products – 1.7% | | | | | | |
| American Standard Companies, Inc. | | 8,600 | | | | 380,808 |
| Masco Corp. | | 30,200 | | | | 1,024,082 |
| Quixote Corp. | | 18,951 | | | | 385,274 |
| Trex Co., Inc. (a) | | 8,200 | | | | 241,080 |
| York International Corp. | | 7,700 | | | | 329,021 |
| | | | | | | 2,360,265 |
| |
| CHEMICALS – 15.5% | | | | | | |
| Commodity Chemicals – 1.9% | | | | | | |
| Celanese Corp. Class A | | 25,900 | | | | 487,438 |
| Georgia Gulf Corp. | | 9,600 | | | | 304,608 |
| Lyondell Chemical Co. | | 428 | | | | 11,958 |
| NOVA Chemicals Corp. | | 22,700 | | | | 796,127 |
| Pioneer Companies, Inc. (a) | | 22,800 | | | | 553,356 |
| Spartech Corp. | | 22,400 | | | | 419,552 |
| | | | | | | 2,573,039 |
| Diversified Chemicals – 4.5% | | | | | | |
| Ashland, Inc. | | 14,600 | | | | 897,170 |
| Dow Chemical Co. | | 72,100 | | | | 3,457,195 |
| Eastman Chemical Co. | | 5,400 | | | | 299,106 |
| FMC Corp. (a) | | 25,700 | | | | 1,554,336 |
| | | | | | | 6,207,807 |
| Fertilizers & Agricultural Chemicals – 2.6% | | | | | | |
| Agrium, Inc. | | 22,300 | | | | 509,985 |
| Monsanto Co. | | 18,200 | | | | 1,226,134 |
| Mosaic Co. (a) | | 59,251 | | | | 1,030,967 |
| Potash Corp. of Saskatchewan | | 8,400 | | | | 893,891 |
| | | | | | | 3,660,977 |
| Industrial Gases – 3.6% | | | | | | |
| Air Products & Chemicals, Inc. | | 33,900 | | | | 2,025,864 |
| Airgas, Inc. | | 42,400 | | | | 1,250,800 |
| Praxair, Inc. | | 33,800 | | | | 1,669,382 |
| | | | | | | 4,946,046 |
| Specialty Chemicals – 2.9% | | | | | | |
| Albemarle Corp. | | 13,700 | | | | 521,970 |
| Chemtura Corp. | | 58,594 | | | | 922,270 |
| Cytec Industries, Inc. | | 8,800 | | | | 399,344 |
| Ecolab, Inc. | | 21,300 | | | | 715,254 |
| Ferro Corp. | | 4,100 | | | | 92,250 |
See accompanying notes which are an integral part of the financial statements.
Cyclical Industries A-38
|
| Common Stocks – continued | | | | | | |
| | | Shares | | Value (Note 1) |
| |
| CHEMICALS – CONTINUED | | | | | | |
| Specialty Chemicals – continued | | | | | | |
| H.B. Fuller Co. | | 19,000 | | $ | | 656,070 |
| Lubrizol Corp. | | 13,100 | | | | 576,400 |
| Minerals Technologies, Inc. | | 1,500 | | | | 93,360 |
| Rohm & Haas Co. | | 200 | | | | 9,212 |
| | | | | | | 3,986,130 |
| |
| TOTAL CHEMICALS | | | | | | 21,373,999 |
| |
| COMMERCIAL SERVICES & SUPPLIES – 2.2% | | | | | | |
| Diversified Commercial & Professional Services – 0.5% | | | | |
| CRA International, Inc. (a) | | 5,700 | | | | 303,240 |
| LECG Corp. (a) | | 15,900 | | | | 343,679 |
| | | | | | | 646,919 |
| Environmental & Facility Services – 0.8% | | | | | | |
| Waste Connections, Inc. (a) | | 15,050 | | | | 541,800 |
| Waste Management, Inc. | | 2,000 | | | | 56,240 |
| Waste Services, Inc. (a) | | 120,100 | | | | 468,390 |
| | | | | | | 1,066,430 |
| Human Resource & Employment Services – 0.8% | | | | |
| CDI Corp. | | 14,200 | | | | 348,894 |
| Robert Half International, Inc. | | 22,400 | | | | 759,136 |
| | | | | | | 1,108,030 |
| Office Services & Supplies – 0.1% | | | | | | |
| Herman Miller, Inc. | | 6,800 | | | | 217,124 |
| |
| TOTAL COMMERCIAL SERVICES & SUPPLIES | | | | 3,038,503 |
| |
| COMMUNICATIONS EQUIPMENT – 0.6% | | | | | | |
| Communications Equipment – 0.6% | | | | | | |
| Harris Corp. | | 21,200 | | | | 785,884 |
| CONSTRUCTION & ENGINEERING – 7.5% | | | | | | |
| Construction & Engineering – 7.5% | | | | | | |
| Chicago Bridge & Iron Co. NV (NY | | | | | | |
| Shares) | | 39,400 | | | | 1,101,230 |
| Comfort Systems USA, Inc. (a) | | 43,400 | | | | 336,350 |
| Dycom Industries, Inc. (a) | | 40,800 | | | | 995,520 |
| Fluor Corp. | | 41,800 | | | | 2,666,840 |
| Foster Wheeler Ltd. (a) | | 32,920 | | | | 760,452 |
| Granite Construction, Inc. | | 21,600 | | | | 739,152 |
| Jacobs Engineering Group, Inc. (a) | | 12,700 | | | | 747,776 |
| Perini Corp. (a) | | 38,400 | | | | 676,224 |
| Shaw Group, Inc. (a) | | 65,600 | | | | 1,254,272 |
| SNC-Lavalin Group, Inc. | | 11,700 | | | | 672,271 |
| URS Corp. (a) | | 1,000 | | | | 37,450 |
| Washington Group International, Inc. (a) | | 5,800 | | | | 312,852 |
| | | | | | | 10,300,389 |
| | | Shares | | Value (Note 1) |
| |
| CONSTRUCTION MATERIALS – 1.5% | | | | | | |
| Construction Materials – 1.5% | | | | | | |
| Lafarge North America, Inc. | | 24 | | $ | | 1,675 |
| Martin Marietta Materials, Inc. | | 14,400 | | | | 1,046,736 |
| Texas Industries, Inc. | | 179 | | | | 13,180 |
| Vulcan Materials Co. | | 14,700 | | | | 1,032,528 |
| | | | | | | 2,094,119 |
| |
| CONTAINERS & PACKAGING – 0.8% | | | | | | |
| Metal & Glass Containers – 0.8% | | | | | | |
| Owens-Illinois, Inc. (a) | | 40,200 | | | | 1,031,130 |
| DIVERSIFIED CONSUMER SERVICES – 0.1% | | | | | | |
| Education Services – 0.1% | | | | | | |
| Education Management Corp. (a) | | 5,200 | | | | 180,700 |
| ELECTRICAL EQUIPMENT – 1.9% | | | | | | |
| Electrical Components & Equipment – 1.4% | | | | | | |
| AMETEK, Inc. | | 5,900 | | | | 243,080 |
| C&D Technologies, Inc. | | 20,100 | | | | 202,407 |
| Emerson Electric Co. | | 100 | | | | 6,580 |
| NEOMAX Co. Ltd. | | 15,000 | | | | 318,156 |
| Rockwell Automation, Inc. | | 9,800 | | | | 504,798 |
| Roper Industries, Inc. | | 8,600 | | | | 660,050 |
| | | | | | | 1,935,071 |
| Heavy Electrical Equipment – 0.5% | | | | | | |
| ABB Ltd. sponsored ADR (a) | | 43,200 | | | | 294,192 |
| Shanghai Electric (Group) Corp. | | | | | | |
| (H Shares) | | 1,748,000 | | | | 436,235 |
| | | | | | | 730,427 |
| |
| TOTAL ELECTRICAL EQUIPMENT | | | | | | 2,665,498 |
| |
| ELECTRONIC EQUIPMENT & INSTRUMENTS – 0.1% | | | | |
| Electronic Equipment & Instruments – 0.1% | | | | | | |
| FARO Technologies, Inc. (a) | | 4,000 | | | | 94,720 |
| HEALTH CARE EQUIPMENT & SUPPLIES – 0.1% | | | | |
| Health Care Equipment – 0.1% | | | | | | |
| Varian, Inc. (a) | | 2,700 | | | | 101,169 |
| HOUSEHOLD DURABLES – 7.0% | | | | | | |
| Consumer Electronics – 0.2% | | | | | | |
| Harman International Industries, Inc. | | 3,200 | | | | 275,040 |
| Home Furnishings – 1.1% | | | | | | |
| Interface, Inc. Class A (a) | | 115,440 | | | | 1,178,642 |
| Tempur-Pedic International, Inc. (a)(d) | | 18,700 | | | | 321,827 |
| | | | | | | 1,500,469 |
| Homebuilding – 5.7% | | | | | | |
| Champion Enterprises, Inc. (a) | | 31,800 | | | | 383,508 |
| D.R. Horton, Inc. | | 30,700 | | | | 1,261,156 |
| KB Home | | 26,100 | | | | 2,137,851 |
See accompanying notes which are an integral part of the financial statements.
A-39 A-39 Annual Report
Advisor Cyclical Industries Fund
Investments - continued
|
| Common Stocks – continued | | | | |
| | | Shares | | Value (Note 1) |
| |
| HOUSEHOLD DURABLES – CONTINUED | | | | |
| Homebuilding – continued | | | | |
| Ryland Group, Inc. | | 19,400 | | $ 1,567,520 |
| Toll Brothers, Inc. (a) | | 46,400 | | 2,571,488 |
| | | | | 7,921,523 |
| |
| TOTAL HOUSEHOLD DURABLES | | | | 9,697,032 |
| |
| INDUSTRIAL CONGLOMERATES – 8.0% | | | | |
| Industrial Conglomerates – 8.0% | | | | |
| 3M Co. | | 38,260 | | 2,869,500 |
| General Electric Co. | | 102,400 | | 3,532,800 |
| Tyco International Ltd. | | 149,900 | | 4,567,453 |
| | | | | 10,969,753 |
| |
| IT SERVICES – 0.2% | | | | |
| IT Consulting & Other Services – 0.2% | | | | |
| Anteon International Corp. (a) | | 5,000 | | 234,750 |
| SI International, Inc. (a) | | 700 | | 22,057 |
| | | | | 256,807 |
| |
| MACHINERY – 13.2% | | | | |
| Construction & Farm Machinery & Heavy Trucks – 8.9% | | |
| A.S.V., Inc. (a) | | 3,500 | | 167,825 |
| Astec Industries, Inc. (a) | | 2,200 | | 63,778 |
| Bucyrus International, Inc. Class A | | 24,100 | | 1,027,142 |
| Caterpillar, Inc. | | 54,000 | | 2,911,140 |
| Daewoo Shipbuilding & Marine | | | | |
| Engineering Co. Ltd. | | 18,310 | | 347,126 |
| Deere & Co. | | 31,300 | | 2,301,489 |
| Freightcar America, Inc. | | 27,500 | | 881,650 |
| Joy Global, Inc. | | 52,600 | | 2,160,282 |
| Manitowoc Co., Inc. | | 20,800 | | 949,520 |
| Navistar International Corp. (a) | | 16,140 | | 551,181 |
| PACCAR, Inc. | | 150 | | 10,833 |
| Samsung Heavy Industries Ltd. | | 33,670 | | 386,615 |
| Toro Co. | | 3,400 | | 136,816 |
| Wabash National Corp | | 12,300 | | 264,573 |
| | | | | 12,159,970 |
| Industrial Machinery – 4.3% | | | | |
| Actuant Corp. Class A (a) | | 9,500 | | 442,035 |
| Albany International Corp. Class A | | 10,100 | | 353,904 |
| Briggs & Stratton Corp. | | 3,000 | | 112,110 |
| Danaher Corp. | | 17,000 | | 942,650 |
| Dover Corp. | | 24,700 | | 1,019,122 |
| Hardinge, Inc. | | 13,570 | | 207,621 |
| ITT Industries, Inc. | | 12,700 | | 1,351,280 |
| Kennametal, Inc. | | 3 | | 143 |
| Pall Corp. | | 200 | | 6,194 |
| Pentair, Inc. | | 7,000 | | 281,190 |
| | | Shares | | Value (Note 1) |
| Timken Co. | | 21,500 | | $ | | 569,105 |
| Watts Water Technologies, Inc. Class A . | | 18,500 | | | | 675,250 |
| | | | | | | 5,960,604 |
| |
| TOTAL MACHINERY | | | | | | 18,120,574 |
| |
| MARINE – 2.6% | | | | | | |
| Marine – 2.6% | | | | | | |
| Alexander & Baldwin, Inc. | | 7,920 | | | | 423,562 |
| Camillo Eitzen & Co. ASA | | 700 | | | | 7,226 |
| Diana Shipping, Inc. | | 19,500 | | | | 253,305 |
| DryShips, Inc. | | 900 | | | | 12,870 |
| Excel Maritime Carriers Ltd. (a) | | 700 | | | | 9,002 |
| Golden Ocean Group Ltd. (a) | | 1,400 | | | | 854 |
| Odfjell ASA (A Shares) | | 71,300 | | | | 1,461,144 |
| Stolt-Nielsen SA | | 41,000 | | | | 1,408,772 |
| | | | | | | 3,576,735 |
| |
| METALS & MINING – 0.2% | | | | | | |
| Steel – 0.2% | | | | | | |
| Carpenter Technology Corp. | | 5,300 | | | | 331,992 |
| OIL, GAS & CONSUMABLE FUELS – 0.9% | | | | | | |
| Coal & Consumable Fuels – 0.2% | | | | | | |
| Massey Energy Co. | | 5,100 | | | | 220,575 |
| Oil & Gas Storage & Transport – 0.7% | | | | | | |
| General Maritime Corp. | | 9,200 | | | | 358,708 |
| OMI Corp. | | 36,800 | | | | 663,504 |
| | | | | | | 1,022,212 |
| |
| TOTAL OIL, GAS & CONSUMABLE FUELS | | | | | | 1,242,787 |
| |
| ROAD & RAIL – 6.7% | | | | | | |
| Railroads – 5.4% | | | | | | |
| Burlington Northern Santa Fe Corp. | | 46,500 | | | | 2,522,625 |
| Canadian National Railway Co. | | 21,600 | | | | 1,431,649 |
| Canadian Pacific Railway Ltd. | | 25,600 | | | | 993,180 |
| Norfolk Southern Corp. | | 66,000 | | | | 2,455,860 |
| | | | | | | 7,403,314 |
| Trucking – 1.3% | | | | | | |
| Laidlaw International, Inc. | | 39,300 | | | | 1,010,010 |
| Landstar System, Inc. (a) | | 22,608 | | | | 753,299 |
| | | | | | | 1,763,309 |
| |
| TOTAL ROAD & RAIL | | | | | | 9,166,623 |
| |
| SPECIALTY RETAIL – 0.4% | | | | | | |
| Home Improvement Retail – 0.4% | | | | | | |
| Sherwin-Williams Co. | | 12,800 | | | | 609,408 |
| TRADING COMPANIES & DISTRIBUTORS – 2.0% | | | | |
| Trading Companies & Distributors – 2.0% | | | | | | |
| Finning International, Inc. | | 10,800 | | | | 335,022 |
| MSC Industrial Direct Co., Inc. Class A | | 29,900 | | | | 1,156,831 |
See accompanying notes which are an integral part of the financial statements.
Cyclical Industries A-40
| Common Stocks – continued | | | | |
| | | Shares | | Value (Note 1) |
| |
| TRADING COMPANIES & DISTRIBUTORS – CONTINUED | | |
| Trading Companies & Distributors – continued | | |
| United Rentals, Inc. (a) | | 15,100 | | $ 280,860 |
| WESCO International, Inc. (a) | | 30,600 | | 1,042,236 |
| | | | | 2,814,949 |
| |
| TOTAL COMMON STOCKS | | | | |
| (Cost $117,344,133) | | | | 136,189,181 |
| |
| Nonconvertible Preferred Stocks — 0.2% |
| |
| AUTOMOBILES – 0.2% | | | | |
| Automobile Manufacturers – 0.2% | | | | |
| Porsche AG (non-vtg.) | | | | |
| (Cost $295,648) | | 400 | | 317,195 |
| |
| Money Market Funds — 1.2% | | |
| |
| Fidelity Cash Central Fund, | | | | |
| 3.31% (b) | | 1,362,247 | | 1,362,247 |
| Fidelity Securities Lending Cash | | | | |
| Central Fund, 3.32% (b)(c) | | 317,900 | | 317,900 |
| TOTAL MONEY MARKET FUNDS | | | | |
| (Cost $1,680,147) | | | | 1,680,147 |
| |
| TOTAL INVESTMENT PORTFOLIO - 100.4% | | |
| (Cost $119,319,828) | | | | 138,186,523 |
| |
| NET OTHER ASSETS – (0.4)% | | | | (579,145) |
| NET ASSETS – 100% | | $ | | 137,607,378 |
| | Legend
(a) Non-income producing
(b) Affiliated fund that is available only to investment companies and other
accounts managed by Fidelity Investments. The rate quoted is the
annualized seven-day yield of the fund at period end. A complete listing
of the fund’s holdings as of its most recent quarter end is available upon
request.
(c) Investment made with cash collateral received from securities on loan.
(d) Security or a portion of the security is on loan at period end.
|
Other Information
Distribution of investments by country of issue, as a percentage of total net assets, is as follows:
| United States of America | | 88.6% |
| Canada | | 4.1% |
| Norway | | 1.1% |
| Luxembourg | | 1.0% |
| Netherlands | | 1.0% |
| Others (individually less than 1%) | | 4.2% |
| | | 100.0% |
See accompanying notes which are an integral part of the financial statements.
A-41 A-41 Annual Report
Advisor Cyclical Industries Fund
Financial Statements
|
| Statement of Assets and Liabilities | | | | |
| | | | | | | | | July 31, 2005 |
| |
| Assets | | | | | | | | |
| Investment in securities, at value (in- | | | | | | |
| cluding securities loaned of | | | | | | | | |
| $321,827) (cost $119,319,928) — | | | | | | |
| See accompanying schedule | | | | | | $ | | 138,186,523 |
| Cash | | | | | | | | 2,939 |
| Receivable for investments sold | | | | | | | | 1,634,317 |
| Receivable for fund shares sold | | | | | | | | 692,753 |
| Dividends receivable | | | | | | | | 71,046 |
| Interest receivable | | | | | | | | 5,231 |
| Prepaid expenses | | | | | | | | 102 |
| Other affiliated receivables | | | | | | | | 27 |
| Other receivables | | | | | | | | 29,770 |
| Total assets | | | | | | | | 140,622,708 |
| Liabilities | | | | | | | | |
| Payable for investments purchased | | $ | | 2,331,130 | | | | |
| Payable for fund shares redeemed | | | | 163,761 | | | | |
| Accrued management fee | | | | 62,738 | | | | |
| Distribution fees payable | | | | 66,296 | | | | |
| Other affiliated payables | | | | 38,336 | | | | |
| Other payables and accrued expenses | | 35,169 | | | | |
| Collateral on securities loaned, at value | | 317,900 | | | | |
| Total liabilities | | | | | | | | 3,015,330 |
| Net Assets | | | | | | $ | | 137,607,378 |
| Net Assets consist of: | | | | | | | | |
| Paid in capital | | | | | | $ | | 112,161,586 |
| Accumulated net investment loss | | | | | | | | (15) |
| Accumulated undistributed net realized | | | | | | |
| gain (loss) on investments and for- | | | | | | |
| eign currency transactions | | | | | | | | 6,579,112 |
| Net unrealized appreciation (depreci- | | | | | | |
| ation) on investments and assets and | | | | | | |
| liabilities in foreign currencies | | | | | | | | 18,866,695 |
| Net Assets | | | | | | $ | | 137,607,378 |
| Calculation of Maximum Offering Price | | | | | | |
| Class A: | | | | | | | | |
| Net Asset Value and redemption | | | | | | | | |
| price per share ($40,264,044 ÷ | | | | | | |
| 1,870,031 shares) | | | | | | $ | | 21.53 |
| Maximum offering price per share | | | | | | | | |
| (100/94.25 of $21.53) | | | | | | $ | | 22.84 |
| Class T: | | | | | | | | |
| Net Asset Value and redemption | | | | | | | | |
| price per share ($40,126,357 ÷ | | | | | | |
| 1,886,791 shares) | | | | | | $ | | 21.27 |
| Maximum offering price per share | | | | | | | | |
| (100/96.50 of $21.27) | | | | | | $ | | 22.04 |
| Class B: | | | | | | | | |
| Net Asset Value and offering price | | | | | | |
| per share ($32,242,125 ÷ | | | | | | | | |
| 1,568,874 shares)A | | | | | | $ | | 20.55 |
| Class C: | | | | | | | | |
| Net Asset Value and offering price | | | | | | |
| per share ($20,595,499 ÷ | | | | | | | | |
| 995,982 shares)A | | | | | | $ | | 20.68 |
| Institutional Class: | | | | | | | | |
| Net Asset Value, offering price and | | | | | | |
| redemption price per share | | | | | | | | |
| ($4,379,353 ÷ 198,535 shares) | | | | $ | | 22.06 |
| Statement of Operations | | | | |
| | | | | Year ended July 31, 2005 |
| |
| Investment Income | | | | | | |
| Dividends | | | | $ | | 1,312,393 |
| Interest | | | | | | 66,594 |
| Security lending | | | | | | 7,432 |
| Total income | | | | | | 1,386,419 |
| |
| Expenses | | | | | | |
| Management fee | | $ | | 575,398 | | |
| Transfer agent fees | | | | 326,458 | | |
| Distribution fees | | | | 612,732 | | |
| Accounting and security lending | | | | | | |
| fees | | | | 43,053 | | |
| Independent trustees’ compensation | | 468 | | |
| Custodian fees and expenses | | | | 19,134 | | |
| Registration fees | | | | 75,710 | | |
| Audit | | | | 42,253 | | |
| Legal | | | | 283 | | |
| Miscellaneous | | | | 2,030 | | |
| Total expenses before reductions | | 1,697,519 | | |
| Expense reductions | | | | (47,581) | | 1,649,938 |
| |
| Net investment income (loss) | | | | | | (263,519) |
| Realized and Unrealized Gain (Loss) | | | | |
| Net realized gain (loss) on: | | | | | | |
| Investment securities | | | | 8,604,224 | | |
| Investment not meeting investment | | | | |
| restrictions | | | | (5,191) | | |
| Foreign currency transactions | | | | (4,999) | | |
| Payment from investment advisor | | | | |
| for loss on investment not meet- | | | | |
| ing investment restrictions | | | | 5,191 | | |
| Total net realized gain (loss) | | | | | | 8,599,225 |
| Change in net unrealized appreci- | | | | |
| ation (depreciation) on: | | | | | | |
| Investment securities | | | | 12,830,685 | | |
| Assets and liabilities in foreign | | | | | | |
| currencies | | | | 98 | | |
| Total change in net unrealized ap- | | | | |
| preciation (depreciation) | | | | | | 12,830,783 |
| Net gain (loss) | | | | | | 21,430,008 |
| Net increase (decrease) in net as- | | | | |
| sets resulting from operations | | | | $ | | 21,166,489 |
A Redemption price per share is equal to net asset value less any applicable contingent deferred sales charge.
See accompanying notes which are an integral part of the financial statements.
| Statement of Changes in Net Assets | | | | | | |
| | | Year ended | | | | Year ended |
| | | July 31, | | | | July 31, |
| | | 2005 | | | | 2004 |
| Increase (Decrease) in Net Assets | | | | | | |
| Operations | | | | | | |
| Net investment income (loss) | | $ (263,519) | | $ | | (212,310) |
| Net realized gain (loss) | | 8,599,225 | | | | 3,763,095 |
| Change in net unrealized appreciation (depreciation) | | 12,830,783 | | | | 4,474,838 |
| Net increase (decrease) in net assets resulting from operations | | 21,166,489 | | | | 8,025,623 |
| Distributions to shareholders from net realized gain | | (3,376,455) | | | | — |
| Share transactions -- net increase (decrease) | | 68,385,639 | | | | 18,136,365 |
| Redemption fees | | 12,053 | | | | 24,255 |
| Total increase (decrease) in net assets | | 86,187,726 | | | | 26,186,243 |
| |
| Net Assets | | | | | | |
| Beginning of period | | 51,419,652 | | | | 25,233,409 |
| End of period (including accumulated net investment loss of $15 and accumulated net investment loss of $20, | | | | | | |
| respectively) | | $ 137,607,378 | | $ | | 51,419,652 |
| Financial Highlights — Class A | | | | | | | | | | |
| Years ended July 31, | | 2005 | | 2004 | | 2003 | | 2002 | | 2001 |
| Selected Per-Share Data | | | | | | | | | | |
| Net asset value, beginning of period | | $ 18.10 | | $ 14.15 | | $ 12.75 | | $ 15.15 | | $ 13.56 |
| Income from Investment Operations | | | | | | | | | | |
| Net investment income (loss)C | | 02 | | (.02) | | .06 | | (.04) | | .04 |
| Net realized and unrealized gain (loss) | | 4.35 | | 3.96 | | 1.36 | | (2.37) | | 1.98 |
| Total from investment operations | | 4.37 | | 3.94 | | 1.42 | | (2.41) | | 2.02 |
| Distributions from net investment income | | — | | — | | (.02) | | — | | (.04) |
| Distributions from net realized gain | | (.94) | | — | | — | | — | | (.40) |
| Total distributions | | (.94) | | — | | (.02) | | — | | (.44) |
| Redemption fees added to paid in capitalC | | —E | | .01 | | —E | | .01 | | .01 |
| Net asset value, end of period | | $ 21.53 | | $ 18.10 | | $ 14.15 | | $ 12.75 | | $ 15.15 |
| Total ReturnA,B | | 25.04% | | 27.92% | | 11.16% | | (15.84)% | | 15.27% |
| Ratios to Average Net AssetsD | | | | | | | | | | |
| Expenses before expense reductions | | 1.34% | | 1.65% | | 1.99% | | 1.83% | | 2.59% |
| Expenses net of voluntary waivers, if any | | 1.34% | | 1.50% | | 1.53% | | 1.50% | | 1.50% |
| Expenses net of all reductions | | 1.29% | | 1.47% | | 1.46% | | 1.49% | | 1.49% |
| Net investment income (loss) | | 09% | | (.12)% | | .46% | | (.25)% | | .28% |
| Supplemental Data | | | | | | | | | | |
| Net assets, end of period (000 omitted) | | $ 40,264 | | $ 12,612 | | $ 4,272 | | $ 3,160 | | $ 2,270 |
| Portfolio turnover rate | | 116% | | 106% | | 149% | | 45% | | 78% |
A Total returns would have been lower had certain expenses not been reduced during the periods shown. B Total returns do not include the effect of the sales charges.
C Calculated based on average shares outstanding during the period.
D Expense ratios reflect operating expenses of the class. Expenses before reductions do not reflect amounts reimbursed by the investment adviser or reductions from brokerage service arrangements or other expense offset arrangements and do not represent the amount paid by the class during periods when reimbursements or reductions occur. Expenses net of any voluntary waivers reflect expenses after reimbursement by the investment adviser but prior to reductions from broker age service arrangements or other expense offset arrangements. Expenses net of all reductions represent the net expenses paid by the class.
E Amount represents less than $.01 per share.
See accompanying notes which are an integral part of the financial statements.
A-43 Annual Report
| Financial Highlights — Class T | | | | | | | | | | |
| Years ended July 31, | | 2005 | | 2004 | | 2003 | | 2002 | | 2001 |
| Selected Per-Share Data | | | | | | | | | | |
| Net asset value, beginning of period | | $ 17.90 | | $ 14.02 | | $ 12.66 | | $ 15.09 | | $ 13.48 |
| Income from Investment Operations | | | | | | | | | | |
| Net investment income (loss)C | | (.03) | | (.06) | | .03 | | (.07) | | —E |
| Net realized and unrealized gain (loss) | | 4.31 | | 3.93 | | 1.34 | | (2.36) | | 2.00 |
| Total from investment operations | | 4.28 | | 3.87 | | 1.37 | | (2.43) | | 2.00 |
| Distributions from net investment income | | — | | — | | (.01) | | — | | (.01) |
| Distributions from net realized gain | | (.91) | | — | | — | | — | | (.39) |
| Total distributions | | (.91) | | — | | (.01) | | — | | (.40) |
| Redemption fees added to paid in capitalC | | —E | | .01 | | —E | | —E | | .01 |
| Net asset value, end of period | | $ 21.27 | | $ 17.90 | | $ 14.02 | | $ 12.66 | | $ 15.09 |
| Total ReturnA,B | | 24.78% | | 27.67% | | 10.84% | | (16.10)% | | 15.18% |
| Ratios to Average Net AssetsD | | | | | | | | | | |
| Expenses before expense reductions | | 1.57% | | 1.90% | | 2.25% | | 2.07% | | 2.85% |
| Expenses net of voluntary waivers, if any | | 1.57% | | 1.75% | | 1.78% | | 1.75% | | 1.75% |
| Expenses net of all reductions | | 1.52% | | 1.72% | | 1.71% | | 1.74% | | 1.74% |
| Net investment income (loss) | | (.14)% | | (.36)% | | .22% | | (.50)% | | .03% |
| Supplemental Data | | | | | | | | | | |
| Net assets, end of period (000 omitted) | | $ 40,126 | | $ 13,089 | | $ 5,493 | | $ 6,216 | | $ 5,654 |
| Portfolio turnover rate | | 116% | | 106% | | 149% | | 45% | | 78% |
A Total returns would have been lower had certain expenses not been reduced during the periods shown.
B Total returns do not include the effect of the sales charges.
C Calculated based on average shares outstanding during the period.
D Expense ratios reflect operating expenses of the class. Expenses before reductions do not reflect amounts reimbursed by the investment adviser or reductions from brokerage service arrangements or other expense offset arrangements and do not
represent the amount paid by the class during periods when reimbursements or reductions occur. Expenses net of any voluntary waivers reflect expenses after reimbursement by the investment adviser but prior to reductions from brokerage service
arrangements or other expense offset arrangements. Expenses net of all reductions represent the net expenses paid by the class.
E Amount represents less than $.01 per share.
|
| Financial Highlights — Class B | | | | | | | | | | |
| Years ended July 31, | | 2005 | | 2004 | | 2003 | | 2002 | | 2001 |
| Selected Per-Share Data | | | | | | | | | | |
| Net asset value, beginning of period | | $ 17.27 | | $ 13.61 | | $ 12.33 | | $ 14.77 | | $ 13.25 |
| Income from Investment Operations | | | | | | | | | | |
| Net investment income (loss)C | | (.13) | | (.14) | | (.03) | | (.14) | | (.07) |
| Net realized and unrealized gain (loss) | | 4.17 | | 3.79 | | 1.31 | | (2.30) | | 1.95 |
| Total from investment operations | | 4.04 | | 3.65 | | 1.28 | | (2.44) | | 1.88 |
| Distributions from net realized gain | | (.76) | | — | | — | | — | | (.37) |
| Redemption fees added to paid in capitalC | | —E | | .01 | | —E | | —E | | .01 |
| Net asset value, end of period | | $ 20.55 | | $ 17.27 | | $ 13.61 | | $ 12.33 | | $ 14.77 |
| Total ReturnA,B | | 24.12% | | 26.89% | | 10.38% | | (16.52)% | | 14.51% |
| Ratios to Average Net AssetsD | | | | | | | | | | |
| Expenses before expense reductions | | 2.11% | | 2.37% | | 2.68% | | 2.58% | | 3.39% |
| Expenses net of voluntary waivers, if any | | 2.11% | | 2.25% | | 2.25% | | 2.25% | | 2.25% |
| Expenses net of all reductions | | 2.07% | | 2.22% | | 2.18% | | 2.24% | | 2.24% |
| Net investment income (loss) | | (.68)% | | (.87)% | | (.26)% | | (1.00)% | | (.47)% |
| Supplemental Data | | | | | | | | | | |
| Net assets, end of period (000 omitted) | | $ 32,242 | | $ 14,722 | | $ 9,005 | | $ 9,008 | | $ 5,674 |
| Portfolio turnover rate | | 116% | | 106% | | 149% | | 45% | | 78% |
A Total returns would have been lower had certain expenses not been reduced during the periods shown.
B Total returns do not include the effect of the contingent deferred sales charge.
C Calculated based on average shares outstanding during the period.
D Expense ratios reflect operating expenses of the class. Expenses before reductions do not reflect amounts reimbursed by the investment adviser or reductions from brokerage service arrangements or other expense offset arrangements and do not
represent the amount paid by the class during periods when reimbursements or reductions occur. Expenses net of any voluntary waivers reflect expenses after reimbursement by the investment adviser but prior to reductions from brokerage service
arrangements or other expense offset arrangements. Expenses net of all reductions represent the net expenses paid by the class.
E Amount represents less than $.01 per share.
|
See accompanying notes which are an integral part of the financial statements.
Cyclical Industries A-44
|
| Financial Highlights — Class C | | | | | | | | | | |
| Years ended July 31, | | 2005 | | 2004 | | 2003 | | 2002 | | 2001 |
| Selected Per-Share Data | | | | | | | | | | |
| Net asset value, beginning of period | | $ 17.36 | | $ 13.67 | | $ 12.39 | | $ 14.84 | | $ 13.26 |
| Income from Investment Operations | | | | | | | | | | |
| Net investment income (loss)C | | (.12) | | (.14) | | (.03) | | (.14) | | (.07) |
| Net realized and unrealized gain (loss) | | 4.19 | | 3.82 | | 1.31 | | (2.31) | | 2.00 |
| Total from investment operations | | 4.07 | | 3.68 | | 1.28 | | (2.45) | | 1.93 |
| Distributions from net realized gain | | (.75) | | — | | — | | — | | (.35) |
| Redemption fees added to paid in capitalC | | —E | | .01 | | —E | | —E | | —E |
| Net asset value, end of period | | $ 20.68 | | $ 17.36 | | $ 13.67 | | $ 12.39 | | $ 14.84 |
| Total ReturnA,B | | 24.16% | | 26.99% | | 10.33% | | (16.51)% | | 14.78% |
| Ratios to Average Net AssetsD | | | | | | | | | | |
| Expenses before expense reductions | | 2.07% | | 2.28% | | 2.57% | | 2.49% | | 3.36% |
| Expenses net of voluntary waivers, if any | | 2.07% | | 2.25% | | 2.25% | | 2.25% | | 2.25% |
| Expenses net of all reductions | | 2.02% | | 2.22% | | 2.18% | | 2.24% | | 2.24% |
| Net investment income (loss) | | (.64)% | | (.87)% | | (.26)% | | (1.00)% | | (.47)% |
| Supplemental Data | | | | | | | | | | |
| Net assets, end of period (000 omitted) | | $ 20,595 | | $ 9,507 | | $ 5,307 | | $ 5,143 | | $ 2,847 |
| Portfolio turnover rate | | 116% | | 106% | | 149% | | 45% | | 78% |
A Total returns would have been lower had certain expenses not been reduced during the periods shown.
B Total returns do not include the effect of the contingent deferred sales charge.
C Calculated based on average shares outstanding during the period.
D Expense ratios reflect operating expenses of the class. Expenses before reductions do not reflect amounts reimbursed by the investment adviser or reductions from brokerage service arrangements or other expense offset arrangements and do not
represent the amount paid by the class during periods when reimbursements or reductions occur. Expenses net of any voluntary waivers reflect expenses after reimbursement by the investment adviser but prior to reductions from brokerage service
arrangements or other expense offset arrangements. Expenses net of all reductions represent the net expenses paid by the class.
E Amount represents less than $.01 per share.
|
| Financial Highlights — Institutional Class | | | | | | | | | | |
| Years ended July 31, | | 2005 | | 2004 | | 2003 | | 2002 | | 2001 |
| Selected Per-Share Data | | | | | | | | | | |
| Net asset value, beginning of period | | $ 18.48 | | $ 14.41 | | $ 12.96 | | $ 15.37 | | $ 13.70 |
| Income from Investment Operations | | | | | | | | | | |
| Net investment income (loss)B | | 07 | | .02 | | .09 | | —D | | .08 |
| Net realized and unrealized gain (loss) | | 4.46 | | 4.04 | | 1.39 | | (2.41) | | 2.05 |
| Total from investment operations | | 4.53 | | 4.06 | | 1.48 | | (2.41) | | 2.13 |
| Distributions from net investment income | | — | | — | | (.03) | | — | | (.07) |
| Distributions from net realized gain | | (.95) | | — | | — | | — | | (.40) |
| Total distributions | | (.95) | | — | | (.03) | | — | | (.47) |
| Redemption fees added to paid in capitalB | | —D | | .01 | | —D | | —D | | .01 |
| Net asset value, end of period | | $ 22.06 | | $ 18.48 | | $ 14.41 | | $ 12.96 | | $ 15.37 |
| Total ReturnA | | 25.41% | | 28.24% | | 11.46% | | (15.68)% | | 15.95% |
| Ratios to Average Net AssetsC | | | | | | | | | | |
| Expenses before expense reductions | | 1.06% | | 1.38% | | 1.55% | | 1.45% | | 2.27% |
| Expenses net of voluntary waivers, if any | | 1.06% | | 1.25% | | 1.25% | | 1.25% | | 1.25% |
| Expenses net of all reductions | | 1.01% | | 1.22% | | 1.18% | | 1.24% | | 1.24% |
| Net investment income (loss) | | 37% | | .13% | | .74% | | — % | | .53% |
| Supplemental Data | | | | | | | | | | |
| Net assets, end of period (000 omitted) | | $ 4,379 | | $ 1,490 | | $ 1,156 | | $ 2,104 | | $ 1,751 |
| Portfolio turnover rate | | 116% | | 106% | | 149% | | 45% | | 78% |
A Total returns would have been lower had certain expenses not been reduced during the periods shown.
B Calculated based on average shares outstanding during the period.
C Expense ratios reflect operating expenses of the class. Expenses before reductions do not reflect amounts reimbursed by the investment adviser or reductions from brokerage service arrangements or other expense offset arrangements and do not
represent the amount paid by the class during periods when reimbursements or reductions occur. Expenses net of any voluntary waivers reflect expenses after reimbursement by the investment adviser but prior to reductions from brokerage service
arrangements or other expense offset arrangements. Expenses net of all reductions represent the net expenses paid by the class.
D Amount represents less than $.01 per share.
|
See accompanying notes which are an integral part of the financial statements.
|
Notes to Financial Statements
For the period ended July 31, 2005
|
1. Significant Accounting Policies.
|
Fidelity Advisor Cyclical Industries Fund (the fund) is a non-diversified fund of Fidelity Advisor Series VII (the trust) and is authorized to issue an unlimited number of shares. The trust is registered under the Investment Company Act of 1940, as amended (the 1940 Act), as an open-end management investment company organized as a Massachusetts business trust.
The fund offers Class A, Class T, Class B, Class C, and Institutional Class shares, each of which has equal rights as to assets and voting privileges. Each class has exclusive voting rights with respect to matters that affect that class. Class B shares will automatically convert to Class A shares after a holding period of seven years from the initial date of purchase. Investment income, realized and unrealized capital gains and losses, the common expenses of the fund, and certain fund-level expense reductions, if any, are allocated on a pro rata basis to each class based on the relative net assets of each class to the total net assets of the fund. Each class differs with respect to transfer agent and distribution and service plan fees incurred. Certain expense reductions also differ by class.
The financial statements have been prepared in conformity with accounting principles generally accepted in the United States of America, which require management to make certain estimates and assumptions at the date of the financial statements. The following summarizes the significant accounting policies of the fund:
Security Valuation. Net asset value per share (NAV calculation) is calculated as of the close of business of the New York Stock Exchange, normally 4:00 p.m. Eastern time. Equity securities, including restricted securities, for which market quotations are available are valued at the last sale price or official closing price (closing bid price or last evaluated quote if no sale has occurred) on the primary market or exchange on which they trade. If prices are not readily available or do not accurately reflect fair value for a security, or if a security’s value has been materially affected by events occurring after the close of the exchange or market on which the security is principally traded, that security may be valued by another method that the Board of Trustees believes accurately reflects fair value. A security’s valuation may differ depending on the method used for determining value. Price movements in futures contracts and ADRs, market and trading trends, the bid/ask quotes of brokers and off-exchange institutional trading may be reviewed in the course of making a good faith determination of a security’s fair value. Short-term securities with remaining maturities of sixty days or less for which quotations are not readily available are valued on the basis of amortized cost. Investments in open-end investment companies are valued at their net asset value each business day.
Foreign Currency. The fund uses foreign currency contracts to facilitate transactions in foreign-denominated securities. Losses from these transactions may arise from changes in the value of the foreign currency or if the counterparties do not perform under the contracts’ terms.
Foreign-denominated assets, including investment securities, and liabilities are translated into U.S. dollars at the exchange rate at period end. Purchases and sales of investment securities, income and dividends received and expenses denominated in foreign currencies are translated into U.S. dollars at the exchange rate in effect on the transaction date.
The effects of exchange rate fluctuations on investments are included with the net realized and unrealized gain (loss) on investment securities. Other foreign currency transactions resulting in realized and unrealized gain (loss) are disclosed separately.
Investment Transactions and Income. Security transactions are accounted for as of trade date. Gains and losses on securities sold are determined on the basis of identified cost. Dividend income is recorded on the ex-dividend date, except for certain dividends from foreign securities where the ex-dividend date may have passed, which are recorded as soon as the fund is informed of the ex-dividend date. Non-cash dividends included in dividend income, if any, are recorded at the fair market value of the securities received. Distributions received on securities that represent a return of capital or capital gain are recorded as a reduction of cost of investments and/or as a realized gain. The fund estimates the components of distributions received that may be considered return of capital distributions or capital gain distributions. Interest income is accrued as earned. Interest income includes coupon interest and amortization of premium and accretion of discount on debt securities. Investment income is recorded net of foreign taxes withheld where recovery of such taxes is uncertain.
Expenses. Most expenses of the trust can be directly attributed to a fund. Expenses which cannot be directly attributed are apportioned among each fund in the trust.
Income Tax Information and Distributions to Shareholders. Each year, the fund intends to qualify as a regulated investment company by distributing all of its taxable income and realized gains under Subchapter M of the Internal Revenue Code. As a result, no provision for income taxes is required in the accompanying financial statements. Foreign taxes are provided for based on the fund’s understanding of the tax rules and rates that exist in the foreign markets in which it invests.
Distributions are recorded on the ex-dividend date. Income dividends and capital gain distributions are declared separately for each class. Income and capital gain distributions are determined in accordance with income tax regulations, which may differ from generally accepted accounting principles. In addition, the fund will claim a portion of the payment made to redeeming shareholders as a distribution for income tax purposes. Capital accounts within the financial statements are adjusted for permanent book-tax differences. These adjustments have no impact on net assets or the results of operations. Temporary book-tax differences will reverse in a subsequent period. Book-tax differences are primarily due to foreign currency transactions, deferred trustees compensation, net operating losses, and losses deferred due to wash sales.
| | 1. Significant Accounting Policies - continued
Income Tax Information and Distributions to Shareholders - continued
The tax-basis components of distributable earnings and the federal tax cost as of period end were as follows:
|
| Unrealized appreciation | | $ 20,443,387 |
| Unrealized depreciation | | (2,153,034) |
| Net unrealized appreciation (depreciation) | | 18,290,353 |
| Undistributed ordinary income | | 2,641,076 |
| Undistributed long-term capital gain | | 3,738,864 |
| |
| Cost for federal income tax purposes | | $ 119,896,170 |
The tax character of distributions paid was as follows:
| | | July 31, 2005 | | | | July 31, 2004 |
| Ordinary Income | | $ | | 1,163,274 | | $ | | — |
| Long-term Capital Gains | | | | 2,213,181 | | | | — |
| Total | | $ | | 3,376,455 | | $ | | — |
Short-Term Trading (Redemption) Fees. Shares held in the fund less than 60 days are subject to a redemption fee equal to 1.00% of the proceeds of the redeemed shares. All redemption fees, including any estimated redemption fees paid by Fidelity Management & Research Company (FMR), are retained by the fund and accounted for as an addition to paid in capital.
2. Operating Policies.
Repurchase Agreements. FMR has received an Exemptive Order from the Securities and Exchange Commission (the SEC) which permits the fund and other affiliated entities of FMR to transfer uninvested cash balances into joint trading accounts which are then invested in repurchase agreements. The fund may also invest directly with institutions in repurchase agreements. Repurchase agreements are collateralized by government or non-government securities. Collateral is held in segregated accounts with custodian banks and may be obtained in the event of a default of the counterparty. The fund monitors, on a daily basis, the value of the collateral to ensure it is at least equal to the principal amount of the repurchase agreement (including accrued interest). In the event of a default by the counterparty, realization of the collateral proceeds could be delayed, during which time the value of the collateral may decline.
3. Purchases and Sales of Investments.
Purchases and sales of securities, other than short-term securities and U.S. government securities, aggregated $179,445,823 and $113,166,082, respectively. The Fund realized a loss on the sale of an investment not meeting the investment restrictions of the fund. The loss was fully reimbursed by the Fund’s investment advisor.
4. Fees and Other Transactions with Affiliates.
Management Fee. FMR and its affiliates provide the fund with investment management related services for which the fund pays a monthly management fee. The management fee is the sum of an individual fund fee rate that is based on an annual rate of .30% of the fund’s average net assets and a group fee rate that averaged .27% during the period. The group fee rate is based upon the average net assets of all the mutual funds advised by FMR. The group fee rate decreases as assets under management increase and increases as assets under management decrease. For the period, the total annual management fee rate was .57% of the fund’s average net assets.
A-47 Annual Report
Notes to Financial Statements - continued
4. Fees and Other Transactions with Affiliates - continued
|
Distribution and Service Plan. In accordance with Rule 12b-1 of the 1940 Act, the fund has adopted separate Distribution and Service Plans for each class of shares. Certain classes pay Fidelity Distributors Corporation (FDC), an affiliate of FMR, separate Distribution and Service Fees, each of which is based on an annual percentage of each class’ average net assets. In addition, FDC may pay financial intermediaries for selling shares of the fund and providing shareholder support services. For the period, the Distribution and Service Fee rates and the total amounts paid to and retained by FDC were as follows:
| | | Distribution | | Service | | | | Paid to | | | | Retained |
| | | Fee | | Fee | | | | FDC | | | | by FDC |
| Class A | | 0% | | .25% | | $ | | 69,461 | | $ | | — |
| Class T | | 25% | | .25% | | | | 153,994 | | | | 46 |
| Class B | | 75% | | .25% | | | | 240,771 | | | | 180,579 |
| Class C | | 75% | | .25% | | | | 148,506 | | | | 57,658 |
| |
| | | | | | | $ | | 612,732 | | $ | | 238,283 |
Sales Load. FDC receives a front-end sales charge of up to 5.75% for selling Class A shares, and 3.50% for selling Class T shares, some of which is paid
to financial intermediaries for selling shares of the fund. FDC receives the proceeds of contingent deferred sales charges levied on Class A, Class T,
Class B, and Class C redemptions. These charges depend on the holding period. The deferred sales charges range from 5% to 1% for Class B, 1% for
Class C, and .25% for certain purchases of Class A and Class T shares.
For the period, sales charge amounts retained by FDC were as follows:
|
| | | | | Retained |
| | | | | by FDC |
| Class A | | $ | | 117,642 |
| Class T | | | | 14,748 |
| Class B* | | | | 63,970 |
| Class C* | | | | 2,023 |
| | | $ | | 198,383 |
| |
| * When Class B and Class C shares are initially sold, FDC pays commissions from its own resources to financial intermediaries through which the sales are made. | | | | |
Transfer Agent Fees. Fidelity Investments Institutional Operations Company, Inc. (FIIOC), an affiliate of FMR, is the transfer, dividend disbursing and shareholder servicing agent for each class of the fund. FIIOC receives account fees and asset-based fees that vary according to the account size and type of account of the shareholders of the respective classes of the fund. FIIOC pays for typesetting, printing and mailing of shareholder reports, except proxy statements. For the period the total transfer agent fees paid by each class to FIIOC, were as follows:
| | | | | | | % of |
| | | | | | | Average |
| | | | | Amount | | Net Assets |
| Class A | | $ | | 91,503 | | .33 |
| Class T | | | | 94,933 | | .31 |
| Class B | | | | 85,414 | | .36 |
| Class C | | | | 45,817 | | .31 |
| Institutional Class | | | | 8,791 | | .30 |
| |
| | | $ | | 326,458 | | |
Accounting and Security Lending Fees. Fidelity Service Company, Inc. (FSC), an affiliate of FMR, maintains the fund’s accounting records. The accounting fee is based on the level of average net assets for the month. Under a separate contract, FSC administers the security lending program. The security lending fee is based on the number and duration of lending transactions.
Central Funds. The fund may invest in affiliated Central Funds managed by Fidelity Investments Money Management, Inc. (FIMM) an affiliate of FMR. The Central Funds are open-end investment companies available only to investment companies and other accounts managed by FMR and its affiliates. The Money Market Central Funds seek preservation of capital and current income. The Central Funds do not pay a management fee. Income distributions earned by the fund are recorded as income in the accompanying financial statements and totaled $80,717 for the period.
Brokerage Commissions. The fund placed a portion of its portfolio transactions with brokerage firms which are affiliates of the investment adviser. The commissions paid to these affiliated firms were $13,770 for the period.
5. Committed Line of Credit.
|
The fund participates with other funds managed by FMR in a $4.2 billion credit facility (the “line of credit”) to be utilized for temporary or emergency purposes to fund shareholder redemptions or for other short-term liquidity purposes. The fund has agreed to pay commitment fees on its pro rata portion of the line of credit. During the period, there were no borrowings on this line of credit.
The fund lends portfolio securities from time to time in order to earn additional income. The fund receives collateral (in the form of U.S. Treasury obligations, letters of credit and/or cash) against the loaned securities and maintains collateral in an amount not less than 100% of the market value of the loaned securities during the period of the loan. The market value of the loaned securities is determined at the close of business of the fund and any additional required collateral is delivered to the fund on the next business day. If the borrower defaults on its obligation to return the securities loaned because of insolvency or other reasons, a fund could experience delays and costs in recovering the securities loaned or in gaining access to the collateral. Cash collateral is invested in the Fidelity Securities Lending Cash Central Fund. The value of loaned securities and cash collateral at period end are disclosed on the fund’s Statement of Assets and Liabilities.
Many of the brokers with whom FMR places trades on behalf of the fund provided services to the fund in addition to trade execution. These services included payments of certain expenses on behalf of the fund totaling $47,481 for the period. In addition, through arrangements with the fund’s custo dian, credits realized as a result of uninvested cash balances were used to reduce the fund’s expenses. During the period, these credits reduced the fund’s custody expenses by $100, respectively.
The fund’s organizational documents provide former and current trustees and officers with a limited indemnification against liabilities arising in
connection with the performance of their duties to the fund. In the normal course of business, the fund may also enter into contracts that provide
general indemnifications. The fund’s maximum exposure under these arrangements is unknown as this would be dependent on future claims that may
be made against the fund. The risk of material loss from such claims is considered remote.
9. Distributions to Shareholders.
Distributions to shareholders of each class were as follows:
|
| Years ended July 31, | | 2005 | | | | 2004 | | |
| From net realized gain | | | | | | | | |
| Class A | | $ 1,008,608 | | $ | | | | — |
| Class T | | 1,078,512 | | | | | | — |
| Class B | | 740,358 | | | | | | — |
| Class C | | 457,235 | | | | | | — |
| Institutional Class | | 91,742 | | | | | | — |
| Total | | $ 3,376,455 | | $ | | | | — |
Notes to Financial Statements - continued
10. Share Transactions.
Transactions for each class of shares were as follows:
|
| | | | | Shares | | | | | | Dollars | | |
| Years ended July 31, | | 2005 | | | | 2004 | | 2005 | | | | 2004 |
| Class A | | | | | | | | | | | | |
| Shares sold | | 1,834,275 | | | | 906,243 | | $ 35,637,759 | | $ 15,361,054 |
| Reinvestment of distributions | | 37,514 | | | | — | | 702,375 | | | | — |
| Shares redeemed | | (698,605) | | | | (511,353) | | (13,721,410) | | | | (8,642,465) |
| Net increase (decrease) | | 1,173,184 | | | | 394,890 | | $ 22,618,724 | | $ | | 6,718,589 |
| Class T | | | | | | | | | | | | |
| Shares sold | | 1,414,958 | | | | 524,204 | | $ 26,674,948 | | $ | | 8,942,910 |
| Reinvestment of distributions | | 55,963 | | | | — | | 1,036,099 | | | | — |
| Shares redeemed | | (315,493) | | | | (184,575) | | (6,149,352) | | | | (3,062,075) |
| Net increase (decrease) | | 1,155,428 | | | | 339,629 | | $ 21,561,695 | | $ | | 5,880,835 |
| Class B | | | | | | | | | | | | |
| Shares sold | | 1,024,205 | | | | 439,402 | | $ 19,088,560 | | $ | | 7,031,675 |
| Reinvestment of distributions | | 34,674 | | | | — | | 620,788 | | | | — |
| Shares redeemed | | (342,241) | | | | (249,000) | | (6,386,553) | | | | (4,000,080) |
| Net increase (decrease) | | 716,638 | | | | 190,402 | | $ 13,322,795 | | $ | | 3,031,595 |
| Class C | | | | | | | | | | | | |
| Shares sold | | 649,529 | | | | 350,466 | | $ 12,242,436 | | $ | | 5,537,878 |
| Reinvestment of distributions | | 19,147 | | | | — | | 344,742 | | | | — |
| Shares redeemed | | (220,294) | | | | (191,062) | | (4,110,203) | | | | (3,095,385) |
| Net increase (decrease) | | 448,382 | | | | 159,404 | | $ 8,476,975 | | $ | | 2,442,493 |
| Institutional Class | | | | | | | | | | | | |
| Shares sold | | 168,340 | | | | 56,561 | | $ 3,418,465 | | $ | | 991,073 |
| Reinvestment of distributions | | 3,419 | | | | — | | 65,261 | | | | — |
| Shares redeemed | | (53,860) | | | | (56,142) | | (1,078,276) | | | | (928,220) |
| Net increase (decrease) | | 117,899 | | | | 419 | | $ 2,405,450 | | $ | | 62,853 |
Advisor Developing Communications Fund — Institutional Class
Average annual total return reflects the change in the value of an investment, assuming reinvestment of the class’ dividend income and capital gains (the profits earned upon the sale of securities that have grown in value) and assuming a constant rate of performance each year. The $10,000 table and the fund’s returns do not reflect the deduction of taxes that a shareholder would pay on fund distributions or the redemption of fund shares. During periods of reimbursement by Fidelity, a fund’s total return will be greater than it would be had the reimbursement not occurred. How a fund did yesterday is no guarantee of how it will do tomorrow.
| Average Annual Total Returns | | | | |
| Periods ended July 31, 2005 | | Past 1 | | Life of |
| | | year | | fundA |
| Institutional Class | | 18.03% | | --5.29% |
| |
| A From December 27, 2000. | | | | |
| | $10,000 Over Life of Fund
|
Let’s say hypothetically that $10,000 was invested in Fidelity Advisor Developing Communications Fund — Institutional Class on Decem-ber 27, 2000, when the fund started. The chart shows how the value of your investment would have changed, and also shows how the S&P 500 Index performed over the same period.
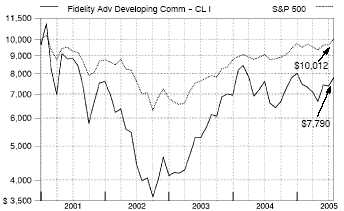
Advisor Developing Communications Fund — Institutional Class
Management’s Discussion of Fund Performance
Comments from Charlie Chai, Portfolio Manager of Fidelity® Advisor Developing Communications Fund
A late-inning rally on Wall Street helped push some key U.S. equity indexes to four-year highs by the conclusion of the 12-month period ending July 31, 2005. Spurred on by bullish economic data and strong corporate earnings, investors enjoyed a stellar month of July, capping off a turbulent 12-month period for U.S. equity markets. Stock prices bounced up and down during most of the year, moving in cadence with gyrations in the price of crude oil and investors’ gathering and ebbing concerns about inflation. The Federal Reserve Board raised short-term interest rates eight times during the period, also affecting overall market sentiment. Despite their fluctuations, the major equity indexes finished on a high note, with the Standard & Poor’s 500SM Index and the NASDAQ Composite® Index posting gains of 14.05% and 16.51%, respectively, for the period. The small-cap Russell 2000® Index rose 24.78% and the Russell Midcap® Index jumped 28.93%, while the blue-chips’ Dow Jones Industrial AverageSM advanced only 7.29% .
For the 12 months ending July 31, 2005, the fund’s Institutional Class shares returned 18.03%, beating the 11.63% gain of the Goldman Sachs® Technology Index. The fund also bested the S&P 500®. A significant overweighting in wireless telecommunications equipment provided the biggest boost. However, the top contributor both in absolute terms and versus the sector index was Internet search engine provider Google. Strong growth in paid-search revenues forced analysts to boost their earnings estimates for the company, driving its stock price sharply higher. Comverse Technology — a holding I reduced for valuation reasons during the period — was the second-best contributor to both absolute and relative performance. The company saw particularly strong growth in wireless services such as IP (Internet Protocol) voice mail, picture messaging and ring tones. Conversely, the fund was hampered by a relatively heavy exposure to communications equipment. Two holdings with ties to the VoIP (Voice over Internet Protocol) market turned in disappointing performances — equipment providers Avaya and Mindspeed Technologies. Slower-than-expected adoption of VoIP hurt both stocks.
The views expressed in this statement reflect those of the portfolio manager only through the end of the period of the report as stated on the cover and do not necessarily represent the views of Fidelity or any other person in the Fidelity organization. Any such views are subject to change at any time based upon market or other conditions and Fidelity disclaims any responsibility to update such views. These views may not be relied on as investment advice and, because investment decisions for a Fidelity fund are based on numerous factors, may not be relied on as an indication of trading intent on behalf of any Fidelity fund.
Developing Communications
|
Advisor Developing Communications Fund
Shareholder Expense Example
|
As a shareholder of the Fund, you incur two types of costs: (1) transaction costs, including sales charges (loads) on purchase payments or redemption proceeds, redemption fees, and (2) ongoing costs, including management fees, distribution and/or service (12b-1) fees and other Fund expenses. This Example is intended to help you understand your ongoing costs (in dollars) of investing in the Fund and to compare these costs with the ongoing costs of investing in other mutual funds.
The Example is based on an investment of $1,000 invested at the beginning of the period and held for the entire period (February 1, 2005 to July 31, 2005).
The first line of the table below for each class of the Fund provides information about actual account values and actual expenses. You may use the information in this line, together with the amount you invested, to estimate the expenses that you paid over the period. Simply divide your account value by $1,000.00 (for example, an $8,600 account value divided by $1,000.00 = 8.6), then multiply the result by the number in the first line for a class of the Fund under the heading entitled “Expenses Paid During Period” to estimate the expenses you paid on your account during this period.
Hypothetical Example for Comparison Purposes
|
The second line of the table below for each class of the Fund provides information about hypothetical account values and hypothetical expenses based on a Class’ actual expense ratio and an assumed rate of return of 5% per year before expenses, which is not the Class’ actual return. The hypothetical account values and expenses may not be used to estimate the actual ending account balance or expenses you paid for the period. You may use this information to compare the ongoing costs of investing in the Fund and other funds. To do so, compare this 5% hypothetical example with the 5% hypothetical examples that appear in the shareholder reports of the other funds.
Please note that the expenses shown in the table are meant to highlight your ongoing costs only and do not reflect any transaction costs. Therefore, the second line of the table is useful in comparing ongoing costs only, and will not help you determine the relative total costs of owning different funds. In addition, if these transactional costs were included, your costs would have been higher.
| | | | | | | | | Expenses Paid |
| | | Beginning | | | | Ending | | During Period* |
| | | Account Value | | | | Account Value | | February 1, 2005 |
| | | February 1, 2005 | | | | July 31, 2005 | | to July 31, 2005 |
| Class A | | | | | | | | | | |
| Actual | | $ 1,000.00 | | $ | | 1,044.80 | | $ | | 7.10 |
| HypotheticalA | | $ 1,000.00 | | $ | | 1,017.85 | | $ | | 7.00 |
| Class T | | | | | | | | | | |
| Actual | | $ 1,000.00 | | $ | | 1,042.50 | | $ | | 8.36 |
| HypotheticalA | | $ 1,000.00 | | $ | | 1,016.61 | | $ | | 8.25 |
| Class B | | | | | | | | | | |
| Actual | | $ 1,000.00 | | $ | | 1,040.60 | | $ | | 10.88 |
| HypotheticalA | | $ 1,000.00 | | $ | | 1,014.13 | | $ | | 10.74 |
| Class C | | | | | | | | | | |
| Actual | | $ 1,000.00 | | $ | | 1,040.60 | | $ | | 10.88 |
| HypotheticalA | | $ 1,000.00 | | $ | | 1,014.13 | | $ | | 10.74 |
| Institutional Class | | | | | | | | | | |
| Actual | | $ 1,000.00 | | $ | | 1,045.60 | | $ | | 5.83 |
| HypotheticalA | | $ 1,000.00 | | $ | | 1,019.09 | | $ | | 5.76 |
| |
| A 5% return per year before expenses | | | | | | | | | | |
* Expenses are equal to each Class’ annualized expense ratio (shown in the table below); multiplied by the average account value over the period, multiplied by 181/365 (to reflect the one-half year period).
| | | Annualized |
| | | Expense Ratio |
| Class A | | 1.40% |
| Class T | | 1.65% |
| Class B | | 2.15% |
| Class C | | 2.15% |
| Institutional Class | | 1.15% |
| | Advisor Developing Communications Fund
Investment Changes
|
| Top Ten Stocks as of July 31, 2005 | | |
| | | % of fund’s | | % of fund’s net assets |
| | | net assets | | 6 months ago |
| Nokia Corp. sponsored ADR | | 9.8 | | 5.4 |
| Research In Motion Ltd. | | 9.0 | | 3.5 |
| Juniper Networks, Inc. | | 8.4 | | 7.9 |
| QUALCOMM, Inc. | | 8.1 | | 7.0 |
| Corning, Inc. | | 6.2 | | 0.0 |
| Google, Inc. Class A (sub. vtg.) | | 5.2 | | 0.4 |
| Freescale Semiconductor, Inc. | | | | |
| Class A | | 3.4 | | 2.5 |
| Motorola, Inc. | | 2.9 | | 4.5 |
| Photon Dynamics, Inc. | | 2.7 | | 0.7 |
| AU Optronics Corp. | | | | |
| sponsored ADR | | 2.5 | | 1.5 |
| | | 58.2 | | |
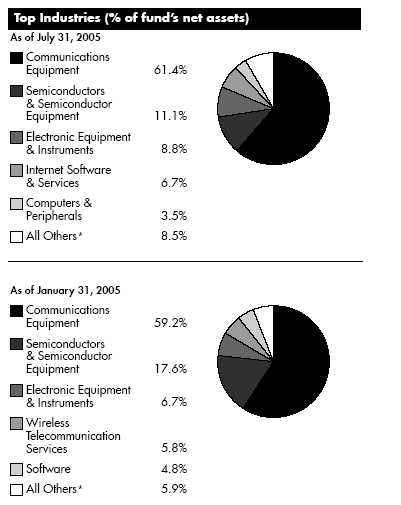
* Includes short term investments and net other assets.
Prior period industry classifications reflect the categories in place as of the date
indicated and have not been adjusted to reflect current industry classifications.
|
Developing Communications A-54
Advisor Developing Communications Fund
Investments July 31, 2005
| Common Stocks — 99.2% | | | | | | |
| | | Shares | | Value (Note 1) |
| |
| COMMUNICATIONS EQUIPMENT – 61.4% | | | | | | |
| Communications Equipment – 61.4% | | | | | | |
| ADC Telecommunications, Inc. (a) | | 4,400 | | $ | | 115,016 |
| Adva AG Optical Networking (a) | | 9,420 | | | | 55,852 |
| Andrew Corp. (a) | | 6,500 | | | | 71,435 |
| AudioCodes Ltd. (a) | | 11,600 | | | | 105,444 |
| Avaya, Inc. (a) | | 15,450 | | | | 159,599 |
| Bookham, Inc. (a) | | 372 | | | | 1,179 |
| C-COR, Inc. (a) | | 800 | | | | 6,664 |
| Carrier Access Corp. (a) | | 4,400 | | | | 23,320 |
| CIENA Corp. (a) | | 92,650 | | | | 207,536 |
| Comtech Group, Inc. (a) | | 2,200 | | | | 12,232 |
| Comverse Technology, Inc. (a) | | 5,460 | | | | 138,083 |
| Corning, Inc. (a) | | 34,100 | | | | 649,605 |
| EMS Technologies, Inc. (a) | | 1,400 | | | | 21,350 |
| F5 Networks, Inc. (a) | | 4,900 | | | | 206,682 |
| Foundry Networks, Inc. (a) | | 900 | | | | 10,656 |
| Foxconn International Holdings Ltd. | | 2,000 | | | | 1,647 |
| Harmonic, Inc. (a) | | 4,700 | | | | 25,051 |
| InterDigital Communication Corp. (a) | | 100 | | | | 1,795 |
| Ixia (a) | | 3,500 | | | | 69,090 |
| Juniper Networks, Inc. (a) | | 36,550 | | | | 876,835 |
| Motorola, Inc. | | 14,100 | | | | 298,638 |
| MRV Communications, Inc. (a) | | 19,165 | | | | 40,821 |
| NMS Communications Corp. (a) | | 30,000 | | | | 101,100 |
| Nokia Corp. sponsored ADR | | 64,600 | | | | 1,030,367 |
| Powerwave Technologies, Inc. (a) | | 6,940 | | | | 79,602 |
| QUALCOMM, Inc. | | 21,600 | | | | 852,984 |
| Redback Networks, Inc. (a) | | 6,683 | | | | 55,402 |
| Research In Motion Ltd. (a) | | 13,340 | | | | 943,339 |
| Riverstone Networks, Inc. (a) | | 82,300 | | | | 52,672 |
| Scientific-Atlanta, Inc. | | 1,100 | | | | 42,350 |
| SiRF Technology Holdings, Inc. (a) | | 1,000 | | | | 21,850 |
| Sonus Networks, Inc. (a) | | 25,404 | | | | 122,955 |
| Telefonaktiebolaget LM Ericsson | | | | | | |
| (B Shares) sponsored ADR | | 22 | | | | 756 |
| Telson Electronics Co. Ltd. (a) | | 16,942 | | | | 0 |
| Terayon Communication Systems, Inc. (a) | | 6,500 | | | | 20,410 |
| Tut Systems, Inc. (a) | | 2,400 | | | | 8,400 |
| | | | | | | 6,430,717 |
| |
| COMPUTERS & PERIPHERALS – 3.5% | | | | | | |
| Computer Hardware – 1.8% | | | | | | |
| Compal Electronics, Inc. | | 5,509 | | | | 5,065 |
| Concurrent Computer Corp. (a) | | 35,817 | | | | 81,663 |
| NEC Corp. sponsored ADR | | 90 | | | | 461 |
| Palm, Inc. (a) | | 3,600 | | | | 102,744 |
| | | | | | | 189,933 |
| Computer Storage & Peripherals – 1.7% | | | | | | |
| EMC Corp. (a) | | 1,100 | | | | 15,059 |
| | | Shares | | Value (Note 1) |
| M-Systems Flash Disk Pioneers Ltd. (a) | | 2,100 | | $ | | 54,285 |
| SanDisk Corp. (a) | | 3,200 | | | | 108,224 |
| | | | | | | 177,568 |
| |
| TOTAL COMPUTERS & PERIPHERALS | | | | | | 367,501 |
| |
| DIVERSIFIED TELECOMMUNICATION SERVICES – 0.4% | | | | |
| Integrated Telecommunication Services – 0.4% | | | | |
| Philippine Long Distance Telephone Co. | | | | | | |
| sponsored ADR | | 1,300 | | | | 37,791 |
| ELECTRONIC EQUIPMENT & INSTRUMENTS – 8.8% | | | | |
| Electronic Equipment & Instruments – 7.5% | | | | | | |
| Aeroflex, Inc. (a) | | 13,000 | | | | 125,840 |
| Applied Films Corp. (a) | | 2,200 | | | | 57,794 |
| AU Optronics Corp. sponsored ADR | | 16,566 | | | | 262,737 |
| LG.Philips LCD Co. Ltd. sponsored ADR . | | 1,100 | | | | 25,322 |
| Photon Dynamics, Inc. (a) | | 14,900 | | | | 282,132 |
| Planar Systems, Inc. (a) | | 3,900 | | | | 30,498 |
| | | | | | | 784,323 |
| Electronic Manufacturing Services – 1.1% | | | | | | |
| KEMET Corp. (a) | | 6,900 | | | | 57,822 |
| M-Flex Electronix, Inc. (a) | | 200 | | | | 4,196 |
| Molex, Inc. | | 900 | | | | 25,416 |
| TTM Technologies, Inc. (a) | | 3,200 | | | | 22,688 |
| | | | | | | 110,122 |
| Technology Distributors – 0.2% | | | | | | |
| Brightpoint, Inc. (a) | | 900 | | | | 21,825 |
| CellStar Corp. (a) | | 7,104 | | | | 2,700 |
| | | | | | | 24,525 |
| |
| TOTAL ELECTRONIC EQUIPMENT & INSTRUMENTS | | | | 918,970 |
| |
| HOUSEHOLD DURABLES – 0.3% | | | | | | |
| Consumer Electronics – 0.3% | | | | | | |
| Thomson SA | | 1,500 | | | | 34,011 |
| INTERNET SOFTWARE & SERVICES – 6.7% | | | | | | |
| Internet Software & Services – 6.7% | | | | | | |
| Akamai Technologies, Inc. (a) | | 1,500 | | | | 22,905 |
| Google, Inc. Class A (sub. vtg.) | | 1,870 | | | | 538,111 |
| Openwave Systems, Inc. (a) | | 5,207 | | | | 96,590 |
| RADVision Ltd. (a) | | 3,400 | | | | 40,834 |
| | | | | | | 698,440 |
| |
| OFFICE ELECTRONICS – 0.2% | | | | | | |
| Office Electronics – 0.2% | | | | | | |
| Zebra Technologies Corp. Class A (a) | | 400 | | | | 15,600 |
| SEMICONDUCTORS & SEMICONDUCTOR EQUIPMENT – 11.1% | | |
| Semiconductor Equipment – 0.4% | | | | | | |
| Amkor Technology, Inc. (a) | | 3,700 | | | | 17,242 |
| Teradyne, Inc. (a) | | 1,200 | | | | 18,636 |
| | | | | | | 35,878 |
See accompanying notes which are an integral part of the financial statements.
A-55 A-55 Annual Report
Advisor Developing Communications Fund
Investments - continued
|
| Common Stocks – continued | | | | | | |
| | | Shares | | Value (Note 1) |
| |
| SEMICONDUCTORS & SEMICONDUCTOR EQUIPMENT – CONTINUED |
| Semiconductors – 10.7% | | | | | | |
| Agere Systems, Inc. (a) | | 1,665 | | $ | | 18,631 |
| AMIS Holdings, Inc. (a) | | 800 | | | | 10,208 |
| Applied Micro Circuits Corp. (a) | | 16,432 | | | | 49,460 |
| ARM Holdings PLC sponsored ADR | | 5,900 | | | | 37,465 |
| Exar Corp. (a) | | 700 | | | | 11,148 |
| Fairchild Semiconductor International, | | | | | | |
| Inc. (a) | | 1,300 | | | | 21,918 |
| Freescale Semiconductor, Inc. Class A | | 14,100 | | | | 359,832 |
| Intersil Corp. Class A | | 2,651 | | | | 51,350 |
| Linear Technology Corp. | | 600 | | | | 23,316 |
| Marvell Technology Group Ltd. (a) | | 1,300 | | | | 56,797 |
| Maxim Integrated Products, Inc. | | 600 | | | | 25,122 |
| Microchip Technology, Inc. | | 1,300 | | | | 40,391 |
| Microtune, Inc. (a) | | 6,200 | | | | 37,758 |
| Mindspeed Technologies, Inc. (a) | | 76,375 | | | | 109,216 |
| O2Micro International Ltd. (a) | | 7,000 | | | | 120,120 |
| Sigma Designs, Inc. (a) | | 4,224 | | | | 36,411 |
| Silicon Image, Inc. (a) | | 1,600 | | | | 18,912 |
| STATS ChipPAC Ltd. sponsored ADR (a) . | | 2,700 | | | | 18,495 |
| Vitesse Semiconductor Corp. (a) | | 28,300 | | | | 62,826 |
| Volterra Semiconductor Corp. | | 1,200 | | | | 13,932 |
| | | | | | | 1,123,308 |
| |
| TOTAL SEMICONDUCTORS | | | | | | |
| & SEMICONDUCTOR EQUIPMENT | | | | | | 1,159,186 |
| |
| SOFTWARE – 3.3% | | | | | | |
| Application Software – 2.6% | | | | | | |
| JAMDAT Mobile, Inc. | | 2,410 | | | | 68,974 |
| Portal Software, Inc. (a) | | 5,000 | | | | 10,850 |
| TIBCO Software, Inc. (a) | | 3,200 | | | | 24,608 |
| Ulticom, Inc. (a) | | 13,898 | | | | 170,251 |
| | | | | | | 274,683 |
| Home Entertainment Software – 0.3% | | | | | | |
| UBI Soft Entertainment SA (a) | | 500 | | | | 27,742 |
| Systems Software – 0.4% | | | | | | |
| Macrovision Corp. (a) | | 2,136 | | | | 46,629 |
| |
| TOTAL SOFTWARE | | | | | | 349,054 |
| |
| WIRELESS TELECOMMUNICATION SERVICES – 3.5% | | | | |
| Wireless Telecommunication Services – 3.5% | | | | | | |
| Nextel Partners, Inc. Class A (a) | | 4,600 | | | | 114,540 |
| NII Holdings, Inc. (a) | | 1,000 | | | | 74,440 |
| Wireless Facilities, Inc. (a) | | 27,833 | | | | 179,245 |
| | | | | | | 368,225 |
| |
| TOTAL COMMON STOCKS | | | | | | |
| (Cost $9,733,958) | | | | 10,379,495 |
| Money Market Funds — 1.8% | | | | |
| | | Shares | | | | Value (Note 1) |
| Fidelity Cash Central Fund, 3.31% (b) | | | | | | |
| (Cost $189,754) | | 189,754 | | $ | | 189,754 |
| TOTAL INVESTMENT PORTFOLIO - 101.0% | | | | |
| (Cost $9,923,712) | | | | | | 10,569,249 |
| |
| NET OTHER ASSETS – (1.0)% | | | | | | (100,286) |
| NET ASSETS – 100% | | | | $ | | 10,468,963 |
Legend
(a) Non-income producing
(b) Affiliated fund that is available only to investment companies and other
accounts managed by Fidelity Investments. The rate quoted is the
annualized seven-day yield of the fund at period end. A complete listing
of the fund’s holdings as of its most recent quarter end is available upon
request.
|
Other Information
Distribution of investments by country of issue, as a percentage of total net
assets, is as follows:
|
| United States of America | | 72.9% |
| Finland | | 9.8% |
| Canada | | 9.0% |
| Taiwan | | 2.5% |
| Israel | | 1.9% |
| Cayman Islands | | 1.1% |
| Others (individually less than 1%) | | 2.8% |
| | | 100.0% |
| | Income Tax Information
At July 31, 2005, the fund had a capital loss carryforward of approximately
$1,987,794 of which $479,787 and $1,508,007 will expire on July 31,
2011 and 2013, respectively.
|
See accompanying notes which are an integral part of the financial statements.
Developing Communications A-56
| | Advisor Developing Communications Fund
Financial Statements
|
| Statement of Assets and Liabilities | | | | |
| | | | | | | | | July 31, 2005 |
| Assets | | | | | | | | |
| Investment in securities, at value (cost | | | | | | |
| $9,923,712) — See accompanying | | | | | | |
| schedule | | | | | | $ | | 10,569,249 |
| Foreign currency held at value (cost | | | | | | |
| $52,549) | | | | | | | | 55,928 |
| Receivable for investments sold | | | | | | | | 365,719 |
| Receivable for fund shares sold | | | | | | | | 10,908 |
| Dividends receivable | | | | | | | | 4,183 |
| Interest receivable | | | | | | | | 663 |
| Prepaid expenses | | | | | | | | 24 |
| Receivable from investment adviser for | | | | | | |
| expense reductions | | | | | | | | 7,426 |
| Other receivables | | | | | | | | 8,856 |
| Total assets | | | | | | | | 11,022,956 |
| |
| Liabilities | | | | | | | | |
| Payable to custodian bank | | $ | | 39,591 | | | | |
| Payable for investments purchased | | | | 250,432 | | | | |
| Payable for fund shares redeemed | | | | 213,033 | | | | |
| Accrued management fee | | | | 5,063 | | | | |
| Distribution fees payable | | | | 5,712 | | | | |
| Other affiliated payables | | | | 4,195 | | | | |
| Other payables and accrued expenses | | 35,967 | | | | |
| Total liabilities | | | | | | | | 553,993 |
| |
| Net Assets | | | | | | $ | | 10,468,963 |
| Net Assets consist of: | | | | | | | | |
| Paid in capital | | | | | | $ | | 12,352,214 |
| Accumulated undistributed net real- | | | | | | |
| ized gain (loss) on investments and | | | | | | |
| foreign currency transactions | | | | | | | | (2,532,167) |
| Net unrealized appreciation (depreci- | | | | | | |
| ation) on investments and assets | | | | | | | | |
| and liabilities in foreign currencies . | | | | | | 648,916 |
| Net Assets | | | | | | $ | | 10,468,963 |
| Calculation of Maximum Offering Price | | | | | | |
| Class A: | | | | | | | | |
| Net Asset Value and redemption | | | | | | |
| price per share ($2,406,032 | | | | | | |
| ÷ 312,536 shares) | | | | | | $ | | 7.70 |
| Maximum offering price per share | | | | | | | | |
| (100/94.25 of $7.70) | | | | | | $ | | 8.17 |
| Class T: | | | | | | | | |
| Net Asset Value and redemption | | | | | | |
| price per share ($3,033,867 ÷ | | | | | | |
| 398,469 shares) | | | | | | $ | | 7.61 |
| Maximum offering price per share | | | | | | | | |
| (100/96.50 of $7.61) | | | | | | $ | | 7.89 |
| Class B: | | | | | | | | |
| Net Asset Value and offering price | | | | | | |
| per share ($2,864,193 ÷ | | | | | | | | |
| 384,883 shares)A | | | | | | $ | | 7.44 |
| Class C: | | | | | | | | |
| Net Asset Value and offering price | | | | | | |
| per share ($1,846,017 ÷ | | | | | | | | |
| 248,107 shares)A | | | | | | $ | | 7.44 |
| Institutional Class: | | | | | | | | |
| Net Asset Value, offering price and | | | | | | |
| redemption price per share | | | | | | | | |
| ($318,854 ÷ 40,924 shares) | | | | $ | | 7.79 |
A Redemption price per share is equal to net asset value less any applicable contingent deferred sales charge.
| Statement of Operations | | | | |
| | | | | Year ended July 31, 2005 |
| Investment Income | | | | | | |
| Dividends | | | | $ | | 45,173 |
| Interest | | | | | | 7,531 |
| | | | | | | 52,704 |
| Less foreign taxes withheld | | | | | | (7,113) |
| Total income | | | | | | 45,591 |
| |
| Expenses | | | | | | |
| Management fee | | $ | | 72,715 | | |
| Transfer agent fees | | | | 63,697 | | |
| Distribution fees | | | | 81,485 | | |
| Accounting fees and expenses | | | | 16,532 | | |
| Independent trustees’ compensation | | 69 | | |
| Custodian fees and expenses | | | | 17,742 | | |
| Registration fees | | | | 54,742 | | |
| Audit | | | | 44,609 | | |
| Legal | | | | 50 | | |
| Miscellaneous | | | | 148 | | |
| Total expenses before reductions | | 351,789 | | |
| Expense reductions | | | | (139,266) | | 212,523 |
| |
| Net investment income (loss) | | | | | | (166,932) |
| Realized and Unrealized Gain (Loss) | | | | |
| Net realized gain (loss) on: | | | | | | |
| Investment securities | | | | (1,572,837) | | |
| Foreign currency transactions | | | | 7,932 | | |
| Total net realized gain (loss) | | | | | | (1,564,905) |
| Change in net unrealized appreci- | | | | |
| ation (depreciation) on: | | | | | | |
| Investment securities | | | | 3,597,519 | | |
| Assets and liabilities in foreign | | | | | | |
| currencies | | | | 3,478 | | |
| Total change in net unrealized | | | | | | |
| appreciation (depreciation) | | | | | | 3,600,997 |
| Net gain (loss) | | | | | | 2,036,092 |
| Net increase (decrease) in net as- | | | | |
| sets resulting from operations | | | | $ | | 1,869,160 |
See accompanying notes which are an integral part of the financial statements.
A-57 Annual Report
Advisor Developing Communications Fund Financial Statements - continued
| Statement of Changes in Net Assets | | | | | | |
| | | Year ended | | | | Year ended |
| | | July 31, | | | | July 31, |
| | | 2005 | | | | 2004 |
| Increase (Decrease) in Net Assets | | | | | | |
| Operations | | | | | | |
| Net investment income (loss) | | $ (166,932) | | $ | | (212,872) |
| Net realized gain (loss) | | (1,564,905) | | | | 3,031,717 |
| Change in net unrealized appreciation (depreciation) | | 3,600,997 | | | | (3,435,275) |
| Net increase (decrease) in net assets resulting from operations | | 1,869,160 | | | | (616,430) |
| Share transactions -- net increase (decrease) | | (4,921,642) | | | | 8,358,921 |
| Redemption fees | | 6,207 | | | | 70,726 |
| Total increase (decrease) in net assets | | (3,046,275) | | | | 7,813,217 |
| |
| Net Assets | | | | | | |
| Beginning of period | | 13,515,238 | | | | 5,702,021 |
| End of period | | $ 10,468,963 | | $ | | 13,515,238 |
| Financial Highlights – Class A | | | | | | | | | | |
| Years ended July 31, | | 2005 | | 2004 | | 2003 | | 2002 | | 2001F |
| Selected Per-Share Data | | | | | | | | | | |
| Net asset value, beginning of period | | $ 6.53 | | $ 5.57 | | $ 3.96 | | $ 8.40 | | $ 10.00 |
| Income from Investment Operations | | | | | | | | | | |
| Net investment income (loss)E | | (.07) | | (.09) | | (.04) | | (.05) | | (.04) |
| Net realized and unrealized gain (loss) | | 1.24 | | 1.01 | | 1.65 | | (4.40) | | (1.57) |
| Total from investment operations | | 1.17 | | .92 | | 1.61 | | (4.45) | | (1.61) |
| Redemption fees added to paid in capitalE | | —H | | .04 | | —H | | .01 | | .01 |
| Net asset value, end of period | | $ 7.70 | | $ 6.53 | | $ 5.57 | | $ 3.96 | | $ 8.40 |
| Total ReturnB,C D | | 17.92% | | 17.24% | | 40.66% | | (52.86)% | | (16.00)% |
| Ratios to Average Net AssetsG | | | | | | | | | | |
| Expenses before expense reductions | | 2.32% | | 2.38% | | 6.13% | | 4.97% | | 6.46%A |
| Expenses net of voluntary waivers, if any | | 1.45% | | 1.50% | | 1.50% | | 1.50% | | 1.50%A |
| Expenses net of all reductions | | 1.28% | | 1.35% | | 1.36% | | 1.40% | | 1.45%A |
| Net investment income (loss) | | (.92)% | | (1.18)% | | (.82)% | | (.85)% | | (.74)%A |
| Supplemental Data | | | | | | | | | | |
| Net assets, end of period (000 omitted) | | $ 2,406 | | $ 3,480 | | $ 970 | | $ 371 | | $ 934 |
| Portfolio turnover rate | | 250% | | 306% | | 167% | | 305% | | 644%A |
A Annualized
B Total returns for periods of less than one year are not annualized.
C Total returns would have been lower had certain expenses not been reduced during the periods shown. D Total returns do not include the effect of the sales charges.
E Calculated based on average shares outstanding during the period.
F For the period December 27, 2000 (commencement of operations) to July 31, 2001.
G Expense ratios reflect operating expenses of the class. Expenses before reductions do not reflect amounts reimbursed by the investment adviser or reductions from brokerage service arrangements or other expense offset arrangements and do not represent the amount paid by the class during periods when reimbursements or reductions occur. Expense ratios before reductions for start up periods may not be representative of longer term operating periods. Expenses net of any voluntary waivers reflect expenses after reimbursement by the investment adviser but prior to reductions from brokerage service arrangements or other expense offset arrangements. Expenses net of all reductions represent the net expenses paid by the class. H Amount represents less than $.01 per share.
See accompanying notes which are an integral part of the financial statements.
Developing Communications A-58
| Financial Highlights – Class T | | | | | | | | | | |
| Years ended July 31, | | 2005 | | 2004 | | 2003 | | 2002 | | 2001F |
| Selected Per-Share Data | | | | | | | | | | |
| Net asset value, beginning of period | | $ 6.48 | | $ 5.54 | | $ 3.95 | | $ 8.40 | | $ 10.00 |
| Income from Investment Operations | | | | | | | | | | |
| Net investment income (loss)E | | (.08) | | (.10) | | (.05) | | (.07) | | (.05) |
| Net realized and unrealized gain (loss) | | 1.21 | | 1.00 | | 1.64 | | (4.39) | | (1.56) |
| Total from investment operations | | 1.13 | | .90 | | 1.59 | | (4.46) | | (1.61) |
| Redemption fees added to paid in capitalE | | —H | | .04 | | —H | | .01 | | .01 |
| Net asset value, end of period | | $ 7.61 | | $ 6.48 | | $ 5.54 | | $ 3.95 | | $ 8.40 |
| Total ReturnB,C,D | | 17.44% | | 16.97% | | 40.25% | | (52.98)% | | (16.00)% |
| Ratios to Average Net AssetsG | | | | | | | | | | |
| Expenses before expense reductions | | 2.78% | | 3.06% | | 6.82% | | 5.36% | | 6.66%A |
| Expenses net of voluntary waivers, if any | | 1.71% | | 1.75% | | 1.75% | | 1.75% | | 1.75%A |
| Expenses net of all reductions | | 1.54% | | 1.60% | | 1.61% | | 1.64% | | 1.70%A |
| Net investment income (loss) | | (1.18)% | | (1.43)% | | (1.07)% | | (1.10)% | | (.99)%A |
| Supplemental Data | | | | | | | | | | |
| Net assets, end of period (000 omitted) | | $ 3,034 | | $ 3,250 | | $ 1,723 | | $ 775 | | $ 2,131 |
| Portfolio turnover rate | | 250% | | 306% | | 167% | | 305% | | 644%A |
A Annualized
B Total returns for periods of less than one year are not annualized.
C Total returns would have been lower had certain expenses not been reduced during the periods shown.
D Total returns do not include the effect of the sales charges.
E Calculated based on average shares outstanding during the period.
F For the period December 27, 2000 (commencement of operations) to July 31, 2001.
G Expense ratios reflect operating expenses of the class. Expenses before reductions do not reflect amounts reimbursed by the investment adviser or reductions from brokerage service arrangements or other expense offset arrangements and do not
represent the amount paid by the class during periods when reimbursements or reductions occur. Expense ratios before reductions for start up periods may not be representative of longer term operating periods. Expenses net of any voluntary
waivers reflect expenses after reimbursement by the investment adviser but prior to reductions from brokerage service arrangements or other expense offset arrangements. Expenses net of all reductions represent the net expenses paid by the class.
H Amount represents less than $.01 per share.
|
| Financial Highlights – Class B | | | | | | | | | | |
| Years ended July 31, | | 2005 | | 2004 | | 2003 | | 2002 | | 2001F |
| Selected Per-Share Data | | | | | | | | | | |
| Net asset value, beginning of period | | $ 6.36 | | $ 5.47 | | $ 3.92 | | $ 8.37 | | $ 10.00 |
| Income from Investment Operations | | | | | | | | | | |
| Net investment income (loss)E | | (.12) | | (.13) | | (.07) | | (.10) | | (.07) |
| Net realized and unrealized gain (loss) | | 1.20 | | .98 | | 1.62 | | (4.36) | | (1.57) |
| Total from investment operations | | 1.08 | | .85 | | 1.55 | | (4.46) | | (1.64) |
| Redemption fees added to paid in capitalE | | —H | | .04 | | —H | | .01 | | .01 |
| Net asset value, end of period | | $ 7.44 | | $ 6.36 | | $ 5.47 | | $ 3.92 | | $ 8.37 |
| Total ReturnB,C,D | | 16.98% | | 16.27% | | 39.54% | | (53.17)% | | (16.30)% |
| Ratios to Average Net AssetsG | | | | | | | | | | |
| Expenses before expense reductions | | 3.14% | | 3.48% | | 6.88% | | 5.62% | | 7.21%A |
| Expenses net of voluntary waivers, if any | | 2.20% | | 2.25% | | 2.25% | | 2.25% | | 2.25%A |
| Expenses net of all reductions | | 2.04% | | 2.11% | | 2.11% | | 2.14% | | 2.20%A |
| Net investment income (loss) | | (1.68)% | | (1.93)% | | (1.56)% | | (1.60)% | | (1.49)%A |
| Supplemental Data | | | | | | | | | | |
| Net assets, end of period (000 omitted) | | $ 2,864 | | $ 2,998 | | $ 1,846 | | $ 1,162 | | $ 2,236 |
| Portfolio turnover rate | | 250% | | 306% | | 167% | | 305% | | 644%A |
A Annualized
B Total returns for periods of less than one year are not annualized.
C Total returns would have been lower had certain expenses not been reduced during the periods shown.
D Total returns do not include the effect of the contingent deferred sales charge.
E Calculated based on average shares outstanding during the period.
F For the period December 27, 2000 (commencement of operations) to July 31, 2001.
G Expense ratios reflect operating expenses of the class. Expenses before reductions do not reflect amounts reimbursed by the investment adviser or reductions from brokerage service arrangements or other expense offset arrangements and do not
represent the amount paid by the class during periods when reimbursements or reductions occur. Expense ratios before reductions for start up periods may not be representative of longer term operating periods. Expenses net of any voluntary
waivers reflect expenses after reimbursement by the investment adviser but prior to reductions from brokerage service arrangements or other expense offset arrangements. Expenses net of all reductions represent the net expenses paid by the class.
H Amount represents less than $.01 per share.
|
See accompanying notes which are an integral part of the financial statements.
|
| Financial Highlights – Class C | | | | | | | | | | |
| Years ended July 31, | | 2005 | | 2004 | | 2003 | | 2002 | | 2001F |
| Selected Per-Share Data | | | | | | | | | | |
| Net asset value, beginning of period | | $ 6.36 | | $ 5.47 | | $ 3.92 | | $ 8.37 | | $ 10.00 |
| Income from Investment Operations | | | | | | | | | | |
| Net investment income (loss)E | | (.12) | | (.14) | | (.07) | | (.10) | | (.07) |
| Net realized and unrealized gain (loss) | | 1.20 | | .99 | | 1.62 | | (4.36) | | (1.57) |
| Total from investment operations | | 1.08 | | .85 | | 1.55 | | (4.46) | | (1.64) |
| Redemption fees added to paid in capitalE | | —H | | .04 | | —H | | .01 | | .01 |
| Net asset value, end of period | | $ 7.44 | | $ 6.36 | | $ 5.47 | | $ 3.92 | | $ 8.37 |
| Total ReturnB,C,D | | 16.98% | | 16.27% | | 39.54% | | (53.17)% | | (16.30)% |
| Ratios to Average Net AssetsG | | | | | | | | | | |
| Expenses before expense reductions | | 3.07% | | 3.19% | | 6.81% | | 5.49% | | 7.09%A |
| Expenses net of voluntary waivers, if any | | 2.19% | | 2.25% | | 2.25% | | 2.25% | | 2.25%A |
| Expenses net of all reductions | | 2.02% | | 2.10% | | 2.11% | | 2.14% | | 2.20%A |
| Net investment income (loss) | | (1.66)% | | (1.93)% | | (1.57)% | | (1.60)% | | (1.49)%A |
| Supplemental Data | | | | | | | | | | |
| Net assets, end of period (000 omitted) | | $ 1,846 | | $ 3,180 | | $ 1,009 | | $ 667 | | $ 1,566 |
| Portfolio turnover rate | | 250% | | 306% | | 167% | | 305% | | 644%A |
A Annualized
B Total returns for periods of less than one year are not annualized.
C Total returns would have been lower had certain expenses not been reduced during the periods shown.
D Total returns do not include the effect of the contingent deferred sales charge.
E Calculated based on average shares outstanding during the period.
F For the period December 27, 2000 (commencement of operations) to July 31, 2001.
G Expense ratios reflect operating expenses of the class. Expenses before reductions do not reflect amounts reimbursed by the investment adviser or reductions from brokerage service arrangements or other expense offset arrangements and do not
represent the amount paid by the class during periods when reimbursements or reductions occur. Expense ratios before reductions for start up periods may not be representative of longer term operating periods. Expenses net of any voluntary
waivers reflect expenses after reimbursement by the investment adviser but prior to reductions from brokerage service arrangements or other expense offset arrangements. Expenses net of all reductions represent the net expenses paid by the class.
H Amount represents less than $.01 per share.
|
| Financial Highlights – Institutional Class | | | | | | | | | | |
| Years ended July 31, | | 2005 | | 2004 | | 2003 | | 2002 | | 2001E |
| Selected Per-Share Data | | | | | | | | | | |
| Net asset value, beginning of period | | $ 6.60 | | $ 5.61 | | $ 3.98 | | $ 8.42 | | $ 10.00 |
| Income from Investment Operations | | | | | | | | | | |
| Net investment income (loss)D | | (.05) | | (.07) | | (.03) | | (.04) | | (.03) |
| Net realized and unrealized gain (loss) | | 1.24 | | 1.02 | | 1.66 | | (4.41) | | (1.56) |
| Total from investment operations | | 1.19 | | .95 | | 1.63 | | (4.45) | | (1.59) |
| Redemption fees added to paid in capitalD | | —G | | .04 | | —G | | .01 | | .01 |
| Net asset value, end of period | | $ 7.79 | | $ 6.60 | | $ 5.61 | | $ 3.98 | | $ 8.42 |
| Total ReturnB,C | | 18.03% | | 17.65% | | 40.95% | | (52.73)% | | (15.80)% |
| Ratios to Average Net AssetsF | | | | | | | | | | |
| Expenses before expense reductions | | 1.85% | | 1.55% | | 5.34% | | 4.24% | | 5.95%A |
| Expenses net of voluntary waivers, if any | | 1.18% | | 1.25% | | 1.25% | | 1.25% | | 1.25%A |
| Expenses net of all reductions | | 1.01% | | 1.11% | | 1.11% | | 1.14% | | 1.20%A |
| Net investment income (loss) | | (.65)% | | (.93)% | | (.57)% | | (.60)% | | (.49)%A |
| Supplemental Data | | | | | | | | | | |
| Net assets, end of period (000 omitted) | | $ 319 | | $ 607 | | $ 154 | | $ 100 | | $ 283 |
| Portfolio turnover rate | | 250% | | 306% | | 167% | | 305% | | 644%A |
A Annualized
B Total returns for periods of less than one year are not annualized.
C Total returns would have been lower had certain expenses not been reduced during the periods shown.
D Calculated based on average shares outstanding during the period.
E For the period December 27, 2000 (commencement of operations) to July 31, 2001.
F Expense ratios reflect operating expenses of the class. Expenses before reductions do not reflect amounts reimbursed by the investment adviser or reductions from brokerage service arrangements or other expense offset arrangements and do not
represent the amount paid by the class during periods when reimbursements or reductions occur. Expense ratios before reductions for start up periods may not be representative of longer term operating periods. Expenses net of any voluntary
waivers reflect expenses after reimbursement by the investment adviser but prior to reductions from brokerage service arrangements or other expense offset arrangements. Expenses net of all reductions represent the net expenses paid by the class.
G Amount represents less than $.01 per share.
|
See accompanying notes which are an integral part of the financial statements.
Developing Communications A-60
|
Notes to Financial Statements
For the period ended July 31, 2005
|
1. Significant Accounting Policies.
|
Fidelity Advisor Developing Communications Fund (the fund) is a non-diversified fund of Fidelity Advisor Series VII (the trust) and is authorized to issue an unlimited number of shares. The trust is registered under the Investment Company Act of 1940, as amended (the 1940 Act), as an open-end management investment company organized as a Massachusetts business trust.
The fund offers Class A, Class T, Class B, Class C, and Institutional Class shares, each of which has equal rights as to assets and voting privileges. Each class has exclusive voting rights with respect to matters that affect that class. Class B shares will automatically convert to Class A shares after a holding period of seven years from the initial date of purchase. Investment income, realized and unrealized capital gains and losses, the common expenses of the fund, and certain fund-level expense reductions, if any, are allocated on a pro rata basis to each class based on the relative net assets of each class to the total net assets of the fund. Each class differs with respect to transfer agent and distribution and service plan fees incurred. Certain expense reductions also differ by class.
The financial statements have been prepared in conformity with accounting principles generally accepted in the United States of America, which require management to make certain estimates and assumptions at the date of the financial statements. The following summarizes the significant accounting policies of the fund:
Security Valuation. Net asset value per share (NAV calculation) is calculated as of the close of business of the New York Stock Exchange, normally 4:00 p.m. Eastern time. Equity securities, including restricted securities, for which market quotations are available are valued at the last sale price or official closing price (closing bid price or last evaluated quote if no sale has occurred) on the primary market or exchange on which they trade. If prices are not readily available or do not accurately reflect fair value for a security, or if a security’s value has been materially affected by events occurring after the close of the exchange or market on which the security is principally traded, that security may be valued by another method that the Board of Trustees believes accurately reflects fair value. A security’s valuation may differ depending on the method used for determining value. Price movements in futures contracts and ADRs, market and trading trends, the bid/ask quotes of brokers and off-exchange institutional trading may be reviewed in the course of making a good faith determination of a security’s fair value. Short-term securities with remaining maturities of sixty days or less for which quotations are not readily available are valued on the basis of amortized cost. Investments in open-end investment companies are valued at their net asset value each business day.
Foreign Currency. The fund uses foreign currency contracts to facilitate transactions in foreign-denominated securities. Losses from these transactions may arise from changes in the value of the foreign currency or if the counterparties do not perform under the contracts’ terms.
Foreign-denominated assets, including investment securities, and liabilities are translated into U.S. dollars at the exchange rate at period end. Purchases and sales of investment securities, income and dividends received and expenses denominated in foreign currencies are translated into U.S. dollars at the exchange rate in effect on the transaction date.
The effects of exchange rate fluctuations on investments are included with the net realized and unrealized gain (loss) on investment securities. Other foreign currency transactions resulting in realized and unrealized gain (loss) are disclosed separately.
Investment Transactions and Income. Security transactions are accounted for as of trade date. Gains and losses on securities sold are determined on the basis of identified cost and may include proceeds received from litigation. Dividend income is recorded on the ex-dividend date, except for certain dividends from foreign securities where the ex-dividend date may have passed, which are recorded as soon as the fund is informed of the ex-dividend date. Non-cash dividends included in dividend income, if any, are recorded at the fair market value of the securities received. Distributions received on securities that represent a return of capital or capital gain are recorded as a reduction of cost of investments and/or as a realized gain. The fund estimates the components of distributions received that may be considered return of capital distributions or capital gain distributions. Interest income is accrued as earned. Interest income includes coupon interest and amortization of premium and accretion of discount on debt securities. Investment income is recorded net of foreign taxes withheld where recovery of such taxes is uncertain.
Expenses. Most expenses of the trust can be directly attributed to a fund. Expenses which cannot be directly attributed are apportioned among each fund in the trust.
Income Tax Information and Distributions to Shareholders. Each year, the fund intends to qualify as a regulated investment company by distributing all of its taxable income and realized gains under Subchapter M of the Internal Revenue Code. As a result, no provision for income taxes is required in the accompanying financial statements. Foreign taxes are provided for based on the fund’s understanding of the tax rules and rates that exist in the foreign markets in which it invests.
Distributions are recorded on the ex-dividend date. Income dividends and capital gain distributions are declared separately for each class. Income and capital gain distributions are determined in accordance with income tax regulations, which may differ from generally accepted accounting principles. Capital accounts within the financial statements are adjusted for permanent book-tax differences. These adjustments have no impact on net assets or the results of operations. Temporary book-tax differences will reverse in a subsequent period.
Notes to Financial Statements - continued
1. Significant Accounting Policies - continued
Income Tax Information and Distributions to Shareholders - continued
|
Book-tax differences are primarily due to foreign currency transactions, net operating losses, capital loss carryforwards and losses deferred due to wash
sales and excise tax regulations.
The tax-basis components of distributable earnings and the federal tax cost as of period end were as follows:
|
| Unrealized appreciation | | $ 1,354,701 |
| Unrealized depreciation | | (877,334) |
| Net unrealized appreciation (depreciation) | | 477,367 |
| Capital loss carryforward | | (1,987,794) |
| |
| Cost for federal income tax purposes | | $ 10,091,882 |
Short-Term Trading (Redemption) Fees. Shares held in the fund less than 60 days are subject to a redemption fee equal to 1.00% of the proceeds of the redeemed shares. All redemption fees, including any estimated redemption fees paid by Fidelity Management & Research Company (FMR), are retained by the fund and accounted for as an addition to paid in capital.
Repurchase Agreements. FMR has received an Exemptive Order from the Securities and Exchange Commission (the SEC) which permits the fund and other affiliated entities of FMR to transfer uninvested cash balances into joint trading accounts which are then invested in repurchase agreements. The fund may also invest directly with institutions in repurchase agreements. Repurchase agreements are collateralized by government or non-government securities. Collateral is held in segregated accounts with custodian banks and may be obtained in the event of a default of the counterparty. The fund monitors, on a daily basis, the value of the collateral to ensure it is at least equal to the principal amount of the repurchase agreement (including accrued interest). In the event of a default by the counterparty, realization of the collateral proceeds could be delayed, during which time the value of the collateral may decline.
3. Purchases and Sales of Investments.
Purchases and sales of securities, other than short-term securities and U.S. government securities, aggregated $30,430,741 and $34,804,168, respectively.
4. Fees and Other Transactions with Affiliates.
Management Fee. FMR and its affiliates provide the fund with investment management related services for which the fund pays a monthly management fee. The management fee is the sum of an individual fund fee rate that is based on an annual rate of .30% of the fund’s average net assets and a group fee rate that averaged .27% during the period. The group fee rate is based upon the average net assets of all the mutual funds advised by FMR. The group fee rate decreases as assets under management increase and increases as assets under management decrease. For the period, the total annual management fee rate was .57% of the fund’s average net assets.
Distribution and Service Plan. In accordance with Rule 12b-1 of the 1940 Act, the fund has adopted separate Distribution and Service Plans for each class of shares. Certain classes pay Fidelity Distributors Corporation (FDC), an affiliate of FMR, separate Distribution and Service Fees, each of which is based on an annual percentage of each class’ average net assets. In addition, FDC may pay financial intermediaries for selling shares of the fund and providing shareholder support services. For the period, the Distribution and Service Fee rates and the total amounts paid to and retained by FDC were as follows:
| | | Distribution | | Service | | | | Paid to | | | | Retained |
| | | Fee | | Fee | | | | FDC | | | | by FDC |
| Class A | | 0% | | .25% | | $ | | 8,386 | | $ | | 71 |
| Class T | | 25% | | .25% | | | | 15,752 | | | | 120 |
| Class B | | 75% | | .25% | | | | 31,380 | | | | 23,601 |
| Class C | | 75% | | .25% | | | | 25,967 | | | | 10,222 |
| |
| | | | | | | $ | | 81,485 | | $ | | 34,014 |
Sales Load. FDC receives a front-end sales charge of up to 5.75% for selling Class A shares, and 3.50% for selling Class T shares, some of which is paid to financial intermediaries for selling shares of the fund. FDC receives the proceeds of contingent deferred sales charges levied on Class A, Class T, Class B, and Class C redemptions. These charges depend on the holding period. The deferred sales charges range from 5% to 1% for Class B, 1% for Class C, and .25% for certain purchases of Class A and Class T shares.
Developing Communications
|
4. Fees and Other Transactions with Affiliates - continued
Sales Load - continued
For the period, sales charge amounts retained by FDC were as follows:
|
| | | | | Retained |
| | | | | by FDC |
| Class A | | $ | | 3,113 |
| Class T | | | | 2,230 |
| Class B* | | | | 18,971 |
| Class C* | | | | 7,224 |
| Institutional Class | | | | — |
| | | $ | | 31,538 |
| |
| * When Class B and Class C shares are initially sold, FDC pays commissions from its own resources to financial intermediaries through which the sales are made. | | | | |
Transfer Agent Fees. Fidelity Investments Institutional Operations Company, Inc. (FIIOC), an affiliate of FMR, is the transfer, dividend disbursing and shareholder servicing agent for each class of the fund. FIIOC receives account fees and asset-based fees that vary according to the account size and type of account of the shareholders of the respective classes of the fund. FIIOC pays for typesetting, printing and mailing of shareholder reports, except proxy statements. For the period the total transfer agent fees paid by each class to FIIOC, were as follows:
| | | | | | | % of |
| | | | | | | Average |
| | | | | Amount | | Net Assets |
| Class A | | $ | | 14,815 | | .44 |
| Class T | | | | 20,585 | | .65 |
| Class B | | | | 15,935 | | .51 |
| Class C | | | | 11,392 | | .44 |
| Institutional Class | | | | 970 | | .22 |
| | | $ | | 63,697 | | |
Accounting Fees. Fidelity Service Company, Inc. (FSC), an affiliate of FMR, maintains the fund’s accounting records. The fee is based on the level of average net assets for the month.
Central Funds. The fund may invest in affiliated Central Funds managed by Fidelity Investments Money Management, Inc. (FIMM) an affiliate of FMR. The Central Funds are open-end investment companies available only to investment companies and other accounts managed by FMR and its affiliates. The Money Market Central Funds seek preservation of capital and current income. The Central Funds do not pay a management fee. Income distributions earned by the fund are recorded as income in the accompanying financial statements and totaled $7,283 for the period.
Brokerage Commissions. The fund placed a portion of its portfolio transactions with brokerage firms which are affiliates of the investment adviser. The commissions paid to these affiliated firms were $3,162 for the period.
| | 5. Committed Line of Credit.
|
The fund participates with other funds managed by FMR in a $4.2 billion credit facility (the “line of credit”) to be utilized for temporary or emergency purposes to fund shareholder redemptions or for other short-term liquidity purposes. The fund has agreed to pay commitment fees on its pro rata portion of the line of credit. During the period, there were no borrowings on this line of credit.
Notes to Financial Statements - continued
6. Expense Reductions.
|
FMR voluntarily agreed to reimburse each class to the extent annual operating expenses exceeded certain levels of average net assets as noted in the
table below. Some expenses, for example interest expense, are excluded from this reimbursement.
The following classes were in reimbursement during the period:
|
| | | Expense | | | | Reimbursement |
| | | Limitations | | | | from adviser |
| Class A | | 1.50% | | -- 1.40%* | | $ | | 29,260 |
| Class T | | 1.75% | | -- 1.65%* | | | | 33,777 |
| Class B | | 2.25% | | -- 2.15%* | | | | 29,212 |
| Class C | | 2.25% | | -- 2.15%* | | | | 22,792 |
| Institutional Class | | 1.25% | | -- 1.15%* | | | | 2,973 |
| | | | | | | $ | | 118,014 |
| * Expense limitation in effect at period end. | | | | | | | | |
Many of the brokers with whom FMR places trades on behalf of the fund provided services to the fund in addition to trade execution. These services included payments of certain expenses on behalf of the fund totaling $21,252 for the period.
The fund’s organizational documents provide former and current trustees and officers with a limited indemnification against liabilities arising in
connection with the performance of their duties to the fund. In the normal course of business, the fund may also enter into contracts that provide
general indemnifications. The fund’s maximum exposure under these arrangements is unknown as this would be dependent on future claims that may
be made against the fund. The risk of material loss from such claims is considered remote.
8. Share Transactions.
Transactions for each class of shares were as follows:
|
| | | | | Shares | | | | | | Dollars | | |
| Years ended July 31, | | 2005 | | | | 2004 | | 2005 | | | | 2004 |
| Class A | | | | | | | | | | | | |
| Shares sold | | 416,894 | | | | 856,040 | | $ 3,024,999 | | $ | | 6,688,889 |
| Shares redeemed | | (636,989) | | | | (497,414) | | (4,589,727) | | | | (3,670,051) |
| Net increase (decrease) | | (220,095) | | | | 358,626 | | $ (1,564,728) | | $ | | 3,018,838 |
| Class T | | | | | | | | | | | | |
| Shares sold | | 174,922 | | | | 608,342 | | $ 1,257,919 | | $ | | 4,433,681 |
| Shares redeemed | | (277,992) | | | | (417,749) | | (1,946,912) | | | | (2,928,626) |
| Net increase (decrease) | | (103,070) | | | | 190,593 | | $ (688,993) | | $ | | 1,505,055 |
| Class B | | | | | | | | | | | | |
| Shares sold | | 193,607 | | | | 592,476 | | $ 1,369,993 | | $ | | 4,376,737 |
| Shares redeemed | | (279,761) | | | | (458,816) | | (1,968,809) | | | | (3,282,550) |
| Net increase (decrease) | | (86,154) | | | | 133,660 | | $ (598,816) | | $ | | 1,094,187 |
| Class C | | | | | | | | | | | | |
| Shares sold | | 114,060 | | | | 580,072 | | $ 812,760 | | $ | | 4,396,643 |
| Shares redeemed | | (365,782) | | | | (264,829) | | (2,486,084) | | | | (1,922,022) |
| Net increase (decrease) | | (251,722) | | | | 315,243 | | $ (1,673,324) | | $ | | 2,474,621 |
| Institutional Class | | | | | | | | | | | | |
| Shares sold | | 11,594 | | | | 609,795 | | $ 84,651 | | $ | | 4,639,769 |
| Shares redeemed | | (62,684) | | | | (545,179) | | (480,432) | | | | (4,373,549) |
| Net increase (decrease) | | (51,090) | | | | 64,616 | | $ (395,781) | | $ | | 266,220 |
Developing Communications
|
Average annual total return reflects the change in the value of an investment, assuming reinvestment of the class’ dividend income and capital gains (the profits earned upon the sale of securities that have grown in value) and assuming a constant rate of performance each year. The $10,000 table and the fund’s returns do not reflect the deduction of taxes that a shareholder would pay on fund distributions or the redemption of fund shares. During periods of reimbursement by Fidelity, a fund’s total return will be greater than it would be had the reimbursement not occurred. How a fund did yesterday is no guarantee of how it will do tomorrow.
| Average Annual Total Returns | | | | |
| Periods ended July 31, 2005 | | Past 1 | | Life of |
| | | year | | fundA |
| Institutional Class | | 22.56% | | --4.35% |
| |
| A From December 27, 2000. | | | | |
| | $10,000 Over Life of Fund
|
Let’s say hypothetically that $10,000 was invested in Fidelity Advisor Electronics Fund - Institutional Class on December 27, 2000, when the fund started. The chart shows how the value of your investment would have changed, and also shows how the S&P 500 Index performed over the same period.
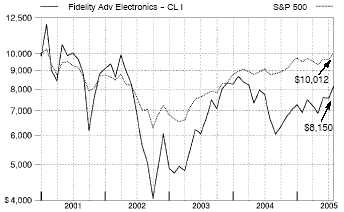
Management’s Discussion of Fund Performance
Comments from Jim Morrow, Portfolio Manager of Fidelity® Advisor Electronics Fund
A late-inning rally on Wall Street helped push some key U.S. equity indexes to four-year highs by the conclusion of the 12-month period ending July 31, 2005. Spurred on by bullish economic data and strong corporate earnings, investors enjoyed a stellar month of July, capping off a turbulent 12-month period for U.S. equity markets. Stock prices bounced up and down during most of the year, moving in cadence with gyrations in the price of crude oil and investors’ gathering and ebbing concerns about inflation. The Federal Reserve Board raised short-term interest rates eight times during the period, also affecting overall market sentiment. Despite their fluctuations, the major equity indexes finished on a high note, with the Standard & Poor’s 500SM Index and the NASDAQ Composite® Index posting gains of 14.05% and 16.51%, respectively, for the period. The small-cap Russell 2000® Index rose 24.78% and the Russell Midcap® Index jumped 28.93%, while the blue-chips’ Dow Jones Industrial AverageSM advanced only 7.29% .
For the 12 months ending July 31, 2005, the fund’s Institutional Class shares returned 22.56%, beating the 11.63% return of the Goldman Sachs® Technology Index and the S&P 500®. Favorable stock selection in semiconductors and a significant overweighting in the group were the main factors boosting the fund’s performance versus the sector benchmark. National Semiconductor was the fund’s top contributor both in absolute and relative terms. The company makes high-performance analog semiconductors for cellular handsets and flat-panel displays — end markets that enjoyed strong demand during the period. The second-best contributor was Marvell Technology Group, a maker of high-speed controllers for disk drives. The stock benefited from robust demand for laptop and notebook computers. I sold Marvell for valuation reasons as the period progressed. As a result of its foreign holdings, favorable currency movements helped boost the fund’s overall returns during the period. Factors that held back the fund’s performance included unfavorable stock picking in wireless telecommunications equipment. In absolute terms and relative to the sector index, Micron Technology was the biggest detractor. Weak pricing for DRAM (dynamic random access memory) due to stiff competition from Asian rivals hurt the stock. Canada-based ATI Technologies, a supplier of graphics chips for computer gaming and related applications, also held back performance, as a delayed product cycle hampered the stock.
The views expressed in this statement reflect those of the portfolio manager only through the end of the period of the report as stated on the cover and do not necessarily represent the views of Fidelity or any other person in the Fidelity organization. Any such views are subject to change at any time based upon market or other conditions and Fidelity disclaims any responsibility to update such views. These views may not be relied on as investment advice and, because investment decisions for a Fidelity fund are based on numerous factors, may not be relied on as an indication of trading intent on behalf of any Fidelity fund.
Shareholder Expense Example
|
As a shareholder of the Fund, you incur two types of costs: (1) transaction costs, including sales charges (loads) on purchase payments or redemption proceeds, redemption fees, and (2) ongoing costs, including management fees, distribution and/or service (12b-1) fees and other Fund expenses. This Example is intended to help you understand your ongoing costs (in dollars) of investing in the Fund and to compare these costs with the ongoing costs of investing in other mutual funds.
The Example is based on an investment of $1,000 invested at the beginning of the period and held for the entire period (February 1, 2005 to July 31, 2005).
The first line of the table below for each class of the Fund provides information about actual account values and actual expenses. You may use the information in this line, together with the amount you invested, to estimate the expenses that you paid over the period. Simply divide your account value by $1,000.00 (for example, an $8,600 account value divided by $1,000.00 = 8.6), then multiply the result by the number in the first line for a class of the Fund under the heading entitled “Expenses Paid During Period” to estimate the expenses you paid on your account during this period.
Hypothetical Example for Comparison Purposes
|
The second line of the table below for each class of the Fund provides information about hypothetical account values and hypothetical expenses based on a Class’ actual expense ratio and an assumed rate of return of 5% per year before expenses, which is not the Class’ actual return. The hypothetical account values and expenses may not be used to estimate the actual ending account balance or expenses you paid for the period. You may use this information to compare the ongoing costs of investing in the Fund and other funds. To do so, compare this 5% hypothetical example with the 5% hypothetical examples that appear in the shareholder reports of the other funds.
Please note that the expenses shown in the table are meant to highlight your ongoing costs only and do not reflect any transaction costs. Therefore, the second line of the table is useful in comparing ongoing costs only, and will not help you determine the relative total costs of owning different funds. In addition, if these transactional costs were included, your costs would have been higher.
| | | | | | | | | | | Expenses Paid |
| | | Beginning | | | | Ending | | | | During Period* |
| | | Account Value | | | | Account Value | | | | February 1, 2005 |
| | | February 1, 2005 | | | | July 31, 2005 | | | | to July 31, 2005 |
| Class A | | | | | | | | | | |
| Actual | | $ 1,000.00 | | $ | | 1,175.40 | | $ | | 7.55 |
| HypotheticalA | | $ 1,000.00 | | $ | | 1,017.85 | | $ | | 7.00 |
| Class T | | | | | | | | | | |
| Actual | | $ 1,000.00 | | $ | | 1,174.00 | | $ | | 8.89 |
| HypotheticalA | | $ 1,000.00 | | $ | | 1,016.61 | | $ | | 8.25 |
| Class B | | | | | | | | | | |
| Actual | | $ 1,000.00 | | $ | | 1,169.90 | | $ | | 11.57 |
| HypotheticalA | | $ 1,000.00 | | $ | | 1,014.13 | | $ | | 10.74 |
| Class C | | | | | | | | | | |
| Actual | | $ 1,000.00 | | $ | | 1,170.20 | | $ | | 11.57 |
| HypotheticalA | | $ 1,000.00 | | $ | | 1,014.13 | | $ | | 10.74 |
| Institutional Class | | | | | | | | | | |
| Actual | | $ 1,000.00 | | $ | | 1,176.00 | | $ | | 6.20 |
| HypotheticalA | | $ 1,000.00 | | $ | | 1,019.09 | | $ | | 5.76 |
| |
| A 5% return per year before expenses | | | | | | | | | | |
* Expenses are equal to each Class’ annualized expense ratio (shown in the table below); multiplied by the average account value over the period, multiplied by 181/365 (to reflect the one-half year period).
| | | Annualized |
| | | Expense Ratio |
| Class A | | 1.40% |
| Class T | | 1.65% |
| Class B | | 2.15% |
| Class C | | 2.15% |
| Institutional Class | | 1.15% |
| | Advisor Electronics Fund
Investment Changes
|
| Top Ten Stocks as of July 31, 2005 | | |
| | | % of fund’s | | % of fund’s net assets |
| | | net assets | | 6 months ago |
| Maxim Integrated Products, Inc. | | 10.3 | | 3.3 |
| Intel Corp. | | 9.8 | | 10.5 |
| Analog Devices, Inc. | | 8.8 | | 8.7 |
| National Semiconductor Corp. | | 8.4 | | 9.4 |
| Arrow Electronics, Inc. | | 6.8 | | 1.9 |
| Nokia Corp. sponsored ADR | | 4.5 | | 0.0 |
| Hon Hai Precision Industries Co. | | | | |
| Ltd. | | 3.5 | | 3.8 |
| Flextronics International Ltd. | | 3.1 | | 3.9 |
| KLA-Tencor Corp. | | 2.9 | | 4.2 |
| Cohu, Inc. | | 2.8 | | 0.0 |
| | | 60.9 | | |
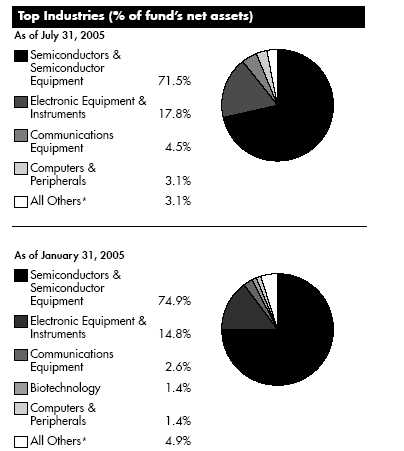
| | * Includes short term investments and net other assets.
Prior period industry classifications reflect the categories in place as of the date
indicated and have not been adjusted to reflect current industry classifications.
|
Electronics A-68
| | Advisor Electronics Fund
Investments July 31, 2005
Showing Percentage of Net Assets
|
| Common Stocks — 96.9% | | | | |
| | | Shares | | Value (Note 1) |
| |
| COMMUNICATIONS EQUIPMENT – 4.5% | | | | |
| Communications Equipment – 4.5% | | | | |
| Nokia Corp. sponsored ADR | | 125,000 | | $ 1,993,750 |
| COMPUTERS & PERIPHERALS – 3.1% | | | | |
| Computer Hardware – 0.9% | | | | |
| Quanta Computer, Inc. | | 224,274 | | 413,081 |
| Computer Storage & Peripherals – 2.2% | | | | |
| Mobility Electronics, Inc. (a) | | 25,000 | | 290,000 |
| SanDisk Corp. (a) | | 20,000 | | 676,400 |
| | | | | 966,400 |
| |
| TOTAL COMPUTERS & PERIPHERALS | | | | 1,379,481 |
| |
| ELECTRONIC EQUIPMENT & INSTRUMENTS – 17.8% | | |
| Electronic Equipment & Instruments – 1.3% | | | | |
| Amphenol Corp. Class A | | 13,360 | | 595,054 |
| Electronic Manufacturing Services – 6.6% | | | | |
| Flextronics International Ltd. (a) | | 100,000 | | 1,354,000 |
| Hon Hai Precision Industries Co. Ltd. | | 277,949 | | 1,561,119 |
| | | | | 2,915,119 |
| Technology Distributors – 9.9% | | | | |
| Arrow Electronics, Inc. (a) | | 100,000 | | 3,002,000 |
| Avnet, Inc. (a) | | 35,000 | | 916,300 |
| Wolfson Microelectronics PLC (a) | | 150,000 | | 456,084 |
| | | | | 4,374,384 |
| |
| TOTAL ELECTRONIC EQUIPMENT & INSTRUMENTS | | 7,884,557 |
| |
| SEMICONDUCTORS & SEMICONDUCTOR EQUIPMENT – 71.5% |
| Semiconductor Equipment – 14.3% | | | | |
| ATMI, Inc. (a) | | 10,000 | | 318,300 |
| Cohu, Inc. | | 50,000 | | 1,230,500 |
| FormFactor, Inc. (a) | | 19,000 | | 496,660 |
| KLA-Tencor Corp. | | 24,990 | | 1,291,983 |
| Lam Research Corp. (a) | | 30,030 | | 854,354 |
| MEMC Electronic Materials, Inc. (a) | | 15,400 | | 261,646 |
| Tessera Technologies, Inc. (a) | | 20,000 | | 702,400 |
| Varian Semiconductor Equipment | | | | |
| Associates, Inc. (a) | | 10,000 | | 415,200 |
| Veeco Instruments, Inc. (a) | | 40,000 | | 808,800 |
| | | | | 6,379,843 |
| Semiconductors – 57.2% | | | | |
| Agere Systems, Inc. (a) | | 46,720 | | 522,797 |
| AMIS Holdings, Inc. (a) | | 22,500 | | 287,100 |
| Analog Devices, Inc. | | 99,950 | | 3,918,040 |
| Applied Micro Circuits Corp. (a) | | 150,000 | | 451,500 |
| ATI Technologies, Inc. (a) | | 65,000 | | 818,638 |
| Freescale Semiconductor, Inc. Class A | | 40,000 | | 1,020,800 |
| Holtek Semiconductor, Inc. | | 104,996 | | 119,261 |
| Integrated Silicon Solution, Inc. (a) | | 50,000 | | 431,250 |
| Intel Corp. | | 159,990 | | 4,342,129 |
| International Rectifier Corp. (a) | | 5,000 | | 235,250 |
| | | Shares | | Value (Note 1) |
| Intersil Corp. Class A | | 25,000 | | $ 484,250 |
| Linear Technology Corp. | | 20,000 | | 777,200 |
| Maxim Integrated Products, Inc. | | 108,900 | | 4,559,643 |
| Microchip Technology, Inc. | | 30,000 | | 932,100 |
| National Semiconductor Corp. | | 150,020 | | 3,706,994 |
| NVIDIA Corp. (a) | | 20,000 | | 541,200 |
| O2Micro International Ltd. (a) | | 60,000 | | 1,029,600 |
| Rambus, Inc. (a) | | 20,000 | | 262,800 |
| Texas Instruments, Inc. | | 29,980 | | 952,165 |
| | | | | 25,392,717 |
| |
| TOTAL SEMICONDUCTORS & SEMICONDUCTOR | | |
| EQUIPMENT | | | | 31,772,560 |
| |
| TOTAL COMMON STOCKS | | | | |
| (Cost $40,213,920) | | | | 43,030,348 |
| |
| Money Market Funds — 2.0% | | | | |
| |
| Fidelity Cash Central Fund, 3.31% (b) | | | | |
| (Cost $897,887) | | 897,887 | | 897,887 |
| |
| TOTAL INVESTMENT PORTFOLIO - 98.9% | | |
| (Cost $41,111,807) | | | | 43,928,235 |
| |
| NET OTHER ASSETS – 1.1% | | | | 473,845 |
| NET ASSETS – 100% | | $ | | 44,402,080 |
| | Legend
(a) Non-income producing
(b) Affiliated fund that is available only to investment companies and other
accounts managed by Fidelity Investments. The rate quoted is the
annualized seven-day yield of the fund at period end. A complete listing
of the fund’s holdings as of its most recent quarter end is available upon
request.
|
| | Other Information
Distribution of investments by country of issue, as a percentage of total net
assets, is as follows:
|
| United States of America | | 82.6% |
| Taiwan | | 4.7% |
| Finland | | 4.5% |
| Singapore | | 3.1% |
| Cayman Islands | | 2.3% |
| Canada | | 1.8% |
| United Kingdom | | 1.0% |
| | | 100.0% |
Income Tax Information
At July 31, 2005, the fund had a capital loss carryforward of approximately
$14,245,984 of which $5,872,965, $5,827,947, $2,265,871 and
$279,201 will expire on July 31, 2010, 2011, 2012 and 2013, respectively.
The fund intends to elect to defer to its fiscal year ending July 31, 2006
approximately $1,416,124 of losses recognized during the period
November 1, 2004 to July 31, 2005.
|
See accompanying notes which are an integral part of the financial statements.
A-69 Annual Report
| | Advisor Electronics Fund
Financial Statements
|
| Statement of Assets and Liabilities | | |
| | | | | | | July 31, 2005 |
| Assets | | | | | | |
| Investment in securities, at value (cost | | | | |
| $41,111,807) — See accompanying | | | | |
| schedule | | | | $ | | 43,928,235 |
| Cash | | | | | | 242,702 |
| Foreign currency held at value (cost | | | | | | |
| $434,470) | | | | | | 430,879 |
| Receivable for investments sold | | | | | | 198,244 |
| Receivable for fund shares sold | | | | | | 36,004 |
| Interest receivable | | | | | | 2,286 |
| Receivable from investment adviser for | | | | |
| expense reductions | | | | | | 7,132 |
| Other receivables | | | | | | 16,166 |
| Total assets | | | | | | 44,861,648 |
| Liabilities | | | | | | |
| Payable for investments purchased | | $ | | 242,702 | | |
| Payable for fund shares redeemed | | | | 121,391 | | |
| Accrued management fee | | | | 21,375 | | |
| Distribution fees payable | | | | 24,679 | | |
| Other affiliated payables | | | | 16,727 | | |
| Other payables and accrued expenses . | | 32,694 | | |
| Total liabilities | | | | | | 459,568 |
| Net Assets | | | | $ | | 44,402,080 |
| Net Assets consist of: | | | | | | |
| Paid in capital | | | | $ | | 57,385,516 |
| Accumulated undistributed net realized | | | | |
| gain (loss) on investments and foreign | | | | |
| currency transactions | | | | | | (15,796,280) |
| Net unrealized appreciation (depreci- | | | | |
| ation) on investments and assets and | | | | |
| liabilities in foreign currencies | | | | | | 2,812,844 |
| Net Assets | | | | $ | | 44,402,080 |
| Calculation of Maximum Offering Price | | | | |
| Class A: | | | | | | |
| Net Asset Value and redemption price | | | | |
| per share ($11,397,298 ÷ | | | | | | |
| 1,418,398 shares) | | | | $ | | 8.04 |
| Maximum offering price per share | | | | | | |
| (100/94.25 of $8.04) | | | | $ | | 8.53 |
| Class T: | | | | | | |
| Net Asset Value and redemption price | | | | |
| per share ($12,085,071 ÷ | | | | | | |
| 1,518,872 shares) | | | | $ | | 7.96 |
| Maximum offering price per share | | | | | | |
| (100/96.50 of $7.96) | | | | $ | | 8.25 |
| Class B: | | | | | | |
| Net Asset Value and offering price per | | | | |
| share ($8,962,606 ÷ 1,151,527 | | | | |
| shares)A | | | | $ | | 7.78 |
| Class C: | | | | | | |
| Net Asset Value and offering price per | | | | |
| share ($11,058,277 ÷ 1,422,513 | | | | |
| shares)A | | | | $ | | 7.77 |
| Institutional Class: | | | | | | |
| Net Asset Value, offering price and | | | | |
| redemption price per share | | | | | | |
| ($898,828 ÷ 110,262 shares) | | | | $ | | 8.15 |
A Redemption price per share is equal to net asset value less any applicable contingent deferred sales charge.
| Statement of Operations | | | | |
| | | | | Year ended July 31, 2005 |
| Investment Income | | | | | | |
| Dividends | | | | $ | | 164,293 |
| Interest | | | | | | 30,477 |
| Security lending | | | | | | 2,287 |
| | | | | | | 197,057 |
| Less foreign taxes withheld | | | | | | (19,259) |
| Total income | | | | | | 177,798 |
| Expenses | | | | | | |
| Management fee | | $ | | 246,173 | | |
| Transfer agent fees | | | | 197,824 | | |
| Distribution fees | | | | 289,329 | | |
| Accounting and security lending | | | | | | |
| fees | | | | 24,837 | | |
| Independent trustees’ compensation | | 226 | | |
| Custodian fees and expenses | | | | 12,122 | | |
| Registration fees | | | | 55,855 | | |
| Audit | | | | 45,079 | | |
| Legal | | | | 118 | | |
| Miscellaneous | | | | 993 | | |
| Total expenses before reductions | | 872,556 | | |
| Expense reductions | | | | (103,341) | | 769,215 |
| |
| Net investment income (loss) | | | | | | (591,417) |
| Realized and Unrealized Gain (Loss) | | | | |
| Net realized gain (loss) on: | | | | | | |
| Investment securities | | | | (805,922) | | |
| Foreign currency transactions | | | | (2,040) | | |
| Total net realized gain (loss) | | | | | | (807,962) |
| Change in net unrealized appreci- | | | | |
| ation (depreciation) on: | | | | | | |
| Investment securities | | | | 9,646,750 | | |
| Assets and liabilities in foreign | | | | | | |
| currencies | | | | (3,057) | | |
| Total change in net unrealized ap- | | | | |
| preciation (depreciation) | | | | | | 9,643,693 |
| Net gain (loss) | | | | | | 8,835,731 |
| Net increase (decrease) in net as- | | | | |
| sets resulting from operations | | | | $ | | 8,244,314 |
See accompanying notes which are an integral part of the financial statements.
Electronics A-70
| Statement of Changes in Net Assets | | | | | | |
| | | Year ended | | | | Year ended |
| | | July 31, | | | | July 31, |
| | | 2005 | | | | 2004 |
| Increase (Decrease) in Net Assets | | | | | | |
| Operations | | | | | | |
| Net investment income (loss) | | $ (591,417) | | $ | | (914,183) |
| Net realized gain (loss) | | (807,962) | | | | 5,034,435 |
| Change in net unrealized appreciation (depreciation) | | 9,643,693 | | | | (4,664,426) |
| Net increase (decrease) in net assets resulting from operations | | 8,244,314 | | | | (544,174) |
| Share transactions -- net increase (decrease) | | (9,174,490) | | | | (1,655,023) |
| Redemption fees | | 6,058 | | | | 26,533 |
| Total increase (decrease) in net assets | | (924,118) | | | | (2,172,664) |
| |
| Net Assets | | | | | | |
| Beginning of period | | 45,326,198 | | | | 47,498,862 |
| End of period | | $ 44,402,080 | | $ | | 45,326,198 |
| Financial Highlights — Class A | | | | | | | | | | |
| Years ended July 31, | | 2005 | | 2004 | | 2003 | | 2002 | | 2001F |
| Selected Per-Share Data | | | | | | | | | | |
| Net asset value, beginning of period | | $ 6.58 | | $ 6.59 | | $ 5.57 | | $ 9.62 | | $ 10.00 |
| Income from Investment Operations | | | | | | | | | | |
| Net investment income (loss)E | | (.07) | | (.09) | | (.06) | | (.10) | | (.04) |
| Net realized and unrealized gain (loss) | | 1.53 | | .08 | | 1.07 | | (3.96) | | (.35) |
| Total from investment operations | | 1.46 | | (.01) | | 1.01 | | (4.06) | | (.39) |
| Redemption fees added to paid in capitalE | | —H | | —H | | .01 | | .01 | | .01 |
| Net asset value, end of period | | $ 8.04 | | $ 6.58 | | $ 6.59 | | $ 5.57 | | $ 9.62 |
| Total ReturnB,C,D | | 22.19% | | (.15)% | | 18.31% | | (42.10)% | | (3.80)% |
| Ratios to Average Net AssetsG | | | | | | | | | | |
| Expenses before expense reductions | | 1.59% | | 1.55% | | 1.89% | | 1.68% | | 2.57%A |
| Expenses net of voluntary waivers, if any | | 1.45% | | 1.50% | | 1.50% | | 1.50% | | 1.50%A |
| Expenses net of all reductions | | 1.38% | | 1.48% | | 1.46% | | 1.49% | | 1.49%A |
| Net investment income (loss) | | (.96)% | | (1.15)% | | (1.09)% | | (1.14)% | | (.77)%A |
| Supplemental Data | | | | | | | | | | |
| Net assets, end of period (000 omitted) | | $ 11,397 | | $ 8,374 | | $ 8,116 | | $ 4,912 | | $ 3,400 |
| Portfolio turnover rate | | 128% | | 84% | | 66% | | 58% | | 98%A |
A Annualized
B Total returns for periods of less than one year are not annualized.
C Total returns would have been lower had certain expenses not been reduced during the periods shown. D Total returns do not include the effect of the sales charges.
E Calculated based on average shares outstanding during the period.
F For the period December 27, 2000 (commencement of operations) to July 31, 2001.
G Expense ratios reflect operating expenses of the class. Expenses before reductions do not reflect amounts reimbursed by the investment adviser or reductions from brokerage service arrangements or other expense offset arrangements and do not represent the amount paid by the class during periods when reimbursements or reductions occur. Expense ratios before reductions for start up periods may not be representative of longer term operating periods. Expenses net of any voluntary waivers reflect expenses after reimbursement by the investment adviser but prior to reductions from brokerage service arrangements or other expense offset arrangements. Expenses net of all reductions represent the net expenses paid by the class. H Amount represents less than $.01 per share.
See accompanying notes which are an integral part of the financial statements.
A-71 Annual Report
| Financial Highlights — Class T | | | | | | | | | | |
| Years ended July 31, | | 2005 | | 2004 | | 2003 | | 2002 | | 2001F |
| Selected Per-Share Data | | | | | | | | | | |
| Net asset value, beginning of period | | $ 6.53 | | $ 6.56 | | $ 5.55 | | $ 9.62 | | $ 10.00 |
| Income from Investment Operations | | | | | | | | | | |
| Net investment income (loss)E | | (.08) | | (.11) | | (.07) | | (.12) | | (.06) |
| Net realized and unrealized gain (loss) | | 1.51 | | .08 | | 1.07 | | (3.96) | | (.33) |
| Total from investment operations | | 1.43 | | (.03) | | 1.00 | | (4.08) | | (.39) |
| Redemption fees added to paid in capitalE | | —H | | —H | | .01 | | .01 | | .01 |
| Net asset value, end of period | | $ 7.96 | | $ 6.53 | | $ 6.56 | | $ 5.55 | | $ 9.62 |
| Total ReturnB,C,D | | 21.90% | | (.46)% | | 18.20% | | (42.31)% | | (3.80)% |
| Ratios to Average Net AssetsG | | | | | | | | | | |
| Expenses before expense reductions | | 1.89% | | 1.83% | | 2.14% | | 1.91% | | 2.81%A |
| Expenses net of voluntary waivers, if any | | 1.69% | | 1.75% | | 1.75% | | 1.75% | | 1.75%A |
| Expenses net of all reductions | | 1.61% | | 1.72% | | 1.71% | | 1.74% | | 1.74%A |
| Net investment income (loss) | | (1.20)% | | (1.39)% | | (1.33)% | | (1.39)% | | (1.02)%A |
| Supplemental Data | | | | | | | | | | |
| Net assets, end of period (000 omitted) | | $ 12,085 | | $ 15,445 | | $ 14,362 | | $ 11,615 | | $ 11,493 |
| Portfolio turnover rate | | 128% | | 84% | | 66% | | 58% | | 98%A |
A Annualized
B Total returns for periods of less than one year are not annualized.
C Total returns would have been lower had certain expenses not been reduced during the periods shown.
D Total returns do not include the effect of the sales charges.
E Calculated based on average shares outstanding during the period.
F For the period December 27, 2000 (commencement of operations) to July 31, 2001.
G Expense ratios reflect operating expenses of the class. Expenses before reductions do not reflect amounts reimbursed by the investment adviser or reductions from brokerage service arrangements or other expense offset arrangements and do not
represent the amount paid by the class during periods when reimbursements or reductions occur. Expense ratios before reductions for start up periods may not be representative of longer term operating periods. Expenses net of any voluntary
waivers reflect expenses after reimbursement by the investment adviser but prior to reductions from brokerage service arrangements or other expense offset arrangements. Expenses net of all reductions represent the net expenses paid by the class.
H Amount represents less than $.01 per share.
|
| Financial Highlights — Class B | | | | | | | | | | |
| Years ended July 31, | | 2005 | | 2004 | | 2003 | | 2002 | | 2001F |
| Selected Per-Share Data | | | | | | | | | | |
| Net asset value, beginning of period | | $ 6.42 | | $ 6.48 | | $ 5.52 | | $ 9.60 | | $ 10.00 |
| Income from Investment Operations | | | | | | | | | | |
| Net investment income (loss)E | | (.12) | | (.14) | | (.10) | | (.16) | | (.08) |
| Net realized and unrealized gain (loss) | | 1.48 | | .08 | | 1.06 | | (3.93) | | (.33) |
| Total from investment operations | | 1.36 | | (.06) | | .96 | | (4.09) | | (.41) |
| Redemption fees added to paid in capitalE | | —H | | —H | | —H | | .01 | | .01 |
| Net asset value, end of period | | $ 7.78 | | $ 6.42 | | $ 6.48 | | $ 5.52 | | $ 9.60 |
| Total ReturnB,C,D | | 21.18% | | (.93)% | | 17.39% | | (42.50)% | | (4.00)% |
| Ratios to Average Net AssetsG | | | | | | | | | | |
| Expenses before expense reductions | | 2.41% | | 2.41% | | 2.76% | | 2.43% | | 3.34%A |
| Expenses net of voluntary waivers, if any | | 2.21% | | 2.25% | | 2.25% | | 2.25% | | 2.25%A |
| Expenses net of all reductions | | 2.13% | | 2.23% | | 2.21% | | 2.24% | | 2.24%A |
| Net investment income (loss) | | (1.72)% | | (1.90)% | | (1.83)% | | (1.89)% | | (1.52)%A |
| Supplemental Data | | | | | | | | | | |
| Net assets, end of period (000 omitted) | | $ 8,963 | | $ 8,498 | | $ 11,335 | | $ 8,362 | | $ 10,941 |
| Portfolio turnover rate | | 128% | | 84% | | 66% | | 58% | | 98%A |
A Annualized
B Total returns for periods of less than one year are not annualized.
C Total returns would have been lower had certain expenses not been reduced during the periods shown.
D Total returns do not include the effect of the contingent deferred sales charge.
E Calculated based on average shares outstanding during the period.
F For the period December 27, 2000 (commencement of operations) to July 31, 2001.
G Expense ratios reflect operating expenses of the class. Expenses before reductions do not reflect amounts reimbursed by the investment adviser or reductions from brokerage service arrangements or other expense offset arrangements and do not
represent the amount paid by the class during periods when reimbursements or reductions occur. Expense ratios before reductions for start up periods may not be representative of longer term operating periods. Expenses net of any voluntary
waivers reflect expenses after reimbursement by the investment adviser but prior to reductions from brokerage service arrangements or other expense offset arrangements. Expenses net of all reductions represent the net expenses paid by the class.
H Amount represents less than $.01 per share.
|
See accompanying notes which are an integral part of the financial statements.
Electronics A-72
|
| Financial Highlights — Class C | | | | | | | | | | |
| Years ended July 31, | | 2005 | | 2004 | | 2003 | | 2002 | | 2001F |
| Selected Per-Share Data | | | | | | | | | | |
| Net asset value, beginning of period | | $ 6.41 | | $ 6.47 | | $ 5.51 | | $ 9.59 | | $ 10.00 |
| Income from Investment Operations | | | | | | | | | | |
| Net investment income (loss)E | | (.11) | | (.14) | | (.10) | | (.16) | | (.09) |
| Net realized and unrealized gain (loss) | | 1.47 | | .08 | | 1.06 | | (3.93) | | (.33) |
| Total from investment operations | | 1.36 | | (.06) | | .96 | | (4.09) | | (.42) |
| Redemption fees added to paid in capitalE | | —H | | —H | | —H | | .01 | | .01 |
| Net asset value, end of period | | $ 7.77 | | $ 6.41 | | $ 6.47 | | $ 5.51 | | $ 9.59 |
| Total ReturnB,C,D | | 21.22% | | (.93)% | | 17.42% | | (42.54)% | | (4.10)% |
| Ratios to Average Net AssetsG | | | | | | | | | | |
| Expenses before expense reductions | | 2.31% | | 2.24% | | 2.52% | | 2.34% | | 3.25%A |
| Expenses net of voluntary waivers, if any | | 2.18% | | 2.24% | | 2.25% | | 2.25% | | 2.25%A |
| Expenses net of all reductions | | 2.11% | | 2.21% | | 2.21% | | 2.24% | | 2.24%A |
| Net investment income (loss) | | (1.69)% | | (1.88)% | | (1.83)% | | (1.89)% | | (1.52)%A |
| Supplemental Data | | | | | | | | | | |
| Net assets, end of period (000 omitted) | | $ 11,058 | | $ 12,322 | | $ 13,061 | | $ 9,921 | | $ 10,782 |
| Portfolio turnover rate | | 128% | | 84% | | 66% | | 58% | | 98%A |
A Annualized
B Total returns for periods of less than one year are not annualized.
C Total returns would have been lower had certain expenses not been reduced during the periods shown.
D Total returns do not include the effect of the contingent deferred sales charge.
E Calculated based on average shares outstanding during the period.
F For the period December 27, 2000 (commencement of operations) to July 31, 2001.
G Expense ratios reflect operating expenses of the class. Expenses before reductions do not reflect amounts reimbursed by the investment adviser or reductions from brokerage service arrangements or other expense offset arrangements and do not
represent the amount paid by the class during periods when reimbursements or reductions occur. Expense ratios before reductions for start up periods may not be representative of longer term operating periods. Expenses net of any voluntary
waivers reflect expenses after reimbursement by the investment adviser but prior to reductions from brokerage service arrangements or other expense offset arrangements. Expenses net of all reductions represent the net expenses paid by the class.
H Amount represents less than $.01 per share.
|
| Financial Highlights — Institutional Class | | | | | | | | | | |
| Years ended July 31, | | 2005 | | 2004 | | 2003 | | 2002 | | 2001E |
| Selected Per-Share Data | | | | | | | | | | |
| Net asset value, beginning of period | | $ 6.65 | | $ 6.64 | | $ 5.60 | | $ 9.64 | | $ 10.00 |
| Income from Investment Operations | | | | | | | | | | |
| Net investment income (loss)D | | (.05) | | (.06) | | (.04) | | (.08) | | (.03) |
| Net realized and unrealized gain (loss) | | 1.55 | | .07 | | 1.07 | | (3.97) | | (.34) |
| Total from investment operations | | 1.50 | | .01 | | 1.03 | | (4.05) | | (.37) |
| Redemption fees added to paid in capitalD | | —G | | —G | | .01 | | .01 | | .01 |
| Net asset value, end of period | | $ 8.15 | | $ 6.65 | | $ 6.64 | | $ 5.60 | | $ 9.64 |
| Total ReturnB,C | | 22.56% | | .15% | | 18.57% | | (41.91)% | | (3.60)% |
| Ratios to Average Net AssetsF | | | | | | | | | | |
| Expenses before expense reductions | | 1.16% | | 1.12% | | 1.46% | | 1.31% | | 2.16%A |
| Expenses net of voluntary waivers, if any | | 1.16% | | 1.12% | | 1.25% | | 1.25% | | 1.25%A |
| Expenses net of all reductions | | 1.08% | | 1.09% | | 1.21% | | 1.24% | | 1.24%A |
| Net investment income (loss) | | (.67)% | | (.76)% | | (.84)% | | (.89)% | | (.52)%A |
| Supplemental Data | | | | | | | | | | |
| Net assets, end of period (000 omitted) | | $ 899 | | $ 687 | | $ 625 | | $ 1,184 | | $ 622 |
| Portfolio turnover rate | | 128% | | 84% | | 66% | | 58% | | 98%A |
A Annualized
B Total returns for periods of less than one year are not annualized.
C Total returns would have been lower had certain expenses not been reduced during the periods shown.
D Calculated based on average shares outstanding during the period.
E For the period December 27, 2000 (commencement of operations) to July 31, 2001.
F Expense ratios reflect operating expenses of the class. Expenses before reductions do not reflect amounts reimbursed by the investment adviser or reductions from brokerage service arrangements or other expense offset arrangements and do not
represent the amount paid by the class during periods when reimbursements or reductions occur. Expense ratios before reductions for start up periods may not be representative of longer term operating periods. Expenses net of any voluntary
waivers reflect expenses after reimbursement by the investment adviser but prior to reductions from brokerage service arrangements or other expense offset arrangements. Expenses net of all reductions represent the net expenses paid by the class.
G Amount represents less than $.01 per share.
|
See accompanying notes which are an integral part of the financial statements.
|
Notes to Financial Statements
For the period ended July 31, 2005
|
1. Significant Accounting Policies.
|
Fidelity Advisor Electronics Fund (the fund) is a non-diversified fund of Fidelity Advisor Series VII (the trust) and is authorized to issue an unlimited number of shares. The trust is registered under the Investment Company Act of 1940, as amended (the 1940 Act), as an open-end management investment company organized as a Massachusetts business trust.
The fund offers Class A, Class T, Class B, Class C and Institutional Class shares, each of which has equal rights as to assets and voting privileges. Each class has exclusive voting rights with respect to matters that affect that class. Class B shares will automatically convert to Class A shares after a holding period of seven years from the initial date of purchase. Investment income, realized and unrealized capital gains and losses, the common expenses of the fund, and certain fund-level expense reductions, if any, are allocated on a pro rata basis to each class based on the relative net assets of each class to the total net assets of the fund. Each class differs with respect to transfer agent and distribution and service plan fees incurred. Certain expense reductions also differ by class.
The financial statements have been prepared in conformity with accounting principles generally accepted in the United States of America, which require management to make certain estimates and assumptions at the date of the financial statements. The following summarizes the significant accounting policies of the fund:
Security Valuation. Net asset value per share (NAV calculation) is calculated as of the close of business of the New York Stock Exchange, normally 4:00 p.m. Eastern time. Equity securities, including restricted securities, for which market quotations are available are valued at the last sale price or official closing price (closing bid price or last evaluated quote if no sale has occurred) on the primary market or exchange on which they trade. If prices are not readily available or do not accurately reflect fair value for a security, or if a security’s value has been materially affected by events occurring after the close of the exchange or market on which the security is principally traded, that security may be valued by another method that the Board of Trustees believes accurately reflects fair value. A security’s valuation may differ depending on the method used for determining value. Price movements in futures contracts and ADRs, market and trading trends, the bid/ask quotes of brokers and off-exchange institutional trading may be reviewed in the course of making a good faith determination of a security’s fair value. Short-term securities with remaining maturities of sixty days or less for which quotations are not readily available are valued on the basis of amortized cost. Investments in open-end investment companies are valued at their net asset value each business day.
Foreign Currency. The fund uses foreign currency contracts to facilitate transactions in foreign-denominated securities. Losses from these transactions may arise from changes in the value of the foreign currency or if the counterparties do not perform under the contracts’ terms.
Foreign-denominated assets, including investment securities, and liabilities are translated into U.S. dollars at the exchange rate at period end. Purchases and sales of investment securities, income and dividends received and expenses denominated in foreign currencies are translated into U.S. dollars at the exchange rate in effect on the transaction date.
The effects of exchange rate fluctuations on investments are included with the net realized and unrealized gain (loss) on investment securities. Other foreign currency transactions resulting in realized and unrealized gain (loss) are disclosed separately.
Investment Transactions and Income. Security transactions are accounted for as of trade date. Gains and losses on securities sold are determined on the basis of identified cost and may include proceeds received from litigation. Dividend income is recorded on the ex-dividend date, except for certain dividends from foreign securities where the ex-dividend date may have passed, which are recorded as soon as the fund is informed of the ex-dividend date. Non-cash dividends included in dividend income, if any, are recorded at the fair market value of the securities received. Interest income is accrued as earned. Interest income includes coupon interest and amortization of premium and accretion of discount on debt securities. Investment income is recorded net of foreign taxes withheld where recovery of such taxes is uncertain.
Expenses. Most expenses of the trust can be directly attributed to a fund. Expenses which cannot be directly attributed are apportioned among each fund in the trust.
Income Tax Information and Distributions to Shareholders. Each year, the fund intends to qualify as a regulated investment company by distributing all of its taxable income and realized gains under Subchapter M of the Internal Revenue Code. As a result, no provision for income taxes is required in the accompanying financial statements. Foreign taxes are provided for based on the fund’s understanding of the tax rules and rates that exist in the foreign markets in which it invests.
Distributions are recorded on the ex-dividend date. Income dividends and capital gain distributions are declared separately for each class. Income and capital gain distributions are determined in accordance with income tax regulations, which may differ from generally accepted accounting principles. Capital accounts within the financial statements are adjusted for permanent book-tax differences. These adjustments have no impact on net assets or the results of operations. Temporary book-tax differences will reverse in a subsequent period.
Book-tax differences are primarily due to foreign currency transactions, capital loss carryforwards and losses deferred due to wash sales and excise tax regulations.
1. Significant Accounting Policies - continued
Income Tax Information and Distributions to Shareholders - continued
The tax-basis components of distributable earnings and the federal tax cost as of period end were as follows:
|
| Unrealized appreciation | | $ 4,286,621 |
| Unrealized depreciation | | (1,607,945) |
| Net unrealized appreciation (depreciation) | | 2,678,676 |
| Capital loss carryforward | | (14,245,984) |
| |
| Cost for federal income tax purposes | | $ 41,249,559 |
Short-Term Trading (Redemption) Fees. Shares held in the fund less than 60 days are subject to a redemption fee equal to 1.00% of the proceeds of the redeemed shares. All redemption fees, including any estimated redemption fees paid by Fidelity Management & Research Company (FMR), are retained by the fund and accounted for as an addition to paid in capital.
Repurchase Agreements. FMR has received an Exemptive Order from the Securities and Exchange Commission (the SEC) which permits the fund and other affiliated entities of FMR to transfer uninvested cash balances into joint trading accounts which are then invested in repurchase agreements. The fund may also invest directly with institutions in repurchase agreements. Repurchase agreements are collateralized by government or non-government securities. Collateral is held in segregated accounts with custodian banks and may be obtained in the event of a default of the counterparty. The fund monitors, on a daily basis, the value of the collateral to ensure it is at least equal to the principal amount of the repurchase agreement (including accrued interest). In the event of a default by the counterparty, realization of the collateral proceeds could be delayed, during which time the value of the collateral may decline.
3. Purchases and Sales of Investments.
Purchases and sales of securities, other than short-term securities and U.S. government securities, aggregated $53,086,584 and $61,948,413, respectively.
4. Fees and Other Transactions with Affiliates.
Management Fee. FMR and its affiliates provide the fund with investment management related services for which the fund pays a monthly management fee. The management fee is the sum of an individual fund fee rate that is based on an annual rate of .30% of the fund’s average net assets and a group fee rate that averaged .27% during the period. The group fee rate is based upon the average net assets of all the mutual funds advised by FMR. The group fee rate decreases as assets under management increase and increases as assets under management decrease. For the period, the total annual management fee rate was .57% of the fund’s average net assets.
Distribution and Service Plan. In accordance with Rule 12b-1 of the 1940 Act, the fund has adopted separate Distribution and Service Plans for each class of shares. Certain classes pay Fidelity Distributors Corporation (FDC), an affiliate of FMR, separate Distribution and Service Fees, each of which is based on an annual percentage of each class’ average net assets. In addition, FDC may pay financial intermediaries for selling shares of the fund and providing shareholder support services. For the period, the Distribution and Service Fee rates and the total amounts paid to and retained by FDC were as follows:
| | | Distribution | | Service | | | | Paid to | | | | Retained |
| | | Fee | | Fee | | | | FDC | | | | by FDC |
| Class A | | 0% | | .25% | | $ | | 21,342 | | $ | | 73 |
| Class T | | 25% | | .25% | | | | 68,576 | | | | 170 |
| Class B | | 75% | | .25% | | | | 89,990 | | | | 67,543 |
| Class C | | 75% | | .25% | | | | 109,421 | | | | 16,312 |
| |
| | | | | | | $ | | 289,329 | | $ | | 84,098 |
Sales Load. FDC receives a front-end sales charge of up to 5.75% for selling Class A shares, and 3.50% for selling Class T shares, some of which is paid to financial intermediaries for selling shares of the fund. FDC receives the proceeds of contingent deferred sales charges levied on Class A, Class T, Class B, and Class C redemptions. These charges depend on the holding period. The deferred sales charges range from 5% to 1% for Class B, 1% for Class C, and .25% for certain purchases of Class A and Class T shares.
| | Notes to Financial Statements - continued
4. Fees and Other Transactions with Affiliates - continued
Sales Load - continued
For the period, sales charge amounts retained by FDC were as follows:
|
| | | | | Retained |
| | | | | by FDC |
| Class A | | $ | | 5,196 |
| Class T | | | | 4,930 |
| Class B* | | | | 50,880 |
| Class C* | | | | 3,634 |
| | | $ | | 64,640 |
* When Class B and Class C shares are initially sold, FDC pays commissions from its own resources to financial intermediaries through which the sales are made.
Transfer Agent Fees. Fidelity Investments Institutional Operations Company, Inc. (FIIOC), an affiliate of FMR, is the transfer, dividend disbursing and shareholder servicing agent for each class of the fund. FIIOC receives account fees and asset-based fees that vary according to the account size and type of account of the shareholders of the respective classes of the fund. FIIOC pays for typesetting, printing and mailing of shareholder reports, except proxy statements. For the period the total transfer agent fees paid by each class to FIIOC, were as follows:
| | | | | | | % of |
| | | | | | | Average |
| | | | | Amount | | Net Assets |
| Class A | | $ | | 37,796 | | .44 |
| Class T | | | | 67,154 | | .49 |
| Class B | | | | 45,992 | | .51 |
| Class C | | | | 44,906 | | .41 |
| Institutional Class | | | | 1,976 | | .26 |
| |
| | | $ | | 197,824 | | |
Accounting and Security Lending Fees. Fidelity Service Company, Inc. (FSC), an affiliate of FMR, maintains the fund’s accounting records. The accounting fee is based on the level of average net assets for the month. Under a separate contract, FSC administers the security lending program. The security lending fee is based on the number and duration of lending transactions.
Central Funds. The fund may invest in affiliated Central Funds managed by Fidelity Investments Money Management, Inc. (FIMM), an affiliate of FMR. The Central Funds are open-end investment companies available only to investment companies and other accounts managed by FMR and its affiliates. The Money Market Central Funds seek preservation of capital and current income. The Central Funds do not pay a management fee. Income distributions earned by the fund are recorded as income in the accompanying financial statements and totaled $32,059 for the period.
Brokerage Commissions. The fund placed a portion of its portfolio transactions with brokerage firms which are affiliates of the investment adviser. The commissions paid to these affiliated firms were $9,910 for the period.
| | 5. Committed Line of Credit.
|
The fund participates with other funds managed by FMR in a $4.2 billion credit facility (the “line of credit”) to be utilized for temporary or emergency purposes to fund shareholder redemptions or for other short-term liquidity purposes. The fund has agreed to pay commitment fees on its pro rata portion of the line of credit. During the period, there were no borrowings on this line of credit.
The fund lends portfolio securities from time to time in order to earn additional income. The fund receives collateral (in the form of U.S. Treasury obligations, letters of credit and/or cash) against the loaned securities and maintains collateral in an amount not less than 100% of the market value of the loaned securities during the period of the loan. The market value of the loaned securities is determined at the close of business of the fund and any additional required collateral is delivered to the fund on the next business day. If the borrower defaults on its obligation to return the securities loaned because of insolvency or other reasons, a fund could experience delays and costs in recovering the securities loaned or in gaining access to the collateral. Cash collateral is invested in the Fidelity Securities Lending Cash Central Fund. At period end there were no security loans outstanding.
| | FMR voluntarily agreed to reimburse each class to the extent annual operating expenses exceeded certain levels of average net assets as noted in the
table below. Some expenses, for example interest expense, are excluded from this reimbursement.
The following classes were in reimbursement during the period:
|
| | | Expense | | | | Reimbursement |
| | | Limitations | | | | from adviser |
| Class A | | 1.50 | | -- 1.40%* | | $ | | 11,754 |
| Class T | | 1.75 | | -- 1.65%* | | | | 27,318 |
| Class B | | 2.25 | | -- 2.15%* | | | | 18,231 |
| Class C | | 2.25 | | -- 2.15%* | | | | 13,396 |
| Institutional Class | | 1.25 | | -- 1.15%* | | | | 21 |
| |
| | | | | | | $ | | 70,720 |
* Expense limitation in effect at period end.
Many of the brokers with whom FMR places trades on behalf of the fund provided services to the fund in addition to trade execution. These services
included payments of certain expenses on behalf of the fund totaling $32,202 for the period. In addition, through arrangements with the fund’s custo
dian, credits realized as a result of uninvested cash balances were used to reduce the fund’s expenses. During the period, these credits reduced the
fund’s custody expenses by $419.
|
The fund’s organizational documents provide former and current trustees and officers with a limited indemnification against liabilities arising in connection with the performance of their duties to the fund. In the normal course of business, the fund may also enter into contracts that provide general indemnifications. The fund’s maximum exposure under these arrangements is unknown as this would be dependent on future claims that may be made against the fund. The risk of material loss from such claims is considered remote.
9. Share Transactions.
Transactions for each class of shares were as follows:
| | | | | Shares | | | | Dollars |
| Years ended July 31, | | 2005 | | 2004 | | 2005 | | | | 2004 |
| Class A | | | | | | | | | | |
| Shares sold | | 810,216 | | 1,163,033 | | $ 5,985,601 | | $ | | 9,193,928 |
| Shares redeemed | | (665,267) | | (1,121,519) | | (4,709,912) | | | | (8,464,153) |
| Net increase (decrease) | | 144,949 | | 41,514 | | $ 1,275,689 | | $ | | 729,775 |
| Class T | | | | | | | | | | |
| Shares sold | | 393,825 | | 880,005 | | $ 2,720,747 | | $ | | 6,765,488 |
| Shares redeemed | | (1,240,792) | | (704,477) | | (8,651,718) | | | | (5,391,404) |
| Net increase (decrease) | | (846,967) | | 175,528 | | $ (5,930,971) | | $ | | 1,374,084 |
| Class B | | | | | | | | | | |
| Shares sold | | 424,624 | | 538,613 | | $ 2,916,025 | | $ | | 4,191,366 |
| Shares redeemed | | (596,931) | | (963,986) | | (4,165,250) | | | | (7,331,908) |
| Net increase (decrease) | | (172,307) | | (425,373) | | $ (1,249,225) | | $ | | (3,140,542) |
| Class C | | | | | | | | | | |
| Shares sold | | 482,588 | | 604,856 | | $ 3,305,584 | | $ | | 4,611,449 |
| Shares redeemed | | (982,233) | | (701,380) | | (6,627,459) | | | | (5,302,803) |
| Net increase (decrease) | | (499,645) | | (96,524) | | $ (3,321,875) | | $ | | (691,354) |
| Institutional Class | | | | | | | | | | |
| Shares sold | | 28,776 | | 63,253 | | $ 204,413 | | $ | | 495,615 |
| Shares redeemed | | (21,842) | | (54,003) | | (152,521) | | | | (422,601) |
| Net increase (decrease) | | 6,934 | | 9,250 | | $ 51,892 | | $ | | 73,014 |
Advisor Financial Services Fund
Average annual total return reflects the change in the value of an investment, assuming reinvestment of the class’ dividend income and capital gains (the profits earned upon the sale of securities that have grown in value) and assuming a constant rate of performance each year. The $10,000 table and the fund’s returns do not reflect the deduction of taxes that a shareholder would pay on fund distributions or the redemption of fund shares. During periods of reimbursement by Fidelity, a fund’s total return will be greater than it would be had the reimbursement not occurred. How a fund did yesterday is no guarantee of how it will do tomorrow.
| Average Annual Total Returns | | | | |
| Periods ended July 31, 2005 | | Past 1 | | Past 5 | | Life of |
| | | year | | years | | fundA |
| Institutional Class | | 13.06% | | 7.45% | | 12.81% |
| |
| A From September 3, 1996. | | | | | | |
| | $10,000 Over Life of Fund
|
Let’s say hypothetically that $10,000 was invested in Fidelity Advisor Financial Services Fund — Institutional Class on September 3, 1996, when the fund started. The chart shows how the value of your investment would have changed, and also shows how the S&P 500 Index performed over the same period.
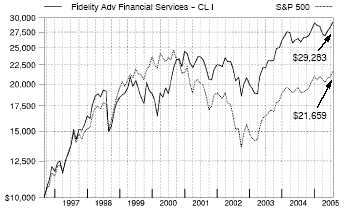
Advisor Financial Services Fund
|
Management’s Discussion of Fund Performance
Comments from Charles Hebard, who became Portfolio Manager of Fidelity Advisor® Financial Services Fund on May 2, 2005
A late-inning rally on Wall Street helped push some key U.S. equity indexes to four-year highs by the conclusion of the 12-month period ending July 31, 2005. Spurred on by bullish economic data and strong corporate earnings, investors enjoyed a stellar month of July, capping off a turbulent 12-month period for U.S. equity markets. Stock prices bounced up and down during most of the year, moving in cadence with gyrations in the price of crude oil and investors’ gathering and ebbing concerns about inflation. The Federal Reserve Board raised short-term interest rates eight times during the period, also affecting overall market sentiment. Despite their fluctuations, the major equity indexes finished on a high note, with the Standard & Poor’s 500SM Index and the NASDAQ Composite® Index posting gains of 14.05% and 16.51%, respectively, for the period. The small-cap Russell 2000® Index rose 24.78% and the Russell Midcap® Index jumped 28.93%, while the blue-chips’ Dow Jones Industrial Average advanced only 7.29% .
For the 12 months that ended July 31, 2005, Fidelity Advisor Financial Services Fund’s Institutional Class shares had a total return of 13.06%, trailing the S&P 500® and the 14.33% return of the Goldman Sachs® Financial Services Index. The fund trailed the Goldman Sachs index largely because it was underweighted in real estate investment trusts (REITs), which strongly outperformed other financials. We continued to avoid this industry because of concerns about the vulnerability of REITs to potential interest rate increases. In terms of individual holdings, Asset Acceptance Capital, a company that specializes in buying consumer receivables from banks and other institutions and then collecting on the balances, reported excellent earnings and was a significant positive contributor relative to the sector index. Also supporting performance was our investment in Archipelago Holdings, which operates an electronic trading system and which announced a merger with the New York Stock Exchange. We no longer held the position at the end of the period. Another boost came from timely trading in brokerage firm Morgan Stanley, while an investment in Endurance Specialty Holdings, a Bermuda-based reinsurance company, also helped. By contrast, a leading detractor from relative performance was First Marblehead. While its student-loan securitizing business continued to produce good earnings growth, investors were concerned about its longer-term outlook. Insurance giant Ameri-can International Group, which we overweighted, retreated because of regulatory investigations into its accounting. Underweighting or not owning auto insurers Allstate and Progressive — two components of the index — also held back performance as they exceeded earnings estimates because of better-than-expected claims trends.
The views expressed in this statement reflect those of the portfolio manager only through the end of the period of the report as stated on the cover and do not necessarily represent the views of Fidelity or any other person in the Fidelity organization. Any such views are subject to change at any time based upon market or other conditions and Fidelity disclaims any responsibility to update such views. These views may not be relied on as investment advice and, because investment decisions for a Fidelity fund are based on numerous factors, may not be relied on as an indication of trading intent on behalf of any Fidelity fund.
Advisor Financial Services Fund
Shareholder Expense Example
|
As a shareholder of the Fund, you incur two types of costs: (1) transaction costs, including sales charges (loads) on purchase payments or redemption proceeds, redemption fees, and (2) ongoing costs, including management fees, distribution and/or service (12b-1) fees and other Fund expenses. This Example is intended to help you understand your ongoing costs (in dollars) of investing in the Fund and to compare these costs with the ongoing costs of investing in other mutual funds.
The Example is based on an investment of $1,000 invested at the beginning of the period and held for the entire period (February 1, 2005 to July 31, 2005).
The first line of the table below for each class of the Fund provides information about actual account values and actual expenses. You may use the information in this line, together with the amount you invested, to estimate the expenses that you paid over the period. Simply divide your account value by $1,000.00 (for example, an $8,600 account value divided by $1,000.00 = 8.6), then multiply the result by the number in the first line for a class of the Fund under the heading entitled “Expenses Paid During Period” to estimate the expenses you paid on your account during this period.
Hypothetical Example for Comparison Purposes
|
The second line of the table below for each class of the Fund provides information about hypothetical account values and hypothetical expenses based on a Class’ actual expense ratio and an assumed rate of return of 5% per year before expenses, which is not the Class’ actual return. The hypothetical account values and expenses may not be used to estimate the actual ending account balance or expenses you paid for the period. You may use this information to compare the ongoing costs of investing in the Fund and other funds. To do so, compare this 5% hypothetical example with the 5% hypothetical examples that appear in the shareholder reports of the other funds.
Please note that the expenses shown in the table are meant to highlight your ongoing costs only and do not reflect any transaction costs. Therefore, the second line of the table is useful in comparing ongoing costs only, and will not help you determine the relative total costs of owning different funds. In addition, if these transactional costs were included, your costs would have been higher.
| | | | | | | | | | | Expenses Paid |
| | | Beginning | | | | Ending | | | | During Period* |
| | | Account Value | | | | Account Value | | | | February 1, 2005 |
| | | February 1, 2005 | | | | July 31, 2005 | | | | to July 31, 2005 |
| Class A | | | | | | | | | | |
| Actual | | $ 1,000.00 | | $ | | 1,021.30 | | $ | | 6.31 |
| HypotheticalA | | $ 1,000.00 | | $ | | 1,018.55 | | $ | | 6.31 |
| Class T | | | | | | | | | | |
| Actual | | $ 1,000.00 | | $ | | 1,020.10 | | $ | | 7.46 |
| HypotheticalA | | $ 1,000.00 | | $ | | 1,017.41 | | $ | | 7.45 |
| Class B | | | | | | | | | | |
| Actual | | $ 1,000.00 | | $ | | 1,017.80 | | $ | | 10.01 |
| HypotheticalA | | $ 1,000.00 | | $ | | 1,014.88 | | $ | | 9.99 |
| Class C | | | | | | | | | | |
| Actual | | $ 1,000.00 | | $ | | 1,017.80 | | $ | | 9.76 |
| HypotheticalA | | $ 1,000.00 | | $ | | 1,015.12 | | $ | | 9.74 |
| Institutional Class | | | | | | | | | | |
| Actual | | $ 1,000.00 | | $ | | 1,023.30 | | $ | | 4.31 |
| HypotheticalA | | $ 1,000.00 | | $ | | 1,020.53 | | $ | | 4.31 |
| |
| A 5% return per year before expenses | | | | | | | | | | |
* Expenses are equal to each Class’ annualized expense ratio (shown in the table below); multiplied by the average account value over the period, multiplied by 181/365 (to reflect the one-half year period).
| | | Annualized |
| | | Expense Ratio |
| Class A | | 1.26% |
| Class T | | 1.49% |
| Class B | | 2.00% |
| Class C | | 1.95% |
| Institutional Class | | 86% |
| | Advisor Financial Services Fund
Investment Changes
|
| Top Ten Stocks as of July 31, 2005 | | |
| | | % of fund’s | | % of fund’s net assets |
| | | net assets | | 6 months ago |
| American International Group, | | | | |
| Inc. | | 9.3 | | 8.5 |
| Bank of America Corp. | | 5.7 | | 9.2 |
| JPMorgan Chase & Co. | | 4.8 | | 3.8 |
| Merrill Lynch & Co., Inc. | | 4.6 | | 4.8 |
| Wells Fargo & Co. | | 4.6 | | 2.7 |
| American Express Co. | | 4.4 | | 3.7 |
| Wachovia Corp. | | 3.0 | | 4.4 |
| General Electric Co. | | 2.2 | | 1.4 |
| Citigroup, Inc. | | 2.1 | | 2.3 |
| ACE Ltd. | | 2.0 | | 1.7 |
| | | 42.7 | | |
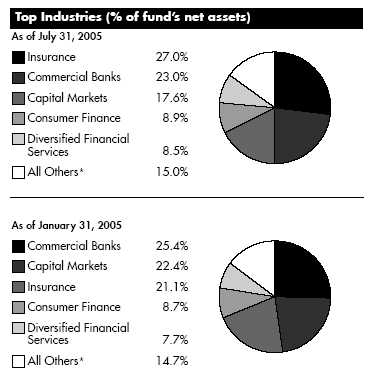
| | * Includes short term investments and net other assets.
Prior period industry classifications reflect the categories in place as of the date
indicated and have not been adjusted to reflect current industry classifications.
|
A-81 Annual Report
Advisor Financial Services Fund
Investments July 31, 2005
Showing Percentage of Net Assets
| Common Stocks — 99.6% | | | | | | |
| | | Shares | | Value (Note 1) |
| |
| CAPITAL MARKETS – 17.6% | | | | | | |
| Asset Management & Custody Banks – 4.3% | | | | | | |
| American Capital Strategies Ltd. | | 12,100 | | $ | | 455,323 |
| Bank of New York Co., Inc. | | 45,760 | | | | 1,408,493 |
| Calamos Asset Management, Inc. | | | | | | |
| Class A | | 15,400 | | | | 444,136 |
| Federated Investors, Inc. Class B | | | | | | |
| (non-vtg.) | | 20,200 | | | | 645,188 |
| FirstCity Financial Corp. (a) | | 27,900 | | | | 339,264 |
| Franklin Resources, Inc. | | 44,000 | | | | 3,556,080 |
| Investors Financial Services Corp. (d) | | 63,000 | | | | 2,168,460 |
| Legg Mason, Inc. | | 18,900 | | | | 1,930,635 |
| National Financial Partners Corp. | | 21,200 | | | | 959,300 |
| Northern Trust Corp. | | 53,500 | | | | 2,717,800 |
| Nuveen Investments, Inc. Class A | | 25,300 | | | | 961,400 |
| State Street Corp. | | 53,200 | | | | 2,646,168 |
| | | | | | | 18,232,247 |
| Diversified Capital Markets – 1.7% | | | | | | |
| Deutsche Bank AG (NY Shares) | | 4,900 | | | | 423,850 |
| UBS AG (NY Shares) | | 83,000 | | | | 6,802,680 |
| | | | | | | 7,226,530 |
| Investment Banking & Brokerage – 11.6% | | | | | | |
| Ameritrade Holding Corp. (a) | | 37,700 | | | | 736,281 |
| Bear Stearns Companies, Inc. | | 21,500 | | | | 2,195,365 |
| Charles Schwab Corp. | | 229,500 | | | | 3,144,150 |
| E*TRADE Financial Corp. (a) | | 327,400 | | | | 5,077,974 |
| Goldman Sachs Group, Inc. | | 70,000 | | | | 7,523,600 |
| LaBranche & Co., Inc. (a) | | 31,500 | | | | 239,085 |
| Lazard Ltd. Class A | | 47,900 | | | | 1,142,894 |
| Lehman Brothers Holdings, Inc. | | 40,100 | | | | 4,215,713 |
| Merrill Lynch & Co., Inc. | | 334,400 | | | | 19,656,032 |
| Morgan Stanley | | 73,700 | | | | 3,909,785 |
| Piper Jaffray Companies (a) | | 2,479 | | | | 85,302 |
| TradeStation Group, Inc. (a) | | 159,361 | | | | 1,528,272 |
| | | | | | | 49,454,453 |
| |
| TOTAL CAPITAL MARKETS | | | | | | 74,913,230 |
| |
| COMMERCIAL BANKS – 23.0% | | | | | | |
| Diversified Banks – 19.5% | | | | | | |
| Banco Popolare di Verona e Novara | | 103,500 | | | | 1,849,652 |
| Bangkok Bank Ltd. PCL (For. Reg.) | | 346,100 | | | | 880,725 |
| Bank of America Corp. | | 558,702 | | | | 24,359,407 |
| HDFC Bank Ltd. sponsored ADR | | 68,500 | | | | 3,479,800 |
| HSBC Holdings PLC sponsored ADR | | 2,948 | | | | 238,759 |
| Korea Exchange Bank (a) | | 99,100 | | | | 968,436 |
| Mitsubishi Tokyo Financial Group, Inc. | | | | | | |
| (MTFG) sponsored ADR | | 1,200 | | | | 9,960 |
| National Bank of Canada | | 67,300 | | | | 3,149,663 |
| Royal Bank of Canada | | 48,900 | | | | 3,091,322 |
| | | Shares | | Value (Note 1) |
| Standard Chartered PLC (United | | | | |
| Kingdom) | | 166,700 | | $ 3,252,118 |
| State Bank of India | | 100,607 | | 2,130,464 |
| U.S. Bancorp, Delaware | | 257,900 | | 7,752,474 |
| Wachovia Corp. | | 251,677 | | 12,679,487 |
| Wells Fargo & Co. | | 316,500 | | 19,414,110 |
| | | | | 83,256,377 |
| Regional Banks – 3.5% | | | | |
| Cathay General Bancorp | | 62,820 | | 2,232,623 |
| Center Financial Corp., California | | 57,600 | | 1,471,680 |
| City National Corp. | | 10,100 | | 738,007 |
| East West Bancorp, Inc. | | 11,977 | | 413,207 |
| M&T Bank Corp. | | 8,600 | | 933,186 |
| Nara Bancorp, Inc. | | 4,700 | | 73,038 |
| North Fork Bancorp, Inc., New York | | 55,334 | | 1,515,598 |
| SVB Financial Group (a) | | 29,500 | | 1,514,530 |
| Synovus Financial Corp. | | 1,100 | | 32,527 |
| UCBH Holdings, Inc. | | 44,200 | | 807,534 |
| UnionBanCal Corp. | | 23,500 | | 1,676,490 |
| Valley National Bancorp | | 257 | | 6,052 |
| Westcorp | | 58,200 | | 3,372,690 |
| | | | | 14,787,162 |
| |
| TOTAL COMMERCIAL BANKS | | | | 98,043,539 |
| |
| COMMERCIAL SERVICES & SUPPLIES – 0.8% | | | | |
| Diversified Commercial & Professional Services – 0.8% | | |
| Asset Acceptance Capital Corp. (a) | | 125,261 | | 3,424,636 |
| CONSUMER FINANCE – 8.9% | | | | |
| Consumer Finance – 8.9% | | | | |
| Advanta Corp. Class B | | 21,600 | | 646,056 |
| American Express Co. | | 344,000 | | 18,920,000 |
| Capital One Financial Corp. (d) | | 52,600 | | 4,339,500 |
| Dollar Financial Corp. | | 247,333 | | 3,225,222 |
| First Marblehead Corp. (a)(d) | | 107,500 | | 3,735,625 |
| MBNA Corp. | | 162,175 | | 4,080,323 |
| SLM Corp. | | 59,900 | | 3,084,251 |
| | | | | 38,030,977 |
| |
| DIVERSIFIED CONSUMER SERVICES – 0.9% | | | | |
| Specialized Consumer Services – 0.9% | | | | |
| Jackson Hewitt Tax Service, Inc. | | 148,900 | | 3,768,659 |
| DIVERSIFIED FINANCIAL SERVICES – 8.5% | | | | |
| Other Diversifed Financial Services – 7.0% | | | | |
| CapitalSource, Inc. (a)(d) | | 22,000 | | 430,760 |
| Citigroup, Inc. | | 208,669 | | 9,077,102 |
| Infrastructure Development Finance Co. | | | | |
| Ltd. (a) | | 36,274 | | 28,391 |
| JPMorgan Chase & Co. | | 578,294 | | 20,321,251 |
| | | | | 29,857,504 |
| Specialized Finance – 1.5% | | | | |
| Chicago Mercantile Exchange Holdings, | | | | |
| Inc. Class A | | 400 | | 120,420 |
See accompanying notes which are an integral part of the financial statements.
Financial Services A-82
|
| Common Stocks – continued | | | | |
| | | Shares | | Value (Note 1) |
| |
| DIVERSIFIED FINANCIAL SERVICES – CONTINUED | | |
| Specialized Finance – continued | | | | |
| CIT Group, Inc. | | 119,700 | | $ 5,283,558 |
| Encore Capital Group, Inc. (a) | | 19,500 | | 343,200 |
| Marlin Business Services Corp. (a) | | 36,749 | | 817,665 |
| | | | | 6,564,843 |
| |
| TOTAL DIVERSIFIED FINANCIAL SERVICES | | | | 36,422,347 |
| |
| INDUSTRIAL CONGLOMERATES – 2.2% | | | | |
| Industrial Conglomerates – 2.2% | | | | |
| General Electric Co. | | 274,500 | | 9,470,250 |
| INSURANCE – 27.0% | | | | |
| Insurance Brokers – 0.3% | | | | |
| Hilb Rogal & Hobbs Co. | | 5,500 | | 186,395 |
| Marsh & McLennan Companies, Inc. | | 35,600 | | 1,031,332 |
| | | | | 1,217,727 |
| Life & Health Insurance – 5.1% | | | | |
| AFLAC, Inc. | | 109,100 | | 4,920,410 |
| Lincoln National Corp. | | 6,500 | | 313,950 |
| MetLife, Inc. | | 126,100 | | 6,196,554 |
| Protective Life Corp. | | 17,200 | | 749,232 |
| Prudential Financial, Inc. | | 53,400 | | 3,572,460 |
| Sun Life Financial, Inc. | | 138,000 | | 4,966,129 |
| Torchmark Corp. | | 17,500 | | 914,725 |
| | | | | 21,633,460 |
| Multi-Line Insurance – 11.2% | | | | |
| American International Group, Inc. | | 658,160 | | 39,621,232 |
| Genworth Financial, Inc. Class A | | | | |
| (non-vtg.) | | 17,800 | | 558,208 |
| Hartford Financial Services Group, Inc. | | 74,000 | | 5,962,180 |
| HCC Insurance Holdings, Inc. | | 42,150 | | 1,168,398 |
| Unitrin, Inc. | | 8,100 | | 431,325 |
| | | | | 47,741,343 |
| Property & Casualty Insurance – 7.0% | | | | |
| ACE Ltd. | | 187,700 | | 8,673,617 |
| AMBAC Financial Group, Inc. | | 38,350 | | 2,755,064 |
| Aspen Insurance Holdings Ltd. | | 69,400 | | 1,971,654 |
| Axis Capital Holdings Ltd. | | 46,800 | | 1,347,840 |
| Berkshire Hathaway, Inc. Class B (a) | | 1,444 | | 4,017,208 |
| Fidelity National Financial, Inc. | | 32,350 | | 1,274,590 |
| MBIA, Inc. | | 17,700 | | 1,075,098 |
| The St. Paul Travelers Companies, Inc. | | 108,800 | | 4,789,376 |
| XL Capital Ltd. Class A | | 57,000 | | 4,093,740 |
| | | | | 29,998,187 |
| | | Shares | | Value (Note 1) |
| Reinsurance – 3.4% | | | | |
| Endurance Specialty Holdings Ltd. | | 162,470 | | $ 6,336,330 |
| Max Re Capital Ltd. | | 70,562 | | 1,619,398 |
| Montpelier Re Holdings Ltd. | | 24,500 | | 880,040 |
| PartnerRe Ltd. | | 44,000 | | 2,852,080 |
| Platinum Underwriters Holdings Ltd. | | 40,200 | | 1,393,734 |
| Scottish Re Group Ltd. | | 62,800 | | 1,510,340 |
| | | | | 14,591,922 |
| |
| TOTAL INSURANCE | | | | 115,182,639 |
| |
| IT SERVICES – 0.0% | | | | |
| Data Processing & Outsourced Services – 0.0% | | |
| First Data Corp. | | 200 | | 8,228 |
| REAL ESTATE – 3.3% | | | | |
| Real Estate Investment Trusts – 3.3% | | | | |
| Apartment Investment & Management | | | | |
| Co. Class A | | 33,200 | | 1,460,800 |
| CBL & Associates Properties, Inc. | | 24,292 | | 1,114,517 |
| Digital Realty Trust, Inc. | | 34,300 | | 649,642 |
| Duke Realty Corp. | | 23,000 | | 781,080 |
| Equity Lifestyle Properties, Inc. | | 14,200 | | 625,794 |
| Equity Residential (SBI) | | 29,600 | | 1,195,840 |
| Federal Realty Investment Trust (SBI) | | 7,400 | | 483,294 |
| Healthcare Realty Trust, Inc. | | 47,000 | | 1,920,420 |
| Reckson Associates Realty Corp. | | 25,400 | | 892,048 |
| Simon Property Group, Inc. | | 52,800 | | 4,210,272 |
| The Mills Corp. | | 9,500 | | 618,070 |
| Vornado Realty Trust | | 300 | | 26,592 |
| | | | | 13,978,369 |
| |
| THRIFTS & MORTGAGE FINANCE – 7.4% | | | | |
| Thrifts & Mortgage Finance – 7.4% | | | | |
| Countrywide Financial Corp. | | 104,329 | | 3,755,844 |
| Doral Financial Corp. | | 24,300 | | 374,949 |
| Downey Financial Corp. | | 7,500 | | 580,800 |
| Fannie Mae | | 139,335 | | 7,783,253 |
| Freddie Mac | | 17,700 | | 1,120,056 |
| Golden West Financial Corp., Delaware | | 63,300 | | 4,122,096 |
| Housing Development Finance Corp. Ltd. | | 66,594 | | 1,419,262 |
| Hudson City Bancorp, Inc. | | 220,075 | | 2,603,487 |
| Hypo Real Estate Holding AG | | 27,300 | | 1,108,892 |
| MGIC Investment Corp. | | 16,900 | | 1,159,002 |
| Radian Group, Inc. | | 20,655 | | 1,065,385 |
| Sovereign Bancorp, Inc. | | 75,900 | | 1,820,841 |
| The PMI Group, Inc. | | 28,200 | | 1,154,790 |
| W Holding Co., Inc. | | 109,774 | | 1,173,484 |
| Washington Mutual, Inc. | | 49,500 | | 2,102,760 |
| | | | | 31,344,901 |
| |
| TOTAL COMMON STOCKS | | | | |
| (Cost $331,553,582) | | | | 424,587,775 |
See accompanying notes which are an integral part of the financial statements.
Advisor Financial Services Fund
Investments - continued
|
| Money Market Funds — 2.4% | | | | |
| | | Shares | | | | Value (Note 1) |
| Fidelity Cash Central Fund, 3.31% (b) | | 233,116 | | $ | | 233,116 |
| Fidelity Securities Lending Cash | | | | | | |
| Central Fund, 3.32% (b)(c) | | 9,845,400 | | | | 9,845,400 |
| TOTAL MONEY MARKET FUNDS | | | | | | |
| (Cost $10,078,516) | | | | | | 10,078,516 |
| TOTAL INVESTMENT PORTFOLIO - 102.0% | | 434,666,291 |
| (Cost $341,632,098) | | | | | | |
| |
| NET OTHER ASSETS – (2.0)% | | | | | | (8,411,362) |
| NET ASSETS – 100% | | | | 426,254,929 |
| Legend | | | | | | |
| | (a) Non-income producing
(b) Affiliated fund that is available only to investment companies and other
accounts managed by Fidelity Investments. The rate quoted is the
annualized seven-day yield of the fund at period end. A complete listing
of the fund’s holdings as of its most recent quarter end is available upon
request.
(c) Investment made with cash collateral received from securities on loan.
(d) Security or a portion of the security is on loan at period end.
|
Distribution of investments by country of issue, as a percentage of total net assets, is as follows:
| United States of America | | 85.6% |
| Bermuda | | 6.2% |
| Canada | | 2.6% |
| India | | 1.6% |
| Switzerland | | 1.6% |
| Others (individually less than 1%) | | 2.4% |
| | | 100.0% |
| See accompanying notes which are an integral part of the financial statements. | | |
| Financial Services | | A-84 |
Advisor Financial Services Fund
Financial Statements
| Statement of Assets and Liabilities | | |
| | | | | | | July 31, 2005 |
| Assets | | | | | | |
| Investment in securities, at value (including | | | | |
| securities loaned of $9,488,478) (cost | | | | |
| $341,632,098) — See accompanying | | | | |
| schedule | | | | $ | | 434,666,291 |
| Receivable for investments sold | | | | | | 8,583,747 |
| Receivable for fund shares sold | | | | | | 87,071 |
| Dividends receivable | | | | | | 575,878 |
| Interest receivable | | | | | | 3,572 |
| Prepaid expenses | | | | | | 794 |
| Other receivables | | | | | | 58,755 |
| Total assets | | | | | | 443,976,108 |
| Liabilities | | | | | | |
| Payable for investments purchased | | $ | | 5,970,741 | | |
| Payable for fund shares redeemed | | | | 1,189,786 | | |
| Accrued management fee | | | | 203,992 | | |
| Distribution fees payable | | | | 250,107 | | |
| Other affiliated payables | | | | 135,709 | | |
| Other payables and accrued expenses | | | | 125,444 | | |
| Collateral on securities loaned, at value | | | | 9,845,400 | | |
| Total liabilities | | | | | | 17,721,179 |
| Net Assets | | | | $ | | 426,254,929 |
| Net Assets consist of: | | | | | | |
| Paid in capital | | | | $ | | 304,961,464 |
| Undistributed net investment income | | | | | | 1,342,292 |
| Accumulated undistributed net realized | | | | | | |
| gain (loss) on investments and foreign | | | | |
| currency transactions | | | | | | 27,006,388 |
| Net unrealized appreciation (depreciation) | | | | |
| on investments and assets and liabilities | | | | |
| in foreign currencies | | | | | | 92,944,785 |
| Net Assets | | | | $ | | 426,254,929 |
| Calculation of Maximum Offering Price | | | | |
| Class A: | | | | | | |
| Net Asset Value and redemption price | | | | |
| per share ($68,011,723 ÷ 2,955,518 | | | | |
| shares) | | | | $ | | 23.01 |
| Maximum offering price per share | | | | | | |
| (100/94.25 of $23.01) | | | | $ | | 24.41 |
| Class T: | | | | | | |
| Net Asset Value and redemption price | | | | |
| per share ($128,387,962 ÷ | | | | | | |
| 5,613,688 shares) | | | | $ | | 22.87 |
| Maximum offering price per share | | | | | | |
| (100/96.50 of $22.87) | | | | $ | | 23.70 |
| Class B: | | | | | | |
| Net Asset Value and offering price per | | | | |
| share ($145,045,526 ÷ 6,496,655 | | | | |
| shares)A | | | | $ | | 22.33 |
| Class C: | | | | | | |
| Net Asset Value and offering price per | | | | |
| share ($72,180,734 ÷ 3,231,531 | | | | | | |
| shares)A | | | | $ | | 22.34 |
| Institutional Class: | | | | | | |
| Net Asset Value, offering price and | | | | | | |
| redemption price per share | | | | | | |
| ($12,628,984 ÷ 542,150 shares) | | | | $ | | 23.29 |
| A Redemption price per share is equal to net asset value less any applicable contingent deferred sales charge. |
| Statement of Operations | | | | |
| | | | | Year ended July 31, 2005 |
| Investment Income | | | | | | |
| Dividends | | | | $ | | 9,409,732 |
| Interest | | | | | | 256,286 |
| Security lending | | | | | | 62,393 |
| Total income | | | | | | 9,728,411 |
| Expenses | | | | | | |
| Management fee | | $ | | 2,637,887 | | |
| Transfer agent fees | | | | 1,560,451 | | |
| Distribution fees | | | | 3,309,641 | | |
| Accounting and security lending | | | | | | |
| fees | | | | 190,345 | | |
| Independent trustees’ compensation | | 2,442 | | |
| Custodian fees and expenses | | | | 18,548 | | |
| Registration fees | | | | 61,852 | | |
| Audit | | | | 44,595 | | |
| Legal | | | | 1,734 | | |
| Miscellaneous | | | | 7,547 | | |
| Total expenses before reductions | | 7,835,042 | | |
| Expense reductions | | | | (111,140) | | 7,723,902 |
| |
| Net investment income (loss) | | | | | | 2,004,509 |
| Realized and Unrealized Gain | | | | | | |
| (Loss) | | | | | | |
| Net realized gain (loss) on: | | | | | | |
| Investment securities | | | | 35,580,505 | | |
| Foreign currency transactions | | | | 4,184 | | |
| Total net realized gain (loss) | | | | | | 35,584,689 |
| Change in net unrealized appreci- | | | | |
| ation (depreciation) on: | | | | | | |
| Investment securities (net of in- | | | | | | |
| crease in deferred foreign taxes | | | | |
| of $89,524) | | | | 15,327,599 | | |
| Assets and liabilities in foreign | | | | | | |
| currencies | | | | (178) | | |
| Total change in net unrealized ap- | | | | |
| preciation (depreciation) | | | | | | 15,327,421 |
| Net gain (loss) | | | | | | 50,912,110 |
| Net increase (decrease) in net as- | | | | |
| sets resulting from operations | | | | $ | | 52,916,619 |
See accompanying notes which are an integral part of the financial statements.
A-85 Annual Report
Advisor Financial Services Fund Financial Statements - continued
| Statement of Changes in Net Assets | | | | | | |
| | | Year ended | | | | Year ended |
| | | July 31, | | | | July 31, |
| | | 2005 | | | | 2004 |
| Increase (Decrease) in Net Assets | | | | | | |
| Operations | | | | | | |
| Net investment income (loss) | | $ 2,004,509 | | $ | | 887,555 |
| Net realized gain (loss) | | 35,584,689 | | | | 60,089,042 |
| Change in net unrealized appreciation (depreciation) | | 15,327,421 | | | | (3,464,721) |
| Net increase (decrease) in net assets resulting from operations | | 52,916,619 | | | | 57,511,876 |
| Distributions to shareholders from net investment income | | (623,607) | | | | (1,712,624) |
| Distributions to shareholders from net realized gain | | (38,323,892) | | | | — |
| Total distributions | | (38,947,499) | | | | (1,712,624) |
| Share transactions -- net increase (decrease) | | (69,921,968) | | | | (93,511,617) |
| Redemption fees | | 19,265 | | | | 62,072 |
| Total increase (decrease) in net assets | | (55,933,583) | | | | (37,650,293) |
| |
| Net Assets | | | | | | |
| Beginning of period | | 482,188,512 | | | | 519,838,805 |
| End of period (including undistributed net investment income of $1,342,292 and undistributed net investment income of | | | | | | |
| $1,503, respectively) | | $ 426,254,929 | | $ | | 482,188,512 |
| Financial Highlights — Class A | | | | | | | | | | |
| Years ended July 31, | | 2005 | | 2004 | | 2003 | | 2002 | | 2001 |
| Selected Per-Share Data | | | | | | | | | | |
| Net asset value, beginning of period | | $ 22.17 | | $ 19.98 | | $ 17.83 | | $ 20.45 | | $ 18.29 |
| Income from Investment Operations | | | | | | | | | | |
| Net investment income (loss)C | | 19 | | .14 | | .16 | | .12 | | .15 |
| Net realized and unrealized gain (loss) | | 2.48 | | 2.20 | | 2.07 | | (2.60) | | 2.20 |
| Total from investment operations | | 2.67 | | 2.34 | | 2.23 | | (2.48) | | 2.35 |
| Distributions from net investment income | | (.07) | | (.15) | | (.08) | | (.14) | | (.19) |
| Distributions from net realized gain | | (1.76) | | — | | — | | — | | — |
| Total distributions | | (1.83) | | (.15) | | (.08) | | (.14) | | (.19) |
| Redemption fees added to paid in capitalC | | —E | | —E | | —E | | —E | | —E |
| Net asset value, end of period | | $ 23.01 | | $ 22.17 | | $ 19.98 | | $ 17.83 | | $ 20.45 |
| Total ReturnA,B | | 12.60% | | 11.76% | | 12.57% | | (12.16)% | | 12.86% |
| Ratios to Average Net AssetsD | | | | | | | | | | |
| Expenses before expense reductions | | 1.26% | | 1.27% | | 1.31% | | 1.27% | | 1.20% |
| Expenses net of voluntary waivers, if any | | 1.26% | | 1.27% | | 1.31% | | 1.27% | | 1.20% |
| Expenses net of all reductions | | 1.23% | | 1.25% | | 1.27% | | 1.23% | | 1.18% |
| Net investment income (loss) | | 88% | | .63% | | .89% | | .60% | | .77% |
| Supplemental Data | | | | | | | | | | |
| Net assets, end of period (000 omitted) | | $ 68,012 | | $ 58,222 | | $ 57,255 | | $ 60,475 | | $ 78,115 |
| Portfolio turnover rate | | 61% | | 74% | | 60% | | 125% | | 110% |
A Total returns would have been lower had certain expenses not been reduced during the periods shown. B Total returns do not include the effect of the sales charges.
C Calculated based on average shares outstanding during the period.
D Expense ratios reflect operating expenses of the class. Expenses before reductions do not reflect amounts reimbursed by the investment adviser or reductions from brokerage service arrangements or other expense offset arrangements and do not represent the amount paid by the class during periods when reimbursements or reductions occur. Expenses net of any voluntary waivers reflect expenses after reimbursement by the investment adviser but prior to reductions from brokerage service arrangements or other expense offset arrangements. Expenses net of all reductions represent the net expenses paid by the class.
E Amount represents less than $.01 per share.
See accompanying notes which are an integral part of the financial statements.
Financial Services A-86
| Financial Highlights — Class T | | | | | | | | | | |
| Years ended July 31, | | 2005 | | 2004 | | 2003 | | 2002 | | 2001 |
| Selected Per-Share Data | | | | | | | | | | |
| Net asset value, beginning of period | | $ 22.07 | | $ 19.90 | | $ 17.77 | | $ 20.38 | | $ 18.21 |
| Income from Investment Operations | | | | | | | | | | |
| Net investment income (loss)C | | 14 | | .09 | | .12 | | .07 | | .11 |
| Net realized and unrealized gain (loss) | | 2.47 | | 2.19 | | 2.07 | | (2.59) | | 2.19 |
| Total from investment operations | | 2.61 | | 2.28 | | 2.19 | | (2.52) | | 2.30 |
| Distributions from net investment income | | (.05) | | (.11) | | (.06) | | (.09) | | (.13) |
| Distributions from net realized gain | | (1.76) | | — | | — | | — | | — |
| Total distributions | | (1.81) | | (.11) | | (.06) | | (.09) | | (.13) |
| Redemption fees added to paid in capitalC | | —E | | —E | | —E | | —E | | —E |
| Net asset value, end of period | | $ 22.87 | | $ 22.07 | | $ 19.90 | | $ 17.77 | | $ 20.38 |
| Total ReturnA,B | | 12.37% | | 11.49% | | 12.37% | | (12.39)% | | 12.64% |
| Ratios to Average Net AssetsD | | | | | | | | | | |
| Expenses before expense reductions | | 1.48% | | 1.50% | | 1.53% | | 1.49% | | 1.43% |
| Expenses net of voluntary waivers, if any | | 1.48% | | 1.50% | | 1.53% | | 1.49% | | 1.43% |
| Expenses net of all reductions | | 1.46% | | 1.48% | | 1.49% | | 1.45% | | 1.41% |
| Net investment income (loss) | | 66% | | .41% | | .67% | | .38% | | .54% |
| Supplemental Data | | | | | | | | | | |
| Net assets, end of period (000 omitted) | | $ 128,388 | | $ 144,887 | | $ 157,238 | | $ 169,429 | | $ 234,268 |
| Portfolio turnover rate | | 61% | | 74% | | 60% | | 125% | | 110% |
A Total returns would have been lower had certain expenses not been reduced during the periods shown.
B Total returns do not include the effect of the sales charges.
C Calculated based on average shares outstanding during the period.
D Expense ratios reflect operating expenses of the class. Expenses before reductions do not reflect amounts reimbursed by the investment adviser or reductions from brokerage service arrangements or other expense offset arrangements and do not
represent the amount paid by the class during periods when reimbursements or reductions occur. Expenses net of any voluntary waivers reflect expenses after reimbursement by the investment adviser but prior to reductions from brokerage service
arrangements or other expense offset arrangements. Expenses net of all reductions represent the net expenses paid by the class.
E Amount represents less than $.01 per share.
|
| Financial Highlights — Class B | | | | | | | | | | |
| Years ended July 31, | | 2005 | | 2004 | | 2003 | | 2002 | | 2001 |
| Selected Per-Share Data | | | | | | | | | | |
| Net asset value, beginning of period | | $ 21.65 | | $ 19.53 | | $ 17.50 | | $ 20.08 | | $ 17.95 |
| Income from Investment Operations | | | | | | | | | | |
| Net investment income (loss)C | | 03 | | (.02) | | .03 | | (.03) | | —E |
| Net realized and unrealized gain (loss) | | 2.41 | | 2.16 | | 2.03 | | (2.55) | | 2.16 |
| Total from investment operations | | 2.44 | | 2.14 | | 2.06 | | (2.58) | | 2.16 |
| Distributions from net investment income | | — | | (.02) | | (.03) | | — | | (.03) |
| Distributions from net realized gain | | (1.76) | | — | | — | | — | | — |
| Total distributions | | (1.76) | | (.02) | | (.03) | | — | | (.03) |
| Redemption fees added to paid in capitalC | | —E | | —E | | —E | | —E | | —E |
| Net asset value, end of period | | $ 22.33 | | $ 21.65 | | $ 19.53 | | $ 17.50 | | $ 20.08 |
| Total ReturnA,B | | 11.78% | | 10.96% | | 11.80% | | (12.85)% | | 12.03% |
| Ratios to Average Net AssetsD | | | | | | | | | | |
| Expenses before expense reductions | | 2.00% | | 2.02% | | 2.03% | | 2.01% | | 1.96% |
| Expenses net of voluntary waivers, if any | | 2.00% | | 2.02% | | 2.03% | | 2.01% | | 1.96% |
| Expenses net of all reductions | | 1.98% | | 2.00% | | 1.99% | | 1.97% | | 1.94% |
| Net investment income (loss) | | 14% | | (.11)% | | .17% | | (.14)% | | .01% |
| Supplemental Data | | | | | | | | | | |
| Net assets, end of period (000 omitted) | | $ 145,046 | | $ 179,873 | | $ 193,373 | | $ 206,460 | | $ 269,612 |
| Portfolio turnover rate | | 61% | | 74% | | 60% | | 125% | | 110% |
A Total returns would have been lower had certain expenses not been reduced during the periods shown.
B Total returns do not include the effect of the contingent deferred sales charge.
C Calculated based on average shares outstanding during the period.
D Expense ratios reflect operating expenses of the class. Expenses before reductions do not reflect amounts reimbursed by the investment adviser or reductions from brokerage service arrangements or other expense offset arrangements and do not
represent the amount paid by the class during periods when reimbursements or reductions occur. Expenses net of any voluntary waivers reflect expenses after reimbursement by the investment adviser but prior to reductions from brokerage service
arrangements or other expense offset arrangements. Expenses net of all reductions represent the net expenses paid by the class.
E Amount represents less than $.01 per share.
|
See accompanying notes which are an integral part of the financial statements.
|
| Financial Highlights — Class C | | | | | | | | | | |
| Years ended July 31, | | 2005 | | 2004 | | 2003 | | 2002 | | 2001 |
| Selected Per-Share Data | | | | | | | | | | |
| Net asset value, beginning of period | | $ 21.65 | | $ 19.53 | | $ 17.49 | | $ 20.05 | | $ 17.96 |
| Income from Investment Operations | | | | | | | | | | |
| Net investment income (loss)C | | 04 | | (.01) | | .04 | | (.02) | | .01 |
| Net realized and unrealized gain (loss) | | 2.42 | | 2.15 | | 2.03 | | (2.54) | | 2.15 |
| Total from investment operations | | 2.46 | | 2.14 | | 2.07 | | (2.56) | | 2.16 |
| Distributions from net investment income | | (.01) | | (.02) | | (.03) | | — | | (.07) |
| Distributions from net realized gain | | (1.76) | | — | | — | | — | | — |
| Total distributions | | (1.77) | | (.02) | | (.03) | | — | | (.07) |
| Redemption fees added to paid in capitalC | | —E | | —E | | —E | | —E | | —E |
| Net asset value, end of period | | $ 22.34 | | $ 21.65 | | $ 19.53 | | $ 17.49 | | $ 20.05 |
| Total ReturnA,B | | 11.88% | | 10.96% | | 11.86% | | (12.77)% | | 12.03% |
| Ratios to Average Net AssetsD | | | | | | | | | | |
| Expenses before expense reductions | | 1.95% | | 1.97% | | 1.99% | | 1.96% | | 1.92% |
| Expenses net of voluntary waivers, if any | | 1.95% | | 1.97% | | 1.99% | | 1.96% | | 1.92% |
| Expenses net of all reductions | | 1.92% | | 1.95% | | 1.95% | | 1.92% | | 1.90% |
| Net investment income (loss) | | 19% | | (.06) % | | .22% | | (.09) % | | .05% |
| Supplemental Data | | | | | | | | | | |
| Net assets, end of period (000 omitted) | | $ 72,181 | | $ 86,199 | | $ 97,434 | | $ 107,899 | | $ 149,160 |
| Portfolio turnover rate | | 61% | | 74% | | 60% | | 125% | | 110% |
A Total returns would have been lower had certain expenses not been reduced during the periods shown.
B Total returns do not include the effect of the contingent deferred sales charge.
C Calculated based on average shares outstanding during the period.
D Expense ratios reflect operating expenses of the class. Expenses before reductions do not reflect amounts reimbursed by the investment adviser or reductions from brokerage service arrangements or other expense offset arrangements and do not
represent the amount paid by the class during periods when reimbursements or reductions occur. Expenses net of any voluntary waivers reflect expenses after reimbursement by the investment adviser but prior to reductions from brokerage service
arrangements or other expense offset arrangements. Expenses net of all reductions represent the net expenses paid by the class.
E Amount represents less than $.01 per share.
|
| Financial Highlights — Institutional Class | | | | | | | | | | |
| Years ended July 31, | | 2005 | | 2004 | | 2003 | | 2002 | | 2001 |
| Selected Per-Share Data | | | | | | | | | | |
| Net asset value, beginning of period | | $ 22.37 | | $ 20.17 | | $ 17.95 | | $ 20.59 | | $ 18.39 |
| Income from Investment Operations | | | | | | | | | | |
| Net investment income (loss)B | | 29 | | .23 | | .24 | | .19 | | .22 |
| Net realized and unrealized gain (loss) | | 2.50 | | 2.21 | | 2.09 | | (2.62) | | 2.22 |
| Total from investment operations | | 2.79 | | 2.44 | | 2.33 | | (2.43) | | 2.44 |
| Distributions from net investment income | | (.11) | | (.24) | | (.11) | | (.21) | | (.24) |
| Distributions from net realized gain | | (1.76) | | — | | — | | — | | — |
| Total distributions | | (1.87) | | (.24) | | (.11) | | (.21) | | (.24) |
| Redemption fees added to paid in capitalB | | —D | | —D | | —D | | —D | | —D |
| Net asset value, end of period | | $ 23.29 | | $ 22.37 | | $ 20.17 | | $ 17.95 | | $ 20.59 |
| Total ReturnA | | 13.06% | | 12.18% | | 13.07% | | (11.84)% | | 13.29% |
| Ratios to Average Net AssetsC | | | | | | | | | | |
| Expenses before expense reductions | | 86% | | .88% | | .88% | | .89% | | .87% |
| Expenses net of voluntary waivers, if any | | 86% | | .88% | | .88% | | .89% | | .87% |
| Expenses net of all reductions | | 84% | | .85% | | .84% | | .85% | | .84% |
| Net investment income (loss) | | 1.28% | | 1.03% | | 1.32% | | .98% | | 1.10% |
| Supplemental Data | | | | | | | | | | |
| Net assets, end of period (000 omitted) | | $ 12,629 | | $ 13,008 | | $ 14,539 | | $ 15,283 | | $ 17,966 |
| Portfolio turnover rate | | 61% | | 74% | | 60% | | 125% | | 110% |
A Total returns would have been lower had certain expenses not been reduced during the periods shown.
B Calculated based on average shares outstanding during the period.
C Expense ratios reflect operating expenses of the class. Expenses before reductions do not reflect amounts reimbursed by the investment adviser or reductions from brokerage service arrangements or other expense offset arrangements and do not
represent the amount paid by the class during periods when reimbursements or reductions occur. Expenses net of any voluntary waivers reflect expenses after reimbursement by the investment adviser but prior to reductions from brokerage service
arrangements or other expense offset arrangements. Expenses net of all reductions represent the net expenses paid by the class.
D Amount represents less than $.01 per share.
|
See accompanying notes which are an integral part of the financial statements.
Financial Services A-88
|
Notes to Financial Statements
For the period ended July 31, 2005
|
1. Significant Accounting Policies.
|
Fidelity Advisor Financial Services Fund (the fund) is a fund of Fidelity Advisor Series VII (the trust) and is authorized to issue an unlimited number of shares. The trust is registered under the Investment Company Act of 1940, as amended (the 1940 Act), as an open-end management investment company organized as a Massachusetts business trust.
The fund offers Class A, Class T, Class B, Class C and Institutional Class shares, each of which has equal rights as to assets and voting privileges. Each class has exclusive voting rights with respect to matters that affect that class. Class B shares will automatically convert to Class A shares after a holding period of seven years from the initial date of purchase. Investment income, realized and unrealized capital gains and losses, the common expenses of the fund, and certain fund-level expense reductions, if any, are allocated on a pro rata basis to each class based on the relative net assets of each class to the total net assets of the fund. Each class differs with respect to transfer agent and distribution and service plan fees incurred. Certain expense reductions also differ by class.
The financial statements have been prepared in conformity with accounting principles generally accepted in the United States of America, which require management to make certain estimates and assumptions at the date of the financial statements. The following summarizes the significant accounting policies of the fund:
Security Valuation. Net asset value per share (NAV calculation) is calculated as of the close of business of the New York Stock Exchange, normally 4:00 p.m. Eastern time. Equity securities, including restricted securities, for which market quotations are available are valued at the last sale price or official closing price (closing bid price or last evaluated quote if no sale has occurred) on the primary market or exchange on which they trade. If prices are not readily available or do not accurately reflect fair value for a security, or if a security’s value has been materially affected by events occurring after the close of the exchange or market on which the security is principally traded, that security may be valued by another method that the Board of Trustees believes accurately reflects fair value. A security’s valuation may differ depending on the method used for determining value. Price movements in futures contracts and ADRs, market and trading trends, the bid/ask quotes of brokers and off-exchange institutional trading may be reviewed in the course of making a good faith determination of a security’s fair value. Short-term securities with remaining maturities of sixty days or less for which quotations are not readily available are valued on the basis of amortized cost. Investments in open-end investment companies are valued at their net asset value each business day.
Foreign Currency. The fund uses foreign currency contracts to facilitate transactions in foreign-denominated securities. Losses from these transactions may arise from changes in the value of the foreign currency or if the counterparties do not perform under the contracts’ terms.
Foreign-denominated assets, including investment securities, and liabilities are translated into U.S. dollars at the exchange rate at period end. Purchases and sales of investment securities, income and dividends received and expenses denominated in foreign currencies are translated into U.S. dollars at the exchange rate in effect on the transaction date.
The effects of exchange rate fluctuations on investments are included with the net realized and unrealized gain (loss) on investment securities. Other foreign currency transactions resulting in realized and unrealized gain (loss) are disclosed separately.
Investment Transactions and Income. Security transactions are accounted for as of trade date. Gains and losses on securities sold are determined on the basis of identified cost and may include proceeds received from litigation. Dividend income is recorded on the ex-dividend date, except for certain dividends from foreign securities where the ex-dividend date may have passed, which are recorded as soon as the fund is informed of the ex-dividend date. Non-cash dividends included in dividend income, if any, are recorded at the fair market value of the securities received. Distributions received on securities that represent a return of capital or capital gain are recorded as a reduction of cost of investments and/or as a realized gain. The fund estimates the components of distributions received that may be considered return of capital distributions or capital gain distributions. Interest income is accrued as earned. Interest income includes coupon interest and amortization of premium and accretion of discount on debt securities. Investment income is recorded net of foreign taxes withheld where recovery of such taxes is uncertain.
Expenses. Most expenses of the trust can be directly attributed to a fund. Expenses which cannot be directly attributed are apportioned among each fund in the trust.
Income Tax Information and Distributions to Shareholders. Each year, the fund intends to qualify as a regulated investment company by distributing all of its taxable income and realized gains under Subchapter M of the Internal Revenue Code. As a result, no provision for income taxes is required in the accompanying financial statements. Foreign taxes are provided for based on the fund’s understanding of the tax rules and rates that exist in the foreign markets in which it invests.
Distributions are recorded on the ex-dividend date. Income dividends and capital gain distributions are declared separately for each class. Income and capital gain distributions are determined in accordance with income tax regulations, which may differ from generally accepted accounting principles. In addition, the fund will claim a portion of the payment made to redeeming shareholders as a distribution for income tax purposes. Capital accounts within the financial statements are adjusted for permanent book-tax differences. These adjustments have no impact on net assets or the results of operations. Temporary book-tax differences will reverse in a subsequent period.
| | Notes to Financial Statements - continued
1. Significant Accounting Policies - continued
Income Tax Information and Distributions to Shareholders - continued
|
Book-tax differences are primarily due to foreign currency transactions, passive foreign investment companies (PFIC), and losses deferred due to wash sales.
The tax-basis components of distributable earnings and the federal tax cost as of period end were as follows:
| Unrealized appreciation | | $ 97,330,451 |
| Unrealized depreciation | | (6,232,419) |
| Net unrealized appreciation (depreciation) | | 91,098,032 |
| Undistributed ordinary income | | 3,234,012 |
| Undistributed long-term capital gain | | 22,659,058 |
| |
| Cost for federal income tax purposes | | $ 343,568,259 |
The tax character of distributions paid was as follows:
| | | July 31, 2005 | | | | July 31, 2004 |
| Ordinary Income | | $ 2,154,145 | | $ | | 1,674,060 |
| Long-term Capital Gains | | 36,793,354 | | | | 38,564 |
| Total | | $ 38,947,499 | | $ | | 1,712,624 |
Short-Term Trading (Redemption) Fees. Shares held in the fund less than 60 days are subject to a redemption fee equal to 1.00% of the proceeds of the redeemed shares. All redemption fees, including any estimated redemption fees paid by Fidelity Management & Research Company (FMR), are retained by the fund and accounted for as an addition to paid in capital.
Repurchase Agreements. FMR has received an Exemptive Order from the Securities and Exchange Commission (the SEC) which permits the fund and other affiliated entities of FMR to transfer uninvested cash balances into joint trading accounts which are then invested in repurchase agreements. The fund may also invest directly with institutions in repurchase agreements. Repurchase agreements are collateralized by government or non-government securities. Collateral is held in segregated accounts with custodian banks and may be obtained in the event of a default of the counterparty. The fund monitors, on a daily basis, the value of the collateral to ensure it is at least equal to the principal amount of the repurchase agreement (including accrued interest). In the event of a default by the counterparty, realization of the collateral proceeds could be delayed, during which time the value of the collateral may decline.
3. Purchases and Sales of Investments.
Purchases and sales of securities, other than short-term securities and U.S. government securities, aggregated $273,730,322 and $371,782,892, respectively.
4. Fees and Other Transactions with Affiliates.
Management Fee. FMR and its affiliates provide the fund with investment management related services for which the fund pays a monthly management fee. The management fee is the sum of an individual fund fee rate that is based on an annual rate of .30% of the fund’s average net assets and a group fee rate that averaged .27% during the period. The group fee rate is based upon the average net assets of all the mutual funds advised by FMR. The group fee rate decreases as assets under management increase and increases as assets under management decrease. For the period, the total annual management fee rate was .57% of the fund’s average net assets.
Distribution and Service Plan. In accordance with Rule 12b-1 of the 1940 Act, the fund has adopted separate Distribution and Service Plans for each class of shares. Certain classes pay Fidelity Distributors Corporation (FDC), an affiliate of FMR, separate Distribution and Service Fees, each of which is based on an annual percentage of each class’ average net assets. In addition, FDC may pay financial intermediaries for selling shares of the fund and providing shareholder support services. For the period, the Distribution and Service Fee rates and the total amounts paid to and retained by FDC were as follows:
| | | Distribution | | Service | | | | Paid to | | | | Retained |
| | | Fee | | Fee | | | | FDC | | | | by FDC |
| Class A | | 0% | | .25% | | $ | | 157,105 | | $ | | 400 |
| Class T | | 25% | | .25% | | | | 690,352 | | | | 3,856 |
| Class B | | 75% | | .25% | | | | 1,661,090 | | | | 1,247,510 |
| Class C | | 75% | | .25% | | | | 801,094 | | | | 50,427 |
| |
| | | | | | | $ | | 3,309,641 | | $ | | 1,302,193 |
4. Fees and Other Transactions with Affiliates - continued
Sales Load. FDC receives a front-end sales charge of up to 5.75% for selling Class A shares, and 3.50% for selling Class T shares, some of which is paid to financial intermediaries for selling shares of the fund. FDC receives the proceeds of contingent deferred sales charges levied on Class A, Class T, Class B, and Class C redemptions. These charges depend on the holding period. The deferred sales charges range from 5% to 1% for Class B, 1% for Class C, and .25% for certain purchases of Class A and Class T shares.
| For the period, sales charge amounts retained by FDC were as follows: | | | | |
| |
| | | | | Retained |
| | | | | by FDC |
| Class A | | $ | | 20,261 |
| Class T | | | | 11,108 |
| Class B* | | | | 410,846 |
| Class C* | | | | 4,432 |
| | | $ | | 446,647 |
| |
| * When Class B and Class C shares are initially sold, FDC pays commissions from its own resources to financial intermediaries through which the sales are made. | | | | |
Transfer Agent Fees. Fidelity Investments Institutional Operations Company, Inc. (FIIOC), an affiliate of FMR, is the transfer, dividend disbursing and shareholder servicing agent for each class of the fund. FIIOC receives account fees and asset-based fees that vary according to the account size and type of account of the shareholders of the respective classes of the fund. FIIOC pays for typesetting, printing and mailing of shareholder reports, except proxy statements. For the period the total transfer agent fees paid by each class to FIIOC, were as follows:
| | | | | | | % of |
| | | | | | | Average |
| | | | | Amount | | Net Assets |
| Class A | | $ | | 228,184 | | .36 |
| Class T | | | | 467,917 | | .34 |
| Class B | | | | 592,505 | | .36 |
| Class C | | | | 243,893 | | .30 |
| Institutional Class | | | | 27,952 | | .22 |
| |
| | | $ | | 1,560,451 | | |
Accounting and Security Lending Fees. Fidelity Service Company, Inc. (FSC), an affiliate of FMR, maintains the fund’s accounting records. The accounting fee is based on the level of average net assets for the month. Under a separate contract, FSC administers the security lending program. The security lending fee is based on the number and duration of lending transactions.
Central Funds. The fund may invest in affiliated Central Funds managed by Fidelity Investments Money Management, Inc. (FIMM), an affiliate of FMR. The Central Funds are open-end investment companies available only to investment companies and other accounts managed by FMR and its affiliates. The Money Market Central Funds seek preservation of capital and current income. The Central Funds do not pay a management fee. Income distributions earned by the fund are recorded as income in the accompanying financial statements and totaled $350,732 for the period.
Brokerage Commissions. The fund placed a portion of its portfolio transactions with brokerage firms which are affiliates of the investment adviser. The commissions paid to these affiliated firms were $32,677 for the period.
| | 5. Committed Line of Credit.
|
The fund participates with other funds managed by FMR in a $4.2 billion credit facility (the “line of credit”) to be utilized for temporary or emergency purposes to fund shareholder redemptions or for other short-term liquidity purposes. The fund has agreed to pay commitment fees on its pro rata portion of the line of credit. During the period, there were no borrowings on this line of credit.
Notes to Financial Statements - continued
6. Security Lending.
|
The fund lends portfolio securities from time to time in order to earn additional income. The fund receives collateral (in the form of U.S. Treasury obligations, letters of credit and/or cash) against the loaned securities and maintains collateral in an amount not less than 100% of the market value of the loaned securities during the period of the loan. The market value of the loaned securities is determined at the close of business of the fund and any additional required collateral is delivered to the fund on the next business day. If the borrower defaults on its obligation to return the securities loaned because of insolvency or other reasons, a fund could experience delays and costs in recovering the securities loaned or in gaining access to the collateral. Cash collateral is invested in the Fidelity Securities Lending Cash Central Fund. The value of loaned securities and cash collateral at period end are disclosed on the fund’s Statement of Assets and Liabilities.
Many of the brokers with whom FMR places trades on behalf of the fund provided services to the fund in addition to trade execution. These services included payments of certain expenses on behalf of the fund totaling $110,873 for the period. In addition, through arrangements with the fund’s custodian, credits realized as a result of uninvested cash balances were used to reduce the fund’s expenses. During the period, these credits reduced the fund’s custody expenses by $267.
The fund’s organizational documents provide former and current trustees and officers with a limited indemnification against liabilities arising in connection with the performance of their duties to the fund. In the normal course of business, the fund may also enter into contracts that provide general indemnifications. The fund’s maximum exposure under these arrangements is unknown as this would be dependent on future claims that may be made against the fund. The risk of material loss from such claims is considered remote.
9. Distributions to Shareholders.
Distributions to shareholders of each class were as follows:
| Years ended July 31, | | 2005 | | | | 2004 |
| From net investment income | | | | | | |
| Class A | | $ 192,609 | | $ | | 420,433 |
| Class T | | 326,696 | | | | 838,212 |
| Class B | | — | | | | 192,478 |
| Class C | | 38,785 | | | | 96,077 |
| Institutional Class | | 65,517 | | | | 165,424 |
| Total | | $ 623,607 | | $ | | 1,712,624 |
| From net realized gain | | | | | | |
| Class A | | $ 4,769,034 | | $ | | — |
| Class T | | 11,388,557 | | | | — |
| Class B | | 14,295,898 | | | | — |
| Class C | | 6,852,951 | | | | — |
| Institutional Class | | 1,017,452 | | | | — |
| Total | | $ 38,323,892 | | $ | | — |
10. Share Transactions.
Transactions for each class of shares were as follows:
|
| | | | | Shares | | | | | | Dollars |
| Years ended July 31, | | 2005 | | | | 2004 | | 2005 | | | | 2004 |
| Class A | | | | | | | | | | | | |
| Shares sold | | 1,159,503 | | | | 614,653 | | $ 25,692,274 | | $ | | 13,695,749 |
| Reinvestment of distributions | | 198,478 | | | | 18,128 | | 4,334,590 | | | | 378,140 |
| Shares redeemed | | (1,028,419) | | | | (872,521) | | (22,675,155) | | | | (19,145,577) |
| Net increase (decrease) | | 329,562 | | | | (239,740) | | $ 7,351,709 | | $ | | (5,071,688) |
| Class T | | | | | | | | | | | | |
| Shares sold | | 420,019 | | | | 658,242 | | $ 9,262,219 | | $ | | 14,430,306 |
| Reinvestment of distributions | | 504,911 | | | | 37,421 | | 10,965,915 | | | | 777,299 |
| Shares redeemed | | (1,875,686) | | | | (2,033,778) | | (41,342,266) | | | | (44,388,616) |
| Net increase (decrease) | | (950,756) | | | | (1,338,115) | | $ (21,114,132) | | $ (29,181,011) |
| Class B | | | | | | | | | | | | |
| Shares sold | | 283,236 | | | | 461,768 | | $ 6,103,430 | | $ | | 9,850,610 |
| Reinvestment of distributions | | 574,588 | | | | 7,853 | | 12,205,894 | | | | 162,959 |
| Shares redeemed | | (2,670,965) | | | | (2,060,890) | | (57,380,601) | | | | (44,422,627) |
| Net increase (decrease) | | (1,813,141) | | | | (1,591,269) | | $ (39,071,277) | | $ (34,409,058) |
| Class C | | | | | | | | | | | | |
| Shares sold | | 213,518 | | | | 653,543 | | $ 4,587,619 | | $ | | 13,848,576 |
| Reinvestment of distributions | | 257,099 | | | | 3,576 | | 5,464,805 | | | | 74,185 |
| Shares redeemed | | (1,219,971) | | | | (1,665,874) | | (26,243,393) | | | | (35,686,628) |
| Net increase (decrease) | | (749,354) | | | | (1,008,755) | | $ (16,190,969) | | $ (21,763,867) |
| Institutional Class | | | | | | | | | | | | |
| Shares sold | | 62,760 | | | | 67,364 | | $ 1,387,106 | | $ | | 1,519,011 |
| Reinvestment of distributions | | 37,434 | | | | 5,506 | | 826,042 | | | | 115,490 |
| Shares redeemed | | (139,433) | | | | (212,405) | | (3,110,447) | | | | (4,720,494) |
| Net increase (decrease) | | (39,239) | | | | (139,535) | | $ (897,299) | | $ | | (3,085,993) |
Advisor Health Care Fund — Institutional Class
Average annual total return reflects the change in the value of an investment, assuming reinvestment of the class’ dividend income and capital gains (the profits earned upon the sale of securities that have grown in value) and assuming a constant rate of performance each year. The $10,000 table and the fund’s returns do not reflect the deduction of taxes that a shareholder would pay on fund distributions or the redemption of fund shares. During periods of reimbursement by Fidelity, a fund’s total return will be greater than it would be had the reimbursement not occurred. How a fund did yesterday is no guarantee of how it will do tomorrow.
| Average Annual Total Returns | | | | |
| Periods ended July 31, 2005 | | Past 1 | | Past 5 | | Life of |
| | | year | | years | | fundA |
| Institutional Class | | 21.78% | | 2.21% | | 12.13% |
| |
| A From September 3, 1996. | | | | | | |
| | $10,000 Over Life of Fund
|
Let’s say hypothetically that $10,000 was invested in Fidelity Advisor Health Care Fund — Institutional Class on September 3, 1996, when the fund started. The chart shows how the value of your investment would have changed, and also shows how the S&P 500 Index performed over the same period.
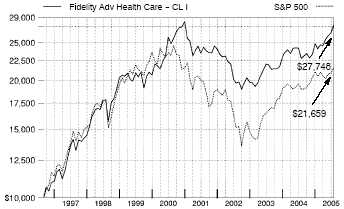
Advisor Health Care Fund — Institutional Class
|
Management’s Discussion of Fund Performance
Comments from Harlan Carere, who became Portfolio Manager of Fidelity® Advisor Health Care Fund on March 23, 2005
A late-inning rally on Wall Street helped push some key U.S. equity indexes to four-year highs by the conclusion of the 12-month period ending July 31, 2005. Spurred on by bullish economic data and strong corporate earnings, investors enjoyed a stellar month of July, capping off a turbulent 12-month period for U.S. equity markets. Stock prices bounced up and down during most of the year, moving in cadence with gyrations in the price of crude oil and investors’ gathering and ebbing concerns about inflation. The Federal Reserve Board raised short-term interest rates eight times during the period, also affecting overall market sentiment. Despite their fluctuations, the major equity indexes finished on a high note, with the Standard & Poor’s 500SM Index and the NASDAQ Composite® Index posting gains of 14.05% and 16.51%, respectively, for the period. The small-cap Russell 2000® Index rose 24.78% and the Russell Midcap® Index jumped 28.93%, while the blue-chips’ Dow Jones Industrial AverageSM advanced only 7.29% .
For the 12 months ending July 31, 2005, Fidelity Advisor Health Care Fund’s Institutional Class shares returned 21.78%, outperforming both the Gold-man Sachs® Health Care Index, which had a total return of 18.58%, and the S&P 500®. Opportune security selection and an underweighting in branded pharmaceuticals, as well as favorable positioning in the rallying biotechnology segment and strong stock picking in health care equipment, provided the biggest lifts to the fund’s performance relative to its sector index. Biotech pioneer Genentech performed well, as did drug distributor McKesson. Under-
weighting such large pharma names as Merck, Eli Lilly and Pfizer — all components of the sector index — also helped, as the industry continued to suffer from drug safety concerns, among other issues. Conversely, although the fund was helped by owning large positions in two managed care companies — UnitedHealth Group and PacifiCare Health Systems — underweighting or not owning several strong-performing names in that segment, among them Aetna, WellPoint Health Networks and Cigna, was the biggest drag on relative performance.
The views expressed in this statement reflect those of the portfolio manager only through the end of the period of the report as stated on the cover and do not necessarily represent the views of Fidelity or any other person in the Fidelity organization. Any such views are subject to change at any time based upon market or other conditions and Fidelity disclaims any responsibility to update such views. These views may not be relied on as investment advice and, because investment decisions for a Fidelity fund are based on numerous factors, may not be relied on as an indication of trading intent on behalf of any Fidelity fund.
Shareholder Expense Example
|
As a shareholder of the Fund, you incur two types of costs: (1) transaction costs, including sales charges (loads) on purchase payments or redemption proceeds, redemption fees, and (2) ongoing costs, including management fees, distribution and/or service (12b-1) fees and other Fund expenses. This Example is intended to help you understand your ongoing costs (in dollars) of investing in the Fund and to compare these costs with the ongoing costs of investing in other mutual funds.
The Example is based on an investment of $1,000 invested at the beginning of the period and held for the entire period (February 1, 2005 to July 31, 2005).
The first line of the table below for each class of the Fund provides information about actual account values and actual expenses. You may use the information in this line, together with the amount you invested, to estimate the expenses that you paid over the period. Simply divide your account value by $1,000.00 (for example, an $8,600 account value divided by $1,000.00 = 8.6), then multiply the result by the number in the first line for a class of the Fund under the heading entitled “Expenses Paid During Period” to estimate the expenses you paid on your account during this period.
Hypothetical Example for Comparison Purposes
|
The second line of the table below for each class of the Fund provides information about hypothetical account values and hypothetical expenses based on a Class’ actual expense ratio and an assumed rate of return of 5% per year before expenses, which is not the Class’ actual return. The hypothetical account values and expenses may not be used to estimate the actual ending account balance or expenses you paid for the period. You may use this information to compare the ongoing costs of investing in the Fund and other funds. To do so, compare this 5% hypothetical example with the 5% hypothetical examples that appear in the shareholder reports of the other funds.
Please note that the expenses shown in the table are meant to highlight your ongoing costs only and do not reflect any transaction costs. Therefore, the second line of the table is useful in comparing ongoing costs only, and will not help you determine the relative total costs of owning different funds. In addition, if these transactional costs were included, your costs would have been higher.
| | | | | | | | | | | Expenses Paid |
| | | Beginning | | | | Ending | | | | During Period* |
| | | Account Value | | | | Account Value | | | | February 1, 2005 |
| | | February 1, 2005 | | | | July 31, 2005 | | | | to July 31, 2005 |
| Class A | | | | | | | | | | |
| Actual | | $ 1,000.00 | | $ | | 1,147.00 | | $ | | 6.81 |
| HypotheticalA | | $ 1,000.00 | | $ | | 1,018.45 | | $ | | 6.41 |
| Class T | | | | | | | | | | |
| Actual | | $ 1,000.00 | | $ | | 1,145.60 | | $ | | 8.14 |
| HypotheticalA | | $ 1,000.00 | | $ | | 1,017.21 | | $ | | 7.65 |
| Class B | | | | | | | | | | |
| Actual | | $ 1,000.00 | | $ | | 1,142.60 | | $ | | 10.78 |
| HypotheticalA | | $ 1,000.00 | | $ | | 1,014.73 | | $ | | 10.14 |
| Class C | | | | | | | | | | |
| Actual | | $ 1,000.00 | | $ | | 1,143.40 | | $ | | 10.42 |
| HypotheticalA | | $ 1,000.00 | | $ | | 1,015.08 | | $ | | 9.79 |
| Institutional Class | | | | | | | | | | |
| Actual | | $ 1,000.00 | | $ | | 1,149.30 | | $ | | 4.64 |
| HypotheticalA | | $ 1,000.00 | | $ | | 1,020.48 | | $ | | 4.36 |
| |
| A 5% return per year before expenses | | | | | | | | | | |
* Expenses are equal to each Class’ annualized expense ratio (shown in the table below); multiplied by the average account value over the period, multiplied by 181/365 (to reflect the one-half year period).
| | | Annualized |
| | | Expense Ratio |
| Class A | | 1.28% |
| Class T | | 1.53% |
| Class B | | 2.03% |
| Class C | | 1.96% |
| Institutional Class | | 87% |
| | Advisor Health Care Fund
Investment Changes
|
| Top Ten Stocks as of July 31, 2005 | | |
| | | % of fund’s | | % of fund’s net assets |
| | | net assets | | 6 months ago |
| UnitedHealth Group, Inc. | | 7.6 | | 7.2 |
| Johnson & Johnson | | 7.0 | | 10.8 |
| Genentech, Inc. | | 6.5 | | 4.7 |
| Amgen, Inc. | | 5.8 | | 5.3 |
| Abbott Laboratories | | 4.3 | | 6.2 |
| Wyeth | | 3.6 | | 3.3 |
| Medtronic, Inc. | | 2.8 | | 7.4 |
| Alcon, Inc. | | 2.6 | | 2.3 |
| WellPoint, Inc. | | 2.5 | | 0.0 |
| McKesson Corp. | | 2.4 | | 2.3 |
| | | 45.1 | | |
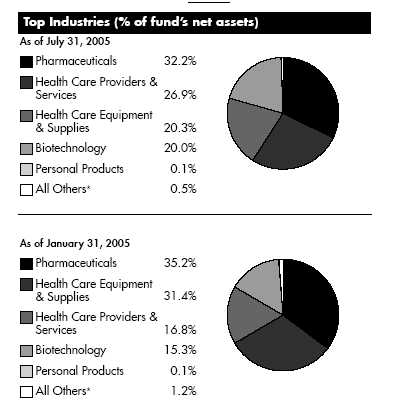
| | * Includes short term investments and net other assets.
Prior period industry classifications reflect the categories in place as of the date
indicated and have not been adjusted to reflect current industry classifications.
|
A-97 Annual Report
Advisor Health Care Fund
Investments July 31, 2005
Showing Percentage of Net Assets
| Common Stocks — 99.5% | | | | | | |
| | | Shares | | Value (Note 1) |
| |
| BIOTECHNOLOGY – 20.0% | | | | | | |
| Biotechnology – 20.0% | | | | | | |
| Affymetrix, Inc. (a) | | 47,400 | | $ | | 2,213,106 |
| Alkermes, Inc. (a) | | 110,864 | | | | 1,718,392 |
| Amgen, Inc. (a)(d) | | 576,400 | | | | 45,967,900 |
| Biogen Idec, Inc. (a) | | 159,800 | | | | 6,278,542 |
| Celgene Corp. (a) | | 1,500 | | | | 71,775 |
| Cephalon, Inc. (a) | | 25,200 | | | | 1,055,880 |
| Charles River Laboratories International, | | | | | | |
| Inc. (a) | | 30,300 | | | | 1,475,610 |
| Chiron Corp. (a) | | 85,000 | | | | 3,079,550 |
| DOV Pharmaceutical, Inc. (a) | | 2,000 | | | | 42,300 |
| Genentech, Inc. (a) | | 583,600 | | | | 52,132,988 |
| Genzyme Corp. (a) | | 125,800 | | | | 9,360,778 |
| Gilead Sciences, Inc. (a) | | 237,800 | | | | 10,655,818 |
| Human Genome Sciences, Inc. (a) | | 128,200 | | | | 1,878,130 |
| ImClone Systems, Inc. (a) | | 39,100 | | | | 1,356,770 |
| Invitrogen Corp. (a) | | 25,400 | | | | 2,178,558 |
| Martek Biosciences (a) | | 15,400 | | | | 671,286 |
| MedImmune, Inc. (a) | | 170,530 | | | | 4,844,757 |
| Millennium Pharmaceuticals, Inc. (a) | | 422,400 | | | | 4,363,392 |
| Neurocrine Biosciences, Inc. (a) | | 110,300 | | | | 5,468,674 |
| OSI Pharmaceuticals, Inc. (a) | | 22,600 | | | | 933,380 |
| Protein Design Labs, Inc. (a) | | 47,200 | | | | 1,075,688 |
| Serologicals Corp. (a) | | 54,500 | | | | 1,253,500 |
| Techne Corp. (a) | | 18,700 | | | | 917,609 |
| Vertex Pharmaceuticals, Inc. (a) | | 42,500 | | | | 677,875 |
| | | | | 159,672,258 |
| |
| HEALTH CARE EQUIPMENT & SUPPLIES – 20.3% | | | | |
| Health Care Equipment – 16.1% | | | | | | |
| Advanced Medical Optics, Inc. (a) | | 102,000 | | | | 4,240,140 |
| Animas Corp. (a)(d) | | 52,500 | | | | 1,098,825 |
| Aspect Medical Systems, Inc. (a) | | 120,000 | | | | 3,960,000 |
| Baxter International, Inc. | | 365,030 | | | | 14,334,728 |
| Beckman Coulter, Inc. | | 67,600 | | | | 3,673,384 |
| Becton, Dickinson & Co. | | 46,600 | | | | 2,580,242 |
| Biomet, Inc. | | 97,575 | | | | 3,720,535 |
| Boston Scientific Corp. (a) | | 66,400 | | | | 1,922,280 |
| C.R. Bard, Inc. | | 31,800 | | | | 2,123,922 |
| Cyberonics, Inc. (a) | | 94,400 | | | | 3,645,728 |
| Cytyc Corp. (a) | | 236,600 | | | | 5,905,536 |
| Dade Behring Holdings, Inc. | | 35,700 | | | | 2,706,060 |
| Epix Pharmaceuticals, Inc. (a) | | 101,700 | | | | 898,011 |
| Fisher Scientific International, Inc. (a) | | 12,400 | | | | 831,420 |
| GN Store Nordic AS | | 277,000 | | | | 3,084,031 |
| Guidant Corp. | | 150,500 | | | | 10,354,400 |
| Hillenbrand Industries, Inc. | | 7,800 | | | | 400,998 |
| Hospira, Inc. (a) | | 3,482 | | | | 133,187 |
| IDEXX Laboratories, Inc. (a) | | 13,300 | | | | 844,018 |
| IntraLase Corp. | | 1,100 | | | | 22,935 |
| Invacare Corp. | | 35,100 | | | | 1,479,465 |
| Kinetic Concepts, Inc. (a) | | 66,900 | | | | 4,011,993 |
| | | Shares | | Value (Note 1) |
| Medtronic, Inc. | | 410,896 | | $ 22,163,730 |
| Novoste Corp. (a)(e) | | 12,500 | | 11,000 |
| ResMed, Inc. (a) | | 80,700 | | 5,406,900 |
| Respironics, Inc. (a) | | 99,400 | | 3,767,260 |
| St. Jude Medical, Inc. (a) | | 261,500 | | 12,397,715 |
| Stereotaxis, Inc. | | 146,224 | | 1,484,174 |
| Syneron Medical Ltd. (d) | | 38,400 | | 1,480,320 |
| Synthes, Inc. | | 33,730 | | 3,659,788 |
| Waters Corp. (a) | | 132,379 | | 5,994,121 |
| Zimmer Holdings, Inc. (a) | | 9,600 | | 790,656 |
| | | | | 129,127,502 |
| Health Care Supplies – 4.2% | | | | |
| Alcon, Inc. | | 177,400 | | 20,321,170 |
| Bausch & Lomb, Inc. | | 31,300 | | 2,649,545 |
| Cooper Companies, Inc. | | 59,700 | | 4,101,390 |
| DENTSPLY International, Inc. | | 36,900 | | 2,057,175 |
| DJ Orthopedics, Inc. (a) | | 69,000 | | 1,692,570 |
| Edwards Lifesciences Corp. (a) | | 100 | | 4,587 |
| Gen-Probe, Inc. (a) | | 22,300 | | 983,207 |
| Millipore Corp. (a) | | 23,700 | | 1,452,099 |
| | | | | 33,261,743 |
| |
| TOTAL HEALTH CARE EQUIPMENT & SUPPLIES | | 162,389,245 |
| |
| HEALTH CARE PROVIDERS & SERVICES – 26.9% | | | | |
| Health Care Distributors & Services – 3.5% | | | | |
| AmerisourceBergen Corp. | | 28,300 | | 2,031,657 |
| Andrx Corp. (a) | | 33,200 | | 615,860 |
| Cardinal Health, Inc. | | 40,000 | | 2,383,200 |
| Henry Schein, Inc. (a) | | 40,900 | | 1,765,653 |
| McKesson Corp. | | 433,800 | | 19,521,000 |
| Patterson Companies, Inc. (a) | | 40,800 | | 1,819,680 |
| | | | | 28,137,050 |
| Health Care Facilities – 2.0% | | | | |
| Community Health Systems, Inc. (a) | | 100,600 | | 3,884,166 |
| HCA, Inc. | | 45,400 | | 2,235,950 |
| LifePoint Hospitals, Inc. (a) | | 22,800 | | 1,066,128 |
| United Surgical Partners International, | | | | |
| Inc. (a) | | 72,388 | | 2,606,692 |
| Universal Health Services, Inc. Class B | | 24,700 | | 1,285,388 |
| VCA Antech, Inc. (a) | | 208,900 | | 4,959,286 |
| | | | | 16,037,610 |
| Health Care Services – 5.6% | | | | |
| American Healthways, Inc. (a) | | 45,500 | | 2,027,935 |
| Caremark Rx, Inc. (a) | | 217,300 | | 9,687,234 |
| Cerner Corp. (a) | | 43,000 | | 3,243,060 |
| Covance, Inc. (a) | | 44,100 | | 2,185,155 |
| DaVita, Inc. (a) | | 61,050 | | 2,884,002 |
| Express Scripts, Inc. (a) | | 68,100 | | 3,561,630 |
| IMS Health, Inc. | | 103,900 | | 2,829,197 |
| Laboratory Corp. of America | | | | |
| Holdings (a) | | 86,100 | | 4,362,687 |
| Lifeline Systems, Inc. (a) | | 16,500 | | 565,950 |
See accompanying notes which are an integral part of the financial statements.
Health Care A-98
| Common Stocks – continued | | | | | | |
| | | Shares | | Value (Note 1) |
| |
| HEALTH CARE PROVIDERS & SERVICES – CONTINUED | | | | |
| Health Care Services – continued | | | | | | |
| Lincare Holdings, Inc. (a) | | 18,300 | | $ | | 738,222 |
| Omnicare, Inc. | | 48,900 | | | | 2,254,290 |
| Pediatrix Medical Group, Inc. (a) | | 29,700 | | | | 2,329,074 |
| Pharmaceutical Product Development, | | | | | | |
| Inc. (a) | | 13,300 | | | | 761,159 |
| Quest Diagnostics, Inc. | | 94,400 | | | | 4,846,496 |
| VistaCare, Inc. Class A (a) | | 85,800 | | | | 1,794,936 |
| WebMD Corp. (a) | | 87,200 | | | | 925,192 |
| | | | | | | 44,996,219 |
| Managed Health Care – 15.8% | | | | | | |
| Aetna, Inc. | | 47,800 | | | | 3,699,720 |
| AMERIGROUP Corp. (a) | | 17,900 | | | | 620,235 |
| Health Net, Inc. (a) | | 393,700 | | | | 15,275,560 |
| Humana, Inc. (a) | | 148,500 | | | | 5,917,725 |
| Molina Healthcare, Inc. (a) | | 41,000 | | | | 981,540 |
| PacifiCare Health Systems, Inc. (a) | | 169,190 | | | | 12,892,278 |
| Sierra Health Services, Inc. (a) | | 23,800 | | | | 1,605,072 |
| UnitedHealth Group, Inc. | | 1,160,700 | | | | 60,704,608 |
| WellChoice, Inc. (a) | | 68,600 | | | | 4,527,600 |
| WellPoint, Inc. (a) | | 284,900 | | | | 20,153,826 |
| | | | | 126,378,164 |
| |
| TOTAL HEALTH CARE PROVIDERS & SERVICES | | 215,549,043 |
| |
| PERSONAL PRODUCTS – 0.1% | | | | | | |
| Personal Products – 0.1% | | | | | | |
| NBTY, Inc. (a) | | 34,800 | | | | 842,160 |
| PHARMACEUTICALS – 32.2% | | | | | | |
| Pharmaceuticals – 32.2% | | | | | | |
| Abbott Laboratories | | 742,620 | | | | 34,628,371 |
| Adams Respiratory Therapeutics, Inc. | | 1,300 | | | | 38,350 |
| Allergan, Inc. | | 145,800 | | | | 13,030,146 |
| American Pharmaceutical Partners, | | | | | | |
| Inc. (a)(d) | | 34,000 | | | | 1,543,260 |
| AstraZeneca PLC sponsored ADR | | 135,300 | | | | 6,148,032 |
| Barr Pharmaceuticals, Inc. (a) | | 47,300 | | | | 2,242,966 |
| Bristol-Myers Squibb Co. | | 22,000 | | | | 549,560 |
| Eli Lilly & Co. | | 28,100 | | | | 1,582,592 |
| Endo Pharmaceuticals Holdings, Inc. (a) . | | 61,400 | | | | 1,747,444 |
| Forest Laboratories, Inc. (a) | | 229,300 | | | | 9,153,656 |
| Hollis-Eden Pharmaceuticals, Inc. (a)(d) . | | 136,500 | | | | 1,235,325 |
| Ista Pharmaceuticals, Inc. (a) | | 72,700 | | | | 725,546 |
| IVAX Corp. (a) | | 220,000 | | | | 5,605,600 |
| Johnson & Johnson | | 871,662 | | | | 55,751,502 |
| King Pharmaceuticals, Inc. (a) | | 96,600 | | | | 1,077,090 |
| Kos Pharmaceuticals, Inc. (a) | | 41,633 | | | | 2,976,760 |
| Medicis Pharmaceutical Corp. Class A | | 24,600 | | | | 834,432 |
| Merck & Co., Inc. | | 252,100 | | | | 7,830,226 |
| MGI Pharma, Inc. (a) | | 31,400 | | | | 857,220 |
| Mylan Laboratories, Inc. | | 61,000 | | | | 1,058,960 |
| | | Shares | | Value (Note 1) |
| Novartis AG sponsored ADR | | 275,900 | | $ 13,439,089 |
| Par Pharmaceutical Companies, Inc. (a) . 15,700 | | 367,694 |
| Pfizer, Inc. | | 562,820 | | 14,914,730 |
| Ranbaxy Laboratories Ltd. sponsored | | | | |
| GDR | | 58,418 | | 654,282 |
| Roche Holding AG (participation | | | | |
| certificate) | | 93,338 | | 12,691,853 |
| Salix Pharmaceuticals Ltd. (a) | | 489,600 | | 9,449,280 |
| Sanofi-Aventis sponsored ADR | | 86,900 | | 3,762,770 |
| Schering-Plough Corp. | | 766,100 | | 15,950,202 |
| Sepracor, Inc. (a) | | 71,700 | | 3,753,495 |
| Taro Pharmaceutical Industries Ltd. (a) | | 3,800 | | 89,262 |
| Teva Pharmaceutical Industries Ltd. | | | | |
| sponsored ADR | | 72,600 | | 2,279,640 |
| Watson Pharmaceuticals, Inc. (a) | | 77,300 | | 2,581,820 |
| Wyeth | | 627,320 | | 28,699,890 |
| | | | | 257,251,045 |
| |
| TOTAL COMMON STOCKS | | | | |
| (Cost $624,171,290) | | | | 795,703,751 |
| |
| Nonconvertible Preferred Stocks — 0.0% | | |
| |
| BIOTECHNOLOGY – 0.0% | | | | |
| Biotechnology – 0.0% | | | | |
| GeneProt, Inc. Series A (a)(f) | | | | |
| (Cost $236,500) | | 43,000 | | 2,365 |
| |
| Money Market Funds — 1.0% | | |
| |
| Fidelity Cash Central Fund, 3.31% (b) | | 3,811,309 | | 3,811,309 |
| Fidelity Securities Lending Cash | | | | |
| Central Fund, 3.32% (b)(c) | | 4,604,700 | | 4,604,700 |
| TOTAL MONEY MARKET FUNDS | | | | |
| (Cost $8,416,009) | | | | 8,416,009 |
| |
| TOTAL INVESTMENT PORTFOLIO - 100.5% | | |
| (Cost $632,823,799) | | 804,122,125 |
| |
| NET OTHER ASSETS – (0.5)% | | | | (4,315,442) |
| NET ASSETS – 100% | | $ 799,806,683 |
| | Legend
(a) Non-income producing
(b) Affiliated fund that is available only to investment companies and other
accounts managed by Fidelity Investments. The rate quoted is the
annualized seven-day yield of the fund at period end. A complete listing
of the fund’s holdings as of its most recent quarter end is available upon
request.
(c) Includes investment made with cash collateral received from securities on
loan.
(d) Security or a portion of the security is on loan at period end.
|
See accompanying notes which are an integral part of the financial statements.
A-99 Annual Report
Investments - continued
(e) Security exempt from registration under Rule 144A of the Securities Act of
1933. These securities may be resold in transactions exempt from
registration, normally to qualified institutional buyers. At the period end,
the value of these securities amounted to $11,000 or 0.0% of net assets.
(f) Restricted securities – Investment in securities not registered under the
Securities Act of 1933 (excluding 144A issues). At the end of the period,
the value of restricted securities (excluding 144A issues) amounted to
$2,365 or 0.0% of net assets.
|
Additional information on each holding is as follows:
| Security | | Acquisition Date | | | | Acquisition Cost |
| GeneProt, Inc. Series A | | 7/7/00 | | $ | | 236,500 |
At July 31, 2005, the fund had a capital loss carryforward of approximately $25,340,648 of which $11,940,350 and $13,400,298 will expire on July 31, 2010 and 2011, respectively.
See accompanying notes which are an integral part of the financial statements.
Health Care A-100
|
Advisor Health Care Fund
Financial Statements
|
| Statement of Assets and Liabilities | | |
| | | | | | | July 31, 2005 |
| Assets | | | | | | |
| Investment in securities, at value (in- | | | | |
| cluding securities loaned of | | | | | | |
| $4,486,423) (cost $632,823,799) | | | | |
| — See accompanying schedule | | | | $ | | 804,122,125 |
| Receivable for investments sold | | | | | | 18,366,601 |
| Receivable for fund shares sold | | | | | | 651,819 |
| Dividends receivable | | | | | | 251,356 |
| Interest receivable | | | | | | 18,643 |
| Prepaid expenses | | | | | | 1,298 |
| Other affiliated receivables | | | | | | 2 |
| Other receivables | | | | | | 143,244 |
| Total assets | | | | | | 823,555,088 |
| Liabilities | | | | | | |
| Payable for investments purchased | | $ | | 16,351,283 | | |
| Payable for fund shares redeemed | | | | 1,657,170 | | |
| Accrued management fee | | | | 375,282 | | |
| Distribution fees payable | | | | 455,399 | | |
| Other affiliated payables | | | | 265,459 | | |
| Other payables and accrued expenses | | 39,112 | | |
| Collateral on securities loaned, at value | | 4,604,700 | | |
| Total liabilities | | | | | | 23,748,405 |
| Net Assets | | | | $ | | 799,806,683 |
| Net Assets consist of: | | | | | | |
| Paid in capital | | | | $ | | 658,653,822 |
| Accumulated net investment loss | | | | | | (458) |
| Accumulated undistributed net realized | | | | |
| gain (loss) on investments and for- | | | | |
| eign currency transactions | | | | | | (30,145,511) |
| Net unrealized appreciation (depreci- | | | | |
| ation) on investments and assets and | | | | |
| liabilities in foreign currencies | | | | | | 171,298,830 |
| Net Assets | | | | $ | | 799,806,683 |
| Calculation of Maximum Offering Price | | | | |
| Class A: | | | | | | |
| Net Asset Value and redemption | | | | | | |
| price per share ($139,158,345 ÷ | | | | |
| 6,067,435 shares) | | | | $ | | 22.94 |
| Maximum offering price per share | | | | | | |
| (100/94.25 of $22.94) | | | | $ | | 24.34 |
| Class T: | | | | | | |
| Net Asset Value and redemption | | | | | | |
| price per share ($243,353,498 ÷ | | | | |
| 10,816,836 shares) | | | | $ | | 22.50 |
| Maximum offering price per share | | | | | | |
| (100/96.50 of $22.50) | | | | $ | | 23.32 |
| Class B: | | | | | | |
| Net Asset Value and offering price | | | | |
| per share ($266,319,223 ÷ | | | | | | |
| 12,355,425 shares)A | | | | $ | | 21.55 |
| Class C: | | | | | | |
| Net Asset Value and offering price | | | | |
| per share ($131,277,330 ÷ | | | | | | |
| 6,075,551 shares)A | | | | $ | | 21.61 |
| Institutional Class: | | | | | | |
| Net Asset Value, offering price and | | | | |
| redemption price per share | | | | | | |
| ($19,698,287 ÷ 839,004 shares) | | $ | | 23.48 |
A Redemption price per share is equal to net asset value less any applicable contingent deferred sales charge.
| Statement of Operations | | | | |
| | | | | Year ended July 31, 2005 |
| Investment Income | | | | | | |
| Dividends | | | | $ | | 7,697,400 |
| Interest | | | | | | 181,289 |
| Security lending | | | | | | 24,222 |
| Total income | | | | | | 7,902,911 |
| Expenses | | | | | | |
| Management fee | | $ | | 4,383,043 | | |
| Transfer agent fees | | | | 2,974,563 | | |
| Distribution fees | | | | 5,422,220 | | |
| Accounting and security lending | | | | | | |
| fees | | | | 284,017 | | |
| Independent trustees’ compensation | | 4,013 | | |
| Custodian fees and expenses | | | | 18,728 | | |
| Registration fees | | | | 71,099 | | |
| Audit | | | | 47,193 | | |
| Legal | | | | 2,889 | | |
| Miscellaneous | | | | 23,550 | | |
| Total expenses before reductions | | 13,231,315 | | |
| Expense reductions | | | | (211,590) | | 13,019,725 |
| |
| Net investment income (loss) | | | | | | (5,116,814) |
| Realized and Unrealized Gain (Loss) | | | | |
| Net realized gain (loss) on: | | | | | | |
| Investment securities | | | | 26,779,783 | | |
| Foreign currency transactions | | | | 12,468 | | |
| Total net realized gain (loss) | | | | | | 26,792,251 |
| Change in net unrealized appreci- | | | | |
| ation (depreciation) on: | | | | | | |
| Investment securities | | | | 122,599,208 | | |
| Assets and liabilities in foreign | | | | | | |
| currencies | | | | 504 | | |
| Total change in net unrealized ap- | | | | |
| preciation (depreciation) | | | | | | 122,599,712 |
| Net gain (loss) | | | | | | 149,391,963 |
| Net increase (decrease) in net as- | | | | |
| sets resulting from operations | | | | $ | | 144,275,149 |
See accompanying notes which are an integral part of the financial statements.
Advisor Health Care Fund
Financial Statements - continued
| Statement of Changes in Net Assets | | | | | | |
| | | Year ended | | | | Year ended |
| | | July 31, | | | | July 31, |
| | | 2005 | | | | 2004 |
| Increase (Decrease) in Net Assets | | | | | | |
| Operations | | | | | | |
| Net investment income (loss) | | $ (5,116,814) | | $ | | (6,048,059) |
| Net realized gain (loss) | | 26,792,251 | | | | 55,619,069 |
| Change in net unrealized appreciation (depreciation) | | 122,599,712 | | | | (24,655,778) |
| Net increase (decrease) in net assets resulting from operations | | 144,275,149 | | | | 24,915,232 |
| Share transactions -- net increase (decrease) | | (127,767,624) | | | | (106,348,165) |
| Redemption fees | | 24,114 | | | | 55,534 |
| Total increase (decrease) in net assets | | 16,531,639 | | | | (81,377,399) |
| |
| Net Assets | | | �� | | | |
| Beginning of period | | 783,275,044 | | | | 864,652,443 |
| End of period (including accumulated net investment loss of $458 and accumulated net investment loss of $581, | | | | | | |
| respectively) | | $ 799,806,683 | | $ | | 783,275,044 |
| Financial Highlights — Class A | | | | | | | | | | |
| Years ended July 31, | | 2005 | | 2004 | | 2003 | | 2002 | | 2001 |
| Selected Per-Share Data | | | | | | | | | | |
| Net asset value, beginning of period | | $ 18.91 | | $ 18.29 | | $ 16.51 | | $ 20.41 | | $ 22.02 |
| Income from Investment Operations | | | | | | | | | | |
| Net investment income (loss)C | | (.05) | | (.05) | | —E | | (.04) | | .01 |
| Net realized and unrealized gain (loss) | | 4.08 | | .67 | | 1.78 | | (3.86) | | (.50) |
| Total from investment operations | | 4.03 | | .62 | | 1.78 | | (3.90) | | (.49) |
| Distributions from net realized gain | | — | | — | | — | | — | | (1.12) |
| Redemption fees added to paid in capitalC | | —E | | —E | | —E | | —E | | —E |
| Net asset value, end of period | | $ 22.94 | | $ 18.91 | | $ 18.29 | | $ 16.51 | | $ 20.41 |
| Total ReturnA,B | | 21.31% | | 3.39% | | 10.78% | | (19.11)% | | (2.50)% |
| Ratios to Average Net AssetsD | | | | | | | | | | |
| Expenses before expense reductions | | 1.28% | | 1.32% | | 1.34% | | 1.29% | | 1.19% |
| Expenses net of voluntary waivers, if any | | 1.28% | | 1.32% | | 1.34% | | 1.29% | | 1.19% |
| Expenses net of all reductions | | 1.26% | | 1.29% | | 1.27% | | 1.24% | | 1.17% |
| Net investment income (loss) | | (.22)% | | (.26)% | | (.01)% | | (.23)% | | .05% |
| Supplemental Data | | | | | | | | | | |
| Net assets, end of period (000 omitted) | | $ 139,158 | | $ 104,258 | | $ 108,692 | | $ 103,292 | | $ 136,304 |
| Portfolio turnover rate | | 71% | | 60% | | 120% | | 167% | | 71% |
A Total returns would have been lower had certain expenses not been reduced during the periods shown. B Total returns do not include the effect of the sales charges.
C Calculated based on average shares outstanding during the period.
D Expense ratios reflect operating expenses of the class. Expenses before reductions do not reflect amounts reimbursed by the investment adviser or reductions from brokerage service arrangements or other expense offset arrangements and do not represent the amount paid by the class during periods when reimbursements or reductions occur. Expenses net of any voluntary waivers reflect expenses after reimbursement by the investment adviser but prior to reductions from broker age service arrangements or other expense offset arrangements. Expenses net of all reductions represent the net expenses paid by the class.
E Amount represents less than $.01 per share.
See accompanying notes which are an integral part of the financial statements.
Health Care A-102
| Financial Highlights — Class T | | | | | | | | | | |
| Years ended July 31, | | 2005 | | 2004 | | 2003 | | 2002 | | 2001 |
| Selected Per-Share Data | | | | | | | | | | |
| Net asset value, beginning of period | | $ 18.60 | | $ 18.03 | | $ 16.31 | | $ 20.22 | | $ 21.87 |
| Income from Investment Operations | | | | | | | | | | |
| Net investment income (loss)C | | (.09) | | (.09) | | (.04) | | (.09) | | (.04) |
| Net realized and unrealized gain (loss) | | 3.99 | | .66 | | 1.76 | | (3.82) | | (.49) |
| Total from investment operations | | 3.90 | | .57 | | 1.72 | | (3.91) | | (.53) |
| Distributions from net realized gain | | — | | — | | — | | — | | (1.12) |
| Redemption fees added to paid in capitalC | | —E | | —E | | —E | | —E | | —E |
| Net asset value, end of period | | $ 22.50 | | $ 18.60 | | $ 18.03 | | $ 16.31 | | $ 20.22 |
| Total ReturnA,B | | 20.97% | | 3.16% | | 10.55% | | (19.34)% | | (2.71)% |
| Ratios to Average Net AssetsD | | | | | | | | | | |
| Expenses before expense reductions | | 1.53% | | 1.56% | | 1.59% | | 1.52% | | 1.43% |
| Expenses net of voluntary waivers, if any | | 1.53% | | 1.56% | | 1.59% | | 1.52% | | 1.43% |
| Expenses net of all reductions | | 1.51% | | 1.53% | | 1.51% | | 1.47% | | 1.41% |
| Net investment income (loss) | | (.47)% | | (.51)% | | (.26)% | | (.46)% | | (.18)% |
| Supplemental Data | | | | | | | | | | |
| Net assets, end of period (000 omitted) | | $ 243,353 | | $ 243,176 | | $ 264,115 | | $ 274,243 | | $ 383,643 |
| Portfolio turnover rate | | 71% | | 60% | | 120% | | 167% | | 71% |
A Total returns would have been lower had certain expenses not been reduced during the periods shown.
B Total returns do not include the effect of the sales charges.
C Calculated based on average shares outstanding during the period.
D Expense ratios reflect operating expenses of the class. Expenses before reductions do not reflect amounts reimbursed by the investment adviser or reductions from brokerage service arrangements or other expense offset arrangements and do not
represent the amount paid by the class during periods when reimbursements or reductions occur. Expenses net of any voluntary waivers reflect expenses after reimbursement by the investment adviser but prior to reductions from brokerage service
arrangements or other expense offset arrangements. Expenses net of all reductions represent the net expenses paid by the class.
E Amount represents less than $.01 per share.
|
| Financial Highlights — Class B | | | | | | | | | | |
| Years ended July 31, | | 2005 | | 2004 | | 2003 | | 2002 | | 2001 |
| Selected Per-Share Data | | | | | | | | | | |
| Net asset value, beginning of period | | $ 17.91 | | $ 17.45 | | $ 15.86 | | $ 19.76 | | $ 21.50 |
| Income from Investment Operations | | | | | | | | | | |
| Net investment income (loss)C | | (.19) | | (.18) | | (.12) | | (.18) | | (.14) |
| Net realized and unrealized gain (loss) | | 3.83 | | .64 | | 1.71 | | (3.72) | | (.48) |
| Total from investment operations | | 3.64 | | .46 | | 1.59 | | (3.90) | | (.62) |
| Distributions from net realized gain | | — | | — | | — | | — | | (1.12) |
| Redemption fees added to paid in capitalC | | —E | | —E | | —E | | —E | | —E |
| Net asset value, end of period | | $ 21.55 | | $ 17.91 | | $ 17.45 | | $ 15.86 | | $ 19.76 |
| Total ReturnA,B | | 20.32% | | 2.64% | | 10.03% | | (19.74)% | | (3.20)% |
| Ratios to Average Net AssetsD | | | | | | | | | | |
| Expenses before expense reductions | | 2.04% | | 2.06% | | 2.05% | | 2.02% | | 1.95% |
| Expenses net of voluntary waivers, if any | | 2.04% | | 2.06% | | 2.05% | | 2.02% | | 1.95% |
| Expenses net of all reductions | | 2.01% | | 2.03% | | 1.98% | | 1.98% | | 1.93% |
| Net investment income (loss) | | (.98)% | | (1.01)% | | (.73)% | | (.97)% | | (.70)% |
| Supplemental Data | | | | | | | | | | |
| Net assets, end of period (000 omitted) | | $ 266,319 | | $ 285,299 | | $ 317,906 | | $ 334,056 | | $ 456,851 |
| Portfolio turnover rate | | 71% | | 60% | | 120% | | 167% | | 71% |
A Total returns would have been lower had certain expenses not been reduced during the periods shown.
B Total returns do not include the effect of the contingent deferred sales charge.
C Calculated based on average shares outstanding during the period.
D Expense ratios reflect operating expenses of the class. Expenses before reductions do not reflect amounts reimbursed by the investment adviser or reductions from brokerage service arrangements or other expense offset arrangements and do not
represent the amount paid by the class during periods when reimbursements or reductions occur. Expenses net of any voluntary waivers reflect expenses after reimbursement by the investment adviser but prior to reductions from brokerage service
arrangements or other expense offset arrangements. Expenses net of all reductions represent the net expenses paid by the class.
E Amount represents less than $.01 per share.
|
See accompanying notes which are an integral part of the financial statements.
|
| Financial Highlights — Class C | | | | | | | | | | |
| Years ended July 31, | | 2005 | | 2004 | | 2003 | | 2002 | | 2001 |
| Selected Per-Share Data | | | | | | | | | | |
| Net asset value, beginning of period | | $ 17.94 | | $ 17.47 | | $ 15.87 | | $ 19.76 | | $ 21.50 |
| Income from Investment Operations | | | | | | | | | | |
| Net investment income (loss)C | | (.17) | | (.17) | | (.11) | | (.17) | | (.14) |
| Net realized and unrealized gain (loss) | | 3.84 | | .64 | | 1.71 | | (3.72) | | (.48) |
| Total from investment operations | | 3.67 | | .47 | | 1.60 | | (3.89) | | (.62) |
| Distributions from net realized gain | | — | | — | | — | | — | | (1.12) |
| Redemption fees added to paid in capitalC | | —E | | —E | | —E | | —E | | —E |
| Net asset value, end of period | | $ 21.61 | | $ 17.94 | | $ 17.47 | | $ 15.87 | | $ 19.76 |
| Total ReturnA,B | | 20.46% | | 2.69% | | 10.08% | | (19.69)% | | (3.20)% |
| Ratios to Average Net AssetsD | | | | | | | | | | |
| Expenses before expense reductions | | 1.97% | | 2.00% | | 2.00% | | 1.97% | | 1.91% |
| Expenses net of voluntary waivers, if any | | 1.97% | | 2.00% | | 2.00% | | 1.97% | | 1.91% |
| Expenses net of all reductions | | 1.94% | | 1.97% | | 1.92% | | 1.93% | | 1.89% |
| Net investment income (loss) | | (.91)% | | (.95)% | | (.67)% | | (.92)% | | (.66)% |
| Supplemental Data | | | | | | | | | | |
| Net assets, end of period (000 omitted) | | $ 131,277 | | $ 130,184 | | $ 150,576 | | $ 160,877 | | $ 229,494 |
| Portfolio turnover rate | | 71% | | 60% | | 120% | | 167% | | 71% |
A Total returns would have been lower had certain expenses not been reduced during the periods shown.
B Total returns do not include the effect of the contingent deferred sales charge.
C Calculated based on average shares outstanding during the period.
D Expense ratios reflect operating expenses of the class. Expenses before reductions do not reflect amounts reimbursed by the investment adviser or reductions from brokerage service arrangements or other expense offset arrangements and do not
represent the amount paid by the class during periods when reimbursements or reductions occur. Expenses net of any voluntary waivers reflect expenses after reimbursement by the investment adviser but prior to reductions from brokerage service
arrangements or other expense offset arrangements. Expenses net of all reductions represent the net expenses paid by the class.
E Amount represents less than $.01 per share.
|
| Financial Highlights — Institutional Class | | | | | | | | | | |
| Years ended July 31, | | 2005 | | 2004 | | 2003 | | 2002 | | 2001 |
| Selected Per-Share Data | | | | | | | | | | |
| Net asset value, beginning of period | | $ 19.28 | | $ 18.58 | | $ 16.70 | | $ 20.58 | | $ 22.13 |
| Income from Investment Operations | | | | | | | | | | |
| Net investment income (loss)B | | 04 | | .03 | | .06 | | .02 | | .07 |
| Net realized and unrealized gain (loss) | | 4.16 | | .67 | | 1.82 | | (3.90) | | (.50) |
| Total from investment operations | | 4.20 | | .70 | | 1.88 | | (3.88) | | (.43) |
| Distributions from net realized gain | | — | | — | | — | | — | | (1.12) |
| Total distributions | | — | | — | | — | | — | | (1.12) |
| Redemption fees added to paid in capitalB | | —D | | —D | | —D | | —D | | —D |
| Net asset value, end of period | | $ 23.48 | | $ 19.28 | | $ 18.58 | | $ 16.70 | | $ 20.58 |
| Total ReturnA | | 21.78% | | 3.77% | | 11.26% | | (18.85)% | | (2.21)% |
| Ratios to Average Net AssetsC | | | | | | | | | | |
| Expenses before expense reductions | | 88% | | .91% | | .96% | | .95% | | .91% |
| Expenses net of voluntary waivers, if any | | 88% | | .91% | | .96% | | .95% | | .91% |
| Expenses net of all reductions | | 85% | | .88% | | .88% | | .90% | | .89% |
| Net investment income (loss) | | 18% | | .14% | | .37% | | .11% | | .33% |
| Supplemental Data | | | | | | | | | | |
| Net assets, end of period (000 omitted) | | $ 19,698 | | $ 20,358 | | $ 23,364 | | $ 35,923 | | $ 45,200 |
| Portfolio turnover rate | | 71% | | 60% | | 120% | | 167% | | 71% |
A Total returns would have been lower had certain expenses not been reduced during the periods shown.
B Calculated based on average shares outstanding during the period.
C Expense ratios reflect operating expenses of the class. Expenses before reductions do not reflect amounts reimbursed by the investment adviser or reductions from brokerage service arrangements or other expense offset arrangements and do not
represent the amount paid by the class during periods when reimbursements or reductions occur. Expenses net of any voluntary waivers reflect expenses after reimbursement by the investment adviser but prior to reductions from brokerage service
arrangements or other expense offset arrangements. Expenses net of all reductions represent the net expenses paid by the class.
D Amount represents less than $.01 per share.
|
See accompanying notes which are an integral part of the financial statements.
Health Care A-104
|
Notes to Financial Statements
For the period ended July 31, 2005
|
1. Significant Accounting Policies.
|
Fidelity Advisor Health Care Fund (the fund) is a non-diversified fund of Fidelity Advisor Series VII (the trust) and is authorized to issue an unlimited number of shares. The trust is registered under the Investment Company Act of 1940, as amended (the 1940 Act), as an open-end management investment company organized as a Massachusetts business trust.
The fund offers Class A, Class T, Class B, Class C, and Institutional Class shares, each of which has equal rights as to assets and voting privileges. Each class has exclusive voting rights with respect to matters that affect that class. Class B shares will automatically convert to Class A shares after a holding period of seven years from the initial date of purchase. Investment income, realized and unrealized capital gains and losses, the common expenses of the fund, and certain fund-level expense reductions, if any, are allocated on a pro rata basis to each class based on the relative net assets of each class to the total net assets of the fund. Each class differs with respect to transfer agent and distribution and service plan fees incurred. Certain expense reductions also differ by class.
The financial statements have been prepared in conformity with accounting principles generally accepted in the United States of America, which require management to make certain estimates and assumptions at the date of the financial statements. The following summarizes the significant accounting policies of the fund:
Security Valuation. Net asset value per share (NAV calculation) is calculated as of the close of business of the New York Stock Exchange, normally 4:00 p.m. Eastern time. Equity securities, including restricted securities, for which market quotations are available are valued at the last sale price or official closing price (closing bid price or last evaluated quote if no sale has occurred) on the primary market or exchange on which they trade. If prices are not readily available or do not accurately reflect fair value for a security, or if a security’s value has been materially affected by events occurring after the close of the exchange or market on which the security is principally traded, that security may be valued by another method that the Board of Trustees believes accurately reflects fair value. A security’s valuation may differ depending on the method used for determining value. Price movements in futures contracts and ADRs, market and trading trends, the bid/ask quotes of brokers and off-exchange institutional trading may be reviewed in the course of making a good faith determination of a security’s fair value. Short-term securities with remaining maturities of sixty days or less for which quotations are not readily available are valued on the basis of amortized cost. Investments in open-end investment companies are valued at their net asset value each business day.
Foreign Currency. The fund uses foreign currency contracts to facilitate transactions in foreign-denominated securities. Losses from these transactions may arise from changes in the value of the foreign currency or if the counterparties do not perform under the contracts’ terms.
Foreign-denominated assets, including investment securities, and liabilities are translated into U.S. dollars at the exchange rate at period end. Purchases and sales of investment securities, income and dividends received and expenses denominated in foreign currencies are translated into U.S. dollars at the exchange rate in effect on the transaction date.
The effects of exchange rate fluctuations on investments are included with the net realized and unrealized gain (loss) on investment securities. Other foreign currency transactions resulting in realized and unrealized gain (loss) are disclosed separately.
Investment Transactions and Income. Security transactions are accounted for as of trade date. Gains and losses on securities sold are determined on the basis of identified cost and may include proceeds received from litigation. Dividend income is recorded on the ex-dividend date, except for certain dividends from foreign securities where the ex-dividend date may have passed, which are recorded as soon as the fund is informed of the ex-dividend date. Non-cash dividends included in dividend income, if any, are recorded at the fair market value of the securities received. Interest income is accrued as earned. Interest income includes coupon interest and amortization of premium and accretion of discount on debt securities. Investment income is recorded net of foreign taxes withheld where recovery of such taxes is uncertain.
Expenses. Most expenses of the trust can be directly attributed to a fund. Expenses which cannot be directly attributed are apportioned among each fund in the trust.
Income Tax Information and Distributions to Shareholders. Each year, the fund intends to qualify as a regulated investment company by distributing all of its taxable income and realized gains under Subchapter M of the Internal Revenue Code. As a result, no provision for income taxes is required in the accompanying financial statements. Foreign taxes are provided for based on the fund’s understanding of the tax rules and rates that exist in the foreign markets in which it invests.
Distributions are recorded on the ex-dividend date. Income dividends and capital gain distributions are declared separately for each class. Income and capital gain distributions are determined in accordance with income tax regulations, which may differ from generally accepted accounting principles. Capital accounts within the financial statements are adjusted for permanent book-tax differences. These adjustments have no impact on net assets or the results of operations. Temporary book-tax differences will reverse in a subsequent period.
Book-tax differences are primarily due to foreign currency transactions, deferred trustees compensation, net operating losses, capital loss carryfor-wards and losses deferred due to wash sales and excise tax regulations.
Notes to Financial Statements - continued
1. Significant Accounting Policies - continued
Income Tax Information and Distributions to Shareholders - continued
The tax-basis components of distributable earnings and the federal tax cost as of period end were as follows:
|
| Unrealized appreciation | | $ 180,660,922 |
| Unrealized depreciation | | (12,288,783) |
| Net unrealized appreciation (depreciation) | | 168,372,139 |
| Capital loss carryforward | | (25,340,648) |
| |
| Cost for federal income tax purposes | | $ 635,749,986 |
Short-Term Trading (Redemption) Fees. Shares held in the fund less than 60 days are subject to a redemption fee equal to 1.00% of the proceeds of the redeemed shares. All redemption fees, including any estimated redemption fees paid by Fidelity Management & Research Company (FMR), are retained by the fund and accounted for as an addition to paid in capital.
Repurchase Agreements. FMR has received an Exemptive Order from the Securities and Exchange Commission (the SEC) which permits the fund and other affiliated entities of FMR to transfer uninvested cash balances into joint trading accounts which are then invested in repurchase agreements. The fund may also invest directly with institutions in repurchase agreements. Repurchase agreements are collateralized by government or non-government securities. Collateral is held in segregated accounts with custodian banks and may be obtained in the event of a default of the counterparty. The fund monitors, on a daily basis, the value of the collateral to ensure it is at least equal to the principal amount of the repurchase agreement (including accrued interest). In the event of a default by the counterparty, realization of the collateral proceeds could be delayed, during which time the value of the collateral may decline.
Restricted Securities. The fund may invest in securities that are subject to legal or contractual restrictions on resale. These securities generally may be resold in transactions exempt from registration or to the public if the securities are registered. Disposal of these securities may involve time-consuming negotiations and expense, and prompt sale at an acceptable price may be difficult. Information regarding restricted securities is included at the end of the fund’s Schedule of Investments.
3. Purchases and Sales of Investments.
Purchases and sales of securities, other than short-term securities and U.S. government securities, aggregated $537,295,495 and $668,685,843, respectively.
4. Fees and Other Transactions with Affiliates.
Management Fee. FMR and its affiliates provide the fund with investment management related services for which the fund pays a monthly management fee. The management fee is the sum of an individual fund fee rate that is based on an annual rate of .30% of the fund’s average net assets and a group fee rate that averaged .27% during the period. The group fee rate is based upon the average net assets of all the mutual funds advised by FMR. The group fee rate decreases as assets under management increase and increases as assets under management decrease. For the period, the total annual management fee rate was .57% of the fund’s average net assets.
Distribution and Service Plan. In accordance with Rule 12b-1 of the 1940 Act, the fund has adopted separate Distribution and Service Plans for each class of shares. Certain classes pay Fidelity Distributors Corporation (FDC), an affiliate of FMR, separate Distribution and Service Fees, each of which is based on an annual percentage of each class’ average net assets. In addition, FDC may pay financial intermediaries for selling shares of the fund and providing shareholder support services. For the period, the Distribution and Service Fee rates and the total amounts paid to and retained by FDC were as follows:
| | | Distribution | | Service | | | | Paid to | | | | Retained |
| | | Fee | | Fee | | | | FDC | | | | by FDC |
| Class A | | 0% | | .25% | | $ | | 283,018 | | $ | | 520 |
| Class T | | 25% | | .25% | | | | 1,181,016 | | | | 7,912 |
| Class B | | 75% | | .25% | | | | 2,707,471 | | | | 2,032,380 |
| Class C | | 75% | | .25% | | | | 1,250,715 | | | | 102,040 |
| |
| | | | | | | $ | | 5,422,220 | | $ | | 2,142,852 |
4. Fees and Other Transactions with Affiliates - continued
Sales Load. FDC receives a front-end sales charge of up to 5.75% for selling Class A shares, and 3.50% for selling Class T shares, some of which is paid to financial intermediaries for selling shares of the fund. FDC receives the proceeds of contingent deferred sales charges levied on Class A, Class T, Class B, and Class C redemptions. These charges depend on the holding period. The deferred sales charges range from 5% to 1% for Class B, 1% for Class C, and .25% for certain purchases of Class A and Class T shares.
For the period, sales charge amounts retained by FDC were as follows:
| | | | | Retained |
| | | | | by FDC |
| Class A | | $ | | 45,779 |
| Class T | | | | 30,312 |
| Class B* | | | | 683,940 |
| Class C* | | | | 18,704 |
| | | $ | | 778,735 |
| |
| * When Class B and Class C shares are initially sold, FDC pays commissions from its own resources to financial intermediaries through which the sales are made. | | | | |
Transfer Agent Fees. Fidelity Investments Institutional Operations Company, Inc. (FIIOC), an affiliate of FMR, is the transfer, dividend disbursing and shareholder servicing agent for each class of the fund. FIIOC receives account fees and asset-based fees that vary according to the account size and type of account of the shareholders of the respective classes of the fund. FIIOC pays for typesetting, printing and mailing of shareholder reports, except proxy statements. For the period the total transfer agent fees paid by each class to FIIOC, were as follows:
| | | | | | | % of |
| | | | | | | Average |
| | | | | Amount | | Net Assets |
| Class A | | $ | | 455,830 | | .40 |
| Class T | | | | 950,840 | | .40 |
| Class B | | | | 1,100,688 | | .41 |
| Class C | | | | 419,992 | | .34 |
| Institutional Class | | | | 47,213 | | .24 |
| |
| | | $ | | 2,974,563 | | |
Accounting and Security Lending Fees. Fidelity Service Company, Inc. (FSC), an affiliate of FMR, maintains the fund’s accounting records. The accounting fee is based on the level of average net assets for the month. Under a separate contract, FSC administers the security lending program. The security lending fee is based on the number and duration of lending transactions.
Central Funds. The fund may invest in affiliated Central Funds managed by Fidelity Investments Money Management, Inc. (FIMM) an affiliate of FMR. The Central Funds are open-end investment companies available only to investment companies and other accounts managed by FMR and its affiliates. The Money Market Central Funds seek preservation of capital and current income. The Central Funds do not pay a management fee. Income distributions earned by the fund are recorded as income in the accompanying financial statements and totaled $261,668 for the period.
Brokerage Commissions. The fund placed a portion of its portfolio transactions with brokerage firms which are affiliates of the investment adviser. The commissions paid to these affiliated firms were $9,896 for the period.
| | 5. Committed Line of Credit.
|
The fund participates with other funds managed by FMR in a $4.2 billion credit facility (the “line of credit”) to be utilized for temporary or emergency purposes to fund shareholder redemptions or for other short-term liquidity purposes. The fund has agreed to pay commitment fees on its pro rata portion of the line of credit. During the period, there were no borrowings on this line of credit.
The fund lends portfolio securities from time to time in order to earn additional income. The fund receives collateral (in the form of U.S. Treasury obligations, letters of credit and/or cash) against the loaned securities and maintains collateral in an amount not less than 100% of the market value of the loaned securities during the period of the loan. The market value of the loaned securities is determined at the close of business of the fund and any additional required collateral is delivered to the fund on the next business day. If the borrower defaults on its obligation to return the securities loaned because of insolvency or other reasons, a fund could experience delays and costs in recovering the securities loaned or in gaining access to the collateral. Cash collateral is invested in the Fidelity Securities Lending Cash Central Fund. The value of loaned securities and cash collateral at period end are disclosed on the fund’s Statement of Assets and Liabilities.
Notes to Financial Statements - continued
7. Expense Reductions.
|
Many of the brokers with whom FMR places trades on behalf of the fund provided services to the fund in addition to trade execution. These services included payments of certain expenses on behalf of the fund totaling $209,473 for the period. In addition, through arrangements with the fund’s transfer agent, credits realized as a result of uninvested cash balances were used to reduce the fund’s expenses. During the period, credits reduced each class’ transfer agent expense as noted in the table below.
| | | Transfer Agent |
| | | expense reduction |
| Class A | | $ 2,117 |
| |
| 8. Other. | | |
The fund’s organizational documents provide former and current trustees and officers with a limited indemnification against liabilities arising in connection with the performance of their duties to the fund. In the normal course of business, the fund may also enter into contracts that provide general indemnifications. The fund’s maximum exposure under these arrangements is unknown as this would be dependent on future claims that may be made against the fund. The risk of material loss from such claims is considered remote.
9. Share Transactions.
Transactions for each class of shares were as follows:
|
| | | | | Shares | | | | | | Dollars |
| Years ended July 31, | | 2005 | | | | 2004 | | 2005 | | | | 2004 |
| Class A | | | | | | | | | | | | |
| Shares sold | | 2,249,275 | | | | 1,326,830 | | $ 46,669,256 | | $ | | 25,583,854 |
| Shares redeemed | | (1,695,541) | | | | (1,754,987) | | (34,388,787) | | | | (33,233,576) |
| Net increase (decrease) | | 553,734 | | | | (428,157) | | $ 12,280,469 | | $ | | (7,649,722) |
| Class T | | | | | | | | | | | | |
| Shares sold | | 1,442,910 | | | | 2,113,234 | | $ 29,136,425 | | $ | | 40,035,265 |
| Shares redeemed | | (3,703,075) | | | | (3,681,338) | | (73,845,453) | | | | (68,961,682) |
| Net increase (decrease) | | (2,260,165) | | | | (1,568,104) | | $ (44,709,028) | | $ | | (28,926,417) |
| Class B | | | | | | | | | | | | |
| Shares sold | | 688,188 | | | | 1,131,221 | | $ 13,318,322 | | $ | | 20,552,323 |
| Shares redeemed | | (4,265,630) | | | | (3,413,291) | | (81,968,667) | | | | (61,904,937) |
| Net increase (decrease) | | (3,577,442) | | | | (2,282,070) | | $ (68,650,345) | | $ | | (41,352,614) |
| Class C | | | | | | | | | | | | |
| Shares sold | | 718,291 | | | | 865,725 | | $ 14,077,610 | | $ | | 15,749,574 |
| Shares redeemed | | (1,900,462) | | | | (2,225,887) | | (36,319,943) | | | | (40,266,820) |
| Net increase (decrease) | | (1,182,171) | | | | (1,360,162) | | $ (22,242,333) | | $ | | (24,517,246) |
| Institutional Class | | | | | | | | | | | | |
| Shares sold | | 80,685 | | | | 122,545 | | $ 1,707,265 | | $ | | 2,394,261 |
| Shares redeemed | | (297,641) | | | | (324,350) | | (6,153,652) | | | | (6,296,427) |
| Net increase (decrease) | | (216,956) | | | | (201,805) | | $ (4,446,387) | | $ | | (3,902,166) |
Advisor Natural Resources Fund — Institutional Class
Average annual total return reflects the change in the value of an investment, assuming reinvestment of the class’ dividend income and capital gains (the profits earned upon the sale of securities that have grown in value) and assuming a constant rate of performance each year. The $10,000 table and the fund’s returns do not reflect the deduction of taxes that a shareholder would pay on fund distributions or the redemption of fund shares. During periods of reimbursement by Fidelity, a fund’s total return will be greater than it would be had the reimbursement not occurred. How a fund did yesterday is no guarantee of how it will do tomorrow.
| Average Annual Total Returns | | | | |
| Periods ended July 31, 2005 | | Past 1 | | Past 5 | | Past 10 |
| | | year | | years | | years |
| Institutional Class | | 43.21% | | 14.06% | | 12.69% |
| | $10,000 Over Past 10 Years
|
Let’s say hypothetically that $10,000 was invested in Fidelity Advisor Natural Resources Fund — Institutional Class on July 31, 1995. The chart shows how the value of your investment would have changed, and also shows how the S&P 500 Index performed over the same period.
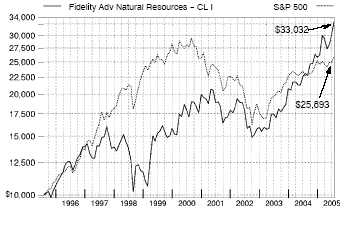
Advisor Natural Resources Fund — Institutional Class
|
Management’s Discussion of Fund Performance
Comments from Matthew Friedman, Portfolio Manager of Fidelity® Advisor Natural Resources Fund
A late-inning rally on Wall Street helped push some key U.S. equity indexes to four-year highs by the conclusion of the 12-month period ending July 31, 2005. Spurred on by bullish economic data and strong corporate earnings, investors enjoyed a stellar month of July, capping off a turbulent 12-month period for U.S. equity markets. Stock prices bounced up and down during most of the year, moving in cadence with gyrations in the price of crude oil and investors’ gathering and ebbing concerns about inflation. The Federal Reserve Board raised short-term interest rates eight times during the period, also affecting overall market sentiment. Despite their fluctuations, the major equity indexes finished on a high note, with the Standard & Poor’s 500SM Index and the NASDAQ Composite® Index posting gains of 14.05% and 16.51%, respectively, for the period. The small-cap Russell 2000® Index rose 24.78% and the Russell Midcap® Index jumped 28.93%, while the blue-chips’ Dow Jones Industrial AverageSM advanced only 7.29% .
For the 12 months that ended July 31, 2005, the fund’s Institutional Class shares returned 43.21%, outpacing both the Goldman Sachs® Natural Resources Index, which returned 40.48%, and the S&P 500®. The fund’s outperformance was driven by oil prices, which remained historically high throughout the period. Overweighting refining stocks compared to the sector index helped quite a bit, led by positions in Premcor, Holly Corporation and Valero Energy, the latter of which I sold. Also, oil rig equipment supplier Varco International, which merged with National Oilwell during the period, benefited from increased rig construction. Relatively large positions in oil and gas exploration companies Frontier Oil, Quicksilver Resources and Range Resources generated gains versus the sector index as well. Finally, the fund experienced significantly increased turnover during the period as a larger-than-usual number of attractive trading opportunities arose in response to the market’s volatility. On the other hand, investments in gold producer Newmont Mining and Apex Silver Mines were disappointing. Also, our holdings in Smurfit-Stone Container underperformed in response to margin pressures. Lastly, underweighting exploration and production stocks Unocal, EOG Resources, Talisman Energy and Burlington Resources — all index components — detracted from relative performance when margin pressures failed to materialize and the stocks performed well.
The views expressed in this statement reflect those of the portfolio manager only through the end of the period of the report as stated on the cover and do not necessarily represent the views of Fidelity or any other person in the Fidelity organization. Any such views are subject to change at any time based upon market or other conditions and Fidelity disclaims any responsibility to update such views. These views may not be relied on as investment advice and, because investment decisions for a Fidelity fund are based on numerous factors, may not be relied on as an indication of trading intent on behalf of any Fidelity fund.
Advisor Natural Resources Fund
Shareholder Expense Example
|
As a shareholder of the Fund, you incur two types of costs: (1) transaction costs, including sales charges (loads) on purchase payments or redemption proceeds, redemption fees, and (2) ongoing costs, including management fees, distribution and/or service (12b-1) fees and other Fund expenses. This Example is intended to help you understand your ongoing costs (in dollars) of investing in the Fund and to compare these costs with the ongoing costs of investing in other mutual funds.
The Example is based on an investment of $1,000 invested at the beginning of the period and held for the entire period (February 1, 2005 to July 31, 2005).
The first line of the table below for each class of the Fund provides information about actual account values and actual expenses. You may use the information in this line, together with the amount you invested, to estimate the expenses that you paid over the period. Simply divide your account value by $1,000.00 (for example, an $8,600 account value divided by $1,000.00 = 8.6), then multiply the result by the number in the first line for a class of the Fund under the heading entitled “Expenses Paid During Period” to estimate the expenses you paid on your account during this period.
Hypothetical Example for Comparison Purposes
|
The second line of the table below for each class of the Fund provides information about hypothetical account values and hypothetical expenses based on a Class’ actual expense ratio and an assumed rate of return of 5% per year before expenses, which is not the Class’ actual return. The hypothetical account values and expenses may not be used to estimate the actual ending account balance or expenses you paid for the period. You may use this information to compare the ongoing costs of investing in the Fund and other funds. To do so, compare this 5% hypothetical example with the 5% hypothetical examples that appear in the shareholder reports of the other funds.
Please note that the expenses shown in the table are meant to highlight your ongoing costs only and do not reflect any transaction costs. Therefore, the second line of the table is useful in comparing ongoing costs only, and will not help you determine the relative total costs of owning different funds. In addition, if these transactional costs were included, your costs would have been higher.
| | | | | | | | | | | Expenses Paid |
| | | Beginning | | | | Ending | | | | During Period* |
| | | Account Value | | | | Account Value | | | | February 1, 2005 |
| | | February 1, 2005 | | | | July 31, 2005 | | | | to July 31, 2005 |
| Class A | | | | | | | | | | |
| Actual | | $ 1,000.00 | | $ | | 1,255.50 | | $ | | 6.88 |
| HypotheticalA | | $ 1,000.00 | | $ | | 1,018.70 | | $ | | 6.16 |
| Class T | | | | | | | | | | |
| Actual | | $ 1,000.00 | | $ | | 1,254.50 | | $ | | 7.99 |
| HypotheticalA | | $ 1,000.00 | | $ | | 1,017.70 | | $ | | 7.15 |
| Class B | | | | | | | | | | |
| Actual | | $ 1,000.00 | | $ | | 1,251.30 | | $ | | 11.00 |
| HypotheticalA | | $ 1,000.00 | | $ | | 1,015.03 | | $ | | 9.84 |
| Class C | | | | | | | | | | |
| Actual | | $ 1,000.00 | | $ | | 1,251.20 | | $ | | 10.83 |
| HypotheticalA | | $ 1,000.00 | | $ | | 1,015.17 | | $ | | 9.69 |
| Institutional Class | | | | | | | | | | |
| Actual | | $ 1,000.00 | | $ | | 1,257.80 | | $ | | 4.98 |
| HypotheticalA | | $ 1,000.00 | | $ | | 1,020.38 | | $ | | 4.46 |
| |
| A 5% return per year before expenses | | | | | | | | | | |
* Expenses are equal to each Class’ annualized expense ratio (shown in the table below); multiplied by the average account value over the period, multiplied by 181/365 (to reflect the one-half year period).
| | | Annualized |
| | | Expense Ratio |
| Class A | | 1.23% |
| Class T | | 1.43% |
| Class B | | 1.97% |
| Class C | | 1.94% |
| Institutional Class | | 89% |
| | Advisor Natural Resources Fund
Investment Changes
|
| Top Ten Stocks as of July 31, 2005 | | |
| | | % of fund’s | | % of fund’s net assets |
| | | net assets | | 6 months ago |
| National Oilwell Varco, Inc. | | 5.2 | | 0.9 |
| ConocoPhillips | | 5.1 | | 6.3 |
| Schlumberger Ltd. (NY Shares) | | 5.0 | | 3.7 |
| BP PLC sponsored ADR | | 4.9 | | 7.5 |
| Halliburton Co. | | 4.3 | | 4.8 |
| Premcor, Inc. | | 3.8 | | 0.9 |
| Newmont Mining Corp. | | 3.4 | | 3.7 |
| Smith International, Inc. | | 3.3�� | | 2.7 |
| Exxon Mobil Corp. | | 2.7 | | 7.8 |
| Alcoa, Inc. | | 2.2 | | 2.3 |
| | | 39.9 | | |
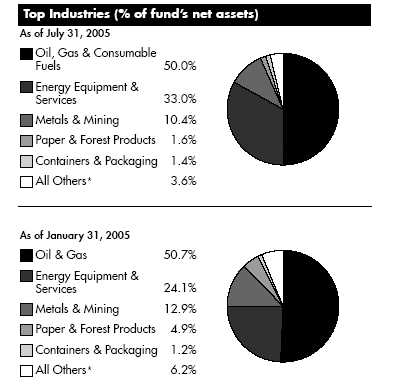
| | * Includes short term investments and net other assets.
Prior period industry classifications reflect the categories in place as of the date
indicated and have not been adjusted to reflect current industry classifications.
|
Natural Resources A-112
Advisor Natural Resources Fund
Investments July 31, 2005
Showing Percentage of Net Assets
| Common Stocks — 99.5% | | | | |
| | | Shares | | Value (Note 1) |
| |
| CHEMICALS – 0.5% | | | | |
| Diversified Chemicals – 0.5% | | | | |
| Ashland, Inc. | | 43,000 | | $ 2,642,350 |
| COMMERCIAL SERVICES & SUPPLIES – 0.3% | | | | |
| Human Resource & Employment Services – 0.3% | | |
| CDI Corp. | | 58,300 | | 1,432,431 |
| CONSTRUCTION & ENGINEERING – 1.0% | | | | |
| Construction & Engineering – 1.0% | | | | |
| Chicago Bridge & Iron Co. NV (NY | | | | |
| Shares) | | 207,200 | | 5,791,240 |
| CONTAINERS & PACKAGING – 1.4% | | | | |
| Paper Packaging – 1.4% | | | | |
| Packaging Corp. of America | | 2,000 | | 42,500 |
| Smurfit-Stone Container Corp. (a) | | 635,175 | | 7,704,673 |
| | | | | 7,747,173 |
| |
| ELECTRICAL EQUIPMENT – 0.2% | | | | |
| Electrical Components & Equipment – 0.2% | | | | |
| Hydrogenics Corp. (a) | | 310,576 | | 1,105,984 |
| Heavy Electrical Equipment – 0.0% | | | | |
| Areva (investment certificates) | | 100 | | 46,803 |
| |
| TOTAL ELECTRICAL EQUIPMENT | | | | 1,152,787 |
| |
| ENERGY EQUIPMENT & SERVICES – 33.0% | | | | |
| Oil & Gas Drilling – 6.2% | | | | |
| Cathedral Energy Services Income Trust . | | 45,900 | | 315,285 |
| Diamond Offshore Drilling, Inc. | | 23,300 | | 1,329,498 |
| ENSCO International, Inc. | | 2,100 | | 84,798 |
| GlobalSantaFe Corp. | | 218,400 | | 9,825,816 |
| Helmerich & Payne, Inc. | | 200 | | 11,424 |
| Nabors Industries Ltd. (a) | | 50,200 | | 3,285,590 |
| Noble Corp. | | 108,300 | | 7,275,594 |
| Patterson-UTI Energy, Inc. | | 17,500 | | 574,525 |
| Precision Drilling Corp. (a) | | 114,500 | | 4,846,155 |
| Pride International, Inc. (a) | | 157,000 | | 4,085,140 |
| Rowan Companies, Inc. | | 32,100 | | 1,096,536 |
| Transocean, Inc. (a) | | 26,100 | | 1,472,823 |
| | | | | 34,203,184 |
| Oil & Gas Equipment & Services – 26.8% | | | | |
| Baker Hughes, Inc. | | 213,450 | | 12,068,463 |
| BJ Services Co. | | 155,800 | | 9,502,242 |
| Cooper Cameron Corp. (a) | | 53,700 | | 3,811,626 |
| Grant Prideco, Inc. (a) | | 246,500 | | 7,912,650 |
| Halliburton Co. | | 426,800 | | 23,922,140 |
| Hornbeck Offshore Services, Inc. (a) | | 53,800 | | 1,608,620 |
| Hydril Co. (a) | | 8,900 | | 571,024 |
| Lone Star Technologies, Inc. (a) | | 22,800 | | 1,163,484 |
| Maverick Tube Corp. (a) | | 76,800 | | 2,547,456 |
| National Oilwell Varco, Inc. (a) | | 552,932 | | 28,945,990 |
| Newpark Resources, Inc. (a) | | 67,900 | | 574,434 |
| | | Shares | | Value (Note 1) |
| NS Group, Inc. (a) | | 124,000 | | $ 5,263,800 |
| Pason Systems, Inc. | | 35,800 | | 704,684 |
| RPC, Inc. | | 2,500 | | 48,725 |
| Schlumberger Ltd. (NY Shares) | | 333,700 | | 27,944,038 |
| Smith International, Inc. | | 269,000 | | 18,275,860 |
| Superior Well Services, Inc. | | 1,800 | | 32,976 |
| Weatherford International Ltd. (a) | | 64,200 | | 4,062,576 |
| | | | | 148,960,788 |
| |
| TOTAL ENERGY EQUIPMENT & SERVICES | | | | 183,163,972 |
| |
| FOOD PRODUCTS – 0.0% | | | | |
| Agricultural Products – 0.0% | | | | |
| Global Bio-Chem Technology Group Co. | | | | |
| Ltd. | | 102,000 | | 51,173 |
| GAS UTILITIES – 0.5% | | | | |
| Gas Utilities – 0.5% | | | | |
| Questar Corp. | | 36,400 | | 2,554,552 |
| IT SERVICES – 0.0% | | | | |
| IT Consulting & Other Services – 0.0% | | | | |
| Telvent GIT SA | | 28,300 | | 306,461 |
| MACHINERY – 0.6% | | | | |
| Construction & Farm Machinery & Heavy Trucks – 0.6% | | |
| Bucyrus International, Inc. Class A | | 76,700 | | 3,268,954 |
| MARINE – 0.0% | | | | |
| Marine – 0.0% | | | | |
| Odfjell ASA (A Shares) | | 6,850 | | 140,376 |
| METALS & MINING – 10.4% | | | | |
| Aluminum – 2.3% | | | | |
| Alcan, Inc. | | 1,300 | | 43,958 |
| Alcoa, Inc. | | 443,200 | | 12,431,760 |
| Aleris International, Inc. (a) | | 21,200 | | 484,844 |
| Century Aluminum Co. (a) | | 2,500 | | 61,175 |
| | | | | 13,021,737 |
| Diversified Metals & Mining – 2.4% | | | | |
| Falconbridge Ltd. | | 115,100 | | 2,373,729 |
| Freeport-McMoRan Copper & Gold, Inc. | | | | |
| Class B | | 1,997 | | 80,439 |
| Grupo Mexico SA de CV Series B | | 618,415 | | 1,057,539 |
| Phelps Dodge Corp. | | 19,500 | | 2,075,775 |
| RTI International Metals, Inc. (a) | | 44,000 | | 1,514,480 |
| Teck Cominco Ltd. Class B (sub. vtg.) | | 100,500 | | 3,843,190 |
| Titanium Metals Corp. (a)(d) | | 33,000 | | 2,113,650 |
| | | | | 13,058,802 |
| Gold – 4.1% | | | | |
| Alamos Gold, Inc. (a) | | 253,700 | | 938,670 |
| Goldcorp, Inc. | | 117,500 | | 1,909,789 |
| Kinross Gold Corp. (a) | | 200,400 | | 1,106,468 |
| Newmont Mining Corp. | | 506,900 | | 19,034,095 |
| | | | | 22,989,022 |
See accompanying notes which are an integral part of the financial statements.
Advisor Natural Resources Fund Investments - continued
| Common Stocks – continued | | | | |
| | | Shares | | Value (Note 1) |
| |
| METALS & MINING – CONTINUED | | | | |
| Precious Metals & Minerals – 1.2% | | | | |
| Apex Silver Mines Ltd. (a)(d) | | 197,800 | | $ 2,745,464 |
| Industrias Penoles SA de CV | | 674,800 | | 3,153,652 |
| Stillwater Mining Co. (a) | | 71,600 | | 584,256 |
| | | | | 6,483,372 |
| Steel – 0.4% | | | | |
| Companhia Vale do Rio Doce sponsored | | | | |
| ADR | | 2,400 | | 78,144 |
| IPSCO, Inc. | | 5,900 | | 317,757 |
| Usinas Siderurgicas de Minas Gerais SA | | | | |
| (Usiminas) (PN-A) | | 93,500 | | 1,670,413 |
| | | | | 2,066,314 |
| |
| TOTAL METALS & MINING | | | | 57,619,247 |
| |
| OIL, GAS & CONSUMABLE FUELS – 50.0% | | | | |
| Coal & Consumable Fuels – 6.5% | | | | |
| Arch Coal, Inc. | | 21,100 | | 1,201,012 |
| Cameco Corp. | | 184,800 | | 8,677,381 |
| CONSOL Energy, Inc. | | 158,100 | | 10,649,616 |
| Massey Energy Co. | | 117,400 | | 5,077,550 |
| Peabody Energy Corp. | | 155,700 | | 10,235,718 |
| USEC, Inc. | | 2,300 | | 36,087 |
| | | | | 35,877,364 |
| Integrated Oil & Gas – 17.7% | | | | |
| Amerada Hess Corp. | | 58,400 | | 6,883,024 |
| BG Group PLC sponsored ADR | | 99,100 | | 4,129,497 |
| BP PLC sponsored ADR | | 412,948 | | 27,205,014 |
| Chevron Corp. | | 1,336 | | 77,501 |
| ConocoPhillips | | 453,398 | | 28,378,181 |
| ENI Spa sponsored ADR | | 300 | | 42,420 |
| Exxon Mobil Corp. | | 255,160 | | 14,990,650 |
| Marathon Oil Corp. | | 11,527 | | 672,716 |
| Occidental Petroleum Corp. | | 123,800 | | 10,186,264 |
| OMV AG | | 25,000 | | 1,164,000 |
| Total SA sponsored ADR | | 37,400 | | 4,675,000 |
| | | | | 98,404,267 |
| Oil & Gas Exploration & Production – 17.0% | | |
| Apache Corp. | | 33,600 | | 2,298,240 |
| Blackrock Ventures, Inc. (a) | | 95,100 | | 755,767 |
| Burlington Resources, Inc. | | 91,300 | | 5,853,243 |
| Cabot Oil & Gas Corp. | | 45,500 | | 1,843,660 |
| Canadian Natural Resources Ltd.�� | | 258,000 | | 10,746,927 |
| Chesapeake Energy Corp. | | 197,400 | | 5,154,114 |
| Comstock Resources, Inc. (a) | | 44,400 | | 1,229,436 |
| Denbury Resources, Inc. (a) | | 26,800 | | 1,254,240 |
| EnCana Corp. | | 262,564 | | 10,823,380 |
| Encore Acquisition Co. (a) | | 51,300 | | 1,618,002 |
| | | Shares | | Value (Note 1) |
| Energy Partners Ltd. (a) | | 1,500 | | $ | | 39,690 |
| Forest Oil Corp. (a) | | 184,000 | | | | 8,235,840 |
| Gastar Exploration Ltd. (a) | | 294,900 | | | | 794,846 |
| Newfield Exploration Co. (a) | | 66,800 | | | | 2,838,332 |
| Nexen, Inc. | | 1,800 | | | | 66,716 |
| Noble Energy, Inc. | | 5,200 | | | | 429,052 |
| Norsk Hydro ASA sponsored ADR | | 20,600 | | | | 1,951,644 |
| Petroleum Development Corp. (a) | | 44,700 | | | | 1,673,568 |
| Pioneer Natural Resources Co. | | 124,300 | | | | 5,385,919 |
| Plains Exploration & Production Co. (a) . | | 246,400 | | | | 9,498,720 |
| Pogo Producing Co. | | 1,600 | | | | 88,048 |
| Quicksilver Resources, Inc. (a) | | 133,950 | | | | 5,674,122 |
| Range Resources Corp. | | 200,300 | | | | 6,117,162 |
| Southwestern Energy Co. (a) | | 6,100 | | | | 336,171 |
| Talisman Energy, Inc. | | 14,000 | | | | 613,926 |
| Ultra Petroleum Corp. (a) | | 208,900 | | | | 7,921,488 |
| Unocal Corp. | | 19,700 | | | | 1,277,545 |
| | | | | | | 94,519,798 |
| Oil & Gas Refining & Marketing – 7.8% | | | | | | |
| Frontier Oil Corp. | | 163,500 | | | | 4,581,270 |
| Giant Industries, Inc. (a) | | 45,900 | | | | 1,800,198 |
| Holly Corp. | | 53,100 | | | | 2,486,142 |
| Neste Oil Oyj | | 81,100 | | | | 2,254,793 |
| Polski Koncern Naftowy Orlen SA | | 68,500 | | | | 1,104,592 |
| Premcor, Inc. | | 276,300 | | | | 21,175,632 |
| Sunoco, Inc. | | 42,900 | | | | 5,393,817 |
| Tesoro Corp. | | 83,000 | | | | 4,002,260 |
| Tupras-Turkiye Petrol Rafinerileri AS | | 30,000 | | | | 438,947 |
| | | | | | | 43,237,651 |
| Oil & Gas Storage & Transport – 1.0% | | | | | | |
| El Paso Corp. | | 210,500 | | | | 2,526,000 |
| OMI Corp. | | 113,700 | | | | 2,050,011 |
| Williams Companies, Inc. | | 40,500 | | | | 860,220 |
| | | | | | | 5,436,231 |
| |
| TOTAL OIL, GAS & CONSUMABLE FUELS | | | | 277,475,311 |
| |
| PAPER & FOREST PRODUCTS – 1.6% | | | | | | |
| Forest Products – 0.0% | | | | | | |
| Canfor Corp. (a) | | 2,629 | | | | 30,706 |
| Sino-Forest Corp. (a) | | 151,600 | | | | 340,507 |
| | | | | | | 371,213 |
| Paper Products – 1.6% | | | | | | |
| Georgia-Pacific Corp. | | 84,500 | | | | 2,885,675 |
| MeadWestvaco Corp. | | 88,000 | | | | 2,571,360 |
| Votorantim Celulose e Papel SA | | | | | | |
| sponsored ADR (non-vtg.) | | 269,900 | | | | 3,252,295 |
| | | | | | | 8,709,330 |
| |
| TOTAL PAPER & FOREST PRODUCTS | | | | | | 9,080,543 |
| |
| TOTAL COMMON STOCKS | | | | | | |
| (Cost $394,778,298) | | | | 552,426,570 |
See accompanying notes which are an integral part of the financial statements.
Natural Resources A-114
| Money Market Funds — 3.1% | | |
| | | Shares | | Value (Note 1) |
| Fidelity Cash Central Fund, 3.31% (b) | | 14,125,070 | | $ 14,125,070 |
| Fidelity Securities Lending Cash | | | | |
| Central Fund, 3.32% (b)(c) | | 3,173,750 | | 3,173,750 |
| TOTAL MONEY MARKET FUNDS | | | | |
| (Cost $17,298,820) | | | | 17,298,820 |
| TOTAL INVESTMENT PORTFOLIO - 102.6% | | |
| (Cost $412,077,118) | | | | 569,725,390 |
| |
| NET OTHER ASSETS – (2.6)% | | | | (14,295,721) |
| NET ASSETS – 100% | | | | $ 555,429,669 |
| Legend | | | | |
(a) Non-income producing
(b) Affiliated fund that is available only to investment companies and other
accounts managed by Fidelity Investments. The rate quoted is the
annualized seven-day yield of the fund at period end. A complete listing
of the fund’s holdings as of its most recent quarter end is available upon
request.
(c) Investment made with cash collateral received from securities on loan.
(d) Security or a portion of the security is on loan at period end.
|
Distribution of investments by country of issue, as a percentage of total net assets, is as follows:
| United States of America | | 69.9% |
| Canada | | 10.5% |
| United Kingdom | | 5.7% |
| Netherlands Antilles | | 5.0% |
| Cayman Islands | | 3.6% |
| Netherlands | | 1.0% |
| Others (individually less than 1%) | | 4.3% |
| | | 100.0% |
See accompanying notes which are an integral part of the financial statements.
Advisor Natural Resources Fund
Financial Statements
|
| Statement of Assets and Liabilities | | |
| | | | | | | July 31, 2005 |
| Assets | | | | | | |
| Investment in securities, at value (includ- | | | | |
| ing securities loaned of $3,202,875) | | | | |
| (cost $412,077,118) — See accompa- | | | | |
| nying schedule | | | | $ | | 569,725,390 |
| Cash | | | | | | 1,498 |
| Receivable for investments sold | | | | | | 1,211,795 |
| Receivable for fund shares sold | | | | | | 1,251,961 |
| Dividends receivable | | | | | | 192,255 |
| Interest receivable | | | | | | 29,893 |
| Prepaid expenses | | | | | | 586 |
| Other affiliated receivables | | | | | | 50,036 |
| Other receivables | | | | | | 156,132 |
| Total assets | | | | | | 572,619,546 |
| Liabilities | | | | | | |
| Payable for investments purchased | | $ | | 5,152,799 | | |
| Payable for fund shares redeemed | | | | 8,146,391 | | |
| Accrued management fee | | | | 257,822 | | |
| Distribution fees payable | | | | 273,402 | | |
| Other affiliated payables | | | | 141,407 | | |
| Other payables and accrued expenses | | 44,306 | | |
| Collateral on securities loaned, at value . | | 3,173,750 | | |
| Total liabilities | | | | | | 17,189,877 |
| Net Assets | | | | $ | | 555,429,669 |
| Net Assets consist of: | | | | | | |
| Paid in capital | | | | $ | | 339,114,603 |
| Accumulated net investment loss | | | | | | (1,571) |
| Accumulated undistributed net realized | | | | |
| gain (loss) on investments and foreign | | | | |
| currency transactions | | | | | | 58,668,704 |
| Net unrealized appreciation (depreci- | | | | |
| ation) on investments and assets and | | | | |
| liabilities in foreign currencies | | | | | | 157,647,933 |
| Net Assets | | | | $ | | 555,429,669 |
| Calculation of Maximum Offering Price | | | | |
| Class A: | | | | | | |
| Net Asset Value and redemption price | | | | |
| per share ($90,342,018 ÷ | | | | | | |
| 2,207,045 shares) | | | | $ | | 40.93 |
| Maximum offering price per share | | | | | | |
| (100/94.25 of $40.93) | | | | $ | | 43.43 |
| Class T: | | | | | | |
| Net Asset Value and redemption price | | | | |
| per share ($280,820,453 ÷ | | | | | | |
| 6,772,961 shares) | | | | $ | | 41.46 |
| Maximum offering price per share | | | | | | |
| (100/96.50 of $41.46) | | | | $ | | 42.96 |
| Class B: | | | | | | |
| Net Asset Value and offering price per | | | | |
| share ($102,002,599 ÷ 2,557,242 | | | | |
| shares)A | | | | $ | | 39.89 |
| Class C: | | | | | | |
| Net Asset Value and offering price per | | | | |
| share ($72,831,974 ÷ 1,816,197 | | | | |
| shares)A | | | | $ | | 40.10 |
| Institutional Class: | | | | | | |
| Net Asset Value, offering price and | | | | | | |
| redemption price per share | | | | | | |
| ($9,432,625 ÷ 225,858 shares) | | | | $ | | 41.76 |
A Redemption price per share is equal to net asset value less any applicable contingent deferred sales charge.
| Statement of Operations | | | | |
| | | | | Year ended July 31, 2005 |
| Investment Income | | | | | | |
| Dividends | | | | $ | | 5,686,172 |
| Interest | | | | | | 219,270 |
| Security lending | | | | | | 48,874 |
| Total income | | | | | | 5,954,316 |
| Expenses | | | | | | |
| Management fee | | $ | | 2,474,768 | | |
| Transfer agent fees | | | | 1,288,005 | | |
| Distribution fees | | | | 2,633,663 | | |
| Accounting and security lending | | | | | | |
| fees | | | | 178,657 | | |
| Independent trustees’ compensation | | 2,280 | | |
| Custodian fees and expenses | | | | 42,678 | | |
| Registration fees | | | | 75,213 | | |
| Audit | | | | 45,494 | | |
| Legal | | | | 1,403 | | |
| Interest | | | | 572 | | |
| Miscellaneous | | | | 7,930 | | |
| Total expenses before reductions | | 6,750,663 | | |
| Expense reductions | | | | (224,870) | | 6,525,793 |
| |
| Net investment income (loss) | | | | | | (571,477) |
| Realized and Unrealized Gain (Loss) | | | | |
| Net realized gain (loss) on: | | | | | | |
| Investment securities | | | | 75,630,265 | | |
| Investment not meeting investment | | | | |
| restrictions | | | | (32,785) | | |
| Foreign currency transactions | | | | (94,327) | | |
| Payment from investment advisor | | | | |
| for loss on investment not meet- | | | | |
| ing investment restrictions | | | | 32,785 | | |
| Total net realized gain (loss) | | | | | | 75,535,938 |
| Change in net unrealized appreci- | | | | |
| ation (depreciation) on: | | | | | | |
| Investment securities | | | | 81,246,405 | | |
| Assets and liabilities in foreign | | | | | | |
| currencies | | | | (334) | | |
| Total change in net unrealized ap- | | | | |
| preciation (depreciation) | | | | | | 81,246,071 |
| Net gain (loss) | | | | | | 156,782,009 |
| Net increase (decrease) in net as- | | | | |
| sets resulting from operations | | | | $ | | 156,210,532 |
See accompanying notes which are an integral part of the financial statements.
Natural Resources A-116
| Statement of Changes in Net Assets | | | | | | |
| | | Year ended | | | | Year ended |
| | | July 31, | | | | July 31, |
| | | 2005 | | | | 2004 |
| Increase (Decrease) in Net Assets | | | | | | |
| Operations | | | | | | |
| Net investment income (loss) | | $ (571,477) | | $ | | (91,145) |
| Net realized gain (loss) | | 75,535,938 | | | | 23,859,151 |
| Change in net unrealized appreciation (depreciation) | | 81,246,071 | | | | 63,349,686 |
| Net increase (decrease) in net assets resulting from operations | | 156,210,532 | | | | 87,117,692 |
| Distributions to shareholders from net investment income | | (316,454) | | | | (681,969) |
| Distributions to shareholders from net realized gain | | (5,002,969) | | | | — |
| Total distributions | | (5,319,423) | | | | (681,969) |
| Share transactions -- net increase (decrease) | | 49,200,390 | | | | 16,197,507 |
| Redemption fees | | 77,479 | | | | 51,991 |
| Total increase (decrease) in net assets | | 200,168,978 | | | | 102,685,221 |
| |
| Net Assets | | | | | | |
| Beginning of period | | 355,260,691 | | | | 252,575,470 |
| End of period (including accumulated net investment loss of $1,571 and accumulated net investment loss of $82,794, | | | | | | |
| respectively) | | $ 555,429,669 | | $ | | 355,260,691 |
| Financial Highlights — Class A | | | | | | | | | | |
| Years ended July 31, | | 2005 | | 2004 | | 2003 | | 2002 | | 2001 |
| Selected Per-Share Data | | | | | | | | | | |
| Net asset value, beginning of period | | $ 29.12 | | $ 21.65 | | $ 20.33 | | $ 26.42 | | $ 24.07 |
| Income from Investment Operations | | | | | | | | | | |
| Net investment income (loss)C | | 06 | | .07 | | .13 | | .15 | | .19 |
| Net realized and unrealized gain (loss) | | 12.21 | | 7.50 | | 1.30 | | (4.36) | | 2.34 |
| Total from investment operations | | 12.27 | | 7.57 | | 1.43 | | (4.21) | | 2.53 |
| Distributions from net investment income | | (.06) | | (.10) | | (.11) | | (.18) | | (.19) |
| Distributions from net realized gain | | (.41) | | — | | — | | (1.70) | | — |
| Total distributions | | (.47) | | (.10) | | (.11) | | (1.88) | | (.19) |
| Redemption fees added to paid in capitalC | | 01 | | —E | | —E | | —E | | .01 |
| Net asset value, end of period | | $ 40.93 | | $ 29.12 | | $ 21.65 | | $ 20.33 | | $ 26.42 |
| Total ReturnA,B | | 42.69% | | 35.08% | | 7.07% | | (16.92)% | | 10.56% |
| Ratios to Average Net AssetsD | | | | | | | | | | |
| Expenses before expense reductions | | 1.25% | | 1.30% | | 1.36% | | 1.28% | | 1.23% |
| Expenses net of voluntary waivers, if any | | 1.25% | | 1.30% | | 1.36% | | 1.28% | | 1.23% |
| Expenses net of all reductions | | 1.19% | | 1.29% | | 1.32% | | 1.24% | | 1.18% |
| Net investment income (loss) | | 19% | | .28% | | .63% | | .64% | | .69% |
| Supplemental Data | | | | | | | | | | |
| Net assets, end of period (000 omitted) | | $ 90,342 | | $ 44,315 | | $ 21,798 | | $ 21,993 | | $ 21,849 |
| Portfolio turnover rate | | 125% | | 40% | | 41% | | 85% | | 130% |
A Total returns would have been lower had certain expenses not been reduced during the periods shown. B Total returns do not include the effect of the sales charges.
C Calculated based on average shares outstanding during the period.
D Expense ratios reflect operating expenses of the class. Expenses before reductions do not reflect amounts reimbursed by the investment adviser or reductions from brokerage service arrangements or other expense offset arrangements and do not represent the amount paid by the class during periods when reimbursements or reductions occur. Expenses net of any voluntary waivers reflect expenses after reimbursement by the investment adviser but prior to reductions from brokerage service arrangements or other expense offset arrangements. Expenses net of all reductions represent the net expenses paid by the class.
E Amount represents less than $.01 per share.
See accompanying notes which are an integral part of the financial statements.
A-117 Annual Report
| Financial Highlights — Class T | | | | | | | | | | |
| Years ended July 31, | | 2005 | | 2004 | | 2003 | | 2002 | | 2001 |
| Selected Per-Share Data | | | | | | | | | | |
| Net asset value, beginning of period | | $ 29.52 | | $ 21.97 | | $ 20.61 | | $ 26.73 | | $ 24.35 |
| Income from Investment Operations | | | | | | | | | | |
| Net investment income (loss)C | | —E | | .03 | | .10 | | .11 | | .14 |
| Net realized and unrealized gain (loss) | | 12.37 | | 7.60 | | 1.32 | | (4.42) | | 2.36 |
| Total from investment operations | | 12.37 | | 7.63 | | 1.42 | | (4.31) | | 2.50 |
| Distributions from net investment income | | (.03) | | (.08) | | (.06) | | (.11) | | (.13) |
| Distributions from net realized gain | | (.41) | | — | | — | | (1.70) | | — |
| Total distributions | | (.44) | | (.08) | | (.06) | | (1.81) | | (.13) |
| Redemption fees added to paid in capitalC | | 01 | | —E | | —E | | —E | | .01 |
| Net asset value, end of period | | $ 41.46 | | $ 29.52 | | $ 21.97 | | $ 20.61 | | $ 26.73 |
| Total ReturnA,B | | 42.41% | | 34.82% | | 6.91% | | (17.07)% | | 10.32% |
| Ratios to Average Net AssetsD | | | | | | | | | | |
| Expenses before expense reductions | | 1.44% | | 1.48% | | 1.50% | | 1.45% | | 1.41% |
| Expenses net of voluntary waivers, if any | | 1.44% | | 1.48% | | 1.50% | | 1.45% | | 1.41% |
| Expenses net of all reductions | | 1.39% | | 1.47% | | 1.47% | | 1.41% | | 1.37% |
| Net investment income (loss) | | (.01)% | | .10% | | .48% | | .47% | | .51% |
| Supplemental Data | | | | | | | | | | |
| Net assets, end of period (000 omitted) | | $ 280,820 | | $ 201,187 | | $ 155,249 | | $ 174,670 | | $ 253,062 |
| Portfolio turnover rate | | 125% | | 40% | | 41% | | 85% | | 130% |
A Total returns would have been lower had certain expenses not been reduced during the periods shown.
B Total returns do not include the effect of the sales charges.
C Calculated based on average shares outstanding during the period.
D Expense ratios reflect operating expenses of the class. Expenses before reductions do not reflect amounts reimbursed by the investment adviser or reductions from brokerage service arrangements or other expense offset arrangements and do not
represent the amount paid by the class during periods when reimbursements or reductions occur. Expenses net of any voluntary waivers reflect expenses after reimbursement by the investment adviser but prior to reductions from brokerage service
arrangements or other expense offset arrangements. Expenses net of all reductions represent the net expenses paid by the class.
E Amount represents less than $.01 per share.
|
| Financial Highlights — Class B | | | | | | | | | | |
| Years ended July 31, | | 2005 | | 2004 | | 2003 | | 2002 | | 2001 |
| Selected Per-Share Data | | | | | | | | | | |
| Net asset value, beginning of period | | $ 28.54 | | $ 21.28 | | $ 20.02 | | $ 26.04 | | $ 23.77 |
| Income from Investment Operations | | | | | | | | | | |
| Net investment income (loss)C | | (.18) | | (.11) | | (.01) | | (.02) | | (.01) |
| Net realized and unrealized gain (loss) | | 11.93 | | 7.37 | | 1.27 | | (4.29) | | 2.31 |
| Total from investment operations | | 11.75 | | 7.26 | | 1.26 | | (4.31) | | 2.30 |
| Distributions from net investment income | | — | | — | | — | | (.01) | | (.04) |
| Distributions from net realized gain | | (.41) | | — | | — | | (1.70) | | — |
| Total distributions | | (.41) | | — | | — | | (1.71) | | (.04) |
| Redemption fees added to paid in capitalC | | 01 | | —E | | —E | | —E | | .01 |
| Net asset value, end of period | | $ 39.89 | | $ 28.54 | | $ 21.28 | | $ 20.02 | | $ 26.04 |
| Total ReturnA,B | | 41.66% | | 34.12% | | 6.29% | | (17.51)% | | 9.72% |
| Ratios to Average Net AssetsD | | | | | | | | | | |
| Expenses before expense reductions | | 1.98% | | 2.02% | | 2.06% | | 2.00% | | 1.95% |
| Expenses net of voluntary waivers, if any | | 1.98% | | 2.02% | | 2.06% | | 2.00% | | 1.95% |
| Expenses net of all reductions | | 1.93% | | 2.01% | | 2.02% | | 1.95% | | 1.91% |
| Net investment income (loss) | | (.55)% | | (.44)% | | (.07)% | | (.07)% | | (.03)% |
| Supplemental Data | | | | | | | | | | |
| Net assets, end of period (000 omitted) | | $ 102,003 | | $ 68,347 | | $ 50,833 | | $ 58,656 | | $ 83,243 |
| Portfolio turnover rate | | 125% | | 40% | | 41% | | 85% | | 130% |
A Total returns would have been lower had certain expenses not been reduced during the periods shown.
B Total returns do not include the effect of the contingent deferred sales charge.
C Calculated based on average shares outstanding during the period.
D Expense ratios reflect operating expenses of the class. Expenses before reductions do not reflect amounts reimbursed by the investment adviser or reductions from brokerage service arrangements or other expense offset arrangements and do not
represent the amount paid by the class during periods when reimbursements or reductions occur. Expenses net of any voluntary waivers reflect expenses after reimbursement by the investment adviser but prior to reductions from brokerage service
arrangements or other expense offset arrangements. Expenses net of all reductions represent the net expenses paid by the class.
E Amount represents less than $.01 per share.
|
See accompanying notes which are an integral part of the financial statements.
Natural Resources A-118
|
| Financial Highlights — Class C | | | | | | | | | | |
| Years ended July 31, | | 2005 | | 2004 | | 2003 | | 2002 | | 2001 |
| Selected Per-Share Data | | | | | | | | | | |
| Net asset value, beginning of period | | $ 28.68 | | $ 21.38 | | $ 20.10 | | $ 26.15 | | $ 23.88 |
| Income from Investment Operations | | | | | | | | | | |
| Net investment income (loss)C | | (.17) | | (.10) | | —E | | (.01) | | —E |
| Net realized and unrealized gain (loss) | | 11.99 | | 7.40 | | 1.28 | | (4.32) | | 2.32 |
| Total from investment operations | | 11.82 | | 7.30 | | 1.28 | | (4.33) | | 2.32 |
| Distributions from net investment income | | — | | — | | — | | (.02) | | (.06) |
| Distributions from net realized gain | | (.41) | | — | | — | | (1.70) | | — |
| Total distributions | | (.41) | | — | | — | | (1.72) | | (.06) |
| Redemption fees added to paid in capitalC | | 01 | | —E | | —E | | —E | | .01 |
| Net asset value, end of period | | $ 40.10 | | $ 28.68 | | $ 21.38 | | $ 20.10 | | $ 26.15 |
| Total ReturnA,B | | 41.70% | | 34.14% | | 6.37% | | (17.52)% | | 9.76% |
| Ratios to Average Net AssetsD | | | | | | | | | | |
| Expenses before expense reductions | | 1.94% | | 1.99% | | 2.01% | | 1.96% | | 1.92% |
| Expenses net of voluntary waivers, if any | | 1.94% | | 1.99% | | 2.01% | | 1.96% | | 1.92% |
| Expenses net of all reductions | | 1.89% | | 1.97% | | 1.97% | | 1.92% | | 1.87% |
| Net investment income (loss) | | (.51)% | | (.41)% | | (.02)% | | (.03)% | | — % |
| Supplemental Data | | | | | | | | | | |
| Net assets, end of period (000 omitted) | | $ 72,832 | | $ 37,206 | | $ 22,044 | | $ 24,201 | | $ 29,699 |
| Portfolio turnover rate | | 125% | | 40% | | 41% | | 85% | | 130% |
A Total returns would have been lower had certain expenses not been reduced during the periods shown.
B Total returns do not include the effect of the contingent deferred sales charge.
C Calculated based on average shares outstanding during the period.
D Expense ratios reflect operating expenses of the class. Expenses before reductions do not reflect amounts reimbursed by the investment adviser or reductions from brokerage service arrangements or other expense offset arrangements and do not
represent the amount paid by the class during periods when reimbursements or reductions occur. Expenses net of any voluntary waivers reflect expenses after reimbursement by the investment adviser but prior to reductions from brokerage service
arrangements or other expense offset arrangements. Expenses net of all reductions represent the net expenses paid by the class.
E Amount represents less than $.01 per share.
|
| Financial Highlights — Institutional Class | | | | | | | | | | |
| Years ended July 31, | | 2005 | | 2004 | | 2003 | | 2002 | | 2001 |
| Selected Per-Share Data | | | | | | | | | | |
| Net asset value, beginning of period | | $ 29.64 | | $ 22.03 | | $ 20.67 | | $ 26.82 | | $ 24.43 |
| Income from Investment Operations | | | | | | | | | | |
| Net investment income (loss)B | | 19 | | .18 | | .22 | | .23 | | .28 |
| Net realized and unrealized gain (loss) | | 12.44 | | 7.62 | | 1.32 | | (4.43) | | 2.37 |
| Total from investment operations | | 12.63 | | 7.80 | | 1.54 | | (4.20) | | 2.65 |
| Distributions from net investment income | | (.11) | | (.19) | | (.18) | | (.25) | | (.27) |
| Distributions from net realized gain | | (.41) | | — | | — | | (1.70) | | — |
| Total distributions | | (.52) | | (.19) | | (.18) | | (1.95) | | (.27) |
| Redemption fees added to paid in capitalB | | 01 | | —D | | —D | | —D | | .01 |
| Net asset value, end of period | | $ 41.76 | | $ 29.64 | | $ 22.03 | | $ 20.67 | | $ 26.82 |
| Total ReturnA | | 43.21% | | 35.60% | | 7.51% | | (16.64)% | | 10.90% |
| Ratios to Average Net AssetsC | | | | | | | | | | |
| Expenses before expense reductions | | 89% | | .90% | | .95% | | .93% | | .88% |
| Expenses net of voluntary waivers, if any | | 89% | | .90% | | .95% | | .93% | | .88% |
| Expenses net of all reductions | | 84% | | .89% | | .91% | | .89% | | .84% |
| Net investment income (loss) | | 54% | | .68% | | 1.04% | | .99% | | 1.04% |
| Supplemental Data | | | | | | | | | | |
| Net assets, end of period (000 omitted) | | $ 9,433 | | $ 4,206 | | $ 2,652 | | $ 4,938 | | $ 6,960 |
| Portfolio turnover rate | | 125% | | 40% | | 41% | | 85% | | 130% |
A Total returns would have been lower had certain expenses not been reduced during the periods shown.
B Calculated based on average shares outstanding during the period.
C Expense ratios reflect operating expenses of the class. Expenses before reductions do not reflect amounts reimbursed by the investment adviser or reductions from brokerage service arrangements or other expense offset arrangements and do not
represent the amount paid by the class during periods when reimbursements or reductions occur. Expenses net of any voluntary waivers reflect expenses after reimbursement by the investment adviser but prior to reductions from brokerage service
arrangements or other expense offset arrangements. Expenses net of all reductions represent the net expenses paid by the class.
D Amount represents less than $.01 per share.
|
See accompanying notes which are an integral part of the financial statements.
|
Notes to Financial Statements
For the period ended July 31, 2005
|
1. Significant Accounting Policies.
|
Fidelity Advisor Natural Resources Fund (the fund) is a non-diversified fund of Fidelity Advisor Series VII (the trust) and is authorized to issue an unlimited number of shares. The trust is registered under the Investment Company Act of 1940, as amended (the 1940 Act), as an open-end management investment company organized as a Massachusetts business trust.
The fund offers Class A, Class T, Class B, Class C, and Institutional Class shares, each of which has equal rights as to assets and voting privileges. Each class has exclusive voting rights with respect to matters that affect that class. Class B shares will automatically convert to Class A shares after a holding period of seven years from the initial date of purchase. Investment income, realized and unrealized capital gains and losses, the common expenses of the fund, and certain fund-level expense reductions, if any, are allocated on a pro rata basis to each class based on the relative net assets of each class to the total net assets of the fund. Each class differs with respect to transfer agent and distribution and service plan fees incurred. Certain expense reductions also differ by class.
The financial statements have been prepared in conformity with accounting principles generally accepted in the United States of America, which require management to make certain estimates and assumptions at the date of the financial statements. The following summarizes the significant accounting policies of the fund:
Security Valuation. Net asset value per share (NAV calculation) is calculated as of the close of business of the New York Stock Exchange, normally 4:00 p.m. Eastern time. Equity securities, including restricted securities, for which market quotations are available are valued at the last sale price or official closing price (closing bid price or last evaluated quote if no sale has occurred) on the primary market or exchange on which they trade. If prices are not readily available or do not accurately reflect fair value for a security, or if a security’s value has been materially affected by events occurring after the close of the exchange or market on which the security is principally traded, that security may be valued by another method that the Board of Trustees believes accurately reflects fair value. A security’s valuation may differ depending on the method used for determining value. Price movements in futures contracts and ADRs, market and trading trends, the bid/ask quotes of brokers and off-exchange institutional trading may be reviewed in the course of making a good faith determination of a security’s fair value. Short-term securities with remaining maturities of sixty days or less for which quotations are not readily available are valued on the basis of amortized cost. Investments in open-end investment companies are valued at their net asset value each business day.
Foreign Currency. The fund uses foreign currency contracts to facilitate transactions in foreign-denominated securities. Losses from these transactions may arise from changes in the value of the foreign currency or if the counterparties do not perform under the contracts’ terms.
Foreign-denominated assets, including investment securities, and liabilities are translated into U.S. dollars at the exchange rate at period end. Purchases and sales of investment securities, income and dividends received and expenses denominated in foreign currencies are translated into U.S. dollars at the exchange rate in effect on the transaction date.
The effects of exchange rate fluctuations on investments are included with the net realized and unrealized gain (loss) on investment securities. Other foreign currency transactions resulting in realized and unrealized gain (loss) are disclosed separately.
Investment Transactions and Income. Security transactions are accounted for as of trade date. Gains and losses on securities sold are determined on the basis of identified cost and may include proceeds received from litigation. Dividend income is recorded on the ex-dividend date, except for certain dividends from foreign securities where the ex-dividend date may have passed, which are recorded as soon as the fund is informed of the ex-dividend date. Non-cash dividends included in dividend income, if any, are recorded at the fair market value of the securities received. Interest income is accrued as earned. Interest income includes coupon interest and amortization of premium and accretion of discount on debt securities. Investment income is recorded net of foreign taxes withheld where recovery of such taxes is uncertain.
Expenses. Most expenses of the trust can be directly attributed to a fund. Expenses which cannot be directly attributed are apportioned among each fund in the trust.
Income Tax Information and Distributions to Shareholders. Each year, the fund intends to qualify as a regulated investment company by distributing all of its taxable income and realized gains under Subchapter M of the Internal Revenue Code. As a result, no provision for income taxes is required in the accompanying financial statements. Foreign taxes are provided for based on the fund’s understanding of the tax rules and rates that exist in the foreign markets in which it invests.
Distributions are recorded on the ex-dividend date. Income dividends and capital gain distributions are declared separately for each class. Income and capital gain distributions are determined in accordance with income tax regulations, which may differ from generally accepted accounting principles. In addition, the fund will claim a portion of the payment made to redeeming shareholders as a distribution for income tax purposes. Capital accounts within the financial statements are adjusted for permanent book-tax differences. These adjustments have no impact on net assets or the results of operations. Temporary book-tax differences will reverse in a subsequent period.
| | 1. Significant Accounting Policies - continued
Income Tax Information and Distributions to Shareholders - continued
|
Book-tax differences are primarily due to foreign currency transactions, passive foreign investment companies (PFIC), capital loss carryforwards and losses deferred due to wash sales.
The tax-basis components of distributable earnings and the federal tax cost as of period end were as follows:
| Unrealized appreciation | | $ 161,536,802 | | | | |
| Unrealized depreciation | | | | (4,781,166) | | | | |
| Net unrealized appreciation (depreciation) | | 156,755,636 | | | | |
| Undistributed ordinary income | | 14,986,118 | | | | |
| Undistributed long-term capital gain | | 38,055,302 | | | | |
| |
| Cost for federal income tax purposes | | $ 412,969,754 | | | | |
| |
| The tax character of distributions paid was as follows: | | | | | | | | |
| | | July 31, 2005 | | | | July 31, 2004 |
| Ordinary Income | | $ | | 316,454 | | $ | | 681,969 |
| Long-term Capital Gains | | | | 5,002,969 | | | | |
| Total | | $ | | 5,319,423 | | $ | | 681,969 |
Short-Term Trading (Redemption) Fees. Shares held in the fund less than 60 days are subject to a redemption fee equal to 1.00% of the proceeds of the redeemed shares. All redemption fees, including any estimated redemption fees paid by Fidelity Management & Research Company (FMR), are retained by the fund and accounted for as an addition to paid in capital.
Repurchase Agreements. FMR has received an Exemptive Order from the Securities and Exchange Commission (the SEC) which permits the fund and other affiliated entities of FMR to transfer uninvested cash balances into joint trading accounts which are then invested in repurchase agreements. The fund may also invest directly with institutions in repurchase agreements. Repurchase agreements are collateralized by government or non-government securities. Collateral is held in segregated accounts with custodian banks and may be obtained in the event of a default of the counterparty. The fund monitors, on a daily basis, the value of the collateral to ensure it is at least equal to the principal amount of the repurchase agreement (including accrued interest). In the event of a default by the counterparty, realization of the collateral proceeds could be delayed, during which time the value of the collateral may decline.
| | 3. Purchases and Sales of Investments.
|
Purchases and sales of securities, other than short-term securities and U.S. government securities, aggregated $581,829,842 and $530,005,208, respec tively. The fund realized a loss on the sale of an investment not meeting the investment restrictions of the fund. The loss was fully reimbursed by the fund’s investment advisor.
| | 4. Fees and Other Transactions with Affiliates.
|
Management Fee. FMR and its affiliates provide the fund with investment management related services for which the fund pays a monthly manage ment fee. The management fee is the sum of an individual fund fee rate that is based on an annual rate of .30% of the fund’s average net assets and a group fee rate that averaged .27% during the period. The group fee rate is based upon the average net assets of all the mutual funds advised by FMR. The group fee rate decreases as assets under management increase and increases as assets under management decrease. For the period, the total annual management fee rate was ..57% of the fund’s average net assets.
| | Notes to Financial Statements - continued
4. Fees and Other Transactions with Affiliates - continued
|
Distribution and Service Plan. In accordance with Rule 12b-1 of the 1940 Act, the fund has adopted separate Distribution and Service Plans for each class of shares. Certain classes pay Fidelity Distributors Corporation (FDC), an affiliate of FMR, separate Distribution and Service Fees, each of which is based on an annual percentage of each class’ average net assets. In addition, FDC may pay financial intermediaries for selling shares of the fund and providing shareholder support services. For the period, the Distribution and Service Fee rates and the total amounts paid to and retained by FDC were as follows:
| | | Distribution | | Service | | | | Paid to | | | | Retained |
| | | Fee | | Fee | | | | FDC | | | | by FDC |
| Class A | | 0% | | .25% | | $ | | 153,254 | | $ | | 165 |
| Class T | | 25% | | .25% | | | | 1,158,870 | | | | 14,728 |
| Class B | | 75% | | .25% | | | | 808,847 | | | | 606,708 |
| Class C | | 75% | | .25% | | | | 512,692 | | | | 148,221 |
| |
| | | | | | | $ | | 2,633,663 | | $ | | 769,822 |
Sales Load. FDC receives a front-end sales charge of up to 5.75% for selling Class A shares, and 3.50% for selling Class T shares, some of which is paid to financial intermediaries for selling shares of the fund. FDC receives the proceeds of contingent deferred sales charges levied on Class A, Class T, Class B, and Class C redemptions. These charges depend on the holding period. The deferred sales charges range from 5% to 1% for Class B, 1% for Class C, and .25% for certain purchases of Class A and Class T shares.
For the period, sales charge amounts retained by FDC were as follows:
| | | | | Retained |
| | | | | by FDC |
| Class A | | $ | | 119,277 |
| Class T | | | | 54,948 |
| Class B* | | | | 176,691 |
| Class C* | | | | 10,805 |
| | | $ | | 361,721 |
| |
| * When Class B and Class C shares are initially sold, FDC pays commissions from its own resources to financial intermediaries through which the sales are made. | | | | |
Transfer Agent Fees. Fidelity Investments Institutional Operations Company, Inc. (FIIOC), an affiliate of FMR, is the transfer, dividend disbursing and shareholder servicing agent for each class of the fund. FIIOC receives account fees and asset-based fees that vary according to the account size and type of account of the shareholders of the respective classes of the fund. FIIOC pays for typesetting, printing and mailing of shareholder reports, except proxy statements. For the period the total transfer agent fees paid by each class to FIIOC, were as follows:
| | | | | | | % of |
| | | | | | | Average |
| | | | | Amount | | Net Assets |
| Class A | | $ | | 207,874 | | .34 |
| Class T | | | | 655,816 | | .28 |
| Class B | | | | 262,058 | | .32 |
| Class C | | | | 146,762 | | .29 |
| Institutional Class | | | | 15,495 | | .24 |
| |
| | | $ | | 1,288,005 | | |
Accounting and Security Lending Fees. Fidelity Service Company, Inc. (FSC), an affiliate of FMR, maintains the fund’s accounting records. The accounting fee is based on the level of average net assets for the month. Under a separate contract, FSC administers the security lending program. The security lending fee is based on the number and duration of lending transactions.
Central Funds. The fund may invest in affiliated Central Funds managed by Fidelity Investments Money Management, Inc. (FIMM), an affiliate of FMR. The Central Funds are open-end investment companies available only to investment companies and other accounts managed by FMR and its affiliates. The Money Market Central Funds seek preservation of capital and current income. The Central Funds do not pay a management fee. Income distributions earned by the fund are recorded as income in the accompanying financial statements and totaled $326,287 for the period.
Brokerage Commissions. The fund placed a portion of its portfolio transactions with brokerage firms which are affiliates of the investment adviser. The commissions paid to these affiliated firms were $26,202 for the period.
4. Fees and Other Transactions with Affiliates - continued
Interfund Lending Program. Pursuant to an Exemptive Order issued by the SEC, the fund, along with other registered investment companies having management contracts with FMR, may participate in an interfund lending program. This program provides an alternative credit facility allowing the funds to borrow from, or lend money to, other participating affiliated funds. At period end, there were no interfund loans outstanding. The fund’s activity in this program during the period for which loans were outstanding was as follows:
| | | | | | | Interest Earned | | | | |
| | | Average Daily Loan | | Weighted Average | | (included in | | | | |
| Borrower or Lender | | Balance | | Interest Rate | | interest income) | | | | Interest Expense |
| Borrower | | $ 1,718,800 | | 2.40% | | — | | $ | | 572 |
5. Committed Line of Credit.
|
The fund participates with other funds managed by FMR in a $4.2 billion credit facility (the “line of credit”) to be utilized for temporary or emergency purposes to fund shareholder redemptions or for other short-term liquidity purposes. The fund has agreed to pay commitment fees on its pro rata portion of the line of credit. During the period, there were no borrowings on this line of credit.
The fund lends portfolio securities from time to time in order to earn additional income. The fund receives collateral (in the form of U.S. Treasury obligations, letters of credit and/or cash) against the loaned securities and maintains collateral in an amount not less than 100% of the market value of the loaned securities during the period of the loan. The market value of the loaned securities is determined at the close of business of the fund and any additional required collateral is delivered to the fund on the next business day. If the borrower defaults on its obligation to return the securities loaned because of insolvency or other reasons, a fund could experience delays and costs in recovering the securities loaned or in gaining access to the collateral. Cash collateral is invested in the Fidelity Securities Lending Cash Central Fund. The value of loaned securities and cash collateral at period end are disclosed on the fund’s Statement of Assets and Liabilities.
Many of the brokers with whom FMR places trades on behalf of the fund provided services to the fund in addition to trade execution. These services included payments of certain expenses on behalf of the fund totaling $224,498 for the period. In addition, through arrangements with the fund’s custodian, credits realized as a result of uninvested cash balances were used to reduce the fund’s expenses. During the period, these credits reduced the fund’s custody expenses by $372.
The fund’s organizational documents provide former and current trustees and officers with a limited indemnification against liabilities arising in connection with the performance of their duties to the fund. In the normal course of business, the fund may also enter into contracts that provide general indemnifications. The fund’s maximum exposure under these arrangements is unknown as this would be dependent on future claims that may be made against the fund. The risk of material loss from such claims is considered remote.
9. Distributions to Shareholders.
|
Distributions to shareholders of each class were as follows:
| Years ended July 31, | | 2005 | | | | 2004 |
| From net investment income | | | | | | |
| Class A | | $ 99,736 | | $ | | 99,224 |
| Class T | | 195,831 | | | | 560,230 |
| Institutional Class | | 20,887 | | | | 22,515 |
| Total | | $ 316,454 | | $ | | 681,969 |
| From net realized gain | | | | | | |
| Class A | | $ 681,527 | | $ | | — |
| Class T | | 2,676,352 | | | | — |
| Class B | | 974,727 | | | | — |
| Class C | | 592,512 | | | | — |
| Institutional Class | | 77,851 | | | | — |
| Total | | $ 5,002,969 | | $ | | — |
Notes to Financial Statements - continued
Transactions for each class of shares were as follows:
| | | | | Shares | | | | Dollars |
| Years ended July 31, | | 2005 | | 2004 | | 2005 | | | | 2004 |
| Class A | | | | | | | | | | |
| Shares sold | | 1,253,753 | | 879,939 | | $ 43,103,050 | | $ 23,517,820 |
| Reinvestment of distributions | | 23,046 | | 3,715 | | 714,182 | | | | 87,332 |
| Shares redeemed | | (591,542) | | (368,575) | | (19,723,914) | | | | (9,483,597) |
| Net increase (decrease) | | 685,257 | | 515,079 | | $ 24,093,318 | | $ 14,121,555 |
| Class T | | | | | | | | | | |
| Shares sold | | 1,803,813 | | 1,119,622 | | $ 62,397,322 | | $ 29,514,297 |
| Reinvestment of distributions | | 85,233 | | 22,018 | | 2,678,882 | | | | 522,475 |
| Shares redeemed | | (1,932,106) | | (1,393,256) | | (66,301,961) | | (36,120,583) |
| Net increase (decrease) | | (43,060) | | (251,616) | | $ (1,225,757) | | $ (6,083,811) |
| Class B | | | | | | | | | | |
| Shares sold | | 949,870 | | 634,362 | | $ 31,871,038 | | $ 16,119,361 |
| Reinvestment of distributions | | 27,043 | | — | | 820,469 | | | | — |
| Shares redeemed | | (814,770) | | (627,931) | | (26,808,279) | | (16,075,114) |
| Net increase (decrease) | | 162,143 | | 6,431 | | $ 5,883,228 | | $ | | 44,247 |
| Class C | | | | | | | | | | |
| Shares sold | | 999,959 | | 581,963 | | $ 33,826,711 | | $ 15,409,819 |
| Reinvestment of distributions | | 15,581 | | — | | 475,225 | | | | — |
| Shares redeemed | | (496,487) | | (315,706) | | (16,702,359) | | | | (7,916,650) |
| Net increase (decrease) | | 519,053 | | 266,257 | | $ 17,599,577 | | $ | | 7,493,169 |
| Institutional Class | | | | | | | | | | |
| Shares sold | | 134,272 | | 62,791 | | $ 4,562,121 | | $ | | 1,688,343 |
| Reinvestment of distributions | | 2,107 | | 613 | | 66,476 | | | | 14,771 |
| Shares redeemed | | (52,414) | | (41,908) | | (1,778,573) | | | | (1,080,767) |
| Net increase (decrease) | | 83,965 | | 21,496 | | $ 2,850,024 | | $ | | 622,347 |
Average annual total return reflects the change in the value of an investment, assuming reinvestment of the class’ dividend income and capital gains (the profits earned upon the sale of securities that have grown in value) and assuming a constant rate of performance each year. The $10,000 table and the fund’s returns do not reflect the deduction of taxes that a shareholder would pay on fund distributions or the redemption of fund shares. During periods of reimbursement by Fidelity, a fund’s total return will be greater than it would be had the reimbursement not occurred. How a fund did yesterday is no guarantee of how it will do tomorrow.
| Average Annual Total Returns | | | | |
| Periods ended July 31, | | Past 1 | | Past 5 | | Life of |
| 2005 | | year | | years | | fundA |
| Institutional Class | | 16.73% | | --13.68% | | 8.60% |
| |
| A From September 3, 1996. | | | | | | |
| | $10,000 Over Life of Fund
|
Let’s say hypothetically that $10,000 was invested in Fidelity Advisor Technology Fund — Institutional Class on September 3, 1996, when the fund started. The chart shows how the value of your investment would have changed, and also shows how the S&P 500 Index performed over the same period.
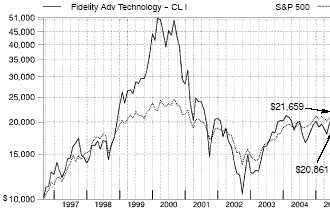
Management’s Discussion of Fund Performance
Comments from Charlie Chai, Portfolio Manager of Fidelity® Advisor Technology Fund
A late-inning rally on Wall Street helped push some key U.S. equity indexes to four-year highs by the conclusion of the 12-month period ending July 31, 2005. Spurred on by bullish economic data and strong corporate earnings, investors enjoyed a stellar month of July, capping off a turbulent 12-month period for U.S. equity markets. Stock prices bounced up and down during most of the year, moving in cadence with gyrations in the price of crude oil and investors’ gathering and ebbing concerns about inflation. The Federal Reserve Board raised short-term interest rates eight times during the period, also affecting overall market sentiment. Despite their fluctuations, the major equity indexes finished on a high note, with the Standard & Poor’s 500SM Index and the NASDAQ Composite® Index posting gains of 14.05% and 16.51%, respectively, for the period. The small-cap Russell 2000® Index rose 24.78% and the Russell Midcap® Index jumped 28.93%, while the blue-chips’ Dow Jones Industrial AverageSM advanced only 7.29% .
For the 12 months ending July 31, 2005, the fund’s Institutional Class shares returned 16.73%, beating the 11.63% gain of the Goldman Sachs® Technology Index. The fund also bested the S&P 500®. My stock selection in computer hardware, Internet portals/content, and computer storage and peripherals was particularly helpful to performance. Internet search engine provider Google was the top contributor in absolute terms and relative to the sector index, as analysts kept raising their earnings estimates for the company. In the case of Apple Computer, investors were attracted primarily by the continued strong sales of the company’s iPod portable digital music player. EMC also provided a nice boost to both absolute and relative returns. Holding back the fund’s performance to some extent was unfavorable stock selection in communications equipment, where the fund’s position in Avaya hurt both absolute and relative performance. The purveyor of VoIP (Voice over Internet Protocol) infrastructure equipment experienced difficulties in executing a recent sales reorganization and badly missed earnings targets for its fiscal second quarter ending March 31, 2005. Semiconductor maker Integrated Circuit Systems also hurt performance by both absolute and relative measures. Weak demand in the company’s digital consumer electronics and communications business hampered its financial results.
The views expressed in this statement reflect those of the portfolio manager only through the end of the period of the report as stated on the cover and do not necessarily represent the views of Fidelity or any other person in the Fidelity organization. Any such views are subject to change at any time based upon market or other conditions and Fidelity disclaims any responsibility to update such views. These views may not be relied on as investment advice and, because investment decisions for a Fidelity fund are based on numerous factors, may not be relied on as an indication of trading intent on behalf of any Fidelity fund.
Shareholder Expense Example
|
As a shareholder of the Fund, you incur two types of costs: (1) transaction costs, including sales charges (loads) on purchase payments or redemption proceeds, redemption fees, and (2) ongoing costs, including management fees, distribution and/or service (12b-1) fees and other Fund expenses. This Example is intended to help you understand your ongoing costs (in dollars) of investing in the Fund and to compare these costs with the ongoing costs of investing in other mutual funds.
The Example is based on an investment of $1,000 invested at the beginning of the period and held for the entire period (February 1, 2005 to July 31, 2005).
The first line of the table below for each class of the Fund provides information about actual account values and actual expenses. You may use the information in this line, together with the amount you invested, to estimate the expenses that you paid over the period. Simply divide your account value by $1,000.00 (for example, an $8,600 account value divided by $1,000.00 = 8.6), then multiply the result by the number in the first line for a class of the Fund under the heading entitled “Expenses Paid During Period” to estimate the expenses you paid on your account during this period.
Hypothetical Example for Comparison Purposes
|
The second line of the table below for each class of the Fund provides information about hypothetical account values and hypothetical expenses based on a Class’ actual expense ratio and an assumed rate of return of 5% per year before expenses, which is not the Class’ actual return. The hypothetical account values and expenses may not be used to estimate the actual ending account balance or expenses you paid for the period. You may use this information to compare the ongoing costs of investing in the Fund and other funds. To do so, compare this 5% hypothetical example with the 5% hypothetical examples that appear in the shareholder reports of the other funds.
Please note that the expenses shown in the table are meant to highlight your ongoing costs only and do not reflect any transaction costs. Therefore, the second line of the table is useful in comparing ongoing costs only, and will not help you determine the relative total costs of owning different funds. In addition, if these transactional costs were included, your costs would have been higher.
| | | | | | | | | | | Expenses Paid |
| | | Beginning | | | | Ending | | | | During Period* |
| | | Account Value | | | | Account Value | | | | February 1, 2005 |
| | | February 1, 2005 | | | | July 31, 2005 | | | | to July 31, 2005 |
| Class A | | | | | | | | | | |
| Actual | | $ 1,000.00 | | $ | | 1,089.70 | | $ | | 6.84 |
| HypotheticalA | | $ 1,000.00 | | $ | | 1,018.25 | | $ | | 6.61 |
| Class T | | | | | | | | | | |
| Actual | | $ 1,000.00 | | $ | | 1,088.40 | | $ | | 8.18 |
| HypotheticalA | | $ 1,000.00 | | $ | | 1,016.96 | | $ | | 7.90 |
| Class B | | | | | | | | | | |
| Actual | | $ 1,000.00 | | $ | | 1,086.20 | | $ | | 10.66 |
| HypotheticalA | | $ 1,000.00 | | $ | | 1,014.58 | | $ | | 10.29 |
| Class C | | | | | | | | | | |
| Actual | | $ 1,000.00 | | $ | | 1,085.80 | | $ | | 10.71 |
| HypotheticalA | | $ 1,000.00 | | $ | | 1,014.53 | | $ | | 10.34 |
| Institutional Class | | | | | | | | | | |
| Actual | | $ 1,000.00 | | $ | | 1,092.80 | | $ | | 4.83 |
| HypotheticalA | | $ 1,000.00 | | $ | | 1,020.18 | | $ | | 4.66 |
| |
| A 5% return per year before expenses | | | | | | | | | | |
* Expenses are equal to each Class’ annualized expense ratio (shown in the table below); multiplied by the average account value over the period, multiplied by 181/365 (to reflect the one-half year period).
| | | Annualized |
| | | Expense Ratio |
| Class A | | 1.32% |
| Class T | | 1.58% |
| Class B | | 2.06% |
| Class C | | 2.07% |
| Institutional Class | | 93% |
| | Advisor Technology Fund
Investment Changes
|
| Top Ten Stocks as of July 31, 2005 | | |
| | | % of fund’s | | % of fund’s net assets |
| | | net assets | | 6 months ago |
| Juniper Networks, Inc. | | 7.1 | | 3.1 |
| Research In Motion Ltd. | | 6.8 | | 1.4 |
| QUALCOMM, Inc. | | 6.6 | | 4.3 |
| Nokia Corp. sponsored ADR | | 6.3 | | 1.9 |
| EMC Corp. | | 4.7 | | 3.9 |
| eBay, Inc. | | 3.0 | | 1.2 |
| Google, Inc. Class A (sub. vtg.) | | 2.9 | | 1.6 |
| Microsoft Corp. | | 2.7 | | 1.5 |
| Apple Computer, Inc. | | 2.4 | | 3.0 |
| AU Optronics Corp. sponsored | | | | |
| ADR | | 2.0 | | 0.5 |
| | | 44.5 | | |
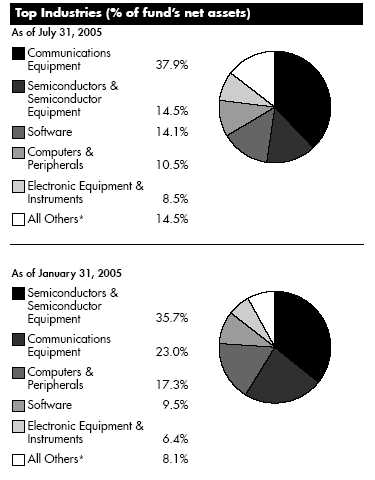
* Includes short term investments and net other assets.
Prior period industry classifications reflect the categories in place as of the date indicated and have not been adjusted to reflect current industry classifications.
Technology A-128
Advisor Technology Fund
Investments July 31, 2005
Showing Percentage of Net Assets
| Common Stocks — 98.9% | | | | |
| | | Shares | | Value (Note 1) |
| |
| COMMUNICATIONS EQUIPMENT – 37.9% | | | | |
| Communications Equipment – 37.9% | | | | |
| ADC Telecommunications, Inc. (a) | | 159,614 | | $ 4,172,310 |
| Andrew Corp. (a) | | 562,500 | | 6,181,875 |
| AudioCodes Ltd. (a) | | 1,055,300 | | 9,592,677 |
| Avaya, Inc. (a) | | 506,100 | | 5,228,013 |
| Carrier Access Corp. (a) | | 161,100 | | 853,830 |
| CIENA Corp. (a) | | 3,157,200 | | 7,072,128 |
| Comverse Technology, Inc. (a) | | 264,300 | | 6,684,147 |
| Corning, Inc. (a) | | 606,500 | | 11,553,825 |
| Extreme Networks, Inc. (a) | | 155,000 | | 740,900 |
| F5 Networks, Inc. (a) | | 398,800 | | 16,821,384 |
| Foxconn International Holdings Ltd. | | 130,000 | | 107,029 |
| Harris Corp. | | 3,200 | | 118,624 |
| ITF Optical Technologies, Inc. Series A (e) | | 34,084 | | 0 |
| Ixia (a) | | 202,900 | | 4,005,246 |
| Juniper Networks, Inc. (a) | | 2,626,846 | | 63,018,035 |
| Motorola, Inc. | | 638,300 | | 13,519,194 |
| MRV Communications, Inc. (a) | | 584,600 | | 1,245,198 |
| NMS Communications Corp. (a) | | 151,180 | | 509,477 |
| Nokia Corp. sponsored ADR | | 3,516,200 | | 56,083,390 |
| OZ Optics Ltd. unit (a)(e) | | 68,000 | | 1,003,000 |
| Powerwave Technologies, Inc. (a) | | 335,300 | | 3,845,891 |
| QUALCOMM, Inc. | | 1,483,700 | | 58,591,313 |
| Redback Networks, Inc. (a) | | 177,818 | | 1,474,111 |
| Research In Motion Ltd. (a) | | 856,700 | | 60,581,603 |
| Sonus Networks, Inc. (a) | | 887,500 | | 4,295,500 |
| | | | | 337,298,700 |
| |
| COMPUTERS & PERIPHERALS – 10.5% | | | | |
| Computer Hardware – 2.9% | | | | |
| Apple Computer, Inc. (a) | | 495,500 | | 21,133,075 |
| Avid Technology, Inc. (a) | | 110,700 | | 4,555,305 |
| Palm, Inc. (a) | | 14,600 | | 416,684 |
| | | | | 26,105,064 |
| Computer Storage & Peripherals – 7.6% | | | | |
| Advanced Digital Information Corp. (a) . | | 228,000 | | 1,819,440 |
| Brocade Communications Systems, | | | | |
| Inc. (a) | | 4,200 | | 18,816 |
| EMC Corp. (a) | | 3,028,172 | | 41,455,675 |
| McDATA Corp. Class A (a) | | 365,900 | | 1,770,956 |
| Network Appliance, Inc. (a) | | 474,900 | | 12,114,699 |
| SanDisk Corp. (a) | | 268,200 | | 9,070,524 |
| Synaptics, Inc. (a) | | 85,500 | | 1,355,175 |
| | | | | 67,605,285 |
| |
| TOTAL COMPUTERS & PERIPHERALS | | | | 93,710,349 |
| |
| ELECTRICAL EQUIPMENT – 0.6% | | | | |
| Electrical Components & Equipment – 0.6% | | | | |
| Evergreen Solar, Inc. (a)(d) | | 738,800 | | 5,208,540 |
| | | Shares | | Value (Note 1) |
| |
| ELECTRONIC EQUIPMENT & INSTRUMENTS – 8.5% | | |
| Electronic Equipment & Instruments – 5.5% | | | | |
| Aeroflex, Inc. (a) | | 123,300 | | $ 1,193,544 |
| Agilent Technologies, Inc. (a) | | 183,000 | | 4,801,920 |
| Applied Films Corp. (a) | | 99,100 | | 2,603,357 |
| AU Optronics Corp.: | | | | |
| ADR (a) | | 91,600 | | 1,452,776 |
| sponsored ADR (d) | | 1,144,064 | | 18,144,855 |
| LG.Philips LCD Co. Ltd. sponsored ADR . | | 85,100 | | 1,959,002 |
| Photon Dynamics, Inc. (a) | | 705,400 | | 13,356,749 |
| Samsung SDI Co. Ltd. | | 22,100 | | 2,202,874 |
| Vishay Intertechnology, Inc. (a) | | 244,200 | | 3,423,684 |
| | | | | 49,138,761 |
| Electronic Manufacturing Services – 1.7% | | | | |
| Hon Hai Precision Industries Co. Ltd. | | 1,252,713 | | 7,035,947 |
| KEMET Corp. (a) | | 336,700 | | 2,821,546 |
| Molex, Inc. | | 81,600 | | 2,304,384 |
| TTM Technologies, Inc. (a) | | 204,900 | | 1,452,741 |
| Xyratex Ltd. (a) | | 93,027 | | 1,558,202 |
| | | | | 15,172,820 |
| Technology Distributors – 1.3% | | | | |
| Arrow Electronics, Inc. (a) | | 145,100 | | 4,355,902 |
| Avnet, Inc. (a) | | 173,400 | | 4,539,612 |
| Ingram Micro, Inc. Class A (a) | | 112,400 | | 2,095,136 |
| | | | | 10,990,650 |
| |
| TOTAL ELECTRONIC EQUIPMENT & INSTRUMENTS | | 75,302,231 |
| |
| HOUSEHOLD DURABLES – 0.2% | | | | |
| Consumer Electronics – 0.2% | | | | |
| ReignCom Ltd. | | 24,592 | | 370,094 |
| Thomson SA | | 68,900 | | 1,562,221 |
| | | | | 1,932,315 |
| |
| INTERNET & CATALOG RETAIL – 3.3% | | | | |
| Internet Retail – 3.3% | | | | |
| eBay, Inc. (a) | | 647,200 | | 27,040,016 |
| Overstock.com, Inc. (a)(d) | | 49,100 | | 2,125,539 |
| | | | | 29,165,555 |
| |
| INTERNET SOFTWARE & SERVICES – 7.1% | | | | |
| Internet Software & Services – 7.1% | | | | |
| Akamai Technologies, Inc. (a) | | 155,700 | | 2,377,539 |
| AsiaInfo Holdings, Inc. (a) | | 120,000 | | 655,200 |
| Google, Inc. Class A (sub. vtg.) | | 88,700 | | 25,524,312 |
| Marchex, Inc. Class B (a)(d) | | 300,700 | | 4,940,501 |
| Openwave Systems, Inc. (a) | | 661,166 | | 12,264,629 |
| VeriSign, Inc. (a) | | 157,400 | | 4,141,194 |
| Yahoo!, Inc. (a) | | 405,660 | | 13,524,704 |
| | | | | 63,428,079 |
See accompanying notes which are an integral part of the financial statements.
A-129 Annual Report
Advisor Technology Fund Investments - continued
| Common Stocks – continued | | | | | | |
| | | Shares | | Value (Note 1) |
| |
| IT SERVICES – 1.8% | | | | | | |
| Data Processing & Outsourced Services – 1.0% | | | | |
| Affiliated Computer Services, Inc. | | | | | | |
| Class A (a) | | 66,500 | | $ | | 3,323,005 |
| Paychex, Inc. | | 156,700 | | | | 5,470,397 |
| | | | | | | 8,793,402 |
| IT Consulting & Other Services – 0.8% | | | | | | |
| Accenture Ltd. Class A (a) | | 189,900 | | | | 4,755,096 |
| Kanbay International, Inc. | | 116,000 | | | | 2,570,560 |
| | | | | | | 7,325,656 |
| |
| TOTAL IT SERVICES | | | | | | 16,119,058 |
| |
| OFFICE ELECTRONICS – 0.2% | | | | | | |
| Office Electronics – 0.2% | | | | | | |
| Zebra Technologies Corp. Class A (a) | | 49,700 | | | | 1,938,300 |
| SEMICONDUCTORS & SEMICONDUCTOR EQUIPMENT – 14.5% | | |
| Semiconductor Equipment – 2.8% | | | | | | |
| Amkor Technology, Inc. (a) | | 564,700 | | | | 2,631,502 |
| ASE Test Ltd. (a) | | 804,900 | | | | 5,594,055 |
| ASML Holding NV (NY Shares) (a) | | 190,300 | | | | 3,349,280 |
| ATMI, Inc. (a) | | 87,300 | | | | 2,778,759 |
| Axcelis Technologies, Inc. (a) | | 94,600 | | | | 653,686 |
| Credence Systems Corp. (a) | | 274,300 | | | | 2,987,127 |
| Lam Research Corp. (a) | | 30,200 | | | | 859,190 |
| Teradyne, Inc. (a) | | 324,900 | | | | 5,045,697 |
| Varian Semiconductor Equipment | | | | | | |
| Associates, Inc. (a) | | 23,700 | | | | 984,024 |
| | | | | | | 24,883,320 |
| Semiconductors – 11.7% | | | | | | |
| Altera Corp. (a) | | 298,200 | | | | 6,521,634 |
| Analog Devices, Inc. | | 109,700 | | | | 4,300,240 |
| Applied Micro Circuits Corp. (a) | | 1,576,800 | | | | 4,746,168 |
| ATI Technologies, Inc. (a) | | 406,400 | | | | 5,118,380 |
| Atmel Corp. (a) | | 648,794 | | | | 1,518,178 |
| Cambridge Display Technologies, Inc. | | 61,700 | | | | 510,876 |
| Cypress Semiconductor Corp. (a) | | 323,000 | | | | 4,638,280 |
| Exar Corp. (a) | | 61,000 | | | | 971,425 |
| Fairchild Semiconductor International, | | | | | | |
| Inc. (a) | | 271,800 | | | | 4,582,548 |
| Freescale Semiconductor, Inc.: | | | | | | |
| Class A | | 205,100 | | | | 5,234,152 |
| Class B | | 87,180 | | | | 2,244,885 |
| Intel Corp. | | 73,100 | | | | 1,983,934 |
| Intersil Corp. Class A | | 237,100 | | | | 4,592,627 |
| Linear Technology Corp. | | 164,600 | | | | 6,396,356 |
| Marvell Technology Group Ltd. (a) | | 92,200 | | | | 4,028,218 |
| Maxim Integrated Products, Inc. | | 155,400 | | | | 6,506,598 |
| Microchip Technology, Inc. | | 56,500 | | | | 1,755,455 |
| Micron Technology, Inc. (a) | | 76,600 | | | | 910,008 |
| Mindspeed Technologies, Inc. (a) | | 2,272,400 | | | | 3,249,532 |
| National Semiconductor Corp. | | 249,100 | | | | 6,155,261 |
| | | Shares | | Value (Note 1) |
| O2Micro International Ltd. (a) | | 115,200 | | $ 1,976,832 |
| ON Semiconductor Corp. (a) | | 320,300 | | 1,841,725 |
| Semiconductor Manufacturing | | | | |
| International Corp. | | | | |
| sponsored ADR (a)(d) | | 126,600 | | 1,354,620 |
| Silicon Image, Inc. (a) | | 40,600 | | 479,892 |
| Siliconware Precision Industries Co. Ltd. | | | | |
| sponsored ADR (d) | | 270,067 | | 1,407,049 |
| STATS ChipPAC Ltd. sponsored | | | | |
| ADR (a)(d) | | 1,178,300 | | 8,071,355 |
| Trident Microsystems, Inc. (a) | | 146,800 | | 4,791,552 |
| Vitesse Semiconductor Corp. (a) | | 974,600 | | 2,163,612 |
| Zoran Corp. (a) | | 386,477 | | 5,565,269 |
| | | | | 103,616,661 |
| |
| TOTAL SEMICONDUCTORS & SEMICONDUCTOR | | |
| EQUIPMENT | | | | 128,499,981 |
| |
| SOFTWARE – 14.1% | | | | |
| Application Software – 5.6% | | | | |
| Citrix Systems, Inc. (a) | | 284,300 | | 6,774,869 |
| Cognos, Inc. (a) | | 25,200 | | 981,778 |
| FileNET Corp. (a) | | 33,800 | | 955,526 |
| Hyperion Solutions Corp. (a) | | 61,200 | | 2,880,072 |
| JAMDAT Mobile, Inc. (d) | | 113,100 | | 3,236,922 |
| Kronos, Inc. (a) | | 22,100 | | 1,038,700 |
| Mercury Interactive Corp. (a) | | 101,300 | | 3,988,181 |
| Monterey Design Systems (a)(e) | | 34,200 | | 0 |
| Quest Software, Inc. (a) | | 501,700 | | 7,149,225 |
| Salesforce.com, Inc. (a) | | 102,900 | | 2,423,295 |
| Siebel Systems, Inc. | | 372,200 | | 3,126,480 |
| TIBCO Software, Inc. (a) | | 263,400 | | 2,025,546 |
| Ulticom, Inc. (a) | | 1,218,798 | | 14,930,276 |
| | | | | 49,510,870 |
| Home Entertainment Software – 1.1% | | | | |
| Activision, Inc. (a) | | 98,200 | | 1,997,388 |
| Take-Two Interactive Software, Inc. (a) | | 104,600 | | 2,574,206 |
| THQ, Inc. (a) | | 104,500 | | 3,655,410 |
| UBI Soft Entertainment SA (a)(d) | | 33,400 | | 1,853,166 |
| | | | | 10,080,170 |
| Systems Software – 7.4% | | | | |
| Adobe Systems, Inc. | | 154,700 | | 4,585,308 |
| Macrovision Corp. (a) | | 30,100 | | 657,083 |
| Microsoft Corp. | | 959,900 | | 24,583,039 |
| Oracle Corp. (a) | | 964,800 | | 13,101,984 |
| Red Hat, Inc. (a) | | 574,100 | | 8,749,284 |
| Symantec Corp. (a) | | 654,291 | | 14,374,773 |
| | | | | 66,051,471 |
| |
| TOTAL SOFTWARE | | | | 125,642,511 |
See accompanying notes which are an integral part of the financial statements.
Technology A-130
| Common Stocks – continued | | | | | | |
| | | | | Shares | | Value (Note 1) |
| WIRELESS TELECOMMUNICATION SERVICES – 0.2% | | |
| Wireless Telecommunication Services – 0.2% | | |
| Wireless Facilities, Inc. (a) | | | | 289,300 | | $ 1,863,092 |
| TOTAL COMMON STOCKS | | | | | | |
| (Cost $842,625,183) | | | | | | 880,108,711 |
| Convertible Preferred Stocks — 0.0% | | |
| |
| COMMUNICATIONS EQUIPMENT – 0.0% | | | | | | |
| Communications Equipment – 0.0% | | | | | | |
| Chorum Technologies, Inc. Series E (a)(e) | | 17,200 | | 0 |
| Procket Networks, Inc. Series C (a)(e) | | | | 276,000 | | 3 |
| TOTAL CONVERTIBLE PREFERRED STOCKS | | |
| (Cost $2,983,808) | | | | | | 3 |
| Money Market Funds — 3.6% | | | | |
| Fidelity Cash Central Fund, 3.31% (b) | | 4,341,769 | | 4,341,769 |
| Fidelity Securities Lending Cash | | | | | | |
| Central Fund, 3.32% (b)(c) | | 27,376,650 | | 27,376,650 |
| TOTAL MONEY MARKET FUNDS | | | | | | |
| (Cost $31,718,419) | | | | | | 31,718,419 |
| TOTAL INVESTMENT PORTFOLIO | | - 102.5% | | |
| (Cost $877,327,410) | | | | 911,827,133 |
| |
| NET OTHER ASSETS – (2.5)% | | | | | | (21,980,095) |
| NET ASSETS – 100% | | | | $ 889,847,038 |
| Legend | | | | | | |
(a) Non-income producing
(b) Affiliated fund that is available only to investment companies and other
accounts managed by Fidelity Investments. The rate quoted is the
annualized seven-day yield of the fund at period end. A complete listing
of the fund’s holdings as of its most recent quarter end is available upon
request.
(c) Investment made with cash collateral received from securities on loan.
(d) Security or a portion of the security is on loan at period end.
(e) Restricted securities – Investment in securities not registered under the
Securities Act of 1933 (excluding 144A issues). At the end of the period,
the value of restricted securities (excluding 144A issues) amounted to
$1,003,003 or 0.1% of net assets.
|
Additional information on each holding is as follows:
| Security | | Acquisition Date | | Acquisition Cost |
| Chorum Technologies, Inc. Series E | | 9/19/00 | | $ | | 296,528 |
| ITF Optical Technologies, Inc. Series A | | 10/11/00 | | $ | | 1,711,500 |
| Monterey Design Systems | | 11/1/00 | | $ | | 1,795,500 |
| OZ Optics Ltd. unit | | 8/18/00 | | $ | | 1,003,680 |
| | | 11/15/00 -- | | | | |
| Procket Networks, Inc. Series C | | 12/26/00 | | $ | | 2,725,776 |
Distribution of investments by country of issue, as a percentage of total net assets, is as follows:
| United States of America | | 77.4% |
| Canada | | 7.6% |
| Finland | | 6.3% |
| Taiwan | | 3.8% |
| Bermuda | | 1.2% |
| Israel | | 1.1% |
| Others (individually less than 1%) | | 2.6% |
| | | 100.0% |
At July 31, 2005, the fund had a capital loss carryforward of approximately $1,678,030,880 of which $1,178,224,097 and $499,806,783 will expire on July 31, 2010 and 2011, respectively.
See accompanying notes which are an integral part of the financial statements.
Advisor Technology Fund
Financial Statements
|
| Statement of Assets and Liabilities | | |
| | | | | | | July 31, 2005 |
| Assets | | | | | | |
| Investment in securities, at value (in- | | | | |
| cluding securities loaned of | | | | | | |
| $26,248,878) (cost $877,327,410) | | | | |
| — See accompanying schedule | | | | $ | | 911,827,133 |
| Foreign currency held at value (cost | | | | | | |
| $5,367,455) | | | | | | 5,274,354 |
| Receivable for investments sold | | | | | | 21,741,742 |
| Receivable for fund shares sold | | | | | | 543,084 |
| Dividends receivable | | | | | | 298,737 |
| Interest receivable | | | | | | 52,681 |
| Prepaid expenses | | | | | | 1,626 |
| Other affiliated receivables | | | | | | 42 |
| Other receivables | | | | | | 733,699 |
| Total assets | | | | | | 940,473,098 |
| Liabilities | | | | | | |
| Payable for investments purchased | | $ | | 19,264,741 | | |
| Payable for fund shares redeemed | | | | 2,668,253 | | |
| Accrued management fee | | | | 422,831 | | |
| Distribution fees payable | | | | 508,421 | | |
| Other affiliated payables | | | | 344,941 | | |
| Other payables and accrued expenses | | 40,223 | | |
| Collateral on securities loaned, at value | | 27,376,650 | | |
| Total liabilities | | | | | | 50,626,060 |
| Net Assets | | | | $ | | 889,847,038 |
| Net Assets consist of: | | | | | | |
| Paid in capital | | | | $2,514,888,463 |
| Undistributed net investment income | | | | (658) |
| Accumulated undistributed net realized | | | | |
| gain (loss) on investments and for- | | | | |
| eign currency transactions | | | | (1,659,447,405) |
| Net unrealized appreciation (depreci- | | | | |
| ation) on investments and assets and | | | | |
| liabilities in foreign currencies | | | | | | 34,406,638 |
| Net Assets | | | | $ | | 889,847,038 |
| Calculation of Maximum Offering Price | | | | |
| Class A: | | | | | | |
| Net Asset Value and redemption price | | | | |
| per share ($144,969,918 ÷ | | | | | | |
| 8,971,067 shares) | | | | $ | | 16.16 |
| Maximum offering price per share | | | | | | |
| (100/94.25 of $16.16) | | | | $ | | 17.15 |
| Class T: | | | | | | |
| Net Asset Value and redemption price | | | | |
| per share ($315,929,739 ÷ | | | | | | |
| 19,896,633 shares) | | | | $ | | 15.88 |
| Maximum offering price per share | | | | | | |
| (100/96.50 of $15.88) | | | | $ | | 16.46 |
| Class B: | | | | | | |
| Net Asset Value and offering price | | | | |
| per share ($309,020,411 ÷ | | | | | | |
| 20,274,503 shares)A | | | | $ | | 15.24 |
| Class C: | | | | | | |
| Net Asset Value and offering price | | | | |
| per share ($108,287,424 ÷ | | | | | | |
| 7,073,073 shares)A | | | | $ | | 15.31 |
| Institutional Class: | | | | | | |
| Net Asset Value, offering price and | | | | |
| redemption price per share | | | | | | |
| ($11,639,546 ÷ 701,323 shares) | | $ | | 16.60 |
A Redemption price per share is equal to net asset value less any applicable contingent deferred sales charge.
| Statement of Operations | | | | |
| | | | | Year ended July 31, 2005 |
| Investment Income | | | | | | |
| Dividends | | | | $ | | 2,963,949 |
| Special Dividends | | | | | | 9,090,900 |
| Interest | | | | | | 307,864 |
| Security lending | | | | | | 261,092 |
| Total income | | | | | | 12,623,805 |
| Expenses | | | | | | |
| Management fee | | $ | | 5,255,678 | | |
| Transfer agent fees | | | | 4,372,246 | | |
| Distribution fees | | | | 6,420,787 | | |
| Accounting and security lending | | | | | | |
| fees | | | | 330,405 | | |
| Independent trustees’ compensation | | 4,866 | | |
| Custodian fees and expenses | | | | 52,520 | | |
| Registration fees | | | | 73,387 | | |
| Audit | | | | 50,222 | | |
| Legal | | | | 4,595 | | |
| Miscellaneous | | | | 47,749 | | |
| Total expenses before reductions | | 16,612,455 | | |
| Expense reductions | | | | (1,024,783) | | 15,587,672 |
| |
| Net investment income (loss) | | | | | | (2,963,867) |
| Realized and Unrealized Gain (Loss) | | | | |
| Net realized gain (loss) on: | | | | | | |
| Investment securities | | | | 53,251,775 | | |
| Foreign currency transactions | | | | 66,895 | | |
| Total net realized gain (loss) | | | | | | 53,318,670 |
| Change in net unrealized appreci- | | | | |
| ation (depreciation) on: | | | | | | |
| Investment securities | | | | 82,493,965 | | |
| Assets and liabilities in foreign | | | | | | |
| currencies | | | | (69,452) | | |
| Total change in net unrealized ap- | | | | |
| preciation (depreciation) | | | | | | 82,424,513 |
| Net gain (loss) | | | | | | 135,743,183 |
| Net increase (decrease) in net as- | | | | |
| sets resulting from operations | | | | $ | | 132,779,316 |
See accompanying notes which are an integral part of the financial statements.
Technology A-132
| Statement of Changes in Net Assets | | | | | | |
| | | Year ended | | | | Year ended |
| | | July 31, | | | | July 31, |
| | | 2005 | | | | 2004 |
| Increase (Decrease) in Net Assets | | | | | | |
| Operations | | | | | | |
| Net investment income (loss) | | $ (2,963,867) | | $ | | (17,700,644) |
| Net realized gain (loss) | | 53,318,670 | | | | 172,486,507 |
| Change in net unrealized appreciation (depreciation) | | 82,424,513 | | | | (101,951,521) |
| Net increase (decrease) in net assets resulting from operations | | 132,779,316 | | | | 52,834,342 |
| Distributions to shareholders from net investment income | | (3,825,456) | | | | — |
| Share transactions -- net increase (decrease) | | (218,784,694) | | | | (107,215,077) |
| Redemption fees | | 52,561 | | | | 148,216 |
| Total increase (decrease) in net assets | | (89,778,273) | | | | (54,232,519) |
| |
| Net Assets | | | | | | |
| Beginning of period | | 979,625,311 | | | | 1,033,857,830 |
| End of period (including accumulated net investment loss of $658 and accumulated net investment loss of $843, | | | | | | |
| respectively) | | $ 889,847,038 | | $ | | 979,625,311 |
| Financial Highlights — Class A | | | | | | | | | | |
| Years ended July 31, | | 2005 | | 2004 | | 2003 | | 2002 | | 2001 |
| Selected Per-Share Data | | | | | | | | | | |
| Net asset value, beginning of period | | $ 13.98 | | $ 13.36 | | $ 10.03 | | $ 17.76 | | $ 36.23 |
| Income from Investment Operations | | | | | | | | | | |
| Net investment income (loss)C | | 02D | | (.17) | | (.11) | | (.15) | | (.17) |
| Net realized and unrealized gain (loss) | | 2.24 | | .79 | | 3.44 | | (7.58) | | (16.67) |
| Total from investment operations | | 2.26 | | .62 | | 3.33 | | (7.73) | | (16.84) |
| Distributions from net investment income | | (.08) | | — | | — | | — | | — |
| Distributions from net realized gain | | — | | — | | — | | — | | (1.63) |
| Total distributions | | (.08) | | — | | — | | — | | (1.63) |
| Redemption fees added to paid in capitalC | | —F | | —F | | —F | | —F | | —F |
| Net asset value, end of period | | $ 16.16 | | $ 13.98 | | $ 13.36 | | $ 10.03 | | $ 17.76 |
| Total ReturnA,B | | 16.20% | | 4.64% | | 33.20% | | (43.52)% | | (48.83)% |
| Ratios to Average Net AssetsE | | | | | | | | | | |
| Expenses before expense reductions | | 1.37% | | 1.44% | | 1.70% | | 1.53% | | 1.23% |
| Expenses net of voluntary waivers, if any | | 1.37% | | 1.44% | | 1.59% | | 1.51% | | 1.23% |
| Expenses net of all reductions | | 1.26% | | 1.35% | | 1.38% | | 1.43% | | 1.21% |
| Net investment income (loss) | | 12%D | | (1.10)% | | (1.03)% | | (1.07)% | | (.68)% |
| Supplemental Data | | | | | | | | | | |
| Net assets, end of period (000 omitted) | | $ 144,970 | | $ 123,389 | | $ 123,604 | | $ 101,649 | | $ 211,429 |
| Portfolio turnover rate | | 180% | | 105% | | 140% | | 164% | | 181% |
| | A Total returns would have been lower had certain expenses not been reduced during the periods shown.
B Total returns do not include the effect of the sales charges.
C Calculated based on average shares outstanding during the period.
D Investment income per share reflects a special dividend which amounted to $.14 per share. Excluding the special dividend, the ratio of net investment income to average net assets would have been (.87)%.
E Expense ratios reflect operating expenses of the class. Expenses before reductions do not reflect amounts reimbursed by the investment adviser or reductions from brokerage service arrangements or other expense offset arrangements and do
not represent the amount paid by the class during periods when reimbursements or reductions occur. Expenses net of any voluntary waivers reflect expenses after reimbursement by the investment adviser but prior to reductions from broker
age service arrangements or other expense offset arrangements. Expenses net of all reductions represent the net expenses paid by the class.
F Amount represents less than $.01 per share.
|
| | See accompanying notes which are an integral part of the financial statements.
|
| Financial Highlights — Class T | | | | | | | | | | |
| Years ended July 31, | | 2005 | | 2004 | | 2003 | | 2002 | | 2001 |
| Selected Per-Share Data | | | | | | | | | | |
| Net asset value, beginning of period | | $ 13.76 | | $ 13.17 | | $ 9.91 | | $ 17.59 | | $ 35.95 |
| Income from Investment Operations | | | | | | | | | | |
| Net investment income (loss)C | | (.02)D | | (.19) | | (.14) | | (.18) | | (.22) |
| Net realized and unrealized gain (loss) | | 2.21 | | .78 | | 3.40 | | (7.50) | | (16.55) |
| Total from investment operations | | 2.19 | | .59 | | 3.26 | | (7.68) | | (16.77) |
| Distributions from net investment income | | (.07) | | — | | — | | — | | — |
| Distributions from net realized gain | | — | | — | | — | | — | | (1.59) |
| Total distributions | | (.07) | | — | | — | | — | | (1.59) |
| Redemption fees added to paid in capitalC | | —F | | —F | | —F | | —F | | —F |
| Net asset value, end of period | | $ 15.88 | | $ 13.76 | | $ 13.17 | | $ 9.91 | | $ 17.59 |
| Total ReturnA,B | | 15.94% | | 4.48% | | 32.90% | | (43.66) % | | (48.96)% |
| Ratios to Average Net AssetsE | | | | | | | | | | |
| Expenses before expense reductions | | 1.60% | | 1.62% | | 1.85% | | 1.70% | | 1.43% |
| Expenses net of voluntary waivers, if any | | 1.60% | | 1.62% | | 1.83% | | 1.70% | | 1.43% |
| Expenses net of all reductions | | 1.48% | | 1.53% | | 1.63% | | 1.62% | | 1.41% |
| Net investment income (loss) | | (.11)%D | | (1.28)% | | (1.28)% | | (1.26)% | | (.88)% |
| Supplemental Data | | | | | | | | | | |
| Net assets, end of period (000 omitted) | | $ 315,930 | | $ 363,399 | | $ 367,257 | | $ 302,657 | | $ 645,015 |
| Portfolio turnover rate | | 180% | | 105% | | 140% | | 164% | | 181% |
A Total returns would have been lower had certain expenses not been reduced during the periods shown.
B Total returns do not include the effect of the sales charges.
C Calculated based on average shares outstanding during the period.
D Investment income per share reflects a special dividend which amounted to $.14 per share. Excluding the special dividend, the ratio of net investment income to average net assets would have been (1.10)% .
E Expense ratios reflect operating expenses of the class. Expenses before reductions do not reflect amounts reimbursed by the investment adviser or reductions from brokerage service arrangements or other expense offset arrangements and do
not represent the amount paid by the class during periods when reimbursements or reductions occur. Expenses net of any voluntary waivers reflect expenses after reimbursement by the investment adviser but prior to reductions from broker
age service arrangements or other expense offset arrangements. Expenses net of all reductions represent the net expenses paid by the class.
F Amount represents less than $.01 per share.
|
| Financial Highlights — Class B | | | | | | | | | | |
| Years ended July 31, | | 2005 | | 2004 | | 2003 | | 2002 | | 2001 |
| Selected Per-Share Data | | | | | | | | | | |
| Net asset value, beginning of period | | $ 13.25 | | $ 12.76 | | $ 9.64 | | $ 17.21 | | $ 35.33 |
| Income from Investment Operations | | | | | | | | | | |
| Net investment income (loss)C | | (.09)D | | (.27) | | (.17) | | (.25) | | (.35) |
| Net realized and unrealized gain (loss) | | 2.12 | | .76 | | 3.29 | | (7.32) | | (16.27) |
| Total from investment operations | | 2.03 | | .49 | | 3.12 | | (7.57) | | (16.62) |
| Distributions from net investment income | | (.04) | | — | | — | | — | | — |
| Distributions from net realized gain | | — | | — | | — | | — | | (1.50) |
| Total distributions | | (.04) | | — | | — | | — | | (1.50) |
| Redemption fees added to paid in capitalC | | —F | | —F | | —F | | —F | | —F |
| Net asset value, end of period | | $ 15.24 | | $ 13.25 | | $ 12.76 | | $ 9.64 | | $ 17.21 |
| Total ReturnA,B | | 15.33% | | 3.84% | | 32.37% | | (43.99)% | | (49.28)% |
| Ratios to Average Net AssetsE | | | | | | | | | | |
| Expenses before expense reductions | | 2.13% | | 2.21% | | 2.38% | | 2.28% | | 1.98% |
| Expenses net of voluntary waivers, if any | | 2.13% | | 2.21% | | 2.25% | | 2.25% | | 1.98% |
| Expenses net of all reductions | | 2.02% | | 2.12% | | 2.05% | | 2.18% | | 1.96% |
| Net investment income (loss) | | (.65)%D | | (1.87)% | | (1.69)% | | (1.81)% | | (1.43)% |
| Supplemental Data | | | | | | | | | | |
| Net assets, end of period (000 omitted) | | $ 309,020 | | $ 355,927 | | $ 391,832 | | $ 337,976 | | $ 729,518 |
| Portfolio turnover rate | | 180% | | 105% | | 140% | | 164% | | 181% |
A Total returns would have been lower had certain expenses not been reduced during the periods shown.
B Total returns do not include the effect of the contingent deferred sales charge.
C Calculated based on average shares outstanding during the period.
D Investment income per share reflects a special dividend which amounted to $.14 per share. Excluding the special dividend, the ratio of net investment income to average net assets would have been (1.64)% .
E Expense ratios reflect operating expenses of the class. Expenses before reductions do not reflect amounts reimbursed by the investment adviser or reductions from brokerage service arrangements or other expense offset arrangements and do
not represent the amount paid by the class during periods when reimbursements or reductions occur. Expenses net of any voluntary waivers reflect expenses after reimbursement by the investment adviser but prior to reductions from broker
age service arrangements or other expense offset arrangements. Expenses net of all reductions represent the net expenses paid by the class.
F Amount represents less than $.01 per share.
|
See accompanying notes which are an integral part of the financial statements.
Technology A-134
|
| Financial Highlights — Class C | | | | | | | | | | |
| Years ended July 31, | | 2005 | | 2004 | | 2003 | | 2002 | | 2001 |
| Selected Per-Share Data | | | | | | | | | | |
| Net asset value, beginning of period | | $ 13.31 | | $ 12.80 | | $ 9.67 | | $ 17.25 | | $ 35.39 |
| Income from Investment Operations | | | | | | | | | | |
| Net investment income (loss)C | | (.08)D | | (.26) | | (.17) | | (.24) | | (.33) |
| Net realized and unrealized gain (loss) | | 2.12 | | .77 | | 3.30 | | (7.34) | | (16.30) |
| Total from investment operations | | 2.04 | | .51 | | 3.13 | | (7.58) | | (16.63) |
| Distributions from net investment income | | (.04) | | — | | — | | — | | — |
| Distributions from net realized gain | | — | | — | | — | | — | | (1.51) |
| Total distributions | | (.04) | | — | | — | | — | | (1.51) |
| Redemption fees added to paid in capitalC�� | | —F | | —F | | —F | | —F | | —F |
| Net asset value, end of period | | $ 15.31 | | $ 13.31 | | $ 12.80 | | $ 9.67 | | $ 17.25 |
| Total ReturnA,B | | 15.34% | | 3.98% | | 32.37% | | (43.94)% | | (49.24)% |
| Ratios to Average Net AssetsE | | | | | | | | | | |
| Expenses before expense reductions | | 2.10% | | 2.13% | | 2.28% | | 2.18% | | 1.94% |
| Expenses net of voluntary waivers, if any | | 2.10% | | 2.13% | | 2.25% | | 2.18% | | 1.94% |
| Expenses net of all reductions | | 1.99% | | 2.04% | | 2.05% | | 2.11% | | 1.91% |
| Net investment income (loss) | | (.61)%D | | (1.79)% | | (1.69)% | | (1.74)% | | (1.38)% |
| Supplemental Data | | | | | | | | | | |
| Net assets, end of period (000 omitted) | | $ 108,287 | | $ 125,926 | | $ 139,654 | | $ 123,034 | | $ 269,563 |
| Portfolio turnover rate | | 180% | | 105% | | 140% | | 164% | | 181% |
A Total returns would have been lower had certain expenses not been reduced during the periods shown.
B Total returns do not include the effect of the contingent deferred sales charge.
C Calculated based on average shares outstanding during the period.
D Investment income per share reflects a special dividend which amounted to $.14 per share. Excluding the special dividend, the ratio of net investment income to average net assets would have been (1.60)% .
E Expense ratios reflect operating expenses of the class. Expenses before reductions do not reflect amounts reimbursed by the investment adviser or reductions from brokerage service arrangements or other expense offset arrangements and do
not represent the amount paid by the class during periods when reimbursements or reductions occur. Expenses net of any voluntary waivers reflect expenses after reimbursement by the investment adviser but prior to reductions from broker
age service arrangements or other expense offset arrangements. Expenses net of all reductions represent the net expenses paid by the class.
F Amount represents less than $.01 per share.
|
| Financial Highlights — Institutional Class | | | | | | | | | | |
| Years ended July 31, | | 2005 | | 2004 | | 2003 | | 2002 | | 2001 |
| Selected Per-Share Data | | | | | | | | | | |
| Net asset value, beginning of period | | $ 14.32 | | $ 13.61 | | $ 10.15 | | $ 17.90 | | $ 36.43 |
| Income from Investment Operations | | | | | | | | | | |
| Net investment income (loss)B | | 09C | | (.09) | | (.05) | | (.08) | | (.08) |
| Net realized and unrealized gain (loss) | | 2.30 | | .80 | | 3.51 | | (7.67) | | (16.78) |
| Total from investment operations | | 2.39 | | .71 | | 3.46 | | (7.75) | | (16.86) |
| Distributions from net investment income | | (.11) | | — | | — | | — | | — |
| Distributions from net realized gain | | — | | — | | — | | — | | (1.67) |
| Total distributions | | (.11) | | — | | — | | — | | (1.67) |
| Redemption fees added to paid in capitalB | | —E | | —E | | —E | | —E | | —E |
| Net asset value, end of period | | $ 16.60 | | $ 14.32 | | $ 13.61 | | $ 10.15 | | $ 17.90 |
| Total ReturnA | | 16.73% | | 5.22% | | 34.09% | | (43.30)% | | (48.67)% |
| Ratios to Average Net AssetsD | | | | | | | | | | |
| Expenses before expense reductions | | 92% | | .93% | | .99% | | 1.00% | | .86% |
| Expenses net of voluntary waivers, if any | | 92% | | .93% | | .99% | | 1.00% | | .86% |
| Expenses net of all reductions | | 81% | | .84% | | .79% | | .92% | | .84% |
| Net investment income (loss) | | 57%C | | (.59)% | | (.43)% | | (.56)% | | (.31)% |
| Supplemental Data | | | | | | | | | | |
| Net assets, end of period (000 omitted) | | $ 11,640 | | $ 10,984 | | $ 11,511 | | $ 10,495 | | $ 24,084 |
| Portfolio turnover rate | | 180% | | 105% | | 140% | | 164% | | 181% |
A Total returns would have been lower had certain expenses not been reduced during the periods shown.
B Calculated based on average shares outstanding during the period.
C Investment income per share reflects a special dividend which amounted to $.14 per share. Excluding the special dividend, the ratio of net investment income to average net assets would have been (.42)%.
D Expense ratios reflect operating expenses of the class. Expenses before reductions do not reflect amounts reimbursed by the investment adviser or reductions from brokerage service arrangements or other expense offset arrangements and do
not represent the amount paid by the class during periods when reimbursements or reductions occur. Expenses net of any voluntary waivers reflect expenses after reimbursement by the investment adviser but prior to reductions from broker
age service arrangements or other expense offset arrangements. Expenses net of all reductions represent the net expenses paid by the class.
E Amount represents less than $.01 per share.
|
See accompanying notes which are an integral part of the financial statements.
|
Notes to Financial Statements
For the period ended July 31, 2005
|
1. Significant Accounting Policies.
|
Fidelity Advisor Technology Fund (the fund) is a non-diversified fund of Fidelity Advisor Series VII (the trust) and is authorized to issue an unlimited number of shares. The trust is registered under the Investment Company Act of 1940, as amended (the 1940 Act), as an open-end management investment company organized as a Massachusetts business trust.
The fund offers Class A, Class T, Class B, Class C and Institutional Class shares, each of which has equal rights as to assets and voting privileges. Each class has exclusive voting rights with respect to matters that affect that class. Class B shares will automatically convert to Class A shares after a holding period of seven years from the initial date of purchase. Investment income, realized and unrealized capital gains and losses, the common expenses of the fund, and certain fund-level expense reductions, if any, are allocated on a pro rata basis to each class based on the relative net assets of each class to the total net assets of the fund. Each class differs with respect to transfer agent and distribution and service plan fees incurred. Certain expense reductions also differ by class.
The financial statements have been prepared in conformity with accounting principles generally accepted in the United States of America, which require management to make certain estimates and assumptions at the date of the financial statements. The following summarizes the significant accounting policies of the fund:
Security Valuation. Net asset value per share (NAV calculation) is calculated as of the close of business of the New York Stock Exchange, normally 4:00 p.m. Eastern time. Equity securities, including restricted securities, for which market quotations are available are valued at the last sale price or official closing price (closing bid price or last evaluated quote if no sale has occurred) on the primary market or exchange on which they trade. If prices are not readily available or do not accurately reflect fair value for a security, or if a security’s value has been materially affected by events occurring after the close of the exchange or market on which the security is principally traded, that security may be valued by another method that the Board of Trustees believes accurately reflects fair value. A security’s valuation may differ depending on the method used for determining value. Price movements in futures contracts and ADRs, market and trading trends, the bid/ask quotes of brokers and off-exchange institutional trading may be reviewed in the course of making a good faith determination of a security’s fair value. Short-term securities with remaining maturities of sixty days or less for which quotations are not readily available are valued on the basis of amortized cost. Investments in open-end investment companies are valued at their net asset value each business day.
Foreign Currency. The fund uses foreign currency contracts to facilitate transactions in foreign-denominated securities. Losses from these transactions may arise from changes in the value of the foreign currency or if the counterparties do not perform under the contracts’ terms.
Foreign-denominated assets, including investment securities, and liabilities are translated into U.S. dollars at the exchange rate at period end. Purchases and sales of investment securities, income and dividends received and expenses denominated in foreign currencies are translated into U.S. dollars at the exchange rate in effect on the transaction date.
The effects of exchange rate fluctuations on investments are included with the net realized and unrealized gain (loss) on investment securities. Other foreign currency transactions resulting in realized and unrealized gain (loss) are disclosed separately.
Investment Transactions and Income. Security transactions are accounted for as of trade date. Gains and losses on securities sold are determined on the basis of identified cost and may include proceeds received from litigation. Dividend income is recorded on the ex-dividend date, except for certain dividends from foreign securities where the ex-dividend date may have passed, which are recorded as soon as the fund is informed of the ex-dividend date. Non-cash dividends included in dividend income, if any, are recorded at the fair market value of the securities received. Distributions received on securities that represent a return of capital or capital gain are recorded as a reduction of cost of investments and/or as a realized gain. The fund estimates the components of distributions received that may be considered return of capital distributions or capital gain distributions. Large, non-recurring dividends recognized by the fund are presented separately on the Statement of Operations as “Special Dividends” and the impact of these dividends is presented in the Financial Highlights. Interest income is accrued as earned. Interest income includes coupon interest and amortization of premium and accretion of discount on debt securities. Investment income is recorded net of foreign taxes withheld where recovery of such taxes is uncertain.
Expenses. Most expenses of the trust can be directly attributed to a fund. Expenses which cannot be directly attributed are apportioned among each fund in the trust.
Income Tax Information and Distributions to Shareholders. Each year, the fund intends to qualify as a regulated investment company by distributing all of its taxable income and realized gains under Subchapter M of the Internal Revenue Code. As a result, no provision for income taxes is required in the accompanying financial statements. Foreign taxes are provided for based on the fund’s understanding of the tax rules and rates that exist in the foreign markets in which it invests.
1. Significant Accounting Policies - continued
Income Tax Information and Distributions to Shareholders - continued
|
Distributions are recorded on the ex-dividend date. Income dividends and capital gain distributions are declared separately for each class. Income and capital gain distributions are determined in accordance with income tax regulations, which may differ from generally accepted accounting principles. Capital accounts within the financial statements are adjusted for permanent book-tax differences. These adjustments have no impact on net assets or the results of operations. Temporary book-tax differences will reverse in a subsequent period.
Book-tax differences are primarily due to foreign currency transactions, net operating losses, capital loss carryforwards, and losses deferred due to wash sales and excise tax regulations.
The tax-basis components of distributable earnings and the federal tax cost as of period end were as follows:
| Unrealized appreciation | | $ | | 87,313,991 | | |
| Unrealized depreciation | | | | (32,858,593) | | |
| Net unrealized appreciation (depreciation) | | | | 54,455,398 | | |
| Capital loss carryforward | | | | (1,678,030,880) | | |
| |
| Cost for federal income tax purposes | | $ | | 857,371,735 | | |
| |
| The tax character of distributions paid was as follows: | | | | | | |
| | | | | July 31, 2005 | | July 31, 2004 |
| Ordinary Income | | $ | | 3,825,456 | | $ |
Short-Term Trading (Redemption) Fees. Shares held in the fund less than 60 days are subject to a redemption fee equal to 1.00% of the proceeds of the redeemed shares. All redemption fees, including any estimated redemption fees paid by Fidelity Management & Research Company (FMR), are retained by the fund and accounted for as an addition to paid in capital.
Repurchase Agreements. FMR has received an Exemptive Order from the Securities and Exchange Commission (the SEC) which permits the fund and other affiliated entities of FMR to transfer uninvested cash balances into joint trading accounts which are then invested in repurchase agreements. The fund may also invest directly with institutions in repurchase agreements. Repurchase agreements are collateralized by government or non-government securities. Collateral is held in segregated accounts with custodian banks and may be obtained in the event of a default of the counterparty. The fund monitors, on a daily basis, the value of the collateral to ensure it is at least equal to the principal amount of the repurchase agreement (including accrued interest). In the event of a default by the counterparty, realization of the collateral proceeds could be delayed, during which time the value of the collateral may decline.
Restricted Securities. The fund may invest in securities that are subject to legal or contractual restrictions on resale. These securities generally may be resold in transactions exempt from registration or to the public if the securities are registered. Disposal of these securities may involve time-consuming negotiations and expense, and prompt sale at an acceptable price may be difficult. Information regarding restricted securities is included at the end of the fund’s Schedule of Investments.
3. Purchases and Sales of Investments.
Purchases and sales of securities, other than short-term securities and U.S. government securities, aggregated $1,627,200,740 and $1,844,231,997, respectively.
4. Fees and Other Transactions with Affiliates.
Management Fee. FMR and its affiliates provide the fund with investment management related services for which the fund pays a monthly management fee. The management fee is the sum of an individual fund fee rate that is based on an annual rate of .30% of the fund’s average net assets and a group fee rate that averaged .27% during the period. The group fee rate is based upon the average net assets of all the mutual funds advised by FMR. The group fee rate decreases as assets under management increase and increases as assets under management decrease. For the period, the total annual management fee rate was .57% of the fund’s average net assets.
Notes to Financial Statements - continued
4. Fees and Other Transactions with Affiliates - continued
|
Distribution and Service Plan. In accordance with Rule 12b-1 of the 1940 Act, the fund has adopted separate Distribution and Service Plans for each class of shares. Certain classes pay Fidelity Distributors Corporation (FDC), an affiliate of FMR, separate Distribution and Service Fees, each of which is based on an annual percentage of each class’ average net assets. In addition, FDC may pay financial intermediaries for selling shares of the fund and providing shareholder support services. For the period, the Distribution and Service Fee rates and the total amounts paid to and retained by FDC were as follows:
| | | Distribution | | Service | | | | Paid to | | | | Retained |
| | | Fee | | Fee | | | | FDC | | | | by FDC |
| Class A | | 0% | | .25% | | $ | | 319,926 | | $ | | 1,190 |
| Class T | | 25% | | .25% | | | | 1,676,053 | | | | 6,551 |
| Class B | | 75% | | .25% | | | | 3,272,936 | | | | 2,456,923 |
| Class C | | 75% | | .25% | | | | 1,151,872 | | | | 72,187 |
| |
| | | | | | | $ | | 6,420,787 | | $ | | 2,536,851 |
Sales Load. FDC receives a front-end sales charge of up to 5.75% for selling Class A shares, and 3.50% for selling Class T shares, some of which is paid to financial intermediaries for selling shares of the fund. FDC receives the proceeds of contingent deferred sales charges levied on Class A, Class T, Class B, and Class C redemptions. These charges depend on the holding period. The deferred sales charges range from 5% to 1% for Class B, 1% for Class C, and .25% for certain purchases of Class A and Class T shares.
For the period, sales charge amounts retained by FDC were as follows:
| | | | | Retained |
| | | | | by FDC |
| Class A | | $ | | 29,738 |
| Class T | | | | 38,715 |
| Class B* | | | | 862,387 |
| Class C* | | | | 11,549 |
| | | $ | | 942,389 |
| |
| * When Class B and Class C shares are initially sold, FDC pays commissions from its own resources to financial intermediaries through which the sales are made. | | | | |
Transfer Agent Fees. Fidelity Investments Institutional Operations Company, Inc. (FIIOC), an affiliate of FMR, is the transfer, dividend disbursing and shareholder servicing agent for each class of the fund. FIIOC receives account fees and asset-based fees that vary according to the account size and type of account of the shareholders of the respective classes of the fund. FIIOC pays for typesetting, printing and mailing of shareholder reports, except proxy statements. For the period the total transfer agent fees paid by each class to FIIOC, were as follows:
| | | | | | | % of |
| | | | | | | Average |
| | | | | Amount | | Net Assets |
| Class A | | $ | | 623,348 | | .49 |
| Class T | | | | 1,548,292 | | .46 |
| Class B | | | | 1,634,038 | | .50 |
| Class C | | | | 534,657 | | .46 |
| Institutional Class | | | | 31,911 | | .29 |
| |
| | | $ | | 4,372,246 | | |
Accounting and Security Lending Fees. Fidelity Service Company, Inc. (FSC), an affiliate of FMR, maintains the fund’s accounting records. The accounting fee is based on the level of average net assets for the month. Under a separate contract, FSC administers the security lending program. The security lending fee is based on the number and duration of lending transactions.
Central Funds. The fund may invest in affiliated Central Funds managed by Fidelity Investments Money Management, Inc. (FIMM), an affiliate of FMR. The Central Funds are open-end investment companies available only to investment companies and other accounts managed by FMR and its affiliates. The Money Market Central Funds seek preservation of capital and current income. The Central Funds do not pay a management fee. Income distributions earned by the fund are recorded as income in the accompanying financial statements and totaled $581,032 for the period.
Brokerage Commissions. The fund placed a portion of its portfolio transactions with brokerage firms which are affiliates of the investment adviser. The commissions paid to these affiliated firms were $165,174 for the period.
5. Committed Line of Credit.
|
The fund participates with other funds managed by FMR in a $4.2 billion credit facility (the “line of credit”) to be utilized for temporary or emergency purposes to fund shareholder redemptions or for other short-term liquidity purposes. The fund has agreed to pay commitment fees on its pro rata portion of the line of credit. During the period, there were no borrowings on this line of credit.
The fund lends portfolio securities from time to time in order to earn additional income. The fund receives collateral (in the form of U.S. Treasury obligations, letters of credit and/or cash) against the loaned securities and maintains collateral in an amount not less than 100% of the market value of the loaned securities during the period of the loan. The market value of the loaned securities is determined at the close of business of the fund and any additional required collateral is delivered to the fund on the next business day. If the borrower defaults on its obligation to return the securities loaned because of insolvency or other reasons, a fund could experience delays and costs in recovering the securities loaned or in gaining access to the collateral. Cash collateral is invested in the Fidelity Securities Lending Cash Central Fund. The value of loaned securities and cash collateral at period end are disclosed on the fund’s Statement of Assets and Liabilities.
Many of the brokers with whom FMR places trades on behalf of the fund provided services to the fund in addition to trade execution. These services included payments of certain expenses on behalf of the fund totaling $1,024,495 for the period. In addition, through arrangements with the fund’s custodian, credits realized as a result of uninvested cash balances were used to reduce the fund’s expenses. During the period, these credits reduced the fund’s custody expenses by $288.
The fund’s organizational documents provide former and current trustees and officers with a limited indemnification against liabilities arising in connection with the performance of their duties to the fund. In the normal course of business, the fund may also enter into contracts that provide general indemnifications. The fund’s maximum exposure under these arrangements is unknown as this would be dependent on future claims that may be made against the fund. The risk of material loss from such claims is considered remote.
9. Distributions to Shareholders.
|
Distributions to shareholders of each class were as follows:
| Years ended July 31, | | 2005 | | | | 2004 | | |
| From net investment income | | | | | | | | |
| Class A | | $ 693,969 | | $ | | | | — |
| Class T | | 1,715,027 | | | | | | — |
| Class B | | 986,706 | | | | | | — |
| Class C | | 351,015 | | | | | | — |
| Institutional Class | | 78,739 | | | | | | — |
| Total | | $ 3,825,456 | | $ | | | | — |
Notes to Financial Statements - continued
10. Share Transactions.
Transactions for each class of shares were as follows:
|
| | | | | Shares | | | | | | Dollars |
| Years ended July 31, | | 2005 | | | | 2004 | | 2005 | | | | 2004 |
| Class A | | | | | | | | | | | | |
| Shares sold | | 2,937,144 | | | | 1,949,432 | | $ 43,834,461 | | $ | | 30,174,313 |
| Reinvestment of distributions | | 41,796 | | | | — | | 642,405 | | | | — |
| Shares redeemed | | (2,834,081) | | | | (2,376,787) | | (41,983,001) | | | | (36,367,643) |
| Net increase (decrease) | | 144,859 | | | | (427,355) | | $ 2,493,865 | | $ | | (6,193,330) |
| Class T | | | | | | | | | | | | |
| Shares sold | | 3,595,175 | | | | 6,284,281 | | $ 51,527,367 | | $ | | 95,617,905 |
| Reinvestment of distributions | | 108,716 | | | | — | | 1,643,786 | | | | — |
| Shares redeemed | | (10,218,806) | | | | (7,757,438) | | (148,664,787) | | | | (117,704,082) |
| Net increase (decrease) | | (6,514,915) | | | | (1,473,157) | | $ (95,493,634) | | $ | | (22,086,177) |
| Class B | | | | | | | | | | | | |
| Shares sold | | 690,525 | | | | 1,611,188 | | $ 9,551,506 | | $ | | 23,596,499 |
| Reinvestment of distributions | | 61,748 | | | | — | | 899,051 | | | | — |
| Shares redeemed | | (7,334,481) | | | | (5,460,468) | | (101,949,576) | | | | (80,101,949) |
| Net increase (decrease) | | (6,582,208) | | | | (3,849,280) | | $ (91,499,019) | | $ | | (56,505,450) |
| Class C | | | | | | | | | | | | |
| Shares sold | | 609,017 | | | | 1,207,664 | | $ 8,508,174 | | $ | | 17,854,754 |
| Reinvestment of distributions | | 20,786 | | | | — | | 304,101 | | | | -- |
| Shares redeemed | | (3,019,680) | | | | (2,652,498) | | (42,215,602) | | | | (39,082,309) |
| Net increase (decrease) | | (2,389,877) | | | | (1,444,834) | | $ (33,403,327) | | $ | | (21,227,555) |
| Institutional Class | | | | | | | | | | | | |
| Shares sold | | 203,821 | | | | 171,199 | | $ 3,156,844 | | $ | | 2,734,772 |
| Reinvestment of distributions | | 3,961 | | | | — | | 62,341 | | | | — |
| Shares redeemed | | (273,671) | | | | (249,741) | | (4,101,764) | | | | (3,937,337) |
| Net increase (decrease) | | (65,889) | | | | (78,542) | | $ (882,579) | | $ | | (1,202,565) |
Advisor Telecommunications & Utilities Growth Fund — Institutional Class
Average annual total return reflects the change in the value of an investment, assuming reinvestment of the class’ dividend income and capital gains (the profits earned upon the sale of securities that have grown in value) and assuming a constant rate of performance each year. The $10,000 table and the fund’s returns do not reflect the deduction of taxes that a shareholder would pay on fund distributions or the redemption of fund shares. During periods of reimbursement by Fidelity, a fund’s total return will be greater than it would be had the reimbursement not occurred. How a fund did yesterday is no guarantee of how it will do tomorrow.
| Average Annual Total Returns | | | | |
| Periods ended July 31, 2005 | | Past 1 | | Past 5�� | | Life of |
| | | year | | years | | fundA |
| Institutional Class | | 27.88% | | --4.58% | | 9.03% |
| |
| A From September 3, 1996. | | | | | | |
| | $10,000 Over Life of Fund
|
Let’s say hypothetically that $10,000 was invested in Fidelity Advisor Telecommunications & Utilities Growth Fund — Institutional Class on September 3, 1996, when the fund started. The chart shows how the value of your investment would have changed, and also shows how the S&P 500 Index performed over the same period.
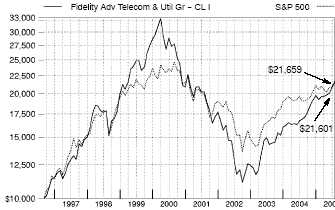
Advisor Telecommunications & Utilities Growth Fund — Institutional Class
Management’s Discussion of Fund Performance
Comments from Brian Younger, Portfolio Manager of Fidelity® Advisor Telecommunications & Utilities Growth Fund
A late-inning rally on Wall Street helped push some key U.S. equity indexes to four-year highs by the conclusion of the 12-month period ending July 31, 2005. Spurred on by bullish economic data and strong corporate earnings, investors enjoyed a stellar month of July, capping off a turbulent 12-month period for U.S. equity markets. Stock prices bounced up and down during most of the year, moving in cadence with gyrations in the price of crude oil and investors’ gathering and ebbing concerns about inflation. The Federal Reserve Board raised short-term interest rates eight times during the period, also affecting overall market sentiment. Despite their fluctuations, the major equity indexes finished on a high note, with the Standard & Poor’s 500SM Index and the NASDAQ Composite® Index posting gains of 14.05% and 16.51%, respectively, for the period. The small-cap Russell 2000® Index rose 24.78% and the Russell Midcap® Index jumped 28.93%, while the blue-chips’ Dow Jones Industrial AverageSM advanced only 7.29% .
For the 12 months that ended July 31, 2005, the fund’s Institutional Class shares returned 27.88% . This return was roughly in line with the Goldman Sachs® Utilities Index, which gained 27.74%, but beat the S&P 500®. Electric utilities and wireless telecommunications stocks were top gainers. Electric utilities benefited from lower-than-expected interest rates and rising energy prices, while wireless stocks climbed amid strong subscriber, revenue and earnings growth. The biggest boost versus the Goldman Sachs index came from sizable stakes in TXU, a regulated utility in Texas; Nextel Communications and NII Holdings, wireless service providers in the United States and Latin America, respectively; and American Tower, a leading wireless tower company, all of which rose sharply in value. Overweightings on the wireline side of telecom hampered returns, as concerns about recent industry consolidation pressured performance. Among the detractors were Verizon Communications and Qwest Communications International, regional Bell operating companies (RBOCs) that suffered during the bidding war over MCI. The fund lost additional ground from having little exposure to Sirius Satellite Radio, an index component that posted steep gains. It instead owned EchoStar Communications, a satellite television stock that turned in disappointing returns as cable competition increased.
The views expressed in this statement reflect those of the portfolio manager only through the end of the period of the report as stated on the cover and do not necessarily represent the views of Fidelity or any other person in the Fidelity organization. Any such views are subject to change at any time based upon market or other conditions and Fidelity disclaims any responsibility to update such views. These views may not be relied on as investment advice and, because investment decisions for a Fidelity fund are based on numerous factors, may not be relied on as an indication of trading intent on behalf of any Fidelity fund.
Telecommunications & Utilities Growth
Advisor Telecommunications & Utilities Growth Fund
Shareholder Expense Example
|
As a shareholder of the Fund, you incur two types of costs: (1) transaction costs, including sales charges (loads) on purchase payments or redemption proceeds, redemption fees, and (2) ongoing costs, including management fees, distribution and/or service (12b-1) fees and other Fund expenses. This Example is intended to help you understand your ongoing costs (in dollars) of investing in the Fund and to compare these costs with the ongoing costs of investing in other mutual funds.
The Example is based on an investment of $1,000 invested at the beginning of the period and held for the entire period (February 1, 2005 to July 31, 2005).
The first line of the table below for each class of the Fund provides information about actual account values and actual expenses. You may use the information in this line, together with the amount you invested, to estimate the expenses that you paid over the period. Simply divide your account value by $1,000.00 (for example, an $8,600 account value divided by $1,000.00 = 8.6), then multiply the result by the number in the first line for a class of the Fund under the heading entitled “Expenses Paid During Period” to estimate the expenses you paid on your account during this period.
Hypothetical Example for Comparison Purposes
|
The second line of the table below for each class of the Fund provides information about hypothetical account values and hypothetical expenses based on a Class’ actual expense ratio and an assumed rate of return of 5% per year before expenses, which is not the Class’ actual return. The hypothetical account values and expenses may not be used to estimate the actual ending account balance or expenses you paid for the period. You may use this information to compare the ongoing costs of investing in the Fund and other funds. To do so, compare this 5% hypothetical example with the 5% hypothetical examples that appear in the shareholder reports of the other funds.
Please note that the expenses shown in the table are meant to highlight your ongoing costs only and do not reflect any transaction costs. Therefore, the second line of the table is useful in comparing ongoing costs only, and will not help you determine the relative total costs of owning different funds. In addition, if these transactional costs were included, your costs would have been higher.
| | | | | | | | | | | Expenses Paid |
| | | Beginning | | | | Ending | | | | During Period* |
| | | Account Value | | | | Account Value | | | | February 1, 2005 |
| | | February 1, 2005 | | | | July 31, 2005 | | | | to July 31, 2005 |
| Class A | | | | | | | | | | |
| Actual | | $ 1,000.00 | | $ | | 1,120.40 | | $ | | 7.20 |
| HypotheticalA | | $ 1,000.00 | | $ | | 1,018.00 | | $ | | 6.85 |
| Class T | | | | | | | | | | |
| Actual | | $ 1,000.00 | | $ | | 1,118.50 | | $ | | 8.56 |
| HypotheticalA | | $ 1,000.00 | | $ | | 1,016.71 | | $ | | 8.15 |
| Class B | | | | | | | | | | |
| Actual | | $ 1,000.00 | | $ | | 1,115.90 | | $ | | 11.12 |
| HypotheticalA | | $ 1,000.00 | | $ | | 1,014.28 | | $ | | 10.59 |
| Class C | | | | | | | | | | |
| Actual | | $ 1,000.00 | | $ | | 1,115.80 | | $ | | 10.81 |
| HypotheticalA | | $ 1,000.00 | | $ | | 1,014.58 | | $ | | 10.29 |
| Institutional Class | | | | | | | | | | |
| Actual | | $ 1,000.00 | | $ | | 1,122.40 | | $ | | 5.05 |
| HypotheticalA | | $ 1,000.00 | | $ | | 1,020.03 | | $ | | 4.81 |
| |
| A 5% return per year before expenses | | | | | | | | | | |
* Expenses are equal to each Class’ annualized expense ratio (shown in the table below); multiplied by the average account value over the period, multiplied by 181/365 (to reflect the one-half year period).
| | | Annualized |
| | | Expense Ratio |
| Class A | | 1.37% |
| Class T | | 1.63% |
| Class B | | 2.12% |
| Class C | | 2.06% |
| Institutional Class | | 96% |
Advisor Telecommunications & Utilities Growth Fund
Investment Changes
| Top Ten Stocks as of July 31, 2005 | | |
| | | % of fund’s | | % of fund’s net assets |
| | | net assets | | 6 months ago |
| SBC Communications, Inc. | | 9.6 | | 9.4 |
| Nextel Communications, Inc. | | | | |
| Class A | | 9.4 | | 7.8 |
| Verizon Communications, Inc. | | 9.4 | | 9.8 |
| BellSouth Corp. | | 9.3 | | 8.9 |
| Exelon Corp. | | 5.3 | | 5.0 |
| Citizens Communications Co. | | 4.1 | | 4.3 |
| Public Service Enterprise Group, | | | | |
| Inc. | | 3.7 | | 0.0 |
| Edison International | | 3.5 | | 0.0 |
| Entergy Corp. | | 3.2 | | 2.6 |
| AES Corp. | | 2.9 | | 1.4 |
| | | 60.4 | | |

| | * Includes short term investments and net other assets.
Prior period industry classifications reflect the categories in place as of the date
indicated and have not been adjusted to reflect current industry classifications.
|
Telecommunications & Utilities Growth
| | Advisor Telecommunications & Utilities Growth Fund
Investments July 31, 2005
Showing Percentage of Net Assets
|
| Common Stocks — 99.7% | | | | |
| | | Shares | | Value (Note 1) |
| |
| DIVERSIFIED TELECOMMUNICATION SERVICES – 36.8% | | |
| Integrated Telecommunication Services – 36.8% | | |
| ALLTEL Corp. | | 20,700 | | $ 1,376,551 |
| BellSouth Corp. | | 689,300 | | 19,024,680 |
| Citizens Communications Co. | | 645,300 | | 8,479,242 |
| FairPoint Communications, Inc. | | 125,300 | | 2,054,920 |
| Qwest Communications International, | | | | |
| Inc. (a) | | 1,422,000 | | 5,432,040 |
| SBC Communications, Inc. | | 801,600 | | 19,599,119 |
| Verizon Communications, Inc. | | 558,000 | | 19,100,340 |
| | | | | 75,066,892 |
| |
| ELECTRIC UTILITIES – 22.8% | | | | |
| Electric Utilities – 22.8% | | | | |
| Allegheny Energy, Inc. (a) | | 142,600 | | 4,064,100 |
| Cinergy Corp. | | 13,800 | | 609,270 |
| Edison International | | 173,900 | | 7,109,032 |
| El Paso Electric Co. (a) | | 23,300 | | 504,212 |
| Entergy Corp. | | 85,600 | | 6,671,664 |
| Exelon Corp. | | 202,700 | | 10,848,504 |
| FirstEnergy Corp. | | 97,200 | | 4,838,616 |
| FPL Group, Inc. | | 93,500 | | 4,031,720 |
| Northeast Utilities | | 18,900 | | 407,862 |
| PG&E Corp. | | 42,600 | | 1,603,038 |
| PPL Corp. | | 92,100 | | 5,671,518 |
| Westar Energy, Inc. | | 10,200 | | 248,166 |
| | | | | 46,607,702 |
| |
| GAS UTILITIES – 2.4% | | | | |
| Gas Utilities – 2.4% | | | | |
| ONEOK, Inc. | | 54,200 | | 1,894,290 |
| Questar Corp. | | 33,700 | | 2,365,066 |
| Southern Union Co. | | 7,900 | | 200,976 |
| UGI Corp. | | 12,400 | | 363,816 |
| | | | | 4,824,148 |
| |
| INDEPENDENT POWER PRODUCERS & ENERGY TRADERS – 6.4% |
| Independent Power & Energy Trade – 6.4% | | | | |
| AES Corp. (a) | | 365,200 | | 5,861,460 |
| NRG Energy, Inc. (a) | | 60,600 | | 2,324,010 |
| TXU Corp. | | 55,300 | | 4,791,192 |
| | | | | 12,976,662 |
| |
| MEDIA – 4.8% | | | | |
| Broadcasting & Cable TV – 4.8% | | | | |
| EchoStar Communications Corp. Class A | | 137,100 | | 3,937,512 |
| Sirius Satellite Radio, Inc. (a)(d) | | 303,000 | | 2,066,460 |
| XM Satellite Radio Holdings, Inc. | | | | |
| Class A (a) | | 108,000 | | 3,848,040 |
| | | | | 9,852,012 |
| | | | | Shares | | Value (Note 1) |
| |
| MULTI-UTILITIES – 7.6% | | | | | | |
| Multi-Utilities – 7.6% | | | | | | |
| Aquila, Inc. (a) | | | | 99,900 | | $ 371,628 |
| CMS Energy Corp. (a) | | | | 85,190 | | 1,349,410 |
| Dominion Resources, Inc. | | | | 69,800 | | 5,155,428 |
| Public Service Enterprise Group, Inc. | | 117,700 | | 7,568,110 |
| Sempra Energy | | | | 24,500 | | 1,041,250 |
| Wisconsin Energy Corp. | | | | 600 | | 24,090 |
| | | | | | | 15,509,916 |
| |
| OIL, GAS & CONSUMABLE FUELS – 0.9% | | | | |
| Oil & Gas Exploration & Production – 0.8% | | |
| Cheniere Energy, Inc. (a) | | | | 46,200 | | 1,570,338 |
| Oil & Gas Refining & Marketing – 0.1% | | | | |
| Western Gas Resources, Inc. | | | | 5,600 | | 224,224 |
| |
| TOTAL OIL, GAS & CONSUMABLE FUELS | | 1,794,562 |
| |
| WATER UTILITIES – 0.2% | | | | | | |
| Water Utilities – 0.2% | | | | | | |
| Aqua America, Inc. | | | | 13,765 | | 441,444 |
| WIRELESS TELECOMMUNICATION SERVICES – 17.8% | | |
| Wireless Telecommunication Services – 17.8% | | |
| Alamosa Holdings, Inc. (a) | | | | 66,500 | | 1,067,990 |
| American Tower Corp. Class A (a) | | | | 93,100 | | 2,139,438 |
| Crown Castle International Corp. (a) | | 41,300 | | 898,688 |
| Nextel Communications, Inc. Class A (a) | | 550,100 | | 19,143,480 |
| Nextel Partners, Inc. Class A (a) | | | | 198,900 | | 4,952,610 |
| NII Holdings, Inc. (a) | | | | 76,200 | | 5,672,328 |
| SpectraSite, Inc. (a) | | | | 5,600 | | 457,520 |
| Western Wireless Corp. Class A (a) | | 46,340 | | 2,070,008 |
| | | | | | | 36,402,062 |
| |
| TOTAL COMMON STOCKS | | | | | | |
| (Cost $176,698,130) | | | | | | 203,475,400 |
| |
| Money Market Funds — 0.8% | | | | |
| |
| |
| Fidelity Cash Central Fund, | | | | | | |
| 3.31% (b) | | | | 79,711 | | 79,711 |
| Fidelity Securities Lending Cash | | | | | | |
| Central Fund, 3.32% (b)(c) | | 1,529,750 | | 1,529,750 |
| TOTAL MONEY MARKET FUNDS | | | | |
| (Cost $1,609,461) | | | | | | 1,609,461 |
| |
| TOTAL INVESTMENT PORTFOLIO - 100.5% | | |
| (Cost $178,307,591) | | | | | | 205,084,861 |
| |
| NET OTHER ASSETS – (0.5)% | | | | | | (1,081,294) |
| NET ASSETS – 100% | | | | $ | | 204,003,567 |
See accompanying notes which are an integral part of the financial statements.
A-145 Annual Report
Advisor Telecommunications & Utilities Growth Fund Investments - continued
(a) Non-income producing
(b) Affiliated fund that is available only to investment companies and other
accounts managed by Fidelity Investments. The rate quoted is the
annualized seven-day yield of the fund at period end. A complete listing
of the fund’s holdings as of its most recent quarter end is available upon
request.
(c) Investment made with cash collateral received from securities on loan.
(d) Security or a portion of the security is on loan at period end.
|
At July 31, 2005, the fund had a capital loss carryforward of approximately $315,578,610 of which $20,422,782, $140,743,296 and $154,412,532 will expire on July 31, 2009, 2010 and 2011, respectively.
See accompanying notes which are an integral part of the financial statements.
Telecommunications & Utilities Growth A-146
|
| | Advisor Telecommunications & Utilities Growth Fund
Financial Statements
|
| Statement of Assets and Liabilities | | |
| | | | | | | July 31, 2005 |
| Assets | | | | | | |
| Investment in securities, at value (in- | | | | |
| cluding securities loaned of | | | | | | |
| $1,439,020) (cost $178,307,591) | | | | |
| — See accompanying schedule | | | | $ | | 205,084,861 |
| Receivable for investments sold | | | | | | 605,067 |
| Receivable for fund shares sold | | | | | | 94,530 |
| Dividends receivable | | | | | | 741,733 |
| Interest receivable | | | | | | 1,448 |
| Prepaid expenses | | | | | | 325 |
| Other affiliated receivables | | | | | | 109 |
| Other receivables | | | | | | 39,308 |
| Total assets | | | | | | 206,567,381 |
| Liabilities | | | | | | |
| Payable for investments purchased | | $ | | 170,519 | | |
| Payable for fund shares redeemed | | | | 529,538 | | |
| Accrued management fee | | | | 95,968 | | |
| Distribution fees payable | | | | 125,557 | | |
| Other affiliated payables | | | | 79,670 | | |
| Other payables and accrued expenses | | 32,812 | | |
| Collateral on securities loaned, at value | | 1,529,750 | | |
| Total liabilities | | | | | | 2,563,814 |
| Net Assets | | | | $ | | 204,003,567 |
| Net Assets consist of: | | | | | | |
| Paid in capital | | | | $ | | 495,447,767 |
| Undistributed net investment income | | | | 1,351,200 |
| Accumulated undistributed net realized | | | | |
| gain (loss) on investments and for- | | | | |
| eign currency transactions | | | | | | (319,572,670) |
| Net unrealized appreciation (depreci- | | | | |
| ation) on investments | | | | | | 26,777,270 |
| Net Assets | | | | $ | | 204,003,567 |
| Calculation of Maximum Offering Price | | | | |
| Class A: | | | | | | |
| Net Asset Value and redemption | | | | | | |
| price per share ($29,149,944 ÷ | | | | |
| 1,922,146 shares) | | | | $ | | 15.17 |
| Maximum offering price per share | | | | | | |
| (100/94.25 of $15.17) | | | | $ | | 16.10 |
| Class T: | | | | | | |
| Net Asset Value and redemption | | | | | | |
| price per share ($55,683,199 ÷ | | | | |
| 3,686,987 shares) | | | | $ | | 15.10 |
| Maximum offering price per share | | | | | | |
| (100/96.50 of $15.10) | | | | $ | | 15.65 |
| Class B: | | | | | | |
| Net Asset Value and offering price | | | | |
| per share ($82,577,183 ÷ | | | | | | |
| 5,569,246 shares)A | | | | $ | | 14.83 |
| Class C: | | | | | | |
| Net Asset Value and offering price | | | | |
| per share ($34,827,085 ÷ | | | | | | |
| 2,346,232 shares)A | | | | $ | | 14.84 |
| Institutional Class: | | | | | | |
| Net Asset Value, offering price and | | | | |
| redemption price per share | | | | | | |
| ($1,766,156 ÷ 115,336 shares) . | | $ | | 15.31 |
A Redemption price per share is equal to net asset value less any applicable contingent deferred sales charge.
| Statement of Operations | | | | |
| | | | | Year ended July 31, 2005 |
| Investment Income | | | | | | |
| Dividends | | | | $ | | 5,524,646 |
| Special Dividends | | | | | | 1,290,600 |
| Interest | | | | | | 24,823 |
| Security lending | | | | | | 17,474 |
| Total income | | | | | | 6,857,543 |
| |
| Expenses | | | | | | |
| Management fee | | $ | | 1,158,757 | | |
| Transfer agent fees | | | | 933,522 | | |
| Distribution fees | | | | 1,540,158 | | |
| Accounting and security lending | | | | | | |
| fees | | | | 83,757 | | |
| Independent trustees’ compensation | | 1,052 | | |
| Custodian fees and expenses | | | | 5,594 | | |
| Registration fees | | | | 55,086 | | |
| Audit | | | | 42,771 | | |
| Legal | | | | 1,959 | | |
| Miscellaneous | | | | 5,699 | | |
| Total expenses before reductions | | 3,828,355 | | |
| Expense reductions | | | | (59,784) | | 3,768,571 |
| |
| Net investment income (loss) | | | | | | 3,088,972 |
| Realized and Unrealized Gain (Loss) | | | | |
| Net realized gain (loss) on: | | | | | | |
| Investment securities | | | | 37,510,316 | | |
| Foreign currency transactions | | | | 10,126 | | |
| Total net realized gain (loss) | | | | | | 37,520,442 |
| Change in net unrealized appreci- | | | | |
| ation (depreciation) on investment | | | | |
| securities | | | | | | 7,253,242 |
| Net gain (loss) | | | | | | 44,773,684 |
| Net increase (decrease) in net as- | | | | |
| sets resulting from operations | | | | $ | | 47,862,656 |
See accompanying notes which are an integral part of the financial statements.
| | Advisor Telecommunications & Utilities Growth Fund
Financial Statements - continued
|
| Statement of Changes in Net Assets | | | | | | |
| | | Year ended | | | | Year ended |
| | | July 31, | | | | July 31, |
| | | 2005 | | | | 2004 |
| Increase (Decrease) in Net Assets | | | | | | |
| Operations | | | | | | |
| Net investment income (loss) | | $ 3,088,972 | | $ | | 757,542 |
| Net realized gain (loss) | | 37,520,442 | | | | 26,016,597 |
| Change in net unrealized appreciation (depreciation) | | 7,253,242 | | | | 5,705,831 |
| Net increase (decrease) in net assets resulting from operations | | 47,862,656 | | | | 32,479,970 |
| Distributions to shareholders from net investment income | | (2,204,610) | | | | (1,058,918) |
| Share transactions -- net increase (decrease) | | (38,936,571) | | | | (39,718,704) |
| Redemption fees | | 6,117 | | | | 13,588 |
| Total increase (decrease) in net assets | | 6,727,592 | | | | (8,284,064) |
| |
| Net Assets | | | | | | |
| Beginning of period | | 197,275,975 | | | | 205,560,039 |
| End of period (including undistributed net investment income of $1,351,200 and undistributed net investment income of | | | | | | |
| $473,223, respectively) | | $ 204,003,567 | | $ | | 197,275,975 |
| Financial Highlights — Class A | | | | | | | | | | |
| Years ended July 31, | | 2005 | | 2004 | | 2003 | | 2002 | | 2001 |
| Selected Per-Share Data | | | | | | | | | | |
| Net asset value, beginning of period | | $ 12.09 | | $ 10.37 | | $ 8.74 | | $ 15.18 | | $ 21.08 |
| Income from Investment Operations | | | | | | | | | | |
| Net investment income (loss)C | | 28D | | .10 | | .13 | | .10 | | .05 |
| Net realized and unrealized gain (loss) | | 3.01 | | 1.72 | | 1.69 | | (6.54) | | (5.41) |
| Total from investment operations | | 3.29 | | 1.82 | | 1.82 | | (6.44) | | (5.36) |
| Distributions from net investment income | | (.21) | | (.10) | | (.19) | | — | | (.28) |
| Distributions from net realized gain | | — | | — | | — | | — | | (.26) |
| Total distributions | | (.21) | | (.10) | | (.19) | | — | | (.54) |
| Redemption fees added to paid in capitalC | | —F | | —F | | —F | | —F | | —F |
| Net asset value, end of period | | $ 15.17 | | $ 12.09 | | $ 10.37 | | $ 8.74 | | $ 15.18 |
| Total ReturnA,B | | 27.48% | | 17.67% | | 21.22% | | (42.42)% | | (26.09)% |
| Ratios to Average Net AssetsE | | | | | | | | | | |
| Expenses before expense reductions | | 1.39% | | 1.51% | | 1.67% | | 1.45% | | 1.25% |
| Expenses net of voluntary waivers, if any | | 1.39% | | 1.50% | | 1.58% | | 1.45% | | 1.25% |
| Expenses net of all reductions | | 1.36% | | 1.45% | | 1.47% | | 1.36% | | 1.20% |
| Net investment income (loss) | | 2.03%D | | .87% | | 1.46% | | .79% | | .32% |
| Supplemental Data | | | | | | | | | | |
| Net assets, end of period (000 omitted) | | $ 29,150 | | $ 21,987 | | $ 21,761 | | $ 22,377 | | $ 54,265 |
| Portfolio turnover rate | | 44% | | 38% | | 81% | | 116% | | 220% |
| | A Total returns would have been lower had certain expenses not been reduced during the periods shown.
B Total returns do not include the effect of the sales charges.
C Calculated based on average shares outstanding during the period.
D Investment income per share reflects a special dividend which amounted to $.09 per share. Excluding the special dividend, the ratio of net investment income to average net assets would have been 1.39% .
E Expense ratios reflect operating expenses of the class. Expenses before reductions do not reflect amounts reimbursed by the investment adviser or reductions from brokerage service arrangements or other expense offset arrangements and do
not represent the amount paid by the class during periods when reimbursements or reductions occur. Expenses net of any voluntary waivers reflect expenses after reimbursement by the investment adviser but prior to reductions from broker
age service arrangements or other expense offset arrangements. Expenses net of all reductions represent the net expenses paid by the class.
F Amount represents less than $.01 per share.
|
See accompanying notes which are an integral part of the financial statements.
Telecommunications & Utilities Growth A-148
|
| Financial Highlights — Class T | | | | | | | | | | |
| Years ended July 31, | | 2005 | | 2004 | | 2003 | | 2002 | | 2001 |
| Selected Per-Share Data | | | | | | | | | | |
| Net asset value, beginning of period | | $ 12.04 | | $ 10.33 | | $ 8.68 | | $ 15.11 | | $ 21.01 |
| Income from Investment Operations | | | | | | | | | | |
| Net investment income (loss)C | | 24D | | .07 | | .11 | | .07 | | .01 |
| Net realized and unrealized gain (loss) | | 2.99 | | 1.72 | | 1.68 | | (6.50) | | (5.40) |
| Total from investment operations | | 3.23 | | 1.79 | | 1.79 | | (6.43) | | (5.39) |
| Distributions from net investment income | | (.17) | | (.08) | | (.14) | | — | | (.25) |
| Distributions from net realized gain | | — | | — | | — | | — | | (.26) |
| Total distributions | | (.17) | | (.08) | | (.14) | | — | | (.51) |
| Redemption fees added to paid in capitalC | | —F | | —F | | —F | | —F | | —F |
| Net asset value, end of period | | $ 15.10 | | $ 12.04 | | $ 10.33 | | $ 8.68 | | $ 15.11 |
| Total ReturnA,B | | 27.03% | | 17.42% | | 20.91% | | (42.55)% | | (26.29)% |
| Ratios to Average Net AssetsE | | | | | | | | | | |
| Expenses before expense reductions | | 1.67% | | 1.79% | | 1.94% | | 1.71% | | 1.49% |
| Expenses net of voluntary waivers, if any | | 1.67% | | 1.75% | | 1.83% | | 1.71% | | 1.49% |
| Expenses net of all reductions | | 1.64% | | 1.70% | | 1.72% | | 1.62% | | 1.44% |
| Net investment income (loss) | | 1.76%D | | .62% | | 1.21% | | .53% | | .08% |
| Supplemental Data | | | | | | | | | | |
| Net assets, end of period (000 omitted) | | $ 55,683 | | $ 53,255 | | $ 55,510 | | $ 59,306 | | $ 149,618 |
| Portfolio turnover rate | | 44% | | 38% | | 81% | | 116% | | 220% |
A Total returns would have been lower had certain expenses not been reduced during the periods shown.
B Total returns do not include the effect of the sales charges.
C Calculated based on average shares outstanding during the period.
D Investment income per share reflects a special dividend which amounted to $.09 per share. Excluding the special dividend, the ratio of net investment income to average net assets would have been 1.12% .
E Expense ratios reflect operating expenses of the class. Expenses before reductions do not reflect amounts reimbursed by the investment adviser or reductions from brokerage service arrangements or other expense offset arrangements and do
not represent the amount paid by the class during periods when reimbursements or reductions occur. Expenses net of any voluntary waivers reflect expenses after reimbursement by the investment adviser but prior to reductions from broker
age service arrangements or other expense offset arrangements. Expenses net of all reductions represent the net expenses paid by the class.
F Amount represents less than $.01 per share.
|
| Financial Highlights — Class B | | | | | | | | | | |
| Years ended July 31, | | 2005 | | 2004 | | 2003 | | 2002 | | 2001 |
| Selected Per-Share Data | | | | | | | | | | |
| Net asset value, beginning of period | | $ 11.82 | | $ 10.15 | | $ 8.49 | | $ 14.85 | | $ 20.72 |
| Income from Investment Operations | | | | | | | | | | |
| Net investment income (loss)C | | 17D | | .01 | | .07 | | .01 | | (.07) |
| Net realized and unrealized gain (loss) | | 2.95 | | 1.69 | | 1.65 | | (6.37) | | (5.33) |
| Total from investment operations | | 3.12 | | 1.70 | | 1.72 | | (6.36) | | (5.40) |
| Distributions from net investment income | | (.11) | | (.03) | | (.06) | | — | | (.21) |
| Distributions from net realized gain | | — | | — | | — | | — | | (.26) |
| Total distributions | | (.11) | | (.03) | | (.06) | | — | | (.47) |
| Redemption fees added to paid in capitalC | | —F | | —F | | —F | | —F | | —F |
| Net asset value, end of period | | $ 14.83 | | $ 11.82 | | $ 10.15 | | $ 8.49 | | $ 14.85 |
| Total ReturnA,B | | 26.51% | | 16.79% | | 20.37% | | (42.83)% | | (26.66)% |
| Ratios to Average Net AssetsE | | | | | | | | | | |
| Expenses before expense reductions | | 2.14% | | 2.25% | | 2.32% | | 2.20% | | 2.01% |
| Expenses net of voluntary waivers, if any | | 2.14% | | 2.25% | | 2.25% | | 2.20% | | 2.01% |
| Expenses net of all reductions | | 2.11% | | 2.20% | | 2.13% | | 2.11% | | 1.96% |
| Net investment income (loss) | | 1.28%D | | .12% | | .79% | | .04% | | (.44)% |
| Supplemental Data | | | | | | | | | | |
| Net assets, end of period (000 omitted) | | $ 82,577 | | $ 84,742 | | $ 87,868 | | $ 91,517 | | $ 213,767 |
| Portfolio turnover rate | | 44% | | 38% | | 81% | | 116% | | 220% |
A Total returns would have been lower had certain expenses not been reduced during the periods shown.
B Total returns do not include the effect of the contingent deferred sales charge.
C Calculated based on average shares outstanding during the period.
D Investment income per share reflects a special dividend which amounted to $.09 per share. Excluding the special dividend, the ratio of net investment income to average net assets would have been .64%.
E Expense ratios reflect operating expenses of the class. Expenses before reductions do not reflect amounts reimbursed by the investment adviser or reductions from brokerage service arrangements or other expense offset arrangements and do
not represent the amount paid by the class during periods when reimbursements or reductions occur. Expenses net of any voluntary waivers reflect expenses after reimbursement by the investment adviser but prior to reductions from broker
age service arrangements or other expense offset arrangements. Expenses net of all reductions represent the net expenses paid by the class.
F Amount represents less than $.01 per share.
|
See accompanying notes which are an integral part of the financial statements.
|
| Financial Highlights — Class C | | | | | | | | | | |
| Years ended July 31, | | 2005 | | 2004 | | 2003 | | 2002 | | 2001 |
| Selected Per-Share Data | | | | | | | | | | |
| Net asset value, beginning of period | | $ 11.84 | | $ 10.16 | | $ 8.50 | | $ 14.85 | | $ 20.71 |
| Income from Investment Operations | | | | | | | | | | |
| Net investment income (loss)C | | 18D | | .02 | | .07 | | .02 | | (.06) |
| Net realized and unrealized gain (loss) | | 2.94 | | 1.70 | | 1.65 | | (6.37) | | (5.33) |
| Total from investment operations | | 3.12 | | 1.72 | | 1.72 | | (6.35) | | (5.39) |
| Distributions from net investment income | | (.12) | | (.04) | | (.06) | | — | | (.21) |
| Distributions from net realized gain | | — | | — | | — | | — | | (.26) |
| Total distributions | | (.12) | | (.04) | | (.06) | | — | | (.47) |
| Redemption fees added to paid in capitalC | | —F | | —F | | —F | | —F | | —F |
| Net asset value, end of period | | $ 14.84 | | $ 11.84 | | $ 10.16 | | $ 8.50 | | $ 14.85 |
| Total ReturnA,B | | 26.48% | | 16.98% | | 20.35% | | (42.76)% | | (26.62)% |
| Ratios to Average Net AssetsE | | | | | | | | | | |
| Expenses before expense reductions | | 2.07% | | 2.17% | | 2.23% | | 2.11% | | 1.96% |
| Expenses net of voluntary waivers, if any | | 2.07% | | 2.17% | | 2.23% | | 2.11% | | 1.96% |
| Expenses net of all reductions | | 2.04% | | 2.12% | | 2.12% | | 2.02% | | 1.91% |
| Net investment income (loss) | | 1.36%D | | .21% | | .80% | | .13% | | (.39)% |
| Supplemental Data | | | | | | | | | | |
| Net assets, end of period (000 omitted) | | $ 34,827 | | $ 35,038 | | $ 37,530 | | $ 41,496 | | $ 104,628 |
| Portfolio turnover rate | | 44% | | 38% | | 81% | | 116% | | 220% |
A Total returns would have been lower had certain expenses not been reduced during the periods shown.
B Total returns do not include the effect of the contingent deferred sales charge.
C Calculated based on average shares outstanding during the period.
D Investment income per share reflects a special dividend which amounted to $.09 per share. Excluding the special dividend, the ratio of net investment income to average net assets would have been .72%.
E Expense ratios reflect operating expenses of the class. Expenses before reductions do not reflect amounts reimbursed by the investment adviser or reductions from brokerage service arrangements or other expense offset arrangements and do not
represent the amount paid by the class during periods when reimbursements or reductions occur. Expenses net of any voluntary waivers reflect expenses after reimbursement by the investment adviser but prior to reductions from brokerage service
arrangements or other expense offset arrangements. Expenses net of all reductions represent the net expenses paid by the class.
F Amount represents less than $.01 per share.
|
| Financial Highlights — Institutional Class | | | | | | | | | | |
| Years ended July 31, | | 2005 | | 2004 | | 2003 | | 2002 | | 2001 |
| Selected Per-Share Data | | | | | | | | | | |
| Net asset value, beginning of period | | $ 12.20 | | $ 10.47 | | $ 8.86 | | $ 15.31 | | $ 21.19 |
| Income from Investment Operations | | | | | | | | | | |
| Net investment income (loss)B | | 33C | | .15 | | .18 | | .16 | | .12 |
| Net realized and unrealized gain (loss) | | 3.03 | | 1.73 | | 1.71 | | (6.61) | | (5.44) |
| Total from investment operations | | 3.36 | | 1.88 | | 1.89 | | (6.45) | | (5.32) |
| Distributions from net investment income | | (.25) | | (.15) | | (.28) | | — | | (.30) |
| Distributions from net realized gain | | — | | — | | — | | — | | (.26) |
| Total distributions | | (.25) | | (.15) | | (.28) | | — | | (.56) |
| Redemption fees added to paid in capitalB | | —E | | —E | | —E | | —E | | —E |
| Net asset value, end of period | | $ 15.31 | | $ 12.20 | | $ 10.47 | | $ 8.86 | | $ 15.31 |
| Total ReturnA | | 27.88% | | 18.14% | | 21.94% | | (42.13)% | | (25.78)% |
| Ratios to Average Net AssetsD | | | | | | | | | | |
| Expenses before expense reductions | | 99% | | 1.09% | | 1.06% | | .96% | | .85% |
| Expenses net of voluntary waivers, if any | | 99% | | 1.09% | | 1.06% | | .96% | | .85% |
| Expenses net of all reductions | | 96% | | 1.04% | | .94% | | .87% | | .80% |
| Net investment income (loss) | | 2.44%C | | 1.29% | | 1.98% | | 1.28% | | .72% |
| Supplemental Data | | | | | | | | | | |
| Net assets, end of period (000 omitted) | | $ 1,766 | | $ 2,254 | | $ 2,891 | | $ 2,939 | | $ 8,945 |
| Portfolio turnover rate | | 44% | | 38% | | 81% | | 116% | | 220% |
A Total returns would have been lower had certain expenses not been reduced during the periods shown.
B Calculated based on average shares outstanding during the period.
C Investment income per share reflects a special dividend which amounted to $.09 per share. Excluding the special dividend, the ratio of net investment income to average net assets would have been 1.80% .
D Expense ratios reflect operating expenses of the class. Expenses before reductions do not reflect amounts reimbursed by the investment adviser or reductions from brokerage service arrangements or other expense offset arrangements and do not
represent the amount paid by the class during periods when reimbursements or reductions occur. Expenses net of any voluntary waivers reflect expenses after reimbursement by the investment adviser but prior to reductions from brokerage service
arrangements or other expense offset arrangements. Expenses net of all reductions represent the net expenses paid by the class.
E Amount represents less than $.01 per share.
|
See accompanying notes which are an integral part of the financial statements.
Telecommunications &Utilities Growth A-150
|
Notes to Financial Statements
For the period ended July 31, 2005
|
1. Significant Accounting Policies.
|
Fidelity Advisor Telecommunications & Utilities Growth Fund (the fund) is a non-diversified fund of Fidelity Advisor Series VII (the trust) and is authorized to issue an unlimited number of shares. The trust is registered under the Investment Company Act of 1940, as amended (the 1940 Act), as an open-end management investment company organized as a Massachusetts business trust.
The fund offers Class A, Class T, Class B, Class C and Institutional Class shares, each of which has equal rights as to assets and voting privileges. Each class has exclusive voting rights with respect to matters that affect that class. Class B shares will automatically convert to Class A shares after a holding period of seven years from the initial date of purchase. Investment income, realized and unrealized capital gains and losses, the common expenses of the fund, and certain fund-level expense reductions, if any, are allocated on a pro rata basis to each class based on the relative net assets of each class to the total net assets of the fund. Each class differs with respect to transfer agent and distribution and service plan fees incurred. Certain expense reductions also differ by class.
The financial statements have been prepared in conformity with accounting principles generally accepted in the United States of America, which require management to make certain estimates and assumptions at the date of the financial statements. The following summarizes the significant accounting policies of the fund:
Security Valuation. Net asset value per share (NAV calculation) is calculated as of the close of business of the New York Stock Exchange, normally 4:00 p.m. Eastern time. Equity securities, including restricted securities, for which market quotations are available are valued at the last sale price or official closing price (closing bid price or last evaluated quote if no sale has occurred) on the primary market or exchange on which they trade. If prices are not readily available or do not accurately reflect fair value for a security, or if a security’s value has been materially affected by events occurring after the close of the exchange or market on which the security is principally traded, that security may be valued by another method that the Board of Trustees believes accurately reflects fair value. A security’s valuation may differ depending on the method used for determining value. Price movements in futures contracts and ADRs, market and trading trends, the bid/ask quotes of brokers and off-exchange institutional trading may be reviewed in the course of making a good faith determination of a security’s fair value. Short-term securities with remaining maturities of sixty days or less for which quotations are not readily available are valued on the basis of amortized cost. Investments in open-end investment companies are valued at their net asset value each business day.
Foreign Currency. The fund uses foreign currency contracts to facilitate transactions in foreign-denominated securities. Losses from these transactions may arise from changes in the value of the foreign currency or if the counterparties do not perform under the contracts’ terms.
Foreign-denominated assets, including investment securities, and liabilities are translated into U.S. dollars at the exchange rate at period end. Purchases and sales of investment securities, income and dividends received and expenses denominated in foreign currencies are translated into U.S. dollars at the exchange rate in effect on the transaction date.
The effects of exchange rate fluctuations on investments are included with the net realized and unrealized gain (loss) on investment securities. Other foreign currency transactions resulting in realized and unrealized gain (loss) are disclosed separately.
Investment Transactions and Income. Security transactions are accounted for as of trade date. Gains and losses on securities sold are determined on the basis of identified cost and may include proceeds received from litigation. Dividend income is recorded on the ex-dividend date, except for certain dividends from foreign securities where the ex-dividend date may have passed, which are recorded as soon as the fund is informed of the ex-dividend date. Non-cash dividends included in dividend income, if any, are recorded at the fair market value of the securities received. Distributions received on securities that represent a return of capital or capital gain are recorded as a reduction of cost of investments and/or as a realized gain. The fund estimates the components of distributions received that may be considered return of capital distributions or capital gain distributions. Large, non-recurring dividends recognized by the fund are presented separately on the Statement of Operations as “Special Dividends” and the impact of these dividends is presented in the Financial Highlights. Interest income is accrued as earned. Interest income includes coupon interest and amortization of premium and accretion of discount on debt securities. Investment income is recorded net of foreign taxes withheld where recovery of such taxes is uncertain.
Expenses. Most expenses of the trust can be directly attributed to a fund. Expenses which cannot be directly attributed are apportioned among each fund in the trust.
Income Tax Information and Distributions to Shareholders. Each year, the fund intends to qualify as a regulated investment company by distributing all of its taxable income and realized gains under Subchapter M of the Internal Revenue Code. As a result, no provision for income taxes is required in the accompanying financial statements. Foreign taxes are provided for based on the fund’s understanding of the tax rules and rates that exist in the foreign markets in which it invests.
Notes to Financial Statements - continued
1. Significant Accounting Policies - continued
Income Tax Information and Distributions to Shareholders - continued
|
Distributions are recorded on the ex-dividend date. Income dividends and capital gain distributions are declared separately for each class. Income and capital gain distributions are determined in accordance with income tax regulations, which may differ from generally accepted accounting principles. Capital accounts within the financial statements are adjusted for permanent book-tax differences. These adjustments have no impact on net assets or the results of operations. Temporary book-tax differences will reverse in a subsequent period.
Book-tax differences are primarily due to foreign currency transactions, capital loss carryforwards and losses deferred due to wash sales.
The tax-basis components of distributable earnings and the federal tax cost as of period end were as follows:
| Unrealized appreciation | | $ 36,563,126 | | | | |
| Unrealized depreciation | | (13,779,832) | | | | |
| Net unrealized appreciation (depreciation) | | 22,783,294 | | | | |
| Undistributed ordinary income | | 1,351,315 | | | | |
| Capital loss carryforward | | (315,578,610) | | | | |
| |
| Cost for federal income tax purposes | | $ 182,301,567 | | | | |
| |
| The tax character of distributions paid was as follows: | | | | | | |
| | | July 31, 2005 | | | | July 31, 2004 |
| Ordinary Income | | $ 2,204,610 | | $ | | 1,058,918 |
Short-Term Trading (Redemption) Fees. Shares held in the fund less than 60 days are subject to a redemption fee equal to 1.00% of the proceeds of the redeemed shares. All redemption fees, including any estimated redemption fees paid by Fidelity Management & Research Company (FMR), are retained by the fund and accounted for as an addition to paid in capital.
Repurchase Agreements. FMR has received an Exemptive Order from the Securities and Exchange Commission (the SEC) which permits the fund and other affiliated entities of FMR to transfer uninvested cash balances into joint trading accounts which are then invested in repurchase agreements. The fund may also invest directly with institutions in repurchase agreements. Repurchase agreements are collateralized by government or non-government securities. Collateral is held in segregated accounts with custodian banks and may be obtained in the event of a default of the counterparty. The fund monitors, on a daily basis, the value of the collateral to ensure it is at least equal to the principal amount of the repurchase agreement (including accrued interest). In the event of a default by the counterparty, realization of the collateral proceeds could be delayed, during which time the value of the collateral may decline.
3. Purchases and Sales of Investments.
Purchases and sales of securities, other than short-term securities and U.S. government securities, aggregated $87,703,693 and $124,116,711, respectively.
4. Fees and Other Transactions with Affiliates.
Management Fee. FMR and its affiliates provide the fund with investment management related services for which the fund pays a monthly management fee. The management fee is the sum of an individual fund fee rate that is based on an annual rate of .30% of the fund’s average net assets and a group fee rate that averaged .27% during the period. The group fee rate is based upon the average net assets of all the mutual funds advised by FMR. The group fee rate decreases as assets under management increase and increases as assets under management decrease. For the period, the total annual management fee rate was .57% of the fund’s average net assets.
Telecommunications & Utilities Growth
4. Fees and Other Transactions with Affiliates - continued
Distribution and Service Plan. In accordance with Rule 12b-1 of the 1940 Act, the fund has adopted separate Distribution and Service Plans for each class of shares. Certain classes pay Fidelity Distributors Corporation (FDC), an affiliate of FMR, separate Distribution and Service Fees, each of which is based on an annual percentage of each class’ average net assets. In addition, FDC may pay financial intermediaries for selling shares of the fund and providing shareholder support services. For the period, the Distribution and Service Fee rates and the total amounts paid to and retained by FDC were as follows:
| | | Distribution | | Service | | | | Paid to | | | | Retained |
| | | Fee | | Fee | | | | FDC | | | | by FDC |
| Class A | | 0% | | .25% | | $ | | 61,780 | | $ | | 139 |
| Class T | | 25% | | .25% | | | | 274,860 | | | | 778 |
| Class B | | 75% | | .25% | | | | 848,148 | | | | 636,630 |
| Class C | | 75% | | .25% | | | | 355,370 | | | | 20,223 |
| |
| | | | | | | $ | | 1,540,158 | | $ | | 657,770 |
Sales Load. FDC receives a front-end sales charge of up to 5.75% for selling Class A shares, and 3.50% for selling Class T shares, some of which is paid to financial intermediaries for selling shares of the fund. FDC receives the proceeds of contingent deferred sales charges levied on Class A, Class T, Class B, and Class C redemptions. These charges depend on the holding period. The deferred sales charges range from 5% to 1% for Class B, 1% for Class C, and .25% for certain purchases of Class A and Class T shares.
For the period, sales charge amounts retained by FDC were as follows:
| | | | | Retained |
| | | | | by FDC |
| Class A | | $ | | 11,820 |
| Class T | | | | 8,973 |
| Class B* | | | | 255,926 |
| Class C* | | | | 1,858 |
| | | $ | | 278,577 |
| * When Class B and Class C shares are initially sold, FDC pays commissions from its own resources to financial intermediaries through which the sales are made. | | | | |
Transfer Agent Fees. Fidelity Investments Institutional Operations Company, Inc. (FIIOC), an affiliate of FMR, is the transfer, dividend disbursing and shareholder servicing agent for each class of the fund. FIIOC receives account fees and asset-based fees that vary according to the account size and type of account of the shareholders of the respective classes of the fund. FIIOC pays for typesetting, printing and mailing of shareholder reports, except proxy statements. For the period the total transfer agent fees paid by each class to FIIOC, were as follows:
| | | | | | | % of |
| | | | | | | Average |
| | | | | Amount | | Net Assets |
| Class A | | $ | | 116,083 | | .47 |
| Class T | | | | 272,389 | | .50 |
| Class B | | | | 397,839 | | .47 |
| Class C | | | | 140,545 | | .40 |
| Institutional Class | | | | 6,666 | | .32 |
| |
| | | $ | | 933,522 | | |
Accounting and Security Lending Fees. Fidelity Service Company, Inc. (FSC), an affiliate of FMR, maintains the fund’s accounting records. The accounting fee is based on the level of average net assets for the month. Under a separate contract, FSC administers the security lending program. The security lending fee is based on the number and duration of lending transactions.
Central Funds. The fund may invest in affiliated Central Funds managed by Fidelity Investments Money Management, Inc. (FIMM), an affiliate of FMR. The Central Funds are open-end investment companies available only to investment companies and other accounts managed by FMR and its affiliates. The Money Market Central Funds seek preservation of capital and current income. The Central Funds do not pay a management fee. Income distributions earned by the fund are recorded as income in the accompanying financial statements and totaled $61,023 for the period.
Brokerage Commissions. The fund placed a portion of its portfolio transactions with brokerage firms which are affiliates of the investment adviser. The commissions paid to these affiliated firms were $1,832 for the period.
| | Notes to Financial Statements - continued
5. Committed Line of Credit.
|
The fund participates with other funds managed by FMR in a $4.2 billion credit facility (the “line of credit”) to be utilized for temporary or emergency purposes to fund shareholder redemptions or for other short-term liquidity purposes. The fund has agreed to pay commitment fees on its pro rata portion of the line of credit. During the period, there were no borrowings on this line of credit.
The fund lends portfolio securities from time to time in order to earn additional income. The fund receives collateral (in the form of U.S. Treasury obligations, letters of credit and/or cash) against the loaned securities and maintains collateral in an amount not less than 100% of the market value of the loaned securities during the period of the loan. The market value of the loaned securities is determined at the close of business of the fund and any additional required collateral is delivered to the fund on the next business day. If the borrower defaults on its obligation to return the securities loaned because of insolvency or other reasons, a fund could experience delays and costs in recovering the securities loaned or in gaining access to the collateral. Cash collateral is invested in the Fidelity Securities Lending Cash Central Fund. The value of loaned securities and cash collateral at period end are disclosed on the fund’s Statement of Assets and Liabilities.
Many of the brokers with whom FMR places trades on behalf of the fund provided services to the fund in addition to trade execution. These services included payments of certain expenses on behalf of the fund totaling $59,784 for the period.
The fund’s organizational documents provide former and current trustees and officers with a limited indemnification against liabilities arising in connection with the performance of their duties to the fund. In the normal course of business, the fund may also enter into contracts that provide general indemnifications. The fund’s maximum exposure under these arrangements is unknown as this would be dependent on future claims that may be made against the fund. The risk of material loss from such claims is considered remote.
| | 9. Distributions to Shareholders.
|
Distributions to shareholders of each class were as follows:
| Years ended July 31, | | 2005 | | | | 2004 |
| From net investment income | | | | | | |
| Class A | | $ 379,843 | | $ | | 201,967 |
| Class T | | 719,068 | | | | 417,451 |
| Class B | | 727,725 | | | | 256,606 |
| Class C | | 334,204 | | | | 143,592 |
| Institutional Class | | 43,770 | | | | 39,302 |
| Total | | $ 2,204,610 | | $ | | 1,058,918 |
Telecommunications & Utilities Growth
10. Share Transactions.
Transactions for each class of shares were as follows:
|
| | | | | Shares | | | | | | Dollars |
| Years ended July 31, | | 2005 | | | | 2004 | | 2005 | | | | 2004 |
| Class A | | | | | | | | | | | | |
| Shares sold | | 617,343 | | | | 298,298 | | $ 8,551,655 | | $ | | 3,438,753 |
| Reinvestment of distributions | | 25,986 | | | | 17,065 | | 343,477 | | | | 183,774 |
| Shares redeemed | | (539,379) | | | | (595,057) | | (7,330,607) | | | | (6,759,275) |
| Net increase (decrease) | | 103,950 | | | | (279,694) | | $ 1,564,525 | | $ | | (3,136,748) |
| Class T | | | | | | | | | | | | |
| Shares sold | | 578,539 | | | | 494,942 | | $ 7,880,368 | | $ | | 5,575,654 |
| Reinvestment of distributions | | 51,235 | | | | 36,573 | | 676,884 | | | | 392,232 |
| Shares redeemed | | (1,366,525) | | | | (1,480,100) | | (18,576,683) | | | | (16,736,309) |
| Net increase (decrease) | | (736,751) | | | | (948,585) | | $ (10,019,431) | | $ (10,768,423) |
| Class B | | | | | | | | | | | | |
| Shares sold | | 216,806 | | | | 312,692 | | $ 2,882,532 | | $ | | 3,435,209 |
| Reinvestment of distributions | | 47,675 | | | | 21,061 | | 631,927 | | | | 219,667 |
| Shares redeemed | | (1,863,609) | | | | (1,821,311) | | (24,817,850) | | | | (20,266,895) |
| Net increase (decrease) | | (1,599,128) | | | | (1,487,558) | | $ (21,303,391) | | $ (16,612,019) |
| Class C | | | | | | | | | | | | |
| Shares sold | | 270,120 | | | | 267,567 | | $ 3,555,440 | | $ | | 2,967,003 |
| Reinvestment of distributions | | 19,593 | | | | 10,338 | | 258,067 | | | | 108,777 |
| Shares redeemed | | (903,829) | | | | (1,009,938) | | (12,032,784) | | | | (11,224,441) |
| Net increase (decrease) | | (614,116) | | | | (732,033) | | $ (8,219,277) | | $ | | (8,148,661) |
| Institutional Class | | | | | | | | | | | | |
| Shares sold | | 17,262 | | | | 23,573 | | $ 232,429 | | $ | | 273,182 |
| Reinvestment of distributions | | 2,019 | | | | 2,128 | | 26,680 | | | | 22,996 |
| Shares redeemed | | (88,732) | | | | (117,098) | | (1,218,106) | | | | (1,349,031) |
| Net increase (decrease) | | (69,451) | | | | (91,397) | | $ (958,997) | | $ | | (1,052,853) |
Report of Independent Registered Public Accounting Firm
To the Trustees of Fidelity Advisor Series VII and Shareholders of Fidelity Advisor Biotechnology Fund, Fidelity Advisor Consumer Industries Fund, Fidelity Advisor Cyclical Industries Fund, Fidelity Advisor Developing Communications Fund, Fidelity Advisor Electronics Fund, Fidelity Advisor Financial Services Fund, Fidelity Advisor Health Care Fund, Fidelity Advisor Natural Resources Fund, Fidelity Advisor Technology Fund, and Fidelity Advisor Telecommunications & Utilities Growth Fund:
We have audited the accompanying statements of assets and liabilities of Fidelity Advisor Biotechnology Fund, Fidelity Advisor Consumer Industries Fund, Fidelity Advisor Cyclical Industries Fund, Fidelity Advisor Developing Communications Fund, Fidelity Advisor Electronics Fund, Fidelity Advisor Financial Services Fund, Fidelity Advisor Health Care Fund, Fidelity Advisor Natural Resources Fund, Fidelity Advisor Technology Fund, and Fidelity Advisor Telecommunications & Utilities Growth Fund, (collectively, the “Funds”), including the portfolios of investments, as of July 31, 2005, and the related statements of operations for the year then ended, the statements of changes in net assets for each of the two years in the period then ended, and the financial highlights for the respective stated periods. These financial statements and financial highlights are the responsibility of the Funds’ management. Our responsibility is to express an opinion on these financial statements and financial highlights based on our audits.
We conducted our audits in accordance with standards of the Public Company Accounting Oversight Board (United States). Those standards require that we plan and perform the audit to obtain reasonable assurance about whether the financial statements and financial highlights are free of material misstatement. The funds are not required to have, nor were we engaged to perform, an audit of their internal control over financial reporting. Our audits included consideration of internal control over financial reporting as a basis for designing audit procedures that are appropriate in the circumstances, but not for the purpose of expressing an opinion on the effectiveness of the Funds’ internal control over financial reporting. Accordingly, we express no such opinion. An audit also includes examining, on a test basis, evidence supporting the amounts and disclosures in the financial statements, assessing the accounting principles used and significant estimates made by management, as well as evaluating the overall financial statement presentation. Our procedures included confirmation of securities owned as of July 31, 2005, by correspondence with the custodians and brokers; where replies were not received from brokers, we performed other auditing procedures. We believe that our audits provide a reasonable basis for our opinion.
In our opinion, the financial statements and financial highlights referred to above present fairly, in all material respects, the financial position of Fidelity Advisor Biotechnology Fund, Fidelity Advisor Consumer Industries Fund, Fidelity Advisor Cyclical Industries Fund, Fidelity Advisor Developing Communications Fund, Fidelity Advisor Electronics Fund, Fidelity Advisor Financial Services Fund, Fidelity Advisor Health Care Fund, Fidelity Advisor Natural Resources Fund, Fidelity Advisor Technology Fund, and Fidelity Advisor Telecommunications & Utilities Growth Fund, as of July 31, 2005, the results of their operations for the year then ended, the changes in their net assets for each of the two years in the period then ended, and their financial highlights for the respective stated periods, in conformity with accounting principles generally accepted in the United States of America.
/s/DELOITTE & TOUCHE LLP
DELOITTE & TOUCHE LLP
Boston, Massachusetts
September 22, 2005
|
Trustees and Officers
The Trustees, Members of the Advisory Board, and executive officers of the trust and funds, as applicable, are listed below. The Board of Trustees governs each fund and is responsible for protecting the interests of shareholders. The Trustees are experienced executives who meet periodically throughout the year to oversee each fund’s activities, review contractual arrangements with companies that provide services to each fund, and review each fund’s performance. Except for William O. McCoy, Stephen P. Jonas, and Kenneth L. Wolfe, each of the Trustees oversees 320 funds advised by FMR or an affiliate. Mr. McCoy oversees 322 funds advised by FMR or an affiliate. Mr. Jonas and Mr. Wolfe oversee 311 funds advised by FMR or an affiliate.
The Trustees hold office without limit in time except that (a) any Trustee may resign; (b) any Trustee may be removed by written instrument, signed by at least two-thirds of the number of Trustees prior to such removal; (c) any Trustee who requests to be retired or who has become incapacitated by illness or injury may be retired by written instrument signed by a majority of the other Trustees; and (d) any Trustee may be removed at any special meeting of shareholders by a two-thirds vote of the outstanding voting securities of the trust. Each Trustee who is not an interested person (as defined in the 1940 Act) (Independent Trustee), shall retire not later than the last day of the calendar year in which his or her 72nd birthday occurs. The Independent Trustees may waive this mandatory retirement age policy with respect to individual Trustees. The executive officers and Advisory Board Members hold office without limit in time, except that any officer and Advisory Board Member may resign or may be removed by a vote of a majority of the Trustees at any regular meeting or any special meeting of the Trustees. Except as indicated, each individual has held the office shown or other offices in the same company for the past five years.
The fund’s Statement of Additional Information (SAI) includes more information about the Trustees. To request a free copy, call Fidelity at 1-877-208-0098.
Interested Trustees*:
Correspondence intended for each Trustee who is an interested person may be sent to Fidelity Investments, 82 Devonshire Street, Boston, Massa-chusetts 02109.
| Name, Age; Principal Occupation |
| |
| Edward C. Johnson 3d (75)** |
| |
| Year of Election or Appointment: 1980 |
| Mr. Johnson is Chairman of the Board of Trustees. Mr. Johnson serves as Chief Executive Officer, Chairman, and a Director of FMR |
| Corp.; a Director and Chairman of the Board and of the Executive Committee of FMR; Chairman and a Director of Fidelity Man- |
| agement & Research (Far East) Inc.; Chairman and a Director of Fidelity Investments Money Management, Inc.; and Chairman |
| (2001-present) and a Director (2000-present) of FMR Co., Inc. |
| |
| Abigail P. Johnson (43)** |
| |
| Year of Election or Appointment: 2001 |
| Ms. Johnson serves as President of Fidelity Employer Services Company (FESCO) (2005-present). She is President and a Director |
| of Fidelity Investments Money Management, Inc. (2001-present), FMR Co., Inc. (2001-present), and a Director of FMR Corp. Pre- |
| viously, Ms. Johnson served as President and a Director of FMR (2001-2005), Senior Vice President of the Fidelity funds |
| (2001-2005), and managed a number of Fidelity funds. |
| |
| Stephen P. Jonas (52) |
| |
| Year of Election or Appointment: 2005 |
| Mr. Jonas is Senior Vice President of Advisor Biotechnology (2005-present), Advisor Consumer Industries (2005-present), Advisor |
| Cyclical Industries (2005-present), Advisor Developing Communications (2005-present), Advisor Electronics (2005-present), Advi- |
| sor Financial Services (2005-present), Advisor Health Care (2005-present), Advisor Natural Resources (2005-present), Advisor |
| Technology (2005-present), and Advisor Telecommunications & Utilities Growth (2005-present). He also serves as Senior Vice |
| President of other Fidelity funds (2005-present). Mr. Jonas is Executive Director of FMR (2005-present). Previously, Mr. Jonas |
| served as President of Fidelity Enterprise Operations and Risk Services (2004-2005), Chief Administrative Officer (2002-2004), |
| and Chief Financial Officer of FMR Co. (1998-2000). Mr. Jonas has been with Fidelity Investments since 1987 and has held vari- |
| ous financial and management positions including Chief Financial Officer of FMR. In addition, he serves on the Boards of Boston |
| Ballet (2003-present) and Simmons College (2003-present). |
| |
| Robert L. Reynolds (53) |
| |
| Year of Election or Appointment: 2003 |
| Mr. Reynolds is a Director (2003-present) and Chief Operating Officer (2002-present) of FMR Corp. He also serves on the Board |
| at Fidelity Investments Canada, Ltd. (2000-present). Previously, Mr. Reynolds served as President of Fidelity Investments Institutional |
| Retirement Group (1996-2000). |
* Trustees have been determined to be “Interested Trustees” by virtue of, among other things, their affiliation with the trust or various entities under common control with FMR.
** Edward C. Johnson 3d, Trustee, is Abigail P. Johnson’s father.
A-157 Annual Report
Trustees and Officers - continued
Independent Trustees:
Correspondence intended for each Independent Trustee (that is, the Trustees other than the Interested Trustees) may be sent to Fidelity Invest-
ments, P.O. Box 55235, Boston, Massachusetts 02205-5235.
|
| Name, Age; Principal Occupation |
| |
| Dennis J. Dirks (57) |
| |
| Year of Election or Appointment: 2005 |
| Prior to his retirement in May 2003, Mr. Dirks was Chief Operating Officer and a member of the Board of The Depository Trust & |
| Clearing Corporation (DTCC) (1999-2003). He also served as President, Chief Operating Officer, and Board member of The De- |
| pository Trust Company (DTC) (1999-2003) and President and Board member of the National Securities Clearing Corporation |
| (NSCC) (1999-2003). In addition, Mr. Dirks served as Chief Executive Officer and Board member of the Government Securities |
| Clearing Corporation (2001-2003) and Chief Executive Officer and Board member of the Mortgage-Backed Securities Clearing |
| Corporation (2001-2003). Mr. Dirks also serves as a Trustee of Manhattan College (2005-present). |
| |
| Robert M. Gates (61) |
| |
| Year of Election or Appointment: 1997 |
| Dr. Gates is Vice Chairman of the Independent Trustees (2005-present). Dr. Gates is President of Texas A&M University |
| (2002-present). He was Director of the Central Intelligence Agency (CIA) from 1991 to 1993. From 1989 to 1991, Dr. Gates |
| served as Assistant to the President of the United States and Deputy National Security Advisor. Dr. Gates is a Director of NACCO |
| Industries, Inc. (mining and manufacturing), Parker Drilling Co., Inc. (drilling and rental tools for the energy industry, 2001- |
| present), and Brinker International (restaurant management, 2003-present). Previously, Dr. Gates served as a Director of |
| LucasVarity PLC (automotive components and diesel engines), a Director of TRW Inc. (automotive, space, defense, and information |
| technology), and Dean of the George Bush School of Government and Public Service at Texas A&M University (1999-2001). |
| Dr. Gates also is a Trustee of the Forum for International Policy. |
| |
| George H. Heilmeier (69) |
| |
| Year of Election or Appointment: 2004 |
| Dr. Heilmeier is Chairman Emeritus of Telcordia Technologies (communication software and systems), where prior to his retirement, |
| he served as company Chairman and Chief Executive Officer. He currently serves on the Boards of Directors of The Mitre Corpo- |
| ration (systems engineering and information technology support for the government), and HRL Laboratories (private research and |
| development, 2004-present). He is Chairman of the General Motors Science & Technology Advisory Board and a Life Fellow of |
| the Institute of Electrical and Electronics Engineers (IEEE) (2000-present). Dr. Heilmeier is a member of the Defense Science Board |
| and the National Security Agency Advisory Board. He is also a member of the National Academy of Engineering, the American |
| Academy of Arts and Sciences, and the Board of Overseers of the School of Engineering and Applied Science of the University of |
| Pennsylvania. Previously, Dr. Heilmeier served as a Director of TRW Inc. (automotive, space, defense, and information technology, |
| 1992-2002), Compaq (1994-2002), Automatic Data Processing, Inc. (ADP) (technology-based business outsourcing, 1995-2002), |
| INET Technologies Inc. (telecommunications network surveillance, 2001-2004), and Teletech Holdings (customer management ser- |
| vices). He is the recipient of the 2005 Kyoto Prize in Advanced Technology for his invention of the liquid display. |
| |
| Marie L. Knowles (58) |
| |
| Year of Election or Appointment: 2001 |
| Prior to Ms. Knowles’ retirement in June 2000, she served as Executive Vice President and Chief Financial Officer of Atlantic Rich- |
| field Company (ARCO) (diversified energy, 1996-2000). From 1993 to 1996, she was a Senior Vice President of ARCO and |
| President of ARCO Transportation Company. She served as a Director of ARCO from 1996 to 1998. She currently serves as a |
| Director of Phelps Dodge Corporation (copper mining and manufacturing) and McKesson Corporation (healthcare service, |
| 2002-present). Ms. Knowles is a Trustee of the Brookings Institution and the Catalina Island Conservancy and also serves as a |
| member of the Advisory Board for the School of Engineering of the University of Southern California. |
| |
| Ned C. Lautenbach (61) |
| |
| Year of Election or Appointment: 2000 |
| Mr. Lautenbach has been a partner of Clayton, Dubilier & Rice, Inc. (private equity investment firm) since September 1998. Pre- |
| viously, Mr. Lautenbach was with the International Business Machines Corporation (IBM) from 1968 until his retirement in 1998. |
| Mr. Lautenbach serves as a Director of Italtel Holding S.p.A. (telecommunications (Milan, Italy), 2004-present) and Eaton Corpora- |
| tion (diversified industrial) as well as the Philharmonic Center for the Arts in Naples, Florida. He also is a member of the Board of |
| Trustees of Fairfield University (2005-present), as well as a member of the Council on Foreign Relations. |
Annual Report A-158
| Name, Age; Principal Occupation |
| |
| Marvin L. Mann (72) |
| |
| Year of Election or Appointment: 1993 |
| Mr. Mann is Chairman of the Independent Trustees (2001-present). He is Chairman Emeritus of Lexmark International, Inc. (com- |
| puter peripherals), where he served as CEO until April 1998, retired as Chairman May 1999, and remains a member of the |
| Board. Prior to 1991, he held the positions of Vice President of International Business Machines Corporation (IBM) and President |
| and General Manager of various IBM divisions and subsidiaries. He is a member of the Executive Committee of the Independent |
| Director’s Council of the Investment Company Institute. In addition, Mr. Mann is a member of the President’s Cabinet at the Univer- |
| sity of Alabama and the Board of Visitors of the Culverhouse College of Commerce and Business Administration at the University |
| of Alabama. |
| |
| William O. McCoy (71) |
| |
| Year of Election or Appointment: 1997 |
| Prior to his retirement in December 1994, Mr. McCoy was Vice Chairman of the Board of BellSouth Corporation (telecommunica- |
| tions) and President of BellSouth Enterprises. He is currently a Director of Liberty Corporation (holding company), Duke Realty Cor- |
| poration (real estate), and Progress Energy, Inc. (electric utility). He is also a partner of Franklin Street Partners (private investment |
| management firm) and a member of the Research Triangle Foundation Board. In addition, Mr. McCoy served as the Interim Chan- |
| cellor (1999-2000) and a member of the Board of Visitors for the University of North Carolina at Chapel Hill and currently serves |
| on the Board of Directors of the University of North Carolina Health Care System and the Board of Visitors of the Kenan-Flagler |
| Business School (University of North Carolina at Chapel Hill). He also served as Vice President of Finance for the University of |
| North Carolina (16-school system). |
| |
| Cornelia M. Small (61) |
| |
| Year of Election or Appointment: 2005 |
| Ms. Small is a member (2000-present) and Chairperson (2002-present) of the Investment Committee, and a member |
| (2002-present) of the Board of Trustees of Smith College. Previously, she served as Chief Investment Officer (1999-2000), Director |
| of Global Equity Investments (1996-1999), and a member of the Board of Directors of Scudder, Stevens & Clark (1990-1997) and |
| Scudder Kemper Investments (1997-1998). In addition, Ms. Small served as Co-Chair (2000-2003) of the Annual Fund for the |
| Fletcher School of Law and Diplomacy. |
| |
| William S. Stavropoulos (66) |
| |
| Year of Election or Appointment: 2001 |
| Mr. Stavropoulos is Chairman of the Board (2000-present) and a Member of the Board of Directors of The Dow Chemical Com- |
| pany. Since joining The Dow Chemical Company in 1967, Mr. Stavropoulos served in numerous senior management positions, |
| including President (1993-2000; 2002-2003), CEO (1995-2000; 2002-2004), and Chairman of the Executive Committee |
| (2000-2004). Currently, he is a Director of NCR Corporation (data warehousing and technology solutions), BellSouth Corporation |
| (telecommunications), Chemical Financial Corporation, Maersk Inc. (industrial conglomerate, 2002-present), and Metalmark Capi- |
| tal (private equity investment firm, 2005-present). He also serves as a member of the Board of Trustees of the American Enterprise |
| Institute for Public Policy Research. In addition, Mr. Stavropoulos is a member of The Business Council, J.P. Morgan International |
| Council and the University of Notre Dame Advisory Council for the College of Science. |
| |
| Kenneth L. Wolfe (66) |
| |
| Year of Election or Appointment: 2005 |
| Mr. Wolfe also serves as a Trustee (2005-present) or Member of the Advisory Board (2004-present) of other investment companies |
| advised by FMR. Prior to his retirement in 2001, Mr. Wolfe was Chairman and Chief Executive Officer of Hershey Foods Corpora- |
| tion (1993-2001). He currently serves as a member of the boards of Adelphia Communications Corporation (2003-present), |
| Bausch & Lomb, Inc., and Revlon Inc. (2004-present). |
| | Advisory Board Members and Executive Officers:
Correspondence intended for Mr. Gamper may be sent to Fidelity Investments, P.O. Box 55235, Boston, Massachusetts 02205-5235. Correspondence
intended for each executive officer and Mr. Lynch may be sent to Fidelity Investments, 82 Devonshire Street, Boston, Massachusetts 02109.
|
| Name, Age; Principal Occupation |
| |
| Albert R. Gamper, Jr. (63) |
| |
| Year of Election or Appointment: 2005 |
| Member of the Advisory Board of Fidelity Advisor Series VII. Prior to his retirement in December 2004, Mr. Gamper served as |
| Chairman of the Board of CIT Group Inc. (commercial finance). During his tenure with CIT Group Inc. Mr. Gamper served in nu- |
| merous senior management positions, including Chairman (1987-1989; 1999-2001; 2002-2004), Chief Executive Officer |
| (1987-2004), and President (1989-2002). He currently serves as a member of the Board of Directors of Public Service Enterprise |
| Group (utilities, 2001-present), Chairman of the Board of Governors, Rutgers University (2004-present), and Chairman of the |
| Board of Saint Barnabas Health Care System. |
A-159 Annual Report
Trustees and Officers - continued
| Name, Age; Principal Occupation |
| |
| Peter S. Lynch (61) |
| |
| Year of Election or Appointment: 2003 |
| Member of the Advisory Board of Fidelity Advisor Series VII. Vice Chairman and a Director of FMR, and Vice Chairman |
| (2001-present) and a Director (2000-present) of FMR Co., Inc. Previously, Mr. Lynch served as a Trustee of the Fidelity funds |
| (1990-2003). In addition, he serves as a Trustee of Boston College, Massachusetts Eye & Ear Infirmary, Historic Deerfield, John F. |
| Kennedy Library, and the Museum of Fine Arts of Boston. |
| |
| Eric D. Roiter (56) |
| |
| Year of Election or Appointment: 1998 or 2000 |
| Secretary of Advisor Biotechnology (2000), Advisor Consumer Industries (1998), Advisor Cyclical Industries (1998), Advisor De- |
| veloping Communications (2000), Advisor Electronics (2000), Advisor Financial Services (1998), Advisor Health Care (1998), |
| Advisor Natural Resources (1998), Advisor Technology (1998), and Advisor Telecommunications & Utilities Growth (1998). He |
| also serves as Secretary of other Fidelity funds; Vice President, General Counsel, and Secretary of FMR Co., Inc. (2001-present) |
| and FMR; Assistant Secretary of Fidelity Management & Research (U.K.) Inc. (2001-present), Fidelity Management & Research (Far |
| East) Inc. (2001-present), and Fidelity Investments Money Management, Inc. (2001-present). Mr. Roiter is an Adjunct Member, |
| Faculty of Law, at Boston College Law School (2003-present).Previously, Mr. Roiter served as Vice President and Secretary of |
| Fidelity Distributors Corporation (FDC) (1998-2005). |
| |
| Stuart Fross (45) |
| |
| Year of Election or Appointment: 2003 |
| Assistant Secretary of Advisor Biotechnology, Advisor Consumer Industries, Advisor Cyclical Industries, Advisor Developing Com- |
| munications, Advisor Electronics, Advisor Financial Services, Advisor Health Care, Advisor Natural Resources, Advisor Technology, |
| and Advisor Telecommunications & Utilities Growth. Mr. Fross also serves as Assistant Secretary of other Fidelity funds |
| (2003-present), Vice President and Secretary of FDC (2005-present), and is an employee of FMR. |
| |
| Christine Reynolds (46) |
| |
| Year of Election or Appointment: 2004 |
| President, Treasurer, and Anti-Money Laundering (AML) officer of Advisor Biotechnology, Advisor Consumer Industries, Advisor |
| Cyclical Industries, Advisor Developing Communications, Advisor Electronics, Advisor Financial Services, Advisor Health Care, |
| Advisor Natural Resources, Advisor Technology, and Advisor Telecommunications & Utilities Growth. Ms. Reynolds also serves as |
| President, Treasurer, and AML officer of other Fidelity funds (2004) and is a Vice President (2003) and an employee (2002) of |
| FMR. Before joining Fidelity Investments, Ms. Reynolds worked at PricewaterhouseCoopers LLP (PwC) (1980-2002), where she was |
| most recently an audit partner with PwC’s investment management practice. |
| |
| Timothy F. Hayes (54) |
| |
| Year of Election or Appointment: 2002 |
| Chief Financial Officer of Advisor Biotechnology, Advisor Consumer Industries, Advisor Cyclical Industries, Advisor Developing |
| Communications, Advisor Electronics, Advisor Financial Services, Advisor Health Care, Advisor Natural Resources, Advisor |
| Technology, and Advisor Telecommunications & Utilities Growth. Mr. Hayes also serves as Chief Financial Officer of other Fidelity |
| funds (2002-present) and President of Fidelity Investment Operations (2005-present) which includes Fidelity Pricing and Cash Man- |
| agement Services Group (FPCMS), where he served as President (1998-2005). Mr. Hayes serves as President of Fidelity Service |
| Company (2003-present) where he also serves as a Director. Mr. Hayes also served as President of Fidelity Investments Operations |
| Group (FIOG, 2002-2005). |
| |
| Kenneth A. Rathgeber (58) |
| |
| Year of Election or Appointment: 2004 |
| Chief Compliance Officer of Advisor Biotechnology, Advisor Consumer Industries, Advisor Cyclical Industries, Advisor Developing |
| Communications, Advisor Electronics, Advisor Financial Services, Advisor Health Care, Advisor Natural Resources, Advisor |
| Technology, and Advisor Telecommunications & Utilities Growth. Mr. Rathgeber also serves as Chief Compliance Officer of other |
| Fidelity funds (2004) and Executive Vice President of Risk Oversight for Fidelity Investments (2002). Previously, he served as Execu- |
| tive Vice President and Chief Operating Officer for Fidelity Investments Institutional Services Company, Inc. (1998-2002). |
| |
| John R. Hebble (47) |
| |
| Year of Election or Appointment: 2003 |
| Deputy Treasurer of Advisor Biotechnology, Advisor Consumer Industries, Advisor Cyclical Industries, Advisor Developing Commu- |
| nications, Advisor Electronics, Advisor Financial Services, Advisor Health Care, Advisor Natural Resources, Advisor Technology, |
| and Advisor Telecommunications & Utilities Growth. Mr. Hebble also serves as Deputy Treasurer of other Fidelity funds (2003), and |
| is an employee of FMR. Before joining Fidelity Investments, Mr. Hebble worked at Deutsche Asset Management where he served as |
| Director of Fund Accounting (2002-2003) and Assistant Treasurer of the Scudder Funds (1998-2003). |
Annual Report A-160
| Name, Age; Principal Occupation |
| |
| Bryan A. Mehrmann (44) |
| |
| Year of Election or Appointment: 2005 |
| Deputy Treasurer of Advisor Biotechnology, Advisor Consumer Industries, Advisor Cyclical Industries, Advisor Developing Commu- |
| nications, Advisor Electronics, Advisor Financial Services, Advisor Health Care, Advisor Natural Resources, Advisor Technology, |
| and Advisor Telecommunications & Utilities Growth. Mr. Mehrmann also serves as Deputy Treasurer of other Fidelity funds |
| (2005-present) and is an employee of FMR. Previously, Mr. Mehrmann served as Vice President of Fidelity Investments Institutional |
| Services Group (FIIS)/Fidelity Investments Institutional Operations Corporation, Inc. (FIIOC) Client Services (1998-2004). |
| |
| Kimberley H. Monasterio (41) |
| |
| Year of Election or Appointment: 2004 |
| Deputy Treasurer of Advisor Biotechnology, Advisor Consumer Industries, Advisor Cyclical Industries, Advisor Developing Commu- |
| nications, Advisor Electronics, Advisor Financial Services, Advisor Health Care, Advisor Natural Resources, Advisor Technology, |
| and Advisor Telecommunications & Utilities Growth. Ms. Monasterio also serves as Deputy Treasurer of other Fidelity funds (2004) |
| and is an employee of FMR (2004). Before joining Fidelity Investments, Ms. Monasterio served as Treasurer (2000-2004) and |
| Chief Financial Officer (2002-2004) of the Franklin Templeton Funds and Senior Vice President of Franklin Templeton Services, LLC |
| (2000-2004). |
| |
| Kenneth B. Robins (35) |
| |
| Year of Election or Appointment: 2005 |
| Deputy Treasurer of Advisor Biotechnology, Advisor Consumer Industries, Advisor Cyclical Industries, Advisor Developing Commu- |
| nications, Advisor Electronics, Advisor Financial Services, Advisor Health Care, Advisor Natural Resources, Advisor Technology, |
| and Advisor Telecommunications & Utilities Growth. Mr. Robins also serves as Deputy Treasurer of other Fidelity funds (2005- |
| present) and is an employee of FMR (2004-present). Before joining Fidelity Investments, Mr. Robins worked at KPMG LLP, where he |
| was a partner in KPMG’s department of professional practice (2002-2004) and a Senior Manager (1999-2000). In addition, Mr. |
| Robins served as Assistant Chief Accountant, United States Securities and Exchange Commission (2000-2002). |
| |
| Robert G. Byrnes (38) |
| |
| Year of Election or Appointment: 2005 |
| Assistant Treasurer of Advisor Biotechnology, Advisor Consumer Industries, Advisor Cyclical Industries, Advisor Developing Com- |
| munications, Advisor Electronics, Advisor Financial Services, Advisor Health Care, Advisor Natural Resources, Advisor Technology, |
| and Advisor Telecommunications & Utilities Growth. Mr. Byrnes also serves as Assistant Treasurer of other Fidelity funds |
| (2005-present) and is an employee of FMR (2005-present). Previously, Mr. Byrnes served as Vice President of FPCMS |
| (2003-2005). Before joining Fidelity Investments, Mr. Byrnes worked at Deutsche Asset Management where he served as Vice |
| President of the Investment Operations Group (2000-2003). |
| |
| John H. Costello (58) |
| |
| Year of Election or Appointment: 1987, 1996, or 2000 |
| Assistant Treasurer of Advisor Biotechnology (2000), Advisor Consumer Industries (1996), Advisor Cyclical Industries (1996), Ad- |
| visor Developing Communications (2000), Advisor Electronics (2000), Advisor Financial Services (1996), Advisor Health Care |
| (1996), Advisor Natural Resources (1987), Advisor Technology (1996), and Advisor Telecommunications & Utilities Growth |
| (1996). Mr. Costello also serves as Assistant Treasurer of other Fidelity funds and is an employee of FMR. |
| |
| Peter L. Lydecker (51) |
| |
| Year of Election or Appointment: 2004 |
| Assistant Treasurer of Advisor Biotechnology, Advisor Consumer Industries, Advisor Cyclical Industries, Advisor Developing Com- |
| munications, Advisor Electronics, Advisor Financial Services, Advisor Health Care, Advisor Natural Resources, Advisor Technology, |
| and Advisor Telecommunications & Utilities Growth. Mr. Lydecker also serves as Assistant Treasurer of other Fidelity funds (2004) |
| and is an employee of FMR. |
| |
| Mark Osterheld (50) |
| |
| Year of Election or Appointment: 2002 |
| Assistant Treasurer of Advisor Biotechnology, Advisor Consumer Industries, Advisor Cyclical Industries, Advisor Developing Com- |
| munications, Advisor Electronics, Advisor Financial Services, Advisor Health Care, Advisor Natural Resources, Advisor Technology, |
| and Advisor Telecommunications & Utilities Growth. Mr. Osterheld also serves as Assistant Treasurer of other Fidelity funds (2002) |
| and is an employee of FMR. |
A-161 Annual Report
Trustees and Officers - continued
| Name, Age; Principal Occupation |
| |
| Gary W. Ryan (46) |
| |
| Year of Election or Appointment: 2005 |
| Assistant Treasurer of Advisor Biotechnology, Advisor Consumer Industries, Advisor Cyclical Industries, Advisor Developing Com- |
| munications, Advisor Electronics, Advisor Financial Services, Advisor Health Care, Advisor Natural Resources, Advisor Technology, |
| and Advisor Telecommunications & Utilities Growth. Mr. Ryan also serves as Assistant Treasurer of other Fidelity funds (2005- |
| present) and is an employee of FMR (2005-present). Previously, Mr. Ryan served as Vice President of Fund Reporting in FPCMS |
| (1999-2005). |
| |
| Salvatore Schiavone (39) |
| |
| Year of Election or Appointment: 2005 |
| Assistant Treasurer of Advisor Biotechnology, Advisor Consumer Industries, Advisor Cyclical Industries, Advisor Developing Com- |
| munications, Advisor Electronics, Advisor Financial Services, Advisor Health Care, Advisor Natural Resources, Advisor Technology, |
| and Advisor Telecommunications & Utilities Growth. Mr. Schiavone also serves as Assistant Treasurer of other Fidelity funds |
| (2005-present) and is an employee of FMR (2005-present). Before joining Fidelity Investments, Mr. Schiavone worked at Deutsche |
| Asset Management, where he most recently served as Assistant Treasurer (2003-2005) of the Scudder Funds and Vice President |
| and Head of Fund Reporting (1996-2003). |
Annual Report A-162
The Board of Trustees of each fund voted to pay to shareholders of record at the opening of business on record date, the following distributions per share derived from capital gains realized from sales of portfolio securities, and dividends derived from net investment income:
| Institutional Class | | Pay Date | | Record Date | | | | Dividends | | Capital Gains |
| Consumer Industries | | 09/19/05 | | 09/16/05 | | $ | | — | | $ | | .02 |
| Cyclical Industries | | 09/19/05 | | 09/16/05 | | $ | | — | | $ | | 1.009 |
| Financial Services | | 09/19/05 | | 09/16/05 | | $ | | .255 | | $ | | 1.39 |
| Natural Resources | | 09/12/05 | | 09/09/05 | | $ | | — | | $ | | 4.03 |
| Telecommunications & Utilities Growth | | 09/19/05 | | 09/16/05 | | $ | | .226 | | $ | | — |
The funds hereby designate as capital gain dividends the amounts noted below for the taxable year indicated or for dividends for the taxable year ended 2005, if subsequently determined to be different, the net capital gain of such year; and for dividends for the taxable year ended 2004, if subsequently determined to be different, the excess of: (a) the net capital gain of such year, over (b) amounts previously designated as capital gain dividends with respect to such year.
| Fund | | July 31, 2005 | | July 31, 2004 |
| Consumer Industries | | 101,875 | | 1,928,104 |
| Cyclical Industries | | 4,639,975 | | 1,346,098 |
| Financial Services | | 27,457,198 | | 32,085,929 |
| Natural Resources | | 43,058,271 | | 0 |
A percentage of the dividends distributed during the fiscal year for the following funds qualifies for the dividends-received deduction for cor porate shareholders:
| Institutional Class | | September 2004 | | December 2004 |
| Cyclical Industries | | 31% | | 76% |
| Financial Services | | — | | 86% |
| Natural Resources | | — | | 100% |
| Technology | | — | | 100% |
| Telecommunications & Utilities Growth | | 100% | | 100% |
A percentage of the dividends distributed during the fiscal year for the following funds as amounts which may be taken into account as a dividend for purposes of the maximum rate under section 1(h)(11) of the Internal Revenue Code.
| Institutional Class | | September 2004 | | December 2004 |
| Cyclical Industries | | 53% | | 44% |
| Financial Services | | — | | 100% |
| Natural Resources | | — | | 100% |
| Technology | | — | | 100% |
| Telecommunications & Utilities Growth | | 100% | | 100% |
The funds will notify shareholders in January 2006 of amounts for use in preparing 2005 income tax returns.
Board Approval of Investment Advisory Contracts and Management Fees
Each year, typically in July, the Board of Trustees, including the independent Trustees (together, the Board), votes on the renewal of the management contract and sub-advisory agreements (together, the Advisory Contracts) for each fund. The Board, assisted by the advice of fund counsel and independent Trustees’ counsel, requests and considers a broad range of information throughout the year.
The Board meets regularly each month except August and takes into account throughout the year matters bearing on Advisory Contracts. The Board, acting directly and through its separate committees, considers at each of its meetings factors that are relevant to the annual renewal of each fund’s Advisory Contracts, including the services and support provided to each fund and its shareholders by Fidelity. At the time of the renewal, the Board had 11 standing committees, each composed of independent Trustees with varying backgrounds, to which the Board has assigned specific subject matter responsibilities in order to enhance effective decision-making by the Board. Each committee has adopted a written charter outlining the structure and purposes of the committee. One such committee, the Equity Contract Committee, meets periodically during the first six months of each year and as necessary to consider matters specifically related to the annual renewal of Advisory Contracts. The committee requests and receives information on, and makes recommendations to the independent Trustees concerning, the approval and annual review of the Advisory Contracts.
At its July 2005 meeting, the Board of Trustees, including the independent Trustees, unanimously determined to renew the Advisory Contracts for each fund. In reaching its determination, the Board considered all factors it believed relevant, including (1) the nature, extent, and quality of the services to be provided to each fund and its shareholders by Fidelity (including the investment performance of each fund); (2) the competitiveness of the management fee and total expenses of each fund; (3) the total costs of the services to be provided by and the profits to be realized by the investment adviser and its affiliates from the relationship with each fund; (4) the extent to which economies of scale would be realized as each fund grows; and (5) whether fee levels reflect these economies of scale, if any, for the benefit of fund shareholders.
In determining whether to renew the Advisory Contracts for each fund, the Board ultimately reached a determination, with the assistance of fund counsel and independent Trustees’ counsel, that the renewal of the Advisory Contracts and the compensation to be received by Fidelity under the management contracts is consistent with Fidelity’s fiduciary duty under applicable law. In addition to evaluating the specific factors noted above, the Board, in reaching its determination, is aware that shareholders in each fund have a broad range of investment choices available to them, including a wide choice among mutual funds offered by competitors to Fidelity, and that each fund’s shareholders, with the opportunity to review and weigh the disclosure provided by the fund in its prospectus and other public disclosures, have chosen to invest in that fund, managed by Fidelity.
Nature, Extent, and Quality of Services Provided by Fidelity. The Board considered staffing within the investment adviser, FMR, and the sub-advisers (together, the Investment Advisers), including the backgrounds of the funds’ portfolio managers and the funds’ investment objectives and disciplines. The independent Trustees also had discussions with senior management of Fidelity’s investment operations and investment groups. The Board considered the structure of the portfolio manager compensation program and whether this structure provides appropriate incentives.
Fidelity Resources Dedicated to Investment Management and Support Services. The Board reviewed the size, education, and experience of the Investment Advisers’ investment staff, their use of technology, and the Investment Advisers’ approach to recruiting, training, and retaining portfolio managers and other research, advisory, and management personnel. The Board considered Fidelity’s extensive global research capabilities that enable the Investment Advisers to aggregate data from various sources in an effort to produce positive investment results. The Board noted that Fidelity’s analysts have access to a variety of technological tools that enable them to perform both fundamental and quantitative analysis and to specialize in various disciplines. The Board also considered that Fidelity’s portfolio managers and analysts have access to daily portfolio attribution that allows for monitoring of a fund’s portfolio, as well as an electronic communication system that provides immediate real-time access to research concerning issuers and credit enhancers.
Shareholder and Administrative Services. The Board considered the nature, extent, quality, and cost of administrative, distribution, and shareholder services performed by the Investment Advisers and their affiliates under the Advisory Contracts and under separate agreements covering transfer agency, pricing and bookkeeping, and securities lending services for each fund. The Board also considered the nature and extent of the Investment Advisers’ supervision of third party service providers, principally custodians and subcustodians. The Board reviewed the allocation of fund brokerage, including allocations to brokers affiliated with the Investment Advisers, the use of brokerage commissions to pay fund expenses, and the use of “soft” commission dollars to pay for research services. The Board also considered that Fidelity voluntarily decided in 2004 to stop using “soft” commission dollars to pay for market data and, instead, to pay for that data out of its own resources. The Board also considered the resources devoted to, and the record of compliance with, each fund’s compliance policies and procedures.
The Board noted that the growth of fund assets across the complex allows Fidelity to reinvest in the development of services designed to enhance the value or convenience of the Fidelity funds as investment vehicles. These services include 24-hour access to account information and market information through phone representatives and over the Internet, and investor education materials and asset allocation tools.
Investment in a Large Fund Family. The Board considered the benefits to shareholders of investing in a Fidelity fund, including the benefits of investing in a fund that is part of a large family of funds offering a variety of investment disciplines and providing for a large variety of mutual fund investor services. For example, fund shareholders are offered the privilege of exchanging shares of a fund for shares of other Fidelity funds, as set forth in the
fund’s prospectus, without paying an additional sales charge. The Board noted that, since the last Advisory Contract renewals in July 2004, Fidelity has taken a number of actions that benefited particular funds, including (i) voluntarily deciding in 2004 to stop using “soft” commission dollars to pay for market data and, instead, to pay for that data out of its own resources, (ii) contractually agreeing to impose management fee reductions and expense limitations on its five Spartan stock index funds and its stock index fund available through variable insurance products, (iii) contractually agreeing to eliminate the management fees on the Fidelity Freedom Funds and the Fidelity Advisor Freedom Funds, (iv) contractually agreeing to reduce the management fees on most of its investment-grade taxable bond funds, and (v) contractually agreeing to impose expense limitations on its retail and Spartan investment-grade taxable bond funds.
Investment Performance and Compliance. The Board considered whether each fund has operated within its investment objective, as well as its record of compliance with its investment restrictions. It also reviewed each fund’s absolute investment performance for each class, as well as each fund’s relative investment performance for each class measured against (i) a Goldman Sachs index that reflects the market sector in which the fund invests (Advisor Consumer Industries, Advisor Cyclical Industries, Advisor Financial Services, Advisor Health Care, Advisor Natural Resources, and Advisor Technology) or a proprietary custom index (Advisor Biotechnology, Advisor Developing Communications, Advisor Electronics, and Advisor Telecommunications & Utilities Growth), and (ii) a peer group of mutual funds over multiple periods. Because each of Advisor Biotechnology, Advisor Developing Communications, and Advisor Electronics had been in existence less than five calendar years, for each fund the following charts considered by the Board show, over the one- and three-year periods ended December 31, 2004, the returns of Class C and Institutional Class of the fund, the returns of a proprietary custom index (“benchmark”), and a range of returns of a peer group of mutual funds identified by Lipper Inc. as having an investment objective similar to that of the fund. For each of Advisor Consumer Industries, Advisor Cyclical Industries, Advisor Financial Services, Advisor Health Care, Advisor Natural Resources, Advisor Technology, and Advisor Telecommunications & Utilities Growth, the following charts considered by the Board show, over the one-, three-, and five-year periods ended December 31, 2004, the returns of Class C and Institutional Class of the fund, the returns of a Goldman Sachs index (or a proprietary custom index, in the case of Telecommunications & Utilities Growth) (“benchmark”), and a range of returns of a peer group of mutual funds identified by Lipper Inc. as having an investment objective similar to that of the fund. The returns of Class C and Institutional Class represent the performance of classes with the highest and lowest 12b-1 fees, respectively (not necessarily with the highest and lowest total expenses). The box within each chart shows the 25th percentile return (bottom of box) and the 75th percentile return (top of box) of the Lipper peer group. Returns shown above the box are in the first quartile and returns shown below the box are in the fourth quartile. The percentage beaten numbers noted below each chart correspond to the percentile box and represent the percentage of funds in the Lipper peer group whose performance was equal to or lower than that of the class indicated. For each of Advisor Biotechnology, Advisor Developing Communications, Advisor Electronics, and Advisor Telecommunications & Utilities Growth, the fund’s proprietary custom index is an index developed and periodically revised by FMR that is a market-capitalization weighted index of securities that meet the fund’s 80% name test.
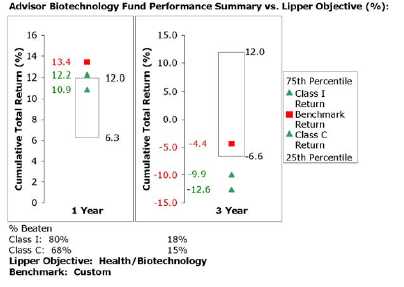
The Board reviewed the fund’s relative investment performance against its Lipper peer group and stated that the performance of Institutional Class of the fund was in the first quartile for the one-year period and the fourth quartile for the three-year period. The Board noted that FMR does not consider that Lipper peer group to be a meaningful comparison for the fund, however, because the funds in the peer group typically have broader investment mandates than the fund, which focuses on a particular subset of companies within the health and biotechnology industries. The Board also stated that the relative investment performance of the fund was lower than its benchmark over time. The Board considered that the variations in performance among the fund’s classes reflect the variations in class expenses, which result in lower performance for higher expense classes. In the absence of a meaningful peer group comparison for the fund and in consideration of the fund’s exposure to a narrow market sector, the Board focused its review on
Board Approval of Investment Advisory Contracts and Management Fees - continued
the fund’s relative investment performance measured against its benchmark. In light of that comparison, the Board discussed with FMR actions to be taken by FMR to improve the fund’s below-benchmark performance.

The Board reviewed the fund’s relative investment performance against its Lipper peer group and stated that the performance of Institutional Class of the fund was in the fourth quartile for the one-year period and the third quartile for the three- and five-year periods. The Board noted that FMR does not consider that Lipper peer group to be a meaningful comparison for the fund, however, because the peer group includes funds that focus on different industries and sectors than the fund. The Board also stated that the relative investment performance of the fund was lower than its benchmark over time. The Board considered that the variations in performance among the fund’s classes reflect the variations in class expenses, which result in lower performance for higher expense classes. In the absence of a meaningful peer group comparison for the fund and in consideration of the fund’s exposure to a narrow market sector, the Board focused its review on the fund’s relative investment performance measured against its benchmark. In light of that comparison, the Board discussed with FMR actions to be taken by FMR to improve the fund’s below-benchmark performance.
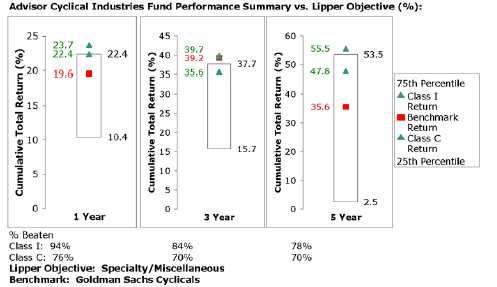
The Board reviewed the fund’s relative investment performance against its Lipper peer group and stated that the performance of Institutional Class of the fund was in the first quartile for the one-, three-, and five-year periods. The Board noted that FMR does not consider that Lipper peer group to be a meaningful comparison for the fund, however, because the peer group includes funds that focus on different industries and sectors than the fund. The Board also stated that the relative investment performance of Institutional Class of the fund has compared favorably to its benchmark over time. The Board considered that the variations in performance among the fund’s classes reflect the variations in class expenses, which result in lower performance for higher expense classes.
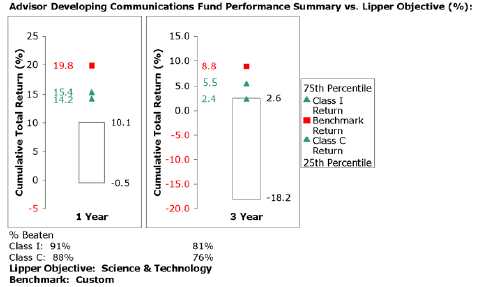
The Board reviewed the fund’s relative investment performance against its Lipper peer group and stated that the performance of Institutional Class of the fund was in the first quartile for the one- and three-year periods. The Board noted that FMR does not consider that Lipper peer group to be a meaningful comparison for the fund, however, because the funds in the peer group typically have broader investment mandates than the fund, which focuses on a particular subset of companies within the science and technology industries. The Board also stated that the relative investment performance of the fund was lower than its benchmark over time. The Board considered that the variations in performance among the fund’s classes reflect the variations in class expenses, which result in lower performance for higher expense classes. In the absence of a meaningful peer group comparison for the fund and in consideration of the fund’s exposure to a narrow market sector, the Board focused its review on the fund’s relative investment performance measured against its benchmark. In light of that comparison, the Board discussed with FMR actions to be taken by FMR to improve the fund’s below-benchmark performance.

The Board reviewed the fund’s relative investment performance against its Lipper peer group and stated that the performance of Institutional Class of the fund was in the fourth quartile for the one- and three-year periods. The Board noted that FMR does not consider that Lipper peer group to be a meaningful comparison for the fund, however, because the funds in the peer group typically have broader investment mandates than the fund, which focuses on a particular subset of companies within the science and technology industries. The Board also stated that the relative investment performance of the fund was lower than its benchmark over time. The Board considered that the variations in performance among the fund’s classes reflect the variations in class expenses, which result in lower performance for higher expense classes. In the absence of a meaningful peer group comparison for the fund and in consideration of the fund’s exposure to a narrow market sector, the Board focused its review on the fund’s relative investment
Board Approval of Investment Advisory Contracts and Management Fees - continued
performance measured against its benchmark. In light of that comparison, the Board discussed with FMR actions to be taken by FMR to improve the fund’s below-benchmark performance.

The Board reviewed the fund’s relative investment performance against its Lipper peer group and stated that the performance of Institutional Class of the fund was in the third quartile for the one- and five-year periods and the second quartile for the three-year period. The Board also stated that the relative investment performance of the fund was lower than its benchmark over time. The Board considered that the variations in performance among the fund’s classes reflect the variations in class expenses, which result in lower performance for higher expense classes.
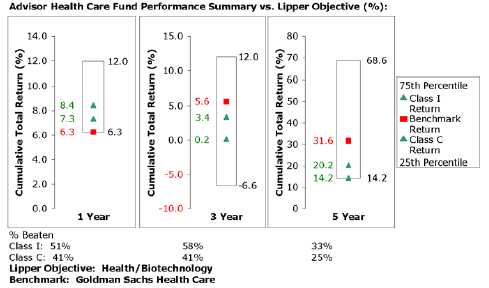
The Board reviewed the fund’s relative investment performance against its Lipper peer group and stated that the performance of Institutional Class of the fund was in the second quartile for the one- and three-year periods and the third quartile for the five-year period. The Board also stated that the relative investment performance of the fund was lower than its benchmark over time, although the one-year cumulative total return of Institutional Class of the fund compared favorably to its benchmark. The Board considered that the variations in performance among the fund’s classes reflect the variations in class expenses, which result in lower performance for higher expense classes.
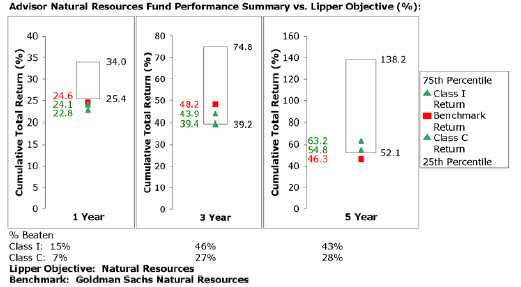
The Board reviewed the fund’s relative investment performance against its Lipper peer group and stated that the performance of Institutional Class of the fund was in the fourth quartile for the one-year period and the third quartile for the three- and five-year periods. The Board also stated that the relative investment performance of the fund was lower than its benchmark for certain periods, although the five-year cumulative total return of Institutional Class of the fund was higher than its benchmark. The Board considered that the variations in performance among the fund’s classes reflect the variations in class expenses, which result in lower performance for higher expense classes. The Board discussed with FMR actions to be taken by FMR to improve the fund’s disappointing performance.

The Board reviewed the fund’s relative investment performance against its Lipper peer group and stated that the performance of Institutional Class of the fund was in the third quartile for the one-year period and the second quartile for the three- and five-year periods. The Board also stated that the relative investment performance of the fund was lower than its benchmark over time. The Board considered that the variations in performance among the fund’s classes reflect the variations in class expenses, which result in lower performance for higher expense classes.
Board Approval of Investment Advisory Contracts and Management Fees - continued

The Board reviewed the fund’s relative investment performance against its Lipper peer group and stated that the performance of Institutional Class of the fund was in the second quartile for the one-year period, the third quartile for the three-year period, and the fourth quartile for the five-year period. The Board also stated that the relative investment performance of Institutional Class of the fund has compared favorably to its benchmark for certain periods, although the fund’s five-year cumulative total return was lower than its benchmark. The Board considered that the variations in performance among the fund’s classes reflect the variations in class expenses, which result in lower performance for higher expense classes.
The Board has had thorough discussions with FMR throughout the year about the Board’s and FMR’s concerns about equity research, equity fund performance, and compliance with internal policies governing gifts and entertainment. FMR has taken steps that it believes will refocus and strengthen equity research and equity portfolio management and compliance. The Board noted with favor FMR’s recent reorganization of its senior management team and FMR’s plans to dedicate additional resources to investment research, and participated in the process that led to those changes.
Based on its review, and giving particular weight to the nature and quality of the resources dedicated by the Investment Advisers to maintain and improve relative performance, the Board concluded that the nature, extent, and quality of the services provided by Fidelity will benefit each fund’s shareholders, particularly in light of the Board’s view that each fund’s shareholders benefit from investing in a fund that is part of a large family of funds offering a variety of investment disciplines and services.
Competitiveness of Management Fee and Total Fund Expenses. The Board considered each fund’s management fee and total expenses compared to “mapped groups” of competitive funds and classes. Fidelity creates “mapped groups” by combining similar Lipper investment objective categories that have comparable management fee characteristics. Combining Lipper investment objective categories aids the Board’s management fee and total expense comparisons by broadening the competitive group used for comparison and by reducing the number of universes to which various Fidelity funds are compared.
The Board considered two proprietary management fee comparisons for the 12-month periods shown in the charts below. The group of Lipper funds used by the Board for management fee comparisons is referred to below as the “Total Mapped Group” and, for the reasons explained above, is broader than the Lipper peer group used by the Board for performance comparisons. The Total Mapped Group comparison focuses on a fund’s standing relative to the total universe of comparable funds available to investors, in terms of gross management fees before expense reimbursements or caps. “TMG %” represents the percentage of funds in the Total Mapped Group that had management fees that were lower than a fund’s. For example, a TMG % of 31% would mean that 69% of the funds in the Total Mapped Group had higher management fees than a fund. The “Asset-Size Peer Group” (ASPG) comparison focuses on a fund’s standing relative to non-Fidelity funds similar in size to the fund within the Total Mapped Group. The ASPG represents at least 15% of the funds in the Total Mapped Group with comparable asset size and management fee characteristics, subject to a minimum of 50 funds (or all funds in the Total Mapped Group if fewer than 50). Additional information, such as the ASPG quartile (“quadrant”) in which a fund’s management fee ranked, is also included in the charts and considered by the Board.
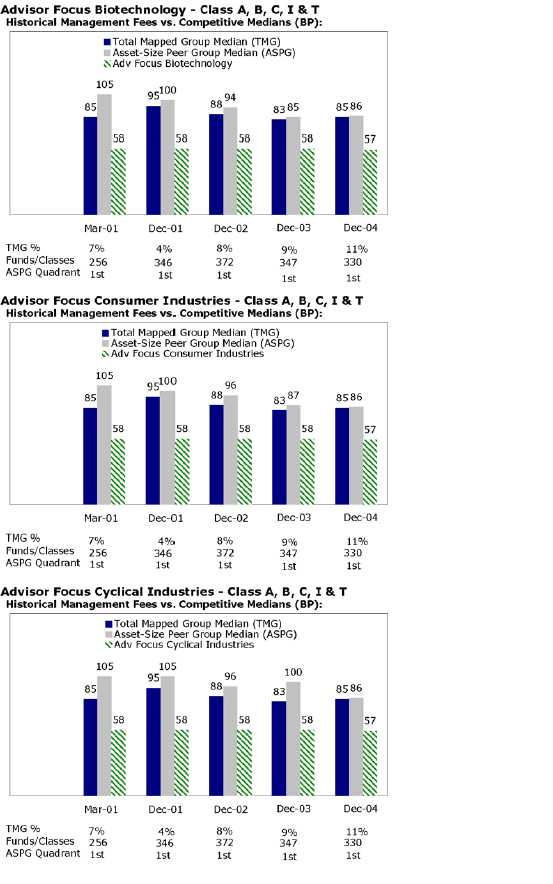
A-171 Annual Report
Board Approval of Investment Advisory Contracts and Management Fees - continued
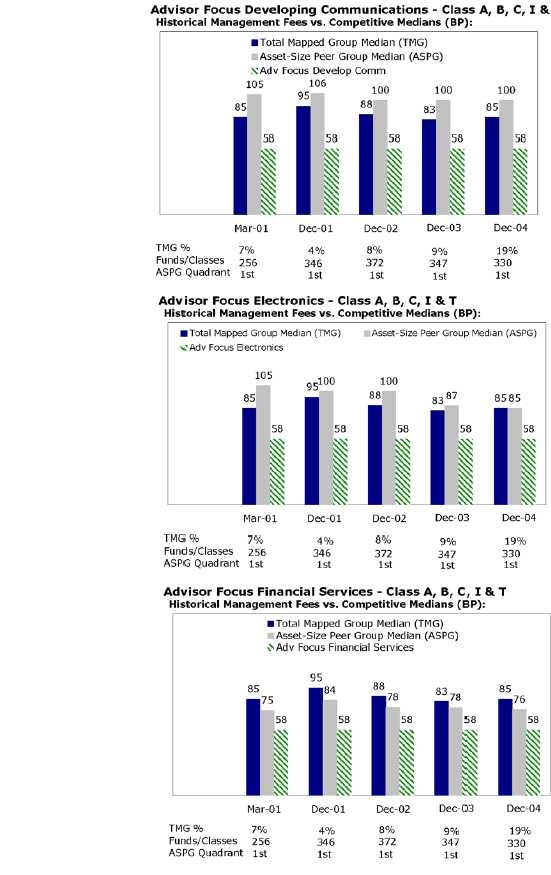
Annual Report A-172
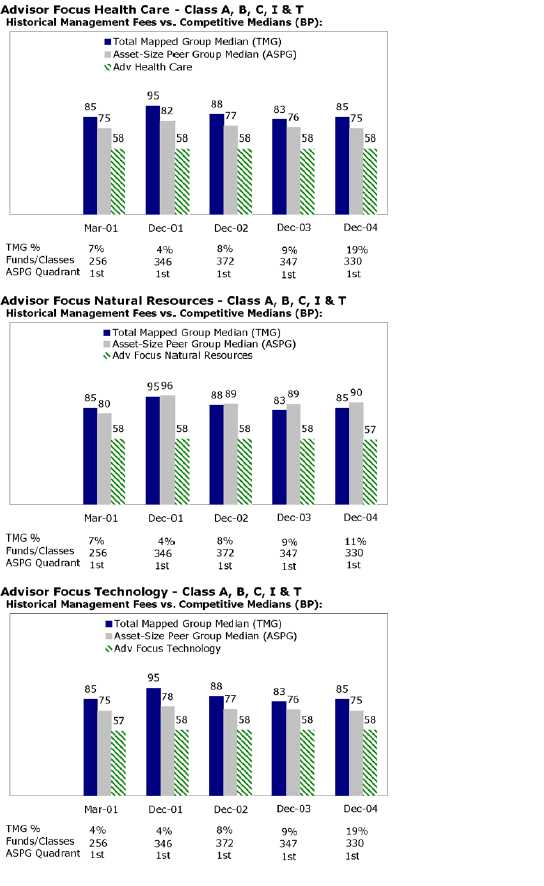
A-173 Annual Report
Board Approval of Investment Advisory Contracts and Management Fees - continued
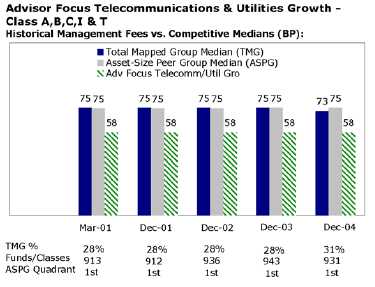
The Board noted that each fund’s management fee ranked below the median of its Total Mapped Group and below the median of its ASPG for 2004.
Based on its review, the Board concluded that each fund’s management fee was fair and reasonable in light of the services that the fund receives and the other factors considered.
In its review of each class’s total expenses, the Board considered the fund’s management fee as well as other fund or class expenses, as applicable, such as transfer agent fees, pricing and bookkeeping fees, fund-paid 12b-1 fees, and custodial, legal, and audit fees. The Board also noted the effects of any waivers and reimbursements on fees and expenses. As part of its review, the Board also considered current and historical total expenses of each class of each fund compared to competitive fund median expenses. Each class of each fund is compared to those funds and classes in the Total Mapped Group (used by the Board for management fee comparisons) that have a similar sales load structure.
The Board noted that each fund offers multiple classes, each of which has a different sales load and 12b-1 fee structure, and that the multiple structures are intended to offer a range of pricing options for the intermediary market. The Board also noted that the total expenses of the classes of each fund vary primarily by the level of their 12b-1 fees, although differences in transfer agent fees may also cause expenses to vary from class to class.
The Board noted that the total expenses of each of Class A, Class B, Class C and Institutional Class of Advisor Biotechnology Fund ranked below its competitive median for 2004, and the total expenses of Class T of the fund ranked above its competitive median for 2004.
The Board noted that the total expenses of each of Class A, Class B and Class C of Advisor Consumer Industries Fund ranked below its competitive median for 2004, and the total expenses of each of Class T and Institutional Class of the fund ranked above its competitive median for 2004.
The Board noted that the total expenses of each of Class A, Class B and Class C of Advisor Cyclical Industries Fund ranked below its competitive median for 2004, and the total expenses of each of Class T and Institutional Class of the fund ranked above its competitive median for 2004.
The Board noted that the total expenses of each of Class A, Class B and Class C of Advisor Developing Communications Fund ranked below its competitive median for 2004, and the total expenses of each of Class T and Institutional Class of the fund ranked above its competitive median for 2004.
The Board noted that the total expenses of each of Class A, Class B and Class C of Advisor Electronics Fund ranked below its competitive median for 2004, and the total expenses of each of Class T and Institutional Class of the fund ranked above its competitive median for 2004.
The Board noted that the total expenses of each class of Advisor Financial Services Fund ranked below its competitive median for 2004. The Board noted that the total expenses of each class of Advisor Health Care Fund ranked below its competitive median for 2004. The Board noted that the total expenses of each class of Advisor Natural Resources Fund ranked below its competitive median for 2004.
The Board noted that the total expenses of each of Class A, Class B, Class C and Institutional Class of Advisor Technology Fund ranked below its competitive median for 2004, and the total expenses of Class T of the fund ranked above its competitive median for 2004.
The Board noted that the total expenses of each class of Advisor Telecommunications & Utilities Growth Fund ranked above its competitive median for 2004.
In its review of total expenses, the Board also considered Fidelity fee structures and other information on clients that FMR and its affiliates service in other competitive markets, such as other mutual funds advised or subadvised by FMR or its affiliates, pension plan clients, and other institutional clients.
Based on its review, the Board concluded that the total expenses for each class of each fund were reasonable, although in some cases above the median of the universe presented for comparison, in light of the services that the fund and its shareholders receive and the other factors considered.
Costs of the Services and Profitability. The Board considered the revenues earned and the expenses incurred by Fidelity in conducting the business of developing, marketing, distributing, managing, administering and servicing each fund and its shareholders. The Board also considered the level of Fidelity’s profits in respect of all the Fidelity funds.
On an annual basis, FMR presents to the Board Fidelity’s profitability for each fund. Fidelity calculates the profitability for each fund, as well as aggregate profitability for groups of Fidelity funds and all Fidelity funds, using a series of detailed revenue and cost allocation methodologies which originate with the audited books and records of Fidelity. The Audit Committee of the Board reviews any significant changes from the prior year’s methodologies.
PricewaterhouseCoopers LLP (PwC), independent registered accounting firm and auditor to Fidelity and certain Fidelity funds, has been engaged annually by the Board as part of the Board’s assessment of the results of Fidelity’s profitability analysis. PwC’s engagement includes the review and assessment of Fidelity’s methodologies used in determining the revenues and expenses attributable to Fidelity’s mutual fund business, and completion of agreed-upon procedures surrounding the mathematical accuracy of fund profitability and its conformity to allocation methodologies. After considering PwC’s reports issued under the engagement and information provided by Fidelity, the Board believes that while other allocation methods may also be reasonable, Fidelity’s profitability methodologies are reasonable in all material respects.
The Board has also reviewed Fidelity’s non-fund businesses and any fall-out benefits related to the mutual fund business as well as cases where Fidelity’s affiliates may benefit from or be related to the funds’ business. In addition, a special committee of the Board reviewed services provided to Fidelity by its affiliates and determined that the fees that Fidelity paid for such services were reasonable.
The Board considered the costs of the services provided by and the profits realized by Fidelity in connection with the operation of each fund and determined that the amount of profit is a fair entrepreneurial profit for the management of each fund.
Economies of Scale. The Board considered whether there have been economies of scale in respect of the management of the Fidelity funds, whether the Fidelity funds (including each fund) have appropriately benefited from any such economies of scale, and whether there is potential for realization of any further economies of scale. The Board considered the extent to which each fund will benefit from economies of scale through increased services to the fund, through waivers or reimbursements, or through fee or expense reductions, including reductions that occur through operation of the transfer agent agreement. The transfer agent fee varies in part based on the number of accounts in each fund. If the number of accounts decreases or the average account size increases, the overall transfer agent fee rate decreases.
The Board recognized that each fund’s management contract incorporates a “group fee” structure, which provides for lower fee rates as total fund assets under FMR’s management increase, and for higher fee rates as total fund assets under FMR’s management decrease. The Board considered that the group fee is designed to deliver the benefits of economies of scale to fund shareholders when total fund assets increase, even if assets of any particular fund are unchanged or have declined, because some portion of Fidelity’s costs are attributable to services provided to all Fidelity funds, and all funds benefit if those costs can be allocated among more assets. The Board concluded that, given the group fee structure, fund shareholders will achieve a certain level of economies of scale as assets under FMR’s management increase at the fund complex level, regardless of whether Fidelity achieves any such economies of scale.
The Board further concluded that any potential economies of scale are being shared between fund shareholders and Fidelity in an appropriate manner.
Additional Information Requested by the Board. In order to develop fully the factual basis for consideration of the Advisory Contracts, the Board requested additional information regarding (i) equity fund transfer agency fees; (ii) Fidelity’s fund profitability methodology and the impact of various changes in the methodology over time; (iii) benefits to shareholders from economies of scale; (iv) composition and characteristics of various fund and industry data used in comparisons; and (v) compensation of portfolio managers and research analysts.
Based on its evaluation of all of the conclusions noted above, and after considering all material factors, the Board ultimately concluded that the existing advisory fee structures are fair and reasonable, and that each fund’s existing Advisory Contracts should be renewed.
Fidelity Management & Research Company Boston, MA
FMR Co., Inc.
Fidelity Management & Research (U.K.) Inc. Fidelity Management & Research (Far East) Inc. Fidelity Investments Japan Limited Fidelity International Investment Advisors
Fidelity International Investment Advisors (U.K.) Limited
Fidelity Distributors Corporation Boston, MA
Transfer and Service Agents
Fidelity Investments Institutional Operations Company, Inc. Boston, MA
Fidelity Service Company, Inc. Boston, MA
Custodians
JPMorgan Chase Bank
New York, NY
|
Brown Brothers Harriman & Co.† Boston, MA
State Street Bank and Trust††
Quincy, MA
|
†
Custodian for Fidelity Advisor Natural Resources Fund only.
†† Custodian for Fidelity Advisor Biotechnology Fund, Fidelity Advisor Developing
Communications Fund, and Fidelity Advisor Electronics Fund only.
|
AFOCI-UANNPRO-0905
1.789242.102

| | Fidelity® Advisor
Real Estate
Fund - Class A, Class T, Class B
and Class C
|
| | Annual Report
July 31, 2005
|

| Chairman’s Message | | 4 | | Ned Johnson’s message to shareholders. |
| |
| Performance | | 5 | | How the fund has done over time. |
| |
| Management’s Discussion | | 7 | | The manager’s review of fund |
| | | | | performance, strategy and outlook |
| |
| Shareholder Expense | | 8 | | An example of shareholder expenses. |
| Example | | | | |
| |
| Investment Changes | | 10 | | A summary of major shifts in the fund’s |
| | | | | investments over the past six months. |
| |
| Investments | | 11 | | A complete list of the fund’s investments |
| | | | | with their market values. |
| |
| Financial Statements | | 14 | | Statements of assets and liabilities, |
| | | | | operations, and changes in net assets, |
| | | | | as well as financial highlights. |
| |
| Notes | | 23 | | Notes to financial statements. |
| |
| Report of Independent | | 31 | | |
| Registered Public | | | | |
| Accounting Firm | | | | |
| |
| Trustees and Officers | | 32 | | |
| |
| Distributions | | 42 | | |
| |
| Board Approval of | | 43 | | |
| Investment Advisory | | | | |
| Contracts and | | | | |
| Management Fees | | | | |
To view a fund’s proxy voting guidelines and proxy voting record for the 12-month period ended June 30, visit www.fidelity.com/proxyvotingresults or visit the Securities and Exchange Commission’s (SEC) web site at www.sec.gov. You may also call 1-877-208-0098 to request a free copy of the proxy voting guidelines.
Standard & Poor’s, S&P and S&P 500 are registered service marks of The McGraw-Hill Companies, Inc. and have been licensed for use by Fidelity Distributors Corporation.
Other third party marks appearing herein are the property of their respective owners. All other marks appearing herein are registered or unregistered trademarks or service marks of FMR Corp. or an affiliated company.
Annual Report 2
This report and the financial statements contained herein are submitted for the general information of the shareholders of the fund. This report is not authorized for distribution to prospective investors in the fund unless preceded or accompanied by an effective prospectus.
A fund files its complete schedule of portfolio holdings with the SEC for the first and third quarters of each fiscal year on Form N-Q. Forms N-Q are available on the SEC’s web site at http://www.sec.gov. A fund’s Forms N-Q may be reviewed and copied at the SEC’s Public Reference Room in Washington, DC. Information regarding the operation of the SEC’s Public Reference Room may be obtained by calling 1-800-SEC-0330. For a complete list of a fund’s portfolio holdings, view the most recent quarterly holdings report, semiannual report, or annual report on Fidelity’s web site at http://www.advisor.fidelity.com.
NOT FDIC INSURED · MAY LOSE VALUE · NO BANK GUARANTEE
Neither the fund nor Fidelity Distributors Corporation is a bank.
3 Annual Report
Chairman’s Message
(Photograph of Edward C. Johnson 3d.)
Dear Shareholder:
During the past year or so, much has been reported about the mutual fund industry, and much of it has been more critical than I believe is warranted. Allegations that some companies have been less than forthright with their shareholders have cast a shadow on the entire industry. I continue to find these reports disturbing, and assert that they do not create an accurate picture of the industry overall. Therefore, I would like to remind everyone where Fidelity stands on these issues. I will say two things specifically regarding allegations that some mutual fund companies were in violation of the Securities and Exchange Commission’s forward pricing rules or were involved in so-called “market timing” activities.
First, Fidelity has no agreements that permit customers who buy fund shares after 4 p.m. to obtain the 4 p.m. price. This is not a new policy. This is not to say that some-one could not deceive the company through fraudulent acts. However, we are extremely diligent in preventing fraud from occurring in this manner — and in every other. But I underscore again that Fidelity has no so-called “agreements” that sanction illegal practices.
Second, Fidelity continues to stand on record, as we have for years, in opposition to predatory short-term trading that adversely affects shareholders in a mutual fund. Back in the 1980s, we initiated a fee— which is returned to the fund and, therefore, to investors — to discourage this activity. Further, we took the lead several years ago in developing a Fair Value Pricing Policy to prevent market timing on foreign securities in our funds. I am confident we will find other ways to make it more difficult for predatory traders to operate. However, this will only be achieved through close cooperation among regulators, legislators and the industry.
Yes, there have been unfortunate instances of unethical and illegal activity within the mutual fund industry from time to time. That is true of any industry. When this occurs, confessed or convicted offenders should be dealt with appropriately. But we are still concerned about the risk of over-regulation and the quick application of simplistic solutions to intricate problems. Every system can be improved, and we support and applaud well thought out improvements by regulators, legislators and industry representatives that achieve the common goal of building and protecting the value of investors’ holdings.
For nearly 60 years, Fidelity has worked very hard to improve its products and service to justify your trust. When our family founded this company in 1946, we had only a few hundred customers. Today, we serve more than 18 million customers including individual investors and participants in retirement plans across America.
Let me close by saying that we do not take your trust in us for granted, and we realize that we must always work to improve all aspects of our service to you. In turn, we urge you to continue your active participation with your financial matters, so that your interests can be well served.

Edward C. Johnson 3d
Fidelity Advisor Real Estate Fund - Class A, T, B, and C
Performance: The Bottom Line
Average annual total return reflects the change in the value of an investment, assuming reinvestment of the class’ dividend income and capital gains (the profits earned upon the sale of securities that have grown in value) and assuming a constant rate of performance each year. The $10,000 table and the fund’s returns do not reflect the deduction of taxes that a shareholder would pay on fund distributions or the redemption of fund shares. During periods of reimbursement by Fidelity, a fund’s total return will be greater than it would be had the reimbursement not occurred. How a fund did yesterday is no guarantee of how it will do tomorrow.
| Average Annual Total Returns | | | | |
| Periods ended July 31, 2005 | | Past 1 | | Life of |
| | | year | | FundA |
| Class A (incl. 5.75% sales charge) | | 37.11% | | 25.00% |
| Class T (incl. 3.50% sales charge) | | 40.04% | | 25.67% |
| Class B (incl. contingent deferred sales charge)B | | 39.31% | | 25.94% |
| Class C (incl. contingent deferred sales charge)C | | 43.38% | | 26.64% |
A From September 12, 2002.
B Class B shares’ contingent deferred sales charges included in the past one year and life of fund total
|
return figures are 5% and 4%, respectively.
|
C Class C shares’ contingent deferred sales charge included in the past one year and life of fund total return figures are 1% and 0%, respectively.
| | $10,000 Over Life of Fund
|
Let’s say hypothetically that $10,000 was invested in Fidelity® Advisor Real Estate Fund — Class T on September 12, 2002, when the fund started, and the current 3.50% sales charge was paid. The chart shows how the value of your investment would have changed, and also shows how the Standard & Poor’s 500SM Index (S&P 500®) performed over the same period.
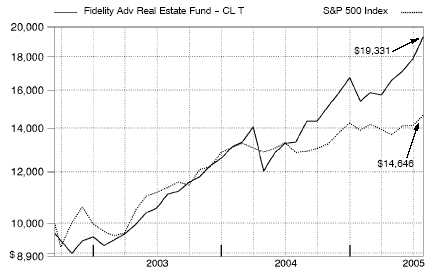
Note: Class T performance is shown above. Class A, Class B, and Class C returns may vary due to the difference in sales charges paid by each class or expenses borne by a particular class. Please see prospectus for added detail regarding class-level expenses.
Management’s Discussion of Fund Performance
Comments from Sam Wald, Portfolio Manager of Fidelity® Advisor Real Estate Fund
A late-inning rally on Wall Street helped push some key U.S. equity indexes to four-year highs by the conclusion of the 12-month period ending July 31, 2005. Spurred on by bullish economic data and strong corporate earnings, investors enjoyed a stellar month of July, capping off a turbulent 12-month period for U.S. equity markets. Stock prices bounced up and down during most of the year, moving in cadence with gyrations in the price of crude oil and investors’ gathering and ebbing concerns about inflation. The Federal Reserve Board raised short-term interest rates eight times during the period, also affecting overall market sentiment. Despite their fluctuations, the major equity indexes finished on a high note, with the Standard & Poor’s 500SM Index and the NASDAQ Composite® Index posting gains of 14.05% and 16.51%, respectively, for the period. The small-cap Russell 2000® Index rose 24.78% and the Russell Midcap® Index jumped 28.93%, while the blue-chips’ Dow Jones Industrial AverageSM advanced only 7.29% .
For the 12 months ending July 31, 2005, the fund’s Class A, Class T, Class B and Class C shares gained 45.48%, 45.12%, 44.31% and 44.38%, respectively. By comparison, the Dow Jones Wilshire Real Estate Securities IndexSM returned 43.72% and the LipperSM Real Estate Funds Average returned 39.86% . The fund also beat the S&P 500®. Continued low interest rates, employment growth and substantial flows into the asset class boosted real estate investment trust (REIT) values in absolute terms as well as relative to the broad stock market. The fund’s outperformance of the Dow Jones Wilshire index stemmed much more from positive stock selection than from favorable sector weightings. In the mall sector, the fund was helped by Rouse and General Growth Properties, which acquired the former for a premium. General Growth gained as investors concluded that the company’s growth potential warranted a higher valuation. On the negative side, office REIT Reckson Associates Realty underperformed in part because of multiple equity offerings to finance acquisition opportunities that have yet to prove their value. Another underperformer was Duke Realty, an office and industrial REIT that was hurt by the lack of sufficient income-producing assets on its balance sheet.
The views expressed in this statement reflect those of the portfolio manager only through the end of the period of the report as stated on the cover and do not necessarily represent the views of Fidelity or any other person in the Fidelity organization. Any such views are subject to change at any time based upon market or other conditions and Fidelity disclaims any responsibility to update such views. These views may not be relied on as investment advice and, because investment decisions for a Fidelity fund are based on numerous factors, may not be relied on as an indication of trading intent on behalf of any Fidelity fund.
7 Annual Report
7
Shareholder Expense Example
As a shareholder of the Fund, you incur two types of costs: (1) transaction costs, including sales charges (loads) on purchase payments or redemption proceeds, and (2) ongoing costs, including management fees, distribution and/or service (12b-1) fees and other Fund expenses. This Example is intended to help you understand your ongoing costs (in dollars) of investing in the Fund and to compare these costs with the ongoing costs of investing in other mutual funds.
The Example is based on an investment of $1,000 invested at the beginning of the period and held for the entire period (February 1, 2005 to July 31, 2005).
The first line of the table below for each class of the Fund provides information about actual account values and actual expenses. You may use the information in this line, together with the amount you invested, to estimate the expenses that you paid over the period. Simply divide your account value by $1,000.00 (for example, an $8,600 account value divided by $1,000.00 = 8.6), then multiply the result by the number in the first line for a class of the Fund under the heading entitled “Expenses Paid During Period” to estimate the expenses you paid on your account during this period.
Hypothetical Example for Comparison Purposes
The second line of the table below for each class of the Fund provides information about hypothetical account values and hypothetical expenses based on a Class’ actual expense ratio and an assumed rate of return of 5% per year before expenses, which is not the Class’ actual return. The hypothetical account values and expenses may not be used to estimate the actual ending account balance or expenses you paid for the period. You may use this information to compare the ongoing costs of investing in the Fund and other funds. To do so, compare this 5% hypothetical example with the 5% hypothetical examples that appear in the shareholder reports of the other funds.
Please note that the expenses shown in the table are meant to highlight your ongoing costs only and do not reflect any transaction costs. Therefore, the second line of the table is useful in comparing ongoing costs only, and will not help you determine the relative total costs of owning different funds. In addition, if these transactional costs were included, your costs would have been higher.
| | | | | | | | | | | | | Expenses Paid |
| | | | | Beginning | | | | Ending | | | | During Period* |
| | | | | Account Value | | | | Account Value | | | | February 1, 2005 |
| | | | | February 1, 2005 | | | | July 31, 2005 | | | | to July 31, 2005 |
| Class A | | | | | | | | | | | | |
| Actual | | $ | | 1,000.00 | | $ | | 1,257.30 | | $ | | 7.00 |
| HypotheticalA | | $ | | 1,000.00 | | $ | | 1,018.60 | | $ | | 6.26 |
| Class T | | | | | | | | | | | | |
| Actual | | $ | | 1,000.00 | | $ | | 1,255.70 | | $ | | 8.39 |
| HypotheticalA | | $ | | 1,000.00 | | $ | | 1,017.36 | | $ | | 7.50 |
| Class B | | | | | | | | | | | | |
| Actual | | $ | | 1,000.00 | | $ | | 1,252.90 | | $ | | 11.17 |
| HypotheticalA | | $ | | 1,000.00 | | $ | | 1,014.88 | | $ | | 9.99 |
Annual Report 8
| | | | | | | | | | | | | Expenses Paid |
| | | | | Beginning | | | | Ending | | | | During Period* |
| | | | | Account Value | | | | Account Value | | | | February 1, 2005 |
| | | | | February 1, 2005 | | | | July 31, 2005 | | | | to July 31, 2005 |
| Class C | | | | | | | | | | | | |
| Actual | | $ | | 1,000.00 | | $ | | 1,252.70 | | $ | | 11.17 |
| HypotheticalA | | $ | | 1,000.00 | | $ | | 1,014.88 | | $ | | 9.99 |
| Institutional Class | | | | | | | | | | | | |
| Actual | | $ | | 1,000.00 | | $ | | 1,260.20 | | $ | | 4.88 |
| HypotheticalA | | $ | | 1,000.00 | | $ | | 1,020.48 | | $ | | 4.36 |
A 5% return per year before expenses
* Expenses are equal to each Class’ annualized expense ratio (shown in the table
|
below); multiplied by the average account value over the period, multiplied by 181/365 (to reflect the one-half year period).
| | | Annualized |
| | | Expense Ratio |
| Class A | | 1.25% |
| Class T | | 1.50% |
| Class B | | 2.00% |
| Class C | | 2.00% |
| Institutional Class | | 87% |
9 Annual Report
Investment Changes
| Top Ten Stocks as of July 31, 2005 | | | | |
| | | % of fund’s | | % of fund’s net assets |
| | | net assets | | 6 months ago |
| Equity Residential (SBI) | | 6.3 | | 5.8 |
| Simon Property Group, Inc. | | 6.2 | | 6.7 |
| Equity Office Properties Trust | | 6.2 | | 5.2 |
| General Growth Properties, Inc. | | 5.9 | | 4.9 |
| Vornado Realty Trust | | 5.5 | | 5.5 |
| ProLogis | | 5.2 | | 5.4 |
| Starwood Hotels & Resorts Worldwide, Inc. unit | | 4.9 | | 4.6 |
| Boston Properties, Inc. | | 4.6 | | 4.2 |
| United Dominion Realty Trust, Inc. (SBI) | | 4.0 | | 3.2 |
| Reckson Associates Realty Corp. | | 3.8 | | 4.2 |
| | | 52.6 | | |
| Top Five REIT Sectors as of July 31, 2005 | | | | |
| | | % of fund’s | | % of fund’s net assets |
| | | net assets | | 6 months ago |
| REITs – Office Buildings | | 24.7 | | 23.0 |
| REITs – Industrial Buildings | | 15.0 | | 16.8 |
| REITs – Apartments | | 14.6 | | 13.5 |
| REITs – Malls | | 14.1 | | 12.8 |
| REITs – Shopping Centers | | 13.1 | | 15.6 |
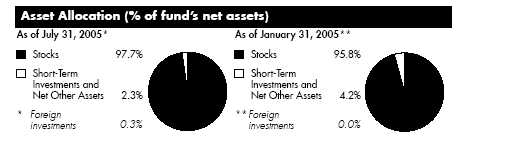
Annual Report 10
Investments July 31, 2005
Showing Percentage of Net Assets
|
| Common Stocks — 97.7% | | | | | | |
| | | Shares | | Value (Note 1) |
| |
| CAPITAL MARKETS – 0.3% | | | | | | |
| |
| Investment Banking & Brokerage – 0.3% | | | | | | |
| Eurocastle Investment Ltd. | | 20,900 | | $ | | 476,416 |
| |
| HOTELS, RESTAURANTS & LEISURE – 5.5% | | | | | | |
| |
| Hotels, Resorts & Cruise Lines – 5.5% | | | | | | |
| Hilton Hotels Corp. | | 44,700 | | | | 1,106,325 |
| Starwood Hotels & Resorts Worldwide, Inc. unit | | 137,410 | | | | 8,700,801 |
| |
| TOTAL HOTELS, RESORTS & CRUISE LINES | | | | | | 9,807,126 |
| |
| REAL ESTATE – 91.9% | | | | | | |
| |
| Real Estate Management & Development – 0.1% | | | | | | |
| CB Richard Ellis Group, Inc. Class A (a) | | 4,000 | | | | 184,160 |
| |
| REITs – Apartments – 14.6% | | | | | | |
| American Campus Communities, Inc. | | 34,700 | | | | 869,235 |
| AvalonBay Communities, Inc. | | 48,800 | | | | 4,272,928 |
| Equity Residential (SBI) | | 280,300 | | | | 11,324,119 |
| GMH Communities Trust | | 80,698 | | | | 1,209,663 |
| Pennsylvania Real Estate Investment Trust (SBI) | | 28,300 | | | | 1,384,153 |
| United Dominion Realty Trust, Inc. (SBI) | | 282,800 | | | | 7,197,260 |
| |
| TOTAL REITS – APARTMENTS | | | | | | 26,257,358 |
| |
| REITs – Factory Outlets – 1.1% | | | | | | |
| Tanger Factory Outlet Centers, Inc. | | 70,100 | | | | 2,018,880 |
| |
| REITs – Health Care Facilities – 1.2% | | | | | | |
| National Health Investors, Inc. | | 13,500 | | | | 415,395 |
| Omega Healthcare Investors, Inc. | | 24,400 | | | | 340,380 |
| Ventas, Inc. | | 43,500 | | | | 1,404,615 |
| |
| TOTAL REITS – HEALTH CARE FACILITIES | | | | | | 2,160,390 |
| |
| REITs – Hotels – 3.9% | | | | | | |
| Host Marriott Corp. | | 89,000 | | | | 1,659,850 |
| Innkeepers USA Trust (SBI) | | 203,300 | | | | 3,124,721 |
| MeriStar Hospitality Corp. (a) | | 232,480 | | | | 2,073,722 |
| Sunstone Hotel Investors, Inc. | | 6,800 | | | | 175,848 |
| |
| TOTAL REITS – HOTELS | | | | | | 7,034,141 |
See accompanying notes which are an integral part of the financial statements.
11 Annual Report
| Common Stocks – continued | | | | |
| | | Shares | | Value (Note 1) |
| |
| REAL ESTATE – CONTINUED | | | | |
| |
| REITs – Industrial Buildings – 15.0% | | | | |
| Catellus Development Corp. | | 95,605 | | $ 3,447,516 |
| CenterPoint Properties Trust (SBI) | | 77,000 | | 3,377,220 |
| Duke Realty Corp. | | 164,510 | | 5,586,760 |
| ProLogis | | 205,790 | | 9,375,792 |
| Public Storage, Inc. | | 69,100 | | 4,612,425 |
| U-Store-It Trust | | 21,900 | | 441,285 |
| |
| TOTAL REITS – INDUSTRIAL BUILDINGS | | | | 26,840,998 |
| |
| REITs – Malls – 14.1% | | | | |
| CBL & Associates Properties, Inc. | | 41,260 | | 1,893,009 |
| General Growth Properties, Inc. | | 231,699 | | 10,653,520 |
| Simon Property Group, Inc. | | 140,400 | | 11,195,496 |
| Taubman Centers, Inc. | | 45,600 | | 1,620,624 |
| |
| TOTAL REITS – MALLS | | | | 25,362,649 |
| |
| REITs – Management/Investment – 2.5% | | | | |
| Capital Automotive (REIT) (SBI) | | 15,000 | | 589,050 |
| Equity Lifestyle Properties, Inc. | | 48,300 | | 2,128,581 |
| Global Signal, Inc. | | 4,100 | | 175,890 |
| Plum Creek Timber Co., Inc. | | 27,800 | | 1,052,230 |
| Trustreet Properties, Inc. | | 30,900 | | 541,986 |
| |
| TOTAL REITS – MANAGEMENT/INVESTMENT | | | | 4,487,737 |
| |
| REITs – Mobile Home Parks – 0.1% | | | | |
| Sun Communities, Inc. | | 6,900 | | 240,465 |
| |
| REITs – Mortgage – 0.4% | | | | |
| Newcastle Investment Corp. | | 20,330 | | 628,197 |
| |
| REITs – Office Buildings – 24.7% | | | | |
| Boston Properties, Inc. | | 108,900 | | 8,292,735 |
| CarrAmerica Realty Corp. | | 68,200 | | 2,648,888 |
| Columbia Equity Trust, Inc. | | 77,900 | | 1,213,682 |
| Equity Office Properties Trust | | 313,700 | | 11,120,665 |
| Highwoods Properties, Inc. (SBI) | | 74,700 | | 2,364,255 |
| Kilroy Realty Corp. | | 25,900 | | 1,349,390 |
| Reckson Associates Realty Corp. | | 192,670 | | 6,766,570 |
| Shurgard Storage Centers, Inc. Class A | | 17,800 | | 834,820 |
See accompanying notes which are an integral part of the financial statements.
| Common Stocks – continued | | | | |
| | | Shares | | Value (Note 1) |
| REAL ESTATE – CONTINUED | | | | |
| REITs – Office Buildings – continued | | | | |
| SL Green Realty Corp. | | 58,200 | | $ 4,056,540 |
| Trizec Properties, Inc. | | 255,000 | | 5,602,350 |
| TOTAL REITS – OFFICE BUILDINGS | | | | 44,249,895 |
| |
| REITs – Prisons – 1.1% | | | | |
| Correctional Properties Trust | | 65,490 | | 1,973,869 |
| REITs – Shopping Centers – 13.1% | | | | |
| Federal Realty Investment Trust (SBI) | | 25,960 | | 1,695,448 |
| Inland Real Estate Corp. | | 62,300 | | 1,033,557 |
| Kimco Realty Corp. | | 102,700 | | 6,743,282 |
| Pan Pacific Retail Properties, Inc. | | 59,090 | | 4,107,346 |
| Vornado Realty Trust | | 110,950 | | 9,834,608 |
| TOTAL REITS – SHOPPING CENTERS | | | | 23,414,241 |
| |
| TOTAL REAL ESTATE | | | | 164,852,980 |
| TOTAL COMMON STOCKS | | | | |
| (Cost $131,614,109) | | | | 175,136,522 |
| Money Market Funds — 2.6% | | | | |
| Fidelity Cash Central Fund, 3.31% (b) | | | | |
| (Cost $4,734,898) | | 4,734,898 | | 4,734,898 |
| TOTAL INVESTMENT PORTFOLIO – 100.3% | | | | |
| (Cost $136,349,007) | | | | 179,871,420 |
| |
| NET OTHER ASSETS – (0.3)% | | | | (549,436) |
| NET ASSETS – 100% | | $ | | 179,321,984 |
| Legend | | (b) | | Affiliated fund that is available only to |
| (a) Non-income producing | | | | investment companies and other |
| | | | | accounts managed by Fidelity |
| | | | | Investments. The rate quoted is the |
| | | | | annualized seven-day yield of the fund |
| | | | | at period end. A complete listing of the |
| | | | | fund’s holdings as of its most recent |
| | | | | quarter end is available upon request. |
See accompanying notes which are an integral part of the financial statements.
13 Annual Report
Financial Statements
| Statement of Assets and Liabilities | | | | | | | | |
| | | | | | | | | July 31, 2005 |
| Assets | | | | | | | | |
| Investment in securities, at value (cost $136,349,007) — | | | | | | | | |
| See accompanying schedule | | | | | | $ | | 179,871,420 |
| Receivable for investments sold | | | | | | | | 1,069,185 |
| Receivable for fund shares sold | | | | | | | | 822,737 |
| Dividends receivable | | | | | | | | 127,273 |
| Interest receivable | | | | | | | | 12,060 |
| Prepaid expenses | | | | | | | | 143 |
| Receivable from investment adviser for expense | | | | | | | | |
| reductions | | | | | | | | 13,642 |
| Other affiliated receivables | | | | | | | | 3,270 |
| Other receivables | | | | | | | | 24,600 |
| Total assets | | | | | | | | 181,944,330 |
| |
| Liabilities | | | | | | | | |
| Payable for investments purchased | | $ | | 2,094,406 | | | | |
| Payable for fund shares redeemed | | | | 283,481 | | | | |
| Accrued management fee | | | | 80,622 | | | | |
| Distribution fees payable | | | | 80,539 | | | | |
| Other affiliated payables | | | | 50,818 | | | | |
| Other payables and accrued expenses | | | | 32,480 | | | | |
| Total liabilities | | | | | | | | 2,622,346 |
| |
| Net Assets | | | | | | $ | | 179,321,984 |
| Net Assets consist of: | | | | | | | | |
| Paid in capital | | | | | | $ | | 129,903,787 |
| Undistributed net investment income | | | | | | | | 377,371 |
| Accumulated undistributed net realized gain (loss) on | | | | | | | | |
| investments and foreign currency transactions | | | | | | | | 5,518,413 |
| Net unrealized appreciation (depreciation) on | | | | | | | | |
| investments | | | | | | | | 43,522,413 |
| Net Assets | | | | | | $ | | 179,321,984 |
See accompanying notes which are an integral part of the financial statements.
| Statement of Assets and Liabilities - continued | | | | |
| | | | | July 31, 2005 |
| Calculation of Maximum Offering Price | | | | |
| Class A: | | | | |
| Net Asset Value and redemption price per share | | | | |
| ($53,096,875 ÷ 2,912,290 shares) | | $ | | 18.23 |
| |
| Maximum offering price per share (100/94.25 of $18.23) | | $ | | 19.34 |
| Class T: | | | | |
| Net Asset Value and redemption price per share | | | | |
| ($66,303,247 ÷ 3,637,329 shares) | | $ | | 18.23 |
| |
| Maximum offering price per share (100/96.50 of $18.23) | | $ | | 18.89 |
| Class B: | | | | |
| Net Asset Value and offering price per share | | | | |
| ($26,349,432 ÷ 1,451,279 shares)A | | $ | | 18.16 |
| |
| Class C: | | | | |
| Net Asset Value and offering price per share | | | | |
| ($29,410,360 ÷ 1,618,296 shares)A | | $ | | 18.17 |
| |
| Institutional Class: | | | | |
| Net Asset Value, offering price and redemption price per | | | | |
| share ($4,162,070 ÷ 227,094 shares) | | $ | | 18.33 |
| |
| A Redemption price per share is equal to net asset value less any applicable contingent deferred sales charge. | | | | |
See accompanying notes which are an integral part of the financial statements.
15 Annual Report
|
Financial Statements - continued
|
| Statement of Operations | | | | | | |
| | | | | Year ended July 31, 2005 |
| Investment Income | | | | | | |
| Dividends | | | | $ | | 3,863,213 |
| Interest | | | | | | 108,804 |
| Security lending | | | | | | 1,239 |
| Total income | | | | | | 3,973,256 |
| |
| Expenses | | | | | | |
| Management fee | | $ | | 705,340 | | |
| Transfer agent fees | | | | 439,979 | | |
| Distribution fees | | | | 712,005 | | |
| Accounting and security lending fees | | | | 50,804 | | |
| Independent trustees’ compensation | | | | 583 | | |
| Custodian fees and expenses | | | | 8,402 | | |
| Registration fees | | | | 63,325 | | |
| Audit | | | | 61,410 | | |
| Legal | | | | 1,233 | | |
| Miscellaneous | | | | 2,985 | | |
| Total expenses before reductions | | | | 2,046,066 | | |
| Expense reductions | | | | (85,046) | | 1,961,020 |
| |
| Net investment income (loss) | | | | | | 2,012,236 |
| Realized and Unrealized Gain (Loss) | | | | | | |
| Net realized gain (loss) on: | | | | | | |
| Investment securities | | | | 8,231,640 | | |
| Foreign currency transactions | | | | 4,590 | | |
| Total net realized gain (loss) | | | | | | 8,236,230 |
| Change in net unrealized appreciation (depreciation) on | | | | | | |
| investment securities | | | | | | 35,843,402 |
| Net gain (loss) | | | | | | 44,079,632 |
| Net increase (decrease) in net assets resulting from | | | | | | |
| operations | | | | $ | | 46,091,868 |
See accompanying notes which are an integral part of the financial statements.
| Statement of Changes in Net Assets | | | | | | | | |
| | | | | Year ended | | | | Year ended |
| | | | | July 31, | | | | July 31, |
| | | | | 2005 | | | | 2004 |
| Increase (Decrease) in Net Assets | | | | | | | | |
| Operations | | | | | | | | |
| Net investment income (loss) | | $ | | 2,012,236 | | $ | | 954,921 |
| Net realized gain (loss) | | | | 8,236,230 | | | | 1,530,823 |
| Change in net unrealized appreciation (depreciation) . | | | | 35,843,402 | | | | 5,162,230 |
| Net increase (decrease) in net assets resulting | | | | | | | | |
| from operations | | | | 46,091,868 | | | | 7,647,974 |
| Distributions to shareholders from net investment income . | | | | (1,811,337) | | | | (926,122) |
| Distributions to shareholders from net realized gain | | | | (3,726,590) | | | | (347,381) |
| Total distributions | | | | (5,537,927) | | | | (1,273,503) |
| Share transactions -- net increase (decrease) | | | | 61,397,757 | | | | 46,608,300 |
| Total increase (decrease) in net assets | | | | 101,951,698 | | | | 52,982,771 |
| |
| Net Assets | | | | | | | | |
| Beginning of period | | | | 77,370,286 | | | | 24,387,515 |
| End of period (including undistributed net investment | | | | | | | | |
| income of $377,371 and undistributed net invest- | | | | | | | | |
| ment income of $97,635, respectively) | | $ | | 179,321,984 | | $ | | 77,370,286 |
See accompanying notes which are an integral part of the financial statements.
17 Annual Report
| Financial Highlights — Class A | | | | | | | | | | | | |
| Years ended July 31, | | | | 2005 | | | | 2004 | | | | 2003F |
| Selected Per-Share Data | | | | | | | | | | | | |
| Net asset value, beginning of period | | $ | | 13.22 | | $ | | 11.33 | | $ | | 10.00 |
| Income from Investment Operations | | | | | | | | | | | | |
| Net investment income (loss)E | | | | 31 | | | | .27 | | | | .21 |
| Net realized and unrealized gain (loss) | | | | 5.52 | | | | 2.03 | | | | 1.28 |
| Total from investment operations | | | | 5.83 | | | | 2.30 | | | | 1.49 |
| Distributions from net investment income | | | | (.29) | | | | (.30) | | | | (.16) |
| Distributions from net realized gain | | | | (.53) | | | | (.11) | | | | — |
| Total distributions | | | | (.82) | | | | (.41) | | | | (.16) |
| Net asset value, end of period | | $ | | 18.23 | | $ | | 13.22 | | $ | | 11.33 |
| Total ReturnB,C,D | | | | 45.48% | | | | 20.59% | | | | 15.13% |
| Ratios to Average Net AssetsG | | | | | | | | | | | | |
| Expenses before expense reductions | | | | 1.31% | | | | 1.54% | | | | 2.98%A |
| Expenses net of voluntary waivers, if any | | | | 1.28% | | | | 1.54% | | | | 1.75%A |
| Expenses net of all reductions | | | | 1.25% | | | | 1.52% | | | | 1.72%A |
| Net investment income (loss) | | | | 1.98% | | | | 2.10% | | | | 2.35%A |
| Supplemental Data | | | | | | | | | | | | |
| Net assets, end of period (000 omitted) | | $53,097 | | $22,273 | | $ | | 3,993 |
| Portfolio turnover rate | | | | 62% | | | | 52% | | | | 47%A |
A Annualized
B Total returns for periods of less than one year are not annualized.
C Total returns would have been lower had certain expenses not been reduced during the periods shown.
D Total returns do not include the effect of the sales charges.
E Calculated based on average shares outstanding during the period.
F For the period September 12, 2002 (commencement of operations) to July 31, 2003.
G Expense ratios reflect operating expenses of the class. Expenses before reductions do not reflect amounts reimbursed by the investment adviser or
reductions from brokerage service arrangements or other expense offset arrangements and do not represent the amount paid by the class during
periods when reimbursements or reductions occur. Expense ratios before reductions for start up periods may not be representative of longer term
operating periods. Expenses net of any voluntary waivers reflect expenses after reimbursement by the investment adviser but prior to reductions
from brokerage service arrangements or other expense offset arrangements. Expenses net of all reductions represent the net expenses paid by the
class.
|
See accompanying notes which are an integral part of the financial statements.
| Financial Highlights — Class T | | | | | | | | | | | | |
| Years ended July 31, | | | | 2005 | | | | 2004 | | | | 2003F |
| Selected Per-Share Data | | | | | | | | | | | | |
| Net asset value, beginning of period | | $ | | 13.21 | | $ | | 11.32 | | $ | | 10.00 |
| Income from Investment Operations | | | | | | | | | | | | |
| Net investment income (loss)E | | | | 26 | | | | .23 | | | | .18 |
| Net realized and unrealized gain (loss) | | | | 5.53 | | | | 2.02 | | | | 1.29 |
| Total from investment operations | | | | 5.79 | | | | 2.25 | | | | 1.47 |
| Distributions from net investment income | | | | (.24) | | | | (.25) | | | | (.15) |
| Distributions from net realized gain | | | | (.53) | | | | (.11) | | | | — |
| Total distributions | | | | (.77) | | | | (.36) | | | | (.15) |
| Net asset value, end of period | | $ | | 18.23 | | $ | | 13.21 | | $ | | 11.32 |
| Total ReturnB,C,D | | | | 45.12% | | | | 20.12% | | | | 14.91% |
| Ratios to Average Net AssetsG | | | | | | | | | | | | |
| Expenses before expense reductions | | | | 1.61% | | | | 1.86% | | | | 3.32%A |
| Expenses net of voluntary waivers, if any | | | | 1.57% | | | | 1.85% | | | | 2.00%A |
| Expenses net of all reductions | | | | 1.54% | | | | 1.83% | | | | 1.97%A |
| Net investment income (loss) | | | | 1.70% | | | | 1.80% | | | | 2.10%A |
| Supplemental Data | | | | | | | | | | | | |
| Net assets, end of period (000 omitted) | | $66,303 | | $26,037 | | $ | | 9,049 |
| Portfolio turnover rate | | | | 62% | | | | 52% | | | | 47%A |
A Annualized
B Total returns for periods of less than one year are not annualized.
C Total returns would have been lower had certain expenses not been reduced during the periods shown.
D Total returns do not include the effect of the sales charges.
E Calculated based on average shares outstanding during the period.
F For the period September 12, 2002 (commencement of operations) to July 31, 2003.
G Expense ratios reflect operating expenses of the class. Expenses before reductions do not reflect amounts reimbursed by the investment adviser or
reductions from brokerage service arrangements or other expense offset arrangements and do not represent the amount paid by the class during
periods when reimbursements or reductions occur. Expense ratios before reductions for start up periods may not be representative of longer term
operating periods. Expenses net of any voluntary waivers reflect expenses after reimbursement by the investment adviser but prior to reductions
from brokerage service arrangements or other expense offset arrangements. Expenses net of all reductions represent the net expenses paid by the
class.
|
See accompanying notes which are an integral part of the financial statements.
19 Annual Report
| Financial Highlights — Class B | | | | | | | | | | | | |
| Years ended July 31, | | | | 2005 | | | | 2004 | | | | 2003F |
| Selected Per-Share Data | | | | | | | | | | | | |
| Net asset value, beginning of period | | $ | | 13.18 | | $ | | 11.29 | | $ | | 10.00 |
| Income from Investment Operations | | | | | | | | | | | | |
| Net investment income (loss)E | | | | 18 | | | | .16 | | | | .14 |
| Net realized and unrealized gain (loss) | | | | 5.50 | | | | 2.04 | | | | 1.28 |
| Total from investment operations | | | | 5.68 | | | | 2.20 | | | | 1.42 |
| Distributions from net investment income | | | | (.17) | | | | (.20) | | | | (.13) |
| Distributions from net realized gain | | | | (.53) | | | | (.11) | | | | — |
| Total distributions | | | | (.70) | | | | (.31) | | | | (.13) |
| Net asset value, end of period | | $ | | 18.16 | | $ | | 13.18 | | $ | | 11.29 |
| Total ReturnB,C,D | | | | 44.31% | | | | 19.67% | | | | 14.38% |
| Ratios to Average Net AssetsG | | | | | | | | | | | | |
| Expenses before expense reductions | | | | 2.10% | | | | 2.33% | | | | 3.82%A |
| Expenses net of voluntary waivers, if any | | | | 2.07% | | | | 2.33% | | | | 2.50%A |
| Expenses net of all reductions | | | | 2.03% | | | | 2.31% | | | | 2.47%A |
| Net investment income (loss) | | | | 1.20% | | | | 1.31% | | | | 1.60%A |
| Supplemental Data | | | | | | | | | | | | |
| Net assets, end of period (000 omitted) | | $26,349 | | $12,910 | | $ | | 5,061 |
| Portfolio turnover rate | | | | 62% | | | | 52% | | | | 47%A |
A Annualized
B Total returns for periods of less than one year are not annualized.
C Total returns would have been lower had certain expenses not been reduced during the periods shown.
D Total returns do not include the effect of the contingent deferred sales charge.
E Calculated based on average shares outstanding during the period.
F For the period September 12, 2002 (commencement of operations) to July 31, 2003.
G Expense ratios reflect operating expenses of the class. Expenses before reductions do not reflect amounts reimbursed by the investment adviser or
reductions from brokerage service arrangements or other expense offset arrangements and do not represent the amount paid by the class during
periods when reimbursements or reductions occur. Expense ratios before reductions for start up periods may not be representative of longer term
operating periods. Expenses net of any voluntary waivers reflect expenses after reimbursement by the investment adviser but prior to reductions
from brokerage service arrangements or other expense offset arrangements. Expenses net of all reductions represent the net expenses paid by the
class.
|
See accompanying notes which are an integral part of the financial statements.
| Financial Highlights — Class C | | | | | | | | | | | | |
| Years ended July 31, | | | | 2005 | | | | 2004 | | | | 2003F |
| Selected Per-Share Data | | | | | | | | | | | | |
| Net asset value, beginning of period | | $ | | 13.18 | | $ | | 11.29 | | $ | | 10.00 |
| Income from Investment Operations | | | | | | | | | | | | |
| Net investment income (loss)E | | | | 19 | | | | .17 | | | | .14 |
| Net realized and unrealized gain (loss) | | | | 5.50 | | | | 2.03 | | | | 1.28 |
| Total from investment operations | | | | 5.69 | | | | 2.20 | | | | 1.42 |
| Distributions from net investment income | | | | (.17) | | | | (.20) | | | | (.13) |
| Distributions from net realized gain | | | | (.53) | | | | (.11) | | | | — |
| Total distributions | | | | (.70) | | | | (.31) | | | | (.13) |
| Net asset value, end of period | | $ | | 18.17 | | $ | | 13.18 | | $ | | 11.29 |
| Total ReturnB,C,D | | | | 44.38% | | | | 19.67% | | | | 14.38% |
| Ratios to Average Net AssetsG | | | | | | | | | | | | |
| Expenses before expense reductions | | | | 2.09% | | | | 2.29% | | | | 3.76%A |
| Expenses net of voluntary waivers, if any | | | | 2.05% | | | | 2.29% | | | | 2.50%A |
| Expenses net of all reductions | | | | 2.02% | | | | 2.27% | | | | 2.47%A |
| Net investment income (loss) | | | | 1.22% | | | | 1.35% | | | | 1.60%A |
| Supplemental Data | | | | | | | | | | | | |
| Net assets, end of period (000 omitted) | | $29,410 | | $13,671 | | $ | | 5,059 |
| Portfolio turnover rate | | | | 62% | | | | 52% | | | | 47%A |
A Annualized
B Total returns for periods of less than one year are not annualized.
C Total returns would have been lower had certain expenses not been reduced during the periods shown.
D Total returns do not include the effect of the contingent deferred sales charge.
E Calculated based on average shares outstanding during the period.
F For the period September 12, 2002 (commencement of operations) to July 31, 2003.
G Expense ratios reflect operating expenses of the class. Expenses before reductions do not reflect amounts reimbursed by the investment adviser or
reductions from brokerage service arrangements or other expense offset arrangements and do not represent the amount paid by the class during
periods when reimbursements or reductions occur. Expense ratios before reductions for start up periods may not be representative of longer term
operating periods. Expenses net of any voluntary waivers reflect expenses after reimbursement by the investment adviser but prior to reductions
from brokerage service arrangements or other expense offset arrangements. Expenses net of all reductions represent the net expenses paid by the
class.
|
See accompanying notes which are an integral part of the financial statements.
21 Annual Report
| Financial Highlights — Institutional Class | | | | | | | | | | |
| Years ended July 31, | | | | 2005 | | | | 2004 | | | | 2003E |
| Selected Per-Share Data | | | | | | | | | | | | |
| Net asset value, beginning of period | | $ | | 13.28 | | $ | | 11.35 | | $ | | 10.00 |
| Income from Investment Operations | | | | | | | | | | | | |
| Net investment income (loss)D | | | | 36 | | | | .32 | | | | .23 |
| Net realized and unrealized gain (loss) | | | | 5.56 | | | | 2.04 | | | | 1.28 |
| Total from investment operations | | | | 5.92 | | | | 2.36 | | | | 1.51 |
| Distributions from net investment income | | | | (.34) | | | | (.32) | | | | (.16) |
| Distributions from net realized gain | | | | (.53) | | | | (.11) | | | | — |
| Total distributions | | | | (.87) | | | | (.43) | | | | (.16) |
| Net asset value, end of period | | $ | | 18.33 | | $ | | 13.28 | | $ | | 11.35 |
| Total ReturnB,C | | | | 46.05% | | | | 21.11% | | | | 15.33% |
| Ratios to Average Net AssetsF | | | | | | | | | | | | |
| Expenses before expense reductions | | | | 91% | | | | 1.12% | | | | 2.68%A |
| Expenses net of voluntary waivers, if any | | | | 91% | | | | 1.12% | | | | 1.50%A |
| Expenses net of all reductions | | | | 88% | | | | 1.10% | | | | 1.47%A |
| Net investment income (loss) | | | | 2.35% | | | | 2.53% | | | | 2.60%A |
| Supplemental Data | | | | | | | | | | | | |
| Net assets, end of period (000 omitted) | | $ | | 4,162 | | $ | | 2,478 | | $ | | 1,225 |
| Portfolio turnover rate | | | | 62% | | | | 52% | | | | 47%A |
A Annualized
B Total returns for periods of less than one year are not annualized.
C Total returns would have been lower had certain expenses not been reduced during the periods shown.
D Calculated based on average shares outstanding during the period.
E For the period September 12, 2002 (commencement of operations) to July 31, 2003.
F Expense ratios reflect operating expenses of the class. Expenses before reductions do not reflect amounts reimbursed by the investment adviser or
reductions from brokerage service arrangements or other expense offset arrangements and do not represent the amount paid by the class during
periods when reimbursements or reductions occur. Expense ratios before reductions for start up periods may not be representative of longer term
operating periods. Expenses net of any voluntary waivers reflect expenses after reimbursement by the investment adviser but prior to reductions
from brokerage service arrangements or other expense offset arrangements. Expenses net of all reductions represent the net expenses paid by the
class.
|
See accompanying notes which are an integral part of the financial statements.
Notes to Financial Statements
For the period ended July 31, 2005
|
1. Significant Accounting Policies.
Fidelity Advisor Real Estate Fund (the fund) is a non-diversified fund of Fidelity Advisor Series VII (the trust) and is authorized to issue an unlimited number of shares. The trust is registered under the Investment Company Act of 1940, as amended (the 1940 Act), as an open-end management investment company organized as a Massachusetts business trust.
The fund offers Class A, Class T, Class B, Class C, and Institutional Class shares, each of which has equal rights as to assets and voting privileges. Each class has exclusive voting rights with respect to matters that affect that class. Class B shares will automatically convert to Class A shares after a holding period of seven years from the initial date of purchase. Investment income, realized and unrealized capital gains and losses, the common expenses of the fund, and certain fund-level expense reductions, if any, are allocated on a pro rata basis to each class based on the relative net assets of each class to the total net assets of the fund. Each class differs with respect to transfer agent and distribution and service plan fees incurred. Certain expense reductions also differ by class.
The financial statements have been prepared in conformity with accounting principles generally accepted in the United States of America, which require management to make certain estimates and assumptions at the date of the financial statements. The following summarizes the significant accounting policies of the fund:
Security Valuation. Net asset value per share (NAV calculation) is calculated as of the close of business of the New York Stock Exchange, normally 4:00 p.m. Eastern time. Equity securities, including restricted securities, for which market quotations are available are valued at the last sale price or official closing price (closing bid price or last evaluated quote if no sale has occurred) on the primary market or exchange on which they trade. If prices are not readily available or do not accurately reflect fair value for a security, or if a security’s value has been materially affected by events occurring after the close of the exchange or market on which the security is principally traded, that security may be valued by another method that the Board of Trustees believes accurately reflects fair value. A security’s valuation may differ depending on the method used for determining value. Price movements in futures contracts and ADRs, market and trading trends, the bid/ask quotes of brokers and off-exchange institutional trading may be reviewed in the course of making a good faith determination of a security’s fair value. Short-term securities with remaining maturities of sixty days or less for which quotations are not readily available are valued on the basis of amortized cost. Investments in open-end investment companies are valued at their net asset value each business day.
23 Annual Report
Notes to Financial Statements - continued
1. Significant Accounting Policies - continued
Foreign Currency. The fund uses foreign currency contracts to facilitate transactions in foreign-denominated securities. Losses from these transactions may arise from changes in the value of the foreign currency or if the counterparties do not perform under the contracts’ terms.
Foreign-denominated assets, including investment securities, and liabilities are translated into U.S. dollars at the exchange rate at period end. Purchases and sales of investment securities, income and dividends received and expenses denominated in foreign currencies are translated into U.S. dollars at the exchange rate in effect on the transaction date.
The effects of exchange rate fluctuations on investments are included with the net realized and unrealized gain (loss) on investment securities. Other foreign currency transactions resulting in realized and unrealized gain (loss) are disclosed separately.
Investment Transactions and Income. Security transactions are accounted for as of trade date. Gains and losses on securities sold are determined on the basis of identified cost. Dividend income is recorded on the ex-dividend date, except for certain dividends from foreign securities where the ex-dividend date may have passed, which are recorded as soon as the fund is informed of the ex-dividend date. Non-cash dividends included in dividend income, if any, are recorded at the fair market value of the securities received. Distributions received on securities that represent a return of capital or capital gain are recorded as a reduction of cost of investments and/or as a realized gain. The fund estimates the components of distributions received that may be considered return of capital distributions or capital gain distributions. Interest income is accrued as earned. Interest income includes coupon interest and amortization of premium and accretion of discount on debt securities. Investment income is recorded net of foreign taxes withheld where recovery of such taxes is uncertain.
Expenses. Most expenses of the trust can be directly attributed to a fund. Expenses which cannot be directly attributed are apportioned among each fund in the trust.
Income Tax Information and Distributions to Shareholders. Each year, the fund intends to qualify as a regulated investment company by distributing all of its taxable income and realized gains under Subchapter M of the Internal Revenue Code. As a result, no provision for income taxes is required in the accompanying financial statements. Foreign taxes are provided for based on the fund’s understanding of the tax rules and rates that exist in the foreign markets in which it invests.
Distributions are recorded on the ex-dividend date. Income dividends and capital gain distributions are declared separately for each class. Income and capital gain distributions are determined in accordance with income tax regulations, which may differ from generally accepted accounting principles. In addition, the fund will claim a portion of the
| 1. Significant Accounting Policies - continued |
| Income Tax Information and Distributions to Shareholders - continued |
payment made to redeeming shareholders as a distribution for income tax purposes. Capital accounts within the financial statements are adjusted for permanent book-tax differences. These adjustments have no impact on net assets or the results of operations. Temporary book-tax differences will reverse in a subsequent period.
Distributions are recorded on the ex-dividend date. Income dividends and capital gain distributions are declared separately for each class. Income and capital gain distributions are determined in accordance with income tax regulations, which may differ from generally accepted accounting principles. In addition, the fund will claim a portion of the payment made to redeeming shareholders as a distribution for income tax purposes. Capital accounts within the financial statements are adjusted for permanent book-tax differences. These adjustments have no impact on net assets or the results of operations. Temporary book-tax differences will reverse in a subsequent period.
Book-tax differences are primarily due to foreign currency transactions, passive foreign investment companies (PFIC), and losses deferred due to wash sales.
The tax-basis components of distributable earnings and the federal tax cost as of period end were as follows:
| Unrealized appreciation | | $ | | 43,307,627 |
| Unrealized depreciation | | | | (47,576) |
| Net unrealized appreciation (depreciation) | | | | 43,260,051 |
| Undistributed ordinary income | | | | 2,668,488 |
| Undistributed long-term capital gain | | | | 2,749,437 |
| |
| Cost for federal income tax purposes | | $ | | 136,611,369 |
| | The tax character of distributions paid was as follows:
|
| | | | | July 31, 2005 | | | | July 31, 2004 |
| Ordinary Income | | $ | | 2,778,359 | | $ | | 1,154,760 |
| Long-term Capital Gains | | | | 2,759,568 | | | | 118,743 |
| Total | | $ | | 5,537,927 | | $ | | 1,273,503 |
Repurchase Agreements. Fidelity Management & Research Company (FMR) has received an Exemptive Order from the Securities and Exchange Commission (the SEC) which permits the fund and other affiliated entities of FMR to transfer uninvested cash balances into joint trading accounts which are then invested in repurchase agreements. The fund may also invest directly with institutions in repurchase agreements. Repurchase agreements are collateralized by government or non-government securities.
25 Annual Report
Notes to Financial Statements - continued
2. Operating Policies - continued
Repurchase Agreements - continued
Collateral is held in segregated accounts with custodian banks and may be obtained in the event of a default of the counterparty. The fund monitors, on a daily basis, the value of the collateral to ensure it is at least equal to the principal amount of the repurchase agreement (including accrued interest). In the event of a default by the counterparty, realization of the collateral proceeds could be delayed, during which time the value of the collateral may decline.
3. Purchases and Sales of Investments.
Purchases and sales of securities, other than short-term securities and U.S. government securities, aggregated $131,539,751 and $73,634,784, respectively.
4. Fees and Other Transactions with Affiliates.
Management Fee. FMR and its affiliates provide the fund with investment management related services for which the fund pays a monthly management fee. The management fee is the sum of an individual fund fee rate that is based on an annual rate of .30% of the fund’s average net assets and a group fee rate that averaged .27% during the period. The group fee rate is based upon the average net assets of all the mutual funds advised by FMR. The group fee rate decreases as assets under management increase and increases as assets under management decrease. For the period, the total annual management fee rate was .57% of the fund’s average net assets.
Distribution and Service Plan. In accordance with Rule 12b-1 of the 1940 Act, the fund has adopted separate Distribution and Service Plans for each class of shares. Certain classes pay Fidelity Distributors Corporation (FDC), an affiliate of FMR, separate Distribution and Service Fees, each of which is based on an annual percentage of each class’ average net assets. In addition, FDC may pay financial intermediaries for selling shares of the fund and providing shareholder support services. For the period, the Distribution and Service Fee rates and the total amounts paid to and retained by FDC were as follows:
| | | Distribution | | Service | | | | Paid to | | | | Retained |
| | | Fee | | Fee | | | | FDC | | | | by FDC |
| |
| Class A | | 0% | | .25% | | $ | | 88,275 | | $ | | 2,464 |
| Class T | | 25% | | .25% | | | | 221,765 | | | | 6,329 |
| Class B | | 75% | | .25% | | | | 191,965 | | | | 148,021 |
| Class C | | 75% | | .25% | | | | 210,000 | | | | 85,023 |
| |
| | | | | | | $ | | 712,005 | | $ | | 241,837 |
4. Fees and Other Transactions with Affiliates - continued
Sales Load. FDC receives a front-end sales charge of up to 5.75% for selling Class A shares, and 3.50% for selling Class T shares, some of which is paid to financial intermediaries for selling shares of the fund. FDC receives the proceeds of contingent deferred sales charges levied on Class A, Class T, Class B, and Class C redemptions. These charges depend on the holding period. The deferred sales charges range from 5% to 1% for Class B, 1% for Class C, and .25% for certain purchases of Class A and Class T shares.
For the period, sales charge amounts retained by FDC were as follows:
| | | | | Retained |
| | | | | by FDC |
| Class A | | $ | | 96,660 |
| Class T | | | | 19,865 |
| Class B* | | | | 42,753 |
| Class C* | | | | 5,887 |
| | | $ | | 165,165 |
* When Class B and Class C shares are initially sold, FDC pays commissions from its own resources to financial intermediaries through which the sales are made.
Transfer Agent Fees. Fidelity Investments Institutional Operations Company, Inc. (FIIOC), an affiliate of FMR, is the transfer, dividend disbursing and shareholder servicing agent for each class of the fund. FIIOC receives account fees and asset-based fees that vary according to the account size and type of account of the shareholders of the respective classes of the fund. FIIOC pays for typesetting, printing and mailing of shareholder reports, except proxy statements. For the period the total transfer agent fees paid by each class to FIIOC, were as follows:
| | | | | | | % of |
| | | | | | | Average |
| | | | | Amount | | Net Assets |
| Class A | | $ | | 116,458 | | .33 |
| Class T | | | | 170,323 | | .38 |
| Class B | | | | 71,994 | | .38 |
| Class C | | | | 75,200 | | .36 |
| Institutional Class | | | | 6,004 | | .19 |
| |
| | | $ | | 439,979 | | |
Accounting and Security Lending Fees. Fidelity Service Company, Inc. (FSC), an affiliate of FMR, maintains the fund’s accounting records. The accounting fee is based on the level of average net assets for the month. Under a separate contract, FSC administers the security lending program. The security lending fee is based on the number and duration of lending transactions.
27 Annual Report
Notes to Financial Statements - continued
4. Fees and Other Transactions with Affiliates - continued
|
Central Funds. The fund may invest in affiliated Central Funds managed by Fidelity Investments Money Management, Inc. (FIMM), an affiliate of FMR. The Central Funds are open-end investment companies available only to investment companies and other accounts managed by FMR and its affiliates. The Money Market Central Funds seek preservation of capital and current income. The Central Funds do not pay a management fee. Income distributions earned by the fund are recorded as income in the accompanying financial statements and totaled $111,575 for the period.
Brokerage Commissions. The fund placed a portion of its portfolio transactions with brokerage firms which are affiliates of the investment adviser. The commissions paid to these affiliated firms were $7,360 for the period.
5. Committed Line of Credit.
|
The fund participates with other funds managed by FMR in a $4.2 billion credit facility (the “line of credit”) to be utilized for temporary or emergency purposes to fund shareholder redemptions or for other short-term liquidity purposes. The fund has agreed to pay commitment fees on its pro rata portion of the line of credit. During the period, there were no borrowings on this line of credit.
The fund lends portfolio securities from time to time in order to earn additional income. The fund receives collateral (in the form of U.S. Treasury obligations, letters of credit and/or cash) against the loaned securities and maintains collateral in an amount not less than 100% of the market value of the loaned securities during the period of the loan. The market value of the loaned securities is determined at the close of business of the fund and any additional required collateral is delivered to the fund on the next business day. If the borrower defaults on its obligation to return the securities loaned because of insolvency or other reasons, a fund could experience delays and costs in recovering the securities loaned or in gaining access to the collateral. At period end there were no security loans outstanding.
FMR voluntarily agreed to reimburse each class to the extent annual operating expenses exceeded certain levels of average net assets as noted in the table below. Some expenses, for example interest expense, are excluded from this reimbursement.
7. Expense Reductions - continued
The following classes were in reimbursement during the period:
|
| | | Expense | | | | Reimbursement |
| | | Limitations | | | | from adviser |
| Class A | | 1.50 | | -- | | 1.25%* | | $ | | 8,714 |
| Class T | | 1.75 | | -- | | 1.50%* | | | | 19,239 |
| Class B | | 2.25 | | -- | | 2.00%* | | | | 6,735 |
| Class C | | 2.25 | | -- | | 2.00%* | | | | 7,994 |
| Institutional Class | | 1.25 | | -- | | 1.00%* | | | | — |
| | | | | | | | | $ | | 42,682 |
| |
| * Expense limitation in effect at period end. | | | | | | | | | | |
Many of the brokers with whom FMR places trades on behalf of the fund provided services to the fund in addition to trade execution. These services included payments of certain expenses on behalf of the fund totaling $42,145 for the period. In addition, through arrangements with the fund’s custodian, credits realized as a result of uninvested cash balances were used to reduce the fund’s expenses. During the period, these credits reduced the fund’s custody expenses by $219.
The fund’s organizational documents provide former and current trustees and officers with a limited indemnification against liabilities arising in connection with the performance of their duties to the fund. In the normal course of business, the fund may also enter into contracts that provide general indemnifications. The fund’s maximum exposure under these arrangements is unknown as this would be dependent on future claims that may be made against the fund. The risk of material loss from such claims is considered remote.
9. Distributions to Shareholders.
|
Distributions to shareholders of each class were as follows:
| Years ended July 31, | | | | 2005 | | | | 2004 |
| From net investment income | | | | | | | | |
| Class A | | $ | | 641,230 | | $ | | 223,988 |
| Class T | | | | 658,084 | | | | 338,921 |
| Class B | | | | 211,083 | | | | 134,524 |
| Class C | | | | 231,206 | | | | 149,846 |
| Institutional Class | | | | 69,734 | | | | 78,843 |
| Total | | $ | | 1,811,337 | | $ | | 926,122 |
29 Annual Report
| Notes to Financial Statements - continued | | | | | | | | |
| |
| |
| 9. Distributions to Shareholders - continued | | | | | | |
| Years ended July 31, | | | | 2005 | | | | | | 2004 |
| From net realized gain | | | | | | | | | | | | |
| Class A | | $ | | 1,060,102 $ | | | | 60,915 |
| Class T | | | | 1,278,789 | | | | 134,733 |
| Class B | | | | 601,375 | | | | 65,143 |
| Class C | | | | 680,328 | | | | 72,033 |
| Institutional Class | | | | 105,996 | | | | | | 14,557 |
| Total | | $ | | 3,726,590 $ | | | | 347,381 |
| |
| |
| 10. Share Transactions. | | | | | | | | | | | | |
| |
| Transactions for each class of shares were as follows: | | | | | | | | |
| | | Shares | | | | | | Dollars |
| Years ended July 31, | | 2005 | | 2004 | | | | 2005 | | | | 2004 |
| Class A | | | | | | | | | | | | |
| Shares sold | | 1,794,039 | | 1,691,797 | | $ 27,861,174 | | $ 21,569,901 |
| Reinvestment of distributions | | 108,047 | | 21,187 | | 1,637,672 | | | | 260,814 |
| Shares redeemed | | (674,456) | | (380,797) | | (10,403,304) | | | | (4,789,141) |
| Net increase (decrease) | | 1,227,630 | | 1,332,187 | | $ 19,095,542 | | $ 17,041,574 |
| Class T | | | | | | | | | | | | |
| Shares sold | | 2,519,838 | | 1,742,381 | | $ 38,726,163 | | $ 21,601,367 |
| Reinvestment of distributions | | 120,472 | | 34,588 | | 1,827,521 | | | | 422,832 |
| Shares redeemed | | (973,349) | | (606,188) | | (14,990,709) | | | | (7,552,018) |
| Net increase (decrease) | | 1,666,961 | | 1,170,781 | | $ 25,562,975 | | $ 14,472,181 |
| Class B | | | | | | | | | | | | |
| Shares sold | | 716,470 | | 707,114 | | $ 10,968,432 | | $ | | 8,864,483 |
| Reinvestment of distributions | | 47,658 | | 14,020 | | | | 717,181 | | | | 172,618 |
| Shares redeemed | | (292,735) | | (189,581) | | (4,504,213) | | | | (2,352,682) |
| Net increase (decrease) | | 471,393 | | 531,553 | | $ 7,181,400 | | $ | | 6,684,419 |
| Class C | | | | | | | | | | | | |
| Shares sold | | 948,824 | | 935,005 | | $ 14,523,391 | | $ 11,727,832 |
| Reinvestment of distributions | | 54,204 | | 15,332 | | | | 815,331 | | | | 188,794 |
| Shares redeemed | | (421,720) | | (361,431) | | (6,415,506) | | | | (4,519,507) |
| Net increase (decrease) | | 581,308 | | 588,906 | | $ 8,923,216 | | $ | | 7,397,119 |
| Institutional Class | | | | | | | | | | | | |
| Shares sold | | 56,832 | | 476,197 | | $ | | 882,400 | | $ | | 6,021,426 |
| Reinvestment of distributions | | 10,199 | | 6,777 | | | | 154,843 | | | | 85,108 |
| Shares redeemed | | (26,530) | | (404,277) | | | | (402,619) | | | | (5,093,527) |
| Net increase (decrease) | | 40,501 | | 78,697 | | $ | | 634,624 | | $ | | 1,013,007 |
Report of Independent Registered Public Accounting Firm
To the Trustees of Fidelity Advisor Series VII and Shareholders of Fidelity Advi sor Real Estate Fund:
We have audited the accompanying statement of assets and liabilities of Fidelity Advisor Real Estate Fund (the Fund), a fund of Fidelity Advisor Series VII, including the portfolio of investments, as of July 31, 2005, and the related statement of operations for the year then ended, the statement of changes in net assets for each of the two years in the period then ended, and the financial highlights for the two years ended July 31, 2005 and July 31, 2004 and for the period from September 12, 2002 (commencement of operations) to July 31, 2003. These financial statements and financial highlights are the responsibility of the Fund’s management. Our responsibility is to express an opinion on these financial statements and financial highlights based on our audits.
We conducted our audits in accordance with standards of the Public Company Accounting Oversight Board (United States). Those standards require that we plan and perform the audit to obtain reasonable assurance about whether the financial statements and financial highlights are free of material misstatement. The Fund is not required to have, nor were we engaged to perform, an audit of its internal control over financial reporting. Our audits included consideration of internal control over financial reporting as a basis for designing audit procedures that are appropriate in the circumstances, but not for the purpose of expressing an opinion on the effectiveness of the Fund’s internal control over financial reporting. Accordingly, we express no such opinion. An audit also includes examining, on a test basis, evidence supporting the amounts and disclosures in the financial statements, assessing the accounting principles used and significant estimates made by management, as well as evaluating the overall financial statement presentation. Our procedures included confirmation of securities owned as of July 31, 2005, by correspondence with the custodians and brokers; where replies were not received from brokers, we performed other auditing procedures. We believe that our audits provide a reasonable basis for our opinion.
In our opinion, the financial statements and financial highlights referred to above present fairly, in all material respects, the financial position of Fidelity Advisor Real Estate Fund as of July 31, 2005, the results of its operations for the year then ended, the changes in its net assets for each of the two years in the period then ended, and its financial highlights for the two years ended July 31, 2005 and July 31, 2004 and for the period from Septem-ber 12, 2002 (commencement of operations) to July 31, 2003, in conformity with accounting principles generally accepted in the United States of America.
/s/DELOITTE & TOUCHE LLP
DELOITTE & TOUCHE LLP
Boston, Massachusetts
September 20, 2005
31 Annual Report
Trustees and Officers
The Trustees, Members of the Advisory Board, and executive officers of the trusts and funds, as applicable, are listed below. The Board of Trustees governs each fund and is responsible for protecting the interests of shareholders. The Trustees are experienced executives who meet periodically throughout the year to oversee each fund’s activities, review contractual arrangements with companies that provide services to each fund, and review each fund’s performance. Except for William O. McCoy, Stephen P. Jonas, and Kenneth L. Wolfe, each of the Trustees oversees 320 funds advised by FMR or an affiliate. Mr. McCoy oversees 322 funds advised by FMR or an affiliate. Mr. Jonas and Mr. Wolfe oversee 311 funds advised by FMR or an affiliate.
The Trustees hold office without limit in time except that (a) any Trustee may resign; (b) any Trustee may be removed by written instrument, signed by at least two-thirds of the number of Trustees prior to such removal; (c) any Trustee who requests to be retired or who has become incapacitated by illness or injury may be retired by written instrument signed by a majority of the other Trustees; and (d) any Trustee may be removed at any special meeting of shareholders by a two-thirds vote of the outstanding voting securities of the trust. Each Trustee who is not an interested person (as defined in the 1940 Act) (Independent Trustee), shall retire not later than the last day of the calendar year in which his or her 72nd birthday occurs. The Independent Trustees may waive this mandatory retirement age policy with respect to individual Trustees. The executive officers and Advisory Board Members hold office without limit in time, except that any officer and Advisory Board Member may resign or may be removed by a vote of a majority of the Trustees at any regular meeting or any special meeting of the Trustees. Except as indicated, each individual has held the office shown or other offices in the same company for the past five years.
The fund’s Statement of Additional Information (SAI) includes more information about the Trustees. To request a free copy, call Fidelity at 1-800-544-8544.
Interested Trustees*:
Correspondence intended for each Trustee who is an interested person may be sent to Fidelity Investments, 82 Devonshire Street, Boston, Massachusetts 02109.
| Name, Age; Principal Occupation |
| |
| Edward C. Johnson 3d (75)** |
| |
| Year of Election or Appointment: 1980 |
| Mr. Johnson is Chairman of the Board of Trustees. Mr. Johnson serves as |
| Chief Executive Officer, Chairman, and a Director of FMR Corp.; a |
| Director and Chairman of the Board and of the Executive Committee of |
| FMR; Chairman and a Director of Fidelity Management & Research (Far |
| East) Inc.; Chairman and a Director of Fidelity Investments Money Man- |
| agement, Inc.; and Chairman (2001-present) and a Director |
| (2000-present) of FMR Co., Inc. |
Annual Report 32
| Name, Age; Principal Occupation |
| |
| Abigail P. Johnson (43)** |
| |
| Year of Election or Appointment: 2001 |
| Ms. Johnson serves as President of Fidelity Employer Services Company |
| (FESCO) (2005-present). She is President and a Director of Fidelity In- |
| vestments Money Management, Inc. (2001-present), FMR Co., Inc. |
| (2001-present), and a Director of FMR Corp. Previously, Ms. Johnson |
| served as President and a Director of FMR (2001-2005), Senior Vice |
| President of the Fidelity funds (2001-2005), and managed a number of |
| Fidelity funds. |
| |
| Stephen P. Jonas (52) |
| |
| Year of Election or Appointment: 2005 |
| Mr. Jonas is Senior Vice President of Advisor Real Estate (2005-present). |
| He also serves as Senior Vice President of other Fidelity funds |
| (2005-present). Mr. Jonas is Executive Director of FMR (2005-present). |
| Previously, Mr. Jonas served as President of Fidelity Enterprise Opera- |
| tions and Risk Services (2004-2005), Chief Administrative Officer |
| (2002-2004), and Chief Financial Officer of FMR Co. (1998-2000). Mr. |
| Jonas has been with Fidelity Investments since 1987 and has held vari- |
| ous financial and management positions including Chief Financial Offi- |
| cer of FMR. In addition, he serves on the Boards of Boston Ballet |
| (2003-present) and Simmons College (2003-present). |
| |
| Robert L. Reynolds (53) |
| |
| Year of Election or Appointment: 2003 |
| Mr. Reynolds is a Director (2003-present) and Chief Operating Officer |
| (2002-present) of FMR Corp. He also serves on the Board at Fidelity |
| Investments Canada, Ltd. (2000-present). Previously, Mr. Reynolds |
| served as President of Fidelity Investments Institutional Retirement Group |
| (1996-2000). |
* Trustees have been determined to be “Interested Trustees” by virtue of, among
other things, their affiliation with the trust or various entities under common
control with FMR.
** Edward C. Johnson 3d, Trustee, is Abigail P. Johnson’s father.
|
33 Annual Report
| | Trustees and Officers - continued
|
Independent Trustees:
Correspondence intended for each Independent Trustee (that is, the Trustees other than
the Interested Trustees) may be sent to Fidelity Investments, P.O. Box 55235, Boston,
Massachusetts 02205-5235.
|
| Name, Age; Principal Occupation |
| |
| Dennis J. Dirks (57) |
| |
| Year of Election or Appointment: 2005 |
| Prior to his retirement in May 2003, Mr. Dirks was Chief Operating |
| Officer and a member of the Board of The Depository Trust & Clearing |
| Corporation (DTCC) (1999-2003). He also served as President, Chief |
| Operating Officer, and Board member of The Depository Trust |
| Company (DTC) (1999-2003) and President and Board member of the |
| National Securities Clearing Corporation (NSCC) (1999-2003). In addi- |
| tion, Mr. Dirks served as Chief Executive Officer and Board member of |
| the Government Securities Clearing Corporation (2001-2003) and Chief |
| Executive Officer and Board member of the Mortgage-Backed Securities |
| Clearing Corporation (2001-2003). Mr. Dirks also serves as a Trustee of |
| Manhattan College (2005-present). |
| |
| Robert M. Gates (61) |
| |
| Year of Election or Appointment: 1997 |
| Dr. Gates is Vice Chairman of the Independent Trustees (2005-present). |
| Dr. Gates is President of Texas A&M University (2002-present). He was |
| Director of the Central Intelligence Agency (CIA) from 1991 to 1993. |
| From 1989 to 1991, Dr. Gates served as Assistant to the President of |
| the United States and Deputy National Security Advisor. Dr. Gates is a |
| Director of NACCO Industries, Inc. (mining and manufacturing), Parker |
| Drilling Co., Inc. (drilling and rental tools for the energy industry, |
| 2001-present), and Brinker International (restaurant management, |
| 2003-present). Previously, Dr. Gates served as a Director of LucasVarity |
| PLC (automotive components and diesel engines), a Director of TRW Inc. |
| (automotive, space, defense, and information technology), and Dean of |
| the George Bush School of Government and Public Service at Texas |
| A&M University (1999-2001). Dr. Gates also is a Trustee of the Forum |
| for International Policy. |
Annual Report 34
| Name, Age; Principal Occupation |
| |
| George H. Heilmeier (69) |
| |
| Year of Election or Appointment: 2004 |
| Dr. Heilmeier is Chairman Emeritus of Telcordia Technologies (commu- |
| nication software and systems), where prior to his retirement, he served |
| as company Chairman and Chief Executive Officer. He currently serves |
| on the Boards of Directors of The Mitre Corporation (systems engineer- |
| ing and information technology support for the government), and HRL |
| Laboratories (private research and development, 2004-present). He is |
| Chairman of the General Motors Science & Technology Advisory Board |
| and a Life Fellow of the Institute of Electrical and Electronics Engineers |
| (IEEE) (2000-present). Dr. Heilmeier is a member of the Defense Science |
| Board and the National Security Agency Advisory Board. He is also a |
| member of the National Academy of Engineering, the American |
| Academy of Arts and Sciences, and the Board of Overseers of the |
| School of Engineering and Applied Science of the University of Pennsyl- |
| vania. Previously, Dr. Heilmeier served as a Director of TRW Inc. (auto- |
| motive, space, defense, and information technology, 1992-2002), |
| Compaq (1994-2002), Automatic Data Processing, Inc. (ADP) |
| (technology-based business outsourcing, 1995-2002), INET Technolo- |
| gies Inc. (telecommunications network surveillance, 2001-2004), and |
| Teletech Holdings (customer management services). He is the recipient of |
| the 2005 Kyoto Prize in Advanced Technology for his invention of the |
| liquid display. |
| |
| Marie L. Knowles (58) |
| |
| Year of Election or Appointment: 2001 |
| Prior to Ms. Knowles’ retirement in June 2000, she served as Executive |
| Vice President and Chief Financial Officer of Atlantic Richfield Company |
| (ARCO) (diversified energy, 1996-2000). From 1993 to 1996, she was |
| a Senior Vice President of ARCO and President of ARCO Transportation |
| Company. She served as a Director of ARCO from 1996 to 1998. She |
| currently serves as a Director of Phelps Dodge Corporation (copper- |
| mining and manufacturing) and McKesson Corporation (healthcare ser- |
| vice, 2002-present). Ms. Knowles is a Trustee of the Brookings Institution |
| and the Catalina Island Conservancy and also serves as a member of |
| the Advisory Board for the School of Engineering of the University of |
| Southern California. |
35 Annual Report
Trustees and Officers - continued
|
| Name, Age; Principal Occupation |
| |
| Ned C. Lautenbach (61) |
| |
| Year of Election or Appointment: 2000 |
| Mr. Lautenbach has been a partner of Clayton, Dubilier & Rice, Inc. |
| (private equity investment firm) since September 1998. Previously, Mr. |
| Lautenbach was with the International Business Machines Corporation |
| (IBM) from 1968 until his retirement in 1998. Mr. Lautenbach serves as |
| a Director of Italtel Holding S.p.A. (telecommunications (Milan, Italy), |
| 2004-present) and Eaton Corporation (diversified industrial) as well as |
| the Philharmonic Center for the Arts in Naples, Florida. He also is a |
| member of the Board of Trustees of Fairfield University (2005-present), |
| as well as a member of the Council on Foreign Relations. |
| |
| Marvin L. Mann (72) |
| |
| Year of Election or Appointment: 1993 |
| Mr. Mann is Chairman of the Independent Trustees (2001-present). He is |
| Chairman Emeritus of Lexmark International, Inc. (computer |
| peripherals), where he served as CEO until April 1998, retired as |
| Chairman May 1999, and remains a member of the Board. Prior to |
| 1991, he held the positions of Vice President of International Business |
| Machines Corporation (IBM) and President and General Manager of |
| various IBM divisions and subsidiaries. He is a member of the Executive |
| Committee of the Independent Director’s Council of the Investment Com- |
| pany Institute. In addition, Mr. Mann is a member of the President’s |
| Cabinet at the University of Alabama and the Board of Visitors of the |
| Culverhouse College of Commerce and Business Administration at the |
| University of Alabama. |
| |
| William O. McCoy (71) |
| |
| Year of Election or Appointment: 1997 |
| Prior to his retirement in December 1994, Mr. McCoy was Vice Chair- |
| man of the Board of BellSouth Corporation (telecommunications) and |
| President of BellSouth Enterprises. He is currently a Director of Liberty |
| Corporation (holding company), Duke Realty Corporation (real estate), |
| and Progress Energy, Inc. (electric utility). He is also a partner of Frank- |
| lin Street Partners (private investment management firm) and a member |
| of the Research Triangle Foundation Board. In addition, Mr. McCoy |
| served as the Interim Chancellor (1999-2000) and a member of the |
| Board of Visitors for the University of North Carolina at Chapel Hill and |
| currently serves on the Board of Directors of the University of North |
| Carolina Health Care System and the Board of Visitors of the Kenan- |
| Flagler Business School (University of North Carolina at Chapel Hill). He |
| also served as Vice President of Finance for the University of North Car- |
| olina (16-school system). |
Annual Report 36
| Name, Age; Principal Occupation |
| |
| Cornelia M. Small (61) |
| |
| Year of Election or Appointment: 2005 |
| Ms. Small is a member (2000-present) and Chairperson (2002-present) |
| of the Investment Committee, and a member (2002-present) of the |
| Board of Trustees of Smith College. Previously, she served as Chief In- |
| vestment Officer (1999-2000), Director of Global Equity Investments |
| (1996-1999), and a member of the Board of Directors of Scudder, |
| Stevens & Clark (1990-1997) and Scudder Kemper Investments |
| (1997-1998). In addition, Ms. Small served as Co-Chair (2000-2003) |
| of the Annual Fund for the Fletcher School of Law and Diplomacy. |
| |
| William S. Stavropoulos (66) |
| |
| Year of Election or Appointment: 2001 |
| Mr. Stavropoulos is Chairman of the Board (2000-present) and a Mem- |
| ber of the Board of Directors of The Dow Chemical Company. Since |
| joining The Dow Chemical Company in 1967, Mr. Stavropoulos served |
| in numerous senior management positions, including President |
| (1993-2000; 2002-2003), CEO (1995-2000; 2000-2004), and Chair- |
| man of the Executive Committee (2002-2004). Currently, he is a Direc- |
| tor of NCR Corporation (data warehousing and technology solutions), |
| BellSouth Corporation (telecommunications), Chemical Financial Corpo- |
| ration, and Maersk Inc. (industrial conglomerate, 2002-present), and |
| Metalmark Capital (private equity investment firm, 2005-present). He |
| also serves as a member of the Board of Trustees of the American Enter- |
| prise Institute for Public Policy Research. In addition, Mr. Stavropoulos is |
| a member of The Business Council, J.P. Morgan International Council |
| and the University of Notre Dame Advisory Council for the College of |
| Science. |
| |
| Kenneth L. Wolfe (66) |
| |
| Year of Election or Appointment: 2005 |
| Mr. Wolfe also serves as a Trustee (2005-present) or Member of the |
| Advisory Board (2004-present) of other investment companies advised |
| by FMR. Prior to his retirement in 2001, Mr. Wolfe was Chairman and |
| Chief Executive Officer of Hershey Foods Corporation (1993-2001). He |
| currently serves as a member of the boards of Adelphia Communica- |
| tions Corporation (2003-present), Bausch & Lomb, Inc., and Revlon Inc. |
| (2004-present). |
37 Annual Report
| | Advisory Board Members and Executive Officers:
Correspondence intended for Mr. Gamper may be sent to Fidelity Investments, P.O. Box
55235, Boston, Massachusetts 02205-5235. Correspondence intended for each executive
officer and Mr. Lynch may be sent to Fidelity Investments, 82 Devonshire Street, Boston,
Massachusetts 02109.
|
| Name, Age; Principal Occupation |
| |
| Albert R. Gamper, Jr. (63) |
| |
| Year of Election or Appointment: 2005 |
| Member of the Advisory Board of Fidelity Advisor Series VII. Prior to his |
| retirement in December 2004, Mr. Gamper served as Chairman of the |
| Board of CIT Group Inc. (commercial finance). During his tenure with |
| CIT Group Inc. Mr. Gamper served in numerous senior management |
| positions, including Chairman (1987-1989; 1999-2001; 2002-2004), |
| Chief Executive Officer (1987-2004), and President (1989-2002). He |
| currently serves as a member of the Board of Directors of Public Service |
| Enterprise Group (utilities, 2001-present), Chairman of the Board of |
| Governors, Rutgers University (2004-present), and Chairman of the |
| Board of Saint Barnabas Health Care System. |
| |
| Peter S. Lynch (61) |
| |
| Year of Election or Appointment: 2003 |
| Member of the Advisory Board of Fidelity Advisor Series VII. Vice |
| Chairman and a Director of FMR, and Vice Chairman (2001-present) |
| and a Director (2000-present) of FMR Co., Inc. Previously, Mr. Lynch |
| served as a Trustee of the Fidelity funds (1990-2003). In addition, he |
| serves as a Trustee of Boston College, Massachusetts Eye & Ear |
| Infirmary, Historic Deerfield, John F. Kennedy Library, and the Museum |
| of Fine Arts of Boston. |
| |
| Dwight D. Churchill (51) |
| |
| Year of Election or Appointment: 2005 |
| Vice President of Advisor Real Estate. Mr. Churchill also serves as Vice |
| President of certain Equity Funds (2005-present) and certain High In- |
| come Funds (2005-present). Previously, he served as Head of Fidelity’s |
| Fixed-Income Division (2000-2005), Vice President of Fidelity’s Money |
| Market Funds (2000-2005), Vice President of Fidelity’s Bond Funds, and |
| Senior Vice President of FIMM (2000) and FMR. Mr. Churchill joined |
| Fidelity in 1993 as Vice President and Group Leader of Taxable Fixed- |
| Income Investments. |
| |
| Sam Wald (31) |
| |
| Year of Election or Appointment: 2005 |
| Vice President of Advisor Real Estate Fund, Prior to assuming his current |
| responsibilities, Mr. Wald has worked as a research analyst, associate |
| portfolio manager and manager. |
Annual Report 38
| Name, Age; Principal Occupation |
| |
| Eric D. Roiter (56) |
| |
| Year of Election or Appointment: 2002 |
| Secretary of Advisor Real Estate. He also serves as Secretary of other |
| Fidelity funds; Vice President, General Counsel, and Secretary of FMR |
| Co., Inc. (2001-present) and FMR; Assistant Secretary of Fidelity Man- |
| agement & Research (U.K.) Inc. (2001-present), Fidelity Management & |
| Research (Far East) Inc. (2001-present), and Fidelity Investments Money |
| Management, Inc. (2001-present). Mr. Roiter is an Adjunct Member, |
| Faculty of Law, at Boston College Law School (2003-present). Previously, |
| Mr. Roiter served as Vice President and Secretary of Fidelity Distributors |
| Corporation (FDC) (1998-2005). |
| |
| Stuart Fross (45) |
| |
| Year of Election or Appointment: 2003 |
| Assistant Secretary of Advisor Real Estate. Mr. Fross also serves as As- |
| sistant Secretary of other Fidelity funds (2003-present), Vice President |
| and Secretary of FDC (2005-present), and is an employee of FMR. |
| |
| Christine Reynolds (46) |
| |
| Year of Election or Appointment: 2004 |
| President, Treasurer, and Anti-Money Laundering (AML) officer of Advi- |
| sor Real Estate. Ms. Reynolds also serves as President, Treasurer, and |
| AML officer of other Fidelity funds (2004) and is a Vice President (2003) |
| and an employee (2002) of FMR. Before joining Fidelity Investments, |
| Ms. Reynolds worked at PricewaterhouseCoopers LLP (PwC) |
| (1980-2002), where she was most recently an audit partner with PwC’s |
| investment management practice. |
| |
| Timothy F. Hayes (54) |
| |
| Year of Election or Appointment: 2002 |
| Chief Financial Officer of Advisor Real Estate. Mr. Hayes also serves as |
| Chief Financial Officer of other Fidelity funds (2002-present) and Presi- |
| dent of Fidelity Investment Operations (2005-present) which includes |
| Fidelity Pricing and Cash Management Services Group (FPCMS), where |
| he served as President (1998-2005). Mr. Hayes serves as President of |
| Fidelity Service Company (2003-present) where he also serves as a |
| Director. Mr. Hayes also served as President of Fidelity Investments Op- |
| erations Group (FIOG, 2002-2005). |
39 Annual Report
Trustees and Officers - continued
|
| Name, Age; Principal Occupation |
| |
| Kenneth A. Rathgeber (58) |
| |
| Year of Election or Appointment: 2004 |
| Chief Compliance Officer of Advisor Real Estate. Mr. Rathgeber also |
| serves as Chief Compliance Officer of other Fidelity funds (2004) and |
| Executive Vice President of Risk Oversight for Fidelity Investments |
| (2002). Previously, he served as Executive Vice President and Chief Op- |
| erating Officer for Fidelity Investments Institutional Services Company, |
| Inc. (1998-2002). |
| |
| John R. Hebble (47) |
| |
| Year of Election or Appointment: 2003 |
| Deputy Treasurer of Advisor Real Estate. Mr. Hebble also serves as Dep- |
| uty Treasurer of other Fidelity funds (2003), and is an employee of FMR. |
| Before joining Fidelity Investments, Mr. Hebble worked at Deutsche Asset |
| Management where he served as Director of Fund Accounting |
| (2002-2003) and Assistant Treasurer of the Scudder Funds |
| (1998-2003). |
| |
| Bryan A. Mehrmann (44) |
| |
| Year of Election or Appointment: 2005 |
| Deputy Treasurer of Advisor Real Estate. Mr. Mehrmann also serves as |
| Deputy Treasurer of other Fidelity funds (2005-present) and is an em- |
| ployee of FMR. Previously, Mr. Mehrmann served as Vice President of |
| Fidelity Investments Institutional Services Group (FIIS)/Fidelity Investments |
| Institutional Operations Corporation, Inc. (FIIOC) Client Services |
| (1998-2004). |
| |
| Kimberley H. Monasterio (41) |
| |
| Year of Election or Appointment: 2004 |
| Deputy Treasurer of Advisor Real Estate. Ms. Monasterio also serves as |
| Deputy Treasurer of other Fidelity funds (2004) and is an employee of |
| FMR (2004). Before joining Fidelity Investments, Ms. Monasterio served |
| as Treasurer (2000-2004) and Chief Financial Officer (2002-2004) of |
| the Franklin Templeton Funds and Senior Vice President of Franklin Tem- |
| pleton Services, LLC (2000-2004). |
| |
| Kenneth B. Robins (35) |
| |
| Year of Election or Appointment: 2005 |
| Deputy Treasurer of Advisor Real Estate. Mr. Robins also serves as Dep- |
| uty Treasurer of other Fidelity funds (2005-present) and is an employee |
| of FMR (2004-present). Before joining Fidelity Investments, Mr. Robins |
| worked at KPMG LLP, where he was a partner in KPMG’s department of |
| professional practice (2002-2004) and a Senior Manager |
| (1999-2000). In addition, Mr. Robins served as Assistant Chief Accoun- |
| tant, United States Securities and Exchange Commission (2000-2002). |

| Name, Age; Principal Occupation |
| |
| Robert G. Byrnes (38) |
| |
| Year of Election or Appointment: 2005 |
| Assistant Treasurer of Advisor Real Estate. Mr. Byrnes also serves as |
| Assistant Treasurer of other Fidelity funds (2005-present) and is an em- |
| ployee of FMR (2005-present). Previously, Mr. Byrnes served as Vice |
| President of FPCMS (2003-2005). Before joining Fidelity Investments, |
| Mr. Byrnes worked at Deutsche Asset Management where he served as |
| Vice President of the Investment Operations Group (2000-2003). |
| |
| John H. Costello (58) |
| |
| Year of Election or Appointment: 2002 |
| Assistant Treasurer of Advisor Real Estate. Mr. Costello also serves as |
| Assistant Treasurer of other Fidelity funds and is an employee of FMR. |
| |
| Peter L. Lydecker (51) |
| |
| Year of Election or Appointment: 2004 |
| Assistant Treasurer of Advisor Real Estate. Mr. Lydecker also serves as |
| Assistant Treasurer of other Fidelity funds (2004) and is an employee of |
| FMR. |
| |
| Mark Osterheld (50) |
| |
| Year of Election or Appointment: 2002 |
| Assistant Treasurer of Advisor Real Estate. Mr. Osterheld also serves as |
| Assistant Treasurer of other Fidelity funds (2002) and is an employee of |
| FMR. |
| |
| Gary W. Ryan (46) |
| |
| Year of Election or Appointment: 2005 |
| Assistant Treasurer of Advisor Real Estate. Mr. Ryan also serves as Assis- |
| tant Treasurer of other Fidelity funds (2005-present) and is an employee |
| of FMR (2005-present). Previously, Mr. Ryan served as Vice President of |
| Fund Reporting in FPCMS (1999-2005). |
| |
| Salvatore Schiavone (39) |
| |
| Year of Election or Appointment: 2005 |
| Assistant Treasurer of Advisor Real Estate. Mr. Schiavone also serves as |
| Assistant Treasurer of other Fidelity funds (2005-present) and is an em- |
| ployee of FMR (2005-present). Before joining Fidelity Investments, Mr. |
| Schiavone worked at Deutsche Asset Management, where he most re- |
| cently served as Assistant Treasurer (2003-2005) of the Scudder Funds |
| and Vice President and Head of Fund Reporting (1996-2003). |
41 Annual Report
The Board of Trustees of Advisor Real Estate Fund voted to pay to shareholders of record at the opening of business on record date, the following distributions per share derived from capital gains realized from sales of portfolio securities, and dividends derived from net investment income:
| | | Pay Date | | Record Date | | Dividends | | Capital Gains |
| Class A | | 9/19/05 | | 9/16/05 | | $0.084 | | $0.50 |
| Class T | | 9/19/05 | | 9/16/05 | | $0.073 | | $0.50 |
| Class B | | 9/19/05 | | 9/16/05 | | $0.052 | | $0.50 |
| Class C | | 9/19/05 | | 9/16/05 | | $0.051 | | $0.50 |
The fund hereby designates as capital gain dividends: For dividends with respect to the taxable year ended July 31, 2005, $4,213,687, or, if subsequently determined to be different, the net capital gain of such year, and for dividends with respect to the taxable year ended July 31, 2004, $1,332,180, or, if subsequently determined to be different, the excess of: (a) the net capital gain of such year, over (b) amounts previously designated as capital gain dividends with respect to such year.
A total of 0.12% of the dividends distributed during the fiscal year was derived from interest on U.S. Government securities which is generally exempt from state income tax.
The fund will notify shareholders in January 2006 of amounts for use in preparing 2005 income tax returns.
Board Approval of Investment Advisory Contracts and Management Fees
Advisor Real Estate Fund
Each year, typically in July, the Board of Trustees, including the independent Trustees (together, the Board), votes on the renewal of the management contract and sub-advisory agreements (together, the Advisory Contracts) for the fund. The Board, assisted by the advice of fund counsel and independent Trustees’ counsel, requests and considers a broad range of information throughout the year.
The Board meets regularly each month except August and takes into account throughout the year matters bearing on Advisory Contracts. The Board, acting directly and through its separate committees, considers at each of its meetings factors that are relevant to the annual renewal of the fund’s Advisory Contracts, including the services and support provided to the fund and its shareholders by Fidelity. At the time of the renewal, the Board had 11 standing committees, each composed of independent Trustees with varying backgrounds, to which the Board has assigned specific subject matter responsibilities in order to enhance effective decision-making by the Board. Each committee has adopted a written charter outlining the structure and purposes of the committee. One such committee, the Equity Contract Committee, meets periodically during the first six months of each year and as necessary to consider matters specifically related to the annual renewal of Advisory Contracts. The committee requests and receives information on, and makes recommendations to the independent Trustees concerning, the approval and annual review of the Advisory Contracts.
At its July 2005 meeting, the Board of Trustees, including the independent Trustees, unanimously determined to renew the Advisory Contracts for the fund. In reaching its determination, the Board considered all factors it believed relevant, including (1) the nature, extent, and quality of the services to be provided to the fund and its shareholders by Fidelity (including the investment performance of the fund); (2) the competitiveness of the management fee and total expenses of the fund; (3) the total costs of the services to be provided by and the profits to be realized by the investment adviser and its affiliates from the relationship with the fund; (4) the extent to which economies of scale would be realized as the fund grows; and (5) whether fee levels reflect these economies of scale, if any, for the benefit of fund shareholders.
In determining whether to renew the Advisory Contracts for the fund, the Board ultimately reached a determination, with the assistance of fund counsel and independent Trustees’ counsel, that the renewal of the Advisory Contracts and the compensation to be received by Fidelity under the management contract is consistent with Fidelity’s fiduciary duty under applicable law. In addition to evaluating the specific factors noted above, the Board, in reaching its determination, is aware that shareholders in the fund have a broad range of investment choices available to them, including a wide choice among mutual funds offered by competitors to Fidelity, and that the fund’s shareholders, with the opportunity to review and weigh the disclosure provided by the fund in its
43 Annual Report
Board Approval of Investment Advisory Contracts and Management Fees - continued
prospectus and other public disclosures, have chosen to invest in this fund, managed by Fidelity.
Nature, Extent, and Quality of Services Provided by Fidelity. The Board considered staffing within the investment adviser, FMR, and the sub-advisers (together, the Investment Advisers), including the background of the fund’s portfolio manager and the fund’s investment objective and discipline. The independent Trustees also had discussions with senior management of Fidelity’s investment operations and investment groups. The Board considered the structure of the portfolio manager compensation program and whether this structure provides appropriate incentives.
Fidelity Resources Dedicated to Investment Management and Support Services. The Board reviewed the size, education, and experience of the Investment Advisers’ investment staff, their use of technology, and the Investment Advisers’ approach to recruiting, training, and retaining portfolio managers and other research, advisory, and management personnel. The Board considered Fidelity’s extensive global research capabilities that enable the Investment Advisers to aggregate data from various sources in an effort to produce positive investment results. The Board noted that Fidelity’s analysts have access to a variety of technological tools that enable them to perform both fundamental and quantitative analysis and to specialize in various disciplines. The Board also considered that Fidelity’s portfolio managers and analysts have access to daily portfolio attribution that allows for monitoring of a fund’s portfolio, as well as an electronic communication system that provides immediate real-time access to research concerning issuers and credit enhancers.
Shareholder and Administrative Services. The Board considered the nature, extent, quality, and cost of administrative, distribution, and shareholder services performed by the Investment Advisers and their affiliates under the Advisory Contracts and under separate agreements covering transfer agency, pricing and bookkeeping, and securities lending services for the fund. The Board also considered the nature and extent of the Investment Advisers’ supervision of third party service providers, principally custodians and subcustodians. The Board reviewed the allocation of fund brokerage, including allocations to brokers affiliated with the Investment Advisers, the use of brokerage commissions to pay fund expenses, and the use of “soft” commission dollars to pay for research services. The Board also considered that Fidelity voluntarily decided in 2004 to stop using “soft” commission dollars to pay for market data and, instead, to pay for that data out of its own resources. The Board also considered the resources devoted to, and the record of compliance with, the fund’s compliance policies and procedures.
The Board noted that the growth of fund assets across the complex allows Fidelity to reinvest in the development of services designed to enhance the value or convenience of the Fidelity funds as investment vehicles. These services include 24-hour access to
account information and market information through phone representatives and over the Internet, and investor education materials and asset allocation tools.
Investment in a Large Fund Family. The Board considered the benefits to shareholders of investing in a Fidelity fund, including the benefits of investing in a fund that is part of a large family of funds offering a variety of investment disciplines and providing for a large variety of mutual fund investor services. For example, fund shareholders are offered the privilege of exchanging shares of the fund for shares of other Fidelity funds, as set forth in the fund’s prospectus, without paying an additional sales charge. The Board noted that, since the last Advisory Contract renewals in July 2004, Fidelity has taken a number of actions that benefited particular funds, including (i) voluntarily deciding in 2004 to stop using “soft” commission dollars to pay for market data and, instead, to pay for that data out of its own resources, (ii) contractually agreeing to impose management fee reductions and expense limitations on its five Spartan stock index funds and its stock index fund available through variable insurance products, (iii) contractually agreeing to eliminate the management fees on the Fidelity Freedom Funds and the Fidelity Advisor Freedom Funds, (iv) contractually agreeing to reduce the management fees on most of its investment-grade taxable bond funds, and (v) contractually agreeing to impose expense limitations on its retail and Spartan investment-grade taxable bond funds.
Investment Performance and Compliance. The Board considered whether the fund has operated within its investment objective, as well as its record of compliance with its investment restrictions. It also reviewed the fund’s absolute investment performance for each class, as well as the fund’s relative investment performance for each class measured against (i) a broad-based securities market index, and (ii) a peer group of mutual funds deemed appropriate by the Board. Because the fund had been in existence less than three calendar years, the following chart considered by the Board shows, for the one-year period ended December 31, 2004, the returns of Class C and Institutional Class of the fund, the return of a broad-based securities market index (“benchmark”), and a range of returns of a peer group of mutual funds identified by Lipper Inc. as having an investment objective similar to that of the fund. The returns of Class C and Institutional Class represent the performance of classes with the highest and lowest 12b-1 fees, respectively (not necessarily with the highest and lowest total expenses). The box within the chart shows the 25th percentile return (bottom of box) and the 75th percentile return (top of box) of the Lipper peer group. Returns shown above the box are in the first quartile and returns shown below the box are in the fourth quartile. The percentage beaten numbers noted below the chart correspond to the percentile box and represent the percentage of funds in the Lipper peer group whose performance was equal to or lower than that of the class indicated.
45 Annual Report
Board Approval of Investment Advisory Contracts and Management Fees - continued

The Board reviewed the fund’s relative investment performance against its Lipper peer group and stated that the performance of Institutional Class of the fund was in the second quartile for the one-year period. The Board also stated that the relative investment performance of the fund was lower than its benchmark for the one-year period. The Board considered that the variations in performance among the fund’s classes reflect the variations in class expenses, which result in lower performance for higher expense classes. The Board stated that it is difficult to evaluate in any comprehensive fashion the performance of the fund, in light of its relatively recent launch.
The Board has had thorough discussions with FMR throughout the year about the Board’s and FMR’s concerns about equity research, equity fund performance, and compliance with internal policies governing gifts and entertainment. FMR has taken steps that it believes will refocus and strengthen equity research and equity portfolio management and compliance. The Board noted with favor FMR’s recent reorganization of its senior management team and FMR’s plans to dedicate additional resources to investment research, and participated in the process that led to those changes.
Based on its review, and giving particular weight to the nature and quality of the resources dedicated by the Investment Advisers to maintain and improve relative performance, the Board concluded that the nature, extent, and quality of the services provided by Fidelity will benefit the fund’s shareholders, particularly in light of the Board’s view that the fund’s shareholders benefit from investing in a fund that is part of a large family of funds offering a variety of investment disciplines and services.
Competitiveness of Management Fee and Total Fund Expenses. The Board considered the fund’s management fee and total expenses compared to “mapped groups”
of competitive funds and classes. Fidelity creates “mapped groups” by combining similar Lipper investment objective categories that have comparable management fee characteristics. Combining Lipper investment objective categories aids the Board’s management fee and total expense comparisons by broadening the competitive group used for comparison and by reducing the number of universes to which various Fidelity funds are compared.
The Board considered two proprietary management fee comparisons for the 12-month (or shorter) periods shown in the chart below. The group of Lipper funds used by the Board for management fee comparisons is referred to below as the “Total Mapped Group” and, for the reasons explained above, is broader than the Lipper peer group used by the Board for performance comparisons. The Total Mapped Group comparison focuses on a fund’s standing relative to the total universe of comparable funds available to investors, in terms of gross management fees before expense reimbursements or caps. “TMG %” represents the percentage of funds in the Total Mapped Group that had management fees that were lower than the fund’s. For example, a TMG % of 30% means that 70% of the funds in the Total Mapped Group had higher management fees than the fund. The “Asset-Size Peer Group” (ASPG) comparison focuses on a fund’s standing relative to non-Fidelity funds similar in size to the fund within the Total Mapped Group. The ASPG represents at least 15% of the funds in the Total Mapped Group with comparable asset size and management fee characteristics, subject to a minimum of 50 funds (or all funds in the Total Mapped Group if fewer than 50). Additional information, such as the ASPG quartile (“quadrant”) in which the fund’s management fee ranked, is also included in the chart and considered by the Board.
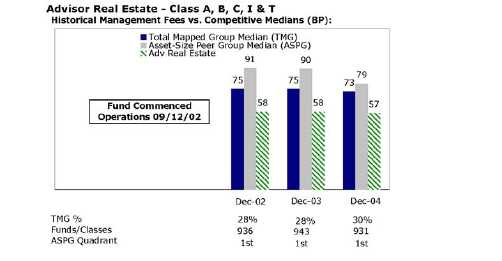
47 Annual Report
Board Approval of Investment Advisory Contracts and Management Fees - continued
The Board noted that the fund’s management fee ranked below the median of its Total Mapped Group and below the median of its ASPG for 2004.
Based on its review, the Board concluded that the fund’s management fee was fair and reasonable in light of the services that the fund receives and the other factors considered.
In its review of each class’s total expenses, the Board considered the fund’s management fee as well as other fund or class expenses, as applicable, such as transfer agent fees, pricing and bookkeeping fees, fund-paid 12b-1 fees, and custodial, legal, and audit fees. The Board also noted the effects of any waivers and reimbursements on fees and expenses. As part of its review, the Board also considered current and historical total expenses of each class of the fund compared to competitive fund median expenses. Each class of the fund is compared to those funds and classes in the Total Mapped Group (used by the Board for management fee comparisons) that have a similar sales load structure.
The Board noted that the total expenses of each class ranked above its competitive median for 2004. The Board noted that the fund offers multiple classes, each of which has a different sales load and 12b-1 fee structure, and that the multiple structures are intended to offer a range of pricing options for the intermediary market. The Board also noted that the total expenses of the classes vary primarily by the level of their 12b-1 fees, although differences in transfer agent fees may also cause expenses to vary from class to class.
Furthermore, the Board considered that on December 16, 2004, it had approved changes (effective January 1, 2005) in the transfer agent and service agreements for the fund that established maximum transfer agent fees and eliminated the minimum pricing and bookkeeping fee to prevent small funds or funds with small average account sizes from having relatively high fees in basis points (the “small-fund fee reductions”). The Board considered that, if the small-fund fee reductions had been in effect in 2004, the total expenses of Institutional Class would have ranked below the median.
In its review of total expenses, the Board also considered Fidelity fee structures and other information on clients that FMR and its affiliates service in other competitive markets, such as other mutual funds advised or subadvised by FMR or its affiliates, pension plan clients, and other institutional clients.
Based on its review, the Board concluded that the total expenses for each class of the fund were reasonable, although in all cases above the median of the universe presented for comparison, in light of the services that the fund and its shareholders receive and the other factors considered.
Costs of the Services and Profitability. The Board considered the revenues earned and the expenses incurred by Fidelity in conducting the business of developing,
marketing, distributing, managing, administering and servicing the fund and its shareholders. The Board also considered the level of Fidelity’s profits in respect of all the Fidelity funds.
On an annual basis, FMR presents to the Board Fidelity’s profitability for the fund. Fidelity calculates the profitability for each fund, as well as aggregate profitability for groups of Fidelity funds and all Fidelity funds, using a series of detailed revenue and cost allocation methodologies which originate with the audited books and records of Fidelity. The Audit Committee of the Board reviews any significant changes from the prior year’s methodologies.
PricewaterhouseCoopers LLP (PwC), independent registered accounting firm and auditor to Fidelity and certain Fidelity funds, has been engaged annually by the Board as part of the Board’s assessment of the results of Fidelity’s profitability analysis. PwC’s engagement includes the review and assessment of Fidelity’s methodologies used in determining the revenues and expenses attributable to Fidelity’s mutual fund business, and completion of agreed-upon procedures surrounding the mathematical accuracy of fund profitability and its conformity to allocation methodologies. After considering PwC’s reports issued under the engagement and information provided by Fidelity, the Board believes that while other allocation methods may also be reasonable, Fidelity’s profitability methodologies are reasonable in all material respects.
The Board has also reviewed Fidelity’s non-fund businesses and any fall-out benefits related to the mutual fund business as well as cases where Fidelity’s affiliates may benefit from or be related to the fund’s business. In addition, a special committee of the Board reviewed services provided to Fidelity by its affiliates and determined that the fees that Fidelity paid for such services were reasonable.
The Board considered the costs of the services provided by and the profits realized by Fidelity in connection with the operation of the fund and determined that the amount of profit is a fair entrepreneurial profit for the management of the fund.
Economies of Scale. The Board considered whether there have been economies of scale in respect of the management of the Fidelity funds, whether the Fidelity funds (including the fund) have appropriately benefited from any such economies of scale, and whether there is potential for realization of any further economies of scale. The Board considered the extent to which the fund will benefit from economies of scale through increased services to the fund, through waivers or reimbursements, or through fee or expense reductions, including reductions that occur through operation of the transfer agent agreement. The transfer agent fee varies in part based on the number of accounts in the fund. If the number of accounts decreases or the average account size increases, the overall transfer agent fee rate decreases.
49 Annual Report
Board Approval of Investment Advisory Contracts and Management Fees - continued
The Board recognized that the fund’s management contract incorporates a “group fee” structure, which provides for lower fee rates as total fund assets under FMR’s management increase, and for higher fee rates as total fund assets under FMR’s management decrease. The Board considered that the group fee is designed to deliver the benefits of economies of scale to fund shareholders when total fund assets increase, even if assets of any particular fund are unchanged or have declined, because some portion of Fidelity’s costs are attributable to services provided to all Fidelity funds, and all funds benefit if those costs can be allocated among more assets. The Board concluded that, given the group fee structure, fund shareholders will achieve a certain level of economies of scale as assets under FMR’s management increase at the fund complex level, regardless of whether Fidelity achieves any such economies of scale.
The Board further concluded that any potential economies of scale are being shared between fund shareholders and Fidelity in an appropriate manner.
Additional Information Requested by the Board. In order to develop fully the factual basis for consideration of the Advisory Contracts, the Board requested additional information regarding (i) equity fund transfer agency fees; (ii) Fidelity’s fund profitability methodology and the impact of various changes in the methodology over time; (iii) benefits to shareholders from economies of scale; (iv) composition and characteristics of various fund and industry data used in comparisons; and (v) compensation of portfolio managers and research analysts.
Based on its evaluation of all of the conclusions noted above, and after considering all material factors, the Board ultimately concluded that the existing advisory fee structures are fair and reasonable, and that the fund’s existing Advisory Contracts should be renewed.
51 Annual Report
53 Annual Report
Investment Adviser
Fidelity Management & Research Company Boston, MA
Investment Sub-Advisers
FMR Co., Inc.
Fidelity Management & Research (U.K.) Inc.
Fidelity Management & Research (Far East) Inc.
Fidelity International Investment Advisors Fidelity International Investment Advisors (U.K.) Limited Fidelity Investments Japan Limited
General Distributor
Fidelity Distributors Corporation Boston, MA
Transfer and Service Agents
Fidelity Investments Institutional Operations Company, Inc. Boston, MA
Fidelity Service Company, Inc. Boston, MA
Custodian
Mellon Bank, N.A. Pittsburgh, PA
ARE-UANN-0905 1.789707.102


Fidelity® Advisor
Real Estate
Fund - Institutional Class
|
Annual Report
July 31, 2005
|

| Chairman’s Message | | 4 | | Ned Johnson’s message to shareholders. |
| Performance | | 5 | | How the fund has done over time. |
| |
| Management’s Discussion | | 6 | | The manager’s review of fund |
| | | | | performance, strategy and outlook |
| |
| Shareholder Expense | | 7 | | An example of shareholder expenses. |
| Example | | | | |
| Investment Changes | | 9 | | A summary of major shifts in the fund’s |
| | | | | investments over the past six months. |
| Investments | | 10 | | A complete list of the fund’s investments |
| | | | | with their market values. |
| Financial Statements | | 13 | | Statements of assets and liabilities, |
| | | | | operations, and changes in net assets, |
| | | | | as well as financial highlights. |
| Notes | | 22 | | Notes to financial statements. |
| Report of Independent | | 30 | | |
| Registered Public | | | | |
| Accounting Firm | | | | |
| Trustees and Officers | | 31 | | |
| |
| Distributions | | 41 | | |
| |
| Board Approval of | | 42 | | |
| Investment Advisory | | | | |
| Contracts and | | | | |
| Management Fees | | | | |
To view a fund’s proxy voting guidelines and proxy voting record for the 12-month period ended June 30, visit www.fidelity.com/proxyvotingresults or visit the Securities and Exchange Commission’s (SEC) web site at www.sec.gov. You may also call 1-877-208-0098 to request a free copy of the proxy voting guidelines.
Standard & Poor’s, S&P and S&P 500 are registered service marks of The McGraw-Hill Companies, Inc. and have been licensed for use by Fidelity Distributors Corporation.
Other third party marks appearing herein are the property of their respective owners. All other marks appearing herein are registered or unregistered trademarks or service marks of FMR Corp. or an affiliated company.
Annual Report 2
This report and the financial statements contained herein are submitted for the general information of the shareholders of the fund. This report is not authorized for distribution to prospective investors in the fund unless preceded or accompanied by an effective prospectus.
A fund files its complete schedule of portfolio holdings with the SEC for the first and third quarters of each fiscal year on Form N-Q. Forms N-Q are available on the SEC’s web site at http://www.sec.gov. A fund’s Forms N-Q may be reviewed and copied at the SEC’s Public Reference Room in Washington, DC. Information regarding the operation of the SEC’s Public Reference Room may be obtained by calling 1-800-SEC-0330. For a complete list of a fund’s portfolio holdings, view the most recent quarterly holdings report, semiannual report, or annual report on Fidelity’s web site at http://www.advisor.fidelity.com.
NOT FDIC INSURED · MAY LOSE VALUE · NO BANK GUARANTEE
Neither the fund nor Fidelity Distributors Corporation is a bank.
3 Annual Report
Chairman’s Message
(Photograph of Edward C. Johnson 3d.)
Dear Shareholder:
During the past year or so, much has been reported about the mutual fund industry, and much of it has been more critical than I believe is warranted. Allegations that some companies have been less than forthright with their shareholders have cast a shadow on the entire industry. I continue to find these reports disturbing, and assert that they do not create an accurate picture of the industry overall. Therefore, I would like to remind everyone where Fidelity stands on these issues. I will say two things specifically regarding allegations that some mutual fund companies were in violation of the Securities and Exchange Commission’s forward pricing rules or were involved in so-called “market timing” activities.
First, Fidelity has no agreements that permit customers who buy fund shares after 4 p.m. to obtain the 4 p.m. price. This is not a new policy. This is not to say that someone could not deceive the company through fraudulent acts. However, we are extremely diligent in preventing fraud from occurring in this manner — and in every other. But I underscore again that Fidelity has no so-called “agreements” that sanction illegal practices.
Second, Fidelity continues to stand on record, as we have for years, in opposition to predatory short-term trading that adversely affects shareholders in a mutual fund. Back in the 1980s, we initiated a fee — which is returned to the fund and, therefore, to investors — to discourage this activity. Further, we took the lead several years ago in developing a Fair Value Pricing Policy to prevent market timing on foreign securities in our funds. I am confident we will find other ways to make it more difficult for predatory traders to operate. However, this will only be achieved through close cooperation among regulators, legislators and the industry.
Yes, there have been unfortunate instances of unethical and illegal activity within the mutual fund industry from time to time. That is true of any industry. When this occurs, confessed or convicted offenders should be dealt with appropriately. But we are still concerned about the risk of over-regulation and the quick application of simplistic solutions to intricate problems. Every system can be improved, and we support and applaud well thought out improvements by regulators, legislators and industry representatives that achieve the common goal of building and protecting the value of investors’ holdings.
For nearly 60 years, Fidelity has worked very hard to improve its products and service to justify your trust. When our family founded this company in 1946, we had only a few hundred customers. Today, we serve more than 18 million customers including individual investors and participants in retirement plans across America.
Let me close by saying that we do not take your trust in us for granted, and we realize that we must always work to improve all aspects of our service to you. In turn, we urge you to continue your active participation with your financial matters, so that your interests can be well served.
Edward C. Johnson 3d
Fidelity Advisor Real Estate Fund - Institutional Class
Performance: The Bottom Line
Average annual total return reflects the change in the value of an investment, assuming reinvestment of the class’ dividend income and capital gains (the profits earned upon the sale of securities that have grown in value) and assuming a constant rate of performance each year. The $10,000 table and the fund’s returns do not reflect the deduction of taxes that a shareholder would pay on fund distributions or the redemption of fund shares. During periods of reimbursement by Fidelity, a fund’s total return will be greater than it would be had the reimbursement not occurred. How a fund did yesterday is no guarantee of how it will do tomorrow.
| Average Annual Total Returns | | | | |
| Periods ended July 31, 2005 | | Past 1 | | Life of |
| | | year | | fundA |
| Institutional Class | | 46.05% | | 28.03% |
| A From September 12, 2002. | | | | |
| $10,000 Over Life of Fund | | | | |
Let’s say hypothetically that $10,000 was invested in Fidelity® Advisor Real Estate Fund — Institutional Class on September 12, 2002, when the fund started. The chart shows how the value of your investment would have changed, and also shows how the Standard & Poor’s 500SM Index (S&P 500®) Index performed over the same period.
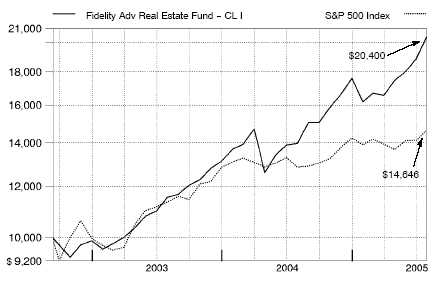
5 Annual Report
5
Management’s Discussion of Fund Performance
Comments from Sam Wald, Portfolio Manager of Fidelity® Advisor Real Estate Fund
A late-inning rally on Wall Street helped push some key U.S. equity indexes to four-year highs by the conclusion of the 12-month period ending July 31, 2005. Spurred on by bullish economic data and strong corporate earnings, investors enjoyed a stellar month of July, capping off a turbulent 12-month period for U.S. equity markets. Stock prices bounced up and down during most of the year, moving in cadence with gyrations in the price of crude oil and investors’ gathering and ebbing concerns about inflation. The Federal Reserve Board raised short-term interest rates eight times during the period, also affecting overall market sentiment. Despite their fluctuations, the major equity indexes finished on a high note, with the Standard & Poor’s 500SM Index and the NASDAQ Composite® Index posting gains of 14.05% and 16.51%, respectively, for the period. The small-cap Russell 2000® Index rose 24.78% and the Russell Midcap® Index jumped 28.93%, while the blue-chips’ Dow Jones Industrial AverageSM advanced only 7.29% .
For the 12 months ending July 31, 2005, the fund’s Institutional Class shares gained 46.05% . By comparison, the Dow Jones Wilshire Real Estate Securities IndexSM returned 43.72% and the LipperSM Real Estate Funds Average returned 39.86% . The fund also beat the S&P 500®. Continued low interest rates, employment growth and substantial flows into the asset class boosted real estate investment trust (REIT) values in absolute terms as well as relative to the broad stock market. The fund’s outperformance of the Dow Jones Wilshire index stemmed much more from positive stock selection than from favorable sector weightings. In the mall sector, the fund was helped by Rouse and General Growth Properties, which acquired the former for a premium. General Growth gained as investors concluded that the company’s growth potential warranted a higher valuation. On the negative side, office REIT Reckson Associates Realty underperformed in part because of multiple equity offerings to finance acquisition opportunities that have yet to prove their value. Another underperformer was Duke Realty, an office and industrial REIT that was hurt by the lack of sufficient income-producing assets on its balance sheet.
The views expressed in this statement reflect those of the portfolio manager only through the end of the period of the report as stated on the cover and do not necessarily represent the views of Fidelity or any other person in the Fidelity organization. Any such views are subject to change at any time based upon market or other conditions and Fidelity disclaims any responsibility to update such views. These views may not be relied on as investment advice and, because investment decisions for a Fidelity fund are based on numerous factors, may not be relied on as an indication of trading intent on behalf of any Fidelity fund.
Shareholder Expense Example
As a shareholder of the Fund, you incur two types of costs: (1) transaction costs, including sales charges (loads) on purchase payments or redemption proceeds, and (2) ongoing costs, including management fees, distribution and/or service (12b-1) fees and other Fund expenses. This Example is intended to help you understand your ongoing costs (in dollars) of investing in the Fund and to compare these costs with the ongoing costs of investing in other mutual funds.
The Example is based on an investment of $1,000 invested at the beginning of the period and held for the entire period (February 1, 2005 to July 31, 2005).
The first line of the table below for each class of the Fund provides information about actual account values and actual expenses. You may use the information in this line, together with the amount you invested, to estimate the expenses that you paid over the period. Simply divide your account value by $1,000.00 (for example, an $8,600 account value divided by $1,000.00 = 8.6), then multiply the result by the number in the first line for a class of the Fund under the heading entitled “Expenses Paid During Period” to estimate the expenses you paid on your account during this period.
Hypothetical Example for Comparison Purposes
The second line of the table below for each class of the Fund provides information about hypothetical account values and hypothetical expenses based on a Class’ actual expense ratio and an assumed rate of return of 5% per year before expenses, which is not the Class’ actual return. The hypothetical account values and expenses may not be used to estimate the actual ending account balance or expenses you paid for the period. You may use this information to compare the ongoing costs of investing in the Fund and other funds. To do so, compare this 5% hypothetical example with the 5% hypothetical examples that appear in the shareholder reports of the other funds.
Please note that the expenses shown in the table are meant to highlight your ongoing costs only and do not reflect any transaction costs. Therefore, the second line of the table is useful in comparing ongoing costs only, and will not help you determine the relative total costs of owning different funds. In addition, if these transactional costs were included, your costs would have been higher.
| | | | | | | | | | | | | Expenses Paid |
| | | | | Beginning | | | | Ending | | | | During Period* |
| | | | | Account Value | | | | Account Value | | | | February 1, 2005 |
| | | | | February 1, 2005 | | | | July 31, 2005 | | | | to July 31, 2005 |
| Class A | | | | | | | | | | | | |
| Actual | | $ | | 1,000.00 | | $ | | 1,257.30 | | $ | | 7.00 |
| HypotheticalA | | $ | | 1,000.00 | | $ | | 1,018.60 | | $ | | 6.26 |
| Class T | | | | | | | | | | | | |
| Actual | | $ | | 1,000.00 | | $ | | 1,255.70 | | $ | | 8.39 |
| HypotheticalA | | $ | | 1,000.00 | | $ | | 1,017.36 | | $ | | 7.50 |
| Class B | | | | | | | | | | | | |
| Actual | | $ | | 1,000.00 | | $ | | 1,252.90 | | $ | | 11.17 |
| HypotheticalA | | $ | | 1,000.00 | | $ | | 1,014.88 | | $ | | 9.99 |
7 Annual Report
Shareholder Expense Example - continued
|
| | | | | | | | | | | | | Expenses Paid |
| | | | | Beginning | | | | Ending | | | | During Period* |
| | | | | Account Value | | | | Account Value | | | | February 1, 2005 |
| | | | | February 1, 2005 | | | | July 31, 2005 | | | | to July 31, 2005 |
| Class C | | | | | | | | | | | | |
| Actual | | $ | | 1,000.00 | | $ | | 1,252.70 | | $ | | 11.17 |
| HypotheticalA | | $ | | 1,000.00 | | $ | | 1,014.88 | | $ | | 9.99 |
| Institutional Class | | | | | | | | | | | | |
| Actual | | $ | | 1,000.00 | | $ | | 1,260.20 | | $ | | 4.88 |
| HypotheticalA | | $ | | 1,000.00 | | $ | | 1,020.48 | | $ | | 4.36 |
| | A 5% return per year before expenses
* Expenses are equal to each Class’ annualized expense ratio (shown in the table
|
below); multiplied by the average account value over the period, multiplied by 181/365 (to reflect the one-half year period).
| | | Annualized |
| | | Expense Ratio |
| Class A | | 1.25% |
| Class T | | 1.50% |
| Class B | | 2.00% |
| Class C | | 2.00% |
| Institutional Class | | 87% |
| Top Ten Stocks as of July 31, 2005 | | | | |
| | | % of fund’s | | % of fund’s net assets |
| | | net assets | | 6 months ago |
| Equity Residential (SBI) | | 6.3 | | 5.8 |
| Simon Property Group, Inc. | | 6.2 | | 6.7 |
| Equity Office Properties Trust | | 6.2 | | 5.2 |
| General Growth Properties, Inc. | | 5.9 | | 4.9 |
| Vornado Realty Trust | | 5.5 | | 5.5 |
| ProLogis | | 5.2 | | 5.4 |
| Starwood Hotels & Resorts Worldwide, Inc. unit | | 4.9 | | 4.6 |
| Boston Properties, Inc. | | 4.6 | | 4.2 |
| United Dominion Realty Trust, Inc. (SBI) | | 4.0 | | 3.2 |
| Reckson Associates Realty Corp. | | 3.8 | | 4.2 |
| | | 52.6 | | |
| Top Five REIT Sectors as of July 31, 2005 | | | | |
| | | % of fund’s | | % of fund’s net assets |
| | | net assets | | 6 months ago |
| REITs – Office Buildings | | 24.7 | | 23.0 |
| REITs – Industrial Buildings | | 15.0 | | 16.8 |
| REITs – Apartments | | 14.6 | | 13.5 |
| REITs – Malls | | 14.1 | | 12.8 |
| REITs – Shopping Centers | | 13.1 | | 15.6 |
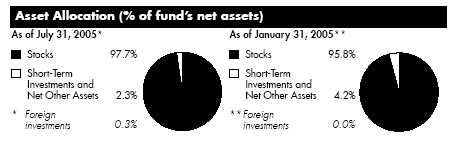
9 Annual Report
Investments July 31, 2005
Showing Percentage of Net Assets
|
| Common Stocks — 97.7% | | | | | | |
| | | Shares | | Value (Note 1) |
| |
| CAPITAL MARKETS – 0.3% | | | | | | |
| |
| Investment Banking & Brokerage – 0.3% | | | | | | |
| Eurocastle Investment Ltd. | | 20,900 | | $ | | 476,416 |
| |
| HOTELS, RESTAURANTS & LEISURE – 5.5% | | | | | | |
| |
| Hotels, Resorts & Cruise Lines – 5.5% | | | | | | |
| Hilton Hotels Corp. | | 44,700 | | | | 1,106,325 |
| Starwood Hotels & Resorts Worldwide, Inc. unit | | 137,410 | | | | 8,700,801 |
| |
| TOTAL HOTELS, RESORTS & CRUISE LINES | | | | | | 9,807,126 |
| |
| REAL ESTATE – 91.9% | | | | | | |
| |
| Real Estate Management & Development – 0.1% | | | | | | |
| CB Richard Ellis Group, Inc. Class A (a) | | 4,000 | | | | 184,160 |
| |
| REITs – Apartments – 14.6% | | | | | | |
| American Campus Communities, Inc. | | 34,700 | | | | 869,235 |
| AvalonBay Communities, Inc. | | 48,800 | | | | 4,272,928 |
| Equity Residential (SBI) | | 280,300 | | | | 11,324,119 |
| GMH Communities Trust | | 80,698 | | | | 1,209,663 |
| Pennsylvania Real Estate Investment Trust (SBI) | | 28,300 | | | | 1,384,153 |
| United Dominion Realty Trust, Inc. (SBI) | | 282,800 | | | | 7,197,260 |
| |
| TOTAL REITS – APARTMENTS | | | | | | 26,257,358 |
| |
| REITs – Factory Outlets – 1.1% | | | | | | |
| Tanger Factory Outlet Centers, Inc. | | 70,100 | | | | 2,018,880 |
| |
| REITs – Health Care Facilities – 1.2% | | | | | | |
| National Health Investors, Inc. | | 13,500 | | | | 415,395 |
| Omega Healthcare Investors, Inc. | | 24,400 | | | | 340,380 |
| Ventas, Inc. | | 43,500 | | | | 1,404,615 |
| |
| TOTAL REITS – HEALTH CARE FACILITIES | | | | | | 2,160,390 |
| |
| REITs – Hotels – 3.9% | | | | | | |
| Host Marriott Corp. | | 89,000 | | | | 1,659,850 |
| Innkeepers USA Trust (SBI) | | 203,300 | | | | 3,124,721 |
| MeriStar Hospitality Corp. (a) | | 232,480 | | | | 2,073,722 |
| Sunstone Hotel Investors, Inc. | | 6,800 | | | | 175,848 |
| |
| TOTAL REITS – HOTELS | | | | | | 7,034,141 |
See accompanying notes which are an integral part of the financial statements.
| Common Stocks – continued | | | | |
| | | Shares | | Value (Note 1) |
| |
| REAL ESTATE – CONTINUED | | | | |
| |
| REITs – Industrial Buildings – 15.0% | | | | |
| Catellus Development Corp. | | 95,605 | | $ 3,447,516 |
| CenterPoint Properties Trust (SBI) | | 77,000 | | 3,377,220 |
| Duke Realty Corp. | | 164,510 | | 5,586,760 |
| ProLogis | | 205,790 | | 9,375,792 |
| Public Storage, Inc. | | 69,100 | | 4,612,425 |
| U-Store-It Trust | | 21,900 | | 441,285 |
| |
| TOTAL REITS – INDUSTRIAL BUILDINGS | | | | 26,840,998 |
| |
| REITs – Malls – 14.1% | | | | |
| CBL & Associates Properties, Inc. | | 41,260 | | 1,893,009 |
| General Growth Properties, Inc. | | 231,699 | | 10,653,520 |
| Simon Property Group, Inc. | | 140,400 | | 11,195,496 |
| Taubman Centers, Inc. | | 45,600 | | 1,620,624 |
| |
| TOTAL REITS – MALLS | | | | 25,362,649 |
| |
| REITs – Management/Investment – 2.5% | | | | |
| Capital Automotive (REIT) (SBI) | | 15,000 | | 589,050 |
| Equity Lifestyle Properties, Inc. | | 48,300 | | 2,128,581 |
| Global Signal, Inc. | | 4,100 | | 175,890 |
| Plum Creek Timber Co., Inc. | | 27,800 | | 1,052,230 |
| Trustreet Properties, Inc. | | 30,900 | | 541,986 |
| |
| TOTAL REITS – MANAGEMENT/INVESTMENT | | | | 4,487,737 |
| |
| REITs – Mobile Home Parks – 0.1% | | | | |
| Sun Communities, Inc. | | 6,900 | | 240,465 |
| |
| REITs – Mortgage – 0.4% | | | | |
| Newcastle Investment Corp. | | 20,330 | | 628,197 |
| |
| REITs – Office Buildings – 24.7% | | | | |
| Boston Properties, Inc. | | 108,900 | | 8,292,735 |
| CarrAmerica Realty Corp. | | 68,200 | | 2,648,888 |
| Columbia Equity Trust, Inc. | | 77,900 | | 1,213,682 |
| Equity Office Properties Trust | | 313,700 | | 11,120,665 |
| Highwoods Properties, Inc. (SBI) | | 74,700 | | 2,364,255 |
| Kilroy Realty Corp. | | 25,900 | | 1,349,390 |
| Reckson Associates Realty Corp. | | 192,670 | | 6,766,570 |
| Shurgard Storage Centers, Inc. Class A | | 17,800 | | 834,820 |
See accompanying notes which are an integral part of the financial statements.
11 Annual Report
| Common Stocks – continued | | | | |
| | | Shares | | Value (Note 1) |
| |
| REAL ESTATE – CONTINUED | | | | |
| |
| REITs – Office Buildings – continued | | | | |
| SL Green Realty Corp. | | 58,200 | | $ 4,056,540 |
| Trizec Properties, Inc. | | 255,000 | | 5,602,350 |
| |
| TOTAL REITS – OFFICE BUILDINGS | | | | 44,249,895 |
| |
| REITs – Prisons – 1.1% | | | | |
| Correctional Properties Trust | | 65,490 | | 1,973,869 |
| |
| REITs – Shopping Centers – 13.1% | | | | |
| Federal Realty Investment Trust (SBI) | | 25,960 | | 1,695,448 |
| Inland Real Estate Corp. | | 62,300 | | 1,033,557 |
| Kimco Realty Corp. | | 102,700 | | 6,743,282 |
| Pan Pacific Retail Properties, Inc. | | 59,090 | | 4,107,346 |
| Vornado Realty Trust | | 110,950 | | 9,834,608 |
| |
| TOTAL REITS – SHOPPING CENTERS | | | | 23,414,241 |
| |
| TOTAL REAL ESTATE | | | | 164,852,980 |
| |
| TOTAL COMMON STOCKS | | | | |
| (Cost $131,614,109) | | | | 175,136,522 |
| |
| Money Market Funds — 2.6% | | | | |
| |
| Fidelity Cash Central Fund, 3.31% (b) | | | | |
| (Cost $4,734,898) | | 4,734,898 | | 4,734,898 |
| |
| TOTAL INVESTMENT PORTFOLIO – 100.3% | | | | |
| (Cost $136,349,007) | | | | 179,871,420 |
| |
| NET OTHER ASSETS – (0.3)% | | | | (549,436) |
| NET ASSETS – 100% | | $ | | 179,321,984 |
| |
| Legend | | (b) Affiliated fund that is available only to |
| (a) Non-income producing | | investment companies and other |
| | | accounts managed by Fidelity |
| | | Investments. The rate quoted is the |
| | | annualized seven-day yield of the fund |
| | | at period end. A complete listing of the |
| | | fund’s holdings as of its most recent |
| | | quarter end is available upon request. |
See accompanying notes which are an integral part of the financial statements.
| Statement of Assets and Liabilities | | | | | | | | |
| | | | | | | | | July 31, 2005 |
| Assets | | | | | | | | |
| Investment in securities, at value (cost $136,349,007) — | | | | | | | | |
| See accompanying schedule | | | | | | $ | | 179,871,420 |
| Receivable for investments sold | | | | | | | | 1,069,185 |
| Receivable for fund shares sold | | | | | | | | 822,737 |
| Dividends receivable | | | | | | | | 127,273 |
| Interest receivable | | | | | | | | 12,060 |
| Prepaid expenses | | | | | | | | 143 |
| Receivable from investment adviser for expense | | | | | | | | |
| reductions | | | | | | | | 13,642 |
| Other affiliated receivables | | | | | | | | 3,270 |
| Other receivables | | | | | | | | 24,600 |
| Total assets | | | | | | | | 181,944,330 |
| |
| Liabilities | | | | | | | | |
| Payable for investments purchased | | $ | | 2,094,406 | | | | |
| Payable for fund shares redeemed | | | | 283,481 | | | | |
| Accrued management fee | | | | 80,622 | | | | |
| Distribution fees payable | | | | 80,539 | | | | |
| Other affiliated payables | | | | 50,818 | | | | |
| Other payables and accrued expenses | | | | 32,480 | | | | |
| Total liabilities | | | | | | | | 2,622,346 |
| |
| Net Assets | | | | | | $ | | 179,321,984 |
| Net Assets consist of: | | | | | | | | |
| Paid in capital | | | | | | $ | | 129,903,787 |
| Undistributed net investment income | | | | | | | | 377,371 |
| Accumulated undistributed net realized gain (loss) on | | | | | | | | |
| investments and foreign currency transactions | | | | | | | | 5,518,413 |
| Net unrealized appreciation (depreciation) on | | | | | | | | |
| investments | | | | | | | | 43,522,413 |
| Net Assets | | | | | | $ | | 179,321,984 |
See accompanying notes which are an integral part of the financial statements.
13 Annual Report
Financial Statements - continued
|
| Statement of Assets and Liabilities - continued | | | | |
| | | | | July 31, 2005 |
| Calculation of Maximum Offering Price | | | | |
| Class A: | | | | |
| Net Asset Value and redemption price per share | | | | |
| ($53,096,875 ÷ 2,912,290 shares) | | $ | | 18.23 |
| |
| Maximum offering price per share (100/94.25 of $18.23) | | $ | | 19.34 |
| Class T: | | | | |
| Net Asset Value and redemption price per share | | | | |
| ($66,303,247 ÷ 3,637,329 shares) | | $ | | 18.23 |
| |
| Maximum offering price per share (100/96.50 of $18.23) | | $ | | 18.89 |
| Class B: | | | | |
| Net Asset Value and offering price per share | | | | |
| ($26,349,432 ÷ 1,451,279 shares)A | | $ | | 18.16 |
| |
| Class C: | | | | |
| Net Asset Value and offering price per share | | | | |
| ($29,410,360 ÷ 1,618,296 shares)A | | $ | | 18.17 |
| |
| Institutional Class: | | | | |
| Net Asset Value, offering price and redemption price per | | | | |
| share ($4,162,070 ÷ 227,094 shares) | | $ | | 18.33 |
| |
| A Redemption price per share is equal to net asset value less any applicable contingent deferred sales charge. | | | | |
See accompanying notes which are an integral part of the financial statements.
Annual Report 14
|
| Statement of Operations | | | | | | |
| | | | | Year ended July 31, 2005 |
| Investment Income | | | | | | |
| Dividends | | | | $ | | 3,863,213 |
| Interest | | | | | | 108,804 |
| Security lending | | | | | | 1,239 |
| Total income | | | | | | 3,973,256 |
| |
| Expenses | | | | | | |
| Management fee | | $ | | 705,340 | | |
| Transfer agent fees | | | | 439,979 | | |
| Distribution fees | | | | 712,005 | | |
| Accounting and security lending fees | | | | 50,804 | | |
| Independent trustees’ compensation | | | | 583 | | |
| Custodian fees and expenses | | | | 8,402 | | |
| Registration fees | | | | 63,325 | | |
| Audit | | | | 61,410 | | |
| Legal | | | | 1,233 | | |
| Miscellaneous | | | | 2,985 | | |
| Total expenses before reductions | | | | 2,046,066 | | |
| Expense reductions | | | | (85,046) | | 1,961,020 |
| |
| Net investment income (loss) | | | | | | 2,012,236 |
| Realized and Unrealized Gain (Loss) | | | | | | |
| Net realized gain (loss) on: | | | | | | |
| Investment securities | | | | 8,231,640 | | |
| Foreign currency transactions | | | | 4,590 | | |
| Total net realized gain (loss) | | | | | | 8,236,230 |
| Change in net unrealized appreciation (depreciation) on | | | | | | |
| investment securities | | | | | | 35,843,402 |
| Net gain (loss) | | | | | | 44,079,632 |
| Net increase (decrease) in net assets resulting from | | | | | | |
| operations | | | | $ | | 46,091,868 |
See accompanying notes which are an integral part of the financial statements.
15 Annual Report
Financial Statements - continued
|
| Statement of Changes in Net Assets | | | | | | | | |
| | | | | Year ended | | | | Year ended |
| | | | | July 31, | | | | July 31, |
| | | | | 2005 | | | | 2004 |
| Increase (Decrease) in Net Assets | | | | | | | | |
| Operations | | | | | | | | |
| Net investment income (loss) | | $ | | 2,012,236 | | $ | | 954,921 |
| Net realized gain (loss) | | | | 8,236,230 | | | | 1,530,823 |
| Change in net unrealized appreciation (depreciation) . | | | | 35,843,402 | | | | 5,162,230 |
| Net increase (decrease) in net assets resulting | | | | | | | | |
| from operations | | | | 46,091,868 | | | | 7,647,974 |
| Distributions to shareholders from net investment income . | | | | (1,811,337) | | | | (926,122) |
| Distributions to shareholders from net realized gain | | | | (3,726,590) | | | | (347,381) |
| Total distributions | | | | (5,537,927) | | | | (1,273,503) |
| Share transactions -- net increase (decrease) | | | | 61,397,757 | | | | 46,608,300 |
| Total increase (decrease) in net assets | | | | 101,951,698 | | | | 52,982,771 |
| |
| Net Assets | | | | | | | | |
| Beginning of period | | | | 77,370,286 | | | | 24,387,515 |
| End of period (including undistributed net investment | | | | | | | | |
| income of $377,371 and undistributed net invest- | | | | | | | | |
| ment income of $97,635, respectively) | | $ | | 179,321,984 | | $ | | 77,370,286 |
See accompanying notes which are an integral part of the financial statements.
| Financial Highlights — Class A | | | | | | | | | | | | |
| Years ended July 31, | | | | 2005 | | | | 2004 | | | | 2003F |
| Selected Per-Share Data | | | | | | | | | | | | |
| Net asset value, beginning of period | | $ | | 13.22 | | $ | | 11.33 | | $ | | 10.00 |
| Income from Investment Operations | | | | | | | | | | | | |
| Net investment income (loss)E | | | | 31 | | | | .27 | | | | .21 |
| Net realized and unrealized gain (loss) | | | | 5.52 | | | | 2.03 | | | | 1.28 |
| Total from investment operations | | | | 5.83 | | | | 2.30 | | | | 1.49 |
| Distributions from net investment income | | | | (.29) | | | | (.30) | | | | (.16) |
| Distributions from net realized gain | | | | (.53) | | | | (.11) | | | | — |
| Total distributions | | | | (.82) | | | | (.41) | | | | (.16) |
| Net asset value, end of period | | $ | | 18.23 | | $ | | 13.22 | | $ | | 11.33 |
| Total ReturnB,C,D | | | | 45.48% | | | | 20.59% | | | | 15.13% |
| Ratios to Average Net AssetsG | | | | | | | | | | | | |
| Expenses before expense reductions | | | | 1.31% | | | | 1.54% | | | | 2.98%A |
| Expenses net of voluntary waivers, if any | | | | 1.28% | | | | 1.54% | | | | 1.75%A |
| Expenses net of all reductions | | | | 1.25% | | | | 1.52% | | | | 1.72%A |
| Net investment income (loss) | | | | 1.98% | | | | 2.10% | | | | 2.35%A |
| Supplemental Data | | | | | | | | | | | | |
| Net assets, end of period (000 omitted) | | $53,097 | | $22,273 | | $ | | 3,993 |
| Portfolio turnover rate | | | | 62% | | | | 52% | | | | 47%A |
A Annualized
B Total returns for periods of less than one year are not annualized.
C Total returns would have been lower had certain expenses not been reduced during the periods shown.
D Total returns do not include the effect of the sales charges.
E Calculated based on average shares outstanding during the period.
F For the period September 12, 2002 (commencement of operations) to July 31, 2003.
G Expense ratios reflect operating expenses of the class. Expenses before reductions do not reflect amounts reimbursed by the investment adviser or
reductions from brokerage service arrangements or other expense offset arrangements and do not represent the amount paid by the class during
periods when reimbursements or reductions occur. Expense ratios before reductions for start up periods may not be representative of longer term
operating periods. Expenses net of any voluntary waivers reflect expenses after reimbursement by the investment adviser but prior to reductions
from brokerage service arrangements or other expense offset arrangements. Expenses net of all reductions represent the net expenses paid by the
class.
|
See accompanying notes which are an integral part of the financial statements.
17 Annual Report
| Financial Highlights — Class T | | | | | | | | | | | | |
| Years ended July 31, | | | | 2005 | | | | 2004 | | | | 2003F |
| Selected Per-Share Data | | | | | | | | | | | | |
| Net asset value, beginning of period | | $ | | 13.21 | | $ | | 11.32 | | $ | | 10.00 |
| Income from Investment Operations | | | | | | | | | | | | |
| Net investment income (loss)E | | | | 26 | | | | .23 | | | | .18 |
| Net realized and unrealized gain (loss) | | | | 5.53 | | | | 2.02 | | | | 1.29 |
| Total from investment operations | | | | 5.79 | | | | 2.25 | | | | 1.47 |
| Distributions from net investment income | | | | (.24) | | | | (.25) | | | | (.15) |
| Distributions from net realized gain | | | | (.53) | | | | (.11) | | | | — |
| Total distributions | | | | (.77) | | | | (.36) | | | | (.15) |
| Net asset value, end of period | | $ | | 18.23 | | $ | | 13.21 | | $ | | 11.32 |
| Total ReturnB,C,D | | | | 45.12% | | | | 20.12% | | | | 14.91% |
| Ratios to Average Net AssetsG | | | | | | | | | | | | |
| Expenses before expense reductions | | | | 1.61% | | | | 1.86% | | | | 3.32%A |
| Expenses net of voluntary waivers, if any | | | | 1.57% | | | | 1.85% | | | | 2.00%A |
| Expenses net of all reductions | | | | 1.54% | | | | 1.83% | | | | 1.97%A |
| Net investment income (loss) | | | | 1.70% | | | | 1.80% | | | | 2.10%A |
| Supplemental Data | | | | | | | | | | | | |
| Net assets, end of period (000 omitted) | | $66,303 | | $26,037 | | $ | | 9,049 |
| Portfolio turnover rate | | | | 62% | | | | 52% | | | | 47%A |
A Annualized
B Total returns for periods of less than one year are not annualized.
C Total returns would have been lower had certain expenses not been reduced during the periods shown.
D Total returns do not include the effect of the sales charges.
E Calculated based on average shares outstanding during the period.
F For the period September 12, 2002 (commencement of operations) to July 31, 2003.
G Expense ratios reflect operating expenses of the class. Expenses before reductions do not reflect amounts reimbursed by the investment adviser or
reductions from brokerage service arrangements or other expense offset arrangements and do not represent the amount paid by the class during
periods when reimbursements or reductions occur. Expense ratios before reductions for start up periods may not be representative of longer term
operating periods. Expenses net of any voluntary waivers reflect expenses after reimbursement by the investment adviser but prior to reductions
from brokerage service arrangements or other expense offset arrangements. Expenses net of all reductions represent the net expenses paid by the
class.
|
See accompanying notes which are an integral part of the financial statements.
| Financial Highlights — Class B | | | | | | | | | | | | |
| Years ended July 31, | | | | 2005 | | | | 2004 | | | | 2003F |
| Selected Per-Share Data | | | | | | | | | | | | |
| Net asset value, beginning of period | | $ | | 13.18 | | $ | | 11.29 | | $ | | 10.00 |
| Income from Investment Operations | | | | | | | | | | | | |
| Net investment income (loss)E | | | | 18 | | | | .16 | | | | .14 |
| Net realized and unrealized gain (loss) | | | | 5.50 | | | | 2.04 | | | | 1.28 |
| Total from investment operations | | | | 5.68 | | | | 2.20 | | | | 1.42 |
| Distributions from net investment income | | | | (.17) | | | | (.20) | | | | (.13) |
| Distributions from net realized gain | | | | (.53) | | | | (.11) | | | | — |
| Total distributions | | | | (.70) | | | | (.31) | | | | (.13) |
| Net asset value, end of period | | $ | | 18.16 | | $ | | 13.18 | | $ | | 11.29 |
| Total ReturnB,C,D | | | | 44.31% | | | | 19.67% | | | | 14.38% |
| Ratios to Average Net AssetsG | | | | | | | | | | | | |
| Expenses before expense reductions | | | | 2.10% | | | | 2.33% | | | | 3.82%A |
| Expenses net of voluntary waivers, if any | | | | 2.07% | | | | 2.33% | | | | 2.50%A |
| Expenses net of all reductions | | | | 2.03% | | | | 2.31% | | | | 2.47%A |
| Net investment income (loss) | | | | 1.20% | | | | 1.31% | | | | 1.60%A |
| Supplemental Data | | | | | | | | | | | | |
| Net assets, end of period (000 omitted) | | $26,349 | | $12,910 | | $ | | 5,061 |
| Portfolio turnover rate | | | | 62% | | | | 52% | | | | 47%A |
A Annualized
B Total returns for periods of less than one year are not annualized.
C Total returns would have been lower had certain expenses not been reduced during the periods shown.
D Total returns do not include the effect of the contingent deferred sales charge.
E Calculated based on average shares outstanding during the period.
F For the period September 12, 2002 (commencement of operations) to July 31, 2003.
G Expense ratios reflect operating expenses of the class. Expenses before reductions do not reflect amounts reimbursed by the investment adviser or
reductions from brokerage service arrangements or other expense offset arrangements and do not represent the amount paid by the class during
periods when reimbursements or reductions occur. Expense ratios before reductions for start up periods may not be representative of longer term
operating periods. Expenses net of any voluntary waivers reflect expenses after reimbursement by the investment adviser but prior to reductions
from brokerage service arrangements or other expense offset arrangements. Expenses net of all reductions represent the net expenses paid by the
class.
|
See accompanying notes which are an integral part of the financial statements.
19 Annual Report
| Financial Highlights — Class C | | | | | | | | | | | | |
| Years ended July 31, | | | | 2005 | | | | 2004 | | | | 2003F |
| Selected Per-Share Data | | | | | | | | | | | | |
| Net asset value, beginning of period | | $ | | 13.18 | | $ | | 11.29 | | $ | | 10.00 |
| Income from Investment Operations | | | | | | | | | | | | |
| Net investment income (loss)E | | | | 19 | | | | .17 | | | | .14 |
| Net realized and unrealized gain (loss) | | | | 5.50 | | | | 2.03 | | | | 1.28 |
| Total from investment operations | | | | 5.69 | | | | 2.20 | | | | 1.42 |
| Distributions from net investment income | | | | (.17) | | | | (.20) | | | | (.13) |
| Distributions from net realized gain | | | | (.53) | | | | (.11) | | | | — |
| Total distributions | | | | (.70) | | | | (.31) | | | | (.13) |
| Net asset value, end of period | | $ | | 18.17 | | $ | | 13.18 | | $ | | 11.29 |
| Total ReturnB,C,D | | | | 44.38% | | | | 19.67% | | | | 14.38% |
| Ratios to Average Net AssetsG | | | | | | | | | | | | |
| Expenses before expense reductions | | | | 2.09% | | | | 2.29% | | | | 3.76%A |
| Expenses net of voluntary waivers, if any | | | | 2.05% | | | | 2.29% | | | | 2.50%A |
| Expenses net of all reductions | | | | 2.02% | | | | 2.27% | | | | 2.47%A |
| Net investment income (loss) | | | | 1.22% | | | | 1.35% | | | | 1.60%A |
| Supplemental Data | | | | | | | | | | | | |
| Net assets, end of period (000 omitted) | | $29,410 | | $13,671 | | $ | | 5,059 |
| Portfolio turnover rate | | | | 62% | | | | 52% | | | | 47%A |
A Annualized
B Total returns for periods of less than one year are not annualized.
C Total returns would have been lower had certain expenses not been reduced during the periods shown.
D Total returns do not include the effect of the contingent deferred sales charge.
E Calculated based on average shares outstanding during the period.
F For the period September 12, 2002 (commencement of operations) to July 31, 2003.
G Expense ratios reflect operating expenses of the class. Expenses before reductions do not reflect amounts reimbursed by the investment adviser or
reductions from brokerage service arrangements or other expense offset arrangements and do not represent the amount paid by the class during
periods when reimbursements or reductions occur. Expense ratios before reductions for start up periods may not be representative of longer term
operating periods. Expenses net of any voluntary waivers reflect expenses after reimbursement by the investment adviser but prior to reductions
from brokerage service arrangements or other expense offset arrangements. Expenses net of all reductions represent the net expenses paid by the
class.
|
See accompanying notes which are an integral part of the financial statements.
| Financial Highlights — Institutional Class | | | | | | | | | | |
| Years ended July 31, | | | | 2005 | | | | 2004 | | | | 2003E |
| Selected Per-Share Data | | | | | | | | | | | | |
| Net asset value, beginning of period | | $ | | 13.28 | | $ | | 11.35 | | $ | | 10.00 |
| Income from Investment Operations | | | | | | | | | | | | |
| Net investment income (loss)D | | | | 36 | | | | .32 | | | | .23 |
| Net realized and unrealized gain (loss) | | | | 5.56 | | | | 2.04 | | | | 1.28 |
| Total from investment operations | | | | 5.92 | | | | 2.36 | | | | 1.51 |
| Distributions from net investment income | | | | (.34) | | | | (.32) | | | | (.16) |
| Distributions from net realized gain | | | | (.53) | | | | (.11) | | | | — |
| Total distributions | | | | (.87) | | | | (.43) | | | | (.16) |
| Net asset value, end of period | | $ | | 18.33 | | $ | | 13.28 | | $ | | 11.35 |
| Total ReturnB,C | | | | 46.05% | | | | 21.11% | | | | 15.33% |
| Ratios to Average Net AssetsF | | | | | | | | | | | | |
| Expenses before expense reductions | | | | 91% | | | | 1.12% | | | | 2.68%A |
| Expenses net of voluntary waivers, if any | | | | 91% | | | | 1.12% | | | | 1.50%A |
| Expenses net of all reductions | | | | 88% | | | | 1.10% | | | | 1.47%A |
| Net investment income (loss) | | | | 2.35% | | | | 2.53% | | | | 2.60%A |
| Supplemental Data | | | | | | | | | | | | |
| Net assets, end of period (000 omitted) | | $ | | 4,162 | | $ | | 2,478 | | $ | | 1,225 |
| Portfolio turnover rate | | | | 62% | | | | 52% | | | | 47%A |
A Annualized
B Total returns for periods of less than one year are not annualized.
C Total returns would have been lower had certain expenses not been reduced during the periods shown.
D Calculated based on average shares outstanding during the period.
E For the period September 12, 2002 (commencement of operations) to July 31, 2003.
F Expense ratios reflect operating expenses of the class. Expenses before reductions do not reflect amounts reimbursed by the investment adviser or
reductions from brokerage service arrangements or other expense offset arrangements and do not represent the amount paid by the class during
periods when reimbursements or reductions occur. Expense ratios before reductions for start up periods may not be representative of longer term
operating periods. Expenses net of any voluntary waivers reflect expenses after reimbursement by the investment adviser but prior to reductions
from brokerage service arrangements or other expense offset arrangements. Expenses net of all reductions represent the net expenses paid by the
class.
|
See accompanying notes which are an integral part of the financial statements.
21 Annual Report
Notes to Financial Statements
For the period ended July 31, 2005
|
1. Significant Accounting Policies.
Fidelity Advisor Real Estate Fund (the fund) is a non-diversified fund of Fidelity Advisor Series VII (the trust) and is authorized to issue an unlimited number of shares. The trust is registered under the Investment Company Act of 1940, as amended (the 1940 Act), as an open-end management investment company organized as a Massachusetts business trust.
The fund offers Class A, Class T, Class B, Class C, and Institutional Class shares, each of which has equal rights as to assets and voting privileges. Each class has exclusive voting rights with respect to matters that affect that class. Class B shares will automatically convert to Class A shares after a holding period of seven years from the initial date of purchase. Investment income, realized and unrealized capital gains and losses, the common expenses of the fund, and certain fund-level expense reductions, if any, are allocated on a pro rata basis to each class based on the relative net assets of each class to the total net assets of the fund. Each class differs with respect to transfer agent and distribution and service plan fees incurred. Certain expense reductions also differ by class.
The financial statements have been prepared in conformity with accounting principles generally accepted in the United States of America, which require management to make certain estimates and assumptions at the date of the financial statements. The following summarizes the significant accounting policies of the fund:
Security Valuation. Net asset value per share (NAV calculation) is calculated as of the close of business of the New York Stock Exchange, normally 4:00 p.m. Eastern time. Equity securities, including restricted securities, for which market quotations are available are valued at the last sale price or official closing price (closing bid price or last evaluated quote if no sale has occurred) on the primary market or exchange on which they trade. If prices are not readily available or do not accurately reflect fair value for a security, or if a security’s value has been materially affected by events occurring after the close of the exchange or market on which the security is principally traded, that security may be valued by another method that the Board of Trustees believes accurately reflects fair value. A security’s valuation may differ depending on the method used for determining value. Price movements in futures contracts and ADRs, market and trading trends, the bid/ask quotes of brokers and off-exchange institutional trading may be reviewed in the course of making a good faith determination of a security’s fair value. Short-term securities with remaining maturities of sixty days or less for which quotations are not readily available are valued on the basis of amortized cost. Investments in open-end investment companies are valued at their net asset value each business day.
1. Significant Accounting Policies - continued
Foreign Currency. The fund uses foreign currency contracts to facilitate transactions in foreign-denominated securities. Losses from these transactions may arise from changes in the value of the foreign currency or if the counterparties do not perform under the contracts’ terms.
Foreign-denominated assets, including investment securities, and liabilities are translated into U.S. dollars at the exchange rate at period end. Purchases and sales of investment securities, income and dividends received and expenses denominated in foreign currencies are translated into U.S. dollars at the exchange rate in effect on the transaction date.
The effects of exchange rate fluctuations on investments are included with the net realized and unrealized gain (loss) on investment securities. Other foreign currency transactions resulting in realized and unrealized gain (loss) are disclosed separately.
Investment Transactions and Income. Security transactions are accounted for as of trade date. Gains and losses on securities sold are determined on the basis of identified cost. Dividend income is recorded on the ex-dividend date, except for certain dividends from foreign securities where the ex-dividend date may have passed, which are recorded as soon as the fund is informed of the ex-dividend date. Non-cash dividends included in dividend income, if any, are recorded at the fair market value of the securities received. Distributions received on securities that represent a return of capital or capital gain are recorded as a reduction of cost of investments and/or as a realized gain. The fund estimates the components of distributions received that may be considered return of capital distributions or capital gain distributions. Interest income is accrued as earned. Interest income includes coupon interest and amortization of premium and accretion of discount on debt securities. Investment income is recorded net of foreign taxes withheld where recovery of such taxes is uncertain.
Expenses. Most expenses of the trust can be directly attributed to a fund. Expenses which cannot be directly attributed are apportioned among each fund in the trust.
Income Tax Information and Distributions to Shareholders. Each year, the fund intends to qualify as a regulated investment company by distributing all of its taxable income and realized gains under Subchapter M of the Internal Revenue Code. As a result, no provision for income taxes is required in the accompanying financial statements. Foreign taxes are provided for based on the fund’s understanding of the tax rules and rates that exist in the foreign markets in which it invests.
Distributions are recorded on the ex-dividend date. Income dividends and capital gain distributions are declared separately for each class. Income and capital gain distributions are determined in accordance with income tax regulations, which may differ from generally accepted accounting principles. In addition, the fund will claim a portion of the
23 Annual Report
| Notes to Financial Statements - continued |
| 1. Significant Accounting Policies - continued |
| Income Tax Information and Distributions to Shareholders - continued |
payment made to redeeming shareholders as a distribution for income tax purposes. Capital accounts within the financial statements are adjusted for permanent book-tax differences. These adjustments have no impact on net assets or the results of operations. Temporary book-tax differences will reverse in a subsequent period.
Distributions are recorded on the ex-dividend date. Income dividends and capital gain distributions are declared separately for each class. Income and capital gain distributions are determined in accordance with income tax regulations, which may differ from generally accepted accounting principles. In addition, the fund will claim a portion of the payment made to redeeming shareholders as a distribution for income tax purposes. Capital accounts within the financial statements are adjusted for permanent book-tax differences. These adjustments have no impact on net assets or the results of operations. Temporary book-tax differences will reverse in a subsequent period.
Book-tax differences are primarily due to foreign currency transactions, passive foreign investment companies (PFIC), and losses deferred due to wash sales.
The tax-basis components of distributable earnings and the federal tax cost as of period end were as follows:
| Unrealized appreciation | | $ | | 43,307,627 |
| Unrealized depreciation | | | | (47,576) |
| Net unrealized appreciation (depreciation) | | | | 43,260,051 |
| Undistributed ordinary income | | | | 2,668,488 |
| Undistributed long-term capital gain | | | | 2,749,437 |
| |
| Cost for federal income tax purposes | | $ | | 136,611,369 |
The tax character of distributions paid was as follows:
|
| | | | | July 31, 2005 | | | | July 31, 2004 |
| Ordinary Income | | $ | | 2,778,359 | | $ | | 1,154,760 |
| Long-term Capital Gains | | | | 2,759,568 | | | | 118,743 |
| Total | | $ | | 5,537,927 | | $ | | 1,273,503 |
Repurchase Agreements. Fidelity Management & Research Company (FMR) has received an Exemptive Order from the Securities and Exchange Commission (the SEC) which permits the fund and other affiliated entities of FMR to transfer uninvested cash balances into joint trading accounts which are then invested in repurchase agreements. The fund may also invest directly with institutions in repurchase agreements. Repurchase agreements are collateralized by government or non-government securities.
2. Operating Policies - continued
Repurchase Agreements - continued
Collateral is held in segregated accounts with custodian banks and may be obtained in the event of a default of the counterparty. The fund monitors, on a daily basis, the value of the collateral to ensure it is at least equal to the principal amount of the repurchase agreement (including accrued interest). In the event of a default by the counterparty, realization of the collateral proceeds could be delayed, during which time the value of the collateral may decline.
3. Purchases and Sales of Investments.
Purchases and sales of securities, other than short-term securities and U.S. government securities, aggregated $131,539,751 and $73,634,784, respectively.
4. Fees and Other Transactions with Affiliates.
Management Fee. FMR and its affiliates provide the fund with investment management related services for which the fund pays a monthly management fee. The management fee is the sum of an individual fund fee rate that is based on an annual rate of .30% of the fund’s average net assets and a group fee rate that averaged .27% during the period. The group fee rate is based upon the average net assets of all the mutual funds advised by FMR. The group fee rate decreases as assets under management increase and increases as assets under management decrease. For the period, the total annual management fee rate was .57% of the fund’s average net assets.
Distribution and Service Plan. In accordance with Rule 12b-1 of the 1940 Act, the fund has adopted separate Distribution and Service Plans for each class of shares. Certain classes pay Fidelity Distributors Corporation (FDC), an affiliate of FMR, separate Distribution and Service Fees, each of which is based on an annual percentage of each class’ average net assets. In addition, FDC may pay financial intermediaries for selling shares of the fund and providing shareholder support services. For the period, the Distribution and Service Fee rates and the total amounts paid to and retained by FDC were as follows:
| | | Distribution | | Service | | | | Paid to | | | | Retained |
| | | Fee | | Fee | | | | FDC | | | | by FDC |
| |
| Class A | | 0% | | .25% | | $ | | 88,275 | | $ | | 2,464 |
| Class T | | 25% | | .25% | | | | 221,765 | | | | 6,329 |
| Class B | | 75% | | .25% | | | | 191,965 | | | | 148,021 |
| Class C | | 75% | | .25% | | | | 210,000 | | | | 85,023 |
| |
| | | | | | | $ | | 712,005 | | $ | | 241,837 |
25 Annual Report
Notes to Financial Statements - continued
4. Fees and Other Transactions with Affiliates - continued
|
Sales Load. FDC receives a front-end sales charge of up to 5.75% for selling Class A shares, and 3.50% for selling Class T shares, some of which is paid to financial intermediaries for selling shares of the fund. FDC receives the proceeds of contingent deferred sales charges levied on Class A, Class T, Class B, and Class C redemptions. These charges depend on the holding period. The deferred sales charges range from 5% to 1% for Class B, 1% for Class C, and .25% for certain purchases of Class A and Class T shares.
For the period, sales charge amounts retained by FDC were as follows:
| | | | | Retained |
| | | | | by FDC |
| Class A | | $ | | 96,660 |
| Class T | | | | 19,865 |
| Class B* | | | | 42,753 |
| Class C* | | | | 5,887 |
| | | $ | | 165,165 |
* When Class B and Class C shares are initially sold, FDC pays commissions from its own resources to financial intermediaries through which the sales are made.
Transfer Agent Fees. Fidelity Investments Institutional Operations Company, Inc. (FIIOC), an affiliate of FMR, is the transfer, dividend disbursing and shareholder servicing agent for each class of the fund. FIIOC receives account fees and asset-based fees that vary according to the account size and type of account of the shareholders of the respective classes of the fund. FIIOC pays for typesetting, printing and mailing of shareholder reports, except proxy statements. For the period the total transfer agent fees paid by each class to FIIOC, were as follows:
| | | | | | | % of |
| | | | | | | Average |
| | | | | Amount | | Net Assets |
| Class A | | $ | | 116,458 | | .33 |
| Class T | | | | 170,323 | | .38 |
| Class B | | | | 71,994 | | .38 |
| Class C | | | | 75,200 | | .36 |
| Institutional Class | | | | 6,004 | | .19 |
| |
| | | $ | | 439,979 | | |
Accounting and Security Lending Fees. Fidelity Service Company, Inc. (FSC), an affiliate of FMR, maintains the fund’s accounting records. The accounting fee is based on the level of average net assets for the month. Under a separate contract, FSC administers the security lending program. The security lending fee is based on the number and duration of lending transactions.
4. Fees and Other Transactions with Affiliates - continued
Central Funds. The fund may invest in affiliated Central Funds managed by Fidelity Investments Money Management, Inc. (FIMM), an affiliate of FMR. The Central Funds are open-end investment companies available only to investment companies and other accounts managed by FMR and its affiliates. The Money Market Central Funds seek preservation of capital and current income. The Central Funds do not pay a management fee. Income distributions earned by the fund are recorded as income in the accompanying financial statements and totaled $111,575 for the period.
Brokerage Commissions. The fund placed a portion of its portfolio transactions with brokerage firms which are affiliates of the investment adviser. The commissions paid to these affiliated firms were $7,360 for the period.
5. Committed Line of Credit.
|
The fund participates with other funds managed by FMR in a $4.2 billion credit facility (the “line of credit”) to be utilized for temporary or emergency purposes to fund shareholder redemptions or for other short-term liquidity purposes. The fund has agreed to pay commitment fees on its pro rata portion of the line of credit. During the period, there were no borrowings on this line of credit.
The fund lends portfolio securities from time to time in order to earn additional income. The fund receives collateral (in the form of U.S. Treasury obligations, letters of credit and/or cash) against the loaned securities and maintains collateral in an amount not less than 100% of the market value of the loaned securities during the period of the loan. The market value of the loaned securities is determined at the close of business of the fund and any additional required collateral is delivered to the fund on the next business day. If the borrower defaults on its obligation to return the securities loaned because of insolvency or other reasons, a fund could experience delays and costs in recovering the securities loaned or in gaining access to the collateral. At period end there were no security loans outstanding.
FMR voluntarily agreed to reimburse each class to the extent annual operating expenses exceeded certain levels of average net assets as noted in the table below. Some expenses, for example interest expense, are excluded from this reimbursement.
27 Annual Report
| Notes to Financial Statements - continued | | | | |
| |
| |
| 7. Expense Reductions - continued | | | | | | | | | | |
| |
| The following classes were in reimbursement during the period: | | | | |
| | | Expense | | | | Reimbursement |
| | | Limitations | | | | from adviser |
| Class A | | 1.50 | | -- | | 1.25%* | | $ | | 8,714 |
| Class T | | 1.75 | | -- | | 1.50%* | | | | 19,239 |
| Class B | | 2.25 | | -- | | 2.00%* | | | | 6,735 |
| Class C | | 2.25 | | -- | | 2.00%* | | | | 7,994 |
| Institutional Class | | 1.25 | | -- | | 1.00%* | | | | — |
| | | | | | | | | $ | | 42,682 |
| |
| * Expense limitation in effect at period end. | | | | | | | | | | |
Many of the brokers with whom FMR places trades on behalf of the fund provided services to the fund in addition to trade execution. These services included payments of certain expenses on behalf of the fund totaling $42,145 for the period. In addition, through arrangements with the fund’s custodian, credits realized as a result of uninvested cash balances were used to reduce the fund’s expenses. During the period, these credits reduced the fund’s custody expenses by $219.
The fund’s organizational documents provide former and current trustees and officers with a limited indemnification against liabilities arising in connection with the performance of their duties to the fund. In the normal course of business, the fund may also enter into contracts that provide general indemnifications. The fund’s maximum exposure under these arrangements is unknown as this would be dependent on future claims that may be made against the fund. The risk of material loss from such claims is considered remote.
| | 9. Distributions to Shareholders.
|
Distributions to shareholders of each class were as follows:
|
| Years ended July 31, | | | | 2005 | | | | 2004 |
| From net investment income | | | | | | | | |
| Class A | | $ | | 641,230 | | $ | | 223,988 |
| Class T | | | | 658,084 | | | | 338,921 |
| Class B | | | | 211,083 | | | | 134,524 |
| Class C | | | | 231,206 | | | | 149,846 |
| Institutional Class | | | | 69,734 | | | | 78,843 |
| Total | | $ | | 1,811,337 | | $ | | 926,122 |
9. Distributions to Shareholders - continued
|
| Years ended July 31, | | | | 2005 | | | | 2004 |
| From net realized gain | | | | | | | | |
| Class A | | $ | | 1,060,102 | | $ | | 60,915 |
| Class T | | | | 1,278,789 | | | | 134,733 |
| Class B | | | | 601,375 | | | | 65,143 |
| Class C | | | | 680,328 | | | | 72,033 |
| Institutional Class | | | | 105,996 | | | | 14,557 |
| Total | | $ | | 3,726,590 | | $ | | 347,381 |
10. Share Transactions.
Transactions for each class of shares were as follows:
| | | Shares | | | | | | Dollars |
| Years ended July 31, | | 2005 | | 2004 | | | | 2005 | | | | 2004 |
| Class A | | | | | | | | | | | | |
| Shares sold | | 1,794,039 | | 1,691,797 | | $ 27,861,174 | | $ 21,569,901 |
| Reinvestment of distributions | | 108,047 | | 21,187 | | | | 1,637,672 | | | | 260,814 |
| Shares redeemed | | (674,456) | | (380,797) | | (10,403,304) | | | | (4,789,141) |
| Net increase (decrease) | | 1,227,630 | | 1,332,187 | | $ 19,095,542 | | $ 17,041,574 |
| Class T | | | | | | | | | | | | |
| Shares sold | | 2,519,838 | | 1,742,381 | | $ 38,726,163 | | $ 21,601,367 |
| Reinvestment of distributions | | 120,472 | | 34,588 | | | | 1,827,521 | | | | 422,832 |
| Shares redeemed | | (973,349) | | (606,188) | | (14,990,709) | | | | (7,552,018) |
| Net increase (decrease) | | 1,666,961 | | 1,170,781 | | $ 25,562,975 | | $ 14,472,181 |
| Class B | | | | | | | | | | | | |
| Shares sold | | 716,470 | | 707,114 | | $ 10,968,432 | | $ | | 8,864,483 |
| Reinvestment of distributions | | 47,658 | | 14,020 | | | | 717,181 | | | | 172,618 |
| Shares redeemed | | (292,735) | | (189,581) | | | | (4,504,213) | | | | (2,352,682) |
| Net increase (decrease) | | 471,393 | | 531,553 | | $ | | 7,181,400 | | $ | | 6,684,419 |
| Class C | | | | | | | | | | | | |
| Shares sold | | 948,824 | | 935,005 | | $ 14,523,391 | | $ 11,727,832 |
| Reinvestment of distributions | | 54,204 | | 15,332 | | | | 815,331 | | | | 188,794 |
| Shares redeemed | | (421,720) | | (361,431) | | | | (6,415,506) | | | | (4,519,507) |
| Net increase (decrease) | | 581,308 | | 588,906 | | $ | | 8,923,216 | | $ | | 7,397,119 |
| Institutional Class | | | | | | | | | | | | |
| Shares sold | | 56,832 | | 476,197 | | $ | | 882,400 | | $ | | 6,021,426 |
| Reinvestment of distributions | | 10,199 | | 6,777 | | | | 154,843 | | | | 85,108 |
| Shares redeemed | | (26,530) | | (404,277) | | | | (402,619) | | | | (5,093,527) |
| Net increase (decrease) | | 40,501 | | 78,697 | | $ | | 634,624 | | $ | | 1,013,007 |
29 Annual Report
Report of Independent Registered Public Accounting Firm
To the Trustees of Fidelity Advisor Series VII and Shareholders of Fidelity Advi sor Real Estate Fund:
We have audited the accompanying statement of assets and liabilities of Fidelity Advisor Real Estate Fund (the Fund), a fund of Fidelity Advisor Series VII, including the portfolio of investments, as of July 31, 2005, and the related statement of operations for the year then ended, the statement of changes in net assets for each of the two years in the period then ended, and the financial highlights for the two years ended July 31, 2005 and July 31, 2004 and for the period from September 12, 2002 (commencement of operations) to July 31, 2003. These financial statements and financial highlights are the responsibility of the Fund’s management. Our responsibility is to express an opinion on these financial statements and financial highlights based on our audits.
We conducted our audits in accordance with standards of the Public Company Accounting Oversight Board (United States). Those standards require that we plan and perform the audit to obtain reasonable assurance about whether the financial statements and financial highlights are free of material misstatement. The Fund is not required to have, nor were we engaged to perform, an audit of its internal control over financial reporting. Our audits included consideration of internal control over financial reporting as a basis for designing audit procedures that are appropriate in the circumstances, but not for the purpose of expressing an opinion on the effectiveness of the Fund’s internal control over financial reporting. Accordingly, we express no such opinion. An audit also includes examining, on a test basis, evidence supporting the amounts and disclosures in the financial statements, assessing the accounting principles used and significant estimates made by management, as well as evaluating the overall financial statement presentation. Our procedures included confirmation of securities owned as of July 31, 2005, by correspondence with the custodians and brokers; where replies were not received from brokers, we performed other auditing procedures. We believe that our audits provide a reasonable basis for our opinion.
In our opinion, the financial statements and financial highlights referred to above present fairly, in all material respects, the financial position of Fidelity Advisor Real Estate Fund as of July 31, 2005, the results of its operations for the year then ended, the changes in its net assets for each of the two years in the period then ended, and its financial highlights for the two years ended July 31, 2005 and July 31, 2004 and for the period from Septem-ber 12, 2002 (commencement of operations) to July 31, 2003, in conformity with accounting principles generally accepted in the United States of America.
/s/DELOITTE & TOUCHE LLP
DELOITTE & TOUCHE LLP
Boston, Massachusetts
September 20, 2005
The Trustees, Members of the Advisory Board, and executive officers of the trusts and funds, as applicable, are listed below. The Board of Trustees governs each fund and is responsible for protecting the interests of shareholders. The Trustees are experienced executives who meet periodically throughout the year to oversee each fund’s activities, review contractual arrangements with companies that provide services to each fund, and review each fund’s performance. Except for William O. McCoy, Stephen P. Jonas, and Kenneth L. Wolfe, each of the Trustees oversees 320 funds advised by FMR or an affiliate. Mr. McCoy oversees 322 funds advised by FMR or an affiliate. Mr. Jonas and Mr. Wolfe oversee 311 funds advised by FMR or an affiliate.
The Trustees hold office without limit in time except that (a) any Trustee may resign; (b) any Trustee may be removed by written instrument, signed by at least two-thirds of the number of Trustees prior to such removal; (c) any Trustee who requests to be retired or who has become incapacitated by illness or injury may be retired by written instrument signed by a majority of the other Trustees; and (d) any Trustee may be removed at any special meeting of shareholders by a two-thirds vote of the outstanding voting securities of the trust. Each Trustee who is not an interested person (as defined in the 1940 Act) (Independent Trustee), shall retire not later than the last day of the calendar year in which his or her 72nd birthday occurs. The Independent Trustees may waive this mandatory retirement age policy with respect to individual Trustees. The executive officers and Advisory Board Members hold office without limit in time, except that any officer and Advisory Board Member may resign or may be removed by a vote of a majority of the Trustees at any regular meeting or any special meeting of the Trustees. Except as indicated, each individual has held the office shown or other offices in the same company for the past five years.
The fund’s Statement of Additional Information (SAI) includes more information about the Trustees. To request a free copy, call Fidelity at 1-800-544-8544.
Interested Trustees*:
Correspondence intended for each Trustee who is an interested person may be sent to Fidelity Investments, 82 Devonshire Street, Boston, Massachusetts 02109.
| Name, Age; Principal Occupation |
| |
| Edward C. Johnson 3d (75)** |
| |
| Year of Election or Appointment: 1980 |
| Mr. Johnson is Chairman of the Board of Trustees. Mr. Johnson serves as |
| Chief Executive Officer, Chairman, and a Director of FMR Corp.; a |
| Director and Chairman of the Board and of the Executive Committee of |
| FMR; Chairman and a Director of Fidelity Management & Research (Far |
| East) Inc.; Chairman and a Director of Fidelity Investments Money Man- |
| agement, Inc.; and Chairman (2001-present) and a Director |
| (2000-present) of FMR Co., Inc. |
31 Annual Report
| | Trustees and Officers - continued
|
| Name, Age; Principal Occupation |
| |
| Abigail P. Johnson (43)** |
| |
| Year of Election or Appointment: 2001 |
| Ms. Johnson serves as President of Fidelity Employer Services Company |
| (FESCO) (2005-present). She is President and a Director of Fidelity In- |
| vestments Money Management, Inc. (2001-present), FMR Co., Inc. |
| (2001-present), and a Director of FMR Corp. Previously, Ms. Johnson |
| served as President and a Director of FMR (2001-2005), Senior Vice |
| President of the Fidelity funds (2001-2005), and managed a number of |
| Fidelity funds. |
| |
| Stephen P. Jonas (52) |
| |
| Year of Election or Appointment: 2005 |
| Mr. Jonas is Senior Vice President of Advisor Real Estate (2005-present). |
| He also serves as Senior Vice President of other Fidelity funds |
| (2005-present). Mr. Jonas is Executive Director of FMR (2005-present). |
| Previously, Mr. Jonas served as President of Fidelity Enterprise Opera- |
| tions and Risk Services (2004-2005), Chief Administrative Officer |
| (2002-2004), and Chief Financial Officer of FMR Co. (1998-2000). Mr. |
| Jonas has been with Fidelity Investments since 1987 and has held vari- |
| ous financial and management positions including Chief Financial Offi- |
| cer of FMR. In addition, he serves on the Boards of Boston Ballet |
| (2003-present) and Simmons College (2003-present). |
| |
| Robert L. Reynolds (53) |
| |
| Year of Election or Appointment: 2003 |
| Mr. Reynolds is a Director (2003-present) and Chief Operating Officer |
| (2002-present) of FMR Corp. He also serves on the Board at Fidelity |
| Investments Canada, Ltd. (2000-present). Previously, Mr. Reynolds |
| served as President of Fidelity Investments Institutional Retirement Group |
| (1996-2000). |
* Trustees have been determined to be “Interested Trustees” by virtue of, among other things, their affiliation with the trust or various entities under common control with FMR.
** Edward C. Johnson 3d, Trustee, is Abigail P. Johnson’s father.
Annual Report 32
Independent Trustees:
Correspondence intended for each Independent Trustee (that is, the Trustees other than the Interested Trustees) may be sent to Fidelity Investments, P.O. Box 55235, Boston, Massachusetts 02205-5235.
| Name, Age; Principal Occupation |
| |
| Dennis J. Dirks (57) |
| |
| Year of Election or Appointment: 2005 |
| Prior to his retirement in May 2003, Mr. Dirks was Chief Operating |
| Officer and a member of the Board of The Depository Trust & Clearing |
| Corporation (DTCC) (1999-2003). He also served as President, Chief |
| Operating Officer, and Board member of The Depository Trust |
| Company (DTC) (1999-2003) and President and Board member of the |
| National Securities Clearing Corporation (NSCC) (1999-2003). In addi- |
| tion, Mr. Dirks served as Chief Executive Officer and Board member of |
| the Government Securities Clearing Corporation (2001-2003) and Chief |
| Executive Officer and Board member of the Mortgage-Backed Securities |
| Clearing Corporation (2001-2003). Mr. Dirks also serves as a Trustee of |
| Manhattan College (2005-present). |
| |
| Robert M. Gates (61) |
| |
| Year of Election or Appointment: 1997 |
| Dr. Gates is Vice Chairman of the Independent Trustees (2005-present). |
| Dr. Gates is President of Texas A&M University (2002-present). He was |
| Director of the Central Intelligence Agency (CIA) from 1991 to 1993. |
| From 1989 to 1991, Dr. Gates served as Assistant to the President of |
| the United States and Deputy National Security Advisor. Dr. Gates is a |
| Director of NACCO Industries, Inc. (mining and manufacturing), Parker |
| Drilling Co., Inc. (drilling and rental tools for the energy industry, |
| 2001-present), and Brinker International (restaurant management, |
| 2003-present). Previously, Dr. Gates served as a Director of LucasVarity |
| PLC (automotive components and diesel engines), a Director of TRW Inc. |
| (automotive, space, defense, and information technology), and Dean of |
| the George Bush School of Government and Public Service at Texas |
| A&M University (1999-2001). Dr. Gates also is a Trustee of the Forum |
| for International Policy. |
33 Annual Report
Trustees and Officers - continued
|
| Name, Age; Principal Occupation |
| |
| George H. Heilmeier (69) |
| |
| Year of Election or Appointment: 2004 |
| Dr. Heilmeier is Chairman Emeritus of Telcordia Technologies (commu- |
| nication software and systems), where prior to his retirement, he served |
| as company Chairman and Chief Executive Officer. He currently serves |
| on the Boards of Directors of The Mitre Corporation (systems engineer- |
| ing and information technology support for the government), and HRL |
| Laboratories (private research and development, 2004-present). He is |
| Chairman of the General Motors Science & Technology Advisory Board |
| and a Life Fellow of the Institute of Electrical and Electronics Engineers |
| (IEEE) (2000-present). Dr. Heilmeier is a member of the Defense Science |
| Board and the National Security Agency Advisory Board. He is also a |
| member of the National Academy of Engineering, the American |
| Academy of Arts and Sciences, and the Board of Overseers of the |
| School of Engineering and Applied Science of the University of Pennsyl- |
| vania. Previously, Dr. Heilmeier served as a Director of TRW Inc. (auto- |
| motive, space, defense, and information technology, 1992-2002), |
| Compaq (1994-2002), Automatic Data Processing, Inc. (ADP) |
| (technology-based business outsourcing, 1995-2002), INET Technolo- |
| gies Inc. (telecommunications network surveillance, 2001-2004), and |
| Teletech Holdings (customer management services). He is the recipient of |
| the 2005 Kyoto Prize in Advanced Technology for his invention of the |
| liquid display. |
| |
| Marie L. Knowles (58) |
| |
| Year of Election or Appointment: 2001 |
| Prior to Ms. Knowles’ retirement in June 2000, she served as Executive |
| Vice President and Chief Financial Officer of Atlantic Richfield Company |
| (ARCO) (diversified energy, 1996-2000). From 1993 to 1996, she was |
| a Senior Vice President of ARCO and President of ARCO Transportation |
| Company. She served as a Director of ARCO from 1996 to 1998. She |
| currently serves as a Director of Phelps Dodge Corporation (copper- |
| mining and manufacturing) and McKesson Corporation (healthcare ser- |
| vice, 2002-present). Ms. Knowles is a Trustee of the Brookings Institution |
| and the Catalina Island Conservancy and also serves as a member of |
| the Advisory Board for the School of Engineering of the University of |
| Southern California. |
Annual Report 34
| Name, Age; Principal Occupation |
| |
| Ned C. Lautenbach (61) |
| |
| Year of Election or Appointment: 2000 |
| Mr. Lautenbach has been a partner of Clayton, Dubilier & Rice, Inc. |
| (private equity investment firm) since September 1998. Previously, Mr. |
| Lautenbach was with the International Business Machines Corporation |
| (IBM) from 1968 until his retirement in 1998. Mr. Lautenbach serves as |
| a Director of Italtel Holding S.p.A. (telecommunications (Milan, Italy), |
| 2004-present) and Eaton Corporation (diversified industrial) as well as |
| the Philharmonic Center for the Arts in Naples, Florida. He also is a |
| member of the Board of Trustees of Fairfield University (2005-present), |
| as well as a member of the Council on Foreign Relations. |
| |
| Marvin L. Mann (72) |
| |
| Year of Election or Appointment: 1993 |
| Mr. Mann is Chairman of the Independent Trustees (2001-present). He is |
| Chairman Emeritus of Lexmark International, Inc. (computer |
| peripherals), where he served as CEO until April 1998, retired as |
| Chairman May 1999, and remains a member of the Board. Prior to |
| 1991, he held the positions of Vice President of International Business |
| Machines Corporation (IBM) and President and General Manager of |
| various IBM divisions and subsidiaries. He is a member of the Executive |
| Committee of the Independent Director’s Council of the Investment Com- |
| pany Institute. In addition, Mr. Mann is a member of the President’s |
| Cabinet at the University of Alabama and the Board of Visitors of the |
| Culverhouse College of Commerce and Business Administration at the |
| University of Alabama. |
| |
| William O. McCoy (71) |
| |
| Year of Election or Appointment: 1997 |
| Prior to his retirement in December 1994, Mr. McCoy was Vice Chair- |
| man of the Board of BellSouth Corporation (telecommunications) and |
| President of BellSouth Enterprises. He is currently a Director of Liberty |
| Corporation (holding company), Duke Realty Corporation (real estate), |
| and Progress Energy, Inc. (electric utility). He is also a partner of Frank- |
| lin Street Partners (private investment management firm) and a member |
| of the Research Triangle Foundation Board. In addition, Mr. McCoy |
| served as the Interim Chancellor (1999-2000) and a member of the |
| Board of Visitors for the University of North Carolina at Chapel Hill and |
| currently serves on the Board of Directors of the University of North |
| Carolina Health Care System and the Board of Visitors of the Kenan- |
| Flagler Business School (University of North Carolina at Chapel Hill). He |
| also served as Vice President of Finance for the University of North Car- |
| olina (16-school system). |
35 Annual Report
Trustees and Officers - continued
| Name, Age; Principal Occupation |
| |
| Cornelia M. Small (61) |
| |
| Year of Election or Appointment: 2005 |
| Ms. Small is a member (2000-present) and Chairperson (2002-present) |
| of the Investment Committee, and a member (2002-present) of the |
| Board of Trustees of Smith College. Previously, she served as Chief In- |
| vestment Officer (1999-2000), Director of Global Equity Investments |
| (1996-1999), and a member of the Board of Directors of Scudder, |
| Stevens & Clark (1990-1997) and Scudder Kemper Investments |
| (1997-1998). In addition, Ms. Small served as Co-Chair (2000-2003) |
| of the Annual Fund for the Fletcher School of Law and Diplomacy. |
| |
| William S. Stavropoulos (66) |
| |
| Year of Election or Appointment: 2001 |
| Mr. Stavropoulos is Chairman of the Board (2000-present) and a Mem- |
| ber of the Board of Directors of The Dow Chemical Company. Since |
| joining The Dow Chemical Company in 1967, Mr. Stavropoulos served |
| in numerous senior management positions, including President |
| (1993-2000; 2002-2003), CEO (1995-2000; 2000-2004), and Chair- |
| man of the Executive Committee (2002-2004). Currently, he is a Direc- |
| tor of NCR Corporation (data warehousing and technology solutions), |
| BellSouth Corporation (telecommunications), Chemical Financial Corpo- |
| ration, and Maersk Inc. (industrial conglomerate, 2002-present), and |
| Metalmark Capital (private equity investment firm, 2005-present). He |
| also serves as a member of the Board of Trustees of the American Enter- |
| prise Institute for Public Policy Research. In addition, Mr. Stavropoulos is |
| a member of The Business Council, J.P. Morgan International Council |
| and the University of Notre Dame Advisory Council for the College of |
| Science. |
| |
| Kenneth L. Wolfe (66) |
| |
| Year of Election or Appointment: 2005 |
| Mr. Wolfe also serves as a Trustee (2005-present) or Member of the |
| Advisory Board (2004-present) of other investment companies advised |
| by FMR. Prior to his retirement in 2001, Mr. Wolfe was Chairman and |
| Chief Executive Officer of Hershey Foods Corporation (1993-2001). He |
| currently serves as a member of the boards of Adelphia Communica- |
| tions Corporation (2003-present), Bausch & Lomb, Inc., and Revlon Inc. |
| (2004-present). |
Annual Report 36
Advisory Board Members and Executive Officers:
Correspondence intended for Mr. Gamper may be sent to Fidelity Investments, P.O. Box 55235, Boston, Massachusetts 02205-5235. Correspondence intended for each executive officer and Mr. Lynch may be sent to Fidelity Investments, 82 Devonshire Street, Boston, Massachusetts 02109.
| Name, Age; Principal Occupation |
| |
| Albert R. Gamper, Jr. (63) |
| |
| Year of Election or Appointment: 2005 |
| Member of the Advisory Board of Fidelity Advisor Series VII. Prior to his |
| retirement in December 2004, Mr. Gamper served as Chairman of the |
| Board of CIT Group Inc. (commercial finance). During his tenure with |
| CIT Group Inc. Mr. Gamper served in numerous senior management |
| positions, including Chairman (1987-1989; 1999-2001; 2002-2004), |
| Chief Executive Officer (1987-2004), and President (1989-2002). He |
| currently serves as a member of the Board of Directors of Public Service |
| Enterprise Group (utilities, 2001-present), Chairman of the Board of |
| Governors, Rutgers University (2004-present), and Chairman of the |
| Board of Saint Barnabas Health Care System. |
| |
| Peter S. Lynch (61) |
| |
| Year of Election or Appointment: 2003 |
| Member of the Advisory Board of Fidelity Advisor Series VII. Vice |
| Chairman and a Director of FMR, and Vice Chairman (2001-present) |
| and a Director (2000-present) of FMR Co., Inc. Previously, Mr. Lynch |
| served as a Trustee of the Fidelity funds (1990-2003). In addition, he |
| serves as a Trustee of Boston College, Massachusetts Eye & Ear |
| Infirmary, Historic Deerfield, John F. Kennedy Library, and the Museum |
| of Fine Arts of Boston. |
| |
| Dwight D. Churchill (51) |
| |
| Year of Election or Appointment: 2005 |
| Vice President of Advisor Real Estate. Mr. Churchill also serves as Vice |
| President of certain Equity Funds (2005-present) and certain High In- |
| come Funds (2005-present). Previously, he served as Head of Fidelity’s |
| Fixed-Income Division (2000-2005), Vice President of Fidelity’s Money |
| Market Funds (2000-2005), Vice President of Fidelity’s Bond Funds, and |
| Senior Vice President of FIMM (2000) and FMR. Mr. Churchill joined |
| Fidelity in 1993 as Vice President and Group Leader of Taxable Fixed- |
| Income Investments. |
| |
| Sam Wald (31) |
| |
| Year of Election or Appointment: 2005 |
| Vice President of Advisor Real Estate Fund, Prior to assuming his current |
| responsibilities, Mr. Wald has worked as a research analyst, associate |
| portfolio manager and manager. |
37 Annual Report
Trustees and Officers - continued
| Name, Age; Principal Occupation |
| |
| Eric D. Roiter (56) |
| |
| Year of Election or Appointment: 2002 |
| Secretary of Advisor Real Estate. He also serves as Secretary of other |
| Fidelity funds; Vice President, General Counsel, and Secretary of FMR |
| Co., Inc. (2001-present) and FMR; Assistant Secretary of Fidelity Man- |
| agement & Research (U.K.) Inc. (2001-present), Fidelity Management & |
| Research (Far East) Inc. (2001-present), and Fidelity Investments Money |
| Management, Inc. (2001-present). Mr. Roiter is an Adjunct Member, |
| Faculty of Law, at Boston College Law School (2003-present). Previously, |
| Mr. Roiter served as Vice President and Secretary of Fidelity Distributors |
| Corporation (FDC) (1998-2005). |
| |
| Stuart Fross (45) |
| |
| Year of Election or Appointment: 2003 |
| Assistant Secretary of Advisor Real Estate. Mr. Fross also serves as As- |
| sistant Secretary of other Fidelity funds (2003-present), Vice President |
| and Secretary of FDC (2005-present), and is an employee of FMR. |
| |
| Christine Reynolds (46) |
| |
| Year of Election or Appointment: 2004 |
| President, Treasurer, and Anti-Money Laundering (AML) officer of Advi- |
| sor Real Estate. Ms. Reynolds also serves as President, Treasurer, and |
| AML officer of other Fidelity funds (2004) and is a Vice President (2003) |
| and an employee (2002) of FMR. Before joining Fidelity Investments, |
| Ms. Reynolds worked at PricewaterhouseCoopers LLP (PwC) |
| (1980-2002), where she was most recently an audit partner with PwC’s |
| investment management practice. |
| |
| Timothy F. Hayes (54) |
| |
| Year of Election or Appointment: 2002 |
| Chief Financial Officer of Advisor Real Estate. Mr. Hayes also serves as |
| Chief Financial Officer of other Fidelity funds (2002-present) and Presi- |
| dent of Fidelity Investment Operations (2005-present) which includes |
| Fidelity Pricing and Cash Management Services Group (FPCMS), where |
| he served as President (1998-2005). Mr. Hayes serves as President of |
| Fidelity Service Company (2003-present) where he also serves as a |
| Director. Mr. Hayes also served as President of Fidelity Investments Op- |
| erations Group (FIOG, 2002-2005). |
Annual Report 38
| Name, Age; Principal Occupation |
| |
| Kenneth A. Rathgeber (58) |
| |
| Year of Election or Appointment: 2004 |
| Chief Compliance Officer of Advisor Real Estate. Mr. Rathgeber also |
| serves as Chief Compliance Officer of other Fidelity funds (2004) and |
| Executive Vice President of Risk Oversight for Fidelity Investments |
| (2002). Previously, he served as Executive Vice President and Chief Op- |
| erating Officer for Fidelity Investments Institutional Services Company, |
| Inc. (1998-2002). |
| |
| John R. Hebble (47) |
| |
| Year of Election or Appointment: 2003 |
| Deputy Treasurer of Advisor Real Estate. Mr. Hebble also serves as Dep- |
| uty Treasurer of other Fidelity funds (2003), and is an employee of FMR. |
| Before joining Fidelity Investments, Mr. Hebble worked at Deutsche Asset |
| Management where he served as Director of Fund Accounting |
| (2002-2003) and Assistant Treasurer of the Scudder Funds |
| (1998-2003). |
| |
| Bryan A. Mehrmann (44) |
| |
| Year of Election or Appointment: 2005 |
| Deputy Treasurer of Advisor Real Estate. Mr. Mehrmann also serves as |
| Deputy Treasurer of other Fidelity funds (2005-present) and is an em- |
| ployee of FMR. Previously, Mr. Mehrmann served as Vice President of |
| Fidelity Investments Institutional Services Group (FIIS)/Fidelity Investments |
| Institutional Operations Corporation, Inc. (FIIOC) Client Services |
| (1998-2004). |
| |
| Kimberley H. Monasterio (41) |
| |
| Year of Election or Appointment: 2004 |
| Deputy Treasurer of Advisor Real Estate. Ms. Monasterio also serves as |
| Deputy Treasurer of other Fidelity funds (2004) and is an employee of |
| FMR (2004). Before joining Fidelity Investments, Ms. Monasterio served |
| as Treasurer (2000-2004) and Chief Financial Officer (2002-2004) of |
| the Franklin Templeton Funds and Senior Vice President of Franklin Tem- |
| pleton Services, LLC (2000-2004). |
| |
| Kenneth B. Robins (35) |
| |
| Year of Election or Appointment: 2005 |
| Deputy Treasurer of Advisor Real Estate. Mr. Robins also serves as Dep- |
| uty Treasurer of other Fidelity funds (2005-present) and is an employee |
| of FMR (2004-present). Before joining Fidelity Investments, Mr. Robins |
| worked at KPMG LLP, where he was a partner in KPMG’s department of |
| professional practice (2002-2004) and a Senior Manager |
| (1999-2000). In addition, Mr. Robins served as Assistant Chief Accoun- |
| tant, United States Securities and Exchange Commission (2000-2002). |
39 Annual Report
Trustees and Officers - continued
| Name, Age; Principal Occupation |
| |
| Robert G. Byrnes (38) |
| |
| Year of Election or Appointment: 2005 |
| Assistant Treasurer of Advisor Real Estate. Mr. Byrnes also serves as |
| Assistant Treasurer of other Fidelity funds (2005-present) and is an em- |
| ployee of FMR (2005-present). Previously, Mr. Byrnes served as Vice |
| President of FPCMS (2003-2005). Before joining Fidelity Investments, |
| Mr. Byrnes worked at Deutsche Asset Management where he served as |
| Vice President of the Investment Operations Group (2000-2003). |
| |
| John H. Costello (58) |
| |
| Year of Election or Appointment: 2002 |
| Assistant Treasurer of Advisor Real Estate. Mr. Costello also serves as |
| Assistant Treasurer of other Fidelity funds and is an employee of FMR. |
| |
| Peter L. Lydecker (51) |
| |
| Year of Election or Appointment: 2004 |
| Assistant Treasurer of Advisor Real Estate. Mr. Lydecker also serves as |
| Assistant Treasurer of other Fidelity funds (2004) and is an employee of |
| FMR. |
| |
| Mark Osterheld (50) |
| |
| Year of Election or Appointment: 2002 |
| Assistant Treasurer of Advisor Real Estate. Mr. Osterheld also serves as |
| Assistant Treasurer of other Fidelity funds (2002) and is an employee of |
| FMR. |
| |
| Gary W. Ryan (46) |
| |
| Year of Election or Appointment: 2005 |
| Assistant Treasurer of Advisor Real Estate. Mr. Ryan also serves as Assis- |
| tant Treasurer of other Fidelity funds (2005-present) and is an employee |
| of FMR (2005-present). Previously, Mr. Ryan served as Vice President of |
| Fund Reporting in FPCMS (1999-2005). |
| |
| Salvatore Schiavone (39) |
| |
| Year of Election or Appointment: 2005 |
| Assistant Treasurer of Advisor Real Estate. Mr. Schiavone also serves as |
| Assistant Treasurer of other Fidelity funds (2005-present) and is an em- |
| ployee of FMR (2005-present). Before joining Fidelity Investments, Mr. |
| Schiavone worked at Deutsche Asset Management, where he most re- |
| cently served as Assistant Treasurer (2003-2005) of the Scudder Funds |
| and Vice President and Head of Fund Reporting (1996-2003). |
Annual Report 40
The Board of Trustees of Advisor Real Estate Fund voted to pay to shareholders of record at the opening of business on record date, the following distributions per share derived from capital gains realized from sales of portfolio securities, and dividends derived from net investment income:
| | | Pay Date | | Record Date | | Dividends | | Capital Gains |
| Institutional Class | | 9/19/05 | | 9/16/05 | | $0.097 | | $0.50 |
The fund hereby designates as capital gain dividends: For dividends with respect to the taxable year ended July 31, 2005, $4,213,687, or, if subsequently determined to be different, the net capital gain of such year, and for dividends with respect to the taxable year ended July 31, 2004, $1,332,180, or, if subsequently determined to be different, the excess of: (a) the net capital gain of such year, over (b) amounts previously designated as capital gain dividends with respect to such year.
A total of 0.12% of the dividends distributed during the fiscal year was derived from interest on U.S. Government securities which is generally exempt from state income tax.
The fund will notify shareholders in January 2006 of amounts for use in preparing 2005 income tax returns.
41 Annual Report
Board Approval of Investment Advisory Contracts and Management Fees
Advisor Real Estate Fund
Each year, typically in July, the Board of Trustees, including the independent Trustees (together, the Board), votes on the renewal of the management contract and sub-advisory agreements (together, the Advisory Contracts) for the fund. The Board, assisted by the advice of fund counsel and independent Trustees’ counsel, requests and considers a broad range of information throughout the year.
The Board meets regularly each month except August and takes into account throughout the year matters bearing on Advisory Contracts. The Board, acting directly and through its separate committees, considers at each of its meetings factors that are relevant to the annual renewal of the fund’s Advisory Contracts, including the services and support provided to the fund and its shareholders by Fidelity. At the time of the renewal, the Board had 11 standing committees, each composed of independent Trustees with varying backgrounds, to which the Board has assigned specific subject matter responsibilities in order to enhance effective decision-making by the Board. Each committee has adopted a written charter outlining the structure and purposes of the committee. One such committee, the Equity Contract Committee, meets periodically during the first six months of each year and as necessary to consider matters specifically related to the annual renewal of Advisory Contracts. The committee requests and receives information on, and makes recommendations to the independent Trustees concerning, the approval and annual review of the Advisory Contracts.
At its July 2005 meeting, the Board of Trustees, including the independent Trustees, unanimously determined to renew the Advisory Contracts for the fund. In reaching its determination, the Board considered all factors it believed relevant, including (1) the nature, extent, and quality of the services to be provided to the fund and its shareholders by Fidelity (including the investment performance of the fund); (2) the competitiveness of the management fee and total expenses of the fund; (3) the total costs of the services to be provided by and the profits to be realized by the investment adviser and its affiliates from the relationship with the fund; (4) the extent to which economies of scale would be realized as the fund grows; and (5) whether fee levels reflect these economies of scale, if any, for the benefit of fund shareholders.
In determining whether to renew the Advisory Contracts for the fund, the Board ultimately reached a determination, with the assistance of fund counsel and independent Trustees’ counsel, that the renewal of the Advisory Contracts and the compensation to be received by Fidelity under the management contract is consistent with Fidelity’s fiduciary duty under applicable law. In addition to evaluating the specific factors noted above, the Board, in reaching its determination, is aware that shareholders in the fund have a broad range of investment choices available to them, including a wide choice among mutual funds offered by competitors to Fidelity, and that the fund’s shareholders, with the opportunity to review and weigh the disclosure provided by the fund in its
prospectus and other public disclosures, have chosen to invest in this fund, managed by Fidelity.
Nature, Extent, and Quality of Services Provided by Fidelity. The Board considered staffing within the investment adviser, FMR, and the sub-advisers (together, the Investment Advisers), including the background of the fund’s portfolio manager and the fund’s investment objective and discipline. The independent Trustees also had discussions with senior management of Fidelity’s investment operations and investment groups. The Board considered the structure of the portfolio manager compensation program and whether this structure provides appropriate incentives.
Fidelity Resources Dedicated to Investment Management and Support Services. The Board reviewed the size, education, and experience of the Investment Advisers’ investment staff, their use of technology, and the Investment Advisers’ approach to recruiting, training, and retaining portfolio managers and other research, advisory, and management personnel. The Board considered Fidelity’s extensive global research capabilities that enable the Investment Advisers to aggregate data from various sources in an effort to produce positive investment results. The Board noted that Fidelity’s analysts have access to a variety of technological tools that enable them to perform both fundamental and quantitative analysis and to specialize in various disciplines. The Board also considered that Fidelity’s portfolio managers and analysts have access to daily portfolio attribution that allows for monitoring of a fund’s portfolio, as well as an electronic communication system that provides immediate real-time access to research concerning issuers and credit enhancers.
Shareholder and Administrative Services. The Board considered the nature, extent, quality, and cost of administrative, distribution, and shareholder services performed by the Investment Advisers and their affiliates under the Advisory Contracts and under separate agreements covering transfer agency, pricing and bookkeeping, and securities lending services for the fund. The Board also considered the nature and extent of the Investment Advisers’ supervision of third party service providers, principally custodians and subcustodians. The Board reviewed the allocation of fund brokerage, including allocations to brokers affiliated with the Investment Advisers, the use of brokerage commissions to pay fund expenses, and the use of “soft” commission dollars to pay for research services. The Board also considered that Fidelity voluntarily decided in 2004 to stop using “soft” commission dollars to pay for market data and, instead, to pay for that data out of its own resources. The Board also considered the resources devoted to, and the record of compliance with, the fund’s compliance policies and procedures.
The Board noted that the growth of fund assets across the complex allows Fidelity to reinvest in the development of services designed to enhance the value or convenience of the Fidelity funds as investment vehicles. These services include 24-hour access to
43 Annual Report
Board Approval of Investment Advisory Contracts and Management Fees - continued
account information and market information through phone representatives and over the Internet, and investor education materials and asset allocation tools.
Investment in a Large Fund Family. The Board considered the benefits to shareholders of investing in a Fidelity fund, including the benefits of investing in a fund that is part of a large family of funds offering a variety of investment disciplines and providing for a large variety of mutual fund investor services. For example, fund shareholders are offered the privilege of exchanging shares of the fund for shares of other Fidelity funds, as set forth in the fund’s prospectus, without paying an additional sales charge. The Board noted that, since the last Advisory Contract renewals in July 2004, Fidelity has taken a number of actions that benefited particular funds, including (i) voluntarily deciding in 2004 to stop using “soft” commission dollars to pay for market data and, instead, to pay for that data out of its own resources, (ii) contractually agreeing to impose management fee reductions and expense limitations on its five Spartan stock index funds and its stock index fund available through variable insurance products, (iii) contractually agreeing to eliminate the management fees on the Fidelity Freedom Funds and the Fidelity Advisor Freedom Funds, (iv) contractually agreeing to reduce the management fees on most of its investment-grade taxable bond funds, and (v) contractually agreeing to impose expense limitations on its retail and Spartan investment-grade taxable bond funds.
Investment Performance and Compliance. The Board considered whether the fund has operated within its investment objective, as well as its record of compliance with its investment restrictions. It also reviewed the fund’s absolute investment performance for each class, as well as the fund’s relative investment performance for each class measured against (i) a broad-based securities market index, and (ii) a peer group of mutual funds deemed appropriate by the Board. Because the fund had been in existence less than three calendar years, the following chart considered by the Board shows, for the one-year period ended December 31, 2004, the returns of Class C and Institutional Class of the fund, the return of a broad-based securities market index (“benchmark”), and a range of returns of a peer group of mutual funds identified by Lipper Inc. as having an investment objective similar to that of the fund. The returns of Class C and Institutional Class represent the performance of classes with the highest and lowest 12b-1 fees, respectively (not necessarily with the highest and lowest total expenses). The box within the chart shows the 25th percentile return (bottom of box) and the 75th percentile return (top of box) of the Lipper peer group. Returns shown above the box are in the first quartile and returns shown below the box are in the fourth quartile. The percentage beaten numbers noted below the chart correspond to the percentile box and represent the percentage of funds in the Lipper peer group whose performance was equal to or lower than that of the class indicated.
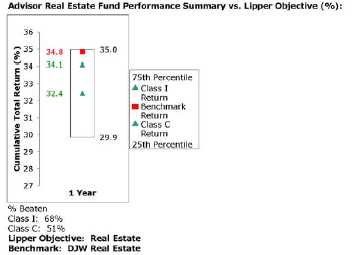
The Board reviewed the fund’s relative investment performance against its Lipper peer group and stated that the performance of Institutional Class of the fund was in the second quartile for the one-year period. The Board also stated that the relative investment performance of the fund was lower than its benchmark for the one-year period. The Board considered that the variations in performance among the fund’s classes reflect the variations in class expenses, which result in lower performance for higher expense classes. The Board stated that it is difficult to evaluate in any comprehensive fashion the performance of the fund, in light of its relatively recent launch.
The Board has had thorough discussions with FMR throughout the year about the Board’s and FMR’s concerns about equity research, equity fund performance, and compliance with internal policies governing gifts and entertainment. FMR has taken steps that it believes will refocus and strengthen equity research and equity portfolio management and compliance. The Board noted with favor FMR’s recent reorganization of its senior management team and FMR’s plans to dedicate additional resources to investment research, and participated in the process that led to those changes.
Based on its review, and giving particular weight to the nature and quality of the resources dedicated by the Investment Advisers to maintain and improve relative performance, the Board concluded that the nature, extent, and quality of the services provided by Fidelity will benefit the fund’s shareholders, particularly in light of the Board’s view that the fund’s shareholders benefit from investing in a fund that is part of a large family of funds offering a variety of investment disciplines and services.
Competitiveness of Management Fee and Total Fund Expenses. The Board considered the fund’s management fee and total expenses compared to “mapped groups”
45 Annual Report
Board Approval of Investment Advisory Contracts and Management Fees - continued
of competitive funds and classes. Fidelity creates “mapped groups” by combining similar Lipper investment objective categories that have comparable management fee characteristics. Combining Lipper investment objective categories aids the Board’s management fee and total expense comparisons by broadening the competitive group used for comparison and by reducing the number of universes to which various Fidelity funds are compared.
The Board considered two proprietary management fee comparisons for the 12-month (or shorter) periods shown in the chart below. The group of Lipper funds used by the Board for management fee comparisons is referred to below as the “Total Mapped Group” and, for the reasons explained above, is broader than the Lipper peer group used by the Board for performance comparisons. The Total Mapped Group comparison focuses on a fund’s standing relative to the total universe of comparable funds available to investors, in terms of gross management fees before expense reimbursements or caps. “TMG %” represents the percentage of funds in the Total Mapped Group that had management fees that were lower than the fund’s. For example, a TMG % of 30% means that 70% of the funds in the Total Mapped Group had higher management fees than the fund. The “Asset-Size Peer Group” (ASPG) comparison focuses on a fund’s standing relative to non-Fidelity funds similar in size to the fund within the Total Mapped Group. The ASPG represents at least 15% of the funds in the Total Mapped Group with comparable asset size and management fee characteristics, subject to a minimum of 50 funds (or all funds in the Total Mapped Group if fewer than 50). Additional information, such as the ASPG quartile (“quadrant”) in which the fund’s management fee ranked, is also included in the chart and considered by the Board.
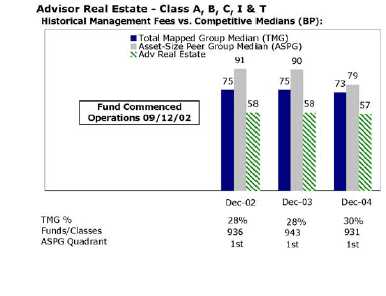
Annual Report 46
The Board noted that the fund’s management fee ranked below the median of its Total Mapped Group and below the median of its ASPG for 2004.
Based on its review, the Board concluded that the fund’s management fee was fair and reasonable in light of the services that the fund receives and the other factors considered.
In its review of each class’s total expenses, the Board considered the fund’s management fee as well as other fund or class expenses, as applicable, such as transfer agent fees, pricing and bookkeeping fees, fund-paid 12b-1 fees, and custodial, legal, and audit fees. The Board also noted the effects of any waivers and reimbursements on fees and expenses. As part of its review, the Board also considered current and historical total expenses of each class of the fund compared to competitive fund median expenses. Each class of the fund is compared to those funds and classes in the Total Mapped Group (used by the Board for management fee comparisons) that have a similar sales load structure.
The Board noted that the total expenses of each class ranked above its competitive median for 2004. The Board noted that the fund offers multiple classes, each of which has a different sales load and 12b-1 fee structure, and that the multiple structures are intended to offer a range of pricing options for the intermediary market. The Board also noted that the total expenses of the classes vary primarily by the level of their 12b-1 fees, although differences in transfer agent fees may also cause expenses to vary from class to class.
Furthermore, the Board considered that on December 16, 2004, it had approved changes (effective January 1, 2005) in the transfer agent and service agreements for the fund that established maximum transfer agent fees and eliminated the minimum pricing and bookkeeping fee to prevent small funds or funds with small average account sizes from having relatively high fees in basis points (the “small-fund fee reductions”). The Board considered that, if the small-fund fee reductions had been in effect in 2004, the total expenses of Institutional Class would have ranked below the median.
In its review of total expenses, the Board also considered Fidelity fee structures and other information on clients that FMR and its affiliates service in other competitive markets, such as other mutual funds advised or subadvised by FMR or its affiliates, pension plan clients, and other institutional clients.
Based on its review, the Board concluded that the total expenses for each class of the fund were reasonable, although in all cases above the median of the universe presented for comparison, in light of the services that the fund and its shareholders receive and the other factors considered.
Costs of the Services and Profitability. The Board considered the revenues earned and the expenses incurred by Fidelity in conducting the business of developing,
47 Annual Report
Board Approval of Investment Advisory Contracts and Management Fees - continued
marketing, distributing, managing, administering and servicing the fund and its shareholders. The Board also considered the level of Fidelity’s profits in respect of all the Fidelity funds.
On an annual basis, FMR presents to the Board Fidelity’s profitability for the fund. Fidelity calculates the profitability for each fund, as well as aggregate profitability for groups of Fidelity funds and all Fidelity funds, using a series of detailed revenue and cost allocation methodologies which originate with the audited books and records of Fidelity. The Audit Committee of the Board reviews any significant changes from the prior year’s methodologies.
PricewaterhouseCoopers LLP (PwC), independent registered accounting firm and auditor to Fidelity and certain Fidelity funds, has been engaged annually by the Board as part of the Board’s assessment of the results of Fidelity’s profitability analysis. PwC’s engagement includes the review and assessment of Fidelity’s methodologies used in determining the revenues and expenses attributable to Fidelity’s mutual fund business, and completion of agreed-upon procedures surrounding the mathematical accuracy of fund profitability and its conformity to allocation methodologies. After considering PwC’s reports issued under the engagement and information provided by Fidelity, the Board believes that while other allocation methods may also be reasonable, Fidelity’s profitability methodologies are reasonable in all material respects.
The Board has also reviewed Fidelity’s non-fund businesses and any fall-out benefits related to the mutual fund business as well as cases where Fidelity’s affiliates may benefit from or be related to the fund’s business. In addition, a special committee of the Board reviewed services provided to Fidelity by its affiliates and determined that the fees that Fidelity paid for such services were reasonable.
The Board considered the costs of the services provided by and the profits realized by Fidelity in connection with the operation of the fund and determined that the amount of profit is a fair entrepreneurial profit for the management of the fund.
Economies of Scale. The Board considered whether there have been economies of scale in respect of the management of the Fidelity funds, whether the Fidelity funds (including the fund) have appropriately benefited from any such economies of scale, and whether there is potential for realization of any further economies of scale. The Board considered the extent to which the fund will benefit from economies of scale through increased services to the fund, through waivers or reimbursements, or through fee or expense reductions, including reductions that occur through operation of the transfer agent agreement. The transfer agent fee varies in part based on the number of accounts in the fund. If the number of accounts decreases or the average account size increases, the overall transfer agent fee rate decreases.
The Board recognized that the fund’s management contract incorporates a “group fee” structure, which provides for lower fee rates as total fund assets under FMR’s management increase, and for higher fee rates as total fund assets under FMR’s management decrease. The Board considered that the group fee is designed to deliver the benefits of economies of scale to fund shareholders when total fund assets increase, even if assets of any particular fund are unchanged or have declined, because some portion of Fidelity’s costs are attributable to services provided to all Fidelity funds, and all funds benefit if those costs can be allocated among more assets. The Board concluded that, given the group fee structure, fund shareholders will achieve a certain level of economies of scale as assets under FMR’s management increase at the fund complex level, regardless of whether Fidelity achieves any such economies of scale.
The Board further concluded that any potential economies of scale are being shared between fund shareholders and Fidelity in an appropriate manner.
Additional Information Requested by the Board. In order to develop fully the factual basis for consideration of the Advisory Contracts, the Board requested additional information regarding (i) equity fund transfer agency fees; (ii) Fidelity’s fund profitability methodology and the impact of various changes in the methodology over time; (iii) benefits to shareholders from economies of scale; (iv) composition and characteristics of various fund and industry data used in comparisons; and (v) compensation of portfolio managers and research analysts.
Based on its evaluation of all of the conclusions noted above, and after considering all material factors, the Board ultimately concluded that the existing advisory fee structures are fair and reasonable, and that the fund’s existing Advisory Contracts should be renewed.
49 Annual Report
51 Annual Report
53 Annual Report
55 Annual Report
Investment Adviser
Fidelity Management & Research Company Boston, MA
Investment Sub-Advisers
FMR Co., Inc.
Fidelity Management & Research (U.K.) Inc.
Fidelity Management & Research (Far East) Inc.
Fidelity International Investment Advisors Fidelity International Investment Advisors (U.K.) Limited Fidelity Investments Japan Limited
General Distributor
Fidelity Distributors Corporation Boston, MA
Transfer and Service Agents
Fidelity Investments Institutional Operations Company, Inc. Boston, MA
Fidelity Service Company, Inc. Boston, MA
Custodian
Mellon Bank, N.A. Pittsburgh, PA
AREI-UANN-0905 1.789708.102

Item 2. Code of Ethics
As of the end of the period, July 31, 2005, Fidelity Advisor Series VII (the trust) has adopted a code of ethics, as defined in Item 2 of Form N-CSR, that applies to its President and Treasurer and its Chief Financial Officer. A copy of the code of ethics is filed as an exhibit to this Form N-CSR.
Item 3. Audit Committee Financial Expert
The Board of Trustees of the trust has determined that Marie L. Knowles is an audit committee financial expert, as defined in Item 3 of Form N-CSR. Ms. Knowles is independent for purposes of Item 3 of Form N-CSR.
Item 4. Principal Accountant Fees and Services
(a) Audit Fees.
For the fiscal years ended July 31, 2005 and July 31, 2004, the aggregate Audit Fees billed by Deloitte & Touche LLP, the member firms of Deloitte Touche Tohmatsu, and their respective affiliates (collectively, “Deloitte Entities”) for professional services rendered for the audits of the financial statements, or services that are normally provided in connection with statutory and regulatory filings or engagements for those fiscal years, for Fidelity Advisor Biotechnology Fund, Fidelity Advisor Consumer Industries Fund, Fidelity Advisor Cyclical Industries Fund, Fidelity Advisor Developing Communications Fund, Fidelity Advisor Electronics Fund, Fidelity Advisor Financial Services Fund, Fidelity Advisor Health Care Fund, Fidelity Advisor Natural Resources Fund, Fidelity Advisor Real Estate Fund, Fidelity Advisor Technology Fund and Fidelity Advisor Telecommunications & Utilities Growth Fund(the funds) and for all funds in the Fidelity Grou p of Funds are shown in the table below.
Fund
| 2005A
| 2004A
|
Fidelity Advisor Biotechnology Fund
| $34,000
| $34,000
|
Fidelity Advisor Consumer Industries Fund
| $32,000
| $32,000
|
Fidelity Advisor Cyclical Industries Fund
| $32,000
| $32,000
|
Fidelity Advisor Developing Communications Fund
| $34,000
| $34,000
|
Fidelity Advisor Electronics Fund
| $34,000
| $34,000
|
Fidelity Advisor Financial Services Fund
| $33,000
| $34,000
|
Fidelity Advisor Health Care Fund
| $35,000
| $34,000
|
Fidelity Advisor Natural Resources Fund
| $34,000
| $34,000
|
Fidelity Advisor Real Estate Fund
| $52,000
| $41,000
|
Fidelity Advisor Technology Fund
| $35,000
| $34,000
|
Fidelity Advisor Telecommunications & Utilities Growth Fund
| $32,000
| $32,000
|
All funds in the Fidelity Group of Funds audited by Deloitte Entities
| $4,800,000
| $4,200,000
|
A
| Aggregate amounts may reflect rounding.
|
(b) Audit-Related Fees.
In each of the fiscal years ended July 31, 2005 and July 31, 2004 the aggregate Audit-Related Fees billed by Deloitte Entities for services rendered for assurance and related services to each fund that are reasonably related to the performance of the audit or review of the fund’s financial statements, but not reported as Audit Fees, are shown in the table below.
Fund
| 2005A
| 2004A
|
Fidelity Advisor Biotechnology Fund
| $0
| $0
|
Fidelity Advisor Consumer Industries Fund
| $0
| $0
|
Fidelity Advisor Cyclical Industries Fund
| $0
| $0
|
Fidelity Advisor Developing Communications Fund
| $0
| $0
|
Fidelity Advisor Electronics Fund
| $0
| $0
|
Fidelity Advisor Financial Services Fund
| $0
| $0
|
Fidelity Advisor Health Care Fund
| $0
| $0
|
Fidelity Advisor Natural Resources Fund
| $0
| $0
|
Fidelity Advisor Real Estate Fund
| $0
| $0
|
Fidelity Advisor Technology Fund
| $0
| $0
|
Fidelity Advisor Telecommunications & Utilities Growth Fund
| $0
| $0
|
A
| Aggregate amounts may reflect rounding.
|
In each of the fiscal years ended July 31, 2005 and July 31, 2004, the aggregate Audit-Related Fees that were billed by Deloitte Entities that were required to be approved by the Audit Committee for services rendered on behalf of Fidelity Management & Research Company (FMR) and entities controlling, controlled by, or under common control with FMR (not including any sub-adviser whose role is primarily portfolio management and is subcontracted with or overseen by another investment adviser) that provide ongoing services to the funds (“Fund Service Providers”) for assurance and related services that relate directly to the operations and financial reporting of each fund that are reasonably related to the performance of the audit or review of the fund’s financial statements, but not reported as Audit Fees, are shown in the table below.
Billed By
| 2005A
| 2004A
|
Deloitte Entities
| $0
| $0
|
A
| Aggregate amounts may reflect rounding.
|
Fees included in the audit-related category comprise assurance and related services (e.g., due diligence services) that are traditionally performed by the independent registered public accounting firm. These audit-related services include due diligence related to mergers and acquisitions, accounting consultations and audits in connection with acquisitions, internal control reviews, attest services that are not required by statute or regulation and consultation concerning financial accounting and reporting standards.
(c) Tax Fees.
In each of the fiscal years ended July 31, 2005 and July 31, 2004, the aggregate Tax Fees billed by Deloitte Entities for professional services rendered for tax compliance, tax advice, and tax planning for each fund is shown in the table below.
Fund
| 2005A
| 2004A
|
Fidelity Advisor Biotechnology Fund
| $4,000
| $3,900
|
Fidelity Advisor Consumer Industries Fund
| $4,000
| $3,900
|
Fidelity Advisor Cyclical Industries Fund
| $4,000
| $3,900
|
Fidelity Advisor Developing Communications Fund
| $4,000
| $3,900
|
Fidelity Advisor Electronics Fund
| $4,000
| $3,900
|
Fidelity Advisor Financial Services Fund
| $4,000
| $3,900
|
Fidelity Advisor Health Care Fund
| $4,000
| $3,900
|
Fidelity Advisor Natural Resources Fund
| $4,000
| $3,900
|
Fidelity Advisor Real Estate Fund
| $3,600
| $3,600
|
Fidelity Advisor Technology Fund
| $4,000
| $3,900
|
Fidelity Advisor Telecommunications & Utilities Growth Fund
| $4,000
| $3,900
|
A
| Aggregate amounts may reflect rounding.
|
In each of the fiscal years ended July 31, 2005 and July 31, 2004, the aggregate Tax Fees billed by Deloitte Entities that were required to be approved by the Audit Committee for professional services rendered on behalf of the Fund Service Providers for tax compliance, tax advice, and tax planning that relate directly to the operations and financial reporting of each fund is shown in the table below.
Billed By
| 2005A
| 2004A
|
Deloitte Entities
| $0
| $0
|
A
| Aggregate amounts may reflect rounding.
|
Fees included in the Tax Fees category comprise all services performed by professional staff in the independent registered public accounting firm’s tax division except those services related to the audit. Typically, this category would include fees for tax compliance, tax planning, and tax advice. Tax compliance, tax advice, and tax planning services include preparation of original and amended tax returns, claims for refund and tax payment-planning services, assistance with tax audits and appeals, tax advice related to mergers and acquisitions and requests for rulings or technical advice from taxing authorities.
(d) All Other Fees.
In each of the fiscal years ended July 31, 2005 and July 31, 2004, the aggregate Other Fees billed by Deloitte Entities for all other non-audit services rendered to the funds is shown in the table below.
Fund
| 2005A
| 2004A
|
Fidelity Advisor Biotechnology Fund
| $0
| $0
|
Fidelity Advisor Consumer Industries Fund
| $0
| $0
|
Fidelity Advisor Cyclical Industries Fund
| $0
| $0
|
Fidelity Advisor Developing Communications Fund
| $0
| $0
|
Fidelity Advisor Electronics Fund
| $0
| $0
|
Fidelity Advisor Financial Services Fund
| $0
| $0
|
Fidelity Advisor Health Care Fund
| $0
| $0
|
Fidelity Advisor Natural Resources Fund
| $0
| $0
|
Fidelity Advisor Real Estate Fund
| $0
| $0
|
Fidelity Advisor Technology Fund
| $0
| $0
|
Fidelity Advisor Telecommunications & Utilities Growth Fund
| $0
| $0
|
A
| Aggregate amounts may reflect rounding.
|
In each of the fiscal years ended July 31, 2005 and July 31, 2004, the aggregate Other Fees billed by Deloitte Entities that were required to be approved by the Audit Committee for all other non-audit services rendered on behalf of the Fund Service Providers that relate directly to the operations and financial reporting of each fund is shown in the table below.
Billed By
| 2005A
| 2004A
|
Deloitte Entities
| $210,000
| $790,000
|
A
| Aggregate amounts may reflect rounding.
|
Fees included in the All Other Fees category include services related to internal control reviews, strategy and other consulting, financial information systems design and implementation, consulting on other information systems, and other tax services unrelated to the fund.
(e) (1)
| Audit Committee Pre-Approval Policies and Procedures:
|
The trust’s Audit Committee must pre-approve all audit and non-audit services provided by the independent registered public accounting firm relating to the operations or financial reporting of the funds. Prior to the commencement of any audit or non-audit services to a fund, the Audit Committee reviews the services to determine whether they are appropriate and permissible under applicable law.
The trust’s Audit Committee has adopted policies and procedures to, among other purposes, provide a framework for the Committee’s consideration of non–audit services by the audit firms that audit the Fidelity funds. The policies and procedures require that any non–audit service provided by a fund audit firm to a Fidelity Fund and any non–audit service provided by a fund auditor to a Fund Service Provider that relates directly to the operations and financial reporting of a Fidelity fund (Covered Service) are subject to approval by the Audit Committee before such service is provided. Non–audit services provided by a fund audit firm for a Fund Service Provider that do not relate directly to the operations and financial reporting of a Fidelity fund (Non–Covered Service) but that are expected to exceed $50,000 are also subject to pre–approval by the Audit Committee.
All Covered Services, as well as Non–Covered Services that are expected to exceed $50,000, must be approved in advance of provision of the service either: (i) by formal resolution of the Audit Committee, or (ii) by oral or written approval of the service by the Chair of the Audit Committee (or if the Chair is unavailable, such other member of the Audit Committee as may be designated by the Chair to act in the Chair’s absence). The approval contemplated by (ii) above is permitted where the Treasurer determines that action on such an engagement is necessary before the next meeting of the Audit Committee. Neither pre–approval nor advance notice of Non–Covered Service engagements for which fees are not expected to exceed $50,000 is required; such engagements are to be reported to the Audit Committee monthly.
(e) (2)
| Services approved pursuant to paragraph (c)(7)(i)(C) of Rule 2-01 of Regulation S-X:
|
Audit-Related Fees:
There were no amounts that were approved by the Audit Committee pursuant to the de minimis exception for the fiscal years ended July 31, 2005 and July 31, 2004 on behalf of each fund.
There were no amounts that were required to be approved by the Audit Committee pursuant to the de minimis exception for the fiscal years ended July 31, 2005 and July 31, 2004 on behalf of the Fund Service Providers that relate directly to the operations and financial reporting of each fund.
Tax Fees:
There were no amounts that were approved by the Audit Committee pursuant to the de minimis exception for the fiscal years ended July 31, 2005 and July 31, 2004 on behalf of each fund.
There were no amounts that were required to be approved by the Audit Committee pursuant to the de minimis exception for the fiscal years ended July 31, 2005 and July 31, 2004 on behalf of the Fund Service Providers that relate directly to the operations and financial reporting of each fund.
All Other Fees:
There were no amounts that were approved by the Audit Committee pursuant to the de minimis exception for the fiscal years ended July 31, 2005 and July 31, 2004 on behalf of each fund.
There were no amounts that were required to be approved by the Audit Committee pursuant to the de minimis exception for the fiscal years ended July 31, 2005 and July 31, 2004 on behalf of the Fund Service Providers that relate directly to the operations and financial reporting of each fund.
(f) According to Deloitte Entities for the fiscal year ended July 31, 2005, the percentage of hours spent on the audit of each fund’s financial statements for the most recent fiscal year that were attributed to work performed by persons who are not full-time, permanent employees of Deloitte Entities is as follows:
Fund
| 2005
|
Fidelity Advisor Biotechnology Fund
| 0%
|
Fidelity Advisor Consumer Industries Fund
| 0%
|
Fidelity Advisor Cyclical Industries Fund
| 0%
|
Fidelity Advisor Developing Communications Fund
| 0%
|
Fidelity Advisor Electronics Fund
| 0%
|
Fidelity Advisor Financial Services Fund
| 0%
|
Fidelity Advisor Health Care Fund
| 0%
|
Fidelity Advisor Natural Resources Fund
| 0%
|
Fidelity Advisor Real Estate Fund
| 0%
|
Fidelity Advisor Technology Fund
| 0%
|
Fidelity Advisor Telecommunications & Utilities Growth Fund
| 0%
|
(g) For the fiscal years ended July 31, 2005 and July 31, 2004, the aggregate fees billed by Deloitte Entities of $650,000A and $2,050,000A for non-audit services rendered on behalf of the funds, FMR (not including any sub-adviser whose role is primarily portfolio management and is subcontracted with or overseen by another investment adviser) and Fund Service Providers relating to Covered Services and Non-Covered Services are shown in the table below.
| 2005A
| 2004A
|
Covered Services
| $250,000
| $850,000
|
Non-Covered Services
| $400,000
| $1,200,000
|
| 2005A
| 2004A
|
Covered Services
| $250,000
| $850,000
|
Non-Covered Services
| $400,000
| $1,200,000
|
A
| Aggregate amounts may reflect rounding.
|
(h) The trust’s Audit Committee has considered Non-Covered Services that were not pre-approved that were provided by Deloitte Entities to Fund Service Providers to be compatible with maintaining the independence of Deloitte Entities in its audit of the funds, taking into account representations from Deloitte Entities, in accordance with Independence Standards Board Standard No.1, regarding its independence from the funds and their related entities.
Item 5. Audit Committee of Listed Registrants
Not applicable.
Item 6. Schedule of Investments
Not applicable.
Item 7. Disclosure of Proxy Voting Policies and Procedures for Closed-End Management Investment Companies
Not applicable.
Item 8. Portfolio Managers of Closed-End Management Investment Companies
Not applicable.
Item 9. Purchase of Equity Securities by Closed-End Management Investment Company and Affiliated Purchasers
Not applicable.
Item 10. Submission of Matters to a Vote of Security Holders
There were no material changes to the procedures by which shareholders may recommend nominees to the trust’s Board of Trustees.
Item 11. Controls and Procedures
(a)(i) The President and Treasurer and the Chief Financial Officer have concluded that the trust’s disclosure controls and procedures (as defined in Rule 30a-3(c) under the Investment Company Act) provide reasonable assurances that material information relating to the trust is made known to them by the appropriate persons, based on their evaluation of these controls and procedures as of a date within 90 days of the filing date of this report.
(a)(ii) There was no change in the trust’s internal control over financial reporting (as defined in Rule 30a-3(d) under the Investment Company Act) that occurred during the second fiscal quarter of the period covered by this report that has materially affected, or is reasonably likely to materially affect, the trust’s internal control over financial reporting.
Item 12. Exhibits
(a)
| (1)
| Code of Ethics pursuant to Item 2 of Form N-CSR is filed and attached hereto as EX-99.CODE ETH.
|
(a)
| (2)
| Certification pursuant to Rule 30a-2(a) under the Investment Company Act of 1940 (17 CFR 270.30a-2(a)) is filed and attached hereto as Exhibit 99.CERT.
|
(a)
| (3)
| Not applicable.
|
(b)
|
| Certification pursuant to Rule 30a-2(b) under the Investment Company Act of 1940 (17 CFR 270.30a-2(b)) is furnished and attached hereto as Exhibit 99.906CERT.
|
SIGNATURES
Pursuant to the requirements of the Securities Exchange Act of 1934 and the Investment Company Act of 1940, the registrant has duly caused this report to be signed on its behalf by the undersigned, thereunto duly authorized.
Fidelity Advisor Series VII
By:
| /s/Christine Reynolds
|
| Christine Reynolds
|
| President and Treasurer
|
|
|
Date:
| September 22, 2005
|
Pursuant to the requirements of the Securities Exchange Act of 1934 and the Investment Company Act of 1940, this report has been signed below by the following persons on behalf of the registrant and in the capacities and on the dates indicated.
By:
| /s/Christine Reynolds
|
| Christine Reynolds
|
| President and Treasurer
|
|
|
Date:
| September 22, 2005
|
By:
| /s/Timothy F. Hayes
|
| Timothy F. Hayes
|
| Chief Financial Officer
|
|
|
Date:
| September 22, 2005
|