Exhibit 99.1
Leo Hinkley Managing Director, IRO954-940-5300 NYSE: BBX November 2018
Forward Looking Statements This presentation contains forward-looking statements based largely on current expectations of BBX Capital or its subsidiaries that involve a number of risks and uncertainties. All opinions, forecasts, projections, future plans and other statements, other than statements of historical fact, are forward-looking statements. Forward-looking statements may be identified by the use of words or phrases such as “plans,” “believes,” “will,” “expects,” “anticipates,” “intends,” “estimates,” “our view,” “we see,” “would” and words and phrases of similar import. The forward-looking statements in this presentation are also forward-looking statements within the meaning of Section 27A of the Securities Act of 1933, as amended (the “Securities Act”), and Section 21E of the Securities Exchange Act of 1934, as amended (the “Exchange Act”). We can give no assurance that such expectations will prove to have been correct. Actual results, performance, or achievements could differ materially from those contemplated, expressed, or implied by the forward-looking statements contained herein. Forward-looking statements are subject to a number of risks and uncertainties that are subject to change based on factors which are, in many instances, beyond our control. You should not place undue reliance on any forward-looking statement, which speaks only as of the date made. This presentation also contains information regarding the past performance of the Company, its subsidiaries and their respective investments and operations, as well as trends relating to the industries in which the Company or its subsidiaries operate. Prior or current performance or trends is not a guarantee or indication of future performance or trends. Future results could differ materially as a result of a variety of risks and uncertainties. Some factors which may affect the accuracy of the forward-looking statements apply generally to the industries in which the Company operates, including the development, operation, management and investment in residential and commercial real estate, the resort development and vacation ownership industries in which Bluegreen operates, the home improvement industry in which Renin operates, and the sugar, candy and retail industry in which IT’SUGAR operates. Risks and uncertainties include, without limitation, the risks and uncertainties affecting BBX Capital and its subsidiaries, and their respective results, operations, markets, products, services and business strategies, including risks associated with the ability to successfully implement currently anticipated plans and initiatives and to generate earnings, long term growth and increased value, the risk that new IT’SUGAR stores may not perform as expected, the risk that Renin’s sales, margin and other financial performance measures may not improve, the risk that the performance of entities in which BBX Capital has made investments may not be profitable or perform as anticipated; BBX Capital is dependent upon dividends from its subsidiaries, principally Bluegreen, to fund its operations; BBX Capital’s subsidiaries may not be in a position to pay dividends, dividend payments may be subject to certain restrictions, including restrictions contained in debt instruments, and may be subject to declaration by such subsidiary’s board of directors or managers; the risks relating to acquisitions, including acquisitions in diverse activities, including the risk that they will not perform as expected and will adversely impact the Company’s results; risks related to BBX Capital’s transaction with the Altman Companies, including that it may not result in the benefits expected or otherwise have a positive impact on BBX Capital or its financial performance; risks relating to the monetization of BBX Capital’s legacy assets; risks relating to the valuation of BBX Capital; and risks related to litigation and other legal proceedings involving BBX Capital and its subsidiaries. The Company’s investment in Bluegreen Vacations Corporation exposes the Company to risks of Bluegreen’s business, including risks relating to its marketing agreements and other strategic alliances and relationships, risks related to what we perceive to be its competitive advantages, including that they may not be maintained or result in the benefits expected, risks related to growth opportunities, and risks inherent in the vacation ownership industry, as well as other risks relating to the ownership of Bluegreen’s common stock, including those risks described in Bluegreen’s Annual and Quarterly Reports filed with the SEC. In addition, with respect to BBX Capital’s Real Estate and Middle Market Divisions, the risks and uncertainties also include risks relating to the real estate market and real estate development, the risk that joint venture partners may not fulfill their obligations and the projects may not be developed as anticipated or be profitable, and the risk that contractual commitments may not be completed on the terms provided or at all; risks relating to acquisition and performance of operating businesses, including integration risks, risks regarding achieving profitability, the risk that new personnel will not be successful, foreign currency transaction risk, goodwill and other intangible impairment risks, and the risk that assets may be disposed of at a loss. Reference is also made to the other risks and uncertainties described in BBX Capital’s Quarterly Report on Form10-Q for the quarter ended September 30, 2018 and its Annual Report on Form10-K for the year ended December 31, 2017 including the Risk Factors Section thereof. The Company cautions that the foregoing factors are not exclusive. 2
BBX Capital Corporation A Diversified Holding Company BBX Capital Corporation (NYSE: BBX) is a Florida-based, diversified holding company whose activities include its 90% ownership of Bluegreen Vacations Corporation (NYSE: BXG) as well as its Real Estate and Middle Market divisions. 3
BBX Capital Executive Team Alan B. Levan Chairman & CEO John E. Abdo Vice Chairman Jarett Levan President Seth Wise BBX Capital Real Estate President Ray Lopez Chief Financial Officer Led by an entrepreneurial team focused on creating value over the long term 4
BBX’s Corporate Strategy Build long-term shareholder value as opposed Goal to focusing on quarterly or annual earnings Since many of BBX Capital’s assets do not generate income on a regular or predictable basis, our objective is to: Achieve long-term growth as measured by increases Objective in book value and intrinsic value over time 5
BBX Capital’s Segments* e bluegreenvacations® REAL ESTATE IT’SUC3AR IJ RENIN *The company also has other investments, including MOD Pizza franchises, Hoffman’s Chocolates and Las Olas Confections and Snacks. These businesses are not material to our business and accordingly we are excluding them from this presentation. =asKCapital 6
BBX Capital Corporation & Affiliates A family of companies dating back more than 45 years, whose activities have included: • Real Estate Acquisition and Management—$1 Billion+ • Banking—100 Branches, $6.5 Billion in Assets • Commercial Real Estate Lending—$3 Billion+ • Investment Banking & Brokerage—1,000 Investment Professionals • Homebuilding—Thousands of Homes • Planned Community Development—9,000 Acres • Asian Themed Restaurants—65 Locations • Vacation Ownership Resort Network, including 69 resorts, and over 216,000+ vacation club owners • Designer, Distributor and Manufacturer of Specialty Doors, Hardware and Home Décor Products • The largest specialty candy retailer in the United States with 96 locations in 26 states and Washington, DC Seeking to invest in companies at the right time and optimize BBX’s value add 7
Past Activities BFCFinancial BankAtlantic LEVITT CORPORATION Sr. LUCIE WEST RYAN BECK~Co. BENIHANA. Capital 8
BBX Capital Corporation As of September 30, 2018 (in thousands) Consolidated Assets: $1,667,767 Shareholders’ Equity: $ 552,740 Market Capitalization: $ 690,007 9
BBX Capital Solid Financial Foundation 2013 2014 2015 2016 (7) 2017 (7) CAGR% (6) ($ in thousands) Total Revenues $ 563,991 676,996 744,257 822,153 869,570 Adjusted EBITDA (1) (2) (5) $ N/A N/A N/A 103,721 120,470 16.1% Fully Diluted Book Value $ 2.77 2.84 4.21 4.32 5.63 19.4% Per Share (3) (5) Over $145M in cash liquidity on our Balance Sheet (4) (1) Adjusted EBITDA is anon-GAAP financial measure. See appendix for a reconciliation of BBX Capital’s net income to Adjusted EBITDA. (2) BBX Capital’s assets do not generate net income or Adjusted EBITDA on a regular or predictable basis. Our objective is long-term growth as measured by increases in book value and intrinsic value over time. (3) The numerator of fully diluted book value per share for all periods is shareholders’ equity. The denominator of fully diluted book value per share for all periods was computed by adding the number of Class A and Class B shares outstanding at year end and the number ofnon-vested restricted stock awards and exercisable stock options. (4) Cash liquidity of BBX Capital Parent Company at September 30, 2018. (5) Adjusted EBITDA and Fully Diluted Book Value Per Share are not comparable metrics prior to the BFC Financial and BBX Capital Merger (6) CAGR – Compound Annual Growth percentage for adjusted EBITDA, over one year (7) Amounts were adjusted for the adoption of the revenue recognition standard and certain other items to maintain comparability with the 2018 presentation. 10
BBX Capital Solid Financial Foundation % Increase YTD YTD % Increase Q3 2017 (4) Q3 2018 (Decrease) 2017 (4) (5) 2018 (5) (Decrease) ($ in thousands) Total Revenues $ 240,896 254,403 5.61% 643,996 715,692 11.13% Adjusted EBITDA (1) (2) $ 28,155 22,122 (21.4%) 96,329 72,556 (24.7%) Fully Diluted Book Value Per Share (3) $ 4.75 5.62 18.3% (1) Adjusted EBITDA is a non-GAAP financial measure. See appendix for a reconciliation of BBX Capital’s net income to Adjusted EBITDA. (2) BBX Capital’s assets do not generate net income or Adjusted EBITDA on a regular or predictable basis. Our objective is long-term growth as measured by increases in book value and intrinsic value over time. (3) The numerator of fully diluted book value per share for all periods is shareholders’ equity. The denominator of fully diluted book value per share for all periods was computed by adding the number of Class A and Class B shares outstanding at year end and the number ofnon-vested restricted stock awards and exercisable stock options. (4) Amounts were adjusted for the adoption of the revenue recognition standard and certain other items to maintain comparability with the 2018 presentation. (5) For the nine months ended September 30, 2017 and 2018, respectively. 11
BBX Capital Stock Performance 2500% $9.03 $7.97 2000% $7.42 1500% $4.88 1000% $3.39 $2.89 $3.15 500% $1.26 300% $0.35 0% 12/30/2011 12/31/2012 12/31/2013 12/30/2014 12/31/2015 12/31/2016 12/31/2017 6/30/2018 9/30/2018 BBX Capital Class A Common Stock S&P 500 Historical results may not be indicative of future results. • On December 15, 2016, the Company, formerly BFC Financial Corporation, consummated its acquisition of BBX Capital Florida, LLC (formerly BBX Capital Corporation). Prior to such acquisition, the Company held an approximate 82% equity interest and 90% voting interest in the former BBX Capital Corporation. During January 2017, BFC Financial Corporation changed its name to BBX Capital Corporation. • The Company’s Class A Common Stock commenced trading on the NYSE on July 13, 2017. The Company’s Class A Common Stock previously traded on the OTCQX. • Note: Sale of BankAtlantic was closed on July 31, 2012. 12
Four Strategic Segments* 1 • NYSE: BXG • 90% ownership interest • 69 Resorts • 216,000+ Vacation Club Owners (1) (1) Data as of 9/30/18 2 Acquisition, Ownership, and Management of: • Developments • Joint Ventures • Investments 3 • Largest specialty candy retailer in the U.S.A. 4 Designer, manufacturer and distributor of specialty doors, hardware, and home décor products *The company also has other investments, including MOD Pizza franchises, Hoffman’s Chocolates and Las Olas Confections and Snacks. These businesses are not material to our business and accordingly we are excluding them from this presentation. 13
Four Strategic Segments* 1 • NYSE: BXG • 90% ownership interest • 69 Resorts • 216,000+ Vacation Club Owners (1) (1) Data as of 9/30/18 2 Acquisition, Ownership, and Management of: • Developments • Joint Ventures • Investments 3 Largest specialty candy retailer in the U.S.A. 4 Designer, manufacturer and distributor of specialty doors, hardware, and home décor products *The company also has other investments, including MOD Pizza franchises, Hoffman’s Chocolates and Las Olas Confections and Snacks. These businesses are not material to our business and accordingly we are excluding them from this presentation. 14
BLUEGREEN VACATIONS OVERVIEW 1994 Entered Vacation Ownership Industry 69 Resorts (1) 45 Club Resorts 24 Club Associate Resorts ~216,000 (1) Vacation Club Owners ~241,000 (2) Tours Annually 70%(2) Capital-Light Revenue 49%+ (2) Sales to New Customers $743 million (2) Revenue $146 million (2) (3) Adjusted EBITDA Solara Surfside | Miami Beach, Florida (1) Data as of 9/30/18. (2) Last Twelve Months period ended 9/30/18. “Capital Light” business activities include sales of VOIs owned by third-party developers for which we are paid a commission and sales of VOIs that we purchase underjust-in-time arrangements with third-parties or from secondary market sources. Reflects retrospective impact of ASU2014-09 “Revenue from Contracts with Customers (Topic 606).” (3) See appendix for a reconciliation of Adjusted EBITDA to Net Income of $135 million for LTM period ended 9/30/18. 15
Bluegreen Vacations Solid Financial Foundation 2013 2014 2015 2016 (2) 2017 (2) ($ in thousands) Total Revenues $ 515,628 583,193 617,647 719,942 723,052 Income before Taxes $ 82,507 108,971 124,319 129,624 136,998 Adjusted EBITDA (1) (2) $ N/A N/A 132,228 142,255 150,280 (1) Adjusted EBITDA is a non-GAAP financial measure. See Appendix for a reconciliation of Bluegreen’s net income to Adjusted EBITDA. (2) Amounts for the years ended 2016 and 2017 were retrospectively adjusted for the adoption of the revenue recognition standard 16
Third Quarter(1) Performance ($ in millions, except per share data) System-Wide Sales of VOIs $180 $175 $173.3 1.1% $171.4 $170 $165 $160 3Q 2017 3Q 2018 Adjusted EBITDA (2) $45 $40 $39.1 (10.7)% $34.9 $35 $30 3Q 2017 3Q 2018 Total Revenues $210 $202.2 $200 3.6% $195.2 $190 $180 3Q 2017 3Q 2018 Earnings Per Share $0.30 $0.28 $0.27 3.8% $0.26 $0.26 $0.24 $0.22 3Q 2017 3Q 2018 (1) Three months ended 9/30/18. (2) See appendix for reconciliations. 17
Year to Date(1) Performance ($ in millions, except per share data) System-Wide Sales of VOIs $480 $478.1 $475 2.3% $470 $467.3 $465 $460 $455 $450 YTD 2017 YTD 2018 Adjusted EBITDA (2) $120 $115 $114.8 (4.1)% $110.1 $110 $105 $100 YTD 2017 YTD 2018 Total Revenues $570 $564.7 $560 3.6% $550 $544.9 $540 $530 YTD 2017 YTD 2018 Earnings Per Share $0.95 $0.91 $0.90 7.1% $0.85 $0.85 $0.80 YTD 2017 YTD 2018 (1) Nine months ended 9/30/17 and 9/30/18. (2) See appendix for reconciliations. 18
The Vacation Ownership Industry Vacation Ownership Industry Sales ($ in billions) $8.6 $9.2 $9.6 $6.9 $7.6 $7.9 $6.3 $6.4 $6.5 Consistent Historical Industry Growth 2009 2010 2011 2012 2013 2014 2015 2016 2017 US Leisure Spend ($ in billions) $613 $632 $581 $596 $518 $533 $551 $465 $494 Vacations are a Priority for Consumers 2009 2010 2011 2012 2013 2014 2015 2016 2017 Sources: EY: State of the Vacation Timeshare Industry and Euromonitor 19
Vacation Vacation Ownership ship Public Public Peer Pee Group Gr p ($ in millions) Vacation Ownership Interest Sales in 2017 (1) (2) $2,143 $1,275 $729 $617 $498 (1) System-wide (Contract) sales for the year ended December 31, 2017. (2) From publicly available information 20
Potential Competitive Advantages Differentiated Target Demographic SignificantFee-Based VOI Sales Multiple Marketing Channels for New Owners Strong Net Owner Growth Balanced Approach to Growth Industry Innovator 21
A Leading Operator of“Drive-To” Vacation Ownership Resorts 85% of owners live within a4-hour drive to a Bluegreen resort Geographically diverse owner base Opportunities for growth in the western US Information as of 9/30/2018 22
Large and Differentiated Owner Base Bluegreen Vacation Club Owners (in thousands) 213 216 208 199 189 179 170 2012 2014 2016 9/30/2018 Avg. Customer Household Income (1) ($ in thousands) $161 $155 $113 $77 Owner Age at Purchase (2) Unknown 7% Millennial 27% Silent Gen 4% Gen X Baby 33% Boomer 29% The Innsbruck | Aspen, CO (1) Above ILG, VAC, and HGV data from 2017, 2018 and 2016 investor presentations issued by each, respectively. (2) Represents owner age at time of purchase for all sales to new owners1/1/14-9/30/18. 23
Bluegreen Vacation Club The Basics The Product Focus Points Vacation Placed in Points Annually, in perpetuity Owner’s Owner’s Account 2017 Average Transaction Size: $13,727 15,365 YTD 09/30/18 Average Transaction Size: $15,576 Deeded Deed Structure interest in a Placed in Simultaneous with VOI sale Bluegreen Vacation Club Legal resort Trust 24
Bluegreen Vacation Club Owner Benefits Basic Ownership Optional Traveler Plus Program $139 annual Club dues (1) $59.00 incremental annual fee (100% of owners) (69% of owners participate) Choice Hotels 69 Resorts (2) Over 6,800 hotels in 35+ countries Cruise Packages RCI Norwegian, Carnival, Crystal, 4,300+ resorts in The Bluegreen Royal Caribbean, Holland 110+ countries Vacation Club America provides access to a variety of destinations 43 Internal Direct Significant Vacation and resort types Exchange Resorts Flexibility Select Connection, Prizzma Including destination, length of stay andborrow-and-save options (3) Additional Vacation Options Interval, Coast to Coast Discounts at various hotels, restaurants, retail and leisure (1) Also requires annual payment of maintenance fees. establishments as well as (2) Information as of 9/30/18. rental car agencies (3) Ability to carryover any unused points for one year and to borrow points from the next year, subject to certain restrictions and fees. 25
Vacation Package Marketing Process Year Ending December 31, 2017 1 Sales of Vacation Packages >245,000 2 Activation Campaign Management >8 million Emails 3 Reservation, Activation & Confirmation >871,000 Inbound Calls and >435,000 Outbound calls 4 Preview Centers >138,000 Previews 5 VOI Sales Over $300 million during 2017 26
Sales & Marketing Driven Business Vacation Packages & Leads 224,000+ Vacation Tanger Outlets | Premium Outlets | Simon Malls Packages Sold Annually (1) 241,000+ Tours Annual Tours (New Customer & Existing Owners) (1) SalesIn-House Tours $630 Million+ System-Wide VOI Sales (1) ~216,000 Owners Vacation Club Owners (2) Marketing Mix by % of Sales (1) Other New Customer 28% Existing Owners 51% Choice Bass 7% Pro 14% New Customer Sales Existing Owner Sales (1) Last twelve months ended 9/30/18. (2) As of 9/30/18. 27
Strategic Relationships Bluegreen has multiple channels intended to drive sales within our core demographic • Extended strategic alliance through 2032 • Expanded opportunities in Choice marketing relationship • Currently 38 Bluegreen Vacations resorts are included in Choice’s upscale Ascend Hotel Collection portfolio of unique, boutique and historic independent hotels and resorts. •One-way, exclusivein-store Bass Pro marketing relationship • Operate kiosks in 69 Bass Pro stores • Virtual reality pilot program launched in Bass Pro stores in Memphis, TN and Springfield, MO • Bass Pro and Cabela’s merger expected to provide further opportunities for growth • Active in 22 outlet malls in proximity to Bluegreen resorts • Sell vacation packages to entice prospective owners to tour Bluegreen preview centers 28
Extensive Reach of Vacation Package Sales Locations Through Various Channels (1) SIMON ! (1) As of 9/30/18. Percent of owner Population by State 28 29
Bass Pro Cabela‘s Acquisition Provides Further Opportunity (1) (2) Percent of Bluegreen Owners by State 1-opUiallon oy :.tate (1) As of 9/30/18 (2) Assumes that Cabela locations are operated as a part of Bass Pro. 29 30
Choice Hotels #1 Hotel Program #2 Hotel Program • Bluegreen Vacations is the official vacation ownership provider of Choice Hotels • Exclusive relationship since 2013, renewed in 2017 for 15+ years • World’s second largest hotel company (1) • Industry’s fastest growing loyalty program with 35 million members (2) • Only hotel company on 2017 Forbes list of 100 top innovative companies • “Soft-branded” 38 Bluegreen resorts into Choice’s Ascend Hotel Collection • Close demographic match with Bluegreen Choice Privileges Membership (2) 40 35 35 30 30 25 25 millions) 22 in 20 19 17 14 15 12 (Members 10 10 5 0 2009 2010 2011 2012 2013 2014 2015 2016 2017 (1) In terms of units. (2) Choice Hotels company filings 31
Four Strategic Segments* 1 • NYSE: BXG • 90% ownership interest • 69 Resorts • 216,000+ Vacation Club Owners (1) (1) Data as of 9/30/18 2 Acquisition, Ownership, and Management of: • Developments • Joint Ventures • Investments 3 • Largest specialty candy retailer in the U.S.A. 4 Designer, manufacturer and distributor of specialty doors, hardware, and home décor products *The company also has other investments, including MOD Pizza franchises, Hoffman’s Chocolates and Las Olas Confections and Snacks. These businesses are not material to our business and accordingly we are excluding them from this presentation. 32
BBX Capital Real Estate Acquisition, ownership and management of joint ventures and investments in real estate and real estate development projects. 33
BBX Capital Real Estate The following describes current investments and joint ventures in real estate development projects. See appendix for additional details. 34
Beacon Lake – Master Planned Development Beacon Lake – Master Planned Development Jacksonville, Florida • Approximately 632 acres • Master Planned 1,476 Lots • 1,280 single family lots • 196 townhome lots • Development is staged in phases 35
Beacon Lake – Master Planned Development Beacon Lake – Phase I Jacksonville, Florida • 302 Lots • 151 Lot commitment with Dream Finders Homes • 151 Lot commitment with Mattamy Homes • 251 Lots taken down to date • 158 Homes sold by homebuilders to date • Land development for Phase I is substantially complete • Entry feature is substantially complete • Construction of amenity center is underway • Grand Opening had excellent attendance –approximately 650 people • Models are now open • Expected commencement of Phase II early 2019 36
Chapel Grove – New Development Chapel Grove Pembroke Pines, Florida • Initial Investment date – Q4 2017 • Approximately 2 acres • Anticipated development of 125 Luxury Townhomes • Prices range from mid $300K to low $400K • Partner—Label & Co • Land work is substantially completed • Vertical construction is currently underway • 84 townhomes contracted for sale to date • Models are open (1) Conceptual Renderings (1) 37
Other Development Activities (1) CC Homes Miramar Miramar, Florida Developing 193 Single Family Homes Initial Investment Date – Q2 2015 Status – Predevelopment Partner – Codina-Carr Company (1) Conceptual Renderings 38
Listing of Completed Real Estate Investments and Results Since 2012 (6) ($ In millions) Project Year of Investment Year of Cumulative Asset Name Description Investment Amount (1) Sale (2) Net Cash IRR (8) Inflows (3) Bonterra Land Sale 50 Acre Land Sale to Lennar 2013 $ 18.7 2015 $ 30.9 27% Flagler Land Joint Venture (5) Land Entitlement 2013 $ 0.9 2015 $ 6.8 324% Flagler Land Sale Land Entitlement 2013 $ 3.2 2015 $ 10.9 67% Gardens on Millenia – Costco and Outparcel Land Development 2013 $ 9.1 2015 $ 10.0 3% Village of Victoria Park (4) Construct 30 Single-Family Homes 2013 $ 1.1 2018 $ 2.9 22% Bonterra CC Homes (4) Develop 394 Single-Family Homes 2014 $ 7.4 2017 $ 26.1 62% The Addison on Millenia (4)(7) Develop 292 Multifamily Units 2015 $ 6.2 2018 $ 15.7 38% Gardens on Millenia—JV Retail (4) Develop Retail 2015 $ 6.3 2018 $ 8.7 16% Altis at Shingle Creek (4)(7) Develop 356 Multifamily Units 2016 $ 0.3 2018 $ 3.7 153% Historical results may not be indicative of future results (1) For assets held in joint ventures, “Investment Amount” represents the fair value of property contributed to the venture on the contribution date and cash invested in the venture. For other assets owned by BBX Capital, “Investment Amount” represents the fair value of the property upon foreclosure and subsequent cash invested in the asset. (2) “Year of sale” for single-family home projects represents the year in which the last home was sold. (3) “Cumulative Net Cash Inflows” represent cash inflows received through the project’s completion date. (4) These assets represent investments in real estate joint ventures that are not consolidated into BBX Capital’s financial statements. (5) Asset was held in a joint venture that was consolidated into BBX Capital’s financial statements. “Investment Amount” and “Cumulative Net Cash Inflows” are presented net of amounts attributed to noncontrolling interests. (6) This table does not include two student housing projects which were acquired through foreclosure and subsequently sold at a loss. (7) These properties were sold during Q4 2018. (8) IRR represents the return to BBX on its investment and was determined based upon the actual timing of cash outflows paid/property contributed by BBX and cash inflows received by BBX throughout the life of the project. Historical returns achieved by any prior investment are not a prediction of future performance or a guaranty of future results. 39
Acquisition of Altman Companies Transaction Details ➢ BBX Capital Real Estate acquired a 50% interest in The Altman Companies, including interests in Altman Development Company, Altman-Glenewinkel Construction, and the Altman Management Company. ➢ Simultaneously with the investment in Altman, BBX Capital Real Estate acquired a 50% interest in the General Partnership and all the existing developments, see next page. ➢ BBX Capital Real Estate has also agreed to acquire an additional 40% interest in Altman in approximately four years and has also agreed to buy the remaining 10% in certain circumstances. 40
Acquisition of Altman Companies ➢ Simultaneously with the investment in Altman, BBX Capital Real Estate acquired a 50% interest in the General Partnership and all the existing developments: Altis Boca Raton, Boca Raton, FL Altis Bonterra, Hialeah, FL Altis Grand Central, Tampa, FL Altis Lakeline, Austin, TX Altis Pembroke Gardens, Pembroke Pines, FL Altis Promenade, Tampa, FL Altis Wiregrass Ranch, Wesley Chapel, FL 41
Altman Companies Altman Companies is a real estate development company which operates a fully integrated platform covering all aspects of the development process from site selection, underwriting, design, construction, management and sale of apartment communities. Since 1968, The Altman Companies have developed, constructed, acquired and managed more than 25,000 multi-family homes in Florida, Michigan, Illinois, Tennessee, Georgia, Texas and North Carolina. The company is best known for its communities rented under its Altís brand. Its real estate and development activities are typically financed through a combination of internal and external equity and institutional debt. 42
Altís Grand Central | TAMPA, FL Altís Wiregrass Ranch | TAMPA, FL (1) Conceptual Renderings Altís Boca Raton | BOCA RATON, FL Altís at Kendall Square| MIAMI, FL 43
COMMUNITIES (1) Altís Shingle Creek | ORLANDO, FL Altís Bonterra | HIALEAH, FL (1) Conceptual Renderings Altís Pembroke Gardens | PEMBROKE PINES, FL Altís Lakeline | AUSTIN, TEXAS 44
APARTMENT INTERIORS THEALTMAN COMPA.”\IJES =asKCapital 45 ALTIS SHINGLE CREEK | ORLANDO, FL
APARTMENT INTERIORS THEALTMAN COMPA.”\IJES =asKCapital 46 ALTIS WIREGRASS | TAMPA FL
APARTMENT INTERIORS =asKCapital ALTIS BOCA RATON| BOCA RATON, FL 47
AMENITIES | INTERIOR =asKCapital 48 ALTIS AT BONTERRA, CLUBHOUSE| HIALLEAH, FL
AMENITIES | INTERIOR THEALTMAN COMPA.”\IJES =asKCapital ALTIS SAND LAKE, CLUBHOUSE| ORLANDO, FL 49
AMENITIES | INTERIOR THEALTMAN COMPA.”\IJES =asKCapital 50 ALTIS AT KENDALL SQUARE CLUBHOUSE| MIAMI, FL
AMENITIES | EXTERIOR =aBYCapital 51 ALTIS AT SHERIDAN VILLAGE| PEMBROKE PINES, FL
AMENITIES | EXTERIOR THEALTMAN COMPA.”\IJES =asKCapital 52 ALTIS SAND LAKE| ORLANDO, FL
AMENITIES | EXTERIOR =asKCapital 53. ALTIS BOCA RATON| BOCA RATON, FL
BBX Capital Real Estate 2014 2015 2016 (1) 2017 (1) ($ in thousands) Total Revenues $ 18,013 46,642 12,475 8,821 EBITDA (2) $ (3,799) 36,363 27,990 14,453 (1) Amounts were adjusted for the adoption of the revenue recognition standard. (2) See appendix for a reconciliation of BBX Capital Real Estate’s net income before income taxes to EBITDA. 54
BBX Capital Real Estate Q3 2017 (1) Q3 2018 YTD 2017 (1) (3) YTD 2018 (3) ($ in thousands) Total Revenues $ 1,643 8,279 6,606 26,024 EBITDA (2) $ 885 1,807 10,417 13,856 (1) Amounts were adjusted for the adoption of the revenue recognition standard. (2) See appendix for a reconciliation of BBX Capital Real Estate’s net income before income taxes to EBITDA. (3) For the nine months ended September 30, 2017 and 2018, respectively. 55
Four Strategic Segments* 1 • NYSE: BXG • 90% ownership interest • 69 Resorts • 216,000+ Vacation Club Owners (1) (1) Data as of 9/30/18 2 Acquisition, Ownership, and Management of: • Developments • Joint Ventures • Investments 3 • Largest specialty candy retailer in the U.S.A. 4 • Designer, manufacturer and distributor of specialty doors, hardware, and home décor products *The company also has other investments, including MOD Pizza franchises, Hoffman’s Chocolates and Las Olas Confections and Snacks. These businesses are not material to our business and accordingly we are excluding them from this presentation. 56
IT’SUGAR Headquartered in Deerfield Beach, Florida, IT’SUGAR, LLC (“IT’SUGAR”) is the largest specialty candy retailer in the United States with 96 locations in 26 states and Washington, DC. BBX Sweet Holdings acquired IT’SUGAR in June 2017 57
IT’SUGAR Current Footprint 96 locations in 26 states and Washington, DC. 58
IT’SUGAR New Stores Opened—2018 Easton Columbus, OH FAO Schweetz New York, NY Victory Park Dallas, TX Dayton Dayton Beach, FL 59
IT’SUGAR Q3 2017 (1) Q3 2018 YTD 2018 (3) ($ in thousands) Total Revenues $ 22,603 22,787 59,101 EBITDA (2) $ 3,326 2,716 2,850 Book Value $ N/A N/A 65,049 (1) Amounts were adjusted for the adoption of the revenue recognition standard. (2) See appendix for a reconciliation of IT’SUGAR’s net income (loss) before income taxes to EBITDA. (3) For the nine months ended September 30, 2018. YTD 2017 is not presented in the table as IT’SUGAR was acquired by the Company in June 2017 60
Four Strategic Segments* 1 • NYSE: BXG • 90% ownership interest • 69 Resorts • 216,000+ Vacation Club Owners (1) (1) Data as of 9/30/18 2 Acquisition, Ownership, and Management of: • Developments • Joint Ventures • Investments 3 • Largest specialty candy retailer in the U.S.A. 4 • Designer, manufacturer and distributor of specialty doors, hardware, and home décor products *The company also has other investments, including MOD Pizza franchises, Hoffman’s Chocolates and Las Olas Confections and Snacks. These businesses are not material to our business and accordingly we are excluding them from this presentation. 61
Designer, distributor, and manufacturer of: International Distribution Canada, United States, and Europe Balanced Sales Mix 50% of Sales from Big Box Retail • Specialty Doors • Hardware • Home Décor Products Lean Management Focused on Improving Sales and Margin Barn Door Systems Driving Growth Millwork Vendor of the Year—2016 62
2014 2015 2016 (1) 2017 (1) ($ in thousands) Total Revenues $ 57,839 56,461 65,068 68,935 Adjusted EBITDA (2) $ (174) (68) 1,852 4,595 Book Value $ 7,155 6,132 10,807 12,698 (1) Amounts were adjusted for the adoption of the revenue recognition standard. (2) See appendix for a reconciliation of Renin’s net income to Adjusted EBITDA. 63
Q3 2017 (1) Q3 2018 YTD 2017 (1) (3) YTD 2018 (3) ($ in thousands) Total Revenues $ 16,463 15,330 51,447 47,205 Adjusted EBITDA (2) $ 834 1,268 2,880 2,597 Book Value $ 11,922 12,539 (1) Amounts were adjusted for the adoption of the revenue recognition standard. (2) See appendix for a reconciliation of Renin’s net income to Adjusted EBITDA. (3) For the nine months ended September 30, 2017 and 2018, respectively. 64
Four Strategic Segments—Summary* 1 • NYSE: BXG • 90% ownership interest • 69 Resorts • 216,000+ Vacation Club Owners (1) (1) Data as of 9/30/18 2 Acquisition, Ownership, and Management of: • Developments • Joint Ventures • Investments 3 • Largest specialty candy retailer in the U.S.A. 4 • Designer, manufacturer and distributor of specialty doors, hardware, and home décor products *The company also has other investments, including MOD Pizza franchises, Hoffman’s Chocolates and Las Olas Confections and Snacks. These businesses are not material to our business and accordingly we are excluding them from this presentation. 65
BBX Capital: Possible Valuation Methodology • Consider the market cap of the Bluegreen Vacations stock owned by BBX, and consider it a tracking stock to BXG based on its ownership stake of 90% trading multiples of Hilton Grand Vacations and Marriott Vacations (4) (1) BBX Capital consolidated book value as of 9/30/18 of $552.7 million minus 90% of Bluegreen Vacations book value as of 9/30/18 of $382.7 million There are many ways to value a company and its securities. Valuation is a complex analytical process involving determinations as to the most appropriate and relevant methods of financial analysis. Thesum-of-the-parts is only one of many possible methodologies. The above valuation does not consider or take into account i) taxes or indebtedness due on a sale, ii) subsidiary expenses or operating results of the subsidiaries, or iii) corporate overhead. Further, estimates of the value of a business or securities may not be realized on sale or liquidation and do not reflect the prices at which securities may trade in the future. The market capitalization of Bluegreen and the equity value of Bluegreen held by BBX in Bluegreen is as of September 30, 2018. Such amount may increase or decrease in the future based on both factors relating to Bluegreen and factors outside of Bluegreen’s control. 66
BBX Capital: Possible Valuation Methodology Bluegreen (NYSE: BXG) Market Capitalization/Equity Value $1.34 billion as of 9/30/18 BBX Capital’s 90% Ownership of Bluegreen Vacations $1.20 billion Corporation BBX Capital’s Market Capitalization as of 9/30/18(2) $690 million BBX Capital’s Fully Diluted Shares Outstanding for the quarter 98 million (1) ended 9/30/18 BBX Capital’s Stock Price on 9/30/18 $7.42 (1) Includes unvested shares (2) Market capitalization is calculated based on the Company’s issued and outstanding Class A and Class B common stock times the quoted closing price on the applicable exchange as of September 30, 2018. There are many ways to value a company and its securities. Valuation is a complex analytical process involving determinations as to the most appropriate and relevant methods of financial analysis. Thesum-of-the-parts is only one of many possible methodologies. The above valuation does not consider or take into account i) taxes or indebtedness due on a sale, ii) subsidiary expenses or operating results of the subsidiaries, or iii) corporate overhead. Further, estimates of the value of a business or securities may not be realized on sale or liquidation and do not reflect the prices at which securities may trade in the future. The market capitalization of Bluegreen and the equity value of Bluegreen held by BBX in Bluegreen is as of September 30, 2018. Such amount may increase or decrease in the future based on both factors relating to Bluegreen and factors outside of Bluegreen’s control. 67
BBX Capital: Possible Valuation Methodology • Consider the market cap of the Bluegreen Vacations stock owned by BBX, and consider it a tracking stock to BXG based on its ownership stake of 90% + • Plus – BBX Capital’s book value, excluding Bluegreen Vacations (1) trading multiples of Hilton Grand Vacations and Marriott Vacations (4) (1) BBX Capital consolidated book value as of 9/30/18 of $552.7 million minus 90% of Bluegreen Vacations book value as of 9/30/18 of $382.7 million There are many ways to value a company and its securities. Valuation is a complex analytical process involving determinations as to the most appropriate and relevant methods of financial analysis. Thesum-of-the-parts is only one of many possible methodologies. The above valuation does not consider or take into account i) taxes or indebtedness due on a sale, ii) subsidiary expenses or operating results of the subsidiaries, or iii) corporate overhead. Further, estimates of the value of a business or securities may not be realized on sale or liquidation and do not reflect the prices at which securities may trade in the future. The market capitalization of Bluegreen and the equity value of Bluegreen held by BBX in Bluegreen is as of September 30, 2018. Such amount may increase or decrease in the future based on both factors relating to Bluegreen and factors outside of Bluegreen’s control. 68
BBX Capital: Valuable Assets Offer Potential Additional Upside Market Cap/Equity Value Market Value – $1.203B 9/30/18 Based on BBX’s 90% ownership stake + Book Value – ~$170M Excluding Bluegreen 9/30/18(1) PotentialSum-of-Parts ValuationSum-of-Parts ~$1.373B BBX fully diluted shares outstanding as of 9/30/18 98 Million (1) BBX Capital consolidated book value as of 9/30/18 of $552.7 million minus 90% of Bluegreen Vacations book value as of 9/30/18 of $382.7 million There are many ways to value a company and its securities. Valuation is a complex analytical process involving determinations as to the most appropriate and relevant methods of financial analysis. Thesum-of-the-parts is only one of many possible methodologies. The above valuation does not consider or take into account i) taxes or indebtedness due on a sale, ii) subsidiary expenses or operating results of the subsidiaries, or iii) corporate overhead. Further, estimates of the value of a business or securities may not be realized on sale or liquidation and do not reflect the prices at which securities may 69 trade in the future. The market capitalization of Bluegreen and the equity value of Bluegreen held by BBX in Bluegreen is as of September 30, 2018. Such amount may increase or decrease in the future based on both factors relating to Bluegreen and factors outside of Bluegreen’s control.
BBX Capital: Possible Valuation Methodology • Consider the market cap of the Bluegreen Vacations stock owned by BBX, and consider it a tracking stock to BXG based on its ownership stake of 90% + • Plus – BBX Capital’s book value, excluding Bluegreen Vacations (1) + • Plus – the market value of BBX Capital’s net assets, excluding Bluegreen Vacations, in excess of book value, if any (1) BBX Capital consolidated book value as of 9/30/18 of $552.7 million minus 90% of Bluegreen Vacations book value as of 9/30/18 of $382.7 million There are many ways to value a company and its securities. Valuation is a complex analytical process involving determinations as to the most appropriate and relevant methods of financial analysis. Thesum-of-the-parts is only one of many possible methodologies. The above valuation does not consider or take into account i) taxes or indebtedness due on a sale, ii) subsidiary expenses or operating results of the subsidiaries, or iii) corporate overhead. Further, estimates of the value of a business or securities may not be realized on sale or liquidation and do not reflect the prices at which securities may trade in the future. The market capitalization of Bluegreen and the equity value of Bluegreen held by BBX in Bluegreen is as of September 30, 2018. Such amount may increase or decrease in the future based on both factors relating to Bluegreen and factors outside of Bluegreen’s control. 70
A Diversified Holding Company Summary 90% owner of Bluegreen Vacations, a profitable and growing“drive-to” vacation ownership company, with a compelling valuation opportunity Track record of identifying growth opportunities, becomingvalue-add partners, with a strong financial footing Current portfolio of assets in diverse verticals Led by an entrepreneurial team focused on creating value over the long term 71
NYSE: BBX Thank You!
Leo Hinkley Managing Director, IRO954-940-5300 Appendix:
BBX Capital Corporation Fully Diluted S&P Fully Diluted Book Value Stock Price Book Value Stock 500 Index Date ($) Book Value (1) Per Share Price Increase/Decrease Increase/Decrease ($ Per Share) Increase/Decrease Over Prior Year % Over Prior Year % Over Prior Year % 12/31/2011 $ 121,534 $ 1.53 (18%) $ 0.35 (5%) (1%) 12/31/2012 $ 298,967 $ 3.50 132% $ 1.26 260% 13% 12/31/2013 $ 239,421 $ 2.77 (21%) $ 2.89 129% 30% 12/31/2014 $ 252,906 $ 2.84 3% $ 3.20 11% 11% 12/31/2015 $ 376,826 $ 4.21 48% $ 3.39 6% (1%) 12/31/2016 $ 466,406 $ 4.32 3% $ 4.88 44% 10% 12/31/2017 $ 585,468 $ 5.63 30% $ 7.97 63% 19% 9/30/2018 $ 552,740 $ 5.62—$7.42 (7%) 9% Returns % Compound annual gain % 21% 57% 13% Overall gain % 267% 2,020% 132% (1) 2016 and 2017 Book Value ($) and Fully Diluted Book Value ($ Per Share) were adjusted for the adoption of the revenue recognition standard. Note: Sale of BankAtlantic was closed on July 31, 2012. 74
BBX Capital Corporation Reconciliation of Net Income to EBITDA and Adjusted EBITDA 2016 (1) 2017 (1) 3Q 2017 3Q 2018 YTD 2017 (2) YTD 2018 (2) ($’s in thousands) Net Income $ 42,596 102,303 11,524 11,985 47,769 40,126 Provision (Benefit) for income taxes 36,390 (9,702) 8,126 6,742 30,021 21,997 Income before income taxes 78,986 92,601 19,650 18,727 77,790 62,123 Add/(less): Interest income (other than interest earned on VOI notes receivable) (4,399) (3,706) (1,031) (1,033) (2,879) (4,189) Interest expense 36,037 35,205 9,483 11,130 27,580 30,732 Interest expense on receivable-backed debt (18,348) (17,809) (4,514) (5,001) (13,364) (14,334) Franchise taxes 186 178 72 56 127 180 Depreciation and amortization 12,906 16,762 4,624 5,657 11,738 16,012 EBITDA 105,368 123,231 28,284 29,536 100,992 90,524 EBITDA attributable tonon-controlling interests (10,005) (14,531) (3,496) (7,356) (9,547) (20,699) Loss (gain) on assetsheld-for-sale (1,423) 46 4 18 44 9 Foreign Exchange (gain) loss (219) 193 105 (76) 312 (91) Corporate realignment cost—6,750 3,258—4,528 2,813One-time special bonus 10,000 — — -Payment to Bass Pro—4,781 — — Adjusted EBITDA $ 103,721 120,470 28,155 22,122 96,329 72,556 (1) Amounts were adjusted for the adoption of the revenue recognition standard. (2) For the nine months ended September 30, 2017 and 2018, respectively. EBITDA is defined as earnings, or net income, before taking into account interest income (excluding interest earned on VOI notes receivable), interest expense (excluding interest expense incurred on financings related to Bluegreen’s receivable-backed notes payable), franchise taxes, and depreciation and amortization. For purposes of the EBITDA calculation, no adjustments were made for interest income earned on Bluegreen’s VOI notes receivable or the interest expense incurred on debt that is secured by such notes receivable because they are both considered to be part of the operations of Bluegreen’s business. Including the amortization of product displays provided to customers that are presented as a reduction of trade sales. Adjusted EBITDA is defined as EBITDA Adjusted for EBIDTA attributable to noncontrolling interest and items that the Company believes are not representative of ongoing operating results. In addition, Adjusted EBITDA for 2017 has been adjusted to exclude accruals for lease obligations and severance costs associated with the closure of a factory by BBX Sweet Holdings, in order to maintain comparability with the presentation of Adjusted EBIDTA for 2018. The Company considers EBITDA and Adjusted EBITDA to be an indicator of its operating performance, and it is used to measure its and its subsidiaries ability to service debt, fund capital expenditures and expand its business. EBITDA is also used by companies, lenders, investors and others because it excludes certain items that can vary widely across different industries or among companies within the same industry. For example, interest expense can be dependent on a company’s capital structure, debt levels and credit ratings. Accordingly, the impact of interest expense on earnings can vary significantly among companies. Additionally, the tax positions of companies can also vary because of their differing abilities to take advantage of tax benefits and because of the tax policies of the jurisdictions in which they operate. As a result, effective tax rates and provision for income taxes can vary considerably among companies. EBITDA also excludes depreciation and amortization because companies utilize productive assets of different ages and use different methods of both acquiring and depreciating productive assets. These differences can result in considerable 75 variability in the relative costs of productive assets and the related depreciation and amortization expense among companies. The Company considers Adjusted EBITDA to be a useful supplemental measure of its operating performance that facilitates the comparability of historical financial periods. EDITDA and Adjusted EBITDA should not be considered as an alternative to income before income taxes as an indicator of the company’s financial performance, or as an alternative to cash flow from operating activities as a measure of its liquidity. The Company’s computation of EBIDTA and Adjusted EBITDA may differ from the methodology utilized by other companies. Investors are cautioned that items excluded from EBITDA and Adjusted EBITDA are significant components in understanding and assessing the Company’s financial performance.
IT’SUGAR Reconciliation of net income (loss) before income taxes to EBITDA Q3 2017 (1) Q3 2018 YTD 2018 (2) ($ in thousands) Income (loss) before income taxes $ 2,326 1,563 (477) Add: Depreciation and Amortization $ 1,000 1,153 3,327 EBITDA $ 3,326 2,716 2,850 (1) Amounts were adjusted for the adoption of the revenue recognition standard. (2) For the nine months ended September 30, 2018. IT’SUGAR’s EBITDA is defined as its earnings, or net income, before taking into account interest expense, income taxes, and depreciation and amortization. The Company considers IT’SUGAR’s EBITDA to be an indicator of IT’SUGAR’s operating performance, and is used to measure IT’SUGAR’s ability to service debt, fund capital expenditures and expand its business. EBITDA is also used by companies, lenders, investors and others because it excludes certain items that can vary widely across different industries or among companies within the same industry. EBITDA should not be considered as an alternative to net income as an indicator of IT’SUGAR’s financial performance or as an alternative to cash flow from operating activities as a measure of its liquidity. The Company’s computation of IT’SUGAR’s EBITDA may differ from the methodology utilized by other companies, and investors are cautioned that items excluded from EBITDA are significant components in understanding and assessing IT’SUGAR’s financial performance. 76
Renin Holdings Reconciliation of net income to Adjusted EBITDA 2014 2015 2016 (1) 2017 (1) 3Q 2017 (1) 3Q 2018 YTD 2017 (2) YTD 2018 (2) (in thousands) Net income (loss) from Renin $ (2,049) (2,224) 857 1,484 (137) 518 599 529 Provision for income taxes 6 166—696 227 175 457 175 Income (loss) before income taxes (2,043) (2,058) 857 2,180 90 693 1,056 704 Add: Interest expense 551 406 396 509 161 157 343 497 Depreciation and amortization 603 546 818 1,713 478 494 1,169 1,487 EDITDA (889) (1,106) 2,071 4,402 729 1,344 2,568 2,688 Foreign exchange (gain) loss 715 1,038 (219) 193 105 (76) 312 (91) Adjusted EBITDA $ (174) (68) 1,852 4,595 834 1,268 2,880 2,597 (1) Amounts were adjusted for the adoption of the revenue recognition standard. (2) For the nine months ended September 30, 2017 and 2018, respectively. Renin’s EBITDA is defined as its earnings, or net income, before taking into account interest expense, income taxes, and depreciation and amortization, including the amortization of product displays provided to customers for marketing purposes that are presented as a reduction of trade sales under GAAP. Renin’s Adjusted EBITDA is defined as EBITDA adjusted for foreign exchange gains and losses, as exchange rates may vary significantly among companies. The Company considers Renin’s EBITDA and Adjusted EBITDA to be an indicator of Renin’s operating performance, and they are used to measure Renin’s ability to service debt, fund capital expenditures and expand its business. EBITDA is also used by companies, lenders, investors and others because it excludes certain items that can vary widely across different industries or among companies within the same industry. The Company considers Renin’s Adjusted EBITDA to be a useful supplemental measure of Renin’s operating performance that facilitates the comparability of historical financial periods. EBITDA and Adjusted EBITDA should not be considered as an alternative to net income as an indicator of Renin’s financial performance or as an alternative to cash flow from operating activities as a measure of its liquidity. The Company’s computation of Renin’s EBITDA and Adjusted EBITDA may differ from the methodology utilized by other companies, and investors are cautioned that 77 items excluded from EBITDA and Adjusted EBITDA are significant components in understanding and assessing Renin’s financial performance.
BBX Capital Real Estate Reconciliation of net income before income taxes to EBITDA 2014 2015 2016 2017 (1) ($ in thousands) Income before income taxes $ 471 45,474 30,993 16,097 Add/(Subtract): Interest income $ (5,072) (9,921) (3,606) (2,225) Depreciation and Amortization $ 802 810 603 581 EBITDA $ (3,799) 36,363 27,990 14,453 (1) Amounts were adjusted for the adoption of the revenue recognition standard. BBX Capital Real Estate’s EBITDA is defined as its earnings, or net income, before taking into account interest expense, income taxes, and depreciation and amortization. The Company considers BBX Capital Real Estate’s EBITDA to be an indicator of BBX Capital Real Estate’s operating performance, and is used to measure BBX Capital Real Estate’s ability to service debt, fund capital expenditures and expand its business. EBITDA is also used by companies, lenders, investors and others because it excludes certain items that can vary widely across different industries or among companies within the same industry. EBITDA should not be considered as an alternative to net income as an indicator of BBX Capital Real Estate’s financial performance or as an alternative to cash flow from operating activities as a measure of its liquidity. The Company’s computation of BBX Capital Real Estate’s EBITDA may differ from the methodology utilized by other companies, and investors are cautioned that items excluded from EBITDA are significant components in understanding and assessing BBX Capital Real Estate’s financial performance. 78
BBX Capital Real Estate Reconciliation of net income before income taxes to EBITDA Q3 2017 (1) Q3 2018 YTD 2017 (1) (2) YTD 2018 (2) ($ in thousands) Income before income taxes $ 1,421 1,945 11,852 15,637 Add/(Subtract): Interest income $ (697) (229) (1,915) (2,064) Depreciation and Amortization $ 161 91 480 283 EBITDA $ 885 1,807 10,417 13,856 (1) Amounts were adjusted for the adoption of the revenue recognition standard. (2) For the nine months ended September 30, 2017 and 2018, respectively. BBX Capital Real Estate’s EBITDA is defined as its earnings, or net income, before taking into account interest expense, income taxes, and depreciation and amortization. The Company considers BBX Capital Real Estate’s EBITDA to be an indicator of BBX Capital Real Estate’s operating performance, and is used to measure BBX Capital Real Estate’s ability to service debt, fund capital expenditures and expand its business. EBITDA is also used by companies, lenders, investors and others because it excludes certain items that can vary widely across different industries or among companies within the same industry. EBITDA should not be considered as an alternative to net income as an indicator of BBX Capital Real Estate’s financial performance or as an alternative to cash flow from operating activities as a measure of its liquidity. The Company’s computation of BBX Capital Real Estate’s EBITDA may differ from the methodology utilized by other companies, and investors are cautioned that items excluded from EBITDA are significant components in understanding and assessing BBX Capital Real Estate’s financial performance. 79
Portfolio of Real Estate Projects (5) Carrying Estimated Expected Remaining Start Amount of (3) Future Asset Name Project Size Status Exit/Sales (2) Investment (3) Date (3) Investment Proceeds Date (in millions) (in millions) (in millions) Multifamily Apartment Developments Altis at Lakeline (1) 354 Apartments Completed / Stabilized 2014 2019 $3.8—$7.1—$7.3 Altis at Bonterra (1) 314 Apartments Completed – Pending Contract (4) 2015 2019 $19.5—$45.3—$49.8 Altis at Grand Central (1) 314 Apartments Under Development 2017 2021 $2.2—$2.7—$3.0 Altis at Promenade (1) 338 Apartments Under Development 2017 2021 $1.0—$1.9—$2.0 Altis Ludlam (1) 310 ApartmentsPre-Development 2018 TBD $0.4 TBD TBD Altis Preserve (1) 350 ApartmentsPre-development 2018 TBD $1.0 TBD TBD (1) These assets represent investments in real estate ventures that are not consolidated into our financial statements. (2) For our consolidated investments, the carrying amount of our investment represents the carrying amount of the real estate asset associated with the applicable project, and for our other investments, which are unconsolidated real estate joint ventures, the carrying amount of our investment represents our investment in the applicable joint venture recognized under the equity method of accounting. (3) The above information under the headings “Expected Exit/Sales Date and “Estimated Future Proceeds” is forward looking and inherently uncertain. The information is based on our current assumptions and expectations which are largely based on factors not within our control. These factors include, but are not limited to, economic conditions generally and conditions that affect the project in particular, the performance of our joint venture partners in managing the projects, potential overruns in development and operating costs, tenant demand for retail, storage and multifamily rental units, buyer demand for single family housing, and the values of the underlying real estate upon sale or exit. Accordingly, there is no assurance that we will achieve results consistent with this forward looking information, and our actual results could differ materially from the information provided. For a discussion of other factors that may impact our actual results, and additional risks and uncertainty related to BBX Capital Real Estate’s projects, see the risks, uncertainties and cautionary factors discussed in our 2017 Annual Report on Form10-K. (4) Altis at Bonterra joint venture is currently negotiating a contract to sell the property. The contract will be subject to various closing conditions, including the potential buyer’s performance of due diligence on the respective property. To the extent that the various contingencies to closing are satisfied, we anticipate that the sale of Altis at Bonterra will occur during the first quarter of 2019. (5) Excludes investments in projects that were made in connection with the Altman acquisition and two projects that were sold in Q4 2018. See “Listing of Completed Real Estate Investments and Results since 2012” on Page 48. 80
Portfolio of Real Estate Projects Carrying Estimated Expected Remaining Start Amount of (3) Future Asset Name Project Size Status Exit/Sales (2) Investment (3) Date (3) Investment Proceeds Date (in millions) (in millions) (in millions) Single Family Developments Under Development Chapel Grove units under contract, 84 2018—(1) 125 Townhomes 2017 $4.7—$6.3—$7.0 Townhomes units closed, 0 2019 Under Development (4) lots under contract, 97 2018—Beacon Lake 1,476 Lots 2016 $21.0 TBD TBD lots closed, 205 2025 Miramar CC Homes (1) 193 Homes Predevelopment 2015 TBD $1.6 TBD TBD Retail Developments Gardens on Millenia–Land 1 Outparcel Completed – land lease 2013 TBD $1.3—$1.9—$2.1 (1) These assets represent investments in real estate ventures that are not consolidated into our financial statements. (2) For our consolidated investments, the carrying amount of our investment represents the carrying amount of the real estate asset associated with the applicable project, and for our other investments, which are unconsolidated real estate joint ventures, the carrying amount of our investment represents our investment in the applicable joint venture recognized under the equity method of accounting. (3) The above information under the headings “Expected Exit/Sales Date and “Estimated Future Proceeds” is forward looking and inherently uncertain. The information is based on our current assumptions and expectations which are largely based on factors not within our control. These factors include, but are not limited to, economic conditions generally and conditions that affect the project in particular, the performance of our joint venture partners in managing the projects, potential overruns in development and operating costs, tenant demand for retail, storage and multifamily rental units, buyer demand for single family housing, and the values of the underlying real estate upon sale or exit. Accordingly, there is no assurance that we will achieve results consistent with this forward looking information, and our actual results could differ materially from the information provided. For a discussion of other factors that may impact our actual results, and additional risks and uncertainty related to BBX Capital Real Estate’s projects, see the risks, uncertainties and cautionary factors discussed in our 2017 Annual Report on Form10-K. (4) A portion of the carrying amount of the Beacon Lake investment was funded by Community Development Bonds. A pro rata portion of the Community Development Bond obligations attaches to each parcel in the development and BBX Capital will be responsible for making payments from time to time subject to future sale of the parcels. 81
Portfolio of Real Estate Projects Carrying Estimated Expected Remaining Start Amount of (3) Future Asset Name Project Size Status Exit/Sales (2) Investment (3) Date (3) Investment Proceeds Date (in millions) (in millions) (in millions) Mixed Use Developments Completed (1) - 2 commercial buildings PGA Pod B 145,000 SF 2013 2019 $0.7—$3.3—$4.1 available for sale—2 buildings under contract (5) Under Development –PGA Pods A&C 18 Acres 2014 2020 $6.5 $0.8—$1.0 $7.2—$8.0 Available for sale (1) TBD Bayview Site 3 Acres Predevelopment 2014 TBD $1.4 TBD Operating Property (4) 90,000 SF Completed – pending rent RoboVault 2013 2021 $6.9—$10.0—$14.0 Storage Facility stabilization (1) These assets represent investments in real estate ventures that are not consolidated into our financial statements. (2) For our consolidated investments, the carrying amount of our investment represents the carrying amount of the real estate asset associated with the applicable project, and for our other investments, which are unconsolidated real estate joint ventures, the carrying amount of our investment represents our investment in the applicable joint venture recognized under the equity method of accounting. (3) The above information under the headings “Expected Exit/Sales Date” and “Estimated Future Proceeds” is forward looking and inherently uncertain. The information is based on our current assumptions and expectations which are largely based on factors not within our control. These factors include, but are not limited to, economic conditions generally and conditions that affect the project in particular, the performance of our joint venture partners in managing the projects, potential overruns in development and operating costs, tenant demand for retail, storage and multifamily rental units, buyer demand for single family housing, and the values of the underlying real estate upon sale or exit. Accordingly, there is no assurance that we will achieve results consistent with this forward looking information, and our actual results could differ materially from the information provided. For a discussion of other factors that may impact our actual results, and additional risks and uncertainty related to BBX Capital Real Estate’s projects, see the risks, uncertainties and cautionary factors discussed in our 2017 Annual Report on Form10-K. (4) RoboVault generated revenue of $1.2 million during the year ended December 31, 2017. (5) Building 10 and 11 are currently under contract subject to various closing conditions including the buyer’s completion of due diligence on the buildings. To the extent that the closing conditions are satisfied, we anticipate the sale of the buildings during the first quarter of 2019. 82
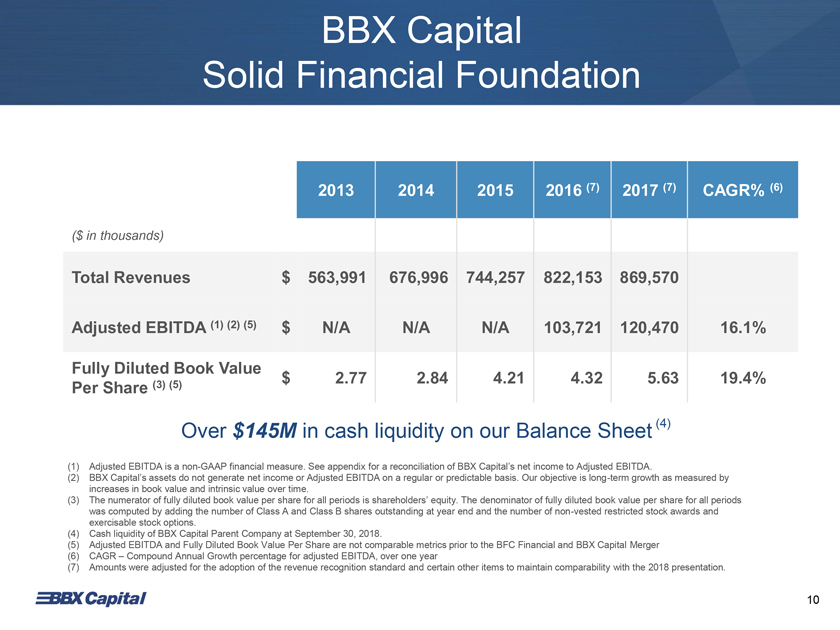
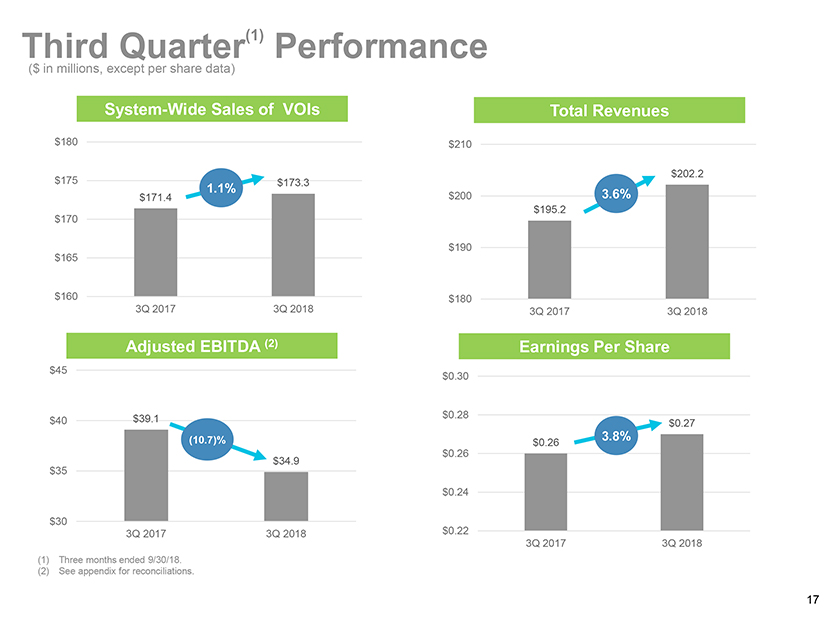
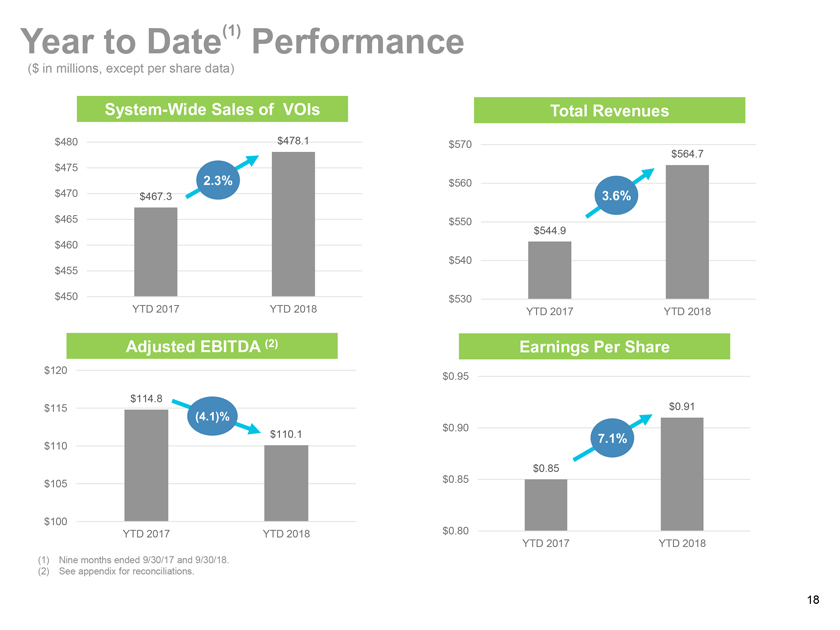
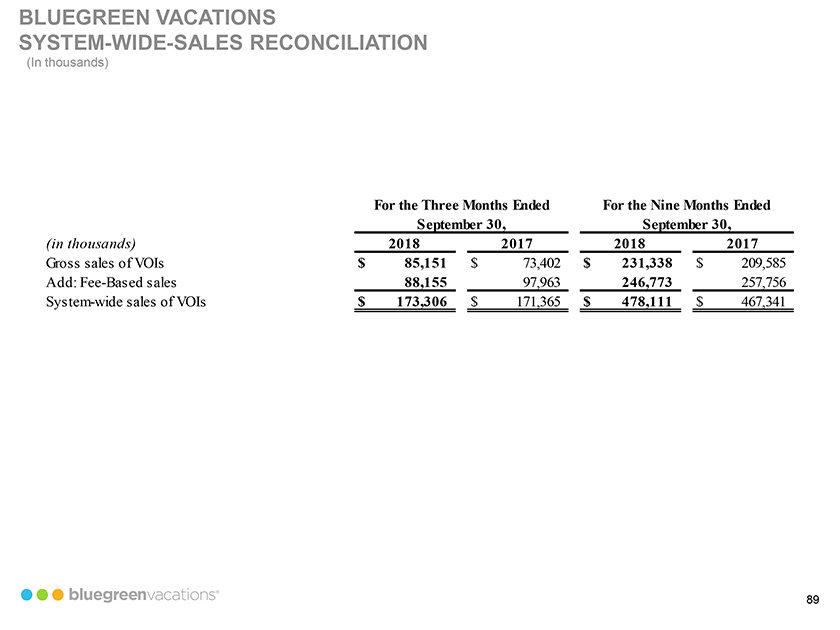
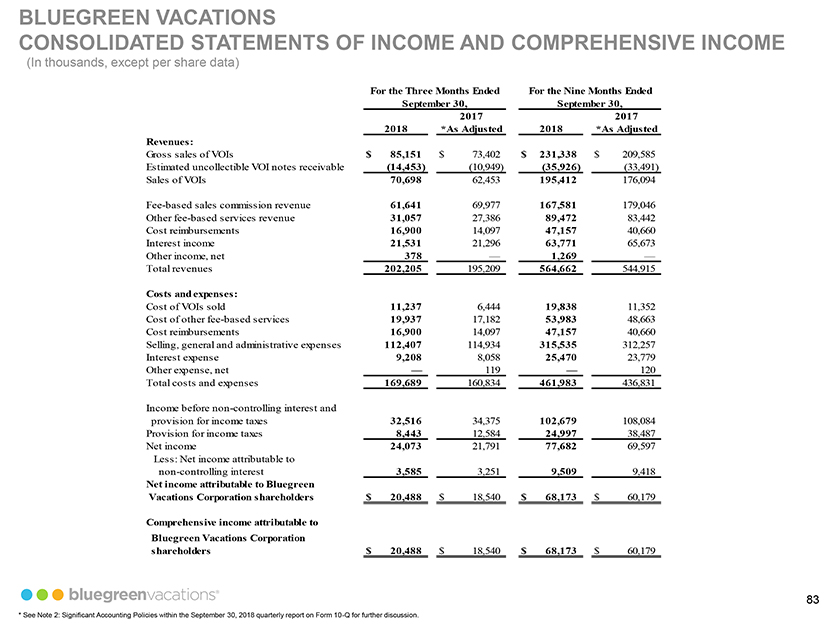
BLUEGREEN VACATIONS CONSOLIDATED STATEMENTS OF INCOME AND COMPREHENSIVE INCOME (In thousands, except per share data) For the Three Months Ended For the Nine Months Ended September 30, September 30, 2017 2017 2018 *As Adjusted 2018 *As Adjusted Revenues: Gross sales of VOIs $ 85,151 $ 73,402 $ 231,338 $ 209,585 Estimated uncollectible VOI notes receivable (14,453) (10,949) (35,926) (33,491) Sales of VOIs 70,698 62,453 195,412 176,094Fee-based sales commission revenue 61,641 69,977 167,581 179,046 Otherfee-based services revenue 31,057 27,386 89,472 83,442 Cost reimbursements 16,900 14,097 47,157 40,660 Interest income 21,531 21,296 63,771 65,673 Other income, net 378 — 1,269 — Total revenues 202,205 195,209 564,662 544,915 Costs and expenses: Cost of VOIs sold 11,237 6,444 19,838 11,352 Cost of otherfee-based services 19,937 17,182 53,983 48,663 Cost reimbursements 16,900 14,097 47,157 40,660 Selling, general and administrative expenses 112,407 114,934 315,535 312,257 Interest expense 9,208 8,058 25,470 23,779 Other expense, net — 119 — 120 Total costs and expenses 169,689 160,834 461,983 436,831 Income beforenon-controlling interest and provision for income taxes 32,516 34,375 102,679 108,084 Provision for income taxes 8,443 12,584 24,997 38,487 Net income 24,073 21,791 77,682 69,597 Less: Net income attributable tonon-controlling interest 3,585 3,251 9,509 9,418 Net income attributable to Bluegreen Vacations Corporation shareholders $ 20,488 $ 18,540 $ 68,173 $ 60,179 Comprehensive income attributable to Bluegreen Vacations Corporation shareholders $ 20,488 $ 18,540 $ 68,173 $ 60,179 83 * See Note 2: Significant Accounting Policies within the September 30, 2018 quarterly report on Form10-Q for further discussion.
BLUEGREEN VACATIONS CONSOLIDATED STATEMENTS OF CASH FLOW (In thousands) For the Nine Months Ended September 30, 2018 2017 *As Adjusted Operating activities: Net income $ 77,682 $ 69,597 Adjustments to reconcile net income to net cash provided by operating activities: Depreciation and amortization 11,852 10,559 Loss on disposal of property and equipment — 428 Provision for loan losses 35,866 32,066 Provision (benefit) for deferred income taxes 2,730 (5,669) Changes in operating assets and liabilities: Notes receivable (48,492) (29,526) Prepaid expenses and other assets (23,386) (17,736) Inventory (23,405) (30,707) Accounts payable, accrued liabilities and other, and deferred income 12,895 19,677 Net cash provided by operating activities 45,742 48,689 Investing activities: Purchases of property and equipment (24,347) (9,380) Net cash used in investing activities (24,347) (9,380) Financing activities: Proceeds from borrowings collateralized by notes receivable 114,756 170,030 Payments on borrowings collateralized by notes receivable (103,578) (164,331) Proceeds from borrowings collateralized byline-of-credit facilities and notes payable 50,042 30,000 Payments underline-of-credit facilities and notes payable (36,717) (32,968) Payments of debt issuance costs (385) (3,217) Distributions tonon-controlling interest (4,900) (3,920) Dividends paid (33,631) (40,000) Net cash used in financing activities (14,413) (44,406) Net increase (decrease) in cash and cash equivalents and restricted cash 6,982 (5,097) Cash, cash equivalents and restricted cash at beginning of period 243,349 190,228 Cash, cash equivalents and restricted cash at end of period $ 250,331 $ 185,131 Supplemental schedule of operating cash flow information: Interest paid, net of amounts capitalized $ 22,437 $ 19,715 Income taxes paid $ 22,856 $ 41,087 Supplemental schedule ofnon-cash investing and financing activities: Acquisition of inventory, property, and equipment for notes payable $ 24,258 $ — 84 * See Note 2: Significant Accounting Policies within the September 30, 2018 quarterly report on Form10-Q for further discussion.
BLUEGREEN VACATIONS CONSOLIDATED BALANCE SHEETS (In thousands, except share data) December 31, September 30, 2017 2018 *As Adjusted ASSETS Cash and cash equivalents $ 195,439 $ 197,337 Restricted cash ($17,081 and $19,488 in VIEs at September 30, 2018 and December 31, 2017, respectively) 54,892 46,012 Notes receivable, net ($308,221 and $279,188 in VIEs at September 30, 2018 and December 31, 2017, respectively) 439,484 426,858 Inventory 325,532 281,291 Prepaid expenses 15,733 10,743 Other assets 70,498 52,506 Intangible assets, net 61,878 61,978 Loan to related party 80,000 80,000 Property and equipment, net 93,536 74,756 Total assets $ 1,336,992 $ 1,231,481 LIABILITIES AND SHAREHOLDERS’ EQUITY Liabilities Accounts payable $ 19,822 $ 22,955 Accrued liabilities and other 94,729 77,317 Deferred income 15,509 16,893 Deferred income taxes 91,696 88,966 Receivable-backed notes payable—recourse 97,770 84,697 Receivable-backed notespayable—non-recourse (in VIEs) 335,680 336,421Lines-of-credit and notes payable 137,834 100,194 Junior subordinated debentures 71,147 70,384 Total liabilities 864,187 797,827 Commitments and Contingencies—See Note 8 Shareholders’ Equity Common stock, $.01 par value, 100,000,000 shares authorized; 74,734,455 shares issued and outstanding at September 30, 2018 and December 31, 2017 747 747 Additionalpaid-in capital 274,366 274,366 Retained earnings 150,062 115,520 Total Bluegreen Vacations Corporation shareholders’ equity 425,175 390,633Non-controlling interest 47,630 43,021 Total shareholders’ equity 472,805 433,654 Total liabilities and shareholders’ equity $ 1,336,992 $ 1,231,481 85 *See Note 2: Significant Accounting Policies within the September 30, 2018 quarterly report on Form10-Q for further discussion.
BLUEGREEN VACATIONS ADJUSTED EBITDA RECONCILIATION (In thousands) For the Years Ended December 31, 2015 2016 2017 (dollars in thousands) Net income attributable to shareholder(s) $ 70,304 77,879 126,583 Net income attributable to thenon-controlling interest in Bluegreen/Big Cedar Vacations 11,705 10,125 12,760 Adjusted EBITDA attributable to thenon-controlling interest in Bluegreen/Big Cedar Vacations (11,197) (10,005) (12,485) Loss (gain) on assets held for sale 56 (1,423) 46 Add:One-time special bonus—10,000—Add: Depreciation 9,181 9,536 9,632 Less: Interest income (other than interest earned on VOI notes receivable) (5,652) (8,167) (6,874) Add: Interest expense—corporate and other 15,390 12,505 12,168 Add: Franchise taxes 130 185 178 Add: (Benefit) provision for income taxes 42,311 41,620 (2,345) Add: Corporate realignment cost — 5,836 Add:One-time payment to Bass Pro — 4,781 Total Adjusted EBITDA $ 132,228 142,255 150,280 86
BLUEGREEN VACATIONS ADJUSTED EBITDA RECONCILIATION (In thousands) For the Three Months Ended For the Nine Months Ended September 30, September 30, (in thousands) 2018 2017 2018 2017 Net income attributable to shareholders $ 20,488 $ 18,540 $ 68,173 $ 60,179 Net income attributable to thenon-controlling interest in Bluegreen/Big Cedar Vacations 3,585 3,251 9,509 9,418 Adjusted EBITDA attributable to thenon-controlling interest in Bluegreen/Big Cedar Vacations (3,637) (3,209) (9,521) (9,183) Loss on assets held for sale 18 4 9 44 Add: depreciation and amortization 3,169 2,420 9,087 7,089 Less: interest income (other than interest earned on VOI notes receivable) (1,407) (1,292) (4,222) (5,487) Add: interest expense—corporate and other 4,207 3,544 11,136 10,415 Add: franchise taxes 56 72 180 127 Add: provision for income taxes 8,443 12,584 24,997 38,487 Corporate realignment cost — 3,216 751 3,679 Total Adjusted EBITDA $ 34,922 $ 39,130 $ 110,099 $ 114,768 87
BLUEGREEN VACATIONS ADJUSTED EBITDA RECONCILIATION (In thousands) For the Twelve Months Ended September 30, 2018 Net income attributable to shareholders $ 134,577 Net income attributable to thenon-controlling interest in Bluegreen/Big Cedar Vacations 12,851 Adjusted EBITDA attributable to thenon-controlling interest in Bluegreen/Big Cedar Vacations (12,823) Loss on assets held for sale 11 Add: depreciation and amortization 11,630 Less: interest income (other than interest earned on VOI notes receivable) (5,609) Add: interest expense—corporate and other 12,889 Add: franchise taxes 231 Less: benefit for income taxes (15,835) Corporate realignment cost 2,908 One time payment to Bass Pro 4,781 Total Adjusted EBITDA $ 145,611 88
BLUEGREEN VACATIONS SYSTEM-WIDE-SALES RECONCILIATION (In thousands) For the Three Months Ended For the Nine Months Ended September 30, September 30, (in thousands) 2018 2017 2018 2017 Gross sales of VOIs $ 85,151 $ 73,402 $ 231,338 $ 209,585 Add:Fee-Based sales 88,155 97,963 246,773 257,756 System-wide sales of VOIs $ 173,306 $ 171,365 $ 478,111 $ 467,341 89
BLUEGREEN VACATIONS OTHER FINANCIAL DATA (In thousands) For the Three Months Ended For the Nine Months Ended September 30, September 30, 2018 2017 2018 2017 Financing Interest Income $ 20,009 $ 19,908 $ 59,281 $ 59,929 Financing Interest Expense (5,001) (4,514) (14,334) (13,364)Non-Financing Interest Income 1,522 1,388 4,490 5,744Non-Financing Interest Expense (4,207) (3,544) (11,136) (10,415) Mortgage Servicing Income 1,454 1,366 4,369 3,783 Mortgage Servicing Expense (1,419) (1,359) (4,351) (4,116) Title Revenue 3,491 2,373 9,355 10,927 Title Expense (1,227) (1,252) (3,584) (3,678) 90