
Exhibit 99.1 Leo Hinkley Managing Director, IRO 954-940-5300 NYSE: BBX August 2019Exhibit 99.1 Leo Hinkley Managing Director, IRO 954-940-5300 NYSE: BBX August 2019

Forward Looking Statements This presentation contains forward-looking statements based largely on current expectations of BBX Capital and/or its subsidiaries that involve a number of risks and uncertainties. All opinions, forecasts, projections, future plans and other statements, other than statements of historical fact, are forward-looking statements. Forward- looking statements may be identified by the use of words or phrases such as “plans,” “believes,” “will,” “expects,” “anticipates,” “intends,” “estimates,” “our view,” “we see,” “would” and words and phrases of similar import. The forward-looking statements in this presentation are also forward-looking statements within the meaning of Section 27A of the Securities Act of 1933, as amended (the “Securities Act”), and Section 21E of the Securities Exchange Act of 1934, as amended (the “Exchange Act”). We can give no assurance that such expectations will prove to have been correct. Actual results, performance, or achievements could differ materially from those contemplated, expressed, or implied by the forward-looking statements contained herein. Forward-looking statements are subject to a number of risks and uncertainties that are subject to change based on factors which are, in many instances, beyond our control. You should not place undue reliance on any forward-looking statement, which speaks only as of the date made. This presentation also contains information regarding the past performance of the Company, its subsidiaries and their respective investments and operations, as well as trends relating to the industries in which the Company or its subsidiaries operate. Prior or current performance or trends is not a guarantee or indication of future performance or trends. Future results could differ materially as a result of a variety of risks and uncertainties. Some factors which may affect the accuracy of the forward-looking statements apply generally to the industries in which the Company operates, including the resort development and vacation ownership industries in which Bluegreen operates, the development, operation, management and investment in residential and commercial real estate, the home improvement industry in which Renin operates, and the sugar and confectionery industry in which IT’SUGAR operates. Risks and uncertainties include, without limitation, the risks and uncertainties affecting BBX Capital and its subsidiaries, and their respective results, operations, markets, products, services and business strategies, including risks associated with the ability to successfully implement currently anticipated plans and generate earnings, long term growth, and increased value; the risk that BBX Capital’s efforts to streamline its businesses and reduce losses may not be successful or achieve the anticipated or desired benefits; the performance of entities of which BBX Capital has acquired or in which it has made investments may not be profitable or perform as anticipated; the risk that BBX Capital is dependent upon dividends from its subsidiaries, principally Bluegreen, to fund its operations and that its subsidiaries may not be in a position to pay dividends at current levels, if at all, dividend payments may be subject to certain restrictions, including restrictions contained in debt instruments, and may be subject to declaration by such subsidiary’s board of directors or managers; the risks relating to acquisitions, including acquisitions in diverse activities, including the risk that they will not be profitable or perform as anticipated, and will adversely impact the Company’s results; the risk that current IT’SUGAR stores will not be profitable and the new IT’SUGAR stores may not perform as expected, the risk that Renin’s sales, margin and other financial performance measures may not continue to improve, risks relating to the monetization of BBX Capital’s legacy assets; risks related to BBX Capital’s transaction with the Altman Companies, including that it may not result in the benefits expected or otherwise have a positive impact on BBX Capital or its financial performance; risks relating to the valuation of BBX Capital; and risks related to litigation and other legal proceedings involving BBX Capital and its subsidiaries. The Company’s investment in Bluegreen Vacations Corporation exposes the Company to risks of Bluegreen’s business including risks relating to its ability to increase Vacation Ownership Interests sales and profitability and risks inherent in the vacation ownership industry, risks relating to its operations, its relationships with its strategic partners and its ability to successfully grow new marketing partnerships and alliances, risks that Bluegreen’s marketing alliances will not contribute to growth or be profitable, risks that the expansion of the Bass Pro/Cabela’s marketing channels will not be successful or occur as anticipated; as well as other risks relating to the ownership of Bluegreen’s common stock, including those described in Bluegreen’s Annual and Quarterly Reports filed with the SEC. In addition, with respect to BBX Capital Real Estate, Renin, IT’SUGAR, and its other investments in operating businesses which includes its MOD Pizza franchises, Hoffman’s Chocolates and Las Olas Confections and Snacks, the risks and uncertainties include risks relating to the real estate market and real estate development, the risk that joint venture partners may not fulfill their obligations and the projects may not be developed as anticipated or be profitable, and the risk that contractual commitments may not be completed on the terms provided or at all; risks relating to acquisition and performance of operating businesses, including integration risks, risks regarding achieving profitability, foreign currency transaction risk, goodwill and other intangible impairment risks, risks relating to restructurings and restated charges, and the risk that assets may be disposed of at a loss. Reference is also made to the other risks and uncertainties described in BBX Capital’s Annual Report on Form 10-K for the year ended December 31, 2018 and its Quarterly Report on Form 10-Q for the quarter ended June 30, 2019, which will be available on the SEC's website, https://www.sec.gov, and on BBX Capital’s website, www.BBXCapital.com, upon filing with the SEC. The Company cautions that the foregoing factors are not exclusive, and that the reader should not place undue reliance on any forward-looking statement, which speaks only as of the date made. 2Forward Looking Statements This presentation contains forward-looking statements based largely on current expectations of BBX Capital and/or its subsidiaries that involve a number of risks and uncertainties. All opinions, forecasts, projections, future plans and other statements, other than statements of historical fact, are forward-looking statements. Forward- looking statements may be identified by the use of words or phrases such as “plans,” “believes,” “will,” “expects,” “anticipates,” “intends,” “estimates,” “our view,” “we see,” “would” and words and phrases of similar import. The forward-looking statements in this presentation are also forward-looking statements within the meaning of Section 27A of the Securities Act of 1933, as amended (the “Securities Act”), and Section 21E of the Securities Exchange Act of 1934, as amended (the “Exchange Act”). We can give no assurance that such expectations will prove to have been correct. Actual results, performance, or achievements could differ materially from those contemplated, expressed, or implied by the forward-looking statements contained herein. Forward-looking statements are subject to a number of risks and uncertainties that are subject to change based on factors which are, in many instances, beyond our control. You should not place undue reliance on any forward-looking statement, which speaks only as of the date made. This presentation also contains information regarding the past performance of the Company, its subsidiaries and their respective investments and operations, as well as trends relating to the industries in which the Company or its subsidiaries operate. Prior or current performance or trends is not a guarantee or indication of future performance or trends. Future results could differ materially as a result of a variety of risks and uncertainties. Some factors which may affect the accuracy of the forward-looking statements apply generally to the industries in which the Company operates, including the resort development and vacation ownership industries in which Bluegreen operates, the development, operation, management and investment in residential and commercial real estate, the home improvement industry in which Renin operates, and the sugar and confectionery industry in which IT’SUGAR operates. Risks and uncertainties include, without limitation, the risks and uncertainties affecting BBX Capital and its subsidiaries, and their respective results, operations, markets, products, services and business strategies, including risks associated with the ability to successfully implement currently anticipated plans and generate earnings, long term growth, and increased value; the risk that BBX Capital’s efforts to streamline its businesses and reduce losses may not be successful or achieve the anticipated or desired benefits; the performance of entities of which BBX Capital has acquired or in which it has made investments may not be profitable or perform as anticipated; the risk that BBX Capital is dependent upon dividends from its subsidiaries, principally Bluegreen, to fund its operations and that its subsidiaries may not be in a position to pay dividends at current levels, if at all, dividend payments may be subject to certain restrictions, including restrictions contained in debt instruments, and may be subject to declaration by such subsidiary’s board of directors or managers; the risks relating to acquisitions, including acquisitions in diverse activities, including the risk that they will not be profitable or perform as anticipated, and will adversely impact the Company’s results; the risk that current IT’SUGAR stores will not be profitable and the new IT’SUGAR stores may not perform as expected, the risk that Renin’s sales, margin and other financial performance measures may not continue to improve, risks relating to the monetization of BBX Capital’s legacy assets; risks related to BBX Capital’s transaction with the Altman Companies, including that it may not result in the benefits expected or otherwise have a positive impact on BBX Capital or its financial performance; risks relating to the valuation of BBX Capital; and risks related to litigation and other legal proceedings involving BBX Capital and its subsidiaries. The Company’s investment in Bluegreen Vacations Corporation exposes the Company to risks of Bluegreen’s business including risks relating to its ability to increase Vacation Ownership Interests sales and profitability and risks inherent in the vacation ownership industry, risks relating to its operations, its relationships with its strategic partners and its ability to successfully grow new marketing partnerships and alliances, risks that Bluegreen’s marketing alliances will not contribute to growth or be profitable, risks that the expansion of the Bass Pro/Cabela’s marketing channels will not be successful or occur as anticipated; as well as other risks relating to the ownership of Bluegreen’s common stock, including those described in Bluegreen’s Annual and Quarterly Reports filed with the SEC. In addition, with respect to BBX Capital Real Estate, Renin, IT’SUGAR, and its other investments in operating businesses which includes its MOD Pizza franchises, Hoffman’s Chocolates and Las Olas Confections and Snacks, the risks and uncertainties include risks relating to the real estate market and real estate development, the risk that joint venture partners may not fulfill their obligations and the projects may not be developed as anticipated or be profitable, and the risk that contractual commitments may not be completed on the terms provided or at all; risks relating to acquisition and performance of operating businesses, including integration risks, risks regarding achieving profitability, foreign currency transaction risk, goodwill and other intangible impairment risks, risks relating to restructurings and restated charges, and the risk that assets may be disposed of at a loss. Reference is also made to the other risks and uncertainties described in BBX Capital’s Annual Report on Form 10-K for the year ended December 31, 2018 and its Quarterly Report on Form 10-Q for the quarter ended June 30, 2019, which will be available on the SEC's website, https://www.sec.gov, and on BBX Capital’s website, www.BBXCapital.com, upon filing with the SEC. The Company cautions that the foregoing factors are not exclusive, and that the reader should not place undue reliance on any forward-looking statement, which speaks only as of the date made. 2
BBX Capital Corporation BBX Capital Corporation (NYSE: BBX) is a Florida-based, holding company whose activities include its 90% ownership of Bluegreen Vacations Corporation (NYSE: BXG) as well as its Real Estate, IT’SUGAR and Renin divisions. 3BBX Capital Corporation BBX Capital Corporation (NYSE: BBX) is a Florida-based, holding company whose activities include its 90% ownership of Bluegreen Vacations Corporation (NYSE: BXG) as well as its Real Estate, IT’SUGAR and Renin divisions. 3
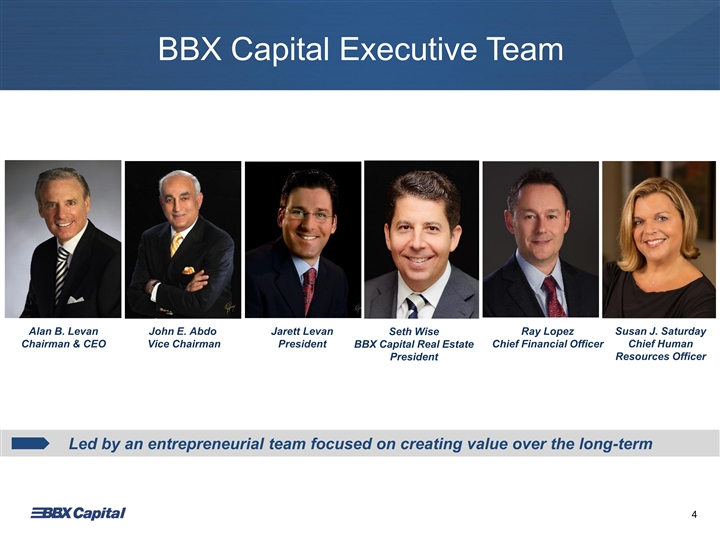
BBX Capital Executive Team Alan B. Levan John E. Abdo Jarett Levan Seth Wise Ray Lopez Susan J. Saturday Chief Human Chairman & CEO Vice Chairman President BBX Capital Real Estate Chief Financial Officer President Resources Officer Led by an entrepreneurial team focused on creating value over the long-term 4BBX Capital Executive Team Alan B. Levan John E. Abdo Jarett Levan Seth Wise Ray Lopez Susan J. Saturday Chief Human Chairman & CEO Vice Chairman President BBX Capital Real Estate Chief Financial Officer President Resources Officer Led by an entrepreneurial team focused on creating value over the long-term 4

BBX’s Corporate Strategy Build long-term shareholder value as opposed Goal to focusing on quarterly or annual earnings Since many of BBX Capital’s assets do not generate income on a regular or predictable basis, our objective is to: Achieve long-term growth as measured by increases Objective in book value and intrinsic value over time 5BBX’s Corporate Strategy Build long-term shareholder value as opposed Goal to focusing on quarterly or annual earnings Since many of BBX Capital’s assets do not generate income on a regular or predictable basis, our objective is to: Achieve long-term growth as measured by increases Objective in book value and intrinsic value over time 5
BBX Capital’s Segments* *The company also has other investments, including MOD Pizza franchises, Hoffman’s Chocolates and Las Olas Confections and Snacks. These businesses are not material to our business and accordingly we are excluding them from this presentation. 6BBX Capital’s Segments* *The company also has other investments, including MOD Pizza franchises, Hoffman’s Chocolates and Las Olas Confections and Snacks. These businesses are not material to our business and accordingly we are excluding them from this presentation. 6

BBX Capital Corporation & Affiliates A family of companies dating back more than 45 years, whose activities have included: • Real Estate Acquisition and Management - $1 Billion+ • Banking - 100 Branches, $6.5 Billion in Assets • Commercial Real Estate Lending - $3 Billion+ • Investment Banking & Brokerage - 1,000 Investment Professionals • Homebuilding - Thousands of Homes • Planned Community Development - 9,000 Acres • Asian Themed Restaurants - 65 Locations • Vacation Ownership Resort Network, including 69 resorts, and over 217,000+ vacation club owners • Designer, Distributor and Manufacturer of Specialty Doors, Hardware and Home Décor Products • The largest specialty candy retailer in the United States with ~100 locations in over 25 states and Washington, DC Seeking to invest in companies at the right time and optimize BBX’s value add 7BBX Capital Corporation & Affiliates A family of companies dating back more than 45 years, whose activities have included: • Real Estate Acquisition and Management - $1 Billion+ • Banking - 100 Branches, $6.5 Billion in Assets • Commercial Real Estate Lending - $3 Billion+ • Investment Banking & Brokerage - 1,000 Investment Professionals • Homebuilding - Thousands of Homes • Planned Community Development - 9,000 Acres • Asian Themed Restaurants - 65 Locations • Vacation Ownership Resort Network, including 69 resorts, and over 217,000+ vacation club owners • Designer, Distributor and Manufacturer of Specialty Doors, Hardware and Home Décor Products • The largest specialty candy retailer in the United States with ~100 locations in over 25 states and Washington, DC Seeking to invest in companies at the right time and optimize BBX’s value add 7
Past Activities 8Past Activities 8

BBX Capital Corporation As of June 30, 2019 (in thousands) Consolidated Assets: $1,801,761 Shareholders’ Equity: $ 539,405 Market Capitalization: $ 478,053 9BBX Capital Corporation As of June 30, 2019 (in thousands) Consolidated Assets: $1,801,761 Shareholders’ Equity: $ 539,405 Market Capitalization: $ 478,053 9

BBX Capital Solid Financial Foundation (7) (7) (7) (6)(7) (6)(7) (7) 2013 2014 2015 2016 2017 2018 ($ in thousands) Total Revenues $ 563,991 676,966 744,257 822,153 869,570 947,593 (1) (2) (5) Adjusted EBITDA $ N/A N/A N/A 103,721 122,853 109,150 Fully Diluted Book $ 2.77 2.84 4.21 4.32 5.63 5.70 (3) (5) Value Per Share (4) Over $125M in cash liquidity on our Balance Sheet (1) Adjusted EBITDA is a non-GAAP financial measure. See appendix for a reconciliation of BBX Capital’s net income to Adjusted EBITDA. (2) BBX Capital’s assets do not generate net income or Adjusted EBITDA on a regular or predictable basis. Our objective is long-term growth as measured by increases in book value and intrinsic value over time. (3) The numerator of fully diluted book value per share for all periods is shareholders’ equity. The denominator of fully diluted book value per share for all periods was computed by adding the number of Class A and Class B shares outstanding at year end and the number of non-vested restricted stock awards and exercisable stock options. (4) Cash liquidity of BBX Capital Parent Company at June 30, 2019, excluding lines of credit. (5) Adjusted EBITDA and fully diluted book value per share are not comparable metrics prior to the BFC Financial and BBX Capital Merger (6) Amounts were adjusted for the adoption of the revenue recognition standard and certain other items to maintain comparability with the 2018 presentation. (7) For the year ended December 31, 2018. 10BBX Capital Solid Financial Foundation (7) (7) (7) (6)(7) (6)(7) (7) 2013 2014 2015 2016 2017 2018 ($ in thousands) Total Revenues $ 563,991 676,966 744,257 822,153 869,570 947,593 (1) (2) (5) Adjusted EBITDA $ N/A N/A N/A 103,721 122,853 109,150 Fully Diluted Book $ 2.77 2.84 4.21 4.32 5.63 5.70 (3) (5) Value Per Share (4) Over $125M in cash liquidity on our Balance Sheet (1) Adjusted EBITDA is a non-GAAP financial measure. See appendix for a reconciliation of BBX Capital’s net income to Adjusted EBITDA. (2) BBX Capital’s assets do not generate net income or Adjusted EBITDA on a regular or predictable basis. Our objective is long-term growth as measured by increases in book value and intrinsic value over time. (3) The numerator of fully diluted book value per share for all periods is shareholders’ equity. The denominator of fully diluted book value per share for all periods was computed by adding the number of Class A and Class B shares outstanding at year end and the number of non-vested restricted stock awards and exercisable stock options. (4) Cash liquidity of BBX Capital Parent Company at June 30, 2019, excluding lines of credit. (5) Adjusted EBITDA and fully diluted book value per share are not comparable metrics prior to the BFC Financial and BBX Capital Merger (6) Amounts were adjusted for the adoption of the revenue recognition standard and certain other items to maintain comparability with the 2018 presentation. (7) For the year ended December 31, 2018. 10

BBX Capital Solid Financial Foundation % Increase (4) (5) (5) Q2 2018 Q2 2019 2017 2018 (Decrease) ($ in thousands) Total Revenues $ 243,226 251,333 3.3% 869,570 947,593 (1) (2) Adjusted EBITDA $ 25,433 33,072 30.0% 122,853 109,150 Fully Diluted Book $ 5.54 5.51 (0.5%) Value Per Share (3) (1) Adjusted EBITDA is a non-GAAP financial measure. See appendix for a reconciliation of BBX Capital’s net income to Adjusted EBITDA. (2) BBX Capital’s assets do not generate net income or Adjusted EBITDA on a regular or predictable basis. Our objective is long-term growth as measured by increases in book value and intrinsic value over time. (3) The numerator of fully diluted book value per share for all periods is shareholders’ equity. The denominator of fully diluted book value per share for all periods was computed by adding the number of Class A and Class B shares outstanding at year end and the number of non-vested restricted stock awards and exercisable stock options. (4) Amounts were adjusted for the adoption of the revenue recognition standard and certain other items to maintain comparability with the 2018 presentation. (5) For the 12 months ended December 31, 2017 and 2018, respectively. 11BBX Capital Solid Financial Foundation % Increase (4) (5) (5) Q2 2018 Q2 2019 2017 2018 (Decrease) ($ in thousands) Total Revenues $ 243,226 251,333 3.3% 869,570 947,593 (1) (2) Adjusted EBITDA $ 25,433 33,072 30.0% 122,853 109,150 Fully Diluted Book $ 5.54 5.51 (0.5%) Value Per Share (3) (1) Adjusted EBITDA is a non-GAAP financial measure. See appendix for a reconciliation of BBX Capital’s net income to Adjusted EBITDA. (2) BBX Capital’s assets do not generate net income or Adjusted EBITDA on a regular or predictable basis. Our objective is long-term growth as measured by increases in book value and intrinsic value over time. (3) The numerator of fully diluted book value per share for all periods is shareholders’ equity. The denominator of fully diluted book value per share for all periods was computed by adding the number of Class A and Class B shares outstanding at year end and the number of non-vested restricted stock awards and exercisable stock options. (4) Amounts were adjusted for the adoption of the revenue recognition standard and certain other items to maintain comparability with the 2018 presentation. (5) For the 12 months ended December 31, 2017 and 2018, respectively. 11

BBX Capital Stock Performance 2500% $10.17 * 2000% $7.97 $5.92 $5.73 1500% $4.91 $4.88 1000% $3.39 $3.15 $2.89 500% $1.26 $0.35 0% 12/31/2011 12/31/2012 12/31/2013 12/30/2014 12/31/2015 12/31/2016 12/31/2017 5/2/2018 12/31/2018 3/31/2019 6/30/2019 BBX Capital Class A Common Stock S&P 500 Historical results may not be indicative of future results. • On December 15, 2016, the Company, formerly BFC Financial Corporation, consummated its acquisition of BBX Capital Florida, LLC (formerly BBX Capital Corporation). Prior to such acquisition, the Company held an approximate 82% equity interest and 90% voting interest in the former BBX Capital Corporation. During January 2017, BFC Financial Corporation changed its name to BBX Capital Corporation. • The Company’s Class A Common Stock commenced trading on the NYSE on July 13, 2017. The Company’s Class A Common Stock previously traded on the OTCQX. • Note: Sale of BankAtlantic was closed on July 31, 2012. • Our stock price since 2011 (the announcement of the sale of BankAtlantic) through June 30, 2019, is up 1,302.86% * Intra-day 52 week high 12BBX Capital Stock Performance 2500% $10.17 * 2000% $7.97 $5.92 $5.73 1500% $4.91 $4.88 1000% $3.39 $3.15 $2.89 500% $1.26 $0.35 0% 12/31/2011 12/31/2012 12/31/2013 12/30/2014 12/31/2015 12/31/2016 12/31/2017 5/2/2018 12/31/2018 3/31/2019 6/30/2019 BBX Capital Class A Common Stock S&P 500 Historical results may not be indicative of future results. • On December 15, 2016, the Company, formerly BFC Financial Corporation, consummated its acquisition of BBX Capital Florida, LLC (formerly BBX Capital Corporation). Prior to such acquisition, the Company held an approximate 82% equity interest and 90% voting interest in the former BBX Capital Corporation. During January 2017, BFC Financial Corporation changed its name to BBX Capital Corporation. • The Company’s Class A Common Stock commenced trading on the NYSE on July 13, 2017. The Company’s Class A Common Stock previously traded on the OTCQX. • Note: Sale of BankAtlantic was closed on July 31, 2012. • Our stock price since 2011 (the announcement of the sale of BankAtlantic) through June 30, 2019, is up 1,302.86% * Intra-day 52 week high 12
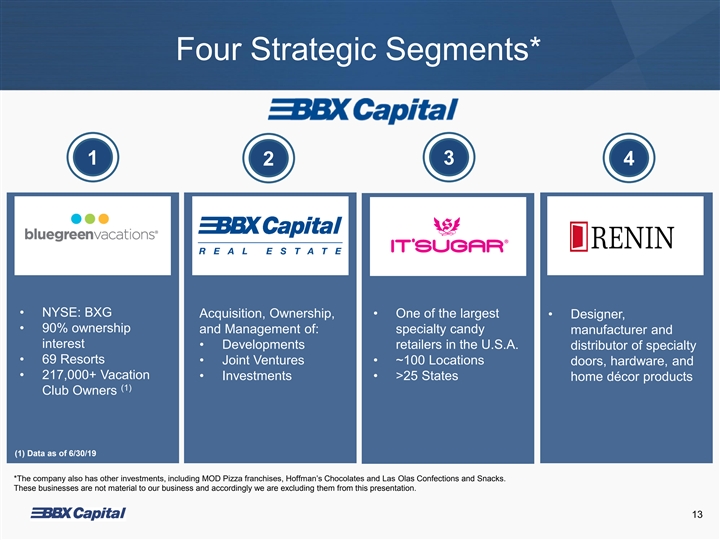
Four Strategic Segments* 1 3 4 2 • NYSE: BXG Acquisition, Ownership, • One of the largest • Designer, • 90% ownership and Management of: specialty candy manufacturer and interest • Developments retailers in the U.S.A. distributor of specialty • 69 Resorts • Joint Ventures • ~100 Locations doors, hardware, and • 217,000+ Vacation • Investments • >25 States home décor products (1) Club Owners (1) Data as of 6/30/19 *The company also has other investments, including MOD Pizza franchises, Hoffman’s Chocolates and Las Olas Confections and Snacks. These businesses are not material to our business and accordingly we are excluding them from this presentation. 13Four Strategic Segments* 1 3 4 2 • NYSE: BXG Acquisition, Ownership, • One of the largest • Designer, • 90% ownership and Management of: specialty candy manufacturer and interest • Developments retailers in the U.S.A. distributor of specialty • 69 Resorts • Joint Ventures • ~100 Locations doors, hardware, and • 217,000+ Vacation • Investments • >25 States home décor products (1) Club Owners (1) Data as of 6/30/19 *The company also has other investments, including MOD Pizza franchises, Hoffman’s Chocolates and Las Olas Confections and Snacks. These businesses are not material to our business and accordingly we are excluding them from this presentation. 13
Four Strategic Segments* 1 3 4 2 • NYSE: BXG Acquisition, Ownership, • One of the largest • Designer, • 90% ownership and Management of: specialty candy manufacturer and interest • Developments retailers in the U.S.A. distributor of specialty • 69 Resorts • Joint Ventures • ~100 Locations doors, hardware, and • 217,000+ Vacation • Investments • >25 States home décor products (1) Club Owners (1) Data as of 6/30/19 *The company also has other investments, including MOD Pizza franchises, Hoffman’s Chocolates and Las Olas Confections and Snacks. These businesses are not material to our business and accordingly we are excluding them from this presentation. 14Four Strategic Segments* 1 3 4 2 • NYSE: BXG Acquisition, Ownership, • One of the largest • Designer, • 90% ownership and Management of: specialty candy manufacturer and interest • Developments retailers in the U.S.A. distributor of specialty • 69 Resorts • Joint Ventures • ~100 Locations doors, hardware, and • 217,000+ Vacation • Investments • >25 States home décor products (1) Club Owners (1) Data as of 6/30/19 *The company also has other investments, including MOD Pizza franchises, Hoffman’s Chocolates and Las Olas Confections and Snacks. These businesses are not material to our business and accordingly we are excluding them from this presentation. 14

BLUEGREEN VACATIONS OVERVIEW 1994 Entered Vacation Ownership Industry (1) 69 Resorts 45 Club Resorts 24 Club Associate Resorts (1) ~217,000 Vacation Club Owners (2) ~236,000 Tours Annually (2) 69% Capital-Light Revenue (2) 47% Sales to New Customers (2) $740 million Revenue (2) (3) $122 million Solara Surfside | Miami Beach, Florida Adjusted EBITDA (1) Data as of 6/30/19. (2) LTM period ended 6/30/19. (3) See appendix for a reconciliation of Adjusted EBITDA to Net Income of $44.2 million for the LTM ended 6/30/19. 15BLUEGREEN VACATIONS OVERVIEW 1994 Entered Vacation Ownership Industry (1) 69 Resorts 45 Club Resorts 24 Club Associate Resorts (1) ~217,000 Vacation Club Owners (2) ~236,000 Tours Annually (2) 69% Capital-Light Revenue (2) 47% Sales to New Customers (2) $740 million Revenue (2) (3) $122 million Solara Surfside | Miami Beach, Florida Adjusted EBITDA (1) Data as of 6/30/19. (2) LTM period ended 6/30/19. (3) See appendix for a reconciliation of Adjusted EBITDA to Net Income of $44.2 million for the LTM ended 6/30/19. 15
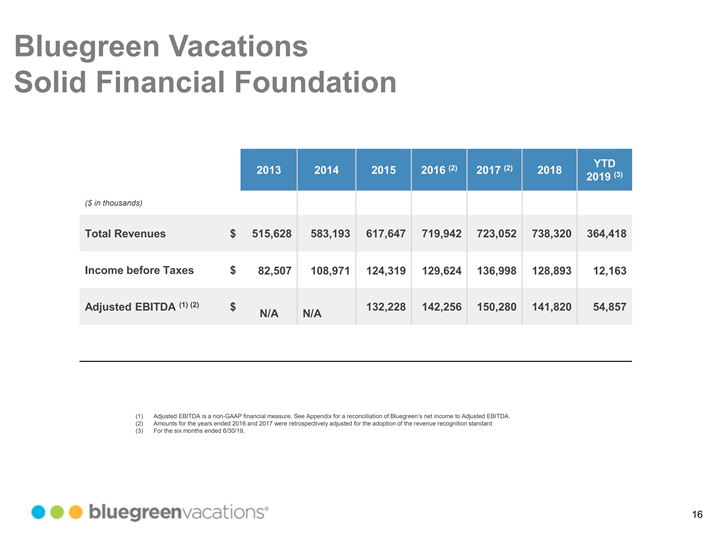
Bluegreen Vacations Solid Financial Foundation YTD (2) (2) 2013 2014 2015 2016 2017 2018 (3) 2019 ($ in thousands) Total Revenues $ 515,628 583,193 617,647 719,942 723,052 738,320 364,418 Income before Taxes $ 82,507 108,971 124,319 129,624 136,998 128,893 12,163 (1) (2) Adjusted EBITDA $ 132,228 142,256 150,280 141,820 54,857 N/A N/A (1) Adjusted EBITDA is a non-GAAP financial measure. See Appendix for a reconciliation of Bluegreen’s net income to Adjusted EBITDA. (2) Amounts for the years ended 2016 and 2017 were retrospectively adjusted for the adoption of the revenue recognition standard (3) For the six months ended 6/30/19, 16Bluegreen Vacations Solid Financial Foundation YTD (2) (2) 2013 2014 2015 2016 2017 2018 (3) 2019 ($ in thousands) Total Revenues $ 515,628 583,193 617,647 719,942 723,052 738,320 364,418 Income before Taxes $ 82,507 108,971 124,319 129,624 136,998 128,893 12,163 (1) (2) Adjusted EBITDA $ 132,228 142,256 150,280 141,820 54,857 N/A N/A (1) Adjusted EBITDA is a non-GAAP financial measure. See Appendix for a reconciliation of Bluegreen’s net income to Adjusted EBITDA. (2) Amounts for the years ended 2016 and 2017 were retrospectively adjusted for the adoption of the revenue recognition standard (3) For the six months ended 6/30/19, 16
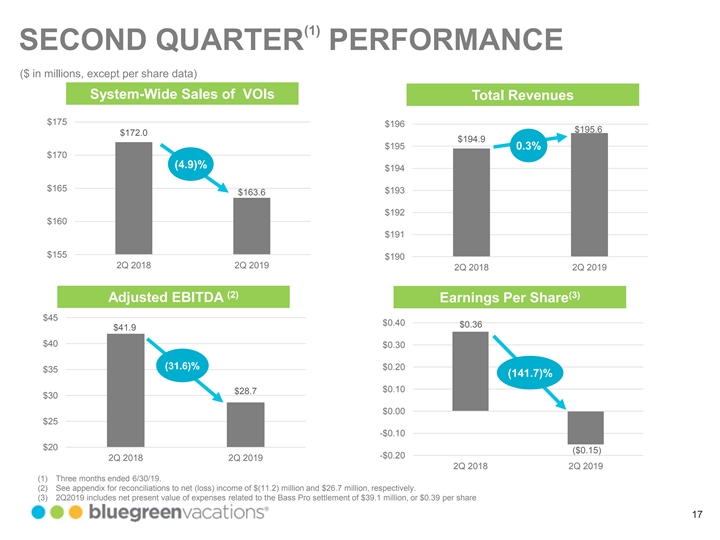
(1) SECOND QUARTER PERFORMANCE ($ in millions, except per share data) System-Wide Sales of VOIs Total Revenues $175 $196 $195.6 $172.0 $194.9 $195 0.3% $170 (4.9)% $194 $165 $193 $163.6 $192 $160 $191 $155 $190 2Q 2018 2Q 2019 2Q 2018 2Q 2019 (2) (3) Adjusted EBITDA Earnings Per Share $45 $0.40 $0.36 $41.9 $40 $0.30 (31.6)% $0.20 $35 (141.7)% $0.10 $28.7 $30 $0.00 $25 -$0.10 $20 ($0.15) -$0.20 2Q 2018 2Q 2019 2Q 2018 2Q 2019 (1) Three months ended 6/30/19. (2) See appendix for reconciliations to net (loss) income of $(11.2) million and $26.7 million, respectively. (3) 2Q2019 includes net present value of expenses related to the Bass Pro settlement of $39.1 million, or $0.39 per share 17(1) SECOND QUARTER PERFORMANCE ($ in millions, except per share data) System-Wide Sales of VOIs Total Revenues $175 $196 $195.6 $172.0 $194.9 $195 0.3% $170 (4.9)% $194 $165 $193 $163.6 $192 $160 $191 $155 $190 2Q 2018 2Q 2019 2Q 2018 2Q 2019 (2) (3) Adjusted EBITDA Earnings Per Share $45 $0.40 $0.36 $41.9 $40 $0.30 (31.6)% $0.20 $35 (141.7)% $0.10 $28.7 $30 $0.00 $25 -$0.10 $20 ($0.15) -$0.20 2Q 2018 2Q 2019 2Q 2018 2Q 2019 (1) Three months ended 6/30/19. (2) See appendix for reconciliations to net (loss) income of $(11.2) million and $26.7 million, respectively. (3) 2Q2019 includes net present value of expenses related to the Bass Pro settlement of $39.1 million, or $0.39 per share 17

YEAR TO DATE PERFORMANCE ($ in millions, except per share data) System-Wide Sales of VOIs Total Revenues $310 $370 $304.8 $305 $300 $364.4 (3.8)% $293.3 $365 $295 $362.5 0.5% $290 $285 $360 $280 $275 $355 $270 $265 $260 $350 YTD 2018 YTD 2019 YTD 2018 YTD 2019 (3) (4) Adjusted EBITDA Earnings Per Share $80 $0.70 $75.2 $0.64 $75 $0.60 $70 $0.50 $65 (27.0)% $60 $0.40 $54.9 (92.2)% $55 $0.30 $50 $45 $0.20 $40 $0.10 $35 $0.05 $30 $0.00 YTD 2018 YTD 2019 YTD 2018 YTD 2019 (1) Six months ended 6/30/18. (2) Six months ended 6/30/19. (3) See appendix for reconciliations to net income of $4.0 million and $47.7 million, respectively. (4) 2Q2019 includes net present value of expenses related to the Bass Pro settlement of $39.1 million, or $0.39 per share 18YEAR TO DATE PERFORMANCE ($ in millions, except per share data) System-Wide Sales of VOIs Total Revenues $310 $370 $304.8 $305 $300 $364.4 (3.8)% $293.3 $365 $295 $362.5 0.5% $290 $285 $360 $280 $275 $355 $270 $265 $260 $350 YTD 2018 YTD 2019 YTD 2018 YTD 2019 (3) (4) Adjusted EBITDA Earnings Per Share $80 $0.70 $75.2 $0.64 $75 $0.60 $70 $0.50 $65 (27.0)% $60 $0.40 $54.9 (92.2)% $55 $0.30 $50 $45 $0.20 $40 $0.10 $35 $0.05 $30 $0.00 YTD 2018 YTD 2019 YTD 2018 YTD 2019 (1) Six months ended 6/30/18. (2) Six months ended 6/30/19. (3) See appendix for reconciliations to net income of $4.0 million and $47.7 million, respectively. (4) 2Q2019 includes net present value of expenses related to the Bass Pro settlement of $39.1 million, or $0.39 per share 18

Vacation Ownership Public Peer Group Vacation Ownership Public Peer Group (1) (2) ($ in millions) Vacation Ownership Interest Sales in 2018 $2,271 (3) $1,487 $1,410 $624 (1) System-wide (Contract) sales for the year ended December 31, 2018. (2) From publicly available information. (3) Including Legacy-ILG as if acquired December 31, 2017. 19Vacation Ownership Public Peer Group Vacation Ownership Public Peer Group (1) (2) ($ in millions) Vacation Ownership Interest Sales in 2018 $2,271 (3) $1,487 $1,410 $624 (1) System-wide (Contract) sales for the year ended December 31, 2018. (2) From publicly available information. (3) Including Legacy-ILG as if acquired December 31, 2017. 19

Potential Competitive Advantages Differentiated Target Significant Fee-Based Multiple Marketing Demographic VOI Sales Channels Leveraging New Owners Strong Net Balanced Approach Industry Owner Growth to Growth Innovator 20Potential Competitive Advantages Differentiated Target Significant Fee-Based Multiple Marketing Demographic VOI Sales Channels Leveraging New Owners Strong Net Balanced Approach Industry Owner Growth to Growth Innovator 20

A Leading Operator of “Drive-To” Vacation Ownership Resorts 89% of owners live within a 4-hour drive to a Bluegreen resort Geographically diverse owner base Opportunities for growth in the western US Information as of 12/31/2018 21A Leading Operator of “Drive-To” Vacation Ownership Resorts 89% of owners live within a 4-hour drive to a Bluegreen resort Geographically diverse owner base Opportunities for growth in the western US Information as of 12/31/2018 21
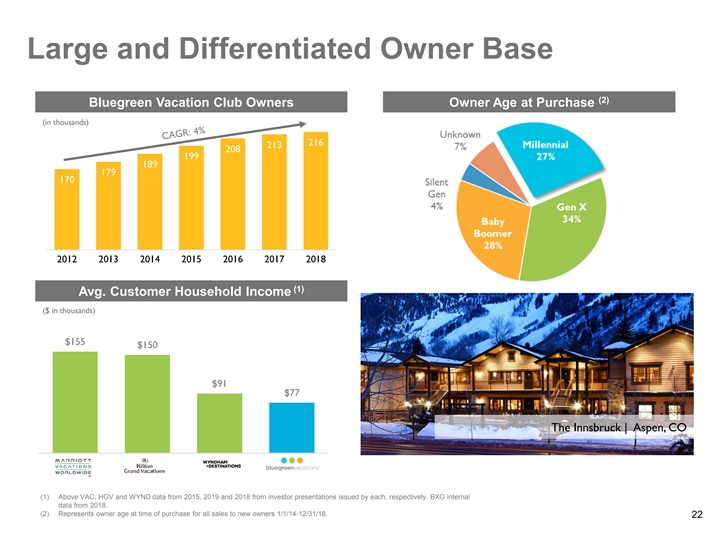
Large and Differentiated Owner Base (2) Bluegreen Vacation Club Owners Owner Age at Purchase (in thousands) 216 213 Millennial 208 199 27% 7% 189 179 170 4% Gen X 33% Baby Boomer 29% 2012 2013 2014 2015 2016 2017 2018 (1) Avg. Customer Household Income ($ in thousands) $155 $150 $91 $77 The Innsbruck | Aspen, CO VAC HGV WND (1) Above VAC, HGV and WYND data from 2015, 2019 and 2018 from investor presentations issued by each, respectively. BXG internal data from 2018. (2) Represents owner age at time of purchase for all sales to new owners 1/1/14-12/31/18. 22Large and Differentiated Owner Base (2) Bluegreen Vacation Club Owners Owner Age at Purchase (in thousands) 216 213 Millennial 208 199 27% 7% 189 179 170 4% Gen X 33% Baby Boomer 29% 2012 2013 2014 2015 2016 2017 2018 (1) Avg. Customer Household Income ($ in thousands) $155 $150 $91 $77 The Innsbruck | Aspen, CO VAC HGV WND (1) Above VAC, HGV and WYND data from 2015, 2019 and 2018 from investor presentations issued by each, respectively. BXG internal data from 2018. (2) Represents owner age at time of purchase for all sales to new owners 1/1/14-12/31/18. 22

Bluegreen Vacation Club The Basics T Th he e Pr Pro od du uct ct Points Placed in Vacation Annually, in perpetuity Owner’s Points Account $13,727 (1) Average Transaction Size : $15,818 Deeded Deed Placed interest in a Simultaneous with VOI sale in Vacation Bluegreen Club Trust resort 23 (1) LTM as of 6/30/19 Legal Structure Owner’s FocusBluegreen Vacation Club The Basics T Th he e Pr Pro od du uct ct Points Placed in Vacation Annually, in perpetuity Owner’s Points Account $13,727 (1) Average Transaction Size : $15,818 Deeded Deed Placed interest in a Simultaneous with VOI sale in Vacation Bluegreen Club Trust resort 23 (1) LTM as of 6/30/19 Legal Structure Owner’s Focus
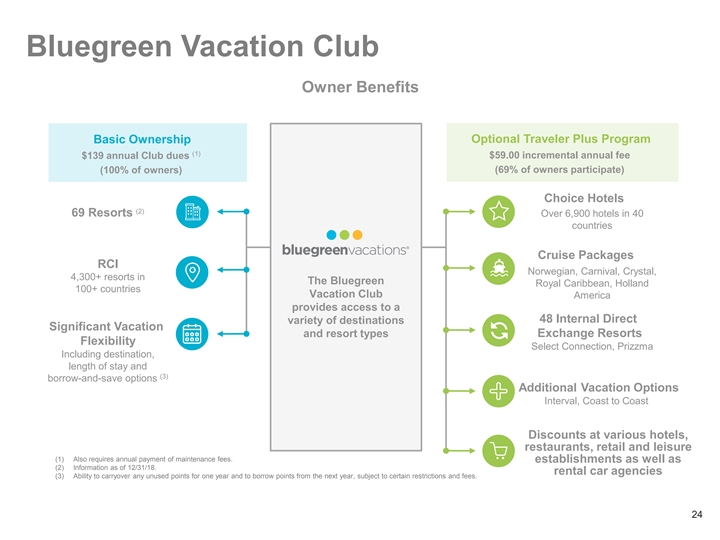
Bluegreen Vacation Club Owner Benefits Basic Ownership Optional Traveler Plus Program (1) $139 annual Club dues $59.00 incremental annual fee (100% of owners) (69% of owners participate) Choice Hotels (2) 69 Resorts Over 6,900 hotels in 40 countries Cruise Packages RCI Norwegian, Carnival, Crystal, 4,300+ resorts in The Bluegreen Royal Caribbean, Holland 100+ countries Vacation Club America provides access to a 48 Internal Direct variety of destinations Significant Vacation and resort types Exchange Resorts Flexibility Select Connection, Prizzma Including destination, length of stay and (3) borrow-and-save options Additional Vacation Options Interval, Coast to Coast Discounts at various hotels, restaurants, retail and leisure (1) Also requires annual payment of maintenance fees. establishments as well as (2) Information as of 12/31/18. rental car agencies (3) Ability to carryover any unused points for one year and to borrow points from the next year, subject to certain restrictions and fees. 24Bluegreen Vacation Club Owner Benefits Basic Ownership Optional Traveler Plus Program (1) $139 annual Club dues $59.00 incremental annual fee (100% of owners) (69% of owners participate) Choice Hotels (2) 69 Resorts Over 6,900 hotels in 40 countries Cruise Packages RCI Norwegian, Carnival, Crystal, 4,300+ resorts in The Bluegreen Royal Caribbean, Holland 100+ countries Vacation Club America provides access to a 48 Internal Direct variety of destinations Significant Vacation and resort types Exchange Resorts Flexibility Select Connection, Prizzma Including destination, length of stay and (3) borrow-and-save options Additional Vacation Options Interval, Coast to Coast Discounts at various hotels, restaurants, retail and leisure (1) Also requires annual payment of maintenance fees. establishments as well as (2) Information as of 12/31/18. rental car agencies (3) Ability to carryover any unused points for one year and to borrow points from the next year, subject to certain restrictions and fees. 24

Vacation Package Marketing Process 1 2 3 4 5 Package Sales Activation Reservation, Activation Preview Centers VOI Sales (1) Vacation Packages Campaign & Confirmation >130,000 Previews Over $305 million (1) >227,000 Management >830,000 Inbound during 2018 (1) >8 million Emails Calls and >550,000 (1) Outbound calls (1) During 2018. 25Vacation Package Marketing Process 1 2 3 4 5 Package Sales Activation Reservation, Activation Preview Centers VOI Sales (1) Vacation Packages Campaign & Confirmation >130,000 Previews Over $305 million (1) >227,000 Management >830,000 Inbound during 2018 (1) >8 million Emails Calls and >550,000 (1) Outbound calls (1) During 2018. 25

Sales & Marketing Driven Business Vacation Packages & Leads Marketing Mix by % 227,000+ (1) Tanger Outlets | Premium Outlets | Simon Malls of Sales Vacation Packages Sold (1) Annually ~238,000 Tours Other New Other New Annual Tours Customers Customer (New Customer & 29% 28% (1) Existing Owners) Existing Owners 52% Choice In-House Tours Bass Sales 7% $624 Million Pro (1) 14% System-Wide VOI Sales New Customer Sales ~216,000 Owners (2) Existing Owner Sales Vacation Club Owners (1) Year ended 12/31/18. (2) As of 12/31/18. 26Sales & Marketing Driven Business Vacation Packages & Leads Marketing Mix by % 227,000+ (1) Tanger Outlets | Premium Outlets | Simon Malls of Sales Vacation Packages Sold (1) Annually ~238,000 Tours Other New Other New Annual Tours Customers Customer (New Customer & 29% 28% (1) Existing Owners) Existing Owners 52% Choice In-House Tours Bass Sales 7% $624 Million Pro (1) 14% System-Wide VOI Sales New Customer Sales ~216,000 Owners (2) Existing Owner Sales Vacation Club Owners (1) Year ended 12/31/18. (2) As of 12/31/18. 26

Strategic Relationships Bluegreen has multiple channels intended to drive sales within our core demographic • Extended strategic alliance • One-way, exclusive in-store Bass • Active in 21 outlet malls in through 2032 Pro marketing relationship proximity to Bluegreen (1) resorts • Expanded opportunities in • Operate kiosks in 67 Bass Pro Choice marketing relationship stores • Sell vacation packages to entice prospective owners • Currently 37 Bluegreen • Once fully rolled out, expect to to tour Bluegreen preview Vacations resorts are included have a presence in at least 60 centers in Choice’s upscale Ascend Cabela’s stores Hotel Collection portfolio of unique, boutique and historic • Virtual reality pilot program in independent hotels and Bass Pro stores in Memphis, TN resorts. and Springfield, MO 27 (1) See the Earnings Release dated August 6, 2019 for a discussion regarding the terms of our amended agreement with Bass Pro.Strategic Relationships Bluegreen has multiple channels intended to drive sales within our core demographic • Extended strategic alliance • One-way, exclusive in-store Bass • Active in 21 outlet malls in through 2032 Pro marketing relationship proximity to Bluegreen (1) resorts • Expanded opportunities in • Operate kiosks in 67 Bass Pro Choice marketing relationship stores • Sell vacation packages to entice prospective owners • Currently 37 Bluegreen • Once fully rolled out, expect to to tour Bluegreen preview Vacations resorts are included have a presence in at least 60 centers in Choice’s upscale Ascend Cabela’s stores Hotel Collection portfolio of unique, boutique and historic • Virtual reality pilot program in independent hotels and Bass Pro stores in Memphis, TN resorts. and Springfield, MO 27 (1) See the Earnings Release dated August 6, 2019 for a discussion regarding the terms of our amended agreement with Bass Pro.

Extensive Reach of Vacation Package Sales (1) Locations Through Various Channels (1) Location data as of 6/30/19. (2) Owner data as of 12/31/18. 28Extensive Reach of Vacation Package Sales (1) Locations Through Various Channels (1) Location data as of 6/30/19. (2) Owner data as of 12/31/18. 28
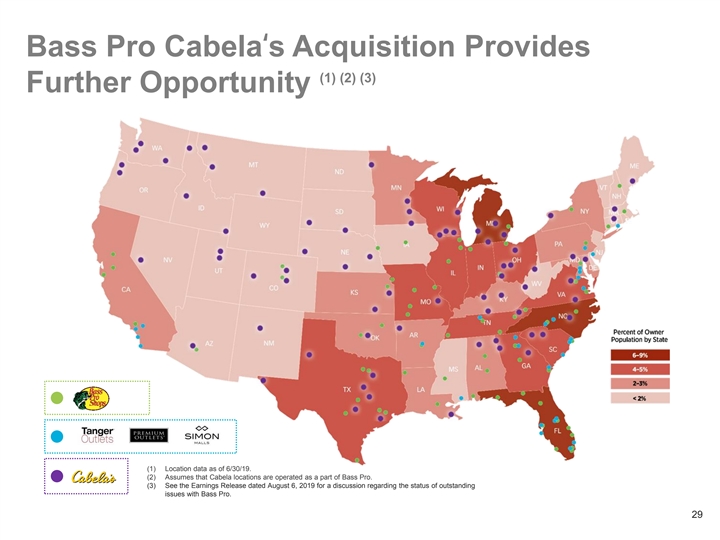
Bass Pro Cabela‘s Acquisition Provides (1) (2) (3) Further Opportunity (1) Location data as of 6/30/19. (2) Assumes that Cabela locations are operated as a part of Bass Pro. (3) See the Earnings Release dated August 6, 2019 for a discussion regarding the status of outstanding issues with Bass Pro. 29Bass Pro Cabela‘s Acquisition Provides (1) (2) (3) Further Opportunity (1) Location data as of 6/30/19. (2) Assumes that Cabela locations are operated as a part of Bass Pro. (3) See the Earnings Release dated August 6, 2019 for a discussion regarding the status of outstanding issues with Bass Pro. 29

Four Strategic Segments* 1 3 4 2 • NYSE: BXG Acquisition, Acquisition, Ow Ownership, nership, • One of the largest • Designer, • 90% ownership and and M Manageme anagement nt of: of: specialty candy manufacturer and interest • • Dev Developments elopments retailers in the U.S.A. distributor of specialty • 69 Resorts • • Joint Joint V Ventures entures • ~100 Locations doors, hardware, and • 217,000+ Vacation • • Inv Investments estments • >25 States home décor products (1) Club Owners (1) Data as of 6/30/19 *The company also has other investments, including MOD Pizza franchises, Hoffman’s Chocolates and Las Olas Confections and Snacks. These businesses are not material to our business and accordingly we are excluding them from this presentation. 30Four Strategic Segments* 1 3 4 2 • NYSE: BXG Acquisition, Acquisition, Ow Ownership, nership, • One of the largest • Designer, • 90% ownership and and M Manageme anagement nt of: of: specialty candy manufacturer and interest • • Dev Developments elopments retailers in the U.S.A. distributor of specialty • 69 Resorts • • Joint Joint V Ventures entures • ~100 Locations doors, hardware, and • 217,000+ Vacation • • Inv Investments estments • >25 States home décor products (1) Club Owners (1) Data as of 6/30/19 *The company also has other investments, including MOD Pizza franchises, Hoffman’s Chocolates and Las Olas Confections and Snacks. These businesses are not material to our business and accordingly we are excluding them from this presentation. 30
BBX Capital Real Estate Acquisition, ownership and management of joint ventures and investments in real estate and real estate development projects. 31BBX Capital Real Estate Acquisition, ownership and management of joint ventures and investments in real estate and real estate development projects. 31

BBX Capital Real Estate The following describes current investments and joint ventures in real estate development projects. See appendix for additional details. 32BBX Capital Real Estate The following describes current investments and joint ventures in real estate development projects. See appendix for additional details. 32

Beacon Lake BBX Master Planned Development Beacon Lake Master Planned Development Developed and owned 100% by BBX Jacksonville, Florida • Approximately 632 acres • Master Planned 1,476 Lots • 1,280 single family lots • 196 townhome lots • Development is staged in phases 33Beacon Lake BBX Master Planned Development Beacon Lake Master Planned Development Developed and owned 100% by BBX Jacksonville, Florida • Approximately 632 acres • Master Planned 1,476 Lots • 1,280 single family lots • 196 townhome lots • Development is staged in phases 33

Beacon Lake BBX Master Planned Development Beacon Lake – Phase I Master Planned Development Developed and owned 100% by BBX Jacksonville, Florida • 302 Lots • 151 Lots sold to Dream Finders Homes • 151 Lots sold to Mattamy Homes • 302 Lots taken down as of 6/30/19 • 216 Homes sold by homebuilders as of 6/30/19 • Land development for Phase I is substantially complete • Entry feature is substantially complete • 8,200 SF Amenity Center is completed • Phase II construction has commenced. • Toll Brothers has contracted for 103 Lots in Phase II • Dream Finders Homes has contracted for 196 Townhome Lots in Phase II 34Beacon Lake BBX Master Planned Development Beacon Lake – Phase I Master Planned Development Developed and owned 100% by BBX Jacksonville, Florida • 302 Lots • 151 Lots sold to Dream Finders Homes • 151 Lots sold to Mattamy Homes • 302 Lots taken down as of 6/30/19 • 216 Homes sold by homebuilders as of 6/30/19 • Land development for Phase I is substantially complete • Entry feature is substantially complete • 8,200 SF Amenity Center is completed • Phase II construction has commenced. • Toll Brothers has contracted for 103 Lots in Phase II • Dream Finders Homes has contracted for 196 Townhome Lots in Phase II 34

Beacon Lake BBX Master Planned Development 35Beacon Lake BBX Master Planned Development 35

Beacon Lake BBX Master Planned Development 36Beacon Lake BBX Master Planned Development 36
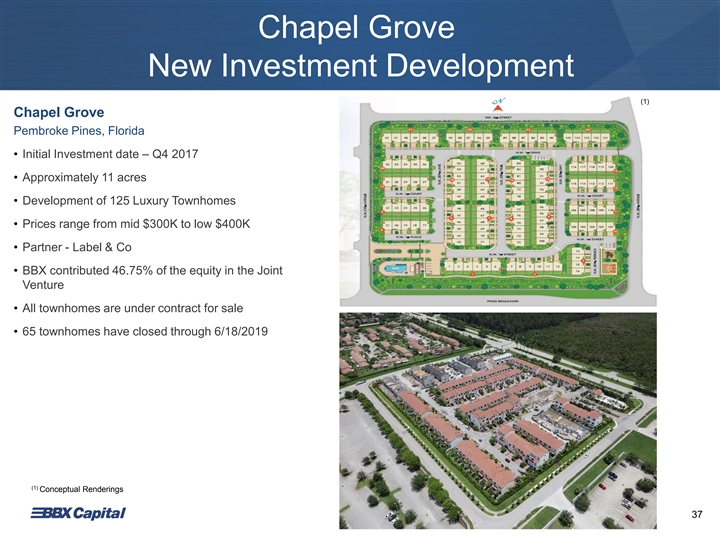
Chapel Grove New Investment Development (1) Chapel Grove Pembroke Pines, Florida • Initial Investment date – Q4 2017 • Approximately 11 acres • Development of 125 Luxury Townhomes • Prices range from mid $300K to low $400K • Partner - Label & Co • BBX contributed 46.75% of the equity in the Joint Venture • All townhomes are under contract for sale • 65 townhomes have closed through 6/18/2019 (1) Conceptual Renderings 37Chapel Grove New Investment Development (1) Chapel Grove Pembroke Pines, Florida • Initial Investment date – Q4 2017 • Approximately 11 acres • Development of 125 Luxury Townhomes • Prices range from mid $300K to low $400K • Partner - Label & Co • BBX contributed 46.75% of the equity in the Joint Venture • All townhomes are under contract for sale • 65 townhomes have closed through 6/18/2019 (1) Conceptual Renderings 37

Other Investment Activities (1) CC Homes Miramar Miramar, Florida • Developing 193 Single Family Homes • Initial Investment Date – Q2 2015 • Status – Predevelopment • Partner – Codina-Carr Company • BBX contributed 70% of predevelopment costs into Joint Venture (1) Conceptual Renderings 38Other Investment Activities (1) CC Homes Miramar Miramar, Florida • Developing 193 Single Family Homes • Initial Investment Date – Q2 2015 • Status – Predevelopment • Partner – Codina-Carr Company • BBX contributed 70% of predevelopment costs into Joint Venture (1) Conceptual Renderings 38

Other Investment Activities • Initial Investment Date – Q2 2019 • Developing 204 Single Family Homes Sky Cove at Westlake • Status – Pre-Development • Part of the Master Planned Community at Westlake Westlake, Florida • Partner – Label & Co • Homes will range in size from 1,446 SF to 2,205 SF • BBX contributed 26.25% of the equity in the Joint Venture NEW INVESTMENT 39Other Investment Activities • Initial Investment Date – Q2 2019 • Developing 204 Single Family Homes Sky Cove at Westlake • Status – Pre-Development • Part of the Master Planned Community at Westlake Westlake, Florida • Partner – Label & Co • Homes will range in size from 1,446 SF to 2,205 SF • BBX contributed 26.25% of the equity in the Joint Venture NEW INVESTMENT 39

Listing of Completed Real Estate Investments (6) and Results Since 2012 ($ In millions) Project Year of Investment Year of Cumulative (1) (2) (8) Asset Name Description Investment Amount Sale Net Cash IRR (3) Inflows Bonterra Land Sale 50 Acre Land Sale to Lennar 2013 $18.7 2015 $30.9 27% (5) Flagler Land Joint Venture Land Entitlement 2013 $ 0.9 2015 $ 6.8 324% Flagler Land Sale Land Entitlement 2013 $ 3.2 2015 $10.9 67% Gardens on Millenia – Costco and Outparcel Land Development 2013 $ 9.1 2015 $10.0 3% PGA Pod B 14,000 SF 2013 $ 4.8 2019 $13.8 23% (4) Village of Victoria Park Construct 30 Single-Family Homes 2013 $ 1.1 2018 $ 2.9 22% Altis at Lakeline Develop 354 Multifamily Units 2014 $ 5.5 2019 $ 9.3 14% (4) Bonterra CC Homes Develop 394 Single-Family Homes 2014 $ 7.4 2017 $26.1 62% PGA Pods A&C 18 Acres 2014 $11.5 2019 $15.0 8% (4)(7) The Addison on Millenia Develop 292 Multifamily Units 2015 $ 6.2 2018 $15.7 38% (4) Gardens on Millenia - JV Retail Develop Retail 2015 $ 6.3 2018 $ 8.7 16% (4)(7) Altis at Shingle Creek Develop 356 Multifamily Units 2016 $ 0.3 2018 $ 3.7 153% Historical results may not be indicative of future results (1) For assets held in joint ventures, Investment Amount represents the fair value of property contributed to the venture on the contribution date and cash invested in the venture. For other assets owned by BBX Capital, Investment Amount represents the fair value of the property upon foreclosure (excluding PGA Pods A&C, which reflects the carrying amount of the associated loan upon foreclosure) and subsequent cash invested in the asset. (2) Year of sale for single-family home projects represents the year in which the last home was sold. (3) Cumulative Net Cash Inflows represent cash inflows received through the project's completion date. (4) These assets represent investments in real estate joint ventures that are not consolidated into BBX Capital's financial statements. (5) Asset was held in a joint venture that was consolidated into BBX Capital's financial statements. Investment Amount and Cumulative Net Cash Inflows are presented net of amounts attributed to noncontrolling interests. (6) This table does not include certain operating real estate assets that were acquired through foreclosure, including two student housing projects that were sold at a loss and a self-storage facility. It lists completed projects through 6/30/19 and does not include projects sold or completed subsequent to 6/30/19. (7) These properties were sold during Q4 2018. (8) IRR represents the return to BBX on its investment and was determined based upon the actual timing of cash outflows paid/property contributed by BBX and cash inflows and notes received by BBX throughout the life of the project. Historical returns achieved by any prior investment are not a prediction of future performance or a guaranty of future results. 40Listing of Completed Real Estate Investments (6) and Results Since 2012 ($ In millions) Project Year of Investment Year of Cumulative (1) (2) (8) Asset Name Description Investment Amount Sale Net Cash IRR (3) Inflows Bonterra Land Sale 50 Acre Land Sale to Lennar 2013 $18.7 2015 $30.9 27% (5) Flagler Land Joint Venture Land Entitlement 2013 $ 0.9 2015 $ 6.8 324% Flagler Land Sale Land Entitlement 2013 $ 3.2 2015 $10.9 67% Gardens on Millenia – Costco and Outparcel Land Development 2013 $ 9.1 2015 $10.0 3% PGA Pod B 14,000 SF 2013 $ 4.8 2019 $13.8 23% (4) Village of Victoria Park Construct 30 Single-Family Homes 2013 $ 1.1 2018 $ 2.9 22% Altis at Lakeline Develop 354 Multifamily Units 2014 $ 5.5 2019 $ 9.3 14% (4) Bonterra CC Homes Develop 394 Single-Family Homes 2014 $ 7.4 2017 $26.1 62% PGA Pods A&C 18 Acres 2014 $11.5 2019 $15.0 8% (4)(7) The Addison on Millenia Develop 292 Multifamily Units 2015 $ 6.2 2018 $15.7 38% (4) Gardens on Millenia - JV Retail Develop Retail 2015 $ 6.3 2018 $ 8.7 16% (4)(7) Altis at Shingle Creek Develop 356 Multifamily Units 2016 $ 0.3 2018 $ 3.7 153% Historical results may not be indicative of future results (1) For assets held in joint ventures, Investment Amount represents the fair value of property contributed to the venture on the contribution date and cash invested in the venture. For other assets owned by BBX Capital, Investment Amount represents the fair value of the property upon foreclosure (excluding PGA Pods A&C, which reflects the carrying amount of the associated loan upon foreclosure) and subsequent cash invested in the asset. (2) Year of sale for single-family home projects represents the year in which the last home was sold. (3) Cumulative Net Cash Inflows represent cash inflows received through the project's completion date. (4) These assets represent investments in real estate joint ventures that are not consolidated into BBX Capital's financial statements. (5) Asset was held in a joint venture that was consolidated into BBX Capital's financial statements. Investment Amount and Cumulative Net Cash Inflows are presented net of amounts attributed to noncontrolling interests. (6) This table does not include certain operating real estate assets that were acquired through foreclosure, including two student housing projects that were sold at a loss and a self-storage facility. It lists completed projects through 6/30/19 and does not include projects sold or completed subsequent to 6/30/19. (7) These properties were sold during Q4 2018. (8) IRR represents the return to BBX on its investment and was determined based upon the actual timing of cash outflows paid/property contributed by BBX and cash inflows and notes received by BBX throughout the life of the project. Historical returns achieved by any prior investment are not a prediction of future performance or a guaranty of future results. 40

Acquisition of Altman Companies Transaction Details ➢ On December 3, 2018 BBX Capital Real Estate acquired a 50% interest in apartment developer The Altman Companies, including interests in Altman Development Company, Altman-Glenewinkel Construction, and the Altman Management Company. ➢ Simultaneously with the investment in Altman, BBX Capital Real Estate acquired a 50% interest in Altman’s share of the General Partnership in all the existing developments, see page 42. ➢ BBX Capital Real Estate has also agreed to acquire an additional 40% interest in Altman on January 1, 2023 and has also agreed to buy the remaining 10% in certain circumstances. 41Acquisition of Altman Companies Transaction Details ➢ On December 3, 2018 BBX Capital Real Estate acquired a 50% interest in apartment developer The Altman Companies, including interests in Altman Development Company, Altman-Glenewinkel Construction, and the Altman Management Company. ➢ Simultaneously with the investment in Altman, BBX Capital Real Estate acquired a 50% interest in Altman’s share of the General Partnership in all the existing developments, see page 42. ➢ BBX Capital Real Estate has also agreed to acquire an additional 40% interest in Altman on January 1, 2023 and has also agreed to buy the remaining 10% in certain circumstances. 41
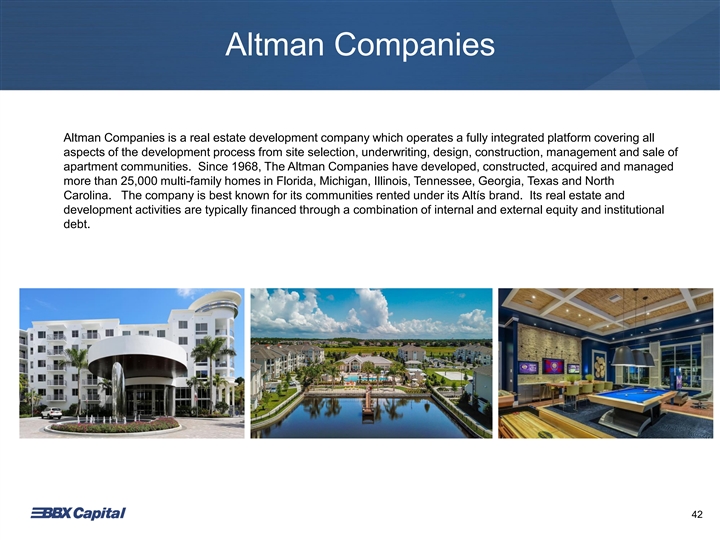
Altman Companies Altman Companies is a real estate development company which operates a fully integrated platform covering all aspects of the development process from site selection, underwriting, design, construction, management and sale of apartment communities. Since 1968, The Altman Companies have developed, constructed, acquired and managed more than 25,000 multi-family homes in Florida, Michigan, Illinois, Tennessee, Georgia, Texas and North Carolina. The company is best known for its communities rented under its Altís brand. Its real estate and development activities are typically financed through a combination of internal and external equity and institutional debt. 42Altman Companies Altman Companies is a real estate development company which operates a fully integrated platform covering all aspects of the development process from site selection, underwriting, design, construction, management and sale of apartment communities. Since 1968, The Altman Companies have developed, constructed, acquired and managed more than 25,000 multi-family homes in Florida, Michigan, Illinois, Tennessee, Georgia, Texas and North Carolina. The company is best known for its communities rented under its Altís brand. Its real estate and development activities are typically financed through a combination of internal and external equity and institutional debt. 42

Acquisition of Altman Companies ➢ Simultaneously with the investment in Altman, BBX Capital Real Estate acquired a 50% interest in Altman’s share of the General Partnership in all the existing apartment developments below: Altis Boca Raton, Boca Raton, FL 398 Units Altis Bonterra, Hialeah, FL 314 Units Altis Grand Central, Tampa, FL 314 Units (1) Altis Lakeline, Austin, TX 354 Units Altis Pembroke Gardens, Pembroke Pines, FL 280 Units Altis Promenade, Tampa, FL 338 Units Altis Wiregrass Ranch, Wesley Chapel, FL 392 Units (1) Sold in April 2019. 43Acquisition of Altman Companies ➢ Simultaneously with the investment in Altman, BBX Capital Real Estate acquired a 50% interest in Altman’s share of the General Partnership in all the existing apartment developments below: Altis Boca Raton, Boca Raton, FL 398 Units Altis Bonterra, Hialeah, FL 314 Units Altis Grand Central, Tampa, FL 314 Units (1) Altis Lakeline, Austin, TX 354 Units Altis Pembroke Gardens, Pembroke Pines, FL 280 Units Altis Promenade, Tampa, FL 338 Units Altis Wiregrass Ranch, Wesley Chapel, FL 392 Units (1) Sold in April 2019. 43

Altis Preserve Altis Preserve Tampa, Florida • 350 Rental Apartments • Construction Loan Closed – Q1 2019 • Status – Under Development 44Altis Preserve Altis Preserve Tampa, Florida • 350 Rental Apartments • Construction Loan Closed – Q1 2019 • Status – Under Development 44
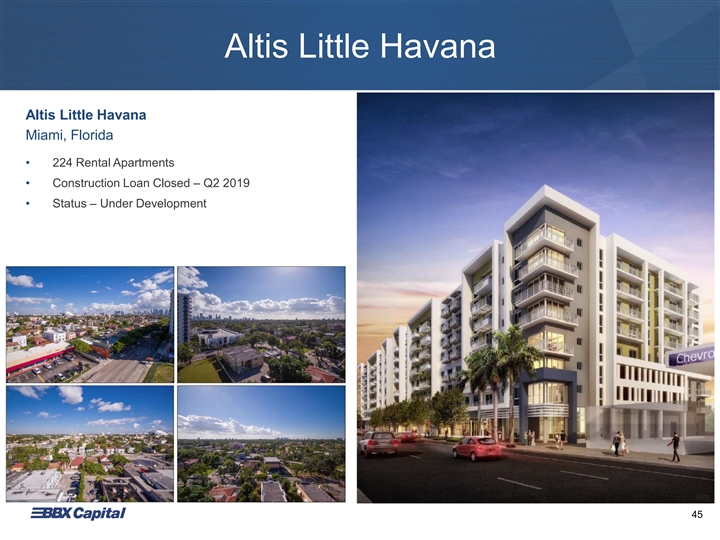
Altis Little Havana Altis Little Havana Miami, Florida • 224 Rental Apartments • Construction Loan Closed – Q2 2019 • Status – Under Development 45Altis Little Havana Altis Little Havana Miami, Florida • 224 Rental Apartments • Construction Loan Closed – Q2 2019 • Status – Under Development 45

Altis Bonterra Altis Bonterra Hialeah, Florida • 314 Rental Apartments • Completed 2018 • 96% Occupied as of 6/30/19 • Status – Under Contract for Sale 46Altis Bonterra Altis Bonterra Hialeah, Florida • 314 Rental Apartments • Completed 2018 • 96% Occupied as of 6/30/19 • Status – Under Contract for Sale 46

BBX Capital Real Estate 3 Year (3) (3) (1) (3) (1) (3) (3) 2014 2015 2016 2017 2018 Average ($ in thousands) Total Revenues $ 18,013 46,642 12,475 8,821 31,264 17,520 (2) EBITDA $ (3,799) 36,363 27,990 14,440 28,311 23,580 (1) Amounts were adjusted for the adoption of the revenue recognition standard. Total revenue excludes equity earnings from unconsolidated Joint Ventures. (2) See appendix for a reconciliation of BBX Capital Real Estate’s net income before income taxes to EBITDA. (3) For the fiscal year ended December 31. 47BBX Capital Real Estate 3 Year (3) (3) (1) (3) (1) (3) (3) 2014 2015 2016 2017 2018 Average ($ in thousands) Total Revenues $ 18,013 46,642 12,475 8,821 31,264 17,520 (2) EBITDA $ (3,799) 36,363 27,990 14,440 28,311 23,580 (1) Amounts were adjusted for the adoption of the revenue recognition standard. Total revenue excludes equity earnings from unconsolidated Joint Ventures. (2) See appendix for a reconciliation of BBX Capital Real Estate’s net income before income taxes to EBITDA. (3) For the fiscal year ended December 31. 47

BBX Capital Real Estate (2) (2) Q2 2018 Q2 2019 YTD 2018 YTD 2019 ($ in thousands) Total Revenues $ 4,994 10,800 17,744 17,416 (1) EBITDA $ 1,425 18,841 12,043 21,155 (1) See appendix for a reconciliation of BBX Capital Real Estate’s net income before income taxes to EBITDA. (2) Over the six months ended June 30, 48BBX Capital Real Estate (2) (2) Q2 2018 Q2 2019 YTD 2018 YTD 2019 ($ in thousands) Total Revenues $ 4,994 10,800 17,744 17,416 (1) EBITDA $ 1,425 18,841 12,043 21,155 (1) See appendix for a reconciliation of BBX Capital Real Estate’s net income before income taxes to EBITDA. (2) Over the six months ended June 30, 48

Four Strategic Segments* 1 3 4 2 • NYSE: BXG Acquisition, Acquisition, Ow Ownership, nership, • One of the largest • Designer, • 90% ownership and and M Manageme anagement nt of: of: specialty candy manufacturer and interest • • Dev Developments elopments retailers in the U.S.A. distributor of specialty • 69 Resorts • • Joint Joint V Ventures entures • ~100 Locations doors, hardware, and • 217,000+ Vacation • • Inv Investments estments • >25 States home décor products (1) Club Owners (1) Data as of 6/30/19 *The company also has other investments, including MOD Pizza franchises, Hoffman’s Chocolates and Las Olas Confections and Snacks. These businesses are not material to our business and accordingly we are excluding them from this presentation. 49Four Strategic Segments* 1 3 4 2 • NYSE: BXG Acquisition, Acquisition, Ow Ownership, nership, • One of the largest • Designer, • 90% ownership and and M Manageme anagement nt of: of: specialty candy manufacturer and interest • • Dev Developments elopments retailers in the U.S.A. distributor of specialty • 69 Resorts • • Joint Joint V Ventures entures • ~100 Locations doors, hardware, and • 217,000+ Vacation • • Inv Investments estments • >25 States home décor products (1) Club Owners (1) Data as of 6/30/19 *The company also has other investments, including MOD Pizza franchises, Hoffman’s Chocolates and Las Olas Confections and Snacks. These businesses are not material to our business and accordingly we are excluding them from this presentation. 49

IT’SUGAR Headquartered in Deerfield Beach, Florida, IT’SUGAR, LLC (“IT’SUGAR”) is one of the largest specialty candy retailers in the United States with approximately 100 locations in over 25 states and Washington, DC. It is anticipated that 3 - 4 stores will be opened in 2019, including flagship locations in Las Vegas and American Dream, Meadowlands, NJ. BBX Sweet Holdings acquired IT’SUGAR in June 2017. 50IT’SUGAR Headquartered in Deerfield Beach, Florida, IT’SUGAR, LLC (“IT’SUGAR”) is one of the largest specialty candy retailers in the United States with approximately 100 locations in over 25 states and Washington, DC. It is anticipated that 3 - 4 stores will be opened in 2019, including flagship locations in Las Vegas and American Dream, Meadowlands, NJ. BBX Sweet Holdings acquired IT’SUGAR in June 2017. 50

IT’SUGAR Las Vegas Opened May 2019 51IT’SUGAR Las Vegas Opened May 2019 51

IT’SUGAR American Dream Rendering Opening October 2019 52IT’SUGAR American Dream Rendering Opening October 2019 52

IT’SUGAR Current Footprint ~100 locations in over 25 states and Washington, DC. 53IT’SUGAR Current Footprint ~100 locations in over 25 states and Washington, DC. 53

IT’SUGAR New Stores Opened - 2018 FAO Schweetz Victory Park Easton New York, NY Dallas, TX Columbus, OH Navy Pier Chicago, IL 54IT’SUGAR New Stores Opened - 2018 FAO Schweetz Victory Park Easton New York, NY Dallas, TX Columbus, OH Navy Pier Chicago, IL 54

IT’SUGAR (2) (2) Q2 2018 Q2 2019 YTD 2018 YTD 2019 ($ in thousands) Total Revenues $ 19,640 21,470 36,340 38,895 (1) EBITDA $ 976 1,250 132 409 (1) See appendix for a reconciliation of IT’SUGAR’s net income (loss) before income taxes to EBITDA. (2) For the six months ended June 30. 55IT’SUGAR (2) (2) Q2 2018 Q2 2019 YTD 2018 YTD 2019 ($ in thousands) Total Revenues $ 19,640 21,470 36,340 38,895 (1) EBITDA $ 976 1,250 132 409 (1) See appendix for a reconciliation of IT’SUGAR’s net income (loss) before income taxes to EBITDA. (2) For the six months ended June 30. 55

Four Strategic Segments* 1 3 4 2 • NYSE: BXG Acquisition, Ownership, • One of the largest • Designer, • 90% ownership and Management of: specialty candy manufacturer and interest • Developments retailers in the U.S.A. distributor of specialty • 69 Resorts • Joint Ventures • ~100 Locations doors, hardware, and • 217,000+ Vacation • Investments • >25 States home décor products (1) Club Owners (1) Data as of 6/30/19 *The company also has other investments, including MOD Pizza franchises, Hoffman’s Chocolates and Las Olas Confections and Snacks. These businesses are not material to our business and accordingly we are excluding them from this presentation. 56Four Strategic Segments* 1 3 4 2 • NYSE: BXG Acquisition, Ownership, • One of the largest • Designer, • 90% ownership and Management of: specialty candy manufacturer and interest • Developments retailers in the U.S.A. distributor of specialty • 69 Resorts • Joint Ventures • ~100 Locations doors, hardware, and • 217,000+ Vacation • Investments • >25 States home décor products (1) Club Owners (1) Data as of 6/30/19 *The company also has other investments, including MOD Pizza franchises, Hoffman’s Chocolates and Las Olas Confections and Snacks. These businesses are not material to our business and accordingly we are excluding them from this presentation. 56

Designer, distributor, and manufacturer of: • Specialty Doors • Hardware International Distribution Lean Management • Home Décor Products Canada, United States, and Europe Focused on Improving Sales and Margin Balanced Sales Mix Barn Door Systems 50% of Sales from Big Box Retail Driving Growth Millwork Vendor of the Year - 2016 57Designer, distributor, and manufacturer of: • Specialty Doors • Hardware International Distribution Lean Management • Home Décor Products Canada, United States, and Europe Focused on Improving Sales and Margin Balanced Sales Mix Barn Door Systems 50% of Sales from Big Box Retail Driving Growth Millwork Vendor of the Year - 2016 57

(3) (3) (1)(3) (1)(3) (3) 2014 2015 2016 2017 2018 ($ in thousands) Total Revenues $ 57,839 56,461 65,068 68,935 68,417 (2) Adjusted EBITDA $ (174) (68) 1,852 4,595 4,984 Book Value $ 7,155 6,132 10,807 12,698 13,114 (1) Amounts were adjusted for the adoption of the revenue recognition standard. (2) See appendix for a reconciliation of Renin’s net income to Adjusted EBITDA. (3) For the years ended December 31. 58(3) (3) (1)(3) (1)(3) (3) 2014 2015 2016 2017 2018 ($ in thousands) Total Revenues $ 57,839 56,461 65,068 68,935 68,417 (2) Adjusted EBITDA $ (174) (68) 1,852 4,595 4,984 Book Value $ 7,155 6,132 10,807 12,698 13,114 (1) Amounts were adjusted for the adoption of the revenue recognition standard. (2) See appendix for a reconciliation of Renin’s net income to Adjusted EBITDA. (3) For the years ended December 31. 58

(2) (2) Q2 2018 Q2 2019 YTD 2018 YTD 2019 ($ in thousands) Total Revenues $ 16,890 15,491 31,875 34,834 (1) Adjusted EBITDA $ 748 486 1,330 2,082 Book Value $ 12,205 12,970 (1) See appendix for a reconciliation of Renin’s net income to Adjusted EBITDA. (2) For the six months ended June 30. 59(2) (2) Q2 2018 Q2 2019 YTD 2018 YTD 2019 ($ in thousands) Total Revenues $ 16,890 15,491 31,875 34,834 (1) Adjusted EBITDA $ 748 486 1,330 2,082 Book Value $ 12,205 12,970 (1) See appendix for a reconciliation of Renin’s net income to Adjusted EBITDA. (2) For the six months ended June 30. 59

Four Strategic Segments* 1 3 4 2 • NYSE: BXG Acquisition, Ownership, • One of the largest • Designer, • 90% ownership and Management of: specialty candy manufacturer and interest • Developments retailers in the U.S.A. distributor of specialty • 69 Resorts • Joint Ventures • ~100 Locations doors, hardware, and • 217,000+ Vacation • Investments • >25 States home décor products (1) Club Owners (1) Data as of 6/30/19 *The company also has other investments, including MOD Pizza franchises, Hoffman’s Chocolates and Las Olas Confections and Snacks. These businesses are not material to our business and accordingly we are excluding them from this presentation. 60Four Strategic Segments* 1 3 4 2 • NYSE: BXG Acquisition, Ownership, • One of the largest • Designer, • 90% ownership and Management of: specialty candy manufacturer and interest • Developments retailers in the U.S.A. distributor of specialty • 69 Resorts • Joint Ventures • ~100 Locations doors, hardware, and • 217,000+ Vacation • Investments • >25 States home décor products (1) Club Owners (1) Data as of 6/30/19 *The company also has other investments, including MOD Pizza franchises, Hoffman’s Chocolates and Las Olas Confections and Snacks. These businesses are not material to our business and accordingly we are excluding them from this presentation. 60

BBX Capital: Possible Valuation Methodology • Consider the market cap of the Bluegreen Vacations stock owned by BBX, and consider it a tracking stock to BXG based on its ownership stake of 90% + • Plus – BBX Capital’s book value, excluding Bluegreen Vacations (3) + • Plus – the market value of BBX Capital’s net assets in excess of book value + • Plus – Bluegreen’s opportunity to narrow the delta between its trading multiple and the (4) trading multiples of Hilton Grand Vacations and Marriott Vacations (1) BBX Capital consolidated book value as of 6/30/19 of $539.4 million minus 90% of Bluegreen Vacations book value as of 6/30/19 of $408.4 million There are many ways to value a company and its securities. Valuation is a complex analytical process involving determinations as to the most appropriate and relevant methods of financial analysis. The sum-of-the-parts is only one of many possible methodologies. The above valuation does not consider or take into account i) taxes or indebtedness due on a sale, ii) subsidiary expenses or operating results of the subsidiaries, or iii) corporate overhead. Further, estimates of the value of a business or securities may not be realized on sale or liquidation and do not reflect the prices at which securities may trade in the future. The market capitalization of Bluegreen and the equity value of Bluegreen held by BBX in Bluegreen is as of June 30, 2019. Such amount may increase or decrease in the future based on both factors relating to Bluegreen and factors outside of Bluegreen’s control. 61BBX Capital: Possible Valuation Methodology • Consider the market cap of the Bluegreen Vacations stock owned by BBX, and consider it a tracking stock to BXG based on its ownership stake of 90% + • Plus – BBX Capital’s book value, excluding Bluegreen Vacations (3) + • Plus – the market value of BBX Capital’s net assets in excess of book value + • Plus – Bluegreen’s opportunity to narrow the delta between its trading multiple and the (4) trading multiples of Hilton Grand Vacations and Marriott Vacations (1) BBX Capital consolidated book value as of 6/30/19 of $539.4 million minus 90% of Bluegreen Vacations book value as of 6/30/19 of $408.4 million There are many ways to value a company and its securities. Valuation is a complex analytical process involving determinations as to the most appropriate and relevant methods of financial analysis. The sum-of-the-parts is only one of many possible methodologies. The above valuation does not consider or take into account i) taxes or indebtedness due on a sale, ii) subsidiary expenses or operating results of the subsidiaries, or iii) corporate overhead. Further, estimates of the value of a business or securities may not be realized on sale or liquidation and do not reflect the prices at which securities may trade in the future. The market capitalization of Bluegreen and the equity value of Bluegreen held by BBX in Bluegreen is as of June 30, 2019. Such amount may increase or decrease in the future based on both factors relating to Bluegreen and factors outside of Bluegreen’s control. 61
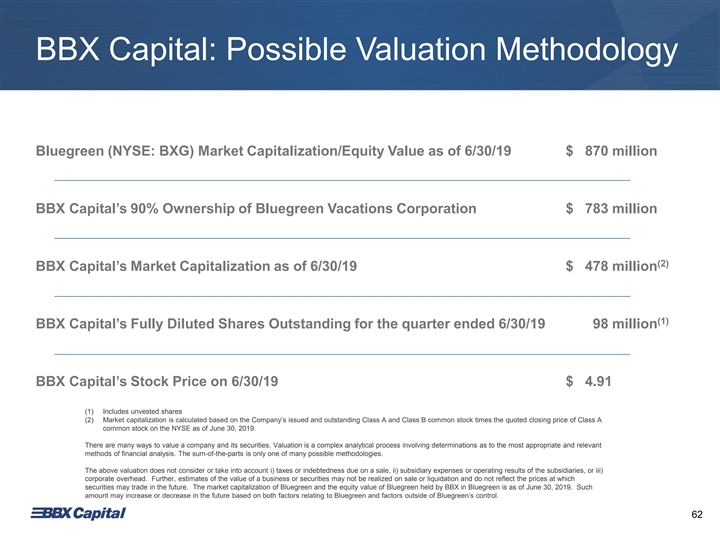
BBX Capital: Possible Valuation Methodology Bluegreen (NYSE: BXG) Market Capitalization/Equity Value as of 6/30/19 $ 870 million BBX Capital’s 90% Ownership of Bluegreen Vacations Corporation $ 783 million (2) BBX Capital’s Market Capitalization as of 6/30/19 $ 478 million (1) BBX Capital’s Fully Diluted Shares Outstanding for the quarter ended 6/30/19 98 million BBX Capital’s Stock Price on 6/30/19 $ 4.91 (1) Includes unvested shares (2) Market capitalization is calculated based on the Company’s issued and outstanding Class A and Class B common stock times the quoted closing price of Class A common stock on the NYSE as of June 30, 2019. There are many ways to value a company and its securities. Valuation is a complex analytical process involving determinations as to the most appropriate and relevant methods of financial analysis. The sum-of-the-parts is only one of many possible methodologies. The above valuation does not consider or take into account i) taxes or indebtedness due on a sale, ii) subsidiary expenses or operating results of the subsidiaries, or iii) corporate overhead. Further, estimates of the value of a business or securities may not be realized on sale or liquidation and do not reflect the prices at which securities may trade in the future. The market capitalization of Bluegreen and the equity value of Bluegreen held by BBX in Bluegreen is as of June 30, 2019. Such amount may increase or decrease in the future based on both factors relating to Bluegreen and factors outside of Bluegreen’s control. 62BBX Capital: Possible Valuation Methodology Bluegreen (NYSE: BXG) Market Capitalization/Equity Value as of 6/30/19 $ 870 million BBX Capital’s 90% Ownership of Bluegreen Vacations Corporation $ 783 million (2) BBX Capital’s Market Capitalization as of 6/30/19 $ 478 million (1) BBX Capital’s Fully Diluted Shares Outstanding for the quarter ended 6/30/19 98 million BBX Capital’s Stock Price on 6/30/19 $ 4.91 (1) Includes unvested shares (2) Market capitalization is calculated based on the Company’s issued and outstanding Class A and Class B common stock times the quoted closing price of Class A common stock on the NYSE as of June 30, 2019. There are many ways to value a company and its securities. Valuation is a complex analytical process involving determinations as to the most appropriate and relevant methods of financial analysis. The sum-of-the-parts is only one of many possible methodologies. The above valuation does not consider or take into account i) taxes or indebtedness due on a sale, ii) subsidiary expenses or operating results of the subsidiaries, or iii) corporate overhead. Further, estimates of the value of a business or securities may not be realized on sale or liquidation and do not reflect the prices at which securities may trade in the future. The market capitalization of Bluegreen and the equity value of Bluegreen held by BBX in Bluegreen is as of June 30, 2019. Such amount may increase or decrease in the future based on both factors relating to Bluegreen and factors outside of Bluegreen’s control. 62

BBX Capital: Possible Valuation Methodology • Consider the market cap of the Bluegreen Vacations stock owned by BBX, and consider it a tracking stock to BXG based on its ownership stake of 90% + (1) • Plus – BBX Capital’s book value, excluding Bluegreen Vacations + • Plus – the market value of BBX Capital’s net assets in excess of book value + • Plus – Bluegreen’s opportunity to narrow the delta between its trading multiple and the (4) trading multiples of Hilton Grand Vacations and Marriott Vacations (1) BBX Capital consolidated book value as of 6/30/19 of $539.4 million minus 90% of Bluegreen Vacations book value as of 6/30/19 of $408.4 million There are many ways to value a company and its securities. Valuation is a complex analytical process involving determinations as to the most appropriate and relevant methods of financial analysis. The sum-of-the-parts is only one of many possible methodologies. The above valuation does not consider or take into account i) taxes or indebtedness due on a sale, ii) subsidiary expenses or operating results of the subsidiaries, or iii) corporate overhead. Further, estimates of the value of a business or securities may not be realized on sale or liquidation and do not reflect the prices at which securities may trade in the future. The market capitalization of Bluegreen and the equity value of Bluegreen held by BBX in Bluegreen is as of June 30, 2019. Such amount may increase or decrease in the future based on both factors relating to Bluegreen and factors outside of Bluegreen’s control. 63BBX Capital: Possible Valuation Methodology • Consider the market cap of the Bluegreen Vacations stock owned by BBX, and consider it a tracking stock to BXG based on its ownership stake of 90% + (1) • Plus – BBX Capital’s book value, excluding Bluegreen Vacations + • Plus – the market value of BBX Capital’s net assets in excess of book value + • Plus – Bluegreen’s opportunity to narrow the delta between its trading multiple and the (4) trading multiples of Hilton Grand Vacations and Marriott Vacations (1) BBX Capital consolidated book value as of 6/30/19 of $539.4 million minus 90% of Bluegreen Vacations book value as of 6/30/19 of $408.4 million There are many ways to value a company and its securities. Valuation is a complex analytical process involving determinations as to the most appropriate and relevant methods of financial analysis. The sum-of-the-parts is only one of many possible methodologies. The above valuation does not consider or take into account i) taxes or indebtedness due on a sale, ii) subsidiary expenses or operating results of the subsidiaries, or iii) corporate overhead. Further, estimates of the value of a business or securities may not be realized on sale or liquidation and do not reflect the prices at which securities may trade in the future. The market capitalization of Bluegreen and the equity value of Bluegreen held by BBX in Bluegreen is as of June 30, 2019. Such amount may increase or decrease in the future based on both factors relating to Bluegreen and factors outside of Bluegreen’s control. 63
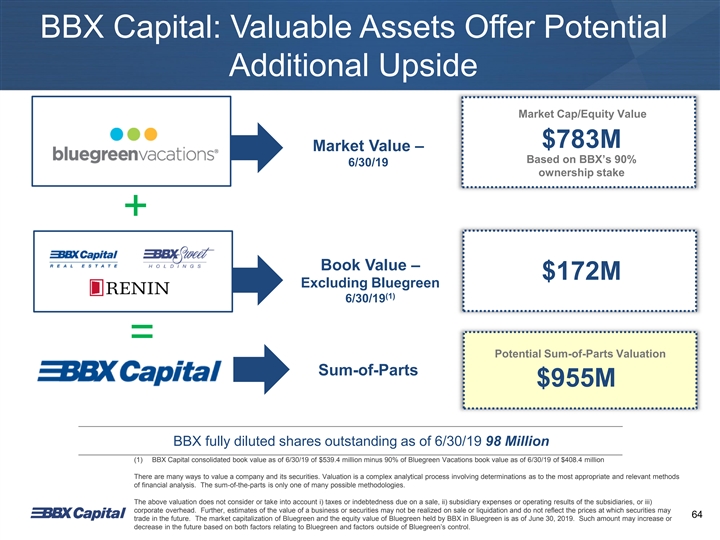
BBX Capital: Valuable Assets Offer Potential Additional Upside Market Cap/Equity Value $783M Market Value – Based on BBX’s 90% 6/30/19 ownership stake + Book Value – $172M Excluding Bluegreen (1) 6/30/19 = Potential Sum-of-Parts Valuation Sum-of-Parts $955M BBX fully diluted shares outstanding as of 6/30/19 98 Million (1) BBX Capital consolidated book value as of 6/30/19 of $539.4 million minus 90% of Bluegreen Vacations book value as of 6/30/19 of $408.4 million There are many ways to value a company and its securities. Valuation is a complex analytical process involving determinations as to the most appropriate and relevant methods of financial analysis. The sum-of-the-parts is only one of many possible methodologies. The above valuation does not consider or take into account i) taxes or indebtedness due on a sale, ii) subsidiary expenses or operating results of the subsidiaries, or iii) corporate overhead. Further, estimates of the value of a business or securities may not be realized on sale or liquidation and do not reflect the prices at which securities may 64 trade in the future. The market capitalization of Bluegreen and the equity value of Bluegreen held by BBX in Bluegreen is as of June 30, 2019. Such amount may increase or decrease in the future based on both factors relating to Bluegreen and factors outside of Bluegreen’s control. BBX Capital: Valuable Assets Offer Potential Additional Upside Market Cap/Equity Value $783M Market Value – Based on BBX’s 90% 6/30/19 ownership stake + Book Value – $172M Excluding Bluegreen (1) 6/30/19 = Potential Sum-of-Parts Valuation Sum-of-Parts $955M BBX fully diluted shares outstanding as of 6/30/19 98 Million (1) BBX Capital consolidated book value as of 6/30/19 of $539.4 million minus 90% of Bluegreen Vacations book value as of 6/30/19 of $408.4 million There are many ways to value a company and its securities. Valuation is a complex analytical process involving determinations as to the most appropriate and relevant methods of financial analysis. The sum-of-the-parts is only one of many possible methodologies. The above valuation does not consider or take into account i) taxes or indebtedness due on a sale, ii) subsidiary expenses or operating results of the subsidiaries, or iii) corporate overhead. Further, estimates of the value of a business or securities may not be realized on sale or liquidation and do not reflect the prices at which securities may 64 trade in the future. The market capitalization of Bluegreen and the equity value of Bluegreen held by BBX in Bluegreen is as of June 30, 2019. Such amount may increase or decrease in the future based on both factors relating to Bluegreen and factors outside of Bluegreen’s control.
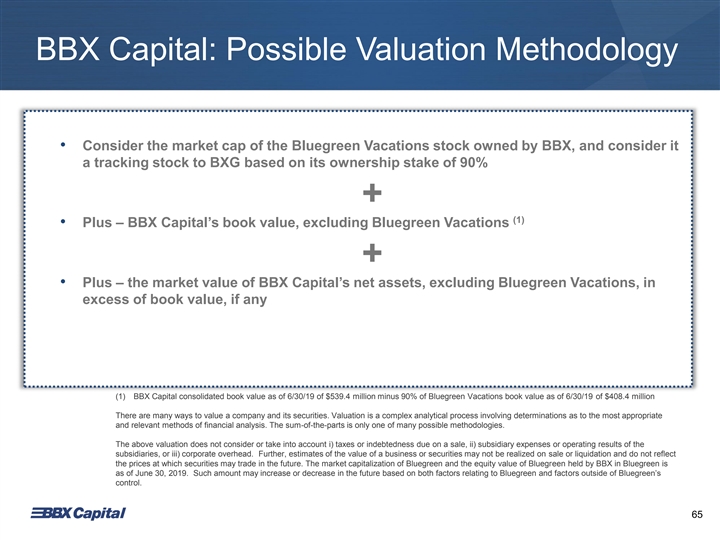
BBX Capital: Possible Valuation Methodology • Consider the market cap of the Bluegreen Vacations stock owned by BBX, and consider it a tracking stock to BXG based on its ownership stake of 90% + (1) • Plus – BBX Capital’s book value, excluding Bluegreen Vacations + • Plus – the market value of BBX Capital’s net assets, excluding Bluegreen Vacations, in excess of book value, if any (1) BBX Capital consolidated book value as of 6/30/19 of $539.4 million minus 90% of Bluegreen Vacations book value as of 6/30/19 of $408.4 million There are many ways to value a company and its securities. Valuation is a complex analytical process involving determinations as to the most appropriate and relevant methods of financial analysis. The sum-of-the-parts is only one of many possible methodologies. The above valuation does not consider or take into account i) taxes or indebtedness due on a sale, ii) subsidiary expenses or operating results of the subsidiaries, or iii) corporate overhead. Further, estimates of the value of a business or securities may not be realized on sale or liquidation and do not reflect the prices at which securities may trade in the future. The market capitalization of Bluegreen and the equity value of Bluegreen held by BBX in Bluegreen is as of June 30, 2019. Such amount may increase or decrease in the future based on both factors relating to Bluegreen and factors outside of Bluegreen’s control. 65BBX Capital: Possible Valuation Methodology • Consider the market cap of the Bluegreen Vacations stock owned by BBX, and consider it a tracking stock to BXG based on its ownership stake of 90% + (1) • Plus – BBX Capital’s book value, excluding Bluegreen Vacations + • Plus – the market value of BBX Capital’s net assets, excluding Bluegreen Vacations, in excess of book value, if any (1) BBX Capital consolidated book value as of 6/30/19 of $539.4 million minus 90% of Bluegreen Vacations book value as of 6/30/19 of $408.4 million There are many ways to value a company and its securities. Valuation is a complex analytical process involving determinations as to the most appropriate and relevant methods of financial analysis. The sum-of-the-parts is only one of many possible methodologies. The above valuation does not consider or take into account i) taxes or indebtedness due on a sale, ii) subsidiary expenses or operating results of the subsidiaries, or iii) corporate overhead. Further, estimates of the value of a business or securities may not be realized on sale or liquidation and do not reflect the prices at which securities may trade in the future. The market capitalization of Bluegreen and the equity value of Bluegreen held by BBX in Bluegreen is as of June 30, 2019. Such amount may increase or decrease in the future based on both factors relating to Bluegreen and factors outside of Bluegreen’s control. 65

A Diversified Holding Company Summary 90% owner of Bluegreen Vacations, a profitable and growing “drive-to” vacation ownership company, with a compelling valuation opportunity Track record of identifying growth opportunities, becoming value-add partners, with a strong financial footing Current portfolio of assets in diverse verticals Led by an entrepreneurial team focused on creating value over the long-term 66A Diversified Holding Company Summary 90% owner of Bluegreen Vacations, a profitable and growing “drive-to” vacation ownership company, with a compelling valuation opportunity Track record of identifying growth opportunities, becoming value-add partners, with a strong financial footing Current portfolio of assets in diverse verticals Led by an entrepreneurial team focused on creating value over the long-term 66

NYSE: BBX Thank You!NYSE: BBX Thank You!
Leo Hinkley Managing Director, IRO 954-940-5300 Appendix: Leo Hinkley Managing Director, IRO 954-940-5300 Appendix:

BBX Capital Corporation Fully Diluted S&P Fully Diluted Book Value Stock Price Book Value Stock 500 Index (1) Date Book Value Per Share Increase/Decrease ($) Price Increase/Decrease ($ Per Share) Increase/Decrease Over Prior Year % Over Prior Year % Over Prior Year % 12/31/2011 $ 121,534 $ 1.53 (18%) $ 0.35 (5%) (1%) 12/31/2012 $ 298,967 $ 3.50 132% $ 1.26 260% 13% 12/31/2013 $ 239,421 $ 2.77 (21%) $ 2.89 129% 30% 12/31/2014 $ 252,906 $ 2.84 3% $ 3.20 11% 11% 12/31/2015 $ 376,826 $ 4.21 48% $ 3.39 6% (1%) 12/31/2016 $ 466,406 $ 4.32 3% $ 4.88 44% 10% 12/31/2017 $ 585,468 $ 5.63 30% $ 7.97 63% 19% 12/31/2018 $ 549,620 $ 5.70 1% $ 5.73 (28%) (6%) Returns % Compound annual gain % 21% 49% 10% Overall gain % 273% 1,537% 99% (1) 2016 and 2017 Book Value ($) and Fully Diluted Book Value ($ Per Share) were adjusted for the adoption of the revenue recognition standard. Note: Sale of BankAtlantic was closed on July 31, 2012. 69BBX Capital Corporation Fully Diluted S&P Fully Diluted Book Value Stock Price Book Value Stock 500 Index (1) Date Book Value Per Share Increase/Decrease ($) Price Increase/Decrease ($ Per Share) Increase/Decrease Over Prior Year % Over Prior Year % Over Prior Year % 12/31/2011 $ 121,534 $ 1.53 (18%) $ 0.35 (5%) (1%) 12/31/2012 $ 298,967 $ 3.50 132% $ 1.26 260% 13% 12/31/2013 $ 239,421 $ 2.77 (21%) $ 2.89 129% 30% 12/31/2014 $ 252,906 $ 2.84 3% $ 3.20 11% 11% 12/31/2015 $ 376,826 $ 4.21 48% $ 3.39 6% (1%) 12/31/2016 $ 466,406 $ 4.32 3% $ 4.88 44% 10% 12/31/2017 $ 585,468 $ 5.63 30% $ 7.97 63% 19% 12/31/2018 $ 549,620 $ 5.70 1% $ 5.73 (28%) (6%) Returns % Compound annual gain % 21% 49% 10% Overall gain % 273% 1,537% 99% (1) 2016 and 2017 Book Value ($) and Fully Diluted Book Value ($ Per Share) were adjusted for the adoption of the revenue recognition standard. Note: Sale of BankAtlantic was closed on July 31, 2012. 69

BBX Capital Corporation Reconciliation of Net Income to EBITDA and Adjusted EBITDA (1)(2) (1)(2) (2) ($’s in thousands) 2016 2017 2018 Q2 2018 Q2 2019 Net Income (loss) $ 42,596 102,303 55,793 12,439 (7,624) Provision (Benefit) for income taxes 36,390 (9,702) 31,639 8,655 (1,338) Income (loss) before income taxes 78,986 92,601 87,432 21,094 (8,962) Add/(less): Interest income (other than interest earned on VOI notes receivable) (4,399) (3,706) (5,631) (927) (1,435) Interest expense 36,037 35,205 41,938 10,403 11,661 Interest expense on receivable- backed debt (18,348) (17,809) (19,514) (4,622) (5,069) Franchise taxes 186 178 199 43 25 Depreciation and amortization 12,906 16,762 21,788 5,218 5,596 EBITDA 105,368 123,231 126,212 31,209 1,816 EBITDA attributable to non-controlling interests (10,005) (14,531) (26,674) (7,543) (8,043) Gain (loss) on assets held-for-sale (1,423) 46 3 11 (1,989) Foreign Exchange (gain) loss (219) 193 (68) 37 29 Corporate realignment cost - 9,133 9,677 1,719 - One-time special bonus 10,000 - - Bass Pro Settlement - 4,781 - - 39,121 Impairment of property and equipment and intangible assets - 2,138 Adjusted EBITDA $ 103,721 122,853 109,150 25,433 33,072 (1) Amounts were adjusted for the adoption of the revenue recognition standard. (2) For the year ended December 31, 2016, 2017 and 2018, respectively. EBITDA is defined as earnings, or net income, before taking into account interest income (excluding interest earned on VOI notes receivable), interest expense (excluding interest expense incurred on financings related to Bluegreen’s receivable-backed notes payable), franchise taxes, and depreciation and amortization. For purposes of the EBITDA calculation, no adjustments were made for interest income earned on Bluegreen’s VOI notes receivable or the interest expense incurred on debt that is secured by such notes receivable because they are both considered to be part of the operations of Bluegreen’s business. Including the amortization of product displays provided to customers that are presented as a reduction of trade sales. Adjusted EBITDA is defined as EBITDA Adjusted for amounts attributable to noncontrolling interest in Bluegreen and Bluegreen/Big Cedar Vacations (in which Bluegreen has 51% equity interest) and items that BBX Capital believes are not representative of ongoing operating results including restructuring charges and goodwill impairment losses. Accordingly, amounts paid, accrued, or incurred in connection with the Bass Pro settlement in June 2019, as well as impairments of property and equipment and intangible assets related to certain of the Company’s MOD Pizza restaurant locations, were excluded in the computation of Adjusted EBITDA. The Company considers EBITDA and Adjusted EBITDA to be an indicator of its operating performance, and it is used to measure its and its subsidiaries ability to service debt, fund capital expenditures and expand its business. EBITDA is also used by companies, lenders, investors and others because it excludes certain items that can vary widely across different industries or among companies within the same industry. For example, interest expense can be dependent on a company’s capital structure, debt levels and credit ratings. Accordingly, the impact of interest expense on earnings can vary significantly among companies. Additionally, the tax positions of companies can also vary because of their differing abilities to take advantage of tax benefits and because of the tax policies of the jurisdictions in which they operate. As a result, effective tax rates and provision for income taxes can vary considerably among companies. EBITDA also excludes depreciation and amortization because companies utilize productive assets of different ages and use different methods of both acquiring and depreciating productive assets. These differences can result in considerable variability in the relative costs of productive assets and the related depreciation and 70 amortization expense among companies. The Company considers Adjusted EBITDA to be a useful supplemental measure of its operating performance that facilitates the comparability of historical financial periods. EDITDA and Adjusted EBITDA should not be considered as an alternative to income before income taxes as an indicator of the company's financial performance, or as an alternative to cash flow from operating activities as a measure of its liquidity. The Company's computation of EBIDTA and Adjusted EBITDA may differ from the methodology utilized by other companies. Investors are cautioned that items excluded from EBITDA and Adjusted EBITDA are significant components in understanding and assessing the Company’s financial performance.BBX Capital Corporation Reconciliation of Net Income to EBITDA and Adjusted EBITDA (1)(2) (1)(2) (2) ($’s in thousands) 2016 2017 2018 Q2 2018 Q2 2019 Net Income (loss) $ 42,596 102,303 55,793 12,439 (7,624) Provision (Benefit) for income taxes 36,390 (9,702) 31,639 8,655 (1,338) Income (loss) before income taxes 78,986 92,601 87,432 21,094 (8,962) Add/(less): Interest income (other than interest earned on VOI notes receivable) (4,399) (3,706) (5,631) (927) (1,435) Interest expense 36,037 35,205 41,938 10,403 11,661 Interest expense on receivable- backed debt (18,348) (17,809) (19,514) (4,622) (5,069) Franchise taxes 186 178 199 43 25 Depreciation and amortization 12,906 16,762 21,788 5,218 5,596 EBITDA 105,368 123,231 126,212 31,209 1,816 EBITDA attributable to non-controlling interests (10,005) (14,531) (26,674) (7,543) (8,043) Gain (loss) on assets held-for-sale (1,423) 46 3 11 (1,989) Foreign Exchange (gain) loss (219) 193 (68) 37 29 Corporate realignment cost - 9,133 9,677 1,719 - One-time special bonus 10,000 - - Bass Pro Settlement - 4,781 - - 39,121 Impairment of property and equipment and intangible assets - 2,138 Adjusted EBITDA $ 103,721 122,853 109,150 25,433 33,072 (1) Amounts were adjusted for the adoption of the revenue recognition standard. (2) For the year ended December 31, 2016, 2017 and 2018, respectively. EBITDA is defined as earnings, or net income, before taking into account interest income (excluding interest earned on VOI notes receivable), interest expense (excluding interest expense incurred on financings related to Bluegreen’s receivable-backed notes payable), franchise taxes, and depreciation and amortization. For purposes of the EBITDA calculation, no adjustments were made for interest income earned on Bluegreen’s VOI notes receivable or the interest expense incurred on debt that is secured by such notes receivable because they are both considered to be part of the operations of Bluegreen’s business. Including the amortization of product displays provided to customers that are presented as a reduction of trade sales. Adjusted EBITDA is defined as EBITDA Adjusted for amounts attributable to noncontrolling interest in Bluegreen and Bluegreen/Big Cedar Vacations (in which Bluegreen has 51% equity interest) and items that BBX Capital believes are not representative of ongoing operating results including restructuring charges and goodwill impairment losses. Accordingly, amounts paid, accrued, or incurred in connection with the Bass Pro settlement in June 2019, as well as impairments of property and equipment and intangible assets related to certain of the Company’s MOD Pizza restaurant locations, were excluded in the computation of Adjusted EBITDA. The Company considers EBITDA and Adjusted EBITDA to be an indicator of its operating performance, and it is used to measure its and its subsidiaries ability to service debt, fund capital expenditures and expand its business. EBITDA is also used by companies, lenders, investors and others because it excludes certain items that can vary widely across different industries or among companies within the same industry. For example, interest expense can be dependent on a company’s capital structure, debt levels and credit ratings. Accordingly, the impact of interest expense on earnings can vary significantly among companies. Additionally, the tax positions of companies can also vary because of their differing abilities to take advantage of tax benefits and because of the tax policies of the jurisdictions in which they operate. As a result, effective tax rates and provision for income taxes can vary considerably among companies. EBITDA also excludes depreciation and amortization because companies utilize productive assets of different ages and use different methods of both acquiring and depreciating productive assets. These differences can result in considerable variability in the relative costs of productive assets and the related depreciation and 70 amortization expense among companies. The Company considers Adjusted EBITDA to be a useful supplemental measure of its operating performance that facilitates the comparability of historical financial periods. EDITDA and Adjusted EBITDA should not be considered as an alternative to income before income taxes as an indicator of the company's financial performance, or as an alternative to cash flow from operating activities as a measure of its liquidity. The Company's computation of EBIDTA and Adjusted EBITDA may differ from the methodology utilized by other companies. Investors are cautioned that items excluded from EBITDA and Adjusted EBITDA are significant components in understanding and assessing the Company’s financial performance.

IT’SUGAR Reconciliation of income (loss) before income taxes to EBITDA (1) (2) (2) 2018 Q2 2018 Q2 2019 YTD 2018 YTD 2019 ($ in thousands) Loss (income) before income taxes $ (2,384) (104) 143 (2,041) (1,780) Add/Subtract: Interest expense (income) $ 40 - 35 (1) 57 Depreciation and amortization $ 4,556 1,080 1,072 2,174 2,132 EBITDA $ 2,212 976 1,250 132 409 (1) For the year ended December 31, 2018. (2) For the six months ended June 30. IT’SUGAR’s EBITDA is defined as its earnings, or net income, before taking into account interest expense, income taxes, and depreciation and amortization. The Company considers IT’SUGAR’s EBITDA to be an indicator of IT’SUGAR’s operating performance, and is used to measure IT’SUGAR’s ability to service debt, fund capital expenditures and expand its business. EBITDA is also used by companies, lenders, investors and others because it excludes certain items that can vary widely across different industries or among companies within the same industry. EBITDA should not be considered as an alternative to net income as an indicator of IT’SUGAR’s financial performance or as an alternative to cash flow from operating activities as a measure of its liquidity. The Company’s computation of IT’SUGAR’s EBITDA may differ from the methodology utilized by other companies, and investors are cautioned that items excluded from EBITDA are significant components in understanding and assessing IT’SUGAR’s financial performance. 71IT’SUGAR Reconciliation of income (loss) before income taxes to EBITDA (1) (2) (2) 2018 Q2 2018 Q2 2019 YTD 2018 YTD 2019 ($ in thousands) Loss (income) before income taxes $ (2,384) (104) 143 (2,041) (1,780) Add/Subtract: Interest expense (income) $ 40 - 35 (1) 57 Depreciation and amortization $ 4,556 1,080 1,072 2,174 2,132 EBITDA $ 2,212 976 1,250 132 409 (1) For the year ended December 31, 2018. (2) For the six months ended June 30. IT’SUGAR’s EBITDA is defined as its earnings, or net income, before taking into account interest expense, income taxes, and depreciation and amortization. The Company considers IT’SUGAR’s EBITDA to be an indicator of IT’SUGAR’s operating performance, and is used to measure IT’SUGAR’s ability to service debt, fund capital expenditures and expand its business. EBITDA is also used by companies, lenders, investors and others because it excludes certain items that can vary widely across different industries or among companies within the same industry. EBITDA should not be considered as an alternative to net income as an indicator of IT’SUGAR’s financial performance or as an alternative to cash flow from operating activities as a measure of its liquidity. The Company’s computation of IT’SUGAR’s EBITDA may differ from the methodology utilized by other companies, and investors are cautioned that items excluded from EBITDA are significant components in understanding and assessing IT’SUGAR’s financial performance. 71

Renin Holdings Reconciliation of income (loss) before taxes to EBITDA and Adjusted EBITDA Q2 Q2 YTD YTD (2) (2) (1)(2) (1)(2) (2) 2014 2015 2016 2017 2018 (3) (3) 2018 2019 2018 2019 ($ in thousands) Loss (income) before $ (2,043) (2,058) 857 2,180 2,461 42 15 12 1,071 income taxes Add/Subtract: Interest expense $ 551 406 396 509 638 174 116 340 256 Depreciation and $ 603 546 818 1,713 1,953 495 326 993 731 amortization EBITDA $ (889) (1,106) 2,071 4,402 5,052 711 457 1,345 2,057 Foreign exchange (gain) $ 715 1,038 (219) 193 (68) 37 29 (15) 24 loss Adjusted EBITDA $ (174) (68) 1,852 4,595 4,984 748 486 1,330 2,082 (1) Amounts were adjusted for the adoption of the revenue recognition standard. (2) For the year ended December 31. (3) For the six months ended June 30. Renin’s EBITDA is defined as its earnings, or net income, before taking into account interest expense, income taxes, and depreciation and amortization, including the amortization of product displays provided to customers for marketing purposes that are presented as a reduction of trade sales under GAAP. Renin’s Adjusted EBITDA is defined as EBITDA adjusted for foreign exchange gains and losses, as exchange rates may vary significantly among companies. The Company considers Renin’s EBITDA and Adjusted EBITDA to be an indicator of Renin’s operating performance, and they are used to measure Renin’s ability to service debt, fund capital expenditures and expand its business. EBITDA is also used by companies, lenders, investors and others because it excludes certain items that can vary widely across different industries or among companies within the same industry. The Company considers Renin’s Adjusted EBITDA to be a useful supplemental measure of Renin’s operating performance that facilitates the comparability of historical financial periods. EBITDA and Adjusted EBITDA should not be considered as an alternative to net income as an indicator of Renin’s financial performance or as an alternative to cash flow from operating activities 72 as a measure of its liquidity. The Company’s computation of Renin’s EBITDA and Adjusted EBITDA may differ from the methodology utilized by other companies, and investors are cautioned that items excluded from EBITDA and Adjusted EBITDA are significant components in understanding and assessing Renin’s financial performance.Renin Holdings Reconciliation of income (loss) before taxes to EBITDA and Adjusted EBITDA Q2 Q2 YTD YTD (2) (2) (1)(2) (1)(2) (2) 2014 2015 2016 2017 2018 (3) (3) 2018 2019 2018 2019 ($ in thousands) Loss (income) before $ (2,043) (2,058) 857 2,180 2,461 42 15 12 1,071 income taxes Add/Subtract: Interest expense $ 551 406 396 509 638 174 116 340 256 Depreciation and $ 603 546 818 1,713 1,953 495 326 993 731 amortization EBITDA $ (889) (1,106) 2,071 4,402 5,052 711 457 1,345 2,057 Foreign exchange (gain) $ 715 1,038 (219) 193 (68) 37 29 (15) 24 loss Adjusted EBITDA $ (174) (68) 1,852 4,595 4,984 748 486 1,330 2,082 (1) Amounts were adjusted for the adoption of the revenue recognition standard. (2) For the year ended December 31. (3) For the six months ended June 30. Renin’s EBITDA is defined as its earnings, or net income, before taking into account interest expense, income taxes, and depreciation and amortization, including the amortization of product displays provided to customers for marketing purposes that are presented as a reduction of trade sales under GAAP. Renin’s Adjusted EBITDA is defined as EBITDA adjusted for foreign exchange gains and losses, as exchange rates may vary significantly among companies. The Company considers Renin’s EBITDA and Adjusted EBITDA to be an indicator of Renin’s operating performance, and they are used to measure Renin’s ability to service debt, fund capital expenditures and expand its business. EBITDA is also used by companies, lenders, investors and others because it excludes certain items that can vary widely across different industries or among companies within the same industry. The Company considers Renin’s Adjusted EBITDA to be a useful supplemental measure of Renin’s operating performance that facilitates the comparability of historical financial periods. EBITDA and Adjusted EBITDA should not be considered as an alternative to net income as an indicator of Renin’s financial performance or as an alternative to cash flow from operating activities 72 as a measure of its liquidity. The Company’s computation of Renin’s EBITDA and Adjusted EBITDA may differ from the methodology utilized by other companies, and investors are cautioned that items excluded from EBITDA and Adjusted EBITDA are significant components in understanding and assessing Renin’s financial performance.
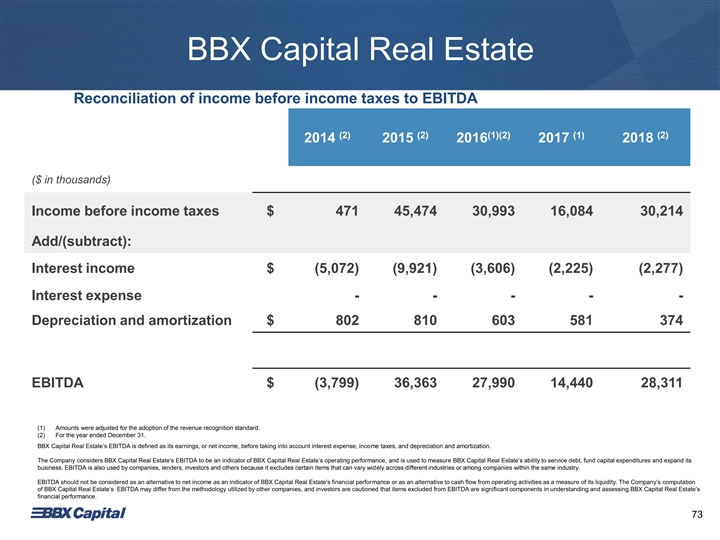
BBX Capital Real Estate Reconciliation of income before income taxes to EBITDA (2) (2) (1)(2) (1) (2) 2014 2015 2016 2017 2018 ($ in thousands) Income before income taxes $ 471 45,474 30,993 16,084 30,214 Add/(subtract): Interest income $ (5,072) (9,921) (3,606) (2,225) (2,277) Interest expense - - - - - Depreciation and amortization $ 802 810 603 581 374 EBITDA $ (3,799) 36,363 27,990 14,440 28,311 (1) Amounts were adjusted for the adoption of the revenue recognition standard. (2) For the year ended December 31. BBX Capital Real Estate’s EBITDA is defined as its earnings, or net income, before taking into account interest expense, income taxes, and depreciation and amortization. The Company considers BBX Capital Real Estate’s EBITDA to be an indicator of BBX Capital Real Estate’s operating performance, and is used to measure BBX Capital Real Estate’s ability to service debt, fund capital expenditures and expand its business. EBITDA is also used by companies, lenders, investors and others because it excludes certain items that can vary widely across different industries or among companies within the same industry. EBITDA should not be considered as an alternative to net income as an indicator of BBX Capital Real Estate’s financial performance or as an alternative to cash flow from operating activities as a measure of its liquidity. The Company’s computation of BBX Capital Real Estate’s EBITDA may differ from the methodology utilized by other companies, and investors are cautioned that items excluded from EBITDA are significant components in understanding and assessing BBX Capital Real Estate’s financial performance. 73BBX Capital Real Estate Reconciliation of income before income taxes to EBITDA (2) (2) (1)(2) (1) (2) 2014 2015 2016 2017 2018 ($ in thousands) Income before income taxes $ 471 45,474 30,993 16,084 30,214 Add/(subtract): Interest income $ (5,072) (9,921) (3,606) (2,225) (2,277) Interest expense - - - - - Depreciation and amortization $ 802 810 603 581 374 EBITDA $ (3,799) 36,363 27,990 14,440 28,311 (1) Amounts were adjusted for the adoption of the revenue recognition standard. (2) For the year ended December 31. BBX Capital Real Estate’s EBITDA is defined as its earnings, or net income, before taking into account interest expense, income taxes, and depreciation and amortization. The Company considers BBX Capital Real Estate’s EBITDA to be an indicator of BBX Capital Real Estate’s operating performance, and is used to measure BBX Capital Real Estate’s ability to service debt, fund capital expenditures and expand its business. EBITDA is also used by companies, lenders, investors and others because it excludes certain items that can vary widely across different industries or among companies within the same industry. EBITDA should not be considered as an alternative to net income as an indicator of BBX Capital Real Estate’s financial performance or as an alternative to cash flow from operating activities as a measure of its liquidity. The Company’s computation of BBX Capital Real Estate’s EBITDA may differ from the methodology utilized by other companies, and investors are cautioned that items excluded from EBITDA are significant components in understanding and assessing BBX Capital Real Estate’s financial performance. 73

BBX Capital Real Estate Reconciliation of income before income taxes to EBITDA (1) (1) Q2 2018 Q2 2019 YTD 2018 YTD 2019 ($ in thousands) Income before income taxes $ 1,625 19,104 13,685 21,527 Add/(subtract): Interest income $ (301) (263) (1,834) (465) Depreciation and amortization $ 101 - 192 93 EBITDA $ 1,425 18,841 12,043 21,155 (1) For the six months ended June 30. BBX Capital Real Estate’s EBITDA is defined as its earnings, or net income, before taking into account interest expense, income taxes, and depreciation and amortization. The Company considers BBX Capital Real Estate’s EBITDA to be an indicator of BBX Capital Real Estate’s operating performance, and is used to measure BBX Capital Real Estate’s ability to service debt, fund capital expenditures and expand its business. EBITDA is also used by companies, lenders, investors and others because it excludes certain items that can vary widely across different industries or among companies within the same industry. EBITDA should not be considered as an alternative to net income as an indicator of BBX Capital Real Estate’s financial performance or as an alternative to cash flow from operating activities as a measure of its liquidity. The Company’s computation of BBX Capital Real Estate’s EBITDA may differ from the methodology utilized by other companies, and investors are cautioned that items excluded from EBITDA are significant components in understanding and assessing BBX Capital Real Estate’s financial performance. 74BBX Capital Real Estate Reconciliation of income before income taxes to EBITDA (1) (1) Q2 2018 Q2 2019 YTD 2018 YTD 2019 ($ in thousands) Income before income taxes $ 1,625 19,104 13,685 21,527 Add/(subtract): Interest income $ (301) (263) (1,834) (465) Depreciation and amortization $ 101 - 192 93 EBITDA $ 1,425 18,841 12,043 21,155 (1) For the six months ended June 30. BBX Capital Real Estate’s EBITDA is defined as its earnings, or net income, before taking into account interest expense, income taxes, and depreciation and amortization. The Company considers BBX Capital Real Estate’s EBITDA to be an indicator of BBX Capital Real Estate’s operating performance, and is used to measure BBX Capital Real Estate’s ability to service debt, fund capital expenditures and expand its business. EBITDA is also used by companies, lenders, investors and others because it excludes certain items that can vary widely across different industries or among companies within the same industry. EBITDA should not be considered as an alternative to net income as an indicator of BBX Capital Real Estate’s financial performance or as an alternative to cash flow from operating activities as a measure of its liquidity. The Company’s computation of BBX Capital Real Estate’s EBITDA may differ from the methodology utilized by other companies, and investors are cautioned that items excluded from EBITDA are significant components in understanding and assessing BBX Capital Real Estate’s financial performance. 74

(4) Portfolio of Real Estate Projects Carrying Estimated Expected Remaining Start Amount of Future Asset Name Project Size Status Exit/Sales Investment (2) (3) Date Investment Proceeds (3) Date (in millions) (in millions) (in millions) Multifamily Apartment Developments (1) Altis Boca Raton 398 Apartments Completed / Stabilized 2015 2019 $1.9 - $2.7 - $3.0 (1) Altis at Bonterra 314 Apartments Completed / Stabilized 2015 2019 $17.3 - $42.4 - $47.1 (1) Altis Pembroke Gardens Completed / Stabilized 2015 2019 $1.3 - $1.2 - $1.3 280 Apartments (1) Altis Wiregrass 392 Apartments Completed / Under Lease Up 2016 2020 $1.8 - $2.0 - $2.2 (1) Altis at Grand Central Under Development 2017 2021 $2.6 - $3.4 - $3.8 314 Apartments (1) Altis at Promenade 338 Apartments Under Development 2017 2021 $2.2 - $3.3 – $3.7 (1) Altis Ludlam 310 Apartments Pre-Development 2018 TBD $0.9 TBD TBD (1) Altis Preserve 350 Apartments Under Development 2018 2022 $0.7 TBD $1.8 - $3.0 Altis Little Havana 224 Apartments Under Development 2019 2027 $0.8 - $3.6 - $4.0 (1) These assets represent investments in real estate ventures that are not consolidated into our financial statements. (2) For our consolidated investments, the carrying amount of our investment represents the carrying amount of the real estate asset associated with the applicable project, and for our other investments, which are unconsolidated real estate joint ventures, the carrying amount of our investment represents our investment in the applicable joint venture recognized under the equity method of accounting, as of June 30, 2019. (3) The above information under the headings “Expected Exit/Sales Date” and “Estimated Future Proceeds” is forward looking and inherently uncertain. The information is based on our current assumptions and expectations which are largely based on factors not within our control. These factors include, but are not limited to, economic conditions generally and conditions that affect the project in particular, the performance of our joint venture partners in managing the projects, potential overruns in development and operating costs, tenant demand for retail, storage and multifamily rental units, buyer demand for single family housing, and the values of the underlying real estate upon sale or exit. Accordingly, there is no assurance that we will achieve results consistent with this forward looking information, and our actual results could differ materially from the information provided. For a discussion of other factors that may impact our actual results, and additional risks and uncertainty related to BBX Capital Real Estate’s projects, see the risks, uncertainties and cautionary factors discussed in our 2018 Annual Report on Form 10-K. (4) As of June 30, 2019. See “Listing of Completed Real Estate Investments and Results since 2012” on Page 41. 75(4) Portfolio of Real Estate Projects Carrying Estimated Expected Remaining Start Amount of Future Asset Name Project Size Status Exit/Sales Investment (2) (3) Date Investment Proceeds (3) Date (in millions) (in millions) (in millions) Multifamily Apartment Developments (1) Altis Boca Raton 398 Apartments Completed / Stabilized 2015 2019 $1.9 - $2.7 - $3.0 (1) Altis at Bonterra 314 Apartments Completed / Stabilized 2015 2019 $17.3 - $42.4 - $47.1 (1) Altis Pembroke Gardens Completed / Stabilized 2015 2019 $1.3 - $1.2 - $1.3 280 Apartments (1) Altis Wiregrass 392 Apartments Completed / Under Lease Up 2016 2020 $1.8 - $2.0 - $2.2 (1) Altis at Grand Central Under Development 2017 2021 $2.6 - $3.4 - $3.8 314 Apartments (1) Altis at Promenade 338 Apartments Under Development 2017 2021 $2.2 - $3.3 – $3.7 (1) Altis Ludlam 310 Apartments Pre-Development 2018 TBD $0.9 TBD TBD (1) Altis Preserve 350 Apartments Under Development 2018 2022 $0.7 TBD $1.8 - $3.0 Altis Little Havana 224 Apartments Under Development 2019 2027 $0.8 - $3.6 - $4.0 (1) These assets represent investments in real estate ventures that are not consolidated into our financial statements. (2) For our consolidated investments, the carrying amount of our investment represents the carrying amount of the real estate asset associated with the applicable project, and for our other investments, which are unconsolidated real estate joint ventures, the carrying amount of our investment represents our investment in the applicable joint venture recognized under the equity method of accounting, as of June 30, 2019. (3) The above information under the headings “Expected Exit/Sales Date” and “Estimated Future Proceeds” is forward looking and inherently uncertain. The information is based on our current assumptions and expectations which are largely based on factors not within our control. These factors include, but are not limited to, economic conditions generally and conditions that affect the project in particular, the performance of our joint venture partners in managing the projects, potential overruns in development and operating costs, tenant demand for retail, storage and multifamily rental units, buyer demand for single family housing, and the values of the underlying real estate upon sale or exit. Accordingly, there is no assurance that we will achieve results consistent with this forward looking information, and our actual results could differ materially from the information provided. For a discussion of other factors that may impact our actual results, and additional risks and uncertainty related to BBX Capital Real Estate’s projects, see the risks, uncertainties and cautionary factors discussed in our 2018 Annual Report on Form 10-K. (4) As of June 30, 2019. See “Listing of Completed Real Estate Investments and Results since 2012” on Page 41. 75

Portfolio of Real Estate Projects Carrying Estimated Remaining Expected Exit/ Amount of Future Asset Name Project Size Status Start Date Investment (3) (2) (3) Sales Date Investment Proceeds (in millions) (in millions) (in millions) Single Family Developments (1) Miramar CC Homes 193 Homes Predevelopment 2015 TBD $4.3 TBD TBD Under Development Lots under contract, 491 (4) Beacon Lake 1,476 Lots 2016 2018 - 2025 $34.6 TBD TBD Lots closed, 302 Under Development Units under contract, 124 Chapel Grove 125 Townhomes 2017 2018 - 2019 $1.2 - $2.1 - $2.4 (1) Units closed, 40 Townhomes Sky Cove 204 Homes Under Development 2019 2022 $4.2 - $5.3 - $5.9 Retail Developments Gardens on Millenia–Land 1 Outparcel Completed – Land Lease 2013 TBD $1.3 - $1.8 - $2.0 (1) These assets represent investments in real estate ventures that are not consolidated into our financial statements. (2) For our consolidated investments, the carrying amount of our investment represents the carrying amount of the real estate asset associated with the applicable project, and for our other investments, which are unconsolidated real estate joint ventures, the carrying amount of our investment represents our investment in the applicable joint venture recognized under the equity method of accounting, as of June 30, 2019. (3) The above information under the headings “Expected Exit/Sales Date” and “Estimated Future Proceeds” is forward looking and inherently uncertain. The information is based on our current assumptions and expectations which are largely based on factors not within our control. These factors include, but are not limited to, economic conditions generally and conditions that affect the project in particular, the performance of our joint venture partners in managing the projects, potential overruns in development and operating costs, tenant demand for retail, storage and multifamily rental units, buyer demand for single family housing, and the values of the underlying real estate upon sale or exit. Accordingly, there is no assurance that we will achieve results consistent with this forward looking information, and our actual results could differ materially from the information provided. For a discussion of other factors that may impact our actual results, and additional risks and uncertainty related to BBX Capital Real Estate’s projects, see the risks, uncertainties and cautionary factors discussed in our 2018 Annual Report on Form 10-K. (4) A portion of the carrying amount of the Beacon Lake investment was funded by Community Development Bonds. A pro rata portion of the Community Development Bond obligations attaches to each parcel in the development and BBX Capital will be responsible for making payments from time to time subject to future sale of the parcels. 76Portfolio of Real Estate Projects Carrying Estimated Remaining Expected Exit/ Amount of Future Asset Name Project Size Status Start Date Investment (3) (2) (3) Sales Date Investment Proceeds (in millions) (in millions) (in millions) Single Family Developments (1) Miramar CC Homes 193 Homes Predevelopment 2015 TBD $4.3 TBD TBD Under Development Lots under contract, 491 (4) Beacon Lake 1,476 Lots 2016 2018 - 2025 $34.6 TBD TBD Lots closed, 302 Under Development Units under contract, 124 Chapel Grove 125 Townhomes 2017 2018 - 2019 $1.2 - $2.1 - $2.4 (1) Units closed, 40 Townhomes Sky Cove 204 Homes Under Development 2019 2022 $4.2 - $5.3 - $5.9 Retail Developments Gardens on Millenia–Land 1 Outparcel Completed – Land Lease 2013 TBD $1.3 - $1.8 - $2.0 (1) These assets represent investments in real estate ventures that are not consolidated into our financial statements. (2) For our consolidated investments, the carrying amount of our investment represents the carrying amount of the real estate asset associated with the applicable project, and for our other investments, which are unconsolidated real estate joint ventures, the carrying amount of our investment represents our investment in the applicable joint venture recognized under the equity method of accounting, as of June 30, 2019. (3) The above information under the headings “Expected Exit/Sales Date” and “Estimated Future Proceeds” is forward looking and inherently uncertain. The information is based on our current assumptions and expectations which are largely based on factors not within our control. These factors include, but are not limited to, economic conditions generally and conditions that affect the project in particular, the performance of our joint venture partners in managing the projects, potential overruns in development and operating costs, tenant demand for retail, storage and multifamily rental units, buyer demand for single family housing, and the values of the underlying real estate upon sale or exit. Accordingly, there is no assurance that we will achieve results consistent with this forward looking information, and our actual results could differ materially from the information provided. For a discussion of other factors that may impact our actual results, and additional risks and uncertainty related to BBX Capital Real Estate’s projects, see the risks, uncertainties and cautionary factors discussed in our 2018 Annual Report on Form 10-K. (4) A portion of the carrying amount of the Beacon Lake investment was funded by Community Development Bonds. A pro rata portion of the Community Development Bond obligations attaches to each parcel in the development and BBX Capital will be responsible for making payments from time to time subject to future sale of the parcels. 76
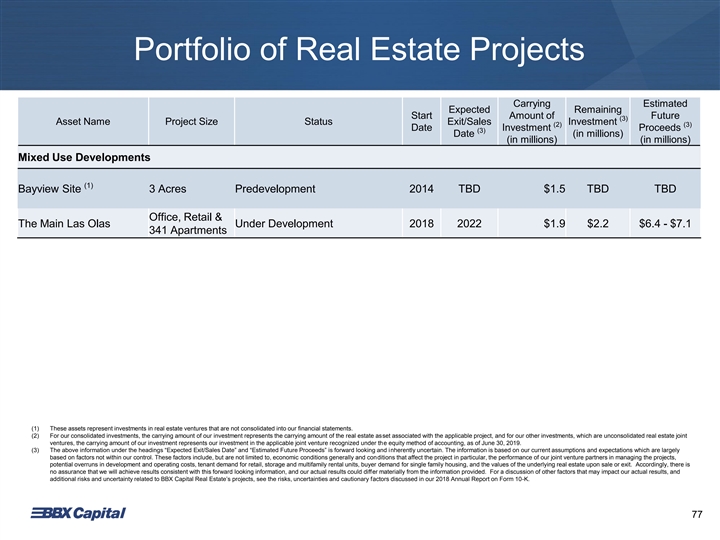
Portfolio of Real Estate Projects Carrying Estimated Expected Remaining Start Amount of Future (3) Asset Name Project Size Status Exit/Sales Investment (2) (3) Date Investment Proceeds (3) Date (in millions) (in millions) (in millions) Mixed Use Developments (1) Bayview Site 3 Acres Predevelopment 2014 TBD $1.5 TBD TBD Office, Retail & The Main Las Olas Under Development 2018 2022 $1.9 $2.2 $6.4 - $7.1 341 Apartments (1) These assets represent investments in real estate ventures that are not consolidated into our financial statements. (2) For our consolidated investments, the carrying amount of our investment represents the carrying amount of the real estate asset associated with the applicable project, and for our other investments, which are unconsolidated real estate joint ventures, the carrying amount of our investment represents our investment in the applicable joint venture recognized under the equity method of accounting, as of June 30, 2019. (3) The above information under the headings “Expected Exit/Sales Date” and “Estimated Future Proceeds” is forward looking and inherently uncertain. The information is based on our current assumptions and expectations which are largely based on factors not within our control. These factors include, but are not limited to, economic conditions generally and conditions that affect the project in particular, the performance of our joint venture partners in managing the projects, potential overruns in development and operating costs, tenant demand for retail, storage and multifamily rental units, buyer demand for single family housing, and the values of the underlying real estate upon sale or exit. Accordingly, there is no assurance that we will achieve results consistent with this forward looking information, and our actual results could differ materially from the information provided. For a discussion of other factors that may impact our actual results, and additional risks and uncertainty related to BBX Capital Real Estate’s projects, see the risks, uncertainties and cautionary factors discussed in our 2018 Annual Report on Form 10-K. 77Portfolio of Real Estate Projects Carrying Estimated Expected Remaining Start Amount of Future (3) Asset Name Project Size Status Exit/Sales Investment (2) (3) Date Investment Proceeds (3) Date (in millions) (in millions) (in millions) Mixed Use Developments (1) Bayview Site 3 Acres Predevelopment 2014 TBD $1.5 TBD TBD Office, Retail & The Main Las Olas Under Development 2018 2022 $1.9 $2.2 $6.4 - $7.1 341 Apartments (1) These assets represent investments in real estate ventures that are not consolidated into our financial statements. (2) For our consolidated investments, the carrying amount of our investment represents the carrying amount of the real estate asset associated with the applicable project, and for our other investments, which are unconsolidated real estate joint ventures, the carrying amount of our investment represents our investment in the applicable joint venture recognized under the equity method of accounting, as of June 30, 2019. (3) The above information under the headings “Expected Exit/Sales Date” and “Estimated Future Proceeds” is forward looking and inherently uncertain. The information is based on our current assumptions and expectations which are largely based on factors not within our control. These factors include, but are not limited to, economic conditions generally and conditions that affect the project in particular, the performance of our joint venture partners in managing the projects, potential overruns in development and operating costs, tenant demand for retail, storage and multifamily rental units, buyer demand for single family housing, and the values of the underlying real estate upon sale or exit. Accordingly, there is no assurance that we will achieve results consistent with this forward looking information, and our actual results could differ materially from the information provided. For a discussion of other factors that may impact our actual results, and additional risks and uncertainty related to BBX Capital Real Estate’s projects, see the risks, uncertainties and cautionary factors discussed in our 2018 Annual Report on Form 10-K. 77

Examples of Altman Companies Apartment Developments COMMUNITIES (1) Altís Boca Raton | BOCA RATON, FL Altís Grand Central | TAMPA, FL Altís Wiregrass Ranch | TAMPA, FL Altís at Kendall Square| MIAMI, FL (1) Conceptual Rendering 78Examples of Altman Companies Apartment Developments COMMUNITIES (1) Altís Boca Raton | BOCA RATON, FL Altís Grand Central | TAMPA, FL Altís Wiregrass Ranch | TAMPA, FL Altís at Kendall Square| MIAMI, FL (1) Conceptual Rendering 78

Examples of Altman Companies Apartment Developments COMMUNITIES (1) Altís Pembroke Gardens | PEMBROKE PINES, FL Altís Shingle Creek | ORLANDO, FL Altís Bonterra | HIALEAH, FL (1) Altís Lakeline |, AUSTIN TEXAS (1) Conceptual Renderings 79Examples of Altman Companies Apartment Developments COMMUNITIES (1) Altís Pembroke Gardens | PEMBROKE PINES, FL Altís Shingle Creek | ORLANDO, FL Altís Bonterra | HIALEAH, FL (1) Altís Lakeline |, AUSTIN TEXAS (1) Conceptual Renderings 79

Examples of Altman Companies Apartment Developments APARTMENT INTERIORS 80 ALTIS SHINGLE CREEK | ORLANDO, FL Examples of Altman Companies Apartment Developments APARTMENT INTERIORS 80 ALTIS SHINGLE CREEK | ORLANDO, FL

Examples of Altman Companies Apartment Developments APARTMENT INTERIORS 81 ALTIS WIREGRASS | TAMPA FL Examples of Altman Companies Apartment Developments APARTMENT INTERIORS 81 ALTIS WIREGRASS | TAMPA FL

Examples of Altman Companies Apartment Developments APARTMENT INTERIORS 82 ALTIS BOCA RATON| BOCA RATON, FL Examples of Altman Companies Apartment Developments APARTMENT INTERIORS 82 ALTIS BOCA RATON| BOCA RATON, FL

Examples of Altman Companies Apartment Developments AMENITIES | INTERIOR 83 ALTIS AT BONTERRA, CLUBHOUSE| HIALLEAH, FL Examples of Altman Companies Apartment Developments AMENITIES | INTERIOR 83 ALTIS AT BONTERRA, CLUBHOUSE| HIALLEAH, FL

Examples of Altman Companies Apartment Developments AMENITIES | INTERIOR 84 ALTIS SAND LAKE, CLUBHOUSE| ORLANDO, FL Examples of Altman Companies Apartment Developments AMENITIES | INTERIOR 84 ALTIS SAND LAKE, CLUBHOUSE| ORLANDO, FL

Examples of Altman Companies Apartment Developments AMENITIES | INTERIOR 85 ALTIS AT KENDALL SQUARE CLUBHOUSE| MIAMI, FL Examples of Altman Companies Apartment Developments AMENITIES | INTERIOR 85 ALTIS AT KENDALL SQUARE CLUBHOUSE| MIAMI, FL

Examples of Altman Companies Apartment Developments AMENITIES | EXTERIOR 86 ALTIS AT SHERIDAN VILLAGE| PEMBROKE PINES, FL Examples of Altman Companies Apartment Developments AMENITIES | EXTERIOR 86 ALTIS AT SHERIDAN VILLAGE| PEMBROKE PINES, FL

Examples of Altman Companies Apartment Developments AMENITIES | EXTERIOR 87 ALTIS SAND LAKE| ORLANDO, FL Examples of Altman Companies Apartment Developments AMENITIES | EXTERIOR 87 ALTIS SAND LAKE| ORLANDO, FL

Examples of Altman Companies Apartment Developments AMENITIES | EXTERIOR 88 ALTIS BOCA RATON| BOCA RATON, FL Examples of Altman Companies Apartment Developments AMENITIES | EXTERIOR 88 ALTIS BOCA RATON| BOCA RATON, FL

CONSOLIDATED STATEMENTS OF OPERATIONS AND COMPREHENSIVE INCOME (In thousands) For the Three Months Ended For the Six Months Ended June 30, June 30, 2019 2018 2019 2018 Revenue: Gross sales of VOIs $ 80,221 $ 82,027 $ 143,105 $ 146,187 Estimated uncollectible VOI notes receivable (11,919) (13,454) (23,072) ( 21,473) Sales of VOIs 68,302 68,573 120,033 124,714 Fee-based sales commission revenue 55,343 60,086 100,555 105,940 Other fee-based services revenue 30,703 30,391 60,271 58,415 Cost reimbursements 17,358 14,059 37,594 30,260 Interest income 21,875 21,118 43,883 42,240 Other income, net 1,993 710 2 ,082 891 Total revenue 195,574 194,937 364,418 362,460 Costs and expenses: Cost of VOIs sold 10,572 6,789 14,420 8,601 Cost of other fee-based services 19,924 16,634 42,792 34,045 Cost reimbursements 17,358 14,059 37,594 30,260 Selling, general and administrative expenses 147,668 109,580 237,882 203,129 Interest expense 10,061 8,495 19,567 16,262 Total costs and expenses 205,583 155,557 352,255 292,297 (Loss) income before non-controlling interest and (benefit) provision for income taxes (10,009) 39,380 12,163 70,163 (Benefit) provision for income taxes (3,957) 9,353 1,346 16,554 Net (loss) income (6,052) 3 0,027 10,817 53,609 Less: Net income attributable to non-controlling interest 5,131 3,317 6,847 5,924 Net (loss) income attributable to Bluegreen Vacations Corporation shareholders $ ( 11,183) $ 2 6,710 $ 3,970 $ 47,685 Comprehensive (loss) income attributable to Bluegreen Vacations Corporation shareholders $ (11,183) $ 2 6,710 $ 3 ,970 $ 47,685 89CONSOLIDATED STATEMENTS OF OPERATIONS AND COMPREHENSIVE INCOME (In thousands) For the Three Months Ended For the Six Months Ended June 30, June 30, 2019 2018 2019 2018 Revenue: Gross sales of VOIs $ 80,221 $ 82,027 $ 143,105 $ 146,187 Estimated uncollectible VOI notes receivable (11,919) (13,454) (23,072) ( 21,473) Sales of VOIs 68,302 68,573 120,033 124,714 Fee-based sales commission revenue 55,343 60,086 100,555 105,940 Other fee-based services revenue 30,703 30,391 60,271 58,415 Cost reimbursements 17,358 14,059 37,594 30,260 Interest income 21,875 21,118 43,883 42,240 Other income, net 1,993 710 2 ,082 891 Total revenue 195,574 194,937 364,418 362,460 Costs and expenses: Cost of VOIs sold 10,572 6,789 14,420 8,601 Cost of other fee-based services 19,924 16,634 42,792 34,045 Cost reimbursements 17,358 14,059 37,594 30,260 Selling, general and administrative expenses 147,668 109,580 237,882 203,129 Interest expense 10,061 8,495 19,567 16,262 Total costs and expenses 205,583 155,557 352,255 292,297 (Loss) income before non-controlling interest and (benefit) provision for income taxes (10,009) 39,380 12,163 70,163 (Benefit) provision for income taxes (3,957) 9,353 1,346 16,554 Net (loss) income (6,052) 3 0,027 10,817 53,609 Less: Net income attributable to non-controlling interest 5,131 3,317 6,847 5,924 Net (loss) income attributable to Bluegreen Vacations Corporation shareholders $ ( 11,183) $ 2 6,710 $ 3,970 $ 47,685 Comprehensive (loss) income attributable to Bluegreen Vacations Corporation shareholders $ (11,183) $ 2 6,710 $ 3 ,970 $ 47,685 89

CONSOLIDATED STATEMENTS OF OPERATIONS AND COMPREHENSIVE INCOME (In thousands, except share and per share data) For the Three Months Ended For the Six Months Ended June 30, June 30, 2019 2018 2019 2018 (Loss) Earnings per share attributable to Bluegreen Vacations Corporation shareholders - Basic and diluted $ ( 0.15) $ 0 .36 $ 0.05 $ 0.64 Weighted average number of common shares outstanding: Basic and diluted 7 4,446 7 4,734 7 4,446 74,734 Cash dividends declared per share $ 0 .17 $ 0 .15 $ 0.34 $ 0 .30 90CONSOLIDATED STATEMENTS OF OPERATIONS AND COMPREHENSIVE INCOME (In thousands, except share and per share data) For the Three Months Ended For the Six Months Ended June 30, June 30, 2019 2018 2019 2018 (Loss) Earnings per share attributable to Bluegreen Vacations Corporation shareholders - Basic and diluted $ ( 0.15) $ 0 .36 $ 0.05 $ 0.64 Weighted average number of common shares outstanding: Basic and diluted 7 4,446 7 4,734 7 4,446 74,734 Cash dividends declared per share $ 0 .17 $ 0 ..15 $ 0.34 $ 0 .30 90

CONSOLIDATED STATEMENTS OF CASH FLOWS For the Six Months Ended June 30, (In thousands) 2019 2018 Operating activities: Net income $ 1 0,817 $ 53,609 Adjustments to reconcile net income to net cash provided by operating activities: Depreciation and amortization 9 ,056 7 ,597 Gain on disposal of property and equipment (1,945) — Provision for loan losses 23,055 21,447 (Benefit) provision for deferred income taxes (10,041) 2,215 Changes in operating assets and liabilities: Notes receivable (24,742) ( 24,236) Prepaid expenses and other assets (11,674) (16,122) Inventory ( 8,071) ( 25,770) Accounts payable, accrued liabilities and other, and deferred income 25,157 4,475 Net cash provided by operating activities 1 1,612 2 3,215 Investing activities: Purchases of property and equipment (14,516) (15,105) Proceeds from sale of property and equipment 1 ,820 — Net cash used in investing activities ( 12,696) (15,105) Financing activities: Proceeds from borrowings collateralized by notes receivable 45,095 73,706 Payments on borrowings collateralized by notes receivable (66,769) (68,531) Proceeds from borrowings collateralized by line-of-credit facilities and notes payable 2 0,386 50,042 Payments under line-of-credit facilities and notes payable (17,407) (24,671) Payments of debt issuance costs (132) (187) Dividends paid (25,312) (22,420) Net cash (used in) provided by financing activities (44,139) 7,939 Net (decrease) increase in cash and cash equivalents and restricted cash ( 45,223) 1 6,049 Cash, cash equivalents and restricted cash at beginning of period 273,134 243,349 Cash, cash equivalents and restricted cash at end of period $ 227,911 $ 259,398 Supplemental schedule of operating cash flow information: Interest paid, net of amounts capitalized $ 16,871 $ 14,250 Income taxes paid $ 14,357 $ 14,618 Supplemental schedule of non-cash investing and financing activities: Acquisition of inventory, property, and equipment for notes payable $ — $ 24,258 91CONSOLIDATED STATEMENTS OF CASH FLOWS For the Six Months Ended June 30, (In thousands) 2019 2018 Operating activities: Net income $ 1 0,817 $ 53,609 Adjustments to reconcile net income to net cash provided by operating activities: Depreciation and amortization 9 ,056 7 ,597 Gain on disposal of property and equipment (1,945) — Provision for loan losses 23,055 21,447 (Benefit) provision for deferred income taxes (10,041) 2,215 Changes in operating assets and liabilities: Notes receivable (24,742) ( 24,236) Prepaid expenses and other assets (11,674) (16,122) Inventory ( 8,071) ( 25,770) Accounts payable, accrued liabilities and other, and deferred income 25,157 4,475 Net cash provided by operating activities 1 1,612 2 3,215 Investing activities: Purchases of property and equipment (14,516) (15,105) Proceeds from sale of property and equipment 1 ,820 — Net cash used in investing activities ( 12,696) (15,105) Financing activities: Proceeds from borrowings collateralized by notes receivable 45,095 73,706 Payments on borrowings collateralized by notes receivable (66,769) (68,531) Proceeds from borrowings collateralized by line-of-credit facilities and notes payable 2 0,386 50,042 Payments under line-of-credit facilities and notes payable (17,407) (24,671) Payments of debt issuance costs (132) (187) Dividends paid (25,312) (22,420) Net cash (used in) provided by financing activities (44,139) 7,939 Net (decrease) increase in cash and cash equivalents and restricted cash ( 45,223) 1 6,049 Cash, cash equivalents and restricted cash at beginning of period 273,134 243,349 Cash, cash equivalents and restricted cash at end of period $ 227,911 $ 259,398 Supplemental schedule of operating cash flow information: Interest paid, net of amounts capitalized $ 16,871 $ 14,250 Income taxes paid $ 14,357 $ 14,618 Supplemental schedule of non-cash investing and financing activities: Acquisition of inventory, property, and equipment for notes payable $ — $ 24,258 91

CONSOLIDATED BALANCE SHEETS (In thousands, except share and per share data) June 30, December 31, 2019 2018 ASSETS Cash and cash equivalents $ 180,166 $ 219,408 Restricted cash ($19,018 and $28,400 in VIEs at June 30, 2019 and December 31, 2018, respectively) 47,745 53,726 Notes receivable, net ($308,042 and $341,975 in VIEs at June 30, 2019 and December 31, 2018, respectively) 440,854 439,167 Inventory 342,220 334,149 Prepaid expenses 14,946 10,097 Other assets 57,970 49,796 Operating lease assets 23,395 — Intangible assets, net 61,556 61,845 Loan to related party 80,000 80,000 Property and equipment, net 102,361 98,279 Total assets $ 1,351,213 $ 1,346,467 LIABILITIES AND SHAREHOLDERS' EQUITY Liabilities Accounts payable $ 18,270 $ 19,515 Accrued liabilities and other 102,183 80,364 Operating lease liabilities 24,584 — Deferred income 17,668 16,522 Deferred income taxes 81,015 91,056 Receivable-backed notes payable - recourse 86,820 76,674 Receivable-backed notes payable - non-recourse (in VIEs) 351,316 382,257 Lines-of-credit and notes payable 136,796 133,391 Junior subordinated debentures 71,691 71,323 Total liabilities 890,343 871,102 Commitments and Contingencies Shareholders' Equity Common stock, $.01 par value, 100,000,000 shares authorized; 74,445,923 shares issued and outstanding at June 30, 2019 and December 31, 2018 744 744 Additional paid-in capital 270,369 270,369 Retained earnings 137,299 158,641 Total Bluegreen Vacations Corporation shareholders' equity 408,412 429,754 Non-controlling interest 52,458 45,611 Total shareholders' equity 460,870 475,365 Total liabilities and shareholders' equity $ 1 ,351,213 $ 1,346,467 92CONSOLIDATED BALANCE SHEETS (In thousands, except share and per share data) June 30, December 31, 2019 2018 ASSETS Cash and cash equivalents $ 180,166 $ 219,408 Restricted cash ($19,018 and $28,400 in VIEs at June 30, 2019 and December 31, 2018, respectively) 47,745 53,726 Notes receivable, net ($308,042 and $341,975 in VIEs at June 30, 2019 and December 31, 2018, respectively) 440,854 439,167 Inventory 342,220 334,149 Prepaid expenses 14,946 10,097 Other assets 57,970 49,796 Operating lease assets 23,395 — Intangible assets, net 61,556 61,845 Loan to related party 80,000 80,000 Property and equipment, net 102,361 98,279 Total assets $ 1,351,213 $ 1,346,467 LIABILITIES AND SHAREHOLDERS' EQUITY Liabilities Accounts payable $ 18,270 $ 19,515 Accrued liabilities and other 102,183 80,364 Operating lease liabilities 24,584 — Deferred income 17,668 16,522 Deferred income taxes 81,015 91,056 Receivable-backed notes payable - recourse 86,820 76,674 Receivable-backed notes payable - non-recourse (in VIEs) 351,316 382,257 Lines-of-credit and notes payable 136,796 133,391 Junior subordinated debentures 71,691 71,323 Total liabilities 890,343 871,102 Commitments and Contingencies Shareholders' Equity Common stock, $.01 par value, 100,000,000 shares authorized; 74,445,923 shares issued and outstanding at June 30, 2019 and December 31, 2018 744 744 Additional paid-in capital 270,369 270,369 Retained earnings 137,299 158,641 Total Bluegreen Vacations Corporation shareholders' equity 408,412 429,754 Non-controlling interest 52,458 45,611 Total shareholders' equity 460,870 475,365 Total liabilities and shareholders' equity $ 1 ,351,213 $ 1,346,467 92
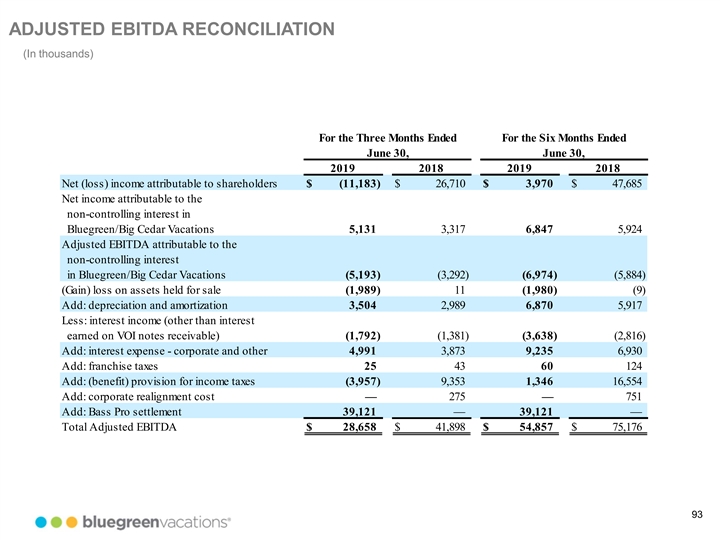
ADJUSTED EBITDA RECONCILIATION (In thousands) For the Three Months Ended For the Six Months Ended June 30, June 30, 2019 2018 2019 2018 Net (loss) income attributable to shareholders $ (11,183) $ 26,710 $ 3,970 $ 47,685 Net income attributable to the non-controlling interest in Bluegreen/Big Cedar Vacations 5,131 3,317 6,847 5,924 Adjusted EBITDA attributable to the non-controlling interest in Bluegreen/Big Cedar Vacations (5,193) ( 3,292) (6,974) ( 5,884) (Gain) loss on assets held for sale (1,989) 11 (1,980) ( 9) Add: depreciation and amortization 3,504 2,989 6,870 5,917 Less: interest income (other than interest earned on VOI notes receivable) (1,792) (1,381) (3,638) ( 2,816) Add: interest expense - corporate and other 4,991 3,873 9,235 6,930 Add: franchise taxes 25 43 60 124 Add: (benefit) provision for income taxes (3,957) 9,353 1,346 16,554 Add: corporate realignment cost — 275 — 751 Add: Bass Pro settlement 39,121 — 39,121 — Total Adjusted EBITDA $ 28,658 $ 41,898 $ 54,857 $ 75,176 93ADJUSTED EBITDA RECONCILIATION (In thousands) For the Three Months Ended For the Six Months Ended June 30, June 30, 2019 2018 2019 2018 Net (loss) income attributable to shareholders $ (11,183) $ 26,710 $ 3,970 $ 47,685 Net income attributable to the non-controlling interest in Bluegreen/Big Cedar Vacations 5,131 3,317 6,847 5,924 Adjusted EBITDA attributable to the non-controlling interest in Bluegreen/Big Cedar Vacations (5,193) ( 3,292) (6,974) ( 5,884) (Gain) loss on assets held for sale (1,989) 11 (1,980) ( 9) Add: depreciation and amortization 3,504 2,989 6,870 5,917 Less: interest income (other than interest earned on VOI notes receivable) (1,792) (1,381) (3,638) ( 2,816) Add: interest expense - corporate and other 4,991 3,873 9,235 6,930 Add: franchise taxes 25 43 60 124 Add: (benefit) provision for income taxes (3,957) 9,353 1,346 16,554 Add: corporate realignment cost — 275 — 751 Add: Bass Pro settlement 39,121 — 39,121 — Total Adjusted EBITDA $ 28,658 $ 41,898 $ 54,857 $ 75,176 93
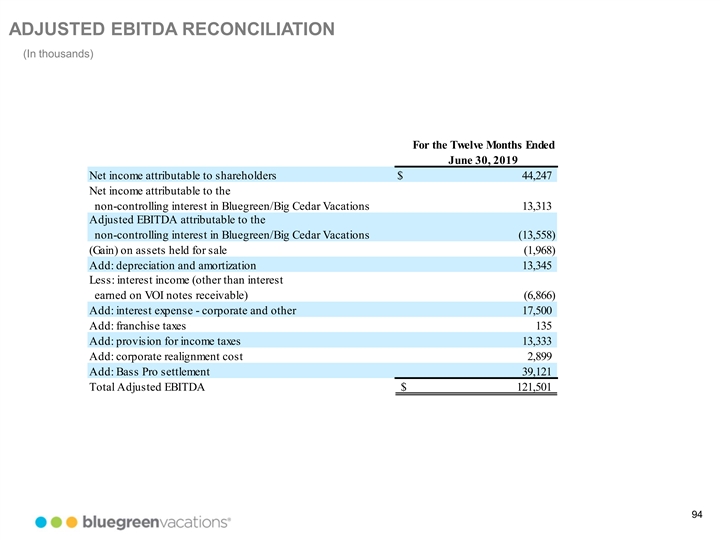
ADJUSTED EBITDA RECONCILIATION (In thousands) For the Twelve Months Ended June 30, 2019 Net income attributable to shareholders $ 4 4,247 Net income attributable to the non-controlling interest in Bluegreen/Big Cedar Vacations 13,313 Adjusted EBITDA attributable to the non-controlling interest in Bluegreen/Big Cedar Vacations (13,558) (Gain) on assets held for sale (1,968) Add: depreciation and amortization 1 3,345 Less: interest income (other than interest earned on VOI notes receivable) (6,866) Add: interest expense - corporate and other 17,500 Add: franchise taxes 135 Add: provision for income taxes 1 3,333 Add: corporate realignment cost 2 ,899 Add: Bass Pro settlement 3 9,121 Total Adjusted EBITDA $ 121,501 94ADJUSTED EBITDA RECONCILIATION (In thousands) For the Twelve Months Ended June 30, 2019 Net income attributable to shareholders $ 4 4,247 Net income attributable to the non-controlling interest in Bluegreen/Big Cedar Vacations 13,313 Adjusted EBITDA attributable to the non-controlling interest in Bluegreen/Big Cedar Vacations (13,558) (Gain) on assets held for sale (1,968) Add: depreciation and amortization 1 3,345 Less: interest income (other than interest earned on VOI notes receivable) (6,866) Add: interest expense - corporate and other 17,500 Add: franchise taxes 135 Add: provision for income taxes 1 3,333 Add: corporate realignment cost 2 ,899 Add: Bass Pro settlement 3 9,121 Total Adjusted EBITDA $ 121,501 94

OTHER FINANCIAL DATA (In thousands) For the Three Months Ended For the Six Months Ended June 30, June 30, 2019 2018 2019 2018 Financing Interest Income $ 1 9,925 $ 1 9,658 $ 3 9,942 $ 3 9,272 Financing Interest Expense (5,070) (4,622) (10,332) ( 9,332) Non-Financing Interest Income 1,950 1 ,460 3 ,941 2,968 Non-Financing Interest Expense (4,991) ( 3,873) (9,235) ( 6,930) Mortgage Servicing Income 1 ,544 1 ,471 3 ,034 2 ,916 Mortgage Servicing Expense (1,174) (1,347) (2,554) (2,933) Title Revenue 3 ,040 3,175 5 ,768 5 ,863 Title Expense (1,099) ( 1,115) (2,309) ( 2,357) 95OTHER FINANCIAL DATA (In thousands) For the Three Months Ended For the Six Months Ended June 30, June 30, 2019 2018 2019 2018 Financing Interest Income $ 1 9,925 $ 1 9,658 $ 3 9,942 $ 3 9,272 Financing Interest Expense (5,070) (4,622) (10,332) ( 9,332) Non-Financing Interest Income 1,950 1 ,460 3 ,941 2,968 Non-Financing Interest Expense (4,991) ( 3,873) (9,235) ( 6,930) Mortgage Servicing Income 1 ,544 1 ,471 3 ,034 2 ,916 Mortgage Servicing Expense (1,174) (1,347) (2,554) (2,933) Title Revenue 3 ,040 3,175 5 ,768 5 ,863 Title Expense (1,099) ( 1,115) (2,309) ( 2,357) 95