UNITED STATES
SECURITIES AND EXCHANGE COMMISSION
Washington, D.C. 20549
FORM 10-K
(Mark One)
| | x | ANNUAL REPORT PURSUANT TO SECTION 13 OR 15(d) OF THE SECURITIES EXCHANGE ACT OF 1934 |
For the Fiscal Year Ended December 31, 2008
OR
| | ¨ | TRANSITION REPORT PURSUANT TO SECTION 13 OR 15(d) OF THE SECURITIES EXCHANGE ACT OF 1934 |
For the Transition Period from to
Commission File Number 0-9204
EXCO RESOURCES, INC.
(Exact name of Registrant as specified in its charter)
| | |
| Texas | | 74-1492779 |
(State or other jurisdiction of incorporation or organization) | | (I.R.S. Employer Identification No.) |
| | |
| |
12377 Merit Drive, Suite 1700, LB 82 Dallas, Texas | | 75251 (Zip Code) |
| (Address of principal executive offices) | | |
Registrant’s telephone number, including area code:(214) 368-2084
Securities registered pursuant to Section 12(b) of the Act:
| | |
| Title of each class | | Name of each exchange on which registered |
| Common Stock, $0.001 par value | | New York Stock Exchange |
Securities registered pursuant to Section 12(g) of the Act:
None
(Title of class)
Indicate by check mark if the registrant is a well-known seasoned issuer, as defined in Rule 405 of the Securities Act. Yes x No ¨
Indicate by check mark if the registrant is not required to file reports pursuant to Section 13 or Section 15(d) of the Act. Yes ¨ No x
Indicate by check mark whether the registrant (1) has filed all reports required to be filed by Section 13 or 15(d) of the Securities Exchange Act of 1934 during the preceding 12 months (or for such shorter period that the registrant was required to file such reports), and (2) has been subject to such filing requirements for the past 90 days. Yes x No ¨
Indicate by check mark if disclosure of delinquent filers pursuant to Item 405 of Regulation S-K is not contained herein, and will not be contained, to the best of registrant’s knowledge, in definitive proxy or information statements incorporated by reference in Part III of this Form 10-K or any amendment to this Form 10-K. x
Indicate by check mark whether the registrant is a large accelerated filer, an accelerated filer, a non-accelerated filer, or a smaller reporting company. See the definitions of “large accelerated filer,” “accelerated filer” and “smaller reporting company” in Rule 12b-2 of the Exchange Act. (Check one):
| | | | | | |
Large accelerated filer x | | Accelerated filer ¨ | | Non-accelerated filer ¨ (Do not check if a smaller reporting company) | | Smaller reporting company ¨ |
Indicate by check mark whether the registrant is a shell company (as defined in Rule 12b-2 of the Exchange Act). Yes ¨ No x
As of February 23, 2009, the registrant had 210,994,167 outstanding shares of common stock, par value $.001 per share, which is its only class of common stock. As of the last business day of the registrant’s most recently completed second fiscal quarter, the aggregate market value of the registrant’s common stock held by non-affiliates was $2,608,040,000.
For purposes of this calculation only, affiliates include all shares held by all officers, directors and 10% or greater shareholders.
DOCUMENTS INCORPORATED BY REFERENCE
Portions of the registrant’s proxy statement to be furnished to shareholders in connection with its 2009 Annual Meeting of Shareholders are incorporated by reference in Part III, Items 10-14 of this Annual Report on Form 10-K.
TABLE OF CONTENTS
i
EXCO RESOURCES, INC.
PART I
General
Unless the context requires otherwise, references in this Annual Report on Form 10-K to “EXCO,” “EXCO Resources,” “Company,” “we,” “us,” and “our” are to EXCO Resources, Inc., its consolidated subsidiaries and EXCO Holdings Inc., or EXCO Holdings, our former parent company that merged with us on February 14, 2006.
We have provided definitions of terms commonly used in the oil and natural gas industry in the “Glossary of selected oil and natural gas terms” beginning on page 24.
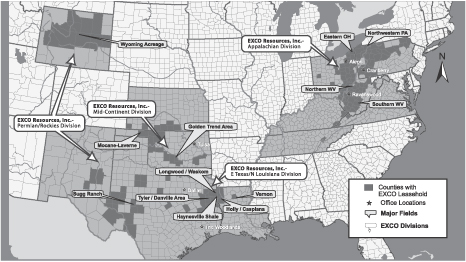
EXCO Resources, a Texas corporation incorporated in October 1955, is an independent oil and natural gas company engaged in the acquisition, development and exploitation of onshore North American oil and natural gas properties. Our operations are focused in key North American oil and natural gas areas including East Texas/North Louisiana, Appalachia, Mid-Continent and Permian. In addition to our oil and natural gas producing operations, we have midstream operations in the East Texas/North Louisiana area. As of December 31, 2008, our Proved Reserves were approximately 1.9 Tcfe, of which 93.6% were natural gas and 74.4% were Proved Developed Reserves. As of December 31, 2008, the related PV-10 of our Proved Reserves was approximately $2.5 billion, and the Standardized Measure of our Proved Reserves was $2.2 billion (see “—Summary of geographic areas of operations” for a reconciliation of PV-10 to Standardized Measure of Proved Reserves). For the year ended December 31, 2008, we produced 144.6 Bcfe of oil and natural gas. Based on our December 2008 average daily production of 407 Mmcfe, this translates to a reserve life of approximately 13.1 years.
Our business strategy
Historically, we have used acquisitions and vertical drilling as our vehicle for growth. As a result of our acquisition strategy, we have accumulated a large inventory of low risk drilling locations and acreage holdings with significant shale resource potential. This shale potential has allowed us to shift our focus to define the extent of and develop this shale resource primarily through horizontal drilling. We will continue to develop certain vertical drilling opportunities in East Texas/North Louisiana, Appalachia and West Texas as economic conditions permit. Any future acquisitions are likely to be focused on supplementing our shale resource holdings in the East Texas/North Louisiana and Appalachian areas.
We plan to achieve reserve, production and cash flow growth by executing our strategy as highlighted below:
| | • | | Develop our shale resource plays |
In our East Texas/North Louisiana areas, we have significant holdings in the Haynesville/Bossier shale resource play currently aggregating approximately 92,000 net acres. In December 2008, we completed our first horizontal well in the Haynesville shale with an initial production rate of 22.9 Mmcf per day of natural gas. Our second horizontal well, in Desoto Parish, Louisiana, had an initial production rate of 24.2 Mmcf per day. As of December 31, 2008, we had four horizontal wells drilling, two EXCO and two non-operated. We expect all four wells to be completed during the first quarter of 2009. We also have significant acreage holdings in the Marcellus and Huron shale resource plays in Appalachia where our current position is approximately 395,000 acres, a significant amount of which is held by production. Prior to our recent emphasis on horizontal drilling in the shales, we drilled numerous vertical tests in the Haynesville/Bossier and Marcellus shales to evaluate drilling locations and obtain scientific knowledge of these plays.
1
| | • | | Expand our midstream assets |
We own a portfolio of midstream assets in our East Texas/North Louisiana operating area. These assets enhance our ability to control the delivery of our production to markets. In addition to our existing assets, we are building an intrastate pipeline in DeSoto Parish, Louisiana and expanding our gathering systems in East Texas/North Louisiana and Appalachia to ensure that our production from these areas can be transported to markets. These expansions also provide an opportunity to transport third party gas and generate gathering and transportation fee income within the Haynesville/Bossier shale resource play.
| | • | | Exploit our multi-year development inventory |
We have a multi-year inventory of drilling locations and exploitation projects. This inventory consists of step-out drilling, infill drilling, exploratory drilling, workovers and recompletions. In 2008, we drilled 475 wells and completed 467 wells resulting in a 98.3% drilling success rate. We have identified over 11,000 drilling locations and exploitation projects across our properties.
| | • | | Maintain financial flexibility |
We employ the use of debt and equity, along with a comprehensive derivative financial instrument program, to support our business strategy. This approach enhances our ability to execute our business plan over the entire commodity price cycle, protect our returns on investments and manage our capital structure.
| | • | | Actively manage our portfolio and associated costs |
We periodically review our properties to identify cost savings opportunities and divestiture candidates. We actively seek to dispose of properties with higher operating costs, properties that are not within our core geographic operating areas and properties that are not strategic. We also seek to opportunistically divest properties in areas in which acquisitions and investment economics no longer meet our objectives.
| | • | | Seek acquisitions that meet our strategic and financial objectives in our core operating areas |
We maintain a disciplined acquisition process to seek and acquire properties in our core operating areas that have established production histories and value enhancement potential through development drilling and exploitation projects. Examples of this strategy include our 2007 acquisitions from Anadarko Petroleum Corporation, or Anadarko, in the Vernon and Ansley Fields located in Jackson Parish, Louisiana, or the Vernon Acquisition, multiple fields primarily in Oklahoma, Texas and Louisiana, or the Southern Gas Acquisition, our 2008 acquisitions from EOG Resources, Inc. located primarily in EXCO’s central Pennsylvania operating area, or the Appalachian Acquisition, and producing oil and natural gas properties, acreage and other assets in Gregg, Rusk and Upshur counties of Texas, or the Danville Acquisition.
| | • | | Identify and exploit upside opportunities on our acquired properties |
Our acquisitions have led to additional reserve opportunities above those identified at the date of acquisition. In our East Texas/North Louisiana area, we plan to drill additional horizontal wells, implement down spacing of vertical wells, and recomplete and restimulate existing wells to enhance our production and reserve position. In Appalachia, our focus will be directed toward unconventional drilling and exploitation of the Marcellus and Huron shale resource plays. We continue to exploit our Permian assets, which have resulted in larger oil production than originally expected and are also evaluating horizontal drilling opportunities.
2
Our strengths
We have a number of strengths that we believe will help us successfully execute our strategy.
| | • | | High quality asset base in attractive regions |
We own, and plan to maintain, a geographically diversified reserve base. Our principal operations are in the East Texas/North Louisiana, Appalachia, Mid-Continent and Permian areas. Our properties are generally characterized by:
| | • | | a multi-year inventory of development drilling and exploitation projects; |
| | • | | high drilling success rates; and |
| | • | | a high natural gas concentration. |
Our Haynesville/Bossier, Marcellus and Huron shale resource plays present significant opportunities to grow our reserves with low finding and development costs. Since the majority of the acreage in these areas is held by production, we are not forced to commit large amounts of capital over a short period of time to avoid lease expirations.
| | • | | Experienced management team with significant employee ownership |
Our management team has led both public and private oil and natural gas companies over the past 20 years and has an average of over 25 years of industry experience in acquiring, developing, and exploiting oil and natural gas properties. Our management team first purchased a significant ownership interest in us in December 1997, and since then we have achieved substantial growth in reserves and production. Since the beginning of 1998, we have increased our Proved Reserves from approximately 4.7 Bcfe to approximately 1.9 Tcfe at December 31, 2008, and our average daily production increased from less than 1 Mmcfe/d in 1997 to 407 Mmcfe/d in December 2008. As of February 20, 2009, our management team and employees (excluding our outside directors) own approximately 9.0% of our issued and outstanding common stock and exercisable stock options and our outside directors or their affiliates own approximately 32.0% of our issued and outstanding common stock and exercisable stock options, which aligns their objectives with those of our shareholders.
We operate a significant portion of our properties which permits us to manage our operating costs and better control capital expenditures as well as the timing of development and exploitation activities. As of December 31, 2008, we were the operator of 11,973 gross wells which represented approximately 95.2% of our Proved Reserves.
Plans for 2009
Our efforts in 2008 were focused on testing and evaluating our shale holdings to determine the best areas and techniques for development. This consisted of drilling and coring vertical test wells, analyzing cores and logs, testing stimulation methods and solving future marketing, logistics and regulatory issues associated with shale development, especially in Appalachia. This work led to our first horizontal well drilled in East Texas/North Louisiana and positioned us to begin a development program for our Haynesville shale acreage. We also began planning for an expansion of our midstream assets in the area to accommodate the expected future natural gas production.
As a result of the decline in commodity prices experienced in late 2008 and early 2009, we have reduced our capital expenditures related to our non-shale assets. We have reduced our rig count from 32 rigs drilling in the third quarter of 2008 to 11 as of February 20, 2009. In 2009, we plan to continue delineating and developing our shale plays, as these opportunities still provide attractive rates of return in the current commodity price environment.
3
Our budgeted capital expenditures in 2009 are focused in the East Texas/North Louisiana operating area where we expect to spend $182.8 million to drill 34 horizontal Haynesville/Bossier wells, of which 27 will be operated by us and 7 will be operated by others. We also plan to spend approximately $131.3 million to expand our midstream assets to transport our natural gas production from the Haynesville/Bossier areas to markets. In Appalachia, we will further test and evaluate our shale holdings, continue to enhance our technical and operational staff, and address regulatory and logistical issues. We plan to focus on the development of our Appalachia shale plays by the end of 2009 and beginning of 2010.
We will also focus in 2009 on lowering our operating expenses and drilling costs. We plan to generate significant free cash flow supplemented with sales of non strategic assets. We may also evaluate potential joint ventures related to our extensive shale holdings to accelerate their development. We are also considering potential joint ventures related to our midstream assets and potential expansion projects in both East Texas/North Louisiana and Appalachia.
Significant acquisition and financing activities during 2008
2008 property acquisitions
During 2008, we completed the following acquisitions of proved and unproved oil and natural gas properties. A summary of these acquisitions and the values allocated to oil and natural gas properties and midstream gathering facilities, net of contractual adjustments, is presented on the following table.
| | | | | | | | | | | | | | | | | | | |
(in thousands) | | Appalachian
Acquisition | | | New Waskom
Acquisition | | Danville
Acquisition | | | Other
acquisitions | | | Total
acquisitions | |
Purchase price calculations: | | | | | | | | | | | | | | | | | | | |
Purchase price | | $ | 386,703 | | | $ | 55,198 | | $ | 249,451 | | | $ | 74,075 | | | $ | 765,427 | |
Acquisition related expenses | | | 741 | | | | — | | | 178 | | | | — | | | | 919 | |
| | | | | | | | | | | | | | | | | | | |
Total purchase price | | $ | 387,444 | | | $ | 55,198 | | $ | 249,629 | | | $ | 74,075 | | | $ | 766,346 | |
| | | | | | | | | | | | | | | | | | | |
Allocation of purchase price: | | | | | | | | | | | | | | | | | | | |
Proved oil and natural gas properties | | $ | 334,308 | | | $ | — | | $ | 199,183 | | | $ | 71,232 | | | $ | 604,723 | |
Unproved oil and natural gas properties | | | 44,797 | | | | — | | | 42,391 | | | | (18 | ) | | | 87,170 | |
Other property and equipment | | | 2,517 | | | | — | | | 656 | | | | — | | | | 3,173 | |
Gulf Coast sale | | | — | | | | — | | | — | | | | 6,471 | | | | 6,471 | |
Gas gathering and related facilities | | | 19,876 | | | | 55,198 | | | 11,042 | | | | — | | | | 86,116 | |
Asset retirement obligations | | | (12,647 | ) | | | — | | | (1,029 | ) | | | — | | | | (13,676 | ) |
Other liabilities, net | | | (1,407 | ) | | | — | | | (2,614 | ) | | | (3,610 | ) | | | (7,631 | ) |
| | | | | | | | | | | | | | | | | | | |
Total purchase price allocation | | $ | 387,444 | | | $ | 55,198 | | $ | 249,629 | | | $ | 74,075 | | | $ | 766,346 | |
| | | | | | | | | | | | | | | | | | | |
Appalachian Acquisition. On February 20, 2008, we acquired shallow natural gas properties from EOG Resources, Inc. located primarily in our central Pennsylvania operating area. The purchase price for the Appalachian Acquisition was $387.4 million and was funded by drawings under the EXCO Resources credit agreement.
New Waskom Acquisition. On March 11, 2008, we acquired a 230 mile gathering system in East Texas/North Louisiana, or the New Waskom Acquisition, at a cost of approximately $55.2 million. The acquisition was funded with drawings under the EXCO Operating credit agreement. The New Waskom gathering system is located primarily in Harrison and Panola Counties in East Texas and Caddo Parish in North Louisiana. The gathering system has access to one processing plant and three interstate pipelines.
Danville Acquisition. On July 15, 2008, we acquired producing oil and natural gas properties, acreage and other assets in Gregg, Rusk and Upshur counties of Texas for approximately $249.6 million, net of closing adjustments. Funding for the Danville Acquisition was provided by a $300.0 million senior unsecured term credit agreement (see “2008 financing activities—Original term credit agreement”).
4
We also acquired additional incremental interest in wells we own in our East Texas/North Louisiana areas, acquired Proved Reserves in our Mid-Continent area and finalized the purchase price allocation of our 2007 Southern Gas Acquisition.
2008 undeveloped acreage acquisitions
During 2008, we spent $187.1 million on leasing of undeveloped acreage, principally in the Haynesville/Bossier and Marcellus shale resource plays.
2008 financing activities
Preferred Stock conversion. On July 18, 2008, we converted all outstanding shares of our 7.0% Cumulative Convertible Perpetual Preferred Stock and Hybrid Preferred Stock, or Preferred Stock, into a total of approximately 105.2 million shares of our common stock. The conversion of the Preferred Stock had the effect of increasing the book value of shareholders’ equity by approximately $2.0 billion. We also paid all accrued dividends in cash totaling approximately $12.8 million to the holders of the converted shares of Preferred Stock. After July 18, 2008, dividends ceased to accrue on the Preferred Stock and all rights of the holders, with respect to the Preferred Stock, terminated, except for the right to receive the whole shares of common stock issuable upon conversion, accrued dividends through July 18, 2008 and cash in lieu of any fractional shares. The conversion of all outstanding shares of Preferred Stock into common stock eliminated our obligation to pay quarterly cash dividends of $35.0 million, resulting in annualized cash dividend savings of $140.0 million.
EXCO Resources credit agreement. On February 20, 2008, we entered into the first amendment to our Second Amended and Restated Credit Agreement, or the EXCO Resources Credit Agreement. The primary change to the EXCO Resources Credit Agreement included an increase in the borrowing base from $0.9 billion to approximately $1.2 billion.
On July 14, 2008, we entered into the second amendment to the EXCO Resources Credit Agreement. This amendment, which was effective June 30, 2008, permitted the payment of cash dividends in connection with the exercise of any right to convert our Preferred Stock into common stock without compliance with certain limitations on restricted payments. In addition, the leverage ratio covenant, as defined in the agreement, was changed to provide that EXCO will not permit such ratio (i) as of the end of any fiscal quarter ending on or after June 30, 2008 and on or before December 31, 2008 to be greater than 4.00 to 1.00, (ii) as of the end of the fiscal quarter ending on March 31, 2009 to be greater than 3.75 to 1.00 and (iii) as of the end of any fiscal quarter ending on or after June 30, 2009 to be greater than 3.50 to 1.00. Prior to the amendment, the leverage ratio was not permitted to be greater than 3.50 to 1.00. The other financial covenants and all other terms, including maturity date and borrowing base, contained within the EXCO Resources Credit Agreement remained unchanged.
On February 4, 2009, we entered into the third amendment to the EXCO Resources Credit Agreement. This amendment extended the leverage ratio covenant parameters of 4.00 to 1.00 through December 31, 2009. The leverage ratio will decrease as of March 31, 2010 to 3.75 to 1.00 and further decrease as of June 30, 2010 to 3.50 to 1.00.
EXCO Operating Company, LP credit agreement. On July 14, 2008, EXCO Operating Company, LP, our indirect wholly-owned subsidiary, or EXCO Operating, entered into a second amendment to its credit agreement, or the EXCO Operating Credit Agreement, to (i) allow EXCO Operating to incur up to $500.0 million of indebtedness under an unsecured term credit agreement and (ii) exclude drawings under such unsecured term credit agreement from the consolidated current ratio, as defined in the EXCO Operating Credit Agreement, through December 31, 2008. The other financial covenants and all other terms, including maturity date and borrowing base contained within the EXCO Operating Credit Agreement remained unchanged.
On December 1, 2008, EXCO Operating entered into a third amendment to the EXCO Operating Credit Agreement to permit the incurrence of up to $300.0 million of unsecured indebtedness under a new senior unsecured term credit agreement with a stated maturity no later than January 15, 2010. On December 8, 2008, the entire $300.0 million under the new senior unsecured term credit agreement was drawn (see “—New term credit agreement”).
5
Original term credit agreement. On July 15, 2008, EXCO Operating entered into a senior unsecured term credit agreement, or the Original Term Credit Agreement, and drew $300.0 million, resulting in net proceeds of $289.4 million after transaction fees and administrative expenses. The Original Term Credit Agreement balance of $300.0 million was borrowed in a single draw on July 15, 2008 and was scheduled to mature on December 15, 2008.
New term credit agreement. On December 8, 2008, EXCO Operating entered into a new $300.0 million senior unsecured term credit agreement, or the New Term Credit Agreement, resulting in net proceeds of $274.4 million. The proceeds were used to fund the repayment and termination of the Original Term Credit Agreement. The New Term Credit Agreement is due and payable on January 15, 2010 and is guaranteed by all existing and future direct or indirect subsidiaries of EXCO Operating, including any guarantor of the EXCO Operating Credit Agreement.
Financial covenants governing the New Term Credit Agreement include a minimum current ratio of 1.00 to 1.00, a maximum leverage ratio of 3.50 to 1.00 and a minimum interest coverage ratio of 2.50 to 1.00. At the borrower’s election, the term loans under the New Term Credit Agreement may bear interest at a rate per annum equal to: (A) the Alternate Base Rate, or ABR [defined as the highest of (i) the rate of interest publicly announced by JPMorgan as its prime rate in effect at its principal office in New York City, (ii) the federal funds effective rate from time to time plus 0.50%, and (iii) the Adjusted LIBO Rate (defined as the greater of (x) the rate at which eurodollar deposits in the London interbank market for one month are quoted on Reuters BBA Libor Rates Page 3750, as adjusted for actual statutory reserve requirements for eurocurrency liabilities, and (y) 4.0%) plus 1.0%] plus 5.0% or (B) the Adjusted LIBO Rate plus 6.00%. The interest rate shall never be less than 10%. Interest is payable on the last day of each calendar month. EXCO Operating paid upfront fees of $25.6 million to the lenders on December 8, 2008. If any unpaid principal remains outstanding on June 15, 2009, EXCO Operating must pay a duration fee in the amount equal to 5.0% of the unpaid principal. If any unpaid principal remains outstanding on September 15, 2009, EXCO Operating must pay an additional duration fee at that time in an amount equal to 3.0% of the unpaid principal.
Pro forma results of operations. The following table reflects the unaudited pro forma results of operations as though the Appalachian Acquisition, the New Waskom Acquisition, the Danville Acquisition, the conversion of our Preferred Stock and the acquisitions and dispositions during 2007, including the Vernon Acquisition, the Southern Gas Acquisition and the sale of a portion of oil and natural gas properties and related assets acquired in the Southern Gas Acquisition, or the Gulf Coast Sale, had occurred on January 1, 2007.
| | | | | | | |
(in thousands, except per share data) | | Year ended
December 31, 2008 | | | Year ended
December 31, 2007 |
Revenues | | $ | 1,541,114 | | | $ | 1,181,884 |
| | | | | | | |
Net income (loss) | | $ | (1,762,605 | ) | | $ | 81,041 |
Preferred stock dividends | | | — | | | | — |
| | | | | | | |
Net income (loss) available to common shareholders | | $ | (1,762,605 | ) | | $ | 81,041 |
| | | | | | | |
Basic earnings (loss) per share | | $ | (8.37 | ) | | $ | 0.39 |
| | | | | | | |
Diluted earnings (loss) per share | | $ | (8.37 | ) | | $ | 0.38 |
| | | | | | | |
6
Summary of geographic areas of operations
The following tables set forth summary operating information attributable to our principal geographic areas of operation as of December 31, 2008:
| | | | | | | | | |
Areas | | Total proved
reserves
(Bcfe)(1) | | PV-10
(in millions)
(1)(2) | | Average
December
daily net
production
(Mmcfe/d) | | Reserve life
(years)(3) |
East Texas/North Louisiana | | 1,004.8 | | $ | 1,364.4 | | 250.0 | | 11.0 |
Appalachia | | 504.8 | | | 436.0 | | 59.0 | | 23.4 |
Mid-Continent | | 315.2 | | | 495.6 | | 64.0 | | 13.5 |
Permian | | 107.8 | | | 173.6 | | 33.0 | | 8.9 |
Rockies | | 7.3 | | | 3.9 | | 1.0 | | 20.0 |
| | | | | | | | | |
Total | | 1,939.9 | | $ | 2,473.5 | | 407.0 | | 13.1 |
| | | | | | | | | |
| | | | | | | | |
Areas | | Identified
drilling
locations(4) | | Identified
exploitation
projects(5) | | Total gross
acreage | | Total net
acreage(6) |
East Texas/North Louisiana | | 2,779 | | 1,648 | | 343,213 | | 282,170 |
Appalachia | | 4,973 | | 533 | | 1,129,388 | | 1,038,127 |
Mid-Continent | | 731 | | 192 | | 360,908 | | 240,309 |
Permian | | 508 | | 33 | | 135,593 | | 111,144 |
Rockies | | 47 | | 7 | | 159,716 | | 140,463 |
| | | | | | | | |
Total | | 9,038 | | 2,413 | | 2,128,818 | | 1,812,213 |
| | | | | | | | |
| (1) | The total Proved Reserves and PV-10, excluding future plugging and abandonment costs, of the Proved Reserves, as used in this table, were prepared by Lee Keeling and Associates, Inc., or Lee Keeling, an independent petroleum engineering firm in Tulsa, Oklahoma. For each area set forth in the table, the Proved Reserves were extracted from the report from Lee Keeling by our internal engineers. The estimated future plugging and abandonment costs necessary to compute PV-10 were computed internally. |
| (2) | The PV-10 data used in this table is based on December 31, 2008 spot prices of $5.71 per Mmbtu for natural gas and $44.60 per Bbl for oil, in each case adjusted for geographical and historical differentials. Market prices for oil and natural gas are volatile. See “Item 1A. Risk factors—Risks relating to our business.” We believe that PV-10 before income taxes, while not a financial measure in accordance with generally accepted accounting principles, or GAAP, is an important financial measure used by investors and independent oil and natural gas producers for evaluating the relative significance of oil and natural gas properties and acquisitions because the tax characteristics of comparable companies can differ materially. The total Standardized Measure, a measure recognized under GAAP, for our Proved Reserves as of December 31, 2008 was $2.2 billion. The Standardized Measure represents the PV-10 after giving effect to income taxes, and is calculated in accordance with Statement of Financial Accounting Standards, or SFAS, No. 69, “Disclosures about Oil and Gas Producing Activities,” or SFAS No. 69. The amount of estimated future plugging and abandonment costs, the PV-10 of these costs and the Standardized Measure were determined by us. We do not designate our derivative financial instruments as hedges and accordingly, do not include the impact of derivative financial instruments when computing the Standardized Measure. The following table provides a reconciliation of our PV-10 to our Standardized Measure as of December 31, 2008. |
| | | | |
(in millions) | | | |
PV-10 | | $ | 2,473.5 | |
Future income taxes | | | (649.8 | ) |
Discount of future income taxes at 10% per annum | | | 412.6 | |
| | | | |
Standardized Measure | | $ | 2,236.3 | |
| | | | |
7
| (3) | For purposes of this table, the reserve life is calculated by dividing the Proved Reserves (on an Mmcfe basis) by the annualized daily production volumes. |
| (4) | Identified drilling locations represent total gross drilling locations identified and scheduled by our management as an estimation of our multi-year drilling activities on existing acreage. Of the total locations shown in the table, 2,134 are classified as proved. Our actual drilling activities may change depending on the availability of capital, regulatory approvals, seasonal restrictions, oil and natural gas prices, costs, drilling results and other factors. See “Item 1A. Risk factors—Risks relating to our business.” |
| (5) | Identified exploitation projects represent total gross exploitation projects, such as workovers, recompletions, and other non-drilling activities, identified and scheduled by our management as an estimation of our multi-year exploitation projects on existing acreage. Of the total exploitation projects shown in the table, 923 are classified as proved. Our actual exploitation projects may change depending on the availability of capital, regulatory approvals, seasonal restrictions, oil and natural gas prices, costs, and other factors. See “Item 1A. Risk factors—Risks relating to our business.” |
| (6) | Includes 104,366, 96,306 and 125,724 net acres with leases expiring in 2009, 2010 and 2011, respectively. |
8
Our development and exploitation project areas
East Texas/North Louisiana
The historical East Texas/North Louisiana area is a part of the Cotton Valley Sand trend, which covers parts of the East Texas Basin and the Northern Louisiana Salt Basin. We are targeting tight sand reservoirs along the Cotton Valley Sand trend at depths of 6,500 to 15,000 feet. Operations in the area are generally characterized by long-lived reserves, high drilling success rates and wells with relatively high initial production rates. Due to the tight nature of the reservoirs, development programs in the area are mostly focused on infill development drilling. Many areas have been down-spaced to 80 acres per well, with some areas having economically established 40 acre spacing. Over the last year, the emergence of the Haynesville Shale opportunity has resulted in a change in our drilling focus from the traditional vertical Cotton Valley drilling to horizontal shale drilling.
Haynesville/Bossier shale
In the Haynesville/Bossier shale resource play in the East Texas and Northwest Louisiana area, we hold approximately 92,000 net leasehold acres. The core area of the play as delineated to date is centered in the DeSoto and Caddo Parish, Louisiana area and extends to the west into Texas and to the east into North Central Louisiana. EXCO holds 51,000 net leasehold acres in the core area of Desoto and Caddo Parishes in Louisiana and Harrison and Panola Counties in Texas. A large percentage of our core area acreage is held by our existing production from the Cotton Valley, Hosston and Travis Peak formations, where EXCO operates over 1,200 wells in the area and has a significant footprint with existing operations and infrastructure in East Texas and Northwest Louisiana.
In 2008, we initiated a vertical Haynesville testing and data acquisition program. After our evaluation of this data, we transitioned to a horizontal well program. In 2008, we drilled nine operated vertical wells and three operated horizontal wells. Our first horizontal well, the Oden 30H #6, in which we own a 100% working interest, in DeSoto Parish Louisiana, is the most prolific well in our history. The well tested to sales in December 2008 with an initial production rate of 22.9 Mmcf per day. It has produced approximately 1.0 Bcf of natural gas in the first 65 days of production. For the seven day period ended February 12, 2009, the Oden 30H #6 averaged approximately 12.9 Mmcf per day. Our second horizontal well, completed in February 2009, tested at an initial production rate of 24.2 Mmcf per day. At year end 2008, we had four horizontal wells drilling, two EXCO operated and two non-operated. All four of these wells will be completed in the first quarter of 2009. We are currently running four operated horizontal rigs in the play and plan to add three additional operated rigs, resulting in a total of seven operated horizontal rigs drilling by mid 2009. We are planning to drill 27 operated horizontal wells and participate in seven non-operated horizontal wells in 2009. Also in 2009, we will be conducting tests on the Bossier shale section that overlays the Haynesville shale.
9
Vernon/Kelleys Fields
The Vernon Field, located in Jackson Parish, Louisiana, is our largest producing field, accounting for approximately one-fourth of our production as of December 31, 2008. The field and gathering system were acquired from Anadarko on March 30, 2007. At December 31, 2008, we had Proved Reserves of 444.4 Bcfe and 403 gross producing wells. Most of the wells in the field produce from the Lower Cotton Valley and Bossier formations at approximately 12,000 to 15,000 feet. We gather and treat our own natural gas and have access to numerous transmission lines. We currently plan to drill five wells in 2009, one of which is in the Kelleys Field located north of the Vernon Field.
East Texas/North Louisiana Cotton Valley Area
Within our Cotton Valley Area, we are active in Harrison, Panola, Smith, Rusk, Upshur and Gregg Counties in Texas, primarily across six fields—Waskom, Overton, Oak Hill, Minden, Glenwood and White Oak. We are also active in Caddo Parish and DeSoto Parish in Louisiana, primarily across four fields—Holly, Kingston, Caspiana and Longwood. At December 31, 2008, we had Proved Reserves of 546.3 Bcfe and 1,408 gross producing wells. We are focused on developing the Lower Cotton Valley (Taylor) and Upper Cotton Valley sands at depths of 10,400 to 11,000 feet, the Pettet Lime at depths of 7,000 to 8,500 feet and Travis Peak Sands at depths of 7,800 to 10,000 feet. Our natural gas is gathered through our own gathering lines in these fields. We currently plan to drill 22 wells in 2009.
Appalachia
The Appalachian Basin includes portions of the states of Kentucky, Ohio, Pennsylvania, Virginia, West Virginia and Tennessee, and covers an area of over 185,000 square miles. In Appalachia, we hold approximately 1,038,000 net leasehold acres. It is the most mature oil and natural gas producing region in the United States, first establishing oil production in 1859. The Appalachian Basin is strategically located near high energy demand areas with limited supply. As a result, the natural gas produced from the area typically commands a higher wellhead price relative to other North American areas.
Although the Appalachian Basin has sedimentary formations indicating the potential for deposits of oil and natural gas reserves up to depths of 30,000 feet or more, most production in this area has been derived from relatively shallow, low porosity and permeability sand and shale formations at depths of 1,000 to 6,000 feet. Operations in the area are generally characterized by long reserve lives, high drilling success rates and a large number of low productivity wells in these shallow formations. In the Appalachian Basin, there are more than 200,000 producing wells and 3,100 operators, with most being relatively small, private enterprises. Our operations in the area have included development drilling on our existing acreage, as well as the acquisition of properties with established production and growth opportunities. We believe that the number of wells and operators presents a significant consolidation opportunity. We also believe the Marcellus shale development presents a significant growth opportunity for us.
Marcellus Shale Resource Play
During 2008, we focused on acquiring additional leasehold in the Marcellus shale resource play fairway, which we define as being geologically over-pressured and containing more than 100 feet of shale. In the fairway, we added approximately 60,000 acres through our leasing efforts. Our total acreage in the play is approximately 395,000 acres. Approximately 70.6% of our Marcellus shale fairway acreage is held by shallow production. Efforts continue to evaluate and develop plans relating to exploitation of the Marcellus shale play, and we have hired a team of technical personnel to conduct development of this play. Testing of the Marcellus shale has been conducted on twelve vertical and two horizontal wells, and additional testing of the over-pressured shale is planned for 2009.
10
Pennsylvania Area
The Pennsylvania Area encompasses 21 counties in the state. At December 31, 2008, we had Proved Reserves of 266.9 Bcfe and 4,563 gross producing wells. Drilling, completion and production activities target the Silurian Medina Sandstone formation at depths of 4,500 to 5,100 feet in the northwest area of Pennsylvania and target the Marcellus shale and the Upper Devonian Venango, Bradford and Elk sandstone groups at depths of 1,800 to 8,100 feet in the other regions of the state. We currently plan to drill 53 wells in 2009.
Eastern Ohio Area
The Eastern Ohio Area includes some 25 counties in eastern Ohio. At December 31, 2008, we had Proved Reserves of 85.4 Bcfe and 2,361 gross producing wells. Drilling, completion and production activities target the Silurian Clinton Sandstone found at depths of 3,500 to 5,600 feet and the Knox series at depths approaching 7,500 feet. Currently, we do not plan to drill any wells in 2009.
West Virginia Area
The West Virginia Area includes 29 counties stretching from the northern to the southern areas of the state. At December 31, 2008 we had Proved Reserves of 147.2 Bcfe and 2,287 gross producing wells. Drilling, completion and production activities target the multiple, laterally stratified reservoirs of the Missippian and Devonian formations found at depths ranging from 1,500 to 5,500 feet. We currently plan to drill five wells in 2009.
Mid-Continent
The Mid-Continent area includes parts of Oklahoma, southwestern Kansas and the Texas Panhandle. The major properties in the Mid-Continent area are located in the Anadarko Shelf and Anadarko Basin of Oklahoma. The Mid-Continent area is characterized by stratigraphic plays with multiple, stacked pay zones and more complex geology than in our other operating areas. Similar to our other operating areas, the Mid-Continent area contains a number of fields with long production histories.
Mocane-Laverne Field
The Mocane-Laverne Field is primarily located in Beaver, Harper and Ellis Counties of Oklahoma. At December 31, 2008, we had estimated Proved Reserves of 99.7 Bcfe, and we had 727 gross producing wells. Primary drilling targets include the Morrow, Chester and Cherokee formations. Current producing wells have an average total depth of approximately 7,200 feet. We currently plan to drill 14 wells in 2009.
Golden Trend Area
The Golden Trend Area is primarily located in Grady, Garvin and McClain Counties of Oklahoma. At December 31, 2008, we had estimated Proved Reserves of 151.5 Bcfe and we had 549 gross producing wells. Primary drilling targets are Sycamore, Hunton, Viola, Woodford, Simpson and Pennsylvanian formations. Current producing wells have an average total depth of approximately 11,300 feet. We currently plan to drill seven wells in 2009.
Permian
The Permian Basin is located in West Texas and the adjoining area of southeastern New Mexico. Though the Permian Basin is better known as a mature oil focused basin exploited with waterflood and other enhanced oil recovery techniques, our activities are focused on conventional natural gas properties. With the use of 3-D seismic, we are targeting prolific natural gas reservoirs with potential for multi-pay horizons. The properties are characterized by long reserve lives and low operating costs.
Sugg Ranch Field
The Sugg Ranch Field is located primarily in Irion County, Texas. We have a total working interest of 97% in the property. At December 31, 2008, we had Proved Reserves of 76.7 Bcfe and 269 gross producing wells.
11
Production is primarily from the Canyon Sand from depths of 6,700 to 7,900 feet. We currently plan to drill 36 wells in 2009.
Rockies
The Rockies area is located in Wyoming, Montana and Colorado. The region is mature and has been oil focused, with more recent emphasis on natural gas and coal-bed methane. The region can be complex geologically. Drill depths range from less than 1,000 feet to greater than 25,000 feet. Opportunities exist to acquire 3-D seismic on existing fields to identify by-passed pay zones.
The Rockies area holdings consist of approximately 140,000 net acres of leasehold in Wyoming, primarily in the Wind River, Bighorn and Powder River Basins. At December 31, 2008, we had Proved Reserves of 7.2 Bcfe and 66 gross producing wells. Currently, we do not plan to drill any wells in 2009.
Our oil and natural gas reserves
The following tables summarize historical information regarding Proved Reserves at December 31, 2008, 2007 and 2006. The historical information was prepared in accordance with the rules and regulations of the Securities and Exchange Commission, or the SEC.
| | | | | | | | | |
| | | At December 31, |
| | | 2008 | | 2007 | | 2006 |
Oil (Mmbbls) | | | | | | | | | |
Developed | | | 14.8 | | | 15.2 | | | 11.3 |
Undeveloped | | | 6.0 | | | 5.7 | | | 4.9 |
| | | | | | | | | |
Total | | | 20.8 | | | 20.9 | | | 16.2 |
| | | | | | | | | |
Natural Gas (Bcf) | | | | | | | | | |
Developed | | | 1,354.8 | | | 1,228.8 | | | 665.3 |
Undeveloped | | | 460.3 | | | 510.9 | | | 461.3 |
| | | | | | | | | |
Total | | | 1,815.1 | | | 1,739.7 | | | 1,126.6 |
| | | | | | | | | |
Equivalent reserves (Bcfe) | | | | | | | | | |
Developed | | | 1,443.6 | | | 1,320.0 | | | 733.1 |
Undeveloped | | | 496.3 | | | 545.1 | | | 490.7 |
| | | | | | | | | |
Total | | | 1,939.9 | | | 1,865.1 | | | 1,223.8 |
| | | | | | | | | |
Pre-tax present value, discounted at 10% (PV-10)
(in millions)(1) | | | | | | | | | |
Developed | | $ | 2,375.7 | | $ | 3,369.2 | | $ | 1,353.7 |
Undeveloped | | | 97.8 | | | 576.7 | | | 252.3 |
| | | | | | | | | |
Total | | $ | 2,473.5 | | $ | 3,945.9 | | $ | 1,606.0 |
| | | | | | | | | |
Standardized Measure (in millions) | | $ | 2,236.3 | | $ | 3,118.9 | | $ | 1,311.8 |
| | | | | | | | | |
| (1) | The PV-10 data does not include the effects of income taxes or derivative financial instruments, and is based on the following spot prices, in each case adjusted for historical differentials. |
| | | | | | |
| | | Spot price |
Date | | Natural gas
(per Mmbtu) | | Oil
(per Bbl) |
December 31, 2008 | | $ | 5.71 | | $ | 44.60 |
December 31, 2007 | | | 6.80 | | | 95.92 |
December 31, 2006 | | | 5.64 | | | 60.82 |
12
We believe that PV-10 before income taxes, while not a financial measure in accordance with GAAP, is an important financial measure used by investors and independent oil and natural gas producers for evaluating the relative significance of oil and natural gas properties and acquisitions due to tax characteristics, which can differ significantly, among comparable companies. The Standardized Measure represents the PV-10 after giving effect to income taxes, and is calculated in accordance with SFAS No. 69. The following table provides a reconciliation of our PV-10 to our Standardized Measure:
| | | | | | | | | | | | |
| | | At December 31, | |
(in millions) | | 2008 | | | 2007 | | | 2006 | |
PV-10 | | $ | 2,473.5 | | | $ | 3,945.9 | | | $ | 1,606.0 | |
Future income taxes | | | (649.8 | ) | | | (1,857.5 | ) | | | (721.2 | ) |
Discount of future income taxes at 10% per annum | | | 412.6 | | | | 1,030.5 | | | | 427.0 | |
| | | | | | | | | | | | |
Standardized Measure | | $ | 2,236.3 | | | $ | 3,118.9 | | | $ | 1,311.8 | |
| | | | | | | | | | | | |
The estimate of Proved Reserves and future net cash flow attributable to our interests, presented as of December 31, 2008, 2007 and 2006 have been prepared by Lee Keeling, our external engineers. The estimate of our PV-10 and Standardized Measure is based upon our internal estimates of future abandonment costs and the report on our Proved Reserves as prepared by Lee Keeling. Estimates of oil and natural gas reserves are projections based on a process involving an independent third party engineering firm’s extensive visits, collection of any and all required geologic, geophysical, engineering and economic data, and such firm’s complete external preparation of all required estimates and are forward-looking in nature. These reports rely upon various assumptions, including assumptions required by the SEC, such as constant oil and natural gas prices, operating expenses, capital expenditures, production and ad valorem taxes and availability of funds. These reports should not be construed as the current market value of our Proved Reserves. The process of estimating oil and natural gas reserves is also dependent on geological, engineering and economic data for each reservoir. Because of the uncertainties inherent in the interpretation of this data, we cannot ensure that the reserves will ultimately be realized. Our actual results could differ materially. See “Note 18. Supplemental information relating to oil and natural gas producing activities (unaudited)” of the notes to our consolidated financial statements for additional information regarding our oil and natural gas reserves and our Standardized Measure.
The Proved Reserve estimates prepared by Lee Keeling for the years ended December 31, 2008, 2007 and 2006 included a detailed review of all of our properties.
Lee Keeling also examined our estimates with respect to reserve categorization, using the definitions for Proved Reserves set forth in SEC Regulation S-X Rule 4-10(a) and SEC staff interpretations and guidance. In preparing an estimate of the reserves of future net cash flow attributable to our interest, Lee Keeling did not independently verify the accuracy and completeness of information and data furnished by us with respect to ownership interests, oil and gas production, well test data, historical costs of operation and development, product prices, or any agreements relating to current and future operations of the properties and sales of production. However, if in the course of the examination something came to the attention of Lee Keeling which brought into question the validity or sufficiency of any such information or data, Lee Keeling did not rely on such information or data until they had satisfactorily resolved their questions relating thereto or had independently verified such information or data. Lee Keeling determined that our estimates of reserves conform to the guidelines of the SEC, including the criteria of “reasonable certainty,” as it pertains to expectations about the recoverability of reserves in future years, under existing economic and operating conditions, consistent with the definition in Rule 4-10(a)(2) of SEC Regulation S-X.
13
Our production, prices and expenses
The following table summarizes revenues (before cash settlements of derivative financial instruments), net production of oil and natural gas sold, average sales price per unit of oil and natural gas and costs and expenses associated with the production of oil and natural gas. This table includes information for acquisitions from the date of closing.
| | | | | | | | | |
(in thousands, except production and per
unit amounts) | | Year ended
December 31,
2008 | | Year ended
December 31,
2007 | | Year ended
December 31,
2006 |
Revenues, production and prices: | | | | | | | | | |
Oil: | | | | | | | | | |
Revenue(1) | | $ | 216,727 | | $ | 117,073 | | $ | 57,043 |
Production sold (Mbbl) | | | 2,236 | | | 1,645 | | | 916 |
Average sales price per Bbl(1) | | $ | 96.93 | | $ | 71.17 | | $ | 62.27 |
Natural gas: | | | | | | | | | |
Revenue(1) | | $ | 1,188,099 | | $ | 758,714 | | $ | 302,192 |
Production sold (Mmcf) | | | 131,159 | | | 111,419 | | | 44,123 |
Average sales price per Mcf(1) | | $ | 9.06 | | $ | 6.81 | | $ | 6.85 |
Costs and expenses: | | | | | | | | | |
Average production cost per Mcfe | | $ | 1.64 | | $ | 1.39 | | $ | 1.38 |
General and administrative expense per Mcfe | | $ | 0.61 | | $ | 0.53 | | $ | 0.83 |
Depreciation, depletion and amortization per Mcfe | | $ | 3.18 | | $ | 3.10 | | $ | 2.74 |
| (1) | Excludes the effects of derivative cash settlements and derivative financial instruments. |
Our interest in productive wells
The following table quantifies information regarding productive wells (wells that are currently producing oil or natural gas or are capable of production), including temporarily shut-in wells. The number of total gross oil and natural gas wells excludes any multiple completions. Gross wells refer to the total number of physical wells in which we hold any working interest, regardless of our percentage interest. A net well is not a physical well, but is a concept that reflects the actual total working interests we hold in all wells. We compute the number of net wells we own by totaling the percentage interests we hold in all our gross wells.
| | | | | | | | | | | | |
| | | At December 31, 2008 |
| | | Gross wells(1) | | Net wells |
Areas | | Oil | | Gas | | Total | | Oil | | Gas | | Total |
East Texas/North Louisiana | | 74 | | 1,744 | | 1,818 | | 65.1 | | 1,320.3 | | 1,385.4 |
Appalachia | | 453 | | 8,773 | | 9,226 | | 448.3 | | 7,967.2 | | 8,415.5 |
Mid-Continent | | 303 | | 1,401 | | 1,704 | | 165.3 | | 819.1 | | 984.4 |
Permian | | 260 | | 139 | | 399 | | 231.5 | | 105.0 | | 336.5 |
Rockies | | 44 | | 22 | | 66 | | 34.1 | | 18.7 | | 52.8 |
| | | | | | | | | | | | |
Total | | 1,134 | | 12,079 | | 13,213 | | 944.3 | | 10,230.3 | | 11,174.6 |
| | | | | | | | | | | | |
| (1) | As of December 31, 2008, we owned interests in 30 gross wells with multiple completions. |
As of December 31, 2008, we were the operator of 11,973 gross (10,858.8 net) wells, which represented approximately 95.2% of our Proved Reserves as of December 31, 2008.
14
Our drilling activities
In 2009, we intend to shift our drilling emphasis toward horizontal drilling in shale plays. Prior to 2009, our drilling emphasis was vertical development type projects. The number and types of wells we drill will vary depending on the amount of funds we have available for drilling, the cost of each well, the size of the fractional working interests in each well, the estimated recoverable reserves attributable to each well and accessibility to the well site.
The following tables summarize our approximate gross and net interests in the wells we drilled during the periods indicated and refers to the number of wells completed at any time during the period, regardless of when drilling was initiated.
| | | | | | | | | | | | |
| | | Development Wells |
| | | Gross | | Net |
| | | Productive | | Dry | | Total | | Productive | | Dry | | Total |
Year ended December 31, 2008 | | 447 | | 4 | | 451 | | 374.2 | | 2.5 | | 376.7 |
Year ended December 31, 2007 | | 487 | | 7 | | 494 | | 394.7 | | 4.6 | | 399.3 |
Year ended December 31, 2006 | | 366 | | 5 | | 371 | | 298.2 | | 2.3 | | 300.5 |
| | | | | | | | | | | | |
| | | Exploratory Wells |
| | | Gross | | Net |
| | | Productive | | Dry | | Total | | Productive | | Dry | | Total |
Year ended December 31, 2008 | | 20 | | 4 | | 24 | | 19.3 | | 3.5 | | 22.8 |
Year ended December 31, 2007 | | 8 | | 4 | | 12 | | 2.5 | | 3.4 | | 5.9 |
Year ended December 31, 2006 | | 1 | | 1 | | 2 | | 0.3 | | 0.3 | | 0.6 |
At December 31, 2008, we had 11 gross (8.6 net) wells being drilled and 14 gross (12.1 net) wells being completed.
Our developed and undeveloped acreage
Developed acreage includes those acres spaced or assignable to producing wells. Undeveloped acreage represents those acres that do not currently have completed wells capable of producing commercial quantities of oil or natural gas, regardless of whether the acreage contains Proved Reserves. The definitions of gross acres and net acres conform to how we determine gross wells and net wells. The following table sets forth our developed and undeveloped acreage at December 31, 2008:
| | | | | | | | |
| | | At December 31, 2008 |
| | | Developed acreage | | Undeveloped acreage |
Areas | | Gross | | Net | | Gross | | Net |
East Texas/North Louisiana | | 189,757 | | 149,515 | | 153,456 | | 132,655 |
Appalachia | | 549,248 | | 496,257 | | 580,140 | | 541,870 |
Mid-Continent | | 333,537 | | 220,186 | | 27,371 | | 20,123 |
Permian | | 37,910 | | 25,514 | | 97,683 | | 85,630 |
Rockies | | 14,205 | | 7,356 | | 145,511 | | 133,107 |
| | | | | | | | |
Total | | 1,124,657 | | 898,828 | | 1,004,161 | | 913,385 |
| | | | | | | | |
The primary terms of our oil and natural gas leases expire at various dates. Much of our undeveloped acreage is “held by production,” which means that these leases are active as long as we produce oil or natural gas from the acreage. Upon ceasing production, these leases will expire. We have 104,366, 96,306 and 125,724 net acres with leases expiring in 2009, 2010 and 2011, respectively.
The undeveloped “held by production” acreage in many cases represents potential additional drilling opportunities through down-spacing and drilling of proved undeveloped and unproved locations in the same formation(s) already producing, as well as other non-producing formations, in a given oil or natural gas field without the necessity of purchasing additional leases or producing properties.
15
Sales of producing properties and undeveloped acreage
We periodically review our properties to identify cost savings opportunities and divestiture candidates. We actively seek to dispose of properties with higher operating costs, properties that are not within our core geographic operating areas and properties that are not strategic. We also seek to opportunistically divest properties in areas in which acquisitions and investment economics no longer meet our objectives. We have a number of divestiture initiatives underway for 2009, although there can be no assurance that we will complete all or any of our proposed divestitures. In addition, we are exploring possible joint venture transactions with respect to both our East Texas/North Louisiana and Appalachia operating areas, as well as our Midstream operations.
Midstream operations
Our midstream operations are principally designed to facilitate delivery of our natural gas produced in the East Texas/North Louisiana region to markets. We also gather and transport production from third parties. Our fees charged to producers, including our exploration and production segment include fixed-rate charges as well as variable charges, such as stages of compression. We do not own any processing facilities. The following paragraphs discuss our midstream subsidiaries and their assets.
TGG Pipeline, Ltd., or TGG, is an intrastate pipeline located in East Texas. TGG has access to 12 interstate pipeline markets for natural gas and transports natural gas for third-party producers as well as some of our production. During 2008, we completed an expansion to the TGG system in East Texas at a cost of approximately $37.6 million. Upon completion of this expansion in August 2008, TGG now has approximately 110 miles of pipeline and current throughput capacity of 390 Mmcf per day without compression. With compression, total throughput capacity could exceed 530 Mmcf per day. During December 2008, average throughput volume in TGG was approximately 174 Mmcf per day, of which approximately 18.0% was natural gas delivered from our exploration and production operating segment.
In August 2008, our board of directors approved construction of a 36” pipeline to be located south of Shreveport, Louisiana and to traverse our existing gathering facilities. The pipeline, which will be owned and operated by TGG, will ensure our ability to get our produced natural gas from this area to market and will provide an opportunity to generate more income by transporting additional third party natural gas from the Haynesville/Bossier shale resource play.
In support of TGG, we own and operate Talco Midstream Assets, Ltd., or Talco, a network of eight natural gas gathering systems comprised of approximately 607 miles of pipeline in our East Texas/North Louisiana area of operation, which gathers natural gas produced from the Holly/Caspiana field, Longwood/Waskom fields and other fields in East Texas and North Louisiana and transports the natural gas to TGG and larger gathering systems and intrastate, interstate and local distribution pipelines owned by third parties. The assets of Talco include gathering assets associated with the New Waskom Acquisition and the Danville Acquisition. As of December 31, 2008, of the 207 Mmcf/d of natural gas gathered and transported by this system, approximately 60.0% represents production from our assets and approximately 40.0% represents production from the assets of third parties. We transport natural gas from unaffiliated producers on our gathering and pipeline assets under fixed fee arrangements pursuant to which our gathering and transportation fee income represents an agreed rate per unit of throughput. The revenues we earn from these arrangements are directly related to the volume of natural gas that flows through our systems and are not directly dependent on commodity prices.
A gathering system and treating facility in the area of our Vernon field operations, or Vernon Gathering, gathers and transports gas from our Vernon field and, to a lesser extent, gas from third-party producers. The gathering system transports natural gas to our Caney Lake facility where the natural gas is treated and delivered to interstate pipeline systems. During December 2008, average throughput in Vernon Gathering was approximately 159 Mmcf per day, of which 98% was natural gas produced by our exploration and production operating segment.
16
Our principal customers
For the year ended December 31, 2008, sales to a natural gas marketing company, Crosstex Gulf Coast Marketing, and to a regulated natural gas utility company, Atmos Energy Marketing L.L.C. and its affiliates, accounted for approximately 12.0% and 11.2%, respectively, of total consolidated revenues. The loss of any significant customer may cause a temporary interruption in sales of, or a lower price for, our oil and natural gas.
Competition
The oil and natural gas industry is highly competitive. We encounter strong competition from other independent operators and from major oil companies in acquiring properties, contracting for drilling equipment and securing trained personnel. Competition has also been strong in hiring experienced personnel, particularly in petroleum engineering, geoscience, accounting and financial reporting, tax and land professions. Many of these competitors have financial, technical and personnel resources substantially larger than ours. As a result, our competitors may be able to pay more for desirable leases, or to evaluate, bid for and purchase a greater number of properties or prospects than our resources will permit.
We are also affected by competition for drilling rigs and the availability of related equipment. In the past, the oil and natural gas industry has experienced shortages of drilling rigs, equipment, proppant, pipe and personnel, which has delayed development drilling and other exploitation activities and has caused significant price increases. However, recent trends, particularly during the fourth quarter of 2008, have reversed the competition for drilling rigs in certain regions. We are unable to predict when, or if, shortages may again occur or how they will affect our development and exploitation program.
Competition is also strong for attractive oil and natural gas producing properties, undeveloped leases and drilling rights, and we cannot provide assurance that we will be able to compete satisfactorily. Many large oil companies have been actively marketing some of their existing producing properties for sale to independent producers.
Applicable laws and regulations
General
The oil and natural gas industry is extensively regulated by numerous federal, state and local authorities. Legislation affecting the oil and natural gas industry is under constant review for amendment or expansion, frequently increasing the regulatory burden. Also, numerous departments and agencies, both federal and state, are authorized by statute to issue rules and regulations binding on the oil and gas industry and its individual members, some of which carry substantial penalties for failure to comply. Although the regulatory burden on the oil and gas industry increases our cost of doing business and, consequently, affects our profitability, these burdens generally do not affect us any differently or to any greater or lesser extent than they affect others in our industry with similar types, quantities and locations of production.
The following is a summary of the more significant existing environmental, safety and other laws and regulations to which our business operations are subject and with which compliance may have a material adverse effect on our capital expenditures, earnings or competitive position.
Production regulation
Our production operations are subject to a number of regulations at federal, state and local levels. These regulations require, among other things, permits for the drilling of wells, drilling bonds and reports concerning operations. Most states, and some counties and municipalities, in which we operate, also regulate one or more of the following:
| | • | | the method of drilling and casing wells; |
17
| | • | | the surface use and restoration of properties upon which wells are drilled; |
| | • | | the plugging and abandoning of wells; and |
| | • | | notice to surface owners and other third parties. |
State laws regulate the size and shape of drilling and spacing units or proration units governing the pooling of oil and natural gas properties. Some states allow forced pooling or integration of tracts to facilitate exploration while other states rely on voluntary pooling of lands and leases. In some instances, forced pooling or unitization may be implemented by third parties and may reduce our interest in the unitized properties. In addition, state conservation laws establish maximum rates of production from oil and natural gas wells, generally prohibit the venting or flaring of natural gas and impose requirements regarding the ratability of production. These laws and regulations may limit the amount of oil and natural gas we can produce from our wells or limit the number of wells or the locations at which we can drill. Moreover, each state generally imposes a production or severance tax with respect to the production and sale of oil and natural gas within its jurisdiction. States do not generally regulate wellhead prices or engage in other, similar direct economic regulation, but there can be no assurance they will not do so in the future.
FERC matters
The availability, terms and cost of downstream transportation significantly affect sales of natural gas, oil and NGLs. With regard to natural gas, the interstate transportation and sale for resale is subject to federal regulation, including regulation of the terms, conditions and rates for interstate transportation, storage and various other matters, primarily by the Federal Energy Regulatory Commission, or FERC. Since 1985, the FERC has implemented regulations intended to increase competition within the natural gas industry by making natural gas transportation more accessible to gas buyers and sellers on an open-access, non-discriminatory basis. Federal and state regulations govern the rates and terms for access to intrastate natural gas pipeline transportation, while states alone regulate natural gas gathering activities. With regard to oil and NGLs, the rates and terms and conditions of service for interstate transportation is regulated by FERC. Tariffs for such transportation must be just and reasonable and not unduly discriminatory. Oil and NGL transportation that is not federally regulated is left to state regulation.
Wholesale prices for natural gas, oil and NGLs are not currently regulated and are determined by the market. We cannot predict, however, whether new legislation to regulate the price of energy commodities might be proposed, what proposals, if any, might actually be enacted by Congress or the various state legislatures, and what effect, if any, the proposals might have on the operations of the underlying properties.
Under the Energy Policy Act of 2005, FERC possesses regulatory oversight over natural gas markets, including the purchase, sale and transportation activities of non-interstate pipelines and other natural gas market participants. The Commodity Futures Trading Commission, or the CFTC, also holds authority to monitor certain segments of the physical and futures energy commodities market pursuant to the Commodity Exchange Act. With regard to our physical sales of natural gas, oil and NGLs, our gathering of any of these energy commodities, and any related hedging activities that we undertake, we are required to observe these anti-market manipulation laws and related regulations enforced by FERC and/or the CFTC. These agencies hold substantial enforcement authority, including the ability to assess civil penalties of up to $1 million per day per violation, to order disgorgement of profits and to recommend criminal penalties. Should we violate the anti-market manipulation laws and regulations, we could also be subject to related third party damage claims by, among others, sellers, royalty owners and taxing authorities.
Federal, state or Indian oil and natural gas leases
In the event we conduct operations on federal, state or Indian oil and natural gas leases, these operations must comply with numerous regulatory restrictions, including various nondiscrimination statutes, royalty and related valuation requirements, and certain of these operations must be conducted pursuant to certain on-site security regulations and other appropriate permits issued by the Bureau of Land Management, or Minerals Management Service or other appropriate federal or state agencies.
18
Other regulatory matters relating to our pipeline and gathering system assets
The pipelines we use to gather and transport our oil and natural gas are subject to regulation by the Department of Transportation, or DOT, under the Hazardous Liquid Pipeline Safety Act of 1979, as amended, or the HLPSA, with respect to oil, and the Natural Gas Pipeline Safety Act of 1968, as amended, or the NGPSA, with respect to natural gas. The HLPSA and NGPSA govern the design, installation, testing, construction, operation, replacement and management of natural gas and hazardous liquids pipeline facilities, including pipelines transporting crude oil. Where applicable, the HLPSA and NGPSA also require us and other pipeline operators to comply with regulations issued pursuant to these acts that are designed to permit access to and allow copying of records and to make certain reports available and provide information as required by the Secretary of Transportation.
The Pipeline Safety Act of 1992, as reauthorized and amended, mandates requirements in the way that the energy industry ensures the safety and integrity of its pipelines. The law applies to natural gas and hazardous liquids pipelines, including some natural gas gathering pipelines. Central to the law are the requirements it places on each pipeline operator to prepare and implement an “integrity management program.” The Pipeline Safety Act of 1992 mandates a number of other requirements, including increased penalties for violations of safety standards and qualification programs for employees who perform sensitive tasks. The DOT has established a number of rules carrying out the provisions of this act. The Pipeline and Hazardous Materials Safety Administration of DOT, or the PHMSA, has established a new risk-based approach to determine which gathering pipelines are subject to regulation, and what safety standards regulated pipelines must meet. We could incur significant expenses as a result of these laws and regulations.
U.S. federal taxation
The federal government may propose tax initiatives that affect us. We are unable to determine what effect, if any, future proposals would have on product demand or our results of operations.
U.S. environmental regulations
The exploration, development and production of oil and natural gas, including the operation of saltwater injection and disposal wells, are subject to various federal, state and local environmental laws and regulations. These laws and regulations can increase the costs of planning, designing, installing and operating oil and natural gas wells. Our domestic activities are subject to federal environmental laws and regulations, as they are amended from time to time, including, but not limited to:
| | • | | the Oil Pollution Act of 1990, or OPA; |
| | • | | the Clean Water Act, or CWA; |
| | • | | the Comprehensive Environmental Response, Compensation and Liability Act, or CERCLA; |
| | • | | the Resource Conservation and Recovery Act, or RCRA; |
| | • | | the Clean Air Act, or CAA; and |
| | • | | the Safe Drinking Water Act, or SDWA. |
Our domestic activities are also controlled by state regulations promulgated under comparable state statutes. We also are subject to regulations governing the handling, transportation, storage and disposal of naturally occurring radioactive materials that are found in our oil and natural gas operations. Administrative, civil and criminal fines and penalties may be imposed for non-compliance with environmental laws and regulations. Additionally, these laws and regulations require the acquisition of permits or other governmental authorizations before undertaking certain of our activities, limit or prohibit other activities because of protected areas or species, can impose certain substantial liabilities for the clean-up of pollution, impose certain reporting requirements, regulate remedial plugging operations to prevent future contamination and can require substantial expenditures for compliance. We cannot predict what effect future regulation or legislation, enforcement policies, and claims for damages to property, employees, other persons and the environment resulting from our operations could have on our activities.
19
Under CWA, which was amended and augmented by OPA, our release or threatened release of oil or hazardous substances into or upon waters of the United States, adjoining shorelines and wetlands and offshore areas could result in our being held responsible for: (1) the costs of removing or remediating a release; (2) administrative, civil or criminal fines or penalties; or (3) specified damages, such as loss of use, property damage and natural resource damages. The scope of our liability could be extensive depending upon the circumstances of the release. Liability can be joint and several and without regard to fault. The CWA also may impose permitting requirements for certain discharges of pollutants and requirements to develop Spill Prevention Control and Countermeasure Plans and Facility Response Plans to address potential discharges of oil into or upon waters of the United States and adjoining shorelines. State laws governing discharges to water also provide varying civil, criminal and administrative penalties and impose liabilities in the case of a discharge of petroleum or its derivatives, or other hazardous substances, into state waters.
CERCLA, as amended, and comparable state statutes, also known as Superfund laws, can impose joint, several and retroactive liability for costs of investigation and remediation and for natural resource damages, without regard to fault or the legality of the original conduct, on specified classes of persons for the release of a “hazardous substance” or under state law, other specified substances, into the environment. In practice, under circumstances where harm is divisible, clean-up costs are usually allocated among the various responsible persons. These classes of persons, or so-called potentially responsible parties, or PRPs, include the current and certain past owners and operators of a facility where there has been a release or threat of release of a hazardous substance and persons who disposed of or arranged for the disposal of hazardous substances found at a site. CERCLA also authorizes the Environmental Protection Agency, or EPA, and, in some cases, third parties to take actions in response to threats to the public health or the environment and to seek to recover from the PRPs the cost of such action. Liability can arise from conditions on properties where operations are conducted, even under circumstances where such operations were performed by third parties not under our control, and/or from conditions at third party disposal facilities where wastes from operations were sent. Although CERCLA currently exempts petroleum (including oil, natural gas and NGLs) from the definition of hazardous substance, some similar state statutes do not provide such an exemption. We cannot assure you that this exemption will be preserved in any future amendments of the act. Such amendments could have a material impact on our costs or operations. Additionally, our operations may involve the use or handling of other materials that may be classified as hazardous substances under CERCLA or regulated under similar state statutes. We may also be the owner or operator of sites on which hazardous substances have been released. To our knowledge, neither we nor our predecessors have been designated as a PRP by the EPA under CERCLA. We also do not know of any prior owners or operators of our properties that are named as PRPs related to their ownership or operation of such properties. Certain states have comparable statutes. In the event hazardous substance contamination is discovered at a site on which we are or have been an owner or operator, we could be liable for costs of investigation and remediation and natural resource damages.
RCRA and comparable state and local programs impose requirements on the management, treatment, storage and disposal of both hazardous and nonhazardous solid wastes. Although we believe we have utilized operating and waste disposal practices that were standard in the industry at the time, hydrocarbons or other solid wastes may have been disposed or released on or under the properties we own or lease or the locations where such wastes have been taken for disposal. In addition, many of these properties have been owned or operated by third parties. We have not had control over such parties’ treatment of hydrocarbons or other solid wastes and the manner in which such substances may have been disposed or released. We also generate hazardous and non-hazardous solid waste in our routine operations. It is possible that certain wastes generated by our operations, which are currently exempt from “hazardous waste” regulations under RCRA may in the future be designated as “hazardous waste” under RCRA or other applicable state statutes and therefore may be subject to more rigorous and costly management and disposal requirements.
Our operations are subject to local, state and federal regulations for the control of emissions from sources of air pollution. The CAA and analogous state laws require new and modified sources of air pollutants to obtain permits prior to commencing construction. Smaller sources may qualify for exemption from permit requirements through qualifications for permits by rule or general permits. Major sources of air pollutants are subject to more
20
stringent, federally imposed requirements including additional operating permits. Federal and state laws designed to control hazardous (i.e., toxic) air pollutants might require installation of additional controls. Administrative enforcement actions for failure to comply strictly with air pollution regulations or permits are generally resolved by payment of monetary fines and correction of any identified deficiencies. Alternatively, regulatory agencies could bring lawsuits for civil penalties or require us to forgo construction, modification or operation of certain air emission sources.
Oil and natural gas exploration and production, and possibly other activities, have been conducted at a majority of our properties by previous owners and operators. Materials from these operations remain on some of the properties and in certain instances may require remediation. In some instances, we have agreed to indemnify the sellers of producing properties from whom we have acquired reserves against certain liabilities for environmental claims associated with the properties. We do not believe the costs to be incurred by us for compliance and remediating previously or currently owned or operated properties will be material, but we cannot guarantee that result.
If in the course of our routine oil and natural gas operations surface spills and leaks occur, including casing leaks of oil or other materials, we may incur penalties and costs for waste handling, remediation and third party actions for damages. Moreover, we are only able to directly control the operations of the wells that we operate. Notwithstanding our lack of control over wells owned by us but operated by others, the failure of the operator to comply with applicable environmental regulations may be attributable to us and may impose legal liabilities upon us.
There are various federal and state programs that regulate the conservation and development of coastal resources. The federal Coastal Zone Management Act, or CZMA, was passed in 1972 to preserve and, where possible, restore the natural resources of the coastal zone of the United States. The CZMA provides for federal grants for state management programs that regulate land use, water use and coastal development. States, such as Texas, also have coastal management programs, which provide for, among other things, the coordination among local and state authorities to protect coastal resources through regulating land use, water, and coastal development. Coastal management programs also may provide for the review of state and federal agency rules and agency actions for consistency with the goals and policies of the state coastal management plan. In the event our activities trigger these programs, this review of agency rules and actions may impact other agency permitting and review activities, resulting in possible delays or restrictions of our activities and adding an additional layer of review to certain activities undertaken by us.
We do not anticipate that we will be required in the near future to expend amounts that are material in relation to our total capital expenditures program complying with current environmental laws and regulations. As these laws and regulations are frequently changed and are subject to interpretation, our assessment regarding the cost of compliance or the extent of liability risks may change in the future.
We are also unable to assure you that more stringent laws and regulations protecting the environment will not be adopted and that we will not incur material expenses in complying with them in the future. For instance, in response to studies suggesting that emissions of carbon dioxide and other greenhouse gases (GHGs) may be contributing to warming of the Earth’s atmosphere, the U.S. Congress considered climate change-related legislation to regulate GHG emissions that could affect our operations and our regulatory costs, as well as the value of oil and natural gas generally. Although that legislation did not pass, expectations are that Congress will continue to consider some type of climate change legislation. In the meantime, in its decision inMassachusetts v. EPA on April 2, 2007, the U.S. Supreme Court declared that CO2and other GHGs are “pollutants” under the federal CAA and directed the EPA to make an “endangerment” finding to determine whether it should regulate CO2and other GHGs. On July 30, 2008, the EPA issued a notice of proposed rulemaking, exploring ways in which it might regulate GHGs. Since then, the EPA Administrator, in response to an Environmental Appeals Board decision, has issued an interpretative memo explaining the agency’s view that CO2and other GHGs need not be considered in issuing certain air quality permits under present programs. Environmental groups have indicated they intend to challenge this interpretation. As a result, there is a great deal of uncertainty as to how and when federal regulation of GHGs might take place. In addition to possible federal regulation, a number of states, individually and regionally, also are considering or have implemented GHG regulatory programs. These potential
21
federal and state initiatives may result in so-called cap-and-trade programs, under which overall GHG emissions are limited and GHG emissions are then allocated and sold, and possibly other regulatory requirements, that could result in our incurring material expenses to comply, e.g., by being required to purchase or to surrender allowances for GHGs resulting from our operations. These regulatory initiatives also could adversely affect the marketability of the oil and natural gas we produce.
If substantial liabilities to third parties or governmental entities are incurred, the payment of such claims may reduce or eliminate the funds available for project investment or result in loss of our properties. Although we maintain insurance coverage we consider to be customary in the industry, we are not fully insured against all of these risks, either because insurance is not available or because of high premiums. Accordingly, we may be subject to liability or may lose substantial portions of properties due to hazards that cannot be insured against or have not been insured against due to prohibitive premiums or for other reasons. The imposition of any of these liabilities or compliance obligations on us may have a material adverse effect on our financial condition and results of operations.
OSHA and other regulations
We are subject to the requirements of the federal Occupational Safety and Health Act, or OSHA, and comparable state statutes. The OSHA hazard communication standard, the EPA community right-to-know regulations under the Title III of CERCLA and similar state statutes require that we organize and/or disclose information about hazardous materials used or produced in our operations. We believe that we are in substantial compliance with these applicable requirements and with other OSHA and comparable requirements.
Title to our properties
When we acquire developed properties, we conduct a title investigation. However, when we acquire undeveloped properties, as is common industry practice, we usually conduct little or no investigation of title other than a preliminary review of local mineral records. We do conduct title investigations and, in most cases, obtain a title opinion of local counsel before we begin drilling operations. We believe that the methods we utilize for investigating title prior to acquiring any property are consistent with practices customary in the oil and natural gas industry and that our practices are adequately designed to enable us to acquire good title to properties. However, some title risks cannot be avoided, despite the use of customary industry practices.
Our properties are generally burdened by:
| | • | | customary royalty and overriding royalty interests; |
| | • | | liens incident to operating agreements; and |
| | • | | liens for current taxes and other burdens and minor encumbrances, easements and restrictions. |
We believe that none of these burdens either materially detract from the value of our properties or materially interfere with property used in the operation of our business. Substantially all of our properties are pledged as collateral under our credit agreements.
Our employees
As of December 31, 2008, we employed 892 persons. None of our employees are represented by unions or covered by collective bargaining agreements. To date, we have not experienced any strikes or work stoppages due to labor problems, and we consider our relations with our employees to be good. We also utilize the services of independent consultants on a contract basis.
22
Forward-looking statements
This Annual Report on Form 10-K contains forward-looking statements, as defined in Section 27A of the Securities Act of 1933 and Section 21E of the Securities Exchange Act of 1934, or the Exchange Act. These forward-looking statements relate to, among other things, the following:
| | • | | our future financial and operating performance and results; |
| | • | | our future use of derivative financial instruments; and |
| | • | | our plans and forecasts. |
We have based these forward-looking statements on our current assumptions, expectations and projections about future events.
We use the words “may,” “expect,” “anticipate,” “estimate,” “believe,” “continue,” “intend,” “plan,” “budget” and other similar words to identify forward-looking statements. You should read statements that contain these words carefully because they discuss future expectations, contain projections of results of operations or of our financial condition and/or state other “forward-looking” information. We do not undertake any obligation to update or revise publicly any forward-looking statements, except as required by law. These statements also involve risks and uncertainties that could cause our actual results or financial condition to materially differ from our expectations in this Annual Report on Form 10-K, including, but not limited to:
| | • | | fluctuations in prices of oil and natural gas; |
| | • | | imports of foreign oil and natural gas, including liquefied natural gas; |
| | • | | future capital requirements and availability of financing; |
| | • | | continued disruption of credit and capital markets and the ability of financial institutions to honor their commitments, such as the events which occurred during the third quarter of 2008 and thereafter, for an extended period of time; |
| | • | | estimates of reserves and economic assumptions used in connection with our acquisitions; |
| | • | | geological concentration of our reserves; |
| | • | | risks associated with drilling and operating wells; |
| | • | | exploratory risks, including our Marcellus and Huron shale plays in Appalachia and the Haynesville/Bossier shale play in East Texas/North Louisiana; |
| | • | | risks associated with the operation of natural gas pipelines and gathering systems; |
| | • | | discovery, acquisition, development and replacement of oil and natural gas reserves; |
| | • | | cash flow and liquidity; |
| | • | | timing and amount of future production of oil and natural gas; |
| | • | | availability of drilling and production equipment; |
| | • | | marketing of oil and natural gas; |
| | • | | developments in oil-producing and natural gas-producing countries; |
| | • | | title to our properties; |
23
| | • | | general economic conditions, including costs associated with drilling and operations of our properties; |
| | • | | environmental or other governmental regulations, including legislation to reduce emissions of greenhouse gases; |
| | • | | receipt and collectability of amounts owed to us by purchasers of our production and counterparties to our derivative financial instruments; |
| | • | | decisions whether or not to enter into derivative financial instruments; |
| | • | | events similar to those of September 11, 2001; |
| | • | | actions of third party co-owners of interests in properties in which we also own an interest; |
| | • | | fluctuations in interest rates; and |
| | • | | our ability to effectively integrate companies and properties that we acquire. |
We believe that it is important to communicate our expectations of future performance to our investors. However, events may occur in the future that we are unable to accurately predict, or over which we have no control. You are cautioned not to place undue reliance on a forward-looking statement. When considering our forward-looking statements, you should keep in mind the risk factors and other cautionary statements in this Annual Report on Form 10-K. The risk factors noted in this Annual Report on Form 10-K and other factors noted throughout this Annual Report on Form 10-K provide examples of risks, uncertainties and events that may cause our actual results to differ materially from those contained in any forward-looking statement. Please see “Item 1A. Risk factors” for a discussion of certain risks of our business and an investment in our common stock.
Our revenues, operating results, financial condition and ability to borrow funds or obtain additional capital depend substantially on prevailing prices for oil and natural gas. Declines in oil or natural gas prices may materially adversely affect our financial condition, liquidity, ability to obtain financing and operating results. Lower oil or natural gas prices may also reduce the amount of oil or natural gas that we can produce economically. A decline in oil and/or natural gas prices could have a material adverse effect on the estimated value and estimated quantities of our oil and natural gas reserves, our ability to fund our operations and our financial condition, cash flow, results of operations and access to capital. Historically, oil and natural gas prices and markets have been volatile, with prices fluctuating widely, and they are likely to continue to be volatile.
Glossary of selected oil and natural gas terms
The following are abbreviations and definitions of terms commonly used in the oil and natural gas industry and this Annual Report on Form 10-K.
Bbl. One stock tank barrel, or 42 U.S. gallons liquid volume, used in reference to oil or other liquid hydrocarbons.
Bcf. One billion cubic feet of natural gas.
Bcfe. One billion cubic feet equivalent calculated by converting one Bbl of oil or NGLs to six Mcf of natural gas.
Btu. British thermal unit, which is the heat required to raise the temperature of a one pound mass of water from 58.5 to 59.5 degrees Fahrenheit.
Commercial Well; Commercially Productive Well. An oil and natural gas well which produces oil and natural gas in sufficient quantities such that proceeds from the sale of such production exceed production expenses and taxes.
Completion. The installation of permanent equipment for the production of oil or natural gas, or, in the case of a dry hole, the reporting of abandonment to the appropriate agency.
24
Developed Acreage. The number of acres which are allocated or assignable to producing wells or wells capable of production.
Development Well. A well drilled within the proved area of an oil or natural gas reservoir, or which extends a proved reservoir, to the depth of a stratigraphic horizon known to be productive.
Downspacing Wells. Additional wells drilled between known producing wells to better exploit the reservoir.
Dry Hole; Dry Well. A well found to be incapable of producing either oil or natural gas in sufficient quantities to justify completion as an oil or natural gas well.
Exploitation. The continuing development of a known producing formation in a previously discovered field. To maximize the ultimate recovery of oil or natural gas from the field by development wells, secondary recovery equipment or other suitable processes and technology.
Exploratory Well. A well drilled to find and produce oil or natural gas in an unproved area or to find a new reservoir in a field previously found to be productive of oil or natural gas in another reservoir.
Farmout. An assignment of an interest in a drilling location and related acreage conditional upon the drilling of a well on that location.
Formation. A succession of sedimentary beds that were deposited under the same general geologic conditions.
Full Cost Pool. The full cost pool consists of all costs associated with property acquisition, exploration, and development activities for a company using the full cost method of accounting. Additionally, any internal costs that can be directly identified with acquisition, exploration and development activities are included. Any costs related to production, general corporate overhead or similar activities are not included.
Gross Acres or Gross Wells. The total acres or wells, as the case may be, in which a working interest is owned.
Held by production. A provision in an oil, gas and mineral lease that perpetuates a company’s right to operate a property or concession as long as the property or concession produces a minimum paying quantity of oil or gas.
Horizontal Wells. Wells which are drilled at angles greater than 70 degrees from vertical.
Infill drilling. Drilling of a well between known producing wells to better exploit the reservoir.
Initial production rate. Generally, the maximum 24 hour production volume from a well.
Mbbl. One thousand stock tank barrels.
Mcf. One thousand cubic feet of natural gas.
Mcfe. One thousand cubic feet equivalent calculated by converting one Bbl of oil or NGLs to six Mcf of natural gas.
Mmbbl. One million stock tank barrels.
Mmbtu. One million British thermal units.
Mmcf. One million cubic feet of natural gas.
Mmcf/d. One million cubic feet of natural gas per day.
Mmcfe. One million cubic feet equivalent calculated by converting one Bbl of oil or NGLs to six Mcf of natural gas.
Mmcfe/d. One million cubic feet equivalent per day calculated by converting one Bbl of oil or NGLs to six Mcf of natural gas.
Mmmbtu. One billion British thermal units.
25
NYMEX. New York Mercantile Exchange.
NGLs. The combination of ethane, propane, butane and natural gasolines that when removed from natural gas become liquid under various levels of higher pressure and lower temperature.
Overriding royalty interest. An interest in an oil and/or natural gas property entitling the owner to a share of oil and natural gas production free of costs of production.
Play. A term applied to a portion of the exploration and production cycle following the identification by geologists and geophysicists of areas with potential oil and gas reserves.
Present value of estimated future net revenues or PV-10. The present value of estimated future net revenues is an estimate of future net revenues from a property at the date indicated, without giving effect to derivative financial instrument activities, after deducting production and ad valorem taxes, future capital costs, abandonment costs and operating expenses, but before deducting federal income taxes. The future net revenues have been discounted at an annual rate of 10% to determine their “present value.” The present value is shown to indicate the effect of time on the value of the net revenue stream and should not be construed as being the fair market value of the properties. Estimates have been made using constant oil and natural gas prices and operating costs at the date indicated, at its acquisition date, or as otherwise indicated. We believe that the present value of estimated future net revenues before income taxes, while not a financial measure in accordance with GAAP, is an important financial measure used by investors and independent oil and natural gas producers for evaluating the relative significance of oil and natural gas properties and acquisitions because the tax characteristics of comparable companies can differ materially.
Productive Well. A productive well is a well that is not a dry well.
Proved Developed Reserves. Reserves that can be expected to be recovered through existing wells with existing equipment and operating methods. Additional oil and natural gas expected to be obtained through the application of fluid injection or other improved recovery techniques for supplementing the natural forces and mechanisms of primary recovery should be included as “proved developed reserves” only after testing by a pilot project or after the operation of an installed program has confirmed through production response that increased recovery will be achieved.
Proved Reserves. The estimated quantities of crude oil, natural gas and natural gas liquids which geological and engineering data demonstrate with reasonable certainty to be recoverable in future years from known reservoirs under existing economic and operating conditions, i.e., prices and costs as of the date the estimate is made. Prices include consideration of changes in existing prices provided only by contractual arrangements, but not on escalations based upon future conditions.
Reservoirs are considered proved if economic producibility is supported by either actual production or conclusive formation test. The area of a reservoir considered proved includes (A) that portion delineated by drilling and defined by gas-oil and/or oil-water contacts, if any, and (B) the immediately adjoining portions not yet drilled, but which can be reasonably judged as economically productive on the basis of available geological and engineering data. In the absence of information on fluid contacts, the lowest known structural occurrence of hydrocarbons controls the lower proved limit of the reservoir.
Reserves which can be produced economically through application of improved recovery techniques (such as fluid injection) are included in the proved classification when successful testing by a pilot project, or the operation of an installed program in the reservoir, provides support for the engineering analysis on which the project or program was based.
Estimates of Proved Reserves do not include the following: (A) oil that may become available from known reservoirs but is classified separately as indicated additional reserves; (B) crude oil, natural gas, and natural gas liquids, the recovery of which is subject to reasonable doubt because of uncertainty as to geology, reservoir characteristics, or economic factors; (C) crude oil, natural gas, and natural gas liquids, that may occur in undrilled prospects; and (D) crude oil, natural gas, and natural gas liquids, that may be recovered from oil shales, coal, gilsonite and other such sources.
26
Proved Undeveloped Reserves. Reserves that are expected to be recovered from new wells on undrilled acreage or from existing wells where a relatively major expenditure is required for recompletion. Reserves on undrilled acreage shall be limited to those drilling units offsetting productive units that are reasonably certain of production when drilled. Proved Reserves for other undrilled units can be claimed only where it can be demonstrated with certainty that there is continuity of production from the existing productive formation. Under no circumstances should estimates for proved undeveloped reserves be attributable to any acreage for which an application of fluid injection or other improved recovery technique is contemplated, unless such techniques have been proved effective by actual tests in the area and in the same reservoir.
Recompletion. An operation within an existing well bore to make the well produce oil and/or gas from a different, separately producible zone other than the zone from which the well had been producing.
Reserve Life. The estimated productive life, in years, of a proved reservoir based upon the economic limit of such reservoir producing hydrocarbons in paying quantities assuming certain price and cost parameters. For purposes of this Annual Report on Form 10-K, reserve life is calculated by dividing the Proved Reserves (on a Mmcfe basis) at the end of the period by production volumes for the previous 12 months.
Reservoir. A porous and permeable underground formation containing a natural accumulation of producible oil or natural gas that is confined by impermeable rock or water barriers and is individual and separate from other reserves.
Royalty interest. An interest in an oil and/or natural gas property entitling the owner to a share of oil and natural gas production free of costs of production.
Shale. Fine-grained sedimentary rock composed mostly of consolidated clay or mud. Shale is the most frequently occurring sedimentary rock.
Standardized Measure of discounted future net cash flows or the Standardized Measure. Under the Standardized Measure, future cash flows are estimated by applying year-end prices, adjusted for fixed and determinable escalations, to the estimated future production of year-end Proved Reserves. Future cash inflows are reduced by estimated future production and development costs based on period-end and future plugging and abandonment costs to determine pre-tax cash inflows. Future income taxes are computed by applying the statutory tax rate to the excess of pre-tax cash inflows over our tax basis in the associated properties. Future net cash inflows after income taxes are discounted using a 10% annual discount rate to arrive at the Standardized Measure.
Stock tank barrel. 42 U.S. gallons liquid volume.
Tcf. One trillion cubic feet of natural gas.
Tcfe. One trillion cubic feet equivalent calculated by converting one Bbl of oil or NGLs to six Mcf of natural gas.
Undeveloped Acreage. Lease acreage on which wells have not been drilled or completed to a point that would permit the production of commercial quantities of oil and natural gas regardless of whether such acreage contains Proved Reserves.
3-D seismic. Geophysical data that depict the subsurface strata in three dimensions. 3-D seismic typically provides a more detailed and accurate interpretation of the subsurface strata than 2-D, or two-dimensional, seismic.
Working interest. The operating interest that gives the owner the right to drill, produce and conduct activities on the property and a share of production.
Workovers. Operations on a producing well to restore or increase production.
27
Available information
We make our filings with the SEC available, free of charge, on our website atwww.excoresources.com as soon as reasonably practicable after those reports and other information are electronically filed with or furnished to the SEC.
The risk factors noted in this section and other factors noted throughout this Annual Report on Form 10-K, including those risks identified in “Item 7. Management’s discussion and analysis of financial condition and results of operations” describe examples of risks, uncertainties and events that may cause our actual results to differ materially from those contained in any forward-looking statement.
If one or more of these risks or uncertainties materialize, or if underlying assumptions prove incorrect, actual outcomes may vary materially from those included in this Annual Report on Form 10-K.
Risks relating to our business
Fluctuations in oil and natural gas prices, which have been volatile at times, may adversely affect our revenues as well as our ability to maintain or increase our borrowing capacity, repay current or future indebtedness and obtain additional capital on attractive terms.
Our future financial condition, access to capital, cash flow and results of operations depend upon the prices we receive for our oil and natural gas. We are particularly dependent on prices for natural gas. As of December 31, 2008, 93.6% of our Proved Reserves were natural gas. Historically, oil and natural gas prices have been volatile and are subject to fluctuations in response to changes in supply and demand, market uncertainty and a variety of additional factors that are beyond our control. Factors that affect the prices we receive for our oil and natural gas include:
| | • | | the level of domestic production; |
| | • | | the availability of imported oil and natural gas; |
| | • | | political and economic conditions and events in foreign oil and natural gas producing nations, including embargoes, continued hostilities in the Middle East and other sustained military campaigns, and acts of terrorism or sabotage; |
| | • | | the ability of members of the Organization of Petroleum Exporting Countries to agree to and maintain oil price and production controls; |
| | • | | the cost and availability of transportation and pipeline systems with adequate capacity; |
| | • | | the cost and availability of other competitive fuels; |
| | • | | fluctuating and seasonal demand for oil, natural gas and refined products; |
| | • | | concerns about global warming or other conservation initiatives and the extent of governmental price controls and regulation of production; |
| | • | | foreign and domestic government relations; and |
| | • | | overall economic conditions, particularly the recent worldwide economic slowdown which has put downward pressure on oil and natural gas prices and demand. |
In the past, prices of oil and natural gas have been extremely volatile, and we expect this volatility to continue. During 2008, the NYMEX price for natural gas has fluctuated from a high of $13.58 per Mmbtu to a low of $5.29 per Mmbtu, while the NYMEX West Texas Intermediate crude oil price ranged from a high of $145.29 per barrel to a low of $33.87 per barrel. For the five years ended December 31, 2008, the NYMEX
28
Henry Hub natural gas price ranged from a high of $15.38 per Mmbtu to a low of $4.20 per Mmbtu, while the NYMEX West Texas Intermediate crude oil price ranged from a high of $145.29 per barrel to a low of $32.48 per barrel. On December 31, 2008, the spot market price for natural gas at Henry Hub was $5.71 per Mmbtu, a 16.0% decrease from December 31, 2007. On December 31, 2008, the spot market price for crude oil at Cushing was $44.60 per barrel, a 53.5% decrease from December 31, 2007. In 2008, our average realized prices (before the impact of derivative financial instruments) for oil and natural gas were $96.93 per Bbl and $9.06 per Mcf compared with 2007 average realized prices of $71.17 per Bbl and $6.81 per Mcf, respectively.
Our revenues, cash flow and profitability and our ability to maintain or increase our borrowing capacity, to repay current or future indebtedness and to obtain additional capital on attractive terms depend substantially upon oil and natural gas prices.
Changes in the differential between NYMEX or other benchmark prices of oil and natural gas and the reference or regional index price used to price our actual oil and natural gas sales could have a material adverse effect on our results of operations and financial condition.
The reference or regional index prices that we use to price our oil and natural gas sales sometimes reflect a discount to the relevant benchmark prices, such as NYMEX. The difference between the benchmark price and the price we reference in our sales contracts is called a differential. We cannot accurately predict oil and natural gas differentials. Changes in differentials between the benchmark price for oil and natural gas and the reference or regional index price we reference in our sales contracts could have a material adverse effect on our results of operations and financial condition. During 2008, the volatility of differentials, particularly in the Mid-Continent and Permian market regions fluctuated dramatically when compared to prior years.
There are risks associated with our drilling activity that could impact the results of our operations.
Our drilling involves numerous risks, including the risk that we will not encounter commercially productive oil or natural gas reservoirs. We must incur significant expenditures to identify and acquire properties and to drill and complete wells. Additionally, seismic technology does not allow us to know conclusively prior to drilling a well that oil or natural gas is present or economically producible. The costs of drilling and completing wells are often uncertain, and drilling operations may be curtailed, delayed or canceled as a result of a variety of factors, including unexpected drilling conditions, pressure or irregularities in formations, equipment failures or accidents, weather conditions and shortages or delays in the delivery of equipment. We have experienced some delays in contracting for drilling rigs and increasing costs to drill wells. All of these risks could adversely affect our results of operations and financial condition.
Part of our strategy involves drilling in new or emerging shale resource plays. As a result, our drilling results in these areas are subject to more uncertainties than our drilling program in the more established shallower formations and may not meet our expectations for reserves or production.
The results of our drilling in new or emerging shale resource plays, such as the Haynesville/Bossier shale and the Marcellus shale, are more uncertain than drilling results in areas that are developed and have established production. Since new or emerging plays and new formations have limited or no production history, we are less able to use past drilling results in those areas to help predict our future drilling results. In addition, part of our drilling strategy to maximize recoveries from the shale resource plays involves the drilling of horizontal wells using completion techniques that have proven to be successful in other shale formations. Our experience with horizontal drilling of the Haynesville/Bossier shale and the Marcellus shale to date, as well as the industry’s drilling and production history in these formations, is limited. To the extent we are unable to execute our expected drilling program in these areas because of capital constraints, lease expirations, regulatory and permitting delays, inadequate drilling or completion techniques, lack of access to adequate gathering systems or pipeline take-away capacity, or unavailability of drilling rigs and other services, the return on our investment in these areas may not be as attractive as we anticipate and our common stock price may decrease. We could incur material write-downs of unevaluated properties, and the value of our undeveloped acreage could decline in the future if our drilling results are unsuccessful. This is especially true in the Marcellus shale, where our shale
29
acreage is principally located in Pennsylvania. Lack of experienced oil field personnel, service providers and natural gas gathering and pipeline infrastructure, as well as significant regulatory and permitting delays would impact our ability to exploit this play for at least the near term.
Our use of derivative financial instruments is subject to risks that our counterparties may default on their contractual obligations to us and may cause us to forego additional future profits or result in our making cash payments.
To reduce our exposure to changes in the prices of oil and natural gas, we have entered into and may in the future enter into derivative financial instrument arrangements for a portion of our oil and natural gas production. The agreements that we have entered into generally have the effect of providing us with a fixed price for a portion of our expected future oil and natural gas production over a fixed period of time. Our derivative financial instruments are subject to mark-to-market accounting treatment. The change in the fair market value of these instruments is reported as a non-cash item in our statement of operations each quarter, which typically result in significant variability in our net income. Derivative financial instruments expose us to the risk of financial loss and may limit our ability to benefit from increases in oil and natural gas prices in some circumstances, including the following:
| | • | | the counterparty to the derivative financial instrument contract may default on its contractual obligations to us; |
| | • | | there may be a change in the expected differential between the underlying price in the derivative financial instrument agreement and actual prices received; or |
| | • | | market prices may exceed the prices which we are contracted to receive, resulting in our need to make significant cash payments. |
Our use of derivative financial instruments could have the effect of reducing our revenues and the value of our common stock. During the year ended December 31, 2008, we made cash payments to settle our derivative financial instrument contracts totaling $109.3 million. During the year ended December 31, 2007, we received cash settlements from our derivative financial instrument contracts totaling $108.4 million. For the year ended December 31, 2008, a $1.00 increase in the average commodity price per Mcfe would have resulted in an increase in cash settlement payments (or a decrease in settlements received) of approximately $115.3 million. As of December 31, 2008, the net unrealized gains on our oil and natural gas derivative financial instrument contracts was $493.7 million. The ultimate settlement amount of these unrealized derivative financial instrument contracts is dependent on future commodity prices. In connection with the acquisition of our East Texas and North Louisiana oil and natural gas properties and midstream assets of Winchester Acquisition, Inc. on October 2, 2006, or the Winchester Acquisition, our acquisition of TXOK Acquisition, Inc., or TXOK, on February 14, 2006, or the TXOK Acquisition, the Vernon Acquisition and the Southern Gas Acquisition, we assumed additional derivative financial instruments covering a significant portion of estimated future production. We may incur significant unrealized losses in the future from our use of derivative financial instruments to the extent market prices increase and our derivatives contracts remain in place. See “—Item 7. Management’s discussion and analysis of financial condition and results of operations—Our results of operations—Derivative financial instruments.”
We incurred a substantial amount of indebtedness to fund our acquisitions, which may adversely affect our cash flow and our ability to operate our business, remain in compliance with debt covenants and make payments on our debt.
In connection with our oil, natural gas and midstream acquisitions and 2008 leasing activities, we have increased our consolidated indebtedness from $2.1 billion at December 31, 2006 to $3.0 billion at December 31, 2008. To service this indebtedness, we will require a significant amount of cash. Our ability to generate cash depends on many factors beyond our control, and any failure to meet our debt obligations could harm our business, financial condition and results of operations. If our operating cash flow and other capital resources are insufficient to fund our debt obligations, we may be forced to sell assets, seek additional equity or debt capital or restructure our debt. None of these remedies may, if necessary, be effected on commercially reasonable terms, or
30
at all. Our cash flow and capital resources may be insufficient for payment of interest on and principal of our debt under our credit facilities, which could cause us to default on our obligations and could impair our liquidity.
We may be unable to acquire or develop additional reserves, which would reduce our revenues and access to capital.
Our success depends upon our ability to find, develop or acquire additional oil and natural gas reserves that are profitable to produce. Factors that may hinder our ability to acquire additional oil and natural gas reserves include competition, access to capital, prevailing oil and natural gas prices and the number and attractiveness of properties for sale. If we are unable to conduct successful development activities or acquire properties containing Proved Reserves, our total Proved Reserves will generally decline as a result of production. Also, our production will generally decline. In addition, if our reserves and production decline, then the amount we are able to borrow under our credit agreements will also decline. We may be unable to locate additional reserves, drill economically productive wells or acquire properties containing Proved Reserves.
We may not identify all risks associated with the acquisition of oil and natural gas properties, and any indemnifications we receive from sellers may be insufficient to protect us from such risks, which may result in unexpected liabilities and costs to us.
Generally, it is not feasible for us to review in detail every individual property involved in an acquisition. Our business strategy focuses on acquisitions of producing oil and natural gas properties. Any future acquisitions will require an assessment of recoverable reserves, title, future oil and natural gas prices, operating costs, potential environmental hazards, potential tax and Employee Retirement Security Act, or ERISA, liabilities, and other liabilities and other similar factors. Ordinarily, our review efforts are focused on the higher-valued properties. For example, in the Winchester Acquisition, the Vernon Acquisition, the Southern Gas Acquisition and the Appalachian Acquisition, we did not review title or production data for, or physically inspect, every well we acquired. Even a detailed review of properties and records may not reveal existing or potential problems, nor will it permit us to become sufficiently familiar with the properties to assess fully their deficiencies and capabilities. We do not inspect every well that we acquire. Potential problems, such as deficiencies in the mechanical integrity of equipment or environmental conditions that may require significant remedial expenditures, are not necessarily observable even when we inspect a well. Any unidentified problems could result in material liabilities and costs that negatively impact our financial condition and results of operations.
Even if we are able to identify problems with an acquisition, the seller may be unwilling or unable to provide effective contractual protection or indemnity against all or part of these problems. Even if a seller agrees to provide indemnity, the indemnity may not be fully enforceable and may be limited by floors and caps on such indemnity. The indemnifications we received in the Winchester Acquisition, the Vernon Acquisition, the Southern Gas Acquisition and the Appalachian Acquisition are subject to floors, caps and time limitations and do not cover all these types of risks.
We may be unable to obtain additional financing to implement our growth strategy.
The growth of our business will require substantial capital on a continuing basis. Due to the amount of debt we have incurred, it may be difficult for us in the foreseeable future to obtain additional debt financing on an unsecured basis or to obtain additional secured financing other than purchase money indebtedness. If we are unable to obtain additional capital on satisfactory terms and conditions, we may lose opportunities to acquire oil and natural gas properties and businesses and, therefore, be unable to implement our growth strategy.
We may not be successful in managing our growth, which could adversely affect our operations and net revenues.
The pursuit of additional acquisitions is part of our strategy. We face challenges in growing our managerial, financial, accounting, technical, operational and administrative resources to keep up with the pace of the growth of our business and our significant corporate transactions such as the Winchester Acquisition, the Vernon
31
Acquisition, the Southern Gas Acquisition and the Appalachian Acquisition. For example, our rapid growth and significant transactions over the past two years have strained, and could continue to strain, our financial, tax and accounting staff. The size and scope of our business from an operational, personnel, financial reporting and accounting perspective have substantially increased due to the Winchester Acquisition, the Vernon Acquisition, the Southern Gas Acquisition and the Appalachian Acquisition. Our growth could disrupt our ongoing business, distract management, divert resources and make it difficult to maintain our current business standards as well as internal controls and procedures. Failure to manage our growth successfully could adversely affect our operations and net revenues through increased operating costs and revenues that do not meet our expectations, as well as adversely affect our ability to satisfy our disclosure and other obligations. We may also be unable to successfully integrate acquired oil and natural gas properties into our operations or achieve desired profitability.
If we are unable to successfully prevent or address material weaknesses in our internal control over financial reporting, or any other control deficiencies, our ability to report our financial results on a timely and accurate basis and to comply with disclosure and other requirements may be adversely affected.
Section 404 of the Sarbanes-Oxley Act of 2002 requires companies subject to the act to disclose any material weaknesses discovered through management’s assessments. We are required to comply with Section 404 of the Sarbanes-Oxley Act of 2002. Prior to December 31, 2007, we were not required to make an assessment of the effectiveness of our internal control over financial reporting for that purpose. In addition, prior to the quarter ended September 30, 2006, our management concluded that our disclosure controls and procedures were not effective due to a material weakness relating to accounting for income taxes. Although we remediated this material weakness, we may identify additional material weaknesses or other deficiencies in our internal control over financial reporting in the future.
A material weakness is a deficiency, or a combination of deficiencies, in internal control over financial reporting, such that there is a reasonable possibility that a material misstatement of our company’s annual or interim financial statements will not be prevented or detected on a timely basis.
We will continue to monitor the effectiveness of these and other processes, procedures and controls and will make any further changes management determines appropriate, including to effect compliance with Section 404 of the Sarbanes-Oxley Act of 2002.
Any material weaknesses or other deficiencies in our internal control over financial reporting may affect our ability to comply with SEC reporting requirements and the New York Stock Exchange, or NYSE, listing standards or cause our financial statements to contain material misstatements, which could negatively affect the market price and trading liquidity of our common stock, cause investors to lose confidence in our reported financial information, as well as subject us to civil or criminal investigations and penalties.
There are inherent limitations in all internal control systems over financial reporting, and misstatements due to error or fraud may occur and not be detected.
While we have taken actions designed to address compliance with the internal control, disclosure control and other requirements of the Sarbanes-Oxley Act of 2002 and the rules and regulations promulgated by the SEC implementing these requirements, there are inherent limitations in our ability to control all circumstances. Our management, including our Chief Executive Officer, Chief Financial Officer and Chief Accounting Officer, does not expect that our internal controls and disclosure controls will prevent all error and all fraud. A control system, no matter how well conceived and operated, can provide only reasonable, not absolute, assurance that the objectives of the control system are met. In addition, the design of a control system must reflect the fact that there are resource constraints and the benefit of controls must be relative to their costs. Because of the inherent limitations in all control systems, no evaluation of controls can provide absolute assurance that all control issues and instances of fraud, if any, in our company have been detected. These inherent limitations include the realities that judgments in decision-making can be faulty and that breakdowns can occur because of simple errors or mistakes. Further, controls can be circumvented by individual acts of some persons, by collusion of two or more persons, or by management override of the controls. The design of any system of controls also is based in part
32
upon certain assumptions about the likelihood of future events, and there can be no assurance that any design will succeed in achieving its stated goals under all potential future conditions. Over time, a control may be inadequate because of changes in conditions, such as growth of our company or increased transaction volume, or the degree of compliance with the policies or procedures may deteriorate. Because of inherent limitations in a cost-effective control system, misstatements due to error or fraud may occur and not be detected.
We may encounter obstacles to marketing our oil and natural gas, which could adversely impact our revenues.
Our ability to market our oil and natural gas production will depend upon the availability and capacity of natural gas gathering systems, pipelines and other transportation facilities. We are primarily dependent upon third parties to transport our products. Transportation space on the gathering systems and pipelines we utilize is occasionally limited or unavailable due to repairs, outages caused by accidents or other events, or improvements to facilities or due to space being utilized by other companies that have priority transportation agreements. We experienced production curtailments in the Appalachian Basin during 2006, 2007 and 2008 resulting from capacity restraints and short term shutdowns of certain pipelines for maintenance purposes. Our access to transportation options can also be affected by U.S. federal and state regulation of oil and natural gas production and transportation, general economic conditions and changes in supply and demand. These factors and the availability of markets are beyond our control. If market factors dramatically change, the impact on our revenues could be substantial and could adversely affect our ability to produce and market oil and natural gas, the value of our common stock and our ability to pay dividends on our company stock.
We may not correctly evaluate reserve data or the exploitation potential of properties as we engage in our acquisition, development, and exploitation activities.
Our future success will depend on the success of our acquisition, development, and exploitation activities. Our decisions to purchase, develop or otherwise exploit properties or prospects will depend in part on the evaluation of data obtained from production reports and engineering studies, geophysical and geological analyses and seismic and other information, the results of which are often inconclusive and subject to various interpretations. Our estimates regarding the increase in our reserves and production resulting from the Winchester Acquisition, the Vernon Acquisition, the Southern Gas Acquisition, the Appalachian Acquisition and the Danville Acquisition may prove to be incorrect, which could significantly reduce our ability to generate cash needed to service our debt and fund our capital program and other working capital requirements.
We cannot control the development of the properties we own but do not operate, which may adversely affect our production, revenues and results of operations.
As of December 31, 2008, third parties operate wells that represent approximately 4.8% of our Proved Reserves. As a result, the success and timing of our drilling and development activities on those properties depend upon a number of factors outside of our control, including:
| | • | | the timing and amount of capital expenditures; |
| | • | | the operators’ expertise and financial resources; |
| | • | | the approval of other participants in drilling wells; and |
| | • | | the selection of suitable technology. |
If drilling and development activities are not conducted on these properties or are not conducted on a timely basis, we may be unable to increase our production or offset normal production declines, which may adversely affect our production, revenues and results of operations.
Our estimates of oil and natural gas reserves involve inherent uncertainty, which could materially affect the quantity and value of our reported reserves and our financial condition.
Numerous uncertainties are inherent in estimating quantities of proved oil and natural gas reserves, including many factors beyond our control. This Annual Report on Form 10-K contains estimates of our proved
33
oil and natural gas reserves and the PV-10 and Standardized Measure of our proved oil and natural gas reserves. These estimates are based upon reports of our independent petroleum engineers. These reports rely upon various assumptions, including assumptions required by the SEC as to constant oil and natural gas prices, drilling and operating expenses, capital expenditures, taxes and availability of funds. These estimates should not be construed as the current market value of our estimated Proved Reserves. The process of estimating oil and natural gas reserves is complex, requiring significant decisions and assumptions in the evaluation of available geological, engineering and economic data for each reservoir. As a result, the estimates are inherently imprecise evaluations of reserve quantities and future net revenue. Our actual future production, revenues, taxes, development expenditures, operating expenses and quantities of recoverable oil and natural gas reserves may vary substantially from those we have assumed in the estimates. Any significant variance in our assumptions could materially affect the quantity and value of reserves, the amount of PV-10 and Standardized Measure described in this Annual Report on Form 10-K, and our financial condition. In addition, our reserves or PV-10 and Standardized Measure may be revised downward or upward, based upon production history, results of future exploitation and development activities, prevailing oil and natural gas prices and other factors. A material decline in prices paid for our production can adversely impact the estimated volumes of our reserves. Similarly, a decline in market prices for oil or natural gas may adversely affect our PV-10 and Standardized Measure. Any of these negative effects on our reserves or PV-10 and Standardized Measure may decrease the value of our common stock.
We are exposed to operating hazards and uninsured risks that could adversely impact our results of operations and cash flow.
Our operations are subject to the risks inherent in the oil and natural gas industry, including the risks of:
| | • | | fires, explosions and blowouts; |
| | • | | abnormally pressured formations; and |
| | • | | environmental accidents such as oil spills, gas leaks, ruptures or discharges of toxic gases, brine or well fluids into the environment (including groundwater contamination). |
We have in the past experienced some of these events during our drilling operations. These events may result in substantial losses to us from:
| | • | | injury or loss of life; |
| | • | | severe damage to or destruction of property, natural resources and equipment; |
| | • | | pollution or other environmental damage; |
| | • | | environmental clean-up responsibilities; |
| | • | | regulatory investigation; |
| | • | | penalties and suspension of operations; or |
| | • | | attorneys’ fees and other expenses incurred in the prosecution or defense of litigation. |
As is customary in our industry, we maintain insurance against some, but not all, of these risks. Our insurance may not be adequate to cover these potential losses or liabilities. Furthermore, insurance coverage may not continue to be available at commercially acceptable premium levels or at all. Due to cost considerations, from time to time we have declined to obtain coverage for certain drilling activities and have therefore been restricted from conducting these types of drilling activities during the period we were uninsured. We do not carry business interruption insurance. Losses and liabilities arising from uninsured or under-insured events could require us to make large unbudgeted cash expenditures that could adversely impact our results of operations and cash flow.
34
We are subject to complex federal, state, local and other laws and regulations that could adversely affect the cost, manner or feasibility of conducting our operations.
Our oil and natural gas development and production operations are subject to complex and stringent laws and regulations. In order to conduct our operations in compliance with these laws and regulations, we must obtain and maintain numerous permits, approvals and certificates from various federal, state and local governmental authorities. We may incur substantial costs in order to comply with these existing laws and regulations. In addition, our costs of compliance may increase if existing laws and regulations are revised or reinterpreted, or if new laws and regulations become applicable to our operations.
Our business is subject to federal, state and local laws and regulations as interpreted and enforced by governmental authorities possessing jurisdiction over various aspects of the exploration for, production and sale of, oil and natural gas. Failure to comply with such laws and regulations, as interpreted and enforced, could have a material adverse effect on our business, financial condition and results of operations. Please see “Item 1. Business—Applicable laws and regulations” for a description of the laws and regulations that affect us.
Our business exposes us to liability and extensive regulation on environmental matters, which could result in substantial expenditures.
Our operations are subject to numerous U.S. federal, state and local laws and regulations relating to the protection of the environment, including those governing the discharge of materials into the water and air, the generation, management and disposal of hazardous substances and wastes and the clean-up of contaminated sites. We could incur material costs, including clean-up costs, fines and civil and criminal sanctions and third-party claims for property damage and personal injury as a result of violations of, or liabilities under, environmental laws and regulations. Such laws and regulations not only expose us to liability for our own activities, but may also expose us to liability for the conduct of others or for actions by us that were in compliance with all applicable laws at the time those actions were taken. In addition, we could incur substantial expenditures complying with environmental laws and regulations, including future environmental laws and regulations which may be more stringent. For example, studies have suggested that emissions of certain gases, commonly referred to as “greenhouse gases,” may be contributing to warming of the Earth’s atmosphere. Methane, a primary component of natural gas, and carbon dioxide, a byproduct of the burning of natural gas, are examples of greenhouse gases. The U.S. Congress is actively considering legislation to reduce emissions of greenhouse gases. In addition, various states have developed initiatives to regulate emissions of greenhouse gases, primarily through the planned development of greenhouse gas emission inventories and/or regional greenhouse gas cap and trade programs. The EPA is separately considering whether it will regulate greenhouse gases as “air pollutants” under the Clean Air Act. Passage of climate control legislation or other regulatory initiatives by Congress or various states in the United States or the adoption of regulations by the EPA or analogous state agencies that regulate or restrict emissions of greenhouse gases including methane or carbon dioxide in areas in which we conduct business could have an adverse effect on our operations and demand for the oil and natural gas that we produce.
Our business substantially depends on Douglas H. Miller, our Chief Executive Officer.
We are substantially dependent upon the skills of Mr. Douglas H. Miller. Mr. Miller has extensive experience in acquiring, financing and restructuring oil and natural gas companies. We do not have an employment agreement with Mr. Miller or maintain key man insurance. The loss of the services of Mr. Miller could hinder our ability to successfully implement our business strategy.
We may have write-downs of our asset values, which could negatively affect our results of operations and net worth.
We follow the full cost method of accounting for our oil and natural gas properties. Depending upon oil and natural gas prices in the future, and at the end of each quarterly and annual period when we are required to test the carrying value of our assets using full cost accounting rules, we may be required to write-down the value of our oil and natural gas properties if the present value of the after-tax future cash flows from our oil and natural
35
gas properties falls below the net book value of these properties. We have in the past, including the third and fourth quarters of 2008, experienced ceiling test write-downs with respect to our oil and natural gas properties. Future non-cash ceiling test write-downs could negatively affect our results of operations and net worth.
We also test goodwill for impairment annually or when circumstances indicate that an impairment may exist. If the book value of our reporting units exceeds the estimated fair value of those reporting units, an impairment charge will occur, which would negatively impact our net worth.
We may experience a financial loss if any of our significant customers fail to pay us for our oil or natural gas.
Our ability to collect the proceeds from the sale of oil and natural gas from our customers depends on the payment ability of our customer base, which includes several significant customers. If any one or more of our significant customers fails to pay us for any reason, we could experience a material loss. In addition, in recent years, a number of energy marketing and trading companies have discontinued their marketing and trading operations, which has significantly reduced the number of potential purchasers for our oil and natural gas production. This reduction in potential customers has reduced market liquidity and, in some cases, has made it difficult for us to identify creditworthy customers. We also sell a portion of our natural gas directly to end users. We may experience a material loss as a result of the failure of our customers to pay us for prior purchases of our oil or natural gas.
We may experience a decline in revenues if we lose one of our significant customers.
For the year ended December 31, 2008, sales to a natural gas marketing company, Crosstex Gulf Coast Marketing, and to a regulated natural gas utility company, Atmos Energy Marketing L.L.C. and its affiliates, accounted for approximately 12.0% and 11.2%, respectively, of total consolidated revenues. The loss of any significant customer may cause a temporary interruption in sales of, or a lower price for, our oil and natural gas.
Competition in our industry is intense and we may be unable to compete in acquiring properties, contracting for drilling equipment and hiring experienced personnel.
The oil and natural gas industry is highly competitive. We encounter strong competition from other independent operators and from major oil companies in acquiring properties, contracting for drilling equipment and securing trained personnel. Many of these competitors have financial and technical resources and headcount substantially larger than ours. As a result, our competitors may be able to pay more for desirable leases, or to evaluate, bid for and purchase a greater number of properties or prospects than our financial or personnel resources will permit. The oil and natural gas industry has periodically experienced shortages of drilling rigs, equipment, pipe and personnel, which has delayed development drilling and other exploitation activities and has caused significant price increases. We may experience difficulties in obtaining drilling rigs and other services in certain areas as well as an increase in the cost for these services and related material and equipment. We are unable to predict when, or if, such shortages may again occur or how such shortages and price increases will affect our development and exploitation program. Competition has also been strong in hiring experienced personnel, particularly in petroleum engineering, geoscience, accounting and financial reporting, tax and land professions. In addition, competition is strong for attractive oil and natural gas producing properties, oil and natural gas companies, and undeveloped leases and drilling rights. We are often outbid by competitors in our attempts to acquire properties or companies. All of these challenges could make it more difficult to execute our growth strategy and increase our costs.
The success of our natural gas gathering and transportation business depends upon our ability to continually obtain new sources of natural gas supply, and any decrease in supplies of natural gas could reduce our transportation revenues.
Our gathering and transportation pipelines are connected to natural gas reserves and wells, for which the production will naturally decline over time, which means that our cash flows associated with these wells will also
36
decline over time. To maintain or increase throughput levels on our pipelines, we must continually obtain new natural gas supplies. We may not be able to obtain additional third party contracts for natural gas supplies. The primary factors affecting our ability to connect new supplies of gas and attract new customers to our gathering and transportation pipelines include: (i) the level of successful drilling activity near our gathering systems and (ii) our ability to compete for the commitment of such additional volumes to our systems.
Fluctuations in energy prices can greatly affect production rates and investments by third parties in the development of new oil and natural gas reserves. Drilling activity generally decreases as oil and natural gas prices decrease. We have no control over the level of drilling activity in the areas of our operations other than our own drilling, the amount of reserves underlying the wells or the rate at which production from a well will decline. In addition, we have no control over third party producers or their production decisions, which are affected by, among other things, prevailing and projected energy prices, demand for hydrocarbons, the level of reserves, geological considerations, governmental regulations and the availability and cost of capital.
We face strong competition in acquiring new natural gas supplies. Competitors to our pipeline operations include major interstate and intrastate pipelines, and other natural gas gatherers. Competition for natural gas supplies is primarily based on the location of pipeline facilities, pricing arrangements, reputation, efficiency, flexibility and reliability. Many of our competitors have greater financial resources than we do.
If we are unable to maintain or increase the throughput on our gathering and transportation pipelines because of decreased drilling activity in the areas in which we operate or because of an inability to connect new supplies of natural gas and attract new customers to our gathering and transportation pipelines, then our business and financial results could be materially adversely affected.
If third-party pipelines or other facilities interconnected to our gathering and transportation pipelines become unavailable to transport or process natural gas, our revenues and cash flow could be adversely affected.
We depend upon third party pipelines and other facilities that provide delivery options from our transportation and gathering pipelines for the benefit of our customers. All of the natural gas transported by our pipelines must be processed by processing plants before delivery into a pipeline for natural gas. We own only one processing plant that treats certain natural gas products. If the processing plants to which we deliver natural gas were to become temporarily or permanently unavailable for any reason, or if throughput were reduced because of testing, line repair, damage to pipelines, reduced operating pressures, lack of capacity or other causes, our customers would be unable to deliver natural gas to end markets. Either of such events could materially and adversely affect our business, results of operations and financial condition.
We do not own all of the land on which our transportation pipelines and gathering systems are located, which could disrupt our operations.
We do not own all of the land on which our transportation and gathering pipelines and gathering systems have been constructed, and we are therefore subject to the possibility of increased costs to retain necessary land use. We obtain the rights to construct and operate our pipelines on land owned by third parties and governmental agencies for a specific period of time. Our loss of these rights, through our inability to renew right-of-way contracts or otherwise, could have a material adverse effect on our business, results of operations and financial condition.
Risks relating to our indebtedness
We have a substantial amount of indebtedness, which may adversely affect our cash flow and our ability to operate our business, remain in compliance with debt covenants and make payments on our debt.
As of December 31, 2008, we had approximately $3.0 billion of indebtedness, including $2.6 billion of indebtedness which is subject to variable interest rates. Our total interest expense, excluding amortization of deferred financing costs, on an annual basis is approximately $109.3 million and would change by approximately $25.7 million for every 1% change in interest rates.
37
Our level of debt could have important consequences, including the following:
| | • | | it may be more difficult for us to satisfy our obligations with respect to our indebtedness, and any failure to comply with the obligations of any of our debt agreements, including financial and other restrictive covenants, could result in an event of default under the indenture with Wilmington Trust Company, as trustee, or the Indenture, governing our senior notes and the agreements governing our other indebtedness; |
| | • | | we may have difficulty borrowing money in the future for acquisitions, capital expenditures or to meet our operating expenses or other general corporate obligations; |
| | • | | the amount of our interest expense may increase because certain of our borrowings are at variable rates of interest; |
| | • | | we will need to use a substantial portion of our cash flows to pay principal and interest on our debt, which will reduce the amount of money we have for operations, working capital, capital expenditures, expansion, acquisitions or general corporate or other business activities; |
| | • | | we may have a higher level of debt than some of our competitors, which may put us at a competitive disadvantage; |
| | • | | we may be more vulnerable to economic downturns and adverse developments in our industry or the economy in general, especially declines in oil and natural gas prices; and |
| | • | | our debt level could limit our flexibility in planning for, or reacting to, changes in our business and the industry in which we operate. |
Our ability to meet our expenses and debt obligations will depend on our future performance, which will be affected by financial, business, economic, regulatory and other factors. We will be unable to control many of these factors, such as economic conditions and governmental regulation. We cannot be certain that our earnings will be sufficient to allow us to pay the principal and interest on our debt and meet our other obligations. For instance, the New Term Credit Agreement matures and becomes payable on January 15, 2010. We believe that based on EXCO Operating’s current production levels and prices for oil and natural gas, our cash flows from operations and remaining borrowing capacity under our credit agreement, may not be sufficient to fully repay the New Term Credit Agreement when due without further reductions in our capital expenditure levels or non-strategic asset sales. If we do not have enough money to service our debt, we may be required but unable to refinance all or part of our existing debt, sell assets, borrow more money or raise equity on terms acceptable to us, if at all. Further, failing to comply with the financial and other restrictive covenants in our credit agreements and the Indenture governing our senior notes could result in an event of default, which could adversely affect our business, financial condition and results of operations.
We may incur substantially more debt, which may intensify the risks described above, including our ability to service our indebtedness.
Together with our subsidiaries, we may incur substantially more debt in the future in connection with our acquisition, development, exploitation and exploration of oil and natural gas producing properties. The restrictions in our debt agreements on our incurrence of additional indebtedness are subject to a number of qualifications and exceptions, and under certain circumstances, indebtedness incurred in compliance with these restrictions could be substantial. Also, these restrictions do not prevent us from incurring obligations that do not constitute indebtedness. To the extent new indebtedness is added to our current indebtedness levels, the risks described above could substantially increase.
To service our indebtedness, we will require a significant amount of cash. Our ability to generate cash depends on many factors beyond our control, and any failure to meet our debt obligations could harm our business, financial condition and results of operations.
Our ability to make payments on and to refinance our indebtedness, including our senior notes and loans under our credit agreements, and to fund planned capital expenditures will depend on our ability to generate cash
38
from operations and other resources in the future. This, to a certain extent, is subject to general economic, financial, competitive, legislative, regulatory and other factors that are beyond our control, including the prices that we receive for oil and natural gas.
Our business may not generate sufficient cash flow from operations and future borrowings may not be available to us in an amount sufficient to enable us to pay our indebtedness, including our senior notes and loans under our credit agreements, or to fund our other liquidity needs. If our cash flow and capital resources are insufficient to fund our debt obligations, we may be forced to sell assets, seek additional equity or debt capital or restructure our debt. None of these remedies may, if necessary, be effected on commercially reasonable terms, or at all. In addition, any failure to make scheduled payments of interest and principal on our outstanding indebtedness would likely result in a reduction of our credit rating, which could harm our ability to incur additional indebtedness on acceptable terms. Our cash flow and capital resources may be insufficient for payment of interest on and principal of our debt in the future, which could cause us to default on our obligations and could impair our liquidity.
Restrictive debt covenants could limit our growth and our ability to finance our operations, fund our capital needs, respond to changing conditions and engage in other business activities that may be in our best interests.
Our credit agreements contain a number of significant covenants that, among other things, restrict our ability to:
| | • | | incur or guarantee additional indebtedness and issue certain types of preferred stock; |
| | • | | pay dividends on our capital stock; |
| | • | | create liens on our assets; |
| | • | | enter into sale or leaseback transactions; |
| | • | | enter into specified investments or acquisitions; |
| | • | | repurchase, redeem or retire our capital stock or subordinated debt; |
| | • | | merge or consolidate, or transfer all or substantially all of our assets and the assets of our subsidiaries; |
| | • | | engage in specified transactions with subsidiaries and affiliates; or |
| | • | | pursue other corporate activities. |
Also, our credit agreements require us to maintain compliance with specified financial ratios and satisfy certain financial condition tests. Our ability to comply with these ratios and financial condition tests may be affected by events beyond our control, and, as a result, we may be unable to meet these ratios and financial condition tests. These financial ratio restrictions and financial condition tests could limit our ability to obtain future financings, make needed capital expenditures, withstand a future downturn in our business or the economy in general or otherwise conduct necessary corporate activities. We may also be prevented from taking advantage of business opportunities that arise because of the limitations imposed on us by the restrictive covenants under our credit agreements and the Indenture governing our senior notes.
A breach of any of these covenants or our inability to comply with the required financial ratios or financial condition tests could result in a default under our credit arrangements. A default, if not cured or waived, could result in acceleration of all indebtedness outstanding under our credit arrangements. The accelerated debt would become immediately due and payable. If that should occur, we may be unable to pay all such debt or to borrow sufficient funds to refinance it. Even if new financing were then available, it may not be on terms that are acceptable to us.
39
The global financial and credit crisis and any associated prolonged decline in the price of oil and natural gas similar to the conditions that existed in the third quarter of 2008 and thereafter will likely limit our access to liquidity and credit and curtail our ability to fund our planned exploration, development, and production activity, which could adversely affect our business, financial condition and results of operations.
The global financial and credit crisis has reduced the availability of liquidity and credit to fund the continuation and expansion of industrial business operations worldwide. Significant write-offs in the financial services sector, the repricing of credit risk and the current weak economic conditions have made it difficult, and will likely continue to make financing difficult. As a result of concerns about the stability of financial markets generally and the solvency of counterparties specifically, the cost of obtaining money from the credit markets generally has increased as many lenders and institutional investors have increased interest rates and enacted tighter lending standards. As a result of the current credit environment, we may be unable to obtain adequate funding under our existing credit agreements because (i) our lending counterparties may be unwilling or unable to meet their funding obligations or (ii) our borrowing bases under our existing credit agreements, which are redetermined at least twice a year, may decrease as a result of lower oil or natural gas prices, operating difficulties, declines in reserves, lending requirements or regulations, or for any other reason. If any borrowing base is decreased below the amount of borrowings outstanding, we may be required, and possibly unable, to repay an amount of borrowing within a six month cure period such that our outstanding borrowings do not exceed the new borrowing base.
The shortage of liquidity and credit combined with recent substantial losses in worldwide equity markets could lead to an extended national or global economic recession. A slowdown in economic activity caused by a recession would likely reduce national and worldwide demand for energy and result in lower oil and natural gas prices. Our revenues, cash flow and profitability and our ability to maintain or increase our borrowing capacity, to repay current or future indebtedness and to obtain additional capital on attractive terms depend substantially upon oil and natural gas prices. Prolonged decline in the price of oil and natural gas similar to the conditions that existed in the third quarter of 2008 and thereafter will likely limit our access to liquidity and credit and curtail our ability to fund our planned exploration, development, and production activity, which could adversely affect our business, financial condition and results of operations.
Risks relating to our common stock
Our stock price may fluctuate significantly.
Our common stock began trading on the NYSE on February 9, 2006. An active trading market may not be sustained. The market price of our common stock could fluctuate significantly as a result of:
| | • | | actual or anticipated quarterly variations in our operating results; |
| | • | | changes in expectations as to our future financial performance or changes in financial estimates of public market analysis; |
| | • | | announcements relating to our business or the business of our competitors; |
| | • | | conditions generally affecting the oil and natural gas industry; |
| | • | | the success of our operating strategy; and |
| | • | | the operating and stock price performance of other comparable companies. |
Many of these factors are beyond our control and we cannot predict their potential effects on the price of our common stock. In addition, the stock markets in general can experience considerable price and volume fluctuations.
Future sales of our common stock may cause our stock price to decline.
As of December 31, 2008, we had 210,968,931 shares of common stock outstanding. All shares are freely tradable by persons other than our affiliates. Sales of substantial amounts of our common stock in the public
40
market, or the perception that these sales may occur, could cause the market price of our common stock to decline. In addition, the sale of these shares could impair our ability to raise capital through the sale of additional common or preferred stock.
The equity trading markets may be volatile, which could result in losses for our shareholders.
The equity trading markets may experience periods of volatility, which could result in highly variable and unpredictable pricing of equity securities. The market price of our common stock could change in ways that may or may not be related to our business, our industry or our operating performance and financial condition.
Our articles of incorporation permit us to issue preferred stock that may restrict a takeover attempt that you may favor.
Our articles of incorporation permit our board to issue up to 10,000,000 shares of preferred stock and to establish by resolution one or more series of preferred stock and the powers, designations, preferences and participating, optional or other special rights of each series of preferred stock. The preferred stock may be issued on terms that are unfavorable to the holders of our common stock, including the grant of superior voting rights, the grant of preferences in favor of preferred shareholders in the payment of dividends and upon our liquidation and the designation of conversion rights that entitle holders of our preferred stock to convert their shares into our common stock on terms that are dilutive to holders of our common stock. The issuance of preferred stock in future offerings may make a takeover or change in control of us more difficult. In 2007, we issued 200,000 shares of preferred stock for proceeds of $2.0 billion to institutional accredited investors in a private placement under the Securities Act of 1933 and during 2008 we converted all outstanding shares of our Preferred Stock into a total of approximately 105.2 million shares of our common stock. See “Item 1. Business—Significant acquisitions and financing activities during 2008—2008 financing activities—Preferred Stock conversion.”
We have not paid dividends on our common stock in the past, and any return on investment has historically been limited to the value of our common stock.
We have never paid cash dividends on our common stock. The payment of dividends will depend on our earnings, capital requirements, financial condition, prospects and other factors our board of directors may deem relevant. If we do not pay dividends, our common stock may be less valuable because a return on your investment will only occur if our stock price appreciates. In addition, our credit agreements and the Indenture governing our senior notes restrict our ability to pay dividends.
| ITEM 1B. UNRESOLVED | STAFF COMMENTS |
Not applicable.
Corporate offices
We lease office space in Dallas, Texas; Akron, Ohio; Tulsa, Oklahoma; Cranberry Township, Pennsylvania; and The Woodlands, Texas. We also have small offices for technical and field operations in Texas, Oklahoma, Louisiana, Colorado, Ohio and West Virginia. The table below summarizes our material corporate leases.
| | | | | | | |
Location | | Approximate
square
footage | | Approximate
monthly
payment | | Expiration |
Dallas, Texas | | 122,200 | | $ | 161,100 | | June 30, 2015 |
Akron, Ohio | | 30,700 | | $ | 49,600 | | December 15, 2012 |
Tulsa, Oklahoma | | 22,700 | | $ | 25,500 | | May 31, 2011 |
Cranberry Township, Pennsylvania | | 22,400 | | $ | 26,100 | | February 28, 2013 |
The Woodlands, Texas | | 13,800 | | $ | 28,700 | | June 30, 2012 |
41
Other
We have described our oil and natural gas properties, oil and natural gas reserves, acreage, wells, production and drilling activity in “Item 1. Business” of this Annual Report on Form 10-K.
In the ordinary course of business, we are periodically a party to lawsuits and claims. We do not believe that any resulting liability from existing legal proceedings, individually or in the aggregate, will have a material adverse effect on our results of operations or financial condition.
| ITEM 4. | SUBMISSION OF MATTERS TO A VOTE OF SECURITY HOLDERS |
Not applicable.
PART II
| ITEM 5. | MARKET FOR THE REGISTRANT’S COMMON EQUITY, RELATED STOCKHOLDER MATTERS AND ISSUER PURCHASES OF EQUITY SECURITIES |
Market information for our common stock
Our common stock trades on the NYSE under the symbol “XCO.” The following table sets forth, for the periods indicated, the high and low sales prices per share of our common stock as reported by the NYSE:
| | | | | | |
| | | Price Per Share |
| | | High | | Low |
2008 | | | | | | |
First Quarter | | $ | 19.33 | | $ | 13.94 |
Second Quarter | | | 39.00 | | | 18.51 |
Third Quarter | | | 40.93 | | | 14.00 |
Fourth Quarter | | | 16.10 | | | 4.08 |
2007 | | | | | | |
First Quarter | | $ | 18.35 | | $ | 15.07 |
Second Quarter | | | 19.70 | | | 15.89 |
Third Quarter | | | 18.27 | | | 14.69 |
Fourth Quarter | | | 17.48 | | | 13.61 |
Our shareholders
According to our transfer agent, Continental Stock Transfer & Trust Company, there were approximately 120 holders of record of our common stock on December 31, 2008 (including nominee holders such as banks and brokerage firms who hold shares for beneficial holders).
Our dividend policy
We have not paid any cash dividends on our common stock. In addition, our credit agreements currently prohibit us from paying dividends on our common stock and the Indenture governing our senior notes contains restrictions on our payment of dividends. Even if our credit agreement permitted us to pay cash dividends, we can make those payments only from our surplus (the excess of the fair value of our total assets over the sum of our liabilities plus our total paid-in share capital). In addition, we can pay cash dividends only if after paying those dividends we would be able to pay our liabilities as they become due.
42
| ITEM 6. | SELECTED FINANCIAL DATA |
The following table presents our selected historical financial and operating data. You should read this financial data in conjunction with “Item 7. Management’s discussion and analysis of financial condition and results of operations,” our consolidated financial statements, the notes to our consolidated financial statements and the other financial information included in this Annual Report on Form 10-K. This information does not replace the consolidated financial statements.
The selected financial data for the year ended December 31, 2004 and the 275 day period from January 1, 2005 to October 2, 2005 is referred to as Predecessor and represents the period of time when EXCO was privately held and owned by a different group of equity holders. On October 3, 2005, a group of investors and EXCO management completed an equity buyout of EXCO, which resulted in a change of control and a change in accounting basis. All periods subsequent to October 3, 2005 are referred to as Successor. We became a publicly traded company on February 14, 2006.
43
Selected consolidated financial and operating data
| | | | | | | | | | | | | | | | | | | | | | | | |
| | | Successor | | | Predecessor | |
(in thousands, except per share amounts) | | Year ended
December 31,
2008 | | | Year ended
December 31,
2007 | | | Year ended
December 31,
2006 | | | 90 day period
from
October 3 to
December 31,
2005 | | | 275 day period
from
January 1 to
October 2,
2005 | | | Year ended
December 31,
2004 | |
Statement of operations data(1): | | | | | | | | | | | | | | | | | | | | | | | | |
Revenues: | | | | | | | | | | | | | | | | | | | | | | | | |
Oil and natural gas | | $ | 1,404,826 | | | $ | 875,787 | | | $ | 359,235 | | | $ | 70,061 | | | $ | 132,821 | | | $ | 141,993 | |
Midstream(2) | | | 85,432 | | | | 18,817 | | | | 8,139 | | | | — | | | | — | | | | — | |
| | | | | | | | | | | | | | | | | | | | | | | | |
Total revenues | | | 1,490,258 | | | | 894,604 | | | | 367,374 | | | | 70,061 | | | | 132,821 | | | | 141,993 | |
| | | | | | | | | | | | | | | | | | | | | | | | |
Costs and expenses: | | | | | | | | | | | | | | | | | | | | | | | | |
Oil and natural gas production(3) | | | 238,071 | | | | 168,999 | | | | 68,517 | | | | 8,949 | | | | 22,157 | | | | 28,256 | |
Midstream operating expenses(2) | | | 82,797 | | | | 16,289 | | | | 7,797 | | | | — | | | | — | | | | — | |
Gathering and transportation | | | 14,206 | | | | 10,210 | | | | 1,615 | | | | — | | | | — | | | | — | |
Depreciation, depletion and amortization | | | 460,314 | | | | 375,420 | | | | 135,722 | | | | 14,071 | | | | 24,687 | | | | 28,519 | |
Write-down of oil and natural gas properties | | | 2,815,835 | | | | — | | | | — | | | | — | | | | — | | | | — | |
Accretion of discount on asset retirement obligations | | | 6,703 | | | | 4,878 | | | | 2,014 | | | | 226 | | | | 617 | | | | 800 | |
General and administrative(4) | | | 87,568 | | | | 64,670 | | | | 41,206 | | | | 6,375 | | | | 89,442 | | | | 15,466 | |
| | | | | | | | | | | | | | | | | | | | | | | | |
Total costs and expenses | | | 3,705,494 | | | | 640,466 | | | | 256,871 | | | | 29,621 | | | | 136,903 | | | | 73,041 | |
| | | | | | | | | | | | | | | | | | | | | | | | |
Operating income (loss) | | | (2,215,236 | ) | | | 254,138 | | | | 110,503 | | | | 40,440 | | | | (4,082 | ) | | | 68,952 | |
Other income (expense): | | | | | | | | | | | | | | | | | | | | | | | | |
Interest expense | | | (161,638 | ) | | | (181,350 | ) | | | (84,871 | ) | | | (19,414 | ) | | | (26,675 | ) | | | (34,570 | ) |
Gain (loss) on derivative financial instruments(5) | | | 384,389 | | | | 26,807 | | | | 198,664 | | | | (256 | ) | | | (177,253 | ) | | | (50,343 | ) |
Other income | | | 3,981 | | | | 10,157 | | | | 2,466 | | | | 2,374 | | | | 7,096 | | | | 1,184 | |
Equity in net income of TXOK Acquisition, Inc | | | — | | | | — | | | | 1,593 | | | | 837 | | | | — | | | | — | |
| | | | | | | | | | | | | | | | | | | | | | | | |
Total other income (expense) | | | 226,732 | | | | (144,386 | ) | | | 117,852 | | | | (16,459 | ) | | | (196,832 | ) | | | (83,729 | ) |
Income (loss) before income taxes | | | (1,988,504 | ) | | | 109,752 | | | | 228,355 | | | | 23,981 | | | | (200,914 | ) | | | (14,777 | ) |
Income tax expense (benefit) | | | (255,033 | ) | | | 60,096 | | | | 89,401 | | | | 7,631 | | | | (63,698 | ) | | | 5,126 | |
| | | | | | | | | | | | | | | | | | | | | | | | |
Income (loss) before discontinued operations | | | (1,733,471 | ) | | | 49,656 | | | | 138,954 | | | | 16,350 | | | | (137,216 | ) | | | (19,903 | ) |
| | | | | | | | | | | | | | | | | | | | | | | | |
Discontinued operations: | | | | | | | | | | | | | | | | | | | | | | | | |
Income (loss) from discontinued operations | | | — | | | | — | | | | — | | | | — | | | | (4,403 | ) | | | 36,274 | |
Gain on disposition of Addison Energy Inc | | | — | | | | — | | | | — | | | | — | | | | 175,717 | | | | — | |
Income tax expense | | | — | | | | — | | | | — | | | | — | | | | 49,282 | | | | 10,358 | |
| | | | | | | | | | | | | | | | | | | | | | | | |
Income from discontinued operations | | | — | | | | — | | | | — | | | | — | | | | 122,032 | | | | 25,916 | |
| | | | | | | | | | | | | | | | | | | | | | | | |
Net income (loss) | | | (1,733,471 | ) | | | 49,656 | | | | 138,954 | | | | 16,350 | | | | (15,184 | ) | | | 6,013 | |
Preferred stock dividends | | | (76,997 | ) | | | (132,968 | ) | | | — | | | | — | | | | — | | | | — | |
| | | | | | | | | | | | | | | | | | | | | | | | |
Net income (loss) available to common shareholders | | $ | (1,810,468 | ) | | $ | (83,312 | ) | | $ | 138,954 | | | $ | 16,350 | | | $ | (15,184 | ) | | $ | 6,013 | |
| | | | | | | | | | | | | | | | | | | | | | | | |
Basic income per share from discontinued operations | | $ | — | | | $ | — | | | $ | — | | | $ | — | | | $ | 1.05 | | | $ | 0.22 | |
| | | | | | | | | | | | | | | | | | | | | | | | |
Basic income (loss) per share available to common shareholders | | $ | (11.81 | ) | | $ | (0.80 | ) | | $ | 1.44 | | | $ | 0.35 | | | $ | (0.13 | ) | | $ | 0.05 | |
| | | | | | | | | | | | | | | | | | | | | | | | |
Diluted income per share from discontinued operations | | $ | — | | | $ | — | | | $ | — | | | $ | — | | | $ | 1.05 | | | $ | 0.22 | |
| | | | | | | | | | | | | | | | | | | | | | | | |
Diluted income (loss) per share available to common shareholders | | $ | (11.81 | ) | | $ | (0.80 | ) | | $ | 1.41 | | | $ | 0.35 | | | $ | (0.13 | ) | | $ | 0.05 | |
| | | | | | | | | | | | | | | | | | | | | | | | |
Weighted average common and common equivalent shares outstanding: | | | | | | | | | | | | | | | | | | | | | | | | |
Basic | | | 153,346 | | | | 104,364 | | | | 96,727 | | | | 47,222 | | | | 116,504 | | | | 115,947 | |
Diluted | | | 153,346 | | | | 104,364 | | | | 98,453 | | | | 47,222 | | | | 116,504 | | | | 115,947 | |
44
Selected consolidated financial and operating data (continued)
| | | | | | | | | | | | | | | | | | | | | | | | |
| | | Successor | | | Predecessor | |
| | | Year ended
December 31,
2008 | | | Year ended
December 31,
2007 | | | Year ended
December 31,
2006 | | | 90 day period
from
October 3 to
December 31,
2005 | | | 275 day period
from
January 1 to
October 2,
2005 | | | Year ended
December 31,
2004 | |
Statement of cash flow data: | | | | | | | | | | | | | | | | | | | | | | | | |
Net cash provided by (used in): | | | | | | | | | | | | | | | | | | | | | | | | |
Operating activities | | $ | 974,966 | | | $ | 577,829 | | | $ | 227,659 | | | $ | 8,177 | | | $ | (81,122 | ) | | $ | 118,528 | |
Investing activities | | | (1,708,579 | ) | | | (2,396,437 | ) | | | (1,791,517 | ) | | | (13,337 | ) | | | 337,880 | | | | (381,476 | ) |
Financing activities | | | 735,242 | | | | 1,851,296 | | | | 1,359,727 | | | | (4,018 | ) | | | (47,035 | ) | | | 283,708 | |
Balance sheet data: | | | | | | | | | | | | | | | | | | | | | | | | |
Current assets | | $ | 513,040 | | | $ | 311,300 | | | $ | 236,710 | | | $ | 342,525 | | | | n/a | | | $ | 75,877 | |
Total assets | | | 4,822,352 | | | | 5,955,771 | | | | 3,707,057 | | | | 1,530,493 | | | | n/a | | | | 922,052 | |
Current liabilities | | | 322,873 | | | | 278,167 | | | | 190,924 | | | | 465,725 | | | | n/a | | | | 105,695 | |
Long-term debt, less current maturities | | | 3,019,738 | | | | 2,099,171 | | | | 2,081,653 | | | | 461,802 | | | | n/a | | | | 487,453 | |
Shareholders’ equity | | | 1,332,501 | | | | 1,115,742 | | | | 1,179,850 | | | | 370,882 | | | | n/a | | | | 203,885 | |
Total liabilities and shareholders’ equity | | | 4,822,352 | | | | 5,955,771 | | | | 3,707,057 | | | | 1,530,493 | | | | n/a | | | | 922,052 | |
| (1) | We have completed numerous acquisitions and dispositions for each of the years presented which impacts the comparability of the selected financial data between periods. |
| (2) | We designated a midstream segment during 2008. For 2005 and 2004, the midstream and gathering operations were not material. |
| (3) | We adopted SFAS No. 123(R), “Share-Based Payment,” or SFAS No. 123(R), on October 3, 2005. Share-based compensation, pursuant to SFAS No. 123(R), included in oil and natural gas production is $4.2 million, $3.6 million and $0 for the years ended December 31, 2008, 2007 and 2006, respectively. |
| (4) | Share-based compensation, pursuant to SFAS No. 123(R), included in general and administrative expenses is $11.8 million, $9.0 million, $6.5 million and $2.2 million for the years ended December 31, 2008, 2007 and 2006 and the 90 day period from October 3, 2005 to December 31, 2005, respectively. The 275 day period from January 1, 2005 to October 2, 2005 includes non-cash based compensation of $44.1 million and cash compensation expenses of $29.6 million arising from the equity buyout transaction that occurred on October 3, 2005. |
| (5) | We do not designate our derivative financial instruments as hedges and as a result the changes in the fair value of our derivative financial instruments are recognized directly in our statement of operations. See “Item 7. Managements’ discussion and analysis of financial condition and results of operations—Critical accounting policies—Accounting for derivatives” for a description of this accounting method. |
45
| ITEM 7. | MANAGEMENT’S DISCUSSION AND ANALYSIS OF FINANCIAL CONDITION AND RESULTS OF OPERATIONS |
The following discussion and analysis of our financial condition and results of operations should be read in conjunction with our financial statements and the related notes to those statements included elsewhere in this Annual Report on Form10-K. In addition to historical financial information, the following discussion and analysis contains forward-looking statements that involve risks, uncertainties and assumptions. Our results and the timing of selected events may differ materially from those anticipated in these forward-looking statements as a result of many factors, including those discussed under “risk factors” and elsewhere in this Annual Report on Form 10-K.
Overview and history
We are an independent oil and natural gas company engaged in the acquisition, development and exploitation of onshore North American oil and natural gas properties. Our principal operations are located in the East Texas/North Louisiana, Appalachia, Mid-Continent and Permian producing areas. Our assets in East Texas/North Louisiana are owned by our subsidiary, EXCO Operating Company, LP (formerly EXCO Partners Operating Partnership, LP), and its subsidiaries and together they are collectively referred to as EXCO Operating. Organizationally, EXCO Operating is an indirect wholly-owned subsidiary of EXCO Resources. EXCO Operating’s debt is not guaranteed by EXCO Resources and EXCO Operating does not guarantee EXCO Resources’ debt. This structure allows us to maintain two credit agreements: the EXCO Resources Credit Agreement, which currently has a borrowing base of approximately $1.2 billion and the EXCO Operating Credit Agreement, which currently has a borrowing base of $1.3 billion. We expect to continue to grow by leveraging our management team’s experience, developing our shale resource plays, exploiting our multi-year inventory of development drilling locations and exploitation projects, and selectively pursuing acquisitions that meet our strategic and financial objectives. We employ the use of debt along with a comprehensive derivative financial instrument program to support our strategy. This approach enhances our ability to execute our business plan over the entire commodity price cycle, protect our returns on investments, and manage our capital structure.
As of December 31, 2008, the related PV-10 of our Proved Reserves was approximately $2.5 billion, and the Standardized Measure of our Proved Reserves was $2.2 billion (see “Item 1.—Summary of geographic areas of operations” for a reconciliation of PV-10 to Standardized Measure of Proved Reserves). For the year ended December 31, 2008, we produced 144.6 Bcfe of oil and natural gas. Based on our December 2008 average daily production of 407 Mmcfe, this translates to a reserve life of approximately 13.1 years.
In 2008, we drilled 475 wells and completed 467 gross (393.5 net) wells with a 98.3% drilling success rate. Our 2008 development, exploitation and other oil and natural gas property capital expenditures totaled $693.2 million. In addition, we leased $187.1 million of undeveloped acreage primarily in the Haynesville/Bossier shale resource play in East Texas/North Louisiana and the Marcellus shale resource play in the Appalachian region. Midstream and corporate capital expenditures totaled $108.8 million. Our acquisitions in 2008 were funded, in part, by our credit agreements and a term loan. Our 2009 capital budget, approved by our Board of Directors, totals $582.0 million. The significant emphasis in our 2009 budget is to drill and complete 186 gross (approximately 143.5 net) wells and expand our gathering system to accommodate new anticipated production from the Haynesville shale play.
Oil and natural gas prices have historically been volatile. During 2008, the NYMEX price for natural gas has fluctuated from a high of $13.58 per Mmbtu to a low of $5.29 per Mmbtu. On December 31, 2008, the spot market price for natural gas at Henry Hub was $5.71 per Mmbtu, a 16.0% decrease from December 31, 2007. The price of oil has shown similar volatility. In 2008, our average realized prices (before the impact of derivative financial instruments) for oil and natural gas were $96.93 per Bbl and $9.06 per Mcf compared with 2007 average realized prices of $71.17 per Bbl and $6.81 per Mcf, respectively. While the annual average prices for oil and natural gas during 2008 exceeded 2007 average prices, the fourth quarter of 2008 experienced significant declines in prices for both commodities. Spot natural gas prices declined to $5.71 per Mmbtu on December 31, 2008 from $7.12 per Mmbtu on September 30, 2008, a decrease of approximately 19.8%. Oil prices in the fourth
46
quarter of 2008 experienced a 55.7% decrease, declining to $44.60 per Bbl on December 31, 2008 from $100.67 per Bbl on September 30, 2008. Natural gas and oil prices have continued to decline into the first quarter of 2009. The volatile commodity price environment from 2006 through the third quarter of 2008 was characterized by an upward trend, which created a competitive environment for drilling rigs, oil field services, labor and tubular goods. Accordingly, prices for these products and services also increased. The rapid declines in oil and natural gas prices beginning late in the third quarter of 2008 have created an environment, particularly with drilling rigs and oil field services, where demand has fallen in certain areas. For the week ended February 20, 2009, the weekly U.S. onshore rotary rig count was 1,241, a decrease of 36.0% from the peak rig count of 1,938 which occurred for the week ended August 29, 2008. It is impossible to predict the duration or outcome of these price declines or the long-term impact on drilling and operating costs and the impacts, whether favorable or unfavorable, to our results of operations and liquidity. We have substantially reduced the number of drilling rigs, from a peak of 32 in October 2008 to 11 on February 20, 2009, throughout our operating areas and are closely monitoring operations and planned capital budget expenditures as the economics of many projects have diminished as a result of commodity price declines.
Like all oil and natural gas production companies, we face the challenge of natural production declines. Oil and natural gas production from a given well naturally decreases over time. We attempt to overcome this natural decline by drilling to identify and develop additional reserves and add additional reserves through acquisitions.
Our future growth will depend upon our ability to continue to identify and add oil and natural gas reserves in excess of production at a reasonable cost. We will maintain our focus on the costs of adding reserves through drilling and acquisitions as well as the costs necessary to produce such reserves.
Since the completion of our initial public offering, or IPO, in February 2006, we have amended our credit agreements on numerous occasions as a result of our 2006, 2007 and 2008 acquisitions of oil and natural gas assets. We also completed a $2.0 billion private placement of preferred stock in March 2007, which was subsequently converted into common stock in July 2008, and used the proceeds from the issuance of the Preferred Stock to fund acquisitions and reduce debt in our credit agreements. On February 23, 2009, the EXCO Resources Credit Agreement had a borrowing base of $1.2 billion, $1.1 billion of which was drawn, and the EXCO Operating Credit Agreement had a borrowing base of $1.3 billion, $1.2 billion of which was drawn. On February 4, 2009, the EXCO Resources Credit Agreement was further amended to modify certain debt covenants beginning with the quarter ended March 31, 2009. We believe we will have adequate unused borrowing capacity under our credit agreements and available cash flow from operations to fund capital development, service debt obligations and working capital needs for the next 12 months. However, the New Term Credit Agreement becomes payable on January 15, 2010. Based on EXCO Operating’s current production levels and prices for oil and natural gas, our cash flows from operations may not be sufficient to fully repay the New Term Credit Agreement when due without further reductions in capital expenditure levels or non-strategic asset sales. We are currently in various stages of activity related to the sale of certain non-strategic oil and natural gas properties and have plans to pursue the sale of additional oil and natural gas properties in 2009. We believe that such asset sales will supplement our free cash to enable us to repay amounts outstanding under the New Term Credit Agreement prior to its maturity. In addition to our credit agreements and the New Term Credit Agreement, EXCO has $444.7 million of 7 1/4% senior notes due January 15, 2011. Funding for future acquisitions may require additional sources of financing, which may not be available.
Critical accounting policies
In response to the SEC’s Release No. 33-8040, “Cautionary Advice Regarding Disclosure About Critical Accounting Policies,” we have identified the most critical accounting policies used in the preparation of our consolidated financial statements. We determined the critical policies by considering accounting policies that involve the most complex or subjective decisions or assessments. We identified our most critical accounting policies to be those related to our Proved Reserves, accounting for business combinations, accounting for derivatives, share-based payments, our choice of accounting method for oil and natural gas properties, goodwill, asset retirement obligations and income taxes.
We prepared our consolidated financial statements for inclusion in this report in accordance with GAAP. GAAP represents a comprehensive set of accounting and disclosure rules and requirements, and applying these
47
rules and requirements requires management judgments and estimates including, in certain circumstances, choices between acceptable GAAP alternatives. The following is a discussion of our most critical accounting policies, judgments and uncertainties that are inherent in our application of GAAP.
Estimates of Proved Reserves
The Proved Reserves data included in this Annual Report on Form 10-K was prepared in accordance with SEC guidelines. The accuracy of a reserve estimate is a function of:
| | • | | the quality and quantity of available data; |
| | • | | the interpretation of that data; |
| | • | | the accuracy of various mandated economic assumptions; and |
| | • | | the judgment of the persons preparing the estimates. |
Because these estimates depend on many assumptions, all of which may substantially differ from actual results, reserve estimates may be different from the quantities of oil and natural gas that are ultimately recovered. In addition, results of drilling, testing and production after the date of an estimate may justify material revisions to the estimate.
You should not assume that the present value of future net cash flows represents the current market value of our estimated Proved Reserves. In accordance with SEC requirements, we based the estimated discounted future net cash flows from Proved Reserves on cash spot prices for oil and natural gas and operating and capital costs on the date of the estimate. Actual future prices and costs may be materially higher or lower than the prices and costs as of the date of the estimate. Further, the mandated discount rate of 10% may not be an accurate assumption of future interest rates.
Proved Reserves quantities directly and materially impact depletion expense. If the Proved Reserves decline, then the rate at which we record depletion expense increases, reducing net income. A decline in the estimate of Proved Reserves may result from lower market prices, and a decline may make it uneconomical to drill or produce from higher cost fields. In addition, a decline in Proved Reserves may impact the outcome of our assessment of our oil and natural gas properties and require an impairment of the carrying value of our oil and natural gas properties.
Proved Reserves are defined as the estimated quantities of crude oil, natural gas and natural gas liquids which geological and engineering data demonstrate with reasonable certainty to be recoverable in future years from known reservoirs under existing economic and operating conditions, i.e., prices and costs as of the date the estimate is made. Prices include consideration of changes in existing prices provided only by contractual arrangements, but not on escalations based upon future conditions.
Reservoirs are considered proved if economic producibility is supported by either actual production or conclusive formation testing. The area of a reservoir considered proved includes, under current definitions and guidelines, (i) that portion delineated by drilling and defined by gas-oil and/or oil-water contacts, if any, and (ii) the immediately adjoining portions not yet drilled, but which can be reasonably judged as economically productive on the basis of available geological and engineering data. In the absence of information on fluid contacts, the lowest known structural occurrence of hydrocarbons controls the lower proved limit of the reservoir.
Reserves which can be produced economically through application of improved recovery techniques (such as fluid injection) are included in the proved classification when successful testing by a pilot project, or the operation of an installed program in the reservoir, provides support for the engineering analysis on which the project or program was based.
Estimates of Proved Reserves do not include, under current definitions and guidelines, the following: (i) oil that may become available from known reservoirs but is classified separately as indicated additional reserves; (ii) crude oil, natural gas and natural gas liquids, the recovery of which is subject to reasonable doubt because of
48
uncertainty as to geology, reservoir characteristics, or economic factors; (iii) crude oil, natural gas and natural gas liquids, that may occur in undrilled prospects; and (iv) crude oil natural gas and natural gas liquids that may be recovered from oil shales, coal, gilsonite and other such sources.
On December 31, 2008, the SEC issued Release No. 33-8995 amending its oil and natural gas reporting requirements for oil and natural gas producing companies. The effective date of the new accounting and disclosure requirements is for annual reports filed for fiscal years ending on or after December 31, 2009. Companies are not permitted to comply at an earlier date. Among other things, Release No. 33-8995:
| | • | | Revises a number of definitions relating to proved oil and natural gas reserves to make them consistent with the Petroleum Resource Management System, which includes certain non-traditional resources in proved reserves, |
| | • | | Permits the use of new technologies for determining proved oil and natural gas reserves, |
| | • | | Requires the use of average prices for the trailing twelve-month period in the estimation of oil and natural gas reserve quantities and, for companies using the full cost method of accounting, in computing the ceiling limitation test, in place of a single day price as of the end of the fiscal year, |
| | • | | Permits the disclosure in filings with the SEC of probable and possible reserves and reserves sensitivity to changes in prices, |
| | • | | Requires additional disclosures (outside of the financial statements) regarding the status of undeveloped reserves and changes in status of these from period to period, and |
| | • | | Requires a discussion of the internal controls in place to assure objectivity in the reserve estimation process and disclosure of the technical qualifications of the technical person having primarily responsibility for preparing the reserve estimates. |
We are currently evaluating the effect of adopting the final rule will have on our financial statements and oil and natural gas reserve estimates and disclosures.
Business combinations
For the periods covered by this Annual Report on Form 10-K, we followed SFAS No. 141 “Accounting for Business Combinations”, or SFAS No. 141, to record our acquisitions of oil and natural gas properties or entities which we acquire. SFAS No. 141 requires that acquired assets, identifiable intangible assets and liabilities be recorded at their fair value, with any excess purchase price being recognized as goodwill. Application of SFAS No. 141 requires significant estimates to be made by management using information available at the time of acquisition. Since these estimates require the use of significant judgment, actual results could vary as the estimates are subject to changes as new information becomes available.
Effective January 1, 2009, we adopted SFAS No. 141(R), “Business Combinations,” or SFAS No. 141(R). SFAS No. 141(R) replaces SFAS No. 141. SFAS No. 141(R) broadens the scope of business combinations to include bargain purchases and combinations of related companies, provides guidance on measuring goodwill and requires acquisition costs to be separate from the value of assets and liabilities purchased.
Accounting for derivatives
We use derivative financial instruments to protect against commodity price fluctuations and in connection with the incurrence of debt related to our acquisition activities. Our objective in entering into these derivative financial instruments is to manage price fluctuations and achieve a more predictable cash flow to fund our development, acquisition activities and support debt incurred with our acquisitions. These derivative financial instruments are not held for trading purposes. We do not designate our derivative financial instruments as hedging instruments and, as a result, we recognize the change in the derivative’s fair value as a component of current earnings.
49
Share-based payments
We account for share-based payments to employees using the methodology prescribed in SFAS No. 123(R) and related interpretations. At December 31, 2008, our employees and directors held options under EXCO’s 2005 Long-Term Incentive Plan, or the 2005 Incentive Plan, to purchase 14,963,315 shares of EXCO common stock at prices ranging from $6.33 per share to $38.01 per share. The options expire ten years from the date of grant. Pursuant to the 2005 Incentive Plan, 25% of the options vest immediately with an additional 25% to vest on each of the next three anniversaries of the date of grant. We use the Black-Scholes model to calculate the fair value of issued options. The gross fair value of the granted options using the Black-Scholes model range from $3.08 per share to $14.27 per share. SFAS No. 123(R) requires share-based compensation be recorded with cost classifications consistent with cash compensation. EXCO uses the full cost method to account for its oil and natural gas properties. As a result, part of our share-based payments are capitalized. Total share-based compensation for 2008 was $20.0 million, of which $4.0 million was capitalized as part of our oil and natural gas properties. In 2007, a total of $15.0 million of share-based compensation was incurred, of which $2.4 million was capitalized.
Accounting for oil and natural gas properties
The accounting for, and disclosure of, oil and natural gas producing activities requires that we choose between two GAAP alternatives; the full cost method or the successful efforts method.
We use the full cost method of accounting, which involves capitalizing all acquisition, exploration, exploitation and development costs of oil and natural gas properties. Once we incur costs, they are recorded in the depletable pool of proved properties or in unproved properties, collectively, the full cost pool. Unproved property costs are not subject to depletion. We review our unproved oil and natural gas property costs on a quarterly basis to assess possible impairment or the need to transfer unproved costs to proved properties as a result of extension or discoveries from drilling operations. We expect these costs to be evaluated in one to seven years and transferred to the depletable portion of the full cost pool during that time. The full cost pool is comprised of intangible drilling costs, lease and well equipment and exploration and development costs incurred plus costs of acquired proved and unproved leaseholds.
During April 2008 we initiated two leasing projects to acquire shale drilling rights in both our Appalachia and East Texas/North Louisiana operating areas. In accordance with our policy and the Statement of Financial Accounting Standards No. 34, “Capitalization of Interest Cost,” we began capitalizing interest on these projects in April 2008. At the end of the third quarter of 2008, these projects were complete. The total expenditures on this project were $157.0 million.
We calculate depletion using the unit-of-production method. Under this method, the sum of the full cost pool and all estimated future development costs are divided by the total quantity of Proved Reserves. This rate is applied to our total production for the period, and the appropriate expense is recorded. We capitalize the portion of general and administrative costs, including share-based compensation, that is attributable to our acquisition, exploration, exploitation and development activities.
Sales, dispositions and other oil and natural gas property retirements are accounted for as adjustments to the full cost pool, with no recognition of gain or loss unless the disposition would significantly alter the relationship between capitalized costs and Proved Reserves.
At the end of each quarterly period, the unamortized cost of proved oil and natural gas properties, net of related deferred income taxes, is limited to the sum of the estimated future net revenues from Proved Reserves using current period-end prices discounted at 10%, adjusted for related income tax effects, or the ceiling test. When computing our ceiling test, we evaluate the limitation at the end of each reporting period date. In the event our capitalized costs exceed the ceiling limitation at the end of the reporting period, we subsequently evaluate the limitation for price changes that occur after the balance sheet to assess impairment as permitted by Staff Accounting Bulletin Topic 12—Oil and Gas Producing Activities. For the year ended December 31, 2008, we recognized ceiling test write-downs of our oil and natural gas properties totaling $2.8 billion ($1.7 billion after tax). Under full cost accounting rules, any ceiling test write-downs of oil and natural gas properties may not be
50
reversed in subsequent periods. Since we do not designate our derivative financial instruments as hedges, we are not allowed to use the impacts of the derivative financial instruments in our ceiling test computation. As a result, decreases in commodity prices which contribute to ceiling test write-downs may be offset, or partially offset, by mark-to-market gains which are not reflected in our ceiling test results.
For the year 2007, we sought and received an exemption from the SEC in July 2007 to exclude the proved oil and natural gas properties of the Winchester Acquisition, and those acquired in the Vernon Acquisition and the Southern Gas Acquisition from our ceiling test for a period of 12 months from the closing date of each acquisition, provided that we could demonstrate beyond a reasonable doubt that the fair value of the oil and natural gas reserves exceeded their unamortized carrying costs. The exemption related to the Winchester Acquisition expired September 30, 2007 and therefore the proved oil and natural gas properties of the Winchester Acquisition were included in our December 31, 2007 ceiling test calculation. The exemption for the Vernon Acquisition expired on March 30, 2008 and the exemption for the Southern Gas Acquisition expired on May 2, 2008 and, accordingly, the proved oil and natural gas reserves relating to these acquisitions are included in our December 31, 2008 ceiling test computation.
The quarterly calculation of the ceiling test is based upon estimates of Proved Reserves. There are numerous uncertainties inherent in estimating quantities of Proved Reserves, in projecting the future rates of production and in the timing of development activities. The accuracy of any reserve estimate is a function of the quality of available data and of engineering and geological interpretation and judgment. Results of drilling, testing and production subsequent to the date of the estimate may justify revision of such estimate. Accordingly, reserve estimates are often different from the quantities of oil and natural gas that are ultimately recovered.
Goodwill
A change in control transaction involving an equity buyout on October 3, 2005, required the application of the purchase method of accounting pursuant to SFAS No. 141 and goodwill of $220.0 million was recognized. Additional goodwill of $250.1 million was recognized from our 2006 acquisitions. As of December 31, 2008, our consolidated goodwill totals $470.1 million. Our strategy is to concentrate on accumulating assets in East Texas, North Louisiana, the Mid-Continent region and Appalachia. We believe the strategic value paid for the assets substantiates the goodwill we have incurred.
Not all of our goodwill is currently deductible for income tax purposes. Furthermore, in accordance with SFAS No. 142, “Goodwill and Intangible Assets,” or SFAS No. 142, goodwill is not amortized, but is tested for impairment on an annual basis, or more frequently as impairment indicators arise. Impairment tests, which involve the use of estimates related to the fair market value of the business operations with which goodwill is associated, are subject to various assumptions and judgments. We use a combination of valuation techniques, including discounted cash flow projections and market comparable analyses to evaluate our goodwill for possible impairment. Actual future results of these assumptions could differ as a result of economic changes which are not within our control. Losses, if any, resulting from impairment tests will be reflected in operating income in the statement of operations. As of December 31, 2008, we did not have any impairment of our goodwill.
Asset retirement obligations
We follow SFAS No. 143, “Asset Retirement Obligations,” or SFAS No. 143, to account for legal obligations associated with the retirement of long-lived assets. SFAS No. 143 requires these obligations be recognized at their estimated fair value at the time that the obligations are incurred. Upon initial recognition of a liability, that cost should be capitalized as part of the related long-lived asset and allocated to expense over the useful life of the asset. The costs of plugging and abandoning oil and natural gas properties fluctuate with costs associated with the industry. We periodically assess the estimated costs of our asset retirement obligations and adjust the liability according to these estimates.
Accounting for income taxes
Income taxes are accounted for using the liability method of accounting in accordance with SFAS No. 109, “Accounting for Income Taxes,” or SFAS No. 109. We must make certain estimates related to the reversal of
51
temporary differences, and actual results could vary from those estimates. Deferred taxes are recorded to reflect the tax benefits and consequences of future years’ differences between the tax basis of assets and liabilities and their financial reporting basis. We record a valuation allowance to reduce deferred tax assets if it is more likely than not that some portion or all of the deferred tax assets will not be realized.
In July 2006, the Financial Accounting Standards Board, or FASB, issued Financial Interpretation No. 48, “Accounting for Uncertainty in Income Taxes,” or FIN 48. FIN 48 clarifies the accounting for uncertainty in income taxes recognized in a company’s financial statements in accordance with SFAS No. 109. FIN 48 provides guidance on recognizing, measuring, presenting and disclosing in the financial statements uncertainties relating to tax positions that a company has taken or expects to take on a tax return. We adopted FIN 48 on January 1, 2007. The adoption of FIN 48 did not have a material impact on our consolidated financial position or results of operations for financial years 2008 or 2007.
Recent accounting pronouncements
In September 2006, the FASB issued SFAS, No. 157, “Fair Value Measurements,” or SFAS No. 157, which defines fair value, establishes a framework for measuring fair value in GAAP and expands disclosures about fair value measurements. SFAS No. 157 is effective for fiscal years beginning after November 15, 2007 and interim periods within those fiscal years for financial instruments. FASB Financial Staff Position No. FAS 157-2 deferred implementation for other non-financial assets and liabilities for one year. Examples of non-financial assets and liabilities are asset retirement obligations and non-financial assets and liabilities initially measured at fair value in a business combination. We adopted SFAS No. 157 on January 1, 2008. See “Note 5. Derivative financial instruments” of the notes to our consolidated financial statements.
In December 2007, the FASB issued SFAS No. 141(R). SFAS No. 141(R) replaces SFAS No. 141 and broadens the scope of business combinations to include bargain purchases and combinations of related companies, provides guidance on measuring goodwill and requires acquisition costs to be separate from the value of assets and liabilities purchased. We adopted SFAS No. 141(R) on January 1, 2009. We do not expect the adoption of SFAS No. 141(R) to have a material impact on our financial statements, other than nominal increases in expenses associated with acquisitions that we previously capitalized as part of the cost of an acquisition.
In December 2007, the FASB issued SFAS No. 160, “Noncontrolling Interests in Consolidated Financial Statements,” or SFAS No. 160. SFAS No. 160 amends Accounting Research Bulletin 51, or ARB 51. SFAS No. 160 requires the recognition of a noncontrolling interest (minority interest) as equity in the consolidated financial statements separate from the parent’s equity. The amount of net income attributable to the noncontrolling interest will be included in consolidated net income on the face of the income statement. It also amends certain of ARB No. 51’s consolidation procedures for consistency with the requirements of SFAS No. 141(R). SFAS No. 160 also includes expanded disclosure requirements regarding the interests of the parent and its noncontrolling interest. SFAS No. 160 is effective for financial statements issued for fiscal years beginning after December 15, 2008, and as such, was adopted by us on January 1, 2009. We do not believe the adoption of SFAS No. 160 will have a material effect on our financial statements.
In March 2008, the FASB issued SFAS No. 161, “Disclosures about Derivative Instruments and Hedging Activities,” or SFAS No. 161. SFAS No. 161 requires enhanced disclosure about the fair value of derivative instruments and their gains or losses in tabular format and information about credit-risk-related contingent features in derivative agreements, counterparty credit risk, and the company’s strategies and objectives for using derivative instruments. SFAS No. 161 is effective for financial statements issued for fiscal years beginning after December 15, 2008, and as such, was adopted by us on January 1, 2009. The adoption of SFAS No. 161 did not impact our financial statements.
In May 2008, the FASB issued SFAS No. 162, “The Hierarchy of Generally Accepted Accounting Principles,” or SFAS No. 162. SFAS No. 162 identifies the sources of accounting principles and the framework for selecting the principles to be used in the preparation of financial statements. SFAS No. 162 became effective on November 15, 2008. The adoption of SFAS No. 162 did not impact our financial statements.
52
On October 10, 2008, the FASB issued FASB Staff Position No. FAS 157-3, or FSP 157-3. FSP 157-3 clarifies the application of SFAS No. 157 in a market that is not active and provides an example which illustrates key considerations in determining fair value of a financial asset when a market for that financial asset is not active. This FSP was effective upon issuance and did not have a material impact on our financial statements.
Our results of operations
A summary of key financial data for 2008, 2007 and 2006 related to our results of operations for the years then ended is presented below.
| | | | | | | | | | | | | | | | | | | | |
(dollars in thousands, except per unit amounts) | | Year ended
December 31,
2008 | | | Year ended
December 31,
2007 | | | Year ended
December 31,
2006 | | | Year to year change | |
| | | | | 2008-
2007 | | | 2007-
2006 | |
Production: | | | | | | | | | | | | | | | | | | | | |
Oil (Mbbls) | | | 2,236 | | | | 1,645 | | | | 916 | | | | 591 | | | | 729 | |
Natural gas (Mmcf) | | | 131,159 | | | | 111,419 | | | | 44,123 | | | | 19,740 | | | | 67,296 | |
Total production (Mmcfe)(1) | | | 144,575 | | | | 121,289 | | | | 49,619 | | | | 23,286 | | | | 71,670 | |
Oil and natural gas revenues before derivative financial instrument activities: | | | | | | | | | | | | | | | | | | | | |
Oil | | $ | 216,727 | | | $ | 117,073 | | | $ | 57,043 | | | $ | 99,654 | | | $ | 60,030 | |
Natural gas | | | 1,188,099 | | | | 758,714 | | | | 302,192 | | | | 429,385 | | | | 456,522 | |
| | | | | | | | | | | | | | | | | | | | |
Total oil and natural gas | | $ | 1,404,826 | | | $ | 875,787 | | | $ | 359,235 | | | $ | 529,039 | | | $ | 516,552 | |
| | | | | | | | | | | | | | | | | | | | |
Midstream operations: | | | | | | | | | | | | | | | | | | | | |
Midstream revenues (before intersegment eliminations) | | $ | 147,636 | | | $ | 45,763 | | | $ | 18,524 | | | $ | 101,873 | | | $ | 27,239 | |
Midstream operating expenses (before intersegment eliminations) | | | 112,705 | | | | 22,276 | | | | 16,342 | | | | 90,429 | | | | 5,934 | |
| | | | | | | | | | | | | | | | | | | | |
Midstream operating profit (before intersegment eliminations) | | | 34,931 | | | | 23,487 | | | | 2,182 | | | | 11,444 | | | | 21,305 | |
Intersegment eliminations | | | (32,296 | ) | | | (20,959 | ) | | | (1,840 | ) | | | (11,337 | ) | | | (19,119 | ) |
| | | | | | | | | | | | | | | | | | | | |
Midstream operating profit (after intersegment eliminations) | | $ | 2,635 | | | $ | 2,528 | | | $ | 342 | | | $ | 107 | | | $ | 2,186 | |
| | | | | | | | | | | | | | | | | | | | |
Oil and natural gas derivative financial instruments: | | | | | | | | | | | | | | | | | | | | |
Cash settlements on derivative financial instruments | | $ | (109,300 | ) | | $ | 108,413 | | | $ | 29,423 | | | $ | (217,713 | ) | | $ | 78,990 | |
Non-cash change in fair value of derivative financial instruments | | | 493,689 | | | | (81,606 | ) | | | 169,241 | | | | 575,295 | | | | (250,847 | ) |
| | | | | | | | | | | | | | | | | | | | |
Total derivative financial instrument activities | | $ | 384,389 | | | $ | 26,807 | | | $ | 198,664 | | | $ | 357,582 | | | $ | (171,857 | ) |
| | | | | | | | | | | | | | | | | | | | |
Average sales price (before cash settlements of derivative financial instruments): | | | | | | | | | | | | | | | | | | | | |
Oil (Bbl) | | $ | 96.93 | | | $ | 71.17 | | | $ | 62.27 | | | $ | 25.76 | | | $ | 8.90 | |
Natural gas (per Mcf) | | | 9.06 | | | | 6.81 | | | | 6.85 | | | | 2.25 | | | | (0.04 | ) |
Natural gas equivalent (per Mcfe) | | | 9.72 | | | | 7.22 | | | | 7.24 | | | | 2.50 | | | | (0.02 | ) |
Costs and expenses: | | | | | | | | | | | | | | | | | | | | |
Oil and natural gas operating costs(2) | | $ | 161,172 | | | $ | 115,719 | | | $ | 46,177 | | | $ | 45,453 | | | $ | 69,542 | |
Production and ad valorem taxes | | | 76,899 | | | | 53,280 | | | | 22,340 | | | | 23,619 | | | | 30,940 | |
Gathering and transportation | | | 14,206 | | | | 10,210 | | | | 1,615 | | | | 3,996 | | | | 8,595 | |
Depletion | | | 435,595 | | | | 357,902 | | | | 129,311 | | | | 77,693 | | | | 228,591 | |
Depreciation and amortization | | | 24,719 | | | | 17,518 | | | | 6,411 | | | | 7,201 | | | | 11,107 | |
General and administrative(3) | | | 87,568 | | | | 64,670 | | | | 41,206 | | | | 22,898 | | | | 23,464 | |
Interest expense, net, including impacts of interest rate swaps | | | 161,638 | | | | 181,350 | | | | 84,871 | | | | (19,712 | ) | | | 96,479 | |
Costs and expenses (per Mcfe): | | | | | | | | | | | | | | | | | | | | |
Oil and natural gas operating costs | | $ | 1.11 | | | $ | 0.95 | | | $ | 0.93 | | | $ | 0.16 | | | $ | 0.02 | |
Production and ad valorem taxes | | | 0.53 | | | | 0.44 | | | | 0.45 | | | | 0.09 | | | | (0.01 | ) |
Gathering and transportation | | | 0.10 | | | | 0.08 | | | | 0.03 | | | | 0.02 | | | | 0.05 | |
Depletion | | | 3.01 | | | | 2.95 | | | | 2.61 | | | | 0.06 | | | | 0.34 | |
Depreciation and amortization | | | 0.17 | | | | 0.15 | | | | 0.13 | | | | 0.02 | | | | 0.02 | |
General and administrative | | | 0.61 | | | | 0.53 | | | | 0.83 | | | | 0.08 | | | | (0.30 | ) |
Net income (loss) | | $ | (1,733,471 | ) | | $ | 49,656 | | | $ | 138,954 | | | $ | (1,783,127 | ) | | $ | (89,298 | ) |
Preferred Stock dividends | | | (76,997 | ) | | | (132,968 | ) | | | — | | | | 55,971 | | | | (132,968 | ) |
| | | | | | | | | | | | | | | | | | | | |
Income (loss) available to common shareholders | | $ | (1,810,468 | ) | | $ | (83,312 | ) | | $ | 138,954 | | | $ | (1,727,156 | ) | | $ | (222,266 | ) |
| | | | | | | | | | | | | | | | | | | | |
53
| (1) | Mmcfe is calculated by converting one barrel of oil into six Mcf of natural gas. |
| (2) | Share-based compensation, pursuant to SFAS No. 123(R), included in oil and natural gas operating costs, is $4.2 million, $3.6 million and $0 for the years ended December 31, 2008, 2007 and 2006, respectively. |
| (3) | Share-based compensation, pursuant to SFAS No. 123(R), included in general and administrative expenses is $11.8 million, $9.0 million and $6.5 million for the years ended December 31, 2008, 2007 and 2006, respectively. See “Note 2. Summary of significant accounting policies—Stock options” in the notes to our consolidated financial statements included in this Annual Report on Form 10-K. |
The following is a discussion of our financial condition and results of operations for the years ended December 31, 2008, 2007 and 2006.
The comparability of our results of operations from 2008, 2007 and 2006 is impacted by:
| | • | | the following acquisitions: |
| | • | | the TXOK Acquisition on February 14, 2006; |
| | • | | the acquisition of Power Gas Marketing & Transmission, Inc., or PGMT, on April 28 2006; |
| | • | | the Winchester Acquisition on October 2, 2006; |
| | • | | the Vernon Acquisition on March 30, 2007; |
| | • | | the Southern Gas Acquisition on May 2, 2007; |
| | • | | the acquisition of an additional 45% interest in the Canyon Sand field in West Texas, or the Canyon Sand Acquisition, on October 9, 2007; |
| | • | | the Appalachian Acquisition on February 20, 2008; |
| | • | | the New Waskom Acquisition on March 11, 2008; and |
| | • | | the Danville Acquisition on July 15, 2008; |
| | • | | dispositions of oil and natural gas properties, primarily properties in the Rocky Mountain region in January 2007 and the sale of our non-operating interests in the Cement Field in Oklahoma in July 2007; |
| | • | | significant changes in the amount of our long-term debt and the issuance of $2.0 billion of preferred stock, which was converted to common stock in July 2008, related to our acquisitions; |
| | • | | changes in proved reserves and their impact on depletion; |
| | • | | fluctuations in oil and natural gas prices which impact our oil and natural gas reserves, revenues and net income or loss; |
| | • | | mark-to-market accounting used for our derivative financial instruments gains or losses; and |
| | • | | the impact of ceiling test write-downs in 2008. |
General
The availability of a ready market for oil and natural gas and the prices of oil and natural gas are dependent upon a number of factors that are beyond our control. These factors include, among other things:
| | • | | the level of domestic production and economic activity, particularly the recent worldwide economic slowdown which has put downward pressure on oil and natural gas prices and demand; |
| | • | | the level of domestic and international industrial demand for manufacturing operations; |
| | • | | the availability of imported oil and natural gas; |
| | • | | actions taken by foreign oil producing nations; |
| | • | | the cost and availability of natural gas pipelines with adequate capacity and other transportation facilities; |
54
| | • | | the cost and availability of other competitive fuels; |
| | • | | fluctuating and seasonal demand for oil, natural gas and refined products; |
| | • | | the extent of governmental regulation and taxation (under both present and future legislation) of the production, refining, transportation, pricing, use and allocation of oil, natural gas, refined products and substitute fuels; and |
| | • | | trends in fuel use and government regulations that encourage less fuel use. |
Accordingly, in light of the many uncertainties affecting the supply and demand for oil, natural gas and refined petroleum products, we cannot accurately predict the prices or marketability of oil and natural gas from any producing well in which we have or may acquire an interest.
Marketing arrangements and backlog
We produce oil and natural gas. We do not refine or process the oil we produce. We sell the majority of the oil we produce under short-term contracts using market sensitive pricing. The majority of our oil contracts are based on NYMEX pricing, which is typically calculated as the average of the daily closing prices of oil to be delivered one month in the future. We also sell a portion of our oil at F.O.B. field prices posted by the principal purchaser of oil where our producing properties are located. Our sales contracts are of a type common within the industry, and we usually negotiate a separate contract for each property. Generally, we sell our oil to purchasers and refiners near the areas of our producing properties.
We sell the majority of our natural gas under individually negotiated natural gas purchase contracts using market sensitive pricing. Our natural gas contracts vary in length from spot market sales of a single day to term agreements that may extend for a year or more. Our natural gas customers include utilities, natural gas marketing companies and a variety of commercial and industrial end users. The natural gas purchase contracts define the terms and conditions unique to each of these sales. The prices received for natural gas sold on the spot market varies daily, reflecting changing market conditions. We also gather, process and transport natural gas for other producers in fields which we operate for which we are compensated.
For the year ended December 31, 2008, sales to a natural gas marketing company, Crosstex Gulf Coast Marketing, and to a regulated natural gas utility company, Atmos Energy Marketing L.L.C. and its affiliates, accounted for approximately 12.0% and 11.2%, respectively, of total consolidated revenues. For the year ended December 31, 2007, sales to a regulated natural gas utility company, Atmos Energy Marketing L.L.C. and its affiliates, and an independent oil and natural gas company, Anadarko and its affiliates, accounted for approximately 18.9% and 11.4%, respectively, of total consolidated revenues. For the year ended December 31, 2006, sales to one customer, Duke Energy Field Services, accounted for approximately 11.3% of total consolidated revenues. The loss of any significant customer may cause a temporary interruption in sales of, or a lower price for, our oil and natural gas, but we believe that the loss of any one customer would not have a material adverse effect on our results of operations or financial condition.
We may be unable to market all the oil and natural gas we produce. If our oil and natural gas can be marketed, we may be unable to negotiate favorable price and contractual terms. Changes in oil or natural gas prices may significantly affect our revenues, cash flows, the value of our oil and natural gas properties and the estimates of economically recoverable oil and natural gas contained in our properties. Further, significant declines in the prices of oil or natural gas may have a material adverse effect on our business and on our financial condition.
We engage in oil and natural gas production activities in geographic regions where, from time to time, the supply of oil or natural gas available for delivery exceeds the demand. In this situation, companies purchasing oil or natural gas in these areas reduce the amount of oil or natural gas that they purchase from us. If we cannot locate other buyers for our production or for any of our newly discovered oil or natural gas reserves, we may shut-in our oil or natural gas wells for periods of time. If this occurs, we may incur additional payment obligations under our oil and natural gas leases and, under certain circumstances, the oil and natural gas leases might be terminated.
55
Summary
For the year ended December 31, 2008 and 2007, we had a net loss available to common shareholders of $1.8 billion and $83.3 million, respectively. For the year ended December 31, 2006, we had net income of $139.0 million.
The impact of acquisitions and derivative financial instruments are significant to our results of operations. During 2008 and 2007, we closed approximately $0.8 billion and $2.5 billion of acquisitions, respectively, which significantly increased our production, revenues and operating costs. In addition, we do not designate our derivative financial instruments as hedges. Therefore, we mark the changes in the fair value of our unsettled derivative financial instruments to market at the end of each reporting period. Due to significant fluctuations in the price of oil and natural gas during 2008, 2007 and 2006, the impacts of derivative financial instruments, including cash settlements or receipts with our counterparties and the non-cash mark-to-market impacts, totaled net gains of $384.4 million, $26.8 million and $198.7 million for 2008, 2007 and 2006, respectively.
Oil and natural gas revenues, production and prices
Total oil and natural gas revenues for 2008 were $1.4 billion compared with $875.8 million for 2007 and $359.2 million for 2006. For 2008, natural gas represented 84.6% of our oil and natural gas revenues and 90.7% of equivalent production. For 2007, natural gas represented 86.6% of our oil and natural gas revenues and 91.9% of equivalent production. For 2006 our natural gas represented 84.1% of our oil and natural gas revenues and 88.9% of equivalent production. Our equivalent production volumes for 2008 were 144.6 Bcfe compared with 121.3 Bcfe for 2007, an increase of 19.2%, due to our 2008 Appalachian Acquisition and the Danville Acquisition, combined with full year 2008 production impacts from the 2007 Vernon Acquisition and the Southern Gas Acquisition. The Appalachian Acquisition and the Danville Acquisition contributed 7.7 Bcfe of production to our 2008 total volumes. Production increases of approximately 10.2 Bcfe in 2008 include the impact of a full year production from the Vernon Acquisition and the Southern Gas Acquisition compared with a partial year in 2007. Our equivalent production volumes for 2007 were 121.3 Bcfe compared with 49.6 Bcfe for 2006, an increase of 144.4%, primarily due to the Vernon Acquisition and the Southern Gas Acquisition. Equivalent production from our 2007 acquisitions represented over 40.8% of 2007 total volumes. The average price per Mcfe was $9.72, $7.22 and $7.24 for 2008, 2007 and 2006, respectively.
For 2008, our average price received for natural gas, was $9.06 per Mcf compared with $6.81 per Mcf in 2007 and $6.85 per Mcf in 2006. The 2008 average price received for oil was $96.93 per Bbl, or 36.2% higher than the 2007 price of $71.17 per Bbl. The average price per Bbl for 2006 was $62.27. The price that we receive for the oil and natural gas we produce is largely a function of market supply and demand. Demand is impacted by general economic conditions, estimates of oil and natural gas in storage, weather and other seasonal conditions, including hurricanes and tropical storms. Market conditions involving over or under supply of natural gas can result in substantial price volatility. Historically, commodity prices have been volatile and we expect the volatility to continue in the future. Changes in oil and natural gas prices have a significant impact on our oil and natural gas revenues, cash flows, quantities of estimated Proved Reserves and related liquidity. Oil and natural gas prices were particularly volatile during the fourth quarter of 2008 where our average price for oil decreased from $116.03 per barrel for the quarter ended September 30, 2008 to $56.11 per barrel for the quarter ended December 31, 2008, a decrease of 51.6%. Average natural gas prices also decreased 36.3% from $10.11 per Mcf to $6.44 per Mcf for the quarters ended September 30, 2008 and December 31, 2008, respectively. Assuming our 2008 production levels, a change of $0.10 per Mcf of natural gas sold would result in an annual increase or decrease in revenues and cash flow of approximately $13.1 million and a change of $1.00 per Bbl of oil sold would result in an annual increase or decrease in revenues and cash flow of approximately $2.2 million without considering the effects of derivative financial instruments.
Changes in oil and natural gas volumes from our acquisitions, development drilling and exploitation projects combined with significant price fluctuations also impacted our operating revenues and cash flows from operations. In 2008, our revenues (before the impact of derivative financial instruments) increased to $1.4 billion from $875.8 million for 2007. The total increase of $529.0 million was attributable to an increase of
56
$236.0 million from increased volumes primarily due to 2008 and 2007 acquisitions along with an increase in our realized price per Mcfe, which increased revenue by $293.0 million.
The 2008, 2007 and 2006 acquisitions significantly increased our presence in the East Texas/North Louisiana, Appalachia, and Mid-Continent regions. Following is a summary of production grouped by our significant producing regions for the years ended December 31, 2008, 2007 and 2006.
| | | | | | | | | | | | |
| | | Years ended December 31, |
| | | 2008 | | 2007 | | 2006 |
Areas | | Mmcfe | | % | | Mmcfe | | % | | Mmcfe | | % |
East Texas/North Louisiana | | 87,540 | | 60.5 | | 78,312 | | 64.6 | | 17,888 | | 36.1 |
Mid-Continent | | 24,239 | | 16.8 | | 19,271 | | 15.9 | | 9,494 | | 19.1 |
Appalachia | | 20,899 | | 14.5 | | 15,661 | | 12.9 | | 15,028 | | 30.3 |
Permian | | 11,364 | | 7.9 | | 7,277 | | 6.0 | | 4,725 | | 9.5 |
Rockies | | 533 | | 0.3 | | 768 | | 0.6 | | 2,484 | | 5.0 |
| | | | | | | | | | | | |
Total production | | 144,575 | | 100.0 | | 121,289 | | 100.0 | | 49,619 | | 100.0 |
| | | | | | | | | | | | |
During 2008 we closed the Appalachian Acquisition, which included shallow natural gas properties located primarily in our central Pennsylvania operating area and the Danville Acquisition, which include producing oil and natural gas properties, acreage and other assets in Gregg, Rusk and Upshur counties of Texas. The Appalachian Acquisition and the Danville Acquisition increased our production in our Appalachia and East Texas/North Louisiana areas by 4.6 Bcfe and 3.1 Bcfe, respectively, during 2008. In addition, the impact of a full year of production in 2008 compared with a partial year in 2007 from the Vernon Acquisition increased volumes in East Texas/North Louisiana by 4.4 Bcfe. Volumes in the Mid-Continent area from the Southern Gas Acquisition increased by 5.7 Bcfe during 2008.
In January 2007, we completed the sale of our producing properties and undeveloped drilling locations in the Wattenberg Field area of the DJ Basin, Colorado. This transaction included substantially all of our producing assets in Colorado. Our remaining Rockies production is in the state of Wyoming. In May 2007, we sold a group of properties acquired in the Southern Gas Acquisition. While this sale, which provided proceeds of approximately $235.5 million, was substantial, it did not impact our results of operations as we did not hold the properties for a period of time sufficient to impact our operating results. In July 2007, we completed the sale of substantially all of our interest in the Cement Field located in our Mid-Continent area. In October 2007, we completed the purchase of an additional 45% ownership interest in approximately 28,000 acres of leasehold interests and 135 producing wells in our Canyon Sand field in West Texas located in our Permian area. We also completed several small sales of producing properties and acreages throughout 2007. The Vernon Acquisition and the Southern Gas Acquisition significantly increased our production in the East Texas/North Louisiana and Mid-Continent areas during 2007.
Midstream revenues
Our Midstream revenues are principally derived from our three wholly-owned subsidiaries; TGG, an intrastate pipeline and the Talco and Vernon gathering systems. Total throughput from these assets exceeds 550.0 Mmcf per day, including natural gas produced from our exploration and production operating segment.
We evaluate our midstream operations as if they were a stand alone operation. Accordingly, the results of operations discussed below are prior to intercompany eliminations.
For year ended December 31, 2008, midstream revenues, were $147.6 million, a 222.6% increase over the year ended December 31, 2007 midstream revenues of $45.8 million. Increases in the sales of natural gas account for 80.9% of the increase in the midstream revenues and are primarily attributable to the New Waskom Acquisition and gathering assets acquired in the Danville Acquisition. These assets, which were not in our portfolio in 2007, have several contracts whereby we purchase and resell natural gas produced by third-parties. The remaining increase in revenues was attributable to increases in drip sales and gathering fees associated with the 2008 acquisitions, as well as increased throughput on our midstream assets.
57
For year ended December 31, 2007, midstream revenues, were $45.8 million, a 147.0% increase over the year ended December 31, 2006 midstream revenues of $18.5 million. The increased revenues were primarily attributable to our having four quarters of revenue from TGG and Talco in 2007, while only having one quarter of revenue from TGG and Talco in 2006. TGG and Talco were acquired with the Winchester Acquisition in the fourth quarter of 2006.
Oil and natural gas operating costs
Our oil and natural gas operating costs for 2008, 2007, and 2006 were $161.2 million, $115.7 million and $46.2 million, respectively. Absolute increases in total dollar value from year to year are due primarily to operating expenses incurred from our acquisitions. Management believes that analyses on a per Mcfe basis provide a more meaningful measure than the absolute dollar increases since the acquisitions in 2007 and 2008 were significant. The following tables summarize direct operating expenses and unit rates per Mcfe for 2008, 2007, and 2006:
| | | | | | | | | | | | | | | | |
(in thousands) | | Year ended
December 31,
2008 | | Year ended
December 31,
2007 | | Year ended
December 31,
2006 | | Year to
year change | | Year to
year change | |
| | | | | 2008-2007 | | 2007-2006 | |
Lease operating expense | | $ | 144,171 | | $ | 104,002 | | $ | 45,504 | | $ | 40,169 | | $ | 58,498 | |
Workovers | | | 12,827 | | | 8,126 | | | 673 | | | 4,701 | | | 7,453 | |
Stock-based compensation (non-cash) | | | 4,174 | | | 3,591 | | | — | | | 583 | | | 3,591 | |
| | | | | | | | | | | | | | | | |
Total oil and natural gas operating costs | | $ | 161,172 | | $ | 115,719 | | $ | 46,177 | | $ | 45,453 | | $ | 69,542 | |
| | | | | | | | | | | | | | | | |
| | | | | |
(per Mcfe) | | Year ended
December 31,
2008 | | Year ended
December 31,
2007 | | Year ended
December 31,
2006 | | Year to
year change | | Year to
year change | |
| | | | | 2008-2007 | | 2007-2006 | |
Lease operating expense | | $ | 0.99 | | $ | 0.85 | | $ | 0.92 | | $ | 0.14 | | $ | (0.07 | ) |
Workovers | | | 0.09 | | | 0.07 | | | 0.01 | | | 0.02 | | | 0.06 | |
Stock-based compensation (non-cash) | | | 0.03 | | | 0.03 | | | — | | | — | | | 0.03 | |
| | | | | | | | | | | | | | | | |
Total oil and natural gas operating costs | | $ | 1.11 | | $ | 0.95 | | $ | 0.93 | | $ | 0.16 | | $ | 0.02 | |
| | | | | | | | | | | | | | | | |
On a per Mcfe basis, oil and natural gas operating expenses for the year ended December 31, 2008 increased $0.16 from year ended December 31, 2007. Direct lease operating expenses per unit increased by $0.14 per Mcfe, or 16.5%, for the year ended December 31, 2008, from year ended 2007. These increases are primarily the result of increases in chemicals, labor, utilities, and the general increase in the costs of goods and services used in our operations. Workover expenses for the year ended December 31, 2008, on an Mcf basis, increased $0.02 per Mcfe from the year ended December 31, 2007 due primarily to higher costs for rigs and services.
The overall increase in oil and natural gas operating costs for the year ended December 31, 2008 was primarily attributable to:
| | • | | the Vernon Acquisition, which closed on March 30, 2007 and added production expenses of $13.7 million for the year ended December 31, 2008 when compared to the same period in 2007; |
| | • | | the Southern Gas Acquisition, which closed on May 2, 2007 and added $6.1 million of production expenses for the year ended December 31, 2008; |
| | • | | the Appalachian Acquisition, which closed on February 20, 2008, added $5.5 million of production expenses for the year ended December 31, 2008; |
| | • | | the Danville Acquisition, which closed on July 15, 2008 and added $3.1 million of production expenses for the year ended December 31, 2008; |
| | • | | increased direct production expenses of approximately $4.8 million in our Sugg Ranch area primarily due to the acquisition of incremental working interests in that area and incremental operating costs resulting from our development of this field; |
58
| | • | | increases of $0.6 million of non-cash stock-based compensation costs; |
| | • | | a general increase in the cost of goods and services used in our oil and natural gas operations, most notably motor fuel and utility costs during the second quarter of 2008; and |
| | • | | increases from new well additions through our development and exploitation capital program. |
On a per Mcfe basis, oil and natural gas operating expenses for the year ended December 31, 2007 increased $0.02 from year ended December 31, 2006. While direct lease operating expenses per unit decreased by $0.07 per Mcfe, or 7.6%, for the year ended December 31, 2007, from year ended 2006, the actual 2007 expense increased by $58.5 million from 2006. The total increase of $69.5 million is due primarily to costs associated with the 2006 and 2007 acquisitions, including $2.1 million related to TXOK, $1.9 million related to PGMT, $29.0 million related to Winchester, $13.1 million related to Vernon and $14.1 million related to Southern Gas. The per unit increase in total costs reflects a general increase in the cost of goods and services for all of our producing areas and an increase in workover activities, which is partially offset by lower per unit operating costs from the Vernon Acquisition due to high production volumes for the properties acquired in the Vernon Acquisition.
Midstream operating expenses
Our midstream operating expenses before intercompany eliminations, which includes the cost of natural gas purchased and then resold, for the year ended December 31, 2008 increased $90.4 million, or 406.0%, respectively, from the year ended December 31, 2007. The increase in midstream operating expenses for the year ended December 31, 2008 was primarily attributable to:
| | • | | increased cost of purchased gas of approximately $78.3 million due primarily to contracts assumed to purchase natural gas from our March 2008 New Waskom Acquisition; and |
| | • | | increased operating expenses of approximately $10.2 million related to the March 2008 New Waskom Acquisition and increased Vernon Gathering operating expenses due to 2008 containing twelve months of operating costs and 2007 containing only nine months of operating costs. |
Gathering and transportation
We report gathering and transportation costs in accordance with Emerging Issues Task Force Issue 00-10, “Accounting for Shipping and Handling Fees and Costs,” or EITF 00-10. We generally sell oil and natural gas under two types of agreements which are common in our industry. Both types of agreements include a transportation charge. One is a netback arrangement, under which we sell oil or natural gas at the wellhead and collect a price, net of the transportation incurred by the purchaser. In this case, we record sales at the price received from the purchaser, net of the transportation costs. Under the other arrangement, we sell oil or natural gas at a specific delivery point, pay transportation to a third party and receive proceeds from the purchaser with no transportation deduction. In this case, we record the transportation cost as gathering and transportation expense. Due to these two distinct selling arrangements, our computed realized prices, before the impact of derivative financial instruments, contain revenues which are reported under two separate bases. Gathering and transportation expenses totaled $14.2 million for the year ended December 31, 2008 compared to $10.2 million for the year ended December 31, 2007. As our marketing efforts expand, we expect our gathering and transportation expenses will also increase.
Production and ad valorem taxes
Production and ad valorem taxes were $76.9 million, $53.3 million and $22.3 million for 2008, 2007, and 2006, respectively. The overall increases in production and ad valorem taxes are primarily attributable to higher oil and natural gas volumes and prices resulting from acquisitions and our development drilling. On a percentage of sales basis, our 2008 production and ad valorem taxes were 5.5% of oil and natural gas sales, excluding the impact of derivative financial instruments, compared with 6.1% and 6.2% for 2007 and 2006, respectively. The decrease in the consolidated rate in 2008 compared with 2007 is primarily the result of a statutory severance tax
59
rate reduction in the state of Louisiana, which lowered the rate from $0.37 per Mcf for 2007 to $0.29 per Mcf for 2008. The lower severance tax rate in Louisiana contributed significantly to our decreased severance tax rate in 2008 when measured as a percentage of revenue due to a significant increase in Louisiana production volume resulting from the Vernon Acquisition and development drilling in North Louisiana. Production taxes are set by state and local governments and vary as to the tax rate and the value to which that rate is applied. Further, ad valorem taxes in Texas and other states are based partially on the value of oil and natural gas reserves, which have increased significantly since the beginning of 2007 due to acquisitions. These taxes are generally based upon the price received for production.
Depreciation, depletion and amortization
The following table presents our depreciation, depletion and amortization expenses for the years ended December 31, 2008, 2007 and 2006. The depreciation, depletion and amortization rate per Mcfe produced varies significantly for each of the periods presented due to our acquisitions of TXOK, PGMT and Winchester in 2006, which increased the depreciation, depletion and amortization rate to $2.74 per Mcfe in 2006. The Vernon Acquisition and the Southern Gas Acquisition, both of which included significant proved developed producing properties, further increased the depreciation, depletion and amortization rate to $3.10 per Mcfe in 2007. The Appalachian Acquisition and the Danville Acquisition, along with a full year of activity related to the 2007 acquisitions, initially increased the depreciation, depletion and amortization rate. However, ceiling test write-downs in 2008 decreased the unit of production rate to $2.88 in the fourth quarter of 2008 and to $3.01 per Mcfe for the full year 2008. The total 2008 depreciation, depletion and amortization rate was $3.18 per Mcfe, approximately 2.6% higher than 2007.
| | | | | | | | | | | | | | | |
(in thousands, except per unit amounts) | | Year ended
December 31,
2008 | | Year ended
December 31,
2007 | | Year ended
December 31,
2006 | | Year to year
change
2008-2007 | | Year to year
change
2007-2006 |
Depreciation, depletion and amortization costs: | | | | | | | | | | | | | | | |
Depletion expense | | $ | 435,595 | | $ | 357,902 | | $ | 129,311 | | $ | 77,693 | | $ | 228,591 |
Depreciation and amortization expense | | $ | 24,719 | | $ | 17,518 | | $ | 6,411 | | $ | 7,201 | | $ | 11,107 |
Depletion calculated rate per Mmcfe | | $ | 3.01 | | $ | 2.95 | | $ | 2.61 | | $ | 0.06 | | $ | 0.34 |
Depreciation and amortization calculated rate per Mmcfe | | $ | 0.17 | | $ | 0.15 | | $ | 0.13 | | $ | 0.02 | | $ | 0.02 |
Consolidated depreciation, depletion and amortization rate per Mcfe | | $ | 3.18 | | $ | 3.10 | | $ | 2.74 | | $ | 0.08 | | $ | 0.36 |
Accretion of discount on asset retirement obligations increased to $6.7 million in 2008 from $4.9 million in 2007 and $2.0 million in 2006. The increase in 2008 from 2007 and in 2007 from 2006 is due to the combination of significant well additions and related plugging liabilities in connection with our 2008, 2007 and 2006 acquisitions and increased estimates for the costs to plug and abandon properties. The increased estimates for plugging and abandoning properties reflect increased costs for labor, rig rates and materials used in those operations.
Write-down of oil and natural gas properties
We recognized a pre-tax write-down of our oil and natural gas properties of $2.8 billion ($1.7 billion after-tax) for the year ended December 31, 2008, $1.2 billion ($0.7 billion after-tax) in the third quarter of 2008 and $1.6 billion ($1.0 billion after-tax) in the fourth quarter of 2008. The prices used to compute our third quarter ceiling test were $7.12 per Mmbtu at Henry Hub and a spot price of $100.67 per Bbl of oil. Under full cost accounting, we are required to compute the after-tax present value of our proved oil and natural gas properties using spot market prices for oil and natural gas at our balance sheet date. The base for our spot prices for natural gas is Henry Hub. On December 31, 2008, the spot price for natural gas at Henry Hub was $5.71 per Mmbtu and the spot oil price was $44.60 per Bbl. Natural gas, which is sold at other natural gas marketing hubs where we conduct our operations, is subject to prices which reflect variables that can increase or decrease spot natural gas prices at these hubs such as market demand, transportation costs and quality of the natural gas being sold. Those differences are referred to as
60
the basis differentials. Typically, basis differentials result in natural gas prices which are lower than Henry Hub, except in Appalachia, where we typically have received a premium to Henry Hub.
General and administrative expenses
The following table presents our general and administrative expenses for the years ended December 31, 2008, 2007 and 2006 and changes for each of the years then ended.
| | | | | | | | | | | | | | | | | | | | |
(in thousands, except per unit amounts) | | Year ended
December 31,
2008 | | | Year ended
December 31,
2007 | | | Year ended
December 31,
2006 | | | Year to year
change
2008-2007 | | | Year to year
change
2006-2007 | |
General and administrative costs: | | | | | | | | | | | | | | | | | | | | |
Gross general and administrative expense | | $ | 123,981 | | | $ | 88,778 | | | $ | 52,357 | | | $ | 35,203 | | | $ | 36,421 | |
Operator overhead reimbursements | | | (24,902 | ) | | | (18,413 | ) | | | (7,824 | ) | | | (6,489 | ) | | | (10,589 | ) |
Capitalized acquisition and development charges | | | (11,511 | ) | | | (5,695 | ) | | | (3,327 | ) | | | (5,816 | ) | | | (2,368 | ) |
| | | | | | | | | | | | | | | | | | | | |
Net general and administrative expense | | $ | 87,568 | | | $ | 64,670 | | | $ | 41,206 | | | $ | 22,898 | | | $ | 23,464 | |
| | | | | | | | | | | | | | | | | | | | |
General and administrative expense per Mcfe | | $ | 0.61 | | | $ | 0.53 | | | $ | 0.83 | | | $ | 0.08 | | | $ | (0.30 | ) |
Net general and administrative expenses for the year ended December 31, 2008 were $87.6 million, or $0.61 per Mcfe, compared with $64.7 million, or $0.53 Mcfe, in 2007, an increase of $22.9 million. Significant components of the increase for the year ended December 31, 2008 include the following items:
| | • | | increased personnel costs of $20.7 million due to increasing our net headcount by 185 employees related primarily to our acquisitions and expanding our technical and managerial staff to fully exploit our asset base; |
| | • | | an increase in share-based compensation costs of $2.8 million due primarily to additional headcount; |
| | • | | increased consulting and contract labor costs of $1.4 million due primarily to acquisitions and information technology-related support; |
| | • | | increased information technology related costs of $2.3 million primarily due to the equipment and infrastructure requirements attributable to our increased headcount; |
| | • | | increased legal fees of $2.0 million, including $3.7 million attributable to a write-off of our proposed master limited partnership offering, which was withdrawn in January 2008. The increase associated with this write-off was partially offset by lower external legal fees of approximately $1.7 million during the year ended December 31, 2008 when compared with the prior year; |
| | • | | increases of $1.1 million in automobile expenses; |
| | • | | increased occupancy costs of $0.7 million resulting from expansion of corporate facilities; |
| | • | | increased franchise tax of $0.6 million due, primarily, to changes in the jurisdictional make-up of our properties; and |
| | • | | other expenses related to the overall growth of our business. |
Net general and administrative expenses for the year ended December 31, 2007 were $64.7 million, or $0.53 per Mcfe, compared with $41.2 million, or $0.83 per Mcfe, in 2006, an increase of $23.5 million. Each of the respective years contains significant and notable variances. In 2007, we experienced significant increases in personnel and support facilities related to our 2006 and 2007 acquisitions. These increased personnel expenses totaled approximately $18.2 million of increased cash expenses for 2007 and non-cash expenses increased approximately $2.5 million from share-based compensation for 2007. We also incurred approximately $16.5 million for 2007 of legal and project-oriented costs including (i) audit and legal fees in connection with our
61
2006 and 2007 acquisitions, (ii) costs for implementation of Section 404 of the Sarbanes-Oxley Act of 2002 and (iii) expenses incurred for conversion of our information technology systems to a common platform.
Partially offsetting the increases in general and administrative expenses were operator overhead recoveries of $24.9 million, $18.4 million and $7.8 million for the years ended December 31, 2008, 2007 and 2006, respectively. Additional offsets to general and administrative expenses were capitalized costs of $11.5 million, $5.7 million and $3.3 million for the years ended December 31, 2008, 2007 and 2008, respectively.
Interest expense
Our interest expense for the year ended December 31, 2008 was $161.6 million compared to $181.3 million for the same period in 2007. The decrease of $19.7 million in 2008 when compared to 2007 reflects higher 2008 interest costs for the Original Term Credit Agreement and the New Term Credit Agreement of $26.9 million and settlements and non-cash changes in the fair value of interest swaps of $9.9 million which were more than offset by reductions of $50.2 million of prior year write-offs of deferred financing costs arising from early debt terminations, reduced interest on credit agreements of $1.7 million and $3.9 million of capitalized interest in 2008. There was no interest capitalized in 2007.
Interest expense for the year ended December 31, 2007 was $181.3 million compared to $84.9 million for the same period in 2006, an increase of $96.4 million. The increase is due primarily to higher interest expenses on credit agreements, most notably the EXCO Operating Credit Agreement, which increased by $56.5 million in 2007 from 2006, an increase of $13.5 million in the EXCO Resources Credit Agreement interest expense and $32.1 million write-offs of deferred financing costs arising from terminations of existing debt agreements. The $56.5 million increase to interest expense in the EXCO Operating Credit Agreement is due primarily to $1.3 billion of debt incurred in connection with the Winchester Acquisition, which closed at the beginning of the fourth quarter of 2006. This debt remained outstanding for all of 2007 compared with only three months during 2006. Additionally, in 2007 we had expenses related to amendments of our credit agreements along with retirement of debt. The following table presents our interest expense for 2008, 2007 and 2006:
| | | | | | | | | | | | | | | | | | |
(in thousands) | | Year ended
December 31,
2008 | | | Year ended
December 31,
2007 | | Year ended
December 31,
2006 | | Year to year
change
2008-2007 | | | Year to year
change
2007-2006 | |
Interest expense: | | | | | | | | | | | | | | | | | | |
7 1/4% senior notes due 2011 | | $ | 28,874 | | | $ | 28,922 | | $ | 29,275 | | $ | (48 | ) | | $ | (353 | ) |
EXCO Resources Credit Agreement | | | 42,628 | | | | 29,415 | | | 15,951 | | | 13,213 | | | | 13,464 | |
EXCO Operating Credit Agreement | | | 52,717 | | | | 68,462 | | | 11,937 | | | (15,745 | ) | | | 56,525 | |
New Term Credit Agreement | | | 1,996 | | | | — | | | — | | | 1,996 | | | | — | |
Original Term Credit Agreement | | | 11,341 | | | | — | | | — | | | 11,341 | | | | — | |
Amortization and write-off of deferred financing costs on EXCO Resources Credit Agreement | | | 1,956 | | | | 1,519 | | | 6,789 | | | 437 | | | | (5,270 | ) |
Amortization and write-off of deferred financing costs on EXCO Operating Credit Agreement | | | 3,014 | | | | 2,619 | | | 858 | | | 395 | | | | 1,761 | |
Amortization of deferred financing costs on New Term Credit Agreement | | | 2,956 | | | | — | | | — | | | 2,956 | | | | — | |
Amortization of deferred financing costs on Original Term Credit Agreement | | | 10,642 | | | | — | | | — | | | 10,642 | | | | — | |
Amortization and write-off of deferred financing costs on EXCO Operating loan | | | — | | | | 32,100 | | | — | | | (32,100 | ) | | | 32,100 | |
EXCO Operating term loan | | | — | | | | 18,140 | | | 18,827 | | | (18,140 | ) | | | (687 | ) |
JP Morgan bridge loan | | | — | | | | — | | | 1,216 | | | — | | | | (1,216 | ) |
Capitalized interest | | | (3,861 | ) | | | — | | | — | | | (3,861 | ) | | | — | |
Interest rate swaps settlements | | | (588 | ) | | | — | | | — | | | (588 | ) | | | — | |
Fair market value adjustment on interest rate swaps | | | 9,878 | | | | — | | | — | | | 9,878 | | | | — | |
Other interest expense | | | 85 | | | | 173 | | | 18 | | | (88 | ) | | | 155 | |
| | | | | | | | | | | | | | | | | | |
Total interest expense | | $ | 161,638 | | | $ | 181,350 | | $ | 84,871 | | $ | (19,712 | ) | | $ | 96,479 | |
| | | | | | | | | | | | | | | | | | |
62
Derivative financial instruments
Our objective in entering into derivative financial instruments is to manage price fluctuations, protect our returns on investments, and achieve a more predictable cash flow in connection with our acquisition activities and borrowings related to these activities. These transactions limit exposure to declines in prices, but also limit the benefits we would realize if prices increase. When prices for oil and natural gas are volatile, a significant portion of the effect of our derivative financial instrument management activities consists of non-cash income or expenses due to changes in the fair value of our derivative financial instrument contracts. Cash charges or gains only arise from payments made or received on monthly settlements of contracts or if we terminate a contract prior to its expiration.
The following table presents our realized and unrealized gains and losses from derivative financial instruments, which are reported as a component of other income or expenses in our consolidated statements of operations. We expect that our revenues will continue to be significantly impacted in future periods by changes in the value of our derivative financial instruments as a result of volatility in oil and natural gas prices and the amount of future production volumes subject to derivative financial instruments.
| | | | | | | | | | | | | | | | | | | |
(in thousands) | | Year ended
December 31,
2008 | | | Year ended
December 31,
2007 | | | Year ended
December 31,
2006 | | Year to year
change
2008-2007 | | | Year to year
change
2007-2006 | |
Derivative financial instrument activities: | | | | | | | | | | | | | | | | | | | |
Cash settlements on derivative financial instruments | | $ | (109,300 | ) | | $ | 108,413 | | | $ | 29,423 | | $ | (217,713 | ) | | $ | 78,990 | |
Non-cash change in fair value of derivative financial instruments | | | 493,689 | | | | (81,606 | ) | | | 169,241 | | | 575,295 | | | | (250,847 | ) |
| | | | | | | | | | | | | | | | | | | |
Total derivative financial instrument activities | | $ | 384,389 | | | $ | 26,807 | | | $ | 198,664 | | $ | 357,582 | | | $ | (171,857 | ) |
| | | | | | | | | | | | | | | | | | | |
The use of derivative financial instruments allows us to limit the impacts of volatile price fluctuations associated with oil and natural gas. The following table presents our natural gas prices, before the impact of derivative financial instruments where average realized prices per Mcfe ranged from a high of $9.72 during the year end December 31, 2008 to a low of $7.22 during the year ended December 31, 2007 while the impact from realized settlements after the impact of our derivative financial instruments increased our price volatility from a high of $8.96 per Mcfe during the year ended December 31, 2008 to a low of $7.83 per Mcfe for the year ended December 31, 2006, respectively.
| | | | | | | | | | | | | | | | | | |
| | | Year ended
December 31,
2008 | | | Year ended
December 31,
2007 | | Year ended
December 31,
2006 | | Year to year
change
2008 - 2007 | | | Year to year
change
2007- 2006 | |
Realized pricing: | | | | | | | | | | | | | | | | | | |
Oil per Bbl | | $ | 96.93 | | | $ | 71.17 | | $ | 62.27 | | $ | 25.76 | | | $ | 8.90 | |
Natural gas per Mcf | | | 9.06 | | | | 6.81 | | | 6.85 | | | 2.25 | | | | (0.04 | ) |
Natural gas equivalent per Mcfe | | | 9.72 | | | | 7.22 | | | 7.24 | | | 2.50 | | | | (0.02 | ) |
Effect of cash settlements on derivatives per Mcfe | | | (0.76 | ) | | | 0.89 | | | 0.59 | | | (1.65 | ) | | | 0.30 | |
| | | | | | | | | | | | | | | | | | |
Net price per Mcfe, including derivative financial instruments | | $ | 8.96 | | | $ | 8.11 | | $ | 7.83 | | $ | 0.85 | | | $ | 0.28 | |
| | | | | | | | | | | | | | | | | | |
Our cash settlements for 2008 decreased revenue by $109.3 million, or $0.76 per Mcfe compared to cash settlements increasing revenues by $108.4 million, or $0.89 per Mcfe, in 2007. The significant fluctuations between settlements of receipts on our derivative financial instruments demonstrates the aforementioned volatility in prices.
Our non-cash mark-to-market changes in the value of derivative financial instruments for 2008 resulted in a gain of $493.7 million compared to a loss of $81.6 million in the prior year. The significant fluctuation was, again, attributable to high volatility in the prices for oil and natural gas between each of the years. The ultimate settlement amount of the unrealized portion of the derivative financial instruments is dependent on future commodity prices.
63
We expect to continue our comprehensive derivative financial instrument program as part of our overall acquisition and financing strategy to enhance our ability to execute our business plan over the entire commodity price cycle, protect our returns on investment, and manage our capital structure. In connection with our acquisitions, we typically hedge a portion of future production acquired in order to lessen the variability of our returns on shareholders’ equity and to protect our shareholders’ equity by supporting our ability to meet our debt service obligations and stabilize cash flows.
In January 2008, we entered into interest rate swaps to mitigate our exposure to fluctuations in interest rates on $700.0 million in principal through February 14, 2010 at LIBO rates ranging from 2.45% to 2.8%. For the year ended December 31, 2008, we had realized gains from settlements of $0.6 million and $9.9 million of non-cash unrealized losses attributable to our interest rate swaps.
Income taxes
The following table presents a reconciliation of our income tax provision (benefit) for the years ended December 31, 2008, 2007 and 2006.
| | | | | | | | | | | |
(in thousands) | | Year ended
December 31,
2008 | | | Year ended
December 31,
2007 | | Year ended
December 31,
2006 | |
United States federal income taxes (benefit) at statutory rate of 35% | | $ | (695,977 | ) | | $ | 38,413 | | $ | 79,925 | |
Increases (reductions) resulting from: | | | | | | | | | | | |
Adjustments to the valuation allowance | | | 526,372 | | | | 9,336 | | | — | |
Non-deductible compensation | | | 2,321 | | | | 3,144 | | | 1,420 | |
State tax rate change | | | — | | |
| 3,078
| | | — | |
State taxes net of federal benefit | | | (88,266 | ) | | | 4,423 | | | 8,704 | |
Other | | | 517 | | | | 1,702 | | | (648 | ) |
| | | | | | | | | | | |
Total income tax provision (benefit) | | $ | (255,033 | ) | | $ | 60,096 | | $ | 89,401 | |
| | | | | | | | | | | |
During 2008, our income tax rate was impacted by the recognition of valuation allowances against deferred tax assets, which were primarily due to ceiling test write-downs that caused previous book basis and tax basis differences to change from deferred tax liabilities to deferred tax assets.
During 2007, our income tax rate was impacted by the substitution of a current federal net operating loss carryback for previously claimed foreign tax credits resulting from the 2005 sale of our Canadian subsidiary. The impact, net of a federal refund of $6.1 million, was an $11.0 million non-cash expense, principally related to foreign tax credits which are required since we no longer have any foreign operations.
Also, as a result of our 2007 acquisitions, our state effective rate increased which required us to change the rate in which we record our deferred tax assets and liabilities. This amount was recognized in our 2007 income tax expense as a current period expense and is presented as part of the “Other” line item presented above.
EXCO files income tax returns in the U.S. federal jurisdictions and various state jurisdictions. With few exceptions, EXCO is no longer subject to U.S. federal and state and local examinations by tax authorities for years before 2004. The Internal Revenue Service, or IRS, completed its examination of EXCO’s 2004 U.S. federal income tax return in January 2008. The result of the audit was an adjustment between U.S. and our Canadian subsidiary for a hedge recorded to the wrong entity. There was no material change to EXCO’s financial position.
The Company adopted the provisions of FASB Interpretation No. 48, “Accounting for Uncertainties in Income Taxes” on January 1, 2007. As a result of the implementation of Interpretation No. 48, the Company recognized a zero liability for unrecognized tax benefits. As of December 31, 2008, 2007 and 2006, the Company’s policy is to recognize interest related to unrecognized tax benefits of interest expense and penalties in operating expenses. The Company has not accrued any interest or penalties relating to unrecognized tax benefits in the current financials.
64
Liquidity, capital resources and capital commitments
Overview
Our financial strategy is to use a combination of cash flow from operations, bank financing, cash received from the sale of oil and natural gas properties and the issuance of equity and debt securities to fund our operations, conduct development and exploitation activities and to fund acquisitions. Historically, we have used acquisitions and vertical drilling as our vehicle for growth. As a result of our acquisition strategy, we have accumulated a large inventory of low risk drilling locations and acreage holdings with significant shale resource potential. This potential has created a shift in our focus to define the extent of and develop this shale resource through the application of horizontal drilling. We will continue to develop certain vertical drilling opportunities in East Texas/North Louisiana, West Texas and Appalachia. Any future acquisitions will more than likely be focused on supplementing our shale resource holdings in our East Texas/North Louisiana and Appalachia areas as economic conditions permit. Consistent with our strategy of acquiring and developing reserves, we have an objective of maintaining financing flexibility and the use of derivative financial instruments to mitigate price fluctuations. During the third quarter of 2008, prices for oil and natural gas began to decline significantly. The magnitude of these price declines, together with other significant negative economic indicators, prompted us to re-evaluate our 2009 capital budget, and we reduced our anticipated capital spending to $582.0 million, as compared to $989.1 million in 2008, a reduction of over 41.2%. The following table presents a comparison of our existing 2009 capital budget to our 2008 activities. We have reduced drilling expenditures in all areas, while our expected capital for midstream operations has been increased, principally to reflect the expansion of our pipeline system to transport expected production from the Haynesville/Bossier area.
| | | | | | | | | | | | |
(dollars in millions) | | 2009 planned
gross wells | | 2009
Capital
budget | | 2008
Actual
spending | | 2009
Increase
(decrease) | |
East Texas/North Louisiana | | 64 | | $ | 284 | | $ | 507 | | $ | (223 | ) |
Appalachia | | 58 | | | 65 | | | 212 | | | (147 | ) |
Mid-Continent | | 24 | | | 31 | | | 62 | | | (31 | ) |
Permian/Rockies | | 40 | | | 36 | | | 115 | | | (79 | ) |
Midstream | | — | | | 141 | | | 55 | | | 86 | |
Corporate and other | | — | | | 25 | | | 38 | | | (13 | ) |
| | | | | | | | | | | | |
Total | | 186 | | $ | 582 | | $ | 989 | | $ | (407 | ) |
| | | | | | | | | | | | |
As of February 23, 2009, the aggregate borrowing base under our credit agreements totaled approximately $2.5 billion, of which $2.3 billion was drawn. In addition, we have $300.0 million outstanding under our New Term Credit Agreement, which matures on January 15, 2010 and $444.7 million of Senior Notes due on January 11, 2011.
We generally do not establish a budget for acquisitions, as these tend to be opportunity driven. Historically, we have used the proceeds from the issuance of equity and debt securities and borrowings under our credit agreements to raise cash to fund acquisitions. Our ability to borrow from sources other than our credit agreements is subject to restrictions imposed by our lenders. In addition, our indenture governing our Senior Notes contains restrictions on incurring indebtedness and pledging our assets. For 2009, we expect the majority of activities to be focused on drilling our shale projects. Accordingly, our acquisition efforts are presently reduced when compared to prior periods. In addition, disruptions in the credit and capital markets have limited the availability of financing to fund acquisitions.
In March, 2007, we issued 200,000 shares of preferred stock for $2.0 billion in cash in connection with the Vernon Acquisition. On July 18, 2008, we converted all outstanding shares of our Preferred Stock into our common stock, which resulted in dividend savings of $35.0 million per quarter, or $140.0 million annually.
Cash flows from operations represent the primary source of liquidity to fund our operations and our capital expenditure programs. The primary factors impacting our cash flow from operations include (a) levels of production of our oil and natural gas sold to third parties, (b) prices we receive for sales of oil and natural gas
65
production, including settlement proceeds or payments related to our oil and natural gas derivatives, (c) operating costs of our oil and natural gas properties, (d) costs for our general and administrative activities and (e) interest expense and other financing related costs.
Recent events affecting liquidity
On October 3, 2008, the United States government signed into law the Emergency Economic Stabilization Act of 2008, or EESA, in response to deterioration of worldwide financial and credit markets. The severe deterioration of the financial and credit markets has impacted several significant financial institutions, some of which were either acquired or filed for bankruptcy. While we are not able to assess the total impact of the EESA on our business, the continuing constraints in the U.S. and global credit markets has created substantial uncertainty regarding our ability to access capital to fund our growth plans and execute our business strategies. We cannot determine the length of time that credit markets will remain constrained, and the ultimate impact on our ability to access capital is expected to be equally uncertain. As further discussed below, our capital budget for 2009 reflects reduced and more targeted capital expenditures for development and exploitation than in 2008. Additionally, should these conditions continue, the borrowing base of our credit agreements, compliance with debt covenants and status with credit rating agencies could be negatively affected.
In addition to the turmoil in the credit markets and related uncertainties, prices for oil and natural gas began to decline significantly during the third quarter of 2008 and have continued into the first quarter of 2009. The spot price for oil and natural gas on February 20, 2009 was $39.32 per Bbl and $4.46 per Mmbtu compared with $100.67 per Bbl and $7.12 per Mmbtu on September 30, 2008 and $44.60 per Bbl and $5.71 per Mmbtu on December 31, 2008. NYMEX future prices for oil and natural gas have also declined significantly since the third quarter of 2008, reflecting anticipated decreasing domestic and worldwide demand for oil and natural gas as a result of the global recession and uncertainties about the depth and length of the recession and the timing of a recovery. Each of the aforementioned events could impact our near-term, and perhaps long-term, liquidity and operating revenues resulting in changes to business plans or operations. As discussed in greater detail under “Item 3. Quantitative and Qualitative Disclosures About Market Risk”, we use derivative financial instruments to mitigate commodity price fluctuations and interest rate fluctuations to manage our debt service requirements.
Lehman Brothers and its affiliates were lenders under our credit agreements and a counterparty to one derivative financial instrument. Lehman Brothers’ aggregate commitments under our revolving credit agreements was approximately $2.7 million, while our derivative financial instrument would result in Lehman Brothers owing us approximately $0.5 million. Substantially all of the counterparties to our derivative financial instruments are lenders under our credit agreements. The remaining counterparties to our derivative financial instruments are affiliates of lenders under our credit agreements.
Oil and natural gas prices initially increased during the first nine months of 2008 and we paid approximately $157.4 million to settle oil and natural gas derivatives during this nine month period. While our revenues benefit from the increased prices, we do not receive benefit on all of our oil and natural gas production as only approximately 20% of our sold volumes were not subject to derivative financial instruments. Beginning in September 2008 and into early 2009, oil and natural gas prices declined significantly. As a result, we received cash payments from our derivative counterparties during the fourth quarter of 2008 totaling $48.1 million. For the year ended December 31, 2008, our net cash settlements attributable to our oil and natural gas derivative financial instruments resulted in $109.3 million of payments to our counterparties. We are required to settle our derivative financial instruments prior to receiving the payments for production, which is typically collected 30 to 60 days after our derivative settlements are closed. This timing between settlement of the derivative financial instruments and actual collection of the physical proceeds can create short-term borrowing requirements in periods of increasing prices. Conversely, during period of declining prices, we may experience temporary cash and liquidity increases from settlements of our derivative financial instruments.
Despite the recent negative events in capital and credit markets and commodity prices, we believe that our capital resources from existing cash balances, anticipated cash flow from operating activities, reduced capital expenditures and remaining borrowing capacity under our credit agreements will be adequate to meet the cash
66
requirements to fund our operations, debt service obligations and our 2009 capital expenditure programs. The New Term Credit Agreement entered into on December 8, 2008 matures and becomes payable on January 15, 2010. We believe that based on EXCO Operating’s current production levels and prices for oil and natural gas, our cash flows from operations and remaining borrowing capacity under our credit agreement, may not be sufficient to fully repay the New Term Credit Agreement when due without further reductions in our capital expenditures levels or non-strategic asset sales. Our future cash flows are subject to a number of variables including production volumes and oil and natural gas prices. If oil and natural gas prices remain depressed for an extended period of time, we may be required to further reduce our capital expenditure budget in 2009 and in the future, which in turn may affect our liquidity and results of operations in future periods and impact our ability to maintain our borrowing base under our credit agreements or comply with existing bank covenants. In connection with the price declines, we expect certain costs, such as drilling costs, tubular goods and oil field services to decrease also. While these savings remain subject to future increases, they play a significant role in our capital budgets and operating costs, both of which impact our overall liquidity.
We are currently in various stages of activities related to the sale of certain non-strategic oil and natural gas properties and have plans to pursue the sale of additional oil and natural gas properties in 2009. We believe that such asset sales will supplement our free cash to enable us to repay amounts outstanding under the New Term Credit Agreement prior to its maturity.
Historical sources and uses of funds
Cash flows from operations
Our operating cash flows are driven by the quantities of our production of oil and natural gas and the prices received from the sale of this production and revenue generated from our midstream operating activities. Prices of oil and natural gas have historically been very volatile and can significantly impact the cash from the sale our oil and natural gas production. Use of derivative financial instruments help mitigate this price volatility. Cash expenses also impact our operating cash flow and consist primarily of oil and natural gas property operating costs, severance and ad valorem taxes, interest on our indebtedness, general and administrative expenses and taxes on income.
Net cash provided by operating activities, before working capital changes and adjustments for settlements of derivative financial instruments with a financing element, was $841.5 million for the year ended December 31, 2008 compared with $599.8 million for the year ended December 31, 2007. The 40.3% increase is attributable primarily to net cash from increased production provided from oil and natural gas property acquisitions made in 2007 and 2008 and from higher average oil and natural gas prices in 2008 (although 2008 prices began to decline significantly in the third quarter of 2008) compared with average prices during 2007. At December 31, 2008, our cash and cash equivalents balance was $57.1 million, a 2.9% increase from December 31, 2007. On February 23, 2009, our cash and cash equivalent balance was $19.5 million. On January 15, 2008, July 15, 2008 and January 15, 2009, we made an interest payment on our Senior Notes of $16.1 million. We made dividend payments to our preferred shareholders totaling $82.8 million during 2008. We are no longer required to pay dividends as all of our shares of Preferred Stock were converted into our common stock on July 18, 2008.
Investing activities and transactions
In recent years, a significant amount of our growth has been through acquisitions of existing producing and non-producing oil and natural gas properties and related assets. These acquisitions have been funded to a great extent by borrowings under credit agreements and term loan agreements, as well as issuance of equity. As discussed above, the deterioration in the U.S. and worldwide credit and equity markets has significantly diminished our ability to fund additional growth in the near term through these capital sources.
67
Acquisitions and capital expenditures
The following table presents our capital expenditures and acquisitions for the years ended December 31, 2008, 2007 and 2006.
| | | | | | | | | |
(in thousands) | | Year Ended
December 31,
2008 | | Year Ended
December 31,
2007 | | Year Ended
December 31,
2006 |
Capital expenditures: | | | | | | | | | |
Oil and natural gas property acquisitions | | $ | 700,174 | | $ | 2,343,829 | | $ | 1,504,278 |
Midstream acquisitions | | | 66,172 | | | 119,409 | | | — |
Lease purchases | | | 187,134 | | | 21,415 | | | 8,991 |
Development capital expenditures | | | 693,173 | | | 446,675 | | | 194,312 |
Midstream capital additions | | | 54,993 | | | 16,980 | | | 6,426 |
Corporate and other | | | 53,834 | | | 31,419 | | | 4,554 |
| | | | | | | | | |
Total capital expenditures | | $ | 1,755,480 | | $ | 2,979,727 | | $ | 1,718,561 |
| | | | | | | | | |
During 2008, we completed the following acquisitions of oil and natural gas properties and undeveloped acreage, including the Appalachian Acquisition, the New Waskom Acquisition and the Danville Acquisition. A summary of these acquisitions and their related values to oil and natural gas properties and gathering facilities, net of contractual adjustments is presented on the following table.
| | | | | | | | | | | | | | | | | | | |
(in thousands) | | Appalachian
Acquisition | | | New Waskom
Acquisition | | Danville
Acquisition | | | Other
acquisitions | | | Total
acquisitions | |
Purchase price calculations: | | | | | | | | | | | | | | | | | | | |
Purchase price | | $ | 386,703 | | | $ | 55,198 | | $ | 249,451 | | | $ | 74,075 | | | $ | 765,427 | |
Acquisition related expenses | | | 741 | | | | — | | | 178 | | | | — | | | | 919 | |
| | | | | | | | | | | | | | | | | | | |
Total purchase price | | $ | 387,444 | | | $ | 55,198 | | $ | 249,629 | | | $ | 74,075 | | | $ | 766,346 | |
| | | | | | | | | | | | | | | | | | | |
Allocation of purchase price: | | | | | | | | | | | | | | | | | | | |
Proved oil and natural gas properties | | $ | 334,308 | | | $ | — | | $ | 199,183 | | | $ | 71,232 | | | $ | 604,723 | |
Unproved oil and natural gas properties | | | 44,797 | | | | — | | | 42,391 | | | | (18 | ) | | | 87,170 | |
Other property and equipment | | | 2,517 | | | | — | | | 656 | | | | — | | | | 3,173 | |
Gulf Coast sale | | | — | | | | — | | | — | | | | 6,471 | | | | 6,471 | |
Gas gathering and related facilities | | | 19,876 | | | | 55,198 | | | 11,042 | | | | — | | | | 86,116 | |
Asset retirement obligations | | | (12,647 | ) | | | — | | | (1,029 | ) | | | — | | | | (13,676 | ) |
Other liabilities, net | | | (1,407 | ) | | | — | | | (2,614 | ) | | | (3,610 | ) | | | (7,631 | ) |
| | | | | | | | | | | | | | | | | | | |
Total purchase price allocation | | $ | 387,444 | | | $ | 55,198 | | $ | 249,629 | | | $ | 74,075 | | | $ | 766,346 | |
| | | | | | | | | | | | | | | | | | | |
On February 20, 2008, we acquired shallow natural gas properties from EOG Resources, Inc. located primarily in our central Pennsylvania operating area. The purchase price for the Appalachian Acquisition was $387.4 million and was financed with funds drawn under the EXCO Resources credit agreement.
On March 11, 2008, we acquired a 230 mile gathering system in East Texas/North Louisiana at a cost of approximately $55.2 million. The acquisition was funded with funds drawn under the EXCO Operating Credit Agreement. The New Waskom system is located primarily in Harrison and Panola Counties in East Texas and Caddo Parish in North Louisiana. The system has access to one processing plant and three interstate pipelines.
On July 15, 2008, we acquired producing oil and natural gas properties, acreage and other assets in Gregg, Rusk and Upshur counties of Texas for approximately $249.6 million, net of closing adjustments. Funding for the Danville Acquisition was provided by a $300.0 million senior unsecured term credit agreement (see “—Credit agreements and long-term debt—Original Term Credit Agreement”).
During the second and third quarters of 2008, we conducted two leasing programs of undeveloped acreage in East Texas/North Louisiana and Appalachia to exploit the Haynesville, Marcellus and Huron shales. In Appalachia, our existing shallow production areas and newly acquired leasehold interests hold deep rights in the
68
Marcellus and Huron shale formations. Similarly, in East Texas and North Louisiana, our existing production areas and newly acquired leasehold interests hold deep rights in the Haynesville/Bossier shale play. At the end of the third quarter of 2008, these programs were complete. We spent approximately $64.9 million in the Haynesville/Bossier shale plays in East Texas and North Louisiana and approximately $92.1 million in the Marcellus and Huron shale plays in the Appalachia region of the United States. While further leasing in these areas may occur, these activities will generally be limited to leasing required to create drilling units.
During 2007, we closed the following acquisitions of oil and natural gas properties and undeveloped acreage, including the Vernon Acquisition and the Southern Gas Acquisition. A summary of these acquisitions and their related values to oil and natural gas properties and gathering facilities, net of contractual adjustments is presented on the following table.
| | | | | | | | | | | | | | | |
(in thousands) | | Vernon
Acquisition | | | Southern Gas
Acquisition | | | Other
acquisitions | | Consolidated
total | |
Purchase price calculations: | | | | | | | | | | | | | | | |
Purchase price | | $ | 1,520,183 | | | $ | 770,498 | | | $ | 180,160 | | $ | 2,470,841 | |
Acquisition related expenses | | | 1,755 | | | | 2,040 | | | | — | | | 3,795 | |
| | | | | | | | | | | | | | | |
Total purchase price | | $ | 1,521,938 | | | $ | 772,538 | | | $ | 180,160 | | $ | 2,474,636 | |
| | | | | | | | | | | | | | | |
Allocation of purchase price: | | | | | | | | | | | | | | | |
Proved oil and natural gas properties | | $ | 1,417,823 | | | $ | 586,407 | | | $ | 159,502 | | $ | 2,163,732 | |
Unproved oil and natural gas properties | | | 58,192 | | | | 4,725 | | | | 20,658 | | | 83,575 | |
Gulf Coast Sale | | | — | | | | 241,948 | | | | — | | | 241,948 | |
Gas gathering and related facilities | | | 119,409 | | | | — | | | | — | | | 119,409 | |
Fair value (liability) of assumed derivative financial instruments | | | (60,015 | ) | | | (42,204 | ) | | | — | | | (102,219 | ) |
Asset retirement obligations | | | (10,726 | ) | | | (12,567 | ) | | | — | | | (23,293 | ) |
Other liabilities, net | | | (2,745 | ) | | | (5,771 | ) | | | — | | | (8,516 | ) |
| | | | | | | | | | | | | | | |
Total purchase price allocation | | $ | 1,521,938 | | | $ | 772,538 | | | $ | 180,160 | | $ | 2,474,636 | |
| | | | | | | | | | | | | | | |
On March 30, 2007, EXCO Operating closed the Vernon Acquisition, consisting of oil and natural gas properties and gathering and treating facilities in Jackson Parish, Louisiana for approximately $1.5 billion in cash, net of purchase price adjustments. The Vernon Acquisition was funded by a $1.75 billion capital contribution from EXCO to EXCO Operating. The capital contribution consisted of $1.67 billion in cash and an $80.0 million deposit made by EXCO in December 2006.
On May 2, 2007, we closed the Southern Gas Acquisition consisting of oil and natural gas properties and related assets, including derivative financial instruments, covering a significant portion of estimated production for 2007, 2008 and 2009 in multiple fields primarily located in Oklahoma, Texas and Louisiana for approximately $761.1 million in cash, net of purchase price adjustments. The Southern Gas Acquisition was funded with cash on hand of $145.2 million, including $133.0 million from escrow accounts from prior sales, borrowings under the EXCO Resources Credit Agreement of $572.9 million and the application of a $43.0 million deposit paid by EXCO in February 2007. During the first quarter of 2008, the purchase price of the Southern Gas Acquisition was finalized for a total of $772.5 million.
On May 2, 2007, in connection with the Southern Gas Acquisition, EXCO entered into the Second Amended and Restated Credit Agreement of the EXCO Resources Credit Agreement among EXCO, as borrower, certain subsidiaries of EXCO, as guarantors, and a group of lenders. As a result of the Southern Gas Acquisition, EXCO and the lenders agreed to increase the borrowing base from $750.0 million to $1.0 billion.
On October 9, 2007, we completed the acquisition of an additional 45.0% interest in 28,000 acres of leasehold interests and 135 producing wells in our Canyon Sand field in West Texas for $155.0 million.
69
2008 and 2007 divestitures
During 2008, we received proceeds of $15.5 million from the sale of certain oil and natural gas assets, including undeveloped acreage, none of which were individually significant.
During 2007, we sold various oil and natural gas properties to multiple purchasers for proceeds totaling approximately $490.3 million.
On January 5, 2007, we completed the sale of oil and natural gas properties and undeveloped drilling locations in the Wattenberg field area of the DJ Basin, or the Wattenberg Field, for approximately $130.9 million in cash, net of contractual adjustments. The transaction included substantially all of the assets EXCO held in the area. Proceeds from the sale were deposited with a third party and used to partially fund the Southern Gas Acquisition in a like-kind exchange for federal income tax purposes.
On May 8, 2007, we completed the sale of a portion of the oil and natural gas properties and related assets in multiple fields primarily located in South Texas and South Louisiana acquired in the Southern Gas Acquisition to an entity affiliated with Crimson Exploration Inc., or Crimson, for an aggregate sale price of $235.5 million in cash, net of purchase price adjustments, and 750,000 shares of unregistered restricted Crimson common stock. In connection with the closing of the Gulf Coast Sale, the borrowing base on the EXCO Resources Credit Agreement was reduced from $1.0 billion to $900.0 million.
On July 13, 2007, we completed the sale of substantially all of our interest in the Cement Field, located in Caddo and Grady Counties, Oklahoma in our Mid-Continent area for approximately $99.7 million, after contractual purchase price adjustments. Proceeds from this sale were deposited with a third party intermediary and used to purchase assets in West Texas in October 2007.
In November 2007, we sold certain assets across our portfolio for approximately $20.4 million. Through this divestiture, we exited Nebraska, Colorado, and certain non-operated properties in Texas and the Gulf Coast area of Louisiana.
No gain or loss was recognized from these sales as we use the full cost method of accounting.
2009 Capital budget
In response to the uncertainties arising from the capital and credit markets and the recent significant declines in commodity prices, management reassessed its plans for capital expenditures for 2009, with emphasis on drilling economics using lower oil and natural gas prices and evaluating certain funding alternatives, including, but not limited to, sales of certain non-strategic assets, establishment of strategic joint ventures and timing of certain capital projects.
We have presently budgeted approximately $582.0 million for capital expenditures in 2009, of which we are contractually obligated to spend $60.2 million as of December 31, 2008. We expect to utilize our current cash balances, cash flow generated from operations and available funds under our credit agreements in 2009 to fund capital expenditures and acquisitions, if any. The capital budget for 2009 reflects a 41.2% decrease from 2008 actual capital expenditures, excluding acquisitions, of approximately $989.1 million.
Future cash flows are subject to a number of variables including production volumes, fluctuations in oil and natural gas prices and our ability to service the debt incurred in connection with our acquisitions. If cash flows decline we may be required to further reduce our capital expenditure budget, which in turn may affect our production in future periods. Our cash flow from operations and other capital resources may not provide cash in sufficient amounts to maintain or initiate planned levels of capital expenditures.
The 2009 capital expenditures have an emphasis on horizontal shale development and expansion of our midstream facilities. We have reduced our conventional drilling program and minimized acreage leasing, except for leasing activities required to complete the formation of drilling units. We will continue our conventional exploitation projects to minimize the base decline of our production on properties.
70
Credit agreements and long-term debt
As of February 23, 2009, we have total debt outstanding aggregating $3.0 billion consisting of the New Term Credit Agreement due in January 2010 ($300.0 million), two credit agreements maturing in March 2012 ($2.3 billion) and Senior Notes due in January 2011 ($444.7 million). Terms and considerations of each of the debt obligations are discussed below.
EXCO Resources Credit Agreement
On February 20, 2008, we entered into the first amendment to the EXCO Resources Credit Agreement. The primary change to the EXCO Resources Credit Agreement was an increase in the borrowing base from $900.0 million to approximately $1.2 billion.
On July 14, 2008, we entered into the second amendment to the EXCO Resources Credit Agreement. This amendment, which was effective June 30, 2008, permitted the payment of cash dividends in connection with the exercise of any right to convert our preferred stock into common stock without compliance with certain limitations on restricted payments. In addition, the leverage ratio covenant, as defined in the agreement, was increased to provide that EXCO will not permit such ratio (i) as of the end of any fiscal quarter ending on or after June 30, 2008 and on or before December 31, 2008 to be greater than 4.00 to 1.00, (ii) as of the end of the fiscal quarter ending on March 31, 2009 to be greater than 3.75 to 1.00 and (iii) as of the end of any fiscal quarter ending on or after June 30, 2009 to be greater than 3.50 to 1.00. The other financial covenants and all other terms, including maturity date and borrowing base, contained within the EXCO Resources Credit Agreement remained unchanged.
On February 4, 2009, we entered into the third amendment to the EXCO Resources Credit Agreement. Pursuant to the third amendment, the leverage ratio covenant, as defined in the agreement, was modified to provide that EXCO will maintain the current maximum leverage ratio of less than 4.00 to 1.00 as of each quarter during 2009. After December 31, 2009, EXCO will not allow the leverage ratio to exceed 3.75 to 1.00 as of the quarter ended March 31, 2010 and not to exceed 3.50 to 1.00 as of the quarter ended June 30, 2010 and thereafter. The other financial covenants and all other terms, including the maturity date and borrowing base were not changed.
The borrowing base is redetermined semi-annually with EXCO and the lenders having the right to interim unscheduled redeterminations in certain circumstances. Scheduled redeterminations are on or about April 1 and October 1 of each year. On October 20, 2008, our banking group reaffirmed the existing borrowing base. The interest rate ranges from LIBOR plus 100 basis points, or bps, to LIBOR plus 175 bps depending upon borrowing base usage. The facility also includes an Alternate Base Rate, or ABR, pricing alternative ranging from ABR plus 0 bps to ABR plus 75 bps depending upon borrowing base usage. Borrowings under the EXCO Resources Credit Agreement are collateralized by a first lien mortgage providing a security interest in our oil and natural gas properties. EXCO has also agreed to have in place derivative financial instruments covering no more than 80% of its forecasted production from total proved reserves (as defined) for each of the first two years of the five year period commencing on March 30, 2007 and 70% of the forecasted production from total Proved Reserves for each of the third through fifth years of such five year period. EXCO is required to have in place mortgages covering 80% of the engineered value of its Borrowing Base Properties (as defined).
The foregoing description of the existing debt covenants is not complete and is qualified in its entirety by the EXCO Resources Credit Agreement. The EXCO Resources Credit Agreement matures on March 30, 2012. As of December 31, 2008, EXCO was in compliance with the following financial covenants contained in the EXCO Resources Credit Agreement:
| | • | | maintain a consolidated current ratio (as defined) of at least 1.0 to 1.0 as of the end of any fiscal quarter; |
| | • | | not permit our ratio of consolidated funded indebtedness (as defined) to consolidated EBITDAX (as defined) to be greater than (i) 4.0 to 1.0 at the end of any fiscal quarter ending on or after December 31, 2008 up to and including December 31, 2009, (ii) 3.75 to 1.0 at the end of the fiscal quarter ending on March 31, 2010 and (iii) 3.50 to 1.0 beginning with the quarter ending June 30, 2010 and each quarter end thereafter; and |
71
| | • | | maintain a consolidated EBITDAX to consolidated interest expense (as defined) ratio of at least 2.5 to 1.0 at the end of any fiscal quarter ending on or after September 30, 2007. |
At February 23, 2009, the one month LIBO rate was 0.47%, which would result in an interest rate of approximately 2.22% on any new indebtedness we may incur under the EXCO Resources Credit Agreement. At February 23, 2009 we had $1.1 billion of outstanding indebtedness under the EXCO Resources Credit Agreement.
EXCO Operating Credit Agreement
The EXCO Operating Credit Agreement has a borrowing base of $1.3 billion, which is scheduled to be redetermined on a semi-annual basis, with EXCO Operating and the lenders having the right to interim unscheduled redeterminations in certain circumstances. Scheduled redeterminations will be made on or about April 1 and October 1 of each year. On October 20, 2008, our banking group reaffirmed the existing borrowing rate. The EXCO Operating Credit Agreement is secured by a first priority lien on the assets of EXCO Operating, including 100% of the equity of EXCO Operating’s subsidiaries, and is guaranteed by all existing and future subsidiaries of EXCO Operating. EXCO Operating has agreed to have in place derivative financial instruments covering no more than 80% of the “forecasted production from total proved reserves” (as defined) for each of the first two years of the five year period commencing on March 30, 2007 and 70% of the forecasted production from total proved reserves for each of the third through fifth years of such five year period.
On July 14, 2008, EXCO Operating entered into a second amendment to the EXCO Operating Credit Agreement to (i) allow EXCO Operating to incur up to $500.0 million of indebtedness under the Original Term Credit Agreement, and (ii) exclude drawings under the Original Term Credit Agreement from the consolidated current ratio, as defined in the EXCO Operating Credit Agreement through December 31, 2008.
On December 1, 2008, EXCO Operating entered into a third amendment to the EXCO Operating Credit Agreement to permit the incurrence of up to $300.0 million of unsecured indebtedness under the New Term Credit Agreement with stated maturity no later than January 15, 2010. On December 8, 2008, the entire $300.0 million under the New Credit Agreement was drawn. (See “New Term Credit Agreement.”)
The foregoing descriptions are not complete and are qualified in their entirety by the EXCO Operating Credit Agreement and amendments thereto. As of December 31, 2008, EXCO Operating was in compliance with the financial covenants contained in the EXCO Operating Credit Agreement, which require that EXCO Operating:
| | • | | maintain a consolidated current ratio (as defined) of at least 1.0 to 1.0 at the end of any fiscal quarter, beginning with the quarter ended September 30, 2007; |
| | • | | not permit our ratio of consolidated indebtedness to consolidated EBITDAX (as defined) to be greater than 3.5 to 1.0 at the end of each fiscal quarter, beginning with the quarter ended September 30, 2007; and |
| | • | | not permit our interest coverage ratio (as defined) to be less than 2.5 to 1.0 at the end of each fiscal quarter, beginning with the quarter ended September 30, 2007. |
The EXCO Operating Credit Agreement contains representations, warranties, covenants, events of default and indemnities customary for agreements of this type. The EXCO Operating Credit Agreement matures March 30, 2012. Interest under the EXCO Operating Credit Agreement ranges from LIBOR plus 100 bps to 175 bps. The facility also includes an ABR pricing alternative ranging from ABR plus 0 bps to ABR plus 75 bps.
At February 23, 2009, the one month LIBO rate was 0.47%, which would result in an interest rate of approximately 2.22% on any new indebtedness we may incur under the EXCO Operating Credit Agreement. At February 23, 2009 we had $1.2 billion of outstanding indebtedness under the EXCO Operating Credit Agreement.
72
Original Term Credit Agreement
On July 15, 2008, EXCO Operating entered into a senior unsecured term credit agreement, or the Original Term Credit Agreement, and drew $300.0 million, resulting in net proceeds of $289.4 million after transaction fees and administrative expenses. The Original Term Credit Agreement balance of $300.0 million was borrowed in a single draw on July 15, 2008 and was scheduled to mature on December 15, 2008.
New Term Credit Agreement
On December 8, 2008, EXCO Operating entered into the New Term Credit Agreement with an aggregate balance of $300.0 million. Net proceeds from the loan of $274.4 million, after bank fees and expenses were used to repay and terminate the Original Term Credit Agreement. In addition to the fees incurred upon the closing of the New Term Credit Agreement, EXCO Operating may incur additional fees on unpaid principal amounts, or duration fees, as defined in the agreement. These include a 5% fee on the unpaid principal outstanding on June 15, 2009, and an additional 3% fee on the unpaid principal outstanding balance on September 15, 2009. Presently, we expect to incur some or all of the duration fees unless cash flow from operations or proceeds from assets sales are sufficient to pay down the loan. The New Term Credit Agreement is due and payable on January 15, 2010 and is guaranteed by all existing and future direct or indirect subsidiaries of EXCO Operating, including any guarantor of the EXCO Operating Credit Agreement.
The foregoing descriptions are not complete and are qualified in their entirety by the New Term Credit Agreement and amendments thereto. As of December 31, 2008, EXCO Operating was in compliance with the financial covenants contained in the New Term Credit Agreement, which require that EXCO Operating:
| | • | | maintain a minimum current ratio of 1.00 to 1.00; |
| | • | | not permit the maximum leverage ratio (as defined) to be greater than 3.50 to 1.00; and |
| | • | | not permit our minimum interest coverage ratio (as defined) to be less than 2.50 to 1.00. |
At the borrower’s election, the New Term Credit Agreement may bear interest at a rate per annum equal to (A) the Alternate Base Rate, or ABR [defined as the highest of (i) the rate of interest publicly announced by JPMorgan as its prime rate in effect at its principal office in New York City, (ii) the federal funds effective rate from time to time plus 0.50%, and (iii) the Adjusted LIBO Rate (defined as the greater of (x) the rate at which eurodollar deposits in the London interbank market for one month are quoted on Reuters BBA Libor Rates Page 3750, as adjusted for actual statutory reserve requirements for eurocurrency liabilities, and (y) 4.0%) plus 1.0%] plus 5.0% or (B) the Adjusted LIBO Rate plus 6.00%. In all cases, the minimum interest rate on the New Term Credit Agreement is 10.0%. The New Term Credit Agreement contains representations, warranties, covenants, events of default and indemnities that are customary for agreements of this type and are substantially the same as the terms included in the EXCO Operating Credit Agreement. At February 23, 2009, the interest rate on the $300.0 million outstanding on the New Term Credit Agreement was 10.0%.
7 1/4% senior notes due January 15, 2011
As of December 31, 2008, $444.7 million in principal was outstanding on our Senior Notes. The unamortized premium on the Senior Notes at December 31, 2008 was $7.6 million. The estimated fair value of the Senior Notes, based on quoted market prices for the Senior Notes, was $344.7 million on December 31, 2008.
Interest is payable on the Senior Notes semi-annually in arrears on January 15 and July 15 of each year. Effective January 15, 2007, we may redeem some or all of the Senior Notes for the redemption price set forth in the Senior Notes. On January 15, 2009, we paid $16.1 million of interest on the Senior Notes. Another interest payment of $16.1 million will be due on July 15, 2009.
The indenture governing the Senior Notes contains covenants, which limit our ability and the ability of our guarantor subsidiaries to:
| | • | | incur or guarantee additional debt and issue certain types of preferred stock; |
| | • | | pay dividends on our capital stock or redeem, repurchase or retire our capital stock or subordinated debt; |
73
| | • | | create liens on our assets; |
| | • | | enter into sale/leaseback transactions; |
| | • | | create restrictions on the ability of our restricted subsidiaries to pay dividends or make other payments to us; |
| | • | | engage in transactions with our affiliates; |
| | • | | transfer or issue shares of stock of subsidiaries; |
| | • | | transfer or sell assets; and |
| | • | | consolidate, merge or transfer all or substantially all of our assets and the assets of our subsidiaries. |
Preferred Stock
We paid cash dividends totaling $82.8 million to the holders of our Preferred Stock between January 1, 2008 and July 18, 2008, the date upon which the Preferred Stock was converted into our common stock.
On July 18, 2008, we converted all outstanding shares of our Preferred Stock into a total of approximately 105.2 million shares of our common stock. The conversion of the Preferred Stock has the effect of increasing the book value of shareholders’ equity by approximately $2.0 billion. We also paid all accrued but unpaid dividends in cash totaling approximately $12.8 million to the holders of the converted shares of Preferred Stock as of July 18, 2008. After July 18, 2008, dividends ceased to accrue on the Preferred Stock and all rights of the holders with respect to the Preferred Stock terminated, except for the right to receive the whole shares of common stock issuable upon conversion, accrued dividends through July 18, 2008 and cash in lieu of any fractional shares. The conversion of all outstanding shares of Preferred Stock into common stock eliminated our obligation to pay quarterly cash dividends of $35.0 million, resulting in annual dividend savings of $140.0 million.
Derivative financial instruments
We use oil and natural gas derivatives and financial risk management instruments to manage our exposure to commodity price and interest rate fluctuations. We do not designate these instruments as hedging instruments for financial accounting purposes, and, as a result, we recognize the change in the respective instruments’ fair value currently in earnings, as a gain or loss on oil and natural gas derivatives and interest expense on financial risk management instruments.
Oil and natural gas derivatives
Our production is generally sold at prevailing market prices. However, we periodically enter into oil and natural gas contracts for a portion of our production when market conditions are deemed favorable and oil and natural gas prices exceed our minimum internal price targets.
74
Our objective in entering into oil and natural gas derivative contracts is to mitigate the impact of price fluctuations and achieve a more predictable cash flow associated with our acquisition activities and borrowings under our credit agreements. These transactions limit exposure to declines in prices, but also limit the benefits we would realize if prices increase. As of December 31, 2008, we had contracts in place for the volumes and prices shown below:
| | | | | | | | | | | | | | | | |
(in thousands, except prices) | | NYMEX gas
volume—
Mmbtu | | Weighted
average
contract
price per
Mmbtu | | Basis
swaps gas
volume—
Mmbtu | | Weighted
average
contract
price per
Mmbtu | | | NYMEX oil
volume—
Bbls | | Weighted
average
contract
price per
Bbl |
Swaps: | | | | | | | | | | | | | | | | |
Q1 2009 | | 24,870 | | $ | 8.26 | | 900 | | $ | (1.10 | ) | | 390 | | $ | 80.62 |
Q2 2009 | | 25,080 | | | 8.15 | | 910 | | | (1.10 | ) | | 394 | | | 80.64 |
Q3 2009 | | 25,290 | | | 8.15 | | 920 | | | (1.10 | ) | | 398 | | | 80.66 |
Q4 2009 | | 25,290 | | | 8.18 | | 920 | | | (1.10 | ) | | 398 | | | 80.66 |
2010 | | 51,698 | | | 8.10 | | — | | | — | | | 1,568 | | | 104.64 |
2011 | | 9,125 | | | 7.97 | | — | | | — | | | 1,095 | | | 112.99 |
2012 | | 1,830 | | | 4.51 | | — | | | — | | | 92 | | | 109.30 |
2013 | | 1,825 | | | 4.51 | | — | | | — | | | — | | | — |
Interest rate swaps
In January 2008, we entered into interest rate swaps to mitigate our exposure to fluctuations in interest rates on $700.0 million in principal through February 14, 2010 at LIBO rates ranging from 2.45% to 2.8%. For the year ended December 31, 2008, we had realized gains from settlements of $0.6 million and $9.9 million of non-cash unrealized losses attributable to our interest rate swaps.
Off-balance sheet arrangements
None.
Contractual obligations and commercial commitments
The following table presents a summary of our contractual obligations at December 31, 2008:
| | | | | | | | | | | | | | | |
| | | Payments due by period |
(in thousands) | | Less than
one year | | One to
three years | | Three to
five years | | More than
five years | | Total |
Long-term debt—Senior Notes(1) | | $ | — | | $ | 444,720 | | $ | — | | $ | — | | $ | 444,720 |
Long-term debt—EXCO Resources Credit Agreement(2) | | | — | | | — | | | 1,048,951 | | | — | | | 1,048,951 |
Long-term debt—EXCO Operating Credit Agreement(3) | | | — | | | — | | | 1,218,485 | | | — | | | 1,218,485 |
New Term Credit Agreement(4) | | | — | | | 300,000 | | | — | | | — | | | 300,000 |
Tubular and other commitments | | | 37,914 | | | — | | | — | | | — | | | 37,914 |
Firm Transportation Services | | | 13,118 | | | 15,094 | | | 4,856 | | | 594 | | | 33,662 |
Operating leases | | | 9,714 | | | 11,465 | | | 6,448 | | | 5,121 | | | 32,748 |
Drilling/work commitments | | | 54,213 | | | 72,368 | | | 11,060 | | | — | | | 137,641 |
| | | | | | | | | | | | | | | |
Total contractual cash obligations | | $ | 114,959 | | $ | 843,647 | | $ | 2,289,800 | | $ | 5,715 | | $ | 3,254,121 |
| | | | | | | | | | | | | | | |
| (1) | Our Senior Notes are due on January 15, 2011. The annual interest obligation is $32.2 million. |
| (2) | The EXCO Resources Credit Agreement matures on March 30, 2012. |
| (3) | The EXCO Operating Credit Agreement matures on March 30, 2012. |
| (4) | The New Term Credit Agreement matures on January 15, 2010. |
75
| ITEM 7A. QUANTITATIVE | AND QUALITATIVE DISCLOSURES ABOUT MARKET RISK |
Some of the information below contains forward-looking statements. The primary objective of the following information is to provide forward-looking quantitative and qualitative information about our potential exposure to market risks. The term “market risk” refers to the risk of loss arising from adverse changes in oil and natural gas prices, interest rates charged on borrowings and earned on cash equivalent investments, and adverse changes in the market value of marketable securities. The disclosure is not meant to be a precise indicator of expected future losses, but rather an indicator of reasonably possible losses. This forward-looking information provides an indicator of how we view and manage our ongoing market risk exposures. Our market risk sensitive instruments were entered into for hedging and investment purposes, not for trading purposes.
Commodity price risk
Our objective in entering into derivative financial instruments is to manage price fluctuations, protect our returns on investments, and achieve a more predictable cash flow in connection with our acquisition activities and borrowings related to these activities. These transactions limit exposure to declines in prices, but also limit the benefits we would realize if prices increase. When prices for oil and natural gas are volatile, a significant portion of the effect of our derivative financial instrument management activities consists of non-cash income or expenses due to changes in the fair value of our derivative financial instrument contracts. Cash charges or gains only arise from payments made or received on monthly settlements of contracts or if we terminate a contract prior to its expiration.
Pricing for oil and natural gas is volatile. We do not designate our derivative financial instruments as hedging instruments for financial accounting purposes and, as a result, we recognize the change in the respective instrument’s fair value currently in earnings, as a gain or loss on oil and natural gas derivatives and as interest expense on financial risk management instruments. To illustrate the volatility of oil and natural gas prices and the impact of derivative financial instruments, we had unrealized mark-to-market losses in excess of $916.5 million for the first six months of 2008 on our oil and natural gas derivative financial instruments due to rapidly increasing prices for both oil and natural gas during that period. By the end of the third quarter of 2008 and through the end of 2008, commodity prices decreased substantially and our unrealized mark-to-market gains between July 2008 and December 2008 more than offset the unrealized losses incurred in the first half of the year which resulted in total net unrealized gains in 2008 of $493.7 million on our oil and natural gas derivative financial instruments. Natural gas prices have continued their decline into 2009. We expect that volatility in commodity prices will continue.
Our major market risk exposure is in the pricing applicable to our oil and natural gas production. Realized pricing is primarily driven by the prevailing worldwide price for crude oil and spot market prices for natural gas. Pricing for oil and natural gas production is volatile.
76
The following table sets forth our oil and natural gas derivatives management activities as of December 31, 2008.
| | | | | | | | | | |
(in thousands, except prices) | | Volume
Mmbtus/Bbls | | Weighted
average strike
price per
Mmbtu/Bbl | | | Fair value at
December 31,
2008 | |
Natural gas: | | | | | | | | | | |
Swaps: | | | | | | | | | | |
2009 | | 100,530 | | $ | 8.18 | | | $ | 203,690 | |
2010 | | 51,698 | | | 8.10 | | | | 49,483 | |
2011 | | 9,125 | | | 7.97 | | | | 7,147 | |
2012 | | 1,830 | | | 4.51 | | | | (2,418 | ) |
2013 | | 1,825 | | | 4.51 | | | | (1,934 | ) |
| | | | | | | | | | |
Total natural gas | | 165,008 | | | | | | | 255,968 | |
| | | | | | | | | | |
Basis swaps: | | | | | | | | | | |
2009 | | 3,650 | | | (1.10 | ) | | | 544 | |
| | | | | | | | | | |
Total basis swaps | | 3,650 | | | | | | | 544 | |
| | | | | | | | | | |
Oil: | | | | | | | | | | |
Swaps: | | | | | | | | | | |
2009 | | 1,580 | | | 80.64 | | | | 40,648 | |
2010 | | 1,568 | | | 104.64 | | | | 61,775 | |
2011 | | 1,095 | | | 112.99 | | | | 44,269 | |
2012 | | 92 | | | 109.30 | | | | 3,094 | |
| | | | | | | | | | |
Total oil | | 4,335 | | | | | | | 149,786 | |
| | | | | | | | | | |
Total oil and natural gas and basis swaps | | | | | | | | $ | 406,298 | |
| | | | | | | | | | |
At December 31, 2008, the average forward NYMEX oil prices per Bbl for calendar year 2009 and 2010 were $54.45 and $63.88, respectively, and the average forward NYMEX natural gas prices per Mmbtu for calendar 2009 and 2010 were $6.11 and $7.13, respectively. During January and February 2009, the average forward NYMEX oil and natural gas prices decreased. Our reported earnings and assets or liabilities for derivative financial instruments will continue to be subject to significant fluctuations in value due to price volatility.
Realized gains or losses from the settlement of our oil and natural gas derivatives are recorded in our financial statements as increases or decreases in other income or loss. For example, using the oil swaps in place as of December 31, 2008 for 2009, if the settlement price exceeds the actual weighted average strike price of $80.64 per Bbl, then a reduction in oil and natural gas revenue would be recorded for the difference between the settlement price and $80.64 per Bbl, multiplied by the hedged volume of 1,580 Mbbls. Conversely, if the settlement price is less than $80.64 per Bbl, then an increase in oil and natural gas revenue would be recorded for the difference between the settlement price and $80.64 per Bbl, multiplied by the hedged volume of 1,580 Mbbls. For example, for a hedged volume of 1,580 Mbbls, if the settlement price is $81.64 per Bbl then oil and natural gas revenue would decrease by $1.6 million. Conversely, if the settlement price is $79.64 per Bbl, oil and natural gas revenue would increase by $1.6 million.
77
Interest rate risk
At December 31, 2008, our exposure to interest rate changes related primarily to borrowings under our credit agreements and interest earned on our short-term investments. The interest rate is fixed at 7 1/4% on the $444.7 million outstanding on our Senior Notes. Interest is payable on borrowings under our credit agreements and the New Term Credit Agreement is based on a floating rate as more fully described in “Management’s Discussion and Analysis of Financial Condition and Results of Operations—Our liquidity, capital resources and capital commitments.” At December 31, 2008, we had $2.6 billion in outstanding borrowings under our credit agreements. A 1% change in interest rates based on the variable borrowings as of December 31, 2008 would result in an increase or decrease in our interest costs of $25.7 million per year. The interest we pay on these borrowings is set periodically based upon market rates.
In January 2008, we entered into financial risk management instruments to mitigate our exposure to fluctuations in interest rates on $700.0 million in principal through February 14, 2010 at LIBO rates ranging from 2.45% to 2.8%. As of December 31, 2008, we had $9.9 million of unrealized losses on our interest rate swaps.
78
| ITEM 8. | FINANCIAL STATEMENTS AND SUPPLEMENTARY DATA |
EXCO RESOURCES, INC.
INDEX TO CONSOLIDATED FINANCIAL STATEMENTS
Contents
79
MANAGEMENT’S REPORT ON INTERNAL CONTROL OVER FINANCIAL REPORTING
To the Board of Directors and Shareholders of
EXCO Resources, Inc.:
Management is responsible for establishing and maintaining adequate internal control over financial reporting (as defined in Rule 13a-15(f) under the Securities Exchange Act of 1934, as amended). Our internal control over financial reporting is designed to provide reasonable assurance to management and our board of directors regarding the preparation and fair presentation of published financial statements. Because of its inherent limitations, internal control over financial reporting may not prevent or detect misstatements. Therefore, even those systems determined to be effective can provide only reasonable assurance with respect to financial statement preparation and presentation. Management assessed the effectiveness of our internal control over financial reporting as of December 31, 2008. In making this assessment, management used the criteria set forth by the Committee of Sponsoring Organizations of the Treadway Commission (COSO) inInternal Control—Integrated Framework. Based on management’s assessment, management believes that, as of December 31, 2008, our internal control over financial reporting is effective based on those criteria.
The effectiveness of EXCO Resources, Inc.’s internal control over financial reporting as of December 31, 2008 has been audited by KPMG LLP, an independent registered public accounting firm, as stated in their report which appears herein.
| | | | | | |
By: | | /s/ DOUGLAS H. MILLER | | By: | | /s/ J. DOUGLAS RAMSEY |
Title: | | Chief Executive Officer | | Title: | | Chief Financial Officer |
Dallas, Texas
February 26, 2009
80
Report of Independent Registered Public Accounting Firm
The Board of Directors and Shareholders
EXCO Resources, Inc.:
We have audited EXCO Resources, Inc.’s (the Company) internal control over financial reporting as of December 31, 2008, based on criteria established inInternal Control—Integrated Framework issued by the Committee of Sponsoring Organizations of the Treadway Commission (COSO). EXCO Resources, Inc.’s management is responsible for maintaining effective internal control over financial reporting and for its assessment of the effectiveness of internal control over financial reporting, included in the accompanyingManagement’s Report on Internal Control over Financial Reporting. Our responsibility is to express an opinion on the Company’s internal control over financial reporting based on our audit.
We conducted our audit in accordance with the standards of the Public Company Accounting Oversight Board (United States). Those standards require that we plan and perform the audit to obtain reasonable assurance about whether effective internal control over financial reporting was maintained in all material respects. Our audit included obtaining an understanding of internal control over financial reporting, assessing the risk that a material weakness exists, and testing and evaluating the design and operating effectiveness of internal control based on the assessed risk. Our audit also included performing such other procedures as we considered necessary in the circumstances. We believe that our audit provides a reasonable basis for our opinion.
A company’s internal control over financial reporting is a process designed to provide reasonable assurance regarding the reliability of financial reporting and the preparation of financial statements for external purposes in accordance with generally accepted accounting principles. A company’s internal control over financial reporting includes those policies and procedures that (1) pertain to the maintenance of records that, in reasonable detail, accurately and fairly reflect the transactions and dispositions of the assets of the company; (2) provide reasonable assurance that transactions are recorded as necessary to permit preparation of financial statements in accordance with generally accepted accounting principles, and that receipts and expenditures of the company are being made only in accordance with authorizations of management and directors of the company; and (3) provide reasonable assurance regarding prevention or timely detection of unauthorized acquisition, use, or disposition of the company’s assets that could have a material effect on the financial statements.
Because of its inherent limitations, internal control over financial reporting may not prevent or detect misstatements. Also, projections of any evaluation of effectiveness to future periods are subject to the risk that controls may become inadequate because of changes in conditions, or that the degree of compliance with the policies or procedures may deteriorate.
In our opinion, EXCO Resources, Inc. maintained, in all material respects, effective internal control over financial reporting as of December 31, 2008, based on criteria established inInternal Control—Integrated Framework issued by the Committee of Sponsoring Organizations of the Treadway Commission.
We also have audited, in accordance with the standards of the Public Company Accounting Oversight Board (United States), the consolidated balance sheets of EXCO Resources, Inc. and subsidiaries as of December 31, 2008 and 2007, and the related consolidated statements of operations, shareholders’ equity, and cash flows for each of the years in the three-year period ended December 31, 2008, and our report dated February 26, 2009 expressed an unqualified opinion on those consolidated financial statements.
KPMG LLP
Dallas, Texas
February 26, 2009
81
Report of Independent Registered Public Accounting Firm
The Board of Directors and Shareholders
EXCO Resources, Inc.:
We have audited the accompanying consolidated balance sheets of EXCO Resources, Inc. and subsidiaries as of December 31, 2008 and 2007, and the related consolidated statements of operations, shareholders’ equity, and cash flows for each of the years in the three-year period ended December 31, 2008. These consolidated financial statements are the responsibility of the Company’s management. Our responsibility is to express an opinion on these consolidated financial statements based on our audits.
We conducted our audits in accordance with the standards of the Public Company Accounting Oversight Board (United States). Those standards require that we plan and perform the audit to obtain reasonable assurance about whether the financial statements are free of material misstatement. An audit includes examining, on a test basis, evidence supporting the amounts and disclosures in the financial statements. An audit also includes assessing the accounting principles used and significant estimates made by management, as well as evaluating the overall financial statement presentation. We believe that our audits provide a reasonable basis for our opinion.
In our opinion, the consolidated financial statements referred to above present fairly, in all material respects, the financial position of EXCO Resources, Inc. and subsidiaries as of December 31, 2008 and 2007, and the results of their operations and their cash flows for each of the years in the three-year period ended December 31, 2008, in conformity with U.S. generally accepted accounting principles.
As discussed in note 3 to the consolidated financial statements, effective January 1, 2008, the Company adopted Statement of Financial Accounting Standards No. 157,Fair Value Measurements, as it relates to financial instruments.
We also have audited, in accordance with the standards of the Public Company Accounting Oversight Board (United States), EXCO Resources, Inc.’s internal control over financial reporting as of December 31, 2008, based on criteria established inInternal Control—Integrated Framework issued by the Committee of Sponsoring Organizations of the Treadway Commission (COSO), and our report dated February 26, 2009 expressed an unqualified opinion on the effectiveness of the Company’s internal control over financial reporting.
KPMG LLP
Dallas, Texas
February 26, 2009
82
EXCO Resources, Inc.
Consolidated balance sheets
| | | | | | | | |
| | | December 31, | |
(in thousands) | | 2008 | | | 2007 | |
Assets | | | | | | | | |
Current assets: | | | | | | | | |
Cash and cash equivalents | | $ | 57,139 | | | $ | 55,510 | |
Accounts receivable: | | | | | | | | |
Oil and natural gas | | | 130,970 | | | | 146,297 | |
Joint interest | | | 22,807 | | | | 21,614 | |
Interest and other | | | 5,895 | | | | 2,151 | |
Inventory | | | 42,479 | | | | 3,686 | |
Derivative financial instruments | | | 247,614 | | | | 66,632 | |
Deferred income taxes | | | — | | | | 6,764 | |
Other | | | 6,136 | | | | 8,646 | |
| | | | | | | | |
Total current assets | | | 513,040 | | | | 311,300 | |
| | | | | | | | |
Oil and natural gas properties (full cost accounting method): | | | | | | | | |
Unproved oil and natural gas properties | | | 481,596 | | | | 334,803 | |
Proved developed and undeveloped oil and natural gas properties | | | 3,578,344 | | | | 4,926,053 | |
Accumulated depletion | | | (936,088 | ) | | | (500,493 | ) |
| | | | | | | | |
Oil and natural gas properties, net | | | 3,123,852 | | | | 4,760,363 | |
| | | | | | | | |
Gas gathering assets | | | 485,201 | | | | 340,706 | |
Accumulated depreciation and amortization | | | (32,232 | ) | | | (16,142 | ) |
| | | | | | | | |
Gas gathering assets, net | | | 452,969 | | | | 324,564 | |
| | | | | | | | |
Office and field equipment, net | | | 25,647 | | | | 20,844 | |
Advance on pending acquisition | | | — | | | | 39,500 | |
Derivative financial instruments | | | 173,003 | | | | 2,491 | |
Deferred financing costs, net | | | 62,884 | | | | 20,406 | |
Other assets | | | 880 | | | | 6,226 | |
Goodwill | | | 470,077 | | | | 470,077 | |
| | | | | | | | |
Total assets | | $ | 4,822,352 | | | $ | 5,955,771 | |
| | | | | | | | |
See accompanying notes.
83
EXCO Resources, Inc.
Consolidated balance sheets
| | | | | | | |
| | | December 31, |
(in thousands, except per share and share data) | | 2008 | | | 2007 |
Liabilities and shareholders’ equity | | | | | | | |
Current liabilities: | | | | | | | |
Accounts payable and accrued liabilities | | $ | 172,400 | | | $ | 106,305 |
Accrued interest payable | | | 28,746 | | | | 21,835 |
Revenues and royalties payable | | | 108,130 | | | | 100,978 |
Income taxes payable | | | 160 | | | | 87 |
Current portion of asset retirement obligations | | | 1,830 | | | | 1,656 |
Derivative financial instruments | | | 11,607 | | | | 47,306 |
| | | | | | | |
Total current liabilities | | | 322,873 | | | | 278,167 |
| | | | | | | |
Long-term debt | | | 3,019,738 | | | | 2,099,171 |
Asset retirement obligations and other long-term liabilities | | | 125,279 | | | | 89,810 |
Deferred income taxes | | | 9,371 | | | | 271,398 |
Derivative financial instruments | | | 12,590 | | | | 109,205 |
Commitments and contingencies | | | — | | | | — |
7.0% Cumulative Convertible Perpetual Preferred Stock, par value $0.001 per share, 39,008 shares outstanding at December 31, 2007, liquidation preference of $391,218 | | | — | | | | 388,574 |
Hybrid Preferred Stock, par value $0.001 per share, 160,992 shares outstanding at December 31, 2007, liquidation preference of $1,614,616 | | | — | | | | 1,603,704 |
| | |
Shareholders’ equity: | | | | | | | |
Preferred stock, $0.001 par value; authorized shares—10,000,000; issued and outstanding shares—200,000 shares presented above | | | — | | | | — |
Common stock, $0.001 par value; authorized shares—350,000,000; issued and outstanding shares—210,968,931 at December 31, 2008 and 104,578,941 at December 31, 2007 | | | 211 | | | | 105 |
Additional paid-in capital | | | 3,070,766 | | | | 1,043,645 |
Retained earnings (deficit) | | | (1,738,476 | ) | | | 71,992 |
| | | | | | | |
Total shareholders’ equity | | | 1,332,501 | | | | 1,115,742 |
| | | | | | | |
Total liabilities and shareholders’ equity | | $ | 4,822,352 | | | $ | 5,955,771 |
| | | | | | | |
See accompanying notes.
84
EXCO Resources, Inc.
Consolidated statements of operations
| | | | | | | | | | | | |
(in thousands, except per share data) | | Year ended
December 31,
2008 | | | Year ended
December 31,
2007 | | | Year ended
December 31,
2006 | |
Revenues: | | | | | | | | | | | | |
Oil and natural gas | | $ | 1,404,826 | | | $ | 875,787 | | | $ | 359,235 | |
Midstream | | | 85,432 | | | | 18,817 | | | | 8,139 | |
| | | | | | | | | | | | |
Total revenues | | | 1,490,258 | | | | 894,604 | | | | 367,374 | |
| | | | | | | | | | | | |
Costs and expenses: | | | | | | | | | | | | |
Oil and natural gas production | | | 238,071 | | | | 168,999 | | | | 68,517 | |
Midstream operating expenses | | | 82,797 | | | | 16,289 | | | | 7,797 | |
Gathering and transportation | | | 14,206 | | | | 10,210 | | | | 1,615 | |
Depreciation, depletion and amortization | | | 460,314 | | | | 375,420 | | | | 135,722 | |
Write-down of oil and natural gas properties | | | 2,815,835 | | | | — | | | | — | |
Accretion of discount on asset retirement obligations | | | 6,703 | | | | 4,878 | | | | 2,014 | |
General and administrative | | | 87,568 | | | | 64,670 | | | | 41,206 | |
| | | | | | | | | | | | |
Total cost and expenses | | | 3,705,494 | | | | 640,466 | | | | 256,871 | |
| | | | | | | | | | | | |
Operating income (loss) | | | (2,215,236 | ) | | | 254,138 | | | | 110,503 | |
Other income (expense): | | | | | | | | | | | | |
Interest expense | | | (161,638 | ) | | | (181,350 | ) | | | (84,871 | ) |
Gain on derivative financial instruments | | | 384,389 | | | | 26,807 | | | | 198,664 | |
Other income | | | 3,981 | | | | 10,157 | | | | 2,466 | |
Equity in net income of TXOK Acquisition, Inc | | | — | | | | — | | | | 1,593 | |
| | | | | | | | | | | | |
Total other income (expense) | | | 226,732 | | | | (144,386 | ) | | | 117,852 | |
| | | | | | | | | | | | |
Income (loss) before income taxes | | | (1,988,504 | ) | | | 109,752 | | | | 228,355 | |
Income tax expense (benefit) | | | (255,033 | ) | | | 60,096 | | | | 89,401 | |
| | | | | | | | | | | | |
Net income (loss) | | | (1,733,471 | ) | | | 49,656 | | | | 138,954 | |
| | | | | | | | | | | | |
Preferred stock dividends | | | (76,997 | ) | | | (132,968 | ) | | | — | |
| | | | | | | | | | | | |
Net income (loss) available to common shareholders | | $ | (1,810,468 | ) | | $ | (83,312 | ) | | $ | 138,954 | |
| | | | | | | | | | | | |
Earnings per share: | | | | | | | | | | | | |
Basic | | | | | | | | | | | | |
Net income (loss) available to common shareholders | | $ | (11.81 | ) | | $ | (0.80 | ) | | $ | 1.44 | |
| | | | | | | | | | | | |
Weighted average common shares outstanding | | | 153,346 | | | | 104,364 | | | | 96,727 | |
| | | | | | | | | | | | |
Diluted | | | | | | | | | | | | |
Net income (loss) available to common shareholders | | $ | (11.81 | ) | | $ | (0.80 | ) | | $ | 1.41 | |
| | | | | | | | | | | | |
Weighted average common and common equivalent shares outstanding | | | 153,346 | | | | 104,364 | | | | 98,453 | |
| | | | | | | | | | | | |
See accompanying notes.
85
EXCO Resources, Inc.
Consolidated statements of cash flows
| | | | | | | | | | | | |
(in thousands) | | Year ended
December 31, 2008 | | | Year ended
December 31, 2007 | | | Year ended
December 31, 2006 | |
| Operating Activities: | | | | | | | | | | | | |
| Net income (loss) | | $ | (1,733,471 | ) | | $ | 49,656 | | | $ | 138,954 | |
Adjustments to reconcile net income (loss) to net cash provided by operating activities: | | | | | | | | | | | | |
Equity in net income of TXOK Acquisition, Inc | | | — | | | | — | | | | (1,593 | ) |
(Gain) loss on sale of other assets | | | 39 | | | | (941 | ) | | | (89 | ) |
Depreciation, depletion and amortization | | | 460,314 | | | | 375,420 | | | | 135,722 | |
Stock option compensation expense | | | 15,978 | | | | 12,632 | | | | 6,532 | |
Accretion of discount on asset retirement obligations | | | 6,703 | | | | 4,878 | | | | 2,014 | |
Write-down of oil and natural gas properties | | | 2,815,835 | | | | — | | | | — | |
Non-cash change in fair value of derivatives | | | (483,811 | ) | | | 81,606 | | | | (169,241 | ) |
Cash settlements of assumed derivatives | | | 83,603 | | | | 14,214 | | | | — | |
Deferred income taxes | | | (255,285 | ) | | | 66,171 | | | | 89,401 | |
Amortization of deferred financing costs, premium on 7 1/4% senior notes due 2011 and discount on long-term debt and term loan | | | 15,195 | | | | 10,332 | | | | 4,733 | |
Effect of changes, net of acquisition effects, in: | | | | | | | | | | | | |
Accounts receivable | | | 7,884 | | | | (59,290 | ) | | | 24,038 | |
Other current assets | | | 1,734 | | | | (3,092 | ) | | | (3,727 | ) |
Accounts payable and other current liabilities | | | 40,248 | | | | 26,243 | | | | 915 | |
| | | | | | | | | | | | |
| Net cash provided by operating activities | | | 974,966 | | | | 577,829 | | | | 227,659 | |
| | | | | | | | | | | | |
| Investing Activities: | | | | | | | | | | | | |
| Additions to oil and natural gas properties, gathering systems and equipment | | | (1,004,792 | ) | | | (654,982 | ) | | | (434,166 | ) |
| Property and Midstream acquisitions | | | (719,330 | ) | | | (2,191,987 | ) | | | (1,283,175 | ) |
| Proceeds from disposition of property and equipment | | | 15,543 | | | | 490,362 | | | | 5,824 | |
| Advance payment on pending acquisition | | | — | | | | (39,500 | ) | | | (80,000 | ) |
| Proceeds from sales of marketable securities | | | — | | | | 5,228 | | | | — | |
| Other investing activities | | | — | | | | (5,558 | ) | | | — | |
| | | | | | | | | | | | |
| Net cash used in investing activities | | | (1,708,579 | ) | | | (2,396,437 | ) | | | (1,791,517 | ) |
| | | | | | | | | | | | |
| Financing Activities: | | | | | | | | | | | | |
| Borrowings under credit agreements | | | 1,700,136 | | | | 2,235,500 | | | | 1,884,250 | |
| Repayment of interim bank loan | | | — | | | | — | | | | (350,000 | ) |
| Repayments under credit agreements | | | (776,200 | ) | | | (2,221,532 | ) | | | (776,849 | ) |
Proceeds from issuance of common stock, net of underwriter’s commissions and initial public offering costs | | | 14,777 | | | | 4,162 | | | | 657,381 | |
Proceeds from issuance of Preferred Stock, net of underwriter’s commissions and issuance costs | | | — | | | | 1,992,273 | | | | — | |
| Dividends on preferred stock | | | (82,831 | ) | | | (127,134 | ) | | | — | |
Settlement of derivative financial instruments on Power Gas Marketing & Transmission, Inc. acquisition | | | — | | | | — | | | | (38,098 | ) |
| Settlements of derivative financial instruments with a financing element | | | (83,603 | ) | | | (14,214 | ) | | | — | |
| Deferred financing costs and other | | | (37,037 | ) | | | (17,759 | ) | | | (16,957 | ) |
| | | | | | | | | | | | |
| Net cash provided by financing activities | | | 735,242 | | | | 1,851,296 | | | | 1,359,727 | |
| | | | | | | | | | | | |
| Net increase (decrease) in cash | | | 1,629 | | | | 32,688 | | | | (204,131 | ) |
| Cash at beginning of period | | | 55,510 | | | | 22,822 | | | | 226,953 | |
| | | | | | | | | | | | |
| Cash at end of period | | $ | 57,139 | | | $ | 55,510 | | | $ | 22,822 | |
| | | | | | | | | | | | |
| Supplemental Cash Flow Information: | | | | | | | | | | | | |
| Interest paid | | $ | 134,087 | | | $ | 182,192 | | | $ | 65,378 | |
| | | | | | | | | | | | |
| Income taxes received | | $ | — | | | $ | (6,075 | ) | | $ | — | |
| | | | | | | | | | | | |
Value of shares issued in connection with redemption of TXOK Acquisition, Inc. preferred stock | | $ | — | | | $ | — | | | $ | 4,667 | |
| | | | | | | | | | | | |
| Long-term debt assumed in TXOK Acquisition, Inc. acquisition | | $ | — | | | $ | — | | | $ | 508,750 | |
| | | | | | | | | | | | |
Long-term debt assumed in Power Gas Marketing & Transmission, Inc. acquisition | | $ | — | | | $ | — | | | $ | 13,096 | |
| | | | | | | | | | | | |
| Derivative financial instruments assumed in acquisitions | | $ | — | | | $ | (102,219 | ) | | $ | — | |
| | | | | | | | | | | | |
| Supplemental non cash investing: | | | | | | | | | | | | |
Capitalized stock compensation | | $ | 4,060 | | | $ | 2,411 | | | $ | 1,401 | |
| | | | | | | | | | | | |
Capitalized interest | | $ | 3,861 | | | $ | — | | | $ | — | |
| | | | | | | | | | | | |
Issuance of common stock for director services | | $ | 137 | | | $ | — | | | $ | — | |
| | | | | | | | | | | | |
Value of shares received for sale of properties | | $ | — | | | $ | 4,575 | | | $ | — | |
| | | | | | | | | | | | |
See accompanying notes.
86
EXCO Resources, Inc.
Consolidated statements of changes in shareholders’ equity
| | | | | | | | | | | | | | | | | |
| | | Common Stock | | Additional
paid-in
capital | | | Retained
earnings
(deficit) | | | Total
shareholders’
equity | |
(in thousands) | | Shares | | Amount | | | |
Balance at December 31, 2005 | | 50,000 | | $ | 50 | | $ | 354,482 | | | $ | 16,350 | | | $ | 370,882 | |
| | | | | | | | | | | | | | | | | |
Issuance of common stock, net of expenses | | 54,162 | | | 54 | | | 668,021 | | | | — | | | | 668,075 | |
Initial public offering costs | | — | | | — | | | (6,027 | ) | | | — | | | | (6,027 | ) |
Share-based compensation | | — | | | — | | | 7,966 | | | | — | | | | 7,966 | |
Net income | | — | | | — | | | — | | | | 138,954 | | | | 138,954 | |
| | | | | | | | | | | | | | | | | |
Balance at December 31, 2006 | | 104,162 | | $ | 104 | | $ | 1,024,442 | | | $ | 155,304 | | | $ | 1,179,850 | |
| | | | | | | | | | | | | | | | | |
Issuance of common stock | | 417 | | | 1 | | | 4,161 | | | | — | | | | 4,162 | |
Preferred stock dividends | | — | | | — | | | — | | | | (132,968 | ) | | | (132,968 | ) |
Share-based compensation | | — | | | — | | | 15,042 | | | | — | | | | 15,042 | |
Net income | | — | | | — | | | — | | | | 49,656 | | | | 49,656 | |
| | | | | | | | | | | | | | | | | |
Balance at December��31, 2007 | | 104,579 | | $ | 105 | | $ | 1,043,645 | | | $ | 71,992 | | | $ | 1,115,742 | |
| | | | | | | | | | | | | | | | | |
Issuance of common stock | | 1,127 | | | 1 | | | 14,913 | | | | — | | | | 14,914 | |
Preferred stock dividends | | — | | | — | | | — | | | | (76,997 | ) | | | (76,997 | ) |
Conversion of preferred stock | | 105,263 | | | 105 | | | 1,992,170 | | | | — | | | | 1,992,275 | |
Share-based compensation | | — | | | — | | | 20,038 | | | | — | | | | 20,038 | |
Net loss | | — | | | — | | | — | | | | (1,733,471 | ) | | | (1,733,471 | ) |
| | | | | | | | | | | | | | | | | |
Balance at December 31, 2008 | | 210,969 | | $ | 211 | | $ | 3,070,766 | | | $ | (1,738,476 | ) | | $ | 1,332,501 | |
| | | | | | | | | | | | | | | | | |
See accompanying notes.
87
EXCO Resources, Inc.
Notes to consolidated financial statements
Unless the context requires otherwise, references in this Annual Report on Form 10-K to “EXCO,” “EXCO Resources,” “Company,” “we,” “us,” and “our” are to EXCO Resources, Inc., and its consolidated subsidiaries.
We are an independent oil and natural gas company engaged in the acquisition, development and exploitation of onshore North American oil and natural gas properties. Our principal operations are located in the East Texas/North Louisiana, Appalachia, Mid-Continent and Permian producing areas. Our assets in East Texas/North Louisiana are owned by our subsidiary, EXCO Operating Company, LP (formerly EXCO Partners Operating Partnership, LP), and its subsidiaries and together they are collectively referred to as EXCO Operating. Organizationally, EXCO Operating is an indirect wholly-owned subsidiary of EXCO Resources. EXCO Operating’s debt is not guaranteed by EXCO Resources and EXCO Operating does not guarantee EXCO Resources’ debt. This structure allows us to maintain two separate credit agreements. We expect to continue to grow by leveraging our management team’s experience, developing our shale resource plays, exploiting our multi-year inventory of development drilling locations and exploitation projects, and selectively pursuing acquisitions that meet our strategic and financial objectives. We employ the use of debt along with a comprehensive derivative financial instrument program to support our strategy. This approach enhances our ability to execute our business plan over the entire commodity price cycle, protect our returns on investments, and manage our capital structure.
The accompanying consolidated balance sheets as of December 31, 2008 and 2007, results of operations, cash flows and changes in shareholders’ equity for the years ended December 31, 2008, 2007 and 2006 are for EXCO, and its subsidiaries. The consolidated financial statements and related footnotes are presented in accordance with accounting principals generally accepted in the United States of America, and therefore, all intercompany transactions have been eliminated.
Prior to the year ended December 31, 2008, we reported the net results of our midstream operations as a component of other income. Beginning in the second quarter of 2008, we made a strategic shift in the focus on and allocation of resources to our midstream division, primarily as a result of midstream asset acquisitions, which significantly increased our third party natural gas purchases and gathering and transportation throughput. We also have increased emphasis on capital projects specifically designed to grow the midstream segment of our business. Our consolidated statements of operations now present midstream revenues and operating expense along with oil and natural gas revenues and operating expenses. Beginning in 2008, we also reclassified our gathering and transporting costs related to our exploration and production segment, which were previously netted within oil and natural gas revenues, to a separately designated expense on our consolidated statements of operations. These gathering costs represent the amounts we pay to a third party, as opposed to being net at the wellhead. We have reclassified prior year amounts related to our midstream segment and our gathering expenses to conform to current year reporting. For further discussion, see “Note 2. Summary of significant accounting policies—Gathering and transportation” and “Note 16. Geographic operating segment information”. We have also reclassified our derivative financial instrument activities and other income items to the other income (expense) caption on our consolidated statements of operations. Previously, we reported these items as a component of revenues.
| 2. | Summary of significant accounting policies |
Principles of consolidation
We fully consolidate all of our subsidiaries in the accompanying consolidated balance sheets as of December 31, 2008 and 2007 and the consolidated statements of operations and consolidated statements of cash flows for the years ended December 31, 2008, 2007 and 2006. All intercompany transactions and accounts have been eliminated.
88
Management estimates
In preparing financial statements in conformity with accounting principles generally accepted in the United States, we are required to make estimates and assumptions that affect the reported amounts of assets, liabilities, revenues and expenses during the reporting periods. The most significant estimates pertain to proved oil and natural gas reserve volumes, future development costs, dismantlement and abandonment costs, share-based compensation expenses, estimates relating to certain oil and natural gas revenues and expenses and the fair market value of assets and liabilities acquired in business combinations, derivatives, goodwill and equity securities. Actual results may differ from management’s estimates.
Cash equivalents
We consider all highly liquid investments with maturities of three months or less when purchased, to be cash equivalents.
Concentration of credit risk and accounts receivable
Financial instruments that potentially subject us to a concentration of credit risk consist principally of cash, trade receivables and our derivative financial instruments. We place our cash with high credit quality financial institutions. We sell oil and natural gas to various customers. In addition, we participate with other parties in the drilling, completion and operation of oil and natural gas wells. The majority of our accounts receivable are due from either purchasers of oil or natural gas or participants in oil and natural gas wells for which we serve as the operator. We have the right to offset future revenues against unpaid charges related to wells which we operate. Oil and natural gas receivables are generally uncollateralized. The allowance for doubtful accounts receivable aggregated $2.5 million and $2.0 million at December 31, 2008 and 2007, respectively. We place our derivative financial instruments with financial institutions and other firms that we believe have high credit ratings. To mitigate our risk of loss due to default, we have entered into master netting agreements with our counterparties on our derivative financial instruments that allow us to offset our asset position with our liability position in the event of a default by the counterparty. As of December 31, 2008, we have a net asset position of $396.4 million.
Derivative financial instruments
In connection with the incurrence of debt related to our acquisition activities, our management has adopted a policy of entering into oil and natural gas derivative financial instruments to protect against commodity price fluctuations and to achieve a more predictable cash flow. Statement of Financial Accounting Standards, or SFAS, No. 133, “Accounting for Derivative Instruments and Hedging Activities,” or SFAS No. 133, requires that every derivative instrument (including certain derivative instruments embedded in other contracts) be recorded on the balance sheet as either an asset or liability measured at its fair value. SFAS No. 133 requires that changes in the derivative’s fair value be recognized currently in earnings unless specific hedge accounting criteria are met, or exemptions for normal purchases and normal sales as permitted by SFAS No. 133 exist. We do not designate our derivative financial instruments as hedging instruments and, as a result, recognize the change in a derivative’s fair value currently in earnings as a component of other income or expense.
Oil and natural gas properties
The accounting for, and disclosure of, oil and natural gas producing activities requires that we choose between two GAAP alternatives; the full cost method or the successful efforts method. We use the full cost method of accounting, which involves capitalizing all acquisition, exploration, exploitation and development costs. Once we incur costs, they are recorded in the depletable pool of proved properties or in unproved properties, collectively, the full cost pool. Unproved property costs, which totaled $481.6 million and $334.8 million as of December 31, 2008 and 2007, respectively, are not subject to depletion. We review our unproved oil and natural gas property costs on a quarterly basis to assess for impairment or the need to transfer unproved costs to proved properties as a result of extension or discoveries from drilling operations. We expect these costs to be evaluated in one to seven years and transferred to the depletable portion of the full cost pool
89
during that time. The full cost pool is comprised of intangible drilling costs, lease and well equipment and exploration and development costs incurred plus acquired proved and unproved leaseholds.
During April 2008, we initiated two leasing projects to acquire shale drilling rights in both our Appalachia and East Texas/North Louisiana operating areas. In accordance with our policy and the Statement of Financial Accounting Standards No. 34, “Capitalization of Interest Cost,” we began capitalizing interest on these projects in April 2008. At the end of the third quarter of 2008 these projects were complete. The total costs of these projects, net of any amortized or transferred amounts into the depletable full cost pool at December 31, 2008 is $139.8 million and the balance is located in unproved oil and natural gas properties on our consolidated balance sheet. When the balance is moved to proved developed and undeveloped oil and natural gas properties we will cease capitalizing interest.
We calculate depletion using the unit-of-production method. Under this method, the sum of the full cost pool, excluding the book value of unproved properties, and all estimated future development costs are divided by the total amount of Proved Reserves. This rate is applied to our total production for the period, and the appropriate expense is recorded. We capitalize the portion of general and administrative costs, including share-based compensation, that is attributable to our acquisition, exploration, exploitation and development activities.
At the end of each quarterly period, the unamortized cost of oil and natural gas properties, net of related deferred income taxes, is limited to the sum of the estimated future net revenues from our oil and natural gas properties using current period-end prices discounted at 10%, adjusted for related income tax effects (ceiling test). When computing our ceiling test, we evaluate the limitation at the end of each reporting period date. In the event our capitalized costs exceed the ceiling limitation at the end of the reporting date, we subsequently evaluate the limitation based on price changes that occur after the balance sheet date to assess impairment as permitted by Staff Accounting Bulletin Topic 12—Oil and Gas Producing Activities. Under full cost accounting rules, any ceiling test write-downs of oil and natural gas properties may not be reversed in subsequent periods. Since we do not designate our derivative financial instruments as hedges, we are not allowed to use the impacts of the derivative financial instruments in our ceiling test computation. As a result, decreases in commodity prices which contribute to ceiling test write-downs may be offset by mark-to-market gains which are not reflected in our ceiling test results.
For the year 2007, we sought and received an exemption from the Securities and Exchange Commission, or the SEC, in July 2007 to exclude the proved oil and natural gas properties of the Winchester acquisition, and those acquired in the Vernon Acquisition and the Southern Gas Acquisition from our ceiling test for a period of 12 months from the closing date of each acquisition, provided that we could demonstrate beyond a reasonable doubt that the fair value of the oil and natural gas reserves exceeded their unamortized carrying costs. The exemption related to Winchester expired September 30, 2007 and therefore the proved oil and natural gas properties of Winchester were included in our December 31, 2007 ceiling test calculation. The exemption for the Vernon Acquisition expired on March 30, 2008 and the exemption for the Southern Gas Acquisition expired on May 2, 2008 and, accordingly, the proved oil and natural gas reserves relating to these acquisitions are included in our December 31, 2008 ceiling test computation.
Sales, dispositions and other oil and natural gas property retirements are accounted for as adjustments to the full cost pool, with no recognition of gain or loss unless the disposition would significantly alter the amortization rate.
The calculation of the ceiling test is based upon estimates of Proved Reserves. There are numerous uncertainties inherent in estimating quantities of Proved Reserves, in projecting the future rates of production and in the timing of development activities. The accuracy of any reserve estimate is a function of the quality of available data and of engineering and geological interpretation and judgment. Results of drilling, testing and production subsequent to the date of the estimate may justify revision of such estimate. Accordingly, reserve estimates are often different from the quantities of oil and natural gas that are ultimately recovered.
90
Write-down of oil and natural gas properties
For the year ended December 31, 2008, we recognized pretax ceiling test write-downs of $2.8 billion ($1.7 billion after-tax) to our proved oil and natural gas properties. Of this total, $1.2 billion ($0.7 billion after-tax) was recognized in the third quarter of 2008 and $1.6 billion ($1.0 billion after-tax) in the fourth quarter of 2008. Under full cost accounting, we are required to compute the after-tax present value of our proved oil and natural gas properties using spot market prices for oil and natural gas at our balance sheet date. The base for our spot prices for natural gas is Henry Hub and Cushing, Oklahoma for oil. On December 31, 2008, the spot price for natural gas at Henry Hub was $5.71 per Mmbtu and the spot oil price was $44.60 per Bbl. The prices used to compute our third quarter write-down were $7.12 per Mmbtu for natural gas and $100.67 per Bbl of oil as of September 30, 2008. Natural gas, which is sold at other natural gas marketing hubs where we conduct operations, is subject to prices which reflect variables that can increase or decrease spot natural gas prices at these hubs such as market demand, transportation costs and quality of the natural gas being sold. Those differences are referred to as the basis differentials. Typically, basis differentials result in natural gas prices which are lower than Henry Hub, except in Appalachia, where we have typically received a premium to Henry Hub. We may face further ceiling test write-downs in future periods, depending on level of commodity prices, drilling results and well performance.
Gas gathering assets
Gas gathering assets are capitalized at cost and depreciated on a straight line basis over their estimated useful lives of 25 to 40 years.
Inventory
Inventory, which is included in current assets, includes tubular goods and other lease and well equipment which we plan to utilize in our ongoing exploration and development activities and is carried at the lower of cost or market. The inventory is capitalized to our full cost pool or gathering system assets once it has been placed into service.
Office and field equipment
Office and field equipment are capitalized at cost and depreciated on a straight line basis over their estimated useful lives. Office and field equipment useful lives range from 3 to 15 years.
Goodwill
In accordance with SFAS No. 142, “Goodwill and Intangible Assets,” or SFAS No. 142, goodwill is not amortized, but is tested for impairment on an annual basis, or more frequently as impairment indicators arise. Impairment tests, which involve the use of estimates related to the fair market value of the business operations with which goodwill is associated, are performed at the end of our fourth quarter. Losses, if any, resulting from impairment tests will be reflected in operating income in the statement of operations. In a February 2005 letter to oil and natural gas companies, the SEC provided guidance concerning the treatment of goodwill in situations when a company sells less than 25% of its proved oil and natural gas reserves in a cost pool. The guidance indicated that such dispositions may trigger a need to evaluate goodwill for impairment under SFAS No. 142. As a result of this guidance, beginning January 1, 2005, we no longer reduce the balance of goodwill for property dispositions of less than 25% of our oil and natural gas reserves unless there is an indication that our goodwill is impaired as a result of the sale.
The balance of goodwill as of December 31, 2008 and 2007 was $470.1 million.
Deferred abandonment and asset retirement obligations
We apply the Financial Accounting Standards Board, or FASB, SFAS No. 143, “Accounting for Asset Retirement Obligations,” or SFAS No. 143 to account for estimated future plugging and abandonment costs. SFAS No. 143 requires legal obligations associated with the retirement of long-lived assets to be recognized at their fair value at the time that the obligations are incurred. Upon initial recognition of a liability, that cost should
91
be capitalized as part of the related long-lived asset and allocated to expense over the useful life of the asset. Our asset retirement obligation primarily represents the estimated present value of the amount we will incur to plug, abandon and remediate our proved producing properties at the end of their productive lives, in accordance with applicable state laws.
The following is a reconciliation of our asset retirement obligations for the periods indicated (in thousands):
| | | | | | | | | | | | |
| | | For the
year ended
December 31,
2008 | | | For the
year ended
December 31,
2007 | | | For the
year ended
December 31,
2006 | |
Asset retirement obligations at beginning of period | | $ | 84,370 | | | $ | 56,149 | | | $ | 15,823 | |
Activity during the period: | | | | | | | | | | | | |
Adjustment to liability due to acquisitions | | | 15,128 | | | | 23,293 | | | | 16,954 | |
Revisions in estimated assumptions | | | 14,960 | | | | — | | | | — | |
Liabilities incurred during period | | | 4,222 | | | | 5,127 | | | | 21,681 | |
Liabilities settled during period | | | (4,712 | ) | | | (5,077 | ) | | | (323 | ) |
Accretion of discount | | | 6,703 | | | | 4,878 | | | | 2,014 | |
| | | | | | | | | | | | |
Asset retirement obligations at end of period: | | | 120,671 | | | | 84,370 | | | | 56,149 | |
Less current portion | | | 1,830 | | | | 1,656 | | | | 1,579 | |
| | | | | | | | | | | | |
Long-term portion | | $ | 118,841 | | | $ | 82,714 | | | $ | 54,570 | |
| | | | | | | | | | | | |
We have no assets that are legally restricted for purposes of settling asset retirement obligations.
Revenue recognition and gas imbalances
We use the sales method of accounting for oil and natural gas revenues. Under the sales method, revenues are recognized based on actual volumes of oil and natural gas sold to purchasers. Gas imbalances at December 31, 2008 and 2007 were not significant.
Gathering and transportation
We generally sell oil and natural gas under two types of agreements which are common in our industry. Both types of agreements include a transportation charge. One is a netback arrangement, under which we sell oil or natural gas at the wellhead and collect a price, net of the transportation incurred by the purchaser. In this case, we record sales at the price received from the purchaser, net of the transportation costs. Under the other arrangement, we sell oil or natural gas at a specific delivery point, pay transportation to a third party and receive proceeds from the purchaser with no transportation deduction. In this case, we record the transportation cost as gathering and transportation expense. Due to these two distinct selling arrangements, our computed realized prices, before the impact of derivative financial instruments, contain revenues which are reported under two separate bases. Gathering and transportation expenses totaled $14.2 million, $10.2 million and $1.6 million for the years ended December 31, 2008, 2007 and 2006, respectively.
Capitalization of internal costs
We capitalize as part of our proved developed oil and natural gas properties a portion of salaries and related share-based compensation for employees who are directly involved in the acquisition and development of oil and natural gas properties. During the years ended December 31, 2008, 2007 and 2006, we have capitalized $15.5 million, $8.1 million and $4.7 million, respectively. Included in the $15.5 million, $8.1 million and $4.7 million are $4.0 million, $2.4 million and $1.4 million of share-based compensation for the years ended December 31, 2008, 2007 and 2006, respectively. See “Note 12. Stock options” for further discussion.
Overhead reimbursement fees
We have classified fees from overhead charges billed to working interest owners, including ourselves, of $24.9 million, $18.4 million and $7.8 million, for the years ended December 31, 2008, 2007 and 2006,
92
respectively, as a reduction of general and administrative expenses in the accompanying consolidated statements of operations. Our share of these charges was $17.0 million, $13.5 million and $5.5 million for the years ended December 31, 2008, 2007 and 2006, respectively, and are classified as oil and natural gas production costs.
Environmental costs
Environmental costs that relate to current operations are expensed as incurred. Remediation costs that relate to an existing condition caused by past operations are accrued when it is probable that those costs will be incurred and can be reasonably estimated based upon evaluations of currently available facts related to each site.
Income taxes
Income taxes are accounted for using the liability method of accounting in accordance with Statement of Financial Standards No. 109, “Accounting for Income Taxes,” or SFAS No. 109, under which deferred income taxes are recognized for the future tax effects of temporary differences between the financial statement carrying amounts and the tax basis of existing assets and liabilities using the enacted statutory tax rates in effect at year-end. The effect on deferred taxes for a change in tax rates is recognized in income in the period that includes the enactment date. A valuation allowance for deferred tax assets is recorded when it is more likely than not that the benefit from the deferred tax asset will not be realized.
Earnings per share
We account for earnings per share in accordance with SFAS No. 128, “Earnings Per Share”, or SFAS No. 128. SFAS No. 128 requires companies to present two calculations of earnings per share, or EPS; basic and diluted. Basic earnings per common share are based on the weighted average number of common shares outstanding during the period. Diluted earnings per common share is computed in the same manner as basic earnings per share after assuming issuance of common stock for all potentially dilutive equivalent shares, whether exercisable or not.
Stock options
We account for our stock-based compensation in accordance with SFAS No. 123(R), which is a revision of SFAS No. 123, “Accounting for Stock-Based Compensation,” or SFAS No. 123. SFAS No. 123(R) requires all share-based payments to employees, including grants of employee stock options, to be recognized in our consolidated statements of operations based on their estimated fair values.
Our 2005 Long-Term Incentive Plan, as amended, or the 2005 Incentive Plan, provides for the granting of options and other equity incentive awards to purchase up to 20,000,000 shares of our common stock. New shares will be issued for any stock options exercised. Since its adoption, EXCO has issued only stock options under the 2005 Incentive Plan, though the plan allows for other share-based awards.
| 3. | Recent accounting pronouncements |
In September 2006, the FASB issued SFAS No. 157, “Fair Value Measurements,” or SFAS No. 157, which defines fair value, establishes a framework for measuring fair value in GAAP and expands disclosures about fair value measurements. SFAS No. 157 was effective for fiscal years beginning after November 15, 2007 and interim periods within those fiscal years for financial instruments. FASB Financial Staff Position No. FAS 157-2, “Effective Date of FASB Statement No. 157,” or FAS 157-2, deferred implementation for other non-financial assets and liabilities for one year. Examples of non-financial assets and liabilities are asset retirement obligations and non-financial assets and liabilities initially measured at fair value in a business combination. We adopted SFAS No. 157 on January 1, 2008. See “Note 5. Derivative financial instruments and fair value measurements” for a discussion of the impacts of the adoption of SFAS No. 157.
In December 2007, the FASB issued SFAS No. 141(R), “Business Combinations,” or SFAS No. 141(R). SFAS No. 141(R) replaces SFAS No. 141, “Accounting for Business Combinations,” or SFAS No. 141. SFAS
93
No. 141(R) broadens the scope of business combinations to include bargain purchases and combinations of related companies, provides guidance on measuring goodwill and requires acquisition costs to be separate from the value of assets and liabilities purchased. We adopted SFAS No. 141(R) on January 1, 2009. We do not believe the adoption of SFAS No. 141(R) will have a material impact on our financial statements, other than to expense certain transaction costs, which could be material. Under SFAS No. 141, transaction costs could be capitalized.
In December 2007, the FASB issued SFAS No. 160, “Noncontrolling Interests in Consolidated Financial Statements,” or SFAS No. 160. SFAS No. 160 amends Accounting Research Bulletin 51, or ARB 51. SFAS No. 160 requires the recognition of a noncontrolling interest (minority interest) as equity in the consolidated financial statements separate from the parent’s equity. The amount of net income attributable to the noncontrolling interest will be included in consolidated net income on the face of the income statement. It also amends certain of ARB No. 51’s consolidation procedures for consistency with the requirements of SFAS No. 141(R). SFAS No. 160 also includes expanded disclosure requirements regarding the interests of the parent and its noncontrolling interest. SFAS No. 160 is effective for financial statements issued for fiscal years beginning after December 15, 2008, and as such, we adopted SFAS No. 160 on January 1, 2009. We do not believe the adoption will have a material impact on our financial statements.
In March 2008, the FASB issued SFAS No. 161, “Disclosures about Derivative Instruments and Hedging Activities,” or SFAS No. 161. SFAS No. 161 requires enhanced disclosure about the fair value of derivative instruments and their gains or losses in tabular format and information about credit-risk-related contingent features in derivative agreements, counterparty credit risk, and the company’s strategies and objectives for using derivative instruments. We adopted SFAS No. 161 on January 1, 2009 and will begin reporting the enhanced disclosures in our Form 10-Q for the quarter ended March 31, 2009. The adoption of SFAS No. 161 did not have a material impact on our financial statements.
In May 2008, the FASB issued SFAS No. 162, “The Hierarchy of Generally Accepted Accounting Principles,” or SFAS No. 162. SFAS No. 162 identifies the sources of accounting principles and the framework for selecting the principles to be used in the preparation of financial statements. We adopted SFAS No. 162 on November 15, 2008. The adoption of SFAS No. 162 did not have an impact on our financial statements.
On October 10, 2008, the FASB issued FASB Staff Position No. FAS 157-3, or FSP 157-3. FSP 157-3 clarifies the application of SFAS No. 157 in a market that is not active and provides an example which illustrates key considerations in determining fair value of a financial asset when a market for that financial asset is not active. The FSP was effective upon issuance and did not have a material impact on our financial statements.
On December 31, 2008, the SEC issued Release No. 33-8995 amending its oil and natural gas reporting requirements for oil and natural gas producing companies. The effective date of the new accounting and disclosure requirements is for annual reports filed for fiscal years ending on or after December 31, 2009. Companies are not permitted to comply at an earlier date. Among other things, Release No. 33-8995:
| | • | | Revises a number of definitions relating to oil and natural gas reserves to make them consistent with the Petroleum Resource Management System, which includes certain non-traditional resources in proved reserves; |
| | • | | Permits the use of new technologies for determining oil and natural gas reserves; |
| | • | | Requires the use of average prices for the trailing twelve-month period in the estimation of oil and natural gas reserve quantities and, for companies using the full cost method of accounting, in computing the ceiling limitation test, in place of a single day price as of the end of the fiscal year; |
| | • | | Permits the disclosure in filings with the SEC of probable and possible reserves and reserves sensitivity to changes in prices; |
| | • | | Requires additional disclosures (outside of the financial statements) regarding the status of undeveloped reserves and changes in status of these from period to period; and |
94
| | • | | Requires a discussion of the internal controls in place to assure objectivity in the reserve estimation process and disclosure of the technical qualifications of the technical person having primary responsibility for preparing the reserve estimates. |
We are currently evaluating the effect of adopting the final rule on our financial statements and oil and natural gas reserve estimates and disclosures.
2008 Acquisitions
During 2008, we completed acquisitions of proved and unproved oil and natural gas properties and undeveloped acreage. A summary of these acquisitions and the values allocated to oil and natural gas properties and gathering facilities, net of contractual adjustments, is presented on the following table.
| | | | | | | | | | | | | | | | | | | |
(in thousands) | | Appalachian
Acquisition | | | New Waskom
Acquisition | | Danville
Acquisition | | | Other
acquisitions | | | Total
acquisitions | |
Purchase price calculations: | | | | | | | | | | | | | | | | | | | |
Purchase price | | $ | 386,703 | | | $ | 55,198 | | $ | 249,451 | | | $ | 74,075 | | | $ | 765,427 | |
Acquisition related expenses | | | 741 | | | | — | | | 178 | | | | — | | | | 919 | |
| | | | | | | | | | | | | | | | | | | |
Total purchase price | | $ | 387,444 | | | $ | 55,198 | | $ | 249,629 | | | $ | 74,075 | | | $ | 766,346 | |
| | | | | | | | | | | | | | | | | | | |
Allocation of purchase price: | | | | | | | | | | | | | | | | | | | |
Proved oil and natural gas properties | | $ | 334,308 | | | $ | — | | $ | 199,183 | | | $ | 71,232 | | | $ | 604,723 | |
Unproved oil and natural gas properties | | | 44,797 | | | | — | | | 42,391 | | | | (18 | ) | | | 87,170 | |
Other property and equipment | | | 2,517 | | | | — | | | 656 | | | | — | | | | 3,173 | |
Gulf Coast sale | | | — | | | | — | | | — | | | | 6,471 | | | | 6,471 | |
Gas gathering and related facilities | | | 19,876 | | | | 55,198 | | | 11,042 | | | | — | | | | 86,116 | |
Asset retirement obligations | | | (12,647 | ) | | | — | | | (1,029 | ) | | | — | | | | (13,676 | ) |
Other liabilities, net | | | (1,407 | ) | | | — | | | (2,614 | ) | | | (3,610 | ) | | | (7,631 | ) |
| | | | | | | | | | | | | | | | | | | |
Total purchase price allocation | | $ | 387,444 | | | $ | 55,198 | | $ | 249,629 | | | $ | 74,075 | | | $ | 766,346 | |
| | | | | | | | | | | | | | | | | | | |
On February 20, 2008, EXCO acquired shallow natural gas properties from EOG Resources, Inc. located primarily in EXCO’s central Pennsylvania operating area, or the Appalachian Acquisition. The purchase price was $387.4 million and was financed with funds drawn under the EXCO Resources credit agreement.
On March 11, 2008, we acquired a gathering system in East Texas, or the New Waskom Acquisition, which contained 230 miles of pipeline and a gathering system at a cost of approximately $55.2 million. The New Waskom system is located primarily in Harrison and Panola Counties in East Texas and Caddo Parish in North Louisiana. The system has access to one plant and three interstate pipelines. The New Waskom Acquisition was funded with drawings under the EXCO Operating credit agreement.
On July 15, 2008, we acquired producing oil and natural gas properties, acreage and other assets in Gregg, Rusk and Upshur counties of Texas, or the Danville Acquisition, for approximately $249.6 million, net of closing adjustments. Funding for this acquisition was provided by a senior unsecured term loan.
In addition to the acquisitions detailed above, we also acquired additional incremental interest in wells we own in our East Texas/North Louisiana areas, along with additional proved reserves in our Mid-Continent area.
Also included in the other column is the finalized purchase price allocation of our May 2007 acquisition of properties located in the Mid-Continent region from Anadarko Petroleum Corporation, or the Southern Gas Acquisition. Included in the Southern Gas Acquisition were oil and natural gas properties which were sold to Crimson Exploration, Inc., or Crimson, on May 8, 2007, or the Gulf Coast Sale.
95
Pro forma results of operations
The following table reflects the unaudited pro forma results of operations as though the Danville Acquisition, the Appalachian Acquisition, the conversion of our Preferred Stock and the acquisitions and dispositions during 2007, including the Vernon Acquisition, the Southern Gas Acquisition and the Gulf Coast Sale, had occurred on January 1, 2007.
| | | | | | | |
(in thousands, except per share data) | | Year ended
December 31, 2008 | | | Year ended
December 31, 2007 |
Revenues | | $ | 1,541,114 | | | $ | 1,181,884 |
| | | | | | | |
Net income (loss) | | $ | (1,762,605 | ) | | $ | 81,041 |
Preferred stock dividends | | | — | | | | — |
| | | | | | | |
Net income (loss) available to common shareholders | | $ | (1,762,605 | ) | | $ | 81,041 |
| | | | | | | |
Basic earnings (loss) per share | | $ | (8.37 | ) | | $ | 0.39 |
| | | | | | | |
Diluted earnings (loss) per share | | $ | (8.37 | ) | | $ | 0.38 |
| | | | | | | |
2007 Acquisitions
During 2007, we completed acquisitions of proved and unproved oil and natural gas properties and undeveloped acreage. A summary of these acquisitions and the values allocated to oil and natural gas properties and gathering facilities, net of contractual adjustments, is presented on the following table. As stated above, the Southern Gas Acquisition was not finalized until 2008.
| | | | | | | | | | | | | | | |
(in thousands) | | Vernon
Acquisition | | | Southern Gas
Acquisition(1) | | | Other
acquisitions | | Consolidated
total | |
Purchase price calculations: | | | | | | | | | | | | | | | |
Purchase price | | $ | 1,520,183 | | | $ | 770,498 | | | $ | 180,160 | | $ | 2,470,841 | |
Acquisition related expenses | | | 1,755 | | | | 2,040 | | | | — | | | 3,795 | |
| | | | | | | | | | | | | | | |
Total purchase price | | $ | 1,521,938 | | | $ | 772,538 | | | $ | 180,160 | | $ | 2,474,636 | |
| | | | | | | | | | | | | | | |
Allocation of purchase price: | | | | | | | | | | | | | | | |
Proved oil and natural gas properties | | $ | 1,417,823 | | | $ | 586,407 | | | $ | 159,502 | | $ | 2,163,732 | |
Unproved oil and natural gas properties | | | 58,192 | | | | 4,725 | | | | 20,658 | | | 83,575 | |
Gulf Coast Sale | | | — | | | | 241,948 | | | | — | | | 241,948 | |
Gas gathering and related facilities | | | 119,409 | | | | — | | | | — | | | 119,409 | |
Fair value (liability) of assumed derivative financial instruments | | | (60,015 | ) | | | (42,204 | ) | | | — | | | (102,219 | ) |
Asset retirement obligations | | | (10,726 | ) | | | (12,567 | ) | | | — | | | (23,293 | ) |
Other liabilities, net | | | (2,745 | ) | | | (5,771 | ) | | | — | | | (8,516 | ) |
| | | | | | | | | | | | | | | |
Total purchase price allocation | | $ | 1,521,938 | | | $ | 772,538 | | | $ | 180,160 | | $ | 2,474,636 | |
| | | | | | | | | | | | | | | |
| (1) | Reflects the final purchase price allocation for the Southern Gas Acquisition. The preliminary purchase price as of December 31, 2007 was $761.1 million. |
On March 30, 2007, EXCO Operating completed the purchase of substantially all of the oil and natural gas properties and related assets, including derivative financial instruments, covering a significant portion of estimated production for 2007, 2008 and 2009 from entities affiliated with Anadarko Petroleum Corporation, or Anadarko, in the Vernon and Ansley fields located in Jackson Parish, Louisiana for approximately $1.5 billion in cash, net of final purchase price adjustments. The Vernon Acquisition was funded by a $1.75 billion capital contribution from EXCO to EXCO Operating. The capital contribution consisted of $1.67 billion in cash and application of an $80.0 million deposit paid by EXCO to Anadarko in December 2006.
96
On May 2, 2007, we completed the purchase of oil and natural gas properties and related assets, including derivative financial instruments, covering a significant portion of estimated production for 2007, 2008 and 2009, from entities affiliated with Anadarko in multiple fields primarily located in Oklahoma, Texas and Louisiana for approximately $761.1 million in cash, including net purchase price adjustments, or the Southern Gas Acquisition. The Southern Gas Acquisition was funded with cash on hand of $145.2 million, including $133.0 million from escrow accounts from prior sales, borrowings under the EXCO Resources credit agreement of $572.9 million and the application of a $43.0 million deposit paid by EXCO to Anadarko in February 2007.
On October 9, 2007, we closed the acquisition of an additional 45% interest in 28,000 acres of leasehold interests and 135 producing wells in our Canyon Sand field in West Texas for $155.0 million from private sellers.
In addition to the acquisitions detailed above, the following transactions occurred during 2007:
On January 5, 2007, we completed the sale of oil and natural gas properties and undeveloped drilling locations in the Wattenberg Field area of the DJ Basin, or the Wattenberg Field, for approximately $130.9 million in cash, net of contractual adjustments. The transaction included substantially all of the assets EXCO held in the area. Proceeds from the sale were deposited with a third party intermediary pending closing of the Southern Gas Acquisition to facilitate a like-kind exchange for federal income tax purposes.
On May 8, 2007, we completed the Gulf Coast Sale, which included oil and natural gas properties and related assets in multiple fields primarily located in South Texas and South Louisiana acquired in the Southern Gas Acquisition to an entity affiliated with Crimson for an aggregate sale price of $241.9 million in cash, net of preliminary purchase price adjustments, and 750,000 shares of unregistered restricted Crimson common stock. In connection with the closing of the Gulf Coast Sale, the borrowing base on the EXCO Resources credit agreement was reduced from $1.0 billion to $900.0 million. On August 15, 2007, we sold the 750,000 shares of unregistered restricted common stock of Crimson for an aggregate sales price of approximately $5.2 million. We recorded a gain of $0.7 million on the sale, which is included in other income for the year ended December 31, 2007.
On July 13, 2007, we completed the sale of substantially all of our interest in the Cement Field, located in Caddo and Grady Counties Oklahoma, in our Mid-Continent area for approximately $99.7 million, after contractual purchase price adjustments. Proceeds from this sale were deposited with a third party intermediary pending closing of assets purchased in West Texas in October 2007.
No gain or loss was recognized from these sales since we use the full cost method of accounting as the sales do not represent a significant divestiture as defined in full cost accounting rules.
| 5. | Derivative financial instruments |
We use oil and natural gas derivatives and financial risk management instruments to manage our exposures to commodity price and interest rate fluctuations. We do not designate these instruments as hedging instruments for financial accounting purposes, and, as a result, we recognize the change in the respective instruments’ fair value currently in earnings, as gains or losses on oil and natural gas derivatives and interest expense on interest rate swaps.
In September 2006, the FASB issued SFAS No. 157. SFAS No. 157 defines fair value, establishes a framework for measuring fair value in accordance with accounting principles generally accepted in the United States and provides for expanded disclosure of information about fair value measurements. We adopted the provisions of SFAS No. 157 on January 1, 2008 for our derivative financial instruments’ assets and liabilities.
SFAS No. 157 defines fair value as the exchange price that would be received for an asset or paid to transfer a liability (exit price) in the principal or most advantageous market for the asset or liability in an orderly transaction between market participants on the measurement date. This fair value may be different than the settlement value based on company-specific inputs, such as credit rating, futures markets and forward curves, and readily available buyers or sellers for such assets or liabilities. Prior to January 1, 2008, our derivative financial instruments were recorded at their expected settlement value.
97
SFAS No. 157 also establishes a three-tier fair value hierarchy, which prioritizes the inputs used in measuring fair value. These tiers include:
Level 1—Observable inputs, such as quoted market prices in active markets, for substantially identical assets and liabilities.
Level 2—Observable inputs other than quoted prices withinLevel 1 for similar assets and liabilities. These include quoted prices in markets that are not active or other inputs that are observable or can be corroborated by observable market data. If the asset or liability has a specified or contractual term, the input must be observable for substantially the full term of the asset or liability.
Level 3—Unobservable inputs that are supported by little or no market activity, generally requiring development of fair value assumptions by management.
As of December 31, 2008, our oil and natural gas derivative financial instruments and interest rate swaps are required to be measured at their estimated fair value pursuant to SFAS No. 157. The following presents a summary of the estimated fair value of our derivative financial instruments at December 31, 2008:
| | | | | | | | | | | | | | |
(in thousands) | | Level 1 | | Level 2 | | | Level 3 | | Total | |
Oil and natural gas derivative financial instruments | | | $— | | $ | 406,298 | | | $ | — | | | $406,298 | |
Interest rate swaps | | | — | | | (9,878 | ) | | | — | | | (9,878 | ) |
| | | | | | | | | | | | | | |
| | $ | — | | $ | 396,420 | | | $ | — | | $ | 396,420 | |
| | | | | | | | | | | | | | |
In measuring fair value of financial assets and liabilities pursuant to SFAS No. 157, we utilize quoted NYMEX futures for period prices, along with other relevant information generated by market transactions, to value our oil and natural gas derivatives and utilize LIBOR, to value our interest rate swaps.
All of our derivative financial instruments, which consist of oil and natural gas swaps, natural gas basis swaps and interest rate swaps, and their related fair value tier have been classified as Level 2. The significant observable inputs for our oil and natural gas derivatives are based principally on NYMEX strip prices, LIBOR, and credit risk assessment which affects the discount rate to be utilized to compute fair value. The significant observable inputs for our interest rate swap derivatives are based principally on the forward LIBOR curve. To adjust for credit risk, we use available credit information about our counterparties, such as credit default swaps, or other factors based on management’s estimates. This factor is applied to each transaction, depending on whether it is a net asset or liability based on master netting agreements with our trading counterparties. For a net asset, we use the credit rating factor for the significant institutional counterparties, which is principally derived from credit default swaps or comparable credit ratings of similar counterparties at December 31, 2008. For a net liability, we use our credit rating factor, which is derived from the combination of our quoted yields on our senior notes, our New Term Credit Agreement, and other companies with credit ratings similar to ours.
98
Oil and natural gas derivatives
The following table presents our financial assets and liabilities for oil and natural gas derivative financial instruments measured at fair value subject to the disclosure requirements of SFAS No. 157 as of December 31, 2008:
| | | | | | | | | | |
(in thousands, except prices) | | Volume
Mmbtus/Bbls | | Weighted average
strike price per
Mmbtu/Bbl | | | Fair value at
December 31,
2008 | |
Natural gas: | | | | | | | | | | |
Swaps: | | | | | | | | | | |
2009 | | 100,530 | | $ | 8.18 | | | $ | 203,690 | |
2010 | | 51,698 | | | 8.10 | | | | 49,483 | |
2011 | | 9,125 | | | 7.97 | | | | 7,147 | |
2012 | | 1,830 | | | 4.51 | | | | (2,418 | ) |
2013 | | 1,825 | | | 4.51 | | | | (1,934 | ) |
| | | | | | | | | | |
Total natural gas | | 165,008 | | | | | | | 255,968 | |
| | | | | | | | | | |
Basis swaps: | | | | | | | | | | |
2009 | | 3,650 | | | (1.10 | ) | | | 544 | |
| | | | | | | | | | |
Total basis swaps | | 3,650 | | | | | | | 544 | |
| | | | | | | | | | |
Oil: | | | | | | | | | | |
Swaps: | | | | | | | | | | |
2009 | | 1,580 | | | 80.64 | | | | 40,648 | |
2010 | | 1,568 | | | 104.64 | | | | 61,775 | |
2011 | | 1,095 | | | 112.99 | | | | 44,269 | |
2012 | | 92 | | | 109.30 | | | | 3,094 | |
| | | | | | | | | | |
Total oil | | 4,335 | | | | | | | 149,786 | |
| | | | | | | | | | |
Total oil and natural gas and basis swaps | | | | | | | | $ | 406,298 | |
| | | | | | | | | | |
At December 31, 2008, the average forward NYMEX oil prices per Bbl for calendar 2009 and 2010 were $54.45 and $63.88, respectively, and the average forward NYMEX natural gas prices per Mmbtu for calendar 2009 and 2010 were $6.11 and $7.13, respectively.
Interest rate swaps
In January 2008, we entered into interest rate swaps to mitigate our exposure to fluctuations in interest rates on $700.0 million in principal through February 14, 2010 at LIBO rates ranging from 2.45% to 2.8%. During the year ended December 31, 2008, we recognized $9.3 million as an increase to interest expense on our interest rate swaps. As of December 31, 2008, the fair value of our interest rate swaps was an asset of $9.9 million.
| | | | | | |
| | | December 31, |
(in thousands) | | 2008 | | 2007 |
Long term debt: | | | | | | |
EXCO Resources Credit agreement | | $ | 1,048,951 | | $ | 560,500 |
EXCO Operating Credit Agreement | | | 1,218,485 | | | 1,083,000 |
New Term Credit Agreement | | | 300,000 | | | — |
7 1/4% senior notes due 2011 | | | 444,720 | | | 444,720 |
Unamortized premium on 7 1/4 % senior notes due 2011 | | | 7,582 | | | 10,951 |
| | | | | | |
Total | | $ | 3,019,738 | | $ | 2,099,171 |
| | | | | | |
99
Credit agreements
EXCO Resources Credit Agreement
On February 20, 2008, we entered into the first amendment to the EXCO Resources Credit Agreement. The primary change to the EXCO Resources Credit Agreement was an increase in the borrowing base from $900.0 million to approximately $1.2 billion.
On July 14, 2008, we entered into the second amendment to the EXCO Resources Credit Agreement. This amendment, which was effective June 30, 2008, permitted the payment of cash dividends in connection with the exercise of any right to convert our preferred stock into common stock without compliance with certain limitations on restricted payments. In addition, the leverage ratio covenant, as defined in the agreement, was increased to provide that EXCO will not permit such ratio (i) as of the end of any fiscal quarter ending on or after June 30, 2008 and on or before December 31, 2008 to be greater than 4.00 to 1.00, (ii) as of the end of the fiscal quarter ending on March 31, 2009 to be greater than 3.75 to 1.00 and (iii) as of the end of any fiscal quarter ending on or after June 30, 2009 to be greater than 3.50 to 1.00. The other financial covenants and all other terms, including maturity date and borrowing base, contained within the EXCO Resources Credit Agreement remained unchanged.
On February 4, 2009, we entered into the third amendment to the EXCO Resources Credit Agreement. Pursuant to the third amendment, the leverage ratio covenant, as defined in the agreement, was modified to provide that EXCO will maintain the current maximum leverage ratio of less than 4.00 to 1.00 as of each quarter during 2009. The leverage ratio will decrease as of March 3, 2010 to 3.75 to 1.00 and further decrease as of June 30, 2010 to 3.50 to 1.00. The other financial covenants and all other terms, including the maturity date and borrowing base were not changed.
The borrowing base is redetermined semi-annually with EXCO and the lenders having the right to interim unscheduled redeterminations in certain circumstances. Scheduled redeterminations are on or about April 1 and October 1 of each year. On October 20, 2008, our banking group reaffirmed the existing borrowing base of $1.2 billion. The interest rate ranges from LIBOR plus 100 basis points, or bps, to LIBOR plus 175 bps depending upon borrowing base usage. The facility also includes an Alternate Base Rate, or ABR, pricing alternative ranging from ABR plus 0 bps to ABR plus 75 bps depending upon borrowing base usage. Borrowings under the EXCO Resources Credit Agreement are collateralized by a first lien mortgage providing a security interest in our oil and natural gas properties. EXCO has also agreed to have in place derivative financial instruments covering no more than 80% of its forecasted production from total proved reserves (as defined) for each of the first two years of the five year period commencing on March 30, 2007 and 70% of the forecasted production from total Proved Reserves for each of the third through fifth years of the five year period. EXCO is required to have in place mortgages covering 80% of the engineered value of its Borrowing Base Properties (as defined). The foregoing description of the existing debt covenants is not complete and is qualified in its entirety by the EXCO Resources Credit Agreement. The EXCO Resources Credit Agreement matures on March 30, 2012. As of December 31, 2008, EXCO was in compliance with the following financial covenants contained in the EXCO Resources Credit Agreement, which require that we:
| | • | | maintain a consolidated current ratio (as defined) of at least 1.0 to 1.0 as of the end of any fiscal quarter; |
| | • | | not permit our ratio of consolidated funded indebtedness (as defined) to consolidated EBITDAX (as defined) to be greater than (i) 4.0 to 1.0 at the end of any fiscal quarter ending on or after December 31, 2008 up to and including December 31, 2009, (ii) 3.75 to 1.0 at the end of the fiscal quarter ending on March 31, 2010 and (iii) 3.50 to 1.0 beginning with the quarter ending June 30, 2010 and each quarter end thereafter; and |
| | • | | maintain a consolidated EBITDAX to consolidated interest expense (as defined) ratio of at least 2.5 to 1.0 at the end of any fiscal quarter ending on or after September 30, 2007. |
At December 31, 2008, the one month LIBO rate was 0.44%, which would result in an interest rate of approximately 1.94% on any new indebtedness we may incur under the EXCO Resources Credit Agreement. At December 31, 2008, we had $1.0 billion of outstanding indebtedness and $123.1 million of available borrowing capacity under the EXCO Resources Credit Agreement.
100
EXCO Operating Credit Agreement
The EXCO Operating Credit Agreement has a borrowing base of $1.3 billion, which is scheduled to be redetermined on a semi-annual basis, with EXCO Operating and the lenders having the right to interim unscheduled redeterminations in certain circumstances. Scheduled redeterminations will be made on or about April 1 and October 1 of each year. On October 20, 2008, our banking group reaffirmed the existing borrowing base of $1.3 billion. The EXCO Operating Credit Agreement is secured by a first priority lien on the assets of EXCO Operating, including 100% of the equity of EXCO Operating’s subsidiaries, and is guaranteed by all existing and future subsidiaries of EXCO Operating. EXCO Operating has agreed to have in place derivative financial instruments covering no more than 80% of the “forecasted production from total proved reserves” (as defined) for each of the first two years of the five year period commencing on March 30, 2007 and 70% of the forecasted production from total proved reserves for each of the third through fifth years of such five year period.
On July 14, 2008, EXCO Operating entered into a second amendment to the EXCO Operating Credit Agreement to (i) allow EXCO Operating to incur up to $500.0 million of indebtedness under the Original Term Credit Agreement, and (ii) exclude drawings under the Original Term Credit Agreement from the consolidated current ratio, as defined in the EXCO Operating Credit Agreement, through December 31, 2008.
On December 1, 2008, EXCO Operating entered into a third amendment to the EXCO Operating Credit Agreement to permit the incurrence of up to $300.0 million of unsecured indebtedness under the New Term Credit Agreement with stated maturity no later than January 15, 2010. On December 8, 2008, the entire $300.0 million under the New Credit Agreement was drawn. (See “New Term Credit Agreement.”)
The foregoing descriptions are not complete and are qualified in their entirety by the EXCO Operating Credit Agreement and amendments thereto. As of December 31, 2008, EXCO Operating was in compliance with the financial covenants contained in the EXCO Operating Credit Agreement, which require that EXCO Operating:
| | • | | maintain a consolidated current ratio (as defined) of at least 1.0 to 1.0 at the end of any fiscal quarter, beginning with the quarter ended September 30, 2007; |
| | • | | not permit our ratio of consolidated indebtedness to consolidated EBITDAX (as defined) to be greater than 3.5 to 1.0 at the end of each fiscal quarter, beginning with the quarter ended September 30, 2007; and |
| | • | | not permit our interest coverage ratio (as defined) to be less than 2.5 to 1.0 at the end of each fiscal quarter, beginning with the quarter ended September 30, 2007. |
The EXCO Operating Credit Agreement contains representations, warranties, covenants, events of default and indemnities customary for agreements of this type. The EXCO Operating Credit Agreement matures March 30, 2012. Interest under the EXCO Operating Credit Agreement ranges from LIBOR plus 100 bps to 175 bps. The facility also includes an ABR pricing alternative ranging from ABR plus 0 bps to ABR plus 75 bps.
At December 31, 2008, the one month LIBO rate was 0.44%, which would result in an interest rate of approximately 2.19% on any new indebtedness we may incur under the EXCO Operating Credit Agreement. At December 31, 2008 we had $1.2 billion of outstanding indebtedness and $80.0 million of available borrowing capacity under the EXCO Operating Credit Agreement.
Original Term Credit Agreement
On July 15, 2008, EXCO Operating entered into a senior unsecured term credit agreement, or the Original Term Credit Agreement, and drew $300.0 million, resulting in net proceeds of $289.4 million after transaction fees and administrative expenses. The Original Term Credit Agreement balance of $300.0 million was borrowed in a single draw on July 15, 2008 and was scheduled to mature on December 15, 2008.
New Term Credit Agreement
On December 8, 2008, EXCO Operating entered into a new $300.0 million senior unsecured term credit agreement, or the New Term Credit Agreement, with an aggregate balance of $300.0 million. Net proceeds from
101
the loan of $274.4 million, after bank fees and expenses, were used to repay and terminate the Original Term Credit Agreement. In addition to the fees incurred upon the closing of the New Term Credit Agreement, EXCO Operating may incur additional fees on unpaid principle amounts, or duration fees, as defined in the agreement. These include a 5% fee on the unpaid principle on June 15, 2009, and an additional 3% fee on the unpaid outstanding balance on September 15, 2009. Presently, we expect to incur some or all of the duration fees unless cash flow from operations or proceeds from assets sales are sufficient to pay down the loan. The New Term Credit Agreement is due and payable on January 15, 2010 and is guaranteed by all existing and future direct or indirect subsidiaries of EXCO Operating, including any guarantor of the EXCO Operating Credit Agreement.
The foregoing descriptions are not complete and are qualified in their entirety by the New Term Credit Agreement and amendments thereto. As of December 31, 2008, EXCO Operating was in compliance with the financial covenants contained in the New Term Credit Agreement, which require that EXCO Operating:
| | • | | maintain a minimum current ratio of 1.00 to 1.00; |
| | • | | not permit the maximum leverage ratio (as defined) to be greater than 3.50 to 1.00; and |
| | • | | not permit our minimum interest coverage ratio (as defined) to be less than 2.50 to 1.00. |
At the borrower’s election, the New Term Credit Agreement may bear interest at a rate per annum equal to (A) the Alternate Base Rate, or ABR [defined as the highest of (i) the rate of interest publicly announced by JPMorgan as its prime rate in effect at its principal office in New York City, (ii) the federal funds effective rate from time to time plus 0.50%, and (iii) the Adjusted LIBO Rate (defined as the greater of (x) the rate at which eurodollar deposits in the London interbank market for one month are quoted on Reuters BBA Libor Rates Page 3750, as adjusted for actual statutory reserve requirements for eurocurrency liabilities, and (y) 4.0%) plus 1.0%] plus 5.0% or (B) the Adjusted LIBO Rate plus 6.00%. In all cases, the minimum interest rate on the New Term Credit Agreement is 10.0%. The New Term Credit Agreement contains representations, warranties, covenants, events of default and indemnities that are customary for agreements of this type and are substantially the same as the terms included in the EXCO Operating Credit Agreement.
At December 31, 2008, the interest rate on the $300.0 million outstanding on the New Term Credit Agreement was 10.0%.
7 1/4% senior notes due January 15, 2011
As of December 31, 2008, $444.7 million in principal was outstanding on our Senior Notes. The unamortized premium on the Senior Notes at December 31, 2008 was $7.6 million. The estimated fair value of the Senior Notes, based on quoted market prices for the Senior Notes, was $344.7 million on December 31, 2008.
Interest is payable on the Senior Notes semi-annually in arrears on January 15 and July 15 of each year. Effective January 15, 2007, we may redeem some or all of the Senior Notes for the redemption price set forth in the Senior Notes. On January 15, 2009, we paid $16.1 million of interest on the Senior Notes. Another interest payment of $16.1 million will be due on July 15, 2009.
The indenture governing the Senior Notes contains covenants, which limit our ability and the ability of our guarantor subsidiaries to:
| | • | | incur or guarantee additional debt and issue certain types of preferred stock; |
| | • | | pay dividends on our capital stock or redeem, repurchase or retire our capital stock or subordinated debt; |
| | • | | create liens on our assets; |
| | • | | enter into sale/leaseback transactions; |
| | • | | create restrictions on the ability of our restricted subsidiaries to pay dividends or make other payments to us; |
| | • | | engage in transactions with our affiliates; |
102
| | • | | transfer or issue shares of stock of subsidiaries; |
| | • | | transfer or sell assets; and |
| | • | | consolidate, merge or transfer all or substantially all of our assets and the assets of our subsidiaries. |
On July 18, 2008, we converted all outstanding shares of our Preferred Stock into a total of approximately 105.2 million shares of our common stock. The conversion of the Preferred Stock has the effect of increasing the book value of shareholders’ equity by approximately $2.0 billion. We also paid all accrued but unpaid dividends in cash totaling approximately $12.8 million to the holders of the converted shares of Preferred Stock as of July 18, 2008. After July 18, 2008, dividends ceased to accrue on the Preferred Stock and all rights of the holders with respect to the Preferred Stock terminated, except for the right to receive the whole shares of common stock issuable upon conversion, accrued dividends through July 18, 2008 and cash in lieu of any fractional shares. The conversion of all outstanding shares of Preferred Stock into common stock eliminated our obligation to pay quarterly cash dividends of $35.0 million, resulting in annual dividend savings of $140.0 million.
Our Series A-1, Series B and Series C 7.0% Cumulative Convertible Perpetual Preferred Stock, or the 7.0% Preferred Stock and Series A-1 Hybrid Preferred Stock, or the Hybrid Preferred Stock, and together with the 7.0% Preferred Stock, the Preferred Stock, were issued in several series at a purchase price of $10,000 per share on March 30, 2007. The Preferred Stock was convertible into common stock at any time by the holder at a price of $19.00 per common share. We were entitled to force the conversion of the Preferred Stock at any time if the common stock traded for 20 days within a period of 30 consecutive days at a price (i) above 175% of the then effective conversion price ($33.25 per share at the final conversion price of $19.00 per share) at any time during the 24 months after issuance, (ii) above 150% of the then effective conversion price ($28.50 per share at the final conversion price of $19.00 per share) thereafter through the 48th month after issuance and (iii) above 125% of the then effective conversion price ($23.75 per share at the final conversion price of $19.00 per share) at any time thereafter. Cash dividends accrued at the rate of 7.0% per annum prior to March 30, 2013 and at the rate of 9.0% per annum thereafter. Upon the occurrence of a change of control, holders of our Preferred Stock were able to force us to repurchase their shares for cash at the liquidation preference plus accumulated dividends. Holders of our Preferred Stock had the right to vote with the holders of common stock as a single class on all matters submitted to our shareholders (except the election of directors) on an as-converted basis. Holders of Preferred Stock had the right to separately elect up to four directors, subject to the rights of the holders of Series B 7.0% Preferred Stock and Series C 7.0% Preferred Stock to vote as separate classes to each elect one of such preferred directors. In addition, upon the occurrence of specified defaults in the Statements of Designation for the Preferred Stock, the holders of the Preferred Stock, voting together as a class, had the right to elect four additional directors, or default directors, until such default was cured. In connection with the mandatory conversion of our Preferred Stock into common stock on July 18, 2008, the right to designate Preferred Stock directors terminated. However, pursuant to letter agreements entered into with each of Ares Management, LLC and Oaktree Capital Management, L.P. each of those entities continue to have the right to nominate one director for election at any annual meeting of shareholders so long as each entity beneficially owns at least 10,000,000 shares of common stock. The remaining two Preferred Stock directors currently serving on our Board of Directors are entitled to serve until the next annual meeting of shareholders.
We paid cash dividends totaling $82.8 million to the holders of our Preferred Stock from January 1, 2008 through July 18, 2008, the date upon which the preferred stock was converted into our common stock.
| 8. | Environmental regulation |
Various federal, state and local laws and regulations covering discharge of materials into the environment, or otherwise relating to the protection of the environment, may affect our operations and the costs of our oil and natural gas exploitation, development and production operations. We do not anticipate that we will be required in the foreseeable future to expend amounts material in relation to the financial statements taken as a whole by reason of environmental laws and regulations. Because these laws and regulations are constantly being changed, we are unable to predict the conditions and other factors over which we do not exercise control that may give rise to environmental liabilities affecting us.
103
| 9. | Commitments and contingencies |
We lease our offices and certain equipment. Our rental expenses were approximately $21.3 million, $8.8 million and $1.7 million for the years ended December 31, 2008, 2007, and 2006, respectively. Our future minimum rental payments under operating leases with remaining noncancellable lease terms at December 31, 2008, are as follows (in thousands). The table excludes month-to-month rental expenses on compressors:
| | | |
| | | Amount |
2009 | | $ | 9,714 |
2010 | | | 6,755 |
2011 | | | 4,710 |
2012 | | | 3,516 |
2013 | | | 2,932 |
Thereafter | | | 5,121 |
| | | |
Total | | $ | 32,748 |
| | | |
We regularly enter into agreements with contract drilling companies which commit us to utilize, or to pay for if not utilized, drilling rigs. As of December 31, 2008, the minimum amount that we are obligated to pay under these contracts is $60.2 million.
In the ordinary course of business, we are periodically a party to lawsuits. We do not believe that any resulting liability from existing legal proceedings, individually or in the aggregate, will have a material adverse effect on our results of operations or financial condition.
| 10. | Employee benefit plans |
At December 31, 2008, we sponsored a 401(k) plan for our employees and matched 100% of employee contributions. Our matching contributions of $6.1 million, $2.6 million and $1.1 million for the years ended December 31, 2008, 2007 and 2006. Prior to 2008, we sponsored two 401(k) plans with different matching terms. Our separate plans were combined effective January 1, 2008.
We account for earnings per share in accordance with SFAS No. 128, “Earnings per share,” or SFAS No. 128. SFAS No. 128 requires companies to present two calculations of earnings per share; basic and diluted. Basic earnings (loss) per share for the years ended December 31, 2008, 2007 and 2006 equals the net income (loss) available to common shareholders divided by the weighted average common shares outstanding during the period. Common shares resulting from the conversion of our Preferred Stock on July 18, 2008 are included in the weighted average common shares for the year ended December 31, 2008. Diluted earnings (loss) per common share for the year ended December 31, 2008, 2007 and 2006 is computed in the same manner as basic earnings per share after assuming issuance of common stock for all potentially dilutive common stock equivalents, including our Preferred Stock, whether exercisable or not. Since we incurred net losses for the years ended 2008 and 2007, we have excluded the potential common stock equivalents from the assumed conversion of stock options of 12,578,968, and 9,206,970, respectively. Antidilutive options representing 366,686 shares for the year ended December 31, 2006 were excluded from the computation of diluted earnings per share due to the options exercise price being lower than the weighted average stock price for the year. We have also excluded 57,097,494 and 105,263,158 shares of common stock equivalents from the assumed conversion of the Preferred Stock from the computation of earnings per share for the years ended December 31, 2008 and 2007, respectively, as they are antidilutive.
104
The following table presents basic and diluted earnings (loss) per share for the years ended December 31, 2008, 2007 and 2006 (in thousands, except per share amounts):
| | | | | | | | | | | |
| | | Year ended
December 31,
2008 | | | Year ended
December 31,
2007 | | | Year ended
December 31,
2006 |
Basic earnings per share: | | | | | | | | | | | |
Net income (loss) available to common shareholders | | $ | (1,810,468 | ) | | $ | (83,312 | ) | | $ | 138,954 |
Shares: | | | | | | | | | | | |
Weighted average number of common shares outstanding | | | 153,346 | | | | 104,364 | | | | 96,727 |
Basic earnings (loss) per share: | | | | | | | | | | | |
| | | | | | | | | | | |
Total basic earnings per share | | $ | (11.81 | ) | | $ | (0.80 | ) | | $ | 1.44 |
| | | | | | | | | | | |
Diluted earnings per share: | | | | | | | | | | | |
Net income (loss) available to common shareholders | | $ | (1,810,468 | ) | | $ | (83,312 | ) | | $ | 138,954 |
Shares: | | | | | | | | | | | |
Weighted average common shares and common stock equivalents | | | 153,346 | | | | 104,364 | | | | 98,453 |
Diluted earnings (loss) per share: | | | | | | | | | | | |
| | | | | | | | | | | |
Total diluted earnings per share | | $ | (11.81 | ) | | $ | (0.80 | ) | | $ | 1.41 |
| | | | | | | | | | | |
We adopted SFAS No. 123(R) on October 3, 2005. As required by SFAS No. 123(R), the granting of options to our employees under the 2005 Incentive Plan are share-based payment transactions and are to be treated as compensation expense by us with a corresponding increase to additional paid-in capital.
The 2005 Incentive Plan, as amended, provides for the granting of options to purchase up to 20,000,000 shares of EXCO’s common stock. The options expire ten years following the date of grant and have a weighted average remaining life of 8.3 years. Pursuant to the 2005 Incentive Plan, 25% of the options vest immediately with an additional 25% to vest on each of the next three anniversaries of the date of the grant. We generally grant incentive stock options. As of December 31, 2008 and 2007, there were 3,342,450 and 7,022,375 shares available to be granted under the 2005 Incentive Plan, respectively.
105
The following table summarizes stock option activity related to our employees under the 2005 Incentive Plan:
| | | | | | | | | | |
| | | Stock
options | | Weighted average
exercise price per
share | | Weighted average
remaining terms
(in years) | | Aggregate
intrinsic
value |
Options outstanding at December 31, 2005 | | 4,973,075 | | $ | 7.50 | | | | | |
Granted | | 3,615,700 | | | 14.02 | | | | | |
Forfeitures | | 163,250 | | | 8.83 | | | | | |
Exercised | | 158,152 | | | 7.97 | | | | | |
| | | | | | | | | | |
Options outstanding at December 31, 2006 | | 8,267,373 | | | 10.32 | | | | | |
| | | | | | | | | | |
Granted | | 4,951,700 | | | 14.94 | | | | | |
Forfeitures | | 399,600 | | | 13.83 | | | | | |
Exercised | | 416,700 | | | 9.99 | | | | | |
| | | | | | | | | | |
Options outstanding at December 31, 2007 | | 12,402,773 | | | 12.06 | | | | | |
| | | | | | | | | | |
Granted | | 4,079,000 | | | 13.21 | | | | | |
Forfeitures | | 399,075 | | | 15.57 | | | | | |
Exercised | | 1,119,383 | | | 13.20 | | | | | |
| | | | | | | | | | |
Options outstanding at December 31, 2008 | | 14,963,315 | | | 12.20 | | 8.29 | | $ | 9,431,007 |
| | | | | | | | | | |
Options exercisable at December 31, 2008 | | 8,905,765 | | $ | 11.07 | | 7.74 | | $ | 7,109,334 |
| | | | | | | | | | |
The weighted average grant date fair value of stock options granted during the years 2008, 2007 and 2006 were $6.02, $5.43 and $4.75, respectively. The total intrinsic value of stock options exercised for the years ended December 31, 2008, 2007 and 2006 was $11.4 million, $2.9 million and $0.9 million, respectively.
The fair value of each option grant is estimated on the date of grant using the Black-Scholes option pricing model. Options are granted at the fair market value of the common stock on the date of grant. The following assumptions were used for the options included in the above table:
| | | | | | | | | |
| | | 2008 | | | 2007 | | | 2006 | |
Expected life | | 5–8.5 years | | | 4–6 years | | | 4 years | |
Risk-free rate of return | | 1.71%–3.33 | % | | 3.28%–4.97 | % | | 4.22%–5.13 | % |
Volatility | | 34.17%–55.26 | % | | 35.67%–37.72 | % | | 30.40%–35.58 | % |
Dividend yield | | 0 | % | | 0 | % | | 0 | % |
As required by SFAS No. 123(R), the granting of options under the 2005 Incentive Plan to our employees are share-based payment transactions and are to be treated as compensation expense by us with a corresponding increase to additional paid-in capital. Expected life was determined based on EXCO’s exercise history, as well as comparable public companies. Risk-free rate of return is a rate of a similar term U.S. Treasury zero coupon bond. Volatility was determined based on the weighted average of historical volatility of our common stock and the daily closing prices from comparable public companies. Total share-based compensation for the years ended December 31, 2008, 2007 and 2006 was $20.0 million, $15.0 million and $7.9 million, of which $11.8 million, $9.0 million and $6.5 million is included in general and administrative expense and $4.2 million, $3.6 million and $0 is included in lease operating expense, respectively. We capitalized $4.0 million, $2.4 million and $1.4 million as a part of proved developed and undeveloped oil and natural gas properties for the years ended December 31, 2008, 2007 and 2006, respectively, as discussed in “Note 2. Summary of significant accounting policies.” The total tax benefit for the years ended December 31, 2008, 2007 and 2006 was $1.7 million, $1.1 million and $0.9 million, respectively. Total share-based compensation to be recognized on unvested awards is $26.7 million over a weighted average period of 1.44 years as of December 31, 2008.
106
The income tax provision attributable to our income (loss) before income taxes consists of the following:
| | | | | | | | | | | |
(in thousands) | | Year Ended
December 31,
2008 | | | Year Ended
December 31,
2007 | | | Year Ended
December 31,
2006 |
Current: | | | | | | | | | | | |
U.S. | | | | | | | | | | | |
Federal | | $ | — | | | $ | (6,075 | ) | | $ | — |
State | | | 252 | | | | — | | | | — |
| | | | | | | | | | | |
Total current income tax (benefit) | | | 252 | | | | (6,075 | ) | | | — |
| | | | | | | | | | | |
Deferred: | | | | | | | | | | | |
U.S. | | | | | | | | | | | |
Federal | | | (693,391 | ) | | | 61,748 | | | | 80,697 |
State | | | (88,266 | ) | | | 4,423 | | | | 8,704 |
Valuation allowance | | | 526,372 | | | | — | | | | — |
| | | | | | | | | | | |
Total deferred income tax (benefit) | | | (255,285 | ) | | | 66,171 | | | | 89,401 |
| | | | | | | | | | | |
Total income tax (benefit) | | $ | (255,033 | ) | | $ | 60,096 | | | $ | 89,401 |
| | | | | | | | | | | |
We have net operating loss carryforwards, or NOLs, for United States income tax purposes that have either been generated from our operations or were purchased in our acquisitions. Our NOLs are scheduled to expire if not utilized between 2009 and 2028. Our ability to use the purchased NOLs has been restricted by Section 382 of the Internal Revenue Code due to ownership changes which occurred on various dates between December 19, 1997 and October 3, 2005. In addition, we experienced a change in control on August 30, 2007 based upon the transformation of the Hybrid Preferred Stock to the same terms as the 7.0% Preferred Stock, but the result was no limitation on 2007 NOLs. We estimate that approximately $9.2 million of the NOLs limited by Section 382 will expire prior to their utilization. Our total NOL available for utilization at December 31, 2008 is approximately $414.2 million.
107
Deferred income taxes reflect the net tax effects of temporary differences between the carrying amounts of assets and liabilities for financial reporting purposes and the amounts used for income tax purposes. Significant components of our deferred tax liabilities and assets are as follows:
| | | | | | | | |
| | | December 31, | |
(in thousands) | | 2008 | | | 2007 | |
Current deferred tax assets (liabilities): | | | | | | | | |
Basis difference in fair value of derivative financial instruments | | $ | — | | | $ | 6,764 | |
Other | | | — | | | | — | |
| | | | | | | | |
Total current deferred tax assets (liabilities) | | | — | | | | 6,764 | |
| | | | | | | | |
Non-current deferred tax assets: | | | | | | | | |
Net operating loss and AMT credits carryforwards—U.S | | | 161,574 | | | | 11,642 | |
Basis difference in fair value of derivative financial instruments | | | — | | | | 53,099 | |
Purchase accounting adjustment to bond premium | | | 6,314 | | | | 9,233 | |
Share-based compensation | | | 4,150 | | | | 2,257 | |
Foreign tax credit carryforwards | | | 9,336 | | | | 9,336 | |
Tax basis of oil and natural gas properties in excess of book basis | | | 706,166 | | | | — | |
Other | | | 103 | | | | 30 | |
| | | | | | | | |
Total long-term deferred tax assets | | | 887,643 | | | | 85,597 | |
| | | | | | | | |
Valuation allowance | | | (535,708 | ) | | | (9,336 | ) |
| | | | | | | | |
Net total non-current deferred tax assets | | | 351,935 | | | | 76,261 | |
| | | | | | | | |
Non-current deferred tax liabilities: | | | | | | | | |
Book basis of oil and natural gas properties in excess of tax basis | | | — | | | | (264,113 | ) |
Book basis of gathering and other properties in excess of tax basis | | | (216,591 | ) | | | (78,340 | ) |
Basis difference in fair value of derivative financial instruments | | | (135,344 | ) | | | — | |
Basis of temporary goodwill | | | (9,371 | ) | | | (5,206 | ) |
| | | | | | | | |
Total non-current deferred liabilities | | | (361,306 | ) | | | (347,659 | ) |
| | | | | | | | |
Net total non-current deferred tax asset (assets) | | $ | (9,371 | ) | | $ | (271,398 | ) |
| | | | | | | | |
108
A reconciliation of our income tax provision (benefit) computed by applying the statutory United States federal income tax rate to our income (loss) before income taxes for the years ended December 31, 2008, 2007 and 2006 is presented in the following table:
| | | | | | | | | | | |
(in thousands) | | Year ended
December 31,
2008 | | | Year ended
December 31,
2007 | | Year ended
December 31,
2006 | |
United States federal income taxes (benefit) at statutory rate of 35% | | $ | (695,977 | ) | | $ | 38,413 | | $ | 79,925 | |
Increases (reductions) resulting from: | | | | | | | | | | | |
Adjustments to the valuation allowance | | | 526,372 | | | | 9,336 | | | — | |
Non-deductible compensation | | | 2,321 | | | | 3,144 | | | 1,420 | |
State tax rate change | | | — | | | | 3,078 | | | — | |
State taxes net of federal benefit | | | (88,266 | ) | | | 4,423 | | | 8,704 | |
Other | | | 517 | | | | 1,702 | | | (648 | ) |
| | | | | | | | | | | |
Total income tax provision (benefit) | | $ | (255,033 | ) | | $ | 60,096 | | $ | 89,401 | |
| | | | | | | | | | | |
During 2008, our income tax rate was impacted by the recognition of valuation allowances against deferred tax assets, which were primarily due to ceiling test write-downs that caused previous book basis and tax basis differences to change from deferred tax liabilities to deferred tax assets. Our deferred tax assets were offset by valuation allowances after testing to determine if the asset would meet a more likely than not criteria for realization pursuant to SFAS No. 109.
During 2007, our income tax rate was impacted by the substitution of a current federal net operating loss carryback for previously claimed foreign tax credits resulting from the 2005 sale of our Canadian subsidiary. The impact, net of a federal refund of $6.1 million, was an $11.0 million non-cash expense, principally related to foreign tax credits which are required since we no longer have any foreign operations.
Also, as a result of our 2007 acquisitions, our state effective rate increased which required us to change the rate in which we record our deferred tax assets and liabilities. This amount was recognized in our 2007 income tax expense as a current period expense and is presented as part of the Other line item in the above table.
The Company adopted the provisions of FASB Interpretation No. 48, “Accounting for Uncertainties in Income Taxes” on January 1, 2007. As a result of the implementation of Interpretation No. 48, the Company recognized a zero liability for unrecognized tax benefits. As of December 31, 2008, 2007 and 2006, the Company’s policy is to recognize interest related to unrecognized tax benefits of interest expense and penalties in operating expenses. The Company has not accrued any interest or penalties relating to unrecognized tax benefits in the current financials.
EXCO files income tax returns in the U.S. federal jurisdictions and various state jurisdictions. With few exceptions, EXCO is no longer subject to U.S. federal and state and local examinations by tax authorities for years before 2004. The Internal Revenue Service, or IRS, completed its examination of EXCO’s 2004 U.S. federal income tax return in January 2008. The result of the audit was an adjustment between U.S. and our Canadian subsidiary for a hedge recorded to the wrong entity. There was no material change to EXCO’s financial position.
| 14. | Related party transactions |
Corporate use of personal aircraft
We periodically charter, for company business, two jet aircraft from DHM Aviation, LLC, a company owned by Douglas H. Miller, our chairman and chief executive officer. The Board of Directors has adopted a written policy covering the use of these aircraft. The Company believes that prudent use of a chartered private
109
airplane by our senior management while on company business can promote efficient use of management time. Such usage can allow for unfettered, confidential communications among management during the course of the flight and minimize airport commuting and waiting time, thereby promoting maximum use of management time for company business. However, we restrict the use of the aircraft to priority company business being conducted by senior management in a manner that is cost effective for us and our shareholders. As a result, EXCO’s reimbursed use of the aircraft is restricted to travel that is integrally and directly related to performing senior management’s jobs. Such use must be approved in advance by our President and our Chief Financial Officer. We maintain a detailed written log of such usage specifying the company personnel (and others, if any) that fly on the aircraft, the travel dates and destination(s), and the company business being conducted. In addition, the log contains a detail of all charges paid or reimbursed by us with supporting written documentation.
In the event the aircraft is chartered for a mixture of company business and personal use, all charges will be reasonably allocated between company-reimbursed charges and charges to the person using the aircraft for personal use.
At least annually, and more frequently if requested by the Audit Committee, our Director of Internal Audit surveys fixed base operators and other charter operators located at Dallas Love Field, Dallas, Texas to ascertain hourly flight rates for aircraft of comparable size and equipment in relation to the aircraft. This survey also ascertains other charges (including fuel surcharges) invoiced by such charter operators as well as out-of-pocket reimbursement policies. Such survey is supplied to the Audit Committee in order for the Audit Committee to establish an hourly rate and other charges EXCO shall pay for the upcoming calendar year for the use of the aircraft. In addition, DHM Aviation, LLC is reimbursed for customary out-of-pocket catering expenses invoiced for a flight and any reimbursement of out-of-pocket expenses incurred by the pilots.
During 2007, DHM Aviation, LLC purchased an additional, larger used jet aircraft. Based upon a national survey of corporate aircraft charter rates, in August 2007, the Board of Directors approved a rate of $5,700 per flight hour plus $600 per flight hour fuel surcharge for the new aircraft, which was utilized in 2007 and 2008. We continue to reimburse DHM Aviation, LLC at a rate of $3,600 per hour, including fuel surcharges for use of its smaller aircraft.
Payments to DHM Aviation, LLC for the year ended December 31, 2008, 2007 and 2006 aggregated $0.8 million, $0.5 million and $0.4 million, respectively, for use of these aircraft.
Suite
The Company maintains a suite at the American Airlines Center in Dallas, Texas. During 2006, the Company shared the suite with and was reimbursed for 50% of its expenses relative to the suite by an entity affiliated with Boone Pickens, one of our directors, pursuant to an arrangement entered into in 2006 between the Company and such entity. During the year ended December 31, 2006, the Company paid a total of $350,000 to maintain the suite, of which $175,000 was reimbursed by the entity affiliated with Mr. Pickens. During 2007, this arrangement was terminated and EXCO now pays 100% of the costs associated with the American Airlines Center.
Private Placement of Preferred Stock
On March 30, 2007, we completed the Private Placement of an aggregate of $390.0 million of 7.0% Preferred Stock and $1.61 billion of Hybrid Preferred Stock to accredited investors pursuant to the terms and conditions of a Preferred Stock Purchase Agreement dated March 28, 2007. The following related persons participated in the transaction:
| | • | | Entities affiliated with Ares Management LLC, or Ares, purchased 2,925 shares of Series C 7.0% Preferred Stock and 12,075 shares of Series A-1 Hybrid Preferred Stock for $150.0 million. Prior to the |
110
| | Private Placement, Ares beneficially owned approximately 6.3% of our outstanding common stock. Jeffrey S. Serota, one of our directors, is a Managing Director of Ares. Mr. Serota was designated to our Board of Directors by Ares pursuant to the terms of the Series C 7.0% Preferred Stock. |
| | • | | Entities affiliated with Oaktree Capital Management, L.P., or Oaktree, purchased 11,700 shares of Series B 7.0% Preferred Stock and 48,300 shares of Series A-1 Hybrid Preferred Stock for $600.0 million. Prior to the Private Placement, Oaktree beneficially owned approximately 3.1% of our outstanding common stock. Vincent J. Cebula, one of our directors, was a Managing Director of Oaktree until October 31, 2007. Mr. Cebula was originally designated to our Board of Directors by Oaktree pursuant to the terms of the Series B 7.0% Preferred Stock. On October 31, 2007, Mr. Cebula resigned from Oaktree and subsequently joined Jefferies Capital Partners. Since Mr. Cebula resigned from Oaktree, he also resigned as the Series B Preferred Stock director effective December 1, 2007 and was replaced by B. James Ford, a Managing Director of Oaktree. Mr. Cebula remains on our Board of Directors and serves in one of the four board seats reserved for the Preferred Stock. Additionally, Rajath Shourie, a Managing Director of Oaktree, serves in one of the four board seats reserved for the Preferred Stock. |
| | • | | Entities affiliated with Greenhill Capital Partners, LLC purchased 1,463 shares of Series A-1 7.0% Preferred Stock and 6,037 shares of Series A-1 Hybrid Preferred Stock for $75.0 million. Prior to the Private Placement, Greenhill beneficially owned approximately 2.2% of our outstanding common stock. Robert H. Niehaus, one of our directors, is a Senior Member of GCP 2000, LLC and Managing Director of Greenhill Capital Partners, LLC, which control the general partners of Greenhill Capital Partners, L.P. and its affiliated investment funds. |
| | • | | Entities affiliated with FMR Corp. purchased 1,952 shares of Series A-1 7.0% Preferred Stock and 8,048 shares of Series A-1 Hybrid Preferred Stock for $100.0 million. Prior to the Private Placement, FMR Corp. beneficially owned approximately 7.0% of our outstanding common stock. |
In connection with the Private Placement, we entered into a letter agreement, dated March 28, 2007, with Oaktree pursuant to which we agreed to cause an individual designated by Oaktree to be nominated to serve on our Board of Directors following such time as (i) Oaktree ceases to have the right to elect a director to serve on our Board of Directors pursuant to the Statement of Designation for the Series B 7.0% Preferred Stock and (ii) less than 25% of the shares of 7.0% Preferred Stock and Hybrid Preferred Stock originally issued on March 30, 2007 remain outstanding, and for so long as Oaktree owns at least 10,000,000 shares of our common stock (including, for this purpose, shares of common stock into which any Preferred Stock then held by Oaktree is convertible).
In connection with the Private Placement, we also entered into a letter agreement, dated March 28, 2007, with certain investors affiliated with Ares pursuant to which we agreed to cause an individual designated by Ares to be nominated to serve on our Board of Directors following such time as (i) Ares ceases to have the right to elect a director to serve on our Board of Directors pursuant to the Statement of Designation for the Series C 7.0% Preferred Stock and (ii) less than 25% of the shares of 7.0% Preferred Stock and Hybrid Preferred Stock originally issued on March 30, 2007 remain outstanding, for so long as Ares owns at least 10,000,000 shares of our common stock (including, for this purpose, shares of common stock into which any Preferred Stock then held by Ares is convertible).
For more information about the Private Placement, see “Note 7. Preferred stock”.
Gulf Coast Sale
On May 8, 2007, we completed the sale of a portion of the oil and natural gas properties and related assets in multiple fields primarily located in South Texas and South Louisiana acquired in the Southern Gas Acquisition to an entity affiliated with Crimson, for an aggregate sale price of $241.9 million in cash, net of preliminary purchase price adjustments, and 750,000 shares of unregistered restricted Crimson common stock, or the Gulf Coast Sale. The purchase price was negotiated on an arm’s-length basis based upon customary industry metrics
111
for acquisitions of oil and natural gas reserves. The purchase agreement for the Gulf Coast Sale contained customary representations, warranties and covenants. Crimson is a publicly-held company that is controlled by investment funds managed by Oaktree. At the time of the Gulf Coast Sale, one of our directors, Vincent J. Cebula was a managing director of Oaktree. Rajath Shourie, a managing director of Oaktree, began serving on our Board of Directors on August 30, 2007. B. James Ford, a managing director of Oaktree and a member of Crimson’s board of directors, began serving on our Board of Directors on December 1, 2007.
On August 15, 2007, we entered into an agreement with funds managed by Oaktree to sell our 750,000 shares of Crimson’s unregistered restricted common stock for an aggregate sales price of approximately $5.2 million.
Other
Penny Wilson, the spouse of Mark E. Wilson, our Vice President, Chief Accounting Officer and Controller, was retained by us from February 2007 to January 2008 as a consultant, through an independent consulting firm to perform accounting work related to our 2007 acquisitions. In addition to Ms. Wilson’s base salary, she also received approximately $19,000 in bonus and commissions from the consulting firm, which were directly tied to her engagement at EXCO. During 2007, fees paid to the consulting firm for Ms. Wilson and other consultants totaled approximately $0.6 million.
112
We follow SFAS No. 131, “Disclosures About Segments of an Enterprise and Related Information,” or SFAS No. 131. Identification of operating segments is based principally upon differences in the types and distribution channel of products. In prior periods, we only had operations in one industry segment, that being the oil and natural gas exploration and production industry. Beginning in the second quarter of 2008, we made a strategic shift in the focus on and allocation of resources to our midstream division. The decision to designate our midstream division as a separate business segment was due primarily to recent pipeline acquisitions and increased third party throughput resulting from capital projects specifically designed to grow this segment of our business. Our reportable segments now consist of exploration and production and midstream. Our exploration and production operational segment and midstream segment are managed separately because of the nature of their products and services. The exploration and production segment is responsible for acquisition, development and production of oil and natural gas. The midstream segment is responsible for purchasing, gathering, transporting, processing and treating natural gas. We evaluate the performance of our operating segments based on segment profits, which includes segment revenues, excluding the gain (loss) on derivative financial instruments, from external and internal customers and segment costs and expenses.
Summarized financial information concerning our reportable segments is shown in the following table:
| | | | | | | | | | | | | | |
(in thousands) | | Exploration and
production | | | Midstream | | Intersegment
eliminations | | | Consolidated
total |
For the year ended December 31, 2008: | | | | | | | | | | | | | | |
Third Party revenues | | $ | 1,404,826 | | | $ | 85,432 | | $ | — | | | $ | 1,490,258 |
Intersegment revenues | | | (32,296 | ) | | | 62,204 | | | (29,908 | ) | | | — |
| | | | | | | | | | | | | | |
Total revenues | | $ | 1,372,530 | | | $ | 147,636 | | $ | (29,908 | ) | | $ | 1,490,258 |
| | | | | | | | | | | | | | |
Segment profit | | $ | 1,120,253 | | | $ | 34,931 | | $ | — | | | $ | 1,155,184 |
| | | | | | | | | | | | | | |
For the year ended December 31, 2007: | | | | | | | | | | | | | | |
Third Party revenues | | $ | 875,787 | | | $ | 18,817 | | $ | — | | | $ | 894,604 |
Intersegment revenues | | | (20,959 | ) | | | 26,946 | | | (5,987 | ) | | | — |
| | | | | | | | | | | | | | |
Total revenues | | $ | 854,828 | | | $ | 45,763 | | $ | (5,987 | ) | | $ | 894,604 |
| | | | | | | | | | | | | | |
Segment profit | | $ | 675,619 | | | $ | 23,487 | | $ | — | | | $ | 699,106 |
| | | | | | | | | | | | | | |
For the year ended December 31, 2006: | | | | | | | | | | | | | | |
Third Party revenues | | $ | 359,235 | | | $ | 8,139 | | $ | — | | | $ | 367,374 |
Intersegment revenues | | | (1,840 | ) | | | 10,385 | | | — | | | | — |
| | | | | | | | | | | | | | |
Total revenues | | $ | 357,395 | | | $ | 18,524 | | $ | — | | | $ | 367,374 |
| | | | | | | | | | | | | | |
Segment profit | | $ | 287,263 | | | $ | 2,182 | | $ | — | | | $ | 289,445 |
| | | | | | | | | | | | | | |
As of December 31, 2008: | | | | | | | | | | | | | | |
Capital expenditures | | $ | 934,141 | | | $ | 54,993 | | $ | — | | | $ | 989,134 |
| | | | | | | | | | | | | | |
Goodwill | | $ | 441,872 | | | $ | 28,205 | | $ | — | | | $ | 470,077 |
| | | | | | | | | | | | | | |
Total assets | | $ | 4,392,218 | | | $ | 430,134 | | $ | — | | | $ | 4,822,352 |
| | | | | | | | | | | | | | |
As of December 31, 2007: | | | | | | | | | | | | | | |
Capital expenditures | | $ | 499,509 | | | $ | 16,980 | | $ | — | | | $ | 516,489 |
| | | | | | | | | | | | | | |
Goodwill | | $ | 441,872 | | | $ | 28,205 | | $ | — | | | $ | 470,077 |
| | | | | | | | | | | | | | |
Total assets | | $ | 5,640,029 | | | $ | 315,742 | | $ | — | | | $ | 5,955,771 |
| | | | | | | | | | | | | | |
113
The following table reconciles the segment profits reported above to income (loss) before income taxes:
| | | | | | | | | | | | |
| | | Year ended December 31, | |
(in thousands) | | 2008 | | | 2007 | | | 2006 | |
Segment profits | | $ | 1,155,184 | | | $ | 699,106 | | | $ | 289,445 | |
Depreciation, depletion and amortization | | | (460,314 | ) | | | (375,420 | ) | | | (135,722 | ) |
Write-down of oil and natural gas properties | | | (2,815,835 | ) | | | — | | | | — | |
Accretion of discount on asset retirement obligations | | | (6,703 | ) | | | (4,878 | ) | | | (2,014 | ) |
General and administrative | | | (87,568 | ) | | | (64,670 | ) | | | (41,206 | ) |
Interest expense, net | | | (161,638 | ) | | | (181,350 | ) | | | (84,871 | ) |
Gain on derivative financial instruments | | | 384,389 | | | | 26,807 | | | | 198,664 | |
Other income | | | 3,981 | | | | 10,157 | | | | 2,466 | |
Equity in net income of TXOK Acquisition, Inc | | | — | | | | — | | | | 1,593 | |
| | | | | | | | | | | | |
Income (loss) before income taxes | | $ | (1,988,504 | ) | | $ | 109,752 | | | $ | 228,355 | |
| | | | | | | | | | | | |
For the year ended December 31, 2008, sales to a natural gas marketing company, Crosstex Gulf Coast Marketing, and to a regulated natural gas utility company, Atmos Energy Marketing L.L.C. and its affiliates, accounted for approximately 12.0% and 11.2%, respectively, of total consolidated revenues. For the year ended December 31, 2007, sales to a regulated natural gas utility company, Atmos Energy Marketing L.L.C. and its affiliates, and an independent oil and natural gas company, Anadarko and its affiliates, accounted for approximately 18.9% and 11.4%, respectively, of total consolidated revenues. For the year ended December 31, 2006, sales to one customer, Duke Energy Field Services, accounted for approximately 11.3% of total consolidated revenues.
| 16. | Consolidating financial statements |
Set forth below are condensed consolidating financial statements of EXCO, the guarantor subsidiaries and the non-guarantor subsidiaries. The senior notes are jointly and severally guaranteed by some of our subsidiaries in the United States (referred to as Guarantor Subsidiaries). Each of the Guarantor Subsidiaries are wholly-owned subsidiaries of Resources, and the guarantees are unconditional as it relates to the assets of the Guarantor Subsidiaries. In 2007, certain subsidiaries, previously guarantor subsidiaries, were merged into and with Resources.
In connection with the 2007 mergers discussed above, the consolidating balance sheet as of December 31, 2006 and the consolidating statements of operations and consolidating statements of cash flows for the year ended December 31, 2006 have been restated to reflect the guarantor subsidiaries as if they had been part of Resources for all periods presented. We have also presented the 2007 consolidating financial statements to reflect these changes as if it was in place at the beginning of the year.
The following financial information presents consolidating financial statements, which include:
| | • | | the guarantor subsidiaries on a combined basis; |
| | • | | the non-guarantor subsidiaries; |
| | • | | elimination entries necessary to consolidate Resources, the guarantor subsidiaries and the non-guarantor subsidiaries; and |
| | • | | EXCO on a consolidated basis. |
Investments in subsidiaries are accounted for using the equity method of accounting. The financial information for the guarantor and non-guarantor subsidiaries are presented on a combined basis. The elimination entries primarily eliminate investments in subsidiaries and intercompany balances and transactions.
114
EXCO Resources, Inc.
Consolidating balance sheet
December 31, 2008
| | | | | | | | | | | | | | | | | | | | |
(in thousands) | | Resources | | | Guarantor
subsidiaries | | | Non-guarantor
subsidiaries | | | Eliminations | | | Consolidated | |
Assets | | | | | | | | | | | | | | | | | | | | |
Current assets: | | | | | | | | | | | | | | | | | | | | |
Cash and cash equivalents | | $ | 8,618 | | | $ | 12,360 | | | $ | 36,161 | | | $ | — | | | $ | 57,139 | |
Other current assets | | | 162,607 | | | | 29,935 | | | | 263,359 | | | | — | | | | 455,901 | |
| | | | | | | | | | | | | | | | | | | | |
Total current assets | | | 171,225 | | | | 42,295 | | | | 299,520 | | | | — | | | | 513,040 | |
| | | | | | | | | | | | | | | | | | | | |
Oil and natural gas properties (full cost accounting method): | | | | | | | | | | | | | | | | | | | | |
Unproved oil and natural gas properties | | | 85,061 | | | | 119,940 | | | | 276,595 | | | | — | | | | 481,596 | |
Proved developed and undeveloped oil and natural gas properties | | | 940,529 | | | | 673,814 | | | | 1,964,001 | | | | — | | | | 3,578,344 | |
Accumulated depletion | | | (232,261 | ) | | | (145,103 | ) | | | (558,724 | ) | | | — | | | | (936,088 | ) |
| | | | | | | | | | | | | | | | | | | | |
Oil and natural gas properties, net | | | 793,329 | | | | 648,651 | | | | 1,681,872 | | | | — | | | | 3,123,852 | |
| | | | | | | | | | | | | | | | | | | | |
Gas gathering, office and field equipment, net | | | 8,582 | | | | 55,404 | | | | 414,630 | | | | — | | | | 478,616 | |
Derivative financial instruments | | | 120,097 | | | | — | | | | 52,906 | | | | — | | | | 173,003 | |
Deferred financing costs, net | | | 6,414 | | | | — | | | | 56,470 | | | | — | | | | 62,884 | |
Goodwill | | | 110,800 | | | | 164,469 | | | | 194,808 | | | | — | | | | 470,077 | |
Investments in and advances to affiliates | | | 802,902 | | | | — | | | | — | | | | (802,902 | ) | | | — | |
Other assets | | | 2 | | | | 678 | | | | 200 | | | | — | | | | 880 | |
| | | | | | | | | | | | | | | | | | | | |
Total assets | | $ | 2,013,351 | | | $ | 911,497 | | | $ | 2,700,406 | | | $ | (802,902 | ) | | $ | 4,822,352 | |
| | | | | | | | | | | | | | | | | | | | |
Liabilities and shareholders’ equity | | | | | | | | | | | | | | | | | | | | |
Current liabilities | | $ | 66,871 | | | $ | 50,256 | | | $ | 205,746 | | | $ | — | | | $ | 322,873 | |
Long-term debt | | | 1,501,253 | | | | — | | | | 1,518,485 | | | | — | | | | 3,019,738 | |
Deferred income taxes | | | 9,371 | | | | — | | | | — | | | | — | | | | 9,371 | |
Other liabilities | | | 27,065 | | | | 78,316 | | | | 32,488 | | | | — | | | | 137,869 | |
Payable to parent | | | (923,710 | ) | | | 948,463 | | | | (24,753 | ) | | | — | | | | — | |
Commitments and contingencies | | | — | | | | — | | | | — | | | | — | | | | — | |
Total shareholders’ equity | | | 1,332,501 | | | | (165,538 | ) | | | 968,440 | | | | (802,902 | ) | | | 1,332,501 | |
| | | | | | | | | | | | | | | | | | | | |
Total liabilities and shareholders’ equity | | $ | 2,013,351 | | | $ | 911,497 | | | $ | 2,700,406 | | | $ | (802,902 | ) | | $ | 4,822,352 | |
| | | | | | | | | | | | | | | | | | | | |
115
EXCO Resources, Inc.
Consolidating balance sheet
December 31, 2007
| | | | | | | | | | | | | | | | | | | | |
(in thousands) | | Resources | | | Guarantor
subsidiaries | | | Non-guarantor
subsidiaries | | | Eliminations | | | Consolidated | |
Assets | | | | | | | | | | | | | | | | | | | | |
Current assets: | | | | | | | | | | | | | | | | | | | | |
Cash and cash equivalents | | $ | 23,069 | | | $ | 7,250 | | | $ | 25,191 | | | $ | — | | | $ | 55,510 | |
Other current assets | | | 76,261 | | | | 31,601 | | | | 147,928 | | | | — | | | | 255,790 | |
| | | | | | | | | | | | | | | | | | | | |
Total current assets | | | 99,330 | | | | 38,851 | | | | 173,119 | | | | — | | | | 311,300 | |
| | | | | | | | | | | | | | | | | | | | |
Oil and natural gas properties (full cost accounting method): | | | | | | | | | | | | | | | | | | | | |
Unproved oil and natural gas properties | | | 92,680 | | | | 17,142 | | | | 224,981 | | | | — | | | | 334,803 | |
Proved developed and undeveloped oil and natural gas properties | | | 1,192,337 | | | | 899,745 | | | | 2,833,971 | | | | — | | | | 4,926,053 | |
Accumulated depletion | | | (112,548 | ) | | | (84,288 | ) | | | (303,657 | ) | | | — | | | | (500,493 | ) |
| | | | | | | | | | | | | | | | | | | | |
Oil and natural gas properties, net | | | 1,172,469 | | | | 832,599 | | | | 2,755,295 | | | | — | | | | 4,760,363 | |
| | | | | | | | | | | | | | | | | | | | |
Gas gathering, office and field equipment, net | | | 7,449 | | | | 32,665 | | | | 305,294 | | | | — | | | | 345,408 | |
Advance on pending acquisition | | | 39,500 | | | | — | | | | — | | | | — | | | | 39,500 | |
Derivative financial instruments | | | 851 | | | | — | | | | 1,640 | | | | — | | | | 2,491 | |
Deferred financing costs, net | | | 7,619 | | | | — | | | | 12,787 | | | | — | | | | 20,406 | |
Goodwill | | | 110,800 | | | | 164,469 | | | | 194,808 | | | | — | | | | 470,077 | |
Investments in and advances to affiliates | | | 2,525,487 | | | | — | | | | — | | | | (2,525,487 | ) | | | — | |
Other assets | | | — | | | | 668 | | | | 5,558 | | | | — | | | | 6,226 | |
| | | | | | | | | | | | | | | | | | | | |
Total assets | | $ | 3,963,505 | | | $ | 1,069,252 | | | $ | 3,448,501 | | | $ | (2,525,487 | ) | | $ | 5,955,771 | |
| | | | | | | | | | | | | | | | | | | | |
Liabilities and shareholders’ equity | | | | | | | | | | | | | | | | | | | | |
Current liabilities | | $ | 118,522 | | | $ | 35,959 | | | $ | 123,686 | | | $ | — | | | $ | 278,167 | |
Long-term debt | | | 1,016,171 | | | | — | | | | 1,083,000 | | | | — | | | | 2,099,171 | |
Deferred income taxes | | | 105,531 | | | | 165,867 | | | | — | | | | — | | | | 271,398 | |
Other liabilities | | | 77,189 | | | | 67,197 | | | | 54,629 | | | | — | | | | 199,015 | |
Payable to parent | | | (461,928 | ) | | | 468,607 | | | | (6,679 | ) | | | — | | | | — | |
Commitments and contingencies | | | — | | | | — | | | | — | | | | — | | | | — | |
Preferred stock | | | 1,992,278 | | | | — | | | | — | | | | — | | | | 1,992,278 | |
Total shareholders’ equity | | | 1,115,742 | | | | 331,622 | | | | 2,193,865 | | | | (2,525,487 | ) | | | 1,115,742 | |
| | | | | | | | | | | | | | | | | | | | |
Total liabilities and shareholders’ equity | | $ | 3,963,505 | | | $ | 1,069,252 | | | $ | 3,448,501 | | | $ | (2,525,487 | ) | | $ | 5,955,771 | |
| | | | | | | | | | | | | | | | | | | | |
116
EXCO Resources, Inc.
Consolidating statement of operations
For the year ended December 31, 2008
| | | | | | | | | | | | | | | | | | | |
(in thousands) | | Resources | | | Guarantor
subsidiaries | | | Non-guarantor
subsidiaries | | | Eliminations | | Consolidated | |
Revenues: | | | | | | | | | | | | | | | | | | | |
Oil and natural gas | | $ | 393,026 | | | $ | 209,221 | | | $ | 802,579 | | | $ | — | | $ | 1,404,826 | |
Midstream | | | — | | | | — | | | | 85,432 | | | | — | | | 85,432 | |
| | | | | | | | | | | | | | | | | | | |
Total revenues | | | 393,026 | | | | 209,221 | | | | 888,011 | | | | — | | | 1,490,258 | |
| | | | | | | | | | | | | | | | | | | |
Costs and expenses: | | | | | | | | | | | | | | | | | | | |
Oil and natural gas production | | | 74,025 | | | | 37,149 | | | | 126,897 | | | | — | | | 238,071 | |
Midstream operating expenses | | | — | | | | — | | | | 82,797 | | | | — | | | 82,797 | |
Gathering and transportation | | | 233 | | | | 3,238 | | | | 10,735 | | | | — | | | 14,206 | |
Depreciation, depletion and amortization | | | 122,328 | | | | 65,461 | | | | 272,525 | | | | — | | | 460,314 | |
Write-down of oil and natural gas properties | | | 485,468 | | | | 717,628 | | | | 1,612,739 | | | | — | | | 2,815,835 | |
Accretion of discount on asset retirement obligations | | | 1,853 | | | | 2,921 | | | | 1,929 | | | | — | | | 6,703 | |
General and administrative | | | 15,266 | | | | 18,302 | | | | 54,000 | | | | — | | | 87,568 | |
| | | | | | | | | | | | | | | | | | | |
Total costs and expenses | | | 699,173 | | | | 844,699 | | | | 2,161,622 | | | | — | | | 3,705,494 | |
| | | | | | | | | | | | | | | | | | | |
Operating income (loss) | | | (306,147 | ) | | | (635,478 | ) | | | (1,273,611 | ) | | | — | | | (2,215,236 | ) |
| | | | | |
Other income (expense): | | | | | | | | | | | | | | | | | | | |
Interest expense | | | (77,563 | ) | | | — | | | | (84,075 | ) | | | — | | | (161,638 | ) |
Gain on derivative financial instruments | | | 254,756 | | | | (3,028 | ) | | | 132,661 | | | | — | | | 384,389 | |
Other income | | | 29,005 | | | | (24,625 | ) | | | (399 | ) | | | — | | | 3,981 | |
Equity in earnings of subsidiaries | | | (1,722,584 | ) | | | — | | | | — | | | | 1,722,584 | | | — | |
| | | | | | | | | | | | | | | | | | | |
Total other income (expense) | | | (1,516,386 | ) | | | (27,653 | ) | | | 48,187 | | | | 1,722,584 | | | 226,732 | |
| | | | | | | | | | | | | | | | | | | |
Income (loss) before income taxes | | | (1,822,533 | ) | | | (663,131 | ) | | | (1,225,424 | ) | | | 1,722,584 | | | (1,988,504 | ) |
Income tax benefit | | | (89,062 | ) | | | (165,971 | ) | | | — | | | | — | | | (255,033 | ) |
| | | | | | | | | | | | | | | | | | | |
Net income (loss) | | | (1,733,471 | ) | | | (497,160 | ) | | | (1,225,424 | ) | | | 1,722,584 | | | (1,733,471 | ) |
Preferred stock dividends | | | (76,997 | ) | | | — | | | | — | | | | — | | | (76,997 | ) |
| | | | | | | | | | | | | | | | | | | |
Net income (loss) available to common shareholders | | $ | (1,810,468 | ) | | $ | (497,160 | ) | | $ | (1,225,424 | ) | | $ | 1,722,584 | | $ | (1,810,468 | ) |
| | | | | | | | | | | | | | | | | | | |
117
EXCO Resources, Inc.
Consolidating statement of operations
For the year ended December 31, 2007
| | | | | | | | | | | | | | | | | | | | |
(in thousands) | | Resources | | | Guarantor
subsidiaries | | | Non-guarantor
subsidiaries | | | Eliminations | | | Consolidated | |
Revenues: | | | | | | | | | | | | | | | | | | | | |
Oil and natural gas | | $ | 224,846 | | | $ | 121,994 | | | $ | 528,947 | | | $ | — | | | $ | 875,787 | |
Midstream | | | — | | | | — | | | | 18,817 | | | | — | | | | 18,817 | |
| | | | | | | | | | | | | | | | | | | | |
Total revenues | | | 224,846 | | | | 121,994 | | | | 547,764 | | | | — | | | | 894,604 | |
| | | | | | | | | | | | | | | | | | | | |
Costs and expenses: | | | | | | | | | | | | | | | | | | | | |
Oil and natural gas production | | | 50,755 | | | | 24,838 | | | | 93,406 | | | | — | | | | 168,999 | |
Midstream operating expenses | | | — | | | | — | | | | 16,289 | | | | — | | | | 16,289 | |
Gathering and transportation | | | 610 | | | | 1,441 | | | | 8,159 | | | | — | | | | 10,210 | |
Depreciation, depletion and amortization | | | 70,767 | | | | 44,427 | | | | 260,226 | | | | — | | | | 375,420 | |
Accretion of discount on asset retirement obligations | | | 1,512 | | | | 1,946 | | | | 1,420 | | | | — | | | | 4,878 | |
General and administrative | | | 36,040 | | | | 10,962 | | | | 17,668 | | | | — | | | | 64,670 | |
| | | | | | | | | | | | | | | | | | | | |
Total costs and expenses | | | 159,684 | | | | 83,614 | | | | 397,168 | | | | — | | | | 640,466 | |
| | | | | | | | | | | | | | | | | | | | |
Operating income | | | 65,162 | | | | 38,380 | | | | 150,596 | | | | — | | | | 254,138 | |
| | | | | |
Other income (expense): | | | | | | | | | | | | | | | | | | | | |
Interest expense | | | (62,540 | ) | | | — | | | | (118,810 | ) | | | — | | | | (181,350 | ) |
Gain (loss) on derivative financial instruments | | | (25,788 | ) | | | (8,612 | ) | | | 61,207 | | | | — | | | | 26,807 | |
Other income (loss) | | | 35,574 | | | | (27,177 | ) | | | 1,760 | | | | — | | | | 10,157 | |
Equity in earnings of subsidiaries | | | 89,823 | | | | — | | | | — | | | | (89,823 | ) | | | — | |
| | | | | | | | | | | | | | | | | | | | |
Total other income (expense) | | | 37,069 | | | | (35,789 | ) | | | (55,843 | ) | | | (89,823 | ) | | | (144,386 | ) |
| | | | | | | | | | | | | | | | | | | | |
Income before income taxes | | | 102,231 | | | | 2,591 | | | | 94,753 | | | | (89,823 | ) | | | 109,752 | |
Income tax expense | | | 52,575 | | | | 7,521 | | | | — | | | | — | | | | 60,096 | |
| | | | | | | | | | | | | | | | | | | | |
Net income (loss) | | | 49,656 | | | | (4,930 | ) | | | 94,753 | | | | (89,823 | ) | | | 49,656 | |
Preferred stock dividends | | | (132,968 | ) | | | — | | | | — | | | | — | | | | (132,968 | ) |
| | | | | | | | | | | | | | | | | | | | |
Net income (loss) available to common shareholders | | $ | (83,312 | ) | | $ | (4,930 | ) | | $ | 94,753 | | | $ | (89,823 | ) | | $ | (83,312 | ) |
| | | | | | | | | | | | | | | | | | | | |
118
EXCO Resources, Inc.
Consolidating statement of operations
For the year ended December 31, 2006
| | | | | | | | | | | | | | | | | | | | |
| | | Resources | | | Guarantor
subsidiaries | | | Non-guarantor
subsidiaries | | | Eliminations | | | Consolidated | |
Revenues: | | | | | | | | | | | | | | | | | | | | |
Oil and natural gas | | $ | 175,056 | | | $ | 122,152 | | | $ | 62,027 | | | $ | — | | | $ | 359,235 | |
Midstream | | | — | | | | — | | | | 8,139 | | | | — | | | | 8,139 | |
| | | | | | | | | | | | | | | | | | | | |
Total revenues | | | 175,056 | | | | 122,152 | | | | 70,166 | | | | — | | | | 367,374 | |
| | | | | | | | | | | | | | | | | | | | |
Costs and expenses: | | | | | | | | | | | | | | | | | | | | |
Oil and natural gas production | | | 33,391 | | | | 20,590 | | | | 14,536 | | | | — | | | | 68,517 | |
Midstream operating expenses | | | — | | | | — | | | | 7,797 | | | | — | | | | 7,797 | |
Gathering and transportation | | | 549 | | | | 365 | | | | 701 | | | | — | | | | 1,615 | |
Depreciation, depletion and amortization | | | 67,122 | | | | 38,241 | | | | 30,359 | | | | — | | | | 135,722 | |
Accretion of discount on asset retirement obligations | | | 854 | | | | 941 | | | | 219 | | | | — | | | | 2,014 | |
General and administrative | | | 25,176 | | | | 11,121 | | | | 4,909 | | | | — | | | | 41,206 | |
| | | | | | | | | | | | | | | | | | | | |
Total costs and expenses | | | 127,092 | | | | 71,258 | | | | 58,521 | | | | — | | | | 256,871 | |
| | | | | | | | | | | | | | | | | | | | |
Operating income | | | 47,964 | | | | 50,894 | | | | 11,645 | | | | — | | | | 110,503 | |
| | | | | |
Other income (expense): | | | | | | | | | | | | | | | | | | | | |
Interest expense | | | (53,246 | ) | | | (28,607 | ) | | | (31,625 | ) | | | 28,607 | | | | (84,871 | ) |
Commodity price risk management activities | | | 84,349 | | | | 88,768 | | | | 25,547 | | | | — | | | | 198,664 | |
Other income (loss) | | | 30,909 | | | | 1,755 | | | | (1,591 | ) | | | (28,607 | ) | | | 2,466 | |
Equity in earnings of subsidiaries | | | 73,153 | | | | — | | | | — | | | | (71,560 | ) | | | 1,593 | |
| | | | | | | | | | | | | | | | | | | | |
Total other income (expense) | | | 135,165 | | | | 61,916 | | | | (7,669 | ) | | | (71,560 | ) | | | 117,852 | |
| | | | | | | | | | | | | | | | | | | | |
Income before income taxes | | | 183,129 | | | | 112,810 | | | | 3,976 | | | | (71,560 | ) | | | 228,355 | |
Income tax expense | | | 44,175 | | | | 45,226 | | | | — | | | | — | | | | 89,401 | |
| | | | | | | | | | | | | | | | | | | | |
Income (loss) | | $ | 138,954 | | | $ | 67,584 | | | $ | 3,976 | | | $ | (71,560 | ) | | $ | 138,954 | |
| | | | | | | | | | | | | | | | | | | | |
119
EXCO Resources, Inc.
Consolidating statement of cash flow
For the year ended December 31, 2008
| | | | | | | | | | | | | | | | | | | |
(in thousands) | | Resources | | | Guarantor
subsidiaries | | | Non-guarantor
subsidiaries | | | Eliminations | | Consolidated | |
Operating Activities: | | | | | | | | | | | | | | | | | | | |
Net cash provided by operating activities | | $ | 286,804 | | | $ | 116,991 | | | $ | 571,171 | | | $ | — | | $ | 974,966 | |
| | | | | | | | | | | | | | | | | | | |
Investing Activities: | | | | | | | | | | | | | | | | | | | |
Property and Midstream acquisitions and additions to oil and natural gas properties, gathering systems and equipment | | | (604,235 | ) | | | (212,185 | ) | | | (907,702 | ) | | | — | | | (1,724,122 | ) |
Proceeds from dispositions of property and equipment | | | 1,315 | | | | 13,425 | | | | 803 | | | | — | | | 15,543 | |
Advances/investments with affiliates | | | (67,897 | ) | | | 86,879 | | | | (18,982 | ) | | | — | | | — | |
| | | | | | | | | | | | | | | | | | | |
Net cash used in investing activities | | | (670,817 | ) | | | (111,881 | ) | | | (925,881 | ) | | | — | | | (1,708,579 | ) |
| | | | | | | | | | | | | | | | | | | |
Financing Activities: | | | | | | | | | | | | | | | | | | | |
Borrowings under credit agreements | | | 784,951 | | | | — | | | | 915,185 | | | | — | | | 1,700,136 | |
Repayments under credit agreements | | | (296,500 | ) | | | — | | | | (479,700 | ) | | | — | | | (776,200 | ) |
Settlement of derivative financial instruments with a financing element | | | (50,135 | ) | | | — | | | | (33,468 | ) | | | — | | | (83,603 | ) |
Proceeds from issuance of common stock, net | | | 14,777 | | | | — | | | | — | | | | — | | | 14,777 | |
Dividends on preferred stock | | | (82,827 | ) | | | — | | | | — | | | | — | | | (82,827 | ) |
Deferred financing costs and other | | | (705 | ) | | | — | | | | (36,336 | ) | | | — | | | (37,041 | ) |
| | | | | | | | | | | | | | | | | | | |
Net cash provided by financing activities | | | 369,561 | | | | — | | | | 365,681 | | | | — | | | 735,242 | |
| | | | | | | | | | | | | | | | | | | |
Net increase (decrease) in cash | | | (14,452 | ) | | | 5,110 | | | | 10,971 | | | | — | | | 1,629 | |
Cash at the beginning of the period | | | 23,069 | | | | 7,250 | | | | 25,191 | | | | — | | | 55,510 | |
| | | | | | | | | | | | | | | | | | | |
Cash at end of period | | $ | 8,617 | | | $ | 12,360 | | | $ | 36,162 | | | $ | — | | $ | 57,139 | |
| | | | | | | | | | | | | | | | | | | |
120
EXCO Resources, Inc.
Consolidating statement of cash flow
For the year ended December 31, 2007
| | | | | | | | | | | | | | | | | | | |
(in thousands) | | Resources | | | Guarantor
subsidiaries | | | Non-guarantor
subsidiaries | | | Eliminations | | Consolidated | |
Operating Activities: | | | | | | | | | | | | | | | | | | | |
Net cash provided by operating activities | | $ | 141,403 | | | $ | 69,223 | | | $ | 367,203 | | | $ | — | | $ | 577,829 | |
| | | | | | | | | | | | | | | | | | | |
Investing Activities: | | | | | | | | | | | | | | | | | | | |
Property and Midstream acquisitions and additions to oil and natural gas properties, gathering systems and equipment | | | (999,434 | ) | | | (68,154 | ) | | | (1,779,381 | ) | | | — | | | (2,846,969 | ) |
Proceeds from dispositions of property and equipment | | | 485,714 | | | | 354 | | | | 4,294 | | | | — | | | 490,362 | |
Advance payment on pending acquisition | | | (39,500 | ) | | | — | | | | — | | | | — | | | (39,500 | ) |
Proceeds from sales of marketable securities | | | 5,228 | | | | — | | | | — | | | | — | | | 5,228 | |
Other investing activities | | | — | | | | — | | | | (5,558 | ) | | | — | | | (5,558 | ) |
Advances/investments with affiliates | | | (1,648,245 | ) | | | (406 | ) | | | 1,648,651 | | | | — | | | — | |
| | | | | | | | | | | | | | | | | | | |
Net cash used in investing activities | | | (2,196,237 | ) | | | (68,206 | ) | | | (131,994 | ) | | | — | | | (2,396,437 | ) |
| | | | | | | | | | | | | | | | | | | |
Financing Activities: | | | | | | | | | | | | | | | | | | | |
Proceeds from long-term debt | | | 972,500 | | | | — | | | | 1,263,000 | | | | — | | | 2,235,500 | |
Payments on long-term debt | | | (751,000 | ) | | | — | | | | (1,470,532 | ) | | | — | | | (2,221,532 | ) |
Settlement of derivative financial instruments with a financing element | | | (11,578 | ) | | | — | | | | (2,636 | ) | | | — | | | (14,214 | ) |
Proceeds from issuance of common stock, net | | | 4,162 | | | | — | | | | — | | | | — | | | 4,162 | |
Proceeds from issuance of preferred stock, net | | | 1,992,273 | | | | — | | | | — | | | | — | | | 1,992,273 | |
Payment of preferred stock dividend | | | (127,134 | ) | | | — | | | | — | | | | — | | | (127,134 | ) |
Deferred financing costs and other | | | (7,850 | ) | | | — | | | | (9,909 | ) | | | — | | | (17,759 | ) |
| | | | | | | | | | | | | | | | | | | |
Net cash provided by (used in) financing activities | | | 2,071,373 | | | | — | | | | (220,077 | ) | | | — | | | 1,851,296 | |
| | | | | | | | | | | | | | | | | | | |
Net increase in cash | | | 16,539 | | | | 1,017 | | | | 15,132 | | | | — | | | 32,688 | |
Cash at the beginning of the period | | | 6,522 | | | | 6,233 | | | | 10,067 | | | | — | | | 22,822 | |
| | | | | | | | | | | | | | | | | | | |
Cash at end of period | | $ | 23,061 | | | $ | 7,250 | | | $ | 25,199 | | | $ | — | | $ | 55,510 | |
| | | | | | | | | | | | | | | | | | | |
121
EXCO Resources, Inc.
Consolidating statement of cash flow
For the year ended December 31, 2006
| | | | | | | | | | | | | | | | | | | |
(in thousands) | | Resources | | | Guarantor
subsidiaries | | | Non-guarantor
subsidiaries | | | Eliminations | | Consolidated | |
Operating Activities: | | | | | | | | | | | | | | | | | | | |
Net cash provided by operating activities | | $ | 94,535 | | | $ | 74,773 | | | $ | 58,351 | | | $ | — | | $ | 227,659 | |
| | | | | | | | | | | | | | | | | | | |
Investing Activities: | | | | | | | | | | | | | | | | | | | |
Additions to oil and natural gas properties, gathering systems and equipment | | | (146,077 | ) | | | (111,370 | ) | | | (176,719 | ) | | | — | | | (434,166 | ) |
Proceeds from dispositions of oil and natural gas properties | | | 4,556 | | | | 150 | | | | 1,118 | | | | — | | | 5,824 | |
Property and Midstream acquisitions | | | (171,126 | ) | | | 58,423 | | | | (1,170,472 | ) | | | — | | | (1,283,175 | ) |
Advance payment on probable acquisition | | | (80,000 | ) | | | — | | | | — | | | | — | | | (80,000 | ) |
| | | | | | | | | | | | | | | | | | | |
Net cash used in investing activities | | | (392,647 | ) | | | (52,797 | ) | | | (1,346,073 | ) | | | — | | | (1,791,517 | ) |
| | | | | | | | | | | | | | | | | | | |
Financing Activities: | | | | | | | | | | | | | | | | | | | |
Proceeds from long-term debt | | | 583,000 | | | | — | | | | 1,301,250 | | | | — | | | 1,884,250 | |
Payments on long-term debt | | | (1,102,751 | ) | | | (13,098 | ) | | | (11,000 | ) | | | — | | | (1,126,849 | ) |
Payments of hedges in conjunction with Power Gas Marketing & | | | | | | | | | | | | | | | | | | | |
Transmission, Inc. acquisition | | | — | | | | (38,098 | ) | | | — | | | | — | | | (38,098 | ) |
Proceeds from issuance of common stock, net | | | 657,381 | | | | — | | | | — | | | | — | | | 657,381 | |
Deferred financing costs and other | | | (1,117 | ) | | | — | | | | (15,840 | ) | | | — | | | (16,957 | ) |
| | | | | | | | | | | | | | | | | | | |
Net cash provided by (used in) financing activities | | | 136,513 | | | | (51,196 | ) | | | 1,274,410 | | | | — | | | 1,359,727 | |
| | | | | | | | | | | | | | | | | | | |
Net decrease in cash | | | (161,599 | ) | | | (29,220 | ) | | | (13,312 | ) | | | — | | | (204,131 | ) |
Cash at the beginning of the period | | | 168,121 | | | | 35,453 | | | | 23,379 | | | | — | | | 226,953 | |
| | | | | | | | | | | | | | | | | | | |
Cash at end of period | | $ | 6,522 | | | $ | 6,233 | | | $ | 10,067 | | | $ | — | | $ | 22,822 | |
| | | | | | | | | | | | | | | | | | | |
122
| 17. | Quarterly financial data (unaudited) |
The following are summarized quarterly financial data for the years ended December 31, 2008 and 2007:
| | | | | | | | | | | | | | | | |
| | | Quarter | |
(in thousands) | | 1st | | | 2nd | | | 3rd | | | 4th | |
2008 | | | | | | | | | | | | | | | | |
Total revenues | | $ | 332,735 | | | $ | 455,692 | | | $ | 429,411 | | | $ | 272,420 | |
Operating income (loss) | | | 136,036 | | | | 234,614 | | | | (1,007,879 | ) | | | (1,578,007 | ) |
Net loss available to common shareholders | | $ | (197,839 | ) | | $ | (297,914 | ) | | $ | (153,326 | ) | | $ | (1,161,389 | ) |
Basic earnings (loss) per share: | | | | | | | | | | | | | | | | |
Net loss | | $ | (1.89 | ) | | $ | (2.83 | ) | | $ | (0.80 | ) | | $ | (5.51 | ) |
Weighted average shares | | | 104,683 | | | | 105,253 | | | | 191,452 | | | | 210,944 | |
Diluted earnings (loss) per share: | | | | | | | | | | | | | | | | |
Net loss | | $ | (1.89 | ) | | $ | (2.83 | ) | | $ | (0.80 | ) | | $ | (5.51 | ) |
Weighted average shares | | | 104,683 | | | | 105,253 | | | | 191,452 | | | | 210,944 | |
2007 | | | | | | | | | | | | | | | | |
Total revenues | | $ | 124,905 | | | $ | 266,763 | | | $ | 232,748 | | | $ | 270,188 | |
Operating income | | | 24,600 | | | | 91,870 | | | | 53,090 | | | | 84,578 | |
Net income (loss) available to common shareholders | | $ | (88,833 | ) | | $ | 31,787 | | | $ | 10,729 | | | $ | (36,995 | ) |
Basic earnings (loss) per share: | | | | | | | | | | | | | | | | |
Net income (loss) | | $ | (0.85 | ) | | $ | 0.30 | | | $ | 0.10 | | | $ | (0.35 | ) |
Weighted average shares | | | 104,202 | | | | 104,313 | | | | 104,415 | | | | 104,522 | |
Diluted earnings (loss) per share: | | | | | | | | | | | | | | | | |
Net income (loss) | | $ | (0.85 | ) | | $ | 0.30 | | | $ | 0.10 | | | $ | (0.35 | ) |
Weighted average shares | | | 104,202 | | | | 106,909 | | | | 106,683 | | | | 104,522 | |
123
| 18. | Supplemental information relating to oil and natural gas producing activities (unaudited) |
Presented below are costs incurred in oil and natural gas property acquisition, exploration and development activities:
| | | |
(in thousands, except per unit amounts) | | Amount |
2008: | | | |
Proved property acquisition costs(1) | | $ | 604,723 |
Unproved property acquisition costs(2) | | | 87,170 |
| | | |
Total property acquisition costs | | | 691,893 |
Development | | | 581,747 |
Exploration costs(3) | | | 111,426 |
Lease acquisitions and other(4) | | | 187,134 |
Capitalized asset retirement costs | | | 19,182 |
Depreciation, depletion and amortization per Boe | | $ | 19.10 |
Depreciation, depletion and amortization per Mcfe | | $ | 3.18 |
2007: | | | |
Proved property acquisition costs(5) | | $ | 2,356,354 |
Unproved property acquisition costs(6) | | | 117,893 |
| | | |
Total property acquisition costs | | | 2,474,247 |
Development and exploration costs(3) | | | 446,675 |
Lease acquisitions and other | | | 21,415 |
Capitalized asset retirement costs | | | 5,127 |
Depreciation, depletion and amortization per Boe | | $ | 18.57 |
Depreciation, depletion and amortization per Mcfe | | $ | 3.10 |
2006: | | | |
Proved property acquisition costs(7) | | $ | 1,384,056 |
Unproved property acquisition costs(8) | | | 248,330 |
| | | |
Total property acquisition costs | | | 1,632,386 |
Development and exploration costs(3) | | | 194,312 |
Lease acquisitions and other | | | 8,991 |
Capitalized asset retirement costs | | | 21,681 |
Depreciation, depletion and amortization per Boe | | $ | 16.44 |
Depreciation, depletion and amortization per Mcfe | | $ | 2.74 |
| (1) | Includes $334.3 million and $199.2 million allocated to proved oil and natural gas properties in connection with the Appalachian Acquisition and the Danville Acquisition, respectively. |
| (2) | Includes $44.8 million and $42.4 million allocated to unproved oil and natural gas properties in connection with the Appalachian Acquisition and the Danville Acquisition, respectively. |
| (3) | Exploration costs incurred in 2008 included approximately $52.2 million in Appalachia (Marcellus shale resource play) and approximately $51.2 million in the Haynesville shale resource play in East Texas/North Louisiana. Exploration costs in 2007 and 2006 were not material. |
| (4) | Lease acquisitions in 2008 include approximately $84.0 million and $55.8 million to lease in the Marcellus and Haynesville shale resource plays, respectively. |
| (5) | Includes $1,417.8 million and $577.9 million allocated to proved oil and natural gas properties in connection with the Vernon and Southern Gas acquisitions, respectively. In addition, $201.2 million of proved property acquisitions have been included to reflect the purchase of the Southern Gas properties on May 2, 2007 which were sold to Crimson on May 8, 2007. |
| (6) | Includes $58.2 million and $4.7 million allocated to unproved oil and natural gas properties in connection with the Vernon and Southern Gas acquisitions, respectively. In addition, $34.3 million of unproved property acquisitions resulting from the purchase of Southern Gas properties on May 2, 2007 which were sold to Crimson on May 8, 2007. |
124
| (7) | Includes $489.1 million, $123.0 million and $583.7 million allocated to proved oil and natural gas properties in connection with the TXOK, PGMT and Winchester acquisitions, respectively. |
| (8) | Includes $60.8 million, $0.4 million and $154.3 million allocated to unproved oil and natural gas properties in connection with the TXOK, PGMT and Winchester acquisitions and $32.8 million of other purchase accounting acquisitions to unproved property acquisition costs, respectively. |
We retain independent engineering firms to provide annual year-end estimates of our future net recoverable oil and natural gas reserves. The estimated proved net recoverable reserves we show below include only those quantities that we expect to be commercially recoverable at prices and costs in effect at the balance sheet dates under existing regulatory practices and with conventional equipment and operating methods. Proved Developed Reserves represent only those reserves that we may recover through existing wells. Proved Undeveloped Reserves include those reserves that we may recover from new wells on undrilled acreage or from existing wells on which we must make a relatively major expenditure for recompletion or secondary recovery operations. All of our reserves are located onshore in the continental United States of America.
Discounted future cash flow estimates like those shown below are not intended to represent estimates of the fair value of our oil and natural gas properties. Estimates of fair value should also consider unproved reserves, anticipated future oil and natural gas prices, interest rates, changes in development and production costs and risks associated with future production. Because of these and other considerations, any estimate of fair value is subjective and imprecise.
Estimated Quantities of Proved Reserves
| | | | | | | | | |
(in thousands) | | Oil
(Bbls) | | | Natural
Gas (Mcf) | | | Mcfe(1) | |
December 31, 2005 | | 6,822 | | | 401,030 | | | 441,962 | |
Purchase of reserves in place | | 8,775 | | | 723,427 | | | 776,077 | |
New discoveries and extensions | | 2,018 | | | 80,832 | | | 92,940 | |
Revisions of previous estimates | | (487 | ) | | (33,467 | ) | | (36,389 | ) |
Production | | (916 | ) | | (44,123 | ) | | (49,619 | ) |
Sales of reserves in place | | (57 | ) | | (1,097 | ) | | (1,439 | ) |
| | | | | | | | | |
December 31, 2006 | | 16,155 | | | 1,126,602 | | | 1,223,532 | |
Purchase of reserves in place | | 10,500 | | | 770,567 | | | 833,567 | |
New discoveries and extensions(2) | | 2,469 | | | 178,248 | | | 193,062 | |
Revisions of previous estimates(3) | | (188 | ) | | (78,647 | ) | | (79,775 | ) |
Production | | (1,645 | ) | | (111,419 | ) | | (121,289 | ) |
Sales of reserves in place | | (6,361 | ) | | (145,801 | ) | | (183,967 | ) |
| | | | | | | | | |
December 31, 2007 | | 20,930 | | | 1,739,550 | | | 1,865,130 | |
Purchase of reserves in place | | 635 | | | 175,679 | | | 179,489 | |
New discoveries and extensions(4) | | 5,040 | | | 259,801 | | | 290,041 | |
Revisions of previous estimates(5) | | (3,467 | ) | | (223,620 | ) | | (244,422 | ) |
Production | | (2,236 | ) | | (131,159 | ) | | (144,575 | ) |
Sales of reserves in place | | (101 | ) | | (5,113 | ) | | (5,719 | ) |
| | | | | | | | | |
December 31, 2008 | | 20,801 | | | 1,815,138 | | | 1,939,944 | |
| | | | | | | | | |
Estimated Quantities of Proved Developed Reserves
| | | | | | |
(in thousands) | | Oil
(Bbls) | | Natural
Gas (Mcf) | | Mcfe(2) |
December 31, 2008 | | 14,815 | | 1,354,729 | | 1,443,619 |
December 31, 2007 | | 15,180 | | 1,228,736 | | 1,319,816 |
December 31, 2006 | | 11,290 | | 665,263 | | 733,003 |
| (1) | Mcfe—one thousand cubic feet equivalent calculated by converting on Bbl of oil to six Mcf of natural gas. |
125
| (2) | New discoveries and extensions between December 31, 2006 and December 31, 2007 include 114,980 Mmcfe in East Texas/North Louisiana, 43,271 Mmcfe in Appalachia, 28,608 Mmcfe in Permian and 6,203 Mmcfe in our other areas. |
| (3) | Revisions between December 31, 2006 and December 31, 2007 include a positive revision of 59,550 Mmcfe due to price changes and negative revisions totaling 139,325 Mmcfe due primarily to performance issues in Appalachia and East Texas/North Louisiana and cost increases, particularly in Appalachia. |
| (4) | New discoveries and extension between December 31, 2007 and December 31, 2008 include 167,381 Mmcfe in East Texas/North Louisiana, 67,161 Mmcfe in Appalachia, 34,833 Mmcfe in Permian and 20,666 Mmcfe in other areas. |
| (5) | Revisions between December 31, 2007 and December 31, 2008 include negative revisions of 107,457 Mmcfe due to price changes and negative revisions of 136,965 Mmcfe due to changes other than price, particularly in our Appalachia and Permian regions. |
Standardized measure of discounted future net cash flows
We have summarized the Standardized Measure related to our proved oil, natural gas, and NGL reserves. We have based the following summary on a valuation of Proved Reserves using discounted cash flows based on year-end prices, costs and economic conditions and a 10% discount rate. The additions to Proved Reserves from the purchase of reserves in place, and new discoveries and extensions could vary significantly from year to year; additionally, the impact of changes to reflect current prices and costs of reserves proved in prior years could also be significant. Accordingly, you should not view the information presented below as an estimate of the fair value of our oil and natural gas properties, nor should you consider the information indicative of any trends.
| | | |
(in thousands) | | Amount |
Year ended December 31, 2008: | | | |
Future cash inflows | | $ | 11,045,544 |
Future production costs | | | 3,650,402 |
Future development costs | | | 1,732,321 |
Future income taxes | | | 649,807 |
| | | |
Future net cash flows | | | 5,013,014 |
Discount of future net cash flows at 10% per annum | | | 2,776,720 |
| | | |
Standardized measure of discounted future net cash flows | | $ | 2,236,294 |
| | | |
Year ended December 31, 2007: | | | |
Future cash inflows | | $ | 13,562,925 |
Future production costs | | | 3,624,057 |
Future development costs | | | 1,491,801 |
Future income taxes | | | 1,857,530 |
| | | |
Future net cash flows | | | 6,589,537 |
Discount of future net cash flows at 10% per annum | | | 3,470,650 |
| | | |
Standardized measure of discounted future net cash flows | | $ | 3,118,887 |
| | | |
Year ended December 31, 2006: | | | |
Future cash inflows | | $ | 7,173,640 |
Future production costs | | | 2,192,022 |
Future development costs | | | 1,205,668 |
Future income taxes | | | 721,154 |
| | | |
Future net cash flows | | | 3,054,796 |
Discount of future net cash flows at 10% per annum | | | 1,743,021 |
| | | |
Standardized measure of discounted future net cash flows | | $ | 1,311,775 |
| | | |
126
During recent years, prices paid for oil and natural gas have fluctuated significantly. The spot prices at December 31, 2008, 2007 and 2006 used in the above table, were $44.60, $95.92 and $60.82 per Bbl of oil, respectively, and $5.71, $6.80 and $5.64 per Mmbtu of natural gas, respectively, in each case adjusted for historical differentials.
The following are the principal sources of change in the Standardized Measure:
| | | | |
(in thousands) | | | |
Year ended December 31, 2008: | | | | |
Sales and transfers of oil and natural gas produced, net of production costs | | $ | (1,156,723 | ) |
Net changes in prices and production costs | | | (857,254 | ) |
Extensions and discoveries, net of future development and production costs | | | 243,912 | |
Development costs during the period | | | 287,975 | |
Changes in estimated future development costs | | | (191,993 | ) |
Revisions of previous quantity estimates | | | (393,359 | ) |
Sales of reserves in place | | | (8,490 | ) |
Purchase of reserves in place | | | 203,707 | |
Accretion of discount before income taxes | | | 388,395 | |
Changes in timing and other | | | 11,460 | |
Net change in income taxes | | | 589,777 | |
| | | | |
Net change | | $ | (882,593 | ) |
| | | | |
Year ended December 31, 2007: | | | | |
Sales and transfers of oil and natural gas produced, net of production costs | | $ | (679,211 | ) |
Net changes in prices and production costs | | | 513,856 | |
Extensions and discoveries, net of future development and production costs | | | 461,961 | |
Development costs during the period | | | 446,675 | |
Changes in estimated future development costs | | | (125,395 | ) |
Revisions of previous quantity estimates | | | (175,857 | ) |
Sales of reserves in place | | | (298,328 | ) |
Purchase of reserves in place | | | 1,923,731 | |
Accretion of discount before income taxes | | | 156,736 | |
Changes in timing and other | | | 126,192 | |
Net change in income taxes | | | (543,248 | ) |
| | | | |
Net change | | $ | 1,807,112 | |
| | | | |
Year ended December 31, 2006: | | | | |
Sales and transfers of oil and natural gas produced, net of production costs | | $ | (286,906 | ) |
Net changes in prices and production costs | | | (541,139 | ) |
Extensions and discoveries, net of future development and production costs | | | 96,494 | |
Development costs during the period | | | 194,312 | |
Changes in estimated future development costs | | | (140,061 | ) |
Revisions of previous quantity estimates | | | (108,658 | ) |
Sales of reserves in place | | | (4,298 | ) |
Purchase of reserves in place | | | 991,548 | |
Accretion of discount before income taxes | | | 124,395 | |
Changes in timing and other | | | 23,900 | |
Net change in income taxes | | | 138,889 | |
| | | | |
Net change | | $ | 488,476 | |
| | | | |
127
| ITEM 9. | CHANGES IN AND DISAGREEMENTS WITH ACCOUNTANTS ON ACCOUNTING AND FINANCIAL DISCLOSURE |
None.
| ITEM 9A. CONTROLS | AND PROCEDURES |
Disclosure controls and procedures. Pursuant to Rule 13a-15(b) under the Exchange Act, management has evaluated, under the supervision and with the participation of our principal executive officer and principal financial officer, the effectiveness of the design and operation of our disclosure controls and procedures (as defined in Rules 13a-15(e) and 15d-15(e) of the Exchange Act), as of the end of the period covered by this report. Based on this evaluation, our principal executive officer and principal financial officer have concluded that EXCO’s disclosure controls and procedures were effective as of December 31, 2008 to ensure that information that is required to be disclosed by EXCO in the reports it files or submits under the Exchange Act is (i) recorded, processed, summarized and reported, within the time periods specified in the SEC’s rules and forms and (ii) accumulated and communicated to EXCO’s management, including our principal executive officer and principal financial officer, as appropriate to allow timely decisions regarding required disclosure.
Management’s report on internal control over financial reporting. EXCO’s management is responsible for establishing and maintaining adequate internal control over financial reporting (as defined in Rule 13a-15(f) or 15d-15(f) of the Exchange Act). Even an effective internal control system, no matter how well designed, has inherent limitations, including the possibility of human error and circumvention or overriding of controls and therefore can provide only reasonable assurance with respect to reliable financial reporting. Furthermore, the effectiveness of an internal control system in future periods can change with conditions. Management’s annual report of internal control over financial reporting and the audit report on our internal control over financial reporting of our independent registered public accounting firm, KPMG LLP, are included in Item 8 of this annual report on Form 10-K and are incorporated by reference herein.
Changes in internal control over financial reporting. EXCO’s management assessed the effectiveness of EXCO’s internal control over financial reporting as there were no changes in EXCO’s internal control over financial reporting that occurred during the fiscal quarter ended December 31, 2008 that have materially affected, or are reasonably likely to materially affect, EXCO’s internal control over financial reporting.
| ITEM 9B. OTHER | INFORMATION |
None.
PART III
| ITEM 10. DIRECTORS, | EXECUTIVE OFFICERS AND CORPORATE GOVERNANCE |
The information required in response to this Item 10 is incorporated herein by reference to our definitive proxy statement to be filed with the Securities and Exchange Commission pursuant to Regulation 14A of the Securities Exchange Act of 1934 not later than 120 days after the end of the fiscal year covered by this Annual Report on Form 10-K.
| ITEM 11. EXECUTIVE | COMPENSATION |
The information required in response to this Item 11 is incorporated herein by reference to our definitive proxy statement to be filed with the Securities and Exchange Commission pursuant to Regulation 14A of the Securities Exchange Act of 1934 not later than 120 days after the end of the fiscal year covered by this Annual Report on Form 10-K.
128
| ITEM 12. | SECURITY OWNERSHIP OF CERTAIN BENEFICIAL OWNERS AND MANAGEMENT AND RELATED STOCKHOLDER MATTERS |
The information required in response to this Item 12 is incorporated herein by reference to our definitive proxy statement to be filed with the Securities and Exchange Commission pursuant to Regulation 14A of the Securities Exchange Act of 1934 not later than 120 days after the end of the fiscal year covered by this Annual Report on Form 10-K.
| ITEM 13. | CERTAIN RELATIONSHIPS AND RELATED TRANSACTIONS AND DIRECTOR INDEPENDENCE |
The information required in response to this Item 13 is incorporated herein by reference to our definitive proxy statement to be filed with the Securities and Exchange Commission pursuant to Regulation 14A of the Securities Exchange Act of 1934 not later than 120 days after the end of the fiscal year covered by this Annual Report on Form 10-K.
| ITEM 14. | PRINCIPAL ACCOUNTANT FEES AND SERVICES |
The information required in response to this Item 14 is incorporated herein by reference to our definitive proxy statement to be filed with the Securities and Exchange Commission pursuant to Regulation 14A of the Securities Exchange Act of 1934 not later than 120 days after the end of the fiscal year covered by this Annual Report on Form 10-K.
PART IV
| ITEM 15. | EXHIBITS AND FINANCIAL STATEMENT SCHEDULES |
| | |
(a)(1) | | See Part II—Item 8. Financial Statements and Supplementary Data in this Annual Report on Form 10-K. |
| |
(a)(2) | | None. |
| |
(a)(3) | | See “Index to Exhibits” for a description of our exhibits. |
| |
(b) | | See “Index to Exhibits” for a description of our exhibits. |
| |
(c) | | None. |
129
SIGNATURE PAGE
Pursuant to the requirements of Section 13 or 15(d) of the Securities Exchange Act of 1934, the registrant has duly caused this report to be signed on its behalf by the undersigned, thereunto duly authorized.
| | | | |
Date: February 26, 2009 | | EXCO RESOURCES, INC. (Registrant) |
| | |
| | By: | | /s/ DOUGLAS H. MILLER |
| | | | Douglas H. Miller |
| | | | Chairman and Chief Executive Officer |
Pursuant to the requirements of the Securities Exchange Act of 1934, this report has been signed below by the following persons on behalf of the registrant and in the capacities and on the date indicated.
| | |
Date: February 26, 2009 | | /s/ DOUGLAS H. MILLER |
| | Douglas H. Miller
Director, Chairman and Chief Executive Officer |
| |
| | /s/ STEPHEN F. SMITH |
| | Stephen F. Smith
Director, Vice Chairman and President |
| |
| | /s/ J. DOUGLAS RAMSEY |
| | J. Douglas Ramsey
Vice President, Chief Financial Officer and Treasurer |
| |
| | /s/ MARK E. WILSON |
| | Mark E. Wilson
Vice President, Chief Accounting Officer and Controller |
| |
| | /s/ JEFFREY D. BENJAMIN |
| | Jeffrey D. Benjamin
Director |
| |
| | /s/ VINCENT J. CEBULA |
| | Vincent J. Cebula Director |
| |
| | /s/ EARL E. ELLIS |
| | Earl E. Ellis |
| | Director |
| |
| | /s/ B. JAMES FORD |
| | B. James Ford
Director |
| |
| | /s/ ROBERT H. NIEHAUS |
| | Robert H. Niehaus Director |
130
| | |
| | /s/ BOONE PICKENS |
| | Boone Pickens Director |
| |
| | /s/ JEFFREY S. SEROTA |
| | Jeffrey S. Serota Director |
| |
| | /s/ RAJATH SHOURIE |
| | Rajath Shourie Director |
| |
| | /s/ ROBERT L. STILLWELL |
| | Robert L. Stillwell Director |
131
SUPPLEMENTAL INFORMATION TO BE FURNISHED WITH REPORTS FILED
PURSUANT TO SECTION 15(d) OF THE ACT BY REGISTRANTS WHICH HAVE
NOT REGISTERED SECURITIES PURSUANT TO SECTION 12 OF THE ACT
Not applicable.
132
INDEX TO EXHIBITS
| | |
Exhibit
Number | | Description of Exhibits |
| 2.1 | | Merger Agreement, dated July 22, 2006, by and among Winchester Acquisition, LLC, Progress Fuels Corporation, Winchester Energy Company, Ltd., and WGC Holdco, LLC, filed as an Exhibit to EXCO’s Current Report on Form 8-K, dated July 22, 2006 and filed on July 25, 2006 and incorporated by reference herein. |
| |
| 2.2 | | First Amendment to Agreement and Plan of Merger, dated as of September 28, 2006, by and among Winchester Acquisition, LLC, Progress Fuels Corporation, Winchester Energy Company, Ltd., and WGC Holdco, LLC, filed as an Exhibit to EXCO’s Current Report on Form 8- K/A-Amendment No. 2, dated July 22, 2006 and filed on October 4, 2006 and incorporated by reference herein. |
| |
| 2.3 | | Purchase and Sale Agreement by and among Anadarko Petroleum Corporation and Anadarko Gathering Company, as Seller, and Vernon Holdings, LLC, as Purchaser, dated December 22, 2006, filed as an Exhibit to EXCO’s Pre-Effective Amendment No. 1 to the Registration Statement on Form S-1 (File No. 333-139568) filed on January 16, 2007 and incorporated by reference herein. |
| |
| 2.4 | | Purchase and Sale Agreement by and among EXCO Resources, Inc., as Purchaser, Anadarko Petroleum Corporation, Anadarko E&P Company, LP, Howell Petroleum Corporation and Kerr-McGee Oil & Gas Onshore LP, as Seller, dated February 1, 2007, filed as an Exhibit to EXCO’s Annual Report on Form 10-K filed on March 19, 2007 and incorporated by reference herein. |
| |
| 2.5 | | First Amendment to Purchase and Sale Agreement and Assignment of Partial Interest in the Purchase and Sale Agreement by and among Anadarko Petroleum Corporation, Anadarko Gathering Company, EXCO Partners Operating Partnership, LP (successor by merger to Vernon Holdings, LLC) and Vernon Gathering, LLC, dated March 30, 2007, filed as an Exhibit to EXCO’s Form 8-K dated March 28, 2007 and filed on April 2, 2007 and incorporated by reference herein. |
| |
| 2.6 | | First Amendment Letter Agreement by and among EXCO Resources, Inc., Southern G Holdings, LLC, Anadarko Petroleum Corporation, Anadarko E&P Company, LP, Howell Petroleum Corporation, and Kerr-McGee Oil & Gas Onshore LP, dated April 13, 2007, filed as an Exhibit to EXCO’s Form 8-K dated May 2, 2007 and filed on May 8, 2007 and incorporated by reference herein. |
| |
| 2.7 | | Second Amendment to Purchase and Sale Agreement, effective as of February 1, 2007, by and among Anadarko Petroleum Corporation, Anadarko E&P Company LP, Howell Petroleum Corporation, Kerr-McGee Oil & Gas Onshore LP, EXCO Resources, Inc. and Southern G Holdings, LLC, filed as an Exhibit to EXCO’s Form 8-K dated May 2, 2007 and filed on May 8, 2007 and incorporated by reference herein. |
| |
| 2.8 | | Third Amendment to Purchase and Sale Agreement and Assignment of Partial Interest in the Purchase and Sale Agreement, effective as of February 1, 2007, by and among Anadarko Petroleum Corporation, Anadarko E&P Company LP, Howell Petroleum Corporation, Kerr-McGee Oil & Gas Onshore LP, EXCO Resources, Inc. and Southern G Holdings, LLC, filed as an Exhibit to EXCO’s Form 8-K dated May 2, 2007 and filed on May 8, 2007 and incorporated by reference herein. |
| |
| 2.9 | | Membership Interest Purchase and Sale Agreement, dated May 8, 2007, by and among EXCO Resources, Inc., Southern G Holdings, LLC and Crimson Exploration Inc. and Crimson Exploration Operating, Inc., filed as an Exhibit to EXCO’s Form 8-K dated May 2, 2007 and filed on May 8, 2007 and incorporated by reference herein. |
| |
| 2.10 | | Asset Purchase Agreement, dated December 7, 2007, between EXCO Appalachia, Inc., as purchaser, and EOG Resources, Inc., EOG Resources Appalachian LLC and Energy Search, Incorporated, as sellers, filed as an Exhibit to EXCO’s Current Report on Form 8-K dated February 20, 2008 and filed on February 26, 2008 and incorporated by reference herein. |
133
| | |
Exhibit
Number | | Description of Exhibits |
| 2.11 | | First Amendment to Asset Purchase Agreement, dated February 20, 2008, between EXCO Appalachia, Inc., as purchaser, and EOG Resources, Inc., EOG Resources Appalachian LLC, and Energy Search, Incorporated, as sellers, filed as an exhibit to EXCO’s Current Report on Form 8-K dated February 20, 2008 and filed on February 26, 2008 and incorporated by reference herein. |
| |
| 3.1 | | Third Amended and Restated Articles of Incorporation of EXCO Resources, Inc., filed as an Exhibit to EXCO’s Current Report on Form 8-K, dated February 8, 2006 and filed on February 14, 2006 and incorporated by reference herein. |
| |
| 3.2 | | Amended and Restated Bylaws of EXCO Resources, Inc., filed as an Exhibit to EXCO’s Current Report on Form 8-K, dated November 14, 2007 and filed on November 16, 2007 and incorporated by reference herein. |
| |
| 3.3 | | Statement of Designation of Series A-1 7.0% Cumulative Convertible Perpetual Preferred Stock of EXCO Resources, Inc., filed as an Exhibit to EXCO’s Form 8-K dated March 28, 2007 and filed on April 2, 2007 and incorporated by reference herein. |
| |
| 3.4 | | Statement of Designation of Series A-2 7.0% Cumulative Convertible Perpetual Preferred Stock of EXCO Resources, Inc., filed as an Exhibit to EXCO’s Form 8-K dated March 28, 2007 and filed on April 2, 2007 and incorporated by reference herein. |
| |
| 3.5 | | Statement of Designation of Series B 7.0% Cumulative Convertible Perpetual Preferred Stock of EXCO Resources, Inc., filed as an Exhibit to EXCO’s Form 8-K dated March 28, 2007 and filed on April 2, 2007 and incorporated by reference herein. |
| |
| 3.6 | | Statement of Designation of Series C 7.0% Cumulative Convertible Perpetual Preferred Stock of EXCO Resources, Inc., filed as an Exhibit to EXCO’s Form 8-K dated March 28, 2007 and filed on April 2, 2007 and incorporated by reference herein. |
| |
| 3.7 | | Statement of Designation of Series A-1 Hybrid Preferred Stock of EXCO Resources, Inc., filed as an Exhibit to EXCO’s Form 8-K dated March 28, 2007 and filed on April 2, 2007 and incorporated by reference herein. |
| |
| 3.8 | | Statement of Designation of Series A-2 Hybrid Preferred Stock of EXCO Resources, Inc., filed as an Exhibit to EXCO’s Form 8-K dated March 28, 2007 and filed on April 2, 2007 and incorporated by reference herein. |
| |
| 4.1 | | Indenture among EXCO Resources, Inc., the Subsidiary Guarantors and Wilmington Trust Company, as Trustee, dated as of January 20, 2004, filed herewith. |
| |
| 4.2 | | First Supplemental Indenture by and among EXCO Resources, Inc., North Coast Energy, Inc., North Coast Energy Eastern, Inc. and Wilmington Trust Company, as Trustee, dated as of January 27, 2004, filed as an Exhibit to EXCO’s Registration Statement on Form S-4 filed March 25, 2004 and incorporated by reference herein. |
| |
| 4.3 | | Second Supplemental Indenture by and among EXCO Resources, Inc., Pinestone Resources, LLC and Wilmington Trust Company, as Trustee, filed as an Exhibit to EXCO’s Annual Report on Form 10-K for 2004 filed March 31, 2005 and incorporated by reference herein. |
| |
| 4.4 | | Third Supplemental Indenture by and among EXCO Resources, Inc., TXOK Acquisition, Inc. and Wilmington Trust Company, as Trustee, filed as an Exhibit to EXCO’s Current Report on Form 8-K filed on February 21, 2006 and incorporated by reference herein. |
| |
| 4.5 | | Form of 7 1/4% Global Note Due 2011, filed as an Exhibit to EXCO’s Pre-effective Amendment No. 1 to its Registration Statement on Form S-4 filed April 20, 2004 and incorporated by reference herein. |
134
| | |
Exhibit
Number | | Description of Exhibits |
| 4.6 | | Specimen Stock Certificate for EXCO’s common stock, filed as an Exhibit to EXCO’s Amendment No. 2 to the Form S-1 (File No. 333- 129935) filed on January 27, 2006 and incorporated by reference herein. |
| |
| 4.7 | | Fourth Supplemental Indenture, dated as of May 4, 2006, by and among EXCO Resources, Inc., Power Gas Marketing & Transmission, Inc. and Wilmington Trust Company, as Trustee, filed as an Exhibit to EXCO’s Current Report on Form 8-K, dated May 4, 2006 and filed on May 10, 2006 and incorporated by reference herein. |
| |
| 4.8 | | Fifth Supplemental Indenture, dated as of May 2, 2007, by and among EXCO Resources, Inc., Southern G Holdings, LLC and Wilmington Trust Company, as Trustee, filed as an Exhibit to EXCO’s Current Report on Form 8-K, dated May 2, 2007 and filed on May 8, 2007 and incorporated by reference herein. |
| |
| 4.9 | | Sixth Supplemental Indenture, dated as of February 12, 2008, by and among EXCO Resources, Inc., EXCO Services, Inc. and Wilmington Trust Company, as Trustee, filed as an exhibit to EXCO’s Annual Report on Form 10-K, filed on February 29, 2008 and incorporated by reference herein. |
| |
| 4.10 | | First Amended and Restated Registration Rights Agreement, by and among EXCO Holdings Inc. and the Initial Holders (as defined therein), effective January 5, 2006, filed as an Exhibit to EXCO’s Amendment No. 1 to its Registration Statement on Form S-1 (File No. 333-129935) filed on January 6, 2006 and incorporated by reference herein. |
| |
| 4.11 | | Registration Rights Agreement, dated March 28, 2007, by and among EXCO Resources, Inc. and the other parties thereto with respect to the 7.0% Cumulative Convertible Perpetual Preferred Stock and the Hybrid Preferred Stock, filed as an Exhibit to EXCO’s Form 8-K dated March 28, 2007 and filed on April 2, 2007 and incorporated by reference herein. |
| |
| 4.12 | | Registration Rights Agreement, dated March 28, 2007, by and among EXCO Resources, Inc. and the other parties thereto with respect to the Hybrid Preferred Stock, filed as an Exhibit to EXCO’s Form 8-K dated March 28, 2007 and filed on April 2, 2007 and incorporated by reference herein. |
| |
| 4.13 | | Seventh Supplemental Indenture, dated as of June 30, 2008, by and among EXCO Resources, Inc., EXCO-North Coast Energy, Inc. and Wilmington Trust Company, as Trustee, filed as an exhibit to EXCO’s Quarterly Report on Form 10-Q, filed on August 6, 2008 and incorporated by reference herein. |
| |
| 4.14 | | Eighth Supplemental Indenture, dated as of December 31, 2008, by and among EXCO Resources, Inc., EXCO Mid-Continent MLP, LLC and Wilmington Trust Company, as Trustee, filed herewith. |
| |
| 10.1 | | Indenture among EXCO Resources, Inc., the Subsidiary Guarantors and Wilmington Trust Company, as Trustee, dated as of January 20, 2004, filed herewith as Exhibit 4.1 and incorporated by reference herein. |
| |
| 10.2 | | First Supplemental Indenture by and among EXCO Resources, Inc., North Coast Energy, Inc., North Coast Energy Eastern, Inc. and Wilmington Trust Company, as Trustee, dated as of January 27, 2004, filed as an Exhibit to EXCO’s Registration Statement on Form S-4 filed March 25, 2004 and incorporated by reference herein. |
| |
| 10.3 | | Second Supplemental Indenture by and among EXCO Resources, Inc., Pinestone Resources, LLC and Wilmington Trust Company, as Trustee, dated as of December 21, 2004, filed as an Exhibit to EXCO’s Annual Report on Form 10-K for 2004 filed March 31, 2005 and incorporated by reference herein. |
| |
| 10.4 | | Third Supplemental Indenture by and among EXCO Resources, Inc., TXOK Acquisition, Inc. and Wilmington Trust Company, as Trustee, filed as an Exhibit to EXCO’s Current Report on Form 8-K/A-Amendment No. 1, dated February 8, 2006 and filed on February 21, 2006 and incorporated by reference herein. |
135
| | |
Exhibit
Number | | Description of Exhibits |
| 10.5 | | Fourth Supplemental Indenture, dated as of May 4, 2006, by and among EXCO Resources, Inc., Power Gas Marketing & Transmission, Inc. and Wilmington Trust Company, as Trustee, filed as an Exhibit to EXCO’s Current Report on Form 8-K, dated May 4, 2006 and filed on May 10, 2006 and incorporated by reference herein. |
| |
| 10.6 | | Form of 7 1/4% Global Note Due 2011, filed as an Exhibit to EXCO’s Pre-effective Amendment No. 1 to its Registration Statement on Form S-4 filed April 20, 2004 and incorporated by reference herein. |
| |
| 10.7 | | Amended and Restated Credit Agreement, dated as of March 17, 2006, among EXCO Resource, Inc. as Borrower, certain of its subsidiaries, as Guarantors, the Lenders defined therein, JPMorgan Chase Bank, N.A., as Administrative Agent, and J.P. Morgan Securities Inc., as Sole Bookrunner and Lead Manager, filed as an Exhibit to EXCO’s Current Report on Form 8-K, dated March 17, 2006 and filed on March 23, 2006 and incorporated by reference herein. |
| |
| 10.8 | | Amended and Restated 2005 Long-Term Incentive Plan, filed as an Exhibit to EXCO’s Current Report on Form 8-K, dated November 14, 2007 and filed on November 16, 2007 and incorporated by reference herein.* |
| |
| 10.9 | | Form of Incentive Stock Option Agreement for the EXCO Resources, Inc. 2005 Long-Term Incentive Plan, filed as an Exhibit to EXCO’s Current Report on Form 8-K, dated November 14, 2007 and filed on November 16, 2007 and incorporated by reference herein.* |
| |
| 10.10 | | Form of Nonqualified Stock Option Agreement for the EXCO Resources, Inc. 2005 Long-Term Incentive Plan, filed as an Exhibit to EXCO’s Current Report on Form 8-K, dated November 14, 2007 and filed on November 16, 2007 and incorporated by reference herein.* |
| |
| 10.11 | | Form of Restricted Stock Award Agreement for the EXCO Resources, Inc. 2005 Long-Term Incentive Plan, filed as an Exhibit to EXCO’s Registration Statement on Form S-8 (File No. 333-132551) filed on March 17, 2006 and incorporated by reference herein.* |
| |
| 10.12 | | Merger Agreement, dated July 22, 2006, by and among Winchester Acquisition, LLC, Progress Fuels Corporation, Winchester Energy Company, Ltd., and WGC Holdco, LLC., filed as an Exhibit to EXCO’s Current Report on Form 8-K, dated July 22, 2006 and filed on July 25, 2006 and incorporated by reference herein. |
| |
| 10.13 | | First Amendment to Agreement and Plan of Merger, dated as of September 28, 2006, by and among Winchester Acquisition, LLC, Progress Fuels Corporation, Winchester Energy Company, Ltd., and WGC Holdco, LLC, filed as an Exhibit to EXCO’s Current Report on Form 8-K/A-Amendment No. 2, dated July 22, 2006 and filed on October 4, 2006 and incorporated by reference herein. |
| |
| 10.14 | | Payment Performance Guaranty, dated July 22, 2006, by and between Progress Fuels Corporation and EXCO Resources, Inc., filed as an exhibit to EXCO’s Current Report on Form 8-K, dated July 22, 2006 and filed on July 24, 2006 and incorporated by reference herein. |
| |
| 10.15 | | Senior Revolving Credit Agreement, dated October 2, 2006, among EXCO Partners Operating Partnership, LP, certain of its subsidiaries, JPMorgan Chase Bank, N.A., as Administrative Agent, and the lenders party thereto, filed as an Exhibit to EXCO’s Current Report on Form 8-K/A-Amendment No. 2, dated July 22, 2006 and filed on October 4, 2006 and incorporated by reference herein. |
| |
| 10.16 | | First Amendment to Credit Agreement, dated October 2, 2006, among EXCO Resources, Inc., certain of its subsidiaries, JPMorgan Chase Bank, N.A., as Administrative Agent, and the lenders party thereto, filed as an Exhibit to EXCO’s Current Report on Form 8-K/A-Amendment No. 2, dated July 22, 2006 and filed on October 4, 2006 and incorporated by reference herein. |
136
| | |
Exhibit
Number | | Description of Exhibits |
| 10.17 | | Amended and Restated Equity Contribution Agreement, dated October 4, 2006, among EXCO Resources, Inc., EXCO Partners Operating Partnership, LP, and JPMorgan Chase Bank, N.A., as Administrative Agent, filed as an Exhibit to EXCO’s Current Report on Form 8-K/A-Amendment No. 2, dated July 22, 2006 and filed on October 4, 2006 and incorporated by reference herein. |
| |
| 10.18 | | Senior Term Credit Agreement, dated October 2, 2006, as amended and restated as of October 13, 2006, among EXCO Partners Operating Partnership, LP, certain of its subsidiaries, JPMorgan Chase Bank, N.A., as Administrative Agent, and the lenders party thereto, filed as an Exhibit to EXCO’s Current Report on Form 8-K/A-Amendment No. 3, dated July 22, 2006 and filed on October 19, 2006 and incorporated by reference herein. |
| |
| 10.19 | | Second Amended and Restated Equity Contribution Agreement, dated October 13, 2006, among EXCO Resources, Inc., EXCO Partners Operating Partnership, LP, and JPMorgan Chase Bank, N.A., as Administrative Agent, filed as an Exhibit to EXCO’s Current Report on Form 8-K/A-Amendment No. 3, dated July 22, 2006 and filed on October 19, 2006 and incorporated by reference herein. |
| |
| 10.20 | | Third Amended and Restated EXCO Resources, Inc. Severance Plan, filed as an Exhibit to EXCO’s Current Report on Form 8-K, dated November 14, 2007 and filed on November 16, 2007 and incorporated by reference herein.* |
| |
| 10.21 | | Amended and Restated 2007 Director Plan of EXCO Resources, Inc., filed as an Exhibit to EXCO’s Current Report on Form 8-K, dated November 14, 2007 and filed on November 16, 2007 and incorporated by reference herein. |
| |
| 10.22 | | Purchase and Sale Agreement by and among Anadarko Petroleum Corporation and Anadarko Gathering Company, as Seller, and Vernon Holdings, LLC, as Purchaser, dated December 22, 2006, filed as an Exhibit to EXCO’s Pre-Effective Amendment No. 1 to the Registration Statement on Form S-1 (File No. 333-139568) filed on January 16, 2007 and incorporated by reference herein. |
| |
| 10.23 | | First Amendment to Purchase and Sale Agreement and Assignment of Partial Interest in the Purchase and Sale Agreement by and among Anadarko Petroleum Corporation, Anadarko Gathering Company, EXCO Partners Operating Partnership, LP (successor by merger to Vernon Holdings, LLC) and Vernon Gathering, LLC, dated March 30, 2007, filed as an Exhibit to EXCO’s Form 8-K dated March 28, 2007 and filed on April 2, 2007 and incorporated by reference herein. |
| |
| 10.24 | | Guaranty dated December 22, 2006 by EXCO Resources, Inc. in favor of Anadarko Petroleum Corporation and Anadarko Gathering Company, filed as an Exhibit to EXCO’s Pre-Effective Amendment No. 1 to the Registration Statement on Form S-1 (File No. 333-139568) filed on January 16, 2007 and incorporated by reference herein. |
| |
| 10.25 | | Purchase and Sale Agreement by and among EXCO Resources, Inc., Anadarko Petroleum Corporation, Anadarko E&P Company, LP, Howell Petroleum Corporation, and Kerr-McGee Oil & Gas Onshore LP, dated February 1, 2007, filed as an Exhibit to EXCO’s Annual Report on Form 10-K filed on March 19, 2007 and incorporated by reference herein. |
| |
| 10.26 | | First Amendment to Credit Agreement effective as of December 31, 2006 among EXCO Partners Operating Partnership, LP, certain of its subsidiaries, JPMorgan Chase Bank, N.A., as Administrative Agent, and the lenders party thereto, filed as an exhibit to EXCO’s Current Report on Form 8-K, dated March 8, 2007 and filed March 13, 2007 and incorporated by reference herein. |
| |
| 10.27 | | Preferred Stock Purchase Agreement, dated March 28, 2007, by and among EXCO Resources, Inc. and the other parties thereto filed as an Exhibit to EXCO’s Form 8-K dated March 28, 2007 and filed on April 2, 2007 and incorporated by reference herein. |
| |
| 10.28 | | Letter Agreement, dated March 28, 2007, with OCM Principal Opportunities Fund IV, L.P. and OCM EXCO Holdings, LLC, filed as an Exhibit to EXCO’s Form 8-K dated March 28, 2007 and filed on April 2, 2007 and incorporated by reference herein.* |
137
| | |
Exhibit
Number | | Description of Exhibits |
| 10.29 | | Letter Agreement, dated March 28, 2007, with Ares Corporate Opportunities Fund, ACOF EXCO, L.P., ACOF EXCO 892 Investors, L.P., Ares Corporate Opportunities Fund II, L.P., Ares EXCO, L.P. and Ares EXCO 892 Investors, L.P, filed as an Exhibit to EXCO’s Form 8-K dated March 28, 2007 and filed on April 2, 2007 and incorporated by reference herein. |
| |
| 10.30 | | Amended and Restated Credit Agreement, dated as of March 30, 2007, among EXCO Partners Operating Partnership, LP, as Borrower, certain subsidiaries of Borrower, as Guarantors, the lenders party thereto, JPMorgan Chase Bank, N.A., as Administrative Agent, and J.P. Morgan Securities Inc., as Sole Bookrunner and Lead Arranger, filed as an Exhibit to EXCO’s Form 8-K dated March 28, 2007 and filed on April 2, 2007 and incorporated by reference herein. |
| |
| 10.31 | | Registration Rights Agreement, dated March 28, 2007, by and among EXCO Resources, Inc. and the other parties thereto with respect to the 7.0% Cumulative Convertible Perpetual Preferred Stock and the Hybrid Preferred Stock, filed as an Exhibit to EXCO’s Form 8-K dated March 28, 2007 and filed on April 2, 2007 and incorporated by reference herein. |
| |
| 10.32 | | Registration Rights Agreement, dated March 28, 2007, by and among EXCO Resources, Inc. and the other parties thereto with respect to the Hybrid Preferred Stock, filed as an Exhibit to EXCO’s Form 8-K dated March 28, 2007 and filed on April 2, 2007 and incorporated by reference herein. |
| |
| 10.33 | | First Amendment to Letter Agreement by and among EXCO Resources, Inc., Southern G Holdings, LLC, Anadarko Petroleum Corporation, Anadarko E&P Company, LP, Howell Petroleum Corporation, and Kerr-McGee Oil & Gas Onshore LP, dated April 13, 2007, filed as an Exhibit to EXCO’s Form 8-K dated May 2, 2007 and filed on May 8, 2007 and incorporated by reference herein. |
| |
| 10.34 | | Second Amended and Restated Credit Agreement, dated as of May 2, 2007, among EXCO Resources, Inc. as Borrower, certain of its subsidiaries, as Guarantors, the Lenders defined therein, JPMorgan Chase Bank, N.A., as Administrative Agent, and J.P. Morgan Securities Inc., as Sole Bookrunner and Lead Arranger, filed as an Exhibit to EXCO’s Form 8-K dated May 2, 2007 and filed on May 8, 2007 and incorporated by reference herein. |
| |
| 10.35 | | Fifth Supplemental Indenture, dated as of May 2, 2007, by and among EXCO Resources, Inc., Southern G Holdings, LLC and Wilmington Trust Company, as Trustee, filed as an Exhibit to EXCO’s Current Report on Form 8-K, dated May 2, 2007 and filed on May 8, 2007 and incorporated by reference herein. |
| |
| 10.36 | | Second Amendment to Purchase and Sale Agreement, effective as of February 1, 2007, by and among Anadarko Petroleum Corporation, Anadarko E&P Company LP, Howell Petroleum Corporation, Kerr-McGee Oil & Gas Onshore LP, EXCO Resources, Inc. and Southern G Holdings, LLC, filed as an Exhibit to EXCO’s Form 8-K dated May 2, 2007 and filed on May 8, 2007 and incorporated by reference herein. |
| |
| 10.37 | | Third Amendment to Purchase and Sale Agreement and Assignment of Partial Interest in the Purchase and Sale Agreement, effective as of February 1, 2007, by and among Anadarko Petroleum Corporation, Anadarko E&P Company LP, Howell Petroleum Corporation, Kerr-McGee Oil & Gas Onshore LP, EXCO Resources, Inc. and Southern G Holdings, LLC, filed as an Exhibit to EXCO’s Form 8-K dated May 2, 2007 and filed on May 8, 2007 and incorporated by reference herein. |
| |
| 10.38 | | Membership Interest Purchase and Sale Agreement, dated May 8, 2007, by and among EXCO Resources, Inc., Southern G Holdings, LLC, Crimson Exploration Inc. and Crimson Exploration Operating, Inc., filed as an Exhibit to EXCO’s Form 8-K dated May 2, 2007 and filed on May 8, 2007 and incorporated by reference herein. |
138
| | |
Exhibit
Number | | Description of Exhibits |
| 10.39 | | Purchase Agreement, effective August 15, 2007, between OCM GW Holdings, LLC and EXCO Resources, Inc., filed as an Exhibit to EXCO’s Current Report on Form 8-K, dated August 15, 2007 and filed on August 21, 2007 and incorporated by reference herein. |
| |
| 10.40 | | Asset Purchase Agreement, dated December 7, 2007, between EXCO Appalachia, Inc., as purchaser, and EOG Resources, Inc., EOG Resources Appalachian LLC and Energy Search, Incorporated, as sellers, filed as an Exhibit to EXCO’s Current Report on Form 8-K dated February 20, 2008 and filed on February 26, 2008 and incorporated by reference herein. |
| |
| 10.41 | | Sixth Supplemental Indenture, dated as of February 12, 2008, by and among EXCO Resources, Inc., EXCO Services, Inc. and Wilmington Trust Company, as Trustee, filed as an exhibit to EXCO’s Annual Report on Form 10-K, filed on February 29, 2008 and incorporated by reference herein. |
| |
| 10.42 | | Counterpart Agreement, dated February 4, 2008, to that Certain Second Amended and Restated Credit Agreement, dated May 2, 2007, among EXCO Resources, Inc., as Borrower, and certain subsidiaries of Borrower and the lender parties thereto, filed as an exhibit to EXCO’s Annual Report on Form 10-K, filed on February 29, 2008 and incorporated by reference herein. |
| |
| 10.43 | | First Amendment to Second Amended and Restated Credit Agreement, dated as of February 20, 2008, by and among EXCO Resources, Inc., as Borrower, certain of its subsidiaries, as Guarantors, the Lenders defined herein, and JP Morgan Chase Bank, N.A., as Administrative Agent, filed as an Exhibit to EXCO’s Current Report on Form 8-K, dated February 20, 2008 and filed on February 26, 2008 and incorporated by reference herein. |
| |
| 10.44 | | First Amendment to Amended and Restated Credit Agreement, dated as of February 20, 2008, by and among EXCO Partners Operating Partnership, LP, as Borrower, certain of its subsidiaries, as Guarantors, the Lenders defined therein and JP Morgan Chase Bank, N.A., as Administrative Agent, filed as an exhibit to EXCO’s Current Report on Form 8-K, dated February 20, 2008 and filed on February 26, 2008 and incorporated by reference herein. |
| |
| 10.45 | | First Amendment to Asset Purchase Agreement, dated February 20, 2008, between EXCO Appalachia, Inc., as purchaser, and EOG Resources, Inc., EOG Resources Appalachian LLC, and Energy Search, Incorporated, as sellers, filed as an exhibit to EXCO’s Current Report on Form 8-K dated February 20, 2008 and filed on February 26, 2008 and incorporated by reference herein. |
| |
| 10.46 | | Senior Unsecured Term Credit Agreement, dated as of July 15, 2008, among EXCO Operating Company, LP as borrower, and certain of its subsidiaries, as guarantors, and JPMorgan Chase Bank, N.A. as administrative agent, and the lenders signatories thereto, filed as an exhibit to EXCO’s Current Report on Form 8-K, dated July 14, 2008 and filed on July 16, 2008 and incorporated by reference herein. |
| |
| 10.47 | | Second Amendment to Amended and Restated Credit Agreement, dated as of July 14, 2008, among EXCO Operating Company, LP, as borrower, and certain of its subsidiaries, as guarantors, and JPMorgan Chase Bank, N.A., as administrative agent, and the lenders signatories thereto, filed as an exhibit to EXCO’s Current Report on Form 8-K, dated July 14, 2008 and filed on July 16, 2008 and incorporated by reference herein. |
| |
| 10.48 | | Second Amendment to Second Amended and Restated Credit Agreement, dated as of July 14, 2008 and effective as of June 30, 2008, among EXCO Resources, Inc., as borrower, and certain of its subsidiaries, as guarantors, and JPMorgan Chase Bank, N.A., as administrative agent, and the lenders signatories thereto, filed as an exhibit to EXCO’s Current Report on Form 8-K, dated July 14, 2008 and filed on July 16, 2008 and incorporated by reference herein. |
| |
| 10.49 | | Seventh Supplemental Indenture, dated as of June 30, 2008, by and among EXCO Resources, Inc., EXCO-North Coast Energy, Inc. and Wilmington Trust Company, as Trustee, filed as an exhibit to EXCO’s Quarterly Report on Form 10-Q, filed on August 6, 2008 and incorporated by reference herein. |
139
| | |
Exhibit
Number | | Description of Exhibits |
| 10.50 | | Third Amendment to Amended and Restated Credit Agreement, dated as of December 1, 2008, among EXCO Operating Company, LP, as borrower, and certain of its subsidiaries, as guarantors, and JPMorgan Chase Bank, N.A., as administrative agent, and the lenders signatories thereto, filed as an exhibit to EXCO’s Current Report on Form 8-K, dated December 1, 2008 and filed on December 5, 2008 and incorporated by reference herein. |
| |
| 10.51 | | Senior Unsecured Term Credit Agreement, dated as of December 8, 2008, among EXCO Operating Company, LP, as borrower, and certain of its subsidiaries, as guarantors, and JPMorgan Chase Bank, N.A. as administrative agent, J.P. Morgan Securities Inc., as sole bookrunner and lead arranger, and the lenders signatories thereto, filed as an exhibit to EXCO’s Current Report on Form 8-K, dated December 8, 2008 and filed on December 8, 2008 and incorporated by reference herein. |
| |
| 10.52 | | Third Amendment to Second Amended and Restated Credit Agreement, dated as of February 4, 2009, among EXCO Resources, Inc., as borrower, and certain of its subsidiaries, as guarantors, and JPMorgran Chase Bank, N.A., as administrative agent, and the lenders signatories thereto, filed as an exhibit to EXCO’s Current Report on Form 8-K, dated February 4, 2009 and filed on February 5, 2009 and incorporated by reference herein. |
| |
| 10.53 | | Eighth Supplemental Indenture, dated as of December 31, 2008, by and among EXCO Resources, Inc., EXCO Mid-Continent MLP, LLC and Wilmington Trust Company, as Trustee, filed herewith as Exhibit 4.14 and incorporated by reference herein. |
| |
| 14.1 | | Code of Ethics for the Chief Executive Officer and Senior Financial Officers, filed as an Exhibit to EXCO’s Amendment No. 1 to its Registration Statement on Form S-1 (File No. 333-129935) filed January 6, 2006 and incorporated by reference herein. |
| |
| 14.2 | | Code of Business Conduct and Ethics for Directors, Officers and Employees, filed as an Exhibit to EXCO’s Amendment No. 1 to its Registration Statement on Form S-1 (File No. 333-129935) filed January 6, 2006 and incorporated by reference herein. |
| |
| 14.3 | | Amendment No. 1 to EXCO Resources, Inc. Code of Business Conduct and Ethics for Directors, Officers and Employees, filed as an Exhibit to EXCO’s Current Report on Form 8-K, dated November 8, 2006 and filed on November 9, 2006 and incorporated by reference herein. |
| |
| 21.1 | | Subsidiaries of the registrant, filed herewith. |
| |
| 23.1 | | Consent of KPMG LLP, filed herewith. |
| |
| 23.2 | | Consent of Lee Keeling and Associates, Inc., filed herewith. |
| |
| 31.1 | | Certification pursuant to Section 302 of the Sarbanes-Oxley Act of 2002 of Chief Executive Officer of EXCO Resources, Inc., filed herewith. |
| |
| 31.2 | | Certification pursuant to Section 302 of the Sarbanes-Oxley Act of 2002 of Chief Financial Officer of EXCO Resources, Inc., filed herewith. |
| |
| 31.3 | | Certification pursuant to Section 302 of the Sarbanes-Oxley Act of 2002 of Chief Accounting Officer of EXCO Resources, Inc., filed herewith. |
| |
| 32.1 | | Certification pursuant to Section 906 of the Sarbanes-Oxley Act of 2002 of Chief Executive Officer and Chief Financial Officer of EXCO Resources, Inc., filed herewith. |
| |
| 99.1 | | Audit Committee Charter, filed as an Exhibit to EXCO’s Form 8-K filed November 24, 2004 and incorporated by reference herein. |
| * | These exhibits are management contracts. |
140