UNITED STATES
SECURITIES AND EXCHANGE COMMISSION
Washington, D.C. 20549
FORM N-CSR
CERTIFIED SHAREHOLDER REPORT OF REGISTERED
MANAGEMENT INVESTMENT COMPANIES
Investment Company Act file number 811-03056
TRIDAN CORP.
(Exact name of registrant as specified in charter)
c/o PKF O’Connor Davies
300 Tice Boulevard, Suite 315, Woodcliff Lake, NJ 07677
(Address of principal executive offices)
c/o PKF O’Connor Davies
300 Tice Boulevard, Suite 315, Woodcliff Lake, NJ 07677
(Name and address of agent for service)
Registrant’s telephone number, including area code: (201) 712-9800
Date of fiscal year end: April 30, 2023
Date of reporting period: April 30, 2023
| Item 1. | Reports to Stockholders. |
(a) Attached on the following pages is a copy of the registrant’s annual report as of April 30, 2023 transmitted to stockholders.
TRIDAN CORP.
P.O. Box 634, New City, N.Y. 10956
(212) 239-0515
ANNUAL REPORT
June 28, 2023
Dear Shareholder:
I am pleased to provide this annual report of Tridan Corp. for the fiscal year ended April 30, 2023, including the enclosed audited financial report for that period and for the corresponding period in 2022. Also enclosed are the notice of meeting, proxy statement for this year’s annual shareholders meeting on July 18, 2023, form of proxy, and the company’s privacy policy.
Fiscal Year Ended April 2023 Muni Market Review
Market Update: The Fed met in early May and raised the Federal Funds rate 25bps Range is now 5.00%-5.25% range. The combination of rate hikes, quantitative tightening, and tighter lending standards – a byproduct of the banking crisis – Tridan’s investment adviser, J.P. Morgan Investment Management, Inc. (the “Adviser” or “JPM”) believes will slow the economy and cool inflation longer term. The Adviser places a high probability of recession later this year potentially leading to Fed rate cuts; as of May 8th, the market was pricing in over two cuts by year end. Most inflation components continue to trend lower, with CPI down from a high of 8.2% in September to 4.9% in April.
Munis: The broad muni index returned -0.23% in April as rates moved marginally higher. The 12 to 22-year portion of the curve, where steepest, outperformed as did A and BBB rated bonds which offered more coupon cushion. Muni yields rose across the curve with short rates, with the Fed still in play, rising the most.
Valuations: The lack of a consistent calendar amid strong retail demand has kept ratios rich through ten years. Municipal ratios of 60% approximate the breakeven between treasuries and municipals for most high-income taxpayers. The slope of the municipal curve is inverted 31bps between 2 and 10 years while the pickup between 10 and 20 years is 82bps.
Supply and Flows: April municipal supply totaled $32 billion, down 26% vs. April of 2022. Year-to-date, $109 billion was priced, down 28% year-over-year, with taxable issuance of $16 billion, down 50%, taking the biggest hit with rates up and refundings out of the money. New money issuance at 76% of supply is up from the average of 67% over the prior five years. The Adviser believes issuance will be heavier in the second half of the year, given the current uncertainty around the debt ceiling and the potential for lower funding costs as the economy slows and inflation tempers. Net supply was $6 billion in April and was about -$20 billion year-to-date. Notwithstanding an unexpected blip in issuance, the Adviser expects net supply to be -$32 billion between now and August, a positive tailwind for performance. Given their view on rates and positive seasonals going into summer, the Adviser notes that extending duration now and avoid the potentially rich summer months may be reasonable. 2023 supply is still estimated to be $375 billion though street estimates range from $300 billion to $400 billion.
TRIDAN CORP.
June 28, 2023
Page – 2 –
Year-to-date mutual fund and ETF outflows total -$5.9 billion, with over $6 billion flowing out of mutual funds. In April, most flows came out of money market, short and long funds. Tax exempt money market fund flows have been volatile as money has been shifting in response to relative value vs. treasury funds (page 5). SIFMA ranged from a low of 1.66% to a high of 4.35% in March and ended April at 3.86%.
Credit: Credit quality should remain generally stable given the credit cushion provided by high budget reserves and unspent pandemic funds, which should help offset budgetary pressure from a slowing economy. Credit headwinds from labor shortages and high inflation will continue to put pressure on some sectors like healthcare and higher education, opening up opportunities to buy some credits at wider spreads. Bankruptcies and default rates should remain low and concentrated in the higher risk credits like single site hospitals, senior living facilities, and industrial development bonds.
Outlook: In 2023, municipals should continue to see solid performance supported by light supply, which the Adviser estimates at $375 billion, strong demand given higher yields and a Fed that is closer to the end of the hiking cycle. The Adviser expects bouts of volatility over the year which will afford opportunities to add in A and BBB rated paper, lower coupons, certain sectors like healthcare and education and less widely held bonds.
Performance of the Tridan Fund:
For the period ended April 30, 2023 the trailing 1-year gross of fees performance of the Fund was 3.63% vs. 4.07% for the index (Bloomberg NY Cmp Int Muni (1-17) Benchmark). For additional context, as of the date from our last Board meeting with performance through February 28, 2023 the trailing one year performance was -2.28% vs -2.63% for the index.
Performance was positive for the trailing 1-year period ended April 30, 2023 even with rates being higher across the curve for the period ended April 30, 2023, led by the front end of the curve (see US Treasury yield table below). Over the past two months rates moved higher and the Adviser had extended Tridan’s duration to be slightly longer than the benchmark, in addition over that same time period the down-in-quality municipal bonds outperformed. Tridan has an up-in-credit quality bias based on guidelines. These two factors caused the underperformance versus the benchmark for the trailing year ended April 30, 2023.
TRIDAN CORP.
June 28, 2023
Page – 3 –
U.S. Treasury Curve Yields

| | | | | | | | | | | | |
| | | Apr 30 23 | | | April 30 22 | | | Change y/y | |
3-month | | | 5.06 | % | | | 0.83 | % | | | 4.23 | % |
6-month | | | 5.02 | % | | | 1.41 | % | | | 3.61 | % |
1-year | | | 4.76 | % | | | 2.07 | % | | | 2.69 | % |
2-year | | | 4.01 | % | | | 2.72 | % | | | 1.29 | % |
3-year | | | 3.72 | % | | | 2.89 | % | | | 0.83 | % |
5-year | | | 3.49 | % | | | 2.96 | % | | | 0.53 | % |
7-year | | | 3.46 | % | | | 2.98 | % | | | 0.48 | % |
10-year | | | 3.43 | % | | | 2.94 | % | | | 0.49 | % |
30-year | | | 3.68 | % | | | 3.00 | % | | | 0.68 | % |

TRIDAN CORP.
June 28, 2023
Page – 4 –
Yields remain attractive and ratios volatile
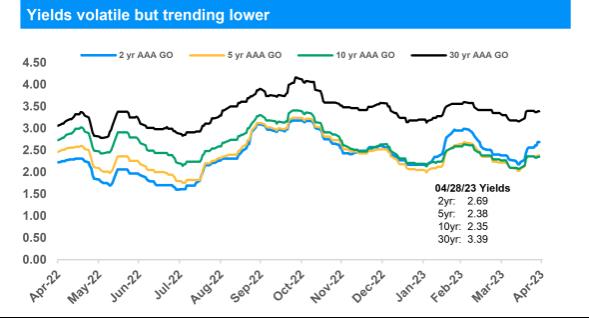
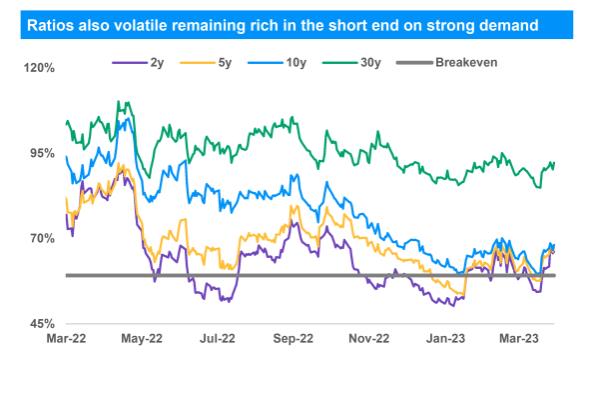
Sources: JPMAM, TM3, Bloomberg. Data as of 4/30/2023.
TRIDAN CORP.
June 28, 2023
Page – 5 –
A schedule of the company’s portfolio holdings at April 30, 2023, consisting entirely of municipal obligations, is included in the financial report. The company invests exclusively in non-voting securities, and accordingly has not voted any proxies for the year ended June 30, 2022. The company files its complete schedule of portfolio holdings with the U.S. Securities and Exchange Commission four quarters of each fiscal year on Form N-PORT. The company’s Forms N-PORT are available on the Commission’s website at http://www.sec.gov.
The net asset value per share at April 30, 2023 was $11.59 compared with $11.48 at April 30, 2022. Net investment income per share for the years ended April 30, 2023 and April 30, 2022 was $0.14. Distributions to shareholders amounted to $0.16 per share for fiscal year 2023 and $0.13 per share for fiscal year 2022.
At the company’s last annual meeting on July 19, 2022, the reappointment of Mazars USA LLP as the company’s auditors for the fiscal year ending April 30, 2023 was ratified by the shareholders as follows:
| | | | |
Shares Voted For | | | 2,819,301.6621 | |
Shares Voted Against | | | 0.0000 | |
Shares Abstaining | | | 0.0000 | |
At the company’s last annual meeting, the then incumbent directors, all of whom are named below, were all reelected to serve as directors until the next annual meeting of shareholders, or until their successors are elected and have qualified.
| | | | | | | | |
| | | Shares Voted For | | | Shares Withheld | |
Mark Goodman | | | 2,819,301.6621 | | | | 0 | |
Russell J. Stoever | | | 2,819,301.6621 | | | | 0 | |
Joan G. Rall | | | 2,819,301.6621 | | | | 0 | |
Benjamin Cope | | | 2,819,301.6621 | | | | 0 | |
The following Tables A and B set forth information concerning the directors, and Table C sets forth information concerning non-director officers of the company. The Table A director (Mark Goodman) is an “interested person” as defined in Section 2(a)19 of the Investment Company Act of 1940, and the Table B directors (Ms. Rall, Messrs. Stoever and Cope) are not “interested persons” of Tridan. Mark Goodman is an “interested person” because he is an officer and holder of more than 5% of the shares of the company.
TRIDAN CORP.
June 28, 2023
Page – 6 –
Table A
| | | | | | | | | | |
Name, Address and Age | | Position(s) in
Tridan Corp. | | Director
Since | | Principal Occupations During Past
5 Years | | Number of
Portfolios
Overseen | | Other
Directorships
During Past
5 Years |
| | | | | |
Interested Person: | | | | | | | | | | |
| | | | | |
Mark Goodman 276 Nantasket Road Hull, MA 02045 Age 69 | | Director, President, Treasurer | | 1999 | | Pianist and Teacher | | 1 | | None |
|
| Table B |
Name, Address and Age | | Position(s) in
Tridan Corp. | | Director
Since | | Principal Occupations During Past
5 Years | | Number of
Portfolios
Overseen | | Other
Directorships
During Past
5 Years |
| | | | | |
Disinterested Persons: | | | | | | | | | | |
| | | | | |
Joan G. Rall 55 East 9th Street, #11F New York, NY 10003 Age 69 | | Director,
Audit Committee Member | | 2017 | | Retired Partner, Ernst & Young
LLP (certified public Accountants) | | 1 | | None |
| | | | | |
Russell Jude Stoever 15 Rockleigh Road Rockleigh, NJ 07647 Age 78 | | Director,
Audit Committee Member | | 1995 | | Vice-President, Stoever Glass
& Co., Inc. (a registered
broker-dealer) | | 1 | | None |
| | | | | |
Benjamin Cope 25 Sheldon Street Milton, MA 02186 Age 29 | | Director,
Audit Committee Member | | 2021 | | Senior Marketing Manager,
Recorded Future | | 1 | | None |
TRIDAN CORP.
June 28, 2023
Page – 7 –
| | | | | | | | | | | | | | | | |
Table C | |
Name, Address and Age ___ | | Positions
in Tridan Corp. | | | Principal
Occupations
During Past
5 Years | | | Number of
Portfolios
Overseen | | | Other
Director-
ships Held | |
| | | | |
Non-director Officers: | | | | | | | | | | | | | | | | |
| | | | |
John H. Lively 11300 Tomahawk Creek Parkway, Suite 310 Leawood, KS 66211 Age 54 | | | Secretary | | | | Attorney, Practus, LLP | | | | None | | | | None | |
| | | | |
Soth Chin 6219 29th Street Arlington, VA 22207 Age 56 | | | Chief Compliance Officer | | | | Managing Member, Fit Compliance | | | | None | | | | None | |
The board of directors governs the Company and is responsible for protecting the interests of shareholders. The directors meet periodically throughout the year to oversee the Company’s activities and review its performance. Each of the directors is committed to regular and active participation in board and committee meetings. The board believes that, collectively, the directors have balanced and diverse experience, qualifications, attributes, and skills which allow the board to operate effectively in governing the Company and protecting the interests of shareholders. Information is provided below about the specific experience, skills, attributes and qualifications of each director.
Mark Goodman – Mr. Goodman has been a director since 1999. He is the son of Peter Goodman, who had been the President and a director of the company. Mark Goodman has been a shareholder of Tridan since before its 1980 conversion to an investment company. He is knowledgeable in the history and activities of the Company. Also, he has broad investment experience in fixed income securities, including municipal bonds.
Joan G. Rall – Ms. Rall is a certified public accountant and is retired from a career with Ernst & Young LLP as an Assurance and Advisory Partner. She has extensive experience in accounting, auditing, enterprise risk management, technology risk and assurance, and personnel management. She was an Adjunct Professor of Accounting at NYU and is Co-Founder and President of a biotech startup, Genusetics Inc.
Russell J. Stoever – Mr. Stoever has been a director since 1995. He is vice president and sales manager of Stoever, Glass & Co., Inc., a registered broker-dealer. He has been employed there since 1971 and became a principal of that corporation in 1982 with involvement in all aspects of municipal finance. He is not an “interested person” of Tridan Corp., as defined in the Investment Company Act, in that he does not execute any portfolio transactions for, or engage in any principal transactions with, Tridan or its investment adviser or any accounts over which the adviser has
TRIDAN CORP.
June 28, 2023
Page – 8 –
brokerage placement discretion, or any other investment company having the same investment adviser. Mr. Stoever brings to the board a keen analysis of economic and market conditions and trends, and his views concerning portfolio management.
Benjamin B. Cope – Mr. Cope is Senior Manager of Enterprise Growth Marketing at Recorded Future. He has broad experience in implementing commercial growth strategies, revenue forecasting and analysis, and scaling technology companies from early venture funding to initial public offering.
No director or officer received compensation from the Company during the last fiscal year, except for the fees of $12,000 during each year to each director, plus an additional $5,000 to Joan G. Rall, who served as chair of the audit committee. The Company does not have a bonus, profit sharing, or any other compensation plan, contract or arrangement with anyone, nor any pension or retirement plan; nor has the Company ever granted anyone any options, warrants or other rights to purchase securities.
Executive officers of the Company received compensation comprised solely of said directors’ fees aggregating $12,000 during fiscal 2023 which excludes professional fees paid to the law firm where Robert Birnbaum, former Secretary of the Company, is of counsel. Mr. Lively receives no fees for his service as Secretary of the Company, although Practus receives fees from the Company for services as counsel. Mr. Chin receives fees from the Company for his service as the Company’s Chief Compliance Officer.
Additional information about directors may be requested by any shareholder without charge by telephoning the Company’s administrator, PKF O’Connor Davies, LLP at 201-712-9800.
Tridan’s Investment Objective, Policies and Risks
Tridan’s investment objective is to achieve a high level of current income through investment primarily in fixed income securities which are exempt from federal income tax and which investments are consistent with flexible maturity and investment grade quality standards. Tridan intends to invest at least 50% of its invested assets in fixed income obligations of states, territories and possessions of the United States and the District of Columbia and their political subdivisions, agencies, authorities and instrumentalities, which constitute Tridan’s major portfolio emphasis, including industrial revenue bonds and other bonds, eases, tax anticipation notes, bond anticipation notes, revenue anticipation notes, project notes and other notes. Tridan may also invest in nonmunicipal fixed income securities including obligations of the U.S. government and its agencies and instrumentalities, bank obligations, debt securities of corporate issuers, asset backed and mortgaged related securities and repurchase agreements. Tridan will invest only in securities of the type described above which have at the time of purchase (i) for municipal securities on a rating of Baa or higher by Moody’s Investors Service, Inc., or BBB or higher by Standard & Poor’s Corporation, (ii) for non-municipal securities B a rating of A1 or higher by Moody’s, or A+ or higher by Standard & Poor’s, or (iii) a credit quality which, in the opinion of the investment adviser, is equivalent to such ratings although the rating agencies may ascribe lower ratings or in the case of unrated securities. Such objective may be changed without the vote of the holders of a majority of Tridan’s outstanding voting securities.
TRIDAN CORP.
June 28, 2023
Page – 9 –
There have been no changes in Tridan’s investment objective, policies or risks since the April 30, 2022 annual shareholder report.
Recital of Fundamental Policies
Tridan has the following policy with respect to each of the activities described below, which may not be changed without the approval of a majority of Tridan’s outstanding voting securities. Tridan will not:
| | • | | issue any senior securities. |
| | • | | make short sales of securities, purchase any securities on margin (except for such short-term credits as are necessary for the clearance of transactions) or write, purchase or sell puts, calls or combinations thereof, except that Tridan may purchase securities which have an attached put, i.e., the right to resell to the seller at an agreed-upon price or yield on a specified date or within a specified period (which will be prior to the maturity date of such security). |
| | • | | borrow money, except for temporary or emergency purposes (but not for investment purposes) in an amount up to 5 percent of the value of its assets (including the amount borrowed) less liabilities (not including the amount borrowed) at the time the borrowing is made. |
| | • | | underwrite securities issued by others. Tridan will not invest in restricted securities (securities which must be registered under the Securities Act of 1933 before they may be offered or sold to the public). |
| | • | | purchase or sell real estate or real estate mortgage loans, except that Tridan reserves the freedom to invest in leases and in securities which are secured by, or have their revenues derived from, real estate or interests therein, provided that such investments are consistent with Tridan’s investment objective and fundamental policies. |
| | • | | purchase or sell commodities or commodity contracts, including futures contracts in a contract market or other futures market. |
| | • | | lend money or securities, except that Tridan may purchase debt securities in private placement transactions or public offerings in accordance with its investment objective and fundamental policies. |
Tridan will invest at least 50% of its invested assets in debt obligations issued by or on behalf of states, territories and possessions of the United States and the District of Columbia and their political subdivisions, agencies and instrumentalities, or multi-state agencies or authorities, the interest from which is exempt from federal income tax. Tridan may also invest up to 50% of its invested assets in nonmunicipal fixed income securities including obligations of the U.S. government and its agencies and instrumentalities, bank obligations, debt securities of corporate issuers, asset backed and mortgage related securities and repurchase agreements.
TRIDAN CORP.
June 28, 2023
Page – 10 –
In addition to the policies listed above, Tridan deems the following to be fundamental policies. Tridan will not:
| | • | | purchase securities of other investment companies, except to the extent permitted by Section 12(d) of the Investment Company Act of 1940 and consistent with Tridan’s investment objective and fundamental policies, or as they may be acquired in connection with a merger, consolidation, reorganization or acquisition of assets. |
| | • | | invest for the purpose of exercising control or management of another company. |
| | • | | invest in interests in oil, gas or mineral exploration or development programs. |
| | • | | participate on a joint or a joint and several basis in any trading account in securities. |
Recital Of Investment Policies
Tridan has the following investment policies which, although significant, are not deemed fundamental and may be changed without shareholder approval:
At the close of each fiscal quarter, at least 50% of the value of Tridan’s total assets will be represented by cash and cash items (including receivables) and securities which are issued or guaranteed as to principal or interest by the United States, and other securities limited in respect of any one issuer to an amount not greater in value than 5% of the value of Tridan’s total assets.
At the close of each fiscal quarter, not more than 25% of the value of Tridan’s total assets will be invested in the securities of any one issuer, other than securities which are issued or guaranteed as to principal or interest by the United States.
Investment Risks
Tridan is subject to management risk and may not achieve its objective if the adviser’s expectations regarding particular instruments or markets are not met. Tridan’s main risks are noted below, any of which may adversely affect Tridan’s performance and ability to achieve its investment objective.
Interest Rate Risk. Tridan mainly invests in bonds and other debt securities. These securities will increase or decrease in value based on changes in interest rates. If rates increase, the value of Tridan’s investments generally declines. Securities with greater interest rate sensitivity and longer maturities generally are subject to greater fluctuations in value. Tridan may face a heightened level of interest rate risk due to certain changes in monetary policy. During periods when interest rates are low or there are negative interest rates, Tridan’s yield (and total return) also may be low or Tridan may be unable to maintain positive returns.
TRIDAN CORP.
June 28, 2023
Page – 11 –
New York Geographic Concentration Risk. Because Tridan invests primarily in municipal obligations issued by the State of New York and New York City, their political subdivisions, authorities, and agencies, its performance will be affected by the fiscal and economic health of that state, the city and their political subdivisions. As the nation’s financial capital, New York’s and New York City’s economy is heavily dependent on the financial sector and may be sensitive to economic problems affecting the sector.
Municipal Obligations Risk. The risk of a municipal obligation generally depends on the financial and credit status of the issuer. Changes in the financial health of a municipal issuer may make it difficult for the issuer to make interest and principal payments when due. This could decrease Tridan’s income or hurt the ability to preserve capital and liquidity. Under some circumstances, municipal obligations might not pay interest unless the state legislature or municipality authorizes money for that purpose. Municipal obligations may be more susceptible to downgrades or defaults during recessions or similar periods of economic stress. In addition, since some municipal obligations may be secured or guaranteed by banks and other institutions, the risk to Tridan could increase if the banking or financial sector suffers an economic downturn and/or if the credit ratings of the institutions issuing the guarantee are downgraded or at risk of being downgraded by a national rating organization. Such a downward revision or risk of being downgraded may have an adverse effect on the market prices of the bonds and thus the value of Tridan’s investments. In addition to being downgraded, an insolvent municipality may file for bankruptcy. The reorganization of a municipality’s debts may significantly affect the rights of creditors and the value of the securities issued by the municipality and the value of Tridan’s investments.
Credit Risk. Tridan’s investments are subject to the risk that issuers and/or counterparties will fail to make payments when due or default completely. If an issuer’s or a counterparty’s financial condition worsens, the credit quality of the issuer or counterparty may deteriorate. Credit spreads may increase, which may reduce the market values of Tridan’s securities. Credit spread risk is the risk that economic and market conditions or any actual or perceived credit deterioration may lead to an increase in the credit spreads (i.e., the difference in yield between two securities of similar maturity but different credit quality) and a decline in price of the issuer’s securities.
Government Securities Risk. Tridan may invest in securities issued or guaranteed by the U.S. government or its agencies and instrumentalities. U.S. government securities are subject to market risk, interest rate risk and credit risk. Securities, such as those issued or guaranteed by the U.S. Treasury, that are backed by the full faith and credit of the United States are guaranteed only as to the timely payment of interest and principal when held to maturity and the market prices for such securities will fluctuate. Notwithstanding that these securities are backed by the full faith and credit of the United States, circumstances could arise that would prevent the payment of interest or principal. This would result in losses to Tridan. Securities issued or guaranteed by U.S. government related organizations, such as Fannie Mae and Freddie Mac, are not backed by the full faith and credit of the U.S. government and no assurance can be given that the U.S. government will provide financial support. Therefore, U.S. government related organizations may not have the funds to meet their payment obligations in the future. U.S. government securities include zero coupon securities, which tend to be subject to greater market risk than interest-paying securities of similar maturities.
TRIDAN CORP.
June 28, 2023
Page – 12 –
Mortgage-Related and Other Asset-Backed Securities Risk. To the extent that Tridan invests in mortgage and other asset-backed securities, it will be subject to this risk. Mortgage-related and asset-backed securities, including certain municipal housing authority obligations, are subject to certain other risks. The value of these securities will be influenced by the factors affecting the housing market and the assets underlying such securities. As a result, during periods of declining asset values, difficult or frozen credit markets, significant changes in interest rates, or deteriorating economic conditions, mortgage-related and asset-backed securities may decline in value, face valuation difficulties, become more volatile and/or become illiquid. These securities are also subject to prepayment and call risk. In periods of declining interest rates, Tridan may be subject to contraction risk which is the risk that borrowers will increase the rate at which they prepay the maturity value of mortgages and other obligations. When mortgages and other obligations are prepaid and when securities are called, Tridan may have to reinvest in securities with a lower yield or fail to recover additional amounts (i.e., premiums) paid for securities with higher interest rates, resulting in an unexpected capital loss and/or a decrease in the amount of dividends and yield. In periods of either rising or declining interest rates, Tridan may be subject to extension risk which is the risk that the expected maturity of an obligation will lengthen in duration due to a decrease in prepayments. As a result, in certain interest rate environments, Tridan may exhibit additional volatility. Additionally, asset-backed, mortgage-related and mortgage-backed securities are subject to risks associated with their structure and the nature of the assets underlying the securities and the servicing of those assets. Certain asset-backed, mortgage-related and mortgage-backed securities may face valuation difficulties and may be less liquid than other types of asset-backed, mortgage-related and mortgage-backed securities, or debt securities.
Debt Securities and Other Callable Securities Risk. The issuers of debt these securities and other callable securities may be able to repay principal in advance, especially when interest rates fall. Changes in prepayment rates can affect the return on investment and yield of these securities. When debt obligations are prepaid and when securities are called, Tridan may have to reinvest in securities with a lower yield. Tridan also may fail to recover additional amounts (i.e., premiums) paid for securities with higher interest rates, resulting in an unexpected capital loss.
Bank Obligations Risk: Bank obligations include bankers’ acceptances, certificates of deposit and time deposits. Bankers’ acceptances are bills of exchange or time drafts drawn on and accepted by a commercial bank. Maturities are generally six months or less. Certificates of deposit are negotiable certificates issued by a bank for a specified period of time and earning a specified return. Time deposits are non-negotiable receipts issued by a bank in exchange for the deposit of funds. These bank obligations are subject to credit and interest rate risk.
Repurchase Agreements Risk: A repurchase agreement is the purchase of a security and the simultaneous commitment to return the security to the seller at an agreed upon price on an agreed upon date. This is treated as a loan. Repurchase agreements are subject to credit and liquidity risks.
|
Sincerely, |
TRIDAN CORP. |
/s/ Mark Goodman |
Mark Goodman, President |
Tridan Corp.
Financial Statements
April 30, 2023 and 2022
Tridan Corp.
Contents
April 30, 2023 and 2022
| | |

Report of Independent Registered Public Accounting Firm | | Mazars USA LLP 399 Thornall Street Edison, New Jersey 08837 Tel: 732.549.2800 www.mazars.us |
To the Shareholders and Board of Directors of Tridan Corp.
Opinion on the Financial Statements and Financial Highlights
We have audited the accompanying statements of assets and liabilities of Tridan Corp. (the “Company”), including the schedules of investments in municipal obligations, as of April 30, 2023 and 2022, the related statements of operations for the years then ended, the statements of changes in net assets for each of the three years in the period ended April 30, 2023, the financial highlights for each of the five years in the period ended April 30, 2023, and the related notes, collectively referred to as the “financial statements and financial highlights”). In our opinion, the financial statements and financial highlights present fairly, in all material respects, the financial position of the Company as of April 30, 2023 and 2022, the results of its operations for the years then ended, the changes in its net assets for each of the three years in the period ended April 30, 2023, and financial highlights for each of the five years in the period ended April 30, 2023, in conformity with accounting principles generally accepted in the United States of America.
Basis for Opinion
These financial statements and financial highlights are the responsibility of the Company’s management. Our responsibility is to express an opinion on the Company’s financial statements and financial highlights based on our audits. We are a public accounting firm registered with the Public Company Accounting Oversight Board (United States) (“PCAOB”) and are required to be independent with respect to the Company in accordance with the U.S. federal securities laws and the applicable rules and regulations of the Securities and Exchanges Commission and the PCAOB.
We conducted our audits in accordance with the standards of the PCAOB. Those standards require that we plan and perform the audit to obtain reasonable assurance about whether the financial statements and financial highlights and other data are free of material misstatement, whether due to error or fraud. The Company is not required to have, nor were we engaged to perform, an audit of its internal control over financial reporting. As part of our audits we are required to obtain an understanding of internal control over financial reporting but not for the purpose of expressing an opinion on the effectiveness of the Company’s internal control over financial reporting.
Accordingly, we express no such opinion.
Our audits included performing procedures to assess the risks of material misstatement of the financial statements and financial highlights, whether due to error or fraud, and performing procedures that respond to those risks. Such procedures included examining, on a test basis, evidence regarding the amounts and disclosures in the financial statements and financial highlights. Our procedures included confirmation of securities owned, as of April 30, 2023 and 2022, by correspondence with the custodian. Our audits also included evaluating the accounting principles used and significant estimates made by management, as well as evaluating the overall presentation of the financial statements and financial highlights. We believe that our audits provide a reasonable basis for our opinion.
Critical Audit Matters
Critical audit matters are matters arising from the current period audit of the financial statements that were communicated or required to be communicated and that: (1) related to accounts or disclosures that are material to the financial statements and (2) involved our especially challenging, subjective, or complex judgments. We determined that there are no critical audit matters.
We have served as the Company’s auditor since 1980.

Edison, New Jersey
June 26, 2023
Mazars USA LLP is an independent member firm of Mazars Group.
Tridan Corp.
Statements of Assets and Liabilities
April 30, 2023 and 2022
| | | | | | | | |
| | | 2023 | | | 2022 | |
Assets | | | | | | | | |
Investments in municipal obligations, at fair value | | | | | | | | |
(original cost – $38,070,390 and $38,645,832 respectively) | | | | | | | | |
(amortized cost – $35,150,441 and $35,345,212 respectively) | | $ | 34,426,800 | | | $ | 34,239,661 | |
Cash | | | 775,990 | | | | 391,329 | |
Prepaid insurance and other assets | | | 260 | | | | 5,150 | |
Accrued interest receivable | | | 486,888 | | | | 464,346 | |
| | | | | | | | |
Total assets | | $ | 35,689,938 | | | $ | 35,100,486 | |
| | | | | | | | |
Liabilities | | | | | | | | |
Accrued liabilities: | | | | | | | | |
Accrued investment advisory and custodian fees | | $ | 34,705 | | | $ | 33,434 | |
Accrued fees – affiliate | | | 43,882 | | | | 18,640 | |
Accrued other | | | 95,871 | | | | 17,990 | |
Dividends payable | | | 123,340 | | | | — | |
| | | | | | | | |
Total liabilities | | | 297,798 | | | | 70,064 | |
| | | | | | | | |
Net assets | | $ | 35,392,140 | | | $ | 35,030,422 | |
| | | | | | | | |
Analysis of net assets | | | | | | | | |
Common stock, at $.02 par value, 6,000,000 shares authorized, 3,199,100 shares issued at April 30, 2023 and 2022 | | $ | 63,982 | | | $ | 63,982 | |
Paid-in capital | | | 37,816,314 | | | | 37,816,314 | |
Treasury stock, 146,729.6288 shares at April 30, 2023 and 2022 | | | (1,762,998 | ) | | | (1,762,998 | ) |
Distributable earnings: | | | | | | | | |
(Overdistributed) underdistributed net investment income | | | (235 | ) | | | 18,677 | |
Undistributed capital losses | | | (1,282 | ) | | | — | |
Unrealized depreciation of investments, net | | | (723,641 | ) | | | (1,105,553 | ) |
| | | | | | | | |
Net assets [equivalent to $11.59 and $11.48 per share, respectively, based on 3,052,370.3712 shares of common stock outstanding] | | $ | 35,392,140 | | | $ | 35,030,422 | |
| | | | | | | | |
The accompanying notes are an integral part of these financial statements.
3
Tridan Corp.
Schedule of Investments in Municipal Obligations
April 30, 2023 and 2022
| | | | | | | | | | | | | | | | | | | | | | | | |
| | | 2023 | | | 2022 | |
| | | Principal
Amount | | | Amortized
Cost | | | Fair
Value | | | Principal
Amount | | | Amortized
Cost | | | Fair
Value | |
New York Municipal Bonds | | | | | | | | | | | | | | | | | | | | | | | | |
| | | | | | |
State of NY Dormitory Auth Personal Inc Tax Rev Ref Educ.
5.50 % due March 15, 2025 | | $ | 500,000 | | | $ | 508,738 | | | $ | 524,140 | | | $ | 500,000 | | | $ | 513,380 | | | $ | 541,520 | |
| | | | | | |
Met Transportation Auth NY Revenue
5.0% due November 15, 2027 | | | 1,250,000 | | | | 1,390,163 | | | | 1,326,925 | | | | 1,250,000 | | | | 1,419,733 | | | | 1,351,963 | |
| | | | | | |
NY St Urban Dev Corp Rev Ref Pers Income Tax
5.0% due March 15, 2031 | | | 750,000 | | | | 815,202 | | | | 814,245 | | | | 750,000 | | | | 830,179 | | | | 817,470 | |
| | | | | | |
NYS Dorm Auth Revs
(Par Call October 01, 2026)
5.0% due October 01, 2033 | | | 1,000,000 | | | | 1,065,038 | | | | 1,068,100 | | | | 1,000,000 | | | | 1,083,273 | | | | 1,092,240 | |
| | | | | | |
Triboro NY Bridge & Tunnel
5.0% due November 15, 2035 | | | 1,015,000 | | | | 1,098,553 | | | | 1,096,119 | | | | 1,015,000 | | | | 1,116,567 | | | | 1,108,725 | |
| | | | | | |
Erie County NY Fiscal Stability Sales Tax
5.00% due June 15, 2024 | | | — | | | | — | | | | — | | | | 165,000 | | | | 176,472 | | | | 174,271 | |
| | | | | | |
NY City Transitional Financial Authority Rev Future Tax
(Par Call November 1, 2022 @100)
5.00% due November 1, 2026 | | | — | | | | — | | | | — | | | | 550,000 | | | | 554,005 | | | | 558,701 | |
| | | | | | |
Brookhaven NY Limited Tax
4.0% due March 15, 2023 | | | — | | | | — | | | | — | | | | 1,000,000 | | | | 1,025,199 | | | | 1,018,430 | |
| | | | | | |
Erie Count Indvl Dev Agency
5.0% due May 1, 2025 | | | 750,000 | | | | 810,558 | | | | 783,743 | | | | 750,000 | | | | 833,973 | | | | 805,147 | |
| | | | | | |
NYC NY Cultural Res-Museum of Modern Art
4.0% due February 1, 2023 | | | — | | | | — | | | | — | | | | 400,000 | | | | 408,477 | | | | 406,606 | |
| | | | | | |
Schenectady CNTY NY Various Purposes LTD Tax
5.0% due December 15, 2022 | | | — | | | | — | | | | — | | | | 300,000 | | | | 306,021 | | | | 306,075 | |
The accompanying notes are an integral part of these financial statements.
4
Tridan Corp.
Schedule of Investments in Municipal Obligations
April 30, 2023 and 2022
| | | | | | | | | | | | | | | | | | | | | | | | |
| | | 2023 | | | 2022 | |
| | | Principal
Amount | | | Amortized
Cost | | | Fair
Value | | | Principal
Amount | | | Amortized
Cost | | | Fair
Value | |
| | | | | | |
Harrison NY REF Public Impt LTD Tax
5.0% due December 15, 2023 | | | — | | | | — | | | | — | | | | 100,000 | | | | 109,244 | | | | 104,502 | |
| | | | | | |
Saratoga County NY Ref LTD Tax
5.0% due July 15, 2023 | | | — | | | | — | | | | — | | | | 100,000 | | | | 107,905 | | | | 103,524 | |
| | | | | | |
SNT Lawrence CNTY NY REF Limited Tax
(Par Call May 15, 2025)
5.0% due May 15, 2026 | | | 105,000 | | | | 110,000 | | | | 109,380 | | | | 105,000 | | | | 112,289 | | | | 112,620 | |
| | | | | | |
NYC NY TR Cultural Res-Museum of Modern Art
4.0% due April 01, 2026 | | | 500,000 | | | | 529,528 | | | | 516,730 | | | | 500,000 | | | | 540,459 | | | | 525,340 | |
| | | | | | |
Laurens NY Central School District
(Par Call June 15, 2025)
4.0% due June 15, 2028 | | | 305,000 | | | | 313,117 | | | | 312,552 | | | | 305,000 | | | | 316,925 | | | | 312,592 | |
| | | | | | |
NYS Dormitory Authority Personal Income Tax
(Par Call August 15, 2026)
5.0% due February 15, 2033 | | | 500,000 | | | | 552,978 | | | | 530,625 | | | | 500,000 | | | | 568,426 | | | | 541,005 | |
| | | | | | |
Brookhaven NY REF Unlimited Tax
5.00% due March 15, 2025 | | | 500,000 | | | | 528,106 | | | | 521,760 | | | | 500,000 | | | | 543,060 | | | | 536,080 | |
| | | | | | |
NY ST Environmental FACS
5.00% due June 15, 2026 | | | 1,300,000 | | | | 1,394,291 | | | | 1,394,185 | | | | 1,300,000 | | | | 1,424,375 | | | | 1,429,142 | |
| | | | | | |
State of NY Dormitory Authority State Pers. Inc. Tax
5.5% due March 15, 2026 | | | 200,000 | | | | 214,482 | | | | 215,058 | | | | 200,000 | | | | 219,506 | | | | 221,544 | |
| | | | | | |
Port Authority of NY and NJ
5.375 % due March 1, 2028 | | | 110,000 | | | | 110,250 | | | | 117,185 | | | | 125,000 | | | | 126,155 | | | | 135,929 | |
| | | | | | |
Util. Debt Securitization
(Par Call June 15, 2024 @100)
5.00% due December 15, 2026 | | | 500,000 | | | | 518,763 | | | | 517,255 | | | | 500,000 | | | | 530,973 | | | | 531,830 | |
| | | | | | |
Erie County NY Fiscal Stability Sales Tax
(Par Call June 15, 2027 @100)
5.00% due June 15, 2029 | | | 1,000,000 | | | | 1,102,822 | | | | 1,095,380 | | | | 1,000,000 | | | | 1,127,109 | | | | 1,111,420 | |
The accompanying notes are an integral part of these financial statements.
5
Tridan Corp.
Schedule of Investments in Municipal Obligations
April 30, 2023 and 2022
| | | | | | | | | | | | | | | | | | | | | | | | |
| | | 2023 | | | 2022 | |
| | | Principal
Amount | | | Amortized
Cost | | | Fair
Value | | | Principal
Amount | | | Amortized
Cost | | | Fair
Value | |
| | | | | | |
Greece NY Central School District Unlimited Tax
(Par Call December 15, 2022 @100)
5.0% due December 15, 2023 | | | — | | | | — | | | | — | | | | 500,000 | | | | 508,094 | | | | 508,580 | |
| | | | | | |
Rensselaer Cnty, NY Limited Tax
5.00% due September 1, 2024 | | | 100,000 | | | | 109,706 | | | | 102,677 | | | | 100,000 | | | | 112,295 | | | | 106,082 | |
| | | | | | |
Mattituck-Cutchogue NY Central School District Unlimited Tax
(Par Call July 15, 2025 @100)
5.0% Unlimited tax due July 15, 2026 | | | 280,000 | | | | 294,886 | | | | 293,544 | | | | 280,000 | | | | 301,603 | | | | 302,487 | |
| | | | | | |
Mattituck-Cutchogue NY
(Par Call July 15, 2025 @100)
5.0% Unlimited tax due July 15, 2027 | | | 365,000 | | | | 383,516 | | | | 381,936 | | | | 365,000 | | | | 391,871 | | | | 393,262 | |
| | | | | | |
Putnam County NY Limited Tax
(Par Call January 15, 2026 @100)
5.0% due January 15, 2027 | | | 135,000 | | | | 143,650 | | | | 143,157 | | | | 135,000 | | | | 146,829 | | | | 147,258 | |
| | | | | | |
Halfmoon NY Pub Imp Limited Tax
(Par Call June 15, 2025 @100)
5.0% due June 15, 2027 | | | 280,000 | | | | 293,747 | | | | 293,037 | | | | 280,000 | | | | 300,222 | | | | 302,042 | |
| | | | | | |
Gates Chili NY Central School Unlimited Tax
(Par Call June 15, 2025 @100)
5.0% due June 15, 2027 | | | 200,000 | | | | 210,575 | | | | 209,354 | | | | 200,000 | | | | 215,529 | | | | 215,808 | |
| | | | | | |
Western Nassau Cty Water Auth
(Par Call April 1, 2025 @100)
5.0% due April 1, 2028 | | | 100,000 | | | | 103,542 | | | | 103,605 | | | | 100,000 | | | | 105,378 | | | | 106,589 | |
| | | | | | |
Central Islip New York Union Free School School District Ref Unlimited Tax
5.00% due July 15, 2022 | | | — | | | | — | | | | — | | | | 750,000 | | | | 755,048 | | | | 755,490 | |
| | | | | | |
Rockville Center NY Limited Tax
4.0% due June 15, 2022 | | | — | | | | — | | | | — | | | | 200,000 | | | | 204,409 | | | | 200,664 | |
The accompanying notes are an integral part of these financial statements.
6
Tridan Corp.
Schedule of Investments in Municipal Obligations
April 30, 2023 and 2022
| | | | | | | | | | | | | | | | | | | | | | | | |
| | | 2023 | | | 2022 | |
| | | Principal
Amount | | | Amortized
Cost | | | Fair
Value | | | Principal
Amount | | | Amortized
Cost | | | Fair
Value | |
Brentwood New York UN Free School
5.00% due January 15, 2023 | | | — | | | | — | | | | — | | | | 430,000 | | | | 432,627 | | | | 439,808 | |
| | | | | | |
Connetquot New York Central School District Unlimited Tax
5.0% due January 15, 2024 | | | — | | | | — | | | | — | | | | 400,000 | | | | 409,153 | | | | 418,672 | |
| | | | | | |
Syosset New York Central School
District Unlimited Tax
5.0% due December 15, 2022 | | | 300,000 | | | | 302,125 | | | | 300,414 | | | | 735,000 | | | | 749,701 | | | | 750,112 | |
| | | | | | |
Syosset New York Central School District Unlimited Tax
5.0% due December 15, 2022 | | | — | | | | — | | | | — | | | | 125,000 | | | | 124,738 | | | | 127,585 | |
| | | | | | |
Onondaga County NY Ref Unlimited Tax
(Par Call March 15, 2024 @100)
5.0% due March 15, 2025 | | | 285,000 | | | | 290,118 | | | | 289,851 | | | | 285,000 | | | | 295,919 | | | | 299,145 | |
| | | | | | |
North Babylon NY Un Free School Dist Ref Unlimited Tax
(Par Call August 1, 2022 @100)
5.0% due August 1, 2023 | | | — | | | | — | | | | — | | | | 250,000 | | | | 251,503 | | | | 251,737 | |
| | | | | | |
Battery Park City NY Authority SR-Ser A
(Par Call November 1, 2023 @100)
5.0% due November 1, 2029 | | | 140,000 | | | | 139,293 | | | | 141,340 | | | | 140,000 | | | | 141,518 | | | | 145,897 | |
| | | | | | |
Buffalo & Ft. Erie NY Pub Bridge Auth Toll Bridge Sys Rev 5.0% due January 1, 2025 | | | 410,000 | | | | 423,138 | | | | 422,788 | | | | 410,000 | | | | 430,836 | | | | 435,620 | |
| | | | | | |
Bayport Blue Point NY Un Free School Dist Ref Unlimited Tax
5.0% due September 15, 2024 | | | — | | | | — | | | | — | | | | 250,000 | | | | 263,880 | | | | 265,435 | |
| | | | | | |
Saratoga Springs NY Ref Public Imports-Unlimited Tax
(Par Call February 15, 2023 @100)
5.0% due February 15, 2025 | | | 225,000 | | | | 226,611 | | | | 225,344 | | | | 225,000 | | | | 231,931 | | | | 230,560 | |
The accompanying notes are an integral part of these financial statements.
7
Tridan Corp.
Schedule of Investments in Municipal Obligations
April 30, 2023 and 2022
| | | | | | | | | | | | | | | | | | | | | | | | |
| | | 2023 | | | 2022 | |
| | | Principal
Amount | | | Amortized
Cost | | | Fair
Value | | | Principal
Amount | | | Amortized
Cost | | | Fair
Value | |
Build NYC Resource Corp.NY Rev United Jewish Appeal
(Par Call July 1, 2024 @100)
5.0% due July 1, 2025 | | | 320,000 | | | | 329,897 | | | | 327,104 | | | | 320,000 | | | | 336,821 | | | | 337,770 | |
| | | | | | |
Tompkins County NY Public Impt Ser B Limited Tax
(Par Call December 15, 2024 @100)
5.0% due December 15, 2027 | | | 500,000 | | | | 519,563 | | | | 516,935 | | | | 500,000 | | | | 531,524 | | | | 533,795 | |
| | | | | | |
Util Debt Securitization Auth NY Restructuring Ser TE
(Par Call December 15, 2023 @100)
5.0% due December 15, 2028 | | | 500,000 | | | | 501,921 | | | | 505,790 | | | | 500,000 | | | | 507,971 | | | | 521,450 | |
| | | | | | |
Rhinebeck New York Central School District Unlimited Tax
(Par Call June 15, 2023 @100)
4.0% due June 15, 2025 | | | 535,000 | | | | 535,882 | | | | 535,669 | | | | 535,000 | | | | 542,349 | | | | 545,523 | |
| | | | | | |
NYS Dorm Auth Persnl Inc Tax
5.0% due August 15, 2026 | | | | | | | | | | | | | | | | | | | | | | | | |
| | | | | | |
Met Transportation Auth NY Revenue
5.0% due November 15, 2027 | | | 300,000 | | | | 320,145 | | | | 313,596 | | | | 300,000 | | | | 327,596 | | | | 323,208 | |
| | | | | | |
NY ST Dorm Auth Revenues Non St
5.0% due October 1, 2029 | | | 1,090,000 | | | | 1,233,291 | | | | 1,188,656 | | | | 1,090,000 | | | | 1,263,958 | | | | 1,199,839 | |
| | | | | | |
NY City Transitional Fin Auth Rev Future
(Par Call February 1, 2026 @100)
5.00 % due February 1, 2031 | | | 1,000,000 | | | | 1,074,797 | | | | 1,057,190 | | | | 1,000,000 | | | | 1,100,741 | | | | 1,077,630 | |
| | | | | | |
Long Island NY Power Auth Elec
5.0% due September 1, 2034 | | | 1,000,000 | | | | 1,134,946 | | | | 1,120,400 | | | | 1,000,000 | | | | 1,158,360 | | | | 1,118,510 | |
| | | | | | |
NYS dorm Sales Tax
5.0% due March 15, 2035 | | | 1,250,000 | | | | 1,368,763 | | | | 1,380,850 | | | | 1,250,000 | | | | 1,390,078 | | | | 1,360,775 | |
| | | | | | |
NY NY Ref - Ser Unlimited Tax
5.0% due August 1, 2029 | | | 750,000 | | | | 879,698 | | | | 858,945 | | | | 750,000 | | | | 898,882 | | | | 849,420 | |
| | | | | | |
NY NY Ser D Sbserv Unltd Tax
5.0% due December 1, 2033 | | | 290,000 | | | | 328,717 | | | | 325,505 | | | | 290,000 | | | | 331,686 | | | | 320,586 | |
The accompanying notes are an integral part of these financial statements.
8
Tridan Corp.
Schedule of Investments in Municipal Obligations
April 30, 2023 and 2022
| | | | | | | | | | | | | | | | | | | | | | | | |
| | | 2023 | | | 2022 | |
| | | Principal
Amount | | | Amortized
Cost | | | Fair
Value | | | Principal
Amount | | | Amortized
Cost | | | Fair
Value | |
N.Y.S. Dormitory Authority Revenues Ref Cornell University
5.0% due July 1, 2031 | | | 1,000,000 | | | | 1,322,274 | | | | 1,205,050 | | | | 1,000,000 | | | | 1,359,994 | | | | 1,177,480 | |
| | | | | | |
N.Y.S. Environmental FACS
5.0% due June 15, 2035 | | | 500,000 | | | | 633,331 | | | | 567,315 | | | | 500,000 | | | | 642,644 | | | | 563,690 | |
| | | | | | |
Util Debt Securitization Auth NY
(Par Call June 15, 2026)
5.0% due December 15, 2033 | | | 100,000 | | | | 112,219 | | | | 106,842 | | | | 100,000 | | | | 116,031 | | | | 108,910 | |
| | | | | | |
NY ST Dorm Auth Rev
5.0% due July 1, 2030 | | | 500,000 | | | | 647,273 | | | | 591,440 | | | | 500,000 | | | | 667,107 | | | | 583,155 | |
| | | | | | |
NY ST Environmental Clean Water
5.0% Due June 15, 2031 | | | 400,000 | | | | 505,724 | | | | 461,880 | | | | 400,000 | | | | 517,814 | | | | 456,710 | |
| | | | | | |
Nassau County NY Interim
5.0% due December 1, 2033 | | | — | | | | — | | | | — | | | | 500,000 | | | | 681,014 | | | | 592,020 | |
| | | | | | |
Nassau County NY Interim
5.0% due November 15, 2031 | | | 500,000 | | | | 662,905 | | | | 600,075 | | | | — | | | | — | | | | — | |
| | | | | | |
Syracuse NY REF-SER B LTD Tax
4.0% due June 1, 2032 | | | 1,060,000 | | | | 1,287,352 | | | | 1,162,163 | | | | 1,060,000 | | | | 1,310,506 | | | | 1,152,845 | |
| | | | | | |
NY ST Dorm Auth Revenues
5.0% due July 1, 2034 | | | — | | | | — | | | | — | | | | 600,000 | | | | 692,642 | | | | 655,176 | |
| | | | | | |
Harrison NY LTD Tax
5.0% due July 1, 2030 | | | 290,000 | | | | 336,559 | | | | 341,147 | | | | — | | | | — | | | | — | |
| | | | | | |
IL ST REF-SER B
5.0% due March 1, 2031 | | | 125,000 | | | | 130,982 | | | | 139,531 | | | | — | | | | — | | | | — | |
| | | | | | |
NY ST Dorm Auth Revenues Non St
5.0% due July 1, 2034 | | | 600,000 | | | | 686,408 | | | | 657,240 | | | | — | | | | — | | | | — | |
| | | | | | |
Triborough NY Brdg & Tunl Auth
4.0% due May 15, 2035 | | | 500,000 | | | | 593,983 | | | | 535,365 | | | | 500,000 | | | | 600,705 | | | | 511,660 | |
| | | | | | |
Liberty Dev Corp NY Rev Ref – Goldman
5.25% due October 1, 2035 | | | 515,000 | | | | 599,478 | | | | 591,153 | | | | — | | | | — | | | | — | |
The accompanying notes are an integral part of these financial statements.
9
Tridan Corp.
Schedule of Investments in Municipal Obligations
April 30, 2023 and 2022
| | | | | | | | | | | | | | | | | | | | | | | | |
| | | 2023 | | | 2022 | |
| | | Principal
Amount | | | Amortized
Cost | | | Fair
Value | | | Principal
Amount | | | Amortized
Cost | | | Fair
Value | |
Port WA NY UN Freesch Dist
5.0% due August 1, 2034 | | | 1,000,000 | | | | 1,166,705 | | | | 1,171,360 | | | | — | | | | — | | | | — | |
| | | | | | |
Port Auth of NY & NJ Ref-Ser
5.0% due December 1, 2035 | | | 1,000,000 | | | | 1,111,550 | | | | 1,186,120 | | | | — | | | | — | | | | — | |
| | | | | | |
Nassau Cnty NY Interim Fin Auth Res-Sales tax
4.0% due November 15, 2035 | | | 625,000 | | | | 663,596 | | | | 686,763 | | | | — | | | | — | | | | — | |
| | | | | | |
NY ST Envrnmntl Facs Corp Rev Green Bond-ST
5.0% due August 15, 2035 | | | 355,000 | | | | 390,809 | | | | 389,591 | | | | — | | | | — | | | | — | |
| | | | | | |
Triborough NY Brdg & Tunl Auth Payroll Mobility
5.0% due November 15, 2033 | | | 500,000 | | | | 619,972 | | | | 609,625 | | | | — | | | | — | | | | — | |
| | | | | | |
Uniondale NY Un Free Sch Dist Unltd
4.0% due January 15, 2041 | | | 1,000,000 | | | | 1,038,989 | | | | 1,007,360 | | | | — | | | | — | | | | — | |
| | | | | | |
William Floyd NY Un Free Sch Dist
4.0% due June 15, 2038 | | | 420,000 | | | | 429,216 | | | | 435,711 | | | | — | | | | — | | | | — | |
| | | | | | | | | | | | | | | | | | | | | | | | |
| | $ | 31,630,000 | | | $ | 35,150,441 | | | $ | 34,426,800 | | | $ | 31,770,000 | | | $ | 35,345,212 | | | $ | 34,239,661 | |
| | | | | | | | | | | | | | | | | | | | | | | | |
The accompanying notes are an integral part of these financial statements.
10
Tridan Corp.
Statements of Operations
Years Ended April 30, 2023 and 2022
| | | | | | | | |
| | | 2023 | | | 2022 | |
Investment income | | | | | | | | |
Interest | | $ | 1,533,868 | | | $ | 1,498,888 | |
Amortization of bond premium and discount - net | | | (662,681 | ) | | | (697,753 | ) |
| | | | | | | | |
Total investment income | | | 871,187 | | | | 801,135 | |
| | | | | | | | |
Expenses | | | | | | | | |
Investment advisory fees | | | 88,046 | | | | 94,045 | |
Custodian fees | | | 6,937 | | | | 7,414 | |
Professional fees | | | 151,852 | | | | 133,460 | |
Director’s fees | | | 53,000 | | | | 50,000 | |
Administrative and accounting expenses | | | 72,000 | | | | 72,000 | |
Insurance and other expenses | | | 31,552 | | | | 20,362 | |
| | | | | | | | |
Total expenses | | | 403,387 | | | | 377,281 | |
| | | | | | | | |
Net investment income | | | 467,800 | | | | 423,854 | |
| | | | | | | | |
Realized and unrealized gain on investments | | | | | | | | |
Net realized gain on investments | | | 386 | | | | — | |
Net unrealized appreciation (depreciation) on investments | | | 381,912 | | | | (3,092,063 | ) |
| | | | | | | | |
Net realized and unrealized gain (loss) on investments | | | 382,298 | | | | (3,092,063 | ) |
| | | | | | | | |
Net increase (decrease) in net assets resulting from operations | | $ | 850,098 | | | $ | (2,668,209 | ) |
| | | | | | | | |
The accompanying notes are an integral part of these financial statements.
11
Tridan Corp.
Statements of Changes in Net Assets
Years Ended April 30, 2023, 2022 and 2021
| | | | | | | | | | | | |
| | | 2023 | | | 2022 | | | 2021 | |
Change in net assets resulting from operations | | | | | | | | | | | | |
Net investment income | | $ | 467,800 | | | $ | 423,854 | | | $ | 475,332 | |
Net realized gain on investments | | | 386 | | | | — | | | | 33,016 | |
Unrealized depreciation (appreciation) on investments | | | 381,912 | | | | (3,092,063 | ) | | | 1,152,894 | |
| | | | | | | | | | | | |
Net increase (decrease) in net assets resulting from operations | | | 850,098 | | | | (2,668,209 | ) | | | 1,661,242 | |
| | | |
Distributions to shareholders from | | | | | | | | | | | | |
Net investment income | | | (486,712 | ) | | | (396,808 | ) | | | (455,576 | ) |
Capital gains | | | (1,668 | ) | | | — | | | | (33,016 | ) |
| | | |
Redemptions of shares | | | | | | | | | | | | |
0, 0, and 1,676,1480 shares, respectively | | | — | | | | — | | | | (20,975 | ) |
| | | | | | | | | | | | |
Total increase (decrease) | | | 361,718 | | | | (3,065,017 | ) | | | 1,151,675 | |
| | | |
Net assets | | | | | | | | | | | | |
Beginning of year | | | 35,030,422 | | | | 38,095,439 | | | | 36,943,764 | |
| | | | | | | | | | | | |
End of year | | $ | 35,392,140 | | | $ | 35,030,422 | | | $ | 38,095,439 | |
| | | | | | | | | | | | |
The accompanying notes are an integral part of these financial statements.
12
Tridan Corp.
Notes to Financial Statements
April 30, 2023 and 2022
| 1. | Significant Accounting Policies |
The following is a summary of the significant accounting policies followed by Tridan Corp. (the “Company”), a closed-end, non-diversified management investment company, registered under the Investment Company Act of 1940.
Basis of Presentation
The accompanying financial statements are prepared in conformity with U.S. generally accepted accounting principles (“GAAP”). The Company is considered an investment company under GAAP and follows the accounting and reporting guidance applicable to investment companies in the Financial Accounting Standards Board Accounting Standards Codification 946, Financial Services – Investment Companies.
Acquisition and Valuation of Investments
Investment transactions are accounted for on the date the securities are purchased/sold (trade date) and interest on securities acquired/sold is included in income from/to the settlement date. Short-term investments are stated at cost, which is equivalent to fair value.
Fair values for the Company’s investments in municipal obligations have been determined based on the bid price of the obligation. Securities for which quotations are not readily available are valued at fair value as determined by the board of directors. There were no securities valued by the board of directors, for which quotations were not readily available, as of April 30, 2023 and 2022.
Amortization of Bond Premium or Discount
In determining investment income, bond premiums or discounts are amortized over the remaining term of the obligation based on the earlier of the call date or the maturity date of the applicable bond.
Income Taxes
It is the Company’s policy to comply with the requirements of the Internal Revenue Code that are applicable to regulated investment companies and to distribute substantially all of its taxable income to its shareholders. The Company also intends to distribute sufficient net investment income and net capital gains, if any, so that it will not be subject to excise tax on undistributed income and gains. Therefore, no income tax provision would be required.
The Company recognizes the tax benefits of uncertain tax positions only where the position is “more likely than not” to be sustained assuming examination by tax authorities. Management has analyzed the Company’s tax positions and has concluded that no liability for unrecognized tax benefits should be recorded. The Company is not aware of any tax positions for which it is reasonably possible that the total amounts of unrecognized tax benefits will change materially in the next twelve months.
13
Tridan Corp.
Notes to Financial Statements
April 30, 2023 and 2022
| 1. | Significant Accounting Policies (continued) |
Income Taxes (continued)
The Company identifies its major tax jurisdictions as U.S. Federal, New York State and New York City where the Company makes significant investments. Generally, the Company’s tax returns are subject to examination by Federal, state and local authorities for a period of three years from the later of the due date of such returns or the actual date the returns were filed. Interest income from municipal investments is exempt from Federal and state income taxes.
Interest income from municipal investments is exempt from Federal and state income taxes.
Distributions to Shareholders
Dividends to shareholders from net investment income, if any, are paid quarterly. Distributions of capital gains, if any, are made at least annually, and as required to comply with Federal excise tax requirements. Dividends to shareholders are determined in accordance with tax regulations and are recorded on the ex-dividend date.
Cash
The Company considers all highly liquid investments purchased with original maturities of 90 days or less to be cash equivalents.
Use of Estimates
The preparation of financial statements, in conformity with GAAP, requires management to make estimates and assumptions that affect the reported amounts of assets and liabilities and disclosures of contingent assets and liabilities at the date of the financial statements and the reported amounts of increases and decreases in net assets from operations during the reporting period. Actual results could differ from those estimates.
Concentration of Credit Risk
Financial instruments that potentially subject the Company to concentrations of credit and market risk consist principally of cash, on deposit with financial institutions. Deposits held at financial institutions insured by the Federal Deposit Insurance Corporation (“FDIC”) are insured up to $250,000. The Company maintains all of its cash on deposit in one financial institution. As of April 30, 2023, there was $525,990 of cash held in in excess of federally insured limits. The value of the Company’s investments may be subject to possible risks involving, among other things, the continued creditworthiness of the various state and local government agencies and public financing authorities underlying its investments.
The Company is aware of multiple banks being transferred into government receivership and the appointment of the Federal Deposit Insurance Corporation as receiver. The Company neither holds any cash or cash equivalents nor does it have any banking relationship with the affected banks.
14
Tridan Corp.
Notes to Financial Statements
April 30, 2023 and 2022
| 1. | Significant Accounting Policies (continued) |
Fair value of Financial Instruments
The carrying amounts for accrued interest receivables and accrued liabilities reflected in the financial statements approximate fair value because of the short maturities of these items. The Company accounts for its investments in municipal obligations in accordance with the accounting guidance for investment companies (FASB ASC 946). See Note 1 “Acquisition and Valuation of Investments” for a description of the valuation methodology, which is unchanged as of April 30, 2023 and 2022. FASB ASC 820 clarifies the definition of fair value, prescribes methods for measuring fair value, establishes a fair value hierarchy based on the inputs used to measure fair value and expands disclosures about the use of fair value measurements. The valuation techniques required by FASB ASC 820 are based upon observable and unobservable inputs. Observable inputs reflect market data obtained from independent sources, while unobservable inputs reflect internal market assumptions.
The levels of the fair value hierarchy are as follows:
| | | | |
| Level 1 | | – | | Unadjusted quoted prices in active markets for identical assets or liabilities that a company has the ability to access. Unadjusted quoted prices in active markets for identical assets or liabilities that a company has the ability to access. |
| | |
| Level 2 | | – | | Observable inputs other than quoted prices included in level 1 that are observable for the asset or liability either directly or indirectly. These inputs may include quoted prices for the identical instrument in an inactive market, prices for similar instruments, interest rates, prepayment speeds, credit risks, yield curves, default rates, and similar data. |
| | |
| Level 3 | | – | | Unobservable inputs for the asset or liability to the extent that relevant observable inputs are not available, representing a company’s own assumptions about the assumptions that a market participant would use in valuing the asset or liability, and that would be based on the best information available. |
The Company’s investments in municipal obligations are all considered Level 2 instruments.
The following table presents the Company’s financial assets that are measured at fair value as of April 30, 2023 and 2022:
| | | | | | | | |
| | | Quoted Prices for Identical
Instruments in Non-active Markets
(Level 2) | |
| | | April 30, | |
| | | 2023 | | | 2022 | |
Investments in municipal obligations | | $ | 34,426,800 | | | $ | 34,239,661 | |
| | | | | | | | |
Instruments classified as Level 2 are valued using industry-standard models or other valuation methodologies calibrated to observable market inputs.
15
Tridan Corp.
Notes to Financial Statements
April 30, 2023 and 2022
| 1. | Significant Accounting Policies (continued) |
Fair value of Financial Instruments (continued)
These models consider various assumptions regarding the security or securities with similar characteristics, such as trade data, bid price or spread, two sided markets, quotes, benchmark curves, and market data feeds, as well as other measurements.
Subsequent Events Evaluation by Management
Management has evaluated subsequent events for disclosure and/or recognition in the financial statements through June , 2023, the date that the financial statements were available for issue.
Accrued liabilities consist of the following at:
| | | | | | | | |
| | | April 30, | |
| | | 2023 | | | 2022 | |
Accrued investment advisory and custodian fees (a) | | $ | 34,705 | | | $ | 33,434 | |
| | | | | | | | |
Accrued fees – related party (b) | | $ | 43,882 | | | $ | 18,640 | |
| | | | | | | | |
Accrued other: | | | | | | | | |
Accrued audit fees (c) | | $ | 26,500 | | | $ | 12,625 | |
Accrued administrative | | | 69,371 | | | | 5,365 | |
| | | | | | | | |
| | | $95,871 | | | $17,990 | |
| | | | | | | | |
| | (a) | The Company utilizes the services of J.P. Morgan Investment Management, Inc. as its investment advisor and J.P. Morgan Chase Bank N.A. as its custodian for its investments. The annual advisory fee is .25 of one percent (effective June1, 2020 and .28 prior to that date) and the custody fee is .02 of one percent of the net assets under management. The fee is computed and payable quarterly, based on the aggregate fair value of the net assets on the last day of each fiscal quarter. |
| | (b) | For the years ended April 30, 2023 and 2022, the Company incurred legal fees of approximately $70,000 and $84,000, respectively, for professional fees paid to the law firm of which a former officer of the Company is a member. |
| | (c) | For the years ended April 30, 2023 and 2022, the Company incurred audit fees of approximately $53,000 and $50,000, respectively. |
16
Tridan Corp.
Notes to Financial Statements
April 30, 2023 and 2022
| 3. | Investment Transactions |
Purchases and sales of investments in municipal obligations (excluding short-term and demand investments) amounted to approximately $6,517,000 and $6,047,000, respectively, for the year ended April 30, 2023, and $2,620,000 and $1,000,000, respectively, for the year ended April 30, 2022.
The U.S. Federal income tax basis (aggregate cost) of the Company’s investments, at April 30, 2023 and 2022, was approximately $35,150,000 and $35,345,000, respectively, and net unrealized depreciation) appreciation at April 30, 2023 and 2022, for U.S. Federal income tax purposes was approximately $(724,000) and $1,106,000, respectively (gross unrealized appreciation of $485,000 and $120,000, respectively; gross unrealized depreciation of approximately $(1,208,000) and $(1,226,000), respectively).
| 4. | Common Stock, Share Redemption Plan and Net Asset Values |
At April 30, 2023 and 2022, there were 6,000,000 shares of $0.02 par value common stock authorized of which 3,199,100 had been issued aggregating $63,982.
The Company has a share redemption plan applicable to 18,919 shares outstanding common stock, at April 30, 2023 and 2022. The plan permits eligible shareholders or their estates to have their shares redeemed upon reaching age 65 or upon death. Shares are redeemed at the net asset value per share, as of the end of the Company’s fiscal quarter in which the request for redemption is received. At April 30, 2023 and 2022, there were 117,398.7423 shares, for both years ended, which have been redeemed under this plan.
The net asset value per share is calculated by dividing the aggregate fair value of all assets less the aggregate fair value of all liabilities by the number of common shares outstanding at the end of the period. The net asset values per share and the shares outstanding are as follows:
| | | | | | | | |
| | | April 30, | |
| | | 2023 | | | 2022 | |
Net asset value | | $ | 11.59 | | | $ | 11.48 | |
Shares outstanding at: | | | | | | | | |
April 30, 2023 | | | 3,052,370.3712 | |
April 30, 2022 | | | 3,052,370.3712 | |
17
Tridan Corp.
Notes to Financial Statements
April 30, 2023 and 2022
During the years ended April 30, 2023, 2022 and 2021, distributions of $488,378 ($.16 per share), $396,808 ($.13 per share) and $488,592 ($.16 per share), respectively, were declared and paid to shareholders. Substantially all of the distributions were exempt from Federal income taxes for the company shareholders except for $386 in 2023, $0 in 2022 and $33,016 in 2021.
The tax character of distributions paid during the years ended April 30, 2023, 2022 and 2021 is as follows:
| | | | | | | | | | | | |
| | | 2023 | | | 2022 | | | 2021 | |
Distributions paid from investment income: | | | | | | | | | | | | |
Tax-exempt investment income, net | | $ | 486,712 | | | $ | 396,808 | | | $ | 455,576 | |
Capital gains | | | 1,668 | | | | — | | | | 33,016 | |
| | | | | | | | | | | | |
| | $ | 488,380 | | | $ | 396,808 | | | $ | 488,592 | |
| | | | | | | | | | | | |
As of April 30, 2023, 2022 and 2021, the components of distributable earnings on a tax basis were as follows:
| | | | | | | | | | | | |
| | | 2023 | | | 2022 | | | 2021 | |
(Overdistributed) underdistributedtax-exempt investment income, net | | $ | (235 | ) | | $ | 18,677 | | | $ | (8,369 | ) |
Over undistributed capital gains (losses) | | | (1,282 | ) | | | — | | | | — | |
Unrealized (depreciation) appreciation of investments, net | | | (723,641 | ) | | | (1,105,553 | ) | | | 1,986,510 | |
| | | | | | | | | | | | |
| | $ | (725,158 | ) | | $ | (1,086,876 | ) | | $ | 1,978,141 | |
| | | | | | | | | | | | |
There are no capital loss carryforwards as of April 30, 2023 and 2022. The Company had no capital reclassification related to permanent book/tax differences for the years ended April 30, 2023, 2022 and 2021. There were no significant differences between total GAAP basis net investment income and net realized gain, and actual distributions for the years ended April 30, 2023 and 2022.
18
Tridan Corp.
Notes to Financial Statements
April 30, 2023 and 2022
Selected per share data and ratios are as follows:
| | | | | | | | | | | | | | | | | | | | |
| | | For the Years Ended April 30, | |
| | | 2023 | | | 2022 | | | 2021 | | | 2020 | | | 2019 | |
Per share operating performance: | | | | | | | | | | | | | | | | | | | | |
(For a share of common stock outstanding throughout the year): | | | | | | | | | | | | | | | | | | | | |
Net assets value, beginning of year | | $ | 11.48 | | | $ | 12.48 | | | $ | 12.09 | | | $ | 12.18 | | | $ | 11.91 | |
| | | | | | | | | | | | | | | | | | | | |
Income from investment operations: | | | | | | | | | | | | | | | | | | | | |
Net investment income | | | 0.14 | | | | 0.14 | | | | 0.16 | | | | 0.16 | | | | 0.18 | |
Net realized and unrealized gain (loss) on investments | | | 0.13 | | | | (1.01 | ) | | | 0.39 | | | | (0.07 | ) | | | 0.28 | |
| | | | | | | | | | | | | | | | | | | | |
Total from investment operations | | | 0.27 | | | | (0.87 | ) | | | 0.55 | | | | 0.09 | | | | 0.46 | |
Less distributions: | | | | | | | | | | | | | | | | | | | | |
Dividends (from net investment income) | | | (0.16 | ) | | | (0.13 | ) | | | (0.15 | ) | | | (0.17 | ) | | | (0.18 | ) |
Capital gains | | | — | | | | — | | | | (0.01 | ) | | | (0.01 | ) | | | (0.01 | ) |
| | | | | | | | | | | | | | | | | | | | |
Total distributions | | | (0.16 | ) | | | (0.13 | ) | | | (0.16 | ) | | | (0.18 | ) | | | (0.19 | ) |
Net asset value – end of year | | $ | 11.59 | | | $ | 11.48 | | | $ | 12.48 | | | $ | 12.09 | | | $ | 12.18 | |
| | | | | | | | | | | | | | | | | | | | |
Per share value – end of year | | $ | 11.59 | | | $ | 11.48 | | | $ | 12.48 | | | $ | 12.09 | | | $ | 12.18 | |
| | | | | | | | | | | | | | | | | | | | |
| | | | | |
* Total investment return | | | 2.43 | % | | | -7.00 | % | | | 4.50 | % | | | 0.78 | % | | | 3.87 | % |
Ratios/Supplemental Data: | | | | | | | | | | | | | | | | | | | | |
Net assets, end of year (in 000’s) | | $ | 35,030 | | | $ | 35,030 | | | $ | 38,095 | | | $ | 36,944 | | | $ | 37,221 | |
Ratio of expenses to average net assets | | | 1.15 | % | | | 1.03 | % | | | 1.04 | % | | | 1.06 | % | | | 1.08 | % |
Ratio of net investment income to average net assets | | | 1.33 | % | | | 1.16 | % | | | 1.27 | % | | | 1.33 | % | | | 1.55 | % |
Portfolio turnover rate | | | 16.56 | % | | | 2.74 | % | | | 11.44 | % | | | 8.63 | % | | | 16.51 | % |
Average (simple) number of shares outstanding (in thousands) | | | 3,053 | | | | 3,053 | | | | 3,053 | | | | 3,054 | | | | 3,057 | |
| | * | Total investment return is calculated by dividing the change in market value of a share of common stock during the year, assuming the reinvestment of dividends on the payment date, by the per share market value at the beginning of the year and has been recalculated for all prior periods presented. |
* * * * *
19
(b) Not applicable.
The registrant has adopted a code of ethics that applies to its principal executive officer and, principal financial officer, and any other person required by applicable SEC rules. The code of ethics was in effect as of the end of the period covered by this report. During that period, there were no amendments to the code of ethics, and no waivers, including any implicit waivers, were granted to individuals covered by the code of ethics. anyone from any provision of the code. A copy of the registrant’s code of ethics is incorporated herein by reference as Exhibit 13 (a)(1) to the registrant’s Form N-CSR dated April 30, 2023, for its fiscal year ended April 30, 2023, filed with the Securities and Exchange Commission.
| Item 3. | Audit Committee Financial Expert |
The registrant has established an audit committee consisting of three members appointed by the board of directors. Each member of the registrant’s audit committee is a member of its board of directors. The registrant’s board of directors has determined that the committee chairperson, Joan Rall, is an “audit committee financial expert” and is “independent”, as both terms are defined by applicable SEC rules.
| Item 4. | Principal Accountant Fees and Services |
(a) Audit Fees. Mazars USA LLP (“Mazars”), the registrant’s principal accountant, billed the registrant a total of $53,000 for the 2023 fiscal year, and $50,000 for the 2022 fiscal year, for the audit of the registrant’s annual financial statements and in connection with statutory and regulatory filings for those years.
(b) Audit-Related Fees. Mazars billed no fees to the registrant for the last two fiscal years for any audit-related services.
(c) Tax Fees. Mazars billed no fees to the registrant for the last two fiscal years for tax compliance, tax advice or tax planning.
(d) All Other Fees. Mazars billed no fees to the registrant for the last two fiscal years for any other services.
(e)(1) Disclose the audit committee’s pre-approval policies and procedures described in paragraph (c)(7) of Rule 2-01 of Regulation S-X.
Pursuant to its charter, the registrant’s audit committee must discuss with the registrant’s independent auditors the overall scope and plans for the audit,
and any other services to be performed by them, including the adequacy of staffing and compensation, all of which services shall be subject to the Audit Committee’s approval.
(e)(2) The percentage of services described in each of paragraphs (b) through (d) of this Item that were approved by the audit committee pursuant to paragraph (c)(7)(i)(C) of Rule 2-01 of Regulation S-X are as follows:
(b) Not applicable.
(c) Not applicable.
(d) Not applicable.
(f) The percentage of hours expended on the principal accountant’s engagement to audit the registrant’s financial statements for the most recent fiscal year that were attributed to work performed by persons other than the principal accountant’s full-time, permanent employees was zero percent (0%).
(g) The aggregate non-audit fees billed by the registrant’s principal accountant for services rendered to the registrant, and rendered to the registrant’s investment adviser (not including any sub-adviser whose role is primarily portfolio management and is subcontracted with or overseen by another investment adviser), and any entity controlling, controlled by, or under common control with the adviser that provides ongoing services to the registrant for each of the last two fiscal years of the registrant was $0 for 2023 and $0 for 2022.
(h) Not applicable.
(i) Not applicable.
(j) Not applicable.
| Item 5. | Audit Committee of Listed Registrants. |
Not applicable, because the registrant is not a listed issuer.
(a) A schedule of registrant’s investments in securities of unaffiliated issuers as of April 30, 2023 is included as part of the report to shareholders filed under Item 1(a) of this Form N-CSR.
(b) Not applicable
| Item 7. | Disclosure of Proxy Voting Policies and Procedures for Closed-End Management Investment Companies. |
Not applicable, because the registrant invests exclusively in non-voting securities.
| Item 8: | Portfolio Managers of Closed-End Management Investment Companies. |
PORTFOLIO MANAGERS
As of the date of this filing, the Portfolio Managers for Tridan Corporation (“Fund”) are as follows:
Richard Taormina, Managing Director, is the lead portfolio manager of the Tax Aware Strategies Group. An employee of J.P. Morgan Investment Management Inc. since 1997, he is responsible for managing municipal and tax-aware mutual funds, high net worth and institutional fixed income accounts, and quantitative analysis.
Kevin M. Ellis, Managing Director, is a senior portfolio manager for the Tax Aware Strategies Group and is responsible for managing tax aware separate accounts. Mr. Ellis has been an employee of J.P. Morgan Investment Management Inc. since 2003.
PORTFOLIO MANAGER’S OTHER ACCOUNTS MANAGED
The following tables show information regarding other accounts managed by the portfolio managers of the Fund, as of April 30, 2023. The portfolio managers did not manage any accounts with a performance based advisory fee.
| | | | | | | | | | | | | | | | | | | | | | | | |
| | | Non-Performance Based Fee Advisory Accounts | |
| | | Registered Investment
Companies | | | Other Pooled Investment
Vehicles | | | Other Accounts | |
| | | Number
of
Accounts | | | Total
Assets | | | Number
of
Accounts | | | Total
Assets | | | Number
of
Accounts | | | Total Assets | |
Richard Taormina | | | 7 | | | $ | 10,139,069,000 | | | | 0 | | | $ | 0 | | | | 4 | | | $ | 496,994,000 | |
Kevin M. Ellis | | | 3 | | | $ | 6,017,723,000 | | | | 0 | | | $ | 0 | | | | 101 | | | $ | 2,863,571,000 | |
POTENTIAL CONFLICTS OF INTEREST
The potential for conflicts of interest exists when portfolio managers manage other accounts with similar investment objectives and strategies as the Fund (“Similar Accounts”). Potential conflicts may include, for example, conflicts between investment
strategies and conflicts in the allocation of investment opportunities. Responsibility for managing the Advisor’s and its affiliates’ clients’ portfolios is organized according to investment strategies within asset classes. Generally, client portfolios with similar strategies are managed by portfolio managers in the same portfolio management group using the same objectives, approach and philosophy. Underlying sectors or strategy allocations within a larger portfolio are likewise managed by portfolio managers who use the same approach and philosophy as similarly managed portfolios. Therefore, portfolio holdings, relative position sizes and industry and sector exposures tend to be similar across similar portfolios and strategies, which minimizes the potential for conflicts of interest.
J.P. Morgan Investment Management Inc. (the “Advisor”) and/or its affiliates (“JPMorgan Chase”) perform investment services, including rendering investment advice, to varied clients. The Advisor, JPMorgan Chase and its or their directors, officers, agents, and/or employees may render similar or differing investment advisory services to clients and may give advice or exercise investment responsibility and take such other action with respect to any of its other clients that differs from the advice given or the timing or nature of action taken with respect to another client or group of clients. It is the Advisor’s policy, to the extent practicable, to allocate, within its reasonable discretion, investment opportunities among clients over a period of time on a fair and equitable basis. One or more of the Advisor’s other client accounts may at any time hold, acquire, increase, decrease, dispose, or otherwise deal with positions in investments in which another client account may have an interest from time-to-time.
The Advisor, JPMorgan Chase, and any of its or their directors, partners, officers, agents or employees, may also buy, sell, or trade securities for their own accounts or the proprietary accounts of the Advisor and/or JPMorgan Chase. The Advisor and/or JPMorgan Chase, within their discretion, may make different investment decisions and other actions with respect to their own proprietary accounts than those made for client accounts, including the timing or nature of such investment decisions or actions. Further, the Advisor is not required to purchase or sell for any client account securities that it, JPMorgan Chase, and any of its or their employees, principals, or agents may purchase or sell for their own accounts or the proprietary accounts of the Advisor, or JPMorgan Chase or its clients.
The Advisor and/or its affiliates may receive more compensation with respect to certain Similar Accounts than that received with respect to the Fund or may receive compensation based in part on the performance of certain Similar Accounts. This may create a potential conflict of interest for the Advisor and its affiliates or the portfolio managers by providing an incentive to favor these Similar Accounts when, for example, placing securities transactions. In addition, the Advisor or its affiliates could be viewed as having a conflict of interest to the extent that the Advisor or an affiliate has a proprietary investment in Similar Accounts, the portfolio managers have personal investments in Similar Accounts or the Similar Accounts are investment options in the Advisor’s or its affiliates’ employee benefit plans. Potential conflicts of interest may arise with both the aggregation and allocation of securities transactions and allocation of
investment opportunities because of market factors or investment restrictions imposed upon the Advisor and its affiliates by law, regulation, contract or internal policies. Allocations of aggregated trades, particularly trade orders that were only partially completed due to limited availability and allocation of investment opportunities generally, could raise a potential conflict of interest, as the Advisor or its affiliates may have an incentive to allocate securities that are expected to increase in value to favored accounts. Initial public offerings, in particular, are frequently of very limited availability. The Advisor and its affiliates may be perceived as causing accounts they manage to participate in an offering to increase the Advisor’s and its affiliates’ overall allocation of securities in that offering. A potential conflict of interest also may be perceived to arise if transactions in one account closely follow related transactions in a different account, such as when a purchase increases the value of securities previously purchased by another account, or when a sale in one account lowers the sale price received in a sale by a second account. If the Advisor or its affiliates manage accounts that engage in short sales of securities of the type in which the Fund invests, the Advisor or its affiliates could be seen as harming the performance of the Fund for the benefit of the accounts engaging in short sales if the short sales cause the market value of the securities to fall.
As an internal policy matter, the Advisor or its affiliates may from time to time maintain certain overall investment limitations on the securities positions or positions in other financial instruments the Advisor or its affiliates will take on behalf of its various clients due to, among other things, liquidity concerns and regulatory restrictions. Such policies may preclude the Fund from purchasing particular securities or financial instruments, even if such securities or financial instruments would otherwise meet the Fund’s objectives.
The goal of the Advisor and its affiliates is to meet their fiduciary obligation with respect to all clients. The Advisor and its affiliates have policies and procedures that seek to manage conflicts. The Advisor and its affiliates monitor a variety of areas, including compliance with fund guidelines, review of allocation decisions and compliance with the Advisor’s Codes of Ethics and JPMorgan Chase and Co.’s Code of Conduct. With respect to the allocation of investment opportunities, the Advisor and its affiliates also have certain policies designed to achieve fair and equitable allocation of investment opportunities among its clients over time. For example: Orders for the same equity security traded through a single trading desk or system are aggregated on a continual basis throughout each trading day consistent with the Advisor’s and its affiliates’ duty of best execution for their clients. If aggregated trades are fully executed, accounts participating in the trade will be allocated their pro rata share on an average price basis. Partially completed orders generally will be allocated among the participating accounts on a pro-rata average price basis, subject to certain limited exceptions. For example, accounts that would receive a de minimis allocation relative to their size may be excluded from the order. Another exception may occur when thin markets or price volatility require that an aggregated order be completed in multiple executions over several days. If partial completion of the order would result in an uneconomic allocation to an account due to fixed transaction or custody costs, the Advisor and its affiliates may exclude small orders until 50% of the total order is
completed. Then the small orders will be executed. Following this procedure, small orders will lag in the early execution of the order, but will be completed before completion of the total order.
Purchases of money market instruments and fixed income securities cannot always be allocated pro-rata across the accounts with the same investment strategy and objective. However, the Advisor and its affiliates attempt to mitigate any potential unfairness by basing non-pro rata allocations traded through a single trading desk or system upon objective predetermined criteria for the selection of investments and a disciplined process for allocating securities with similar duration, credit quality and liquidity in the good faith judgment of the Advisor or its affiliates so that fair and equitable allocation will occur over time.
PORTFOLIO MANAGER COMPENSATION
The Advisor’s compensation programs are designed to align the behavior of employees with the achievement of its short- and long-term strategic goals, which revolve around client investment objectives. This is accomplished, in part, through a balanced performance assessment process and total compensation program, as well as a clearly defined culture that rigorously and consistently promotes adherence to the highest ethical standards.
In determining portfolio manager compensation, the Advisor uses a balanced discretionary approach to assess performance against four broad categories: (1) business results; (2) risk and control; (3) customers and clients; and (4) people and leadership.
These performance categories consider short-, medium- and long-term goals that drive sustained value for clients, while accounting for risk and control objectives. Specifically, portfolio manager performance is evaluated against various factors including the following: (1) blended pre-tax investment performance relative to competitive indices, generally weighted more to the long-term; (2) individual contribution relative to the client’s risk/return objectives; and (3) adherence with the Advisor’s compliance, risk and regulatory procedures.
Feedback from the Advisor’s risk and control professionals is considered in assessing performance.
The Advisor maintains a balanced total compensation program comprised of a mix of fixed compensation (including a competitive base salary and, for certain employees, a fixed cash allowance), variable compensation in the form of cash incentives, and long-term incentives in the form of equity based and/or fund-tracking incentives that vest over time. Long-term awards comprise of up to 60% of overall incentive compensation, depending on an employee’s pay level.
Long-term awards are generally in the form of time-vested JPMC Restricted Stock Units (“RSUs”). However, portfolio managers are subject to a mandatory
deferral of long-term incentive compensation under JPMorgan’s Mandatory Investor Plan (“MIP”). The MIP provides for a rate of return equal to that of the Fund(s) that the portfolio managers manage, thereby aligning portfolio manager’s pay with that of their client’s experience/return. 100% of the portfolio manager’s long-term incentive compensation is eligible for MIP with 50% allocated to the specific Fund(s) they manage, as determined by their respective manager. The remaining portion of the overall amount is electable and may be treated as if invested in any of the other Funds available in the plan or can take the form of RSUs.
As of April 30, 2023, the Portfolio Managers did not beneficially own any shares of the Fund.
| Item 9. | Purchases of Equity Securities by Closed-End Management Investment Company and Affiliated Purchasers. |
Not applicable, because the registrant has no equity securities that are registered pursuant to Section 12 of the Securities Exchange Act of 1934.
| Item 10. | Submission of Matters to a Vote of Security Holders. |
The registrant does not have in place procedures by which shareholders may recommend nominees to the registrant’s board of directors.
| Item 11. | Controls and Procedures |
| | (a) | The registrant’s principal executive and principal financial officers have evaluated the registrant’s disclosure controls and procedures (as defined in Rule 30a-3(c) under the Investment Company Act of 1940, as amended the “1940 Act”)) as of a date within 90 days of the filing date of this report. Based on that evaluation as required by Rule 30a-3(b) of the 1940 Act said officers have concluded that the registrant’s disclosure controls and procedures are effective to ensure that information required to be disclosed in this report is recorded, processed, summarized and reported within the required time periods. |
| | (b) | There was no change in the registrant’s internal control over financial reporting that occurred during the period covered by this report that has materially affected, or is reasonably likely to materially affect, the registrant’s internal control over financial reporting. |
| Item 12. | Disclosure of Securities Lending Activities for Closed-End Management Investment Companies |
(a) The following exhibit is filed herewith:
(1) The registrant’s code of ethics referenced in Item 2 is incorporated by reference to Exhibit 12(a)(1) of the registrant’s Form N-CSR filed with the SEC via EDGAR on July 12, 2021.
(2) The separate certification required by Rule 30a-2(a) under the 1940 Act for the registrant’s principal executive and principal financial officers are filed herewith.
(3) Not applicable.
(4) Not applicable.
(5) Not applicable.
(b) Not applicable.
SIGNATURES
Pursuant to the requirements of the Investment Company Act of 1940, the registrant has duly caused this report to be signed on its behalf by the undersigned, thereunto duly authorized.
| | | | |
| (Registrant) | | Tridan Corp. | | |
| | | | |
| By (Signature and Title) | | | | /s/ Mark Goodman |
| | | | Mark Goodman, |
| | | | President |
Pursuant to the requirements of the Investment Company Act of 1940, this report has been signed below by the following persons on behalf of the registrant and in the capacities and on the dates indicated.
| | | | |
| By (Signature and Title) | | | | /s/ Mark Goodman |
| | | | Mark Goodman, |
| | | | President |
| | |
Date: 07/06/2023 | | | | |
| | |
| | | | /s/ Mark Goodman |
| | | | Mark Goodman, |
| | | | Treasurer and Principal Financial Officer |
| | |
Date: 07/06/2023 | | | | |