EXHIBIT 99.2
| MANAGEMENT’S DISCUSSION AND ANALYSIS |
The following discussion and analysis of the operations, results, and financial position of Avino Silver & Gold Mines Ltd. (the “Company” or “Avino”) should be read in conjunction with the Company’s condensed consolidated interim financial statements for the three months ended March 31, 2018, and the audited consolidated financial statements as at and for the year ended December 31, 2017, and the notes thereto.
This Management’s Discussion and Analysis (“MD&A”) is dated May 15, 2018, and discloses specified information up to that date. The condensed consolidated interim financial statements are prepared in accordance with International Financial Reporting Standards (“IFRS”) as issued by the International Accounting Standards Board (“IASB”). Unless otherwise cited, references to dollar amounts are in US dollars. This MD&A contains “forward-looking statements” that are subject to risk factors including those set out in the “Cautionary Statement” at the end of this MD&A. All information contained in this MD&A is current and has been approved by the Company’s Board of Directors as of May 15, 2018, unless otherwise indicated. Throughout this report we refer to “Avino”, the “Company”, “we”, “us”, “our”, or “its”. All these terms are used in respect of Avino Silver & Gold Mines Ltd. We recommend that readers consult the “Cautionary Statement” on the last page of this report. Additional information relating to the Company is available on the Company’s website at www.avino.com and on SEDAR at www.sedar.com.
Effective January 1, 2017, the Company changed its presentation currency to US dollars from Canadian dollars. As a result, all dollar amounts in this MD&A are expressed in US dollars, unless otherwise noted. Please refer to the section “Changes in Accounting Standards” for further details regarding the change in presentation currency.
Business Description
Founded in 1968, the Company is engaged in the production and sale of silver, gold, and copper bulk concentrate, and the acquisition, exploration, and evaluation of mineral properties. The Company holds mineral claims and leases in Durango, Mexico, and in British Columbia and Yukon, Canada. Avino is a reporting issuer in all of the provinces of Canada, except for Quebec, and a foreign private issuer with the Securities and Exchange Commission in the United States. The Company’s shares trade on the Toronto Stock Exchange (“TSX”), under the symbol “ASM” (the Company graduated from the TSX Venture Exchange on January 8, 2018), on the NYSE American under the symbol “ASM”, and on the Berlin and Frankfurt Stock Exchanges under the symbol “GV6”.
1 | P a g e |
| MANAGEMENT’S DISCUSSION AND ANALYSIS |
Overall Performance and Highlights
HIGHLIGHTS (Expressed in US$) |
| First Quarter 2018 |
|
| First Quarter 2017 |
|
| Change |
| |||
Operating |
| |||||||||||
Tonnes Milled |
|
| 140,817 |
|
|
| 136,686 |
|
|
| 3 | % |
Silver Ounces Produced |
|
| 309,927 |
|
|
| 320,082 |
|
|
| -3 | % |
Gold Ounces Produced |
|
| 2,065 |
|
|
| 1,837 |
|
|
| 12 | % |
Copper Pounds Produced |
|
| 970,165 |
|
|
| 1,024,853 |
|
|
| -5 | % |
Silver Equivalent Ounces1 Produced |
|
| 656,699 |
|
|
| 604,643 |
|
|
| 9 | % |
Concentrate Sales and Cash Costs | ||||||||||||
Silver Equivalent Ounces Sold2 |
|
| 566,157 |
|
|
| 524,356 |
|
|
| 8 | % |
Cash Cost per Silver Equivalent Ounce2,3 |
| $ | 9.63 |
|
| $ | 8.01 |
|
|
| 20 | % |
All-in Sustaining Cash Cost per Silver Equivalent Ounce2,3 |
| $ | 11.74 |
|
| $ | 9.55 |
|
|
| 23 | % |
Average Realized Silver Price per Ounce |
| $ | 16.73 |
|
| $ | 17.38 |
|
|
| -4 | % |
Average Realized Gold Price per Ounce |
| $ | 1,330 |
|
| $ | 1,218 |
|
|
| 9 | % |
Average Realized Copper Price per Tonne |
| $ | 6,979 |
|
| $ | 5,873 |
|
|
| 19 | % |
Financial | ||||||||||||
Revenues |
| $ | 8,155,902 |
|
| $ | 8,127,863 |
|
|
| 0 | % |
Mine Operating Income |
| $ | 1,855,360 |
|
| $ | 3,460,843 |
|
|
| -46 | % |
Net Income |
| $ | 817,501 |
|
| $ | 721,305 |
|
|
| 13 | % |
Cash |
| $ | 2,340,073 |
|
| $ | 3,419,532 |
|
|
| -32 | % |
Working Capital |
| $ | 11,558,478 |
|
| $ | 16,402,359 |
|
|
| -30 | % |
Per Share Amounts | ||||||||||||
Earnings per Share ("EPS") – Basic |
| $ | 0.02 |
|
| $ | 0.01 |
|
|
| 100 | % |
Cash Flow per Share (YTD)3 – Basic |
| $ | 0.02 |
|
| $ | 0.04 |
|
|
| -50 | % |
1. In Q1 2018, AgEq was calculated using metals prices of $16.77 oz Ag, $1,330 oz Au and $3.16 lb Cu. In Q1 2017, AgEq was calculated using metals prices of $17.05 oz Ag, $1,258 oz Au and $2.80 lb Cu.
2. “Silver equivalent ounces sold” for the purposes of cash costs and all-in sustaining costs consists of the sum of silver ounces, gold ounces and copper tonnes sold multiplied by the ratio of the average spot gold and copper prices to the average spot silver price for the corresponding period.
3. The Company reports non-IFRS measures which include cash cost per silver equivalent ounce, all-in sustaining cash cost per ounce, and cash flow per share. These measures are widely used in the mining industry as a benchmark for performance, but do not have a standardized meaning and the calculation methods may differ from methods used by other companies with similar reported measures.
During the three months ended March 31, 2018, the Company produced 2,166 tonnes of bulk copper/silver/gold concentrate from its Avino Mine, and 1,074 tonnes of bulk silver/gold concentrate from its San Gonzalo Mine, and recognized revenues of $6,169,515 on the sale of 2,273 tonnes of Avino Mine bulk copper/silver/gold concentrate and $1,986,387 on the sale of 717 tonnes of San Gonzalo bulk silver/gold concentrate, net of penalties, treatment costs and refining charges, for a mine operating income of $1,855,360. Metal prices for revenues recognized during the three months ended March 31, 2018, averaged $16.73 per ounce of silver, $1,330 per ounce of gold, and $6,979 per tonne of copper. In the three months ended March 31, 2018, the Company produced 22,343 silver equivalent (“AgEq”) ounces of low grade zinc concentrate.
Consolidated cash cost per silver equivalent AgEq ounce for the three months ended March 31, 2018, was $9.63, while consolidated all-in sustaining cash cost per AgEq ounce was $11.74.
2 | P a g e |
| MANAGEMENT’S DISCUSSION AND ANALYSIS |
The Company’s cash balance at March 31, 2018, totaled $2,340,073 compared to $3,419,532 at December 31, 2017, and $7,654,982 at March 31, 2017. Working capital totaled $11,558,478 at March 31, 2018, compared to $16,402,359 at December 31, 2017, and $21,133,853 at March 31, 2017.
Flow Through Share Offering
Subsequent to March 31, 2018, the Company closed a private placement of 3,000,000 flow-through common shares for gross proceeds of C$6,000,000. The Company will use the gross proceeds raised from the offering to incur qualifying Canadian exploration expenses and flow-through mining expenditures on its Bralorne Mine, located in British Columbia, which will be renounced to the purchasers of the flow-through shares for the 2018 taxation year.
Sales Agreement & Prepayment
Subsequent to March 31, 2018, the Company signed a sales agreement with MK Metal Trading Mexico S.A. de C.V., a subsidiary of Ocean Partners, to sell San Gonzalo concentrate for a 12 month period. As per the agreement, the Company received a prepayment of $2,000,000, which will be repaid in equal monthly installments for a 12 month period ending March 2019. The prepayment will be used to fund the remaining expenditures related to Mill Circuit 4 in Mexico.
Discussion of Operations
The Company’s production, exploration, and evaluation activities during the three months ended March 31, 2018, have been conducted on its Avino Property and its Bralorne Mine property.
The Company holds a 99.67% effective interest in Compañía Minera Mexicana de Avino, S.A. de C.V. (“Avino Mexico”), a Mexican corporation which owns the Avino Property. The Avino Property covers approximately 1,104 contiguous hectares, and is located approximately 80 km north-east of the city of Durango. The Avino Property is equipped with milling and processing facilities that presently process all output from the San Gonzalo and Avino Mines located on the property.
The Company also holds a 100% interest in the Bralorne Mine property through its ownership of Bralorne Gold Mines Ltd. The Bralorne Mine property consists of a comprehensive package of mineral claims, land parcels, and equipment and infrastructure assembled during historic mining operations in the Bridge River mining camp of southwest British Columbia.
Consolidated First Quarter 2018 Production Highlights
Comparative production results from the Avino Mine and San Gonzalo Mine for the first quarter of 2018 and the first quarter of 2017 are presented below:
|
| Q1 |
|
| Q1 |
|
| % |
| |||
Total Silver Produced (oz) calculated |
|
| 309,927 |
|
|
| 320,082 |
|
|
| -3 | % |
Total Gold Produced (oz) calculated |
|
| 2,065 |
|
|
| 1,837 |
|
|
| 12 | % |
Total Copper Produced (Lbs) calculated |
|
| 970,165 |
|
|
| 1,024,853 |
|
|
| -5 | % |
Total Silver Eq. Produced (oz) calculated1 |
|
| 656,699 |
|
|
| 604,643 |
|
|
| 9 | % |
________
1 In Q1 2018, AgEq was calculated using metals prices of $16.77 oz Ag, $1,330 oz Au and $3.16 lb Cu. In Q1 2017, AgEq was calculated using metals prices of $17.05 oz Ag, $1,258 oz Au and $2.80 lb Cu.
3 | P a g e |
| MANAGEMENT’S DISCUSSION AND ANALYSIS |
Avino Mine Production Highlights
Comparative figures for the first quarter 2018 and the first quarter of 2017 for the Avino Mine are as follows:
|
| Q1 2018 |
|
| Q1 2017 |
|
| Quarterly Change % |
| |||
Total Mill Feed (dry tonnes) |
|
| 120,631 |
|
|
| 116,553 |
|
|
| 3 | % |
Feed Grade Silver (g/t) |
|
| 56 |
|
|
| 61 |
|
|
| -8 | % |
Feed Grade Gold (g/t) |
|
| 0.58 |
|
|
| 0.50 |
|
|
| 16 | % |
Feed Grade Copper (%) |
|
| 0.43 |
|
|
| 0.44 |
|
|
| -2 | % |
Recovery Silver (%) |
|
| 81 |
|
|
| 86 |
|
|
| -6 | % |
Recovery Gold (%) |
|
| 68 |
|
|
| 67 |
|
|
| 1 | % |
Recovery Copper (%) |
|
| 84 |
|
|
| 91 |
|
|
| -8 | % |
Total Silver Produced (kg) |
|
| 5,438 |
|
|
| 6,083 |
|
|
| -11 | % |
Total Gold Produced (g) |
|
| 48,036 |
|
|
| 38,935 |
|
|
| 23 | % |
Total Copper Produced (Kg) |
|
| 440,060 |
|
|
| 464,866 |
|
|
| -5 | % |
Total Silver Equivalent Produced (oz) calculated* |
|
| 480,315 |
|
|
| 439,163 |
|
|
| 9 | % |
________
1 In Q1 2018, AgEq was calculated using metals prices of $16.77 oz Ag, $1,330 oz Au and $3.16 lb Cu. In Q1 2017, AgEq was calculated using metals prices of $17.05 oz Ag, $1,258 oz Au and $2.80 lb Cu.
Under National Instrument 43-101, the Company is required to disclose that it has not based its production decisions on NI 43-101-compliant reserve estimates, preliminary economic assessments, or feasibility studies, and historically projects without such reports have increased uncertainty and risk of economic viability. The Company's decision to place a mine into operation at levels intended by management, expand a mine, make other production-related decisions, or otherwise carry out mining and processing operations is largely based on internal non-public Company data, and on reports based on exploration and mining work by the Company and by geologists and engineers engaged by the Company. The results of this work are evident in the Company's discovery of the San Gonzalo and Avino Mine resources, and in the Company's record of mineral production and financial returns since operations at levels intended by management commenced at the San Gonzalo Mine in 2012.
At the Avino mine during the first quarter, we advanced 1,188 metres of underground development, and 116,155 tonnes of mill feed were trucked to the plant for processing. An additional 4,476 tonnes from historic stockpiles were also processed during the quarter. The blending of the historic stockpile material with fresh underground material resulted in lower copper and silver recoveries for the quarter. Gold feed grade for the quarter increased by 16% and gold production for the quarter increased by 23%.
The construction of Mill Circuit 4 is almost complete, and the installation of a filter press and a bank of flotation cells from Outotec, and piping for the thickener are now underway. This work is expected to be completed late May, 2018. The start-up and commissioning of the ball mill for Mill Circuit 4 commenced during the quarter with the flotation feed from the new ball mill reporting to Mill Circuit 3’s flotation cells. There have been no issues encountered, and the mill is operating at design capacity.
At the Avino Mine, development is now taking place at level 16.5 near a high-grade gold zone for potential future mill feed. Rehabilitation work at the San Luis portal has also started. The portal entrance has been stabilized with shotcrete and the areas with poor ground conditions have been reinforced with wire mesh and rock anchors. A new electrical substation near the portal has been installed to provide power to the mine and piping for a new water line to the portal is currently being installed.
4 | P a g e |
| MANAGEMENT’S DISCUSSION AND ANALYSIS |
San Gonzalo Mine Production Highlights
Comparative figures for the first quarter 2018 and the first quarter of 2017 for the San Gonzalo Mine are as follows:
|
| Q1 2018 |
|
| Q1 2017 |
|
| Quarterly Change % |
| |||
Total Mill Feed (dry tonnes) |
|
| 20,186 |
|
|
| 20,133 |
|
|
| 0 | % |
Feed Grade Silver (g/t) |
|
| 264 |
|
|
| 229 |
|
|
| 15 | % |
Feed Grade Gold (g/t) |
|
| 1.1 |
|
|
| 1.2 |
|
|
| -10 | % |
Recovery Silver (%) |
|
| 79 |
|
|
| 84 |
|
|
| -6 | % |
Recovery Gold (%) |
|
| 75 |
|
|
| 76 |
|
|
| -1 | % |
Total Silver Produced (kg) |
|
| 4,201 |
|
|
| 3,873 |
|
|
| 8 | % |
Total Gold Produced (g) |
|
| 16,206 |
|
|
| 18,182 |
|
|
| -11 | % |
Total Silver Equivalent Produced (oz) calculated* |
|
| 176,384 |
|
|
| 165,480 |
|
|
| 7 | % |
________
1 In Q1 2018, AgEq was calculated using metals prices of $16.77 oz Ag, $1,330 oz Au and $3.16 lb Cu. In Q1 2017, AgEq was calculated using metals prices of $17.05 oz Ag, $1,258 oz Au and $2.80 lb Cu.
Under National Instrument 43-101, the Company is required to disclose that it has not based its production decisions on NI 43-101-compliant reserve estimates, preliminary economic assessments, or feasibility studies, and historically projects without such reports have increased uncertainty and risk of economic viability. The Company's decision to place a mine into operation at levels intended by management, expand a mine, make other production-related decisions, or otherwise carry out mining and processing operations is largely based on internal non-public Company data, and on reports based on exploration and mining work by the Company and by geologists and engineers engaged by the Company. The results of this work are evident in the Company's discovery of the San Gonzalo and Avino Mine resources, and in the Company's record of mineral production and financial returns since operations at levels intended by management commenced at the San Gonzalo Mine in 2012.
The silver grades at San Gonzalo for Q1, 2018 increased by 15% and the gold grades decreased by 10% compared to Q1, 2017, as a result of the mineralization of the area being mined. Mill feed for the quarter came for Levels 4-020, 5-020 and 6-020.
Underground development consisted of 362 metres of drifts, 255 metres of raises, and 134 metres of crosscuts for a total of 751 metres.
Additionally, the tonnage broken for the quarter was 14,677 tonnes. The plant availability for the first quarter 2018 was 96%, and there no major shut downs other than the normal scheduled maintenance.
5 | P a g e |
| MANAGEMENT’S DISCUSSION AND ANALYSIS |
Zinc Circuit
The Company continued its testing program for recovery of precious metals and zinc from the San Gonzalo tailings. In Q1, 2018, the Company produced 233 tonnes of low quality zinc concentrate grading 1,582 g/t silver, 6.96 g/t gold and 13.35% zinc for an additional 22,343 AgEq ounces. This product is considered a by-product and is recorded as a reduction to cost of sales through the consolidated statements of operations.
Updated Resource Estimate
In February 2018, Avino announced the results of an updated resource estimate for the Avino property. The updated estimate encompasses the Property’s San Gonzalo Mine, the Avino Mine vein systems, and the Property’s Oxide Tailings. The mineral resources estimate has been included in an updated technical report prepared by Aranz Geo Ltd. under National Instrument 43-101 (“NI-43-101”), which was filed on SEDAR under the Company’s profile on April 6, 2018.
This updated mineral resource estimate includes 34 drill holes that were completed during the drill programs from 2016 to 2017. These drilling programs have significantly increased the amount of information available for resource estimation. The drill holes and assay data were incorporated into the updated mineral resource estimate. The results of the additional drilling contributed to an approximate 225% increase in tonnage in the Measured and Indicated Resource categories and a decrease of 25% in the Inferred resource due to a conversion of a portion of the Inferred Resources to the Indicated Resource category.
The following is a summary of current resources at the San Gonzalo and Avino Mines, as well as the updated oxide tailings resource, grouped into the measured, indicated and inferred categories. The effective date of the resource estimates is February 21, 2018.
The resource estimates were prepared by Michael O’Brien P.Geo., Pr.Sci.Nat., who is a “Qualified Person” within the meaning of NI 43-101 and who is an employee of ARANZ Geo and independent of Avino, as defined by Section 1.5 of NI 43-101.
6 | P a g e |
| MANAGEMENT’S DISCUSSION AND ANALYSIS |
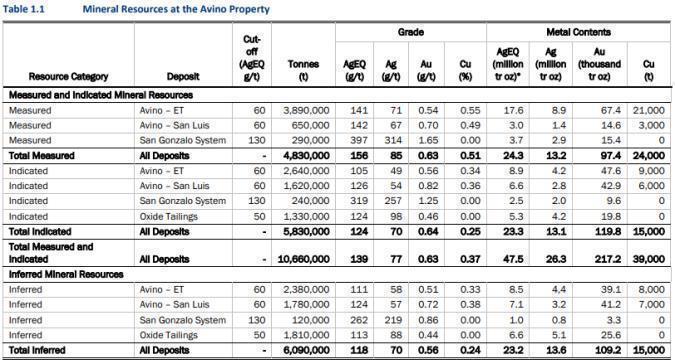
Mineral resources which are not mineral reserves do not have demonstrated economic viability. The estimate of mineral resources may be materially affected by environmental, permitting, legal, title, taxation, sociopolitical, marketing, or other relevant issues. The quantity and grade of reported Inferred resources in this estimation are uncertain in nature and there has been insufficient exploration to define these Inferred resources as an Indicated or Measured mineral resource and it is uncertain if further exploration will result in upgrading them to the Indicated or Measured mineral resource category.
Figures in the table may not add to the totals shown due to rounding.
The mineral resource estimate is classified in accordance with the Canadian Institute of Mining, Metallurgy and Petroleum's "CIM Definition Standards- for Mineral Resources and Mineral Reserves" incorporated by reference into National Instrument 43-101 "Standards of Disclosure for Mineral Projects".
Mineral Resources are reported at cut-off grades 60, 130 and 50 g/t silver equivalent grade for the Avino, San Gonzalo and oxide tailings respectively as indicated in the table.
Cautionary Note to United States Investors - The information contained herein and incorporated by reference herein has been prepared in accordance with the requirements of Canadian securities laws, which differ from the requirements of United States securities laws. In particular, the term “resource” does not equate to the term “reserve”. The Securities Exchange Commission’s (the “SEC”) disclosure standards normally do not permit the inclusion of information concerning “measured mineral resources”, “indicated mineral resources” or “inferred mineral resources” or other descriptions of the amount of mineralization in mineral deposits that do not constitute “reserves” by SEC standards, unless such information is required to be disclosed by the law of the Company’s jurisdiction of incorporation or of a jurisdiction in which its securities are traded. U.S. investors should also understand that “inferred mineral resources” have a great amount of uncertainty as to their existence and great uncertainty as to their economic and legal feasibility. Disclosure of “contained ounces” is permitted disclosure under Canadian regulations; however, the SEC normally only permits issuers to report mineralization that does not constitute “reserves” by SEC standards as in place tonnage and grade without reference to unit measures.
7 | P a g e |
| MANAGEMENT’S DISCUSSION AND ANALYSIS |
Silver Equivalent Calculations
The silver equivalent was calculated using the following assumptions:
For Avino (ET and San Luis), San Gonzalo and Oxide Tailings:
| · | Au price US$1,300/oz |
| · | Ag price US$ 17.50/oz |
| · | Copper price US$3.00/lb |
A net smelter return (NSR) was calculated and the silver equivalent was back calculated.
For ET using the formula:
| · | AgEQ = (24.06 x Au (g/t) + 0.347 x Ag (g/t) + 43.0 x Cu (%) - 151.8 x Bi (%)) / 0.347 |
For San Gonzalo using the formula:
| · | AgEQ = (0.03 x Au (g/t) + 0.385 x Ag (g/t) - 4.03 / 0.385 |
For Oxide Tailings using the formula:
| · | AgEQ = 69.37 x Au (g/t) + Ag (g/t) |
Alternative Tailings Disposal
The Company retained the services of SRK Consulting (Canada) Inc. and MPL Mine Paste Ltd. to review the mine operating plan and alternatives for tailings disposal. Additionally, an optimization review of our internal operating plan was carried out, resulting in discussions on alternatives to conventional tailings storage and a recommendation to use tailings as backfill. Their recommendation is contingent on a revised internal operating plan, which is underway. This is based on using the thickened tails as backfill for ground support underground for the mined-out stopes and tailings disposal into the existing open pit as preferred alternatives to the conventional tailings storage facility (“TSF”). A revised internal operating plan will be submitted for our consideration; however, in the meantime management felt it prudent to temporarily defer construction of the new TSF to further understand this alternative, and, if the plan is agreed to by the Company, a follow up site visit will be planned for implementation.
The advantages of this alternative method of tailings disposal include, but are not limited to:
| · | Limited ground disturbance and capital expenditures |
| · | Reduced footprint on surface from future mining |
| · | Increased tailings storage capacity with minimal permitting requirements |
| · | Lowered risk of social and community issues |
Exploration
New Drill Programs Targeting Three Areas of Potential Mineralization
The Company has commenced new drill programs on the Avino property, which are targeting three areas of mineralization. These three areas are all outside of the existing active mining areas, and have the potential to extend resources.
8 | P a g e |
| MANAGEMENT’S DISCUSSION AND ANALYSIS |
The first area of drilling is located on surface at the west end of the San Gonzalo Mine, and comprises six (6) holes for a total of 1,200 metres of NQ drilling. The second area is situated where the Avino-San Juventino and the Footwall Breccia intersect, and consists of five (5) holes for a total of 1,300 metres.
The third area is located in the historical El Chirumbo mining area, which is located at the east end of the Avino Vein System, and comprises ten (10) holes for a total of 2,000 metres of NQ drilling. This area was previously mined between 1930 and 1940, is characterized by gold-rich mineralization in a narrow vein (1 metre in width); therefore, the Company believes there is potential to extend the mineralisation.
Preliminary results from the exploration program were released in a news release dated February 6, 2018. During the first quarter, 17 holes were drilled in the 3 areas totalling 2,356 metres, assay results are pending.
Assay Methods
Following detailed geological and geotechnical logging, drill core samples are sawed in half. One half of the core is submitted for assaying, and the other half is retained on-site for verification and reference. Samples from diamond drill holes were submitted to the SGS Laboratory facility in Durango, Mexico. The gold is assayed by fire assay with an AA finish. Any samples exceeding 3.0 grams/tonne gold are re-assayed and followed by a gravimetric finish. Multi-element analyses are also completed for each sample by SGS ICP14B methods. Any copper values over 10,000 ppm (1%) are re-assayed using ICP 90Q. Silver is fire assayed with a gravimetric finish for samples assaying over 100 grams/tonne.
Avino uses a series of standard reference materials (SRMs), blank reference materials (blanks), and duplicates as part of their QA/QC program during analysis of assays.
Bralorne Mine
The Bralorne Mine, located approximately 240 km north-east of Vancouver, British Columbia, is in the exploration, evaluation, and planning stage.
In 2017, engineering and internal economic models indicated that a larger operation is required than 100tpd under the amended M207 permit, which was issued in November 2017. Thus, engineering for mine design, mine planning, process design and infrastructure is now on hold while the Company carries out exploration to better define and expand current resources, and make new discoveries.
Environmental work continues including studies to improve the short and long term water management on site, plus work required under the reclamation plan, and to potentially permit for a larger operation.
Exploration
In December 2017, the Company announced that plans were finalised for an 8,000 metre drill program to commence early January 2018. This drill program was aimed at both identifying additional resources and increasing the confidence in existing resources, in advance of a revised resource update. The program would consist of 8,000 metres of drilling, and focus on 9 gold-bearing veins containing existing resources as defined in the NI 43-101 Updated Resource Estimate completed in October 2016. Due to the recent flow-through financing, the Company is currently updating the drill program. This program was designed to delineate additional resources above the 800 level in the vicinity of previously reported gold resources. The program was designed by Bralorne’s independent consultant with the assistance of Bralorne geologists. This program was also to include two geotechnical holes to provide information for the engineering design of the proposed new tunnel on the 800 level.
9 | P a g e |
| MANAGEMENT’S DISCUSSION AND ANALYSIS |
In the first quarter of 2018 about half of the planned drill program was completed. The Bralorne geological team is currently evaluating the results.
Environmental & Permitting Progress
In November 2017, the Company received an approved Permit Amendment (M207) from the Ministry of Energy, Mines and Petroleum Resources (“MEMPR”) previously the Ministry of Mines and Energy (“MEM”) to operate at 100tpd. The Permit Amendment provides a comprehensive and responsible permit, which is updated to modern environmental and permitting standards, and is an important step in the Company’s strategic plan to re-open the Bralorne Gold Mine. With the receipt of this modern permit, the Company anticipates an easier and quicker transition to an amended permit that will allow for future expansion.
During Q1 2018 environmental work continued with regard to the requirements under the operating permit (M207), in particular studies and reclamation regarding legacy issues, plus work to improve the short / long term water treatment and overall water management. As a result of initial positive passive water treatment testing in 2016 and 2017a Bio-reactor pilot plant was constructed in Q1 2018, which will be commissioned in Q2 of 2018, tested through maximum mine water flow during freshet from April to June and more normal flows for the remainder of the year. The objective is to find a passive system that could replace the current water treatment plant to lower operating costs.
During 2017, an independent consulting engineering firm reviewed the processing plant and infrastructure to determine which buildings and equipment should be replaced. Most of the equipment was configured for a 100 tonnes per day (‘tpd’) operation and needed to be updated for the anticipated higher processing plant operating rate. Accordingly, new or refurbished equipment is being proposed for the processing plant. A separate crushing building is being considered for the plant, with separate fine ore storage, which will provide more space in the current mill building for the larger equipment being considered. Other buildings and surface infrastructure will either be upgraded to meet the current required capacity, or they will be removed / demolished, and replaced.
First Nations Education, Training & Engagement, and Collaboration
In 2017, Avino continued with the underground mining training for members of the St’at’imc communities, and the third training program with North Island College was completed in February 2018 in Pemberton, B.C. In addition to the training program through North Island College, Avino has been working with the Center for Training Excellence in Mining, the BC government, Thompson Rivers University, New Gold, Seabridge Gold and Sandvik, amongst others, on the development of the curriculum for a new accredited underground mining training program aligned with the Mining Industry Human Resources Council’s Canadian Mining Certification Program.
During 2017, Avino announced the signing of a non-binding Letter of Intent (“LOI”) to recognize the opportunity for collaboration and the establishment of joint ventures to allow the St’át’imc First Nations (the “St’át’imc”) to economically participate in the development and ongoing operations of the Bralorne Gold Mine project. St’át’imc Eco-Resources Ltd. is owned by 9 of the 11 St’át’imc Communities.
10 | P a g e |
| MANAGEMENT’S DISCUSSION AND ANALYSIS |
Qualified Person(s)
Avino’s Mexican projects are under the supervision of Jasman Yee, P.Eng, Avino Director, and the Bralorne project is under the supervision of Fred Sveinson, B.A., B.Sc., P. Eng., both of whom are qualified persons within the context of National Instrument 43-101, and have reviewed and approved the technical data in this news release.
Objectives
Avino's mission is to create shareholder value through profitable organic growth at the Avino Property and the strategic acquisition and advancement of mineral exploration and mining properties. We are committed to expanding our operations and managing all business activities in an environmentally responsible and cost-effective manner while contributing to the well-being of the communities, in which we operate.
The Company remains focused on the following key objectives:
| 1. | Maintain and improve profitable mining operations while managing operating costs and achieving efficiencies; |
|
|
|
| 2. | Complete the Mill Circuit 4 expansion to increase Avino Mine production; |
|
|
|
| 3. | Conduct a successful drill program in 2018 to increase and improve confidence in our resource base at Bralorne; |
|
|
|
| 4. | Continue mine expansion drilling and explore regional targets on the Avino property; and, |
|
|
|
| 5. | Follow the recommendations made in the 2017 PEA on the oxide tailings resource at the Avino Mine and assess the potential for processing the oxide tailings resource. |
|
|
|
| 6. | Complete paste backfill engineering and commence the construction of the paste backfill plant |
Non – IFRS Measures
Cash cost per ounce, all-in sustaining cash cost per ounce, and cash flow per share
Cash cost per ounce, all-in sustaining cash cost per ounce, and cash flow per share are measures developed by mining companies in an effort to provide a comparable standard. However, there can be no assurance that our reporting of these non-IFRS measures is similar to that reported by other mining companies. Total cash cost per ounce, all-in sustaining cash cost per ounce, and cash flow per share are measures used by the Company to manage and evaluate operating performance of the Company’s mining operations, and are widely reported in the silver and gold mining industry as benchmarks for performance, but do not have standardized meanings prescribed by IFRS, and are disclosed in addition to IFRS measures.
Management believes that the Company’s ability to control the cash cost per silver equivalent ounce is one of its key performance drivers impacting both the Company’s financial condition and results of operations. Achieving a low silver equivalent production cost base allows the Company to remain profitable from mining operations even during times of low commodity prices, and provides more flexibility in responding to changing market conditions. In addition, a profitable operation results in the generation of positive cash flows, which then improve the Company’s financial condition.
11 | P a g e |
| MANAGEMENT’S DISCUSSION AND ANALYSIS |
The Company has adopted the reporting of “all-in sustaining cash cost per silver equivalent ounce”. This measure has no standardized meaning throughout the industry. However, it is intended to provide additional information. Avino presents all-in sustaining cash cost, because it believes that it more fully defines the total current cost associated with producing a silver equivalent ounce. Further, the Company believes that this measure allows investors of the Company to better understand its cost of producing silver equivalent ounces, and better assess the Company’s ability to generate cash flow from operations. Although the measure seeks to reflect the full cost per silver equivalent ounce of production from current operations, it does not include capital expenditures attributable to mine expansions, exploration, and evaluation costs attributable to growth projects, income tax payments, marketing and treatment charges, and financing costs. In addition, the calculation of all-in sustaining cash costs does not include depreciation and depletion expense as it does not reflect the impact of expenditures incurred in prior periods. The Company’s calculation of all-in sustaining cash costs includes sustaining capital expenditures of $Nil for the three months ended March 31, 2018 and 2017, as substantially all of the mining equipment used at San Gonzalo and Avino has been newly purchased or refurbished. The Company has planned for sustaining capital expenditures in future years in accordance with mine operating plans and expected equipment utilization levels. Although this measure is not representative of all of the Company’s cash expenditures, management believes that it is a useful measure in allowing it to analyze the efficiency of its mining operations.
The Company also presents cash flow per share, as it believes it assists investors and other stakeholders in evaluating the Company's overall performance and its ability to generate cash flow from current operations.
To facilitate a better understanding of these measures as calculated by the Company, detailed reconciliations between the non-IFRS measures and the Company’s condensed consolidated interim financial statements are provided below. The measures presented are intended to provide additional information, and should not be considered in isolation nor should they be considered substitutes for IFRS measures. Calculated figures may not add up due to rounding.
Cash Cost and All-in Sustaining Cash Cost per Silver Equivalent Ounce
The following tables provide a reconciliation of cost of sales from the consolidated financial statements to cash cost and all-in sustaining cash cost per silver equivalent ounce sold. In each table, “silver equivalent ounces sold” consists of the sum of silver ounces, gold ounces and copper tonnes sold multiplied by the ratio of the average spot gold and copper prices for the corresponding period.
12 | P a g e |
| MANAGEMENT’S DISCUSSION AND ANALYSIS |
San Gonzalo
Expressed in US$ |
| 2018 |
|
| 2017 |
| ||||||||||||||||||
|
| Q1 |
|
| Year |
|
| Q4 |
|
| Q3 |
|
| Q2 |
|
| Q1 |
| ||||||
Cost of sales |
| $ | 1,777,967 |
|
| $ | 6,017,735 |
|
| $ | 2,019,296 |
|
| $ | 1,828,122 |
|
| $ | 1,401,522 |
|
| $ | 768,795 |
|
Depletion and depreciation |
|
| (445,995 | ) |
|
| (1,160,319 | ) |
|
| (485,247 | ) |
|
| (316,808 | ) |
|
| (260,911 | ) |
|
| (97,353 | ) |
Cash production cost |
|
| 1,331,972 |
|
|
| 4,857,416 |
|
|
| 1,534,049 |
|
|
| 1,511,314 |
|
|
| 1,140,611 |
|
|
| 671,442 |
|
Silver equivalent ounces sold |
|
| 155,183 |
|
|
| 604,132 |
|
|
| 193,510 |
|
|
| 132,509 |
|
|
| 134,559 |
|
|
| 143,554 |
|
Cash cost per silver equivalent ounce |
| $ | 8.58 |
|
| $ | 8.04 |
|
| $ | 7.93 |
|
| $ | 11.41 |
|
| $ | 8.48 |
|
| $ | 4.68 |
|
General and administrative expenses |
|
| 365,177 |
|
|
| 1,378,167 |
|
|
| 314,941 |
|
|
| 507,688 |
|
|
| 262,442 |
|
|
| 293,096 |
|
Share-based payments and G&A depreciation |
|
| (37,916 | ) |
|
| (496,709 | ) |
|
| (56,702 | ) |
|
| (308,302 | ) |
|
| (59,193 | ) |
|
| (72,512 | ) |
Cash operating cost |
|
| 1,659,233 |
|
|
| 5,738,874 |
|
|
| 1,792,288 |
|
|
| 1,710,700 |
|
|
| 1,343,860 |
|
|
| 892,026 |
|
All-in sustaining cash cost per silver equivalent ounce |
| $ | 10.69 |
|
| $ | 9.50 |
|
| $ | 9.26 |
|
| $ | 12.91 |
|
| $ | 9.99 |
|
| $ | 6.21 |
|
During the first quarter of 2018, the cash cost and all-in sustaining cash cost per silver equivalent ounce at the San Gonzalo Mine was higher than the overall cash cost for 2017. Overall, costs at San Gonzalo have increased in 2018 compared to 2017, due to changes in grade as the mine enters the latter stages of its life, and increases in material and labour costs during the period.
Avino Mine
Expressed in US$ |
| 2018 |
|
| 2017 |
| ||||||||||||||||||
|
| Q1 |
|
| Year |
|
| Q4 |
|
| Q3 |
|
| Q2 |
|
| Q1 |
| ||||||
Cost of sales |
| $ | 4,522,575 |
|
| $ | 15,957,395 |
|
| $ | 3,501,106 |
|
| $ | 4,529,977 |
|
| $ | 4,028,087 |
|
| $ | 3,898,225 |
|
Depletion and depreciation |
|
| (401,553 | ) |
|
| (1,396,967 | ) |
|
| (317,964 | ) |
|
| (369,082 | ) |
|
| (342,263 | ) |
|
| (367,658 | ) |
Cash production cost |
|
| 4,121,022 |
|
|
| 14,560,428 |
|
|
| 3,183,142 |
|
|
| 4,160,895 |
|
|
| 3,685,824 |
|
|
| 3,530,567 |
|
Silver equivalent ounces sold |
|
| 410,974 |
|
|
| 1,641,814 |
|
|
| 403,775 |
|
|
| 449,794 |
|
|
| 407,443 |
|
|
| 380,802 |
|
Cash cost per silver equivalent ounce |
| $ | 10.03 |
|
| $ | 8.87 |
|
| $ | 7.88 |
|
| $ | 9.25 |
|
| $ | 9.05 |
|
| $ | 9.27 |
|
General and administrative expenses |
|
| 967,102 |
|
|
| 3,952,628 |
|
|
| 657,146 |
|
|
| 1,723,320 |
|
|
| 794,675 |
|
|
| 777,487 |
|
Share-based payments and G&A depreciation |
|
| (100,413 | ) |
|
| (1,536,415 | ) |
|
| (118,313 | ) |
|
| (1,046,513 | ) |
|
| (179,238 | ) |
|
| (192,351 | ) |
Cash operating cost |
|
| 4,987,711 |
|
|
| 16,976,641 |
|
|
| 3,721,975 |
|
|
| 4,837,702 |
|
|
| 4,301,261 |
|
|
| 4,115,703 |
|
All-in sustaining cash cost per silver equivalent ounce |
| $ | 12.14 |
|
| $ | 10.34 |
|
| $ | 9.22 |
|
| $ | 10.76 |
|
| $ | 10.56 |
|
| $ | 10.81 |
|
Cash cost and all-in sustaining cash cost per silver equivalent ounce at the Avino Mine increased in the first quarter of 2018 as the Company realized increased material and labour costs during the period.
13 | P a g e |
| MANAGEMENT’S DISCUSSION AND ANALYSIS |
Consolidated
Expressed in US$ |
| 2018 |
|
| 2017 |
| ||||||||||||||||||
|
| Q1 |
|
| Year |
|
| Q4 |
|
| Q3 |
|
| Q2 |
|
| Q1 |
| ||||||
Cost of sales |
| $ | 6,300,542 |
|
| $ | 21,975,130 |
|
| $ | 5,520,402 |
|
| $ | 6,358,099 |
|
| $ | 5,429,609 |
|
| $ | 4,667,020 |
|
Depletion and depreciation |
|
| (847,548 | ) |
|
| (2,557,286 | ) |
|
| (803,211 | ) |
|
| (685,890 | ) |
|
| (603,174 | ) |
|
| (465,011 | ) |
Cash production cost |
|
| 5,452,994 |
|
|
| 19,417,844 |
|
|
| 4,717,191 |
|
|
| 5,672,209 |
|
|
| 4,826,435 |
|
|
| 4,202,009 |
|
Silver equivalent ounces sold |
|
| 566,157 |
|
|
| 2,245,946 |
|
|
| 597,285 |
|
|
| 582,303 |
|
|
| 542,002 |
|
|
| 524,356 |
|
Cash cost per silver equivalent ounce |
| $ | 9.63 |
|
| $ | 8.65 |
|
| $ | 7.90 |
|
| $ | 9.74 |
|
| $ | 8.90 |
|
| $ | 8.01 |
|
General and administrative expenses |
|
| 1,332,279 |
|
|
| 5,330,795 |
|
|
| 972,087 |
|
|
| 2,231,008 |
|
|
| 1,057,117 |
|
|
| 1,070,583 |
|
Share-based payments and G&A depreciation |
|
| (138,329 | ) |
|
| (2,033,124 | ) |
|
| (175,015 | ) |
|
| (1,354,815 | ) |
|
| (238,431 | ) |
|
| (264,863 | ) |
Cash operating cost |
|
| 6,646,944 |
|
|
| 22,715,515 |
|
|
| 5,514,263 |
|
|
| 6,548,402 |
|
|
| 5,645,121 |
|
|
| 5,007,729 |
|
All-in sustaining cash cost per silver equivalent ounce |
| $ | 11.74 |
|
| $ | 10.11 |
|
| $ | 9.23 |
|
| $ | 11.25 |
|
| $ | 10.42 |
|
| $ | 9.55 |
|
The Company continues to review its expenditures, and has been successful in the pursuit to achieve lower costs. Ongoing cost reduction activities include negotiating more favourable terms with vendors, while maintenance costs are expected to decrease as a result of utilizing newer mining equipment.
Cash Flow per Share
Cash flow per share is determined based on operating cash flows before movements in working capital, as illustrated in the consolidated statements of cash flows, divided by the basic and diluted weighted average shares outstanding during the period.
|
| Three Months Ended March 31, |
| |||||
|
| 2018 |
|
| 2017 |
| ||
Operating cash flows before movements in working capital |
| $ | 1,214,658 |
|
| $ | 1,991,929 |
|
Weighted average number of shares outstanding |
|
|
|
|
|
|
|
|
Basic |
|
| 52,718,153 |
|
|
| 52,435,668 |
|
Diluted |
|
| 53,343,473 |
|
|
| 53,494,526 |
|
Cash Flow per Share – basic and diluted |
| $ | 0.02 |
|
| $ | 0.04 |
|
Working Capital
|
| March 31, 2018 |
|
| December 31, 2017 |
| ||
Current assets |
| $ | 24,308,446 |
|
| $ | 26,590,784 |
|
Current liabilities |
|
| (12,749,968 | ) |
|
| (10,188,425 | ) |
Working capital |
| $ | 11,558,478 |
|
| $ | 16,402,359 |
|
14 | P a g e |
| MANAGEMENT’S DISCUSSION AND ANALYSIS |
Results of Operations
Summary of Quarterly Results
|
| 2017 |
|
| 2017 |
|
| 2017 |
|
| 2017 |
|
| 2017 |
|
| 2016 |
|
| 2016 |
|
| 2016 |
| ||||||||
Quarter ended |
| Mar 31 Q1 |
|
| Dec 31 Q4 |
|
| Sep 30 Q3 |
|
| Jun 30 Q2 |
|
| Mar 31 Q1 |
|
| Dec 31 Q4 |
|
| Sep 30 Q3 |
|
| Jun 30 Q2 |
| ||||||||
Revenue |
| $ | 8,155,902 |
|
| $ | 8,883,647 |
|
| $ | 8,435,743 |
|
| $ | 7,911,388 |
|
| $ | 8,127,863 |
|
| $ | 9,048,747 |
|
| $ | 10,035,932 |
|
| $ | 9,017,929 |
|
Earnings (Loss) for the quarter |
|
| 817,501 |
|
|
| 1,496,381 |
|
|
| (715,774 | ) |
|
| 1,151,549 |
|
|
| 721,305 |
|
|
| 950,770 |
|
|
| 847,263 |
|
|
| (336,748 | ) |
Earnings (Loss) per share - basic |
| $ | 0.02 |
|
| $ | 0.03 |
|
| $ | (0.01 | ) |
| $ | 0.02 |
|
| $ | 0.01 |
|
|
| 0.02 |
|
|
| 0.02 |
|
|
| (0.01 | ) |
Earnings (Loss) per share - diluted |
| $ | 0.02 |
|
| $ | 0.03 |
|
| $ | (0.01 | ) |
| $ | 0.02 |
|
| $ | 0.01 |
|
|
| 0.02 |
|
|
| 0.02 |
|
|
| (0.01 | ) |
Total Assets |
| $ | 102,227,899 |
|
| $ | 102,627,862 |
|
| $ | 101,207,430 |
|
| $ | 98,719,613 |
|
| $ | 97,445,910 |
|
| $ | 93,793,897 |
|
| $ | 79,791,805 |
|
| $ | 72,703,682 |
|
| · | Revenue decreased slightly compared to the third and fourth quarters of 2017 due to lower silver equivalent ounces solid. Revenues have been relatively consistent since the Company commenced production at the Avino Mine as of April 1, 2016. |
|
|
|
| · | Earnings in the third quarter of 2017 were lower than those of other quarters due to lower tonnes of concentrate produced and sold from San Gonzalo, as well as non-cash expenses such as share-based payment expenses. Earnings in the first quarter of 2018 were consistent with other preceding quarters. |
|
|
|
| · | Total assets remained relatively consistent with December 31, 2017. Overall, total assets have steadily increased throughout the previous quarters, as the Company continues to grow through debt and equity financings to advance its projects and acquire equipment. |
Quarterly results will fluctuate with changes in revenues, cost of sales, general and administrative expenses, including non-cash items such as share-based payments, and other items including foreign exchange and deferred income taxes. Effective January 1, 2017, the Company changed its presentation currency to US dollars from Canadian dollars. Refer to the section “Changes in Accounting Standards” for further details regarding the change in presentation currency.
15 | P a g e |
| MANAGEMENT’S DISCUSSION AND ANALYSIS |
Three months ended March 31, 2018, compared to the three months ended March 31, 2017:
|
| 2018 |
|
| 2017 |
|
| Note |
| |||
Revenue from Mining Operations |
| $ | 8,155,902 |
|
| $ | 8,127,863 |
|
|
|
| |
Cost of Sales |
|
| 6,300,542 |
|
|
| 4,667,020 |
|
|
| 1 |
|
Mine Operating Income |
|
| 1,855,360 |
|
|
| 3,460,843 |
|
|
| 1 |
|
Operating Expenses |
|
|
|
|
|
|
|
|
|
|
|
|
General and administrative expenses |
|
| 1,198,587 |
|
|
| 809,208 |
|
|
| 2 |
|
Share-based payments |
|
| 133,692 |
|
|
| 261,375 |
|
|
| 3 |
|
Income before other items |
|
| 523,081 |
|
|
| 2,390,260 |
|
|
|
|
|
Other Items |
|
|
|
|
|
|
|
|
|
|
|
|
Interest and other income |
|
| 35,492 |
|
|
| 76,092 |
|
|
|
|
|
Unrealized gain (loss) on long-term investments |
|
| (8,464 | ) |
|
| 15,964 |
|
|
|
|
|
Fair value adjustment on warrant liability |
|
| 151,490 |
|
|
| (715,686 | ) |
|
| 4 |
|
Foreign exchange gain (loss) |
|
| 168,512 |
|
|
| (559,095 | ) |
|
| 5 |
|
Finance cost |
|
| (51,469 | ) |
|
| (40,628 | ) |
|
|
|
|
Accretion of reclamation provision |
|
| (97,821 | ) |
|
| (38,013 | ) |
|
|
|
|
Interest expense |
|
| (28,407 | ) |
|
| (29,977 | ) |
|
|
|
|
Net Income Before Income Taxes |
|
| 692,414 |
|
|
| 1,098,917 |
|
|
|
|
|
Income Taxes |
|
|
|
|
|
|
|
|
|
|
|
|
Current income tax expense |
|
| (438,913 | ) |
|
| (706,878 | ) |
|
| 6 |
|
Deferred income tax recovery |
|
| 564,000 |
|
|
| 329,266 |
|
|
| 6 |
|
|
|
| 125,087 |
|
|
| (377,612 | ) |
|
|
|
|
Net Income |
|
| 817,501 |
|
|
| 721,305 |
|
|
| 7 |
|
Earnings per Share |
|
|
|
|
|
|
|
|
|
|
|
|
Basic |
| $ | 0.02 |
|
| $ | 0.01 |
|
|
| 7 |
|
Diluted |
| $ | 0.02 |
|
| $ | 0.01 |
|
|
| 7 |
|
__________
| 1. | Cost of Sales for the three months ended March 31, 2018, were $6,300,542 compared to $4,667,020 for the three months ended March 31, 2017. The increase of $1,633,522 reflects increased material and labour costs, as well as increased non-cash depletion expense on the San Gonzalo Mine, as it nears the end of life. As a result, Mine Operating Income decreased for the three months ended March 31, 2018, compared to March 31, 2017. |
16 | P a g e |
| MANAGEMENT’S DISCUSSION AND ANALYSIS |
| 2. | General and administrative expenses for the three months ended March 31, 2018, totalled $1,198,587 compared to $809,208 for the three months ended March 31, 2017. The increase of $389,379 reflects increased overhead costs as the Company continues to expand operations. |
|
|
| 3. | Share-based payments for the three months ended March 31, 2018, totalled $133,692 compared to $261,375 for the three months ended March 31, 2017. Share-based payments are comprised of the issuance of stock options, as well as restricted share units (“RSUs”) to directors, officers, employees, and consultants of the Company during the periods. RSUs vest over the following three years upon issuance. |
|
|
| 4. | The fair value adjustment on the Company’s warrant liability relates to the issuance of US dollar denominated warrants, which are re-valued each reporting period, and the value fluctuates with changes in the US-Canadian dollar exchange rate, and in the variables used in the valuation model, such as the Company’s US share price, and expected share price volatility. |
|
|
| 5. | Foreign exchange gains or losses result from transactions in currencies other than the Canadian dollar functional currency. During the three months ended March 31, 2018, the US dollar appreciated in relation to the Canadian dollar and depreciated in relation to the Mexican peso, resulting in a minimal foreign exchange gain, as the Company incurred an increased amount of capital expenditures, such as the construction of Mill Circuit 4. During the three months ended March 31, 2017, the US dollar was appreciated in relation to the Canadian dollar and the Mexican peso, resulting in a foreign exchange loss. |
|
|
| 6. | Current income tax expense was $438,913 for the three months ended March 31, 2018, compared to $706,878 in the three months ended March 31, 2017. Deferred income tax recovery was $564,000 for the three months ended March 31, 2018, compared to $329,266 in the comparative quarter. Deferred income tax fluctuates due to movements in taxable and deductible temporary differences related to the special mining duty in Mexico and to changes in inventory, plant, equipment and mining properties, and exploration and evaluation assets, amongst other factors. The changes in current income taxes and deferred income taxes for the three months ended March 31, 2018, primarily relate to movements in the tax bases and increased mining profits in Mexico. |
|
|
| 7. | As a result of the foregoing, net income for the three months ended March 31, 2018, was $817,501, an increase of $96,196 compared to net income of $721,305 for the three months ended March 31, 2017. The increase had an impact on basic and diluted earnings per share, increasing to $0.02 for the quarter ended March 31, 2018, from $0.01 for the quarter ended March 31, 2017. |
17 | P a g e |
| MANAGEMENT’S DISCUSSION AND ANALYSIS |
Liquidity and Capital Resources
The Company’s ability to generate sufficient amounts of cash, in both the short term and the long term, to maintain existing capacity and to fund ongoing exploration, is dependent upon the discovery of economically recoverable reserves or resources and the ability of the Company to obtain the financing necessary to generate and sustain profitable operations.
Management expects that the Company’s ongoing liquidity requirements will be funded from cash generated from current operations and from further financing, as required, in order to fund ongoing exploration activities, and meet its objectives, including ongoing advancement at the Avino Mine. The Company continues to evaluate financing opportunities to advance its projects. The Company’s ability to secure adequate financing is, in part, dependent on overall market conditions, the prices of silver, gold, and copper, and other factors outside the Company’s control. There is no guarantee the Company will be able to secure any or all necessary financing in the future. The Company’s recent financing activities are summarized in the table below.
Intended Use of Proceeds | Actual Use of Proceeds |
In April 2018, the Company closed a private placement of 3,000,000 flow-through common shares for gross proceeds of C$6,000,000.
| As of the date of this MD&A, the Company has begun to use the funds as intended. The Company will use the gross proceeds raised from the offering to incur qualifying Canadian exploration expenses and flow-through mining expenditures on its Bralorne Mine, located in British Columbia, which will be renounces to the purchasers of the flow-through shares for the 2018 taxation year.
|
In November 2016, the Company received gross proceeds of $11,185,355 in connection with a bought-deal offering issued under a prospectus supplement. The Company intends to use the proceeds to advance the exploration and development of the Company’s Avino Mine and Bralorne Mine and for general working capital.
Since July 2014, the Company received gross proceeds of $13,346,561 in connection with a brokered at-the-market offering issued under prospectus supplements. The Company intends to use the proceeds to advance the exploration of the Bralorne Mine property and the Avino property, and for working capital.
In July 2015, the Company entered into a term facility agreement with Samsung C&T U.K. Limited for $10,000,000. The facility is being used for mining equipment, to optimize the advancement of the Company’s projects for increased productivity, for improvements to its tailings impoundment facilities, and for general working capital requirements.
| As of the date of this MD&A, the Company had used, and was continuing to use, the funds as intended. There has been no impact on the ability of the Company to achieve its business objectives and milestones.
In supporting mining operations in Mexico, the Company incurred expenditures of $197,447 for exploration and evaluation activities (excluding foreign exchange movement of $16,622), acquired property and equipment of $2,219,092 (excluding depreciation of $851,822), and made lease and loan repayments of $500,941 during the period ended March 31, 2018.
In advancing the Bralorne Mine, the Company incurred expenditures of $1,298,138 for exploration and evaluation activities (excluding depreciation of $145,536, share-based payments of $10,099, and foreign exchange movement of $918,138, acquired property and equipment of $47,361 (excluding depreciation of $145,672 and foreign exchange movement of $31,191), and made lease and loan repayments of $217,385 during the period ended March 31, 2018.
The Company intends to continue to explore its properties, subject to market conditions and the ability to continue to obtain suitable financing.
|
In May 2015, the Company entered into a master credit facility with Sandvik Customer Finance LLC for $5,000,000. The facility is being used to acquire equipment necessary for continuing exploration activities at the Avino and Bralorne Mines.
| As of the date of this MD&A, the Company had used, and was continuing to use, the facility as intended, and there was $4,103,623 in available credit remaining under the facility. There has been no impact on the ability of the Company to achieve its business objectives and milestones.
|
In December 2014, the Company’s master credit facility with Caterpillar Finance was renewed for $5,375,400. The facility is being used to acquire equipment necessary for advancing operations at the San Gonzalo Mine and for operations and continuing exploration activities at the Avino Mine.
| As of the date of this MD&A, the Company had used, and was continuing to use, the facility as intended, and there was $3,867,033 in available credit remaining under the facility. There has been no impact on the ability of the Company to achieve its business objectives and milestones. |
18 | P a g e |
| MANAGEMENT’S DISCUSSION AND ANALYSIS |
Discussion and analysis relating to the Company’s liquidity as at March 31, 2018, December 31, 2017 and March 31, 2017, is as follows:
Statement of Financial Position
|
| March 31, 2018 |
|
| December 31, 2017 |
| ||
Cash |
| $ | 2,340,073 |
|
| $ | 3,419,532 |
|
Working capital |
|
| 11,558,478 |
|
|
| 16,402,359 |
|
Accumulated Deficit |
|
| (18,299,716 | ) |
|
| (19,083,196 | ) |
Cash Flow
|
| March 31, 2018 |
|
| March 31, 2017 |
| ||
Cash generated by (used in) operating activities |
| $ | 2,137,023 |
|
| $ | (1,526,897 | ) |
Cash used in financing activities |
|
| (641,269 | ) |
|
| (629,469 | ) |
Cash used in investing activities |
|
| (2,575,319 | ) |
|
| (1,965,198 | ) |
Change in cash |
|
| (1,079,565 | ) |
|
| (4,121,564 | ) |
Effect of exchange rate changes on cash |
|
| 106 |
|
|
| (3,172 | ) |
Cash, beginning of period |
|
| 3,419,532 |
|
|
| 11,779,718 |
|
Cash, end of period |
| $ | 2,340,073 |
|
| $ | 7,654,982 |
|
Operating Activities
Cash generated by operating activities for the three months ended March 31, 2018, was $2,100,278 compared to cash used in operating activities of $1,526,897 for the three months ended March 31, 2017. Cash generated by or used in operating activities can fluctuate with changes in net income, non-cash items, such as foreign exchange and deferred income tax expenses, and working capital.
19 | P a g e |
| MANAGEMENT’S DISCUSSION AND ANALYSIS |
Financing Activities
Cash used in financing activities was $641,269 for the three months ended March 31, 2018, compared to cash used in financing activities of $629,469 for the three months ended March 31, 2017, an increase of $11,800. Cash used in financing activities for the three months ended March 31, 2018, relates to the repayments of equipment loans and finance leases for mining equipment. During the three months ended March 31, 2018, employees, consultants, and directors exercised stock options generating cash flows of $77,057 (March 31, 2018 - $12,352). During the three months ended March 31, 2018, the Company made finance lease and equipment loan payments totalling $718,326 (March 31, 2017 - $641,821).
Investing Activities
Cash used in investing activities for the three months ended March 31, 2018, was $2,538,574 compared to $946,217 for the three months ended March 31, 2017. Cash used in investing activities during the three months ended March 31, 2018, includes cash expenditures of $2,042,854 (March 31, 2017 - $971,397) on the acquisition of property and equipment. Equipment purchases included new mining, milling/processing, and transportation equipment for the Company’s San Gonzalo Mine and Avino Mine, and exploration and mining equipment for the Bralorne Mine. During the three months ended March 31, 2018, the Company also incurred cash expenditures of $1,495,720 (March 31, 2017 - $993,801) on exploration and evaluation activities. During the three months ended March 31, 2018, the Company also redeemed $1,000,000 in short-term investments (March 31, 2017 - $Nil).
Off-Balance Sheet Arrangements
The Company has no off-balance sheet arrangements.
Transactions with Related Parties
All related party transactions are recorded at the exchange amount which is the amount agreed to by the Company and the related party.
| (a) | Key management personnel |
|
|
|
|
| The Company has identified its directors and certain senior officers as its key management personnel. The compensation costs for key management personnel for the three months ended March 31, were as follows: |
|
| Three months ended March 31, |
| |||||
|
| 2018 |
|
| 2017 |
| ||
Salaries, benefits, and consulting fees |
| $ | 207,895 |
|
| $ | 203,999 |
|
Share‐based payments |
|
| 128,056 |
|
|
| 238,445 |
|
|
| $ | 335,951 |
|
| $ | 442,444 |
|
20 | P a g e |
| MANAGEMENT’S DISCUSSION AND ANALYSIS |
| (b) | Amounts due to/from related parties |
|
|
|
|
| In the normal course of operations, the Company transacts with companies related to Avino’s directors or officers. All amounts payable and receivable are non-interest bearing, unsecured and due on demand. Advances to Oniva International Services Corp. of $225,864 (December 31, 2017 - $232,076) for expenditures to be incurred on behalf of the Company are included in prepaid expenses and other assets on the condensed consolidated interim statements of financial position as at March 31, 2018. As at March 31, 2018 and December 31, 2017, the following amounts were due to related parties: |
|
| March 31, 2018 |
|
| December 31, 2017 |
| ||
Oniva International Services Corp. |
| $ | 133,708 |
|
| $ | 139,047 |
|
Directors |
|
| 25,173 |
|
|
| 41,660 |
|
Jasman Yee & Associates, Inc. |
|
| 4,073 |
|
|
| 5,856 |
|
|
| $ | 162,954 |
|
| $ | 186,563 |
|
| (c) | Other related party transactions |
|
|
|
|
| The Company has a cost sharing agreement with Oniva International Services Corp. (“Oniva”) for office and administration services. Pursuant to the cost sharing agreement, the Company will reimburse Oniva for the Company’s percentage of overhead and corporate expenses and for out-of-pocket expenses incurred on behalf of the Company. The cost sharing agreement may be terminated with one-month notice by either party without penalty.
The transactions with Oniva during the three months ended March 31, are summarized below: |
|
| March 31, 2018 |
|
| March 31, 2017 |
| ||
Salaries and benefits |
| $ | 141,037 |
|
| $ | 91,259 |
|
Office and miscellaneous |
|
| 172,424 |
|
|
| 143,172 |
|
Exploration and evaluation assets |
|
| 91,096 |
|
|
| 82,647 |
|
|
| $ | 404,557 |
|
| $ | 317,078 |
|
| For services provided to the Company as President and Chief Executive Officer, the Company pays Intermark Capital Corporation (“ICC”), a company controlled by David Wolfin, the Company’s president and CEO and also a director, for consulting services. For the three months ended March 31, 2018, the Company paid $59,303 (March 31, 2017 - $56,685) to ICC. | |
|
|
|
|
| The Company pays Jasman Yee & Associates, Inc. (“JYAI”) for operational, managerial, metallurgical, engineering and consulting services related to the Company’s activities. JYAI’s managing director is a director of the Company. For the three months ended March 31, 2018 and 2017, the Company paid $16,111 and $23,717, respectively, to JYAI. |
|
|
|
|
| The Company pays Wear Wolfin Designs Ltd. (“WWD”), a company whose director is the brother-in-law of David Wolfin, for financial consulting services related to ongoing consultation with stakeholders and license holders. For the three months ended March 31, 2018 and 2017, the Company paid $5,930 and $5,669, respectively, to WWD. |
21 | P a g e |
| MANAGEMENT’S DISCUSSION AND ANALYSIS |
Financial Instruments and Risks
The fair values of the Company’s amounts due to related parties and accounts payable approximate their carrying values because of the short-term nature of these instruments. Cash, amounts receivable, short and long-term investments, and warrant liability are recorded at fair value. The carrying amounts of the Company’s term facility, equipment loans, and finance lease obligations are a reasonable approximation of their fair values based on current market rates for similar financial instruments.
The Company’s financial instruments are exposed to certain financial risks, including credit risk, liquidity risk, and market risk.
| (a) | Credit Risk |
|
|
|
|
| Credit risk is the risk that one party to a financial instrument will cause a financial loss for the other party by failing to discharge an obligation. The Company has exposure to credit risk through its cash, short-term investments, and amounts receivable.
The Company manages credit risk, in respect of cash and short-term investments, by maintaining the majority of cash and short-term investments at highly rated financial institutions.
The Company is exposed to a significant concentration of credit risk with respect to its trade accounts receivable balance because all of its concentrate sales are with three (December 31, 2017 – three) counterparties. However, the Company has not recorded any allowance against its trade receivables because to-date all balances owed have been settled in full when due (typically within 60 days of submission) and because of the nature of the counterparties.
The Company’s maximum exposure to credit risk at the end of any period is equal to the carrying amount of these financial assets as recorded in the consolidated statement of financial position. At March 31, 2018, no amounts were held as collateral. |
| (b) | Liquidity Risk |
|
|
|
|
| Liquidity risk is the risk that the Company will encounter difficulty in satisfying financial obligations as they become due. The Company manages its liquidity risk by forecasting cash flows required by its operating, investing and financing activities. The Company had cash at March 31, 2018, in the amount of $2,340,073 and working capital of $11,558,478 in order to meet short-term business requirements. Accounts payable have contractual maturities of approximately 30 to 90 days, or are due on demand and are subject to normal trade terms. The current portions of term facility, equipment loans, and finance lease obligations are due within 12 months of the condensed consolidated interim statement of financial position date. Amounts due to related parties are without stated terms of interest or repayment. |
22 | P a g e |
| MANAGEMENT’S DISCUSSION AND ANALYSIS |
The maturity profiles of the Company’s contractual obligations and commitments as at March 31, 2018 are summarized as follows:
|
| Total |
|
| Less Than 1 Year |
|
| 1-5 years |
|
| More Than 5 Years |
| ||||
Accounts payable and accrued liabilities |
| $ | 4,487,885 |
|
| $ | 4,487,885 |
|
| $ | - |
|
| $ | - |
|
Due to related parties |
|
| 162,954 |
|
|
| 162,954 |
|
|
| - |
|
|
| - |
|
Minimum rental and lease payments |
|
| 406,721 |
|
|
| 186,540 |
|
|
| 205,825 |
|
|
| 14,356 |
|
Term facility |
|
| 9,176,682 |
|
|
| 6,400,166 |
|
|
| 2,776,516 |
|
|
| - |
|
Equipment loans |
|
| 1,063,098 |
|
|
| 737,484 |
|
|
| 325,614 |
|
|
| - |
|
Finance lease obligations |
|
| 2,208,596 |
|
|
| 1,109,445 |
|
|
| 1,099,151 |
|
|
| - |
|
Total |
| $ | 17,505,936 |
|
| $ | 13,084,474 |
|
| $ | 4,407,106 |
|
| $ | 14,356 |
|
| (c) | Market Risk |
|
|
|
|
| Market risk consists of interest rate risk, foreign currency risk, and price risk. These are discussed further below. |
|
|
|
|
| Interest Rate Risk |
|
|
|
|
| Interest rate risk consists of two components: |
|
| (I) | To the extent that payments made or received on the Company’s monetary assets and liabilities are affected by changes in the prevailing market interest rates, the Company is exposed to interest rate cash flow risk. |
|
|
|
|
|
| (ii) | To the extent that changes in prevailing market rates differ from the interest rates on the Company’s monetary assets and liabilities, the Company is exposed to interest rate price risk. |
|
|
|
|
|
| In management’s opinion, the Company is not exposed to significant interest rate cash flow risk as the Company’s term facility, equipment loans, and finance lease obligations bear interest at fixed rates. | |
23 | P a g e |
| MANAGEMENT’S DISCUSSION AND ANALYSIS |
|
| Foreign Currency Risk |
|
|
|
| Foreign currency risk is the risk that the fair value or future cash flows of a financial instrument will fluctuate due to changes in foreign exchange rates. The Company is exposed to foreign currency risk to the extent that the following monetary assets and liabilities are denominated in Mexican pesos and Canadian dollars (“C$”): |
|
| March 31, 2018 |
|
| December 31, 2017 |
| ||||||||||
|
| MXN |
|
| CDN |
|
| MXN |
|
| CDN |
| ||||
Cash |
| $ | 7,951,678 |
|
| $ | 353,561 |
|
| $ | 9,504,034 |
|
| $ | 320,751 |
|
Long-term investments |
|
| - |
|
|
| 31,664 |
|
|
| - |
|
|
| 42,368 |
|
Reclamation bonds |
|
| - |
|
|
| 895,500 |
|
|
| - |
|
|
| 895,500 |
|
Amounts receivable |
|
| - |
|
|
| 139,874 |
|
|
| - |
|
|
| 131,961 |
|
Accounts payable and accrued liabilities |
|
| (35,459,520 | ) |
|
| (820,583 | ) |
|
| (27,482,356 | ) |
|
| (603,463 | ) |
Due to related parties |
|
| - |
|
|
| (210,047 | ) |
|
| - |
|
|
| (224,664 | ) |
Equipment loans |
|
| - |
|
|
| (675,768 | ) |
|
| - |
|
|
| (781,675 | ) |
Finance lease obligations |
|
| (1,674,843 | ) |
|
| (887,850 | ) |
|
| (750,795 | ) |
|
| (1,002,470 | ) |
Net exposure |
|
| (29,182,685 | ) |
|
| (1,173,379 | ) |
|
| (18,729,117 | ) |
|
| (1,221,692 | ) |
US dollar equivalent |
| $ | (1,590,456 | ) |
| $ | (910,301 | ) |
| $ | (949,465 | ) |
| $ | (973,847 | ) |
|
| Based on the net US dollar denominated asset and liability exposures as at March 31, 2018, a 10% fluctuation in the US/Mexican and Canadian/US exchange rates would impact the Company’s earnings for the three months ended March 31, 2018, by approximately $263,960 (year ended December 31, 2017 - $326,558). The Company has not entered into any foreign currency contracts to mitigate this risk.
Price Risk
Price risk is the risk that the fair value or future cash flows of a financial instrument will fluctuate due to changes in market prices, other than those arising from interest rate risk or foreign currency risk.
Price risk is the risk that the fair value or future cash flows of a financial instrument will fluctuate due to changes in market prices, other than those arising from interest rate risk or foreign currency risk.
The Company is exposed to price risk with respect to its accounts receivable, as certain trade accounts receivable are recorded based on provisional terms that are subsequently adjusted according to quoted metal prices at the date of final settlement. Quoted metal prices are affected by numerous factors beyond the Company’s control and are subject to volatility, and the Company does not employ hedging strategies to limit its exposure to price risk. At March 31, 2018, based on outstanding accounts receivable that were subject to pricing adjustments, a 10% change in metals prices would have an impact on net earnings (loss) of approximately $390,387 (December 31, 2017 - $223,625).
The Company is exposed to price risk with respect to its long-term investments, as these investments are carried at fair value based on quoted market prices. Changes in market prices result in gains or losses being recognized in net income (loss). At March 31, 2018, a 10% change in market prices would have an impact on net earnings of approximately $2,456 (December 31, 2017 - $3,377). |
24 | P a g e |
| MANAGEMENT’S DISCUSSION AND ANALYSIS |
|
| The Company’s profitability and ability to raise capital to fund exploration, evaluation and production activities is subject to risks associated with fluctuations in mineral prices. Management closely monitors commodity prices, individual equity movements, and the stock market to determine the appropriate course of action to be taken by the Company. |
|
|
|
| (d) | Classification of Financial Instruments |
|
|
|
|
| IFRS 7 Financial Instruments: Disclosures establishes a fair value hierarchy that prioritizes the inputs to valuation techniques used to measure fair value as follows:
Level 1 – quoted prices (unadjusted) in active markets for identical assets or liabilities; Level 2 – inputs other than quoted prices included in Level 1 that are observable for the asset or liability, either directly (i.e., as prices) or indirectly (i.e., derived from prices); and Level 3 – inputs for the asset or liability that are not based on observable market data (unobservable inputs).
The following table sets forth the Company’s financial assets and financial liabilities measured at fair value on a recurring basis by level within the fair value hierarchy as at March 31, 2018: |
|
| Level 1 |
|
| Level 2 |
|
| Level 3 |
| |||
Financial assets |
|
|
|
|
|
|
|
|
| |||
Cash |
| $ | 2,340,073 |
|
| $ | - |
|
| $ | - |
|
Amounts receivable |
|
| - |
|
|
| 3,308,651 |
|
|
| - |
|
Long-term investments |
|
| 24,565 |
|
|
| - |
|
|
| - |
|
Financial liabilities |
|
|
|
|
|
|
|
|
|
|
|
|
Warrant liability |
|
| - |
|
|
| - |
|
|
| (981,398 | ) |
Total financial assets and liabilities, net |
| $ | 2,364,638 |
|
| $ | 3,308,651 |
|
| $ | (981,398 | ) |
Commitments
The Company has a cost sharing agreement to reimburse Oniva for a percentage of its overhead expenses, to reimburse 100% of its out-of-pocket expenses incurred on behalf of the Company, and to pay a percentage fee based on Oniva’s total overhead and corporate expenses. The agreement may be terminated with one-month notice by either party. Transactions and balances with Oniva are disclosed in “Transactions with Related Parties”.
The Company and its subsidiaries have various operating lease agreements for their office premises, use of land, and equipment. Commitments in respect of these lease agreements are as follows:
|
| March 31, 2018 |
|
| December 31, 2017 |
| ||
Not later than one year |
| $ | 186,540 |
|
| $ | 300,285 |
|
Later than one year and not later than five years |
|
| 205,825 |
|
|
| 251,435 |
|
Later than five years |
|
| 14,356 |
|
|
| 14,568 |
|
|
| $ | 406,721 |
|
| $ | 566,288 |
|
Office lease payments recognized as an expense during the three months ended March 31, 2018, totalled $27,226 (March 31, 2017 - $25,317).
25 | P a g e |
| MANAGEMENT’S DISCUSSION AND ANALYSIS |
Changes in Accounting Standards
The Company’s consolidated financial statements are presented in US dollars. The Company changed its presentation currency to US dollars from Canadian dollars effective January 1, 2017. The functional currency of the Company and its Canadian subsidiary is the Canadian dollar, while the functional currency of the Company’s Mexican subsidiaries is the US dollar. The Company believes that the change in presentation currency will provide shareholders with a better reflection of the Company’s business activities and enhance the comparability of the Company’s financial information to peers. The change in presentation currency represents a voluntary change in accounting policy which is accounted for retrospectively. The consolidated financial statements for all periods presented have been translated into the new presentation currency in accordance with IAS 21 - The Effects of Changes in Foreign Exchange Rates.
Application of new and revised accounting standards:
Adoption of IFRS 15 Revenue from Contracts with Customers (“IFRS 15”)
On January 1, 2018, the Company adopted the requirements of IFRS 15. IFRS 15 covers principles that an entity shall apply to report useful information to users of the financial statements about the nature, amount, timing, and uncertainty of revenue and cash flows arising from a contract with a customer. The Company elected to apply IFRS 15 using a full retrospective approach.
IFRS 15 requires companies to recognize revenue when “control” of goods or services transfers to the customer, whereas the previous standard, IAS 18, required entities to recognize revenue when the “risks and rewards” of the goods or services transfer to the customer. The Company concluded that there is no change to the timing of revenue recognition of its concentrate sales under IFRS 15 compared to the previous standard. As such, no adjustment was required to the Company’s financial statements.
Additionally, IFRS 15 requires companies to apportion the transaction price attributable to contracts from customers with distinct performance obligations on a relative standalone selling price basis. Certain of the Company’s concentrate agreements stipulate that the Company must pay the shipping and insurance costs necessary to bring the goods to the named destination. As such, a portion of revenue earned under these contracts, representing the obligation to fulfill the shipping and insurance services that occur after the transfer of control, is deferred and recognized over time as the obligations are fulfilled. The impact of this change is not significant to the Company’s financial statements.
IFRS 15 requires that variable consideration should only be recognized to the extent that it is highly probable that a significant reversal in the amount of cumulative revenue recognized will not occur. The Company concluded that the adjustments relating to the final assay results for the quantity and quality of concentrate sold are not significant and do not constrain the recognition of revenue.
26 | P a g e |
| MANAGEMENT’S DISCUSSION AND ANALYSIS |
Adoption of IFRS 9 Financial Instruments (“IFRS 9”)
On January 1, 2018, the Company adopted the requirements of IFRS 9. IFRS 9 provides a revised model for recognition and measurement of financial instruments and a single, forward-looking “expected-loss” impairment model. The Company adopted a retrospective approach, other than for hedge accounting, which is applied prospectively.
IFRS 9 did not impact the Company’s classification and measurement of financial assets and liabilities, and there was no significant impact on the carrying amounts of the Company’s financial instruments at the transition date. The Company had the option to designate its current equity securities as financial assets at fair value through other comprehensive income or loss. The Company chose not to make this election, and changes in the fair value of its current equity securities will continue to be recognized in profit or loss in accordance with the Company’s current policy.
The introduction of the new ‘expected credit loss’ impairment model had negligible impact on the Company, given the Company sells its concentrate to large international organizations with no historical level of customer default, and the corresponding receivables from these sales are short-term in nature.
The Company currently has no hedging arrangements, and will apply the new accounting requirements under IFRS 9 as required.
Additional Disclosures
Additional disclosures have been presented in Notes 18 and 21 as a result of adopting IFRS 9 and IFRS 15.
Changes in accounting standards not yet effective:
The Company has not early adopted any amendment, standard or interpretation that has been issued by the IASB but is not yet effective. The following accounting standards were issued and are effective as of March 31, 2018:
IFRS 16 – Leases
In January 2016, the IASB issued IFRS 16 – Leases (“IFRS 16”) which replaces IAS 17 – Leases and its associated interpretative guidance, and will be effective for accounting periods beginning on or after January 1, 2019. Early adoption is permitted, provided the Company has adopted IFRS 15. This standard sets out a new model for lease accounting. A lessee can choose to apply IFRS 16 using either a full retrospective approach or a modified retrospective approach. The Company plans to apply IFRS 16 at the date it becomes effective and has not yet selected a transition approach.
The Company is in the process of identifying and collecting data relating to existing agreements that may contain right-of-use assets. At this time it is not possible for the Company to make reasonable quantitative estimates of the effects of the new standard, and is currently evaluating its expected impact on the consolidated financial statements.
27 | P a g e |
| MANAGEMENT’S DISCUSSION AND ANALYSIS |
Outstanding Share Data
The Company’s authorized share capital consists of an unlimited number of common shares without par value.
As at May 15, 2018, the following common shares, warrants, and stock options were outstanding:
|
| Number of shares |
|
| Exercise price |
|
| Remaining life (years) |
| |||
Share capital |
|
| 55,805,653 |
|
|
| - |
|
|
| - |
|
Warrants |
|
| 3,602,215 |
|
| $1.00 - $2.00 |
|
| 0.85 – 1.56 |
| ||
RSUs |
|
| 592,172 |
|
|
| - |
|
| 1.32 – 2.37 |
| |
Stock options |
|
| 3,126,000 |
|
| C$1.62 - C$2.95 |
|
| 0.34 – 4.41 |
| ||
Fully diluted |
|
| 63,126,040 |
|
|
|
|
|
|
|
|
|
The following are details of outstanding stock options as at March 31, 2018, and May 15, 2018:
Expiry Date |
| Exercise Price Per Share |
| Number of Shares Remaining Subject to Options (March 31, 2018) |
|
| Number of Shares Remaining Subject to Options (May 15, 2018) |
| ||
September 9, 2018 |
| C$1.62 |
|
| 276,000 |
|
|
| 248,500 |
|
September 19, 2019 |
| C$1.90 |
|
| 620,000 |
|
|
| 620,000 |
|
December 22, 2019 |
| C$1.90 |
|
| 105,000 |
|
|
| 105,000 |
|
September 2, 2021 |
| C$2.95 |
|
| 682,500 |
|
|
| 682,500 |
|
September 20, 2022 |
| C$1.98 |
|
| 1,430,000 |
|
|
| 1,430,000 |
|
October 6, 2022 |
| C$1.98 |
|
| 40,000 |
|
|
| 40,000 |
|
Total: |
|
|
|
| 3,153,500 |
|
|
| 3,126,000 |
|
The following are details of outstanding warrants as at March 31, 2018, and May 15, 2018:
Expiry Date |
| Exercise Price Per Share |
|
| Number of Underlying Shares (March 31, 2018) |
|
| Number of Underlying Shares (May 15, 2018) |
| |||
March 14, 2019 |
| $ | 1.00 |
|
|
| 40,000 |
|
|
| 40,000 |
|
November 28, 2019 |
| $ | 2.00 |
|
|
| 3,562,215 |
|
|
| 3,562,215 |
|
Total: |
|
|
|
|
|
| 3,602,215 |
|
|
| 3,602,215 |
|
The following are details of outstanding RSUs as at March 31, 2018, and May 15, 2018:
Expiry Date |
| Number of Shares Remaining Subject to RSUs (March 31, 2018) |
|
| Number of Shares Remaining Subject to RSUs (May 15, 2018) |
| ||
September 2, 2019 |
|
| 511,672 |
|
|
| 511,672 |
|
September 20, 2020 |
|
| 80,500 |
|
|
| 80,500 |
|
Total: |
|
| 592,172 |
|
|
| 592,172 |
|
28 | P a g e |
| MANAGEMENT’S DISCUSSION AND ANALYSIS |
Disclosure Controls and Procedures
Management has designed and evaluated the effectiveness of the design and operation of the Company’s disclosure controls and procedures on financial reporting (as defined in NI 52-109 - Certification of Disclosure in Issuers’ Annual and Interim Filings) and has concluded that, based on its evaluation, they are effective as of March 31, 2018, to provide reasonable assurance that material information relating to the Company and its consolidated subsidiaries is made known to management and disclosed in accordance with applicable securities regulations.
Internal Controls over Financial Reporting (“ICFR”)
The management of the Company is responsible for establishing and maintaining adequate internal controls over financial reporting. Internal controls over financial reporting is a process to provide reasonable assurance regarding the reliability of the Company’s financial reporting for external purposes in accordance with IFRS. Internal controls over financial reporting includes maintaining records that in reasonable detail accurately and fairly reflect the Company’s transactions and dispositions of the assets of the Company; providing reasonable assurance that transactions are recorded as necessary for preparation of the Company’s consolidated financial statements in accordance with IFRS; providing reasonable assurance that receipts and expenditures are made in accordance with authorizations of management and the directors of the Company; and providing reasonable assurance that unauthorized acquisition, use or disposition of the Company’s assets that could have a material effect on the Company’s consolidated financial statements would be prevented or detected on a timely basis. Our management and the Board of Directors do not expect that our disclosure controls and procedures or internal controls over financial reporting will prevent all errors or all instances of fraud. A control system, no matter how well designed and operated, can provide only reasonable (not absolute) assurance that the control system’s objectives will be met. Further, the design, maintenance and testing of a control system must reflect the fact that there are resource constraints and the benefits of controls must be considered relative to their costs.
Because of the inherent limitations in all control systems, no evaluation of controls can provide absolute assurance that all control gaps and instances of fraud have been detected. These inherent limitations include the reality that judgment in decision-making can be faulty, and that breakdowns can occur because of simple errors or mistakes. Controls can also be circumvented by the individual acts of some persons, by collusion of two or more people, or by management override of the controls. The design, maintenance and testing of any system of controls is based in part upon certain assumptions about the likelihood of future events, and any control system may not succeed in achieving its stated goals under all potential future conditions.
Management conducted an evaluation of the effectiveness of the Company’s internal controls over financial reporting based on the framework and criteria established in Internal Control – Integrated Framework, issued by the Committee of Sponsoring Organizations of the Treadway Commission (2013) (‘COSO’). This evaluation included review of the documentation of controls, evaluation of the design effectiveness of controls, testing of the operating effectiveness of controls and a conclusion on this evaluation.
Based on this evaluation, management concluded that as of March 31, 2018, the Company’s internal controls over financial reporting, as defined in NI 52-109 - Certification of Disclosure in Issuer’s Annual and Interim Filings, are effective to achieve the purpose for which they have been designed.
29 | P a g e |
| MANAGEMENT’S DISCUSSION AND ANALYSIS |
Unresolved Staff Comments with the SEC
In late December 2017, Avino received written comments from the Staff of the SEC regarding our financial statements contained in our Annual Report on Form 20-F for the year ended December 31, 2016. We have responded to those comments and have received follow-up letters from the Staff in which the Company has responded to such follow-up letters.
The substance of the principal unresolved comments involve providing further information regarding (i) development-type costs that were included in our exploration and evaluation assets; (ii) mine and camp costs, and milling, processing and labor costs incurred during our evaluation phase of mine operations; (iii) exploration and evaluation activities as they relate to reclamation provisions; (iv) methodology of classifying development-type costs as capitalized assets; and (v) factors considered to determine that we had entered into commercial production.
While we believe that we have addressed the Staff’s comments raised in their various letters, as of the date of the filing of this Interim Report, there remains the above unresolved, outstanding staff comments including our responses to such outstanding comments.
Cautionary Statement
This MD&A is based on a review of the Company’s operations, financial position and plans for the future based on facts and circumstances as of May 15, 2018. Except for historical information or statements of fact relating to the Company, this document contains “forward-looking statements” within the meaning of applicable Canadian securities regulations. Forward-looking statements in this document include, but are not limited to, those regarding the economic outlook for the mining industry, expectations regarding metals prices, expectations regarding production output, production costs, cash costs and other operating results, expectations regarding growth prospects and the outlook for the Company’s operations, and statements regarding the Company’s liquidity, capital resources, and capital expenditures. There can be no assurance that such statements will prove to be accurate, and future events and actual results could differ materially from those anticipated in such statements. Important factors that could cause actual results to differ materially from our expectations are disclosed in the Company’s documents filed from time to time via SEDAR with the Canadian regulatory agencies to whose policies we are bound. Forward-looking statements are based on the estimates and opinions of management on the date the statements are made, and we do not undertake any obligation to update forward-looking statements should conditions or our estimates or opinions change, except as required by applicable securities regulations. These statements involve known and unknown risks, uncertainties, and other factors that may cause the Company’s actual results, levels of activity, performance or achievements to be materially different from any future results, levels of activity, performance or achievements expressed or implied by these forward-looking statements. |
30 | P a g e |
|