The following discussion and analysis of the operations, results, and financial position of Avino Silver & Gold Mines Ltd. (the “Company” or “Avino”) should be read in conjunction with the Company’s audited consolidated financial statements as at and for the year ended December 31, 2023, and the notes thereto.
This Management’s Discussion and Analysis (“MD&A”) is dated March 20, 2024, and discloses specified information up to that date. The consolidated financial statements are prepared in accordance with International Financial Reporting Standards (“IFRS”) as issued by the International Accounting Standards Board (“IASB”). Unless otherwise cited, references to dollar amounts are in US dollars. This MD&A contains “forward-looking statements” that are subject to risk factors including those set out in the “Cautionary Statement” at the end of this MD&A. All information contained in this MD&A is current and has been approved by the Company’s Board of Directors as of March 20, 2024, unless otherwise indicated. Throughout this report we refer to “Avino”, the “Company”, “we”, “us”, “our”, or “its”. All these terms are used in respect of Avino Silver & Gold Mines Ltd. We recommend that readers consult the “Cautionary Statement” on the last page of this report. Additional information relating to the Company is available on the Company’s website at www.avino.com and on SEDAR+ at www.sedarplus.ca.
Business Description
Avino Silver & Gold Mines Ltd. (the “Company” or “Avino”) was incorporated in 1968 under the laws of the Province of British Columbia, Canada. The Company is engaged in the production and sale of silver, gold, and copper and the acquisition, exploration, and advancement of mineral properties.
The Company’s head office and principal place of business is Suite 900, 570 Granville Street, Vancouver, BC, Canada. The Company is a reporting issuer in Canada (except for the province of Quebec) and the United States, and its common shares are listed on the Toronto Stock Exchange (“TSX”), the NYSE American, and the Frankfurt and Berlin Stock Exchanges.
Discussion of Operations
The Company’s production, exploration, and evaluation activities during the year ended December 31, 2023, have been conducted on its Avino Property.
The Company holds a 99.67% effective interest in Compañía Minera Mexicana de Avino, S.A. de C.V. (“Avino Mexico”), a Mexican corporation which owns the Avino Property. The Avino Property covers approximately 1,104 contiguous hectares, and is located approximately 80 km north-east of the city of Durango. The Avino Property is equipped with milling and processing facilities that presently process all output from the Avino Mine located on the property. The Avino property also hosts the San Gonzalo Mine, which is currently on care and maintenance. The Company also holds 100% interest in Proyectos Mineros La Preciosa S.A. de C.V. (“La Preciosa”), a Mexican corporation which owns the La Preciosa Property. The Company also owns interests in mineral properties located in British Columbia and Yukon, Canada.
1 | Page
MANAGEMENT’S DISCUSSION AND ANALYSIS
FOR THE YEAR ENDED DECEMBER 31, 2023
Operational Highlights
HIGHLIGHTS
(Expressed in US$, unless otherwise noted)
Fourth Quarter 2023
Fourth Quarter 2022
Change
Year
2023
Year
2022
Change
Operating
Tonnes Milled
143,738
150,292
-4%
615,373
541,823
14%
Silver Ounces Produced
224,723
309,856
-27%
928,643
985,195
-6%
Gold Ounces Produced
1,452
2,426
-40%
7,335
5,778
27%
Copper Pounds Produced
1,317,793
1,540,851
-14%
5,304,808
6,504,177
-18%
Silver Equivalent Ounces1 Produced
558,460
770,127
-27%
2,415,232
2,655,502
-9%
Concentrate Sales and Cash Costs
Silver Equivalent Payable Ounces Sold2
584,061
756,536
-23%
2,086,485
2,449,704
-15%
Cash Cost per Silver Equivalent Payable Ounce1,2,3
$
15.04
$
11.76
28%
$
15.61
$
10.34
51%
All-in Sustaining Cash Cost per Silver Equivalent Payable Ounce1,2,3
$
21.67
$
18.63
16%
$
21.87
$
17.91
22%
1.In Q4 2023, AgEq was calculated using metals prices of $23.50 oz Ag, $1,994 oz Au and $3.72 lb Cu. In Q4 2022, AgEq was calculated using metals prices of $21.18 oz Ag, $1,729 oz Au and $3.63 lb Cu. For YTD 2023, AgEq was calculated using metals prices of $23.46 oz Ag, $1,953 oz Au and $3.83 lb Cu. For YTD 2022, AgEq was calculated using metal prices of $21.75 oz Ag, $1,801 oz Au and $4.00 lb Cu. Calculated figures may not add up due to rounding.
2. “Silver equivalent payable ounces sold” for the purposes of cash costs and all-in sustaining costs consists of the sum of payable silver ounces, gold ounces and copper tonnes sold, before penalties, treatment charges, and refining charges, multiplied by the ratio of the average spot gold and copper prices to the average spot silver price for the corresponding period.
3. The Company reports non-IFRS measures which include cash cost per silver equivalent payable ounce and all-in sustaining cash cost per payable ounce. These measures are widely used in the mining industry as a benchmark for performance, but do not have a standardized meaning under IFRS and the calculation methods may differ from methods used by other companies with similar reported measures. See Non-IFRS Measures section for further information and detailed reconciliations.
Financial Highlights
HIGHLIGHTS
(Expressed in 000’s of US$)
Fourth Quarter 2023
Fourth Quarter 2022
Change
Year
2023
Year
2022
Change
Financial Operating Performance
Revenues
$
12,530
$
14,649
-14%
$
43,889
$
44,187
-1%
Mine operating income
$
2,561
$
4,356
-41%
$
7,819
$
15,062
-48%
Net income
$
563
$
1,296
-57%
$
542
$
3,096
-82%
Earnings before interest, taxes and amortization (“EBITDA”)1
$
1,120
$
3,207
-65%
$
2,506
$
10,262
-76%
Adjusted earnings1
$
1,972
$
4,026
-51%
$
4,601
$
10,238
-55%
Cash provided by operating activities
$
621
$
3,320
-81%
$
1,488
$
11,831
-87%
Per Share Amounts
Earnings per share – basic & diluted
$
0.00
$
0.01
-100%
$
0.00
$
0.03
-100%
Adjusted earnings per share1
$
0.02
$
0.03
-33%
$
0.04
$
0.08
-50%
HIGHLIGHTS
(Expressed in 000’s of US$)
December 31, 2023
September 30, 2023
Change
December 31, 2023
December 31, 2022
Change
Liquidity & Working Capital
Cash
$
2,688
$
1,856
45%
$
2,688
$
11,245
-76%
Working capital1
$
9,727
$
7,445
31%
$
9,727
$
8,821
10%
1. The Company reports non-IFRS measures which include cash cost per silver equivalent payable ounce, all-in sustaining cash cost per payable ounce, EBITDA, adjusted earnings, adjusted earnings per share, and working capital. These measures are widely used in the mining industry as a benchmark for performance, but do not have a standardized meaning and the calculation methods may differ from methods used by other companies with similar reported measures. See Non-IFRS Measures section for further information and detailed reconciliations.
2 | Page
MANAGEMENT’S DISCUSSION AND ANALYSIS
FOR THE YEAR ENDED DECEMBER 31, 2023
4th Quarter and FY 2023 Highlights
Oxide Tailings Project
On February 5, 2024, the Company released the results of the Preliminary Prefeasibility Study (the “PSF”) prepared in accordance with National Instrument 43-101 – Standard for Disclosure for Mineral Projects with NPV US$98 million (pre-tax) and US$61 million (post-tax) at a 5% discount rate, IRR 35% (pre-tax) and 26% (post-tax), proven and probable mineral reserves of 6.70 Million tonnes at a silver and gold grade of 55 g/t and 0.47 g/t respectively, nominal processing rate over a 9-year life of mine. The completion of the study is a milestone in our 5-year growth plan to become an intermediate silver producer in Mexico.
La Preciosa Update:
On January 9, 2024, the Company announced that it had signed a long-term land-use agreement with a local community for the development of La Preciosa in Durango, Mexico. La Preciosa hosts one of the largest undeveloped primary silver resources in Mexico and is located approximately 19 kilometres from the current Avino Mine production operations. With this long-term land-use agreement in place, the Company will start planning to commence hauling of old surface stockpiles of material to our mill at the Avino Mine for processing. In addition, the Company will now begin the filing of the environmental permit for underground extraction. The La Preciosa mine represents a key pillar in Avino’s transformational growth strategy.
Consistent Production at Avino
On January 16, 2024, the Company released its fourth quarter production results. 558,460 silver equivalent ounces produced in Q4 2023. Achieved full year 2023 production results of 2.4 million silver equivalent ounces.
Avino Announced Best Drill Intercept in Company History
On July 5, 2023, the Company released the results of three holes from below Level 17, the current deepest workings at the ET area of the Avino system. Drill Hole ET-23-13 showed 44.40 metres true width of mineralization and is a step-out 50 metres to the west of Avino’s most westerly drill hole at 200 metres downdip below Level 17. This mineralized intercept is exceptionally wide and has very high silver, gold and copper grades. The vein system continues to be open along strike and at depth.
Continuing Exceptional Drill Results
On September 14, 2023, the Company released the results of four additional holes from below Level 17, the current deepest workings at the Elena Tolosa (“ET”) area of the Avino system. These latest deep step-out holes test the SW extent of the robust Avino vein, and one infill hole was drilled to confirm local continuity. This drilling follows the continuity of the steeply dipping mineralization and aids in understanding the deep source of the mineralization. The Company is looking at the potential geometry and controls of the mineralization to come up with a model. Avino has completed its planned and budgeted drilling program for the year by drilling 7,545 metres in 13 drill holes. Our geologists on site are working through the recommendations made by our consulting geologists to study the potential of the entire ore body. The 2023 results will be reviewed to determine exploration plans and budget for 2024. The drill holes hit substantial widths at grades well above our current cutoff grade on all four drill holes.
3 | Page
MANAGEMENT’S DISCUSSION AND ANALYSIS
FOR THE YEAR ENDED DECEMBER 31, 2023
Dry Stack Tailings Facility:
The facility has been fully operational for a year. The conveyor system is installed and is currently transporting the pressed dry residues to the previously-mined Avino open pit area. A tab is now available on our website that provides further information on our tailings management system, along with a video (in Spanish) from the minesite that can be viewed. In addition, a selection of short videos of the facility in operation can be viewed under Videos and Media.
Financial Results – Three months ended December 31, 2023, compared to three months ended December 31, 2022
2023
2022
Revenue from mining operations
$
12,530
$
14,649
Cost of sales
9,969
10,393
Mine operating income
2,561
4,356
Operating expenses:
General and administrative expenses
1,621
1,687
Share-based payments
460
406
Income before other items
480
2,263
Other items:
Interest and other income
180
47
Gain (loss) on long-term investments
(31
)
400
Fair value adjustment on warrant liability
-
(297
)
Unrealized foreign exchange gain (loss)
(73
)
213
Finance cost
(1
)
(85
)
Accretion of reclamation provision
(13
)
(12
)
Interest expense
(106
)
(33
)
Income before income taxes
436
2,402
Income taxes:
Current income tax expense
(118
)
(502
)
Deferred income tax recovery (expense)
245
(604
)
Income tax recovery (expense)
127
(1,106
)
Net income
$
563
$
1,296
Other comprehensive income (loss):
Currency translation differences
361
(202
)
Total comprehensive income
$
819
$
1,094
Earnings per share
Basic
$
0.00
$
0.01
Diluted
$
0.00
$
0.01
Weighted average number of common shares outstanding
Basic
124,714,723
118,349,090
Diluted
127,763,043
120,552,038
4 | Page
MANAGEMENT’S DISCUSSION AND ANALYSIS
FOR THE YEAR ENDED DECEMBER 31, 2023
Revenues
During the three months ended December 31, 2023, the Company recognized revenues of $12.5 million on the sale of Avino Mine bulk copper/silver/gold concentrate, compared to $14.6 million revenues for Q4 2022, a decrease of $2.1 million. The decrease is a result of lower payable silver equivalent ounces sold in the current period of 584,061 ounces, compared to 736,885 ounces in Q4 2022. This is primarily as a result of mine production in areas of lower feed grade, resulting in lower recoveries and fewer ounces produced. This was partially offset by higher realized metal prices in Q4 2023 compared to Q4 2022.
Metal prices for revenues recognized during the period were $23.50 per ounce of silver, $1,994 per ounce of gold, and $8,202 per tonne of copper, compared to averages of $21.54, $1,735, and $7,982, respectively, for the fourth quarter of 2022.
Cost of Sales & Mine Operating Income
During the three months ended December 31, 2023, cost of sales was $10.0 million, compared to $10.4 million in Q4 2022, a decrease of $0.4 million. Cost of sales for Q4 2023 was in line with Q4 2022, with higher tonnes mined and lower tonnes processed in the current period comparatively. Tonnage mined and hauled to surface was 163,496 tonnes in Q4 2023, compared to 155,278 tonnes in Q4 2022, an increase of 5%. Tonnage processed in Q4 2023 was 143,798 tonnes, compared to 150,292 tonnes in Q4 2022, a decrease of 4%.
Mine operating income, after depreciation and depletion, was $2.6 million, compared to income of $4.4 million in Q4 2022. The mine operating income was lower than Q4 2022 as a result of lower sales volumes, which is a direct result of lower payable silver equivalent ounces sold in the current quarter, and as described in the “Revenues” section.
General and Administrative Expenses & Share-Based Payments
General and administrative expenses was $1.6 million, compared to $1.7 million in Q4 2022. This is in line with expectations, demonstrating another consistent quarter in managing administrative expenses. Share-based payments was $0.5 million, compared to $0.4 million in Q4 2022, consistent with prior quarter, and as a result of the vesting of previously issued options and restricted share units.
Other Items
Other Items totaled a loss of $0.3 million for the period, a change of $0.4 million compared to income of $0.1 million related to other items in Q4 2022.
Unrealized loss on long-term investment was $0.03 million, a decrease of $0.4 million compared to a gain of $0.4 million in Q4 2022. This is a direct result of fluctuations in the Company’s investment in shares of Talisker Resources, as well as the Company’s investment in shares of Silver Wolf Exploration and Endurance Gold.
Fair value adjustment on warrant liability was $Nil compared to a gain of $0.3 million in Q4 2022. The fair value adjustment on the Company’s warrant liability relates to the issuance of US dollar-denominated warrants, which are re-valued each reporting period, and the value fluctuates with changes in the US-Canadian dollar exchange rate, and in the variables used in the valuation model, such as the Company’s US share price, and expected share price volatility. All US dollar-denominated warrants expired in September 2023, thus there is no adjustment for Q4 2023.
Foreign exchange loss for the period was $0.1 million, a change of $0.3 million compared to a gain of $0.2 million in Q4 2022. Unrealized foreign exchange gains or losses result from transactions in currencies other than the Canadian dollar functional currency. During the quarter ended December 31, 2023, the Mexican peso appreciated slightly in relation to the US dollar, which resulted in an unrealized loss on the net asset position in Mexico, while in Q4 2022, the US dollar and Canadian dollar appreciated slightly resulting in an unrealized foreign exchange gain. The remaining Other Items resulted in a gain of $0.1 million, a difference of $0.3 million when compared to a loss of $0.2 million in Q4 2022.
5 | Page
MANAGEMENT’S DISCUSSION AND ANALYSIS
FOR THE YEAR ENDED DECEMBER 31, 2023
Current and Deferred Income Taxes
Current income tax expense of $0.1 million in Q4 2023, compared to $0.5 million in income tax expense for Q4 2022, remains fairly consistent. The movement relates primarily to movements in the calculation of the Special Mining Duty tax that applies to mining profits generated in Mexico.
Deferred income tax recovery was $0.2 million, a change of $0.8 million compared to an expense of $0.6 million in Q4 2022. Deferred income tax fluctuates due to movements in taxable and deductible temporary differences related to changes in inventory, plant, equipment and mining properties, and exploration and evaluation assets, amongst other factors. The changes in current income taxes and deferred income taxes during the current and comparable periods primarily relate to movements in the tax bases and mining profits and/or losses in Mexico.
Net Income/Loss
Net income was $0.6 million for the period, or $0.00 per share, compared to a net income of $1.3 million, or $0.01 per share during Q4 2022. The changes are a result of the items noted above, which are primarily decreases in revenues, cost of sales, mine operating income and movements in the fair value adjustment of the long-term investments and unrealized foreign exchange. The remain items were consistent, showing no significant variances as noted above.
EBITDA & Adjusted Income/Loss (see “Non-IFRS Measures”)
EBITDA was $1.1 million, a decrease of $2.1 million when compared to $3.2 million for Q4 2022. The changes in EBITDA are primarily a factor of the items above, excluding any changes in depreciation and depletion, changes in interest expense and income, as well as any changes in income taxes. See Non-IFRS Measures for a reconciliation for EBITDA.
Adjusted earnings for the period was $2.0 million, a decrease of $2.0 million when compared to adjusted earnings of $4.0 million in the corresponding quarter in 2022. Changes to adjusted earnings are a result of the items noted above in EBITDA, further excluding share-based payments, gains and losses related to warrants, and movements in unrealized foreign exchange. See Non-IFRS Measures for a reconciliation for adjusted losses.
Cash Costs & All-in Sustaining Cash Costs (see “Non-IFRS Measures”)
Cash costs per silver equivalent payable ounce was $15.04, compared to $11.76 for Q4 2022. The increase in cost per ounce is a result of higher mine cost with less ounces produced and sold in Q4 2023 when compared to Q4 2022, primarily due to lower mill productivity and performance in the current quarter. The increase is also attributable to a stronger Mexican peso during the quarter, which directly impacted labour and contractor costs.
All-in sustaining cash costs per silver equivalent payable ounce was $21.67, compared to $18.63 for Q4 2022. The increase is primarily a result of items above, with no significant difference between the comparable quarter in sustaining capital and exploration costs.
See Non-IFRS Measures for a reconciliation for cash costs and all-in sustaining cash costs.
6 | Page
MANAGEMENT’S DISCUSSION AND ANALYSIS
FOR THE YEAR ENDED DECEMBER 31, 2023
Annual Selected information – Year ended December 31, 2023, compared to year ended December 31, 2022:
2023
2022
Revenue from mining operations
$
43,889
$
44,187
Cost of sales
36,070
29,125
Mine operating income
7,819
15,062
Operating expenses
General and administrative expenses
5,620
5,156
Share-based payments
2,269
2,024
(70
)
7,882
Other items
Interest and other income
414
20
Unrealized loss on long-term investments
(931
)
(2,103
)
Fair value adjustment on warrant liability
478
2,395
Foreign exchange gain (loss)
110
(17
)
Project evaluation expenses
-
(81
)
Finance cost
(81
)
(273
)
Accretion of reclamation provision
(49
)
(44
)
Interest expense
(381
)
(99
)
Income (loss) before income taxes
(510
)
7,680
Income taxes:
Current income tax recovery (expense)
527
(1,144
)
Deferred income tax recovery (expense)
525
(3,440
)
Income tax (expense) recovery
1,052
(4,584
)
Net income
542
3,096
Other comprehensive income (loss)
Items that may be reclassified subsequently to profit or loss:
Currency translation differences
15
(254
)
Total comprehensive income
$
557
$
2,842
Earnings per share
Basic
$
0.00
$
0.03
Diluted
$
0.00
$
0.03
Weighted average number of common shares outstanding
Basic
121,261,696
114,372,371
Diluted
125,346,674
117,615,898
7 | Page
MANAGEMENT’S DISCUSSION AND ANALYSIS
FOR THE YEAR ENDED DECEMBER 31, 2023
Revenues
The Company recognized revenues net of penalties, treatment costs and refining charges, of $43.9 million on the sale of Avino Mine bulk copper/silver/gold concentrate, compared to $44.2 million revenues for year ended December 31, 2022, a decrease of $0.3 million. The sales are in line with prior year as a result of higher realized metal prices in 2023, primarily for gold and silver, partially offset by lower payable silver equivalent ounces sold in the current period of 2.08 million, compared to 2.45 million in 2022. This was a result of mine production in areas of lower feed grade, resulting in lower recoveries and fewer ounces produced in the current year compared to 2022. The decrease was partially offset by higher realized metal prices for silver and gold in the current year.
Metal prices for revenues recognized during the period were $23.46 per ounce of silver, $1,953 per ounce of gold, and $8,439 per tonne of copper, compared to $21.51, $1,788, and $8,552, respectively, for the same period in 2022.
Cost of Sales & Mine Operating Income
Cost of sales was $36.1 million, compared to $29.1 million in 2022, an increase of $7.0 million. The increase in cost of sales is partially attributable to 14% higher milled tonnes during 2023 compared to 2022, as well as 24% higher mined tonnes in the same period, which resulted in higher overall overhead costs despite lower ounces sold in the current year when compared to 2022. The increase is also attributable to a stronger Mexican peso during the period, which directly impacted labour and contractor costs. The Company prides itself in operating primarily with local workers and contractors for its mining operations.
Mine operating income, after depreciation and depletion, was $7.8 million, compared to $15.1 million in 2022. The decrease in mine operating income is a result of the increased cost of sales noted above. Further, unit costs were directly impacted due to a stronger Mexican Peso, especially labour and contractor costs. These increases were partially offset by higher realized metal prices during 2023 compared to 2022, as noted above.
General and Administrative Expenses & Share-Based Payments
General and administrative expenses was $5.6 million, compared to $5.1 million during the corresponding period in 2022, with the increases coming additional professional fees incurred following the inclusion of La Preciosa into ongoing operations.
Share-based payments was $2.3 million, compared to $2.0 million for the same period in 2022, an increase of $0.3 million. The increase is a direct result of the timing of option and RSU grants, and fluctuations in share price on the date of issuance.
Other Items
Other Items totaled loss of $0.7 million for the period, a change of $0.5 million compared to $0.2 in 2022.
Unrealized loss on long-term investments was $0.9 million, a positive movement of $1.2 million compared to a loss of $2.1 million in 2022. This is a direct result of fluctuations in the Company’s investment in shares of Talisker Resources, and to a lesser extent, the Company’s investment in shares of Silver Wolf Exploration and Endurance Gold Corp.
Fair value adjustment on warrant liability was a gain of $0.5 million, a decrease to income of $1.9 million compared to a gain of $2.4 million in 2022. The fair value adjustment on the Company’s warrant liability relates to the issuance of US dollar-denominated warrants, which are re-valued each reporting period, and the value fluctuates with changes in the US-Canadian dollar exchange rate, and in the variables used in the valuation model, such as the Company’s US share price, and expected share price volatility. All US dollar-denominated warrants expired in September 2023.
8 | Page
MANAGEMENT’S DISCUSSION AND ANALYSIS
FOR THE YEAR ENDED DECEMBER 31, 2023
Interest expense for the period was $0.4 million, a change of $0.3 million compared to an expense of $0.1 million in the comparable period of 2022. The increase in interest expense is mainly attributable to new mining equipment acquired under leases during 2023.
Foreign exchange gain for the period was $0.1 million, a change of $0.1 million compared to a loss of Nil in the comparable period of 2022. Foreign exchange gains or losses result from transactions in currencies other than the Canadian dollar functional currency. During both periods, the Canadian dollar and the US dollar depreciated in relation to the Mexican peso, resulting in a foreign exchange loss.
The remaining Other Items resulting in a loss of $0.2 million for both years ended December 31, 2023 and 2022.
Current and Deferred Income Taxes
Current income tax recovery was $0.5 million in 2023, a change of $1.6 million compared to $1.1 in income tax expense for the comparable period of 2022. The movements are a result of higher profits generated in 2022, resulting in increased income tax expense, whereas in 2023, the Company was in a recovery position as a result of less profitable mining operations in the early part of the year.
Deferred income tax recovery was $0.5 million, a change of $3.9 million compared to a tax expense of $3.4 million in 2022. Deferred income tax fluctuates due to movements in taxable and deductible temporary differences related to the special mining duty in Mexico and to changes in inventory, plant, equipment and mining properties, and exploration and evaluation assets, amongst other factors. The changes in current income taxes and deferred income taxes during the current and comparable periods primarily relate to movements in the tax bases and mining profits and/or losses in Mexico.
Net Income/Loss
Net income was $0.5 million for the period, or $0.00 per share, compared to income of $3.1 million, or $0.03 per share during comparable period of 2022. The changes are a result of the items noted above, which are primarily increases in cost of sales resulting in a decrease of mine operating income, slight increases in general and administrative expenses and share-based payments. Net income was further impacted by movements in unrealized foreign exchange, fair value adjustments on the warrant liability, and a decreased unrealized loss on investments, as noted above.
EBITDA & Adjusted Income/Loss (see “Non-IFRS Measures”)
EBITDA was $2.5 million, a decrease of $7.8 million when compared to $10.3 million for comparable period of 2022. The changes in EBITDA are primarily a factor of the items above, excluding any changes in depreciation and depletion, changes in interest expense and income, as well as any changes in income taxes. See Non-IFRS Measures for a reconciliation for EBITDA.
Adjusted earnings for the period was $4.6 million, a decrease of $5.6 million when compared to adjusted earnings of $10.2 million in the corresponding period in 2022. Changes to adjusted losses are a result of the items noted above in EBITDA, further excluding share-based payments, gains and losses related to warrants, and movements in unrealized foreign exchange. See Non-IFRS Measures for a reconciliation for adjusted earnings.
Cash Costs & All-in Sustaining Cash Costs (see “Non-IFRS Measures”)
Cash costs per silver equivalent payable ounce, excluding stand-by costs, was $15.61, compared to $10.34 for the same period in 2022. The increase in cost per ounce is partially attributable to higher milled and mined tonnes of 24% and 14%, respectively, in the year ended December 31, 2023 compared to 2022, which resulted in higher overall costs despite lower ounces sold in the current period. The increase is also attributable to a stronger Mexican peso, which directly impacted labour and contractor costs, and as outlined in the “Cost of Sales & Mine Operating Income” section.
9 | Page
MANAGEMENT’S DISCUSSION AND ANALYSIS
FOR THE YEAR ENDED DECEMBER 31, 2023
All-in sustaining cash costs per silver equivalent payable ounce was $21.87, compared to $17.91 for the same period in 2022. The increase is primarily a result of the items noted above, offset by reductions in penalties, exploration expenses and sustaining capital expenditures.
See Non-IFRS Measures for a reconciliation for cash costs and all-in sustaining cash costs.
Avino Mine Production Highlights
Q4
2023
Q4
2022
Change
%
FY
2023
FY
2022
Change %
Total Mill Feed (dry tonnes)
143,738
150,292
-4%
615,373
541,823
14%
Feed Grade Silver (g/t)
56
70
-20%
54
62
-13%
Feed Grade Gold (g/t)
0.45
0.62
-27%
0.51
0.42
21%
Feed Grade Copper (%)
0.49
0.53
-7%
0.47
0.61
-23%
Recovery Silver (%)
87%
92%
-5%
87%
92%
-5%
Recovery Gold (%)
70%
81%
-14%
72%
78%
-8%
Recovery Copper (%)
84%
88%
-4%
83%
89%
-7%
Total Silver Produced (oz)
224,723
309,856
-27%
928,643
985,185
-6%
Total Gold Produced (oz)
1,452
2,426
-40%
7,335
5,778
27%
Total Copper Produced (lbs)
1,317,793
1,540,851
-14%
5,304,808
6,504,177
-18%
Total Silver Equivalent Produced (oz)*
558,460
770,127
-27%
2,415,232
2,655,502
-9%
*In Q4 2023, AgEq was calculated using metals prices of $23.50 oz Ag, $1,994 oz Au and $3.72 lb Cu. In Q4 2022, AgEq was calculated using metals prices of $21.18 oz Ag, $1,729 oz Au and $3.63 lb Cu. For YTD 2023, AgEq was calculated using metals prices of $23.46 oz Ag, $1,953 oz Au and $3.83 lb Cu. For YTD 2022, AgEq was calculated using metal prices of $21.75 oz Ag, $1,801 oz Au and $4.00 lb Cu.
Under National Instrument 43-101, the Company is required to disclose that it has not based its production decisions on NI 43-101-compliant reserve estimates, preliminary economic assessments, or feasibility studies, and historically projects without such reports have increased uncertainty and risk of economic viability. The Company's decision to place a mine into operation at levels intended by management, expand a mine, make other production-related decisions, or otherwise carry out mining and processing operations is largely based on internal non-public Company data, and on reports based on exploration and mining work by the Company and by geologists and engineers engaged by the Company. The results of this work are evident in the Company's discovery of the San Gonzalo and Avino Mine resources, and in the Company's record of mineral production and financial returns since operations at levels intended by management commenced at the San Gonzalo Mine in 2012.
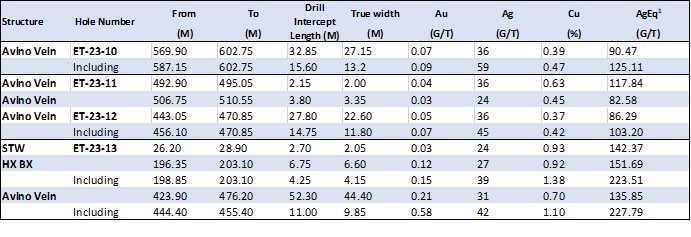
Exploration
On September 14, 2023, the Company released the results of four holes from below Level 17, the current deepest workings at the ET area of the Avino system. The drill holes hit substantial widths at grades well above our current cutoff grade on all four drill holes.
Selected Intercept Highlights:
·
Hole ET 23-13: 0.70 % Cu, 31 Ag g/t and 0.21 Au g/t over 44.40 metres true width
o
including 1.10 % Cu, 42 Ag g/t and 0.58 Au g/t over 9.85 metres true width
·
Hole ET 23-10: 0.39 % Cu, 36 Ag g/t and 0.07 Au g/t over 27.15 metres true width
o
including 0.47 % Cu, 59 Ag g/t g and 0.09 Au g/t over 13.2 metres true width
10 | Page
MANAGEMENT’S DISCUSSION AND ANALYSIS
FOR THE YEAR ENDED DECEMBER 31, 2023
Details are shown in the table below.
Table 1 – Summary Drill Results
1.
AgEq in drill results above assumes $1,850/ oz Au and $22.00 oz/ Ag, and $4.00/ lb Cu, and 100% metallurgical recovery
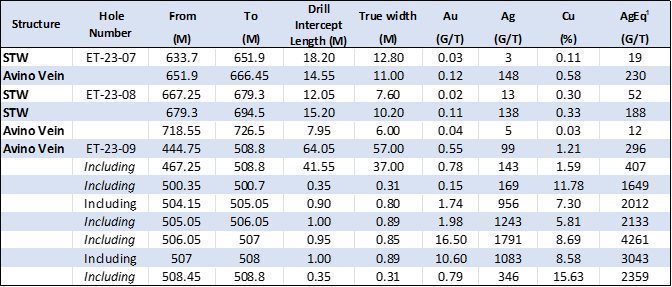
On July 5, 2023, the Company released the results of three holes from below Level 17, the current deepest workings at the ET area of the Avino system. Drill Hole ET-23-09 showed 57 metres true width of mineralization and is a step-out 50 metres to the west of Avino’s most westerly drill hole at 200 metres downdip below Level 17. This mineralized intercept is exceptionally wide and has very high silver, gold and copper grades. The vein system continues to be open along strike and at depth.
Selected Intercept Highlights:
·
Hole ET 23-09: 296 AgEq g/t over 57 metres true width, including 407 AgEq g/t over 37 metres true width and 2,866 AgEq g/t over 3.43 metres true width (To view images of the corresponding core, please click here)
·
Hole ET 23-07: 230 AgEq g/t over 11 metres true width
Previously, the Company reported the extension of the Avino Vein to a further 500 metres downdip below the lowest current production mining level. Drill Hole ET-23-09 shows 57 metres true width of mineralization and is a step out 50 metres to the west of Avino’s most westerly drill hole at 200 metres downdip below Level 17. This continuing exploration program is testing the continuity of the steeply dipping mineralization. Avino has enlisted world-renowned consulting geologists to contribute to the geological theory to drive understanding of the mineralization characteristics. The depth extent of at least 750 metres of known mineralization is unusual in comparison with most Mexican epithermal deposits.
11 | Page
MANAGEMENT’S DISCUSSION AND ANALYSIS
FOR THE YEAR ENDED DECEMBER 31, 2023
Details are shown in the table below.
Table 1 – Summary Drill Results
1.
AgEq in drill results below assumes $22.00 oz/ Ag and $1,850/ oz Au and $4.00/ lb. Cu, and 100% metallurgical recovery.
2.
STW = Stockwork Veins
The Company budgeted 8,000 metres of drilling in 2023, with a focus on the area at depth below the current ET production area, and completed approximately 7,500 metres of drilling in 2023.
Additional information on the Company’s exploration and evaluation properties by region is as follows:
(a) Avino, Mexico
The Company’s subsidiary Avino Mexico owns 42 mineral claims and leases four mineral claims in the state of Durango, Mexico. The Company’s mineral claims in Mexico are divided into the following four groups:
(i) Avino Mine area property
The Avino mine area property is situated around the towns of Panuco de Coronado and San Jose de Avino and surrounding the historic Avino mine site. There are four exploration concessions covering 154.4 hectares, 24 exploitation concessions covering 1,284.7 hectares, and one leased exploitation concession covering 98.83 hectares.
(ii) Gomez Palacio/Ana Maria property
The Ana Maria property is located near the town of Gomez Palacio, and consists of nine exploration concessions covering 2,549 hectares, and is also known as the Ana Maria property.
12 | Page
MANAGEMENT’S DISCUSSION AND ANALYSIS
FOR THE YEAR ENDED DECEMBER 31, 2023
(iii) Santiago Papasquiaro property
The Santiago Papasquiaro property is located near the village of Santiago Papasquiaro, and consists of four exploration concessions covering 2,552.6 hectares and one exploitation concession covering 602.9 hectares.
(iv) Unification La Platosa properties
The Unification La Platosa properties, consisting of three leased concessions in addition to the leased concession described in note (i) above, are situated within the Avino mine area property near the towns of Panuco de Coronado and San Jose de Avino and surrounding the Avino Mine.
(b) La Preciosa, Mexico
On March 21, 2022, the Company completed the acquisition of the La Preciosa property from Coeur Mining Inc.
La Preciosa consists of 15 exploration concessions totaling 6,011 hectares located in Durango, Mexico, within the municipalities of Panuco de Coronado and Canatlan. The property is located within 20 kilometres of the Company’s current Avino mining operations.
(c) British Columbia & Yukon, Canada
Eagle Property - Yukon
The Company has a 100% interest in 14 quartz leases located in the Mayo Mining Division of Yukon, Canada, which collectively comprise the Eagle property.
During the year ended December 31, 2023, the Company sold to a subsidiary of Hecla Mining Company (“Hecla”) the Eagle Property for cash consideration of C$250.
Minto and Olympic-Kelvin properties – British Columbia
On May 2, 2022, the Company granted Endurance Gold Corporation the right to acquire an option to earn 100% ownership of the former Minto Gold Mine, Olympic and Kelvin gold prospects contained within a parcel of crown grant and mineral claims (the “Olympic Claims”).
As of December 31, 2023, Endurance was in compliance with all terms of the Option agreement. See Note 8 of the consolidated financial statements for further details.
Qualified Person(s)
Peter Latta, P.Eng, MBA, Vice President, Technical Services, Avino, is a qualified person within the context of National Instrument 43-101, and has reviewed and approved the technical data in this document.
13 | Page
MANAGEMENT’S DISCUSSION AND ANALYSIS
FOR THE YEAR ENDED DECEMBER 31, 2023
Non – IFRS Measures
EBITDA and Adjusted earnings
Earnings, or loss, before interest, taxes and amortization (“EBITDA”) is a non IFRS financial measure which excludes the following items from net earnings:
·
Income tax expense
·
Finance cost
·
Amortization and depletion
Adjusted earnings excludes the following additional items from EBITDA
·
Share based compensation;
·
Non-operational items including foreign exchange movements, fair value adjustments on outstanding warrants and other non-recurring items
Management believes EBITDA and adjusted earnings provides an indication of continuing capacity to generate operating cash flow to fund capital needs, service debt obligations and fund capital expenditures. These measures are intended to provide additional information to investors and analysts. There are not standardized definitions under IFRS and should not be considered in isolation or as a substitute for measures of operating performance prepared in accordance with IFRS.
Adjusted earnings excludes share-based payments, and non-operating or recurring items such as foreign exchange gains and losses and fair value adjustments on outstanding warrants. Under IFRS, entities must reflect within compensation expense the cost of share-based payments. In the Company’s circumstances, share-based compensation can involve significant amounts that will not be settled in cash but are settled by issuance of shares in exchange. The Company discloses adjusted earnings to aid in understanding the results of the Company.
The following table provides a reconciliation of net earnings in the financial statements to EBITDA and adjusted earnings:
Expressed in 000’s of US$, unless otherwise noted
Q4 2023
Q4 2022
FY 2023
FY 2022
Net income for the period
$
563
$
1,296
$
542
$
3,096
Depreciation and depletion
744
628
2,919
2,186
Interest income and other
(180
)
47
(414
)
(20
)
Interest expense
106
33
381
99
Finance cost
1
85
81
273
Accretion of reclamation provision
13
12
49
44
Current income tax expense
118
502
(527
)
1,144
Deferred income tax (recovery) expense
(245
)
604
(525
)
3,440
EBITDA
$
1,120
$
3,207
$
2,506
$
10,262
Fair value adjustment on warrant liability
1
297
(478
)
(2,395
)
Share-based payments
460
406
2,269
2,024
Write down of equipment
319
330
414
330
Foreign exchange loss (gain)
72
(214
)
(110
)
17
Adjusted earnings
$
1,972
$
4,026
$
4,601
$
10,238
Shares outstanding (diluted)
127,763,043
120,097,423
125,346,674
117,615,898
Adjusted earnings per share
$
0.02
$
0.03
$
0.04
$
0.08
14 | Page
MANAGEMENT’S DISCUSSION AND ANALYSIS
FOR THE YEAR ENDED DECEMBER 31, 2023
Cash Cost and All-in Sustaining Cash Cost per Silver Equivalent Payable Ounce
The following tables provide a reconciliation of cost of sales from the consolidated financial statements to cash cost and all-in sustaining cash cost per silver equivalent payable ounce sold. In each table, “silver equivalent payable ounces sold” consists of the sum of payable silver ounces, gold ounces and copper tonnes sold, before penalties, treatment charges, and refining charges, multiplied by the ratio of the average spot gold and copper prices for the corresponding period.
Cash cost per payable ounce and all-in sustaining cash cost per payable ounce are measures developed by mining companies in an effort to provide a comparable standard. However, there can be no assurance that our reporting of these non-IFRS measures is similar to that reported by other mining companies. Total cash cost per payable ounce and all-in sustaining cash cost per payable ounce are measures used by the Company to manage and evaluate operating performance of the Company’s mining operations, and are widely reported in the silver and gold mining industry as benchmarks for performance, but do not have standardized meanings prescribed by IFRS as issued by the IASB, and are disclosed in addition to IFRS measures.
Cash cost per payable ounce
Management believes that the Company’s ability to control the cash cost per payable silver equivalent ounce is one of its key performance drivers impacting both the Company’s financial condition and results of operations. Achieving a low silver equivalent production cost base allows the Company to remain profitable from mining operations even during times of low commodity prices, and provides more flexibility in responding to changing market conditions. In addition, a profitable operation results in the generation of positive cash flows, which then improve the Company’s financial condition.
The Company’s calculation of all-in sustaining cash costs includes sustaining capital expenditures of $1,041 for the year ended December 31, 2023 (December 31, 2022 - $3,473) and all of which is attributable to the Avino Mine.
To facilitate a better understanding of these measures as calculated by the Company, detailed reconciliations between the non-IFRS measures and the Company’s consolidated financial statements are provided below. The non-IFRS measures presented are intended to provide additional information, and should not be considered in isolation nor should they be considered substitutes for IFRS measures. Calculated figures may not add up accurately due to rounding.
15 | Page
MANAGEMENT’S DISCUSSION AND ANALYSIS
FOR THE YEAR ENDED DECEMBER 31, 2023
The following table reconciles cost of sales to cash cost per payable AgEq oz and all-in sustaining cash cost per payable AgEq oz for the preceding quarters:
Expressed in 000’s of US$, unless otherwise noted
Avino – Consolidated
Q4 2023
Q3 2023
Q2 2023
Q1 2023
Q4 2022
Q3 2022
Q2 2022
Q1 2022
Cost of sales
$
9,969
$
9,952
$
8,175
$
7,974
$
10,293
$
7,058
$
5,468
$
6,306
Exploration expenses
(148
)
(41
)
(27
)
(95
)
(472
)
(336
)
(305
)
(296
)
Write down of equipment and supplies and materials inventory
(319
)
(4
)
(91
)
-
(330
)
-
-
-
Depletion and depreciation
(717
)
(720
)
(677
)
(670
)
(592
)
(514
)
(481
)
(459
)
Cash production cost
8,785
9,187
7,380
7,209
8,899
6,208
4,682
5,551
Payable silver equivalent ounces sold
584,061
543,686
452,011
506,727
756,536
603,360
594,700
495,109
Cash cost per silver equivalent ounce
$
15.04
$
16.90
$
16.33
$
14.22
$
11.76
$
10.29
$
7.87
$
11.21
General and administrative expenses
2,080
1,907
2,338
1,524
2,094
1,553
2,218
1,316
Treatment & refining charges
978
1,001
651
709
784
568
700
766
Penalties
834
535
634
898
1,649
1,705
897
1,578
Sustaining capital expenditures
318
289
270
164
639
672
1,586
576
Exploration expenses
148
41
27
95
472
336
305
296
Share-based payments and G&A depreciation
(487
)
(665
)
(878
)
(374
)
(442
)
(591
)
(899
)
(230
)
Cash operating cost
$
12,655
$
12,335
$
10,422
$
10,223
$
14,095
$
10,451
$
9,489
$
9,853
AISC per silver equivalent ounce
$
21.67
$
22.69
$
23.06
$
20.17
$
18.63
$
17.32
$
15.95
$
19.90
The following table reconciles cash cost per AgEq oz production cost to all-in sustaining cash cost per AgEq oz for the year ended December 31, 2023, and 2022:
Expressed in 000’s of US$, unless otherwise noted
Avino - Consolidated
FY 2023
FY 2022
Cost of sales
$
36,070
$
29,125
Exploration expenses
(311
)
(1,410
)
Write down of equipment and supplies and materials inventory
(414
)
(330
)
Depletion and depreciation
(2,784
)
(2,046
)
Cash production cost
32,561
25,339
Payable silver equivalent ounces sold
2,086,485
2,449,704
Cash cost per silver equivalent ounce
$
15.61
$
10.34
General and administrative expenses
7,889
7,180
Treatment & refining charges
3,339
2,817
Penalties
2,900
5,828
Sustaining capital expenditures
1,041
3,473
Exploration expenses
311
1,410
Share-based payments and G&A depreciation
(2,404
)
(2,164
)
Cash operating cost
$
48,637
$
43,883
AISC per silver equivalent ounce
$
21.87
$
17.91
16 | Page
MANAGEMENT’S DISCUSSION AND ANALYSIS
FOR THE YEAR ENDED DECEMBER 31, 2023
Working Capital
Management uses working capital to assessment the Company’s ongoing liquidity position and future requirements, and believe it provides useful information to an investor. The Company’s working capital position is as follows:
December 31,
2023
December 31,
2022
Current assets
$
23,535
$
25,585
Current liabilities
(13,808
)
(16,764
)
Working capital
$
9,727
$
8,821
Results of Operations
Summary of Quarterly Results
(000’s)
2023
2023
2023
2022
2022
2022
2022
2022
Quarter ended
Dec 31
Q4
Sep 30
Q3
Jun 30
Q2
Mar 31
Q1
Dec 31
Q4
Sep 30
Q3
Jun 30
Q2
Mar 31
Q1
Revenue
$
12,530
$
12,316
$
9,218
$
9,825
$
14,649
$
9,118
$
9,370
$
11,050
Net income (loss)
563
(803
)
1,134
(352
)
1,296
(1,129
)
2,283
646
Earnings (loss) per share - basic
$
0.00
$
(0.01
)
$
0.01
$
0.00
$
0.01
$
(0.01
)
$
0.02
$
0.01
Earnings (loss) per share - diluted
$
0.00
$
(0.01
)
$
0.01
$
0.00
$
0.01
$
(0.01
)
$
0.02
$
0.01
Total
Assets
$
128,340
$
123,493
$
120,469
$
118,606
$
121,196
$
118,404
$
118,092
$
114,507
During Q4 2023, revenue increased compared to the comparable 2023 quarters, as a result of higher realized silver and gold metal prices and slightly higher silver equivalent ounces sold. When compared to Q4 2022, revenues were lower due to lower ounces sold. The increased revenues and ounces sold in Q4 2022 were due to better than expected grades in mining production and recoveries in the mill process, thus resulting in higher overall ounces sold.
Net income and earnings/loss per share in Q4 2023 was positive primarily due to improved operating margins compared to Q3 2023. When compared to Q4 2022, net income decreased, primarily due to the stronger operating margins realized in Q4 2022, as described above. For further details see “Financial Results” section.
Total assets have increased overall when compared to previous quarters, as result of the acquisition of La Preciosa as well as operating and financing cash flow generation, and capital investment in the operation.
Quarterly results will fluctuate with changes in revenues, cost of sales, general and administrative expenses, including non-cash items such as share-based payments, and other items including foreign exchange and deferred income taxes these fluctuations are mainly caused by market conditions such as fluctuations in metal prices, currency fluctuations as well as variations in mineralization of the zones mined.
17 | Page
MANAGEMENT’S DISCUSSION AND ANALYSIS
FOR THE YEAR ENDED DECEMBER 31, 2023
Discussion and analysis relating to the Company’s financial position, as well as movements in cash flow, is as follows:
Selected Annual Information - Statement of Financial Position
(000’s)
December 31,
2023
December 31,
2022
December 31,
2021
Cash
$
2,688
$
11,245
$
24,765
Total current assets
23,535
25,585
35,478
Total assets
128,340
121,196
86,278
Total current liabilities
13,808
16,764
3,843
Total liabilities
22,339
23,175
7,771
Share capital
151,688
145,515
129,953
Accumulated deficit
(51,423
)
(52,096
)
(55,953
)
Total equity
106,001
98,021
78,507
Cash and current assets have decreased year over year, as a result of the acquisition of La Preciosa in 2022, as well as capital re-investment into mining operations at Avino and exploration expenditures. As a result of these capital acquisitions, total assets have increased year over year.
Total current liabilities decreased in 2023 compared to 2022 as a result of the repayment of the $5 million note payable arising from the La Preciosa acquisition that closed during 2022, as well as reductions in taxes payable and the expiration of the warrants associated with the warrant liability. The decrease was partially offset by an increase in accounts payable and accrued liabilities and the current portion of finance lease obligations.
Current and total liabilities had increased in 2022 from 2021 as a result of the addition of the aforementioned $5 million note payable, as well as increases to accounts payable as the Company ramped up production mining activities during 2022.
Share capital and total equity increased year over year as a result of shares issued as partial consideration for the La Preciosa transaction in 2022 upon closing, as well as At The Market (“ATM”) share issuances for capital expansion purposes.
Accumulated deficit has decreased year over year as a result of profitable operations in both 2023 and 2022. Further details are available on operations in the “Financial Results” sections.
Cash Flow
(000’s)
December 31,
2023
December 31,
2022
Cash generated by operating activities
$
1,488
$
11,831
Cash generated by (used in) financing activities
3,488
(1,149
)
Cash used in investing activities
(13,531
)
(24,101
)
Change in cash
(8,555
)
(13,419
)
Effect of exchange rate changes on cash
(2
)
(101
)
Cash, beginning of period
11,245
24,765
Cash, end of period
$
2,688
$
11,245
18 | Page
MANAGEMENT’S DISCUSSION AND ANALYSIS
FOR THE YEAR ENDED DECEMBER 31, 2023
Operating Activities
Cash generated by operating activities for the year ended December 31, 2023, was $1.5 million, a decrease of $10.3 million compared to $11.8 million for the year ended December 31, 2022. Cash movements from operating activities can fluctuate with changes in net income and working capital movements. In 2023, cash generated from operating activities decreased by $10.3 million primarily due to lower mine operating income as a result of higher levels of production activities (mining and milling) with limited increase in sales volumes during the quarter and an increase in operating costs resulting from the strengthening of the Mexican Peso compared to the US dollar. Other movements are primarily a result of working capital changes between the two periods.
Financing Activities
Cash provided by financing activities was $3.5 million for year ended December 31, 2023, compared to $1.1 million used for the year ended December 31, 2022. The movement is a result of proceeds from shares issued on the ATM, partially offset by higher payments of lease and equipment loan. During the year ended December 31, 2023, the Company received net proceeds from issuance of shares for cash of $5.2 million (December 31, 2022 – $0.03 million). The Company also made finance lease and equipment loan payments totalling $1.7 million (December 31, 2022 - $1.2 million).
Investing Activities
Cash used in investing activities for the year ended December 31, 2023, was $13.5 million compared to $24.1 million for the year ended December 31, 2022. Cash used in investing activities included $8.5 million (December 31, 2022 - $9.0 million) spent on the acquisition of property and equipment and exploration expenditures, as well as $5.0 million related to the repayment of the promissory note associated with the acquisition of La Preciosa during the year ended December 31, 2023, compared to $15.1 million in the upfront payments in the year ended December 31, 2022.
Liquidity and Capital Resources
The Company’s ability to generate sufficient amounts of cash, in both the short term and the long term, to maintain existing capacity and to fund ongoing exploration, is dependent upon the discovery of economically recoverable reserves or resources and the ability of the Company to continue with sustainable and profitable mining operations.
Management expects that the Company’s ongoing liquidity requirements will be funded from cash generated from current operations and from further financing, as required, in order to fund ongoing exploration activities, and meet its objectives, including ongoing advancement at the Avino Mine. The Company continues to evaluate financing opportunities to advance its projects. The Company’s ability to secure adequate financing is, in part, dependent on overall market conditions, the prices of silver, gold, and copper, and other factors.
19 | Page
MANAGEMENT’S DISCUSSION AND ANALYSIS
FOR THE YEAR ENDED DECEMBER 31, 2023
The Company’s recent financing activities are summarized in the table below.
Intended Use of Proceeds
Actual Use of Proceeds
During 2023, the Company received net proceeds of $5.2 million in connection with a brokered at-the-market offering issued under prospectus supplements.
As of the date of this MD&A, the Company has used the funds as intended.
During 2023, all funds were used for exploration and evaluation activities, the acquisition of property and equipment, and the repayments of capital equipment acquired under lease and loan.
During 2021, the Company received net proceeds of $18.1 million in connection with a brokered at-the-market offering issued under prospectus supplements, $0.8 million in connection with warrants exercised and $0.2 million in connection with stock options exercised.
As of the date of this MD&A, the Company has used the funds as intended. During 2021, the Company announced an increase to its exploration from 12,000 to 30,600 metres of exploration and resource drilling. As of the date of this MD&A, over 20,000 metres of the program had been completed.
In supporting mining operations in Mexico, the Company acquired La Preciosa for net cash consideration of $15.4 million. During 2022, the remaining $3.7 million was used for exploration and evaluation activities, the acquisition of property and equipment, the repayment of capital equipment acquired under lease and loan.
During 2020, the Company received net proceeds of $4.7 million in connection with a brokered at-the-market offering issued under prospectus supplements and $3.7 million in connection with warrants exercised.
As of the date of this MD&A, the Company had used the funds as intended. There has been no impact on the ability of the Company to achieve its business objectives and milestones.
Off-Balance Sheet Arrangements
The Company has no off-balance sheet arrangements.
Transactions with Related Parties
All related party transactions are recorded at the exchange amount which is the amount agreed to by the Company and the related party.
(a) Key management personnel
The Company has identified its directors and certain senior officers as its key management personnel. The compensation costs for key management personnel for the years ended December 31, 2023 and 2022 is as follows:
2023
2022
Salaries, benefits, and consulting fees
$
1,184
$
1,228
Share-based payments
1,782
1,566
$
2,966
$
2,794
(b) Amounts due to/(from) related parties
In the normal course of operations the Company transacts with companies related to Avino’s directors or officers. All amounts payable and receivable are non-interest bearing, unsecured and due on demand.
20 | Page
MANAGEMENT’S DISCUSSION AND ANALYSIS
FOR THE YEAR ENDED DECEMBER 31, 2023
The following table summarizes the amounts were due to/(from) related parties:
December 31,
2023
December 31,
2022
Oniva International Services Corp.
$
102
$
100
Silver Wolf Exploration Ltd.
(269
)
(72
)
$
(167
)
$
28
For services provided to the Company as President and Chief Executive Officer, the Company pays Intermark Capital Corporation (“ICC”), a company controlled by David Wolfin, the Company’s President and CEO and also a director, for consulting services. For the year ended December 31, 2023, the Company paid $285 (December 31, 2022 - $326) to ICC.
(c) Other related party transactions
The Company has a cost sharing agreement with Oniva International Services Corp. (“Oniva”) for office and administration services. Pursuant to the cost sharing agreement, the Company will reimburse Oniva for the Company’s percentage of overhead and corporate expenses and for out-of-pocket expenses incurred on behalf of the Company, with a 2.5% markup. David Wolfin, President & CEO, and a director of the Company, is the sole owner of Oniva. The cost sharing agreement may be terminated with one-month notice by either party without penalty.
The transactions with Oniva during the year ended December 31, 2023 and 2022, are summarized below:
2023
2022
Salaries and benefits
$
953
$
878
Office and miscellaneous
482
461
$
1,435
$
1,339
Financial Instruments and Risks
The fair values of the Company’s amounts due to related parties and accounts payable approximate their carrying values because of the short-term nature of these instruments. Cash, amounts receivable, long-term investments, and warrant liability are recorded at fair value. The carrying amounts of the Company’s equipment loans, and finance lease obligations are a reasonable approximation of their fair values based on current market rates for similar financial instruments.
The Company’s financial instruments are exposed to certain financial risks, including credit risk, liquidity risk, and market risk.
(a) Credit Risk
Credit risk is the risk that one party to a financial instrument will cause a financial loss for the other party by failing to discharge an obligation. The Company has exposure to credit risk through its cash, long-term investments and amounts receivable. The Company manages credit risk, in respect of cash and short-term investments, by maintaining the majority of cash and short-term investments at highly rated financial institutions.
21 | Page
MANAGEMENT’S DISCUSSION AND ANALYSIS
FOR THE YEAR ENDED DECEMBER 31, 2023
The Company is exposed to a significant concentration of credit risk with respect to its trade accounts receivable balance because all of its concentrate sales are with three (December 31, 2022 – two) counterparties. However, the Company has not recorded any allowance against its trade receivables because to-date all balances owed have been settled in full when due (typically within 60 days of submission) and because of the nature of the counterparties.
The Company’s maximum exposure to credit risk at the end of any period is equal to the carrying amount of these financial assets as recorded in the unaudited condensed consolidated interim statement of financial position. At December 31, 2023, no amounts were held as collateral.
(b) Liquidity Risk
Liquidity risk is the risk that the Company will encounter difficulty in satisfying financial obligations as they become due. The Company manages its liquidity risk by forecasting cash flows required by its operating, investing and financing activities. The Company had cash at December 31, 2023, in the amount of $2,688 and working capital of $9,727 in order to meet short-term business requirements. Accounts payable have contractual maturities of approximately 30 to 90 days, or are due on demand and are subject to normal trade terms. The current portions of note payable and finance lease obligations are due within 12 months of the condensed consolidated interim statement of financial position date. Amounts due to related parties are without stated terms of interest or repayment.
The maturity profiles of the Company’s contractual obligations and commitments as at December 31, 2023, are summarized as follows:
Total
Less Than
1 Year
1-5 years
More Than 5
Years
Accounts payable and accrued liabilities
$
11,867
$
11,867
$
-
$
-
Minimum rental and lease payments
5,920
714
1,241
3,965
Equipment loans
405
188
217
-
Finance lease obligations
3,361
1,830
1,531
-
Total
$
21,553
$
14,599
$
2,989
$
3,965
(c) Market Risk
Market risk consists of interest rate risk, foreign currency risk and price risk. These are discussed further below.
Interest Rate Risk
Interest rate risk consists of two components:
(i) To the extent that payments made or received on the Company’s monetary assets and liabilities are affected by changes in the prevailing market interest rates, the Company is exposed to interest rate cash flow risk.
(ii) To the extent that changes in prevailing market rates differ from the interest rates on the Company’s monetary assets and liabilities, the Company is exposed to interest rate price risk.
In management’s opinion, the Company is not materially exposed to interest rate risk, as any material debt obligations that bear interest are fixed and not subject to floating interest rates. A 10% change in the interest rate would not a result in a material impact on the Company’s operations.
22 | Page
MANAGEMENT’S DISCUSSION AND ANALYSIS
FOR THE YEAR ENDED DECEMBER 31, 2023
Foreign Currency Risk
Foreign currency risk is the risk that the fair value or future cash flows of a financial instrument will fluctuate due to changes in foreign exchange rates. The Company is exposed to foreign currency risk to the extent that the following monetary assets and liabilities are denominated in Mexican pesos and Canadian dollars:
December 31, 2023
December 31, 2022
MXN
CDN
MXN
CDN
Cash
$
13,338
$
70
$
4,097
$
250
Due from related parties
4,558
-
1,402
-
Long-term investments
-
1,164
-
2,365
Reclamation bonds
-
6
-
4
Amounts receivable
18,644
26
-
34
Accounts payable and accrued liabilities
(95,662
)
(150
)
(85,486
)
(108
)
Due to related parties
-
(135
)
-
(135
)
Finance lease obligations
(1,129
)
(217
)
(161
)
(343
)
Net exposure
(60,251
)
764
(80,148
)
2,067
US dollar equivalent
$
(3,567
)
$
577
$
(4,136
)
$
1,526
Based on the net US dollar denominated asset and liability exposures as at December 31, 2023, a 10% fluctuation in the US/Mexican and Canadian/US exchange rates would impact the Company’s earnings for the year ended December 31, 2023, by approximately $304 (year ended December 31, 2022 - $275). The Company has not entered into any foreign currency contracts to mitigate this risk.
Price Risk
Price risk is the risk that the fair value or future cash flows of a financial instrument will fluctuate due to changes in market prices, other than those arising from interest rate risk or foreign currency risk.
The Company is exposed to price risk with respect to its amounts receivable, as certain trade accounts receivable are recorded based on provisional terms that are subsequently adjusted according to quoted metal prices at the date of final settlement. Quoted metal prices are affected by numerous factors beyond the Company’s control and are subject to volatility, and the Company does not employ hedging strategies to limit its exposure to price risk. At December 31, 2023, based on outstanding accounts receivable that were subject to pricing adjustments, a 10% change in metals prices would have an impact on net earnings (loss) of approximately $134 (December 31, 2022 - $65).
The Company is exposed to price risk with respect to its long-term investments, as these investments are carried at fair value based on quoted market prices. Changes in market prices result in gains or losses being recognized in net income (loss). At December 31, 2023, a 10% change in market prices would have an impact on net earnings (loss) of approximately $86 (December 31, 2022 - $175).
The Company’s profitability and ability to raise capital to fund exploration, evaluation and production activities is subject to risks associated with fluctuations in mineral prices. Management closely monitors commodity prices, individual equity movements, and the stock market to determine the appropriate course of action to be taken by the Company.
23 | Page
MANAGEMENT’S DISCUSSION AND ANALYSIS
FOR THE YEAR ENDED DECEMBER 31, 2023
(d) Classification of Financial Instruments
The following table sets forth the Company’s financial assets and financial liabilities measured at fair value on a recurring basis by level within the fair value hierarchy as at December 31, 2023:
Level 1
Level 2
Level 3
Financial assets
Cash
$
2,688
$
-
$
-
Amounts receivable
-
3,303
-
Long-term investments
934
-
-
Total financial assets
$
3,622
$
3,303
$
-
The following table sets forth the Company’s financial assets and financial liabilities measured at fair value on a recurring basis by level within the fair value hierarchy as at December 31, 2022:
Level 1
Level 2
Level 3
Financial assets
Cash
$
11,245
$
-
$
-
Amounts receivable
-
2,672
-
Long-term investments
1,746
-
-
Total financial assets
$
12,991
$
2,672
$
-
Financial liabilities
Warrant liability
-
-
(475
)
Total financial liabilities
$
-
$
-
$
(475
)
The Company uses Black-Scholes model to measure its Level 3 financial instruments. As at December 31, 2023, the Company’s has no Level 3 financial instruments (December 31, 2022 – consisted of the warrant liability).
Commitments
The Company has a cost sharing agreement to reimburse Oniva for a percentage of its overhead expenses, to reimburse 100% of its out-of-pocket expenses incurred on behalf of the Company, and to pay a percentage fee based on Oniva’s total overhead and corporate expenses. The agreement may be terminated with one-month notice by either party. Transactions and balances with Oniva are disclosed in Note 12 of the consolidated financial statements.
The Company and its subsidiaries have various operating lease agreements for their office premises, use of land, and equipment. Commitments in respect of these lease agreements are as follows:
December 31,
2023
December 31,
2022
Not later than one year
$
714
$
105
Later than one year and not later than five years
1,241
347
Later than five years
3,965
398
$
5,920
$
850
Office lease payments recognized as an expense during the year ended December 31, 2023, totalled $29 (December 31, 2022 - $18).
24 | Page
MANAGEMENT’S DISCUSSION AND ANALYSIS
FOR THE YEAR ENDED DECEMBER 31, 2023
Subsequent Events
At-The-Market Sales – Subsequent to December 31, 2023, the Company issued 1,886,248 common shares in at-the-market offerings under prospectus supplement for gross proceeds of $900.
Outstanding Share Data
The Company’s authorized share capital consists of an unlimited number of common shares without par value.
As at March 20, 2024 the following common shares, warrants, and stock options were outstanding:
Number of shares
Exercise price
Remaining life (years)
Share capital
130,325,696
-
-
Restricted Share Units (“RSUs”)
2,994,709
-
1.01 – 2.02
Stock options
6,476,000
C$0.79 - C$1.64
0.42 – 4.31
Fully diluted
139,796,405
The following are details of outstanding stock options as at December 31, 2023 and March 20, 2024:
Expiry Date
Exercise Price Per Share
Number of Shares Remaining Subject to Options
(December 31, 2023)
Number of Shares Remaining Subject to Options
(March 20, 2024)
August 21, 2024
C$0.79
126,000
126,000
August 4, 2025
C$1.64
1,660,000
1,620,000
March 25, 2027
C$1.20
2,330,000
2,255,000
May 4, 2027
C$0.92
25,000
25,000
March 29, 2028
C$1.12
2,375,000
2,300,000
July 10, 2028
C$1.12
150,000
150,000
Total:
6,666,000
6,476,000
The following are details of outstanding RSUs as at December 31, 2023 and March 20, 2024:
Expiry Date
Number of Shares Remaining Subject to RSUs
(December 31, 2023)
Number of Shares Remaining Subject to RSUs
(March 20, 2024)
March 25, 2025
1,162,265
1,162,265
March 29, 2026
1,832,444
1,832,444
Total:
2,994,709
2,994,709
25 | Page
MANAGEMENT’S DISCUSSION AND ANALYSIS
FOR THE YEAR ENDED DECEMBER 31, 2023
Recent Accounting Pronouncements
New and amended IFRS that are effective for the current year:
In the current year, the Company has applied the below amendments to IFRS Standards and Interpretations issued by the IASB that were effective for annual periods that begin on or after January 1, 2023. These standards did not have a material impact on the Company’s disclosures or on the amounts in the current reporting periods.
Amendments to IAS 1 – Presentation of Financial Statements and IFRS Practice Statement 2 Making Material Judgments – Disclosure of Accounting Policies
The amendments change the requirements in IAS 1 with regards to disclosure of accounting policies. The amendments replace all instances of the term “significant accounting policies” with “material accounting policy information.” Accounting policy information is material if, when considered together with other information included in an entity’s financial statements, it can reasonable by expected to influence decisions that the primary users of general purpose financial statements make on the basis of those financial statements.
The supporting paragraphs in IAS 1 are also amended to clarify that accounting policy information that relates to immaterial transactions, other events, or conditions, is immaterial and not required to be disclosed. Accounting policy information may be material because of the nature of the related transactions, other events, or conditions, even of the amounts are immaterial. However, not all accounting policy information relating to material transactions, other events, or conditions, is itself material. The IASB has also developed guidance and examples to explain and demonstrate the application of the “four-step materiality process” described in IFRS Practice Statement 2.
The amendments were applied effective January 1, 2023, and did not have a material impact on the Company’s interim consolidated financial statements.
Amendments to IAS 8 – Accounting Policies, Changes in Accounting Estimates and Errors – Definition of Accounting Estimates
The amendments replace the definition of a change in accounting estimates with a definition of accounting estimates. Under the new definition, accounting estimates are “monetary amounts in financial statements that are subject to measurement uncertainty.”
The definition of a change in accounting estimates was deleted; however, the IASB retained the concept of changes in accounting estimates in the Standard with the following clarifications:
·
A change in accounting estimate that results from new information or new developments is not a correct of an error
·
The effects of a change in an input or a measurement technique used to develop an accounting estimate are changes in accounting estimates if they do not result from the correction of prior period errors
The amendments were applied effective January 1, 2023, and did not have a material impact on the Company’s interim consolidated financial statements.
Amendments to IAS 12 – Deferred Tax Related to Assets and Liabilities Arising from a Single Transaction
The amendments clarify that companies are required to recognize deferred taxes on transactions where both assets and liabilities are recognized, such as with leases and decommissioning liabilities. The amendments were applied effective January 1, 2023, and did not have a material impact on the Company’s interim consolidated financial statements.
26 | Page
MANAGEMENT’S DISCUSSION AND ANALYSIS
FOR THE YEAR ENDED DECEMBER 31, 2023
Future Changes in Accounting Policies Not Yet Effective as at December 31, 2023:
Certain new accounting standards and interpretations have been published that are not mandatory for the current period and have not been early adopted. These standards are not expected to have a material impact on the Company in the current or future reporting periods.
Amendments to IAS 1 – Classification of Liabilities as Current or Non-Current with Covenants
The amendments aim to promote consistency in applying the requirements by helping companies determine whether, in the statement of financial position, debt and other liabilities with an uncertain settlement date should be classified as current (due or potentially due to be settled within one year) or non-current.
In addition, the amendment requires entities to disclose information to enable users of the financial statements to understand the risk that non-current liabilities with covenants could become repayable within twelve months. The amendments are applied on or after the first annual reporting period beginning on or after January 1, 2024, with early application permitted. The amendment is not expected to have a material impact on the Company’s consolidated financial statements.
Amendments to IFRS 16 – Lease Liability in a Sale and Leaseback
The amendments require a seller/lessee to subsequently measure lease liabilities arising from a leaseback in a way that it does not recognize any amount of the gain or loss that relates to the right of use it retains. The new requirements do not prevent a seller/lessee from recognizing in profit or loss any gain or loss relating to the partial or full termination of a lease. A seller-lessee applies the amendments retrospectively in accordance with IAS 8 Accounting Policies, Change in Accounting Estimates and Errors to sale or leaseback transactions entered into after the date of initial application.
The amendments are applied on or after the first annual reporting period beginning on or after January 1, 2024, with early application permitted. The amendment is not expected to have a material impact on the Company’s consolidated financial statements.
Disclosure Controls and Procedures
Management, including our principal executive officer and principal financial officer, has evaluated the effectiveness of the design and operation of the Company’s disclosure controls and procedures on financial reporting (as defined in NI 52-109 - Certification of Disclosure in Issuers’ Annual and Interim Filings and as defined in Rules 13a-15(e) and 15d-15(e) under the Exchange Act) and has concluded that, based on its evaluation, that the Company’s disclosure controls and procedures were effective as of December 31, 2023.
Management’s Report on Internal Control over Financial Reporting (“ICFR”)
The management of the Company is responsible for establishing and maintaining adequate internal controls over financial reporting. Internal controls over financial reporting is a process to provide reasonable assurance regarding the reliability of the Company’s financial reporting for external purposes in accordance with IFRS as issued by the IASB. Internal controls over financial reporting includes maintaining records that in reasonable detail accurately and fairly reflect the Company’s transactions and dispositions of the assets of the Company; providing reasonable assurance that transactions are recorded as necessary for preparation of the Company’s consolidated financial statements in accordance with IFRS as issued by the IASB; providing reasonable assurance that receipts and expenditures are made in accordance with authorizations of management and the directors of the Company; and providing reasonable assurance that unauthorized acquisition, use or disposition of the Company’s assets that could have a material effect on the Company’s consolidated financial statements would be prevented or detected on a timely basis.
Management, including our principal executive officer and principal financial officer, conducted an evaluation of the effectiveness of the Company’s internal controls over financial reporting based on the framework and criteria established in Internal Control – Integrated Framework, issued by the Committee of Sponsoring Organizations of the Treadway Commission (2013) (‘COSO’). This evaluation included review of the documentation of controls, evaluation of the design effectiveness of controls, testing of the operating effectiveness of controls and a conclusion on this evaluation. Based on this evaluation, management concluded that as of December 31, 2023, the Company’s internal controls over financial reporting, as defined in NI 52-109 - Certification of Disclosure in Issuer’s Annual and Interim Filings and as defined in Rule 13a-15(f) and 15d-15(f) under the Exchange Act) were effective as of December 31, 2023.
The consolidated financial statements as at December 31, 2023, and for the years ended December 31, 2023 and 2022, have been audited by Deloitte LLP, an independent registered public accounting firm, and its attestation report on management's assessment of the Company’s internal control over financial reporting as of December 31, 2023 appearing immediately preceding the Company’s audited consolidated financial statements.
Our management and the Board of Directors do not expect that our disclosure controls and procedures or internal controls over financial reporting will prevent all errors or all instances of fraud. A control system, no matter how well designed and operated, can provide only reasonable (not absolute) assurance that the control system’s objectives will be met. Further, the design, maintenance and testing of a control system must reflect the fact that there are resource constraints and the benefits of controls must be considered relative to their costs.
Because of the inherent limitations in all control systems, no evaluation of controls can provide absolute assurance that all control gaps and instances of fraud have been detected. These inherent limitations include the reality that judgment in decision-making can be faulty, and that breakdowns can occur because of simple errors or mistakes. Controls can also be circumvented by the individual acts of some persons, by collusion of two or more people, or by management override of the controls. The design, maintenance and testing of any system of controls is based in part upon certain assumptions about the likelihood of future events, and any control system may not succeed in achieving its stated goals under all potential future conditions.
Changes in Internal Control Over Financial Reporting
There have been no changes in our internal control over financial reporting (as defined in Rules 13a-15(f) or 15d-15(f) of the Exchange Act) that occurred during the year ended December 31, 2023, that have materially affected, or are reasonably likely to materially affect, the Company’s internal control over financial reporting, other than the changes described below.
27 | Page
MANAGEMENT’S DISCUSSION AND ANALYSIS
FOR THE YEAR ENDED DECEMBER 31, 2023
Remediation
In early 2023, the Company implemented a remediation plan to address the material weakness described in the management’s discussion and analysis for the year ended December 31, 2022. The material weakness is considered remediated when the applicable controls operate for a sufficient period of time and management has concluded, through testing, that these controls are operating effectively. The remediation of the material weakness has been completed prior to the end of the year ended December 31, 2023.
The Company identified and remediated efforts to improve the effectiveness of our internal control over financial reporting. The Company implemented a more formal process for the analysis and review of the proper application of IFRS accounting for non-routine transactions, as well as instituting additional diligence procedures in reviewing non-routine transactions.
Cautionary Note regarding Reserves and Resources
National Instrument 43-101 Standards of Disclosure for Mineral Projects (“NI 43-101”), issued by the Canadian Securities Administrators, lays out the standards of disclosure for mineral projects. This includes a requirement that a certified Qualified Person (“QP”) (as defined under the NI 43-101) supervises the preparation of the mineral reserves and mineral resources. Peter Latta, Vice President, Technical Services is a certified QP for the Company and has reviewed this MD&A for QP technical disclosures. All NI 43-101 technical reports can be found on the Company’s website at www.avino.com or under the Company’s profile on SEDAR+ at www.sedarplus.ca.
Cautionary Note to United States Investors Concerning Estimates of Mineral Reserves and Resources
This MD&A has been prepared in accordance with the requirements of the securities laws in effect in Canada, which differ from the requirements of United States securities laws applicable to U.S. companies. Information concerning our mineral properties has been prepared in accordance with the requirements of Canadian securities laws, which differ in respects from the requirements of the United States Securities and Exchange Commission (the “SEC”) applicable to domestic United States issuers. Accordingly, the disclosure in this MD&A regarding our mineral properties may not be comparable to the disclosure of United States issuers subject to the SEC’s mining disclosure requirements.
Additional Information
Additional information on the Company, including the Company’s Annual Information Form and the Company’s audited consolidated financial statements for the year ended December 31, 2023, is available under the Company’s profile on SEDAR+ at www.sedarplus.ca and on the Company’s website at www.avino.com.
28 | Page
MANAGEMENT’S DISCUSSION AND ANALYSIS
FOR THE YEAR ENDED DECEMBER 31, 2023
Cautionary Statement
This MD&A is based on a review of the Company’s operations, financial position and plans for the future based on facts and circumstances as of March 20, 2024. Except for historical information or statements of fact relating to the Company, this document contains “forward-looking statements” within the meaning of applicable Canadian securities regulations. Forward-looking statements in this document include, but are not limited to, those regarding the economic outlook for the mining industry, expectations regarding metals prices, expectations regarding production output, production costs, cash costs and other operating results, expectations regarding growth prospects and the outlook for the Company’s operations, and statements regarding the Company’s liquidity, capital resources, and capital expenditures. There can be no assurance that such statements will prove to be accurate, and future events and actual results could differ materially from those anticipated in such statements. Important factors that could cause actual results to differ materially from our expectations are disclosed in the Company’s documents filed from time to time via SEDAR+ with the Canadian regulatory agencies to whose policies we are bound. Forward-looking statements are based on the estimates and opinions of management on the date the statements are made, and we do not undertake any obligation to update forward-looking statements should conditions or our estimates or opinions change, except as required by applicable securities regulations. These statements involve known and unknown risks, uncertainties, and other factors that may cause the Company’s actual results, levels of activity, performance or achievements to be materially different from any future results, levels of activity, performance or achievements expressed or implied by these forward-looking statements. Material linked to the Company’s website within this MD&A is not deemed to be incorporated by reference nor form a part of this MD&A.
29 | Page
We use cookies on this site to provide a more responsive and personalized service. Continuing to browse, clicking I Agree, or closing this banner indicates agreement. See our Cookie Policy for more information.