Item 1: Report to Shareholders| Prime Reserve Fund | May 31, 2005 |
The views and opinions in this report were current as of May 31, 2005. They are not guarantees of performance or investment results and should not be taken as investment advice. Investment decisions reflect a variety of factors, and the managers reserve the right to change their views about individual stocks, sectors, and the markets at any time. As a result, the views expressed should not be relied upon as a forecast of the fund’s future investment intent. The report is certified under the Sarbanes-Oxley Act of 2002, which requires mutual funds and other public companies to affirm that, to the best of their knowledge, the information in their financial reports is fairly and accurately stated in all material respects.
REPORTS ON THE WEB
Sign up for our E-mail Program, and you can begin to receive updated fund reports and prospectuses online rather than through the mail. Log in to your account at troweprice.com for more information.
Fellow Shareholders
Money market securities produced positive returns in the 6- and 12-month periods ended May 31, 2005. The Federal Reserve continued raising the overnight federal funds target rate in the last six months, which lifted yields and total returns for money market investors.
ECONOMY AND INTEREST RATES
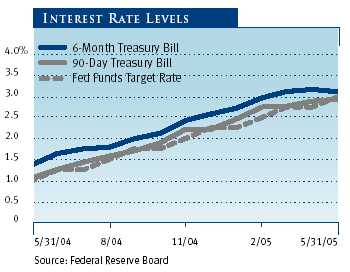
Twelve months ago, strong U.S. economic growth and signs of rising inflation prompted the Federal Reserve to warn investors that it would soon begin removing the accommodative monetary policy that had prevailed for several years. From mid-2004 through May 2005, the central bank gradually lifted the federal funds target rate—an overnight bank lending rate—from a 46-year low of 1.00% to 3.00% in eight quarter-point increments. Despite these rate increases, as well as elevated oil prices, the economy continued to expand steadily over the last year.
Money market yields, which closely track the fed funds rate, rose substantially over the last 12 months. In contrast, long-term interest rates declined, which was highly unexpected and which Federal Reserve Chairman Alan Greenspan deemed a “conundrum.” As a result, the difference between short- and long-term interest rates significantly narrowed during our fiscal year—also known as a flattening of the Treasury yield curve.
PERFORMANCE AND PORTFOLIO REVIEW
Your fund returned 0.99% and 1.46% in the 6- and 12-month periods ended May 31, 2005, respectively. The fund outperformed its Lipper benchmark in both periods, as shown in the table at the top of page 2, because of the defensive maturity posture we adopted about a year ago and maintained as short-term rates rose gradually throughout our fiscal year. By keeping the portfolio’s weighted average maturity (WAM) shorter than that of the benchmark, we were able to use proceeds from maturing money market instruments to purchase newer issues at progressively higher yields sooner than our average competitor.
| PERFORMANCE COMPARISON | |
| Periods Ended 5/31/05 | 6 Months | 12 Months |
| Prime Reserve Fund | 0.99% | 1.46% |
| Lipper Money Market | | |
| Funds Average | 0.84 | 1.20 |
| Please see the fund’s quarter-end returns following this letter. |
The fund’s performance relative to other money market funds has been favorable in the last few years, as you can see in the Average Annual Compound Total Return table on page 6. In fact, Lipper ranked the fund in the top 20% of the Lipper money market funds universe for the five-year period ended March 31, 2005. (Based on total return, Lipper ranked the Prime Reserve Fund 103 out of 383, 100 out of 348, 59 out of 302, and 61 out of 181 funds for the 1-, 3-, 5-, and 10-year periods ended March 31, 2005, respectively. Results will vary for other time periods, and past performance cannot guarantee future results.)
During the last six months, the fund’s WAM eased from 28 days to 27 days, as shown in the Portfolio Characteristics table, and we kept it about 10 days shorter than that of the average money market fund. In a rising rate environment, the shorter maturity helps to protect shareholders’ principal, which is the fund’s primary objective.
| PORTFOLIO CHARACTERISTICS | |
| Periods Ended | 11/30/04 | 5/31/05 |
| Price Per Share | $1.00 | $1.00 |
| Dividends Per Share | | |
| For 6 Months | 0.005 | 0.010 |
| For 12 Months | 0.007 | 0.015 |
| Dividend Yield (7-Day Simple) * | 1.44% | 2.46% |
| Weighted Average Maturity (days) | 28 | 27 |
| * Dividends earned for the last seven days of the periods |
| * indicated are annualized and divided by the fund’s net |
| * asset value. | | |
| Note: A money fund’s yield more closely reflects its current |
| earnings than the total return. | | |
At the end of May, three-fourths of the fund’s assets were invested in commercial paper, with the balance invested primarily in certificates of deposit. Our commercial paper holdings are well diversified by issuer and industry. (Please refer to the fund’s portfolio of investments for a complete listing of the fund’s holdings and the amount each represents in the portfolio.)
| SECTOR DIVERSIFICATION | | |
| | Percent of Net Assets |
| | 11/30/04 | 5/31/05 |
| Commercial Paper and | | |
| Medium-Term Notes * | 67.7% | 75.3% |
| Certificates of Deposit | 27.2 | 22.1 |
| Funding Agreements | 3.1 | 2.6 |
| Municipal Obligations | 0.3 | 0.5 |
| Other U.S. Government & | | |
| Agency Securities | 2.6 | 0.1 |
| Other Assets Less Liabilities | -0.9 | -0.6 |
| Total | 100.0% | 100.0% |
| * Includes money market securities issued by foreign |
| governments. | | |
During the last 12 months, we have been able to invest in high-quality, tax-free municipal securities at competitive yields during periodic episodes of supply and demand imbalances in that market. At the end of our reporting period, we had only 0.5% of the fund’s assets in municipal securities, but at times in the last year, these securities represented as much as 13% of assets.
The portfolio’s structure at the end of our fiscal year can best be described as a “bullet.” Rather than a “barbell” that emphasizes the extremes of the money market universe or a “ladder” that gives roughly equal emphasis to securities with various maturities, we have concentrated most of the fund’s assets in money market instruments that will mature around the time of the Federal Reserve’s late-June monetary policy meeting.
| SHORT-TERM QUALITY DIVERSIFICATION |
| | Percent of Net Assets |
| Periods Ended | 11/30/04 | 5/31/05 |
| A-1 + | 66.5% | 72.3%* |
| A-1 | 33.5 | 27.7 |
| A-2 | – | – |
| A-3 | – | – |
| Not Rated | – | – |
| Total | 100.0% | 100.0% |
| * Includes 0.12% with an S&P bond rating of AAA | |
| Source: Standard & Poor’s; if Standard & Poor’s does not |
| rate a security, then Moody’s Investors Service is used as a |
| secondary source. | | |
As shown in the table above, nearly three-fourths of the fund’s assets were invested in money market securities with the highest credit quality. While we are pleased to see higher money market yields, our primary concern is to provide safety of principal and liquidity for our shareholders.
OUTLOOK
Economic growth is likely to continue at a moderate pace, and the Federal Reserve is poised to continue raising short-term interest rates in quarter-point increments as long as inflation remains contained. The Fed seeks to lift rates to a “neutral” level that neither stimulates nor stifles growth; as a result, the peak for the fed funds rate during this tightening cycle depends on future economic and inflation data. In the meantime, money market investors will continue to welcome higher money market yields.
Thank you for your confidence in T. Rowe Price.
Respectfully submitted,

James M. McDonald
Chairman of the fund’s Investment Advisory Committee
June 15, 2005
The committee chairman has day-to-day responsibility for managing the portfolio and works with committee members in developing and executing the fund’s investment program.
RISKS OF INVESTING IN MONEY MARKET SECURITIES
Since money market funds are managed to maintain a constant $1.00 share price, there should be little risk of principal loss. However, there is no assurance the fund will avoid principal losses if fund holdings default or are downgraded—which are highly unlikely for securities backed by the full faith and credit of the U.S. government—or if interest rates rise sharply in an unusually short period. In addition, the fund’s yield will vary; it is not fixed for a specific period like the yield on a bank certificate of deposit. An investment in the fund is not insured or guaranteed by the Federal Deposit Insurance Corporation (FDIC) or any other government agency. Although a money market fund seeks to preserve the value of your investment at $1.00 per share, it is possible to lose money by investing in it.
GLOSSARY
Average maturity: The average of the stated maturity dates of a bond or money market portfolio’s securities. The average maturity for a money market fund is measured in days, whereas a bond fund’s average maturity is measured in years. In general, the longer the average maturity, the greater the fund’s sensitivity to interest rate changes, which means greater price fluctuation.
Fed funds target rate: An overnight lending rate set by the Federal Reserve and used by banks to meet reserve requirements. Banks also use the fed funds rate as a benchmark for their prime lending rates.
Inflation: A sustained increase in prices throughout the economy.
Yield curve: A graphic depiction of the relationship between yields and maturity dates for a set of similar securities, such as Treasuries or municipal securities. Yield curves typically slope upward, indicating that longer maturities offer higher yields. When the yield curve is flat, there is little or no difference between the yields offered by shorter- and longer-term securities.
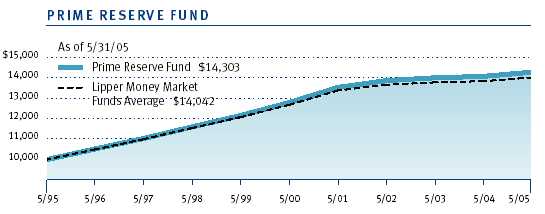
This chart shows the value of a hypothetical $10,000 investment in the fund over the past 10 fiscal year periods or since inception (for funds lacking 10-year records). The result is compared with benchmarks, which may include a broad-based market index and a peer group average or index. Market indexes do not include expenses, which are deducted from fund returns as well as mutual fund averages and indexes.
| AVERAGE ANNUAL COMPOUND TOTAL RETURN |
This table shows how the fund and its benchmark would have performed if their actual (or cumulative) returns for the periods shown had been earned at a constant rate.
| Periods Ended 5/31/05 | 1 Year | 5 Years | 10 Years |
| Prime Reserve Fund | 1.46% | 2.23% | 3.64% |
| Lipper Money Market Funds Average | 1.20 | 1.94 | 3.44 |
| Returns do not reflect taxes that the shareholder may pay on fund distributions or the redemption of |
| fund shares. Past performance cannot guarantee future results. | | | |
As a mutual fund shareholder, you may incur two types of costs: (1) transaction costs such as redemption fees or sales loads and (2) ongoing costs, including management fees, distribution and service (12b-1) fees, and other fund expenses. The following example is intended to help you understand your ongoing costs (in dollars) of investing in the fund and to compare these costs with the ongoing costs of investing in other mutual funds. The example is based on an investment of $1,000 invested at the beginning of the most recent six-month period and held for the entire period.
Actual Expenses
The first line of the following table (“Actual”) provides information about actual account values and actual expenses. You may use the information in this line, together with your account balance, to estimate the expenses that you paid over the period. Simply divide your account value by $1,000 (for example, an $8,600 account value divided by $1,000 = 8.6), then multiply the result by the number in the first line under the heading “Expenses Paid During Period” to estimate the expenses you paid on your account during this period.
Hypothetical Example for Comparison Purposes
The information on the second line of the table (“Hypothetical”) is based on hypothetical account values and expenses derived from the fund’s actual expense ratio and an assumed 5% per year rate of return before expenses (not the fund’s actual return). You may compare the ongoing costs of investing in the fund with other funds by contrasting this 5% hypothetical example and the 5% hypothetical examples that appear in the shareholder reports of the other funds. The hypothetical account values and expenses may not be used to estimate the actual ending account balance or expenses you paid for the period.
Note: T. Rowe Price charges an annual small-account maintenance fee of $10, generally for accounts with less than $2,000 ($500 for UGMA/UTMA). The fee is waived for any investor whose T. Rowe Price mutual fund accounts total $25,000 or more, accounts employing automatic investing, and IRAs and other retirement plan accounts that utilize a prototype plan sponsored by T. Rowe Price (although a separate custodial or administrative fee may apply to such accounts). This fee is not included in the accompanying table. If you are subject to the fee, keep it in mind when you are estimating the ongoing expenses of investing in the fund and when comparing the expenses of this fund with other funds.
You should also be aware that the expenses shown in the table highlight only your ongoing costs and do not reflect any transaction costs, such as redemption fees or sales loads. Therefore, the second line of the table is useful in comparing ongoing costs only and will not help you determine the relative total costs of owning different funds. To the extent a fund charges transaction costs, however, the total cost of owning that fund is higher.
| T. ROWE PRICE PRIME RESERVE FUND | |
| |
| | Beginning | Ending | Expenses Paid |
| | Account Value | Account Value | During Period* |
| | 12/1/04 | 5/31/05 | 12/1/04 to 5/31/05 |
| Actual | $1,000.00 | $1,009.90 | $3.16 |
| Hypothetical (assumes 5% | | | |
| return before expenses) | 1,000.00 | 1,021.79 | 3.18 |
| * Expenses are equal to the fund’s annualized expense ratio for the six-month period (0.63%), multiplied |
| * by the average account value over the period, multiplied by the number of days in the most recent fiscal |
| * half year (182) divided by the days in the year (365) to reflect the half-year period. |
| QUARTER-END RETURNS | | | | |
| |
| | 7-Day | | | |
| Periods Ended 3/31/05 | Simple Yield | 1 Year | 5 Years | 10 Years |
| |
| Prime Reserve Fund | 2.13% | 1.15% | 2.34% | 3.70% |
| Lipper Money Market Funds Average | – | 0.91 | 2.05 | 3.53 |
| |
| Current performance may be lower or higher than the quoted past performance, which cannot |
| guarantee future results. Share price, principal value, yield, and return will vary, and you may |
| have a gain or loss when you sell your shares. For the most recent month-end performance |
| information, please visit our Web site (troweprice.com) or contact a T. Rowe Price representa- |
| tive at 1-800-225-5132. | | | | |
| This table provides returns through the most recent calendar quarter-end rather than through the end of |
| the fund’s fiscal period. It shows how the fund would have performed each year if its actual (or cumulative) |
| returns for the periods shown had been earned at a constant rate. Average annual total return figures include |
| reinvested dividends and capital gain distributions. Returns do not reflect taxes that the shareholder may pay |
| on fund distributions or the redemption of fund shares. When assessing performance, investors should con- |
| sider both short- and long-term returns. A money fund’s yield more closely represents its earnings than the |
| total return. | | | | |
| FINANCIAL HIGHLIGHTS | | | | For a share outstanding throughout each period |
| |
| | | | Year | | | | | | | | |
| | | | Ended | | | | | | | | |
| | | | 5/31/05** | | 5/31/04 | | 5/31/03 | | 5/31/02 | | 5/31/01 |
| NET ASSET VALUE | | | | | | | | | | |
| Beginning of period | $ | 1.000 | $ | 1.000 | $ | 1.000 | $ | 1.000 | $ | 1.000 |
| |
| Investment activities | | | | | | | | | | |
| | Net investment income (loss) | | 0.015 | | 0.005 | | 0.010 | | 0.024 | | 0.057 |
| Distributions | | | | | | | | | | |
| | Net investment income | | (0.015) | | (0.005) | | (0.010) | | (0.024) | | (0.057) |
|
|
| |
| NET ASSET VALUE | | | | | | | | | | |
| End of period | $ | 1.000 | $ | 1.000 | $ | 1.000 | $ | 1.000 | $ | 1.000 |
| |
|
| |
| |
| Ratios/Supplemental Data | | | | | | | | | | |
| Total return^ | | 1.46% | | 0.51% | | 1.01% | | 2.47% | | 5.82% |
| Ratio of total expenses to | | | | | | | | | | |
| average net assets | | 0.62% | | 0.62% | | 0.64% | | 0.63% | | 0.59% |
| Ratio of net investment | | | | | | | | | | |
| income (loss) to average net assets | | 1.45% | | 0.51% | | 1.01% | | 2.44% | | 5.66% |
| Net assets, end of period | | | | | | | | | | |
| (in millions) | $ | 4,918 | $ | 5,053 | $ | 5,652 | $ | 5,531 | $ | 5,758 |
| |
| |
| |
| |
| ^ | Total return reflects the rate that an investor would have earned on an investment in the fund during each period, |
| | assuming reinvestment of all distributions. | | | | | | | | | | |
| ** | Per share amounts calculated using average shares outstanding method. | | | | | |
| |
| The accompanying notes are an integral part of these financial statements. | | | | | | |
| PORTFOLIO OF INVESTMENTS (1) | $ Par | Value |
| (Amounts in 000s) | | |
| | | |
| ASSET-BACKED SECURITIES 0.7% | | |
| | | |
| Capital One Auto Finance Trust, Series 2005-BSS, Class A1 | | |
| 3.34%, 6/15/06 | 14,750 | 14,750 |
| Triad Auto Receivables Owner Trust, Series 2005-A, Class A1 | | |
| 3.30%, 6/12/06 | 17,750 | 17,750 |
| Total Asset-Backed Securities (Cost $32,500) | | 32,500 |
| | | |
| BANK NOTES 1.0% | | |
| | | |
| World Savings Bank, 2.92%, 6/1/05 | 47,500 | 47,500 |
| Total Bank Notes (Cost $47,500) | | 47,500 |
| | | |
| CERTIFICATES OF DEPOSIT - DOMESTIC * 4.8% | | |
| | | |
| DEPFA Bank, 3.25%, 8/26/05 | 40,000 | 40,000 |
| Dexia Credit, 3.065%, 7/20/05 | 22,700 | 22,700 |
| First Tennessee Bank, 3.06%, 7/13/05 | 14,750 | 14,750 |
| Mercantile Safe Deposit & Trust | | |
| 3.03%, 6/17/05 | 12,500 | 12,500 |
| VR, 3.08%, 12/12/05 | 8,000 | 8,000 |
| VR, 3.09%, 10/18/05 | 5,000 | 5,000 |
| Regions Bank, 3.00%, 6/24/05 | 16,000 | 16,000 |
| Treasury Bank, VR, 3.334%, 2/23/06 | 15,700 | 15,700 |
| Wells Fargo | | |
| 3.03%, 6/17/05 | 28,000 | 28,000 |
| 3.03%, 6/23/05 | 35,800 | 35,800 |
| Wilmington Trust | | |
| 3.06%, 7/1/05 | 14,700 | 14,700 |
| 3.09%, 7/11/05 | 20,000 | 20,001 |
| Total Certificates of Deposit - Domestic * (Cost $233,151) | | 233,151 |
| | | |
| CERTIFICATES OF DEPOSIT - EURODOLLAR ^ 4.8% | | |
| | | |
| ABN Amro Bank, 3.16%, 8/9/05 | 50,000 | 50,000 |
| Barclays Bank | | |
| 2.86%, 6/1/05 | 15,000 | 15,000 |
| 3.08%, 7/14/05 | 17,000 | 17,000 |
| 3.175%, 8/9/05 | 32,000 | 32,001 |
| Deutsche Bank, 3.16%, 8/9/05 | 32,000 | 32,001 |
| Nordea Bank, 3.03%, 6/30/05 | 33,000 | 33,000 |
| Northern Rock, 3.04%, 6/30/05 | 16,000 | 16,000 |
| Skandinaviska Enskilda Banken, 3.01%, 6/30/05 | 16,000 | 16,000 |
| Societe Generale, 2.94%, 6/1/05 | 24,000 | 24,000 |
| Total Certificates of Deposit - Eurodollar ^ (Cost $235,002) | | 235,002 |
| | | |
| CERTIFICATES OF DEPOSIT - YANKEE ++ 12.5% | | |
| | | |
| Abbey National Treasury Services, 3.02%, 6/13/05 | 49,650 | 49,650 |
| ABN Amro Bank, 3.025%, 6/30/05 | 10,750 | 10,750 |
| Banco Bilbao Vizcaya, 3.02%, 6/10/05 | 31,500 | 31,500 |
| Bank of Montreal (Chicago), 2.98%, 6/20/05 | 30,750 | 30,750 |
| Barclays Bank, 3.11%, 7/11/05 | 15,000 | 15,000 |
| Calyon, 3.15%, 8/8/05 | 43,700 | 43,700 |
| Canadian Imperial Bank of Commerce, 3.03%, 6/30/05 | 48,500 | 48,500 |
| Credit Suisse First Boston, 3.12%, 7/18/05 | 34,500 | 34,500 |
| Danske Bank, 3.03%, 6/6/05 | 31,500 | 31,500 |
| Deutsche Bank, 3.04%, 6/27/05 | 15,500 | 15,500 |
| Fortis Bank, 3.02%, 6/8/05 | 40,000 | 40,000 |
| KBC Bank, 3.035%, 6/30/05 | 23,500 | 23,500 |
| Natexis Banques Populaires, 3.15%, 8/8/05 | 24,500 | 24,500 |
| Rabobank Nederland | | |
| 3.09%, 7/25/05 | 14,700 | 14,700 |
| 3.39%, 12/15/05 | 19,750 | 19,748 |
| Royal Bank of Scotland, 2.31%, 6/17/05 | 21,500 | 21,502 |
| Svenska Handelsbanken | | |
| 3.00%, 6/20/05 | 25,000 | 25,000 |
| 3.04%, 6/30/05 | 23,750 | 23,750 |
| Toronto-Dominion Bank, 3.05%, 7/13/05 | 49,000 | 49,000 |
| UBS, 3.005%, 6/30/05 | 63,500 | 63,500 |
| Total Certificates of Deposit - Yankee ++ (Cost $616,550) | | 616,550 |
| | | |
| COMMERCIAL PAPER 25.7% | | |
| | | |
| ANZ ( Delaware), 3.01%, 6/29/05 | 40,000 | 39,906 |
| Capital One Multi-Asset Executive Trust | | |
| 3.03%, 6/9/05 | 30,000 | 29,980 |
| 3.06%, 7/12/05 | 11,000 | 10,961 |
| CBA Finance (Delaware), 3.01%, 6/9/05 | 28,000 | 27,981 |
| Citicorp, 3.02%, 7/6/05 | 50,000 | 49,853 |
| Citigroup Global Markets, 3.03%, 7/14/05 | 20,000 | 19,928 |
| Dexia Delaware, 3.02%, 6/8/05 | 9,550 | 9,544 |
| European Investment Bank, 3.01%, 7/1/05 | 100,000 | 99,749 |
| FCAR Owner Trust | | |
| 3.02%, 6/8/05 | 24,500 | 24,486 |
| 3.03%, 7/6/05 | 43,000 | 42,873 |
| Ixis Commercial Paper | | |
| 3.00%, 6/27/05 | 134,225 | 133,934 |
| 3.07%, 7/12/05 | 40,000 | 39,860 |
| K2 (U.S.A) | | |
| 3.02%, 6/20/05 | 16,000 | 15,975 |
| 3.03%, 6/8/05 | 22,600 | 22,587 |
| 3.03%, 6/15/05 | 40,300 | 40,252 |
| Merck & Co., 3.01%, 6/3/05 | 47,049 | 47,041 |
| National City Credit, 3.02%, 6/27/05 | 24,000 | 23,948 |
| National Rural Utilities, 3.03%, 6/24/05 | 43,000 | 42,917 |
| New Center Asset Trust | | |
| 3.03%, 6/7/05 | 5,000 | 4,997 |
| 3.18%, 7/18/05 | 3,415 | 3,401 |
| New York State Power Auth., 3.03%, 6/14/05 | 29,295 | 29,263 |
| New York Times, 3.02%, 6/21/05 | 4,388 | 4,381 |
| Paccar Financial | | |
| 3.01%, 6/9/05 | 15,000 | 14,990 |
| 3.01%, 6/10/05 | 15,000 | 14,989 |
| 3.01%, 6/13/05 | 15,000 | 14,985 |
| Province of Quebec, 3.00%, 6/22/05 | 25,000 | 24,956 |
| Prudential Funding | | |
| 3.00%, 6/3/05 | 25,000 | 24,996 |
| 3.01%, 6/1/05 | 45,000 | 45,000 |
| Rabobank USA Financial, 3.00%, 7/11/05 | 75,000 | 74,750 |
| Royal Bank of Scotland, 3.00%, 6/2/05 | 41,000 | 40,997 |
| San Paolo IMI U.S. Financial, 3.14%, 7/25/05 | 20,000 | 19,906 |
| Siemens Capital | | |
| 3.01%, 6/24/05 | 82,000 | 81,842 |
| 3.01%, 6/28/05 | 50,000 | 49,887 |
| 3.04%, 6/1/05 | 9,567 | 9,567 |
| Stanford Univ., 3.03%, 6/2/05 | 15,680 | 15,679 |
| Toyota Motor Credit, 3.01%, 6/17/05 | 50,000 | 49,933 |
| Westpac Capital, 3.01%, 7/8/05 | 15,000 | 14,954 |
| Total Commercial Paper (Cost $1,261,248) | | 1,261,248 |
| | | |
| COMMERCIAL PAPER - 4(2) 44.9% | | |
| | | |
| Allied Irish Banks, 2.92%, 6/2/05 | 49,500 | 49,496 |
| Alpine Securitization | | |
| 3.02%, 6/3/05 | 50,000 | 49,992 |
| 3.02%, 6/8/05 | 8,500 | 8,495 |
| 3.02%, 6/22/05 | 25,000 | 24,956 |
| 3.04%, 7/12/05 | 15,000 | 14,948 |
| ASB Bank, 3.05%, 7/5/05 | 12,000 | 11,965 |
| Atlantic Asset Securitization | | |
| 3.02%, 6/10/05 | 21,372 | 21,356 |
| 3.03%, 6/9/05 | 18,000 | 17,988 |
| Bank of Ireland | | |
| 3.04%, 7/6/05 | 5,200 | 5,185 |
| 3.05%, 7/1/05 | 29,500 | 29,425 |
| Cafco | | |
| 3.02%, 6/20/05 | 13,000 | 12,979 |
| 3.03%, 7/1/05 | 9,000 | 8,977 |
| 3.03%, 7/7/05 | 50,000 | 49,849 |
| 3.04%, 7/12/05 | 18,000 | 17,938 |
| 3.10%, 7/19/05 | 27,000 | 26,888 |
| Citibank Credit Card Issuance Trust | | |
| 2.85%, 6/1/05 | 49,500 | 49,500 |
| 3.13%, 7/21/05 | 16,000 | 15,930 |
| 3.15%, 7/26/05 | 30,000 | 29,856 |
| CRC Funding | | |
| 3.01%, 6/7/05 | 50,000 | 49,975 |
| 3.02%, 6/21/05 | 15,000 | 14,975 |
| 3.02%, 6/29/05 | 9,000 | 8,979 |
| 3.03%, 6/21/05 | 49,750 | 49,666 |
| 3.03%, 6/29/05 | 20,000 | 19,953 |
| 3.03%, 7/7/05 | 20,000 | 19,939 |
| Discover Card Master Trust I | | |
| 2.98%, 6/20/05 | 7,500 | 7,488 |
| 3.00%, 6/13/05 | 25,000 | 24,975 |
| 3.00%, 6/20/05 | 19,250 | 19,220 |
| Fairway Finance | | |
| 3.00%, 6/6/05 | 29,131 | 29,119 |
| 3.02%, 6/1/05 | 11,000 | 11,000 |
| 3.03%, 6/14/05 | 5,775 | 5,769 |
| Falcon Asset Securitization | | |
| 3.02%, 6/2/05 | 20,000 | 19,998 |
| 3.02%, 6/16/05 | 48,000 | 47,940 |
| 3.03%, 6/10/05 | 10,060 | 10,052 |
| 3.03%, 6/13/05 | 2,979 | 2,976 |
| 3.03%, 6/14/05 | 10,000 | 9,989 |
| Ford Credit Floorplan | | |
| 3.03%, 6/2/05 | 35,000 | 34,997 |
| 3.05%, 6/8/05 | 8,000 | 7,995 |
| 3.07%, 6/9/05 | 16,827 | 16,816 |
| Grampian Funding, 3.04%, 6/1/05 | 50,000 | 50,000 |
| Irish Life & Permanent, 2.63%, 6/3/05 | 3,000 | 3,000 |
| Jefferson-Pilot, 3.02%, 6/27/05 | 10,000 | 9,978 |
| K2 (U.S.A), 3.01%, 6/30/05 | 11,300 | 11,273 |
| KFW International Finance, 3.00%, 6/29/05 | 100,000 | 99,767 |
| Kitty Hawk Funding, 3.03%, 6/16/05 | 46,750 | 46,691 |
| MassMutual Funding | | |
| 3.01%, 6/20/05 | 20,000 | 19,968 |
| 3.01%, 6/22/05 | 16,300 | 16,271 |
| 3.01%, 6/23/05 | 18,000 | 17,967 |
| MBNA Master Credit Card Trust II | | |
| 3.01%, 6/29/05 | 29,000 | 28,932 |
| 3.03%, 6/22/05 | 23,250 | 23,209 |
| 3.12%, 7/20/05 | 15,000 | 14,936 |
| 3.14%, 7/26/05 | 9,750 | 9,703 |
| 3.15%, 7/27/05 | 37,000 | 36,819 |
| National Australia Funding, 3.02%, 6/2/05 | 48,664 | 48,660 |
| Nationwide Life Insurance, 3.15%, 8/8/05 | 28,000 | 27,833 |
| Nestle Capital, 3.01%, 6/3/05 | 37,650 | 37,644 |
| Old Line Funding | | |
| 3.03%, 6/15/05 | 6,952 | 6,944 |
| 3.03%, 6/23/05 | 30,106 | 30,050 |
| Park Avenue Receivables | | |
| 3.02%, 6/2/05 | 20,000 | 19,998 |
| 3.02%, 6/6/05 | 15,320 | 15,313 |
| 3.02%, 6/10/05 | 13,400 | 13,390 |
| 3.02%, 6/21/05 | 46,000 | 45,923 |
| 3.03%, 6/3/05 | 853 | 853 |
| Pfizer, 3.02%, 6/1/05 | 100,000 | 100,000 |
| Preferred Receivables Funding | | |
| 3.02%, 6/27/05 | 25,000 | 24,946 |
| 3.025%, 6/23/05 | 82,000 | 81,848 |
| Ranger Funding | | |
| 3.03%, 6/15/05 | 50,900 | 50,840 |
| 3.03%, 6/24/05 | 11,510 | 11,488 |
| Rio Tinto, 3.01%, 6/1/05 | 30,068 | 30,068 |
| Sigma Finance | | |
| 3.02%, 7/15/05 | 50,000 | 49,815 |
| 3.10%, 7/26/05 | 38,000 | 37,820 |
| Southern Company, 3.05%, 7/6/05 | 19,775 | 19,716 |
| Total Fina Elf Capital, 3.00%, 6/2/05 | 50,000 | 49,996 |
| Tulip Funding | | |
| 3.02%, 6/10/05 | 25,000 | 24,981 |
| 3.11%, 7/29/05 | 50,000 | 49,750 |
| Variable Funding Capital, 3.03%, 6/10/05 | 50,000 | 49,962 |
| Wal-Mart Funding, 3.00%, 6/21/05 | 66,000 | 65,890 |
| Yorktown Capital, 3.02%, 6/7/05 | 68,650 | 68,615 |
| Total Commercial Paper - 4(2) (Cost $2,208,401) | | 2,208,401 |
| | | |
| FUNDING AGREEMENTS 2.6% | | |
| | | |
| Allstate Life Insurance | | |
| VR, 3.026%, 9/1/05 ‡ | 25,000 | 25,000 |
| VR, 3.138%, 9/1/05 ‡ | 25,000 | 25,000 |
| GE Capital Assurance, VR, 3.23%, 1/12/06 ‡ | 30,000 | 30,000 |
| ING Annuity & Life Insurance, 3.14%, 6/24/05 ‡ | 15,000 | 15,000 |
| New York Life Insurance, VR, 3.181%, 12/9/05 ‡ | 30,000 | 30,000 |
| Transamerica Occidential Life Insurance | | |
| VR, 3.231%, 6/1/06 ‡ | 5,000 | 5,000 |
| Total Funding Agreements (Cost $130,000) | | 130,000 |
| | |
| MEDIUM-TERM NOTES 3.0% | | |
| | |
| GE Capital | | |
| VR, 3.19%, 6/9/06 | 23,900 | 23,900 |
| VR, 3.19%, 6/16/06 | 14,900 | 14,900 |
| Goldman Sachs Group, VR, 144A, 3.151%, 5/1/06 | 49,600 | 49,600 |
| International Lease Finance | | |
| 4.375%, 12/15/05 | 5,250 | 5,278 |
| VR, 3.30%, 9/22/05 | 3,945 | 3,948 |
| VR, 4.41%, 8/1/05 | 10,000 | 10,020 |
| VR, 4.441%, 7/15/05 | 8,000 | 8,012 |
| Nationwide Building, VR, 144A, 3.09%, 7/7/06 | 27,500 | 27,500 |
| SLM, VR, 3.361%, 1/13/06 | 6,200 | 6,207 |
| Total Medium-Term Notes (Cost $149,365) | | 149,365 |
| | | |
| MUNICIPAL SECURITIES 0.5% | | |
| | | |
| Colorado Housing Fin. Auth., Single Family | | |
| VRDN (Currently 3.08%) | 17,310 | 17,310 |
| Texas, Veterans Housing, VRDN (Currently 3.06%) | 8,710 | 8,710 |
| Total Municipal Securities (Cost $26,020) | | 26,020 |
| | | |
| U.S. GOVERNMENT AGENCY OBLIGATIONS ± 0.1% | | |
| | | |
| Federal Home Loan Bank, VR, 3.25%, 4/25/06 | 6,000 | 6,000 |
| Total U.S. Government Agency Obligations ± (Cost $6,000) | | 6,000 |
| | | |
| Total Investments in Securities | | |
| | | |
| 100.6% of Net Assets (Cost $4,945,737) | $ | 4,945,737 |
| (1) | Denominated in U.S. dollars unless other- |
| | wise noted |
| * | Domestic certificates of deposit are issued |
| | by domestic branches of U.S. banks |
| ± | The issuer is a publicly-traded company |
| | that operates under a congressional char- |
| | ter; its securities are neither issued nor |
| | guaranteed by the U.S. government. |
| ^ | Eurodollar certificates of deposit are issued |
| | by foreign branches of U.S. or foreign banks |
| ++ | Yankee certificates of deposit are issued by |
| | U.S. branches of foreign banks |
| 144A | Security was purchased pursuant to Rule |
| | 144A under the Securities Act of 1933 and |
| | may be resold in transactions exempt from |
| | registration only to qualified institutional |
| | buyers – total value of such securities at |
| | period-end amounts to $77,100 and repre- |
| | sents 1.6% of net assets |
| 4(2) | Commercial paper exempt from registration |
| | under Section 4(2) of the Securities Act of |
| | 1933 and may be resold in transactions |
| | exempt from registration only to dealers in |
| | that program or other “accredited investors” |
| | – total value of such securities at period-end |
| | amounts to $2,208,401 and represents |
| | 44.9% of net assets |
| VR | Variable Rate; rate shown is effective rate |
| | at period-end |
| VRDN | Variable-Rate Demand Note; rate shown is |
| | effective rate at period-end |
| ‡Restricted Securities | | |
| Amounts in (000s) | | |
| |
| |
| The fund may invest in securities that cannot be offered for public resale without first being |
| registered under the Securities Act of 1933 and related rules. The total restricted securities |
| (excluding 144A issues) at period-end amounts to $130,000 and represents 2.6% of net assets. |
| |
| | Acquisition | Acquisition |
| Description | Date | Cost |
| Allstate Life Insurance, VR, 3.026%, 9/1/05 | 2/2/04 | $ 25,000 |
| Allstate Life Insurance, VR, 3.138%, 9/1/05 | 6/24/99 | 25,000 |
| GE Capital Assurance, VR, 3.23%, 1/12/06 | 1/11/05 | 30,000 |
| ING Annuity & Life Insurance, 3.14%, 6/24/05 | 2/22/05 | 15,000 |
| New York Life Insurance, VR, 3.181%, 12/9/05 | 12/8/04 | 30,000 |
| Transamerica Occidential Life Insurance, VR, 3.231%, 6/1/06 | 11/1/04 | 5,000 |
| Totals | | $ 130,000 |
| |
| The fund has registration rights for certain restricted securities held as of May 31, 2005. Any costs |
| related to such registration are borne by the issuer. | | |
| |
| |
| The accompanying notes are an integral part of these financial statements. | | |
| STATEMENT OF ASSETS AND LIABILITIES | | |
| (In thousands except shares and per share amounts) | | |
| Assets | | |
| Investments in securities, at value (cost $4,945,737) | $ | 4,945,737 |
| Interest receivable | | 4,644 |
| Receivable for shares sold | | 18,848 |
| Other assets | | 4,585 |
| |
|
| Total assets | | 4,973,814 |
| |
|
| |
| Liabilities | | |
| Investment management fees payable | | 1,509 |
| Payable for investment securities purchased | | 29,649 |
| Payable for shares redeemed | | 20,312 |
| Due to affiliates | | 828 |
| Other liabilities | | 3,179 |
| |
|
| Total liabilities | | 55,477 |
| |
|
| |
| NET ASSETS | $ | 4,918,337 |
| |
|
| Net Assets Consist of: | | |
| Undistributed net investment income (loss) | $ | 736 |
| Undistributed net realized gain (loss) | | (24) |
| Paid-in-capital applicable to 4,918,270,915 shares of | | |
| $0.01 par value capital stock outstanding; | | |
| 15,000,000,000 shares authorized | | 4,917,625 |
| |
|
| |
| NET ASSETS | $ | 4,918,337 |
| |
|
| |
| NET ASSET VALUE PER SHARE | $ | 1.00 |
| |
|
| |
| |
| |
| |
| The accompanying notes are an integral part of these financial statements. | | |
| STATEMENT OF OPERATIONS | | |
| ($ 000s) | | |
| | | Year |
| | | Ended |
| | | 5/31/05 |
| Investment Income (Loss) | | |
| Interest income | $ | 101,957 |
| |
|
| Expenses | | |
| Investment management | | 17,917 |
| Shareholder servicing | | 11,709 |
| Prospectus and shareholder reports | | 442 |
| Custody and accounting | | 350 |
| Registration | | 85 |
| Proxy and annual meeting | | 57 |
| Legal and audit | | 21 |
| Directors | | 19 |
| Miscellaneous | | 71 |
| |
|
| Total expenses | | 30,671 |
| Expenses paid indirectly | | (3) |
| |
|
| Net expenses | | 30,668 |
| |
|
| Net investment income (loss) | | 71,289 |
| |
|
| |
| Realized and Unrealized Gain (Loss) | | |
| Net realized gain (loss) on securities | | (24) |
| |
|
| |
| INCREASE (DECREASE) IN NET | | |
| ASSETS FROM OPERATIONS | $ | 71,265 |
| |
|
| |
| |
| |
| |
| The accompanying notes are an integral part of these financial statements. | | |
| STATEMENT OF CHANGES IN NET ASSETS | | | | |
| ($ 000s) | | | | |
| | | Year | | |
| | | Ended | | |
| | | 5/31/05 | | 5/31/04 |
| |
| Increase (Decrease) in Net Assets | | | | |
| Operations | | | | |
| Net investment income (loss) | $ | 71,289 | $ | 26,839 |
| Net realized gain (loss) | | (24) | | 86 |
|
|
| Increase (decrease) in net assets from operations | | 71,265 | | 26,925 |
|
|
| |
| Distributions to shareholders | | | | |
| Net investment income | | (71,289) | | (26,839) |
|
|
| |
| Capital share transactions * | | | | |
| Shares sold | | 3,719,343 | | 4,011,213 |
| Distributions reinvested | | 70,082 | | 26,141 |
| Shares redeemed | | (3,923,910) | | (4,636,758) |
|
|
| Increase (decrease) in net assets from capital | | | | |
| share transactions | | (134,485) | | (599,404) |
|
|
| |
| Net Assets | | | | |
| Increase (decrease) during period | | (134,509) | | (599,318) |
| Beginning of period | | 5,052,846 | | 5,652,164 |
|
|
| |
| End of period | $ | 4,918,337 | $ | 5,052,846 |
|
|
| (Including undistributed net investment income of | | | | |
| $736 at 5/31/05 and $736 at 5/31/04) | | | | |
| |
| |
| |
| |
| * Capital shares transactions at net asset value of $1.00 per share. | | | | |
| |
| The accompanying notes are an integral part of these financial statements. | | | | |
| NOTES TO FINANCIAL STATEMENTS |
NOTE 1 - SIGNIFICANT ACCOUNTING POLICIES
T. Rowe Price Prime Reserve Fund, Inc. (the fund) is registered under the Investment Company Act of 1940 (the 1940 Act) as a diversified, open-end management investment company. The fund commenced operations on January 26, 1976. The fund seeks preservation of capital, liquidity, and consistent with these, the highest possible current income.
The accompanying financial statements were prepared in accordance with accounting principles generally accepted in the United States of America, which require the use of estimates made by fund management.
Valuation Securities are valued at amortized cost. Assets and liabilities for which such valuation procedures are deemed not to reflect fair value are stated at fair value as determined in good faith by the T. Rowe Price Valuation Committee, established by the fund’s Board of Directors.
Credits The fund earns credits on temporarily uninvested cash balances at the custodian that reduce the fund’s custody charges. Custody expense in the accompanying financial statements is presented before reduction for credits, which are reflected as expenses paid indirectly.
Investment Transactions, Investment Income, and Distributions Income and expenses are recorded on the accrual basis. Premiums and discounts on debt securities are amortized for financial reporting purposes. Investment transactions are accounted for on the trade date. Realized gains and losses are reported on the identified cost basis. Distributions to shareholders are recorded on the ex-dividend date. Income distributions are declared on a daily basis and paid monthly.
NOTE 2 - INVESTMENT TRANSACTIONS
Consistent with its investment objective, the fund engages in the following practices to manage exposure to certain risks or enhance performance. The investment objective, policies, program, and risk factors of the fund are described more fully in the fund’s prospectus and Statement of Additional Information.
Restricted Securities The fund may invest in securities that are subject to legal or contractual restrictions on resale. Although certain of these securities may be readily sold, for example, under Rule 144A, others may be illiquid, their sale may involve substantial delays and additional costs, and prompt sale at an acceptable price may be difficult.
NOTE 3 - FEDERAL INCOME TAXES
No provision for federal income taxes is required since the fund intends to continue to qualify as a regulated investment company under Subchapter M of the Internal Revenue Code and distribute to shareholders all of its taxable income and gains. Federal income tax regulations differ from generally accepted accounting principles; therefore, distributions determined in accordance with tax regulations may differ significantly in amount or character from net investment income and realized gains for financial reporting purposes. Financial reporting records are adjusted for permanent book/tax differences to reflect tax character. Financial records are not adjusted for temporary differences.
Distributions during the year ended May 31, 2005 totaled $71,289,000 and were characterized as ordinary income for tax purposes. At May 31, 2005, the tax-basis components of net assets were as follows:
| Unrealized depreciation | $ | (14,000) |
| Undistributed ordinary income | | 736,000 |
| Capital loss carryforwards | | (10,000) |
| Paid-in capital | | 4,917,625,000 |
| |
|
| |
| Net assets | $4,918,337,000 |
| |
|
The fund intends to retain realized gains to the extent of available capital loss carryforwards for federal income tax purposes. As of May 31, 2005, the fund had $10,000 of capital loss carryforwards that expire in fiscal 2013.
At May 31, 2005, the cost of investments for federal income tax purposes was $4,945,751,000.
NOTE 4 - RELATED PARTY TRANSACTIONS
The fund is managed by T. Rowe Price Associates, Inc. (the manager or Price Associates), a wholly owned subsidiary of T. Rowe Price Group, Inc. The investment management agreement between the fund and the manager provides for an annual investment management fee, which is computed daily and paid monthly. The fee consists of an individual fund fee, equal to 0.05% of the fund’s average daily net assets, and a group fee. The group fee rate is calculated based on the combined net assets of certain mutual funds sponsored by Price Associates (the group) applied to a graduated fee schedule, with rates ranging from 0.48% for the first $1 billion of assets to 0.29% for assets in excess of $160 billion. Prior to May 1, 2005, the maximum group fee rate in the graduated fee schedule had been 0.295% for assets in excess of $120 billion. The fund’s group fee is determined by applying the group fee rate to the fund’s average daily net assets. At May 31, 2005, the effective annual group fee rate was 0.31% .
In addition, the fund has entered into service agreements with Price Associates and two wholly owned subsidiaries of Price Associates (collectively, Price). Price Associates computes the daily share price and maintains the financial records of the fund. T. Rowe Price Services, Inc., provides shareholder and administrative services in its capacity as the fund’s transfer and dividend disbursing agent. T. Rowe Price Retirement Plan Services, Inc., provides subaccounting and record-keeping services for certain retirement accounts invested in the fund. For the year ended May 31, 2005, expenses incurred pursuant to these service agreements were $84,000 for Price Associates, $5,696,000 for T. Rowe Price Services, Inc., and $2,654,000 for T. Rowe Price Retirement Plan Services, Inc. The total amount payable at period end pursuant to these service agreements is reflected as due to affiliates in the accompanying financial statements.
| REPORT OF INDEPENDENT REGISTERED PUBLIC ACCOUNTING FIRM |
To the Board of Directors and Shareholders of T. Rowe Price Prime Reserve Fund, Inc.
In our opinion, the accompanying statement of assets and liabilities, including the portfolio of investments, and the related statements of operations and of changes in net assets and the financial highlights present fairly, in all material respects, the financial position of T. Rowe Price Prime Reserve Fund, Inc. at May 31, 2005, the results of its operations for the year then ended, the changes in its net assets for each of the two years in the period then ended and the financial highlights for each of the five years in the period then ended, in conformity with accounting principles generally accepted in the United States of America. These financial statements and financial highlights (hereafter referred to as “financial statements”) are the responsibility of the Fund’s management; our responsibility is to express an opinion on these financial statements based on our audits. We conducted our audits of these financial statements in accordance with the auditing standards of the Public Company Accounting Oversight Board (United States). Those standards require that we plan and perform the audit to obtain reasonable assurance about whether the financial statements are free of material misstatement. An audit includes examining, on a test basis, evidence supporting the amounts and disclosures in the financial statements, assessing the accounting principles used and significant estimates made by management, and evaluating the overall financial statement presentation. We believe that our audits, which included confirmation of securities at May 31, 2005 by correspondence with the custodian and brokers, provide a reasonable basis for our opinion.
PricewaterhouseCoopers LLP
Baltimore, Maryland
July 12, 2005
| INFORMATION ON PROXY VOTING POLICIES, PROCEDURES, AND RECORDS |
A description of the policies and procedures used by T. Rowe Price funds and portfolios to determine how to vote proxies relating to portfolio securities is available in each fund’s Statement of Additional Information, which you may request by calling 1-800-225-5132 or by accessing the SEC’s Web site, www.sec.gov. The description of our proxy voting policies and procedures is also available on our Web site, www.troweprice.com. To access it, click on the words “Company Info” at the top of our homepage for individual investors. Then, in the window that appears, click on the “Proxy Voting Policy” navigation button in the top left corner.
Each fund’s most recent annual proxy voting record is available on our Web site and through the SEC’s Web site. To access it through our Web site, follow the directions above, then click on the words “Proxy Voting Record” at the bottom of the Proxy Voting Policy page.
| HOW TO OBTAIN QUARTERLY PORTFOLIO HOLDINGS |
The fund files a complete schedule of portfolio holdings with the Securities and Exchange Commission for the first and third quarters of each fiscal year on Form N-Q. The fund’s Form N-Q is available electronically on the SEC’s Web site (www.sec.gov); hard copies may be reviewed and copied at the SEC’s Public Reference Room, 450 Fifth St. N.W., Washington, DC 20549. For more information on the Public Reference Room, call 1-800-SEC-0330.
| APPROVAL OF INVESTMENT MANAGEMENT AGREEMENT |
On March 2, 2005, the fund’s Board of Directors unanimously approved the investment advisory contract (“Contract”) between the fund and its investment manager, T. Rowe Price Associates, Inc. (“Manager”). The Board considered a variety of factors in connection with its review of the Contract, also taking into account information provided by the Manager during the course of the year, as discussed below:
Services Provided by the Manager
The Board considered the nature, quality, and extent of the services provided to the fund by the Manager. These services included, but were not limited to, management of the fund’s portfolio and a variety of activities related to portfolio management. The Board also reviewed the background and experience of the Manager’s senior management team and investment personnel involved in the management of the fund. The Board concluded that it was satisfied with the nature, quality, and extent of the services provided by the Manager.
Investment Performance of the Fund
The Board reviewed the fund’s average annual total return over the 1-, 3-, 5-, and 10-year periods as well as the fund’s year-by-year returns and compared these returns to a wide variety of previously agreed upon comparable performance measures and market data, including those supplied by Lipper and Morningstar, which are independent providers of mutual fund data. On the basis of this evaluation and the Board’s ongoing review of investment results, the Board concluded that the fund’s performance was satisfactory.
Costs, Benefits, Profits, and Economies of Scale
The Board reviewed detailed information regarding the revenues received by the Manager under the Contract and other benefits that the Manager (and its affiliates) may have realized from its relationship with the fund, including research received under “soft dollar” agreements. The Board also received information on the estimated costs incurred and profits realized by the Manager and its affiliates from advising T. Rowe Price mutual funds, as well as estimates of the gross profits realized from managing the fund in particular. The Board concluded that the Manager’s profits were reasonable in light of the services provided to the fund. The Board also considered whether the fund or other funds benefit under the fee levels set forth in the Contract from any economies of scale realized by the Manager. Under the Contract, the fund pays a fee to the Manager composed of two components—a group fee rate based on the aggregate assets of certain T. Rowe Price mutual funds (including the fund) that declines at certain asset levels and an individual fund fee rate that is assessed on the assets of the fund. The Board concluded that an additional breakpoint should be added to the group fee component of the fees paid by the fund under the Contract at a level of $160 billion. The Board further concluded that, with this change, the advisory fee structure for the fund continued to provide for a reasonable sharing of benefits from economies of scale with the fund’s investors.
Fees
The Board reviewed the fund’s management fee rate, operating expenses, and total expense ratio and compared them to fees and expenses of other comparable funds based on information and data supplied by Lipper. The information provided to the Board showed that the fund’s management fee rate was above the median of certain groups of comparable funds but below the median of other groups of comparable funds. The information also indicated that the fund’s expense ratio was generally below the median of comparable funds. The Board also reviewed the fee schedules for comparable privately managed accounts of the Manager and its affiliates. Management informed the Board that the Manager’s responsibilities for privately managed accounts are more limited than its responsibilities for the fund and other T. Rowe Price mutual funds that it or its affiliates advise. On the basis of the information provided, the Board concluded that the fees paid by the fund under the Contract were reasonable.
Approval of the Contract
As noted, the Board approved the continuation of the Contract as amended to add an additional breakpoint to the group fee rate. No single factor was considered in isolation or to be determinative to the decision. Rather, the Board concluded, in light of a weighting and balancing of all factors considered, that it was in the best interests of the fund to approve the continuation of the Contract, including the fees to be charged for services thereunder.
| ABOUT THE FUND’S DIRECTORS AND OFFICERS |
Your fund is governed by a Board of Directors that meets regularly to review investments, performance, expenses, and other business matters, and is responsible for protecting the interests of shareholders. The majority of the fund’s directors are independent of T. Rowe Price Associates, Inc. (T. Rowe Price); “inside” directors are officers of T. Rowe Price. The Board of Directors elects the fund’s officers, who are listed in the final table. The business address of each director and officer is 100 East Pratt Street, Baltimore, MD 21202. The Statement of Additional Information includes additional information about the fund directors and is available without charge by calling a T. Rowe Price representative at 1-800-225-5132.
| Independent Directors | |
| |
| Name | |
| (Year of Birth) | Principal Occupation(s) During Past 5 Years and |
| Year Elected * | Directorships of Other Public Companies |
| |
| Anthony W. Deering | Chairman, Exeter Capital, LLC, a private investment firm (2004 to pre- |
| (1945) | sent); Director, Chairman of the Board, and Chief Executive Officer, |
| 1979 | The Rouse Company, real estate developers (1997 to 2004); Director, |
| | Mercantile Bank (4/03 to present) |
| |
| Donald W. Dick, Jr. | Principal, EuroCapital Advisors, LLC, an acquisition and management |
| (1943) | advisory firm; Chairman, President, and Chief Executive Officer, |
| 2001 | The Haven Group, a custom manufacturer of modular homes (1/04 |
| | to present) |
| |
| David K. Fagin | Chairman and President, Nye Corporation (6/88 to present); Director, |
| (1938) | Canyon Resources Corporation and Golden Star Resources Ltd. (5/00 |
| 2001 | to present), and Pacific Rim Mining Corporation (2/02 to present) |
| |
| Karen N. Horn | Managing Director and President, Global Private Client Services, Marsh |
| (1943) | Inc. (1999 to 2003); Managing Director and Head of International Private |
| 2003 | Banking, Bankers Trust (1996 to 1999); Director, Eli Lilly and Company |
| | and Georgia Pacific |
| |
| F. Pierce Linaweaver | President, F. Pierce Linaweaver & Associates, Inc., consulting environ- |
| (1934) | mental and civil engineers |
| 1980 | |
| |
| Theo C. Rodgers ** | President, A&R Development Corporation |
| (1941) | |
| 2005 | |
| |
| John G. Schreiber | Owner/President, Centaur Capital Partners, Inc., a real estate investment |
| (1946) | company; Partner, Blackstone Real Estate Advisors, L.P.; Director, AMLI |
| 1992 | Residential Properties Trust |
| |
| ** Each independent director oversees 112 T. Rowe Price portfolios and serves until retirement, resignation, or |
| ** election of a successor. | |
| ** Elected effective April 1, 2005. |
| Inside Directors | |
| |
| Name | |
| (Year of Birth) | |
| Year Elected * | |
| [Number of T. Rowe Price | Principal Occupation(s) During Past 5 Years and |
| Portfolios Overseen] | Directorships of Other Public Companies |
| |
| Mary J. Miller, CFA | Director and Vice President, T. Rowe Price; Vice President, T. Rowe |
| (1955) | Price Group, Inc.; Vice President, Prime Reserve Fund |
| 2004 | |
| [37] | |
| |
| James S. Riepe | Director and Vice President, T. Rowe Price; Vice Chairman of the Board, |
| (1943) | Director, and Vice President, T. Rowe Price Group, Inc.; Chairman of the |
| 1994 | Board and Director, T. Rowe Price Global Asset Management Limited, |
| [112] | T. Rowe Price Global Investment Services Limited, T. Rowe Price |
| | Investment Services, Inc., T. Rowe Price Retirement Plan Services, |
| | Inc., and T. Rowe Price Services, Inc.; Chairman of the Board, Director, |
| | President, and Trust Officer, T. Rowe Price Trust Company; Director, |
| | T. Rowe Price International, Inc.; Director, The Nasdaq Stock Market, Inc. |
| |
| * Each inside director serves until retirement, resignation, or election of a successor. |
| Officers | |
| |
| Name (Year of Birth) | |
| Title and Fund(s) Served | Principal Occupation(s) |
| |
| Steven G. Brooks, CFA (1954) | Vice President, T. Rowe Price and T. Rowe Price |
| Vice President, Prime Reserve Fund | Group, Inc. |
| |
| Brian E. Burns (1960) | Assistant Vice President, T. Rowe Price |
| Vice President, Prime Reserve Fund | |
| |
| Joseph A. Carrier, CPA (1960) | Vice President, T. Rowe Price, T. Rowe Price |
| Treasurer, Prime Reserve Fund | Group, Inc., T. Rowe Price Investment Services, |
| | Inc., and T. Rowe Price Trust Company |
| |
| Patrick S. Cassidy, CFA (1964) | Vice President, T. Rowe Price and T. Rowe Price |
| Vice President, Prime Reserve Fund | Group, Inc. |
| |
| Roger L. Fiery III, CPA (1959) | Vice President, T. Rowe Price, T. Rowe Price |
| Vice President, Prime Reserve Fund | Group, Inc., T. Rowe Price International, Inc., |
| | and T. Rowe Price Trust Company |
| |
| Alisa Fiumara, CFA (1974) | Assistant Vice President, T. Rowe Price |
| Vice President, Prime Reserve Fund | |
| |
| John R. Gilner (1961) | Chief Compliance Officer and Vice President, |
| Chief Compliance Officer, Prime Reserve Fund | T. Rowe Price; Vice President, T. Rowe Price |
| | Group, Inc., and T. Rowe Price Investment |
| | Services, Inc. |
| |
| Gregory S. Golczewski (1966) | Vice President, T. Rowe Price and T. Rowe Price |
| Vice President, Prime Reserve Fund | Trust Company |
| |
| Terri L. Hett (1959) | Employee, T. Rowe Price |
| Assistant Vice President, Prime Reserve Fund | |
| |
| Henry H. Hopkins (1942) | Director and Vice President, T. Rowe Price |
| Vice President, Prime Reserve Fund | Investment Services, Inc., T. Rowe Price Services, |
| | Inc., and T. Rowe Price Trust Company; Vice |
| | President, T. Rowe Price, T. Rowe Price Group, |
| | Inc., T. Rowe Price International, Inc., and |
| | T. Rowe Price Retirement Plan Services, Inc. |
| |
| Alan D. Levenson, PhD (1958) | Vice President, T. Rowe Price and T. Rowe Price |
| Vice President, Prime Reserve Fund | Group, Inc. |
| |
| Patricia B. Lippert (1953) | Assistant Vice President, T. Rowe Price and |
| Secretary, Prime Reserve Fund | T. Rowe Price Investment Services, Inc. |
| |
| Joseph K. Lynagh, CFA (1958) | Vice President, T. Rowe Price and T. Rowe Price |
| Vice President, Prime Reserve Fund | Group, Inc. |
| |
| James M. McDonald (1949) | Vice President, T. Rowe Price, T. Rowe Price |
| President, Prime Reserve Fund | Group, Inc., and T. Rowe Price Trust Company |
| |
| Susan G. Troll, CPA (1966) | Vice President, T. Rowe Price and T. Rowe Price |
| Vice President, Prime Reserve Fund | Group, Inc. |
| |
| Julie L. Waples (1970) | Vice President, T. Rowe Price |
| Vice President, Prime Reserve Fund | |
| |
| Edward A. Wiese, CFA (1959) | Vice President, T. Rowe Price, T. Rowe Price |
| Vice President, Prime Reserve Fund | Group, Inc., and T. Rowe Price Trust Company; |
| | Chief Investment Officer, Director, and Vice |
| | President, T. Rowe Price Savings Bank |
| |
| Unless otherwise noted, officers have been employees of T. Rowe Price or T. Rowe Price International for at |
| least five years. | |
Item 2. Code of Ethics.
The registrant has adopted a code of ethics, as defined in Item 2 of Form N-CSR, applicable to its principal executive officer, principal financial officer, principal accounting officer or controller, or persons performing similar functions. A copy of this code of ethics is filed as an exhibit to this Form N-CSR. No substantive amendments were approved or waivers were granted to this code of ethics during the period covered by this report.
Item 3. Audit Committee Financial Expert.
The registrant’s Board of Directors/Trustees has determined that Mr. David K. Fagin qualifies as an audit committee financial expert, as defined in Item 3 of Form N-CSR. Mr. Fagin is considered independent for purposes of Item 3 of Form N-CSR.
Item 4. Principal Accountant Fees and Services.
(a) – (d) Aggregate fees billed to the registrant for the last two fiscal years for professional services rendered by the registrant’s principal accountant were as follows:
| | 2005 | 2004 |
| Audit Fees | $11,607 | $18,092 |
| Audit-Related Fees | 1,590 | 1,647 |
| Tax Fees | 3,547 | 5,000 |
| All Other Fees | 306 | 124 |
Audit fees include amounts related to the audit of the registrant’s annual financial statements and services normally provided by the accountant in connection with statutory and regulatory filings. Audit-related fees include amounts reasonably related to the performance of the audit of the registrant’s financial statements, specifically the issuance of a report on internal controls. Tax fees include amounts related to tax compliance, tax planning, and tax advice. Other fees include the registrant’s pro-rata share of amounts for agreed-upon procedures in conjunction with service contract approvals by the registrant’s Board of Directors/Trustees.
(e)(1) The registrant’s audit committee has adopted a policy whereby audit and non-audit services performed by the registrant’s principal accountant for the registrant, its investment adviser, and any entity controlling, controlled by, or under common control with the investment adviser that provides ongoing services to the registrant require pre-approval in advance at regularly scheduled audit committee meetings. If such a service is required between regularly scheduled audit committee meetings, pre-approval may be authorized by one audit committee member with ratification at the next scheduled audit committee meeting. Waiver of pre-approval for audit or non-audit services requiring fees of a de minimis amount is not permitted.
(2) No services included in (b) – (d) above were approved pursuant to paragraph (c)(7)(i)(C) of Rule 2-01 of Regulation S-X.
(f) Less than 50 percent of the hours expended on the principal accountant’s engagement to audit the registrant’s financial statements for the most recent fiscal year were attributed to work performed by persons other than the principal accountant’s full-time, permanent employees.
(g) The aggregate fees billed for the most recent fiscal year and the preceding fiscal year by the registrant’s principal accountant for non-audit services rendered to the registrant, its investment adviser, and any entity controlling, controlled by, or under common control with the investment adviser that provides ongoing services to the registrant were $903,000 and $821,000, respectively, and were less than the aggregate fees billed for those same periods by the registrant’s principal accountant for audit services rendered to the T. Rowe Price Funds.
(h) All non-audit services rendered in (g) above were pre-approved by the registrant’s audit committee. Accordingly, these services were considered by the registrant’s audit committee in maintaining the principal accountant’s independence.
Item 5. Audit Committee of Listed Registrants.
Not applicable.
Item 6. Schedule of Investments.
Not applicable. The complete schedule of investments is included in Item 1 of this Form N-CSR.
Item 7. Disclosure of Proxy Voting Policies and Procedures for Closed-End Management Investment Companies.
Not applicable.
Item 8. Portfolio Managers of Closed-End Management Investment Companies.
Not applicable.
Item 9. Purchases of Equity Securities by Closed-End Management Investment Company and Affiliated Purchasers.
Not applicable.
Item 10. Submission of Matters to a Vote of Security Holders.
Not applicable.
Item 11. Controls and Procedures.
(a) The registrant’s principal executive officer and principal financial officer have evaluated the registrant’s disclosure controls and procedures within 90 days of this filing and have concluded that the registrant’s disclosure controls and procedures were effective, as of that date, in ensuring that information required to be disclosed by the registrant in this Form N-CSR was recorded, processed, summarized, and reported timely.
(b) The registrant’s principal executive officer and principal financial officer are aware of no change in the registrant’s internal control over financial reporting that occurred during the registrant’s second fiscal quarter covered by this report that has materially affected, or is reasonably likely to materially affect, the registrant’s internal control over financial reporting.
Item 12. Exhibits.
(a)(1) The registrant’s code of ethics pursuant to Item 2 of Form N-CSR is attached.
(2) Separate certifications by the registrant's principal executive officer and principal financial officer, pursuant to Section 302 of the Sarbanes-Oxley Act of 2002 and required by Rule 30a-2(a) under the Investment Company Act of 1940, are attached.
(3) Written solicitation to repurchase securities issued by closed-end companies: not applicable.
(b) A certification by the registrant's principal executive officer and principal financial officer, pursuant to Section 906 of the Sarbanes-Oxley Act of 2002 and required by Rule 30a-2(b) under the Investment Company Act of 1940, is attached.
Pursuant to the requirements of the Securities Exchange Act of 1934 and the Investment Company Act of 1940, the registrant has duly caused this report to be signed on its behalf by the undersigned, thereunto duly authorized.
T. Rowe Price Prime Reserve Fund, Inc.
| By | /s/ James S. Riepe |
| | James S. Riepe |
| | Principal Executive Officer |
| |
| Date | July 20, 2005 |
Pursuant to the requirements of the Securities Exchange Act of 1934 and the Investment Company Act of 1940, this report has been signed below by the following persons on behalf of the registrant and in the capacities and on the dates indicated.
| By | /s/ James S. Riepe |
| | James S. Riepe |
| | Principal Executive Officer |
| |
| Date | July 20, 2005 |
| |
| |
| |
| By | /s/ Joseph A. Carrier |
| | Joseph A. Carrier |
| | Principal Financial Officer |
| |
| Date | July 20, 2005 |