UNITED STATES
SECURITIES AND EXCHANGE COMMISSION
Washington, D.C. 20549
FORM N-CSR
CERTIFIED SHAREHOLDER REPORT OF REGISTERED
MANAGEMENT INVESTMENT COMPANIES
Investment Company Act File Number: 811-02603
| T. Rowe Price Government Money Fund, Inc. |
|
| (Exact name of registrant as specified in charter) |
| |
| 100 East Pratt Street, Baltimore, MD 21202 |
|
| (Address of principal executive offices) |
| |
| David Oestreicher |
| 100 East Pratt Street, Baltimore, MD 21202 |
|
| (Name and address of agent for service) |
Registrant’s telephone number, including area code: (410) 345-2000
Date of fiscal year end: May 31
Date of reporting period: November 30, 2019
Item 1. Reports to Shareholders
(a) Report pursuant to Rule 30e-1.
| Government Money Fund | November 30, 2019 |
| PRRXX | Investor Class |
| TTGXX | I Class |
Beginning on January 1, 2021, as permitted by SEC regulations, paper copies of the T. Rowe Price funds’ annual and semiannual shareholder reports will no longer be mailed, unless you specifically request them. Instead, shareholder reports will be made available on the funds’ website (troweprice.com/prospectus), and you will be notified by mail with a website link to access the reports each time a report is posted to the site.
If you already elected to receive reports electronically, you will not be affected by this change and need not take any action. At any time, shareholders who invest directly in T. Rowe Price funds may generally elect to receive reports or other communications electronically by enrolling attroweprice.com/paperlessor, if you are a retirement plan sponsor or invest in the funds through a financial intermediary (such as an investment advisor, broker-dealer, insurance company, or bank), by contacting your representative or your financial intermediary.
You may elect to continue receiving paper copies of future shareholder reports free of charge. To do so, if you invest directly with T. Rowe Price, please call T. Rowe Price as follows: IRA, nonretirement account holders, and institutional investors,1-800-225-5132; small business retirement accounts,1-800-492-7670. If you are a retirement plan sponsor or invest in the T. Rowe Price funds through a financial intermediary, please contact your representative or financial intermediary or follow additional instructions if included with this document. Your election to receive paper copies of reports will apply to all funds held in your account with your financial intermediary or, if you invest directly in the T. Rowe Price funds, with T. Rowe Price. Your election can be changed at any time in the future.
| T. ROWE PRICE GOVERNMENT MONEY FUND |
|
HIGHLIGHTS
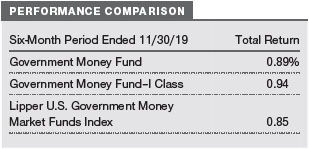
| ■ | The Government Money Fund returned 0.89% in the six-month period ended November 30, 2019, versus 0.85% for the Lipper U.S. Government Money Market Funds Index. |
| |
| ■ | The Federal Reserve cut rates three times in our reporting period. Other short-term interest rates also declined as a result of the Fed’s actions. |
| |
| ■ | While much of the portfolio at the end of November was invested in Treasuries and other U.S. government securities, we also had a large allocation to repurchase agreements (repos). High repo rates created an opportunity for us to provide what we considered low-risk lending with attractive yields. |
| |
| ■ | We expect the Fed to be on hold for the foreseeable future. Central bank officials have stressed that material, concrete inflation data would need to be evident before any future rate hike would occur. On the other hand, future weak economic data could precipitate another rate cut. |

Log in to your account attroweprice.comfor more information.
*Certain mutual fund accounts that are assessed an annual account service fee can also save money by switching to e-delivery.
CIO Market Commentary
Dear Shareholder
Global markets recorded solid results in the first half of your fund’s fiscal year, the six-month period ended November 30, 2019. Both stock and bond indexes advanced as the Federal Reserve and other key central banks took action to address a slowing global economy.
In the U.S., the large-cap Dow Jones Industrial Average and S&P 500 Index reached record highs, as did the technology-heavy Nasdaq Composite Index. The smaller-cap benchmarks recorded double-digit gains but remained below their 2018 peaks. At the sector level, technology stocks produced the strongest gains. International stocks generally performed well, although there were pockets of weakness in some emerging markets. The U.S. dollar finished with mixed results versus other currencies, but a relatively strong greenback versus the euro and yen weighed modestly on returns for U.S. investors in European and Japanese securities.
Fixed income securities also produced solid gains during the period—with corporate bonds leading the way—as yields fell. The yield on the 30-year Treasury bond hit a record low in August, falling below the 2% mark for the first time, and the benchmark 10-year Treasury note’s yield dipped to its lowest level since 2016. Outside the U.S., yields on government bonds issued by certain countries were in negative territory. (Bond prices and yields move in opposite directions.)
Worries had grown in May that an escalating trade dispute between the U.S. and China could lead to a recession. However, Fed Chair Jerome Powell sparked a rebound in investor sentiment in early June, at the start of your fund’s fiscal year, with his comments that central bank policymakers were paying close attention to the impact of trade tensions on the economy and would “act as appropriate to sustain the expansion.”
Fed policymakers followed through with quarter-percentage-point rate cuts in July, September, and October and took steps to maintain liquidity in short-term lending markets. Other central banks also acted to address flagging growth. The European Central Bank lowered its benchmark deposit rate deeper into negative territory and announced that it was restarting its quantitative easing program.
The shift in global central bank policies was a marked change from 2018, when there were approximately two interest rate hikes for every cut. In 2019, central bank rate cuts have outnumbered hikes by a more than five-to-one margin and appear to be succeeding in their goal of stimulating economic growth. After contracting earlier in the period, key manufacturing and export indicators showed signs of stabilizing by November, and the Treasury yield curve returned to a more normal positive slope, easing recession fears.
The U.S. economy was sustained by consumer spending and remained relatively strong compared with other developed markets. While corporate earnings experienced a year-over-year decline through the third quarter, slightly more companies than usual surpassed earnings expectations, providing further market support.
Besides monetary policy, investors also closely followed developments in the U.S.-China trade dispute. Stocks suffered their biggest sell-off during the six-month period in early August after President Donald Trump announced that the U.S. would impose a 10% tariff on Chinese imports, and China retaliated with new tariffs of its own. However, investors generally took an optimistic view of trade negotiations, which limited the trade war’s toll on markets.
Looking ahead, we believe that further progress in U.S.-China trade talks will be a key factor in sustaining positive market sentiment. A reduction in trade barriers could help corporate earnings rebound and provide a lift to the manufacturing sector.
Our investment teams will also be closely following the U.S. presidential election, Brexit, and other developments that could influence markets in 2020. In an uncertain environment, with a wide dispersion of returns possible, we believe that in-depth fundamental research will be particularly critical for identifying potential opportunities and risks.
Thank you for your continued confidence in T. Rowe Price.
Sincerely,

Robert Sharps
Group Chief Investment Officer
Management’s Discussion of Fund Performance
INVESTMENT OBJECTIVE
The fund’s goals are preservation of capital, liquidity, and, consistent with these, the highest possible current income.
FUND COMMENTARY
How did the fund perform in the past six months?
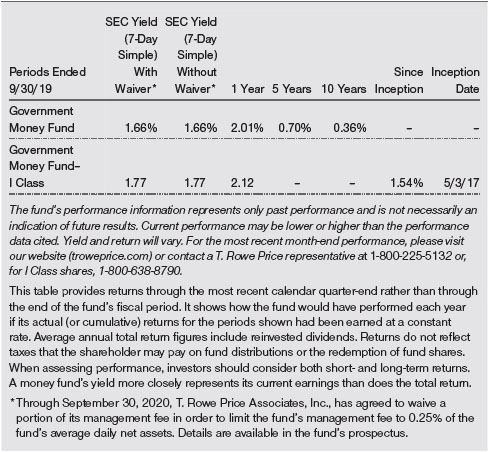
The Government Money Fund returned 0.89% in the six-month period ended November 30, 2019, versus 0.85% for the Lipper U.S. Government Money Market Funds Index. (Performance for the fund’s I Class shares will vary due toa different fee structure.Past performance cannot guarantee future results.)
What factors influenced the fund’s performance?
When the reporting period began, there was a collective belief within the market that the central bank was finishedraising rates and needed to lower rates to prolong the economic expansion. The Fed eventually appeased the market with three rate reductions. The Fed decreased the federal funds target rate range by 25 basis points (0.25 percentage points) following the July, September, and October monetary policy meetings. The new range at the end of our reporting period was 1.50% to 1.75%.
Other short-term interest rates declined as a result of the Fed’s actions. For example, the yield on the 90-day Treasury bill decreased from 2.35% to 1.59% over the last six months while the six-month Treasury bill yield fell from 2.35% to 1.63%. Similarly, the fund’s 7-day simple yield decreased from 2.09% at the end of May to 1.36% at the end of November.
How is the fund positioned?
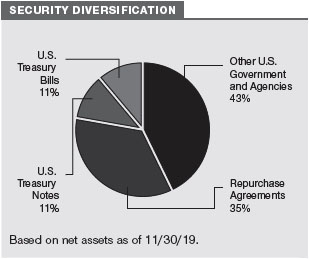
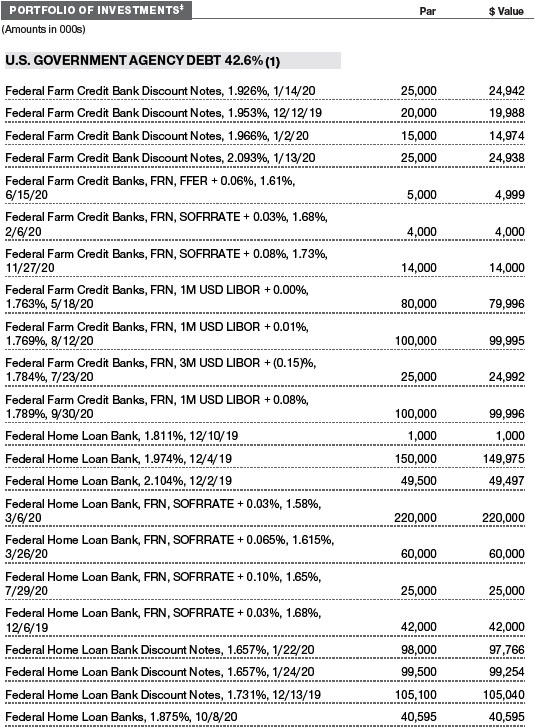
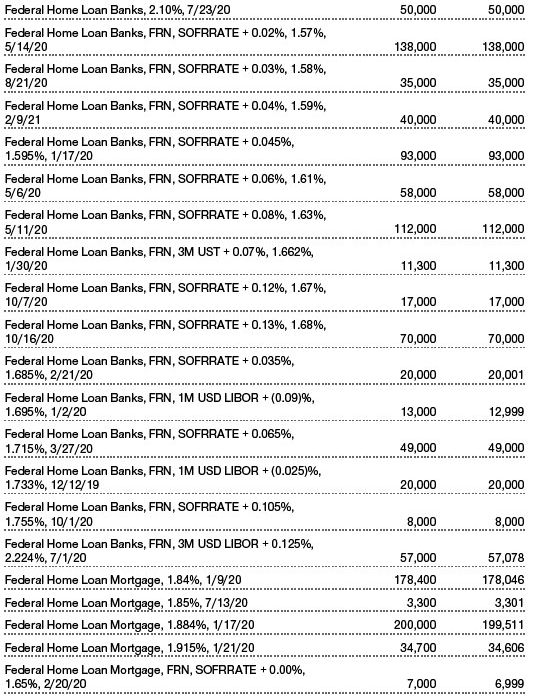
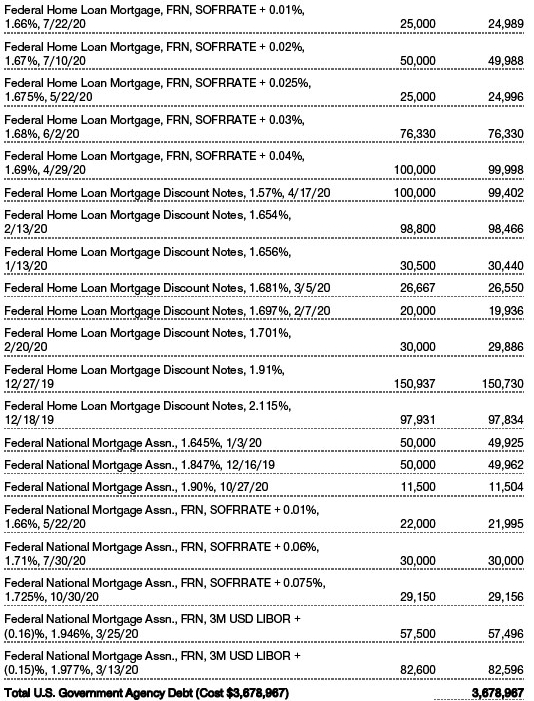
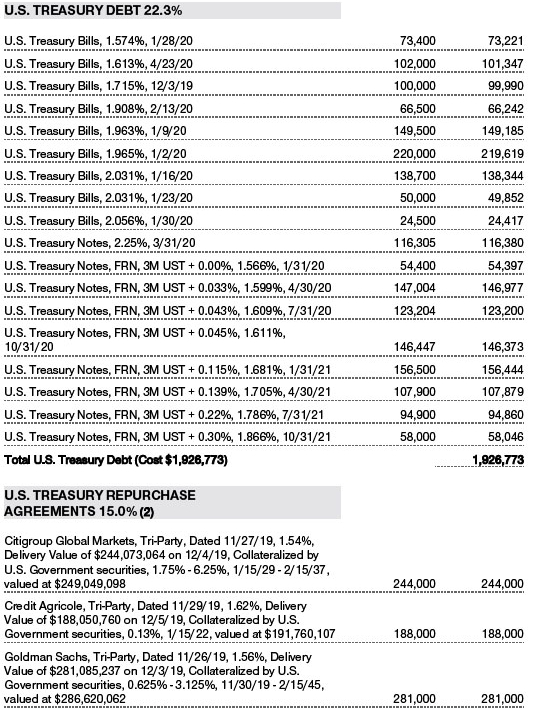
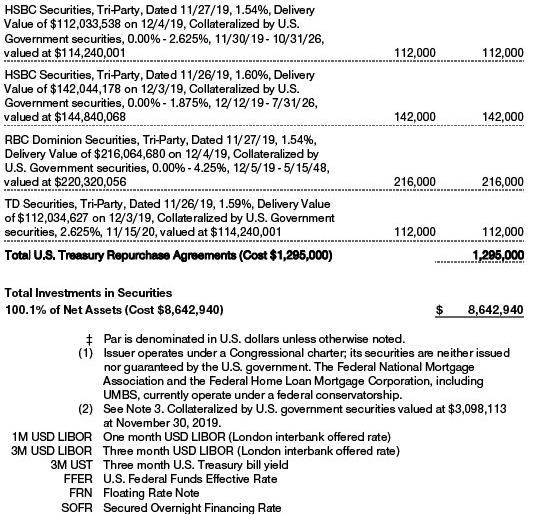
As a government money fund, the portfolio is required to invest almost exclusively in Treasury bills and other U.S. government securities, as well as repurchase agreements fully collateralized by government securities. Of course, the fund is not subject to the liquidity fees and redemption restrictions (also known as “gates”) that may be applied to nongovernment money funds during times of severe redemption activity. At the end of November 2019, about 22% of the fund’s assets were invested in Treasury bills and notes while other U.S. government and agency securities accounted for about 43%.
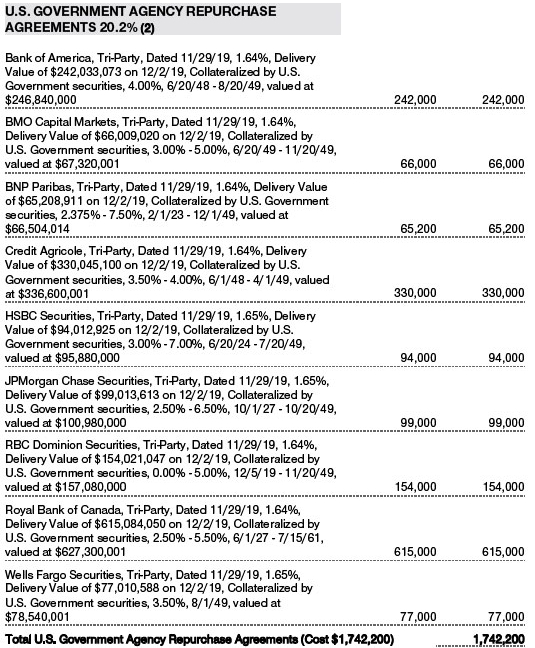
Repurchase agreements (repos) represented about 35%, an unusually high percentage for this fund that—due to their very short maturities (one to seven days)—resulted in a relatively short weighted average maturity of 22 days at the end of November. Repo rates were high throughout our reporting period due to the heavy need for dealers to finance their inventories of securities. Then, the supply of money to finance these securities became scarce in September. These factors created an opportunity for us to provide what we considered low-risk lending with attractive yields.
After some short-lasting volatility in the repo markets, the Fed announced a temporary program to provide liquidity to the dealers as a stopgap measure. Following the central bank’s late-October meeting, Fed officials announced a longer-lasting solution to buy Treasury bills out of the market to increase the reserves on the Fed’s balance sheet. The program increased demand for T-bills and, thus, drove their prices higher. Investors then rotated out of T-billsand, instead, favored repo investments, ultimately providing the desired securities financing to dealers and banks.
What is portfolio management’s outlook?
The Federal Reserve’s projections and many market participants’ expectations, including ours, are for the Fed to be on hold for the foreseeable future. The central bank has stressed that material, concrete inflationdata would need to be evident before any future rate hike will occur. Future weak economic data, though, may precipitate another rate cut. In any event, our focus remains on principal stability and on investments with the highest credit quality.
The views expressed reflect the opinions of T. Rowe Price as of the date of this report and are subject to change based on changes in market, economic, or other conditions. These views are not intended to be a forecast of future events and are no guarantee of future results.
RISKS OF INVESTING IN THE GOVERNMENT MONEY FUND
You could lose money by investing in the Fund. Although the Fund seeks to preserve the value of your investment at $1.00 per share, it cannot guarantee it will do so. An investment in the Fund is not insured or guaranteed by the Federal Deposit Insurance Corporation or any other government agency. The Fund’s sponsor has no legal obligation to provide financial support to the Fund, and you should not expect that the sponsor will provide financial support to the Fund at any time.
The potential for realizing a loss of principal in the fund could derive from:
Credit risks. An issuer of a debt instrument, or a counterparty to a repurchase agreement entered into by the fund, could suffer an adverse change in financial condition that results in a payment default (failure to make scheduled interest or principal payments), a rating downgrade, or an inability to meet a financial obligation. Although the fund only purchases securities that present minimal credit risk in the opinion of T. Rowe Price, the credit quality of the fund’s holdings could change rapidly during periods of market stress.
Interest rate risks.A decline in interest rates may lower the fund’s yield, or a rise in the overall level of interest rates may cause a decline in the prices of fixed income securities held by the fund. The fund’s yield will vary; it is not fixed for a specific period like the yield on a bank certificate of deposit. This is a disadvantage when interest rates are falling because the fund would have to reinvest at lower interest rates.
Repurchase agreement risks.A counterparty to a repurchase agreement may become insolvent or fail to repurchase securities from the fund as required, which could increase the fund’s costs or prevent the fund from immediately accessing its collateral.
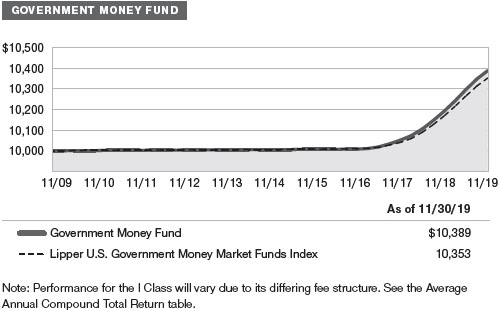
GROWTH OF $10,000
This chart shows the value of a hypothetical $10,000 investment in the fund over the past 10 fiscal year periods or since inception (for funds lacking 10-year records). The result is compared with benchmarks, which include a broad-based market index and may also include a peer group average or index. Market indexes do not include expenses, which are deducted from fund returns as well as mutual fund averages and indexes.
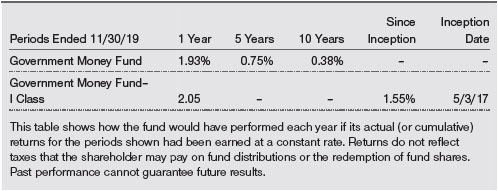
AVERAGE ANNUAL COMPOUND TOTAL RETURN
EXPENSE RATIO

FUND EXPENSE EXAMPLE
As a mutual fund shareholder, you may incur two types of costs: (1) transaction costs, such as redemption fees or sales loads, and (2) ongoing costs, including management fees, distribution and service (12b-1) fees, and other fund expenses. The following example is intended to help you understand your ongoing costs (in dollars) of investing in the fund and to compare these costs with the ongoing costs of investing in other mutual funds. The example is based on an investment of $1,000 invested at the beginning of the most recent six-month period and held for the entire period.
Please note that the fund has two share classes: The original share class (Investor Class) charges no distribution and service (12b-1) fee, and the I Class shares are also available to institutionally oriented clients and impose no 12b-1 or administrative fee payment. Each share class is presented separately in the table.
Actual Expenses
The first line of the following table (Actual) provides information about actual account values and expenses based on the fund’s actual returns. You may use the information on this line, together with your account balance, to estimate the expenses that you paid over the period. Simply divide your account value by $1,000 (for example, an $8,600 account value divided by $1,000 = 8.6), then multiply the result by the number on the first line under the heading “Expenses Paid During Period” to estimate the expenses you paid on your account during this period.
Hypothetical Example for Comparison Purposes
The information on the second line of the table (Hypothetical) is based on hypothetical account values and expenses derived from the fund’s actual expense ratio and an assumed 5% per year rate of return before expenses (not the fund’s actual return). You may compare the ongoing costs of investing in the fund with other funds by contrasting this 5% hypothetical example and the 5% hypothetical examples that appear in the shareholder reports of the other funds. The hypothetical account values and expenses may not be used to estimate the actual ending account balance or expenses you paid for the period.
Note:T. Rowe Price charges an annual account service fee of $20, generally for accounts with less than $10,000. The fee is waived for any investor whose T. Rowe Price mutual fund accounts total $50,000 or more; accounts electing to receive electronic delivery of account statements, transaction confirmations, prospectuses, and shareholder reports; or accounts of an investor who is a T. Rowe Price Personal Services or Enhanced Personal Services client (enrollment in these programs generally requires T. Rowe Price assets of at least $250,000). This fee is not included in the accompanying table. If you are subject to the fee, keep it in mind when you are estimating the ongoing expenses of investing in the fund and when comparing the expenses of this fund with other funds.
You should also be aware that the expenses shown in the table highlight only your ongoing costs and do not reflect any transaction costs, such as redemption fees or sales loads. Therefore, the second line of the table is useful in comparing ongoing costs only and will not help you determine the relative total costs of owning different funds. To the extent a fund charges transaction costs, however, the total cost of owning that fund is higher.

QUARTER-END RETURNS
Unaudited

The accompanying notes are an integral part of these financial statements.
Unaudited
The accompanying notes are an integral part of these financial statements.
Unaudited
The accompanying notes are an integral part of these financial statements.
Unaudited
The accompanying notes are an integral part of these financial statements.
Unaudited
The accompanying notes are an integral part of these financial statements.
Unaudited

The accompanying notes are an integral part of these financial statements.
Unaudited
| NOTES TO FINANCIAL STATEMENTS |
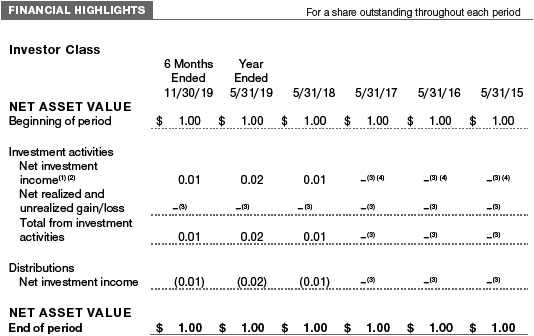
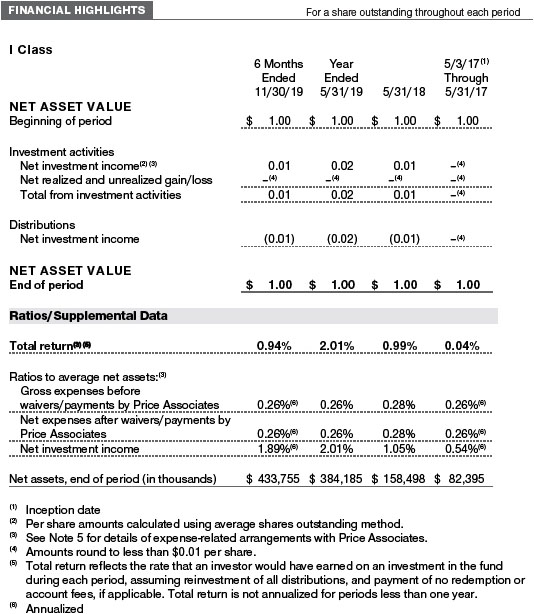
T. Rowe Price Government Money Fund, Inc. (the fund) is registered under the Investment Company Act of 1940 (the 1940 Act) as a diversified, open-end management investment company. The fund seeks preservation of capital, liquidity, and, consistent with these, the highest possible current income. The fund intends to operate as a government money market fund and has no intention to voluntarily impose liquidity fees on redemptions or temporarily suspend redemptions. The fund has two classes of shares: the Government Money Fund (Investor Class) and the Government Money Fund–I Class (I Class). I Class shares require a $1 million initial investment minimum, although the minimum generally is waived for retirement plans, financial intermediaries, and certain other accounts. Each class has exclusive voting rights on matters related solely to that class; separate voting rights on matters that relate to both classes; and, in all other respects, the same rights and obligations as the other class.
NOTE 1 - SIGNIFICANT ACCOUNTING POLICIES
Basis of PreparationThe fund is an investment company and follows accounting and reporting guidance in the Financial Accounting Standards Board (FASB)Accounting Standards CodificationTopic 946 (ASC 946). The accompanying financial statements were prepared in accordance with accounting principles generally accepted in the United States of America (GAAP), including, but not limited to, ASC 946. GAAP requires the use of estimates made by management. Management believes that estimates and valuations are appropriate; however, actual results may differ from those estimates, and the valuations reflected in the accompanying financial statements may differ from the value ultimately realized upon sale or maturity. Certain prior year amounts in the accompanying financial statements and financial highlights have been restated to conform to current year presentation.
Investment Transactions, Investment Income, and Distributions Investment transactions are accounted for on the trade date basis. Income and expenses are recorded on the accrual basis. Realized gains and losses are reported on the identified cost basis. Premiums and discounts on debt securities are amortized for financial reporting purposes. Income tax-related interest and penalties, if incurred, are recorded as income tax expense. Distributions to shareholders are recorded on the ex-dividend date.Income distributions are declared by each class daily and paid monthly. A capital gain distribution may also be declared and paid by the fund annually.
Class Accounting Shareholder servicing, prospectus, and shareholder report expenses incurred by each class are charged directly to the class to which they relate. Expenses common to both classes and investment income are allocated to the classes based upon the relative daily net assets of each class’s settled shares; realized and unrealized gains and losses are allocated based upon the relative daily net assets of each class’s outstanding shares.
New Accounting GuidanceIn March 2017, the FASB issued amended guidance to shorten the amortization period for certain callable debt securities held at a premium. The guidance is effective for fiscal years and interim periods beginning after December 15, 2018. Adoption will have no effect on the fund’s net assets or results of operations.
IndemnificationIn the normal course of business, the fund may provide indemnification in connection with its officers and directors, service providers, and/or private company investments. The fund’s maximum exposure under these arrangements is unknown; however, the risk of material loss is currently considered to be remote.
NOTE 2 - VALUATION
The fund’s financial instruments are valued and each class’s net asset value (NAV) per share is computed at the close of the New York Stock Exchange (NYSE), normally 4 p.m. ET, each day the NYSE is open for business. However, the NAV per share may be calculated at a time other than the normal close of the NYSE if trading on the NYSE is restricted, if the NYSE closes earlier, or as may be permitted by the SEC. The fund’s financial instruments are reported at fair value, which GAAP defines as the price that would be received to sell an asset or paid to transfer a liability in an orderly transaction between market participants at the measurement date. Assets and liabilities other than financial instruments, including short-term receivables and payables, are carried at cost, or estimated realizable value, if less, which approximates fair value. The T. Rowe Price Valuation Committee (the Valuation Committee) is an internal committee that has been delegated certain responsibilities by the fund’s Board of Directors (the Board) to ensure that financial instruments are appropriately priced at fair value in accordance with GAAP and the 1940 Act. Subject to oversight by the Board, the Valuation Committee develops and oversees pricing-related policies and procedures, including the comparison of amortized cost to market-based value, and approves all fair value determinations.
Various valuation techniques and inputs are used to determine the fair value of financial instruments. GAAP establishes the following fair value hierarchy that categorizes the inputs used to measure fair value:
Level 1 – quoted prices (unadjusted) in active markets for identical financial instruments that the fund can access at the reporting date
Level 2 – inputs other than Level 1 quoted prices that are observable, either directly or indirectly (including, but not limited to, quoted prices for similar financial instruments in active markets, quoted prices for identical or similar financial instruments in inactive markets, interest rates and yield curves, implied volatilities, and credit spreads)
Level 3 – unobservable inputs
Observable inputs are developed using market data, such as publicly available information about actual events or transactions, and reflect the assumptions market participants would use to price the financial instrument. Unobservable inputs are those for which market data are not available and are developed using the best information available about the assumptions that market participants would use to price the financial instrument. GAAP requires valuation techniques to maximize the use of relevant observable inputs and minimize the use of unobservable inputs. Input levels are not necessarily an indication of the risk or liquidity associated with financial instruments at that level but rather the degree of judgment used in determining those values. For example, securities held by a money market fund are generally high quality and liquid; however, they are reflected as Level 2 because the inputs used to determine fair value are not quoted prices in an active market.
In accordance with Rule 2a-7 under the 1940 Act, the fund values its securities at amortized cost, which approximates fair value. Securities for which amortized cost is deemed not to reflect fair value are stated at fair value as determined in good faith by the Valuation Committee. On November 30, 2019, all of the fund’s financial instruments were classified as Level 2 in the fair value hierarchy.
NOTE 3 - OTHER INVESTMENT TRANSACTIONS
Consistent with its investment objective, the fund engages in the following practices to manage exposure to certain risks and/or to enhance performance. The investment objective, policies, program, and risk factors of the fund are described more fully in the fund’s prospectus and Statement of Additional Information.
Repurchase AgreementsThe fund may engage in repurchase agreements, pursuant to which it pays cash to and receives securities from a counterparty that agrees to “repurchase” the securities at a specified time, typically within seven business days, for a specified price. The fund enters into such agreements with well-established securities dealers or banks that are members of the Federal Reserve System and are on Price Associates’ approved list. All repurchase agreements are fully collateralized by U.S. government or related agency securities, which are held by the custodian designated by the agreement. Collateral is evaluated daily to ensure that its market value exceeds the delivery value of the repurchase agreements at maturity. Although risk is mitigated by the collateral, the fund could experience a delay in recovering its value and a possible loss of income or value if the counterparty fails to perform in accordance with the terms of the agreement.
NOTE 4 - FEDERAL INCOME TAXES
No provision for federal income taxes is required since the fund intends to continue to qualify as a regulated investment company under Subchapter M of the Internal Revenue Code and distribute to shareholders all of its taxable income and gains. Distributions determined in accordance with federal income tax regulations may differ in amount or character from net investment income and realized gains for financial reporting purposes. Financial reporting records are adjusted for permanent book/tax differences to reflect tax character but are not adjusted for temporary differences. The amount and character of tax-basis distributions and composition of net assets are finalized at fiscal year-end; accordingly, tax-basis balances have not been determined as of the date of this report.
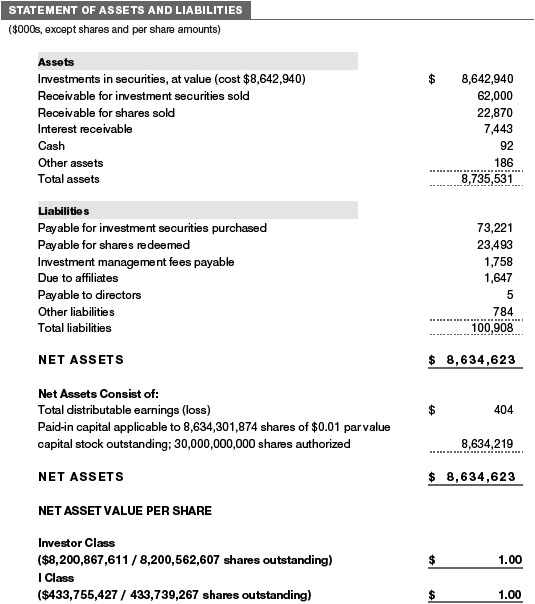
At November 30, 2019, the cost of investments for federal income tax purposes was $8,642,940,000.
NOTE 5 - RELATED PARTY TRANSACTIONS
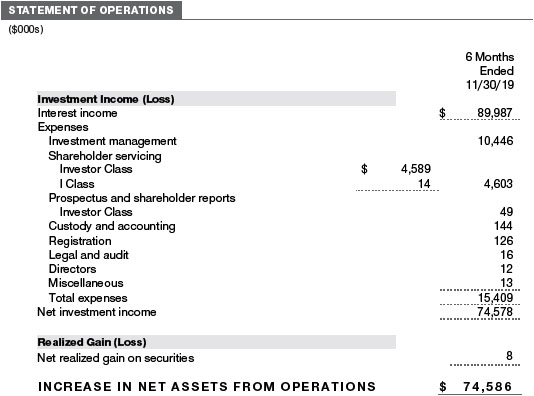
The fund is managed by T. Rowe Price Associates, Inc. (Price Associates), a wholly owned subsidiary of T. Rowe Price Group, Inc. (Price Group). The investment management agreement between the fund and Price Associates provides for an annual investment management fee, which is computed daily and paid monthly. The fee is determined by applying a group fee rate to the fund’s average daily net assets. The group fee rate is calculated based on the combined net assets of certain mutual funds sponsored by Price Associates (the group) applied to a graduated fee schedule, with rates ranging from 0.48% for the first $1 billion of assets to 0.265% for assets in excess of $650 billion.Price Associates agreed to waive a portion of the fund’s annual investment management fee in order to limit the fund’s management fees to 0.25% of the fund’s average daily net assets through September 30, 2020.This contractual management fee waiver arrangement will renew automatically for one-year terms thereafter and may be terminated only with approval of the fund’s Board. The fund has no obligation to repay fees waived under this arrangement. At November 30, 2019, the effective annual group fee rate was 0.29%.
The I Class is subject to an operating expense limitation (I Class Limit) pursuant to which Price Associates is contractually required to pay all operating expenses of the I Class, excluding management fees; interest; expenses related to borrowings, taxes, and brokerage; and other non-recurring expenses permitted by the investment management agreement, to the extent such operating expenses, on an annualized basis, exceed the I Class Limit. This agreement will continue through the expense limitation date indicated in the table below, and may be renewed, revised, or revoked only with approval of the fund’s Board. The I Class is required to repay Price Associates for expenses previously paid to the extent the class’s net assets grow or expenses decline sufficiently to allow repayment without causing the class’s operating expenses (after the repayment is taken into account) to exceed the lesser of: (1) the I Class Limit in place at the time such amounts were paid; or (2) the current I Class Limit. However, no repayment will be made more than three years after the date of a payment or waiver.
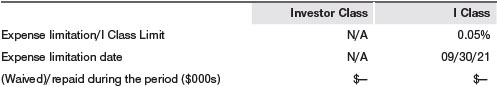
Price Associates may voluntarily waive all or a portion of its management fee and reimburse operating expenses to the extent necessary for the fund to maintain a zero or positive net yield (voluntary waiver). This voluntary waiver is in addition to the contractual expense limit in effect for the fund. Any amounts waived/paid by Price Associates under this voluntary agreement are not subject to repayment by the fund. Price Associates may amend or terminate this voluntary arrangement at any time without prior notice. For the six months ended November 30, 2019, the fund had no voluntary waivers.
In addition, the fund has entered into service agreements with Price Associates and two wholly owned subsidiaries of Price Associates, each an affiliate of the fund (collectively, Price). Price Associates provides certain accounting and administrative services to the fund. T. Rowe Price Services, Inc. provides shareholder and administrative services in its capacity as the fund’s transfer and dividend-disbursing agent. T. Rowe Price Retirement Plan Services, Inc. provides subaccounting and recordkeeping services for certain retirement accounts invested in the Investor Class. For the six months ended November 30, 2019, expenses incurred pursuant to these service agreements were $37,000 for Price Associates; $3,022,000 for T. Rowe Price Services, Inc.; and $550,000 for T. Rowe Price Retirement Plan Services, Inc. All amounts due to and due from Price, exclusive of investment management fees payable, are presented net on the accompanying Statement of Assets and Liabilities.
As of November 30, 2019, T. Rowe Price Group, Inc., or its wholly owned subsidiaries owned 1,685,135,243 shares of the Investor Class, representing 21% of the Investor Class’s net assets.
The fund may participate in securities purchase and sale transactions with other funds or accounts advised by Price Associates (cross trades), in accordance with procedures adopted by the fund’s Board and Securities and Exchange Commission rules, which require, among other things, that such purchase and sale cross trades be effected at the independent current market price of the security. During the six months ended November 30, 2019, the fund had no purchases or sales cross trades with other funds or accounts advised by Price Associates.
INFORMATION ON PROXY VOTING POLICIES, PROCEDURES, AND RECORDS
A description of the policies and procedures used by T. Rowe Price funds and portfolios to determine how to vote proxies relating to portfolio securities is available in each fund’s Statement of Additional Information. You may request this document by calling 1-800-225-5132 or by accessing the SEC’s website, sec.gov.
The description of our proxy voting policies and procedures is also available on our corporate website. To access it, please visit the following Web page:
https://www.troweprice.com/corporate/en/utility/policies.html
Scroll down to the section near the bottom of the page that says, “Proxy Voting Policies.” Click on the Proxy Voting Policies link in the shaded box.
Each fund’s most recent annual proxy voting record is available on our website and through the SEC’s website. To access it through T. Rowe Price, visit the website location shown above, and scroll down to the section near the bottom of the page that says, “Proxy Voting Records.” Click on the Proxy Voting Records link in the shaded box.
HOW TO OBTAIN QUARTERLY PORTFOLIO HOLDINGS
Effective for reporting periods on or after March 1, 2019, a fund, except a money market fund, files a complete schedule of portfolio holdings with the Securities and Exchange Commission (SEC) for the first and third quarters of each fiscal year as an exhibit to its reports on Form N-PORT. Prior to March 1, 2019, a fund, including a money market fund, filed a complete schedule of portfolio holdings with the SEC for the first and third quarters of each fiscal year on Form N-Q. A money market fund files detailed month-end portfolio holdings information on Form N-MFP with the SEC each month and posts a complete schedule of portfolio holdings on its website (troweprice.com) as of each month-end for the previous six months. A fund’s Forms N-PORT, N-MFP, and N-Q are available electronically on the SEC’s website (sec.gov).
Item 1. (b) Notice pursuant to Rule 30e-3.
Not applicable.
Item 2. Code of Ethics.
A code of ethics, as defined in Item 2 of Form N-CSR, applicable to its principal executive officer, principal financial officer, principal accounting officer or controller, or persons performing similar functions is filed as an exhibit to the registrant’s annual Form N-CSR. No substantive amendments were approved or waivers were granted to this code of ethics during the registrant’s most recent fiscal half-year.
Item 3. Audit Committee Financial Expert.
Disclosure required in registrant’s annual Form N-CSR.
Item 4. Principal Accountant Fees and Services.
Disclosure required in registrant’s annual Form N-CSR.
Item 5. Audit Committee of Listed Registrants.
Not applicable.
Item 6. Investments.
(a) Not applicable. The complete schedule of investments is included in Item 1 of this Form N-CSR.
(b) Not applicable.
Item 7. Disclosure of Proxy Voting Policies and Procedures for Closed-End Management Investment Companies.
Not applicable.
Item 8. Portfolio Managers of Closed-End Management Investment Companies.
Not applicable.
Item 9. Purchases of Equity Securities by Closed-End Management Investment Company and Affiliated Purchasers.
Not applicable.
Item 10. Submission of Matters to a Vote of Security Holders.
Not applicable.
Item 11. Controls and Procedures.
(a) The registrant’s principal executive officer and principal financial officer have evaluated the registrant’s disclosure controls and procedures within 90 days of this filing and have concluded that the registrant’s disclosure controls and procedures were effective, as of that date, in ensuring that information required to be disclosed by the registrant in this Form N-CSR was recorded, processed, summarized, and reported timely.
(b) The registrant’s principal executive officer and principal financial officer are aware of no change in the registrant’s internal control over financial reporting that occurred during the period covered by this report that has materially affected, or is reasonably likely to materially affect, the registrant’s internal control over financial reporting.
Item 12. Disclosure of Securities Lending Activities for Closed-End Management Investment Companies.
Not applicable.
Item 13. Exhibits.
(a)(1) The registrant’s code of ethics pursuant to Item 2 of Form N-CSR is filed with the registrant’s annual Form N-CSR.
(2) Separate certifications by the registrant's principal executive officer and principal financial officer, pursuant to Section 302 of the Sarbanes-Oxley Act of 2002 and required by Rule 30a-2(a) under the Investment Company Act of 1940, are attached.
(3) Written solicitation to repurchase securities issued by closed-end companies: not applicable.
(b) A certification by the registrant's principal executive officer and principal financial officer, pursuant to Section 906 of the Sarbanes-Oxley Act of 2002 and required by Rule 30a-2(b) under the Investment Company Act of 1940, is attached.
SIGNATURES
Pursuant to the requirements of the Securities Exchange Act of 1934 and the Investment Company Act of 1940, the registrant has duly caused this report to be signed on its behalf by the undersigned, thereunto duly authorized.
T. Rowe Price Government Money Fund, Inc.
| By | | /s/ David Oestreicher |
| | | David Oestreicher |
| | | Principal Executive Officer |
| |
| Date | | January 16, 2020 | | | | |
Pursuant to the requirements of the Securities Exchange Act of 1934 and the Investment Company Act of 1940, this report has been signed below by the following persons on behalf of the registrant and in the capacities and on the dates indicated.
| By | | /s/ David Oestreicher |
| | | David Oestreicher |
| | | Principal Executive Officer |
| |
| Date | | January 16, 2020 | | | | |
| |
| |
| By | | /s/ Catherine D. Mathews |
| | | Catherine D. Mathews |
| | | Principal Financial Officer |
| |
| Date | | January 16, 2020 | | | | |