1
© PPL Corporation 2011
PPL Corporation
4th Quarter Earnings Call
February 4, 2011
Exhibit 99.2
2
© PPL Corporation 2011
Any statements made in this presentation about future operating
results or other future events are forward-looking statements under
the Safe Harbor Provisions of the Private Securities Litigation Reform
Act of 1995. Actual results may differ materially from such forward-
looking statements. A discussion of factors that could cause actual
results or events to vary is contained in the Appendix to this
presentation and in the Company’s SEC filings.
Cautionary Statements and Factors
That May Affect Future Results
3
© PPL Corporation 2011
J. H. Miller
P. A. Farr
W. H. Spence
Agenda
Fourth Quarter 2010 Earnings and 2011 Earnings
Forecast and Outlook
Operational Review
Segment Results and Financial Overview
Q&A
4
© PPL Corporation 2011
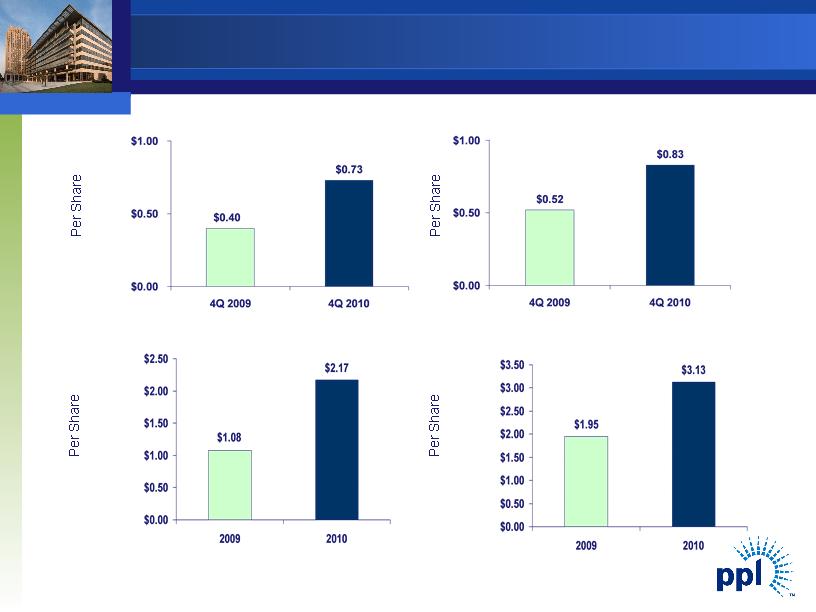
Fourth Quarter
Reported Earnings
Fourth Quarter
Earnings from Ongoing Operations
Note: See Appendix for the reconciliation of earnings from ongoing operations to reported earnings.
Year-to-Date
Reported Earnings
Year-to-Date
Earnings from Ongoing Operations
Earnings Results
5
© PPL Corporation 2011
PPL: Poised for Additional Growth
§ Three high-performing utilities with tangible rate
base growth
§ Well-positioned supply business with in-the-money
hedges and growth as market recovers
§ Strong track record of execution
6
© PPL Corporation 2011
$3.13
$2.60
$/Share
(1) See appendix for reconciliation of earnings from ongoing operations to reported earnings.
(2) Based on mid-point of forecasted earnings range.
(1)
(2)
$2.40
73%
27%
50%
50%
2010A
2011E
2011 Earnings Forecast
7
© PPL Corporation 2011
Our Strengths
§ Strong regulatory relationships
§ Best in class reliability, customer service
§ Strong operating performance - regulated and
competitive
§ Strong carbon and other environmental position
§ Excellent cost-management
§ Knowledgeable, dedicated employees
§ Strong dividend with opportunity for growth
8
© PPL Corporation 2011
PPL Corporation
9
© PPL Corporation 2011
Kentucky Regulated Segment
Key Business and Value Drivers
§ Excellent customer service
§ Superior cost position and operational excellence
§ Constructive regulatory environment
§ Low rates and an opportunity for growth
LG&E and KU Are Among Best Performing Utilities in the U.S.
10
© PPL Corporation 2011
Significant EPA Regulations Impacting Kentucky
§ Environmental compliance spending associated with coal
combustion is recoverable through the ECR.
§ $2.9 billion recovered via mechanism since inception
§ NOx, SO2, Mercury, Particulate Regulations will increase capital
spending.
§ Exact remediation and incremental cost will not be known until final
regulations on all pollutants are completed.
11
© PPL Corporation 2011
Current State of Environmental Controls
Kentucky Regulated Major Coal Plant Sites
(1) Dry handling disposal construction approved by KPSC and permitting underway at Trimble and Ghent.
(2) Wet ash impoundments exist at all plants.
(3) Construction underway. Scheduled to be in service 2012.
P= Installed
P = Under consideration
12
© PPL Corporation 2011
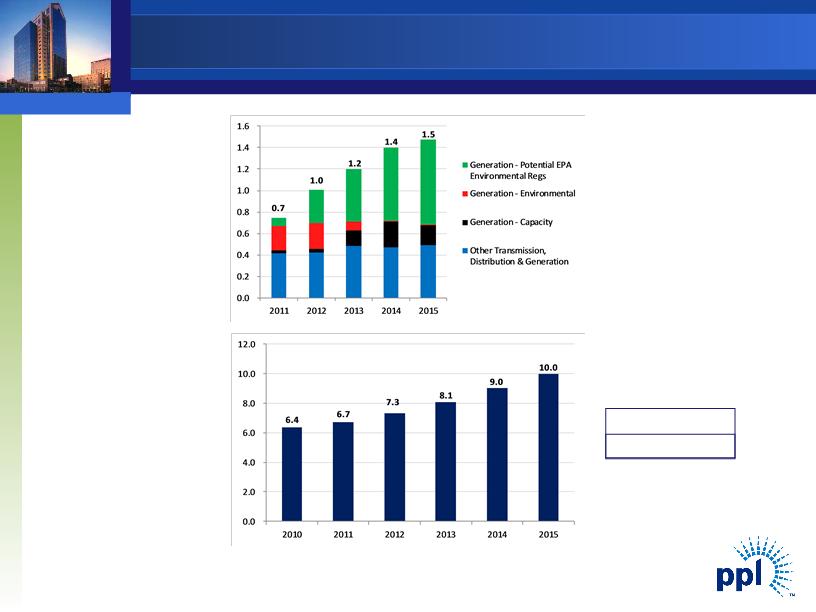
Estimated
Annual CAPEX
$ Billions
Estimated Rate
Base (Utility
Capitalization) (1)
$ Billions
CAGR (2011-2015)
10.5%
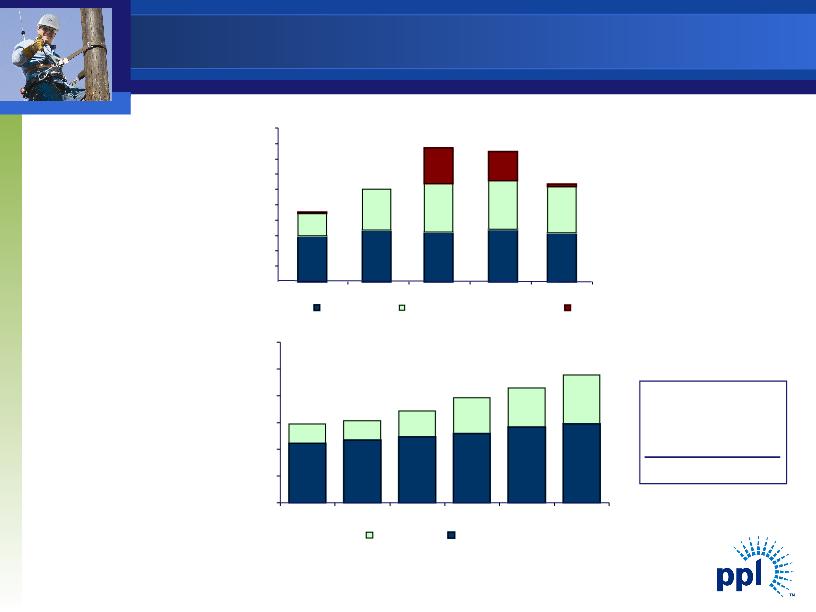
Kentucky Regulated Capital
Expenditures and Rate Base Growth
(1) Represents year-end amounts
6.4 6.7 7.3 8.1 9.0 10.0 0.0 2.0 4.0 6.0 8.0 10.0 12.0 2010 2011 2012 2013 2014 2015 Estimated Annual CAPEX $ Billions Estimated Rate Base (Utility Capitalization) (1) $ Billions CAGR (2011-2015) 10.5% Kentucky Regulated Capital Expenditures and Rate Base Growth (1) Represents year-end amounts 0.7 1.0 1.2 1.4 1.5 0.0 0.2 0.4 0.6 0.8 1.0 1.2 1.4 1.6 2011 2012 2013 2014 2015 Generation -Potential EPA Environmental Regs Generation -Environmental Generation -Capacity Other Transmission, Distribution & Generation
14
© PPL Corporation 2011
International Regulated Segment
Key Business and Value Drivers
§ Electricity distribution businesses are regulated by the UK’s Office of Gas and
Electricity Markets (Ofgem).
§ Current price control period is April 1, 2010 to March 31, 2015.
§ Business growth is driven by capital investment in aging infrastructure and
load-related assets.
§ $2.0 billion investment in current price control period (2010 - 2015); 31%
higher than previous price control period.
§ Regulatory Incentive mechanisms provide opportunity for enhanced returns.
§ Customer service and reliability.
§ Cost efficiency.
§ $240 million awarded during DPCR5 and $130 million awarded during
DPCR4 reviews
15
© PPL Corporation 2011
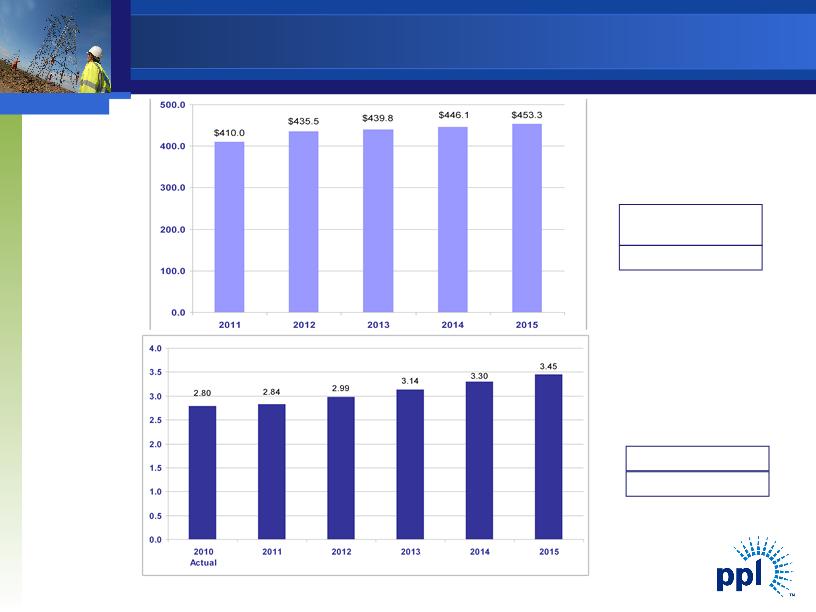
International Regulated Segment
Capital Expenditures and Rate Base Growth
CAGR (2011-2015)
5.0%
Regulatory Period
(DPCR5)
$2.0 BB
(1) Represents year-end amounts
Estimated
Annual CAPEX
$ Millions
Estimated
RAV (1)
$ Billions
16
© PPL Corporation 2011
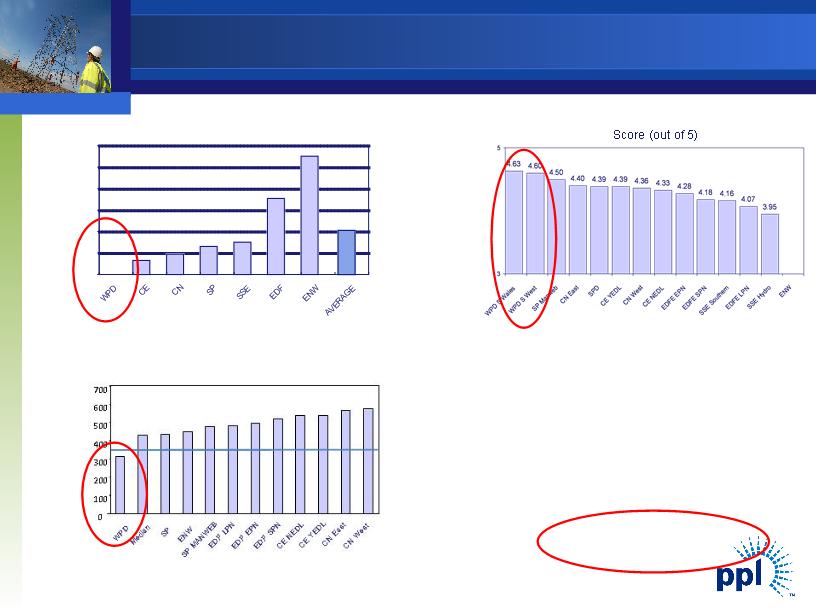
Outstanding Operational Performance
Ombudsman Complaints
Complaints to Ombudsman per 100,000 customers
Ofgem Telephony Incentive Scheme
1 Hour Restoration Rate
Year ended 31 March 1999 - 51.9%
Year ended 31 March 2001 - 57.6%
Year ended 31 March 2003 - 80.0%
Year ended 31 March 2005 - 84.8%
Year ended 31 March 2007 - 84.6%
Year ended 31 March 2008 - 85.5%
Year ended 31 March 2009 - 86.3%
Year to date 31 December 2010 - 87.4%
Best in UK
0.00
0.13
0.19
0.26
0.30
0.71
1.10
0.41
0.00
0.20
0.40
0.60
0.80
1.00
1.20
Capex Efficiency in DPCR5
Performance against Peers
16 Outstanding Operational Performance Ombudsman Complaints Complaints to Ombudsman per 100,000 customers Ofgem Telephony Incentive Scheme Score (out of 5) 4.63 4.60 4.50 4.40 4.39 4.39 4.36 4.33 4.28 4.18 4.16 4.07 3.95 3 5 WPDSWales WPDSWest SPManweb CNEast SPD CEYEDL CNWest CENEDL EDFEEPN EDFESPN SSESouthern EDFELPN SSEHydro ENW 1 Hour Restoration Rate &# 160;Year ended 31 March 1999 -51.9% Year ended 31 March 2001 -57.6% Year ended 31 March 2003 -80.0% Year ended 31 March 2005 -84.8% Year ended 31 March 2007 -84.6% Year ended 31 March 2008 -85.5% Year ended 31 March 2009 -86.3% Year to date 31 December 2010 -87.4% Best in UK 0.00 0.13 0.19 0.26 0.30 0.71 1.10 0.41 0.00 0.20 0.40 0.60 0.80 1.00 1.20 WPD CE CN SP SSE EDF ENW AVERAGE Capex Efficiency in DPCR5 Performance against Peers
17
© PPL Corporation 2011
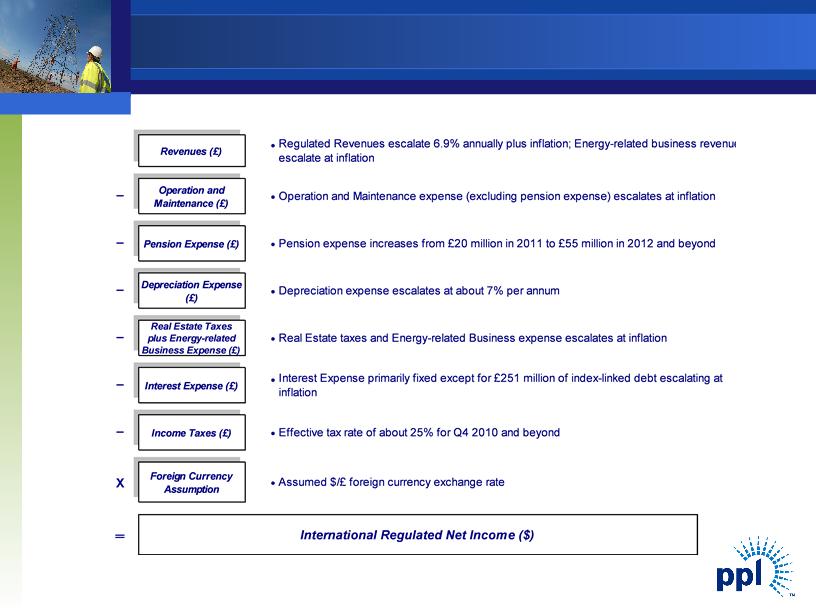
International - Modeling Parameters
17 International -Modeling Parameters X - . International Regulated Net Income ($) Foreign Currency Assumption .Assumed $/£ foreign currency exchange rate Interest Expense (£) Income Taxes (£) Depreciation expense escalates at about 7% per annum Interest Expense primarily fixed except for £251 million of index-linked debt escalating at inflation . . Effective tax rate of about 25% for Q4 2010 and beyond Real Estate taxes and Energy-related Business expense escalates at inflation Depreciation Expense (£) Real Estate Taxes plus Energy-related Business Expense (£) Revenues (� 3;) . Regulated Revenues escalate 6.9% annually plus inflation; Energy-related business revenue escalate at inflation . Operation and Maintenance expense (excluding pension expense) escalates at inflation Pension expense increases from £20 million in 2011 to £55 million in 2012 and beyond Operation and Maintenance (£) Pension Expense (£)
19
© PPL Corporation 2011
PA Regulated Segment Key Business
and Value Drivers
§ Superior customer service -
§ 16th JD Power awards, most in nation
§ 1st place JD Power East Region Large Utilities -
Business Customers
§ 83% “very satisfied” with customer transactions
§ Constructive regulatory relationships
§ Attractive future rate base investment
opportunities to support reliability
§ Rate Base growth from $3.0 Billion in 2010 to
$4.8 Billion in 2015
20
© PPL Corporation 2011
$1,000
100
200
300
400
500
600
700
800
900
2011
2012
2013
2014
2015
Distribution
Transmission (excluding S-R)
Susquehanna-Roseland
$452
$629
$868
$821
$667
CAGR (2011-2015)
Distribution = 6.5%
Transmission = 22.5%
Combined = 11.6%
$3,113
$3,410
$3,932
$4,391
$4,833
$2,998
$797
$862
$995
$1,357
$1,639
$1,938
$2,201
$2,251
$2,415
$2,575
$2,752
$2,895
$0
$1,000
$2,000
$3,000
$4,000
$5,000
$6,000
2010
2011
2012
2013
2014
2015
Transmission
Distribution
Estimated
Annual CAPEX
$ Millions
Estimated Rate
Base (Utility
Capitalization) (1)
$ Millions
(1) Represents year-end amounts
PA Regulated Segment
Capex and Rate Base Growth
21
© PPL Corporation 2011
PPL Generation
PPL EnergyPlus
22
© PPL Corporation 2011
Supply Segment Key Business
and Value Drivers
§ Our efficient, diverse generating fleet with the ability
to meet proposed EPA regulations without
substantial increase in capital or operating cost
§ Our ability to control spending and optimize
operations in a low commodity business cycle
§ Current and future capacity additions to our low cost,
carbon-free nuclear and hydro facilities
§ Our active hedging strategy to protect and enhance
the value of our competitive generation fleet
§ Improved supply/demand fundamentals
23
© PPL Corporation 2011
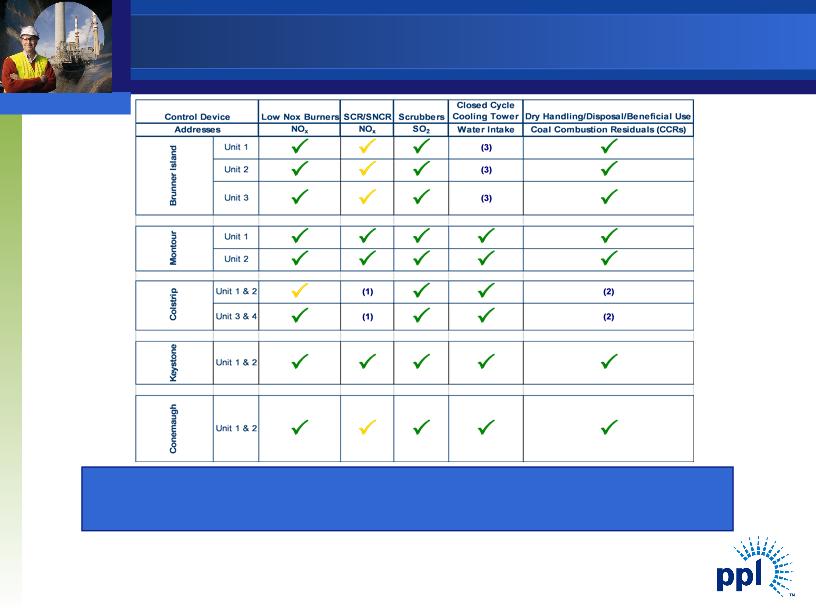
Actively Managing Environmental Uncertainty
P= Installed
P = Under
Consideration
PPL’s proactive approach to environmental compliance has
made the EPA’s pending regulations manageable
(1) At this time we believe that SCR/SNCRs are not required at Colstrip to meet the proposed NOx emission units.
(2) PPL has begun to assess dry handling/disposal of CCRs at Colstrip.
(3) If required, once through cooling towers could be converted to closed cycle.
24
© PPL Corporation 2011
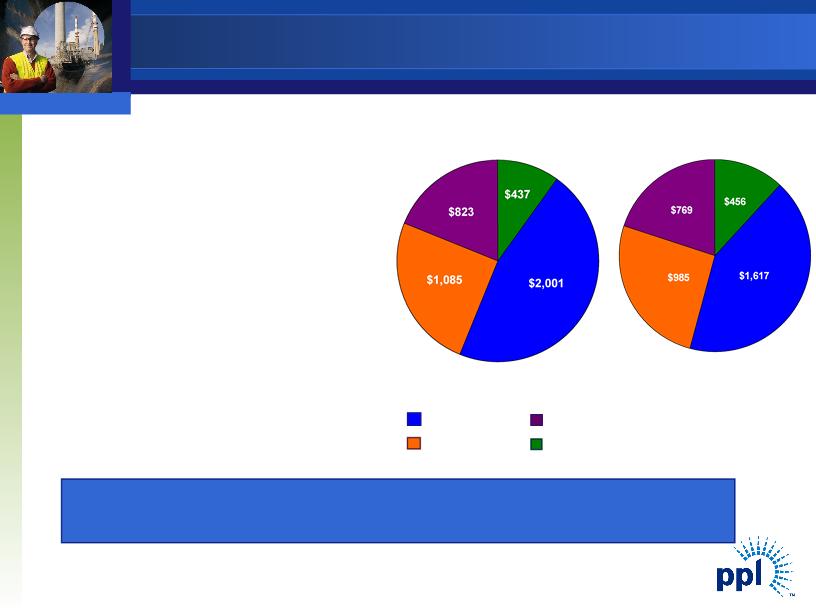
PPL’s proactive approach to controlling spending and optimizing
operations is maximizing value
Total 2010-2014:
$3,827
Previous
Plan
Sustenance
Growth
Nuclear Fuel
Environmental & Regulatory
Total 2010-2014:
$4,346
Current
Plan
§ Controlling Capital
§ Reducing capital spending by
over $500 million over the 5
year plan
§ Optimizing Operation
§ Operating at minimums during
low priced off-peak periods
§ Reducing unit minimums
§ Analyzing fuel options
§ Controlling operating costs
Operating in a Down Commodity Cycle
25
© PPL Corporation 2011
Capacity revenues are expected to be $430 million, $385 million and $590 million for 2011, 2012 and 2013, respectively.
As of December 31, 2010
(1) Represents expected sales based on current business plan assumptions.
(2) The 2011 average hedge energy prices are based on the fixed price swaps as of December 31, 2010; the prior collars have all been converted to fixed swaps.
(3) The 2012 ranges of average energy prices for existing hedges were estimated by determining the impact on the existing collars resulting from 2012 power prices at
the 5th and 95th percentile confidence levels.
| | | 2011 | | 2012 | | |
Baseload | | | | | | | |
Expected Generation(1) (Million MWhs) | | | 51.4 | | 54.7 | | |
East | | | 43.1 | | 46.2 | | |
West | | | 8.3 | | 8.5 | | |
| | | | | | | |
Current Hedges (%) | | | 99% | | 68% | | |
East | | | 100% | | 63% | | |
West | | | 95% | | 94% | | |
| | | | | | | |
Average Hedged Price (Energy Only) ($/MWh) (2) (3) | | | | | | | |
East | | | $56 | | $59-61 | | |
West | | | $54 | | $53-54 | | |
| | | | | | | |
Current Coal Hedges (%) | | | 99% | | 96% | | |
East | | | 99% | | 94% | | |
West | | | 100% | | 100% | | |
| | | | | | | |
Average Hedged Consumed Coal Price (Delivered $/Ton) | | | | | | | |
East | | | $73-74 | | $76-80 | | |
West | | | $23-28 | | $23-29 | | |
| | | | | | | |
Intermediate/Peaking | | | | | | | |
Expected Generation(1) (Million MWhs) | | | 6.0 | | 6.2 | | |
Current Hedges (%) | | | 34% | | 7% | | |
Enhancing Value Through Active Hedging
26
© PPL Corporation 2011
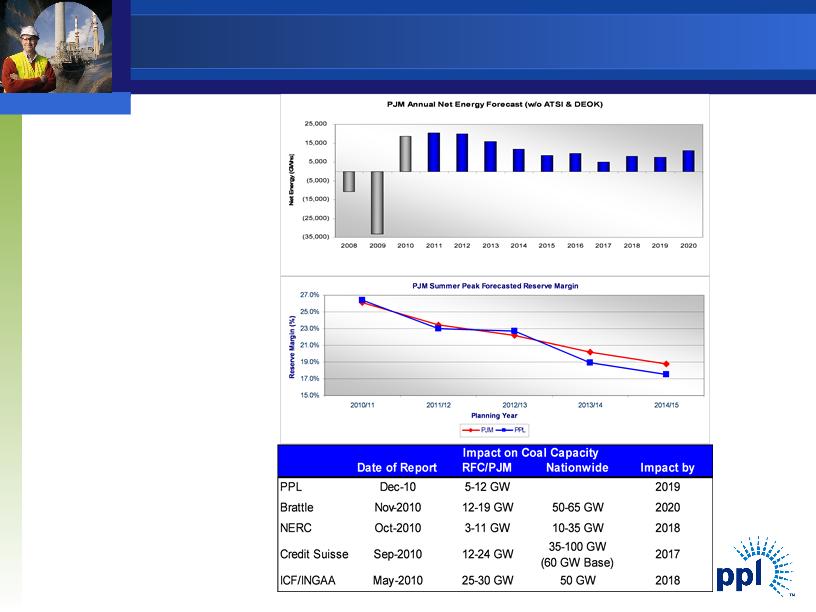
Source: PJM Load Forecast Report (December 28, 2010)
ATSI - First Energy
DEOK - Duke Energy Ohio & Kentucky
Supply & Demand - Catalysts for Growth
§ Economic recovery driving
increases in electric
demand
§ Existing forward prices
provide little incentive to
build
§ Proposed EPA regulations
are expected to be a net
benefit given our mix of
generation
26 Date of Report RFC/PJM Nationwide Impact by PPL Dec-10 5-12 GW 2019 Brattle Nov-2010 12-19 GW 50-65 GW 2020 NERC Oct-2010 3-11 GW 10-35 GW 2018 Credit Suisse Sep-2010 12-24 GW 35-100 GW (60 GW Base) 2017 ICF/INGAA May-2010 25-30 GW 50 GW 2018 Impact on Coal Capacity Supply & Demand -Catalysts for Growth .Economic recovery driving increases in electric demand .Existing forward prices provide little incentive to build .Proposed EPA regulations are expected to be a net benefit given our mix of generation PJM Summer Peak Forecasted Reserve Margin&# 160; 15.0% 17.0% 19.0% 21.0% 23.0% 25.0% 27.0% 2010/11 2011/12 2012/13 2013/14 2014/15 Planning Year Reserve Margin (%) PJM PPL PJM Annual Net Energy Forecast (w/o ATSI & DEOK) (35,000) (25,000) (15,000) (5,000) 5,000 15,000 25,000 2008 2009 2010 2011 2012 2013 2014 2015 2016 2017 2018 2019 2020 Net Energy(GWhs) Source: PJM Load Forecast Report (December 28, 2010) ATSI – First Energy DEOK – Duke Energy Ohio & Kentucky
27
© PPL Corporation 2011
Financial Overview
28
© PPL Corporation 2011
| Q4 | | Q4 | | |
| 2010 | | 2009 | | Change |
Kentucky Regulated | $0.07 | | $0.00 | | $0.07 |
International Regulated | 0.07 | | 0.18 | | (0.11) |
Pennsylvania Regulated | 0.05 | | 0.09 | | (0.04) |
Supply | 0.64 | | 0.25 | | 0.39 |
Total | $0.83 | | $0.52 | | $0.31 |
| | | | | |
| | | | | |
Note: See Appendix for the reconciliation of earnings from ongoing operations to reported earnings. |
| 2010 | | 2009 | | Change |
Kentucky Regulated | $0.06 | | $0.00 | | $0.06 |
International Regulated | 0.53 | | 0.72 | | (0.19) |
Pennsylvania Regulated | 0.27 | | 0.35 | | (0.08) |
Supply | 2.27 | | 0.88 | | 1.39 |
Total | $3.13 | | $1.95 | | $1.18 |
| | | | | |
| | | | | |
Ongoing Earnings Overview
29
© PPL Corporation 2011
Note: See Appendix for the reconciliation of earnings from ongoing operations to reported earnings. |
| 2010 |
2009 EPS - Ongoing Earnings | | $0.72 |
Delivery Revenue | 0.08 | |
O&M | (0.09) | |
Financing | (0.10) | |
Effect of Exchange Rates | 0.04 | |
Income Taxes & Other | (0.05) | |
Dilution | (0.07) | |
Total | | (0.19) |
2010 EPS - Ongoing Earnings | | $0.53 |
International Regulated Segment
Earnings Drivers
30
© PPL Corporation 2011
Note: See Appendix for the reconciliation of earnings from ongoing operations to reported earnings. |
| 2010 |
2009 EPS - Ongoing Earnings | | $0.35 |
O&M | (0.06) | |
Other | 0.01 | |
Dilution | (0.03) | |
Total | | (0.08) |
2010 EPS - Ongoing Earnings | | $0.27 |
Pennsylvania Regulated Segment
Earnings Drivers
31
© PPL Corporation 2011
Note: See Appendix for the reconciliation of earnings from ongoing operations to reported earnings. |
| 2010 |
2009 EPS - Ongoing Earnings | | $0.88 |
Margins - East | 1.56 | |
Margins - West | 0.03 | |
O&M | (0.08) | |
Depreciation | (0.07) | |
Income Taxes & Other | 0.24 | |
Discontinued Operations | 0.04 | |
Dilution | (0.33) | |
Total | | 1.39 |
2010 EPS - Ongoing Earnings | | $2.27 |
Supply Segment
Earnings Drivers
32
© PPL Corporation 2011
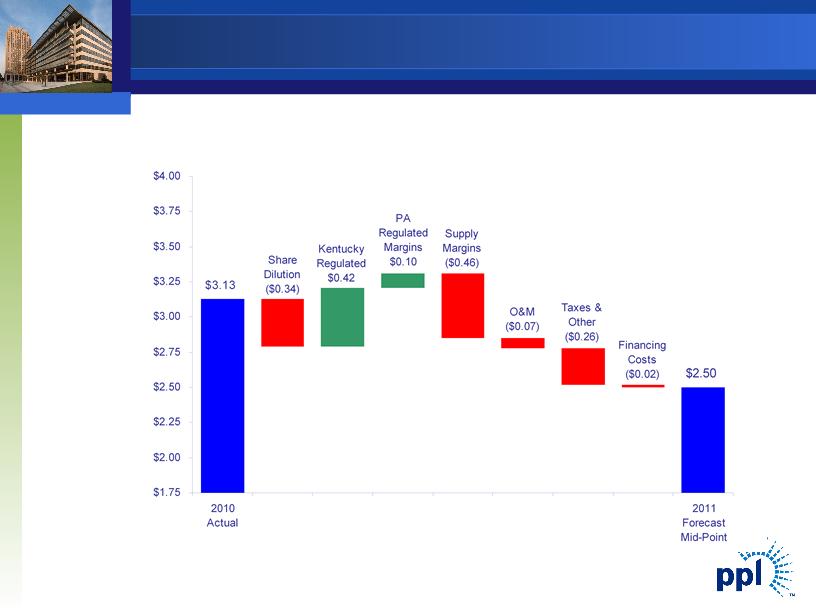
Earnings Per Share
2010 to 2011 Earnings Walk
32 2010 to 2011 Earnings Walk $2.50 Taxes & Other ($0.26) O&M ($0.07) Supply Margins ($0.46) PA Regulated Margins $0.10 Financing Costs ($0.02) Share Dilution ($0.34) Kentucky Regulated $0.42 $3.13 $1.75 $2.00 $2.25 $2.50 $2.75 $3.00 $3.25 $3.50 $3.75 $4.00 2010 Actual 2011 Forecast Mid-Point Earnings Per Share
33
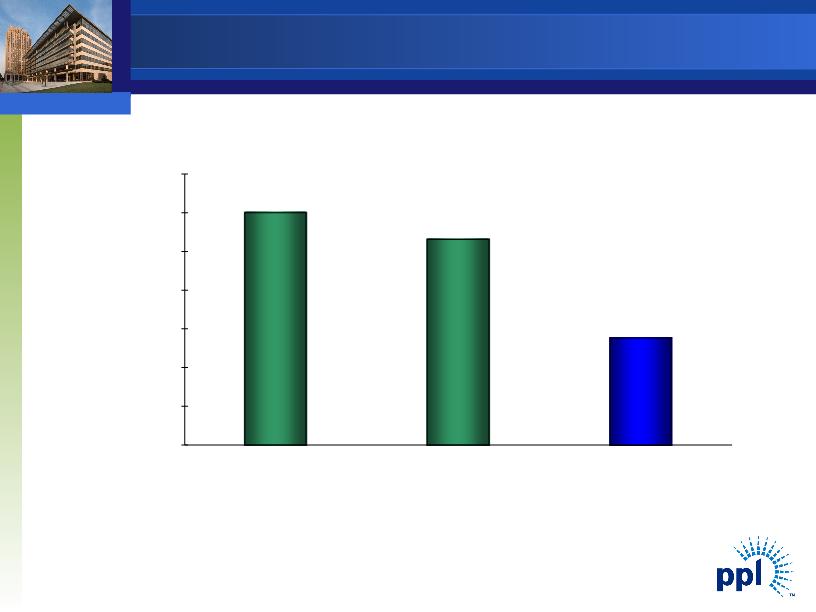
© PPL Corporation 2011
Millions of Dollars
2010 Free Cash Flow includes two months of the results of the Kentucky
Regulated segment
Note: See Appendix for reconciliation of free cash flow before dividends to cash from operations.
$600
$531
$275
$0
$100
$200
$300
$400
$500
$600
$700
2009
Actual
2010
Actual
2011
Forecast
Free Cash Flow before Dividends
34
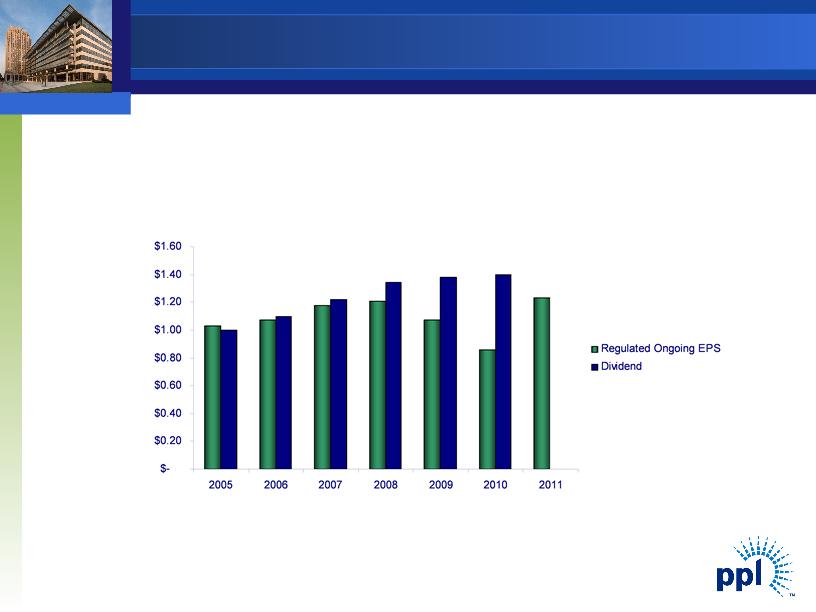
© PPL Corporation 2011
$/Share
Annualized
A significantly more rate-regulated business mix provides strong
support for current dividend and a platform for future growth
(1) Regulated EPS based on mid-point of forecast. Dividend to be determined by Board of Directors.
(1)
Dividend Profile
35
© PPL Corporation 2011
Key Expected Earnings Drivers - 2012 and 2013
§ Higher domestic regulated earnings as a result of higher rate bases and planned
distribution rate filings
§ Continued benefits from WPD’s current distribution price control review
§ Lower Supply margins as a result of depressed energy prices
§ Higher O&M
§ Positive Fundamentals in Supply
§ Heat rate expansion
§ Load recovery
36
© PPL Corporation 2011
Appendix
37
© PPL Corporation 2011
Kentucky Rate Mechanisms
§Fuel Adjustment Clause (FAC) - Collects or refunds difference between base
rate fuel component and actual fuel cost monthly with a two-month lag
§Gas Supply Clause (GSC) - Actual cost of gas supply passed through to
customers with rates reset quarterly based on projected cost with balancing
mechanism
§ Performance-Based Rate Component - Utility retains 25% of savings vs.
benchmark gas costs
§ Weather Normalization Adjustment (WNA) - Applies to residential and
commercial gas customers during winter months
§Environmental Cost Recovery Surcharge (ECR) - Entitled to recovery of and
on costs of complying with environmental regulations with a two-month lag
§Construction Work in Progress (CWIP) - Recovery on CWIP included in base
rates and ECR
§Demand-Side Management Cost Recovery Mechanism (DSMRM) - Provides
for concurrent recovery of DSM costs and provides incentive for implementing
DSM programs, including lost revenue
38
© PPL Corporation 2011
UK Electricity Distribution Regulation
§ Electricity distribution revenues are set through a Distribution Price Control
Review (DPCR) process.
§ Based on a forward looking assessment of income sufficient to finance
an efficient business.
§ Revenues cover operating and capital costs at an efficient level for the
service territory.
§ Efficiency is determined through a detailed comparable analysis of all UK
electricity distribution companies.
§ Annual adjustments for inflation
§ An incentive / penalty arrangement exists for reliability and customer
service levels.
§ The revenue that a company can earn in each rate period is the sum of:
§ The Regulator’s view of efficient costs,
§ A return on the value of Regulated Asset Value (“RAV”),
§ A return of capital being the depreciation of the RAV, and
§ Incentive payments for performance.
§ Rate set through March 31, 2015.
39
© PPL Corporation 2011
Morony
Ryan
Cochrane
Rainbow
Black Eagle
Kerr
Thompson Falls
Holter
Hauser
Madison
Mystic Lake
Corette
Colstrip
Montour
Keystone
Conemaugh
Lake
Wallenpaupack
Susquehanna
Martins Creek
Lower Mount Bethel
Ironwood
Brunner
Island
Holtwood
Hydro
Coal
Nuclear
Gas/Oil
Renewables
Key
Montana
Generating capacity - 1,278 MW
Madison
Morony
Mystic Lake
Rainbow
Ryan
Thompson Falls
Other generating stations
Pennsylvania
Generating capacity - 9,482 MW
Susquehanna
Conemaugh
Keystone
Ironwood
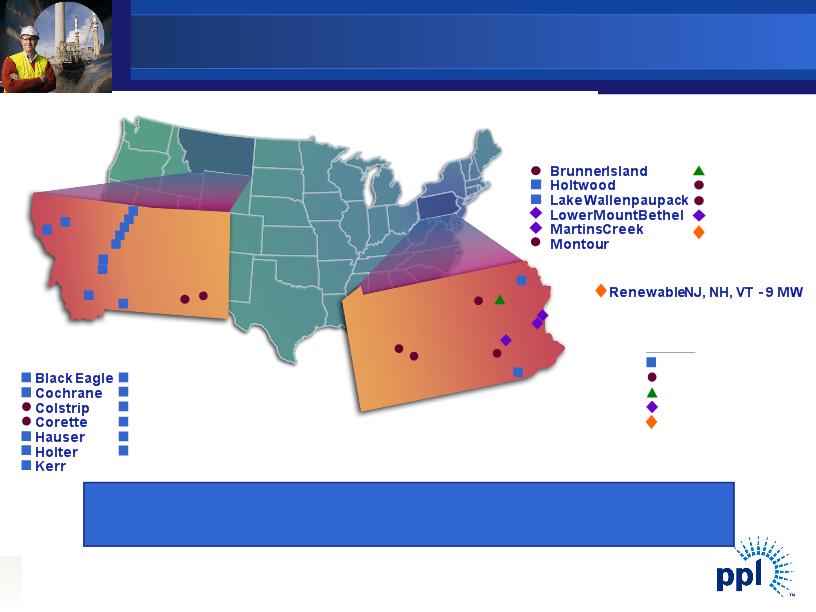
Diverse Competitive Generation Portfolio
Our size, location and diverse mix of competitive generation
gives us flexibility to adapt in a variety of market conditions
Renewable
39 Morony Ryan Cochrane Rainbow Black Eagle Kerr Thompson Falls Holter Hauser Madison Mystic Lake Corette Colstrip Montour Keystone Conemaugh Lake Wallenpaupack Susquehanna Martins Creek Lower Mount Bethel Ironwood Brunner Island Holtwood HydroCoal Nuclear Gas/Oil Renewables Key Montana Generating capacity – 1,278 MW Black Eagle Cochrane Colstrip Corette Hauser Holter Kerr Madison Morony Mystic Lake Rainb ow Ryan Thompson Falls Other generating stations Renewable NJ, NH, VT – 9 MW Pennsylvania Generating capacity – 9,482 MW Brunner Island Holtwood Lake Wallenpaupack Lower Mount Bethel Martins Creek Montour Susquehanna Conemaugh Keystone Ironwood Diverse Competitive Generation Portfolio Our size, location and diverse mix of competitive generation gives us flexibility to adapt in a variety of market conditions Renewable
40
© PPL Corporation 2011
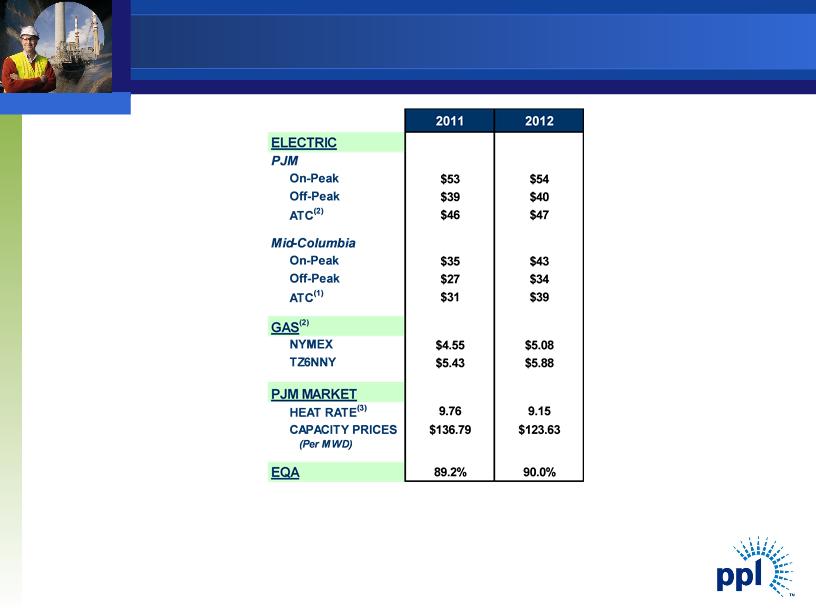
Market Prices
| |
(1) | 24-hour average |
(2) | NYMEX and TZ6NNY forward gas prices on 12/31/2010 |
(3) | Market Heat Rate = PJM on-peak power price divided by TZ6NNY gas price |
40 Market Prices 2011 2012 $53 $54 $39 $40 $46 $47 $35 $43 $27 $34 $31 $39 $4.55 $5.08 $5.43 $5.88 9.76 9.15 $136.79 $123.63 89.2% 90.0% (Per MWD) EQA HEAT RATE(3) TZ6NNY PJM MARKET ATC(1) NYMEX GAS(2) CAPACITY PRICES Mid-Columbia On-Peak Off-Peak ATC(2) ELECTRIC PJM On-Peak Off-Peak (1) 24-hour average (2) NYMEX and TZ6NNY forward gas prices on 12/31/2010 (3) Market Heat Rate = PJM on-peak power price divided by TZ6NNY gas price
41
© PPL Corporation 2011
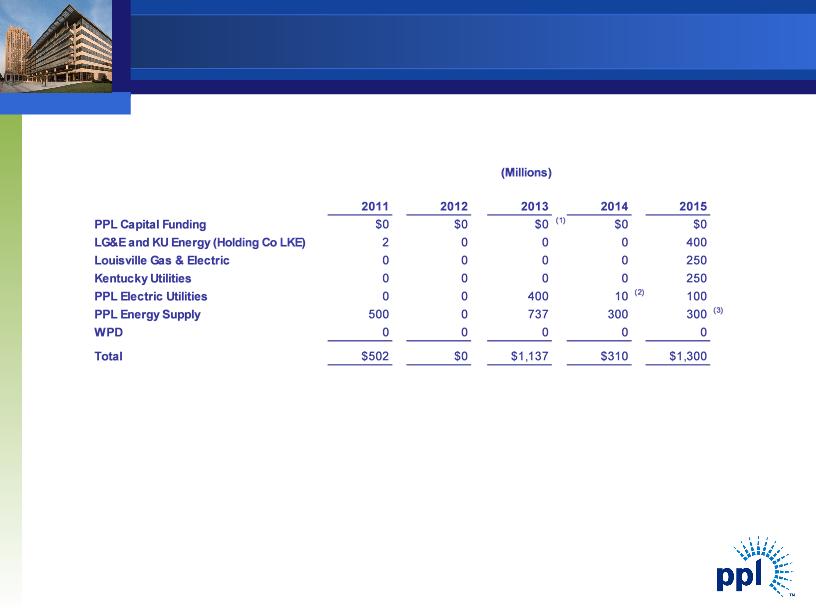
Note: As of December 31, 2010
(1) Excludes $1.15 billion of junior subordinated notes due 2018 that are a component of PPL’s Equity Units and may be
put back to PPL Capital Funding if the remarketing in 2013 is not successful.
(2) Bonds defeased in substance in 2008 by depositing sufficient funds with the trustee.
(3) Represents REset Put Securities due 2035 that are required to be put by the holders in October 2015 either for (a)
purchase and remarketing by a remarketing dealer or (b) repurchase by PPL Energy Supply.
Debt Maturities
41 Debt Maturities Note: As of December 31, 2010 (1) Excludes $1.15 billion of junior subordinated notes due 2018 that are a component of PPL’s Equity Units and may be put back to PPL Capital Funding if the remarketing in 2013 is not successful (2) Bonds defeased in substance in 2008 by depositing sufficient funds with the trustee (3) Represents REset Put Securities due 2035 that are required to be put by the holders in October 2015 either for (a) purchase and remarketing by a remarketing dealer or (b) repurchase by PPL Energy Supply. 2011 2012 2013 2014 2015 PPL Capital Funding $0 $0 $0 (1) $0 $0 LG&E and KU Energy (Holding Co LKE) 2 0 0 0 400 ; Louisville Gas & Electric 0 0 0 0 250 Kentucky Utilities 0 0 0 0 250 PPL Electric Utilities 0 0 400 10 (2) 100 PPL Energy Supply 500 0 737 300 300 (3) WPD 0 0 0 0 0 Total $502 $0 $1,137 $310 $1,300 (Millions)
42
© PPL Corporation 2011
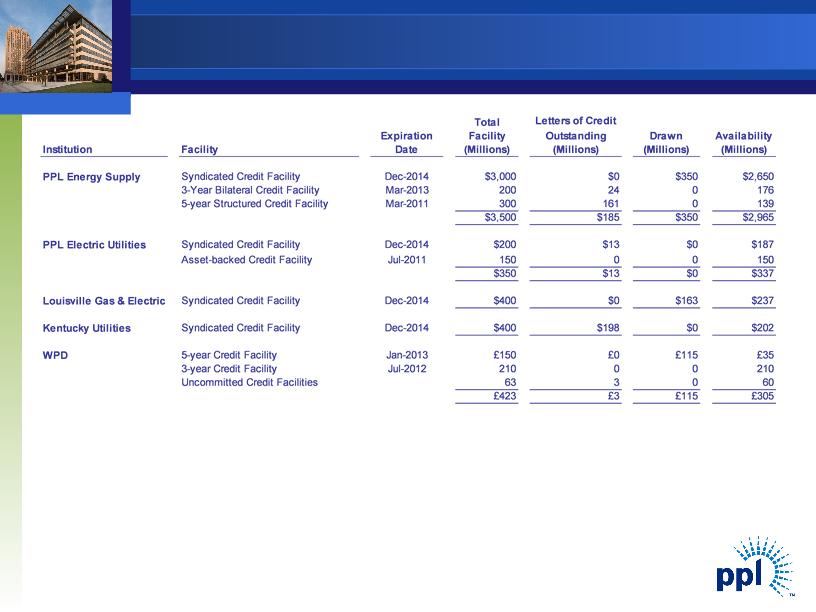
Domestic facilities consist of a diverse bank group, with no bank and its
affiliates providing an aggregate commitment of more than 12% of the total
committed capacity.
Liquidity Profile
42 Liquidity Profile Domestic facilities consist of a diverse bank group, with no bank and its affiliates providing an aggregate commitment of more than 12% of the total committed capacity. Institution Facility Expiration Date Total Facility (Millions) Letters of Credit Outstanding (Millions) Drawn (Millions) Availability (Millions) PPL Energy Supply Syndicated Credit Facility Dec-2014 $3,000 $0 $350 $2,650 3-Year Bilateral Credit Facility Mar-2013 200 24 0 176 5-year Structured Credit Facility Mar-2011 300 161 0 139 $3,500 $185 $350 $2,965 ;PPL Electric Utilities Syndicated Credit Facility Dec-2014 $200 $13 $0 $187 Asset-backed Credit Facility Jul-2011 150 0 0 150 $350 $13 $0 $337 Louisville Gas & Electric Syndicated Credit Facility Dec-2014 $400 $0 $163 $237 Kentucky Utilities Syndicated Credit Facility Dec-2014 $400 $198 $0 $202 WPD 5-year Credit Facility Jan-2013 £150 £0 £115 £35 3-year Credit Facility Jul-2012 210 0 0 210 Uncommitted Credit Facilities 63 3 0 60 £423 £3 £115 £305
43
© PPL Corporation 2011
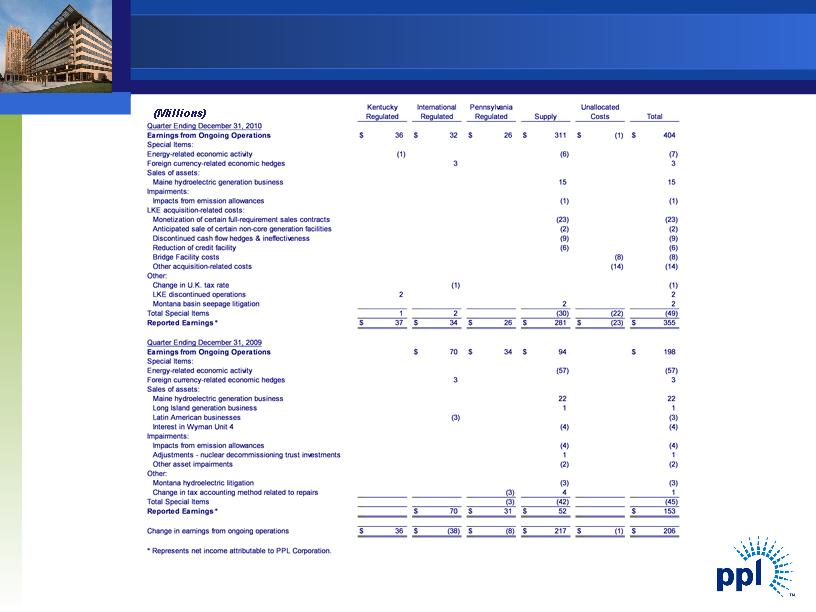
Reconciliation of Fourth Quarter Earnings from
Ongoing Operations to Reported Earnings
43 Reconciliation of Fourth Quarter Earnings from Ongoing Operations to Reported Earnings (Millions) Quarter Ending December 31, 2010 $ 36 $ 32 $ 26 $ 311 $ (1) $ 404 (1) (6) (7) 3 3 Maine hydroelectric generation business 15 15 Impacts from emission allowances (1) (1) Monetization of certain full-requirement sales contracts (23) (23) Anticipated sale of certain non-core generation facilities (2) (2) Discontinued cash flow hedges & ineffectiveness (9) (9) Reduction of credit facility (6) (6) Bridge Facility costs (8) (8) Other acquisition-related costs (14) (14) Change in U.K. tax rate (1) (1) LKE discontinued operations 2 2 Montana basin seepage litigation 2 2 1 2 (30) (22) (49) $ 37 $ 34 $ 26 $ 281 $ (23) $ 355 Quarter Ending December 31, 2009 $ 70 $ 34 $ 94 $ 198 (57) (57) 3 3 Maine hydroelectric generation business 22 22 Long Island generation business 1 1 Latin American businesses (3) (3) Interest in Wyman Unit 4 (4) (4) Impacts from emission allowances (4) (4) Adjustments -nuclear decommissioning trust investments 1 1 Other asset impairments (2) (2) Montana hydroelectric litigation (3) (3) Change in tax accounting method related to repairs (3) 4 1 (3) (42) (45) $ 70 $ 31 $ 52 $ 153 Change in earnings from ongoing operations $ 36 $ (38) $ (8) $ 217 $ (1) $ 206 * Represents net income attributable to PPL Corporation. Other: Total Special Ite ms Reported Earnings * Energy-related economic activity Foreign currency-related economic hedges Sales of assets: Impairments: Total Special Items Reported Earnings * Earnings from Ongoing Operations Special Items: Sales of assets: Impairments: LKE acquisition-related costs: Other: Earnings from Ongoing Operations Special Items: Energy-related economic activity Foreign currency-related economic hedges Regulated Supply Pennsylvania Kentucky International Regulated Regulated Unallocated Costs Total
44
© PPL Corporation 2011
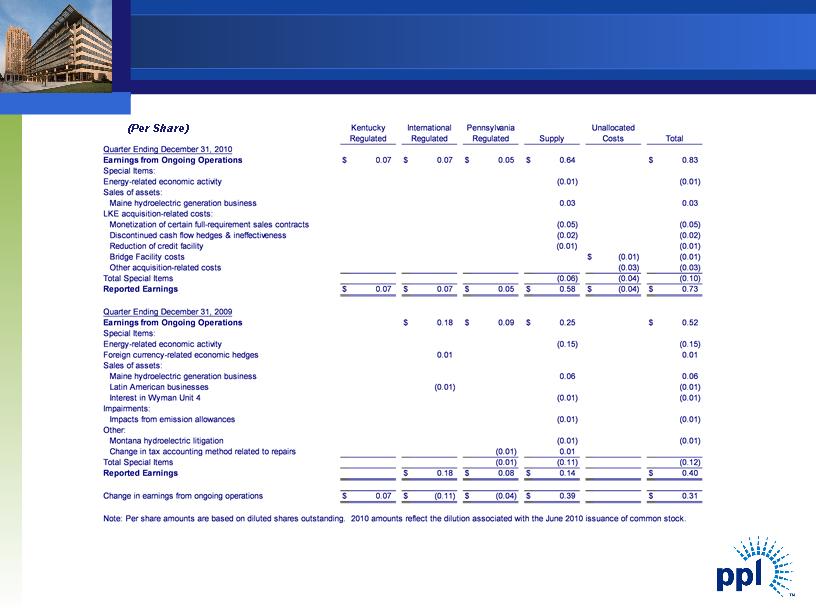
Reconciliation of Fourth Quarter Earnings from
Ongoing Operations to Reported Earnings
44 Reconciliation of Fourth Quarter Earnings from Ongoing Operations to Reported Earnings (Per Share) Quarter Ending December 31, 2010 $ 0.07 $ 0.07 $ 0.05 $ 0.64 $ 0.83 (0.01) (0.01) Maine hydroelectric generation business 0.03 0.03 Monetization of certain full-requirement sales contracts (0.05) (0.05) Discontinued cash flow hedges & ineffectiveness (0.02) (0.02) Reduction of credit facility (0.01) (0.01) Bridge Facility costs $ (0.01) (0.01) Other acquisition-related costs (0.03) (0.03) (0.06) (0.04) (0.10) $ 0.07 $ 0.07 $ 0.05 $ 0.58 $ (0.04) $ 0.73 Quarter Ending December 31, 2009 $ 0.1 8 $ 0.09 $ 0.25 $ 0.52 (0.15) (0.15) 0.01 0.01 Maine hydroelectric generation business 0.06 0.06 Latin American businesses (0.01) (0.01) Interest in Wyman Unit 4 (0.01) (0.01) Impacts from emission allowances (0.01) (0.01) Montana hydroelectric litigation (0.01) (0.01) Change in tax accounting method related to repairs (0.01) 0.01 (0.01) (0.11) (0.12) $ 0.18 $ 0.08 $ 0.14 $ 0.40 Change in earnings from ongoing operations $ 0.07 $ (0.11) $ (0.04) $ 0.39 $ 0.31 Note: Per share amounts are based on diluted shares outstanding. 2010 amounts reflect the dilution associated with the June 2010 issuance of common stock. Unallocated Costs Total Kentucky International Regulated Regulated Regulated Supply Pennsylvania Earnings from Ongoing Operations Special Items: Earnings from Ongoing Operations & #160;Special Items: Energy-related economic activity Sales of assets: LKE acquisition-related costs: Total Special Items Reported Earnings Total Special Items Reported Earnings Energy-related economic activity Foreign currency-related economic hedges Sales of assets: Impairments: Other:
45
© PPL Corporation 2011
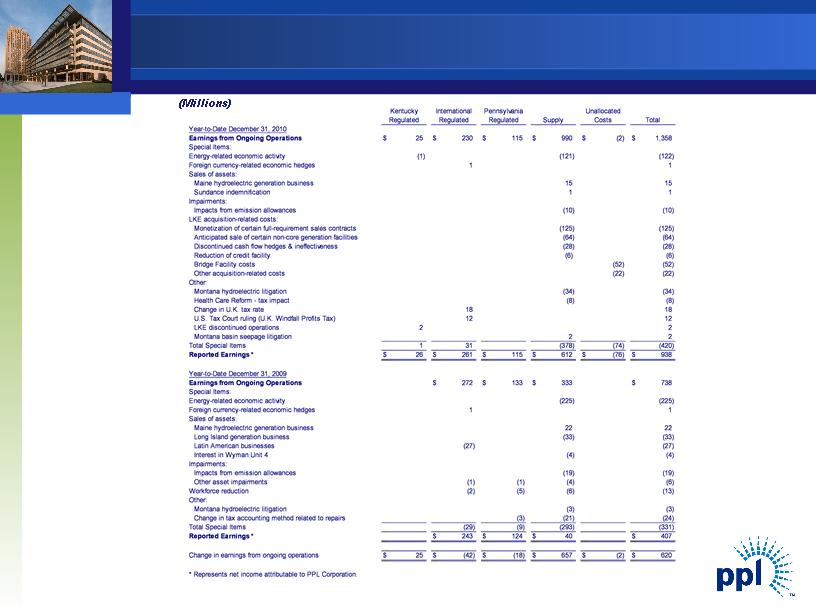
Reconciliation of Year-to-Date Earnings from
Ongoing Operations to Reported Earnings
45 Reconciliation of Year-to-Date Earnings from Ongoing Operations to Reported Earnings (Millions) Year-to-Date December 31, 2010 $ 25 $ 230 $ 115 $ 990 $ (2) $ 1,358 (1) (121) (122) 1 1 Maine hydroelectric generation business 15 15 Sundance indemnification 1 1 Impacts from emission allowances (10) (10) Monetization of certain full-requirement sales contracts (125) (125) Anticipated sale of certain non-core generation facilities (64) (64) Discontinued cash flow hedges & ineffectiveness (28) (28) Reduction of credit facility (6) (6) Bridge Facility costs (52) (52) Other acquisition-related c osts (22) (22) Montana hydroelectric litigation (34) (34) Health Care Reform -tax impact (8) (8) Change in U.K. tax rate 18 18 U.S. Tax Court ruling (U.K. Windfall Profits Tax) 12 12 LKE discontinued operations 2 2 Montana basin seepage litigation 2 2 1 31 (378) (74) (420) $ 26 $ 261 $ 115 $ 612 $ (76) $ 938 Year-to-Date December 31, 2009 $ 272 $ 133 $ 333 $ 738 (225) (225) 1 1 Maine hydroelectric generation business 22 22 Long Island generation business (33) (33) Latin American businesses (27) (27) Interest in Wyman Unit 4 (4) (4) Impacts from emission allowances (19) (19) Other asset impairments (1) (1) (4) (6) (2) (5) (6) (13) Montana hydroelectric litigation (3) (3) Change in tax accounting method related to repairs (3) (21) (24) (29) (9) (293) (331) $ 243 $ 124 $ 40 $ 407 Change in earnings from ongoing operations $ 25 $ (42) $ (18) $ 657 $ (2) $ 620 * Represents net income attributable to PPL Corporation. Unallocated Costs Total Kentucky International Regulated Regulated Regulated Supply Pennsylvania Earnings from Ongoing Operations Special Items: Energy-related economic activity Foreign currency-related economic hedges Sales of assets: Impairments: LKE acquisition-related costs: Other: Total Special Items Reported Earnings * Earnings from Ongoing Operations Special Items: Total Special Items Reported Earnings * Energy-related economic activity Foreign currency-related economic hedges Sales of assets: Impairments: Workforce reduction Other:
46
© PPL Corporation 2011
Reconciliation of Year-to-Date Earnings from
Ongoing Operations to Reported Earnings
46 Reconciliation of Year-to-Date Earnings from Ongoing Operations to Reported Earnings (Per Share) Year-to-Date December 31, 2010 $ 0.06 $ 0.53 $ 0.27 $ 2.27 $ 3.13 (0.27) (0.27) Maine hydroelectric generation business 0.03 0.03 Impacts from emission allowances (0.02) (0.02) Monetization of certain full-requirement sales contracts (0.29) (0.29) Anticipated sale of certain non-core generation facilities (0.14) (0.14) Discontinued cash flow hedges & ineffectiveness (0.06) (0.06) Reduction of credit facility (0.01) (0.01) Bridge Facility costs $ (0.12) (0.12) Other acquisition-related costs (0.05) (0.05) � 0;Montana hydroelectric litigation (0.08) (0.08) Health Care Reform -tax impact (0.02) (0.02) Change in U.K. tax rate 0.04 0.04 U.S. Tax Court ruling (U.K. Windfall Profits Tax) 0.03 0.03 0.07 (0.86) (0.17) (0.96) $ 0.06 $ 0.60 $ 0.27 $ 1.41 $ (0.17) $ 2.17 Year-to-Date December 31, 2009 $ 0.72 $ 0.35 $ 0.88 $ 1.95 (0.59) (0.59) Maine hydroelectric generation business 0.06 0.06 Long Island generation business (0.09) (0.09) Latin American businesses (0.07) (0.07) Interest in Wyman Unit 4 (0.01) (0.01) Impacts from emission allowances (0.05) (0.05) Other asset impairments (0.01) (0.01) (0.01) (0.01) (0.01) (0.03) Montana hydroelectric litigation (0.01) (0.01) Change in tax accounting method related to repairs (0.01) (0.06) (0.07) (0.08) (0.02) (0.77) (0.87) $ 0.64 $ 0.33 $ 0.11 $ 1.08 Change in earnings from ongoing operations $ 0.06 $ (0.19) $ (0.08) $ 1.39 $ 1.18 Note: Per share amounts are based on diluted shares outstanding. 2010 amounts reflect the dilution associated with the June 2010 issuance of common stock. Unallocated Earnings from Ongoing Operations Special Items: Earnings from Ongoing Operations Special Items: Energy-related economic activity Sales of assets: LKE acquisition-related costs: Other: Costs Total Kentucky International Regulated Regulated Regulated Supply Pennsylvania Impairments: Total Special Items Reported Earnings Total Special Items Reported Earnings Energy-related economic activity Sales of assets: Impairments: Workforce reduction Other:
47
© PPL Corporation 2011
(Per Share)
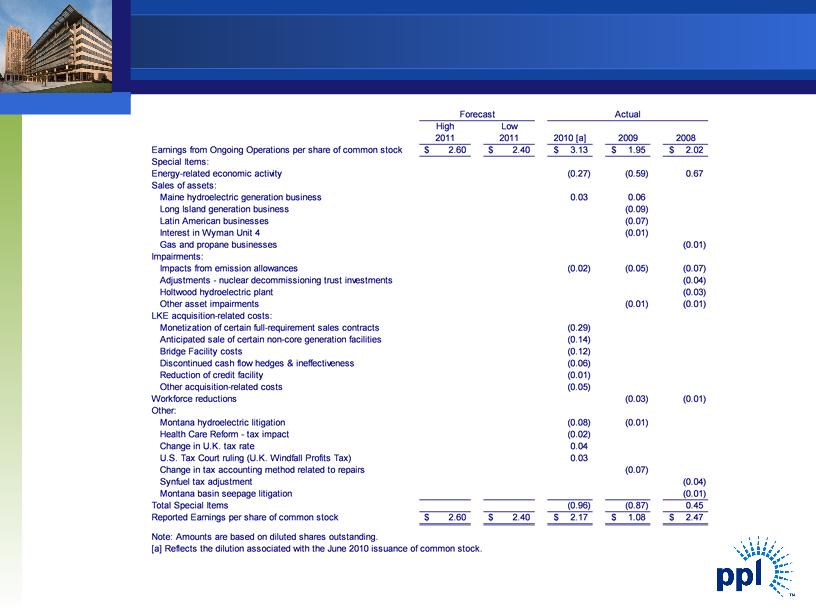
Reconciliation of PPL’s Earnings from Ongoing
Operations to Reported Earnings
47 Reconciliation of PPL’s Earnings from Ongoing Operations to Reported Earnings High Low 2011 2011 2010 [a] 2009 2008 Earnings from Ongoing Operations per share of common stock 2.60 $ 2.40 $ 3.13 $ 1.95 $ 2.02 $ Special Items: Energy-related economic activity (0.27) (0.59) 0.67 Sales of assets: Maine hydroelectric generation business 0.03 0.06 Long Island generation business (0.09) Latin American businesses (0.07) Interest in Wyman Unit 4 (0.01) Gas and propane businesses (0.01) Impairments: Impacts from emission allowances (0.02) (0.05) (0.07) Adjustments -nuclear decommissioning trust investments (0.04) Holtwood hydroelectric plant (0.03) Other asset impairments (0.01) (0.01) LKE acquisition-related costs: Monetization of certain full-requirement sales contracts (0.29) Anticipated sale of certain non-core generation facilities (0.14) Bridge Facility costs (0.12) Discontinued cash flow hedges & ineffectiveness (0.06) Reduction of credit facility (0.01) Other acquisition-related costs (0.05) Workforce reductions (0.03) (0.01) Other: Montana hydroelectric litigation (0.08) (0.01) Health Care Reform -tax impact (0.02) Change in U.K. tax rate 0.04 U.S. Tax Court ruling (U.K. Windfall Profits Tax) 0.03 Change in tax accounting method related to repairs (0.07) Synfuel tax adjustment (0.04) Montana basin seepage litigation (0.01) Total Special Items (0.96) (0.87) 0.45 Reported Earnings per share of common stock 2.60 $ 2.40 $ 2.17 $ 1.08 $ 2.47 $ Note: Amounts are based on diluted shares outstanding. [a] Reflects the dilution associated with the June 2010 issuance of common stock. Forecast Actual (Per Share)
48
© PPL Corporation 2011
A-10
(Millions of Dollars)
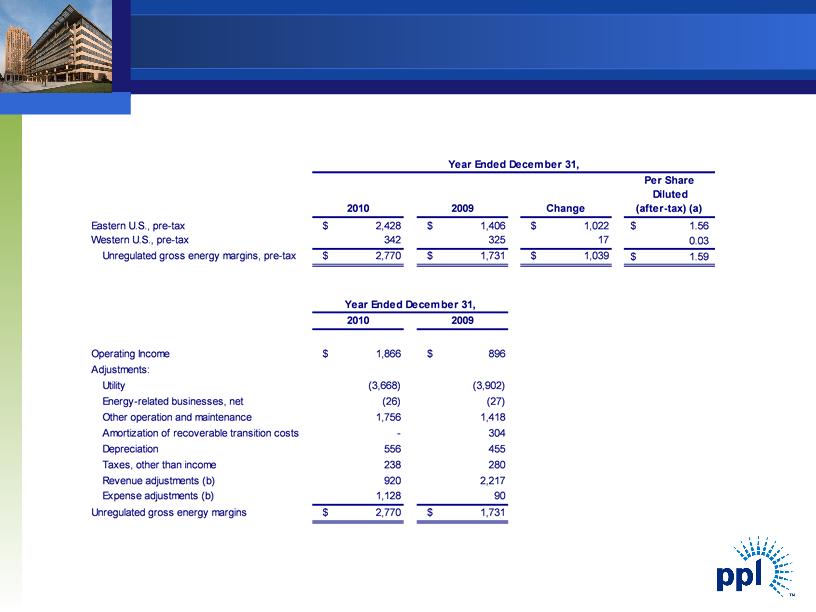
(a) Excludes dilution associated with the June 2010 issuance of common stock. (b) See additional information on the following slide. |
Reconciliation of Year-to-Date Operating Income
to Unregulated Gross Energy Margins
48 Reconciliation of Year-to-Date Operating Income to Unregulated Gross Energy Margins 2010 2009 Change Per Share Diluted (after-tax) (a) Eastern U.S., pre-tax $ 2,428 $ 1,406 $ 1,022 1.56 $ Western U.S., pre-tax 342 325 17 0.03 Unregulated gross energy margins, pre-tax $ 2,770 $ 1,731 $ 1,039 1.59 $ 2010 2009 Operating Income $ 1,866 $ 896 Adjustments: Utility (3,668) (3,902) Energy-related businesses, net (26) (27) Other operation and maintenance 1,756 1,418 Amortization of recoverable transition costs -304 Depreciation 556 455 Taxes, other than income 238 280 ;Revenue adjustments (b) 920 2,217 Expense adjustments (b) 1,128 90 Unregulated gross energy margins $ 2,770 $ 1,731 Year Ended December 31, Year Ended December 31, A-10 (Millions of Dollars) (a) Excludes dilution associated with the June 2010 issuance of common stock. (b) See additional information on the following slide.
49
© PPL Corporation 2011
A-10
(Millions of Dollars)
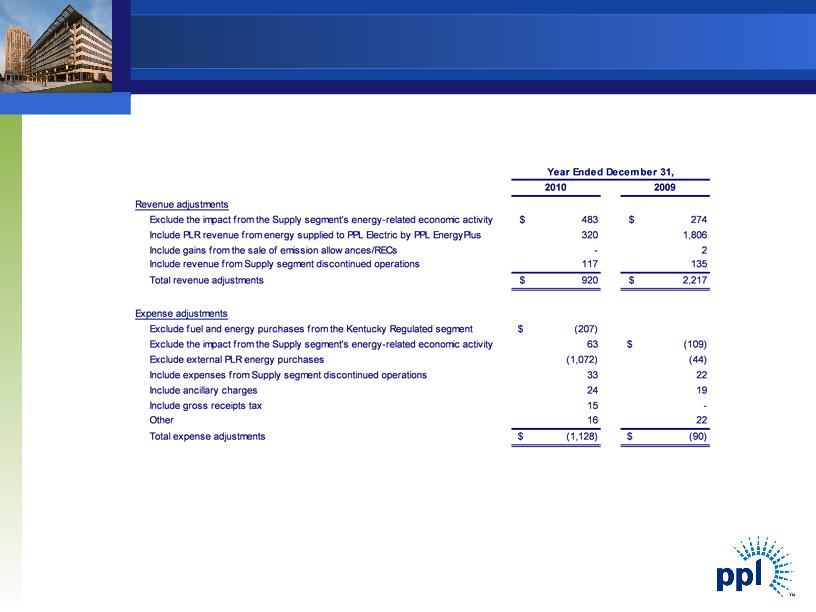
Reconciliation of Year-to-Date Operating Income
to Unregulated Gross Energy Margins
49 © PPL Corporation 2011 A-10 Reconciliation of Year-to-Date Operating Income to Unregulated Gross Energy Margins (Millions of Dollars) 2010 2009 Revenue adjustments Exclude the impact from the Supply segment's energy-related economic activity $ 483 $ 274 Include PLR revenue from energy supplied to PPL Electric by PPL EnergyPlus 320 1,806 Include gains from the sale of emission allowances/RECs -2 Include revenue from Supply segment discontinued operations 117 135 Total revenue adjustments $ 920 $ 2,217 Expense adjustments Exclude fuel and energy purchases from the Kentucky Regulated segment $ (207) Exclude the impact from the Supply segment's energy-related economic activity 63 $ (109) Exclude external PLR energy purchases (1,072) (44) Include expenses from Supply segment discontinued operations 33 22 Include ancillary charges 24 19 Include gross receipts tax 15 - Other 16 22 Total expense adjustments $ (1,128) $ (90) Year Ended December 31,
50
© PPL Corporation 2011
| 2009 | | 2010 | | 2011 |
Cash from Operations | $1,852 | | $2,034 | | $2,399 |
Increase (Decrease) in cash due to: | | | | | |
Capital Expenditures | (1,265) | | (1,644) | | (2,505) |
Sale of Assets | 84 | | 161 | | 381 |
Other Investing Activities - Net | (71) | | (20) | | 0 |
Free Cash Flow before Dividends | $ 600 | | $ 531 | | $ 275 |
(Millions of Dollars)
PPL Corporation Reconciliation of Cash from
Operations to Free Cash Flow before Dividends
51
© PPL Corporation 2011
Statements contained in this news release, including statements with respect to future events and their timing, including statements
concerning the acquisition by PPL Corporation of E.ON U.S. LLC and its subsidiaries Louisville Gas and Electric Company and
Kentucky Utilities Company (collectively, the “Kentucky Entities”), the expected results of operations of any of the Kentucky Entities or
PPL Corporation both before or following PPL Corporation’s acquisition of the Kentucky Entities, as well as statements as to future
earnings, energy prices, margins and sales, growth, revenues, expenses, cash flow, credit profile, ratings, financing, asset disposition,
marketing performance, hedging, regulation, corporate strategy and generating capacity and performance, are “forward-looking
statements” within the meaning of the federal securities laws. Although PPL Corporation believes that the expectations and
assumptions reflected in these forward-looking statements are reasonable, these expectations, assumptions and statements are
subject to a number of risks and uncertainties, and actual results may differ materially from the results discussed in the statements.
The following are among the important factors that could cause actual results to differ materially from the forward-looking statements:
capital market conditions and decisions regarding capital structure; the market prices of equity securities and the impact on pension
income and resultant cash funding requirements for defined benefit pension plans; the securities and credit ratings of PPL Corporation
and its subsidiaries; stock price performance; receipt of necessary government permits, approvals, rate relief and regulatory cost
recovery; market demand and prices for energy, capacity and fuel; weather conditions affecting customer energy usage and operating
costs; competition in power markets; the effect of any business or industry restructuring; the profitability and liquidity of PPL
Corporation, the Kentucky Entities and either of their subsidiaries; new accounting requirements or new interpretations or applications
of existing requirements; operating performance of plants and other facilities; environmental conditions and requirements and the
related costs of compliance, including environmental capital expenditures and emission allowance and other expenses; system
conditions and operating costs; development of new projects, markets and technologies; performance of new ventures; asset
acquisitions and dispositions; any impact of hurricanes or other severe weather on our business, including any impact on fuel prices;
the impact of state, federal or foreign investigations applicable to PPL Corporation, the Kentucky Entities and either of their
subsidiaries; the outcome of litigation against PPL Corporation, the Kentucky Entities and either of their subsidiaries; political,
regulatory or economic conditions in states, regions or countries where PPL Corporation, the Kentucky Entities and either of their
subsidiaries conduct business, including any potential effects of threatened or actual terrorism or war or other hostilities; foreign
exchange rates; new state, federal or foreign legislation, including new tax or environmental legislation or regulation; and the
commitments and liabilities of PPL Corporation, the Kentucky Entities and each of their subsidiaries. Any such forward-looking
statements should be considered in light of such important factors and in conjunction with PPL Corporation’s Form 10-K and other
reports on file with the Securities and Exchange Commission.
Forward-Looking Information Statement
52
© PPL Corporation 2011
“Earnings from ongoing operations” should not be considered as an alternative to reported earnings, or net income attributable to PPL, which is an
indicator of operating performance determined in accordance with generally accepted accounting principles (GAAP). PPL believes that “earnings from
ongoing operations,” although a non-GAAP financial measure, is also useful and meaningful to investors because it provides management’s view of
PPL’s fundamental earnings performance as another criterion in making investment decisions. PPL’s management also uses “earnings from ongoing
operations” in measuring certain corporate performance goals. Other companies may use different measures to present financial performance.
“Earnings from ongoing operations” is adjusted for the impact of special items. Special items include:
• Energy-related economic activity (as discussed below).
• Foreign currency-related economic hedges.
• Gains and losses on sales of assets not in the ordinary course of business.
• Impairment charges (including impairments of securities in the company’s nuclear decommissioning trust funds).
• Workforce reduction and other restructuring impacts.
• Costs and charges related to the acquisition of E.ON U.S.
• Other charges or credits that are, in management’s view, not reflective of the company’s ongoing operations.
Energy-related economic activity includes the changes in fair value of positions used economically to hedge a portion of the economic value of PPL’s
generation assets, load-following and retail activities. This economic value is subject to changes in fair value due to market price volatility of the input
and output commodities (e.g., fuel and power). Also included in this special item are the ineffective portion of qualifying cash flow hedges and the
premium amortization associated with options classified as economic activity. These items are included in ongoing earnings over the delivery period
of the item that was hedged or upon realization. Management believes that adjusting for such amounts provides a better matching of earnings from
ongoing operations to the actual amounts settled for PPL’s underlying hedged assets. Please refer to the Notes to the Consolidated Financial
Statements and MD&A in PPL Corporation’s periodic filings with the Securities and Exchange Commission for additional information on energy-
related economic activity.
“Free cash flow before dividends” is derived by deducting capital expenditures and other investing activities-net, from cash flow from operations. Free
cash flow before dividends should not be considered as an alternative to cash flow from operations, which is determined in accordance with GAAP.
PPL believes that free cash flow before dividends, although a non-GAAP measure, is an important measure to both management and investors since
it is an indicator of the company’s ability to sustain operations and growth without additional outside financing beyond the requirement to fund
maturing debt obligations. Other companies may calculate free cash flow before dividends in a different manner.
Definitions of Non-GAAP Financial Measures