|
| OMB APPROVAL |
|
| | OMB Number: 3235-0570
Expires:August 31, 2011
Estimated average burden
hours per response... 18.9 |
|
UNITED STATES
SECURITIES AND EXCHANGE COMMISSION
Washington, D.C. 20549
FORM N-CSR
CERTIFIED SHAREHOLDER REPORT OF REGISTERED MANAGEMENT INVESTMENT COMPANIES
Investment Company Act file number 811-3070
Hilliard-Lyons Government Fund, Inc.
(Exact name of registrant as specified in charter)
P. O. Box 32760, Louisville, Kentucky 40232-2760
(Address of principal executive offices) (Zip code)
| | |
| | Joseph C. Curry, Jr. | Carol Gehl |
| | Hilliard-Lyons Government Fund, Inc. | Godfrey & Kahn, S.C. |
| | P. O. Box 32760 | 780 North Water Street |
| | Louisville, Kentucky 40232-2760 | Milwaukee, Wisconsin 53202 |
(Name and address of agents for service)
Registrant's telephone number, including area code: (502) 588-8602
Date of fiscal year end: August 31
Date of reporting period: February 28, 2009
Form N-CSR is to be used by management investment companies to file reports with the Commission not later than 10 days after the transmission to stockholders of any report that is required to be transmitted to stockholders under Rule 30e-1 under the Investment Company Act of 1940 (17 CFR 270.30e -1). The Commission may use the information provided on Form N-CSR in its regulatory, disclosure review, inspection, and policymaking roles.
A registrant is required to disclose the information specified by Form N-CSR, and the Commission will make this information public. A registrant is not required to respond to the collection of information contained in Form N-CSR unless the Form displays a currently valid Office of Management and Budget ("OMB") control number. Please direct comments concerning the accuracy of the information collection burden estimate and any suggestions for reducing the burden to Secretary, Securities and Exchange Commission, 450 Fifth Street, NW, Washington, DC 20549-0609. The OMB has reviewed this collection of information under the clearance requirements of 44 U.S.C. § 3507.
| |
| ITEM 1. | REPORT TO SHAREHOLDERS. |
| | |
| | The Semi-Annual Report to Shareholders follows. |
March 19, 2009
Dear Shareholders:
We are pleased to present this report on the Hilliard-Lyons Government Fund, Inc. (“HLGF” or the “Fund”) for the six months ended February 28, 2009.
Times continue to be turbulent for investors. The effects of the credit crisis that began in August 2007 still weigh on financial markets. The U.S. Treasury and the Federal Reserve (the “Fed”) have acted aggressively and in innovative ways to provide liquidity and to jump start credit markets. If these efforts produce results it would go a long way toward increasing confidence in the U.S. economy. The Fed’s liquidity programs (Asset-Backed Commercial Paper Money-Market Mutual Fund Liquidity Facility, the Commercial Paper Funding Facility, the Money-Market Investor Funding Facility, the Primary Dealer Credit Facility and the Term Securities Lending Facility) set to expire on April 30, 2009 have been extended to October 30, 2009. The Term Asset-Backed Securities Loan Facility is set to expire December 31, 2009 while the Term Auction Facility doesn’t have a fixed expiration date.
The Fed last met March 18, 2009 and left the federal funds rate unchanged. The federal funds rate is the rate charged on overnight loans between banks. Prior to that meeting, the Fed met December 16, 2008 and lowered the federal funds rate from 1.00% to a target range of 0% - .25%, the lowest level on record. In its accompanying statement, the Fed stated, “it expected interest rates to remain “exceptionally” low for some time.” Normally, a lower Fed rate reduces borrowing costs for businesses, consumers and financial institutions which increases borrowing and economic activity. While the Fed has set its lending rate at an historic low level, rates for borrowers with even a modicum of risk remain far above levels of a few months ago. Low overnight lending rates usually help banks because they can borrow cheaply and then lend for a longer period of time at a higher rate. But longer term rates have also been pushed down making lenders less inclined to lend. Along with its historic rate cut, the Fed has introduced a range of unconventional strategies including purchases of mortgage related securities.
The Federal Deposit Insurance Corporation (“FDIC”) and the U.S. Treasury have also implemented various programs to bolster confidence and create liquidity in the nation’s banking system and credit markets. The FDIC announced the creation of the Temporary Liquidity Guarantee Program (“TLGP”) in October 2008. One component of the TLGP is the Debt Guarantee Program which guarantees the payment of newly issued senior unsecured debt of participating organizations issued between October 14, 2008 and June 30, 2009. For such debts maturing beyond June 30, 2012, the guarantee remains in effect until June 30, 2012. Debt issued under the TLGP is backed by the full faith and credit of the United States.
The Fund has purchased some debt securities issued under the TLGP. The guarantee of payment by the FDIC along with competitive rates, make these issues an attractive investment for the Fund. These investments are shown under the heading FDIC Guaranteed Securities on the Schedule of Investments
included in this report. All securities held by the Fund have the highest ratings available from both Standard & Poor’s and Moody’s. The portfolio allocation at February 28, 2009 is shown here:
Portfolio Allocation1
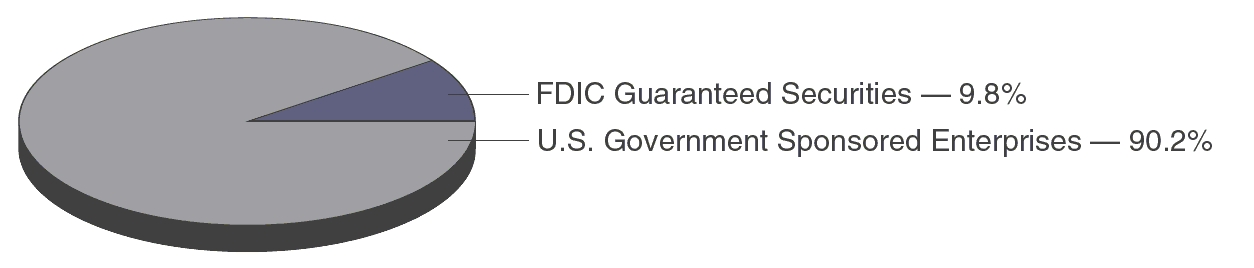
1 As a percentage of total investments at February 28, 2009. Investments are subject to change daily.
All money market fund investors have seen yields on their funds fall sharply in recent months. U.S. Treasury funds have been particularly hard hit with both historically low rates and large inflows of money as investors followed a flight to safety. The U.S. Treasury issued 3-month bills in December 2008 at 0%. Yields were actually briefly below 0% before rising slightly. Several Treasury funds have closed to new investors as investing at these low yields makes it impossible for them to cover expenses and maintain a positive yield for shareholders. With rates at these historically low levels, the Fund’s investment adviser, J.J.B. Hilliard, W.L. Lyons, LLC voluntarily agreed to waive a portion of its advisory fees beginning on January 16, 2009. This voluntary fee waiver reduces the Fund’s expenses and adds to the dividends paid to shareholders. The Adviser may discontinue or modify this voluntary fee waiver at its discretion. For more information on this voluntary fee waiver please see Note B.
Money market funds are required to maintain an average maturity of 90 days or less which causes their yields to respond fairly quickly to changes in short term interest rates. When current rates fall, money market rates follow suit as proceeds on securities that mature are replaced with securities with lower yields. Operating expenses are paid from the income on these securities and the remainder is passed on to shareholders as income dividends. If this environment continues, pressure on money market fund yields will continue as well. Conversely, when rates rise as we expect they eventually will, money market yields will quickly rise as well.
In this time of economic uncertainty, HLGF remains committed to offering its shareholders a money market fund that offers both a high degree of credit safety and the highest level of current income consistent with the preservation of capital. Shareholders of the Fund have easy and immediate access to their money by same day withdrawals (until 12:00 noon Eastern time) or by utilizing the Fund’s checkwriting service. HLGF is one of the only money market funds that still offers its shareholders unlimited, completely free check-writing. There is no limit on the number of checks that can be written plus no minimum check amount.
We appreciate your investment in the Hilliard-Lyons Government Fund, Inc. and take the responsibility of managing your investment seriously.
| |
 |  |
| JOSEPH C. CURRY, JR. | DIANNA P. WENGLER |
| President | Senior Vice President and Treasurer |
An investment in the Fund is not insured or guaranteed by the Federal Deposit Insurance Corporation or any other government agency. Although the Fund seeks to preserve the value of your investment at $1.00 per share, it is possible to lose money by investing in the Fund.2
UNDERSTANDING YOUR FUND’S EXPENSES—(UNAUDITED)
All mutual funds have operating expenses. As a shareholder of the Fund, you incur ongoing costs including costs for portfolio management, administrative services and shareholder reports such as this one. Operating expenses directly reduce the investment return of a fund as they are paid from gross income. A fund’s expenses are shown by its expense ratio which is calculated as a percentage of average net assets. The following table is intended to help you understand the ongoing fees, expressed in dollars, of investing in the Fund and to be able to compare these costs with those of other mutual funds. The examples in the table are based on an initial investment of $1,000 made at the beginning of the period and held for the entire period.
The table shows costs in two ways.
Actual Return. The first line of the table below lets you estimate the actual expenses you paid over the period. It shows the expenses that would have been paid on a $1,000 investment for the period September 1, 2008 to February 28, 2009. It shows the value of the investment at the end of the period using actual returns and expenses.
You may use the information in this line, together with the amount you invested, to estimate the expenses that you paid over the period. Simply divide your account value by $1,000 (for example, an $8,600 account value divided by $1,000 = 8.6), then multiply the result by the number in the first line under the heading entitled “Expenses Paid During Period” to estimate the expenses you paid on your account during this period.
Hypothetical 5% Return. The second line of the table below lets you compare the expenses of investing in the Fund with the expenses of other mutual funds. It uses a hypothetical annualized rate of return of 5% per year and the Fund’s actual expenses. All mutual fund shareholder reports will provide this information. You can compare this 5% hypothetical example with the 5% hypothetical examples that appear in the shareholder reports of other funds.
| | | | |
| | Beginning
Account
Value
9/1/08 | Ending
Account
Value
2/28/09 | Net
Annualized
Expense
Ratio | Expenses
Paid
During
Period* |
| |
| |
| |
| |
|
|
|
|
| Actual Fund Return | $1,000.00 | $ 1,006.82 | .70% | $3.48 |
| Hypothetical 5% Return | $1,000.00 | $ 1,024.79 | .70% | $3.51 |
| * | Expenses are equal to the Fund’s annualized expense ratio multiplied by the average account value for the period; multiplied by 181/365 (to reflect the one-half year period). |
| |
INFORMATION ABOUT PROXY VOTING BY THE FUND—(UNAUDITED)
The Fund invests exclusively in non-voting securities and therefore is not required to include information regarding proxy voting policies and procedures.
INFORMATION ABOUT THE FUND’S PORTFOLIO HOLDINGS—(UNAUDITED)
The Fund files its complete schedule of portfolio holdings with the SEC for the first and third fiscal quarters of each fiscal year (quarters ended May 31 and November 30) on Form N-Q. The Fund’s Form N-Q is available on the SEC’s website at www.sec.gov and may be reviewed and copied at the SEC’s Public Reference Room in Washington D.C. Information on the operation of the SEC’s Public Reference Room may be obtained by calling 1-800-SEC-0330.
3
HILLIARD-LYONS GOVERNMENT FUND, INC.
SCHEDULE OF INVESTMENTS
(UNAUDITED)
February 28, 2009
| | | | | | | | |
Principal
Amount | | | Cash
Equivalent
Yield | Maturity
Date | Value |
| | |
|
|
|
| | | | U.S. GOVERNMENT SPONSORED ENTERPRISES* — 90.2%*** |
| $ | 7,000,000 | | Federal Home Loan Bank | 0.122 | % | 03/02/2009 | | $ 6,999,976 |
| | 19,700,000 | | Federal Home Loan Bank | 3.394 | | 03/02/2009 | | 19,698,194 |
| | 8,000,000 | | Federal Home Loan Bank | 1.261 | (a) | 03/02/2009 | (b) | 7,985,566 |
| | 11,590,000 | | Federal Home Loan Bank | 0.203 | | 03/03/2009 | | 11,589,871 |
| | 25,000,000 | | Federal Home Loan Bank | 0.864 | | 03/04/2009 | | 24,998,229 |
| | 9,100,000 | | Federal Home Loan Bank | 0.680 | | 03/05/2009 | | 9,099,322 |
| | 20,000,000 | | Federal Home Loan Bank | 0.101 | | 03/06/2009 | | 19,999,722 |
| | 25,000,000 | | Federal Home Loan Bank | 0.378 | (a) | 03/08/2009 | (b) | 24,948,316 |
| | 15,000,000 | | Federal Home Loan Bank | 0.162 | | 03/09/2009 | | 14,999,466 |
| | 12,000,000 | | Federal Home Loan Bank | 0.254 | | 03/10/2009 | | 11,999,250 |
| | 60,000,000 | | Federal Home Loan Bank | 2.189 | (a) | 03/10/2009 | (b) | 60,030,413 |
| | 20,000,000 | | Federal Home Loan Bank | 1.119 | | 03/11/2009 | | 19,993,888 |
| | 20,000,000 | | Federal Home Loan Bank | 0.081 | | 03/12/2009 | | 19,999,511 |
| | 45,000,000 | | Federal Farm Credit Bank | 0.360 | (a) | 03/12/2009 | (b) | 45,000,000 |
| | 12,161,000 | | Federal Home Loan Bank | 2.084 | | 03/13/2009 | | 12,152,730 |
| | 23,000,000 | | Federal Home Loan Bank | 0.405 | (a) | 03/13/2009 | (b) | 22,992,334 |
| | 20,000,000 | | Federal Home Loan Bank | 1.741 | (a) | 03/15/2009 | (b) | 19,966,777 |
| | 25,000,000 | | Federal Farm Credit Bank | 0.830 | (a) | 03/15/2009 | (b) | 25,000,000 |
| | 15,000,000 | | Federal Home Loan Bank | 0.304 | | 03/16/2009 | | 14,998,125 |
| | 20,000,000 | | Federal Home Loan Bank | 0.081 | | 03/19/2009 | | 19,999,200 |
| | 17,000,000 | | Federal Home Loan Bank | 0.193 | | 03/20/2009 | | 16,998,295 |
| | 20,000,000 | | Federal Home Loan Bank | 0.030 | | 03/23/2009 | | 19,999,633 |
| | 20,000,000 | | Federal Home Loan Bank | 0.030 | | 03/24/2009 | | 19,999,617 |
| | 25,000,000 | | Federal Home Loan Bank | 0.122 | | 03/25/2009 | | 24,998,000 |
| | 25,000,000 | | Federal Home Loan Bank | 0.122 | | 03/26/2009 | | 24,997,917 |
| | 18,300,000 | | Federal Home Loan Bank | 1.356 | (a) | 03/26/2009 | (b) | 18,254,647 |
| | 40,000,000 | | Federal Home Loan Bank | 1.466 | (a) | 03/27/2009 | (b) | 40,000,291 |
| | 10,000,000 | | Federal Home Loan Bank | 0.294 | | 03/30/2009 | | 9,997,664 |
| | 20,000,000 | | Federal Home Loan Bank | 1.212 | | 03/31/2009 | | 19,980,167 |
| | 17,000,000 | | Federal Home Loan Bank | 0.233 | | 04/01/2009 | | 16,996,633 |
| | 50,000,000 | | Federal Farm Credit Bank | 0.350 | (a) | 04/01/2009 | (b) | 49,514,759 |
See notes to financial statements.
4
HILLIARD-LYONS GOVERNMENT FUND, INC.
SCHEDULE OF INVESTMENTS—continued
(UNAUDITED)
February 28, 2009
| | | | | | | | |
| | | | | Cash
Equivalent
Yield | | | |
Principal
Amount | | | Maturity
Date | |
| | | Value |
| | |
|
|
|
| | | | U.S. GOVERNMENT SPONSORED ENTERPRISES* — 90.2%*** |
| $ | 17,000,000 | | Federal Home Loan Bank | 0.325 | % | 04/02/2009 | | $ 16,995,164 |
| | 20,000,000 | | Federal Home Loan Bank | 0.274 | | 04/03/2009 | | 19,995,050 |
| | 64,500,000 | | Federal Farm Credit Bank | 0.748 | (a) | 04/04/2009 | (b) | 64,471,985 |
| | 41,500,000 | | Federal Home Loan Bank | 1.385 | (a) | 04/05/2009 | (b) | 41,501,599 |
| | 13,000,000 | | Federal Home Loan Bank | 0.325 | | 04/06/2009 | | 12,995,840 |
| | 45,750,000 | | Federal Home Loan Bank | 1.223 | (a) | 04/06/2009 | (b) | 45,706,409 |
| | 50,000,000 | | Federal Home Loan Bank | 1.241 | (a) | 04/07/2009 | (b) | 50,000,000 |
| | 65,000,000 | | Federal Home Loan Bank | 0.571 | (a) | 04/07/2009 | (b) | 65,000,000 |
| | 17,000,000 | | Federal Home Loan Bank | 0.304 | | 04/08/2009 | | 16,994,617 |
| | 20,000,000 | | Federal Home Loan Bank | 0.233 | | 04/09/2009 | | 19,995,017 |
| | 90,000,000 | | Federal Home Loan Bank | 1.254 | (a) | 04/13/2009 | (b) | 90,024,248 |
| | 55,000,000 | | Federal Home Loan Bank | 1.185 | (a) | 04/13/2009 | (b) | 55,006,171 |
| | 20,000,000 | | Federal Home Loan Bank | 1.130 | | 04/14/2009 | | 19,972,867 |
| | 6,025,000 | | Federal Home Loan Bank | 1.110 | | 04/14/2009 | | 6,016,973 |
| | 20,000,000 | | Federal Home Loan Bank | 0.335 | | 04/15/2009 | | 19,991,750 |
| | 32,000,000 | | Federal Home Loan Bank | 0.934 | (a) | 04/15/2009 | (b) | 32,006,803 |
| | 78,000,000 | | Federal Home Loan Bank | 1.044 | (a) | 04/15/2009 | (b) | 77,995,019 |
| | 20,000,000 | | Federal Home Loan Bank | 0.142 | | 04/16/2009 | | 19,996,422 |
| | 50,000,000 | | Federal Home Loan Bank | 0.908 | (a) | 04/16/2009 | (b) | 50,000,000 |
| | 20,000,000 | | Federal Home Loan Bank | 1.305 | | 04/17/2009 | | 19,966,578 |
| | 15,000,000 | | Federal Home Loan Bank | 0.284 | | 04/20/2009 | | 14,994,167 |
| | 33,600,000 | | Federal Farm Credit Bank | 0.975 | (a) | 04/23/2009 | (b) | 33,571,767 |
| | 20,000,000 | | Federal Home Loan Bank | 0.355 | | 04/24/2009 | | 19,989,500 |
| | 90,000,000 | | Federal Home Loan Bank | 1.089 | (a) | 04/27/2009 | (b) | 89,997,553 |
| | 20,000,000 | | Federal Home Loan Bank | 0.345 | | 04/28/2009 | | 19,989,044 |
| | 55,000,000 | | Federal Home Loan Bank | 1.134 | (a) | 04/28/2009 | (b) | 55,010,304 |
| | 15,000,000 | | Federal Home Loan Bank | 1.094 | (a) | 05/05/2009 | (b) | 14,989,295 |
| | 72,500,000 | | Federal Home Loan Bank | 1.171 | (a) | 05/10/2009 | (b) | 72,425,155 |
| | 25,000,000 | | Federal Home Loan Bank | 0.315 | | 05/13/2009 | | 24,984,285 |
| | 66,030,000 | | Federal Home Loan Bank | 1.211 | (a) | 05/19/2009 | (b) | 65,995,996 |
| | | | | | | | |
|
| | | | TOTAL U. S. GOVERNMENT SPONSORED ENTERPRISES | | | | | |
| | | | (at amortized cost—$1,830,768,091) | | | | | 1,830,768,091 |
| | | | | | | | |
|
See notes to financial statements.
5
HILLIARD-LYONS GOVERNMENT FUND, INC.
SCHEDULE OF INVESTMENTS—continued
(UNAUDITED)
February 28, 2009
| | | | | | | | |
| | | | | Cash
Equivalent
Yield | | | |
Principal
Amount | | | Maturity
Date | |
| | | Value |
| | |
|
|
|
| | | | FDIC GUARANTEED SECURITIES**—9.8%*** |
| | | | Commercial Paper—1.5%*** | | | | | |
| $ | 15,000,000 | | Citigroup Funding Inc. | 0.406 | % | 03/17/2009 | | $ 14,997,333 |
| | 15,000,000 | | Citigroup Funding Inc. | 0.406 | | 03/18/2009 | | 14,997,167 |
| | | | | | | | |
|
| | | | Total Commercial Paper | | | | | 29,994,500 |
| | | | | | | | |
|
| | | | Corporate Floating Rate Notes—8.3%*** | | | | | |
| | 48,000,000 | | General Electric Capital Corp. | 3.116 | (a) | 03/09/2009 | (b) | 49,146,245 |
| | 48,600,000 | | American Express Bank, FSB | 1.299 | (a) | 03/10/2009 | (b) | 49,243,674 |
| | 17,500,000 | | KeyCorp | 2.646 | (a) | 03/16/2009 | (b) | 17,549,607 |
| | 10,000,000 | | SunTrust Bank | 2.571 | (a) | 03/16/2009 | (b) | 10,026,748 |
| | 42,000,000 | | Citigroup Funding Inc. | 1.274 | (a) | 04/30/2009 | (b) | 42,065,663 |
| | | | | | | | |
|
| | | | Total Corporate Floating Rate Notes | | | | | 168,031,937 |
| | | | | | | | |
|
| | | | TOTAL FDIC GUARANTEED SECURITIES | | | | | |
| | | | (at amortized cost—$198,026,437) | | | | | 198,026,437 |
| | | | | | | | |
|
| | | | TOTAL INVESTMENTS—100.0% | | | | | |
| | | | (at amortized cost—$2,028,794,528****) | | | | | 2,028,794,528 |
| | | | | | | | |
|
| | | | OTHER ASSETS LESS LIABILITIES—0.0% | | | | | 1,381,060 |
| | | | | | | | |
|
| | | | NET ASSETS—100.0% | | | | | $2,030,175,588 |
| | | | | | | | |
|
| |
* | Obligations of U.S. Government sponsored enterprises are not issued or guaranteed by the United States Treasury. |
** | This debt is guaranteed under the Federal Deposit Insurance Corporation’s (“FDIC”) Temporary Liquidity Guarantee Program (“TLGP”) and is backed by the full faith and credit of the United States. Details of the TLGP can be found on the FDIC’s website, www.fdic.gov/tlgp. |
*** | The percentage shown for each investment category is the total value of that category as a percentage of the total net assets of the Fund. |
| **** | Also represents cost for federal income tax purposes. |
| (a) | Floating or variable rate security. The interest rate shown is the rate in effect as of February 28, 2009. |
(b) | The maturity date shown is either the readjustment date of the interest rate or the stated maturity date on the security. |
See notes to financial statements.
6
HILLIARD-LYONS GOVERNMENT FUND, INC.
STATEMENT OF ASSETS AND LIABILITIES
(UNAUDITED)
February 28, 2009
| |
| ASSETS | |
| Investments, (at amortized cost which approximates fair value | |
| (identified and tax cost—$2,028,794,528)) | $2,028,794,528 |
| Cash | 82,185 |
| Interest receivable | 2,290,370 |
| Prepaid expenses | 130,397 |
| |
|
| TOTAL ASSETS | 2,031,297,480 |
| |
|
| LIABILITIES | |
| Dividends payable | 345,425 |
| Due to affiliates—Note B | |
| Investment advisory fee | 159,891 |
| Shareholder services fee | 321,469 |
| Administration services fee | 281,767 |
| Accrued directors’ fees | 9,280 |
| Accrued expenses | 4,060 |
| |
|
| TOTAL LIABILITIES | 1,121,892 |
| |
|
| NET ASSETS | $2,030,175,588 |
| |
|
| Shares of beneficial interest outstanding | 2,030,175,588 |
| |
|
| Net asset value, offering and redemption price per share | |
| (net assets ÷ shares of beneficial interest outstanding) | $1.00 |
| |
|
See notes to financial statements.
7
HILLIARD-LYONS GOVERNMENT FUND, INC.
STATEMENT OF OPERATIONS
(UNAUDITED)
For the six months ended February 28, 2009
| | |
| INVESTMENT INCOME | | |
| Interest | $19,340,871 | |
| |
| |
| EXPENSES | | |
| Investment advisory fee—Note B | 2,667,978 | |
| Shareholder services fee—Note B | 1,993,314 | |
| Administration services fee—Note B | 1,697,794 | |
| Printing and other expenses | 309,483 | |
| Custodian fees and expenses | 111,175 | |
| Directors’ fees | 56,650 | |
| Insurance expense | 49,191 | |
| Professional fees | 46,450 | |
| Registration fees | 31,975 | |
| Transfer agent fees and expenses | 22,810 | |
| |
| |
| Total expenses | 6,986,820 | |
| |
| |
| Waiver of investment advisory fee—Note B | (381,458 | ) |
| |
| |
| Total net expenses | 6,605,362 | |
| |
| |
| Net investment income | 12,735,509 | |
| |
| |
| Net increase in net assets resulting from operations | $12,735,509 | |
| |
| |
See notes to financial statements.
8
HILLIARD-LYONS GOVERNMENT FUND, INC.
STATEMENTS OF CHANGES IN NET ASSETS
| | | | |
| | For the six
months ended
February 28,
2009
(UNAUDITED) | | |
| | For the
year ended
August 31,
2008 |
| |
| |
| |
| |
|
|
| FROM OPERATIONS | | | | |
| Net investment income | $12,735,509 | | $47,712,472 | |
| |
| |
| |
| Net increase in net assets resulting from operations | 12,735,509 | | 47,712,472 | |
| |
| |
| |
| DIVIDENDS TO SHAREHOLDERS FROM | | | | |
| Net investment income | (12,735,509 | ) | (47,712,472 | ) |
| |
| |
| |
| Total dividends | (12,735,509 | ) | (47,712,472 | ) |
| |
| |
| |
| FROM CAPITAL SHARE TRANSACTIONS | | | | |
| Net capital share transactions (at $1.00 per share)—Note C | 355,505,743 | | 31,638,517 | |
| |
| |
| |
| NET ASSETS | | | | |
| Beginning of period | 1,674,669,845 | | 1,643,031,328 | |
| |
| |
| |
| End of period | $2,030,175,588 | | $1,674,669,845 | |
| |
| |
| |
See notes to financial statements.
9
HILLIARD-LYONS GOVERNMENT FUND, INC.
FINANCIAL HIGHLIGHTS
The following table includes selected data for a share of capital stock outstanding throughout each period and other performance information derived from the financial statements. The total returns in the table represent the rate that an investor would have earned on an investment in the Fund (assuming reinvestment of all dividends and distributions).
| | | | | | | | | | | | |
| | For the six
months ended
February 28,
2009
(UNAUDITED) | For the years ended August 31, |
| |
| |
| |
|
| | 2008 | 2007 | 2006 | 2005 | | 2004 |
| |
|
|
|
|
| |
|
| Net asset value, beginning | | | | | | | | | | | | |
| of period | $1.00 | | $1.00 | | $1.00 | | $1.00 | | $1.00 | | $1.00 | |
| |
| |
| |
| |
| |
| |
| |
| Net investment income | 0.01 | (a) | 0.03 | | 0.04 | | 0.04 | | 0.02 | (a) | 0.01 | (a) |
| |
|
| |
| |
| |
| |
| |
| Total from investment | | | | | | | | | | | | |
| operations | 0.01 | | 0.03 | | 0.04 | | 0.04 | | 0.02 | | 0.01 | |
| |
| |
| |
| |
| |
| |
| |
| Less distributions: | | | | | | | | | | | | |
| From net investment | | | | | | | | | | | | |
| income | (0.01 | ) | (0.03 | ) | (0.04 | ) | (0.04 | ) | (0.02 | ) | (0.01 | ) |
| |
| |
| |
| |
| |
| |
| |
| Total distributions | (0.01 | ) | (0.03 | ) | (0.04 | ) | (0.04 | ) | (0.02 | ) | (0.01 | ) |
| |
| |
| |
| |
| |
| |
| |
| Net asset value, end of | | | | | | | | | | | | |
| period | $1.00 | | $1.00 | | $1.00 | | $1.00 | | $1.00 | | $1.00 | |
| |
| |
| |
| |
| |
| |
| |
| Total investment return | 0.68 | % | 2.82 | % | 4.56 | % | 3.70 | % | 1.70 | % | 0.53 | % |
| |
| |
| |
| |
| |
| |
| |
| SUPPLEMENTAL DATA | | | | | | | | | | | | |
| Net assets, end of period | | | | | | | | | | | | |
| (000’s omitted) | $2,030,176 | | $1,674,670 | | $1,643,031 | | $1,396,088 | | $1,378,492 | | $1,427,543 | |
| RATIOS TO AVERAGE NET | | | | | | | | | | | | |
| ASSETS | | | | | | | | | | | | |
| Operating expenses | 0.70 | %*(b) | 0.74 | % | 0.76 | % | 0.80 | % | 0.79 | %(c) | 0.58 | %(d) |
| Net investment income | 1.35 | %*(b) | 2.76 | % | 4.47 | % | 3.64 | % | 1.69 | %(c) | 0.53 | %(d) |
| |
| (a) | Net of voluntary investment advisory fee waiver by the Adviser. |
| | |
| (b) | Net of voluntary investment advisory fee waiver by the Adviser. If the Fund had paid the full investment advisory fee, the annualized ratios of expenses and net investment income to average net assets would have been .74% and 1.31% respectively, for the six months ended February 28, 2009. |
| | |
(c) | Net of voluntary investment advisory fee waiver by the Adviser. If the Fund had paid the full investment advisory fee, the ratios of expenses and net investment income to average net assets would have been unchanged at .79% and 1.69% respectively, for the year ended August 31, 2005. |
| | |
(d) | Net of voluntary investment advisory fee waiver by the Adviser. If the Fund had paid the full investment advisory fee, the ratios of expenses and net investment income to average net assets would have been .78% and .33% respectively, for the year ended August 31, 2004. |
| | |
* | Annualized |
See notes to financial statements.
10
HILLIARD-LYONS GOVERNMENT FUND, INC.
NOTES TO FINANCIAL STATEMENTS
(UNAUDITED)
February 28, 2009
NOTE A—SIGNIFICANT ACCOUNTING POLICIES
Hilliard-Lyons Government Fund, Inc. (the “Fund”) is a diversified open-end management investment company registered under the Investment Company Act of 1940 (the “1940 Act”), as amended. The Fund was incorporated in June 1980 under the laws of the state of Maryland. The primary investment objective of the Fund is to provide investors with liquidity and the highest possible level of current income consistent with the preservation of capital.
The following is a summary of significant accounting policies followed by the Fund in the preparation of its financial statements.
Security Valuation: The Fund employs the amortized cost method of security valuation for U.S. Government securities in accordance with Rule 2a-7 of the 1940 Act. Securities are valued at cost when purchased, and thereafter a constant proportionate amortization of any discount or premium, if any, is recorded until maturity of the security. The Board of Directors (the “Board”) monitors deviations between net asset value per share as determined by using available market quotations and the amortized cost method of security valuation. If the deviation in the aggregate is significant, the Board considers what action, if any, should be initiated to provide fair valuation.
The Fund adopted Financial Accounting Standards Board Statement of Financial Accounting Standards No. 157, Fair Value Measurements (“FAS 157”), effective January 1, 2008. In accordance with FAS 157, fair value is defined as the price that the Fund would receive upon selling an investment in a timely transaction to an independent buyer in the principal or most advantageous market of the investment. FAS 157 establishes a three-tier hierarchy to classify fair value measurements for disclosure purposes. The three tier hierarchy of inputs is summarized in the three broad levels listed below.
|
| Level 1 — | quoted prices in active markets for identical securities |
| | |
| Level 2 — | other significant observable inputs (including quoted prices for similar securities, interest rates, prepayment speeds, credit risks, etc.) |
| | |
| Level 3 — | significant unobservable inputs (including the Fund’s own assumptions in determining fair value of investments) |
The inputs or methodology used for valuing securities are not necessarily an indication of the risk associated with investing in these securities. For example, short-term debt securities with a maturity of less than 60 days are valued using amortized cost, in accordance with rules under the 1940 Act. Generally, amortized cost approximates the current fair value of a security, but since the value is not obtained from a quoted price in an active market, such securities are reflected as Level 2. The following is a summary of the inputs used to value each of the Fund’s investments at February 28, 2009.
11
HILLIARD-LYONS GOVERNMENT FUND, INC.
NOTES TO FINANCIAL STATEMENTS—continued
(UNAUDITED)
February 28, 2009
| | |
| | Investments in
Securities |
| Valuation Inputs |
|
|
| Level 1 — Quoted prices | $ | — |
| Level 2 — Other significant observable inputs | | 2,028,794,528 |
| Level 3 — Significant unobservable inputs | | — |
| |
|
| |
| Total | $ | 2,028,794,528 |
| |
|
Federal Income Taxes: It is the policy of the Fund to continue to qualify under the Internal Revenue Code as a regulated investment company and to distribute all of its taxable income to shareholders, thereby relieving the Fund of federal income tax liability.
Management of the Fund has concluded that there are no significant uncertain tax positions that would require recognition in the financial statements. Since tax authorities can examine previously filed tax returns, the Fund’s tax returns for each of the four years ended August 31, 2008 are subject to such review.
Dividends to Shareholders: The net investment income of the Fund is determined on each business day and is declared as a dividend payable to shareholders of record daily and is paid monthly. The tax character of distributions paid during 2008 and 2007 was as follows:
| | | |
| | For the year ended August 31, |
| |
|
| | 2008 | | 2007 |
| |
| |
|
| Distributions paid from ordinary income | $47,712,472 | | $69,011,587 |
| |
| |
|
| Total distributions | $47,712,472 | | $69,011,587 |
| |
| |
|
Investment Transactions: Investment transactions are accounted for on the date the securities are bought or sold. Income is accrued daily. Interest income and expenses are recorded on the accrual basis. Net realized gains and losses on sales of investments, if any, are determined on the basis of identified cost.
Use of Estimates: The preparation of financial statements in conformity with accounting principles generally accepted in the United States of America requires management to make certain estimates and assumptions that may affect the reported amounts of assets and liabilities and disclosure of contingent assets and liabilities at the date of the financial statements. Estimates also affect the reported amounts of revenues and expenses during the reporting period. Actual results could differ from those estimates.
12
HILLIARD-LYONS GOVERNMENT FUND, INC.
NOTES TO FINANCIAL STATEMENTS—continued
(UNAUDITED)
February 28, 2009
NOTE B—INVESTMENT ADVISORY FEES & OTHER TRANSACTIONS WITH AFFILIATES
On December 17, 2007, the Board of Directors of the Fund, including a majority of the directors who are unaffiliated with the Fund, approved a new investment advisory agreement with J.J.B Hilliard W.L. Lyons, LLC. (the “Adviser”) for a period of two years. Under the investment advisory agreement, the Adviser supervises investment operations of the Fund and the composition of its portfolio, and furnishes advice and recommendations with respect to investments and the purchase and sale of securities in accordance with the Fund’s investment objectives, policies and restrictions; subject, however, to the general supervision and control of the Fund’s Board. For the services the Adviser renders, the Fund has agreed to pay the Adviser an annual advisory fee at the annual rates of 1/2 of 1% of the first $200 million of average daily net assets, 3/8 of 1% of the next $100 million of average daily net assets, and 1/4 of 1% of the average daily net assets in excess of $300 million. Such fee is accrued daily and paid monthly. The Adviser has agreed to reimburse the Fund if total operating expenses of the Fund, excluding taxes, all brokers’ commissions and other normal charges incident to the purchase and sale of portfolio securities, interest and extraordinary expenses (as defined), exceed on an annual basis 1 1/2% of the first $30 million of average daily net assets and 1% of average daily net assets over $30 million. There was no reimbursement required for the six months ended February 28, 2009. The Adviser voluntarily agreed to waive a portion of its advisory fee beginning January 16, 2009. The Adviser may discontinue or modify any such waiver at its discretion. For the six months ended February 28, 2009, the Adviser would have earned $2,667,978 before the voluntary waiver from the Fund. The Adviser voluntarily waived $381,458 for the period January 16, 2009 through February 28, 2009. At February 28, 2009, the Fund owed $159,891 net of the voluntary waiver to the Adviser.
The Fund has entered into a separate Omnibus Account Agreement (the “Omnibus Agreement”) with the Adviser to provide shareholder and administration services to the Fund. Under the Omnibus Agreement, the Adviser provides certain shareholder and administrative functions for the Fund, including but not limited to: (i) preparing and mailing monthly statements to shareholders; (ii) forwarding shareholder communications from the Fund; (iii) responding to inquiries from shareholders concerning their investments in the Fund; (iv) maintaining account information relating to shareholders that invest in the Fund; and (v) processing purchase, exchange and redemption requests from shareholders and placing orders and appropriate documentation with the Fund or its service providers. For its services to the Fund under the Omnibus Agreement, the Adviser receives a shareholder services fee from the Fund at the annual rate of 25 basis points on the first $1.25 billion of average daily net assets, 15 basis points on the next $250 million of average daily net assets, 13 basis points on the next $500 million of average daily net assets, 10 basis points on the next $250 million of average daily net assets and 5 basis points on average daily net assets exceeding $2.25 billion. The Adviser also receives an administration services fee from the Fund at the annual rate of 18 basis point of the Fund’s average daily net assets. Such fees are accrued daily and paid monthly. For the six months ended February 28, 2009, the Adviser earned $1,993,314 and $1,697,794 from the Fund for the shareholder services fee and administration services fee, respectively. At February 28, 2009, the Fund owed the Adviser $321,469 and $281,767 for the shareholder services fee and administration services fee, respectively.
No compensation is paid by the Fund to officers of the Fund and directors who are affiliated with the Adviser. The Fund pays each unaffiliated director an annual retainer of $12,000, plus a fee of $2,000 for each board or committee meeting attended, and all expenses the directors incur in attending meetings. The board of directors chair receives an additional annual retainer of $4,000, the audit committee chair receives an
13
HILLIARD-LYONS GOVERNMENT FUND, INC.
NOTES TO FINANCIAL STATEMENTS—continued
(UNAUDITED)
February 28, 2009
additional annual retainer of $3,500 and the nominating committee chair receives an additional annual retainer of $1,500. Total fees paid to directors for the six months ended February 28, 2009 were $68,500. Transfer agent fees are paid to State Street Bank & Trust Co.
NOTE C—CAPITAL STOCK
At February 28, 2009, there were 2,500,000,000 shares of $.01 par value Common Stock authorized, and capital paid in aggregated $2,030,175,588. Each transaction in Fund shares was at the net asset value of $1.00 per share. The dollar amount represented is the same as the shares shown below for such transactions.
| | | | | |
| | For the six
months ended
February 28,
2009 | | For the
year ended
August 31,
2008 |
| |
| |
| |
| |
| |
|
| Shares sold | 2,989,103,672 | | | 5,686,661,581 | |
| Shares issued to shareholders in reinvestment of dividends | 13,246,570 | | | 48,556,747 | |
| Less shares repurchased | (2,646,844,499 | ) | | (5,703,579,811 | ) |
| |
| | |
| |
| Net increase in capital shares | 355,505,743 | | | 31,638,517 | |
| |
| | |
| |
NOTE D—INDEMNIFICATIONS
Under the Fund’s organizational documents, its officers and directors are indemnified against certain liabilities arising out of the performance of their duties on behalf of the Fund. In addition, in the normal course of business, the Fund enters into contracts that provide general indemnifications to other parties. The Fund’s maximum exposure under these arrangements is unknown as this would involve future claims that may be made against the Fund that have not yet occurred. However, the Fund has not had prior claims or losses pursuant to these contracts and believes the risk of loss to be remote.
14
HILLIARD-LYONS GOVERNMENT FUND, INC.
500 West Jefferson Street
Louisville, Kentucky 40202
(502) 588-8400
Investment Adviser, Administrator
and Distributor
J.J.B. Hilliard, W.L. Lyons, LLC.
500 West Jefferson Street
Louisville, Kentucky 40202
(502) 588-8400
Custodian and Transfer Agent
State Street Bank and Trust Company
John Adams Building – 2N
1776 Heritage Drive
North Quincy, Massachusetts 02105
Legal Counsel
Godfrey & Kahn, S.C.
780 North Water Street
Milwaukee, Wisconsin 53202
Independent
Registered Public Accounting Firm
Cohen Fund Audit Services, Ltd.
800 Westpoint Parkway, Suite 1100
Westlake, Ohio 44145-1524
DIRECTORS AND OFFICERS
BOARD OF DIRECTORS
Lindy B. Street – Chair
William A. Blodgett, Jr.
J. Robert Shine
Gregory A. Wells
OFFICERS
Joseph C. Curry, Jr. – President
Dianna P. Wengler – Senior Vice President
and Treasurer
Edward J. Veilleux – Vice President
and Chief Compliance Officer
Stephanie J. Ferree – Assistant Vice President
and Secretary
Timothy P. Riordan – Assistant Vice President
Hilliard-Lyons
Government Fund, Inc.
Semi-Annual Report
February 28, 2009

| | |
| ITEM 2. | CODE OF ETHICS. |
| | |
| | Not applicable to semi-annual reports. |
| | |
| ITEM 3. | AUDIT COMMITTEE FINANCIAL EXPERT. |
| | |
| | Not applicable to semi-annual reports. |
| | |
| ITEM 4. | PRINCIPAL ACCOUNTANT FEES AND SERVICES. |
| | |
| | Not applicable to semi-annual reports. |
| | |
| ITEM 5. | AUDIT COMMITTEE OF LISTED REGISTRANTS. |
| | |
| | Not applicable to open-end investment companies. |
| | |
| ITEM 6. | INVESTMENTS. |
| | | |
| | (a) | Schedule of Investments. Included as part of the report to shareholders filed under Item 1 of this Form. |
| | | |
| | (b) | Divestment of securities in accordance with Section 13(c) of the Investment Company Act of 1940 (the “1940 Act”). Not Applicable. |
| | | |
| ITEM 7. | DISCLOSURE OF PROXY VOTING POLICIES AND PROCEDURES |
| | FOR CLOSED-END MANAGEMENT INVESTMENT COMPANIES. |
| | |
| | Not applicable to open-end investment companies. |
| | |
| ITEM 8. | PORTFOLIO MANAGERS OF CLOSED-END MANAGEMENT INVESTMENT COMPANIES. |
| | |
| | Not applicable to open-end investment companies. |
| | |
| ITEM 9. | PURCHASES OF EQUITY SECURITIES BY CLOSED-END MANAGEMENT |
| | INVESTMENT COMPANY AND AFFILIATED PURCHASERS. |
| | |
| | Not applicable to open-end investment companies. |
| | |
| ITEM 10. | SUBMISSION OF MATTERS TO A VOTE OF SECURITY HOLDERS. |
| | |
| | Not applicable. |
| | |
| ITEM 11. | CONTROLS AND PROCEDURES. |
| | | |
| | (a) | The registrant’s principal executive officer and principal financial officer have concluded that the registrant’s disclosure controls and procedures (as defined in Rule 30a-3(c) under the 1940 Act) are effective, based on an evaluation of those controls and procedures made as of a date within 90 days of the filing date of this report as required by Rule 30a-3(b) under the 1940 Act and Rule 13a-15(b) under the Securities Exchange Act of 1934. |
|
|
|
|
| | | |
| | (b) | There have been no changes in the registrant’s internal control over financial reporting (as defined in rule 30a-3(d) under the 1940 Act) that occurred during the registrant’s second fiscal quarter of the period covered by this report that have materially affected, or are reasonably likely to materially affect, the registrant’s internal control over financial reporting. |
|
|
|
|
| | |
| ITEM 12. | EXHIBITS. |
| | | |
| | (a)(1) | Code of Ethics. Incorporated by reference to the registrant’s Form N-CSR filed October 29, 2004. |
| | | |
| | (a)(2) | Certifications pursuant to Section 302 of the Sarbanes-Oxley Act of 2002. Filed herewith. |
| | | |
| | (a)(3) | Written solicitations to purchase securities pursuant to Rule 23c-1 under the 1940 Act. Not applicable. |
| | | |
| | (b) | Certifications pursuant to Section 906 of the Sarbanes-Oxley Act of 2002. Furnished herewith. |
SIGNATURES
Pursuant to the requirements of the Securities Exchange Act of 1934 and the Investment Company Act of 1940, the registrant has duly caused this report to be signed on its behalf by the undersigned, thereunto duly authorized.
| |
| (Registrant) | HILLIARD-LYONS GOVERNMENT FUND, INC. |
| |
| By (Signature and Title) | /s/ Joseph C. Curry, Jr.
|
| | Joseph C. Curry, Jr. |
| | President |
| | (Principal Executive Officer) |
Date: April 6, 2009
Pursuant to the requirements of the Securities Exchange Act of 1934 and the Investment Company Act of 1940, this report has been signed below by the following persons on behalf of the registrant and in the capacities and on the dates indicated.
| |
| By (Signature and Title) | /s/ Dianna P. Wengler
|
| | Dianna P. Wengler |
| | Senior Vice President and Treasurer |
| | (Principal Financial Officer) |
Date: April 6, 2009
| |
| By (Signature and Title) | /s/ Joseph C. Curry, Jr.
|
| | Joseph C. Curry, Jr. |
| | President |
| | (Principal Executive Officer) |
Date: April 6, 2009