UNITED STATES
SECURITIES AND EXCHANGE COMMISSION
Washington, D.C. 20549
Form 10-K
(Mark One)
| | | | | |
| ☒ | ANNUAL REPORT PURSUANT TO SECTION 13 OR 15(d) OF THE SECURITIES EXCHANGE ACT OF 1934 |
For the fiscal year ended December 31, 2024
or
| | | | | |
| ☐ | TRANSITION REPORT PURSUANT TO SECTION 13 OR 15(d) OF THE SECURITIES EXCHANGE ACT OF 1934 |
Commission file number 001-37702
Amgen Inc.
(Exact name of registrant as specified in its charter)
| | | | | | | | |
| Delaware | | 95-3540776 |
(State or other jurisdiction of
incorporation or organization) | | (I.R.S. Employer
Identification No.) |
| One Amgen Center Drive | | 91320-1799 |
| Thousand Oaks | |
| California | |
| (Address of principal executive offices) | | (Zip Code) |
(805) 447-1000
(Registrant’s telephone number, including area code)
Securities registered pursuant to Section 12(b) of the Act:
| | | | | | | | |
| Title of each class | Trading Symbol (s) | Name of each exchange on which registered |
| Common stock, $0.0001 par value | AMGN | The Nasdaq Global Select Market |
| 2.00% Senior Notes due 2026 | AMGN26 | The Nasdaq Global Select Market |
Securities registered pursuant to Section 12(g) of the Act: None
Indicate by check mark if the registrant is a well-known seasoned issuer, as defined in Rule 405 of the Securities Act. Yes ý No ¨
Indicate by check mark if the registrant is not required to file reports pursuant to Section 13 or Section 15(d) of the Act. Yes ¨ No ý
Indicate by check mark whether the registrant (1) has filed all reports required to be filed by Section 13 or Section 15(d) of the Securities Exchange Act of 1934 during the preceding 12 months (or for such shorter period that the registrant was required to file such reports), and (2) has been subject to such filing requirements for the past 90 days. Yes ý No ¨
Indicate by check mark whether the registrant has submitted electronically every Interactive Data File required to be submitted pursuant to Rule 405 of Regulation S-T (§ 232.405 of this chapter) during the preceding 12 months (or for such shorter period that the registrant was required to submit such files). Yes ý No ¨
Indicate by check mark whether the registrant is a large accelerated filer, an accelerated filer, a non-accelerated filer, a smaller reporting company, or an emerging growth company. See the definitions of “large accelerated filer,” “accelerated filer,” “smaller reporting company,” and “emerging growth company” in Rule 12b-2 of the Exchange Act.
| | | | | | | | | | | | | | |
| Large accelerated filer | Accelerated filer | Non-accelerated filer | Smaller reporting company | Emerging growth company |
| ☒ | ☐ | ☐ | ☐ | ☐ |
If an emerging growth company, indicate by check mark if the registrant has elected not to use the extended transition period for complying with any new or revised financial accounting standards provided pursuant to Section 13(a) of the Exchange Act. ¨
Indicate by check mark whether the registrant has filed a report on and attestation to its management’s assessment of the effectiveness of its internal control over financial reporting under Section 404(b) of the Sarbanes-Oxley Act (15 U.S.C. 7262(b)) by the registered public accounting firm that prepared or issued its audit report. ☒
If securities are registered pursuant to Section 12(b) of the Act, indicate by check mark whether the financial statements of the registrant included in the filing reflect the correction of an error to previously issued financial statements. ☐
Indicate by check mark whether any of those error corrections are restatements that required a recovery analysis of incentive-based compensation received by any of the registrant’s executive officers during the relevant recovery period pursuant to §240.10D-1(b). ☐
Indicate by check mark whether the registrant is a shell company (as defined in Rule 12b-2 of the Act) Yes ☐ No ý
The approximate aggregate market value of voting and non-voting stock held by non-affiliates of the registrant was $167.6 billion as of the last business day of the registrant’s most recently completed second fiscal quarter.(A)
(A)Excludes 948,404 shares of common stock held by directors and executive officers, and any stockholders whose ownership exceeds ten percent of the shares outstanding, as of the last business day of the registrant’s most recently completed second fiscal quarter. Exclusion of shares held by any person should not be construed to indicate that such person possesses the power, directly or indirectly, to direct or cause the direction of the management or policies of the registrant, or that such person is controlled by or under common control with the registrant.
537,204,943
(Number of shares of common stock outstanding as of February 11, 2025)
DOCUMENTS INCORPORATED BY REFERENCE
Specified portions of the registrant’s Proxy Statement with respect to the 2025 Annual Meeting of Stockholders to be held on May 23, 2025, are incorporated by reference into Part III of this annual report.
INDEX
| | | | | | | | |
| | Page No. |
| | |
| | |
| Item 1. | | |
| | |
| | |
| | |
| | |
| | |
| | |
| | |
| | |
| | |
| | |
| | |
| Item 1A. | | |
| Item 1B. | | |
| Item 1C. | | |
| Item 2. | | |
| Item 3. | | |
| Item 4. | | |
| | |
| Item 5. | | |
| Item 6. | | |
| Item 7. | | |
| Item 7A. | | |
| Item 8. | | |
| Item 9. | | |
| Item 9A. | | |
| Item 9B. | | |
| Item 9C. | | |
| | |
| Item 10. | | |
| Item 11. | | |
| Item 12. | | |
| Item 13. | | |
| Item 14. | | |
| | |
| Item 15. | | |
| Item 16. | | |
| | |
Defined Terms and Products
Defined terms
We use several terms in this Form 10-K, including but not limited to those that are finance, regulation and disease-state related as well as names of other companies, which are given below.
| | | | | | | | | |
| Term | Description | | | | |
| | | | | |
| 2017 Tax Act | Tax Cuts and Jobs Act of 2017 | | | | |
| | | | | |
| | | | | |
| 340B Program | Federal 340B Drug Pricing Program | | | | |
| Amended 2009 Plan | Amended and Restated 2009 Equity Incentive Plan | | | | |
| | | | | |
| AOCI | accumulated other comprehensive income (loss) | | | | |
| ASR | Accelerated Share Repurchase | | | | |
| AstraZeneca | AstraZeneca plc | | | | |
| ASU | Accounting Standards Update | | | | |
| ATMOS | Amgen Technology and Medical Organizations | | | | |
| B-ALL | B-cell precursor acute lymphoblastic leukemia | | | | |
| BeiGene | BeiGene, Ltd. | | | | |
BiTE® | bispecific T-cell engager | | | | |
| BLA | Biologics License Application | | | | |
| BPCIA | Biologics Price Competition and Innovation Act of 2009 | | | | |
| CCPA | California Consumer Privacy Act of 2018 | | | | |
| CDT | Cybersecurity & Digital Trust | | | | |
| | | | | |
| CGRP | calcitonin gene-related peptide | | | | |
| ChemoCentryx | ChemoCentryx, Inc. | | | | |
| chemotherapy | anticancer medicines | | | | |
| CHMP | Committee for Medicinal Products for Human Use | | | | |
| CIO | Chief Information Officer | | | | |
| CISO | Chief Information Security Officer | | | | |
| CMS | Centers for Medicare & Medicaid Services | | | | |
| COSO | Committee of Sponsoring Organizations of the Treadway Commission | | | | |
| | | | | |
| | | | | |
| CRCC | Corporate Responsibility and Compliance Committee | | | | |
| | | | | |
| DLL3 | delta-like ligand 3 | | | | |
| DOJ | U.S. Department of Justice | | | | |
| EC | European Commission | | | | |
| Eczacıbaşı | EIS Eczacıbaşı İlaç, Sınai ve Finansal Yatırımlar Sanayi ve Ticaret A.Ş. | | | | |
| EMA | European Medicines Agency | | | | |
| EPO | European Patent Office | | | | |
| EPS | earnings per share | | | | |
| ESG | environmental, social and governance | | | | |
| EU | European Union | | | | |
| FASB | Financial Accounting Standards Board | | | | |
| FCPA | U.S. Foreign Corrupt Practices Act | | | | |
| FDA | U.S. Food and Drug Administration | | | | |
| FDCA | Federal Food, Drug, and Cosmetic Act | | | | |
| Fitch | Fitch Ratings, Inc. | | | | |
| FTC | Federal Trade Commission | | | | |
| GAAP | U.S. generally accepted accounting principles | | | | |
| GDPR | General Data Protection Regulation | | | | |
| | | | | |
| Gensenta | Gensenta İlaç Sanayi ve Ticaret A.Ş. | | | | |
| | | | | | | | | |
| Term | Description | | | | |
| HHS | U.S. Department of Health & Human Services | | | | |
| Horizon | Horizon Therapeutics plc | | | | |
| IGF-1R | insulin-like growth factor-1 receptor | | | | |
| | | | | |
| IND | Investigational New Drug Application | | | | |
| IPR&D | in-process research and development | | | | |
| IRA | Inflation Reduction Act of 2022 | | | | |
| IRS | Internal Revenue Service | | | | |
| | | | | |
| | | | | |
| KRAS | Kirsten rat sarcoma viral oncogene | | | | |
| Kyowa Kirin | Kyowa Kirin Co., Ltd. | | | | |
| LDL-C | low-density lipoprotein cholesterol | | | | |
| Lilly | Eli Lilly and Company | | | | |
| | | | | |
| | | | | |
| MAA | Marketing Authorisation Application | | | | |
| | | | | |
| MD&A | management’s discussion and analysis | | | | |
| Moody’s | Moody’s Investors Service, Inc. | | | | |
| | | | | |
| | | | | |
| MRD | minimal residual disease | | | | |
| Neumora | Neumora Therapeutics, Inc. | | | | |
| NOL | net operating loss | | | | |
| | | | | |
| NSCLC | non-small cell lung cancer | | | | |
| OECD | Organisation for Economic Co-operation and Development | | | | |
| OIG | Office of Inspector General | | | | |
| | | | | |
| | | | | |
| PBM | pharmacy benefit manager | | | | |
| PCSK9 | proprotein convertase subtilisin/kexin type 9 | | | | |
| PDAB | Prescription Drug Affordability Board | | | | |
| PDE4 | phosphodiesterase 4 | | | | |
| | | | | |
| | | | | |
| | | | | |
| | | | | |
| | | | | |
| R&D | research and development | | | | |
| RANKL | receptor activator of nuclear factor kappa-B ligand | | | | |
| RAR | Revenue Agent Report | | | | |
| RAS | Rat sarcoma viral oncogene | | | | |
| Regeneron | Regeneron Pharmaceuticals, Inc. | | | | |
| REMS | Risk Evaluation and Mitigation Strategy | | | | |
| ROU | right-of-use | | | | |
| ROW | rest of world | | | | |
| RSUs | restricted stock units | | | | |
| S&P | Standard & Poor’s Financial Services LLC | | | | |
| | | | | |
| SEC | U.S. Securities and Exchange Commission | | | | |
| SG&A | selling, general and administrative | | | | |
| | | | | |
| SOFR | Secured Overnight Financing Rate | | | | |
| TED | thyroid eye disease | | | | |
| Teneobio | Teneobio, Inc. | | | | |
| U.S. Treasury | U.S. Department of Treasury | | | | |
| USPTO | U.S. Patent and Trademark Office | | | | |
| UTB | unrecognized tax benefit | | | | |
| | | | | |
| | | | | |
| | | | | |
| | | | | |
| | | | | |
| | | | | |
| | | | | |
| | | | | |
| | | | | |
| | | | | |
| | | | | |
Products
The brand names of our products, our delivery devices and certain of our product candidates and their associated generic names are given below.
| | | | | |
| Term | Description |
| |
| ACTIMMUNE | ACTIMMUNE® (interferon gamma-1b) |
| Aimovig | Aimovig® (erenumab-aooe) |
| AMJEVITA/AMGEVITA | AMJEVITA® (adalimumab-atto)/AMGEVITA™ (adalimumab) |
| Aranesp | Aranesp® (darbepoetin alfa) |
| AutoTouch | AutoTouch® |
| AVSOLA | AVSOLA® (infliximab-axxq) |
| BKEMV/BEKEMV | BKEMV™ (eculizumab-aeeb)/BEKEMV™ (eculizumab) |
| BLINCYTO | BLINCYTO® (blinatumomab) |
| |
| BUPHENYL | BUPHENYL® (sodium phenylbutyrate) |
| ConfiPen | ConfiPen™ |
| Corlanor | Corlanor® (ivabradine) |
| |
| |
| DUEXIS | DUEXIS® (ibuprofen and famotidine) |
| ENBREL | Enbrel® (etanercept) |
| ENBREL Mini | ENBREL Mini® |
| EPOGEN | EPOGEN® (epoetin alfa) |
| EVENITY | EVENITY® (romosozumab-aqqg) |
| IMDELLTRA/IMDYLLTRA | IMDELLTRA® (tarlatamab-dlle)/IMDYLLTRA® (tarlatamab) |
| IMLYGIC | IMLYGIC® (talimogene laherparepvec) |
| KANJINTI | KANJINTI® (trastuzumab-anns) |
| KRYSTEXXA | KRYSTEXXA® (pegloticase) |
| KYPROLIS | KYPROLIS® (carfilzomib) |
| LUMAKRAS/LUMYKRAS | LUMAKRAS®/LUMYKRAS™ (sotorasib) |
| MariTide | Maridebart cafraglutide (formerly AMG 133) |
| MVASI | MVASI® (bevacizumab-awwb) |
| Neulasta | Neulasta® (pegfilgrastim) |
| NEUPOGEN | NEUPOGEN® (filgrastim) |
| Nplate | Nplate® (romiplostim) |
| |
| Onpro | Onpro® |
| |
| Otezla | Otezla® (apremilast) |
| Parsabiv | Parsabiv® (etelcalcetide) |
| PAVBLU | PAVBLU™ (aflibercept-ayyh, formerly ABP 938) |
| PENNSAID | PENNSAID® (diclofenac sodium topical solution) 2% |
| PROCYSBI | PROCYSBI® (cysteamine bitartrate) |
| Prolia | Prolia® (denosumab) |
| Pushtronex | Pushtronex® |
| QUINSAIR | QUINSAIR® (levofloxacin) |
| RAVICTI | RAVICTI® (glycerol phenylbutyrate) |
| RAYOS | RAYOS® (prednisone) |
| Repatha | Repatha® (evolocumab) |
| RIABNI | RIABNI® (rituximab-arrx) |
| |
| |
| Sensipar/Mimpara | Sensipar®/Mimpara™ (cinacalcet) |
| SureClick | SureClick® |
| | | | | |
| Term | Description |
| TAVNEOS | TAVNEOS® (avacopan) |
| TEPEZZA | TEPEZZA® (teprotumumab-trbw) |
| TEZSPIRE | TEZSPIRE® (tezepelumab-ekko) |
| UPLIZNA | UPLIZNA® (inebilizumab-cdon) |
| Vectibix | Vectibix® (panitumumab) |
| WEZLANA/WEZENLA | WEZLANA™ (ustekinumab-auub) / WEZENLA™ (ustekinumab) |
| |
| XGEVA | XGEVA® (denosumab) |
Products referenced in this report that are not included in the above list are trademarks of their respective owners. They are Avastin®, BESPONSA®, Cosentyx®, DARZALEX®, DUPIXENT®, ERBITUX®, EYLEA®, FASENRA®, Herceptin®, HUMIRA®, HYRIMOZ®, KEYTRUDA®, LEQVIO®, Nucala®, POMALYST®/IMNOVID®, PRALUENT®, PROCRIT®, PROMACTA®/REVOLADE™, Remicade®, REVLIMID®, RINVOQ®, Rituxan®/MabThera®, Skyrizi®, SOLIRIS®, SOTYKTU®, STELARA®, Taltz®, Teribone™, Tremfya®, VELCADE®, Xeljanz® and XOLAIR®.
PART I
Amgen Inc. (including its subsidiaries, referred to as “Amgen,” “the Company,” “we,” “our” or “us”) discovers, develops, manufactures and delivers innovative medicines to fight some of the world’s toughest diseases. We focus on areas of high unmet medical need and leverage our expertise to strive for solutions that dramatically improve people’s lives, while also reducing the social and economic burden of disease. We helped launch the biotechnology industry more than 40 years ago and have grown to be one of the world’s leading independent biotechnology companies. Our robust pipeline includes potential first-in-class medicines at all stages of development. We have a presence in approximately 100 countries worldwide.
Amgen was incorporated in California in 1980 and became a Delaware corporation in 1987. Amgen operates in one operating segment: human therapeutics.
Significant Developments
Following is a summary of significant developments affecting our business that have occurred and that we have reported since the filing of our Annual Report on Form 10-K for the year ended December 31, 2023.
Products/Pipeline
Maridebart cafraglutide
In November 2024, we announced positive data at 52 weeks in part 1 of a double-blind, dose-ranging Phase 2 study with MariTide, a differentiated peptide-antibody conjugate subcutaneously administered monthly or less frequently. In people living with obesity or overweight without type 2 diabetes, MariTide demonstrated up to approximately 20% average weight loss at week 52 without a weight loss plateau. The study also showed people living with obesity or overweight and type 2 diabetes achieved up to approximately 17% average weight loss without a weight loss plateau and lowered their average hemoglobin A1C (HbA1c) by up to 2.2 percentage points at week 52. MariTide also demonstrated robust and clinically meaningful improvements in cardiometabolic parameters, including blood pressure, triglycerides and high-sensitivity C-reactive protein (hs-CRP) across doses.
The most common adverse events (AEs) in part 1 of the Phase 2 study were gastrointestinal (GI) related, including nausea, vomiting and constipation. The incidence of nausea and vomiting was substantially reduced with dose escalation. The discontinuation rate in the dose escalation arms due to any AE was approximately 11% and less than 8% for GI-related AEs.
IMDELLTRA
In May 2024, we announced IMDELLTRA received accelerated approval from the FDA for the treatment of adult patients with extensive-stage small cell lung cancer (ES-SCLC) with disease progression on or after platinum-based chemotherapy.
BLINCYTO
In June 2024, we announced BLINCYTO received approval from the FDA in frontline consolidation for patients with CD19-positive Philadelphia chromosome-negative B-cell precursor acute lymphoblastic leukemia (B-ALL).
In December 2024, we announced new data from a Phase 3 trial demonstrating that adding BLINCYTO to chemotherapy significantly improves disease-free survival (DFS) in newly diagnosed pediatric patients with National Cancer Institute (NCI) standard risk (SR) B-ALL of average or higher risk of relapse. The study met its primary endpoint of DFS. Overall, the 3-year DFS was 96.0% for patients treated with chemotherapy plus BLINCYTO compared to 87.9% for those treated with only chemotherapy. The hazard ratio (HR) was 0.39 [95% confidence interval (CI) 0.24-0.64], indicating a 61% reduction in the risk of disease relapse, secondary malignant neoplasm or remission death with BLINCYTO. At three years, more patients remained alive and cancer free when treated with BLINCYTO plus chemotherapy compared to chemotherapy alone. Safety results are consistent with the known safety profile of BLINCYTO.
TEPEZZA
In September 2024, we announced TEPEZZA was approved for the treatment of active or high clinical activity score (CAS) thyroid eye disease (TED) in Japan.
UPLIZNA
In June 2024, we announced positive top-line results from our Phase 3 registrational trial evaluating UPLIZNA for the treatment of Immunoglobulin G4-related disease (IgG4-RD). The trial met its primary endpoint, showing a statistically significant 87% reduction in the risk of IgG4-RD flare compared to placebo during the 52-week placebo-controlled period. All key secondary endpoints were also met, which were annualized flare rate; flare-free, treatment-free complete remission; and flare-free, corticosteroid-free complete remission. No new safety signals were identified. The FDA has accepted our submission under priority review, with a Prescription Drug User Fee Action (PDUFA) date of April 3, 2025.
In September 2024, we announced top-line results of the Phase 3 MINT trial of UPLIZNA. MINT is a Phase 3, randomized, placebo-controlled, double-blind trial assessing the efficacy and safety of UPLIZNA in patients with generalized myasthenia gravis (gMG). The trial met its primary endpoint, with a statistically significant change from baseline in Myasthenia Gravis Activities of Daily Living (MG-ADL) score for UPLIZNA compared with placebo at week 26 of the combined patient population. UPLIZNA demonstrated a statistically significant and clinically meaningful change from baseline compared to placebo for four out of five key secondary endpoints. Overall safety results during the placebo-controlled period of the trial were consistent with the known safety profile of UPLIZNA.
Rocatinlimab
In September 2024, we announced top-line results of the Phase 3 ROCKET HORIZON trial of rocatinlimab, an investigational therapy targeting the OX40 receptor and one of eight studies in the rocatinlimab Phase 3 clinical trial program for atopic dermatitis. HORIZON, a Phase 3, randomized, placebo-controlled, double-blind trial assessing the efficacy, safety and tolerability of rocatinlimab monotherapy in adults with moderate-to-severe atopic dermatitis, met its co-primary endpoints and reached statistically significant difference from placebo for all key secondary endpoints. Overall safety findings in the study were comparable to those seen in the Phase 2b study. Rocatinlimab is being developed in collaboration with Kyowa Kirin.
TEZSPIRE
In November 2024, we announced positive top-line results from the Phase 3 WAYPOINT trial, a double-blind, multi-center, randomized, placebo-controlled, parallel group trial designed to evaluate the efficacy and safety of TEZSPIRE in adults with severe chronic rhinosinusitis with nasal polyps (CRSwNP). The trial demonstrated patients treated with TEZSPIRE had a statistically significant and clinically meaningful reduction in the size of nasal polyps and reduced nasal congestion compared to placebo with safety and tolerability profiles consistent with the known profile of the medicine. TEZSPIRE is being developed in collaboration with AstraZeneca.
Marketing, Distribution and Selected Marketed Products
The largest concentration of our sales and marketing forces is based in the United States and Europe. We also commercialize and market our products into other geographic territories, including Japan, China and other parts of Asia, Latin America and the Middle East by using our own affiliates, by acquiring existing third-party businesses or product rights or by collaborating with third parties. In the Asia Pacific region, we also sell our products in partnership with other companies, including Astellas Pharma Inc., BeiGene, Daiichi Sankyo Co., Ltd., Takeda Pharmaceutical Co., Ltd., Kyowa Kirin and Mitsubishi Tanabe Pharma Corporation. This international footprint allows us to deliver our medicines to more patients globally. See Business Relationships for our significant alliances. Whether we use our own sales and marketing forces or a third party’s services varies across these markets. Such use typically depends on several factors, including the nature of entry into the new market, the size of an opportunity and operational capabilities. Together with our collaborators, we market our products to healthcare providers, including physicians or their clinics, dialysis centers, hospitals and pharmacies.
In the United States, substantially all of our sales are to pharmaceutical wholesale distributors, which is the principal means of distributing our products to healthcare providers. We market certain products through direct-to-consumer channels, including print, television and online media. For further discussion, see Government Regulation—Regulation in the United States—Regulation of Product Marketing and Promotion. Outside the United States, we sell principally to healthcare providers and/or pharmaceutical wholesale distributors depending on the distribution practice in each country.
Our product sales to three large wholesalers, McKesson Corporation, Cencora, Inc. and Cardinal Health, Inc., each individually accounted for more than 10% of total revenues for each of the years 2024, 2023 and 2022. On a combined basis, these wholesalers accounted for 77%, 79% and 82% of worldwide gross revenues for 2024, 2023 and 2022, respectively. We monitor the financial condition of our larger customers and limit our credit exposure by setting credit limits and, in certain circumstances, by requiring letters of credit or obtaining credit insurance.
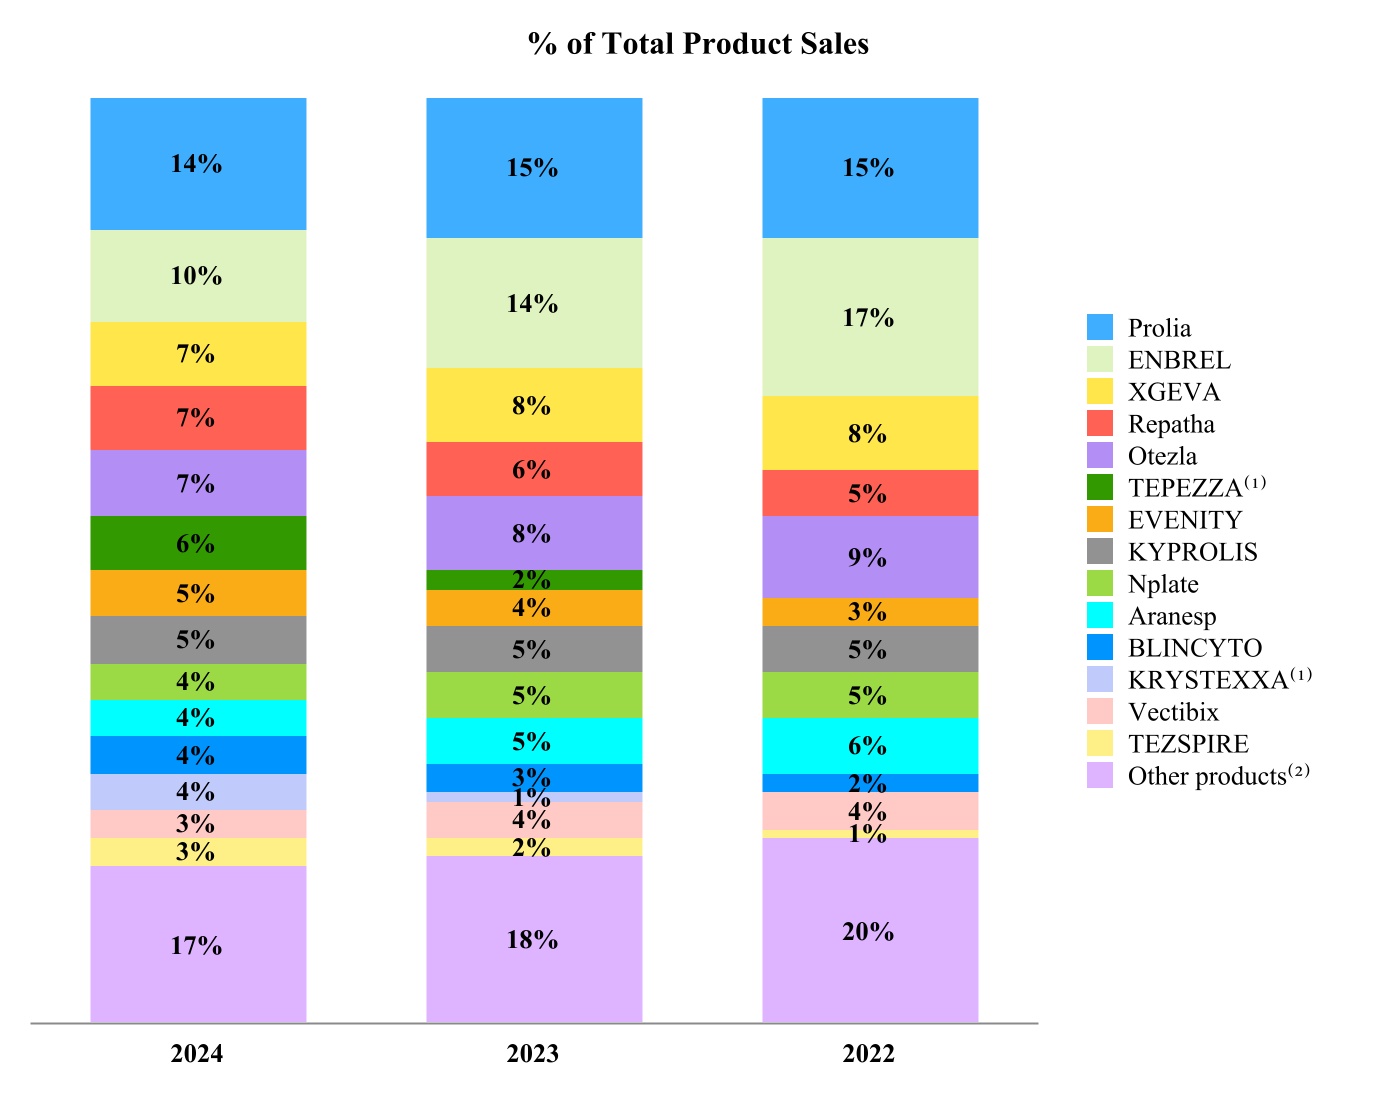
Our products are marketed around the world, with the United States as our largest market. The following chart shows our product sales by principal product, and the table below (dollar amounts in millions) shows product sales by geography for the years 2024, 2023 and 2022.
| | | | | | | | | | | | | | | | | | | | | | | | | | |
| 2024 | | 2023 | | 2022 |
| Product Sales by Geography: | | | | | | | | |
| U.S. | $ | 23,301 | | 73 | % | | $ | 19,272 | | 72 | % | | $ | 17,743 | | 72 | % |
| ROW | 8,725 | | 27 | % | | 7,638 | | 28 | % | | 7,058 | | 28 | % |
| Total | $ | 32,026 | | 100 | % | | $ | 26,910 | | 100 | % | | $ | 24,801 | | 100 | % |
____________
(1) TEPEZZA and KRYSTEXXA were acquired from our Horizon acquisition on October 6, 2023, and include product sales in the periods after the acquisition date.
(2) Consists of product sales of our non-principal products.
Prolia
We market Prolia in many countries around the world. Prolia and XGEVA contain the same active ingredient but are approved for different indications, patient populations, dose and frequency of administration. Prolia was launched in the United States and Europe in 2010. In the United States, it is used primarily in the indication for the treatment of postmenopausal women with osteoporosis at high risk of fracture and for treatment to increase bone mass in men with osteoporosis at high risk of fracture. In Europe, Prolia is used primarily for the treatment of osteoporosis in men and postmenopausal women at increased risk of fracture. Our patents for RANKL antibodies, including sequences, for Prolia expire in February 2025 in the United States and November 2025 in select countries in Europe. See Patents table below.
ENBREL
We market ENBREL, a tumor necrosis factor blocker, in the United States and Canada. ENBREL was launched in 1998 and is used primarily in indications for the treatment of adult patients with moderately to severely active rheumatoid arthritis, patients with chronic moderate-to-severe plaque psoriasis who are candidates for systemic therapy or phototherapy and patients with active psoriatic arthritis.
XGEVA
We market XGEVA in many countries around the world. Prolia and XGEVA contain the same active ingredient but are approved for different indications, patient populations, dose and frequency of administration. XGEVA was launched in 2010 and is used primarily in the indication for prevention of skeletal-related events (pathological fracture, radiation to bone, spinal cord compression or surgery to bone) in patients with bone metastases from solid tumors and multiple myeloma. Our patents for RANKL antibodies, including sequences, for XGEVA expire in February 2025 in the United States and November 2025 in select countries in Europe. See Patents table below.
Repatha
We market Repatha, a PCSK9 inhibitor, in many countries around the world. Repatha was launched in 2015 and is indicated to reduce the risks of myocardial infarction, stroke and coronary revascularization in adults with established cardiovascular disease. Repatha is also indicated to reduce low-density lipoprotein cholesterol (LDL-C) in adults with primary hyperlipidemia, including heterozygous familial hypercholesterolemia (HeFH).
Otezla
We market Otezla, a small molecule that inhibits phosphodiesterase 4 (PDE4), in many countries around the world. Otezla was acquired from Bristol-Myers Squibb Company in November 2019 after its acquisition of Celgene Corporation. Otezla is an oral therapy approved for the treatment of adults with plaque psoriasis across all severities (in the United States, Japan and Australia) and moderate-to-severe plaque psoriasis (in other global markets, including Europe); for adults with active psoriatic arthritis; for adults with oral ulcers associated with Behçet’s disease; and for pediatric patients six years of age and older and weighing at least 20 kilograms with moderate-to-severe plaque psoriasis who are candidates for phototherapy or systemic therapy.
TEPEZZA
We market TEPEZZA primarily in the United States. TEPEZZA was acquired through our Horizon acquisition in October 2023. TEPEZZA is a fully human monoclonal antibody and a targeted inhibitor of the insulin-like growth factor-1 receptor (IGF-1R) that is the first and only approved medicine for the treatment of thyroid eye disease (TED).
EVENITY
Together with our collaboration partners, we market EVENITY in many countries around the world. EVENITY was launched in the United States and Japan in 2019. In the United States, it is used in the indication for the treatment of osteoporosis in postmenopausal women at high risk for fracture, defined as a history of osteoporotic fracture, or multiple risk factors for fracture; or patients who have failed or are intolerant to other available osteoporosis therapy. In Japan, EVENITY is used primarily in the indication for the treatment of osteoporosis in men and postmenopausal women at high risk of fracture.
KYPROLIS
We market KYPROLIS primarily in the United States and Europe. KYPROLIS was launched in 2012 and is indicated in combination with (i) dexamethasone, (ii) lenalidomide plus dexamethasone, (iii) daratumumab plus dexamethasone, (iv) daratumumab plus hyaluronidase-fihj plus dexamethasone, and (v) isatuximab plus dexamethasone for the treatment of patients with relapsed or refractory multiple myeloma who have received one to three prior lines of therapy. It is also approved as a single agent for patients with relapsed or refractory multiple myeloma who have received one or more previous therapies.
Nplate
We market Nplate in many countries around the world. Nplate was launched in 2008 and is indicated to treat thrombocytopenia in patients with immune thrombocytopenia (ITP) who have had an insufficient response to corticosteroids, immunoglobulins or splenectomy.
Aranesp
We market Aranesp primarily in the United States and Europe. Aranesp was launched in 2001 and is indicated to treat a lower-than-normal number of red blood cells (anemia) caused by chronic kidney disease (CKD) in both patients on dialysis and patients not on dialysis. Aranesp is also indicated for the treatment of anemia due to concomitant myelosuppressive chemotherapy in certain patients with nonmyeloid malignancies and when chemotherapy will be used for at least two months after starting Aranesp.
BLINCYTO
We market BLINCYTO in many countries around the world. BLINCYTO was launched in 2014 and has proven efficacy in a wide range of patients with CD19-positive B-ALL, including those who are MRD(–) or MRD(+) in frontline consolidation, and those with relapsed or refractory (R/R) disease. Acute lymphoblastic leukemia (ALL) is a cancer of the blood in which a particular kind of white blood cell is growing out of control.
KRYSTEXXA
We market KRYSTEXXA in the United States. KRYSTEXXA was acquired through our Horizon acquisition in October 2023. KRYSTEXXA is the first and only FDA-approved medicine for the treatment of chronic refractory gout.
Vectibix
We market Vectibix in many countries around the world. Vectibix was launched in 2006 and is indicated for the treatment of patients with wild-type RAS metastatic colorectal cancer (mCRC, cancer that has spread outside the colon and rectum) and in the United States, in combination with LUMAKRAS, for the treatment of adult patients with KRAS G12C-mutated mCRC, who have received prior fluoropyrimidine-, oxaliplatin- and irinotecan-based chemotherapy. RAS status is determined by an FDA-approved test.
TEZSPIRE
Together with our collaboration partner, we market TEZSPIRE in many countries around the world. TEZSPIRE is currently approved for the treatment of severe asthma in the United States, Europe, Japan and more than 50 countries across the globe. TEZSPIRE is a first-in-class human monoclonal antibody that works on the primary source of inflammation: the airway epithelium, which is the first point of contact for viruses, allergens, pollutants and other environmental insults.
Other Marketed Products
We also market a number of other products in various markets worldwide, including but not limited to AMJEVITA/AMGEVITA, MVASI, Neulasta, RAVICTI, UPLIZNA, Parsabiv, LUMAKRAS/LUMYKRAS, Aimovig, TAVNEOS, PROCYSBI, EPOGEN and IMDELLTRA.
Patents
The following table lists our outstanding material patents for the indicated product by territory, general subject matter and latest expiry date. Certain of the European patents are subjects of supplemental protection certificates that provide additional protection for the products in certain European countries beyond the dates listed in the table. See footnotes to the patent table below.
One or more patents with the same or earlier expiry dates may fall under the same general subject matter and are not listed separately.
| | | | | | | | | | | | | | | | | | | | |
| Product | | Territory | | General subject matter | | Expiration |
Prolia®/XGEVA® (denosumab) | | U.S. | | RANKL antibodies, including sequences | | 2/19/2025 |
| Europe | | RANKL antibodies, including sequences(1) | | 6/25/2022 |
Enbrel® (etanercept) | | U.S. | | Fusion protein and pharmaceutical compositions | | 11/22/2028 |
| U.S. | | DNA encoding fusion protein and methods of making fusion protein | | 4/24/2029 |
| U.S. | | Formulations and methods of preparing formulations | | 10/19/2037 |
| | | | | | | | | | | | | | | | | | | | |
| Product | | Territory | | General subject matter | | Expiration |
Repatha® (evolocumab) | | U.S. | | Antibodies | | 8/27/2029 |
| U.S. | | Methods of treatment | | 11/22/2030 |
| Europe | | Compositions(1) | | 8/22/2028 |
| Europe | | Methods of treatment | | 5/10/2032 |
| Europe | | Formulation | | 5/3/2033 |
Otezla® (apremilast)(2) | | U.S. | | Compositions and compounds(3) | | 2/16/2028 |
TEPEZZA® (teprotumumab-trbw) | | U.S. | | IGF-1R antibodies(4) | | 3/3/2029 |
| U.S. | | Methods of treatment | | 12/11/2039 |
EVENITY® (romosozumab-aqqg) | | U.S. | | Antibodies | | 4/25/2026 |
| U.S. | | Formulation and methods of using formulation | | 5/11/2031 |
| U.S. | | Methods of treatment | | 4/9/2033 |
| Europe | | Antibodies(1) | | 4/28/2026 |
| Europe | | Formulation and methods of using formulation | | 5/11/2031 |
| Europe | | Methods of treatment | | 4/18/2032 |
KYPROLIS® (carfilzomib) | | U.S. | | Methods of treatment | | 4/14/2025 |
| U.S. | | Compositions and compounds | | 12/7/2027 |
| U.S. | | Methods of making | | 5/8/2033 |
| Europe | | Compositions, compounds and methods of treatment(1) | | 12/7/2025 |
Nplate® (romiplostim) | | U.S. | | Formulation | | 2/12/2028 |
| Europe | | Formulation | | 4/20/2027 |
BLINCYTO® (blinatumomab) | | U.S. | | Pharmaceutical compositions and bifunctional polypeptides | | 4/6/2030 |
| U.S. | | Method of treatment | | 8/26/2031 |
| Europe | | Bifunctional polypeptides(1) | | 11/26/2024 |
| Europe | | Method of treatment | | 11/6/2029 |
KRYSTEXXA® (pegloticase) | | U.S. | | Polypeptides and pharmaceutical compositions | | 4/11/2026 |
| U.S. | | Methods of treatment | | 6/25/2030 |
TEZSPIRE® (tezepelumab-ekko) | | U.S. | | Polypeptides(5) | | 2/3/2029 |
| U.S. | | Methods of treatment | | 8/23/2038 |
| Europe | | Polypeptides(1) | | 9/9/2028 |
UPLIZNA® (inebilizumab-cdon) | | U.S. | | CD19 antibodies and pharmaceutical compositions | | 6/11/2034 |
| Europe | | CD19 antibodies, pharmaceutical compositions and methods of treatment(1) | | 9/7/2027 |
Parsabiv® (etelcalcetide)
| | U.S. | | Compound and pharmaceutical composition | | 2/7/2031 |
| U.S. | | Formulation | | 6/27/2034 |
| U.S. | | Methods of making | | 8/9/2035 |
| Europe | | Compound and pharmaceutical composition(1) | | 7/29/2030 |
| Europe | | Formulation | | 6/27/2034 |
| Europe | | Methods of making | | 4/3/2035 |
LUMAKRAS®/LUMYKRAS™ (sotorasib) | | U.S. | | Compounds and pharmaceutical compositions | | 5/21/2038 |
| U.S. | | Crystalline form, pharmaceutical compositions and methods of treatment | | 5/20/2040 |
| U.S. | | Methods of treatment | | 9/15/2040 |
| Europe | | Compounds, pharmaceutical compositions and methods of treatment | | 5/21/2038 |
Aimovig® (erenumab-aooe) | | U.S. | | Polynucleotides encoding CGRP receptor antibodies and methods of making antibodies | | 12/11/2031 |
| U.S. | | CGRP receptor antibodies | | 5/17/2032 |
| U.S. | | Methods of treatment | | 4/22/2036 |
| U.S. | | Compositions and pharmaceutical formulations | | 4/1/2039 |
| Europe | | CGRP receptor antibodies(1) | | 12/18/2029 |
| Europe | | Methods of treatment | | 8/10/2035 |
TAVNEOS® (avacopan) | | U.S. | | Compounds and pharmaceutical compositions(5) | | 2/3/2031 |
| U.S. | | Formulations | | 11/27/2039 |
| U.S. | | Amorphous forms and pharmaceutical compositions | | 5/29/2041 |
| Europe | | Compounds, pharmaceutical compositions, and methods of treatment(1) | | 12/21/2029 |
| Europe | | Formulations | | 11/27/2039 |
IMDELLTRA®(tarlatamab-dlle)/IMDYLLTRA® (tarlatamab) | | U.S. | | Bifunctional polypeptides(5) | | 8/12/2036 |
| Europe | | Bifunctional polypeptides | | 8/1/2036 |
| | | | | | |
| | | | | |
| | | | | |
| | | | | | |
| | | | | | |
(1)A European patent with this subject matter may also be entitled to supplemental protection in one or more countries in Europe, and the length of any such extension will vary by country. For example, supplementary protection certificates have been issued related to the indicated products for patents in at least the following countries:
•denosumab — France, Germany, Italy, Spain and the United Kingdom, expiring in November 2025
•evolocumab — France, Italy, Spain and the United Kingdom, expiring in 2031
•romosozumab — France, Germany, Italy, Spain and the United Kingdom, expiring in 2031
•carfilzomib — France, Germany, Italy, Spain and the United Kingdom, expiring in 2030
•blinatumomab — France, Germany, Italy, Spain and the United Kingdom, expiring in 2029
•tezepelumab — France, Italy and Spain, expiring in 2033
•inebilizumab — France, Italy and Spain, expiring in 2032
•etelcalcetide — France, Germany, Italy, Spain and the United Kingdom, expiring in 2031
•erenumab — France, Germany, Italy, Spain and the United Kingdom, expiring in 2033
•avacopan — France, Italy, Spain and the United Kingdom, expiring in 2034
(2)Regulatory data exclusivity for apremilast in Europe expires in 2026.
(3)Pediatric exclusivity granted to 8/16/2028 for a patent with this subject matter.
(4)We have biologic exclusivity in the United States covering teprotumumab-trbw that will expire in 2032.
(5)A patent with this subject matter may be entitled to patent term extension in the United States.
Competition
We operate in a highly competitive environment. A number of our marketed products are indicated for disease areas in which other products or treatments are currently available or are being pursued by our competitors through R&D activities. Additionally, some competitor-marketed products target the same genetic pathways as our recently launched marketed products or product candidates. This competition could impact the pricing and market share of our products. We continue to pursue ways of increasing the value of our medicines through innovations, which can include expanding the disease areas for which our products are indicated and finding new methods to make the delivery or manufacture of our medicines easier and less costly. Such activities can offer important opportunities for differentiation. We plan to continue pursuing innovation efforts to strengthen our competitive position. Such position may be based on, among other things, safety, efficacy, reliability, availability, patient convenience, delivery devices, price, reimbursement, access to and timing of market entry and patent position and expiration.
Certain of the existing patents on our principal products have expired, and we face new and increasing competition, including from biosimilars and generics. A biosimilar is another version of a biological product for which marketing approval is sought or has been obtained based on a demonstration that it is “highly similar” to the original reference product. We have experienced adverse effects from biosimilar competition on our originator product sales. Companies have launched versions of EPOGEN, NEUPOGEN, Neulasta and ENBREL (Canada only) with U.S. ENBREL biosimilars approved but not launched. Our patents for RANKL antibodies, including sequences, for Prolia and XGEVA expire in February 2025 in the United States and November 2025 in select countries in Europe, and we expect sales erosion driven by biosimilar competition. Once multiple biosimilar versions of one of our originator products have launched, competition intensifies rapidly, resulting in accelerated net price declines for both the reference and the biosimilar products. See also Government Regulation—Regulation in the United States—Approval of Biosimilars.
We also have our own biosimilar products both in the United States and outside of U.S. markets that are competing against branded and biosimilar versions of our competitors’ products. In 2018, we launched AMGEVITA, a biosimilar to HUMIRA, in markets outside the United States. In 2019, we launched MVASI, a biosimilar to Avastin, and KANJINTI, a biosimilar to Herceptin. In 2020, we launched AVSOLA, a biosimilar to Remicade. In 2021, we launched RIABNI, a biosimilar to Rituxan. In 2023, we launched AMJEVITA, a biosimilar to HUMIRA, in the United States, and BEKEMV, a biosimilar to SOLIRIS, in the EU. Additionally, in 2023, we received FDA approval for WEZLANA, a biosimilar to STELARA, and in 2024, we received FDA approval for BKEMV, a biosimilar to SOLIRIS, and in the fourth quarter of 2024, we launched PAVBLU, a biosimilar to EYLEA, in the United States. In January 2025, we launched WEZLANA in the United States. We expect additional biosimilar competition against both our branded and biosimilar products in the future across markets.
Although biosimilars compete on price, we believe many patients, providers and payers will continue to place high value on the reputation, supply reliability and safety of our products. As additional biosimilar competitors come to market, we will continue to leverage our global experience to distinguish against both branded and biosimilar competitors.
Although most of our products are biologics, some are small molecule products, including Otezla, KYPROLIS and LUMAKRAS/LUMYKRAS. Because the FDA approval process permits generic manufacturers to rely on the safety and efficacy data of the innovator product rather than having to conduct their own costly and time-consuming clinical trials, generic manufacturers can often develop and market their competing versions of our small molecule products at much lower prices. For example, following loss of exclusivity of patents directed to cinacalcet, the active ingredient in our small molecule calcimimetic Sensipar, we lost a significant share of the market and corresponding revenues in a very short period of time.
The introduction of new products, the development of new processes or technologies by competitors or the emergence of new information about existing products may result in (i) increased competition for our marketed products, even for those protected by patents and/or (ii) reductions in the prices we receive from selling our products. In addition, the development of new treatment options or standards of care may reduce the use of our products or may limit the utility and application of ongoing clinical trials of our product candidates. (As used in this document, the term clinical trials may include prospective clinical trials, observational studies, registries and other studies.) See Item 1A. Risk Factors—Our products face substantial competition and our product candidates are also likely to face substantial competition and Item 1A. Risk Factors—We currently face competition from biosimilars and generics and expect to face increasing competition from biosimilars and generics in the future.
The following table reflects our significant competitors for our principal products and is not exhaustive.
| | | | | | | | | | | | | | | | | | | | |
| Product | | Territory | | Competitor-marketed product | | Competitors |
Prolia(1) | | U.S., Europe & Asia Pacific | | Bisphosphonates, including generics | | Various |
| ENBREL | | U.S. | | HUMIRA(2) | | AbbVie Inc. |
| U.S. | | HYRIMOZ | | Sandoz Group AG |
| U.S. | | RINVOQ | | AbbVie Inc. |
| U.S. | | Xeljanz | | Pfizer Inc. |
| Canada | | Etanercept biosimilars | | Various |
XGEVA(1) | | U.S. & Europe | | Zoledronate generics | | Various |
| Repatha | | U.S., Europe & Asia Pacific | | PRALUENT | | Regeneron Sanofi |
| U.S. & Europe | | LEQVIO | | Novartis Pharma AG |
| Otezla | | U.S. & Europe | | Skyrizi | | AbbVie Inc. |
| U.S. & Europe | | HUMIRA(2) | | AbbVie Inc. |
| U.S. & Europe | | Tremfya | | Johnson & Johnson Innovative Medicine(3) |
| U.S. & Europe | | Taltz | | Lilly |
| U.S. & Europe | | Cosentyx | | Novartis Pharma AG |
| U.S. & Europe | | SOTYKTU | | Bristol Myers Squibb Company |
| U.S. & Europe | | Topical products | | Various |
| EVENITY | | U.S. | | Bisphosphonates, including generics | | Various |
| Japan | | Teribone | | Asahi Kasei Pharma |
| KYPROLIS | | U.S. & Europe | | DARZALEX | | Johnson & Johnson Innovative Medicine(3) |
| U.S. & Europe | | POMALYST/IMNOVID | | Celgene Corporation(4) |
| U.S. & Europe | | REVLIMID(5) | | Various |
| U.S. | | VELCADE | | Takeda Oncology(6) |
| Nplate | | U.S. & Europe | | PROMACTA/REVOLADE | | Novartis Pharma AG |
| Aranesp | | U.S. | | PROCRIT(7) | | Johnson & Johnson Innovative Medicine(3) |
| U.S. & Europe | | Epoetin alfa biosimilars | | Various |
| BLINCYTO | | U.S. & Europe | | BESPONSA | | Pfizer Inc. |
| U.S. & Europe | | Chemotherapy regime | | Various |
| Vectibix | | U.S. & Europe | | Avastin | | F. Hoffmann-La Roche Ltd. (Roche) |
| U.S. | | KEYTRUDA | | Merck & Co., Inc. |
| U.S. & Europe | | ERBITUX | | Lilly |
| U.S. & Europe | | Chemotherapy regime | | Various |
| TEZSPIRE | | U.S. | | DUPIXENT | | Regeneron Sanofi |
| U.S. | | FASENRA | | AstraZeneca |
| U.S. | | XOLAIR | | Genentech, Inc. Novartis Pharma AG |
| U.S. | | NUCALA | | GSK plc. |
(1)Approved biosimilars available for Prolia and XGEVA in Asia Pacific only. Other biosimilars under regulatory review in the United States, Europe and Asia Pacific.
(2)Approved biosimilars for HUMIRA available.
(3)A subsidiary of Johnson & Johnson.
(4)A subsidiary of Bristol-Myers Squibb Company.
(5)REVLIMID also includes generics.
(6)A subsidiary of Takeda Pharmaceutical Co., Ltd.
(7)PROCRIT competes with Aranesp in supportive cancer care and predialysis settings.
TEPEZZA and KRYSTEXXA currently do not face any direct competitors in the United States or Europe. TEPEZZA faces competition from other therapies, such as corticosteroids, which have been used on an off-label basis to alleviate some of the symptoms of TED. TEPEZZA and KRYSTEXXA may face competition from competitor medicines currently in clinical trials. See TEPEZZA and KRYSTEXXA sections above and Government Regulation—Regulation of Orphan Medicines.
Reimbursement
Sales of our products are dependent on the availability and extent of coverage and reimbursement from third-party payers. In many markets around the world, these payers, including government health systems, private health insurers and other organizations, remain focused on reducing the cost of healthcare; and their efforts have intensified, in part, as a result of uncertain macroeconomic conditions, rising healthcare costs and pressures on healthcare budgets. Drugs remain heavily scrutinized for cost containment. As a result, payers have been and continue to be more restrictive regarding the use of biopharmaceutical products and are scrutinizing the prices of these products while requiring a higher level of clinical evidence to support the benefits such products bring to patients and the broader healthcare system. For example, as discussed below, payers are increasingly using stricter utilization management criteria, such as prior authorization and step therapy, to contain or reduce costs. These pressures become intensified when our products become subject to competition, including from biosimilars.
In the United States, healthcare providers and other entities such as pharmacies and PBMs are reimbursed for covered services and products they deliver through both private-payer and government healthcare programs such as Medicare and Medicaid. We provide negotiated rebates or discounts to healthcare providers, private payers, government payers and PBMs. In addition, we are required to (i) provide rebates or discounts on our products that are reimbursed through certain government programs, including Medicare and Medicaid, and (ii) provide discounts to qualifying healthcare providers under the 340B Program. Further, inappropriate expanded utilization of the 340B Program has had a negative impact on the Company’s financial performance.
Both private and some government payers use formularies to manage access to and utilization of drugs. A drug’s inclusion and favorable positioning on a formulary are essential to ensure patients have full access to a particular drug. Even when access is available, some patients abandon their prescriptions for economic reasons. Payers continue to institute cost reduction and containment measures that lower drug utilization and/or spending altogether and/or shift a greater portion of the costs to patients. Such measures include, but are not limited to, more-limited benefit plan designs, higher patient co-pays or coinsurance obligations, limitations on patients’ use of commercial manufacturer co-pay payment assistance programs (including through co-pay accumulator adjustment or maximization programs), stricter utilization management criteria (such as prior authorization and step therapy) before a patient may get access to a drug, higher-tier formulary placement that increases the level of patient out-of-pocket costs and formulary exclusion, which effectively encourages patients and providers to seek alternative treatments or pay 100% of the cost of a drug. The use of such measures by PBMs and insurers has continued to intensify and has thereby limited Amgen product usage and sales. Furthermore, in the United States, the top six integrated health plans and PBMs controlled about 94% of all pharmacy prescriptions. As a result, PBMs and insurers have greater market power and negotiating leverage to mandate stricter utilization criteria and/or exclude drugs from their formularies in favor of competitor drugs or alternative treatments. In highly competitive treatment markets such as the markets for ENBREL, Otezla, Repatha and Aimovig, PBMs are also able to exert negotiating leverage by requiring incremental rebates from manufacturers in order for them to gain and/or maintain their formulary position.
In addition to market actions taken by private and government payers in the United States, policy makers in both of the major U.S. political parties have supported policies to lower drug costs. See Item 1A. Risk Factors—Our sales depend on coverage and reimbursement from government and commercial third-party payers, and pricing and reimbursement pressures have affected, and are likely to continue to affect, our profitability. For example, in 2022, the IRA was enacted and includes provisions requiring that beginning in 2026, mandatory price setting be introduced in Medicare for certain drugs paid for under Parts B and D, whereby manufacturers must accept a price established by the government or face penalties on all U.S. sales (starting with 10 drugs in 2026, adding 15 in 2027 and 2028, and adding 20 in 2029 and subsequent years such that by 2031 approximately 100 drugs could be subject to such set prices). The Medicare price setting process began in August 2023 when CMS announced the first 10 drugs for Medicare price setting, which includes ENBREL, currently a product that generates considerable revenue for the Company. On July 30, 2024, CMS set a price for ENBREL in Medicare Part D that is significantly lower than the currently applicable price, effective beginning on January 1, 2026. We expect this will negatively impact
ENBREL’s profitability in Medicare. In January 2025, CMS announced the next 15 drugs for Medicare price setting that will be applicable beginning on January 1, 2027, which includes Otezla. Also under the IRA, starting on January 1, 2024, Medicare Part D was redesigned to cap beneficiary out-of-pocket costs and, beginning on January 1, 2025, Federal reinsurance will become reduced in the catastrophic phase (resulting in a shift and increase of such costs to Part D plans and manufacturers, including by requiring manufacturer discounts on certain drugs). Further, the IRA created a mechanism for CMS to collect rebates from manufacturers if price increases outpace inflation. We began to accrue for rebate obligations on October 1, 2022 for Medicare Part D and on January 1, 2023 for Medicare Part B.
Other potential policies cover a wide range of areas, including allowing the importation of drugs from other countries; increasing transparency in drug pricing; using third-party value assessments to determine drug prices; referencing foreign prices; and changes to government rebate programs. For example, on January 5, 2024, the FDA authorized Florida to move forward with its importation program proposal, which excludes biologics. CMS also issued a proposed Medicaid Drug Rebate Program rule that would have required manufacturers to aggregate or “stack” all rebates, discounts or other price concessions made to separate, unrelated entities across the pharmaceutical supply chain on a given unit of product to determine the “Best Price,” a metric that is used to determine Medicaid rebates and 340B statutory rates. This proposal was not finalized but remains a policy that could be reconsidered in the future. Further, at the state level, eight states (Colorado, Maine, Maryland, Minnesota, New Hampshire, New Jersey, Oregon and Washington) have enacted laws that establish PDABs to identify drugs that pose affordability challenges, and in four states (Colorado, Maryland, Minnesota and Washington) include authority for the state PDAB to set upper payment limits on certain drugs for in-state patients, payers and providers.
In many countries other than the United States, government-sponsored healthcare systems are the primary payers for drugs and biologics. With increasing budgetary constraints and/or difficulty in understanding the value of medicines, governments and payers in many countries are applying a variety of measures to exert downward price pressure. These measures can include mandatory price controls, price referencing, therapeutic-reference pricing, increases in rebates, incentives for generic substitution and biosimilar usage and government-mandated price cuts. In this regard, many governments use health technology assessment organizations to judge the added benefit of new treatments over existing ones, metrics which are then used to set reimbursement prices and/or set coverage limits. Many countries also limit coverage to populations narrower than those specified on our product labels or impose volume caps to limit utilization. We expect that governments will continue taking aggressive actions to seek to reduce expenditures on drugs and biologics. Similarly, fiscal constraints may also affect the extent to which countries are willing to approve new and innovative therapies and/or allow access to new technologies. The EU is currently undergoing a review and revision of its pharmaceutical legislation. Various proposals are under consideration with the EU Council, followed by a negotiation among the EU government to agree to a final law. Full implementation is not expected until 2027 or later. The new legislation, if implemented, will likely have a significant impact on the landscape for access and pricing decisions within EU Member States.
The dynamics and developments discussed above create pressures on the pricing and potential usage of our products and on the industry. Given the diverse interests in play between payers, biopharmaceutical manufacturers, policy makers, healthcare providers and independent organizations, if and whether the parties involved can achieve alignment on the matters discussed above remain unclear, and the outcome of any such alignment is difficult to predict. We remain focused on pricing our products responsibly and delivering breakthrough treatments for unmet medical needs. Amgen is committed to working with the entire healthcare community to ensure continued innovation and to facilitate patient access to needed medicines. We do this by:
•investing billions of dollars annually in R&D;
•pricing our medicines to reflect the value they provide;
•developing more affordable therapeutic choices in the form of high-quality and reliably supplied biosimilars;
•partnering with payers to share risk and accountability for health outcomes;
•providing patient support and education programs;
•helping patients in financial need access our medicines; and
•working with policy makers, patients and other stakeholders to establish a sustainable healthcare system with access to affordable care and in which patients and their healthcare professionals are the primary decision makers.
See Item 1A. Risk Factors—Our sales depend on coverage and reimbursement from government and commercial third-party payers, and pricing and reimbursement pressures have affected, and are likely to continue to affect, our profitability and Item 1A. Risk Factors—Guidelines and recommendations published by various organizations can reduce the use of our products.
Manufacturing, Distribution and Raw Materials
Manufacturing
We believe we are a leader in the manufacture of biologics and that our manufacturing capabilities represent a competitive advantage. The products we manufacture consist of both biologics and small molecule drugs. The majority of our products are biologics that are produced in living cells and that are inherently complex due to naturally occurring molecular variations. Highly specialized knowledge and extensive process and product characterization are required to transform laboratory-scale processes into reproducible commercial manufacturing processes. Further, our expertise in the manufacture of biologics has positioned us well for leadership in the global biosimilars market. For additional information regarding manufacturing facilities, see Item 2. Properties.
We are expanding our manufacturing capacity and incorporating state-of-the-art technologies, allowing us to optimize our manufacturing network and mitigate risks while continuing to ensure adequate supply of our products to patients worldwide. Our new state-of-the-art biomanufacturing plants, including our facility in North Carolina and FDA-approved facility in Ohio, have been constructed at a lower cost and with greater speed as compared to traditional facilities. For example, our facility in North Carolina has equipment that is portable and smaller, which provides greater flexibility and speed in the manufacture of different medicines simultaneously, allowing us to respond to changing demands for our medicines with increased scale and agility. Furthermore, such state-of-the-art plants incorporate multiple innovative technologies, automation solutions and environmental sustainability into a single facility, thus requiring smaller manufacturing footprints and offering greater environmental benefits, including reduced consumption of water and energy and lower levels of carbon emissions. For example, our facility in North Carolina and our FDA-approved facility in Ohio contain many examples of environmental commitments, including on-site photovoltaic renewable energy generation at both sites. We expect our North Carolina facility’s carbon footprint, water usage and waste disposed to be substantially lower than that of a traditional drug substance manufacturing plant. Similarly, we expect lower carbon footprint, water usage and waste disposed per unit at our Ohio facility as compared to traditional packaging and assembly facilities.
Our internal manufacturing network has commercial production capabilities for bulk manufacturing, formulation, fill, finish, tableting and final device assembly. These activities are performed within the United States and its territory, including in our Puerto Rico, Rhode Island, Ohio and California facilities, as well as internationally in our Ireland, Netherlands and Singapore facilities. In addition, we use third-party contract manufacturers to supplement the capacity or capability of our commercial manufacturing network.
To support our clinical trials, we manufacture product candidates primarily at our California facilities. We also use third-party contract manufacturers, including contract manufacturers that were added to our clinical manufacturing network from the Horizon acquisition, to supplement the capacity or capability of our overall clinical manufacturing network.
See Item 1A. Risk Factors for a discussion of the factors that could adversely impact our manufacturing operations and the global supply of our products.
Distribution
We operate distribution centers in Puerto Rico, Kentucky, California and the Netherlands for worldwide distribution of the majority of our commercial and clinical products. We also use third-party distributors to supplement distribution of our products worldwide.
Other
In addition to the manufacturing and distribution activities noted above, each of our manufacturing locations includes key manufacturing support functions such as quality control, process development, engineering, procurement, production scheduling and warehousing. Certain of those manufacturing and distribution activities are highly regulated by the FDA as well as international regulatory agencies. See Government Regulation—Regulation in the United States—Regulation of Manufacturing Standards.
Manufacturing Initiatives
As discussed above, we are expanding our capacity and advancing new innovations to support anticipated patient demand for our current and future products.
In January 2024, our biomanufacturing plant located in New Albany, Ohio received FDA licensure for commercial production. This final product assembly and packaging plant supports the growing demand for Amgen’s medicines and uses state-of-the-art technologies and automation.
In January 2025, we opened our Holly Springs, North Carolina site, a cutting-edge drug substance facility. Upon FDA approval, this facility will increase our biologics manufacturing capacity. Also in January 2025, we broke ground on a second drug substance manufacturing facility in Holly Springs, North Carolina. This second facility will incorporate state-of-the-art technologies and sustainable practices, further enhancing our manufacturing network to support reliable and efficient supply of our medicines to patients worldwide.
Subsequent to the Horizon acquisition, we continue to evaluate our supply chains and pursue activities to further improve resiliency and efficiency. Additionally, in 2024, we have initiated actions to consolidate the commercial production of select acquired Horizon products into our existing manufacturing network. See Item 1A. Risk factors—Our efforts to collaborate with or acquire other companies, products, or technology, and to integrate the operations of companies or to support the products or technology we have acquired, may not be successful, and may result in unanticipated costs, delays or failures to realize the benefits of the transactions.
See Item 1A. Risk Factors—Manufacturing difficulties, disruptions or delays could limit supply of our products and limit our product sales.
Raw Materials and Medical Devices
Certain raw materials, medical devices (including companion diagnostics) and components necessary for the commercial and/or clinical manufacturing of our products are provided by and are the proprietary products of unaffiliated third-party suppliers, certain of which may be our only sources for such materials. We currently attempt to manage the risk associated with such suppliers by means of inventory management, relationship management and evaluation of alternative sources when feasible. We also monitor the financial condition and manufacturing quality and compliance of key suppliers and their ability to supply our needs. See Item 1A. Risk Factors—We rely on third-party suppliers for certain of our raw materials, medical devices and components.
We perform various procedures to help authenticate the sources of raw materials, including intermediary materials used in the manufacture of our products; the procedures include verification of country of origin and are incorporated into the manufacturing processes we and our third-party contract manufacturers perform.
To better ensure supply, Amgen has a risk mitigation strategy that uses a combination of methods, including multiple sources or backup inventory of critical raw materials. As part of our ongoing business continuity efforts, we continue to closely monitor our inventory levels and have taken additional measures to mitigate against raw material supply interruption. See Item 1A. Risk Factors for a discussion of the factors that could adversely impact our manufacturing operations and the global supply of our products.
Government Regulation
Regulation by government authorities in the United States and other countries is a significant factor in the production and marketing of our products and our ongoing R&D activities. To clinically test, manufacture and market products for therapeutic use, we must satisfy mandatory procedures and safety and effectiveness standards established by various regulatory bodies. Compliance with these standards is complex, and failure to comply with any of these standards can result in significant implications. See Item 1A. Risk Factors for a discussion of factors, including global regulatory implications, that can adversely impact our development and marketing of commercial products.
Regulation in the United States
In the United States, the Public Health Service Act; the FDCA; and the regulations promulgated thereunder as well as other federal and state statutes and regulations govern, among other things, the production, research, development, testing, manufacture, quality control, labeling, storage, record keeping, approval, advertising, promotion and distribution of our products in addition to the reporting of certain payments and other transfers of value to healthcare professionals and teaching hospitals.
Clinical Development and Product Approval. Drug development in our industry is complex, challenging and risky, and failure rates are high. Product development cycles are typically very long—approximately 10 to 15 years from discovery to market. A potential new medicine must undergo many years of preclinical and clinical testing to establish its safety and efficacy for use in humans at appropriate dosing levels and with an acceptable risk–benefit profile. We continue to work toward reducing cycle times by applying our expertise in human genetics and innovation in technology, clinical trials and real-world evidence. See Research and Development and Selected Product Candidates section below.
After laboratory analysis and preclinical testing in animals, we file an IND with the FDA to begin human testing. Typically, we undertake an FDA-designated three-phase human clinical testing program.
•In phase 1, we conduct small clinical trials to investigate the safety and proper dose ranges of our product candidates in a small number of human subjects.
•In phase 2, we conduct clinical trials to investigate side-effect profiles and the efficacy of our product candidates in a patient population larger than phase 1 but still relatively small, who have the disease or condition under study.
•In phase 3, we conduct clinical trials to investigate the short- and long-term safety and efficacy of our product candidates, compared to commonly used treatments, in a large number of patients who have the disease or condition under study.
The FDA monitors the progress of each trial conducted under an IND and may, at its discretion, reevaluate, alter, suspend or terminate the testing based on data accumulated to that point and the FDA’s risk–benefit assessment with regard to the patients enrolled in the trial. The results of preclinical and clinical trials are submitted to the FDA in the form of either a BLA for biologic products or a New Drug Application for small molecule products. We are not permitted to market or promote a new product until the FDA has approved our marketing application.
Approval of Biosimilars. The Affordable Care Act authorized the FDA to approve biosimilars via a separate, abbreviated pathway. The pathway allows sponsors of a biosimilar to seek and obtain regulatory approval based in part on the nonclinical-trial and clinical-trial data of an originator product to which the biosimilar has been demonstrated to be “highly similar” and to have no clinically meaningful differences with regard to safety, purity and potency. The relevance of demonstrating “similarity” is that in many cases, biosimilars can be brought to market without conducting the full suite of clinical trials typically required of originators, because risk–benefit has previously been established. To preserve incentives for future innovation, the law establishes a period of exclusivity for originators’ products, which in general prohibits biosimilars from gaining FDA approval based in part on reliance on or reference to the originator’s data in their application to the FDA for 12 years after initial FDA approval of the originator product. The law does not change the duration of patents granted on biologic products. As part of the implementation of the abbreviated approval pathway for biosimilars, the FDA released a number of guidance documents, some of which remain in draft form. See Item 1A. Risk Factors—We currently face competition from biosimilars and generics and expect to face increasing competition from biosimilars and generics in the future.
Regulation of Product Marketing and Promotion. The FDA regulates the marketing and promotion of drug products. Our product promotions for approved product indications must comply with the statutory standards of the FDCA and the FDA’s implemented regulations and guidance. The FDA’s review of marketing and promotional activities encompasses but is not limited to direct-to-consumer advertising, healthcare-provider-directed advertising and promotion, sales representative communications to healthcare professionals, promotional programming and promotional activities involving electronic media. The FDA may also review industry-sponsored scientific and educational activities that make representations regarding product safety or efficacy in a promotional context. The FDA may take enforcement action against a company for violations of the FDA’s advertising and labeling laws and regulations. Enforcement action may include product seizures, injunctions, civil or criminal penalties or regulatory letters, which may require corrective advertising or other corrective communications to healthcare professionals. Failure to comply with the FDA’s regulations also can result in adverse publicity or increased scrutiny of company activities by the U.S. Congress or other legislators. Additionally, as described below, such failure may lead to additional liability under U.S. healthcare fraud and abuse laws.
Regulation of Manufacturing Standards. The FDA regulates and inspects the equipment, facilities, laboratories and processes used in the manufacturing and testing of products prior to granting approval to market products. If after receiving approval from the FDA we make a material change in manufacturing equipment, location or process, additional regulatory review may be required. We also must adhere to current Good Manufacturing Practice regulations and product-specific regulations enforced by the FDA through its facilities inspection program. The FDA conducts regular, periodic visits to reinspect our equipment, facilities, laboratories and processes following an initial approval.
Regulation of Combination Products. Combination products are defined by the FDA as products composed of two or more regulated components (e.g., a biologic and/or drug and a device). Biologics/drugs and devices each have their own regulatory requirements, and combination products may have additional requirements. A number of our marketed products meet this definition and are regulated under this framework, and we expect that a number of our pipeline product candidates will be evaluated for regulatory approval under this framework as well.
Regulation of Orphan Medicines. Orphan drugs are defined by the FDA as products intended to treat a rare disease or condition that affects less than 200,000 persons in the United States. A company must request orphan drug designation prior to filing and, if granted for being the first medicine to treat such a rare disease, means the FDA will not approve another sponsor’s marketing application for the same drug for the same indication for seven years. Orphan drug exclusivity will not bar approval of another medicine for the same indication if it is shown to be clinically superior. In the United States, a number of our products, including products such as TEPEZZA and UPLIZNA, have orphan drug exclusivity under this framework.
Regulation outside the United States
In EU countries as well as in the United Kingdom, Switzerland, Canada, Australia and Japan, regulatory requirements and approval processes are similar in principle to those in the United States.
In the EU, there are currently two potential tracks for seeking marketing approval for a product not authorized in any EU member state: a decentralized procedure and a centralized procedure. In the decentralized procedure, identical applications for marketing authorization are submitted simultaneously to the national regulatory agencies. Regulatory review is led by one member state (the reference-member state), and its assessment—based on safety, quality and efficacy—is reviewed and approved (assuming there are no concerns that the product poses a serious risk to public health) by the other member states from which the applicant is seeking approval (the concerned-member states). The decentralized procedure leads to a series of single national approvals in all relevant countries. In the centralized procedure, which is required of all products derived from biotechnology, a company submits a single MAA to the EMA, which conducts an evaluation of the dossier, drawing upon its scientific resources across Europe. If the drug product is proven to fulfill requirements for quality, safety and efficacy, the EMA’s CHMP adopts a positive opinion, which is transmitted to the EC for final decision on granting of the marketing authorization. Even though the EC generally follows the CHMP’s opinion, it is not bound to do so. Subsequent commercialization is enabled by country-by-country reimbursement approval.
In the EU, biosimilars are approved under a specialized pathway of the centralized procedure. As with the U.S. pathway, an applicant seeks and obtains regulatory approval for a biosimilar once the data exclusivity period for the original reference product has expired, relying in part on the data submitted for the originator product together with data evidencing that the biosimilar is “highly similar” with regard to quality, safety and efficacy to the original reference product authorized in the European Economic Area. See Item 1A. Risk Factors—We currently face competition from biosimilars and generics and expect to face increasing competition from biosimilars and generics in the future.
In the EU, Regulation (EC) No 141/2000, as implemented by Regulation (EC) No. 847/2000, provides that a medicine can be designated as an orphan medicinal product by the EC if its sponsor can establish that: (i) the product is intended for the diagnosis, prevention or treatment of life-threatening or chronically debilitating conditions; (ii) either (a) such conditions affect not more than 5 in 10,000 persons in the EU when the application is made, or (b) the product without the benefits derived from orphan status, would not generate sufficient return in the EU to justify the necessary investment in developing the medicinal product; and (iii) there exists no satisfactory authorized method of diagnosis, prevention, or treatment of the condition that has been authorized in the EU, or even if such method exists, the product will be of significant benefit to those affected by that condition. An application for the designation of a medicinal product as an orphan medicinal product may be submitted at any stage of development of the medicinal product but before the filing of an MAA. A marketing authorization for an orphan medicinal product may only include indications designated as orphan. For non-orphan indications treated with the same active pharmaceutical ingredient, a separate marketing authorization has to be sought. Approved orphan drugs in the EU receive 10 years of market exclusivity for the approved indication in all EU member states. We currently have orphan medicinal product designation for BLINCYTO in the EU and intend to seek medicinal product designation for a number of our products in the future.
Other countries such as those in Latin America and the Middle East have review processes and data requirements similar to those of the EU and in some cases can rely on prior marketing approval from U.S. or EU regulatory authorities. The regulatory process in these countries may include manufacturing/testing facility inspections, testing of drug product upon importation and other domestic requirements.
In Asia Pacific, a number of countries such as China, Japan, South Korea and Taiwan may require local clinical-trial data for bridging purposes as part of the drug registration process in addition to global clinical trials, which can add to overall drug development and registration timelines. In most of the Asian markets, registration timelines depend on marketing approval in the United States or the EU. In some markets in Asia, such as China, Indonesia and Thailand, regulatory timelines can be less predictable. The regulatory process may also include manufacturing/testing facility inspections, testing of drug product upon importation and other domestic requirements. Countries such as Australia and Japan have more-mature systems that would allow for submissions under more-competitive time frames. With regard to biosimilars, several of these countries have pathways to register biosimilars (e.g., Australia, India, Singapore, South Korea and Taiwan), and biosimilar products are already present on the markets (e.g., Australia and South Korea).
In some countries, such as Japan and those in the EU, medical devices may be subject to regulatory regimes whereby manufacturers must establish that their medical devices conform to essential requirements set out in the law for the particular device category. For example, in the EU, with limited exceptions, medical devices placed on the market must bear the Conformité Européenne marking to indicate their conformity with legal requirements.
Postapproval Phase
After approval, we continue to monitor adverse events and product complaints reported following the use of our products through routine postmarketing surveillance and studies when applicable. We report such events to the appropriate regulatory agencies as required by local regulations for individual cases and aggregate reports. We proactively monitor (according to good pharmacovigilance practices) and ensure the implementation of signal detection, assessment and the communication of adverse events that may be associated with the use of our products. We also proactively monitor product complaints through our quality systems, which includes assessing our drug delivery devices for device complaints, adverse events and malfunctions. We may also be required by regulatory agencies to conduct further clinical trials on our marketed products as a condition of their approval or to provide additional information on safety and efficacy. Health regulators, including the FDA, have authority to mandate labeling changes to products at any point based on new safety information or as part of an evolving label change to a particular class of products.
Health regulators, including the FDA, also have authority both before and after approval to require that a company implement a risk management program for a product to ensure that the benefits of the drug outweigh the risks. Each risk management program is unique and varies depending on the specific factors required. In the United States, such a risk management program is known as a REMS, and we currently have REMSs for Prolia, Nplate and BLINCYTO.
Other Regulation
We are also subject to various laws pertaining to healthcare fraud and abuse, including antikickback laws and false-claims laws. Antikickback laws make it illegal to solicit, offer, receive or pay any remuneration in exchange for or to induce the referral of business, including the purchase or prescribing of a particular drug that is reimbursed by a state or federal program. False-claims laws prohibit knowingly and willingly presenting or causing to be presented for payment to third-party payers (including Medicare and Medicaid) any claims for reimbursed drugs or services that are false or fraudulent, claims for items or services not provided as claimed or claims for medically unnecessary items or services. Violations of fraud and abuse laws may be punishable by criminal and/or civil sanctions, including fines and civil monetary penalties, as well as by the possibility of exclusion from federal healthcare programs (including Medicare and Medicaid). Liability under false-claims laws may also arise when violation of certain laws or regulations related to the underlying product (e.g., a violation regarding improper promotional activity or unlawful payments) contributes to the submission of a false claim. See Item 1A. Risk Factors—Our business may be affected by litigation and government investigations.
The FCPA prohibits U.S. corporations and their representatives from offering, promising, authorizing or making payments to any foreign government official, government staff member, political party or political candidate in an attempt to obtain or retain business abroad. The scope of the FCPA arguably includes interactions with certain healthcare professionals in many countries. Other countries have enacted similar anticorruption laws and/or regulations. Failure by our employees, agents, contractors, vendors, licensees, partners or collaborators to comply with the FCPA and other anticorruption laws and/or regulations could result in significant civil or criminal penalties.
We are subject to various laws and regulations globally with regard to privacy and data protection. These laws and regulations involve the collection, storage, handling, use, disclosure, transfer and security of personal data. The legislative and regulatory environments regarding privacy and data protection are continually evolving and developing because these issues are subjects of increasing amounts of attention in countries globally. For example, we are subject to the EU’s GDPR, which became effective on May 25, 2018; the CCPA, which became effective on January 1, 2020; the California Privacy Rights Act of 2020, which amended the CCPA and became effective on January 1, 2023; and China’s Personal Information Protection Law, which became effective on November 1, 2021. Other jurisdictions where we operate have enacted or proposed similar legislation and/or regulations, such as consumer privacy laws that went into effect in Virginia, Colorado, Utah, Connecticut and Florida in 2023 and Oregon, Texas and Montana in 2024. Consumer privacy laws were also passed in other states, including Iowa, Delaware, New Hampshire, Nebraska, New Jersey, Tennessee, Minnesota, Maryland, Indiana, Kentucky and Rhode Island and will be effective beginning in 2025 through 2026. In April 2023, a new type of state privacy law focused on protection of consumer health data emerged in Washington with the enactment of the My Health My Data Act, with similar legislation passed subsequently in Nevada. Both these new consumer health privacy laws became effective on March 31, 2024. Further, in 2024, the EU Artificial Intelligence (AI) Act, formally known as Regulation (EU) 2024/1689, was passed into law. Certain provisions of this regulation, such as transparency obligations and governance structures, will take effect in February and August 2025, with the regulation becoming fully effective on August 2, 2026. The regulation establishes a risk-based framework governing the development, deployment and use of AI systems across the EU. High-risk AI systems are subject to stringent requirements such as mandatory risk assessments, technical documentation, bias mitigation and explainability standards. Non-compliance with these current and future laws could result in significant penalties.
Our business has been and will continue to be subject to various other U.S. and foreign laws, rules and regulations, including provisions of the IRA. See Reimbursement section above.
Research and Development and Selected Product Candidates
We focus our R&D on novel human therapeutics for the treatment of serious illness. We capitalize on our strengths in human genetics, novel biology and protein engineering. We leverage our biologic expertise and seek to choose the optimal modality for a drug target and disease. And we use cutting-edge science and technology to study subtle biological mechanisms in search of therapies that will improve the lives of those who suffer from diseases. See Government Regulation—Clinical Development and Product Approval section above.
Our discovery research programs may therefore yield targets that lead to the development of human therapeutics delivered as large molecules, small molecules, other combination modalities or new modalities. We have reshaped our portfolio and have increasingly focused our efforts on human genetics when possible to enhance the likelihood of success. We have major R&D centers in the United States in Thousand Oaks and San Francisco, California; Iceland; and the United Kingdom, as well as smaller research centers and development facilities globally. See Item 2. Properties.
With regard to our clinical trial activities, we are continuously monitoring the possible impacts from health-related events, geopolitical conflicts and natural disasters. We are working to mitigate effects on future study enrollment in our clinical trials; and we are evaluating the impact in all relevant countries. We remain focused on supporting our active clinical sites in their providing care for patients and in our providing investigational drug supply. Our clinical trial activities are conducted by both our internal staff and third-party contract clinical trial service providers. To increase the number and diversity of patients available for enrollment in our clinical trials, we have opened clinical sites and will continue opening clinical sites and enrolling patients in a number of geographic locations. See Government Regulation—Regulation in the United States—Clinical Development and Product Approval for a discussion of government regulation over clinical development. Also see Item 1A. Risk Factors—We must conduct clinical trials in humans before we commercialize and sell any of our product candidates or existing products for new indications.
For the years ended December 31, 2024, 2023 and 2022, our R&D expenses were $6.0 billion, $4.8 billion and $4.4 billion, respectively. We expect to continue allocating significant resources to our R&D activities.
Some of our competitors are actively engaged in R&D in areas in which we have products or in which we are developing product candidates or new indications for existing products. For example, we compete with other clinical trials for eligible patients, which may limit the number of available patients who meet the criteria for certain clinical trials. The competitive marketplace for our product candidates is greatly dependent on the timing of entry into the market. Early entry may have important advantages in gaining product acceptance, thereby contributing to a product’s eventual success and profitability. Accordingly, we expect that in some cases, the relative speed with which we can develop products, complete clinical testing, receive regulatory approval and supply commercial quantities of a product to the market will be important to our competitive position.
In addition to product candidates and marketed products generated from our internal R&D efforts, we acquire companies, acquire and license certain product and R&D technology rights and establish R&D arrangements with third parties to enhance our strategic position within our industry by strengthening and diversifying our R&D capabilities, product pipeline and marketed product base. In pursuing these R&D arrangements and licensing or acquisition activities, we face competition from other pharmaceutical and biotechnology companies that also seek to license or acquire technologies, product candidates or marketed products from those entities performing the R&D.
The following table shows a selection of certain of our product candidates by phase of development in our therapeutic areas of focus as of February 4, 2025, unless otherwise indicated. Additional product candidate information can be found on our website at www.amgen.com. (The website address is not intended to function as a hyperlink, and the information contained on our website is not intended to be a part of this filing.) The information in this section does not include, among other things, other, nonregistrational clinical trials that we may conduct for purposes other than for submission to regulatory agencies for their approval of a new product indication.
We may conduct nonregistrational clinical trials for various reasons, including to evaluate real-world outcomes or to collect additional safety information with regard to the use of products.
| | | | | | | | |
| | Investigational indications (programs) |
| Phase 3 | | |
| AMJEVITA | | Interchangeability |
| Bemarituzumab | | Gastric and gastroesophageal junction cancer |
| BLINCYTO | | Ph-negative B-ALL |
| | | | | | | | |
| | Investigational indications (programs) |
| Dazodalibep | | Sjögren’s disease |
| EVENITY | | Male osteoporosis |
| IMDELLTRA | | Small cell lung cancer |
| LUMAKRAS/LUMYKRAS | | Advanced colorectal cancer |
| Non-small cell lung cancer |
| Nplate | | Chemotherapy-induced thrombocytopenia |
| Olpasiran | | Cardiovascular disease |
| Otezla | | Palmoplantar pustulosis |
| Repatha | | Cardiovascular disease |
| Rocatinlimab | | Moderate-to-severe atopic dermatitis |
| Prurigo nodularis |
| TEPEZZA | | Subcutaneous administration for TED |
| Chronic/low clinical activity score TED in Japan |
| TEZSPIRE | | Chronic rhinosinusitis with nasal polyps |
| Eosinophilic esophagitis |
| Severe asthma |
| UPLIZNA | | Generalized myasthenia gravis |
| IgG4-related disease |
| Xaluritamig | | Metastatic castrate resistant prostate cancer |
| ABP 206 | | Investigational biosimilar to OPDIVO (nivolumab) |
| ABP 234 | | Investigational biosimilar to KEYTRUDA (pembrolizumab) |
| ABP 692 | | Investigational biosimilar to OCREVUS (ocrelizumab) |
| Phase 2 | | |
| Bemarituzumab | | Other tumors |
| Blinatumomab | | Systemic lupus erythematosus with nephritis |
| Daxdilimab | | Dermatomyositis and anti-synthetase inflammatory myositis |
| Discoid lupus erythematosus |
| Inebilizumab | | Systemic lupus erythematosus with nephritis |
| LUMAKRAS/LUMYKRAS | | Other tumors |
| Maridebart cafraglutide | | Obesity |
| Type 2 diabetes |
| Ordesekimab | | Celiac disease |
| Rocatinlimab | | Moderate-to-severe asthma |
| TEZSPIRE | | Chronic obstructive pulmonary disease |
| AMG 104 | | Asthma |
| AMG 193 | | Non-small cell lung cancer |
| AMG 329 | | Sjögren’s disease |
| Phase 1 | | |
| IMDELLTRA | | Neuroendocrine prostate cancer |
| Xaluritamig | | Prostate cancer |
| AMG 193 | | Solid tumors |
| AMG 305 | | Solid tumors |
| AMG 355 | | Solid tumors |
| AMG 513 | | Obesity |
| AMG 651 | | Solid tumors |
| | | | | | | | |
| | Investigational indications (programs) |
| AMG 691 | | Asthma |
| AMG 732 | | TED |
| | |
| | | | | |
| Phase 3 | Clinical trials investigate the short- and long-term safety and efficacy of our product candidates, compared to commonly used treatments, in a large number of patients who have the disease or condition under study. |
| Phase 2 | Clinical trials investigate side-effect profiles and efficacy of product candidates in a larger patient population than phase 1, but still relatively small, who have the disease or condition under study. |
| Phase 1 | Clinical trials investigate the safety and proper dose ranges of product candidates usually in a small number of human subjects. |
Phase 3 Product Candidate Program Changes
As of January 31, 2024, we had 24 phase 3 programs studied in investigational indications. As of February 4, 2025, we have 25 phase 3 programs being studied in investigational indications, as five programs initiated phase 3 studies, three programs were approved by the FDA and one program was approved in Japan. These changes are set forth in the following table.
| | | | | | | | | | | | | | |
| Molecule | | Investigational indications (programs) | | Program changes |
| BKEMV | | Investigational biosimilar to SOLIRIS (eculizumab) | | Approved by the FDA |
| PAVBLU | | Investigational biosimilar to EYLEA (aflibercept) | | Approved by the FDA |
| Rocatinlimab | | Prurigo nodularis | | Initiated phase 3 study |
| TEPEZZA | | Subcutaneous administration for TED | | Initiated phase 3 study |
| Active TED in Japan | | Approved in Japan |
| WEZLANA | | Investigational biosimilar to STELARA (ustekinumab) | | Approved by the FDA |
| Xaluritamig | | Metastatic castrate resistant prostate cancer | | Initiated phase 3 study |
| ABP 234 | | Investigational biosimilar to KEYTRUDA (pembrolizumab) | | Initiated phase 3 study |
| ABP 692 | | Investigational biosimilar to OCREVUS (ocrelizumab) | | Initiated phase 3 study |
Phase 3 Product Candidate Patent Information
The following table describes our composition-of-matter patents that have been issued thus far for our product candidates in phase 3 development that have yet to be approved for any indication in the United States or the EU. Patents for products already approved for one or more indications in the United States or the EU but that are currently undergoing phase 3 clinical trials for additional indications have been previously described. See Marketing, Distribution and Selected Marketed Products—Patents.
| | | | | | | | | | | | | | | | | | | | |
| Molecule | | Territory | | General subject matter | | Estimated expiration(1) |
| Bemarituzumab | | U.S. | | Polypeptides | | 2029 |
| Europe | | Polypeptides | | 2029 |
| Dazodalibep | | U.S. | | Polypeptides | | 2034 |
| Europe | | Polypeptides | | 2032 |
| Olpasiran | | U.S. | | Compounds | | 2036 |
| Europe | | Compounds | | 2036 |
| Rocatinlimab | | U.S. | | Polypeptides | | 2028 |
| Europe | | Polypeptides | | 2026 |
| Xaluritamig | | U.S. | | Polypeptides | | 2039 |
(1) Patent expiration estimates are based on issued patents, which may be challenged, invalidated or circumvented by competitors. The estimates do not include any term adjustments, extensions or supplemental protection certificates that may be obtained in the future and thereby extend these dates. Corresponding patent applications are pending in other jurisdictions. Additional patents may be filed or issued and may provide additional exclusivity for the product candidate or its use. In addition to patent exclusivity, the product candidates may be protected by regulatory exclusivities upon approval in some countries. For example, new chemical entities would receive a five year exclusivity period and new molecular entities would receive a 12 year exclusivity period in the United States, whereas new chemical and molecular entities would receive a 10 year exclusivity period in Europe.
Phases 2 and 3 Program Descriptions
The following provides additional information about selected products and product candidates that have advanced into human clinical trials.
AMJEVITA
AMJEVITA, a biosimilar to HUMIRA, is a monoclonal antibody that inhibits binding of tumor necrosis factor (TNF) alpha to cell surface TNF receptor / TNF-alpha.
Bemarituzumab
Bemarituzumab is a monoclonal antibody that inhibits fibroblast growth factor receptor 2b (FGFR2b). It is being investigated for the treatment of gastric and gastroesophageal junction cancer and advanced solid tumors other than advanced squamous NSCLC.
Blinatumomab
Blinatumomab is an anti-CD19 x anti-CD3 BiTE® molecule. It is being investigated for the treatment of systemic lupus erythematosus with nephritis.
BLINCYTO
BLINCYTO is an anti-CD19 x anti-CD3 BiTE® molecule. It is being investigated for the treatment of newly diagnosed adults with B-ALL.
Daxdilimab
Daxdilimab is a fully human monoclonal antibody against ILT7 that depletes certain dendritic cells. It is being investigated for the treatment of both dermatomyositis and anti-synthetase inflammatory myositis and discoid lupus erythematosus.
Dazodalibep
Dazodalibep is a fusion protein binding CD40L on T cells, blocking their interaction with CD40-expressing B cells. It is being investigated for the treatment of Sjögren’s disease.
EVENITY
EVENITY is a monoclonal antibody that inhibits the action of sclerostin. It is being evaluated as a treatment for male osteoporosis. EVENITY is being developed in collaboration with UCB.
IMDELLTRA
IMDELLTRA is an anti-DLL3 x anti-CD3 BiTE® molecule. It is being investigated for the treatment of small cell lung cancer.
Inebilizumab
Inebilizumab is a humanized, affinity-optimized, afucosylated IgG1 kappa (IgG1κ) monoclonal antibody that binds to the B cell-specific surface antigen CD19. It is being investigated as treatment for patients with systemic lupus erythematosus with nephritis.
LUMAKRAS/LUMYKRAS
LUMAKRAS/LUMYKRAS is a KRASG12C small molecule inhibitor. It is being investigated in NSCLC, colorectal cancer and other solid tumor cancers.
Maridebart cafraglutide
MariTide is a differentiated peptide-antibody conjugate that activates the glucagon like peptide 1 (GLP-1) receptor and antagonizes gastric inhibitory polypeptide receptor (GIPR). It is being investigated for the treatment of obesity and type 2 diabetes. See Significant Developments for additional information regarding clinical trial updates.
Nplate
Nplate is a thrombopoietin receptor agonist (TPO-RA). It is being investigated for the treatment of chemotherapy-induced thrombocytopenia (CIT).
Olpasiran
Olpasiran is a small interfering RNA (siRNA) that lowers lipoprotein(a) (Lp(a)). It is being investigated in phase 3 for the treatment of atherosclerotic cardiovascular disease (ASCVD).
Ordesekimab
Ordesekimab is a monoclonal antibody that inhibits the action of IL-15. It is being investigated for the treatment of celiac disease and is being developed in collaboration with Provention Bio, Inc.
Otezla
Otezla is a small molecule that inhibits PDE4. It is being investigated in phase 3 studies for the treatment of palmoplantar pustulosis.
Repatha
Repatha is a human monoclonal antibody that inhibits PCSK9. It is being investigated in patients at high cardiovascular risk without a prior myocardial infarction or stroke.
Rocatinlimab
Rocatinlimab is a monoclonal antibody that inhibits OX-40. It is being investigated in phase 3 studies for the treatment of moderate-to-severe atopic dermatitis and prurigo nodularis. It is also being investigated in a phase 2 study for the treatment of moderate-to-severe asthma. Rocatinlimab is being developed in collaboration with Kyowa Kirin. See Significant Developments for additional information regarding clinical trial updates.
TEPEZZA
TEPEZZA is a monoclonal antibody against IGF-1R. It is being investigated in phase 3 studies for subcutaneous administration for the treatment of TED and chronic/low clinical activity score (CAS) TED in Japan.
TEZSPIRE
TEZSPIRE is a human monoclonal antibody that inhibits the action of thymic stromal lymphopoietin. It is being evaluated in phase 3 studies as a treatment for chronic rhinosinusitis with nasal polyps (CRSwNP), eosinophilic esophagitis and severe asthma. It is also being investigated in phase 2 studies as a treatment for chronic obstructive pulmonary disease (COPD). TEZSPIRE is being developed in collaboration with AstraZeneca. See Significant Developments for additional information regarding clinical trial updates.
UPLIZNA
UPLIZNA is a humanized, affinity-optimized, afucosylated IgG1 kappa (IgG1κ) monoclonal antibody that binds to the B cell-specific surface antigen CD19. It is being investigated in phase 3 studies for the treatment of generalized myasthenia gravis and flares in patients with IgG4-related disease. See Significant Developments for additional information regarding clinical trial updates.
Xaluritamig
Xaluritamig is a bivalent T cell engager and is designed using XmAb 2+1 technology. It is being investigated for the treatment of prostate cancer.
ABP 206
ABP 206, a biosimilar candidate to OPDIVO, is a monoclonal antibody that binds to the receptor protein called programmed death protein 1 (PD-1).
ABP 234
ABP 234, a biosimilar candidate to KEYTRUDA, is a monoclonal antibody that binds to the receptor protein (PD-1). It is being investigated in a phase 3 study for biosimilarity to KEYTRUDA. The reference-product primary condition is NSCLC.
ABP 692
ABP 692 is an investigational biosimilar to OCREVUS, which is a monoclonal antibody that binds to CD20, which is a protein found on the surface of B-cells.
AMG 104
AMG 104 is a human anti-TSLP Fab. It is being investigated for the treatment of asthma and is being developed in collaboration with AstraZeneca.
AMG 193
AMG 193 is a small molecule methylthioadenosine (MTA) cooperative protein arginine methyltransferase 5 (PRMT5) inhibitor. It is being investigated for the treatment of NSCLC.
AMG 329
AMG 329 is a fully human monoclonal antibody that binds and neutralizes the function of the FLT3-ligand, thereby reducing both conventional and plasmacytoid dendritic cells. It is being investigated for the treatment of Sjögren’s disease.
Business Relationships
From time to time, we enter into business relationships, including joint ventures and collaborative arrangements, for the R&D, manufacture and/or commercialization of products and/or product candidates. In addition, we acquire product and R&D technology rights and establish R&D collaborations with third parties to enhance our strategic position within our industry by strengthening and diversifying our R&D capabilities, product pipeline and marketed-product base. These arrangements generally provide for nonrefundable upfront license fees, development and commercial-performance milestone payments, cost sharing, royalties and/or profit sharing. The activities under these collaboration agreements are performed with no guarantee of either technological or commercial success, and each is unique in nature.
Trade secret protection for our unpatented confidential and proprietary information is important to us. To protect our trade secrets, we generally require counterparties to execute confidentiality agreements upon commencement of a business relationship with us. However, others could either develop independently the same or similar information or unlawfully obtain access to our information.
AstraZeneca plc
We are in a collaboration with AstraZeneca for the development and commercialization of TEZSPIRE.1 Under our collaboration, both companies share global costs, profits and losses equally after payment by AstraZeneca of a mid-single-digit royalty to Amgen. AstraZeneca leads global development. In North America, Amgen, as the principal, recognizes product sales of TEZSPIRE in the United States, and AstraZeneca, as the principal, recognizes product sales of TEZSPIRE in Canada. AstraZeneca leads commercialization for TEZSPIRE outside North America. Amgen manufactures and supplies TEZSPIRE worldwide.
UCB
We are in a collaboration with UCB for the development and commercialization of EVENITY. Under our collaboration, UCB has rights to lead commercialization for EVENITY in most countries in Europe. Amgen, as the principal, leads commercialization for EVENITY and recognizes product sales in all other territories, including the United States. Global development costs and commercialization profits and losses related to the collaboration are shared equally. Amgen manufactures and supplies EVENITY worldwide.
BeiGene, Ltd.
In January 2020, we acquired an equity stake in BeiGene for approximately $2.8 billion in cash as part of a collaboration to expand our oncology presence in China. For additional information regarding our equity investment in BeiGene, see Part IV—Note 10, Investments, to the Consolidated Financial Statements. Under the collaboration, BeiGene began selling XGEVA in 2020, BLINCYTO in 2021 and KYPROLIS in 2022 in China, and Amgen shares profits and losses equally during the initial product-specific commercialization periods; thereafter, product rights may revert to Amgen, and Amgen would pay royalties to BeiGene on sales in China of such products for a specified period. Amgen manufactures and supplies the collaboration products to BeiGene.
In addition, we jointly develop a portion of our oncology portfolio with BeiGene, which shares in global R&D costs by providing cash and development services of up to $1.25 billion. Upon regulatory approval, BeiGene will assume commercialization rights in China for a specified period, and Amgen and BeiGene will share profits and losses equally until certain of these product rights revert to Amgen. Upon return of the product rights, Amgen will pay royalties to BeiGene on sales in China for a specified period. For product sales outside China, Amgen also pays royalties to BeiGene.
For financial information about our significant collaborative arrangements, see Part IV—Note 9, Collaborations, to the Consolidated Financial Statements.
1 We are also in a collaboration with AstraZeneca for the development of AMG 104. See Research and Development and Selected Product Candidates section above.
Human Capital Resources
Overview
Amgen’s approach to human capital resource management starts with our mission to serve patients. We strive to serve patients by transforming the promise of science and biotechnology into therapies that have the power to restore health or save lives. The complexities of our industry along with the challenges of running an enterprise focused on the discovery, development, manufacture and commercialization of innovative medicines, require a highly engaged and committed workforce.
As of December 31, 2024, Amgen had approximately 28,000 staff members in over 50 countries, including approximately 11,000 staff members outside the United States, and we have had relatively low global turnover rates compared to peer companies, based on available industry information. We also supplement our workforce with independent contractors, contingent workers and temporary workers, as needed. Outside of the United States, some of our employees are represented by unions or works councils. We consider our staff relations to be good, supported by regular assessments of staff engagement surveys on a wide range of topics (including flexible work environments, career development, and maintaining a culture of compliance). Our engagement scores were above general market benchmarks in 2024. We discuss the results of these surveys with our workforce and our Board of Directors. Reflecting our staff members’ desire to retain a flexible approach to work, we offer a flexible workspace initiative that enables many employees to work together with their manager to determine the location that best enables their work at hand, supporting virtual work as well as working in person.
Compensation, Benefits and Development
Our approach to employee compensation and benefits is designed to deliver cash, equity and benefit programs that are competitive with those offered by leading companies in the biotechnology and pharmaceutical industries, and to attract, motivate and retain talent with a focus on encouraging performance, promoting accountability and adherence to our values and alignment with the interests of the Company’s stockholders.
Our base pay program aims to compensate staff members relative to the value of the contributions of their role, which takes into account the skills, knowledge and abilities required to perform each position, as well as the experience brought to the job. We also provide annual incentive programs to reward our staff in alignment with achievement of Company-wide goals that are established annually and designed to drive aspects of our strategic priorities that support and advance our strategy across our Company and are intended to positively position us for both near- and long-term success. The majority of our staff members are also eligible for equity award grants under our long-term incentive program that are designed to align the interests of our staff members with those of our stockholders. For senior level staff, a significant proportion of equity award value is dependent on Company performance.
All staff participate in a regular performance measurement process through which staff receive performance and development feedback, and pay is aligned to performance. Our values and leadership attributes are an integral part of the performance assessments of our staff members, and these evaluations serve as an important information tool and basis for promotion and compensation decisions.
Our staff receive, and are guided by, regular trainings that help them understand what is expected of them. Further, to support the development of our staff, we provide a variety of programs, including leadership development programs, classroom-based and virtual instructor-led courses, and self-paced learning options as well as mentoring, networking and coaching opportunities.
Our benefit programs are generally broad-based, promote health and overall well-being and emphasize saving for retirement. All regular U.S. staff members are eligible to participate in the same core health and welfare and retirement savings plans. Other U.S. employee benefits include adoption assistance, paid parental leave programs, access to childcare, employee assistance programs, employee stock purchase plan, flexible spending accounts, life insurance, long-term care and business travel accident insurance, short and long-term disability benefits, wellness benefits and work-life resources and referrals. Comparable programs and benefits are available globally, with the same health and well-being intent, and consistent with local statutory requirements.
Our Compensation and Management Development Committee provides oversight of our compensation plans, policies and programs.
Total Workforce Health
Creating a safe and healthy workplace for our staff is an important priority at Amgen. Our goal is to have a world class safety record through safety leadership, engaged staff, risk management practices and integrating safety throughout our business processes. We provide job-specific safety training tailored to each role, and to foster our safety culture, we implement a comprehensive safety program and reinforce desired safety behaviors, driving to understand and mitigate the root cause of
safety incidents and manage and control variability. We track injuries and near-miss incidents through our incident tracking system, and we use leading indicators to assess the effectiveness of our safety programs and make course corrections as needed. Additionally, we perform formal executive management review of functional safety performance for Operations, Global Commercial Operations and R&D on a quarterly basis with a focus on identifying early signals and taking action to drive continuous improvement.
Our CRCC provides general oversight of our safety programs and initiatives.
Culture
We believe that an inclusive culture helps attract and retain a strong and engaged workforce informed by the varied backgrounds and experiences represented, which fosters innovation, collaboration and productivity as we execute on our mission to serve patients. A cross-functional, executive-level council composed of the CEO and his direct reports is responsible for overseeing our strategy to further an inclusive workplace. We offer a variety of learning programs and have continued to launch enhanced resources and data analytic tools that guide staff and our leadership on the role they play in creating an inclusive culture.
In our effort to attract and retain the best talent, we seek out and support talent across the globe. As part of our multidimensional hiring and talent development strategy, our Apprenticeship Program launched in 2023 in our Manufacturing and ATMOS functions and expanded to include another cohort of apprentices at our North Carolina site in January 2025. Our Apprenticeship Program is a skills-based approach that proactively seeks to hire candidates from nontraditional sources and backgrounds and is designed to invest in our future workforce through attracting, hiring and upskilling non-four-year degreed talent in the United States. Through the Apprenticeship Program, we provide individuals with classroom-based and on-the-job training as well as mentorship opportunities needed to develop proficiency in targeted business areas and roles. We believe that our Apprenticeship Program and other skills-based approaches to hiring provide us with access to a larger pool of highly motivated and productive talent while also providing underrepresented groups greater access to jobs in innovative sectors of the economy.
Our Compensation and Management Development Committee oversees our labor and employment policies, programs and initiatives, including those relating to our talent strategy and culture of inclusion and belonging.
Information about Our Executive Officers
The executive officers of the Company as of February 14, 2025, are set forth below.
Mr. Robert A. Bradway, age 62, has served as a director of the Company since 2011 and Chairman of the Board of Directors since 2013. Mr. Bradway has been the Company’s President since 2010 and Chief Executive Officer since 2012. From 2010 to 2012, Mr. Bradway served as the Company’s President and Chief Operating Officer. Mr. Bradway joined the Company in 2006 as Vice President, Operations Strategy, and served as Executive Vice President and Chief Financial Officer from 2007 to 2010. Prior to joining the Company, Mr. Bradway was a Managing Director at Morgan Stanley in London, where, beginning in 2001, he had responsibility for the firm’s banking department and corporate finance activities in Europe. Mr. Bradway has been a director of The Boeing Company, an aerospace company and manufacturer of commercial airplanes and defense, space, and securities systems, since 2016. He has served on the board of trustees of the University of Southern California since 2014.
Dr. James E. Bradner, age 52, became Executive Vice President, Research and Development, in 2023 and also served as the Company’s Chief Scientific Officer from 2023 through December 2024. Prior to joining the Company, from 2022 to 2023, Dr. Bradner was a clinician at the Dana-Farber Cancer Institute, a comprehensive cancer treatment and research institution, and a principal teaching affiliate at Harvard Medical School. From 2016 to 2022, Dr. Bradner served as President of the Novartis Institutes for BioMedical Research, the research and early development organizational unit of Novartis AG, where he was a member of the Executive Committee. Dr. Bradner previously served on the faculty at Harvard Medical School.
Mr. Murdo Gordon, age 58, became Executive Vice President, Global Commercial Operations, in 2018. Prior to joining the Company, Mr. Gordon was Chief Commercial Officer at Bristol-Myers Squibb Company (BMS), a pharmaceutical company, from 2016 to 2018. Mr. Gordon served as Head of Worldwide Markets at BMS from 2015 to 2016. Prior to that, Mr. Gordon served in a variety of leadership roles at BMS for more than 25 years.
Mr. Jonathan P. Graham, age 64, became Executive Vice President and General Counsel and Secretary in 2019. Mr. Graham joined the Company in 2015. From 2015 to 2019, Mr. Graham was Senior Vice President, General Counsel and Secretary. Prior to joining Amgen, from 2006 to 2015, Mr. Graham was Senior Vice President and General Counsel at Danaher Corporation. From 2004 to 2006, Mr. Graham was Vice President, Litigation and Legal Policy, at General Electric Company (GE). Prior to GE, Mr. Graham was a partner at Williams & Connolly LLP.
Mr. Peter H. Griffith, age 66, became Executive Vice President and Chief Financial Officer in 2020. Mr. Griffith joined the Company in 2019 as Executive Vice President, Finance. Prior to joining Amgen, Mr. Griffith was President of Sherwood Canyon Group, LLC, a private equity firm. From 1997 to 2019, Mr. Griffith was a partner at EY, an accounting and professional services firm, and served in a variety of senior leadership roles, with his last position being Global Vice Chair, Corporate Development. Prior to EY, Mr. Griffith was a Managing Director and head of the investment banking division of Wedbush Securities Inc.
Ms. Nancy A. Grygiel, age 57, became Senior Vice President and Chief Compliance Officer in 2020. Ms. Grygiel joined the Company in 2015. From 2016 to 2020, Ms. Grygiel was Vice President, Compliance. Prior to joining Amgen, from 2011 to 2015, Ms. Grygiel served as Vice President, Compliance, Corporate & International, at Allergan, Inc. (Allergan). Prior to Allergan, Ms. Grygiel held several management positions at Mylan Pharmaceuticals, Inc.
Ms. Rachna Khosla, age 52, became Senior Vice President, Business Development, in 2021. Ms. Khosla joined the Company in 2013 as Corporate Development Director. From 2018 to 2021, Ms. Khosla was Vice President, Business Development, and from 2016 to 2018, was Executive Director, Business Development. Prior to joining the Company, Ms. Khosla was a Director at Lazard Ltd. (Lazard) responsible for healthcare mergers and acquisitions. Prior to Lazard, Ms. Khosla held various roles in investment banking (mergers and acquisitions) and corporate venture capital at Credit Suisse Group AG, Sanofi Aventis, Aventis Capital, J.P. Morgan Chase & Co., and Salomon Brothers, Inc.
Mr. Derek Miller, age 52, became Senior Vice President, Human Resources, in 2022. Mr. Miller joined the Company in 2003 and has held human resources leadership roles supporting each of the Company’s major business functions. From 2020 to 2022, Mr. Miller was Vice President, Global Total Rewards, and from 2018 to 2020, was Vice President, Human Resources. From 2015 to 2018, Mr. Miller was an Executive Director, Human Resources. Prior to 2015, Mr. Miller served as a Senior Manager in the Human Resources organization, before his promotion to Director, Human Resources, and then to Strategy Director.
Dr. David M. Reese, age 62, became the Company’s inaugural Executive Vice President and Chief Technology Officer in December 2023, responsible for accelerating the use of technology and artificial intelligence across the organization. From 2018 to December 2023, Dr. Reese served as Executive Vice President, Research and Development. Dr. Reese joined the Company in 2005 and has held leadership roles in development, translational, and medical sciences, and discovery research, including as Senior Vice President, Translational Sciences and Oncology, from 2017 to 2018. Prior to joining Amgen, Dr. Reese was a cofounder, president, and chief medical officer of Translational Oncology Research International, a not-for-profit academic clinical research organization, and director of Clinical Research at the Breast Cancer International Research Group. Dr. Reese previously served on the faculty at the University of California, Los Angeles and the University of California, San Francisco.
Mr. Esteban Santos, age 57, became Executive Vice President, Operations, in 2016. Mr. Santos joined the Company in 2007 as Executive Director, Manufacturing Technologies. From 2013 to 2016, Mr. Santos was Senior Vice President, Manufacturing. From 2008 to 2013, Mr. Santos held a number of Vice President roles at the Company in engineering, manufacturing, site operations and drug product. Prior to joining the Company, Mr. Santos served as Site General Manager of Johnson & Johnson’s (J&J) Cordis operation in Puerto Rico. Prior to J&J, Mr. Santos held several management positions in GE’s industrial and transportation businesses.
Geographic Area Financial Information
For financial information concerning the geographic areas in which we operate, see Part IV—Note 3, Revenues, and Note 12, Property, plant and equipment, to the Consolidated Financial Statements.
Investor Information
Financial and other information about us is available on our website at www.amgen.com. We make available on our website, free of charge, copies of our Annual Report on Form 10-K, Quarterly Reports on Form 10-Q, current reports on Form 8-K and amendments to those reports filed or furnished pursuant to Section 13(a) or 15(d) of the Exchange Act as soon as reasonably practicable after we electronically file such material with or furnish it to the U.S. Securities and Exchange Commission (SEC). In addition, we have previously filed registration statements and other documents with the SEC. Any document we file may be inspected without charge at the SEC’s website at www.sec.gov. (These website addresses are not intended to function as hyperlinks, and the information contained in our website and in the SEC’s website is not intended to be a part of this filing.)
This report and other documents we file with the SEC contain forward-looking statements that are based on current expectations, estimates, forecasts and projections about us, our future performance, our business, our beliefs and our management’s assumptions. These statements are not guarantees of future performance and involve certain risks, uncertainties and assumptions that are difficult to predict. You should carefully consider the risks and uncertainties our business faces. The risks described below are not the only ones we face. Our business is also subject to the risks that affect many other companies, such as employment relations, general economic conditions, geopolitical events and international operations. Further, additional risks not currently known to us or that we currently believe are immaterial may in the future materially and adversely affect our business, operations, liquidity and stock price.
SUMMARY
Risks Related to Government Regulations and Third-Party Policies
•Our sales depend on coverage and reimbursement from government and commercial third-party payers, and pricing and reimbursement pressures have affected, and are likely to continue to affect, our profitability.
•Guidelines and recommendations published by various organizations can reduce the use of our products.
•We could be subject to additional tax liabilities, including from an adverse outcome in our ongoing tax dispute with the IRS and other tax examinations, enactment of the OECD minimum corporate tax rate agreement and the adoption and interpretation of new tax legislation, and we anticipate additional tax liabilities from certain provisions of the 2017 Tax Act that will go into effect in 2026; such tax liabilities could adversely affect our profitability and results of operations.
•Our business may be affected by litigation and government investigations.
Risks Related to Economic Conditions and Operating a Global Business
•Our efforts to collaborate with or acquire other companies, products, or technology, and to integrate the operations of companies or to support the products or technology we have acquired, may not be successful, and may result in unanticipated costs, delays or failures to realize the benefits of the transactions.
•A breakdown of our information technology systems, cyberattack or information security breach could significantly compromise the confidentiality, integrity and availability of our information technology systems, network-connected control systems and/or our data, interrupt the operation of our business and/or affect our reputation.
•Our sales and operations are subject to the risks of doing business internationally, including in emerging markets.
•We may not be able to access the capital and credit markets on terms that are favorable to us, or at all.
Risks Related to Competition
•Our products face substantial competition and our product candidates are also likely to face substantial competition.
•Our intellectual property positions may be challenged, invalidated or circumvented, or we may fail to prevail in current and future intellectual property litigation.
•We currently face competition from biosimilars and generics and expect to face increasing competition from biosimilars and generics in the future.
•Concentration of sales at certain of our wholesaler distributors, and consolidation of private payers, such as insurers, and PBMs has negatively affected, and may continue to negatively affect, our business.
Risks Related to Research and Development
•We may not be able to develop commercial products despite significant investments in R&D.
•We must conduct clinical trials in humans before we commercialize and sell any of our product candidates or existing products for new indications.
•Our current products and products in development cannot be sold without regulatory approval.
•Some of our products are used with drug delivery or companion diagnostic devices that have their own regulatory, manufacturing and other risks.
•Some of our pharmaceutical pipeline and our commercial product sales rely on collaborations with third parties, which may adversely affect the development and sales of our products.
Risks Related to Operations
•We perform a substantial majority of our commercial manufacturing activities at our facility in the U.S. territory of Puerto Rico and a substantial majority of our clinical manufacturing activities at our facility in Thousand Oaks, California; significant disruptions or production failures at these facilities could significantly impair our ability to supply our products or continue our clinical trials.
•We rely on third-party suppliers for certain of our raw materials, medical devices and components.
•Manufacturing difficulties, disruptions or delays could limit supply of our products and limit our product sales.
•Our business and operations may be negatively affected by the failure, or perceived failure, of achieving our environmental, social and governance objectives.
•The effects of global climate change and related natural disasters could negatively affect our business and operations.
General Risk Factors
•Global economic conditions may negatively affect us and may magnify certain risks that affect our business.
•Our stock price is volatile.
RISKS RELATED TO GOVERNMENT REGULATIONS AND THIRD-PARTY POLICIES
Our sales depend on coverage and reimbursement from government and commercial third-party payers, and pricing and reimbursement pressures have affected, and are likely to continue to affect, our profitability.
Sales of our products depend on the availability and extent of coverage and reimbursement from third-party payers, including government healthcare programs and private insurance plans. Governments and private payers continue to pursue initiatives to manage drug utilization and contain costs. Further, pressures on healthcare budgets from the economic downturn and inflation continue and are likely to increase, across the markets we serve. Payers are increasingly focused on costs, which has resulted, and is expected to continue to result, in lower reimbursement rates for our products and/or narrower patient populations for which payers will reimburse. Continued intense public scrutiny of the price of drugs and other healthcare costs, together with payer dynamics, have limited, and are likely to continue to limit, our ability to set or adjust the price of our products based on their value, which can have a material adverse effect on our business. In the United States, particularly over the past few years, a number of legislative and regulatory proposals have been introduced and/or signed into law to lower drug prices. These include the IRA law that enables the U.S. government to set prices for certain drugs in Medicare, redesigns Medicare Part D benefits to shift a greater proportion of the costs to manufacturers and health plans, and enables the U.S. government to impose penalties if drug prices are increased at a rate faster than inflation (IRA Inflation Penalties). Additional proposals focused on drug pricing continue to be debated, and additional executive orders or regulatory initiatives focused on drug pricing and competition are likely to be adopted and implemented in some form. It is unclear what policies the new Administration will advance with respect to IRA implementation and other drug pricing proposals. Further, state government activity has been dynamic, including certain states enacting new laws limiting drug reimbursement under state run Medicaid programs and prohibiting restrictions on 340B Program use. Such state laws could also eventually be adopted at the federal level.
We are unable to predict which or how many policy, regulatory, administrative or legislative changes may ultimately be, or effectively estimate the consequences to our business if, enacted and implemented. However, to the extent that payer actions further decrease or modify the coverage or reimbursement available for our products, require that we pay increased rebates or shift other costs to us, limit or affect our decisions regarding the pricing of or otherwise reduce the use of our products, such actions could have a material adverse effect on our business and results of operations.
—Changing U.S. federal coverage and reimbursement policies and practices have affected, and are likely to continue to affect, access to, pricing of, and sales of our products
A substantial proportion of our U.S. business relies on reimbursement from federal government healthcare programs and commercial insurance plans regulated by federal and state governments. See Part I, Item 1. Business—Reimbursement. Our business has been, and will continue to be, affected by legislative actions changing U.S. federal reimbursement policy. For example, the IRA includes provisions requiring that, beginning in 2026, mandatory price setting be introduced in Medicare for certain drugs paid for under Parts B and D, whereby manufacturers must accept a price established by the government or face penalties on all U.S. sales (starting with 10 drugs in 2026, adding 15 in 2027 and 2028, and adding 20 in 2029 and subsequent
years such that, by 2031, approximately 100 drugs could be subject to such set prices). The Medicare price setting process for the first 10 drugs subject to Medicare price setting in Part D began in 2023 , which includes ENBREL, our product that currently generates considerable revenues. In 2024, CMS set a price for ENBREL under Medicare Part D that is significantly lower than currently applicable, beginning on January 1, 2026, which we expect will negatively impact its profitability in Medicare. See Part I, Item 2. Management’s Discussion and Analysis of Financial Condition and Results of Operations—Results of operations—Product sales—ENBREL. In January 2025, CMS announced the next 15 drugs for Medicare price setting that will be applicable beginning on January 1, 2027, which includes Otezla. Depending on the growth and success of our medicines, other of our medicines may also be subject to selection by CMS in the next, or in a future, cycle of mandatory Medicare price setting. If other of our medicines are selected by CMS for Medicare price setting, we may be required to accept a price set by the government for Medicare similar to the process that was applied to ENBREL. Also under the IRA, Medicare Part D was redesigned to cap beneficiary out-of-pocket costs and, beginning January 1, 2025, Federal reinsurance will be reduced in the catastrophic phase (resulting in a shift and increase of such costs to Part D plans and manufacturers, including by requiring manufacturer discounts on certain drugs). Further, the IRA inflation penalties allows CMS to collect rebates from manufacturers if price increases outpace inflation. Such rebate obligations began to accrue October 1, 2022 for Medicare Part D and January 1, 2023 for Medicare Part B, but CMS has not yet issued invoices and has some discretion as to when to issue such invoices to manufacturers. We expect that several of our products will be subject to IRA inflation penalties, and several of our products have been on lists that are issued and updated on a quarterly basis by CMS under a related program under which Medicare beneficiaries are charged reduced coinsurance if price increases exceed inflation. The IRA’s Medicare price setting and Medicare redesign are likely to have a material adverse effect on our sales, our business and our results of operations, and such impact is expected to increase through the end of the decade and will depend on factors including the extent of our portfolio’s exposure to Medicare reimbursement, the rate of inflation over time, the number of our products selected for Medicare price setting and the timing of market entry of generic or biosimilar competition. Further, following the enactment of the IRA, the environment remains dynamic and U.S. policymakers continue to demonstrate interest in health care and drug pricing changes. For example, in April 2024, CMS finalized policy changes that will give Part D plans more flexibility to substitute biosimilars for innovator products on formularies in 2025. Additionally, various government agencies have taken actions designed to reduce expenditures on prescription drugs. For example, HHS released a report with drug pricing proposals that seek to promote competition. The USPTO has also taken steps to strengthen coordination with the FDA to address perceived impediments to generic drug and biosimilar competition. Other CMS policy changes and demonstration projects to test new care, delivery and payment models can also significantly affect how drugs, including our products, are covered and reimbursed.
We also face risks related to the reporting of pricing data that affects reimbursement of and discounts provided for our products. U.S. government price reporting regulations are complex and may require biopharmaceutical manufacturers to update certain previously submitted data. If our submitted pricing data are incorrect, we may become subject to substantial fines and penalties or other government enforcement actions, which could have a material adverse effect on our business and results of operations. In addition, as a result of restating previously reported price data, we may be required to pay additional rebates and provide additional discounts.
—Changing reimbursement and pricing actions in various states have negatively affected, and may continue to negatively affect, access to, and have affected, and may continue to affect, sales of our products
At the state level, legislation, government actions, and ballot initiatives can also affect how our products are covered and reimbursed and/or create additional pressure on our pricing decisions. Existing and proposed state pricing laws have added complexity to the pricing of drugs and may already be affecting industry pricing decisions. A number of states have adopted, and many other states are considering, PDABs, drug importation programs, reference pricing schemes, and other drug pricing actions, including proposals designed to require biopharmaceutical manufacturers to report to the state proprietary pricing information or provide advance notice of certain price increases.
States are also enacting laws referencing the IRA and seeking to regulate and prohibit restrictions on the 340B Program. For example, following the passage of the IRA, bills have been proposed in multiple states that would apply the drug price caps set by HHS for Medicare to drug prices in an individual state, and such references to IRA price caps have also been included in PDAB legislation. For Medicaid patients, states have established a Medicaid drug spending cap (New York) and implemented a new review and supplemental rebate negotiation process (Massachusetts). Eight states (Colorado, Maine, New Hampshire, New Jersey, Maryland, Minnesota, Oregon and Washington) have enacted laws that establish PDABs to identify drugs that pose affordability challenges, and four such states include authority for the state PDABs to set upper payment limits on certain drugs for in-state patients, payers and providers. In 2024, no fewer than 17 states introduced PDAB legislation. The eight states with enacted PDAB laws are in various phases of implementation, with Colorado’s PDAB being the furthest along. The Colorado PDAB deemed three of five drugs “unaffordable,” including ENBREL, and are subject to rulemaking to establish an Upper Payment Limit (UPL) commencing March 2025 and that could be effective as soon as the fourth quarter of 2025. Further, inappropriate expanded utilization of the 340B Program from broadened application of the 340B discounts has had, and is
expected to continue to have, a negative impact on the Company’s product sales, business and results of operations. Louisiana, Arkansas, West Virginia, Minnesota, Kansas, Mississippi, Missouri and Maryland have enacted laws with mandates on manufacturers participating in the 340B Program, and, in 2024, no fewer than 25 states considered similar legislation. These bills vary, but typically include provisions on restricting a manufacturer’s ability to direct drugs in 340B channels, recognizing 340B contract pharmacies and a prohibition on requiring the inclusion of 340B claims modifiers. In March 2024, the U.S. Court of Appeals for the 8th Circuit ruled that Arkansas’ Act 1103, which prohibits drugmakers from restricting the acquisition or delivery of 340B drugs to covered entities and their contract pharmacies, was not preempted by the federal 340B statute. The decision contributed to an increase in the number of states considering similar legislation. In July 2024, the U.S. District Court for the Southern District of Mississippi denied motions for a preliminary injunction in two cases challenging a similar law in Mississippi, finding that neither plaintiff had demonstrated a substantial likelihood of success on the merits. These orders are being appealed at the U.S. Court of Appeals for the 5th Circuit. In September 2024, the U.S. District Court for the Western District of Louisiana dismissed a lawsuit challenging Louisiana’s 340B contract pharmacy mandate law, and the U.S. District Court for the District of Maryland denied a motion for preliminary injunction challenging a similar law in Maryland. These lawsuits challenging states on their 340B contract pharmacy laws are subsequent to Genesis Health Care, Inc. v. Becerra, where the U.S. District Court for the District of South Carolina issued an order in November 2023 that enjoins the Health Resources and Services Administration from enforcing its more restrictive interpretation of who is considered a patient under the 340B Program, to the potential benefit of healthcare systems seeking to expand the application of 340B discounts.
Additionally, on January 5, 2024, the FDA authorized Florida to move forward with its importation program proposal, though the state has not completed any significant steps towards importation within the one-year authorization window. Colorado, Maine, New Hampshire, New Mexico, Texas and Vermont have also enacted state importation laws, and some have submitted plans for approval to the FDA. Other states could adopt similar approaches or could pursue different policy changes in a continuing effort to reduce their costs.
Ultimately, as with U.S. federal government actions, existing or future state government actions or ballot initiatives may also have a material adverse effect on our product sales, business and results of operations.
—U.S. commercial payer actions have affected, and may continue to affect, access to and sales of our products
Payers, including healthcare insurers, PBMs, integrated healthcare delivery systems (vertically-integrated organizations built from consolidations of healthcare insurers and PBMs) and group purchasing organizations, are continuing to seek ways to further reduce their costs. With increasing frequency, payers are adopting benefit plan changes that shift a greater proportion of drug costs to patients. Such measures include more limited benefit plan designs, high deductible plans, higher patient co-pay or coinsurance obligations and more significant limitations on patients’ use of manufacturer commercial co-pay assistance programs. Further, government regulation of payers may affect these trends. Payers, including PBMs, have sought, and continue to seek, price discounts or rebates in connection with the placement of our products on their formularies or those they manage, and to also impose restrictions on access to, or usage of, our products (such as Step Therapy), require that patients receive the payer’s prior authorization before covering the product, and/or chosen to exclude certain indications for which our products are approved. For example, some payers require physicians to demonstrate or document that the patients for whom Repatha has been prescribed meet their utilization criteria, and these requirements have served to limit patient access to Repatha treatment. In an effort to reduce barriers to access, we reduced the net price of Repatha by providing greater discounts and rebates to payers (including PBMs that administer Medicare Part D prescription drug plans), and in response to a very high percentage of Medicare patients abandoning their Repatha prescriptions rather than paying their co-pay, we introduced a set of new National Drug Codes to make Repatha available at a lower list price. However, affordability of patient out-of-pocket co-pay cost has limited, and may continue to limit, patient use. Further, despite these net and list price reductions, some payers have restricted, and may continue to restrict, patient access and may seek further discounts or rebates or take other actions, such as changing formulary coverage for Repatha, that could reduce its sales. These factors have limited, and may continue to limit, patient affordability and use, negatively affecting Repatha sales.
Further, significant consolidation in the health insurance industry has resulted in a few large insurers and PBMs, which places greater pressure on pricing and usage negotiations with biopharmaceutical manufacturers, significantly increasing discount and rebate requirements and limiting patient access and usage. For example, in the United States, the FTC’s interim report released in 2024 showed that the top six integrated health plans and PBMs controlled about 94% of all pharmacy prescriptions. This high degree of consolidation among insurers, PBMs and other payers, including integrated healthcare delivery systems and/or with specialty or mail-order pharmacies and pharmacy retailers, has increased the negotiating leverage such entities have over us and other biopharmaceutical manufacturers and has resulted in greater price discounts, rebates and service fees realized by those payers from our business. Each of CVS, Express Scripts and United Health Group (among the top six integrated health plans and PBMs) have Rebate Management Organizations that further increase their leverage to negotiate deeper discounts on their behalf and for the benefit of their other customers. Ultimately, additional discounts, rebates, fees, coverage changes, plan changes, restrictions or exclusions imposed by these commercial payers could have a material adverse
effect on our product sales, business and results of operations. Policy reforms advanced by Congress or the Administration that refine the role of PBMs in the U.S. marketplace could have downstream implications or consequences for our business and how we interact with these entities. For example, in September 2024, the FTC brought action against the three largest PBMs alleging anticompetitive and unfair rebating practices. In addition, multiple Congressional Committees have been investigating PBM practices and have also proposed legislation that could increase transparency and reporting of these practices and/or impact rebates and service fees. The results of such inquiries could have an effect on manufacturer interactions with PBMs, resulting in changes to access for certain medicines. See Concentration of sales at certain of our wholesaler distributors, and consolidation of private payers, such as insurers, and PBMs has negatively affected, and may continue to negatively affect, our business.
Our business is also affected by policies implemented by private healthcare entities that process Medicare claims, including Medicare Administrative Contractors. For example, in 2022, several Medicare Administrative Contractors issued notice that TEZSPIRE would be added to their “self-administered drug” exclusion lists. Although the Medicare Administrative Contractors subsequently removed TEZSPIRE from their exclusion lists, these exclusions, if reintroduced and/or implemented, would result in Medicare beneficiaries with severe asthma losing access to TEZSPIRE coverage under Medicare Part B and potentially also under Medicare Advantage.
—Government and commercial payer actions outside the United States have affected and will continue to affect access to and sales of our products
Outside the United States, we expect countries will also continue to take actions to reduce their drug expenditures and to reduce intellectual property protections. See Part I, Item 1. Business—Reimbursement. Pressures to decrease drug expenditures may intensify as governments take actions to address budgets strained by high inflation and weak economic conditions, including in Europe where the effects of the Russia–Ukraine conflict have challenged the economies in that region. Further, the EU is currently undergoing a review and revision of its general pharmaceutical legislation that, while full implementation is not expected before 2027, has led to proposals that would reduce intellectual property protection for new products (including potentially shortening the duration of regulatory data exclusivity and orphan drug exclusivity protections), as well as change the reimbursement and regulatory landscape. International reference pricing has been widely used by many countries outside the United States to control costs. International reference pricing policies can change quickly and frequently and may not reflect differences in the burden of disease, indications, market structures or affordability across countries or regions. Other expenditure control practices, including the use of revenue clawbacks, rebates and caps on product sales, are also used in various foreign jurisdictions. In addition, countries may refuse to reimburse, or may restrict the reimbursed population for a product, when their national health technology assessments do not consider a medicine to demonstrate sufficient clinical benefit beyond existing therapies or to meet certain cost effectiveness thresholds. For example, despite the EMA’s approval of Repatha for the treatment of patients with established atherosclerotic disease, prior to 2020, the reimbursement of Repatha in France was limited to a narrower patient population (such as those with homozygous familial hypercholesterolemia (HoFH)) following a national health technology assessment. Many countries decide on reimbursement between potentially competing products through national or regional tenders that often result in one product receiving most, or all of, the sales in that country or region. Failure to obtain coverage and reimbursement for our products, a deterioration in their existing coverage and reimbursement, or a decline in the timeliness or certainty of payment by payers to hospitals and other providers, has negatively affected, and may further negatively affect, the ability or willingness of healthcare providers to prescribe our products for their patients and otherwise negatively affect the use of our products or the prices we realize for them. Such failures and changes have had, and could in the future have, a material adverse effect on our product sales, business and results of operations.
Guidelines and recommendations published by various organizations can reduce the use of our products.
Government agencies promulgate regulations and guidelines directly applicable to us and to our products. Professional societies, practice management groups, insurance carriers, physicians’ groups, private health and science foundations and organizations involved in various diseases also publish guidelines and recommendations to healthcare providers, administrators and payers, as well as patient communities. Recommendations by government agencies or other groups and organizations may relate to such matters as usage, dosage, route of administration and use of related therapies. In addition, a growing number of organizations are providing assessments of the value and pricing of biopharmaceutical products, and even organizations whose guidelines have historically been focused on clinical matters have begun to incorporate analyses of the cost effectiveness of various treatments into their treatment guidelines and recommendations. Value assessments may come from private organizations that publish their findings and offer recommendations relating to the products’ reimbursement by government and private payers. Some companies and payers have announced pricing and payment decisions based in part on the assessments of private organizations. In addition, government health technology assessment organizations in many countries make reimbursement recommendations to payers in their jurisdictions based on the clinical effectiveness, cost-effectiveness and service effects of new, emerging and existing medicines and treatments. Such health technology assessment organizations have recommended, and may in the future recommend, reimbursement for certain of our products for a narrower indication than was approved by applicable regulatory agencies or may recommend against reimbursement entirely. See Our sales depend on
coverage and reimbursement from government and commercial third-party payers, and pricing and reimbursement pressures have affected, and are likely to continue to affect, our profitability. The EU has adopted regulations, beginning this year, intended to increase cooperation among EU member states and harmonize various procedures and standards at the EU level in assessing health technologies and in support of joint clinical assessments of health technologies and medicines. These and other such recommendations or guidelines may affect our reputation, and any recommendations or guidelines that result in decreased use, dosage or reimbursement of our products could have a material adverse effect on our product sales, business and results of operations. In addition, the perception by the investment community or stockholders that such recommendations or guidelines will result in decreased use and dosage of our products could adversely affect the market price of our common stock.
We could be subject to additional tax liabilities, including from an adverse outcome in our ongoing tax dispute with the IRS and other tax examinations, enactment of the OECD minimum corporate tax rate agreement and the adoption and interpretation of new tax legislation, and we anticipate additional tax liabilities from certain provisions of the 2017 Tax Act that will go into effect in 2026; such tax liabilities could adversely affect our profitability and results of operations.
We are subject to income and other taxes in the United States and other jurisdictions in which we do business. As a result, our provision for income taxes is derived from a combination of applicable tax rates in the various places we operate. Significant judgment is required for determining our provision for income tax.
One or more of our legal entities file income tax returns in the U.S. federal jurisdiction, various U.S. state jurisdictions and foreign jurisdictions. Our income tax returns are routinely examined by tax authorities in those jurisdictions. Significant disputes can and have arisen with tax authorities involving issues regarding the timing and amount of deductions, the use of tax credits and allocations of income and expenses among various tax jurisdictions because of differing interpretations of tax laws, regulations and relevant facts, and such tax authorities (including the IRS) are becoming more aggressive in their audits and are particularly focused on such matters. In 2017, we received an RAR and a modified RAR from the IRS for the years 2010–2012, proposing significant adjustments that primarily relate to the allocation of profits between certain of our entities in the United States and the U.S. territory of Puerto Rico. We disagreed with the proposed adjustments and calculations and pursued resolution with the IRS administrative appeals office but were unable to reach resolution. In July 2021, we filed a petition in the U.S. Tax Court to contest two duplicate Statutory Notices of Deficiency (Notices) for the years 2010–2012 that we received in May and July 2021 which seek to increase our U.S. taxable income for the years 2010–2012.
In 2020, we received an RAR and a modified RAR from the IRS for the years 2013–2015, also proposing significant adjustments that primarily relate to the allocation of profits between certain of our entities in the United States and the U.S. territory of Puerto Rico similar to those proposed for the years 2010–2012. We disagreed with the proposed adjustments and calculations and pursued resolution with the IRS appeals office but were unable to reach resolution. In July 2022, we filed a petition in the U.S. Tax Court to contest a Notice for the years 2013–2015 that we previously reported receiving in April 2022 that seeks to increase our U.S. taxable income for the years 2013–2015 and asserts penalties.
We firmly believe that the IRS positions set forth in the 2010–2012 and 2013–2015 Notices are without merit. We are contesting the 2010–2012 and 2013–2015 Notices through the judicial process. The cases were consolidated on December 19, 2022. The trial began on November 4, 2024 and concluded on January 17, 2025. With the conclusion of the trial, the parties will file post-trial briefs and make closing arguments in 2025. The Company expects a decision from the U.S. Tax Court no earlier than 2026.
We are currently also under examination by the IRS for the years 2016–2018 with respect to issues similar to those for the 2010 through 2015 period. We believe that the IRS may also seek to continue to audit similar issues related to the allocation of income between the United States and the U.S. territory of Puerto Rico for years beyond 2018. In addition, we are under examination by a number of state and foreign tax jurisdictions.
Final resolution of these complex tax matters is not likely within the next 12 months. We continue to believe our accrual for income tax liabilities is appropriate based on past experience, interpretations of tax law, application of the tax law to our facts and judgments about potential actions by tax authorities; however, due to the complexity of the provision for income taxes and uncertain resolution of these matters, the ultimate outcome of any tax matters may result in payments substantially greater than amounts accrued and could have a material adverse effect on the results of our operations.
See Part II, Item 7. Management’s Discussion and Analysis of Financial Condition and Results of Operations—Results of Operations, Income Taxes, and Part IV—Note 7, Income taxes, to the Consolidated Financial Statements.
Our provision for income taxes and results of operations in the future could be adversely affected by changes to our operating structure, changes in the mix of income and expenses in countries with differing tax rates, changes in the valuation of deferred tax assets and liabilities and changes in applicable tax laws, regulations or administrative interpretations thereof. The 2017 Tax Act is complex and a large volume of regulations and guidance has been issued and could be subject to different interpretations. We could face audit challenges to our application of the 2017 Tax Act.
As previously reported, the OECD reached an agreement to align countries on a minimum corporate tax rate and an expansion of the taxing rights of market countries. As of January 1, 2025, select individual countries, including the United Kingdom, EU member countries, and Singapore, have enacted the global minimum tax agreement. Our legal entities in the countries that have enacted the agreement, along with their direct and indirect subsidiaries, are now subject to a 15% minimum tax rate on adjusted financial statement income. Additional provisions of the OECD agreement may come into effect in future years, and the OECD is expected to continue to release additional guidance that may impact the application and interpretation of the agreement that could further increase our tax liabilities. Other countries, including the United States and the U.S. territory of Puerto Rico, have not yet enacted the OECD agreement and implementation remains highly uncertain. The continued enactment of the agreement, either by all OECD participants or unilaterally by individual countries, could result in tax increases or double taxation in the United States or foreign jurisdictions.
The tax rates associated with certain international provisions of the 2017 Tax Act are set to increase beginning in 2026. If those changes take effect as scheduled, we anticipate that the overall U.S. tax rate on our foreign income would increase. The Administration and U.S. Congress are discussing various proposals that would renew, modify, or eliminate the international and other corporate provisions of the 2017 Tax Act and U.S. tax law more generally. Changes to existing tax law in the United States, the U.S. territory of Puerto Rico or other jurisdictions, including the changes and potential changes discussed above, could result in tax increases where we do business and could have a material adverse effect on the results of our operations.
Our business may be affected by litigation and government investigations.
We and certain of our subsidiaries are involved in legal proceedings. See Part IV—Note 20, Contingencies and commitments, to the Consolidated Financial Statements. Civil and criminal litigation is inherently unpredictable, and the outcome can result in costly verdicts, fines and penalties, exclusion from federal healthcare programs and/or injunctive relief that affect how we operate our business. Defense of litigation claims can be expensive, time consuming and distracting, and it is possible that we could incur judgments or enter into settlements of claims for monetary damages or change the way we operate our business, which could have a material adverse effect on our product sales, business and results of operations. In addition, product liability is a major risk in testing and marketing biotechnology and pharmaceutical products. We may face substantial product liability exposure in human clinical trials and for products we sell after regulatory approval. Product liability claims, regardless of their merits, could be costly and divert management’s attention and could adversely affect our reputation and the demand for our products. We and certain of our subsidiaries have previously been, and currently are, named as defendants in product liability actions for certain of our products.
We are also involved in government investigations that arise in the ordinary course of our business. In recent years, there has been a trend of increasing government investigations and litigations against companies operating in our industry, both in the United States and around the world. See Our sales depend on coverage and reimbursement from government and commercial third-party payers, and pricing and reimbursement pressures have affected, and are likely to continue to affect, our profitability. Our business activities outside of the United States are subject to the FCPA and similar antibribery or anticorruption laws, regulations or rules of other countries in which we operate, including the U.K. Bribery Act. We cannot ensure that all our employees, agents, contractors, vendors, licensees, partners or collaborators will comply with all applicable laws and regulations. We entered into a corporate integrity agreement with the DOJ and the OIG of the HHS to settle certain allegations relating to our support of independent charitable organizations that provide patients with financial assistance to access their medicines that required us to maintain a corporate compliance program and to undertake a set of defined corporate integrity obligations through April 2024, and that we completed on November 27, 2024. While we fully complied with all of our obligations under the corporate integrity agreement, we may be subject to future corporate integrity agreements and failure to comply could result in substantial penalties and potential exclusion from government healthcare programs. We may also see new government investigations of or actions against us citing novel theories of recovery. For example, prosecutors are placing greater scrutiny on patient support programs, including commercial copay assistance programs, and further enforcement actions and investigations regarding such programs could limit our ability to provide co-pay assistance to commercial patients. Greater scrutiny has also been placed on sponsorships, speaker programs and other arrangements where healthcare professionals receive remuneration, travel or other value to participate in certain events, and further enforcement actions could limit our ability to participate in such arrangements. Any of these results could have a material adverse effect on our business and results of operations.
RISKS RELATED TO ECONOMIC CONDITIONS AND OPERATING A GLOBAL BUSINESS
Our efforts to collaborate with or acquire other companies, products, or technology, and to integrate the operations of companies or to support the products or technology we have acquired, may not be successful, and may result in unanticipated costs, delays or failures to realize the benefits of the transactions.
We seek innovation through significant investment in both internal R&D and external transactions, including collaborations, partnerships, alliances, licenses, joint ventures, mergers and acquisitions (collectively, acquisition activity).
Acquisition activities may be subject to regulatory approvals or other requirements that are not within our control. Antitrust scrutiny by regulatory agencies and changes to regulatory approval process in the U.S. and foreign jurisdictions may cause approvals to take longer than anticipated to obtain, not be obtained at all, or contain burdensome conditions, which may jeopardize, delay or reduce the anticipated benefits of acquisitions to us and could impede the execution of our business strategy. There can be no assurance that such regulatory or other approvals will be obtained or that all closing conditions required in connection with our acquisition activities will be satisfied or waived, which could result in us being unable to complete the planned acquisition activities.
Acquisition activities are complex, time consuming and expensive and may result in unanticipated costs, delays or other operational or financial problems related to integrating the acquired company and business with our company, which may divert our management’s attention from other business issues and opportunities and restrict the full realization of the anticipated benefits of such transactions within the expected timeframe or at all. We may pay substantial amounts of cash, incur debt or issue equity securities to pay for acquisition activities, which could adversely affect our liquidity or result in dilution to our stockholders, respectively. For example, the primary sources of funds for our acquisition of Horizon were those received from our $24 billion of senior notes issued on March 2, 2023, together with the $4 billion drawn down from our term loan facility, of which we repaid $2.2 billion, and while the Company currently has investment grade credit ratings, this substantial additional indebtedness resulted in downgrades to our credit ratings. Further, failures or difficulties in integrating or retaining new personnel or in integrating the operations of the businesses, products or assets we acquire (including related technology, research, development and commercial operations, compliance programs, manufacturing, distribution and general business operations and procedures and ESG activities) may affect our ability to realize the benefits of the transaction and grow our business and may result in us incurring asset impairment or restructuring charges. These and other challenges may arise in connection with our acquisitions, including our acquisitions of ChemoCentryx and Horizon and/or our collaborations with BeiGene and Kyowa Kirin, or with other acquisition activities, which could have a material adverse effect on our business, results of operations and stock price.
We may not realize the anticipated strategic benefits of our acquisition of Horizon, including our efforts to leverage Amgen’s global presence and commercial and medical capabilities in inflammation and nephrology to accelerate revenue growth of Horizon’s products. Our assumptions and estimates about the future revenue growth of Horizon’s products may prove to be incorrect. Sales of our rare disease products acquired through our acquisition of Horizon will depend on our ability to increase awareness and educate physicians on the rare conditions that such medicines are designed to treat, as well as successfully identifying target patients and educating them about our treatments. We may also face greater than expected challenges associated with rare disease drug development (such as challenges obtaining patients for clinical trials and/or regulatory approvals) and reimbursement (such as obtaining reimbursement of orphan drugs by public health systems). We are in the process of completing the integration of the Horizon business into ours, including a number of complex operational and administrative systems, including with respect to information and information security systems and supply chain systems and third party relationships (including vendors and third party manufacturers). For example, Horizon adds more than 30 contract manufacturing organizations (CMOs) to our operations, many of which are single source suppliers (including the CMO that produces TEPEZZA drug substance and the CMO that produces all of our KRYSTEXXA drug substance in Israel that is affected by the current conflict in Israel and Gaza). Business integrations generally, and our integration of Horizon specifically, are complex, time consuming and expensive, and we may experience unanticipated costs, delays or other operational or financial challenges. These integration efforts may also divert our management’s attention and resources away from other business operations, which may disrupt to some degree our ongoing business. Failure to successfully fully integrate the Horizon business into ours and/or achieve its anticipated strategic benefits may result in our incurring significant asset impairment or restructuring charges, and could have a material adverse effect on our business, results of operations and stock price.
A breakdown of our information technology systems, cyberattack or information security breach could significantly compromise the confidentiality, integrity and availability of our information technology systems, network-connected control systems and/or our data, interrupt the operation of our business and/or affect our reputation.
To achieve our business objectives, we rely on sophisticated information technology systems, including hardware, software, technology infrastructure, online sites and networks for both internal and external operations, mobile applications, cloud services and network-connected control systems, some of which are managed, hosted, provided or serviced by third parties. Internal or external events that compromise the confidentiality, integrity and availability of our systems and data may significantly interrupt the operation of our business, result in significant costs and/or adversely affect our reputation.
Our information technology systems are highly integrated into our business, including our R&D efforts, our clinical and commercial manufacturing processes and our product sales and distribution processes. Further, as the majority of our employees work remotely for some portion of their jobs in our hybrid work environment, our reliance on our and third-party information technology systems has increased substantially and is expected to continue to increase. Remote and hybrid working arrangements, including those of many third-party providers, can increase cybersecurity risks due to the challenges associated
with managing remote computing assets and security vulnerabilities that are present in many non-corporate and home networks. The complexity and interconnected nature of software, hardware and our systems make them vulnerable to breakdown or other service interruptions, and to software errors or defects, misconfiguration and other security vulnerabilities. For example, in July 2024, businesses worldwide were affected by an information technology outage due to a faulty software update issued by a cybersecurity firm. Although our systems and operations were temporarily affected by the outage, the impact of this firm’s faulty update on the Company was immaterial to our business operations. However, there can be no assurance that a future similar incident would not result in a material adverse effect on our business or results of operations. Upgrades or changes to our systems or the software that we use have resulted and we expect, in the future, will result in the introduction of new cybersecurity vulnerabilities and risks. In 2022, we identified a number of security vulnerabilities introduced into our information systems as a result of flaws that we subsequently identified in software that we had purchased and installed, and these flaws required that we apply emergency patches to certain of our systems. While we did not experience any significant adverse effects as a result of these vulnerabilities, there can be no assurance that we will timely identify and address future vulnerabilities. Our systems are also subject to frequent perimeter network reconnaissance and scanning, phishing and other cyberattacks. For example, as a result of our cybersecurity monitoring of the Horizon legacy information systems, we detected phishing activity in the accounts of two Horizon executives. These accounts were de-activated, the incidents were investigated and the determination was made separately by both our internal cybersecurity team and our external digital forensics and incident response supplier that no confidential information had been exfiltrated, and the incidents are now closed. As the cyber-threat landscape evolves, these attacks are growing in frequency, sophistication, and intensity, and are becoming increasingly difficult to detect and increasingly sophisticated in using techniques and tools—including artificial intelligence—that circumvent security controls, evade detection and remove forensic evidence. Such attacks could include the use of harmful and virulent malware, including ransomware or other denials of service, which can be deployed through various means, including the software supply chain, e-mail, malicious websites and/or the use of social engineering/phishing.
We have also experienced denial of service attacks against our network, and, although such attacks did not succeed, there can be no assurance that our efforts to guard against the wide and growing variety of potential attack techniques will be successful in the future. Attacks such as those experienced by government entities (including those that approve and/or regulate our products, such as the EMA) and other multi-national companies, including some of our peers, could leave us unable to utilize key business systems or access or protect important data, and could have a material adverse effect on our ability to operate our business, including developing, gaining regulatory approval for, manufacturing, selling and/or distributing our products. For example, in 2017, a pharmaceutical company experienced a cyberattack involving virulent malware that significantly disrupted its operations, including its research and sales operations and the production of some of its medicines and vaccines. As a result of the cyberattack, its orders and sales for certain products were negatively affected. In late 2020, SolarWinds Corporation, a leading provider of software for monitoring and managing information technology infrastructure, disclosed that it had suffered a cybersecurity incident whereby attackers had inserted malicious code into legitimate software updates for its products that were installed by myriad private and government customers, enabling the attackers to access a backdoor to such systems. In 2022, Okta, Inc., a provider of software that helps companies manage user authentication, disclosed that several hundred of its corporate customers were vulnerable to a security breach that allowed attackers to access Okta’s internal network. Although this breach did not have a significant effect on our business, there can be no assurance that a similar future breach would not result in a material adverse effect on our business or results of operations.
Our systems also contain and use a high volume of sensitive data, including intellectual property, trade secrets and other proprietary business information, financial information, regulatory information, strategic plans, sales trends and forecasts, litigation materials and/or personal identifiable information belonging to us, our staff, our patients, customers and/or other parties. In some cases, we utilize third-party service providers to collect, process, store, manage or transmit such data, which have increased our risk. Intentional or inadvertent data privacy or security breaches (including cyberattacks) resulting from attacks or lapses by employees, service providers (including providers of information technology-specific services), business partners, nation states (including groups associated with or supported by foreign intelligence agencies), organized crime organizations, “hacktivists” or others, create risks that our sensitive data may be exposed to unauthorized persons, our competitors or the public. Malicious actors, including those working under state-sponsored campaigns, have sought employment, often in remote information technology roles, as a means to gain inside access at targeted companies. In the third quarter of 2024, an individual used fraudulent identification in connection with their hiring by the Company. While the individual was detected and terminated before any data was extracted or malware installed, there can be no assurance that future attempts by similar actors will be unsuccessful. System vulnerabilities and/or cybersecurity breaches experienced by our third-party service providers have constituted a substantial share of the information security risks that have affected us. For example, in the first half of 2021, a supplier experienced a data breach in which an unauthorized third party acquired access to certain information provided to the supplier in the course of its provision of services to us, including business documents and certain personally identifiable patient information (not including social security or other financial or health insurance information). As required, we promptly notified the applicable state attorneys general and the individuals whose personally identifiable information was affected of this data breach at the supplier. In the third quarter of 2022, another service provider experienced a
similar cybersecurity breach in which an attacker exfiltrated certain data (including non-significant Amgen data) from the service provider’s systems. Additionally, in April 2024, one of our former vendors notified us that its subsidiary that had provided us with certain patient support services until mid-2022, experienced a cybersecurity incident that it discovered in February 2024 and that data containing individually identifiable health information of over 1.7 million Amgen patients (that was retained as required by FDA regulations) was involved in the incident. Pursuant to the Health Breach Notification Rule requirements, we notified the FTC of this incident. Although these supplier data breaches have not resulted in material adverse effects on our business, there can be no assurance that a similar future cybersecurity incident would not result in a material adverse effect on our business or results of operations. Further, the timeliness of our awareness of a cybersecurity incident affects our ability to respond to and work to mitigate the severity of such events. For example, in 2020 and 2022, two of our vendors experienced cyberattacks and each initially reported to us that neither event involved our data. However, upon further investigation, they each subsequently informed us that the attackers had accessed limited, non-significant Amgen information. Although neither of these breaches had a significant adverse effect on our business, in the future we may again not receive timely reporting of cybersecurity events and such events could have a material adverse effect on our business.
Cyberattackers are also increasingly exploiting vulnerabilities in commercially available software from shared or open-source code. We rely on third party commercial software that have had and may have such vulnerabilities, but as use of open-source code is frequently not disclosed, our ability to fully assess this risk to our systems is limited. For example, in December 2021, a remote code execution vulnerability was discovered in a software library that is widely used in a variety of commercially available software and services. Although this vulnerability has not resulted in any significant adverse effects on us, there can be no assurances that a similar future vulnerability in the software and services that we use would not result in a material adverse effect on our business or results of operations.
Domestic and global government regulators, our business partners, suppliers with whom we do business, companies that provide us or our partners with business services and companies we have acquired or may acquire face similar risks. Security breaches of their systems or service outages have adversely affected systems and could, in the future, affect our systems and security, leave us without access to important systems, products, raw materials, components, services or information, or expose our confidential data or sensitive personal information. For example, in 2019, two vendors that perform testing and analytical services that we use in developing and manufacturing our products experienced cyberattacks, and in April and September of 2020, vendors that provide us with information technology services and clinical data services, respectively, each experienced ransomware attacks. Although there was no breach of our systems, each of these incidents required us to disconnect our systems from those vendors’ systems. While we were able to reconnect our systems following restoration of these vendors’ capabilities without significantly affecting product availability, a more extended service outage affecting these or other vendors, particularly where such vendor is the single source from which we obtain the services, could have a material adverse effect on our business or results of operations. In February 2024, Change Healthcare, a large U.S. insurance claim and co-pay card processing clearinghouse, experienced a ransomware attack that has caused significant disruptions to healthcare provider and pharmacy operations. While Change Healthcare does not directly provide us with services, disruptions to co-pay card support, insurance billing and Medicaid rebate processing led to lost sales and required us to take action to help patients access their medications and to provide extended payment terms to certain customers. Although services have been rerouted and restored, and the impact on our business has been immaterial, similar disruptions may occur in the future stemming from the interconnectedness of the U.S. healthcare ecosystem and industry reliance on centralized claims processing systems and networks, and such future disruptions may have a material adverse effect on our business or results of operations. In addition, we distribute our products in the United States primarily through three pharmaceutical wholesalers, and a security breach that impairs the distribution operations of our wholesalers could significantly impair our ability to deliver our products to healthcare providers and patients. There can be no assurance that our cybersecurity risk management program and processes, including our policies, controls, or procedures, will be fully implemented, complied with or effective in protecting our information technology systems and sensitive data.
Although we have experienced system breakdowns, attacks and information security breaches, we do not believe such breakdowns, attacks and breaches have had a material adverse effect on our business or results of operations. We will continue to experience varying degrees of cyberattacks and other incidents in the future. Even though we continue to invest in the monitoring, protection and resilience of our critical and/or sensitive data and systems, there can be no assurances that our efforts will detect, prevent or fully recover systems or data from all breakdowns, service interruptions, attacks and/or breaches of our systems that could adversely affect our business and operations and/or result in the loss or exposure of critical, proprietary, private, confidential or otherwise sensitive data, which could result in material financial, legal business or reputational harm to us or negatively affect our stock price. While we maintain cyber-liability insurance, our insurance is not sufficient to cover us against all losses that could potentially result from a service interruption, breach of our systems or loss of our critical or sensitive data.
We are also subject to various laws and regulations globally regarding cybersecurity, privacy and data protection, including laws and regulations relating to the collection, storage, handling, use, disclosure, transfer and security of personal
data. The legislative and regulatory environment regarding privacy and data protection is continuously evolving and developing and the subject of significant attention globally. For example, we are subject to the EU’s GDPR, which became effective in May 2018, and the CCPA, which became effective in January 2020, both of which provide for substantial penalties for noncompliance. The CCPA was amended in late 2020, to create the California Privacy Rights Act to create opt in requirements for the use of sensitive personal data and the formation of a new dedicated agency for the enforcement of the law, the California Privacy Protection Agency. Similar consumer privacy laws went into effect in 13 other states, have been enacted (but not yet in effect) in 6 other states, and have been proposed in four additional states. Outside the United States, other jurisdictions where we operate have passed, or continue to propose, data privacy or cybersecurity legislation and/or regulations. For example, in China, the Personal Information Protection Law and the Data Security Law, which regulate data processing activities associated with personal and nonpersonal data, are in effect and build upon the existing Cybersecurity Law. Failure to comply with these current and future laws could result in significant penalties and reputational harm and could have a material adverse effect on our business and results of operations.
We are adopting and exploring the use of artificial intelligence (AI) in our business, and as an emerging and rapidly evolving technology, our use of AI introduces potential opportunities but also presents risks that could adversely affect our operations, information security and reputation. AI systems may produce inaccurate or flawed outputs due to flawed algorithms, or insufficient and/or erroneous training data. Reliance on flawed outputs could result in lower quality decision-making or prevent us from effectively utilizing AI in our business. We may also become vulnerable to operational disruptions if the AI technologies we use experience downtimes or are compromised by cyberattacks. If we do not effectively implement guardrails and train our staff on the safe and proper use of AI, or if our staff fail to effectively adhere to our established guardrails and training on the use of AI, we may experience adverse effects on our business, including data breaches, the loss of confidential information (including our intellectual property), unintentional disclosure of personal data, or other misuse of our proprietary information. Further, several governments and regulatory authorities have proposed or passed laws and regulations governing the use of AI. For example, in March 2024, the European Parliament adopted the Artificial Intelligence Act that provides for EU-wide rules on data quality, transparency, human oversight and accountability with respect to the use of artificial intelligence. In April 2024, the EU also revised its Cybersecurity Directive NIS2 rules that create new cybersecurity risk management and reporting obligations. Failure to comply with these current and future laws could result in significant penalties and reputational harm and could have a material adverse effect on our business and results of operations.
Our sales and operations are subject to the risks of doing business internationally, including in emerging markets.
As we continue our expansion efforts in emerging markets around the world, through acquisitions and licensing transactions as well as through the development and introduction, both independently and through collaborations such as our collaboration with BeiGene, of our products in new markets, we face numerous risks to our business. There is no guarantee that our efforts and strategies to expand sales in emerging markets will succeed. Our international business, including in China and emerging market countries, may be especially vulnerable to periods of global and local political, legal, regulatory and financial instability, including issues of geopolitical relations, the imposition of international sanctions in response to certain state actions and/or sovereign debt issues, and management of health policy in response to pressures such as global pandemics. For example, the BIOSECURE Act that prohibits federal contracting with companies that have commercial connections with enumerated “biotechnology companies of concern” located in certain geographies, including China, has passed in the U.S. House of Representatives, and, if passed by the U.S. Senate and signed into law by the Administration, could restrict our ability to contract or collaborate with such biotechnology companies in the future. If relations between the United States and other governments deteriorate, our business and investments in such markets may also be adversely affected. We may also be required to increase our reliance on third-party agents and unfamiliar operations and arrangements, including those previously utilized by companies we partner with or acquire in emerging markets. See We must conduct clinical trials in humans before we commercialize and sell any of our product candidates or existing products for new indications. Our expansion efforts in China and emerging markets around the world are dependent upon the establishment of an environment that is predictable, navigable and supportive of biopharmaceutical innovation, sustained access for our products and predictable pricing controls. China continues to strengthen regulations on the collection, use and transmission of Chinese human genetic resources, and has expanded regulations on the conduct of biotechnology R&D activities in China. For example, between 2020 and 2022, we experienced delays in our applications to the Human Genetic Resources Administration of China that sought approval to conduct clinical trials in China. Our international operations and business may also be subject to less protective intellectual property or other applicable laws, diverse data privacy and protection requirements, changing tax laws and tariffs, trade restrictions or other barriers designed to protect industry in the home country against foreign competition, far-reaching antibribery and anticorruption laws and regulations and/or evolving legal and regulatory environments. For example, recent cross-border data transfer compliance requirements in China, as well as a new DOJ final rule on preventing access to Americans’ bulk sensitive personal data by “countries of concern,” may also impose additional costs of doing business, including costs associated with localizing operations.
In response to the ongoing armed conflict in Ukraine, the U.S. government, numerous state governments, the EU and other countries in which we conduct business have imposed a wide range of economic sanctions that restrict commerce and business dealings with Russia, certain regions of Ukraine and certain entities and individuals. Additionally, the recent armed conflict in the Middle East has caused regional disruptions to economic activity. For a description of the conflict’s impact on our third-party contract manufacturing of KRYSTEXXA, see Our efforts to collaborate with or acquire other companies, products, or technology, and to integrate the operations of companies or to support the products or technology we have acquired, may not be successful, and may result in unanticipated costs, delays or failures to realize the benefits of the transactions. These conflicts may also precipitate or amplify the other risks described herein, including risks relating to cybersecurity, global economic conditions, clinical trials and supply chains, which could adversely affect our business, operations and financial condition and results.
As we expand internationally, we are subject to fluctuations in foreign currency exchange rates relative to the U.S. dollar. While we have a program in place that is designed to reduce our exposure to foreign currency exchange rate fluctuations through foreign currency hedging arrangements, our hedging efforts do not completely offset the effect of these fluctuations on our revenues and earnings. Overall, the legal and operational challenges of our international business operations, along with government controls, the challenges of attracting and retaining qualified personnel and obtaining and/or maintaining necessary regulatory or pricing approvals of our products, may result in material adverse effects on our international product sales, business and results of operations.
We may not be able to access the capital and credit markets on terms that are favorable to us, or at all.
The capital and credit markets may experience extreme volatility and disruption, which may lead to uncertainty and liquidity issues for both borrowers and investors. For example, in early 2020, there were significant disruptions in the commercial paper market and several borrowers were unable to obtain funding at normal rates or maturities, which resulted in a significant increase in draws of corporate credit lines with banks. Similarly, the bond markets experienced extreme volatility in terms of interest rates and credit spreads, with several days without new issuances of corporate bonds.
While we have historically accessed capital markets to supplement our existing funds and cash generated from operations to satisfy our needs for capital expenditures, debt service requirements, to pay dividends and repurchase stock, and engage in other business initiatives, including acquisitions and licensing activities, in 2023, we substantially increased our outstanding indebtedness in connection with our acquisition of Horizon, which may limit our ability to timely obtain additional financing on desired terms. See Our efforts to collaborate with or acquire other companies, products, or technology, and to integrate the operations of companies or to support the products or technology we have acquired, may not be successful, and may result in unanticipated costs, delays or failures to realize the benefits of the transactions. While we have reduced, and plan to continue to reduce, our debt leverage levels before returning to the capital or credit markets for new funds, if we are required to access the capital and credit markets at an inopportune time, including when adverse capital and credit market conditions prevail, we may be unable to obtain financing on favorable terms, or at all, which could have a material adverse effect on our business and results of operations or our ability to complete business acquisitions. Changes in credit ratings issued by nationally recognized credit-rating agencies could also adversely affect our ability to obtain capital and credit market financing and the cost of such financing and have an adverse effect on the market price of our securities.
RISKS RELATED TO COMPETITION
Our products face substantial competition and our product candidates are also likely to face substantial competition.
We operate in a highly competitive environment. See Item 1. Business—Marketing, Distribution and Selected Marketed Products—Competition. We expect that our products and product candidates will compete with existing drugs, new drugs currently in development, drugs currently approved for other indications that may later be approved for the same indications as those of our products and drugs approved for other indications that are used off-label. Large pharmaceutical companies and generics manufacturers of pharmaceutical products have expanded into, and are expected to continue expanding into, the biotechnology field, and some pharmaceutical companies and generics manufacturers have formed partnerships to pursue biosimilars. With the proliferation of companies pursuing biopharmaceuticals, several of our biosimilar products have entered, and a number of our product candidates may enter, markets with one or more competitors or with competitors soon to arrive. In addition, some of our competitors may have technical, competitive or other advantages over us for the development of technologies and processes or greater experience in particular therapeutic areas, and consolidation among pharmaceutical and biotechnology companies can enhance such advantages. These advantages may make it difficult for us to compete with them successfully to discover, develop and market new products and for our current products to compete with new products or new product indications they may bring to market. As a result, our products have been competing and may continue to compete, and our product candidates may compete, against products or product candidates that offer higher rebates or discounts, lower prices, equivalent or superior efficacy, better safety profiles, easier administration, earlier market availability or other competitive
features. If we are unable to compete effectively, this could reduce our sales, which could have a material adverse effect on our business and results of operations.
Our intellectual property positions may be challenged, invalidated or circumvented, or we may fail to prevail in current and future intellectual property litigation.
Our success depends in part on our ability to obtain and defend patent rights and other intellectual property rights that are important to the commercialization of our products and product candidates. The patent positions of pharmaceutical and biotechnology companies can be highly uncertain and often involve complex legal, scientific and factual questions. Driven by cost pressures, efforts to limit or weaken patent protection for our industry are increasing. For example, the COVID-19 pandemic resulted in increased interest in compulsory licenses, march-in rights or other governmental interventions, both in the United States and internationally, related to the procurement of drugs, and the World Trade Organization has agreed to a waiver of COVID-19 vaccine intellectual property protections through the Trade-Related Aspects of Intellectual Property Rights waiver process. At the end of 2023, the prior Administration released a proposed framework that would consider price as a factor when determining whether to exercise march-in rights pursuant to the Bayh-Dole Act with respect to drugs or other taxpayer-funded inventions, and it is unclear whether the current Administration will finalize this framework. Further, in early 2025, the new Administration has taken actions to freeze or reduce the federal workforce. Significant reductions of, or disruptions to, staffing and resources available at the USPTO could lead to delays in the examination or approval of patent applications, or other challenges to securing and/or enforcing our intellectual property rights.
Third parties have challenged and may continue to challenge, invalidate or circumvent our patents (including any patent applications, term extensions, term adjustments and supplemental protection certificates) relating to our products, product candidates and technologies. See Part IV—Note 20, Contingencies and commitments, to the Consolidated Financial Statements. Challenges to patents have come from potential competitors or from parties other than those who sought to market a potentially-infringing product. In addition, in certain cases our patent positions have not protected us, and may not protect us, against competitors with similar products or technologies because competing products or technologies may not infringe our patents. For certain of our products and/or product candidates, third parties may obtain patents that claim the product, one or more of its uses, the drug delivery device used to administer the product, or our manufacturing process used to make the product, and they may seek to prevent us from commercializing the product and/or seek payment of a royalty on the product’s sales in one or more territories. Further, disputes may arise with third parties from whom we have licensed rights to intellectual property necessary for the development and commercialization of some of our products. Patent disputes are frequent, costly and can preclude, delay or increase the cost of commercialization of products. We have been in the past, are currently and expect to be in the future, involved in patent litigation. These matters have included, and may in the future include, litigation with manufacturers of products that purport to be biosimilars of certain of our products for patent infringement, invalidity, unenforceability and failure to comply with certain provisions of the BPCIA, and litigation with manufacturers of innovator products that allege patent infringement. A determination made by a court, agency or tribunal concerning infringement, validity, enforceability, injunctive or economic remedy, or the right to patent protection, for example, are typically subject to appellate or administrative review. Upon review, such initial determinations may be afforded little or no deference by the reviewing tribunal and may be affirmed, reversed or made the subject of reconsideration through further proceedings. A patent dispute or litigation has not discouraged, and may not in the future discourage, a potential violator from bringing the allegedly infringing product to market prior to a final resolution of the dispute or litigation. The period from inception until resolution of a patent dispute or litigation is subject to the availability and schedule of the court, agency or tribunal before which the dispute or litigation is pending. We have been, and may in the future be, subject to competition during this period and may not be able to recover fully from the losses, damages and harms we incur from infringement by the competitor product even if we prevail. Moreover, if we lose or settle current or future litigations at certain stages or entirely, we could be subject to competition and/or significant liabilities, be required to enter into third-party licenses for the infringed product or technology or be required to cease using the technology or product in dispute. In addition, we cannot guarantee that such licenses will be available on terms acceptable to us, or at all.
Further, under the Hatch–Waxman Act, our products approved by the FDA under the FDCA have been, and may in the future be, the subject of patent litigation with generics competitors before expiry of the five-year period of data exclusivity provided for under the Hatch-Waxman Act and prior to the expiration of the patents listed for the product. Likewise, our innovative biologic products have been, and may in the future be, the subject of patent litigation prior to the expiration of our patents and, with respect to competitors seeking approval as a biosimilar or interchangeable version of our products, prior to the 12-year exclusivity period provided under the BPCIA. In addition, we have faced, and may in the future face, patent litigation involving claims that our biosimilar product candidates infringe the patents of other companies, including those that manufacture, market or sell the applicable reference products or who are developing or have developed other biosimilar versions of such products. Patents held by other entities have contributed, and may in the future contribute, to a decision by us to not pursue all of the labeled indications of the applicable reference product. However, a decision not to pursue all of the labeled indications of the applicable reference product might not avoid, or end, potential litigation. While we have attempted,
and expect to continue to attempt, to challenge the patents held by other companies, our efforts may be unsuccessful. For examples of and information related to our patent litigation, see Part IV—Note 20, Contingencies and commitments, to the Consolidated Financial Statements.
Certain of the existing patents on our products have expired or will soon expire. See Item 1. Business—Marketing, Distribution and Selected Marketed Products—Patents. As our patents expire, competitors are able to legally produce and market similar products or technologies, including biosimilars, which has had, and may continue to have, a material adverse effect on our product sales, business and results of operations. In addition, competitors have been, and may continue to be, able to invalidate, design around or otherwise circumvent our patents and sell competing products.
We currently face competition from biosimilars and generics and expect to face increasing competition from biosimilars and generics in the future.
We currently face competition from biosimilars and generics in most of the territories in which we operate, including the United States and Europe, and we expect to face increasing biosimilar and/or generics competition this year and beyond. Expiration or successful challenge of applicable patent rights or expiration of an applicable exclusivity period has accelerated such competition, and we expect to face more litigation regarding the validity and/or scope of our patents. Our products have also experienced greater competition from lower cost biosimilars or generics that come to market when branded products that compete with our products lose their own patent protection. To the extent that governments adopt more permissive regulatory approval standards and competitors are able to obtain broader or expedited marketing approval for biosimilars and generics, the rate of increased competition for our products would likely accelerate.
In the EU, biosimilars are evaluated for marketing authorization pursuant to a set of general and product class-specific guidelines. In addition, in an effort to spur biosimilar utilization and/or increase potential healthcare savings, some EU countries and some Canadian provinces have adopted, or are considering the adoption of, biosimilar uptake measures such as physician prescribing quotas or automatic pharmacy substitution of biosimilars for the corresponding reference products. Some EU countries impose automatic price reductions upon market entry of one or more biosimilar competitors. In September 2022, the EMA and the EU Heads of Medicines’ Agencies (HMA) issued a joint statement providing that biosimilar medicines approved in the EU are “interchangeable” with their reference products and other biosimilars of the same reference product for purposes of prescribing. This EMA-HMA statement could further contribute to the prescribing of biosimilars and to greater competition in Europe. While the degree of competitive effects of biosimilar competition differs between EU countries and between products, in the EU the overall use of biosimilars and the rate at which product sales of innovative products are being affected by biosimilar competition is increasing.
In the United States, the BPCIA authorizes the FDA to approve biosimilars via a separate, abbreviated pathway. See Item 1. Business—Government Regulation—Regulation in the United States—Approval of Biosimilars. In the United States, the FDA has approved numerous biosimilars, including biosimilar versions of Neulasta, EPOGEN, ENBREL, Prolia and XGEVA, and a growing number of companies have announced that they are also developing biosimilar versions of our products. For example, a number of biosimilar versions of Neulasta have been approved in the United States, including an on-body injector presentation that was approved in December 2023 for a Neulasta biosimilar, and impact to our Neulasta sales has been accelerated as the number of additional competitors has increased. See Item 1. Business—Marketing, Distribution and Selected Marketed Products—Competition. Manufacturers of biosimilars have attempted, and may in the future attempt, to compete with our products by offering greater discounts or rebates, contracts that offer longer-term pricing or a broader portfolio of other products, or lower list prices. Companies pursuing development of biosimilar versions of our products have challenged and may continue to challenge our patents well in advance of the expiration of our material patents. For examples of and information related to our biosimilars and generics patent litigation, see Part IV—Note 20, Contingencies and commitments, to the Consolidated Financial Statements. See Our intellectual property positions may be challenged, invalidated or circumvented, or we may fail to prevail in current and future intellectual property litigation.
The U.S. biosimilar pathway includes the option for biosimilar products that meet certain criteria to be approved as interchangeable with their reference products. Some companies currently developing or already marketing biosimilars may seek to obtain interchangeable status from the FDA, which could potentially allow pharmacists to substitute those biosimilars for our reference products without prior approval from the prescriber under state law. The FDA approved the first interchangeable biosimilar in 2021 and has subsequently granted interchangeability designations to additional biosimilars, including without always requiring a switching study. For example, in August 2022, the FDA designated a monoclonal antibody biosimilar as interchangeable without requiring a switching study to support the interchangeability determination, and has continued to make other such designations of interchangeability on a case-by-case basis. In June 2024, the FDA issued a draft guidance on considerations for demonstrating interchangeability and stated that switching studies generally would not be needed, potentially codifying the FDA’s practice.
In addition, critics of the 12-year exclusivity period in the biosimilar pathway law may continue to seek to shorten the data exclusivity period and/or to encourage the FDA to interpret narrowly the law’s provisions regarding which new products receive data exclusivity. In 2019, the Administration agreed to remove from the United States-Mexico-Canada Agreement a requirement for at least 10 years of data exclusivity for biologic products. Also, the FDA is considering whether subsequent changes to a licensed biologic would be protected by the remainder of the reference product’s original 12-year exclusivity period (a concept known in the generic drug context as “umbrella exclusivity”). If the FDA were to decide that umbrella exclusivity does not apply to biological reference products or were to make other changes to the exclusivity period, this could expose us to biosimilar competition at an earlier time. There also have been, and may continue to be, legislative and regulatory efforts to promote competition through policies enabling easier generic and biosimilar approval and commercialization, including efforts to lower standards for demonstrating biosimilarity or interchangeability, eliminate the standard for interchangeability and declare by law that all biosimilars are de facto interchangeable with their reference products, limit patents that may be litigated and/or patent settlements, implement preferential reimbursement policies for biosimilars and pass new laws requiring more disclosure in the FDA’s Orange Book and Purple Book. For example, in 2021 the FDA sent a letter to the USPTO describing ways to strengthen coordination between the two agencies, offering training to help identify prior art, and seeking USPTO’s views on practices that extend market exclusivities, whether pharmaceutical patent examiners need additional resources, and the effect of post-grant challenges at the Patent Trial and Appeal Board on drug patents. The USPTO responded in July 2022 with a letter to the FDA stating that it is prepared to create formal mechanisms to collaborate with the FDA on patent issues that may affect the timing of generic and biosimilar entry. In January 2023, the USPTO held a joint listening session with the FDA on USPTO-FDA collaboration efforts.
Upon the expiration or loss of patent protection and/or applicable exclusivity for one of our products, we can lose the majority of revenues for that product in a very short period of time. See Item 1. Business—Marketing, Distribution and Selected Marketed Products—Competition. Additionally, if one of our products is the subject of an FDA Written Request for pediatric studies and we are unable to adequately complete these studies, we may not obtain the pediatric exclusivity award that extends unexpired regulatory exclusivity for the product (and existing patents for a small molecule product) by an additional six months. Further, in 2023, the FDA released draft guidance that contemplates that the agency may no longer grant pediatric exclusivity for studies conducted solely to fulfill Pediatric Research Equity Act (PREA) requirements.
While we are unable to predict the precise effects of biosimilars and generics on our products, we are currently facing and expect to face greater competition in the United States, Europe and elsewhere as a result of biosimilar and generic competition and, in turn, downward pressure on our product prices and sales. This competition has had, and could increasingly have, a material adverse effect on our product sales, business and results of operations. State laws may also have an impact on our business. For example, California is the first state to have passed legislation, effective on January 1, 2020, against “pay for delay” settlements of patent infringement claims filed by manufacturers of generics or biosimilars where anything of value is given in exchange for settlement. Under this law, such settlement agreements are presumptively anticompetitive. The law may result in prolonged litigation and fewer settlements. Similar legislation based on California’s law continues to be introduced in other states, including Connecticut and New York. Efforts to target such settlements are also active at the federal level, including legislation introduced such as the Preserving Access to Affordable Generics and Biosimilars Act that adopts California’s anticompetitive presumption approach.
Concentration of sales at certain of our wholesaler distributors, and consolidation of private payers, such as insurers, and PBMs has negatively affected, and may continue to negatively affect, our business.
Certain of our distributors, customers and payers have substantial purchasing leverage, due to the volume of our products they purchase or the number of patient lives for which they provide coverage. The substantial majority of our U.S. product sales is made to three pharmaceutical product wholesaler distributors: McKesson Corporation, Cencora, Inc. (formerly AmerisourceBergen Corporation) and Cardinal Health, Inc. These distributors, in turn, sell our products to their customers, which include physicians or their clinics, dialysis centers, hospitals and pharmacies. Similarly, as discussed above, there has been significant consolidation in the health insurance industry, including that a small number of PBMs now oversee a substantial percentage of total covered lives in the United States. See Our sales depend on coverage and reimbursement from government and commercial third-party payers, and pricing and reimbursement pressures have affected, and are likely to continue to affect, our profitability. For example, the six largest PBMs in the United States are now part of major health insurance providers, and nationally account for 94% of prescription drug claims. The growing concentration of purchasing and negotiating power by these entities has, and may continue to, put pressure on our pricing due to their ability to extract price discounts on our products, fees for other services or rebates, negatively affecting our bargaining position, sales and/or profit margins. In addition, decisions by these entities to purchase or cover less or none of our products in favor of competing products could have a material adverse effect on our product sales, business and results of operations due to their purchasing volume. Further, if one of our significant wholesale distributors encounters financial or other difficulties and becomes unable or unwilling to pay us all amounts that such distributor owes us on a timely basis, or at all, it could negatively affect our business and results of operations. In addition, if one of our significant wholesale distributors becomes insolvent or otherwise unable to
continue its commercial relationship with us in its present form, it could significantly disrupt our business and adversely affect our product sales, our business and results of operations unless suitable alternatives are timely found or lost sales are absorbed by another distributor.
RISKS RELATED TO RESEARCH AND DEVELOPMENT
We may not be able to develop commercial products despite significant investments in R&D.
Amgen invests heavily in R&D. Successful product development in the biotechnology industry is highly uncertain, and very few R&D projects yield approved and commercially viable products. Product candidates, including biosimilar product candidates, or new indications for existing products (collectively, product candidates) that appear promising in the early phases of development have failed to reach the market for a number of reasons, such as:
•the product candidate did not demonstrate acceptable clinical trial results even though it achieved its primary endpoints and/or demonstrated positive preclinical or early clinical trial results, for reasons that could include changes in the standard of care of medicine or expectations of health authorities;
•the product candidate was not effective or not more effective than currently available or potentially competitive therapies in treating a specified condition or illness;
•the product candidate was not cost effective in light of existing or potentially competitive therapeutics;
•the product candidate had harmful side effects in animals or humans;
•the necessary regulatory bodies, such as the FDA or EMA, did not approve the product candidate for an intended use;
•reimbursement for the product candidate is limited despite regulatory approval;
•the product candidate was not economical for us to manufacture and commercialize;
•the patient population size is smaller than anticipated;
•other parties had or may have had proprietary rights relating to our product candidate, such as patent rights, and did not let us sell it on reasonable terms, or at all;
•we and certain of our licensees, partners, contracted organizations or independent investigators failed to effectively conduct clinical development or clinical manufacturing activities;
•the pathway to regulatory approval or reimbursement for product candidates was uncertain or not well-defined;
•the biosimilar product candidate failed to demonstrate the requisite biosimilarity to the applicable reference product, or was otherwise determined by a regulatory authority to not meet applicable standards for approval; and
•a companion diagnostic device that is required with the use of a product candidate is not approved by the necessary regulatory authority.
We believe that genetics, together with the benefit of artificial intelligence and computational evidence, could meaningfully aid our search for new medicines and help guide our R&D decisions and investments, and have focused our R&D strategy on drug targets validated by genetic or other compelling human evidence. We have invested considerable time, energy and resources into developing our expertise in human genetics and acquiring access to libraries of genetic information, and are applying artificial intelligence to our R&D activities, including applying such technologies to advance our human data efforts and our generative biology platform that seek to discover and design new drugs. However, product candidates based on genetically validated targets or developed with the assistance of such technologies remain subject to the uncertainties of the drug development process and may not reach the market for a number of reasons, including the factors listed above.
We must conduct clinical trials in humans before we commercialize and sell any of our product candidates or existing products for new indications.
Before a product may be sold, we must conduct clinical trials to demonstrate that our product candidates are safe and effective for use in humans. The results of those clinical trials are used as the basis to obtain approval from regulatory authorities such as the FDA and EMA. See Our current products and products in development cannot be sold without regulatory approval. We are required to conduct clinical trials using an appropriate number of trial sites and patients to support the product label claims. The length of time, number of trial sites and number of patients required for clinical trials vary substantially, and we may spend several years and incur substantial expense in completing certain clinical trials. In addition, we may have difficulty finding a sufficient number of clinical trial sites and/or patients to participate in our clinical trials,
particularly if competitors are conducting clinical trials in similar patient populations and/or in rare disease therapy clinical trials due to the inherently small patient population potentially served by such therapies. Patients may withdraw from clinical trials at any time (including trials in which patients believe that they may not be receiving a clinical benefit), and evolving legal obligations including, but not limited to, privacy laws and/or other restrictions in certain countries may restrict the ability of clinical trial investigators to conduct further follow-up on such patients, which may adversely affect the interpretation of study results. Regulatory authorities may also pause or halt conduct of clinical trials based on their appraisal of the potential or actual risks of continuing the study. Delays and complications in planned clinical trials can result in increased development costs, associated delays in regulatory approvals and in product candidates reaching the market and revisions to existing product labels.
Further, to increase the number of patients available for enrollment in our clinical trials, we have opened, and will continue to open, clinical sites and enroll patients in a number of locations where our experience conducting clinical trials is more limited, including India, China, South Korea, the Philippines, Singapore, Saudi Arabia and some Central and South American countries, either through utilization of third-party contract clinical trial providers entirely or in combination with local staff. Conducting clinical trials in locations where we have limited experience requires substantial time and resources to understand the unique regulatory environments of individual countries. For other examples of the risks of conducting clinical trials in China, see also Our sales and operations are subject to the risks of doing business internationally, including in emerging markets. Further, we must ensure the timely production, distribution and delivery of the clinical supply of our product candidates to numerous and varied clinical trial sites. Additionally, regional disruptions, including natural and man-made disasters, health emergencies (such as novel viruses or pandemics, including the COVID-19 pandemic), or geopolitical conflicts (such as the ongoing armed conflicts in Ukraine and the Middle East) have significantly disrupted the timing of clinical trials, and in the future could disrupt the timing, execution and outcome of clinical trials. If we fail to adequately manage the design, execution and diverse regulatory aspects of our clinical trials or to manage the production or distribution of our clinical supply, or such sites experience disruptions as a result of a natural/man-made disaster, health emergency or geopolitical conflict, corresponding regulatory approvals may be delayed or we may fail to gain approval for our product candidates or could lose our ability to market existing products in certain therapeutic areas or altogether. For example, our clinical trials were adversely affected by the COVID-19 pandemic. If we are unable to market and sell our products or product candidates or to obtain approvals in the timeframe needed to execute our product strategies, our business and results of operations could be materially and adversely affected.
We rely on independent third-party clinical investigators to recruit patients and conduct clinical trials on our behalf in accordance with applicable study protocols, laws and regulations. We also rely on unaffiliated third-party vendors to perform certain aspects of our clinical trial operations, including that such vendors have appropriate experienced staff to execute on such activities. Further, the disease states that we are studying, such as cancers, require complex treatment protocols that may be difficult to consistently apply across global trial sites, which can impact the quality, interpretability, timing and/or registrability of the data generated. In some circumstances, we enter into co-development arrangements with other pharmaceutical and medical devices companies that provide for the other company to conduct certain clinical trials for the product we are co-developing or to develop a diagnostic test used in screening or monitoring patients in our clinical trials. See Some of our pharmaceutical pipeline and our commercial product sales rely on collaborations with third parties, which may adversely affect the development and sales of our products. We also may acquire companies that have past or ongoing clinical trials or rights to products or product candidates for which clinical trials have been or are being conducted. These trials may not have been conducted to the same standards as ours; however, once an acquisition has been completed we assume responsibility for the conduct of these trials, including any potential risks and liabilities associated with the past and prospective conduct of those trials. If regulatory authorities determine that we or others, including our licensees or co-development partners, or the independent investigators or vendors selected by us, our co-development partners or by a company we have acquired or from which we have acquired rights to a product or product candidate, have not complied with regulations applicable to the clinical trials, those authorities may refuse or reject some or all of the clinical trial data or take other actions that could delay or otherwise negatively affect our ability to obtain or maintain marketing approval of the product or indication. In addition, delays or failures to develop diagnostic tests for our clinical trials can affect the timely enrollment of such trials and lead to delays or inability to obtain marketing approval. If we were unable to market and sell our products or product candidates, our business and results of operations could be materially and adversely affected.
In addition, some of our clinical trials utilize drugs and combination products manufactured and marketed by other pharmaceutical companies or vendors. These drugs, devices and/or products may be administered or used in clinical trials in combination with one of our products or product candidates or in a head-to-head study comparing the products’ or product candidates’ relative efficacy and safety. In the event that any of these vendors or pharmaceutical companies have unforeseen issues that negatively affect the quality of their work product or create a shortage of supply, or if we are otherwise unable to obtain an adequate supply of these other drugs, our ability to complete our applicable clinical trials and/or evaluate clinical results may also be negatively affected. As a result, such quality or supply problems could adversely affect our ability to timely file for, gain or maintain regulatory approvals worldwide.
Clinical trials must generally be designed based on the current standard of medical care. However, in certain diseases, such as cancer, the standard of care is evolving rapidly. In some cases, we may design a clinical trial based on the standard of care we anticipate will exist at the time our study is completed. The duration of time needed to complete certain clinical trials may result in the design of such clinical trials being based on standards of medical care that are no longer or that have not become the current standards by the time such trials are completed, limiting the utility and application of such trials. Additionally, the views of regulatory agencies relating to the requirements for accelerated approval may change over time, and trial designs that were sufficient to support accelerated approvals for some oncology products may not be considered sufficient for later candidates. We may not obtain favorable clinical trial results and therefore may not be able to obtain regulatory approval for new product candidates or new indications for existing products and/or maintain our current product labels. Participants in clinical trials of our products and product candidates may also suffer adverse medical events or side effects that could, among other factors, delay or terminate clinical trial programs and/or require additional or longer trials to gain approval.
Even after a product is on the market, safety concerns may require additional or more extensive clinical trials as part of a risk management plan for our product or for approval of a new indication. Additional clinical trials we initiate, including those required by the FDA, could result in substantial additional expense, and the outcomes could result in further label restrictions or the loss of regulatory approval for an approved indication, each of which could have a material adverse effect on our product sales, business and results of operations. Additionally, any negative results from such trials could materially affect the extent of approvals, the use, reimbursement and sales of our products, our business and results of operations.
Our current products and products in development cannot be sold without regulatory approval.
Our business is subject to extensive regulation by numerous state and federal government authorities in the United States, including the FDA, and by foreign regulatory authorities, including the EMA. We are required in the United States and in the other regions and countries in which we, or our partners and affiliates, sell to obtain approval from regulatory authorities before we manufacture, market and sell our products. Once our products are approved, the FDA and other U.S. and ex-U.S. regulatory agencies have substantial authority to require additional testing and reporting, perform inspections, change product labeling or mandate withdrawals of our products. Failure to comply with applicable regulatory requirements may subject us to administrative and/or judicially imposed sanctions or monetary penalties as well as reputational and other harms. The sanctions could include the FDA’s or ex-U.S. regulatory authorities’ refusals to approve pending applications, delays in obtaining or withdrawals of approvals, delays or suspensions of clinical trials, warning letters, product recalls or seizures, total or partial suspensions of our operations, injunctions, fines, civil penalties and/or criminal prosecutions.
Obtaining and maintaining regulatory approvals have been, and will continue to be, increasingly difficult, time-consuming and costly. Legislative bodies or regulatory agencies could enact new laws or regulations, change existing laws or regulations or change their interpretations of laws or regulations at any time, which could affect our ability to obtain or maintain approval of our products or product candidates. The rate and degree of change in existing laws and regulations and regulatory expectations have accelerated in established markets, and regulatory expectations continue to evolve in emerging markets. We are unable to predict whether and when any further changes to laws or regulatory policies affecting our business could occur, such as changes to laws or regulations governing manufacturer communications concerning drug products and drug product candidates and whether such changes could have a material adverse effect on our product sales, business and results of operations. Further, we are reliant on regulators having the resources necessary to evaluate and approve our products. In the United States, a partial federal government shutdown halted the work of many federal agencies and their employees from late December 2018 through late January 2019. A subsequent extended shutdown or, pursuant to the new Administration’s actions in early 2025 to freeze or reduce the federal workforce, significant reductions of, or disruptions to, staffing and resources available to government agencies could result in reductions or delays of FDA’s activities, including with respect to our ongoing clinical programs, our manufacturing of our products and product candidates and our product approvals.
Regulatory authorities have questioned, and may in the future question, the sufficiency for approval of the endpoints we select for our clinical trials. A number of our products and product candidates have been evaluated in clinical trials using surrogate endpoints that measure an effect that is known to correlate with an ultimate clinical benefit. For example, a therapeutic oncology product candidate may be evaluated for its ability to reduce or eliminate minimal residual disease (MRD), or to extend the length of time during and after the treatment that a patient lives without the disease worsening, measured by progression-free survival (PFS). Demonstrating that the product candidate induces MRD-negative responses or produces a statistically significant improvement in PFS does not necessarily mean that the product candidate will show a statistically significant improvement in overall survival or the time that the patients remain alive. In the cardiovascular setting, a heart disease therapeutic candidate may be evaluated for its ability to reduce LDL-C levels, as an elevated LDL-C level has been a surrogate endpoint for cardiovascular events such as death, heart attack and stroke. The use of surrogate endpoints such as PFS and LDL-C reduction, in the absence of other measures of clinical benefit, may not be sufficient for broad usage or approval even when such results are statistically significant. Regulatory authorities could also add new requirements, such as the completion of enrollment in a confirmatory study or the completion of an outcomes study or a meaningful portion of an
outcomes study, as conditions for obtaining approval or obtaining an indication. For example, despite demonstrating that Repatha reduced LDL-C levels in a broad patient population, only after our large phase 3 outcomes study evaluating the ability of Repatha to prevent cardiovascular events met certain of its primary composite endpoint and key secondary composite endpoint did the FDA grant a broader approval of Repatha to reduce the risk of certain cardiovascular events. There may also be situations in which demonstrating the efficacy and safety of a product candidate may not be sufficient to gain regulatory approval unless superiority to other existing treatment options can be shown. The imposition of additional requirements or our inability to meet them in a timely fashion, or at all, has delayed, and may in the future delay, our clinical development and regulatory filing efforts, delay or prevent us from obtaining regulatory approval for new product candidates or new indications for existing products, or prevent us from maintaining our current product labels.
Some of our products have been approved by U.S. and ex-U.S. regulatory authorities on an accelerated or conditional basis with full approval conditioned upon fulfilling the requirements of regulators. For example, the FDA has approved LUMAKRAS under accelerated approval for the treatment of adult patients with KRAS G12C-mutated local advanced or metastatic NSCLC. Following our submission of the LUMAKRAS/LUMYKRAS CodeBreaK 200 Phase 3 confirmatory data in March 2023 to the FDA and EMA, we received a Complete Response Letter from the FDA and a new post-marketing requirement for an additional confirmatory study to support full approval. Regulatory authorities are placing greater focus on whether the sponsors of products originally approved on an accelerated or conditional basis have met the conditions of the accelerated or conditional approvals. If we are unable to fulfill the regulators’ requirements that were conditions of a product’s accelerated or conditional approval and/or if regulators reevaluate the data or risk-benefit profile of our product, the conditional approval may not result in full approval or may be revoked or not renewed. Alternatively, we may be required to change the product’s labeled indications, conduct an additional confirmatory clinical trial, or even withdraw the product from the market.
Regulatory authorities can also impose post-marketing pediatric study requirements. Failure to fulfill such requirements may result in regulatory or enforcement action, including financial penalties or the invalidation of a product’s marketing authorization.
Safety problems or signals can arise as our products and product candidates are evaluated in clinical trials, including investigator sponsored studies, or as our marketed products are used in clinical practice. We are required continuously to collect and assess adverse events reported to us and to communicate to regulatory agencies these adverse events and safety signals regarding our products. Regulatory agencies periodically perform inspections of our pharmacovigilance processes, including our adverse event reporting. In the United States, for our products with approved Risk Evaluation and Mitigation Strategies (REMS, see Part I, Item 1. Business—Government Regulation—Postapproval Phase), we are required to submit periodic assessment reports to the FDA to demonstrate that the goals of the REMS are being met. REMS and other risk management programs are designed to help ensure that a drug’s benefits outweigh the risks and vary in the elements they contain. If the FDA is not satisfied with the results of the periodic assessment reports we submit for any of our REMS, the FDA may also modify our REMS or take other regulatory actions, such as implementing revised or restrictive labeling. The drug delivery devices approved for use in combination with our products are also subject to regulatory oversight and review for safety and malfunctions. See Some of our products are used with drug delivery or companion diagnostic devices that have their own regulatory, manufacturing and other risks. If regulatory agencies determine that we or other parties (including our clinical trial investigators, those operating our patient support programs or licensees of our products) have not complied with the applicable reporting, other pharmacovigilance or other safety or quality assessment requirements, we may become subject to additional inspections, warning letters or other enforcement actions, including fines, marketing authorization withdrawal and other penalties. Our product candidates and marketed products can also be affected by safety problems or signals occurring with respect to products that are similar to ours or that implicate an entire class of products. Further, as a result of clinical trials, including sub-analyses or meta-analyses of earlier clinical trials (a meta-analysis involves the use of various statistical methods to combine results from previous separate but related studies) performed by us or others, concerns may arise about the sufficiency of the data or studies underlying a product’s approved label. Such actual or perceived safety problems or concerns can lead to:
•revised or restrictive labeling for our products, or the potential for restrictive labeling that has resulted, and may in the future result, in our decision not to commercialize a product candidate;
•requirement of risk management or minimization activities or other regulatory agency compliance actions related to the promotion and sale of our products;
•post-marketing commitments, mandated post-marketing requirements or pharmacovigilance programs for our approved products;
•product recalls of our approved products;
•required changes to the processes used in the manufacture of our products, which could increase our manufacturing costs and affect the availability of contract manufacturers we may utilize to assist in such manufacturing;
•revocation of approval for our products from the market completely, or within particular therapeutic areas or patient types;
•increased timelines or delays in being approved by the FDA or other regulatory bodies; and/or
•treatments or product candidates not being approved by regulatory bodies.
For example, after an imbalance in positively adjudicated cardiovascular serious adverse events was observed in one of the phase 3 clinical trials for EVENITY but not in another, larger phase 3 study, in April 2019 the FDA approved EVENITY for the treatment of osteoporosis in postmenopausal women at high risk for fracture, along with a post-marketing requirement. The requirement includes a five-year observational feasibility study that could be followed by a comparative safety study or trial.
Regulatory authorities also require that our products are tested and controlled for impurities. Impurities exceeding established limits may lead to delayed product approvals or disrupt the manufacture and distribution of our products. For example, certain jurisdictions and regulatory agencies, including the FDA and EMA, require risk assessments, and if applicable, testing, for the presence of nitrosamine impurities in certain small molecule drugs, and we are following the established process of evaluating potentially impacted small molecule products. Testing of our cinacalcet product has indicated the presence of nitrosamines in certain lots above established limits. After working closely with regulatory agencies in each impacted country we have stopped distribution of cinacalcet in certain countries and initiated recalls in certain Middle Eastern countries.
In addition to our innovative products, we are working to develop and commercialize biosimilar versions of a number of products currently manufactured, marketed and sold by other pharmaceutical companies. In some markets outside the United States and EU, there is not yet a legislative or regulatory pathway for the approval of biosimilars. In the United States, the BPCIA provided for such a pathway. Discussions within the FDA and other regulatory authorities, and between regulatory authorities and sponsors, continue as to the evidence needed to demonstrate biosimilarity or interchangeability for specific products. See We currently face competition from biosimilars and generics and expect to face increasing competition from biosimilars and generics in the future. Delays or uncertainties in the development or implementation of such pathways, or changes in existing regulatory pathways, including degradation of regulatory standards, could result in delays or difficulties in getting our biosimilar products approved by regulatory authorities, subject us to unanticipated development costs or otherwise reduce the value of the investments we have made in the biosimilars area. Further, we cannot predict the extent to which any potential legislative or policy initiatives would affect the biosimilar pathway or have a material adverse effect on our development of biosimilars, on our marketed biosimilars or on our pursuit of interchangeability designations for any biosimilar. In addition, if we are unable to bring our biosimilar products to market on a timely basis and secure “first-to-market” or other advantageous positions, our future biosimilar sales, business and results of operations could be materially and adversely affected.
Some of our products are used with drug delivery or companion diagnostic devices that have their own regulatory, manufacturing and other risks.
Many of our products and product candidates may be used in combination with a drug delivery device, such as an injector or other delivery system. For example, Neulasta is available as part of the Neulasta Onpro kit, our AutoTouch reusable autoinjector is used with ENBREL Mini single-dose prefilled cartridges, Repatha can be administered with the Repatha SureClick autoinjector, and WEZLANA uses our ConfiPen drug delivery device. In addition, some of our products or product candidates, including many of our oncology product candidates and products, including LUMAKRAS/LUMYKRAS and bemarituzumab, may also require the use of a companion or other diagnostic device such as a device that determines whether the patient is eligible to use our drug or that helps ensure its safe and effective use. In some regions, including the United States, regulatory authorities may require contemporaneous approval of the companion diagnostic device and the therapeutic product; in others the regulatory authorities may require a separate study of the companion diagnostic device. Our product candidates or expanded indications of our products used with such devices may not be approved or may be substantially delayed in receiving regulatory approval if development or approval of such devices is delayed, such devices do not also gain or maintain regulatory approval or clearance, or if such devices do not remain commercially available. When approval of the product and device is sought under a single marketing drug application, the increased complexity of the review process may delay receipt of regulatory approval. In addition, some of these devices may be provided by single-source unaffiliated third-party companies. We are dependent on the sustained cooperation and effort of those third-party companies to supply and/or market the devices and, in some cases, to conduct the studies required for approval or clearance by the applicable regulatory agencies. We are also dependent on those third-party companies continuing to meet applicable regulatory or other requirements. Failure to successfully develop, modify, or supply the devices, delays in or failures of the Amgen or third-party studies, or failure by us or the third-party companies to obtain or maintain regulatory approval or clearance of the devices could result in increased
development costs; delays in, or failure to obtain or maintain, regulatory approval; and/or associated delays in a product candidate reaching the market or in the addition of new indications for existing products. We are also required to collect and assess user complaints, adverse events and malfunctions regarding our devices, and actual or perceived safety problems or concerns with a device used with our product can lead to regulatory actions and adverse effects on our products. See Our current products and products in development cannot be sold without regulatory approval. Additionally, regulatory agencies conduct routine monitoring and inspections to identify and evaluate potential issues with our devices. For example, in 2017, the FDA reported on its adverse event reporting system that it was evaluating our Neulasta Onpro kit. Subsequently, we implemented device and labeling enhancements to address product complaints received on this device. We continuously monitor complaints and adverse events and implement additional enhancements as needed. Loss of regulatory approval or clearance of a device that is used with our product may also result in the removal of our product from the market. Further, failure to successfully develop, supply, or gain or maintain approval for these devices could adversely affect sales of the related approved products. See also We rely on third-party suppliers for certain of our raw materials, medical devices and components.
Some of our pharmaceutical pipeline and our commercial product sales rely on collaborations with third parties, which may adversely affect the development and sales of our products.
We depend on alliances with other companies, including pharmaceutical and biotechnology companies, vendors and service providers, for the development of a portion of the products in our pharmaceutical pipeline and for the commercialization and sales of certain of our commercial products. For example, we have collaborations with third parties under which we share development rights, obligations and costs and/or commercial rights and obligations. See Item 1. Business—Business Relationships.
Failures by these parties to meet their contractual, regulatory, or other obligations to us or any disruption in the relationships between us and these third parties, could have a material adverse effect on our pharmaceutical pipeline and business. In addition, our collaborative relationships for R&D and/or commercialization and sales often extend for many years and have given, and may in the future give, rise to disputes regarding the relative rights, obligations and revenues of us and our collaboration partners, including the ownership or prosecution of intellectual property and associated rights and obligations. This could result in the loss of intellectual property rights or protection, delay the development and sale of potential pharmaceutical products, affect the sale and delivery of our commercialized products and lead to lengthy and expensive litigation, administrative proceedings or arbitration.
RISKS RELATED TO OPERATIONS
We perform a substantial majority of our commercial manufacturing activities at our facility in the U.S. territory of Puerto Rico and a substantial majority of our clinical manufacturing activities at our facility in Thousand Oaks, California; significant disruptions or production failures at these facilities could significantly impair our ability to supply our products or continue our clinical trials.
The global supply of our products and product candidates for commercial sales and for use in our clinical trials is significantly dependent on the uninterrupted and efficient operation of our manufacturing facilities, in particular those in the U.S. territory of Puerto Rico and Thousand Oaks, California. See Manufacturing difficulties, disruptions or delays could limit supply of our products and limit our product sales.
We currently perform a substantial majority of our clinical manufacturing that supports our product candidates at our facility in Thousand Oaks, California. A substantial disruption in our ability to operate our Thousand Oaks manufacturing facility could materially and adversely affect our ability to supply our product candidates for use in our clinical trials, leading to delays in development of our product candidates.
In addition, we currently perform a substantial majority of our commercial manufacturing activities at our facility in the U.S. territory of Puerto Rico. In recent years, Puerto Rico has been affected by a number of natural disasters, including Hurricanes Maria (2017) and Fiona (2022), as well as earthquakes (2020). These natural disasters have affected, and may continue to affect, public and private properties and Puerto Rico’s electric grid and communications networks. While the critical manufacturing areas of our commercial manufacturing facility were not significantly affected by these natural disasters, the restoration of electrical service on the island after Hurricane Maria was a slow process, and our facility relied on backup diesel powered generators for some time. We also operated on backup generators for a few weeks after the early 2020 earthquakes in Puerto Rico. In 2021, the baseload power generation units of the Puerto Rico Electric Power Authority malfunctioned, leading to selective outages across the island. In September 2022, Hurricane Fiona caused further damage to the island’s utility infrastructure which again resulted in widespread power outages and water supply issues. On December 31, 2024, an island-wide power outage also required that we operate on backup generators. Although these events did not directly have a material effect on our business, they have resulted in disruptions to our third-party suppliers on the island. Further instability of the electric grid could require us to increase our use of our generators or to use them exclusively. In addition, future storms,
earthquakes or other natural or man-made disasters or events (including political unrest or labor shortages) could have a more significant effect on our manufacturing operations. The COVID-19 pandemic also resulted in disruptions to activities on the island. In March 2020, the Governor of Puerto Rico issued Executive Orders requiring the lockdown of businesses and government facilities, imposing restrictions on business operations and a curfew on residents in response to COVID-19. Additionally, during the summer of 2021, a labor dispute arose between the maritime terminal operation company and its employees, represented by the International Longshoremen’s Association (ILA), which resulted in a strike that delayed cargo movement from the San Juan Port Zone for several days. Hurricanes Maria and Fiona, the 2020 earthquakes, the COVID-19 pandemic and the ILA strike have placed greater stress on the island’s already challenged economy. Beginning in 2016, the government of Puerto Rico defaulted on its roughly $72 billion of debt. In response, the U.S. Congress passed the Puerto Rico Oversight, Management, and Economic Stability Act, which established a financial oversight board for Puerto Rico. After years of negotiations with bondholders and other creditors, this financial oversight board reached an agreement with the same, which was confirmed by the U.S. District Court for the District of Puerto Rico effective March 2022. Although our ability to manufacture and supply our products has not, to date, been significantly affected by natural disasters, unreliable electric utility services, strikes, pandemic lockdowns or the island’s economic challenges, these, or a combination of these challenges, or other issues that create a substantial disruption to our ability to operate our Puerto Rico manufacturing facility or get supplies and manufactured products transported to and from that location, could make it more expensive or difficult for us to operate in Puerto Rico, and could materially and adversely affect our ability to supply our products and affect our product sales. See Manufacturing difficulties, disruptions or delays could limit supply of our products and limit our product sales.
We rely on third-party suppliers for certain of our raw materials, medical devices and components.
We rely on unaffiliated third-party suppliers for certain raw materials, medical devices and components necessary for the manufacturing of our commercial and clinical products. Certain of those raw materials, medical devices and components are proprietary products of those unaffiliated third-party suppliers and are specifically cited in our drug applications with regulatory agencies so that they must be obtained from that specific sole source or sources and could not be obtained from another supplier unless and until the regulatory agency approved such supplier. For example, we rely on a single source for the SureClick autoinjectors used in the drug delivery of Repatha, ENBREL, Aimovig, AMJEVITA/AMGEVITA and Aranesp, and we also relied on a single source for the Pushtronex automated mini doser used in the drug delivery of Repatha. Recently, to uphold the high standards that we have set for patient experience and the need for a reliable supply of components, we have decided to discontinue the Repatha automated mini doser presentation in all countries and are working with health care professionals to transition patients to alternative Repatha delivery options. Also, certain of the raw materials required in the commercial and clinical manufacturing of our products are sourced from other countries and/or derived from biological sources, including mammalian tissues, bovine serum and human serum albumin.
Among the reasons we may be unable to obtain these raw materials, medical devices and components include:
•regulatory requirements or action by regulatory agencies or others;
•adverse financial or other strategic developments at or affecting the supplier, including bankruptcy;
•unexpected demand for or shortage of raw materials, medical devices or components;
•failure to comply with our quality standards which results in quality and product failures, complaints, product contamination and/or recall;
•a material shortage, contamination, recall and/or restrictions on the use of certain biologically derived substances or other raw materials;
•discovery of previously unknown or undetected imperfections in raw materials, medical devices or components;
•cyberattacks on supplier systems;
•natural or other disasters, including hurricanes, earthquakes, volcanoes or fires;
•labor disputes (such as strikes) or shortages, including from the effects of health emergencies (such as novel viruses or pandemics) or natural disasters; and
•geopolitical conflicts (such as the ongoing conflicts in Ukraine and the Middle East).
For example, in prior years we have experienced shortages in certain components necessary for the formulation, fill and finish of certain of our products in our Puerto Rico facility, and we have also experienced shortages related to single use systems and packaging which has caused disruptions to our manufacturing plans. Further quality issues that result in unexpected additional demand for certain components have resulted in shortages and in the future may lead to shortages of
required raw materials or components (such as we have experienced with EPOGEN glass vials). We may experience similar or other shortages in the future resulting in delayed shipments, supply constraints, clinical trial delays, contract disputes and/or stock-outs of our products. These or other similar events could negatively affect our ability to satisfy demand for our products or conduct clinical trials, which could have a material adverse effect on our product sales, business and results of operations.
Manufacturing difficulties, disruptions or delays could limit supply of our products and limit our product sales.
Manufacturing biologic and small molecule human therapeutic products is difficult, complex and highly regulated. We manufacture many of our commercial products and product candidates internally. In addition, we use third-party contract manufacturers to produce, or assist in the production of, a number of our products, and we currently use contract manufacturers to produce, or assist in the production of, a number of our late-stage product candidates and drug delivery devices. The number of third-party contract manufacturers that we use has increased with our acquisition of Horizon, as Horizon required such contract manufacturers for all of its products. See Part I, Item 1. Business—Manufacturing, Distribution and Raw Materials—Manufacturing; and Part I, Item 1A, Risk Factors—Our efforts to collaborate with or acquire other companies, products, or technology, and to integrate the operations of companies or to support the products or technology we have acquired, may not be successful, and may result in unanticipated costs, delays or failures to realize the benefits of the transactions. Our ability to adequately and timely manufacture and supply our products (and product candidates to support our clinical trials) is dependent on the uninterrupted and efficient operation of our facilities and those of our third-party contract manufacturers, which may be affected by:
•capacity of manufacturing facilities;
•contamination by microorganisms or viruses, or foreign particles from the manufacturing process;
•natural or other disasters, including hurricanes, earthquakes, volcanoes or fires;
•labor disputes or shortages, including the effects of health emergencies (such as novel viruses or pandemics) or natural disasters;
•compliance with regulatory requirements;
•changes in forecasts of future demand;
•timing and actual number of production runs and production success rates and yields;
•updates of manufacturing specifications;
•contractual disputes with our suppliers and contract manufacturers;
•timing and outcome of product quality testing;
•power failures and/or other utility failures;
•cyberattacks on supplier systems;
•breakdown, failure, substandard performance or improper installation or operation of equipment (including our information technology systems and network-connected control systems or those of our contract manufacturers or third-party service providers);
•delays in the ability of the FDA or foreign regulatory agencies to provide us necessary reviews, inspections and approvals, including as a result of a subsequent extended U.S. federal or other government shutdowns; and/or
•geopolitical conflicts (such as the ongoing conflicts in Ukraine and the Middle East).
If any of these or other problems affect production in one or more of our facilities or those of our third-party contract manufacturers, or if we do not accurately forecast demand for our products or the amount of our product candidates required in clinical trials, we may be unable to start or increase production in our unaffected facilities to meet demand. If the efficient manufacture and supply of our products or product candidates is interrupted, we may experience delayed shipments, delays in our clinical trials, supply constraints, stock-outs, adverse event trends, contract disputes and/or recalls of our products. From time to time, we have initiated recalls of certain lots of our products. For example, in July 2014 we initiated a voluntary recall of an Aranesp lot distributed in the EU after particles were detected in a quality control sample following distribution of that lot, and in April 2018 we initiated a precautionary recall of two batches of Vectibix distributed in Switzerland after potential crimping defects were discovered in the metal seals on some product vials. If we are at any time unable to provide an uninterrupted supply of our products to patients, we may lose patients and physicians may elect to prescribe competing
therapeutics instead of our products, which could have a material adverse effect on our product sales, business and results of operations.
Our manufacturing processes, those of our third-party contract manufacturers and those of certain of our third-party service providers must undergo regulatory approval processes and are subject to continued review by the FDA and other regulatory authorities. It can take longer than five years to build, validate and license another manufacturing plant, and it can take longer than three years to qualify and license a new contract manufacturer or service provider. If we elect or are required to make changes to our manufacturing processes because of new regulatory requirements, new interpretations of existing requirements or other reasons, this could increase our manufacturing costs and result in delayed shipments, delays in our clinical trials, supply constraints, stock-outs, adverse event trends or contract negotiations or disputes. Such manufacturing challenges may also occur if our existing contract manufacturers are unable or unwilling to timely implement such changes, or at all.
We are expanding our manufacturing capabilities to support current and anticipated demand for our products and product candidates. Our expansion efforts, in certain circumstances, rely on a single or small number of vendors or suppliers, and finding alternative suppliers may not be feasible or could take a significant amount of time and involve significant expense due to the nature of the requirements of our facilities. Construction or quality assurance challenges at the facilities we are building or expanding, labor shortages, contractual disputes with our suppliers, negative outcomes from agency officials or other delays or challenges in operationalizing additional manufacturing capacity could limit our ability to capitalize on demand for our products and product candidates.
In addition, regulatory agencies conduct routine monitoring and inspections of our manufacturing facilities and processes as well as those of our third-party contract manufacturers and service providers. If regulatory authorities determine that we or our third-party contract manufacturers or certain of our third-party service providers have violated regulations, they may mandate corrective actions and/or issue warning letters, or even restrict, suspend or revoke our prior approvals, prohibiting us from manufacturing our products or conducting clinical trials or selling our marketed products until we or the affected third-party contract manufacturers or third-party service providers comply, or indefinitely. See Our current products and products in development cannot be sold without regulatory approval. Such issues may also delay the approval of product candidates we have submitted for regulatory review, even if such product candidates are not directly related to the products, devices or processes at issue with regulators. Because our third-party contract manufacturers and certain of our third-party service providers are subject to the FDA and foreign regulatory authorities, alternative qualified third-party contract manufacturers and third-party service providers may not be available on a timely basis, or at all. If we or our third-party contract manufacturers or third-party service providers cease or interrupt production or if our third-party contract manufacturers and third-party service providers fail to supply materials, products or services to us, we may experience delayed shipments, delays in our clinical trials, supply constraints, contract disputes, stock-outs and/or recalls of our products. Additionally, we distribute a substantial volume of our commercial products through our primary distribution centers in Louisville, Kentucky for the United States and in Breda, Netherlands for Europe and much of the rest of the world. We also conduct most of the labeling and packaging of our products distributed in Europe and much of the rest of the world in Breda. Our ability to timely supply products is dependent on the uninterrupted and efficient operations of our distribution and logistics centers, our third-party logistics providers and our labeling and packaging facility in Breda. Further, we rely on commercial transportation, including air and sea freight, for the distribution of our products to our customers, which has been negatively affected by the COVID-19 pandemic, labor unrest, natural disasters and geopolitical security threats.
Changes in laws or regulations with respect to the use and/or presence of certain chemicals in our products or the components used in the research, development, manufacture and/or packaging of our products could also disrupt or restrict our ability to develop, produce or sell our products in the affected jurisdictions. For example, the EU, the U.S. Congress, the U.S. Environmental Protection Agency, and several U.S. states are considering legislation and/or policies to address the reporting, presence, and/or use, of certain chemicals in certain of the components used in the manufacture or packaging of commercial products, including chemicals known as per- and polyfluorinated substances (PFAS). In July 2024, Canada (through Environment and Climate Change Canada) issued a notice requiring reporting on PFAS manufacture, import, and use in Canada. In addition, proposed legislation in several jurisdictions are under consideration to prohibit or otherwise regulate the importation, manufacture, or distribution of goods containing PFAS, and some such proposals do not provide exemptions for drug products, medical devices, their packaging, or the materials used in the research, development, or manufacture of such products or devices. For example, the EU is considering a ban on PFAS in the manufacturing and packaging of pharmaceutical products that could affect pharmaceutical research and development activities and commercial distribution. Some proposals, if enacted without exemptions for pharmaceutical products, and materials used in their research, development, and manufacture, or without adequate time to research and develop or otherwise identify alternative materials or suppliers, may cause significant disruptions to our ability to manufacture and supply products to the affected jurisdictions, potentially resulting in a material adverse effect on our business.
There have also been legislative and administrative proposals seeking to incentivize greater drug manufacturing in the United States with the stated goal of improving supply reliability in the United States. For example, on August 6, 2020, an Executive Order was issued that was aimed at boosting domestic production of essential medicines, medical countermeasures, and critical inputs titled “Executive Order on Ensuring Essential Medicines, Medical Countermeasures, and Critical Inputs are Made in the United States.” Additionally, one legislative proposal would have prohibited the U.S. Department of Veterans Affairs from purchasing certain drugs that have active pharmaceutical ingredients manufactured outside the United States. While we perform a substantial majority of our commercial manufacturing activities in the United States, including in the U.S. territory of Puerto Rico, and a substantial majority of our clinical manufacturing activities at our facility in Thousand Oaks, California, the passage of such legislation could result in foreign governments enacting retaliatory legislation or regulatory actions, which may have an adverse effect on our product sales, business and results of operations.
Our business and operations may be negatively affected by the failure, or perceived failure, of achieving our environmental, social and governance objectives.
We continue to work towards operating our business in an environmentally responsible and socially inclusive manner. Stakeholders, including our investors and our employees, have increasingly focused on, and are expected to continue to focus on, our ESG practices. Policymakers, regulators and investors globally have increased their focus on ESG matters, resulting in rapidly evolving and diverging expectations and standards. For example, California recently enacted the Climate Corporate Data Accountability Act that requires, among other things, disclosure of greenhouse gas emissions. In contrast, in other states, there are a growing number of anti-ESG initiatives that may conflict with certain of our stakeholders’ expectations. For example, at least 16 states have enacted laws prohibiting the consideration of ESG factors in connection with state pension asset investment decisions. If our ESG practices fail to meet our stakeholders’ expectations and standards, or if we fail to comply with ESG-related regulations across our global business, there could be a material adverse effect on our reputation, business and, ultimately, our stock price.
Our ESG report is made available on our website and describes our current ESG goals and the progress we have made on the ESG issues that we believe our external and internal stakeholders consider to be important, based on surveys, interviews and certain frameworks for corporate responsibility. Achieving our ESG goals requires long-term investments and broad, coordinated activity, and we may be required to incur additional costs or allocate additional resources towards monitoring, reporting and implementing our ESG programs. Further, we may fail to accurately assess our stakeholders’ ESG priorities and concerns, as such priorities and concerns have been rapidly changing. While we have achieved most of our goals set in prior years, whether we can achieve our current and future ESG goals continues to be uncertain and remains subject to numerous risks, including evolving regulatory requirements and social expectations affecting ESG practices, our ability to recruit, develop and retain a diverse workforce, the availability of suppliers and collaboration partners that can meet our environmental goals, the effects of the organic growth of our business and potential acquisitions of other businesses on our ESG performance, and the availability and cost of technologies or resources, such as carbon credits, that support our goals. Any failure or perceived failure to meet our ESG program priorities could result in a material adverse effect on our reputation, business and stock price.
The effects of global climate change and related natural disasters could negatively affect our business and operations.
Many of our operations and facilities, including those essential to our manufacturing, R&D and distribution activities, are in locations that are subject to natural disasters, including droughts, fires, extreme temperatures, hurricanes, tropical storms and/or floods. For example, in 2017 Hurricane Maria caused catastrophic damage, compounded in 2022 by Hurricane Fiona, to the U.S. territory of Puerto Rico, where we perform a substantial majority of our commercial manufacturing activities. Although our site was well-protected and suffered minimal damage, there can be no assurances that we would have similar results in the face of future natural disasters. The severity and frequency of weather-related natural disasters has been amplified, and is expected to continue to be amplified by, global climate change. For example, in January 2025 Los Angeles county experienced unprecedented wildfires, and while the natural disaster did not impact our facilities or their operations, a number of our staff members lost their homes or were subject to evacuation orders and/or multiple-day power outages. Such natural disasters have caused, and in the future may cause, damage to and/or disrupt our operations, which may result in a material adverse effect on our product sales, business and results of operations. Our suppliers, vendors and business partners also face similar risks, and any disruption to their operations could have an adverse effect on our supply and manufacturing chain. Further, many of our key facilities are located on islands, including Puerto Rico, Singapore and Ireland, which rely on essential port facilities that may be vulnerable to climate change-related or other natural disasters. Although we have detailed business continuity plans in place and periodic assessments of our natural disaster risk, any natural disaster may also result in prolonged interruption to our critical operational and business activities, and we may be required to incur significant costs to remedy the effects of such natural disasters and fully resume operations, which may result in a material adverse effect on our product sales, business and results of operations. See We perform a substantial majority of our commercial manufacturing activities at our facility in the U.S. territory of Puerto Rico and a substantial majority of our clinical manufacturing activities at our facility in Thousand Oaks, California; significant disruptions or production failures at these facilities could significantly impair our ability to supply
our products or continue our clinical trials and Manufacturing difficulties, disruptions or delays could limit supply of our products and limit our product sales.
GENERAL RISK FACTORS
Global economic conditions may negatively affect us and may magnify certain risks that affect our business.
Our operations and performance have been, and may continue to be, affected by global economic conditions. The economic downturn resulting from the COVID-19 pandemic precipitated a global recession, which was followed by high rates of inflation and actions taken by financial regulators to raise interest rates. Instability in the financial system, tighter lending standards and higher interest rates have added stress that may create additional vulnerabilities in the global economy, the effects of which may be of an extended duration. Additionally, with higher interest rates, deficits (including those associated with the pandemic), and other fiscal pressures, governments may be unable to sustain their previously high levels of fiscal spending. Further, in the United States, although Congress has approved stopgap measures to fund the government through early March, the federal government continues to be at risk of a shutdown if legislation providing funding for the fiscal year is not passed as a result of political divisions in Congress and an impasse on budgetary and spending matters. Congress must also reach an agreement to extend the federal debt ceiling in 2025 to avoid default on U.S. government debt, and such negotiation will also likely include a focus on decreasing government spending (which the new Administration and Congressional majorities have indicated will be a priority). Consequently, these and other financial pressures have caused, and may continue to cause, government or other third-party payers to more aggressively seek cost containment measures in healthcare and other settings. See Our sales depend on coverage and reimbursement from government and commercial third-party payers, and pricing and reimbursement pressures have affected, and are likely to continue to affect, our profitability. As a result of global economic conditions, some third-party payers may delay or be unable to satisfy their reimbursement obligations. Job losses or other economic hardships (including inflation) may also affect patients’ ability to afford healthcare as a result of increased co-pay or deductible obligations, greater cost sensitivity to existing co-pay or deductible obligations, lost healthcare insurance coverage or for other reasons. We believe such conditions have led and could continue to lead to reduced demand for our products, which could have a material adverse effect on our product sales, business and results of operations. The cumulative effects of inflationary pressures and the effects from the armed conflict in Ukraine (including the effects of the sanctions that were implemented in response to the conflict and the resulting impacts on the commodity market and supply chains) and the Middle East have also increased our operating expenses and may continue to affect our operating expenses. Our operational costs, including the cost of energy, materials, labor, distribution and our other operational and facilities costs are subject to market conditions and are being adversely affected by inflationary pressures. Although we monitor our distributors’, customers’ and suppliers’ financial condition and their liquidity to mitigate our business risks, some of our distributors, customers and suppliers may become insolvent, which could have a material adverse effect on our product sales, business and results of operations. A significant worsening of global economic conditions could precipitate or materially amplify the other risks described herein. Further, the range of actions the new Administration has taken, and may take, around tariffs and trade and the associated uncertainty of how such actions may be implemented may have adverse effects on the global economic environment and could also amplify such other risks.
We maintain a significant portfolio of investments on our consolidated balance sheets. In the recent past, the global COVID-19 pandemic and interest rate increases have led to disruption and volatility in the global capital markets. We have certain assets, including equity investments, that are exposed to market fluctuations that could, in a sustained or recurrent series of market disruptions, result in impairments. The value of our investments may also be adversely affected by interest rate fluctuations, inflation, downgrades in credit ratings, illiquidity in the capital markets, geopolitical events and other factors that may result in other-than-temporary declines in the value of our investments. Any of those events could cause us to record impairment charges with respect to our investment portfolio or to realize losses on sales of investments. We also maintain a majority of our cash and cash equivalents in accounts with major multi-national financial institutions, and our deposits at these institutions exceed insured limits. Market conditions can adversely affect the viability of these institutions. In the event of failure of any of the financial institutions where we maintain our cash and cash equivalents, there can be no assurance that we would be able to access uninsured funds in a timely manner or at all. Inability to access, or a delay in accessing these funds, could adversely affect our business and financial position.
Our stock price is volatile.
Our stock price, like that of our peers in the biotechnology and pharmaceutical industries, is volatile. Our revenues and operating results may fluctuate from period to period for a number of reasons. Events such as a delay in product development, changes to our expectations or strategy or even a relatively small revenue shortfall may cause financial results for a period to be below our expectations or projections. As a result, our revenues and operating results and, in turn, our stock price may be subject to significant fluctuations. Announcements or discussions, including via social media channels, of possible restrictive actions by government or private payers that would negatively affect our business or industry if ultimately enacted or adopted may also cause our stock price to fluctuate, whether or not such restrictive actions ever actually occur. Similarly, actual or
perceived safety issues with our products or similar products or unexpected clinical trial results can have an immediate and rapid effect on our stock price, whether or not our operating results are materially affected.
| | | | | |
| Item 1B. | UNRESOLVED STAFF COMMENTS |
None.
Risk Management and Strategy
Amgen has a multi-layered and iterative approach towards assessing, identifying, managing and mitigating risks from cybersecurity threats. The Amgen Technology & Medical Organizations (ATMOS) function is designed to support our productivity, innovation and outreach globally through the quality delivery of information systems, solutions and services for our business and operations. The ATMOS function has a Cybersecurity & Digital Trust (CDT) team that assesses and reduces cybersecurity exposure, including by providing employees with training and resources to identify potential cybersecurity threats and implementing information technology security practices. The CDT team also monitors for cybersecurity threat activity and seeks to mitigate the impact from cybersecurity incidents by deploying information security engineers, system architects, analysts and cybersecurity specialists to provide monitoring, reporting and management of cybersecurity incidents.
To evaluate the progress of its activities, our ATMOS function uses various industry and regulatory frameworks as guides to assess the state of the Company’s cybersecurity program maturity and controls, including our organizational, people, physical and technological controls. The CDT team also conducts reviews and evaluations of our cybersecurity resilience program with Amgen’s Cybersecurity & Digital Trust Governance Council (which includes leaders from CDT, Worldwide Compliance and Business Ethics, Regulatory Affairs, Operations, R&D, Global Commercial Operations, Corporate Audit, Law and Business Development functions).
Our cybersecurity risk management program is considered by and integrated into our Company-wide Enterprise Risk Management program and shares common methodologies, reporting channels and governance processes that apply across the Enterprise Risk Management program to that of other enterprise level risks (such as product development, safety and surveillance, financial and intellectual property risks). Regular evaluations are conducted of the greatest risks to our business and their underlying risk drivers as well as the associated mitigation activities, maturity and controls. This program is overseen by our Executive Vice President and Chief Financial Officer and guided by the Enterprise Risk Council, a cross-functional group of the Company’s business leaders representing key business functions that is co-chaired by our Chief Audit Executive. The results of the enterprise risk evaluations and the status and operation of the Enterprise Risk Management program are presented to our Board of Directors, which oversees the Company’s enterprise-level risks.
Further, our corporate audit function is responsible for assessing risk and testing whether, and the extent to which, our information security policies and practices are being implemented effectively within our business and by third party providers. Findings from such reports and related corrective action plans are shared with our CDT team, Company leadership, and the Audit Committee and Corporate Responsibility and Compliance Committee (CRCC) of our Board of Directors.
In addition to leveraging the Company’s own information technology resources, our Incident Response and Cyber Threat Intelligence teams engage, as needed, third-party cybersecurity risk assessors and consultants to assist in recognizing threats, identifying security vulnerabilities and evaluating the impact of cybersecurity attacks and incidents when they occur. On a biennial basis, our ATMOS also engages external third-party experts to assess the Company’s cybersecurity control maturity across the organization and develops plans to address such experts’ recommendations.
Our CDT function has processes to oversee and identify the risks of cybersecurity threats associated with third-party service providers and monitors and works to mitigate the impact of cybersecurity incidents encountered by our third-party service providers. Upon becoming aware of cybersecurity incidents encountered by our third-party service providers, the CDT function’s Incident Response and Cyber Threat Intelligence teams are deployed to evaluate and mitigate the impact of such incidents on our business.
In connection with our adoption of artificial intelligence (AI) tools in our business, including AI tools customized for our business and a variety of Amgen-built tools for use across applications, the Company established an AI Governance Council composed of cross-functional leadership that oversees the safe adoption of third-party AI services, including by establishing guardrails to reduce risks and allocating resources to provide staff training on the proper use of AI and responsible AI practices. The AI Governance Council is co-sponsored by our Chief Compliance Officer and Senior Vice President, Artificial Intelligence & Data.
Despite our layered controls and cybersecurity efforts, the Company and its third-party vendors have experienced cyberattacks and information security vulnerabilities, and while such incidents have not had a material adverse effect on the Company, there can be no assurance that future cybersecurity attacks or incidents would not result in a material adverse effect on our business strategy, results of operations or financial condition. For examples of such matters and a discussion of the risks that we face, see Item 1A. Risk Factors—A breakdown of our information technology systems, cyberattack or information security breach could significantly compromise the confidentiality, integrity and availability of our information technology systems, network-connected control systems and/or our data, interrupt the operation of our business and/or affect our reputation. However, we have not identified risk from known cybersecurity threats, including as a result of any prior cybersecurity incidents, that have materially affected or are reasonably likely to materially affect us, including our operations, business strategy, results of operations or financial condition.
Governance
Our Board of Directors oversees an enterprise-wide approach to risk management, including risks related to information systems and cybersecurity, and each Board committee has primary risk oversight responsibilities aligned with its areas of focus. At each regular meeting of the Board, the Board receives and considers reports from each of its committees, and such reports provide additional detail on significant risk management issues as appropriate, including cybersecurity. The CRCC is the committee that has primary oversight responsibility for the Company’s information systems and management of cybersecurity and receives reports from our Senior Vice President and Chief Information Officer (CIO) and Chief Information Security Officer (CISO) that includes reviews of our information systems strategy, technology investments, cybersecurity risks and incidents, and third-party risk management, as well as an annual evaluation of the Company’s cybersecurity status. The Board’s Audit Committee has oversight responsibility of our internal controls, assurances and financial risks. The Audit Committee is provided with copies of materials presented to our CRCC by our CIO and CISO and receives reports from our CIO regarding topics including integration or implementation of new financial systems and key controls and governance designed to address cybersecurity risks associated with the use of such new financial systems.
Our management team, including our CIO and CISO, supervises efforts to prevent, detect, mitigate and remediate cybersecurity risks and incidents through various means, which may include briefings from internal information security personnel; threat intelligence and other information obtained from governmental, public or private sources, including external consultants engaged by us; and alerts and reports produced by security tools deployed in the information systems environment.
Our CISO, who heads our CDT team and is accountable for the Company’s cybersecurity risk management program, joined the Company’s information systems organization in 2016, is a Certified Information Systems Security Professional and is certified in risk and information systems control. Previously, our CISO served in both leadership and operational positions as a cybersecurity professional in the U.S. government and was a cybersecurity consultant, providing a wide range of cybersecurity services to various U.S. government agencies and departments. Our CISO is overseen by our CIO, who has 27 years of experience in information systems (including over 14 years at the Company and more than 6 years as a senior technology executive outside of Amgen), and holds a Computer Information Systems B.S. and an Information Technology Management MBA. Our Executive Vice President and Chief Technology Officer (CTO) leads our ATMOS function and oversees our CIO.
As leaders of the Technology and CDT functions within ATMOS, respectively, the Company’s CIO and CISO are informed about and monitor significant cybersecurity threats and incidents through the Company’s internal cybersecurity reporting structure. Our CDT team is responsible for monitoring and detecting cybersecurity threats and incidents. Our CDT team, overseen by our CISO, is also responsible for the mitigation and remediation of cybersecurity incidents. When members of the CDT team detect a cybersecurity threat or incident or are made aware of a cybersecurity incident encountered by a third-party service provider, the discovery is communicated to the Incident Response team, which includes our CISO and other senior members of the CDT function. The Incident Response team evaluates the severity of the cybersecurity threat or incident and shares its findings with our CISO.
Our CISO and/or his senior team leaders, in addition to our CIO and CTO, also provide regular reports to executives leading our Finance, Compliance, Law and Human Resources functions on potentially significant cybersecurity incidents and the progress made towards mitigation and remediation of those incidents. These leaders oversee reporting to our CRCC and Audit Committee, and reporting of such cybersecurity incidents is included in the course of regular meetings of such committees. Additionally, in appropriate circumstances, reporting of potentially significant cybersecurity incidents is made directly to the leaders of our CRCC and Audit Committee or directly to the Board of Directors outside of their regular meeting schedule. Further, in support of our internal controls, our CISO also reviews cybersecurity matters and trends with our Accounting and Law functions at least on a quarterly basis.
Information Systems Acquired from Horizon Therapeutics plc
On October 6, 2023, we completed our acquisition of Horizon. Certain Horizon legacy information systems are maintained separately from Amgen’s preexisting information system infrastructure. We are continuing to operationally integrate and transition the legacy Horizon systems into our own, with the integrated systems becoming subject to Amgen’s cybersecurity risk management structure and strategy. While we are integrating these systems, our CISO and CDT function are engaging in cybersecurity risk management activities, and any cybersecurity incidents detected on the legacy Horizon information systems are assessed, mitigated and remediated by our CDT function’s Operations, Incident Response and Cyber Threat Intelligence teams and reported in accordance with the governance processes detailed above. See Item 1A. Risk Factors—Our efforts to collaborate with or acquire other companies, products, or technology, and to integrate the operations of companies or to support the products or technology we have acquired, may not be successful, and may result in unanticipated costs, delays or failures to realize the benefits of the transactions and Item 1A. Risk Factors—A breakdown of our information technology systems, cyberattack or information security breach could significantly compromise the confidentiality, integrity and availability of our information technology systems, network-connected control systems and/or our data, interrupt the operation of our business and/or affect our reputation.
As of December 31, 2024, we owned or leased approximately 160 properties. The locations and primary functions of significant properties are summarized in the following tables:
| | | | | | | | | | | | | | | | | | | | |
| U.S. Location: | Manufacturing | Administrative | R&D | Sales & marketing | Warehouse | Distribution center |
Thousand Oaks, CA(1) | x | x | x | x | x | x |
| Juncos, Puerto Rico | x | x | | | x | x |
| West Greenwich, RI | x | x | | | x | |
| Deerfield, IL | | x | x | x | | |
| Cambridge, MA | | | x | | | |
| New Albany, OH | x | x | | | x | |
| San Francisco, CA | | | x | | | |
| Tampa, FL | | x | | x | | |
| Louisville, KY | | | | | x | x |
Other U.S. cities(2) | | x | x | x | | |
| | | | | | | | | | | | | | | | | | | | |
| ROW Location: | Manufacturing | Administrative | R&D | Sales & marketing | Warehouse | Distribution center |
| Brazil | | x | | x | | |
| Canada | | x | x | x | | |
| China | | x | | x | | |
| Denmark | | x | x | x | | |
| Germany | | x | x | x | | |
| Iceland | | x | x | | | |
| India | | x | | | | |
| Ireland | x | x | | x | x | x |
| Netherlands | x | x | | x | x | x |
| Singapore | x | x | | x | x | |
| United Kingdom | | x | x | x | | |
Other countries(2) | | x | x | x | x | |
____________
(1) Corporate headquarters
(2) Includes smaller properties in other U.S. and ROW locations, primarily for administrative and sales & marketing
Excluded from the information above are (i) undeveloped land and leased properties that have been abandoned and (ii) certain buildings we still own but that are no longer used in our business. Additionally, in 2024 we received FDA licensure of our manufacturing facility in New Albany, Ohio; opened a new technology and innovation site in India; and continued to progress on the construction of our first drug substance manufacturing facility in Holly Springs, North Carolina. Furthermore, in January 2025, we broke ground on our second drug substance manufacturing facility in Holly Springs, North Carolina. There are no material encumbrances on our owned properties.
We believe our facilities are suitable for their intended uses and, in conjunction with our third-party contract manufacturing agreements, provide adequate capacity and are sufficient to meet our expected needs. See Item 1A. Risk Factors for a discussion of the factors that could adversely impact our manufacturing operations and the global supply of our products.
See Item 1. Business—Manufacturing, Distribution and Raw Materials.
Certain of the legal proceedings in which we are involved are discussed in Part IV—Note 20, Contingencies and commitments, to the Consolidated Financial Statements and are hereby incorporated by reference.
| | | | | |
| Item 4. | MINE SAFETY DISCLOSURES |
Not applicable.
PART II
| | | | | |
| Item 5. | MARKET FOR REGISTRANT’S COMMON EQUITY, RELATED STOCKHOLDER MATTERS AND ISSUER PURCHASES OF EQUITY SECURITIES |
Common stock
Our common stock trades on the Nasdaq Global Select Market under the symbol AMGN. As of February 11, 2025, there were approximately 4,047 holders of record of our common stock.
Performance graph
The following graph shows the value of an investment of $100 on December 31, 2019, in each of Amgen common stock, the Amex Biotech Index, the Amex Pharmaceutical Index and Standard & Poor’s 500 Index. All values assume reinvestment of the pretax value of dividends and are calculated as of December 31 of each year. The historical stock price performance of the Company’s common stock shown in the performance graph is not necessarily indicative of future stock price performance.
| | | | | | | | | | | | | | | | | | | | | | | | | | | | | | | | | | | |
| 12/31/2019 | | 12/31/2020 | | 12/31/2021 | | 12/31/2022 | | 12/31/2023 | | 12/31/2024 |
| Amgen (AMGN) | $100.00 | | $98.00 | | $98.86 | | $119.11 | | $135.21 | | $126.14 |
| Amex Biotech (BTK) | $100.00 | | $113.57 | | $109.57 | | $105.18 | | $108.20 | | $114.95 |
| Amex Pharmaceutical (DRG) | $100.00 | | $108.73 | | $134.15 | | $144.55 | | $155.72 | | $163.62 |
| Standard & Poor’s 500 (SPX) | $100.00 | | $118.39 | | $152.34 | | $124.66 | | $157.49 | | $196.50 |
The material in the above performance graph is not soliciting material, is not deemed filed with the SEC and is not incorporated by reference in any filing of the Company under the Securities Act or the Exchange Act, whether made on, before or after the date of this filing and irrespective of any general incorporation language in such filing.
Stock repurchase program
During the year ended December 31, 2024, we had one outstanding stock repurchase program, under which repurchase activity was as follows:
| | | | | | | | | | | | | | | | | | | | | | | | | | |
| | Total
number of
shares
purchased | | Average price paid per share | | Total number
of shares purchased as part of publicly
announced program | | Maximum dollar value that may yet be purchased under the program |
| October 1–October 31 | | — | | | | | — | | | $ | 6,979,263,848 | |
| November 1–November 30 | | — | | | | | — | | | $ | 6,979,263,848 | |
| December 1–December 31 | | 718,799 | | | $ | 278.26 | | | 718,799 | | | $ | 6,779,253,902 | |
| | 718,799 | | | | | 718,799 | | | |
January 1–December 31(1) | | 718,799 | | | $ | 278.26 | | | 718,799 | | | |
____________
(1) During the year ended December 31, 2024, the Company purchased an additional 1,225 shares at an average price paid of $323.34 per share from staff members to satisfy federal law compliance obligations. These shares were not repurchased under our stock repurchase program.
Dividends
For the years ended December 31, 2024 and 2023, we paid quarterly dividends. We expect to continue to pay quarterly dividends, although the amount and timing of any future dividends are subject to approval by our Board of Directors. Additional information required by this item is incorporated herein by reference to Part IV—Note 17, Stockholders’ equity, to the Consolidated Financial Statements.
Securities Authorized for Issuance Under Existing Equity Compensation Plans
Information about securities authorized for issuance under existing equity compensation plans is incorporated by reference from Part III, Item 12—Securities Authorized for Issuance Under Existing Equity Compensation Plans.
| | | | | |
| Item 7. | MANAGEMENT’S DISCUSSION AND ANALYSIS OF FINANCIAL CONDITION AND RESULTS OF OPERATIONS |
The following MD&A is intended to assist the reader in understanding Amgen’s business. MD&A is provided as a supplement to, and should be read in conjunction with, our consolidated financial statements and accompanying notes. Our results of operations discussed in MD&A are presented in conformity with GAAP. Amgen operates in one operating segment: human therapeutics. Therefore, our results of operations are discussed on a consolidated basis.
Forward-looking statements
This report and other documents we file with the SEC contain forward-looking statements that are based on current expectations, estimates, forecasts and projections about us, our future performance, our business, our beliefs and our management’s assumptions. In addition, we, or others on our behalf, may make forward-looking statements in press releases, written statements or our communications and discussions with investors and analysts in the normal course of business through meetings, webcasts, phone calls and conference calls. Such words as “expect,” “anticipate,” “outlook,” “could,” “target,” “project,” “intend,” “plan,” “believe,” “seek,” “estimate,” “should,” “may,” “assume” and “continue” as well as variations of such words and similar expressions are intended to identify such forward-looking statements. These statements are not guarantees of future performance and they involve certain risks, uncertainties and assumptions that are difficult to predict. We describe our respective risks, uncertainties and assumptions that could affect the outcome or results of operations in Part I, Item 1A. Risk Factors. We have based our forward-looking statements on our management’s beliefs and assumptions based on information available to our management at the time the statements are made. We caution you that actual outcomes and results may differ materially from what is expressed, implied or forecasted by our forward-looking statements. Reference is made in particular to forward-looking statements regarding product sales, regulatory activities, clinical trial results, reimbursement, expenses, EPS, liquidity and capital resources, trends, planned dividends, stock repurchases and collaborations. Except as required under the federal securities laws and the rules and regulations of the SEC, we do not have any intention or obligation to update publicly any forward-looking statements after the distribution of this report, whether as a result of new information, future events, changes in assumptions or otherwise.
Overview
Amgen Inc. (including its subsidiaries, referred to as “Amgen,” “the Company,” “we,” “our” or “us”) discovers, develops, manufactures and delivers innovative medicines to fight some of the world’s toughest diseases. We focus on areas of high unmet medical need and leverage our expertise to strive for solutions that dramatically improve people’s lives, while also reducing the social and economic burden of disease. We helped launch the biotechnology industry more than 40 years ago and have grown to be one of the world’s leading independent biotechnology companies. Our robust pipeline includes potential first-in-class medicines at all stages of development.
Our principal products are Prolia, ENBREL, XGEVA, Repatha, Otezla, TEPEZZA, EVENITY, KYPROLIS, Nplate, Aranesp, BLINCYTO, KRYSTEXXA, Vectibix and TEZSPIRE. We also market a number of other products, including but not limited to AMJEVITA/AMGEVITA, MVASI, Neulasta, RAVICTI, UPLIZNA, Parsabiv, LUMAKRAS/LUMYKRAS, Aimovig, TAVNEOS, PROCYSBI, EPOGEN and IMDELLTRA. For additional information about our products, see Part I, Item 1. Business—Marketing, Distribution and Selected Marketed Products.
Our strategy is the integrated set of actions we take to improve our competitive position in the industry. In 2024, we advanced our innovative pipeline; generated strong sales growth across our product portfolio and regions; and expanded our world-class manufacturing network. We accomplished these objectives while maintaining a strategic and disciplined approach to capital allocation.
We received regulatory approvals for BLINCYTO in CD19-positive Philadelphia chromosome-negative B-ALL and IMDELLTRA in extensive-stage small cell lung cancer (ES-SCLC) and reported five Phase 3 data readouts, including for BLINCYTO, UPLIZNA, rocatinlimab and TEZSPIRE, as well as MariTide Phase 2 top-line results. For more information on our pipeline and clinical development updates, see Part I, Item 1. Business—Research and Development and Selected Product Candidates, and Part I, Item 1. Business—Significant Developments.
Total product sales increased in 2024, primarily driven by volume growth of 23%, partially offset by declines in net selling price of 2%. Product sales from acquired Horizon products contributed $4.2 billion in 2024 compared to $954 million in 2023, with volume growth from our other brands of 11%.
Cash flows from operating activities in 2024 totaled $11.5 billion, which supported investment in our business, including capital expenditures of $1.1 billion to enhance and expand our manufacturing network, and allowed us to both reduce our debt outstanding and return capital to shareholders through the payment of cash dividends. For 2024, we increased our quarterly cash dividend by 6% to $2.25 per share of common stock. In December 2024, the Board of Directors declared a cash dividend of
$2.38 per share of common stock for the first quarter of 2025, an increase of 6% over the same period in the prior year, to be paid in March 2025.
Amgen’s approach to and investment in human capital resource management is directed at attracting, motivating, developing and retaining talent to tackle the challenges of running an enterprise focused on the discovery, development and commercialization of innovative medicines. Our compensation, benefits and development programs are designed to encourage performance, promote accountability and adherence to Company values, and align with the interests of the Company’s shareholders. In our effort to attract and retain the best talent, we seek out and support talent across the globe. Further, we believe that an inclusive culture helps attract and retain a strong and engaged workforce informed by the varied backgrounds and experiences represented, which fosters innovation, collaboration and productivity as we execute on our mission to serve patients. For further information on these and other efforts, see Part I, Item 1. Business—Human Capital Resources.
We have a long-standing ambition to be environmentally responsible, and we regularly set targets to challenge ourselves to deliver further improvements. To continue on our path to greater environmental sustainability, in January 2021 we announced a new set of long-term environmental targets to achieve by 2027, including achieving carbon neutrality, reducing water consumption by 40% and reducing waste disposed by 75%.2,3
Our long-term success depends, to a great extent, on our ability to continue to discover, develop and commercialize innovative products and acquire or collaborate on therapies currently in development by other companies. We must grow sales from existing and new products to achieve revenue growth and to offset revenue losses caused by products’ loss of their exclusivity or launches of competing products. For example, our patents for RANKL antibodies, including sequences, for Prolia and XGEVA expire in February 2025 in the United States and in November 2025 in select countries in Europe. Certain of our products face increasing pressure from competition, including biosimilars and generics. For additional information, including information on the expirations of patents for various products, see Part I, Item 1. Business—Marketing, Distribution and Selected Marketed Products—Patents, and Part I, Item 1. Business—Marketing, Distribution and Selected Marketed Products—Competition. We devote considerable resources to R&D activities, but successful product development in the biotechnology industry is highly uncertain. We also face increasing regulatory scrutiny of safety and efficacy both before and after products launch.
Macroeconomic and other challenges
Uncertain macroeconomic conditions, including the risk of inflation, tariffs or trade protection measures, higher interest rates and instability in the financial system, as well as rising healthcare costs, continue to pose challenges to our business. Further, ongoing geopolitical conflicts continue to create additional uncertainty in global macroeconomic conditions. Additionally, with public and private healthcare-provider focus, the industry continues to be subject to cost containment measures and significant pricing pressures, resulting in net price declines. Moreover, provisions of the IRA, as well as the 340B Program, have affected, and are likely to continue to affect, our business. For example, ENBREL and Otezla have been selected by CMS for Medicare price setting beginning in 2026 and 2027, respectively. Finally, wholesale and end-user buying patterns can affect our product sales. These buying patterns can cause fluctuations in quarterly product sales, but have generally not been significant to date when comparing full-year product performance to the prior year. See Part I, Item 1. Business—Marketing, Distribution and Selected Marketed Products, and Part I, Item 1A. Risk Factors for further discussion of certain factors that could impact our future product sales.
2 Represents reductions against established baselines, taking into account only verified reduction projects and does not take into account changes associated with contraction or expansion of the Company.
3 Carbon neutrality goal refers to Scopes 1 and 2.
Selected Financial Information
The following is an overview of our results of operations (in millions, except percentages and per-share data):
| | | | | | | | | | | | | | | | | |
| Year ended December 31, 2024 | | Change | | Year ended December 31, 2023 |
| Product sales: | | | | | |
| U.S. | $ | 23,301 | | | 21 | % | | $ | 19,272 | |
| ROW | 8,725 | | | 14 | % | | 7,638 | |
| Total product sales | 32,026 | | | 19 | % | | 26,910 | |
| Other revenues | 1,398 | | | 9 | % | | 1,280 | |
| Total revenues | $ | 33,424 | | | 19 | % | | $ | 28,190 | |
| Operating expenses | $ | 26,166 | | | 29 | % | | $ | 20,293 | |
| Operating income | $ | 7,258 | | | (8) | % | | $ | 7,897 | |
| Net income | $ | 4,090 | | | (39) | % | | $ | 6,717 | |
| Diluted EPS | $ | 7.56 | | | (39) | % | | $ | 12.49 | |
| Diluted shares | 541 | | | 1 | % | | 538 | |
In the following discussion of changes in product sales, any reference to volume growth or decline refers to changes in the purchases of our products by healthcare providers (such as physicians or their clinics), dialysis centers, hospitals and pharmacies. In addition, any reference to increases or decreases in inventory refers to changes in inventory held by wholesaler customers and end users (such as pharmacies).
Total product sales increased 19% in 2024, primarily driven by volume growth of 23%, partially offset by declines in net selling price of 2%. U.S. volume grew 26% and ROW volume grew 17%. Product sales from acquired Horizon products contributed $4.2 billion in 2024 compared to $954 million in 2023, with volume growth of 11% from our other brands, including Repatha, TEZSPIRE, EVENITY, BLINCYTO and Prolia.
For 2025, we expect volume growth from certain brands to be partially offset by net selling price declines. Further, the first quarter of a year historically represents the lowest product sales quarter for the year, in part due to plan changes, insurance reverifications and higher co-pay expenses as U.S. patients work through deductibles, particularly for products acquired through pharmacy benefit programs.
Uncertain macroeconomic conditions, changes in the healthcare ecosystem and geopolitical conflicts have the potential to introduce variability into product sales. Furthermore, product sales continue to be impacted by actions from governments and other entities to curb high inflation, provisions of the IRA, inappropriate expanded utilization of the 340B Program and growth in numbers of Medicaid enrollees and uninsured individuals. See Risk Factors in Part I, Item 1A. of this Form 10-K.
Other revenues increased for 2024, primarily driven by higher corporate partner revenue from licensed products and royalty income.
Operating expenses increased for 2024, driven by higher amortization expense from Horizon acquisition-related assets, higher R&D and SG&A expenses, including expenses from the acquired Horizon business, and higher profit share and royalty expense.
Results of Operations
Product sales
Worldwide product sales were as follows (dollar amounts in millions):
| | | | | | | | | | | | | | | | | | | | | | | | | | | | | |
| Year ended December 31, 2024 | | Change | | Year ended December 31, 2023 | | Change | | Year ended December 31, 2022 |
| Prolia | $ | 4,374 | | | 8 | % | | $ | 4,048 | | | 12 | % | | $ | 3,628 | |
| ENBREL | 3,316 | | | (10) | % | | 3,697 | | | (10) | % | | 4,117 | |
| XGEVA | 2,225 | | | 5 | % | | 2,112 | | | 5 | % | | 2,014 | |
| Repatha | 2,222 | | | 36 | % | | 1,635 | | | 26 | % | | 1,296 | |
| Otezla | 2,126 | | | (3) | % | | 2,188 | | | (4) | % | | 2,288 | |
TEPEZZA(1) | 1,851 | | | * | | 448 | | | N/A | | — | |
| EVENITY | 1,563 | | | 35 | % | | 1,160 | | | 47 | % | | 787 | |
| KYPROLIS | 1,503 | | | 7 | % | | 1,403 | | | 13 | % | | 1,247 | |
| Nplate | 1,456 | | | (1) | % | | 1,477 | | | 13 | % | | 1,307 | |
| Aranesp | 1,342 | | | (1) | % | | 1,362 | | | (4) | % | | 1,421 | |
| BLINCYTO | 1,216 | | | 41 | % | | 861 | | | 48 | % | | 583 | |
KRYSTEXXA(1) | 1,185 | | | * | | 272 | | | N/A | | — | |
| Vectibix | 1,045 | | | 6 | % | | 984 | | | 10 | % | | 893 | |
| TEZSPIRE | 972 | | | 71 | % | | 567 | | | * | | 170 | |
Other products(2) | 5,630 | | | 20 | % | | 4,696 | | | (7) | % | | 5,050 | |
| Total product sales | $ | 32,026 | | | 19 | % | | $ | 26,910 | | | 9 | % | | $ | 24,801 | |
| Total U.S. | $ | 23,301 | | | 21 | % | | $ | 19,272 | | | 9 | % | | $ | 17,743 | |
| Total ROW | 8,725 | | | 14 | % | | 7,638 | | | 8 | % | | 7,058 | |
| Total product sales | $ | 32,026 | | | 19 | % | | $ | 26,910 | | | 9 | % | | $ | 24,801 | |
* Change in excess of 100%
N/A = not applicable
____________
(1) TEPEZZA and KRYSTEXXA were acquired from our Horizon acquisition on October 6, 2023, and include product sales in the periods after the acquisition date.
(2) Consists of product sales of our non-principal products.
Future sales of our products will depend in part on the factors discussed in the Overview, Part I, Item 1. Business—Marketing, Distribution and Selected Marketed Products—Competition, Part I, Item 1. Business—Reimbursement, Part I, Item 1A. Risk Factors, and any additional factors discussed in the individual product sections below. In addition, for a list of our products’ significant competitors, see Part I, Item 1. Business—Marketing, Distribution and Selected Marketed Products—Competition.
Prolia
Total Prolia sales by geographic region were as follows (dollar amounts in millions):
| | | | | | | | | | | | | | | | | | | | | | | | | | | | | |
| Year ended December 31, 2024 | | Change | | Year ended December 31, 2023 | | Change | | Year ended December 31, 2022 |
| Prolia — U.S. | $ | 2,885 | | | 6 | % | | $ | 2,733 | | | 11 | % | | $ | 2,465 | |
| Prolia — ROW | 1,489 | | | 13 | % | | 1,315 | | | 13 | % | | 1,163 | |
| Total Prolia | $ | 4,374 | | | 8 | % | | $ | 4,048 | | | 12 | % | | $ | 3,628 | |
The increase in global Prolia sales for 2024 was driven by volume growth.
The increase in global Prolia sales for 2023 was primarily driven by volume growth and higher net selling price.
As disclosed in Part I, Item 1. Business—Marketing, Distribution and Selected Marketed Products—Patents, our patents for RANKL antibodies, including sequences, for Prolia expire in February 2025 in the United States and in November 2025 in select countries in Europe. For 2025, we expect sales erosion driven by biosimilar competition.
For a discussion of ongoing litigation related to Prolia, see Part IV—Note 20, Contingencies and commitments, to the Consolidated Financial Statements.
ENBREL
Total ENBREL sales by geographic region were as follows (dollar amounts in millions):
| | | | | | | | | | | | | | | | | | | | | | | | | | | | | |
| Year ended December 31, 2024 | | Change | | Year ended December 31, 2023 | | Change | | Year ended December 31, 2022 |
| ENBREL — U.S. | $ | 3,288 | | | (10) | % | | $ | 3,650 | | | (10) | % | | $ | 4,044 | |
| ENBREL — Canada | 28 | | | (40) | % | | 47 | | | (36) | % | | 73 | |
| Total ENBREL | $ | 3,316 | | | (10) | % | | $ | 3,697 | | | (10) | % | | $ | 4,117 | |
The decrease in ENBREL sales for 2024 was driven by lower net selling price. For 2025, we expect ENBREL to follow the historical pattern of lower sales in the first quarter relative to subsequent quarters due to the impact of benefit plan changes, insurance reverification and increased co-pay expenses as U.S. patients work through deductibles. In addition, going forward, we expect relatively flat volumes with continued declines in net selling price, including the impact from the IRA Medicare Part D price set by CMS beginning in 2026.
The decrease in ENBREL sales for 2023 was driven by lower net selling price, lower inventory and unfavorable changes to estimated sales deductions.
XGEVA
Total XGEVA sales by geographic region were as follows (dollar amounts in millions):
| | | | | | | | | | | | | | | | | | | | | | | | | | | | | |
| Year ended December 31, 2024 | | Change | | Year ended December 31, 2023 | | Change | | Year ended December 31, 2022 |
| XGEVA — U.S. | $ | 1,507 | | | (1) | % | | $ | 1,527 | | | 3 | % | | $ | 1,480 | |
| XGEVA — ROW | 718 | | | 23 | % | | 585 | | | 10 | % | | 534 | |
| Total XGEVA | $ | 2,225 | | | 5 | % | | $ | 2,112 | | | 5 | % | | $ | 2,014 | |
The increases in global XGEVA sales for 2024 and 2023 were driven by higher net selling price.
As disclosed in Part I, Item 1. Business—Marketing, Distribution and Selected Marketed Products—Patents, our patents for RANKL antibodies, including sequences, for XGEVA expire in February 2025 in the United States and in November 2025 in select countries in Europe. For 2025, we expect sales erosion driven by biosimilar competition.
For a discussion of ongoing litigation related to XGEVA, see Part IV—Note 20, Contingencies and commitments, to the Consolidated Financial Statements.
Repatha
Total Repatha sales by geographic region were as follows (dollar amounts in millions):
| | | | | | | | | | | | | | | | | | | | | | | | | | | | | |
| Year ended December 31, 2024 | | Change | | Year ended December 31, 2023 | | Change | | Year ended December 31, 2022 |
Repatha — U.S. | $ | 1,139 | | | 44 | % | | $ | 793 | | | 30 | % | | $ | 608 | |
Repatha — ROW | 1,083 | | | 29 | % | | 842 | | | 22 | % | | 688 | |
| Total Repatha | $ | 2,222 | | | 36 | % | | $ | 1,635 | | | 26 | % | | $ | 1,296 | |
The increase in global Repatha sales for 2024 was primarily driven by volume growth of 43%, partially offset by lower net selling price of 10%.
The increase in global Repatha sales for 2023 was driven by volume growth, partially offset by lower net selling price.
For 2025, we expect lower declines in net selling price.
For a discussion of ongoing litigation related to Repatha, see Part IV—Note 20, Contingencies and commitments, to the Consolidated Financial Statements.
Otezla
Total Otezla sales by geographic region were as follows (dollar amounts in millions):
| | | | | | | | | | | | | | | | | | | | | | | | | | | | | |
| Year ended December 31, 2024 | | Change | | Year ended December 31, 2023 | | Change | | Year ended December 31, 2022 |
| Otezla — U.S. | $ | 1,699 | | | (4) | % | | $ | 1,777 | | | (6) | % | | $ | 1,886 | |
| Otezla — ROW | 427 | | | 4 | % | | 411 | | | 2 | % | | 402 | |
| Total Otezla | $ | 2,126 | | | (3) | % | | $ | 2,188 | | | (4) | % | | $ | 2,288 | |
The decrease in global Otezla sales for 2024 was primarily driven by lower net selling price of 8%, partially offset by volume growth of 3%. For 2025, we expect Otezla to follow the historical pattern of lower sales in the first quarter relative to subsequent quarters due to the impact of benefit plan changes, insurance reverification and increased co-pay expenses as U.S. patients work through deductibles. In January 2025, Otezla was selected by CMS for Medicare price setting that will be applicable beginning on January 1, 2027.
The decrease in global Otezla sales for 2023 was driven by lower net selling price and inventory, partially offset by volume growth.
TEPEZZA
Total TEPEZZA sales by geographic region were as follows (dollar amounts in millions):
| | | | | | | | | | | | | | | | | | | | | | | | | | | | | |
| Year ended December 31, 2024 | | Change | | Year ended December 31, 2023 | | Change | | Year ended December 31, 2022 |
| TEPEZZA — U.S. | $ | 1,835 | | | * | | $ | 441 | | | N/A | | $ | — | |
| TEPEZZA — ROW | 16 | | | * | | 7 | | | N/A | | — | |
| Total TEPEZZA | $ | 1,851 | | | * | | $ | 448 | | | N/A | | $ | — | |
* Change in excess of 100%
N/A = not applicable
TEPEZZA was acquired on October 6, 2023 from our Horizon acquisition and generated $1.9 billion and $448 million in product sales for 2024 and 2023, respectively. As TEPEZZA was acquired on October 6, 2023, there were no recorded product sales in the periods prior to the acquisition date.
EVENITY
Total EVENITY sales by geographic region were as follows (dollar amounts in millions):
| | | | | | | | | | | | | | | | | | | | | | | | | | | | | |
| Year ended December 31, 2024 | | Change | | Year ended December 31, 2023 | | Change | | Year ended December 31, 2022 |
| EVENITY — U.S. | $ | 1,131 | | | 40 | % | | $ | 809 | | | 52 | % | | $ | 533 | |
| EVENITY — ROW | 432 | | | 23 | % | | 351 | | | 38 | % | | 254 | |
| Total EVENITY | $ | 1,563 | | | 35 | % | | $ | 1,160 | | | 47 | % | | $ | 787 | |
The increases in global EVENITY sales for 2024 and 2023 were driven by volume growth.
KYPROLIS
Total KYPROLIS sales by geographic region were as follows (dollar amounts in millions):
| | | | | | | | | | | | | | | | | | | | | | | | | | | | | |
| Year ended December 31, 2024 | | Change | | Year ended December 31, 2023 | | Change | | Year ended December 31, 2022 |
| KYPROLIS — U.S. | $ | 948 | | | 3 | % | | $ | 921 | | | 8 | % | | $ | 850 | |
| KYPROLIS — ROW | 555 | | | 15 | % | | 482 | | | 21 | % | | 397 | |
| Total KYPROLIS | $ | 1,503 | | | 7 | % | | $ | 1,403 | | | 13 | % | | $ | 1,247 | |
The increase in global KYPROLIS sales for 2024 was driven by volume growth outside the United States.
The increase in global KYPROLIS sales for 2023 was driven by volume growth.
Nplate
Total Nplate sales by geographic region were as follows (dollar amounts in millions):
| | | | | | | | | | | | | | | | | | | | | | | | | | | | | |
| Year ended December 31, 2024 | | Change | | Year ended December 31, 2023 | | Change | | Year ended December 31, 2022 |
| Nplate — U.S. | $ | 970 | | | (3) | % | | $ | 996 | | | 17 | % | | $ | 848 | |
| Nplate — ROW | 486 | | | 1 | % | | 481 | | | 5 | % | | 459 | |
| Total Nplate | $ | 1,456 | | | (1) | % | | $ | 1,477 | | | 13 | % | | $ | 1,307 | |
Global Nplate sales for 2024 decreased 1% and included U.S. government orders of $128 million and $286 million for 2024 and 2023, respectively. Excluding the U.S. government orders from this comparison, global Nplate sales increased 12% for 2024, driven by volume growth of 8% and higher net selling price of 6%.
The increase in global Nplate sales for 2023 was primarily driven by volume growth, including U.S. government orders totaling $286 million.
Aranesp
Total Aranesp sales by geographic region were as follows (dollar amounts in millions):
| | | | | | | | | | | | | | | | | | | | | | | | | | | | | |
| Year ended December 31, 2024 | | Change | | Year ended December 31, 2023 | | Change | | Year ended December 31, 2022 |
| Aranesp — U.S. | $ | 386 | | | (15) | % | | $ | 452 | | | (13) | % | | $ | 521 | |
| Aranesp — ROW | 956 | | | 5 | % | | 910 | | | 1 | % | | 900 | |
| Total Aranesp | $ | 1,342 | | | (1) | % | | $ | 1,362 | | | (4) | % | | $ | 1,421 | |
Global Aranesp sales for 2024 remained relatively unchanged as unfavorable changes to both estimated sales deductions and foreign currency exchange rates were offset by volume growth outside the United States.
The decrease in global Aranesp sales for 2023 was driven by unfavorable changes to foreign currency exchange rates and lower net selling price. U.S. Aranesp sales for 2023 decreased due to lower unit demand as a result of independent and medium-sized dialysis organizations transitioning from Aranesp to EPOGEN.
BLINCYTO
Total BLINCYTO sales by geographic region were as follows (dollar amounts in millions):
| | | | | | | | | | | | | | | | | | | | | | | | | | | | | |
| Year ended December 31, 2024 | | Change | | Year ended December 31, 2023 | | Change | | Year ended December 31, 2022 |
| BLINCYTO — U.S. | $ | 800 | | | 41 | % | | $ | 566 | | | 68 | % | | $ | 336 | |
| BLINCYTO — ROW | 416 | | | 41 | % | | 295 | | | 19 | % | | 247 | |
| Total BLINCYTO | $ | 1,216 | | | 41 | % | | $ | 861 | | | 48 | % | | $ | 583 | |
The increases in global BLINCYTO sales for 2024 and 2023 were primarily driven by volume growth.
KRYSTEXXA
Total KRYSTEXXA sales by geographic region were as follows (dollar amounts in millions):
| | | | | | | | | | | | | | | | | | | | | | | | | | | | | |
| Year ended December 31, 2024 | | Change | | Year ended December 31, 2023 | | Change | | Year ended December 31, 2022 |
| KRYSTEXXA — U.S. | $ | 1,185 | | | * | | $ | 272 | | | N/A | | $ | — | |
| KRYSTEXXA — ROW | — | | | N/A | | — | | | N/A | | — | |
| Total KRYSTEXXA | $ | 1,185 | | | * | | $ | 272 | | | N/A | | $ | — | |
* Change in excess of 100%
N/A = not applicable
KRYSTEXXA was acquired on October 6, 2023 from our Horizon acquisition and generated $1.2 billion and $272 million in product sales for 2024 and 2023, respectively. As KRYSTEXXA was acquired on October 6, 2023, there were no recorded product sales in the periods prior to the acquisition date.
Vectibix
Total Vectibix sales by geographic region were as follows (dollar amounts in millions):
| | | | | | | | | | | | | | | | | | | | | | | | | | | | | |
| Year ended December 31, 2024 | | Change | | Year ended December 31, 2023 | | Change | | Year ended December 31, 2022 |
| Vectibix — U.S. | $ | 519 | | | 13 | % | | $ | 461 | | | 16 | % | | $ | 396 | |
| Vectibix — ROW | 526 | | | 1 | % | | 523 | | | 5 | % | | 497 | |
| Total Vectibix | $ | 1,045 | | | 6 | % | | $ | 984 | | | 10 | % | | $ | 893 | |
The increase in global Vectibix sales for 2024 was driven by higher net selling price of 8% and volume growth of 4%, partially offset by unfavorable changes to foreign currency exchange rates.
The increase in global Vectibix sales for 2023 was driven by volume growth.
TEZSPIRE
Total TEZSPIRE sales by geographic region were as follows (dollar amounts in millions):
| | | | | | | | | | | | | | | | | | | | | | | | | | | | | |
| Year ended December 31, 2024 | | Change | | Year ended December 31, 2023 | | Change | | Year ended December 31, 2022 |
| TEZSPIRE — U.S. | $ | 972 | | | 71 | % | | $ | 567 | | | * | | $ | 170 | |
* Change in excess of 100%
The increases in TEZSPIRE sales for 2024 and 2023 were primarily driven by volume growth.
Other products
Other product sales by geographic region were as follows (dollar amounts in millions):
| | | | | | | | | | | | | | | | | | | | | | | | | | | | | |
| Year ended December 31, 2024 | | Change | | Year ended December 31, 2023 | | Change | | Year ended December 31, 2022 |
| AMJEVITA — U.S. | $ | 202 | | | 60 | % | | $ | 126 | | | N/A | | $ | — | |
AMGEVITA — ROW | 559 | | | 12 | % | | 500 | | | 9 | % | | 460 | |
| MVASI — U.S. | 449 | | | (12) | % | | 511 | | | (15) | % | | 602 | |
| MVASI — ROW | 278 | | | (4) | % | | 289 | | | (3) | % | | 299 | |
| Neulasta — U.S. | 318 | | | (55) | % | | 710 | | | (26) | % | | 959 | |
| Neulasta — ROW | 113 | | | (18) | % | | 138 | | | (17) | % | | 167 | |
RAVICTI — U.S.(1) | 396 | | * | | 86 | | | N/A | | — | |
RAVICTI — ROW(1) | 16 | | | * | | 1 | | | N/A | | — | |
UPLIZNA — U.S.(1) | 314 | | | * | | 60 | | | N/A | | — | |
UPLIZNA — ROW(1) | 65 | | | * | | 5 | | | N/A | | — | |
| Parsabiv — U.S. | 203 | | | (11) | % | | 228 | | | (10) | % | | 253 | |
| Parsabiv— ROW | 153 | | | 14 | % | | 134 | | | 4 | % | | 129 | |
LUMAKRAS — U.S. | 214 | | | 9 | % | | 197 | | | (11) | % | | 222 | |
LUMYKRAS — ROW | 136 | | | 64 | % | | 83 | | | 32 | % | | 63 | |
| Aimovig — U.S. | 308 | | | 2 | % | | 303 | | | (24) | % | | 398 | |
| Aimovig — ROW | 21 | | | 5 | % | | 20 | | | 25 | % | | 16 | |
| TAVNEOS — U.S. | 256 | | | * | | 126 | | | * | | 16 | |
| TAVNEOS — ROW | 27 | | | * | | 8 | | | 60 | % | | 5 | |
PROCYSBI — U.S.(1) | 221 | | * | | 49 | | | N/A | | — | |
PROCYSBI — ROW(1) | 8 | | | * | | 1 | | | N/A | | — | |
| EPOGEN — U.S. | 125 | | | (45) | % | | 226 | | | (55) | % | | 506 | |
| IMDELLTRA — U.S. | 115 | | | N/A | | — | | | N/A | | — | |
Other — U.S.(2) | 916 | | | 34 | % | | 685 | | | 5 | % | | 650 | |
Other — ROW(2) | 217 | | | 3 | % | | 210 | | | (31) | % | | 305 | |
| Total other product sales | $ | 5,630 | | | 20 | % | | $ | 4,696 | | | (7) | % | | $ | 5,050 | |
| Total U.S. — other products | $ | 4,037 | | | 22 | % | | $ | 3,307 | | | (8) | % | | $ | 3,606 | |
| Total ROW — other products | 1,593 | | | 15 | % | | 1,389 | | | (4) | % | | 1,444 | |
| Total other product sales | $ | 5,630 | | | 20 | % | | $ | 4,696 | | | (7) | % | | $ | 5,050 | |
N/A = not applicable
* Change in excess of 100%
____________
(1) RAVICTI, UPLIZNA and PROCYSBI were acquired from our Horizon acquisition on October 6, 2023, and include product sales in the periods after the acquisition date.
(2) Consists of product sales from (i) KANJINTI, RIABNI, AVSOLA, NEUPOGEN, Corlanor, IMLYGIC, BEKEMV, PAVBLU, WEZLANA/WEZENLA and Sensipar/Mimpara; and (ii) ACTIMMUNE, RAYOS, BUPHENYL, QUINSAIR, PENNSAID and DUEXIS in the periods after our Horizon acquisition on October 6, 2023.
Operating expenses
Operating expenses were as follows (dollar amounts in millions):
| | | | | | | | | | | | | | | | | | | | | | | | | | | | | |
| Year ended December 31, 2024 | | Change | | Year ended December 31, 2023 | | Change | | Year ended December 31, 2022 |
| Cost of sales | $ | 12,858 | | | 52 | % | | $ | 8,451 | | | 32 | % | | $ | 6,406 | |
| % of product sales | 40.1 | % | | | | 31.4 | % | | | | 25.8 | % |
| % of total revenues | 38.5 | % | | | | 30.0 | % | | | | 24.3 | % |
| Research and development | $ | 5,964 | | | 25 | % | | $ | 4,784 | | | 8 | % | | $ | 4,434 | |
| % of product sales | 18.6 | % | | | | 17.8 | % | | | | 17.9 | % |
| % of total revenues | 17.8 | % | | | | 17.0 | % | | | | 16.8 | % |
| | | | | | | | | |
| | | | | | | | | |
| | | | | | | | | |
| Selling, general and administrative | $ | 7,096 | | | 15 | % | | $ | 6,179 | | | 14 | % | | $ | 5,414 | |
| % of product sales | 22.2 | % | | | | 23.0 | % | | | | 21.8 | % |
| % of total revenues | 21.2 | % | | | | 21.9 | % | | | | 20.6 | % |
| Other | $ | 248 | | | (72) | % | | $ | 879 | | | 75 | % | | $ | 503 | |
| Total operating expenses | $ | 26,166 | | | 29 | % | | $ | 20,293 | | | 21 | % | | $ | 16,757 | |
Cost of sales
Cost of sales increased to 38.5% of total revenues for 2024, driven by higher amortization expense from Horizon acquisition-related assets and, to a lesser extent, higher profit share and royalty expense, partially offset by the prior year impact of the 2022 Puerto Rico tax law change that replaced an excise tax with an income tax beginning in 2023. For 2024, the unfavorable impact from product sales mix of certain Amgen products was offset by the favorable impact on product sales mix of the addition of acquired Horizon products. See Part IV—Note 4, Acquisitions and divestitures, and Note 7, Income taxes, to the Consolidated Financial Statements.
Cost of sales increased to 30.0% of total revenues for 2023, driven by higher amortization expense from acquisition-related assets primarily associated with the Horizon acquisition, higher profit share and royalty expense and changes in our product sales mix, partially offset by the impact of the 2022 Puerto Rico tax law change.
Research and development
The Company groups all of its R&D activities and related expenditures into three categories: (i) research and early pipeline, (ii) later-stage clinical programs and (iii) marketed products. These categories are described below:
| | | | | | | | |
| Category | | Description |
| Research and early pipeline | | R&D expenses incurred in activities substantially in support of early research through the completion of phase 1 clinical trials, including drug discovery, toxicology, pharmacokinetics and drug metabolism and process development |
| Later-stage clinical programs | | R&D expenses incurred in or related to phase 2 and phase 3 clinical programs intended to result in registration of a new product or a new indication for an existing product primarily in the United States or the EU |
| Marketed products | | R&D expenses incurred in support of the Company’s marketed products that are authorized to be sold primarily in the United States or the EU. Includes clinical trials designed to gather information on product safety (certain of which may be required by regulatory authorities) and their product characteristics after regulatory approval has been obtained, as well as the costs of obtaining regulatory approval of a product in a new market after approval in either the United States or the EU has been obtained |
R&D expense by category was as follows (in millions):
| | | | | | | | | | | | | | | | | |
| Years ended December 31, |
| 2024 | | 2023 | | 2022 |
| Research and early pipeline | $ | 1,534 | | | $ | 1,584 | | | $ | 1,611 | |
| Later-stage clinical programs | 2,830 | | | 1,898 | | | 1,627 | |
| Marketed products | 1,600 | | | 1,302 | | | 1,196 | |
| Total R&D expense | $ | 5,964 | | | $ | 4,784 | | | $ | 4,434 | |
The increase in R&D expense for 2024 was driven by higher spend in later-stage clinical programs and marketed product support, including Horizon-acquired programs. We expect to continue to grow our spend on later-stage clinical programs as we advance our pipeline.
The increase in R&D expense for 2023 was driven by higher spend in later-stage clinical programs and marketed product support, including Horizon-acquired programs.
Selling, general and administrative
The increase in SG&A expense for 2024 was primarily driven by expenses from the acquired Horizon business and other commercial expenses, partially offset by lower acquisition-related expenses related to the Horizon acquisition incurred in 2024.
The increase in SG&A expense for 2023 was primarily driven by acquisition-related expenses, in addition to commercial and general and administrative expenses related to the Horizon acquisition, partially offset by lower spend for other marketed products.
Other
Other operating expenses for 2024 primarily consisted of impairment charges associated with IPR&D intangible assets related to our Teneobio acquisition in 2021 and expenses related to cost-savings initiatives incurred in 2024.
Other operating expenses for 2023 primarily consisted of a net IPR&D intangible asset impairment charge for AMG 340 and expenses related to our restructuring plan that were both initiated and substantially completed in 2023.
Other operating expenses for 2022 primarily consisted of a loss on the divestiture of Gensenta.
Nonoperating expenses/income and income taxes
Nonoperating expenses/income and income taxes were as follows (dollar amounts in millions):
| | | | | | | | | | | | | | | | | |
| Years ended December 31, |
| 2024 | | 2023 | | 2022 |
| Interest expense, net | $ | (3,155) | | | $ | (2,875) | | | $ | (1,406) | |
| Other income (expense), net | $ | 506 | | | $ | 2,833 | | | $ | (814) | |
| Provision for income taxes | $ | 519 | | | $ | 1,138 | | | $ | 794 | |
| Effective tax rate | 11.3 | % | | 14.5 | % | | 10.8 | % |
Interest expense, net
The increases in Interest expense, net, in 2024 and 2023 over the respective prior years were primarily due to higher average debt outstanding and higher weighted-average fixed and floating interest rates on the debt. See Part IV—Note 16, Financing arrangements, to the Consolidated Financial Statements.
Other income (expense), net
The change in Other income (expense), net, for 2024 was primarily due to current year net unrealized losses on our strategic equity investments compared with net unrealized gains in the prior year, as well as reduced interest income as a result of lower average cash balances. The 2023 net unrealized gains on our strategic equity investments were principally composed of amounts recognized on our BeiGene investment in the first quarter of 2023 as a result of a change from the equity method of accounting to recording this investment at fair value with changes in fair value recognized in earnings. See Part IV—Note 10, Investments, to the Consolidated Financial Statements.
The change in Other income (expense), net, for 2023 was primarily due to gains recognized in connection with recording our BeiGene investment at fair value and an increase in interest income due to higher average cash balances and higher interest rates as compared to the prior year.
Income taxes
The decrease in our effective tax rate for 2024 compared with 2023 was primarily due to a change in earnings mix, including the net unrealized impact of our strategic equity investments, partially offset by the deferred tax adjustments associated with U.S. minimum tax on the earnings of our foreign subsidiaries.
As previously reported, the OECD reached an agreement to align countries on a minimum corporate tax rate and an expansion of the taxing rights of market countries. As of January 1, 2025, select individual countries, including the United Kingdom, EU member countries and Singapore, have enacted the global minimum tax agreement. Our legal entities in the countries that have enacted the agreement, along with their direct and indirect subsidiaries, are now subject to a 15% minimum tax rate on adjusted financial statement income. Other countries, including the United States and the U.S. territory of Puerto Rico, have not yet enacted the OECD agreement and implementation remains highly uncertain. The continued enactment of the agreement, either by all OECD participants or unilaterally by individual countries, could result in tax increases or double taxation in the United States or foreign jurisdictions.
A 2022 Puerto Rico tax law change replaced the excise tax with an income tax, beginning in 2023. As of January 1, 2023, we are no longer subject to a 4% excise tax in the U.S. territory of Puerto Rico on the gross intercompany purchase price of goods and services from our manufacturer in Puerto Rico. We qualify for and are subject to the alternative income tax rate on industrial development income of our Puerto Rico affiliate. In the United States, this income tax qualifies for foreign tax credits under the U.S. Treasury final foreign tax credit regulations. See Part IV—Note 7, Income taxes, to the Consolidated Financial Statements for further discussion.
In 2017, we received an RAR and a modified RAR from the IRS for the years 2010–2012, proposing significant adjustments that primarily relate to the allocation of profits between certain of our entities in the United States and the U.S. territory of Puerto Rico. We disagreed with the proposed adjustments and calculations and pursued resolution with the IRS appeals office but were unable to reach resolution. In July 2021, we filed a petition in the U.S. Tax Court to contest two duplicate Statutory Notices of Deficiency (Notices) for the years 2010–2012 that we received in May and July 2021, which seek to increase our U.S. taxable income for the years 2010–2012 by an amount that would result in additional federal tax of approximately $3.6 billion plus interest. Any additional tax that could be imposed for the years 2010–2012 would be reduced by up to approximately $900 million of repatriation tax previously accrued on our foreign earnings.
In 2020, we received an RAR and a modified RAR from the IRS for the years 2013–2015, also proposing significant adjustments that primarily relate to the allocation of profits between certain of our entities in the United States and the U.S. territory of Puerto Rico similar to those proposed for the years 2010–2012. We disagreed with the proposed adjustments and calculations and pursued resolution with the IRS appeals office but were unable to reach resolution. In July 2022, we filed a petition in the U.S. Tax Court to contest a Notice for the years 2013–2015 that we previously reported receiving in April 2022 that seeks to increase our U.S. taxable income for the years 2013–2015 by an amount that would result in additional federal tax of approximately $5.1 billion, plus interest. In addition, the Notice asserts penalties of approximately $2.0 billion. Any additional tax that could be imposed for the years 2013–2015 would be reduced by up to approximately $2.2 billion of repatriation tax previously accrued on our foreign earnings.
We firmly believe that the IRS positions set forth in the 2010–2012 and 2013–2015 Notices are without merit. We are contesting the 2010–2012 and 2013–2015 Notices through the judicial process. The two cases were consolidated in the U.S. Tax Court on December 19, 2022. The trial began on November 4, 2024 and concluded on January 17, 2025. With the conclusion of the trial, the parties will file post-trial briefs and make closing arguments in 2025. The Company expects a decision from the U.S. Tax Court no earlier than 2026.
We are currently under examination by the IRS for the years 2016–2018 with respect to issues similar to those for the 2010 through 2015 period. We believe that the IRS may also seek to continue to audit similar issues related to the allocation of income between the United States and the U.S. territory of Puerto Rico for years beyond 2018. In addition, we are under examination by a number of state and foreign tax jurisdictions.
Final resolution of these complex matters is not likely within the next 12 months. We continue to believe our accrual for income tax liabilities is appropriate based on past experience, interpretations of tax law, application of the tax law to our facts and judgments about potential actions by tax authorities; however, due to the complexity of the provision for income taxes and uncertain resolution of these matters, the ultimate outcome of any tax matters may result in payments substantially greater than amounts accrued and could have a material adverse impact on our consolidated financial statements.
See Part I, Item 1A. Risk Factors—We could be subject to additional tax liabilities, including from an adverse outcome in our ongoing tax dispute with the IRS and other tax examinations, enactment of the OECD minimum corporate tax rate agreement and the adoption and interpretation of new tax legislation, and we anticipate additional tax liabilities from certain provisions of the 2017 Tax Act that will go into effect in 2026; such tax liabilities could adversely affect our profitability and results of operations; Part II, Item 7. Management’s Discussion and Analysis or Financial Condition and Results of Operations—Critical Accounting Policies and Estimates, Income taxes; and Part IV—Note 7, Income taxes, to the Consolidated Financial Statements for further discussion.
Financial Condition, Liquidity and Capital Resources
Selected financial data was as follows (in millions):
| | | | | | | | | | | |
| December 31, |
| 2024 | | 2023 |
| Cash and cash equivalents | $ | 11,973 | | | $ | 10,944 | |
| Total assets | $ | 91,839 | | | $ | 97,154 | |
| Current portion of long-term debt | $ | 3,550 | | | $ | 1,443 | |
| Long-term debt | $ | 56,549 | | | $ | 63,170 | |
| Stockholders’ equity | $ | 5,877 | | | $ | 6,232 | |
Cash and cash equivalents
Our balance of cash and cash equivalents was $12.0 billion on December 31, 2024. The primary objective of our investment portfolio is to maintain safety of principal, prudent levels of liquidity and acceptable levels of risk. Our investment policy limits interest-bearing security investments to certain types of debt and money market instruments issued by institutions with primarily investment-grade credit ratings, and it places restrictions on maturities and concentration by asset class and issuer.
Capital allocation
Consistent with the objective to optimize our capital structure, we deploy our accumulated cash balances in a strategic manner and consider a number of alternatives, including investments in innovation both internally and externally (including investments that expand our portfolio of products in areas of therapeutic interest), capital expenditures, repayment of debt, payment of dividends and stock repurchases.
We intend to continue investing in our business while reducing our debt and returning capital to stockholders through the payment of cash dividends and stock repurchases. This reflects our desire to optimize our cost of capital and our confidence in the future cash flows of our business. The timing and amount of future dividends and stock repurchases will vary based on a number of factors, including future capital requirements for strategic transactions, debt levels and debt service requirements, our credit rating, availability of financing on acceptable terms, changes to applicable tax laws or corporate laws, changes to our business model and periodic determination by our Board of Directors that cash dividends and/or stock repurchases are in the best interests of stockholders and are in compliance with applicable laws and the Company’s agreements. In addition, the timing and amount of stock repurchases may also be affected by our overall level of cash, stock price and blackout periods, during which we are restricted from repurchasing stock. The manner of stock repurchases may include block purchases, tender offers, ASRs and market transactions.
The Board of Directors declared quarterly cash dividends of $2.25, $2.13 and $1.94 per share of common stock paid in 2024, 2023 and 2022, respectively, reflecting year-over-year increases of 6% and 10% for 2024 and 2023, respectively. In December 2024, the Board of Directors declared a cash dividend of $2.38 per share of common stock for the first quarter of 2025, an increase of 6% over the same period in the prior year, to be paid in March 2025.
We also returned capital to stockholders through our stock repurchase program. During 2024, we repurchased $200 million of common stock under the stock repurchase program. During 2023, we did not repurchase any of our common stock under the stock repurchase program. During 2022, we repurchased $6.3 billion of common stock, including $6.0 billion under ASR agreements and had cash settlements for stock repurchases of $6.4 billion. As of December 31, 2024, $6.8 billion remained available under the stock repurchase program.
As a result of stock repurchases and quarterly dividend payments, we had an accumulated deficit as of December 31, 2024 and 2023. Our accumulated deficit is not anticipated to affect our future ability to operate, repurchase stock, pay dividends or repay our debt given our expected continued profitability and strong financial position.
We believe that existing funds, cash generated from operations and existing sources of and access to financing are adequate to satisfy our needs for working capital, capital expenditure and debt service requirements as well as our plans to reduce debt, pay dividends and repurchase stock, and other business initiatives we plan to strategically pursue, including acquisitions and licensing activities. We anticipate that our liquidity needs can be met through a variety of sources, including cash provided by operating activities, borrowings through commercial paper and/or syndicated credit facilities, and access to other domestic and foreign debt markets and equity markets. See Part I, Item 1A. Risk Factors—Global economic conditions may negatively affect us and may magnify certain risks that affect our business.
Financing arrangements
To help meet our liquidity requirements, we have entered into various financing arrangements. The noncurrent portions of our long-term borrowings as of December 31, 2024 and 2023, were $56.5 billion and $63.2 billion, respectively. The carrying values of our long-term borrowings are net of fair value adjustments for interest rate swaps and unamortized discounts, premiums and offering costs. As of December 31, 2024, S&P, Moody’s and Fitch assigned credit ratings to our outstanding senior notes of BBB+, Baa1 and BBB, respectively, which are considered investment grade. Unfavorable changes to these ratings may have an adverse impact on future financings.
In December 2022, in connection with the acquisition of Horizon, we entered into a bridge credit agreement and a term loan credit agreement, which provided for borrowings in the aggregate of $28.5 billion. During 2023, we issued $24.0 billion of debt composed of eight series of notes, terminated the bridge credit agreement and borrowed $4.0 billion under the term loan credit agreement, of which $1.8 billion of borrowings was outstanding as of December 31, 2024. During 2022, we issued debt with an aggregate principal amount of $7.0 billion.
During 2024, debt repayments totaled $3.6 billion, of which $2.2 billion was composed of repayments on our term loans. During 2023, debt repayments totaled $1.5 billion, and we had no debt repayments in 2022. In addition, we opportunistically repurchase our debt when market conditions are favorable. During 2024, 2023 and 2022, we repurchased aggregate principal amounts of our debt of $875 million, $881 million and $378 million, respectively, for aggregate costs of $659 million, $647 million and $297 million, respectively, which resulted in the recognition of gains on extinguishment of debt of $215 million, $225 million and $78 million, respectively, recorded in Other income (expense), net in the Consolidated Statements of Income.
To achieve a desired mix of fixed-rate and floating-rate debt, we entered into interest rate swap contracts that effectively converted a fixed-rate interest coupon for certain of our debt issuances to a floating, SOFR-based coupon over the terms of the respective notes. These interest rate swap contracts qualify and are designated as fair value hedges. As of both December 31, 2024 and 2023, we had interest rate swap contracts with an aggregate notional amount of $6.7 billion.
To hedge our exposure to foreign currency exchange rate risk associated with certain of our long-term notes denominated in foreign currencies, we entered into cross-currency swap contracts, which effectively convert the interest payments and principal repayment of the respective notes from euros, pounds sterling and Swiss francs to U.S. dollars. These cross-currency swap contracts qualify and are designated as cash flow hedges. As of both December 31, 2024 and 2023, we had cross-currency swap contracts with an aggregate notional amount of $2.7 billion.
As of December 31, 2024, our commercial paper program allows us to issue up to $2.5 billion of unsecured commercial paper to fund our working capital needs. During 2024, 2023 and 2022, we did not issue any commercial paper. No commercial paper was outstanding as of December 31, 2024 and 2023.
In 2023, we amended and restated our syndicated, unsecured, revolving credit agreement, under which we may borrow up to $4.0 billion for general corporate purposes, including as a liquidity backstop for our commercial paper program. The commitments under the revolving credit agreement may be increased by up to $1.25 billion with the agreement of the banks. Each bank that is a party to the agreement has an initial commitment term of five years. This term may be extended for up to two additional one-year periods with the agreement of the banks. Annual commitment fees for this agreement are 0.09% of the unused portion of the facility based on our current credit rating. Generally, we would be charged interest for any amounts borrowed under this facility, based on our current credit rating, at (i) SOFR plus 1.01% or (ii) the highest of (A) the administrative agent bank base commercial lending rate, (B) the overnight federal funds rate plus 0.50% or (C) one-month SOFR plus 1.1%. As of December 31, 2024 and 2023, no amounts were outstanding under this facility.
Also in 2023, we filed a shelf registration statement with the SEC that allows us to issue unspecified amounts of debt securities; common stock; preferred stock; warrants to purchase debt securities, common stock, preferred stock or depositary shares; rights to purchase common stock or preferred stock; securities purchase contracts; securities purchase units; and depositary shares. Under this shelf registration statement, all of the securities available for issuance may be offered from time to time, with terms to be determined at the time of issuance. This shelf registration statement expires in February 2026.
Certain of our financing arrangements contain nonfinancial covenants. In addition, our revolving credit agreement and term loan credit agreement include a financial covenant that requires us to maintain a specified minimum interest coverage ratio of (i) the sum of consolidated net income, interest expense, provision for income taxes, depreciation expense, amortization expense, unusual or nonrecurring charges and other noncash items (consolidated earnings before interest, taxes, depreciation and amortization) to (ii) Consolidated Interest Expense, each as defined and described in the respective agreements. We were in compliance with all applicable covenants under these arrangements as of December 31, 2024.
These financing arrangements are more fully discussed in Part IV—Note 16, Financing arrangements, and Note 19, Derivative instruments, to the Consolidated Financial Statements.
Cash flows
Our summarized cash flow activity was as follows (in millions):
| | | | | | | | | | | | | | | | | |
| Years ended December 31, |
| 2024 | | 2023 | | 2022 |
| Net cash provided by operating activities | $ | 11,490 | | | $ | 8,471 | | | $ | 9,721 | |
| Net cash used in investing activities | $ | (1,046) | | | $ | (26,204) | | | $ | (6,044) | |
| Net cash (used in) provided by financing activities | $ | (9,415) | | | $ | 21,048 | | | $ | (4,037) | |
Operating
Cash provided by operating activities has been and is expected to continue to be our primary recurring source of funds. Cash provided by operating activities increased in 2024 as compared to 2023 due to higher net income after adjustments for noncash items and timing of working capital items primarily driven by higher collections in the fourth quarter.
Cash provided by operating activities decreased in 2023 as compared to 2022 due to lower net income after adjustments for noncash items, primarily transaction and integration payments made in connection with the Horizon acquisition, as well as higher tax payments, partially offset by changes in working capital items.
Investing
Cash used in investing activities during 2024 was primarily due to $1.1 billion of capital expenditures, including construction costs for new plants in North Carolina and Ohio.
Cash used in investing activities during 2023 was primarily due to $27.0 billion of net cash used for the purchase of Horizon and $1.1 billion of capital expenditures, partially offset by net cash inflows related to marketable securities of $1.7 billion.
Cash used in investing activities during 2022 was primarily due to our $3.8 billion purchase of ChemoCentryx, net cash outflows related to marketable securities of $1.4 billion and $936 million of capital expenditures.
We currently estimate 2025 investments in capital projects to be approximately $2.3 billion. A majority of the increase in expenditures relates to expansion of manufacturing capacity to enable supply of products and product candidates.
Financing
Cash used in financing activities during 2024 was primarily due to the payment of dividends of $4.8 billion, the repayment and extinguishment of debt of $3.6 billion and $659 million, respectively, and payments to repurchase our common stock of $200 million.
Cash provided by financing activities during 2023 was primarily due to net proceeds from long-term debt issuances of $27.8 billion primarily in connection with the acquisition of Horizon, partially offset by the payment of dividends of $4.6 billion and the repayment and extinguishment of debt of $1.5 billion and $647 million, respectively.
Cash used in financing activities during 2022 was primarily due to payments to repurchase our common stock of $6.4 billion and the payment of dividends of $4.2 billion, partially offset by net proceeds from the issuance of debt of $6.9 billion.
See Part IV—Note 10, Investments; Note 16, Financing arrangements; and Note 17, Stockholders’ equity, to the Consolidated Financial Statements.
Capital requirements
We have material cash requirements to pay third parties under various contractual obligations discussed below.
We are obligated to pay interest and repay principal under our various financing arrangements, including amounts under interest rate swap and cross-currency swap contracts related to certain of our long-term debt obligations. For information on scheduled debt maturities and payments under derivative contracts associated with our long-term debt obligations, see Part IV—Note 16, Financing arrangements, and Note 19, Derivative instruments, to the Consolidated Financial Statements.
We are obligated to make payments for operating leases, including rental commitments on abandoned leases and leases that have not yet commenced. For information on these obligations, see Part IV—Note 14, Leases, to the Consolidated Financial Statements.
Under the 2017 Tax Act, we elected to pay in eight annual installments the repatriation tax related primarily to prior indefinitely invested earnings of our foreign operations, of which the final installment will be paid in 2025.
As of December 31, 2024, we have purchase obligations of $5.7 billion primarily related to (i) R&D commitments (including those related to clinical trials) for new and existing products, (ii) capital expenditures and (iii) open purchase orders for the acquisition of goods and services in the ordinary course of business. Most of these obligations are expected to be paid within one year, and payment of certain of these amounts may be reduced based on certain future events.
In addition to the purchase obligations noted above and upon the achievement of various development, regulatory and commercial milestones for agreements we have entered into with third parties, we are contractually obligated to pay additional amounts that, in the aggregate, are significant. These payments are contingent upon the occurrence of various future events, substantially all of which have a high degree of uncertainty of occurring, and any resulting cash requirements are managed through our operational budgeting processes. Except with respect to the fair value of the contingent consideration of approximately $106 million as of December 31, 2024, these obligations are not recorded on our Consolidated Balance Sheets. As of December 31, 2024, the maximum amount that may be payable in the future for agreements we have entered into with third parties is $5.6 billion.
We have recorded liabilities for UTBs that, because of their nature, have a high degree of uncertainty regarding the timing of future cash payment and other events that extinguish these liabilities. See Part IV—Note 7, Income taxes, to the Consolidated Financial Statements.
Critical Accounting Policies and Estimates
The preparation of our consolidated financial statements in conformity with GAAP requires management to make estimates and assumptions that affect the amounts reported in the financial statements and the notes to the financial statements. Some of those judgments can be subjective and complex, and therefore, actual results could differ materially from those estimates under different assumptions or conditions. Our significant accounting policies are included in Part IV—Note 1, Summary of significant accounting policies, to the Consolidated Financial Statements. The following are considered critical to our consolidated financial statements because they require the most difficult, subjective or complex judgments, often because of the need to make estimates about matters that are inherently uncertain.
Product sales and sales deductions
Revenue from product sales is recognized upon transfer of control of a product to a customer, generally upon delivery, based on an amount that reflects the consideration to which we expect to be entitled, net of accruals for estimated rebates, wholesaler chargebacks, discounts and other deductions (collectively, sales deductions) established at the time of sale.
We analyze the adequacy of our accruals for sales deductions quarterly. Amounts accrued for sales deductions are adjusted when trends or significant events indicate that adjustment is appropriate. Accruals are also adjusted to reflect actual results. Amounts recorded in Accrued liabilities in the Consolidated Balance Sheets for sales deductions were as follows (in millions):
| | | | | | | | | | | | | | | | | | | | | | | |
| Rebates | | Chargebacks | | Other deductions | | Total |
| Balance as of December 31, 2021 | $ | 4,147 | | | $ | 797 | | | $ | 230 | | | $ | 5,174 | |
| Amounts charged against product sales | 12,500 | | | 10,630 | | | 2,288 | | | 25,418 | |
| Payments | (11,768) | | | (10,578) | | | (2,260) | | | (24,606) | |
| Balance as of December 31, 2022 | 4,879 | | | 849 | | | 258 | | | 5,986 | |
Additions (1) | 263 | | | 24 | | | 39 | | | 326 | |
| Amounts charged against product sales | 14,328 | | | 13,349 | | | 2,533 | | | 30,210 | |
| Payments | (13,634) | | | (13,125) | | | (2,492) | | | (29,251) | |
| Balance as of December 31, 2023 | 5,836 | | | 1,097 | | | 338 | | | 7,271 | |
| Amounts charged against product sales | 17,404 | | | 14,882 | | | 3,060 | | | 35,346 | |
| Payments | (16,423) | | | (14,817) | | | (2,972) | | | (34,212) | |
| Balance as of December 31, 2024 | $ | 6,817 | | | $ | 1,162 | | | $ | 426 | | | $ | 8,405 | |
____________
(1) Represents sales deductions assumed from the Horizon acquisition.
For the years ended December 31, 2024, 2023 and 2022, total sales deductions were 52%, 53% and 51% of gross product sales, respectively. The increase in the total sales deductions balance as of December 31, 2024, compared with December 31, 2023, was primarily driven by higher gross sales. Included in the amounts are immaterial net adjustments related to prior-year sales due to changes in estimates.
In the United States, we use wholesalers as the principal means of distributing our products to healthcare providers such as physicians or their clinics, dialysis centers, hospitals and pharmacies. Products we sell in Europe are distributed principally to hospitals and/or wholesalers depending on the distribution practice in each country where the products are sold. We monitor the inventory levels of our products at our wholesalers by using data from our wholesalers and other third parties, and we believe wholesaler inventories have been maintained at appropriate levels (generally two to three weeks) given end-user demand. Accordingly, historical fluctuations in wholesaler inventory levels have not significantly affected our method of estimating sales deductions.
Accruals for sales deductions are based primarily on estimates of the amounts earned or to be claimed on the related sales. These estimates take into consideration current contractual and statutory requirements, specific known market events and trends, internal and external historical data and forecasted customer buying patterns. Sales deductions are substantially product specific and therefore, for any given year, can be affected by the mix of products sold.
Rebates include primarily amounts paid to payers and providers in the United States, including those paid to state Medicaid programs and those related to the IRA, and are based on contractual arrangements or statutory requirements that vary by product, by payer and by individual payer plans. As we sell products, we estimate the amount of rebate we will pay based on
the product sold, contractual terms, estimated patient population, historical experience and wholesaler inventory levels; and we accrue these rebates in the period the related sales are recorded. We then adjust the rebate accruals as more information becomes available and to reflect actual claims experience. Estimating such rebates is complicated, in part because of the time delay between the date of sale and the actual settlement of the liability. We believe the methodology we use to accrue for rebates is reasonable and appropriate given current facts and circumstances, but actual results may differ.
Wholesaler chargebacks relate to our contractual agreements to sell products to healthcare providers in the United States at fixed prices that are lower than the prices we charge wholesalers. When healthcare providers purchase our products through wholesalers at these reduced prices, wholesalers charge us for the difference between their purchase prices and the contractual prices between Amgen and the healthcare providers. The provision for chargebacks is based on expected sales by our wholesaler customers to healthcare providers. Accruals for wholesaler chargebacks are less difficult to estimate than rebates are, and they closely approximate actual results because chargeback amounts are fixed at the date of purchase by the healthcare providers and because we generally settle the liability for these deductions within a few weeks.
Income taxes
We provide for income taxes based on pretax income and applicable tax rates in the various jurisdictions in which we operate.
We recognize the tax benefit from an uncertain tax position only if it is more likely than not that the tax position will be sustained upon examination by tax authorities based on the technical merits of the position. The tax benefit recognized in the consolidated financial statements for a particular tax position is based on the largest benefit that is more likely than not to be realized. The amount of UTBs is adjusted as appropriate for changes in facts and circumstances, such as significant amendments to existing tax law, new regulations or interpretations by tax authorities, new information obtained during a tax examination or resolution of an examination. We believe our estimates for uncertain tax positions are appropriate and sufficient for any assessments that may result from examinations of our tax returns. We recognize both accrued interest and penalties, when appropriate, related to UTBs in income tax expense. See Part IV—Note 7, Income taxes, to the Consolidated Financial Statements.
Certain items are included in our tax return at different times than they are reflected in the financial statements, and they cause temporary differences between the tax bases of assets and liabilities and their reported amounts. Such temporary differences create deferred tax assets and liabilities. Deferred tax assets are generally items that can be used as tax deductions or credits in tax returns in future years but for which we have already recorded the tax benefit in the consolidated financial statements. We establish valuation allowances against our deferred tax assets when the amount of expected future taxable income is not likely to support the use of the deduction or credit. Deferred tax liabilities are either (i) tax expenses recognized in the consolidated financial statements for which payment has been deferred, (ii) expenses for which we have already taken a deduction on the tax return but have not yet recognized in the consolidated financial statements or (iii) liabilities for the difference between the book basis and the tax basis of the intangible assets acquired in many business combinations, because future expenses associated with these assets most often will not be tax deductible.
Amgen is subject to current U.S. minimum tax on foreign subsidiaries. Based on our election beginning in 2022, we have established deferred taxes with respect to the U.S. minimum tax on the earnings of our foreign subsidiaries. This requires us to recognize deferred taxes for temporary basis differences expected to reverse as global intangible low-taxed income in future years. These are ongoing adjustments that are likely to occur in the future.
We are a vertically integrated enterprise with operations in the United States and various foreign jurisdictions. In the jurisdictions where we conduct operations, we are subject to income tax based on the tax laws and principles of such jurisdictions and on the functions, risks and activities performed therein. Our pretax income is therefore attributed to domestic or foreign sources based on the operations performed and the risks assumed in each location, as well as on the tax laws and principles of the respective taxing jurisdictions. For example, we conduct significant operations in Puerto Rico, a territory of the United States that is treated as a foreign jurisdiction for U.S. tax purposes, pertaining to manufacturing, distribution and other related functions to meet our worldwide product demand. Income from our operations in Puerto Rico is subject to tax incentive grants through 2050.
In 2017, we received an RAR and a modified RAR from the IRS for the years 2010–2012, proposing significant adjustments that primarily relate to the allocation of profits between certain of our entities in the United States and the U.S. territory of Puerto Rico. We disagreed with the proposed adjustments and calculations and pursued resolution with the IRS appeals office but were unable to reach resolution. In July 2021, we filed a petition in the U.S. Tax Court to contest two duplicate Statutory Notices of Deficiency (Notices) for the years 2010–2012 that we received in May and July 2021, which seek to increase our U.S. taxable income for the years 2010–2012 by an amount that would result in additional federal tax of
approximately $3.6 billion plus interest. Any additional tax that could be imposed for the years 2010–2012 would be reduced by up to approximately $900 million of repatriation tax previously accrued on our foreign earnings.
In 2020, we received an RAR and a modified RAR from the IRS for the years 2013–2015, also proposing significant adjustments that primarily relate to the allocation of profits between certain of our entities in the United States and the U.S. territory of Puerto Rico similar to those proposed for the years 2010–2012. We disagreed with the proposed adjustments and calculations and pursued resolution with the IRS appeals office but were unable to reach resolution. In July 2022, we filed a petition in the U.S. Tax Court to contest a Notice for the years 2013–2015 that we previously reported receiving in April 2022 that seeks to increase our U.S. taxable income for the years 2013–2015 by an amount that would result in additional federal tax of approximately $5.1 billion, plus interest. In addition, the Notice asserts penalties of approximately $2.0 billion. Any additional tax that could be imposed for the years 2013–2015 would be reduced by up to approximately $2.2 billion of repatriation tax previously accrued on our foreign earnings.
We firmly believe that the IRS positions set forth in the 2010–2012 and 2013–2015 Notices are without merit. We are contesting the 2010–2012 and 2013–2015 Notices through the judicial process. The two cases were consolidated in the U.S. Tax Court on December 19, 2022. The trial began on November 4, 2024, and concluded on January 17, 2025. With the conclusion of the trial, the parties will file post-trial briefs and make closing arguments in 2025. The Company expects a decision from the Tax Court no earlier than 2026.
We are currently under examination by the IRS for the years 2016–2018 with respect to issues similar to those for the 2010 through 2015 period. We believe that the IRS may also seek to continue to audit similar issues related to the allocation of income between the United States and the U.S. territory of Puerto Rico for years beyond 2018. In addition, we are under examination by a number of state and foreign tax jurisdictions.
Final resolution of these complex matters is not likely within the next 12 months. We continue to believe our accrual for income tax liabilities is appropriate based on past experience, interpretations of tax law, application of the tax law to our facts and judgments about potential actions by tax authorities; however, due to the complexity of the provision for income taxes and uncertain resolution of these matters, the ultimate outcome of any tax matters may result in payments substantially greater than amounts accrued and could have a material adverse impact on our consolidated financial statements. See Part I, Item 1A. Risk Factors—We could be subject to additional tax liabilities, including from an adverse outcome in our ongoing tax dispute with the IRS and other tax examinations, enactment of the OECD minimum corporate tax rate agreement and the adoption and interpretation of new tax legislation, and we anticipate additional tax liabilities from certain provisions of the 2017 Tax Act that will go into effect in 2026; such tax liabilities could adversely affect our profitability and results of operations; Part II, Item 7. Management’s Discussion and Analysis of Financial Condition and Results of Operations—Results of Operations, Income taxes; and Part IV—Note 7, Income taxes, to the Consolidated Financial Statements for further discussion.
Our operations are subject to the tax laws, regulations and administrative practices of the United States, the U.S. territory of Puerto Rico, U.S. state jurisdictions and other countries in which we do business. Significant changes in these rules could have a material adverse effect on our results of operations. See Part I, Item 1A. Risk Factors—We could be subject to additional tax liabilities, including from an adverse outcome in our ongoing tax dispute with the IRS and other tax examinations, enactment of the OECD minimum corporate tax rate agreement and the adoption and interpretation of new tax legislation, and we anticipate additional tax liabilities from certain provisions of the 2017 Tax Act that will go into effect in 2026; such tax liabilities could adversely affect our profitability and results of operations.
Contingencies
In the ordinary course of business, we are involved in various legal proceedings, government investigations and other matters such as intellectual property disputes, contractual disputes and class action suits that are complex in nature and have outcomes that are difficult to predict. We describe our legal proceedings and other matters that are significant or that we believe could become significant in Part IV—Note 20, Contingencies and commitments, to the Consolidated Financial Statements. We record accruals for loss contingencies to the extent that we conclude it is probable that a liability has been incurred and the amount of the related loss can be reasonably estimated. We evaluate, on a quarterly basis, developments in legal proceedings and other matters that could cause an increase or decrease in the amount of the liability that has been accrued previously.
While it is not possible to accurately predict or determine the eventual outcomes of these items, an adverse determination in one or more of these items currently pending could have a material adverse effect on our consolidated results of operations, financial position or cash flows.
Valuation of assets and liabilities in connection with acquisitions
We have acquired and continue to acquire intangible assets in connection with business combinations and asset acquisitions. These intangible assets consist primarily of technology associated with currently marketed human therapeutic products and IPR&D product candidates. Discounted cash flow models are typically used to determine the fair values of these intangible assets for purposes of allocating consideration paid to the net assets acquired in an acquisition. See Part IV—Note 4, Acquisitions and divestitures, to the Consolidated Financial Statements. These models require the use of significant estimates and assumptions, including but not limited to:
•determining the timing and expected costs to complete in-process projects, taking into account the stage of completion at the acquisition date;
•projecting the probability and timing of obtaining marketing approval from the FDA and other regulatory agencies for product candidates;
•estimating the timing of and future net cash flows from product sales resulting from completed products and in-process projects; and
•developing appropriate discount rates to calculate the present values of the cash flows.
Significant estimates and assumptions are also required to determine the business combination date fair values of any contingent consideration obligations incurred in connection with business combinations. In addition, we must revalue these obligations each subsequent reporting period until the related contingencies are resolved and record changes in their fair values in earnings. The acquisition date fair values of contingent consideration obligations incurred or assumed in the acquisitions were determined using a combination of valuation techniques. Significant estimates and assumptions required for these valuations included but were not limited to the timing and probability of achieving regulatory milestones, product sales projections under various scenarios and discount rates used to calculate the present value of the required payments. These estimates and assumptions are required to be updated in order to revalue these contingent consideration obligations each reporting period. Accordingly, subsequent changes in underlying facts and circumstances could result in changes in these estimates and assumptions, which could have a material impact on the estimated future fair values of these obligations.
We believe the fair values used to record intangible assets acquired and contingent consideration obligations incurred in connection with business combinations and asset acquisitions are based on reasonable estimates and assumptions given the facts and circumstances as of the related valuation dates.
Impairment of long-lived assets
We review the carrying value of our finite-lived intangible assets for impairment whenever events or changes in circumstances indicate that the carrying amount of an asset may not be recoverable. If such circumstances exist, an estimate of undiscounted future cash flows to be generated by the long-lived asset is compared with the carrying value to determine whether an impairment exists. If an asset is determined to be impaired, the loss is measured based on the difference between the asset’s fair value and its carrying value.
Indefinite-lived intangible assets, composed of IPR&D projects acquired in a business combination that have not reached technological feasibility or that lack regulatory approval at the time of acquisition, are reviewed for impairment annually, whenever events or changes in circumstances indicate that the carrying amount may not be recoverable and upon establishment of technological feasibility or regulatory approval. We test for impairment by comparing the fair value of the asset to its carrying value. If the asset’s carrying value exceeds its fair value, an impairment charge is recorded for the difference, and its carrying value is reduced accordingly.
Estimating future cash flows of an IPR&D product candidate for purposes of an impairment analysis requires us to make significant estimates and assumptions regarding the amount and timing of costs to complete the project and the amount, timing and probability of achieving revenues from the completed product similar to how the acquisition date fair value of the project was determined, as described above. There are often major risks and uncertainties associated with IPR&D projects as we are required to obtain regulatory approvals in order to be able to market these products. Such approvals require completing clinical trials that demonstrate a product candidate is safe and effective. Consequently, the eventual realized value of the acquired IPR&D project may vary from its fair value at the date of acquisition, and IPR&D impairment charges may occur in future periods which could have a material adverse effect on our results of operations.
We believe our estimations of future cash flows used for assessing impairment of long-lived assets are based on reasonable assumptions given the facts and circumstances as of the related dates of the assessments.
Recently Issued Accounting Standards
See Part IV—Note 1, Summary of significant accounting policies, to the Consolidated Financial Statements for a discussion of recently issued accounting pronouncements.
| | | | | |
| Item 7A. | QUANTITATIVE AND QUALITATIVE DISCLOSURES ABOUT MARKET RISK |
We are exposed to market risks that may result from changes in interest rates, foreign currency exchange rates and prices of equity instruments as well as changes in general economic conditions in the countries where we conduct business. To reduce certain of these risks, we enter into various types of foreign currency and interest rate derivative hedging transactions as part of our risk management program. We do not use derivatives for speculative trading purposes.
In the discussion that follows, we assumed a hypothetical change in interest rates of 100 basis points from those as of December 31, 2024 and 2023. Except as noted below, we also assumed a hypothetical 20% change in foreign currency exchange rates against the U.S. dollar based on its position relative to other currencies as of December 31, 2024 and 2023.
Interest-rate-sensitive financial instruments
Our portfolio of available-for-sale investments as of December 31, 2024 and 2023, was composed almost entirely of U.S. Treasury securities and money market mutual funds. The fair values of our available-for-sale investments were $11.5 billion and $10.4 billion as of December 31, 2024 and 2023, respectively. Duration is a sensitivity measure that can be used to approximate the change in the value of a security that will result from a 100 basis point change in interest rates. Applying a duration model, a hypothetical 100 basis point increase in interest rates as of December 31, 2024 and 2023, would not have resulted in a material reduction in the fair values of these securities. In addition, a hypothetical 100 basis point decrease in interest rates as of December 31, 2024 and 2023, would not result in a material effect on income in the respective ensuing year.
As of December 31, 2024, we had outstanding notes with an aggregate carrying value of $58.3 billion and an aggregate fair value of $54.9 billion. As of December 31, 2023, we had outstanding notes with an aggregate carrying value of $60.6 billion and an aggregate fair value of $59.2 billion. Our outstanding notes were composed of debt with fixed interest rates. Changes in interest rates do not affect interest expense on fixed-rate debt. Changes in interest rates would, however, affect the fair values of fixed-rate debt. A hypothetical 100 basis point decrease in interest rates relative to interest rates as of December 31, 2024 and 2023, would have resulted in increases of $4.7 billion and $5.4 billion, respectively, in the aggregate fair values of our outstanding debt on these dates. The sensitivity analysis of the notes does not consider the impact that hypothetical changes in interest rates would have on related interest rate swap contracts and cross-currency swap contracts, discussed below. In addition, the analysis above does not include our term loans, which had carrying values of $1.8 billion and $4.0 billion at December 31, 2024 and 2023, respectively. The fair values of our term loans approximate their carrying values as these debt instruments bear interest at floating rates.
To achieve a desired mix of fixed-rate and floating-rate debt, we entered into interest rate swap contracts that qualified and were designated for accounting purposes as fair value hedges for certain of our fixed-rate debt. These interest rate swap contracts effectively converted a fixed-rate interest coupon to a floating-rate SOFR-based coupon over the terms of the respective notes. Interest rate swap contracts with an aggregate notional amount of $6.7 billion were outstanding as of both December 31, 2024 and 2023. A hypothetical 100 basis point increase in interest rates relative to interest rates as of December 31, 2024 and 2023, would have resulted in reductions in fair values of approximately $220 million and $180 million, respectively, on our interest rate swap contracts on these dates. Analysis of the interest rate swap contracts does not consider the impact that hypothetical changes in interest rates would have on the related fair values of debt that these interest-rate-sensitive instruments were designed to offset.
As of both December 31, 2024 and 2023, we had outstanding cross-currency swap contracts with aggregate notional amounts of $2.7 billion that hedge our foreign-currency-denominated debt and related interest payments. These contracts effectively convert interest payments and principal repayment of this debt to U.S. dollars from euros and pounds sterling and are designated for accounting purposes as cash flow hedges. A hypothetical 100 basis point adverse movement in interest rates relative to interest rates as of December 31, 2024 and 2023, would have resulted in reductions in the fair values of our cross-currency swap contracts of approximately $70 million and $100 million, respectively.
Foreign-currency-sensitive financial instruments
Our international operations are affected by fluctuations in the value of the U.S. dollar compared with foreign currencies, predominantly the euro. Increases and decreases in our international product sales from movements in foreign currency exchange rates are partially offset by corresponding increases or decreases in our international operating expenses. Increases and decreases in our foreign-currency-denominated assets from movements in foreign currency exchange rates are partially
offset by corresponding increases or decreases in our foreign-currency-denominated liabilities. To further reduce our net exposure to foreign currency exchange rate fluctuations on our results of operations, we enter into foreign currency forward and cross-currency swap contracts.
As of December 31, 2024, we had outstanding euro- and pound-sterling-denominated debt with both a principal carrying value and a fair value of $2.2 billion. As of December 31, 2023, we had outstanding euro- and pound-sterling-denominated debt with both a principal carrying value and a fair value of $2.3 billion. A hypothetical 20% adverse movement in foreign currency exchange rates compared with the U.S. dollar relative to exchange rates as of December 31, 2024, would have resulted in an increase in fair value of this debt of approximately $440 million on this date and a reduction in income in the ensuing year of approximately $450 million. A hypothetical 20% adverse movement in foreign currency exchange rates compared with the U.S. dollar relative to exchange rates as of December 31, 2023, would have resulted in an increase in fair value of this debt of $460 million on this date and a reduction in income in the ensuing year of $470 million. The impact on income from these hypothetical changes in foreign currency exchange rates would be substantially offset by the impact such changes would have on related cross-currency swap contracts, which are in place for the related foreign-currency-denominated debt.
We have cross-currency swap contracts that are designated as cash flow hedges of our debt denominated in euros and pounds sterling with aggregate notional amounts of $2.7 billion as of both December 31, 2024 and 2023. A hypothetical 20% adverse movement in foreign currency exchange rates compared with the U.S. dollar relative to exchange rates on these dates would have resulted in reductions in the fair values of these contracts of approximately $450 million and $480 million on these dates, respectively. The impact of this hypothetical adverse movement in foreign currency exchange rates on ensuing years’ income from these contracts would be fully offset by corresponding hypothetical changes in the carrying amounts of the related hedged debt.
We enter into foreign currency forward contracts that are designated for accounting purposes as cash flow hedges of certain anticipated foreign currency transactions. As of December 31, 2024, the fair values of these contracts were a $420 million asset and an $8 million liability. As of December 31, 2023, the fair values of these contracts were a $145 million asset and a $116 million liability. As of December 31, 2024, we had primarily euro-based open foreign currency forward contracts with an aggregate notional amount of $7.2 billion. As of December 31, 2023, we had primarily euro-based open foreign currency forward contracts with an aggregate notional amount of $6.6 billion. With regard to foreign currency forward contracts that were open as of December 31, 2024, a hypothetical 20% adverse movement in foreign currency exchange rates compared with the U.S. dollar relative to exchange rates as of December 31, 2024, would have resulted in a reduction in fair value of these contracts of approximately $1.3 billion on this date and in the ensuing year, a reduction in income of approximately $700 million. With regard to contracts that were open as of December 31, 2023, a hypothetical 20% adverse movement in foreign currency exchange rates compared with the U.S. dollar relative to exchange rates as of December 31, 2023, would have resulted in a reduction in fair value of these contracts of approximately $1.2 billion on this date and in the ensuing year, a reduction in income of $690 million. The analysis does not consider the impact that hypothetical changes in foreign currency exchange rates would have on anticipated transactions that these foreign-currency-sensitive instruments were designed to offset.
As of December 31, 2024 and 2023, we had open, short-duration, foreign currency forward contracts that mature in one month or less, that had aggregate notional amounts of $0.1 billion and $0.5 billion, respectively, and that hedged fluctuations of certain assets and liabilities denominated in foreign currencies but were not designated as hedges for accounting purposes. These contracts had no material net unrealized gains or losses as of December 31, 2024 and 2023. With regard to these foreign currency forward contracts that were open as of December 31, 2024 and 2023, a hypothetical 5% adverse movement in foreign currency exchange rates compared with the U.S. dollar relative to exchange rates on these dates would not have a material effect on the fair values of these contracts or related income in the respective ensuing years. The analysis does not consider the impact that hypothetical changes in foreign currency exchange rates would have on assets and liabilities that these foreign-currency-sensitive instruments were designed to offset.
Market-price-sensitive financial instruments
As of December 31, 2024 and 2023, we were exposed to price risk on equity securities included in our portfolio of investments, which were acquired primarily for the promotion of business and strategic objectives. These investments include our investments in BeiGene and Neumora, as well as other publicly and privately held small-capitalization stocks and limited partnerships that invest in early-stage biotechnology companies. A 20% decrease in the aggregate value of our equity investment portfolio as of December 31, 2024 and 2023, would result in losses in fair value of approximately $950 million and $1.0 billion, respectively.
Counterparty credit risks
Our financial instruments, including derivatives, are subject to counterparty credit risk, which we consider as part of the overall fair value measurement. Our financial risk management policy limits derivative transactions by requiring that transactions be made only with institutions with minimum credit ratings of A– or equivalent by S&P, Moody’s or Fitch; and it places exposure limits on the amount with any individual counterparty. In addition, we have an investment policy that limits investments to certain types of debt and money market instruments issued by institutions with investment-grade credit ratings and places restriction on maturities and concentrations by asset class and issuer.
| | | | | |
| Item 8. | FINANCIAL STATEMENTS AND SUPPLEMENTARY DATA |
The information required by this item is incorporated herein by reference to the financial statements and schedule listed in Item 15(a)1 and (a)2 of Part IV and included in this Annual Report on Form 10-K.
| | | | | |
| Item 9. | CHANGES IN AND DISAGREEMENTS WITH ACCOUNTANTS ON ACCOUNTING AND FINANCIAL DISCLOSURE |
None.
| | | | | |
| Item 9A. | CONTROLS AND PROCEDURES |
We maintain “disclosure controls and procedures,” as such term is defined under the Securities Exchange Act Rule 13a-15(e), that are designed to ensure that information required to be disclosed in Amgen’s Exchange Act reports is recorded, processed, summarized and reported within the time periods specified in the SEC’s rules and forms and that such information is accumulated and communicated to Amgen’s management, including its Chief Executive Officer and Chief Financial Officer, as appropriate, to allow timely decisions regarding required disclosures. In designing and evaluating the disclosure controls and procedures, Amgen’s management recognized that any controls and procedures, no matter how well designed and operated, can provide only reasonable assurance of achieving the desired control objectives, and in reaching a reasonable level of assurance, Amgen’s management is required to apply its judgment in evaluating the cost-benefit relationship of possible controls and procedures. We have carried out an evaluation under the supervision and with the participation of our management, including Amgen’s Chief Executive Officer and Chief Financial Officer, of the effectiveness of the design and operation of Amgen’s disclosure controls and procedures. Based upon their evaluation and subject to the foregoing, the Chief Executive Officer and Chief Financial Officer concluded that our disclosure controls and procedures were effective as of December 31, 2024.
Management determined that as of December 31, 2024, there were no changes in our internal control over financial reporting that occurred during the fiscal quarter then ended that have materially affected or are reasonably likely to materially affect our internal control over financial reporting.
Management’s Report on Internal Control over Financial Reporting
Management of the Company is responsible for establishing and maintaining adequate internal control over financial reporting, as such term is defined in Rule 13a-15(f) under the Securities Exchange Act of 1934. The Company’s internal control over financial reporting is designed to provide reasonable assurance regarding the reliability of financial reporting and the preparation of financial statements for external purposes in accordance with GAAP in the United States. However, all internal control systems, no matter how well designed, have inherent limitations. Therefore, even those systems determined to be effective can provide only reasonable assurance with respect to financial statement preparation and reporting.
Management assessed the effectiveness of the Company’s internal control over financial reporting as of December 31, 2024. In making this assessment, management used the criteria set forth by the COSO in Internal Control—Integrated Framework (2013 framework). Based on our assessment, management believes that the Company maintained effective internal control over financial reporting as of December 31, 2024, based on the COSO criteria.
The effectiveness of the Company’s internal control over financial reporting has been audited by Ernst & Young LLP, an independent registered public accounting firm, as stated in their attestation report appearing below, which expresses an unqualified opinion on the effectiveness of the Company’s internal control over financial reporting as of December 31, 2024.
Report of Independent Registered Public Accounting Firm
To the Stockholders and the Board of Directors of Amgen Inc.
Opinion on Internal Control Over Financial Reporting
We have audited Amgen Inc.’s internal control over financial reporting as of December 31, 2024, based on criteria established in Internal Control—Integrated Framework issued by the Committee of Sponsoring Organizations of the Treadway Commission (2013 framework) (the COSO criteria). In our opinion, Amgen Inc. (the Company) maintained, in all material respects, effective internal control over financial reporting as of December 31, 2024, based on the COSO criteria.
We also have audited, in accordance with the standards of the Public Company Accounting Oversight Board (United States) (PCAOB), the consolidated balance sheets of the Company as of December 31, 2024 and 2023, the related consolidated statements of income, comprehensive income, stockholders’ equity and cash flows for each of the three years in the period ended December 31, 2024, and the related notes and the financial statement schedule listed in the Index at Item 15(a)2 and our report dated February 14, 2025 expressed an unqualified opinion thereon.
Basis for Opinion
The Company’s management is responsible for maintaining effective internal control over financial reporting and for its assessment of the effectiveness of internal control over financial reporting included in the accompanying Management’s Report on Internal Control over Financial Reporting. Our responsibility is to express an opinion on the Company’s internal control over financial reporting based on our audit. We are a public accounting firm registered with the PCAOB and are required to be independent with respect to the Company in accordance with the U.S. federal securities laws and the applicable rules and regulations of the Securities and Exchange Commission and the PCAOB.
We conducted our audit in accordance with the standards of the PCAOB. Those standards require that we plan and perform the audit to obtain reasonable assurance about whether effective internal control over financial reporting was maintained in all material respects.
Our audit included obtaining an understanding of internal control over financial reporting, assessing the risk that a material weakness exists, testing and evaluating the design and operating effectiveness of internal control based on the assessed risk, and performing such other procedures as we considered necessary in the circumstances. We believe that our audit provides a reasonable basis for our opinion.
Definition and Limitations of Internal Control Over Financial Reporting
A company’s internal control over financial reporting is a process designed to provide reasonable assurance regarding the reliability of financial reporting and the preparation of financial statements for external purposes in accordance with generally accepted accounting principles. A company’s internal control over financial reporting includes those policies and procedures that (1) pertain to the maintenance of records that, in reasonable detail, accurately and fairly reflect the transactions and dispositions of the assets of the company; (2) provide reasonable assurance that transactions are recorded as necessary to permit preparation of financial statements in accordance with generally accepted accounting principles, and that receipts and expenditures of the company are being made only in accordance with authorizations of management and directors of the company; and (3) provide reasonable assurance regarding prevention or timely detection of unauthorized acquisition, use, or disposition of the company’s assets that could have a material effect on the financial statements.
Because of its inherent limitations, internal control over financial reporting may not prevent or detect misstatements. Also, projections of any evaluation of effectiveness to future periods are subject to the risk that controls may become inadequate because of changes in conditions, or that the degree of compliance with the policies or procedures may deteriorate.
/s/ Ernst & Young LLP
Los Angeles, California
February 14, 2025
| | | | | |
| Item 9B. | OTHER INFORMATION |
Rule 10b5-1 trading arrangements
During the three months ended December 31, 2024, none of our directors or officers (as defined in Rule 16a-1(f) of the Exchange Act) adopted or terminated any “Rule 10b5-1 trading arrangement” or “non-Rule 10b5-1 trading arrangement,” as each term is defined in Item 408 of Regulation S-K.
| | | | | |
| Item 9C. | DISCLOSURE REGARDING FOREIGN JURISDICTIONS THAT PREVENT INSPECTIONS |
Not applicable.
PART III
| | | | | |
| Item 10. | DIRECTORS, EXECUTIVE OFFICERS AND CORPORATE GOVERNANCE |
Information about our Directors is incorporated by reference from the section entitled ITEM 1—ELECTION OF DIRECTORS in our Proxy Statement for the 2025 Annual Meeting of Stockholders to be filed with the SEC within 120 days of December 31, 2024 (the Proxy Statement). Information about the procedures by which stockholders may recommend nominees for the Board of Directors is incorporated by reference from APPENDIX A—AMGEN INC. BOARD OF DIRECTORS GUIDELINES FOR DIRECTOR QUALIFICATIONS AND EVALUATIONS and OTHER MATTERS—Stockholder Proposals for the 2026 Annual Meeting in our Proxy Statement. Information about our Audit Committee, members of the committee and our Audit Committee financial experts is incorporated by reference from the section entitled CORPORATE GOVERNANCE—Audit Committee in our Proxy Statement. Information about our insider trading policies and procedures is incorporated by reference from the section entitled COMPENSATION DISCUSSION AND ANALYSIS—COMPENSATION POLICIES AND PRACTICES—INSIDER TRADING POLICIES AND PROCEDURES in our Proxy Statement. A copy of our Insider Trading Policy and our securities transactions pre-clearance practices and procedures are filed with this Annual Report on Form 10-K as Exhibits 19.1 and 19.2, respectively. Information about our executive officers is contained in the discussion entitled Part I, Item 1. Business—Information about our Executive Officers.
Code of Ethics
We maintain a Code of Ethics for the Chief Executive Officer and Senior Financial Officers applicable to our principal executive officer, principal financial officer, principal accounting officer or controller and other persons performing similar functions. To view this code of ethics free of charge, please visit our website at www.amgen.com. (The website address is not intended to function as a hyperlink, and the information contained in our website is not intended to be a part of this filing.) We intend to satisfy the disclosure requirements under Item 5.05 of Form 8-K regarding an amendment to or a waiver from a provision of this code of ethics, if any, by posting such information on our website as set forth above.
| | | | | |
| Item 11. | EXECUTIVE COMPENSATION |
Information about director and executive compensation is incorporated by reference from the sections entitled COMPENSATION DISCUSSION AND ANALYSIS, EXECUTIVE COMPENSATION TABLES, DIRECTOR COMPENSATION and CORPORATE GOVERNANCE—Pay Ratio in our Proxy Statement. Information about compensation committee matters is incorporated by reference from the sections entitled CORPORATE GOVERNANCE—Compensation and Management Development Committee and CORPORATE GOVERNANCE—Compensation Committee Report in our Proxy Statement.
| | | | | |
| Item 12. | SECURITY OWNERSHIP OF CERTAIN BENEFICIAL OWNERS AND MANAGEMENT AND RELATED STOCKHOLDER MATTERS |
Securities Authorized for Issuance Under Existing Equity Compensation Plans
The following table sets forth certain information as of December 31, 2024, concerning the shares of our common stock that may be issued under any form of award granted under our equity compensation plans in effect as of December 31, 2024, including upon the exercise of options, upon the vesting of awards of RSUs or when performance units are earned and related dividend equivalents have been granted.
| | | | | | | | | | | | | | | | | | | | |
| | (a) | | (b) | | (c) |
| Plan category | | Number of securities to be issued upon exercise of outstanding options and rights | | Weighted-average exercise price of outstanding options and rights | | Number of securities remaining available for future issuance under equity compensation plans (excluding securities reflected in
column (a)) |
| Equity compensation plans approved by Amgen security holders: | | | | | | |
Amended and Restated 2009 Equity Incentive Plan(1) | | 10,714,775 | | | $ | 225.84 | | | 59,435,223 | |
Amended and Restated 1991 Equity Incentive Plan(2) | | 100 | | | | | |
| Amended and Restated Employee Stock Purchase Plan | | | | | | 3,946,553 | |
| Total approved plans | | 10,714,875 | | | $ | 225.84 | | | 63,381,776 | |
| Equity compensation plan not approved by Amgen security holders: | | | | | | |
Amgen Profit Sharing Plan for Employees in Ireland(3) | | | | | | 175,345 | |
Horizon stock plans(4) | | 467,296 | | | | | |
| Total unapproved plans | | 467,296 | | | — | | | 175,345 | |
| Total all plans | | 11,182,171 | | | $ | 225.84 | | | 63,557,121 | |
(1)The Amended 2009 Plan employs a fungible share-counting formula for determining the number of shares available for issuance under the plan. In accordance with this formula, each option or stock appreciation right counts as one share, while each RSU, performance unit or dividend equivalent counts as 1.9 shares. The number under column (a) represents the actual number of shares issuable under our outstanding awards without giving effect to the fungible share-counting formula. The number under column (c) represents the number of shares available for issuance under this plan based on each such available share counting as one share. Commencing with the grants made in April 2012, RSUs and performance units accrue dividend equivalents that are payable in shares only to the extent and when the underlying RSUs vest or underlying performance units have been earned and the related shares are issued to the grantee. The performance units granted under this plan are earned based on the accomplishment of specified performance goals at the end of their respective three-year performance periods; the number of performance units granted represent target performance, and the maximum number of units that could be earned based on our performance is 200% of the performance units granted in 2022, 2023 and 2024.
As of December 31, 2024, the number of outstanding awards under column (a) includes (i) 5,909,018 shares issuable upon the exercise of outstanding options with a weighted-average exercise price of $225.84; (ii) 3,289,089 shares issuable upon the vesting of outstanding RSUs, including 198,925 related dividend equivalents; and (iii) 1,516,669 shares subject to outstanding 2022, 2023 and 2024 performance units, including 91,901 related dividend equivalents. The weighted-average exercise price shown in column (b) is for the outstanding options only. The number of available shares under column (c) represents the number of shares that remain available for future issuance under this plan as of December 31, 2024, employing the fungible share formula and presumes the issuance of target shares under the performance units granted in 2022, 2023 and 2024 and related dividend equivalents. The numbers under columns (a) and (c) do not give effect to the additional shares that could be issuable in the event that above target performance on the performance goals under these outstanding performance units is achieved. Maximum performance under these goals could result in 200% of target shares being awarded for performance units granted in 2022, 2023 and 2024.
(2)This plan has terminated as to future grants. The number under column (a) with respect to this plan includes 100 shares issuable upon the settlement of deferred RSUs.
(3)The Profit Sharing Plan was approved by the Board of Directors on July 28, 2011. The Profit Sharing Plan permits eligible employees of the Company’s subsidiaries located in Ireland who participate in the Profit Sharing Plan to apply a
portion of their qualifying bonus and salary to the purchase of the Company’s common stock on the open market at the market price by a third-party trustee as described in the Profit Sharing Plan.
(4)The Horizon Therapeutics Public Limited Company Amended and Restated 2014 Equity Incentive Plan, the Horizon Therapeutics Public Limited Company Amended and Restated 2020 Equity Incentive Plan and 2020 Restricted Stock Unit Award Sub-Plan and the Horizon Therapeutics Public Limited Company Amended and Restated 2018 Equity Incentive Plan and 2018 Restricted Stock Unit Award Sub-Plan (collectively, the “Horizon stock plans”) were acquired on October 6, 2023, pursuant to our acquisition of Horizon. In connection with the closing of the Horizon acquisition and pursuant to its terms, outstanding RSUs issued under the Horizon stock plans were converted into Amgen RSUs, and these plans terminated as to future grants on October 6, 2023.
Security Ownership of Directors and Executive Officers and Certain Beneficial Owners
Information about security ownership of certain beneficial owners and management is incorporated by reference from the sections entitled SECURITY OWNERSHIP OF DIRECTORS AND EXECUTIVE OFFICERS and SECURITY OWNERSHIP OF CERTAIN BENEFICIAL OWNERS in our Proxy Statement.
| | | | | |
| Item 13. | CERTAIN RELATIONSHIPS AND RELATED TRANSACTIONS AND DIRECTOR INDEPENDENCE |
Information about certain relationships and related transactions and director independence is incorporated by reference from the sections entitled CERTAIN RELATIONSHIPS AND RELATED TRANSACTIONS and CORPORATE GOVERNANCE—Director Independence in our Proxy Statement.
| | | | | |
| Item 14. | PRINCIPAL ACCOUNTANT FEES AND SERVICES |
Information about the fees for professional services rendered by our independent registered public accountants is incorporated by reference from the section entitled AUDIT MATTERS—Independent Registered Public Accountants in our Proxy Statement.
PART IV
| | | | | |
| Item 15. | EXHIBITS AND FINANCIAL STATEMENT SCHEDULES |
(a)1.Index to Financial Statements
The following Consolidated Financial Statements are included herein:
| | | | | |
| | Page
number |
| Report of Independent Registered Public Accounting Firm (PCAOB ID: 42) | |
| |
| Consolidated Statements of Income for each of the three years in the period ended December 31, 2024 | |
| |
| Consolidated Statements of Comprehensive Income for each of the three years in the period ended December 31, 2024 | |
| |
| Consolidated Balance Sheets as of December 31, 2024 and 2023 | |
| |
| Consolidated Statements of Stockholders’ Equity for each of the three years in the period ended December 31, 2024 | |
| |
| Consolidated Statements of Cash Flows for each of the three years in the period ended December 31, 2024 | |
| |
| Notes to Consolidated Financial Statements | |
(a)2.Index to Financial Statement Schedules
The following Schedule is filed as part of this Annual Report on Form 10-K:
| | | | | |
| | Page
number |
| Schedule II. Valuation and Qualifying Accounts | |
All other schedules are omitted because they are not applicable, not required or because the required information is included in the consolidated financial statements or notes thereto.
(a)3.Exhibits
| | | | | | | | |
| Exhibit No. | | Description |
| 2.1 | | Agreement and Plan of Merger, dated July 27, 2021, by and among Amgen Inc., Teneobio, Inc., Tuxedo Merger Sub, Inc., and Fortis Advisors LLC. (portions of the exhibit have been omitted because they are both (i) not material and (ii) is the type of information that the Company treats as private or confidential) (Filed as an exhibit to Form 10-Q for the quarter ended September 30, 2021 on November 3, 2021 and incorporated herein by reference.) |
| | |
| 2.2 | | |
| | |
| 2.3 | | |
| | |
| 2.4 | | |
| | |
| 3.1 | | |
| | |
| 3.2 | | |
| | |
| 4.1 | | |
| | |
| | | | | | | | |
| Exhibit No. | | Description |
| 4.2 | | Form of Indenture, dated January 1, 1992. (Filed as an exhibit to Form S-3 Registration Statement filed on December 19, 1991 and incorporated herein by reference.) |
| | |
| 4.3 | | |
| | |
| 4.4 | | |
| | |
| 4.5 | | |
| | |
| 4.6 | | |
| | |
| 4.7 | | |
| | |
| 4.8 | | |
| | |
| 4.9 | | |
| | |
| 4.10 | | |
| | |
| 4.11 | | |
| | |
| 4.12 | | |
| | |
| 4.13 | | |
| | |
| 4.14 | | |
| | |
| 4.15 | | |
| | |
| 4.16 | | |
| | |
| 4.17 | | |
| | |
| 4.18 | | |
| | |
| 4.19 | | |
| | |
| 4.20 | | |
| | |
| 4.21 | | |
| | |
| | | | | | | | |
| Exhibit No. | | Description |
| 4.22 | | |
| | |
| 4.23 | | |
| | |
| 4.24 | | |
| | |
| 4.25 | | |
| | |
| 4.26 | | |
| | |
| 4.27 | | |
| | |
| 4.28 | | |
| | |
| 4.29 | | |
| | |
| 4.30 | | |
| | |
| 4.31 | | Officer’s Certificate of the Company, dated as of March 2, 2023, including forms of the Company’s 5.250% Senior Notes due 2025, 5.507% Senior Notes due 2026, 5.150% Senior Notes due 2028, 5.250% Senior Notes due 2030, 5.250% Senior Notes due 2033, 5.600% Senior Notes due 2043, 5.650% Senior Notes due 2053 and 5.750% Senior Notes due 2063. (Filed as an exhibit to Form 8-K on March 2, 2023 and incorporated herein by reference.) |
| | |
| 4.32* | | |
| | |
| 10.1+ | | |
| | |
| 10.2*+ | | |
| | |
| 10.3*+ | | |
| | |
| 10.4+ | | Amgen Inc. 2009 Performance Award Program. (As Amended and Restated on May 31, 2024.) (Filed as an exhibit to Form 10-Q for the quarter ended June 30, 2024 on August 7, 2024 and incorporated herein by reference.) |
| | |
| 10.5*+ | | |
| | |
| 10.6+ | | |
| | |
| | | | | | | | |
| Exhibit No. | | Description |
| 10.7+ | | |
| | |
| 10.8+ | | |
| | |
| 10.9+ | | |
| | |
| 10.9.1+ | | |
| | |
| 10.9.2+ | | |
| | |
| 10.9.3+ | | |
| | |
| 10.9.4+ | | |
| | |
| 10.9.5+ | | |
| | |
| 10.10+ | | |
| | |
| 10.11+ | | Amgen Inc. Executive Incentive Plan. (As Amended and Restated effective January 1, 2022.) (Filed as an exhibit to Form 10-Q for the quarter ended March 31, 2022 on April 28, 2022 and incorporated herein by reference.) |
| | |
| 10.12+ | | |
| | |
| 10.12.1+ | | |
| | |
| 10.12.2+ | | |
| | |
| | |
| 10.12.3+ | | |
| | |
| 10.12.4+ | | |
| | |
| 10.13+ | | |
| | |
| 10.14+ | | |
| | |
| | | | | | | | |
| Exhibit No. | | Description |
| 10.15 | | Term Loan Credit Agreement, dated as of December 22, 2022, by and among Amgen Inc., Citibank, N.A., as administrative agent, Bank of America, N.A., as syndication agent, Citibank, N.A., Bank of America, N.A., Goldman Sachs Bank USA and Mizuho Bank, Ltd., as lead arrangers and book runners, Goldman Sachs Bank USA and Mizuho Bank, Ltd. as documentation agents, and the other banks party thereto. (Filed as an exhibit to Form 8-K on December 22, 2022 and incorporated herein by reference.) |
| | |
| 10.16 | | Third Amended and Restated Credit Agreement, dated as of March 9, 2023, among Amgen Inc., the Banks therein named, Citibank, N.A., as Administrative Agent, and JPMorgan Chase Bank, N.A., as Syndication Agent. (Filed as an exhibit to Form 8-K on March 9, 2023 and incorporated herein by reference.) |
| | |
| 10.17 | | |
| | |
| 10.17.1 | | |
| | |
| 10.18 | | |
| | |
| 10.19 | | |
| | |
| 10.19.1 | | |
| | |
| 10.19.2 | | |
| | |
| 10.20 | | |
| | |
| 10.21 | | |
| | |
| 10.21.1 | | |
| | |
| 10.21.2 | | |
| | |
| 10.21.3 | | |
| | |
| | | | | | | | |
| Exhibit No. | | Description |
| 10.22 | | |
| | |
| 10.22.1 | | |
| | |
| 10.22.2 | | Amendment Nos. 2 through 6 to the March 30, 2012 Collaboration Agreement between Amgen Inc. and AstraZeneca Collaboration Ventures, LLC, dated May 2 and 27 and October 2, 2016, January 31, 2018, and May 15, 2020, respectively (portions of the exhibit have been omitted because they are both (i) not material and (ii) would be competitively harmful if publicly disclosed.) (Filed as an exhibit to Form 10-Q for the quarter ended June 30, 2020 on July 29, 2020 and incorporated herein by reference.) |
| | |
| 10.22.3 | | |
| | |
| 10.22.4 | | |
| | |
| 10.22.5 | | |
| | |
| 10.23 | | |
| | |
| 19.1* | | |
| | |
| 19.2* | | |
| | |
| 21* | | |
| | |
| 23 | | Consent of the Independent Registered Public Accounting Firm. The consent is set forth on page 96 of this Annual Report on the 10-K. |
| | |
| 24 | | Power of Attorney. The Power of Attorney is set forth on page 97 of this Annual Report on Form 10-K. |
| | |
| 31* | | |
| | |
| 32** | | |
| | |
| 97* | | |
| | |
| 101.INS | | Inline XBRL Instance Document - The instance document does not appear in the interactive data file because its XBRL tags are embedded within the Inline XBRL document. |
| | |
| 101.SCH* | | Inline XBRL Taxonomy Extension Schema Document. |
| | |
| 101.CAL* | | Inline XBRL Taxonomy Extension Calculation Linkbase Document. |
| | |
| 101.DEF* | | Inline XBRL Taxonomy Extension Definition Linkbase Document. |
| | |
| | | | | | | | |
| Exhibit No. | | Description |
| 101.LAB* | | Inline XBRL Taxonomy Extension Label Linkbase Document. |
| | |
| 101.PRE* | | Inline XBRL Taxonomy Extension Presentation Linkbase Document. |
| | |
| 104 | | Cover Page Interactive Data File (formatted as Inline XBRL and contained in Exhibit 101). |
____________________________
* = filed herewith
** = furnished herewith and not “filed” for purposes of Section 18 of the Securities Exchange Act of 1934, as amended
+ = management contract or compensatory plan or arrangement
| | | | | |
| Item 16. | FORM 10-K SUMMARY |
Not applicable.
SIGNATURES
Pursuant to the requirements of the Securities Exchange Act of 1934, the registrant has duly caused this Annual Report to be signed on its behalf by the undersigned, thereunto duly authorized.
| | | | | | | | | | | | | | |
| | AMGEN INC. |
| | (Registrant) |
| | | | |
| Date: | February 14, 2025 | By: | | /s/ PETER H. GRIFFITH |
| | | | Peter H. Griffith |
| | | | Executive Vice President and Chief Financial Officer |
| | | | (Principal Financial Officer) |
EXHIBIT 23
CONSENT OF INDEPENDENT REGISTERED PUBLIC ACCOUNTING FIRM
We consent to the incorporation by reference in the following Registration Statements:
•Registration Statement (Form S-3 No. 333-269670) of Amgen Inc.,
•Registration Statements (Form S-8 Nos. 333-159377 and 333-280155) pertaining to the Amgen Inc. Second Amended and Restated 2009 Equity Incentive Plan,
•Registration Statement (Form S-8 No. 33-39183) pertaining to the Amgen Inc. Amended and Restated Employee Stock Purchase Plan,
•Registration Statements (Form S-8 Nos. 33-39104, 333-144581 and 333-216719) pertaining to the Amgen Retirement and Savings Plan,
•Registration Statements (Form S-8 Nos. 33-47605, 333-144580 and 333-216715) pertaining to The Retirement and Savings Plan for Amgen Manufacturing Limited LLC (formerly known as The Retirement and Savings Plan for Amgen Manufacturing, Limited),
•Registration Statements (Form S-8 Nos. 333-81284, 333-177868, 333-216723 and 333-260723) pertaining to the Amgen Nonqualified Deferred Compensation Plan,
•Registration Statements (Form S-8 Nos. 333-176240 and 333-260724) pertaining to the Amgen Profit Sharing Plan for Employees in Ireland, and
•Registration Statement (Form S-8 No. 333-274900) pertaining to the Horizon Therapeutics Public Limited Company Amended and Restated 2014 Equity Incentive Plan, Horizon Therapeutics Public Limited Company Amended and Restated 2018 Equity Incentive Plan and 2018 Restricted Stock Unit Award Sub-Plan, and Horizon Therapeutics Public Limited Company Amended and Restated 2020 Equity Incentive Plan and 2020 Restricted Stock Unit Award Sub-Plan;
of our reports dated February 14, 2025, with respect to the consolidated financial statements of Amgen Inc. and the effectiveness of internal control over financial reporting of Amgen Inc. included in this Annual Report (Form 10-K) of Amgen Inc. for the year ended December 31, 2024.
/s/ Ernst & Young LLP
Los Angeles, California
February 14, 2025
EXHIBIT 24
POWER OF ATTORNEY
KNOW ALL MEN AND WOMEN BY THESE PRESENTS, that each person whose signature appears below constitutes and appoints Robert A. Bradway, Peter H. Griffith and Jonathan P. Graham, or any of them, his or her attorney-in-fact, each with the power of substitution and re-substitution, for him or her in any and all capacities, to sign any amendments to this Report, and to file the same, with exhibits thereto and other documents in connection therewith, with the Securities and Exchange Commission, hereby ratifying and confirming all that each of said attorneys-in-fact, or his or her substitute or substitutes, may do or cause to be done by virtue hereof.
Pursuant to the requirements of the Securities Exchange Act of 1934, this report has been signed below by the following persons on behalf of the registrant and in the capacities and on the dates indicated:
| | | | | | | | | | | | | | |
| Signature | | Title | | Date |
| | | | |
| /S/ ROBERT A. BRADWAY | | Chairman of the Board, Chief Executive Officer
and President, and Director
(Principal Executive Officer) | | 2/14/2025 |
| Robert A. Bradway | | | |
| | | | |
| /S/ PETER H. GRIFFITH | | Executive Vice President and
Chief Financial Officer
(Principal Financial Officer) | | 2/14/2025 |
| Peter H. Griffith | | | |
| | | | |
| /S/ MATTHEW C. BUSCH | | Vice President, Finance and
Chief Accounting Officer
(Principal Accounting Officer) | | 2/14/2025 |
| Matthew C. Busch | | | |
| | | | |
| /S/ WANDA M. AUSTIN | | Director | | 2/14/2025 |
| Wanda M. Austin | | | | |
| | | | |
| /S/ MICHAEL V. DRAKE | | Director | | 2/14/2025 |
| Michael V. Drake | | | | |
| | | | |
| /S/ BRIAN J. DRUKER | | Director | | 2/14/2025 |
| Brian J. Druker | | | | |
| | | | |
| /S/ ROBERT A. ECKERT | | Director | | 2/14/2025 |
| Robert A. Eckert | | | | |
| | | | |
| /S/ GREG C. GARLAND | | Director | | 2/14/2025 |
| Greg C. Garland | | | | |
| | | | |
| /S/ CHARLES M. HOLLEY, JR. | | Director | | 2/14/2025 |
| Charles M. Holley, Jr. | | | | |
| | | | |
| /S/ S. OMAR ISHRAK | | Director | | 2/14/2025 |
| S. Omar Ishrak | | | | |
| | | | |
| /S/ TYLER JACKS | | Director | | 2/14/2025 |
| Tyler Jacks | | | | |
| | | | |
| /S/ MARY E. KLOTMAN | | Director | | 2/14/2025 |
| Mary E. Klotman | | | | |
| | | | |
| /S/ ELLEN J. KULLMAN | | Director | | 2/14/2025 |
| Ellen J. Kullman | | | | |
| | | | |
| /S/ AMY E. MILES | | Director | | 2/14/2025 |
| Amy E. Miles | | | | |
Report of Independent Registered Public Accounting Firm
To the Stockholders and the Board of Directors of Amgen Inc.
Opinion on the Financial Statements
We have audited the accompanying consolidated balance sheets of Amgen Inc. (the Company) as of December 31, 2024 and 2023, the related consolidated statements of income, comprehensive income, stockholders’ equity and cash flows for each of the three years in the period ended December 31, 2024, and the related notes and the financial statement schedule listed in the Index at Item 15(a)2 (collectively referred to as the “consolidated financial statements”). In our opinion, the consolidated financial statements present fairly, in all material respects, the financial position of the Company at December 31, 2024 and 2023, and the results of its operations and its cash flows for each of the three years in the period ended December 31, 2024, in conformity with U.S. generally accepted accounting principles.
We also have audited, in accordance with the standards of the Public Company Accounting Oversight Board (United States) (PCAOB), the Company’s internal control over financial reporting as of December 31, 2024, based on criteria established in Internal Control—Integrated Framework issued by the Committee of Sponsoring Organizations of the Treadway Commission (2013 framework) and our report dated February 14, 2025 expressed an unqualified opinion thereon.
Basis for Opinion
These financial statements are the responsibility of the Company’s management. Our responsibility is to express an opinion on the Company’s financial statements based on our audits. We are a public accounting firm registered with the PCAOB and are required to be independent with respect to the Company in accordance with the U.S. federal securities laws and the applicable rules and regulations of the Securities and Exchange Commission and the PCAOB.
We conducted our audits in accordance with the standards of the PCAOB. Those standards require that we plan and perform the audit to obtain reasonable assurance about whether the financial statements are free of material misstatement, whether due to error or fraud. Our audits included performing procedures to assess the risks of material misstatement of the financial statements, whether due to error or fraud, and performing procedures that respond to those risks. Such procedures included examining, on a test basis, evidence regarding the amounts and disclosures in the financial statements. Our audits also included evaluating the accounting principles used and significant estimates made by management, as well as evaluating the overall presentation of the financial statements. We believe that our audits provide a reasonable basis for our opinion.
Critical Audit Matters
The critical audit matters communicated below are matters arising from the current period audit of the financial statements that were communicated or required to be communicated to the audit committee and that: (1) relate to accounts or disclosures that are material to the financial statements and (2) involved our especially challenging, subjective or complex judgments. The communication of critical audit matters does not alter in any way our opinion on the consolidated financial statements, taken as a whole, and we are not, by communicating the critical audit matters below, providing separate opinions on the critical audit matters or on the accounts or disclosures to which they relate.
| | | | | | | | |
| | Sales deductions |
| Description of the Matter | | As of December 31, 2024, the Company recorded accrued sales deductions of $8.4 billion. As described in Note 1 to the financial statements under the caption “Product sales and sales deductions,” revenues from product sales are recognized net of accruals for estimated rebates, wholesaler chargebacks, discounts and other deductions (collectively sales deductions), which are established at the time of sale. Auditing the estimation of sales deductions, specifically estimated chargebacks, commercial rebates, and Medicaid rebates related to U.S. product sales, which are netted against product sales, is complex, requires significant judgment, and the amounts involved are material to the financial statements taken as a whole. Revenue from product sales is recognized upon transfer of control of a product to a customer, generally upon delivery, and is based on an amount that reflects the consideration to which the Company expects to be entitled, which represents an amount that is net of accruals for estimated sales deductions. The estimated sales deductions are based on current contractual and statutory requirements, market events and trends, internal and external historical data, and forecasted customer buying patterns. |
| | |
| How We Addressed the Matter in Our Audit | | We obtained an understanding, evaluated the design and tested the operating effectiveness of internal controls over the sales deduction processes. This included testing controls over management’s review of significant assumptions and inputs used in the estimate of sales deductions, including actual sales, contractual terms, historical experience, wholesaler inventory levels, demand data and estimated patient population. We also tested management’s controls over the accuracy of forecasting demand activity as well as the completeness and accuracy of the significant components included in the final sales deduction estimates. To test management’s estimated sales deductions, we obtained management’s calculations for the respective estimates and performed the following procedures, among others. We tested management’s estimation process over the determination of sales discount accruals by developing an independent expectation of the estimated accrual balances, including comparing accrual balances recorded by management to those implied by historical payment trends, evaluating trends in actual sales and discount accrual balances, testing a sample of credits issued and payments made throughout the year, and agreeing rates to underlying contract terms. |
| | |
| | | | | | | | |
| | Unrecognized tax benefits |
| Description of the Matter | | As discussed in Notes 1 and 7 to the consolidated financial statements, the Company operates in various jurisdictions in which differing interpretations of complex tax laws and regulations create uncertainty and necessitate the use of significant judgment in the determination of the Company’s unrecognized tax benefits, particularly in the U.S. federal tax jurisdiction where the Company has significant assets and operations. In this regard, the Company uses significant judgment in (1) determining whether a tax position’s technical merits are more-likely-than-not to be sustained and (2) measuring the amount of tax benefit that qualifies for recognition. As of December 31, 2024, the Company accrued $4.2 billion of gross unrecognized tax benefits. Auditing the assessment of the technical merits and measurement of the Company’s unrecognized tax benefits is challenging due to the high degree of estimation and management judgement, given the ultimate resolution is dependent on uncontrollable factors such as the resolution of audit disputes with the IRS and results of the U.S. Tax Court case. |
| | |
| How We Addressed the Matter in Our Audit | | We obtained an understanding, evaluated the design and tested the operating effectiveness of internal controls over the Company’s process to assess the technical merits of its tax positions, as well as management’s process to measure the unrecognized tax benefits of those tax positions, particularly in regard to matters in dispute with the IRS. This included testing controls over management’s review of the inputs, calculations, assumptions and methods selected to measure the amount of tax benefits that qualify for recognition. We involved tax controversy and transfer pricing specialists to assist in assessing the technical merits and measurement of certain of the Company’s unrecognized tax benefits. Depending on the nature of the specific tax position and, as applicable, developments with the relevant tax authorities, our procedures included obtaining and reviewing the Company’s correspondence with such tax authorities and evaluating certain third-party advice to support the Company’s evaluations and recorded positions. We evaluated the status of the ongoing U.S. Tax Court case and developments in the applicable regulatory environments to assess potential effects on the Company’s recorded positions. We assessed management’s consideration of current tax controversy, litigation and tax litigation trends. We analyzed the assumptions and data used by the Company when it determined the amount of tax benefits to recognize, including applicable interest and penalties, and we tested the accuracy of those underlying calculations. We have also evaluated the Company’s income tax disclosures included in Note 7 in relation to these matters. |
| | |
We have served as the Company’s auditor since 1980.
Los Angeles, California
February 14, 2025
AMGEN INC.
CONSOLIDATED STATEMENTS OF INCOME
Years ended December 31, 2024, 2023 and 2022
(In millions, except per-share data)
| | | | | | | | | | | | | | | | | |
| 2024 | | 2023 | | 2022 |
| Revenues: | | | | | |
| Product sales | $ | 32,026 | | | $ | 26,910 | | | $ | 24,801 | |
| Other revenues | 1,398 | | | 1,280 | | | 1,522 | |
| Total revenues | 33,424 | | | 28,190 | | | 26,323 | |
| | | | | |
| Operating expenses: | | | | | |
| Cost of sales | 12,858 | | | 8,451 | | | 6,406 | |
| Research and development | 5,964 | | | 4,784 | | | 4,434 | |
| | | | | |
| Selling, general and administrative | 7,096 | | | 6,179 | | | 5,414 | |
| Other | 248 | | | 879 | | | 503 | |
| Total operating expenses | 26,166 | | | 20,293 | | | 16,757 | |
| | | | | |
| Operating income | 7,258 | | | 7,897 | | | 9,566 | |
| | | | | |
| Other income (expense): | | | | | |
| Interest expense, net | (3,155) | | | (2,875) | | | (1,406) | |
| Other income (expense), net | 506 | | | 2,833 | | | (814) | |
| | | | | |
| Income before income taxes | 4,609 | | | 7,855 | | | 7,346 | |
| | | | | |
| Provision for income taxes | 519 | | | 1,138 | | | 794 | |
| | | | | |
| Net income | $ | 4,090 | | | $ | 6,717 | | | $ | 6,552 | |
| | | | | |
| Earnings per share: | | | | | |
| Basic | $ | 7.62 | | | $ | 12.56 | | | $ | 12.18 | |
| Diluted | $ | 7.56 | | | $ | 12.49 | | | $ | 12.11 | |
| | | | | |
| Weighted-average shares used in the calculation of earnings per share: | | | | | |
| Basic | 537 | | 535 | | 538 |
| Diluted | 541 | | 538 | | 541 |
See accompanying notes.
AMGEN INC.
CONSOLIDATED STATEMENTS OF COMPREHENSIVE INCOME
Years ended December 31, 2024, 2023 and 2022
(In millions)
| | | | | | | | | | | | | | | | | |
| 2024 | | 2023 | | 2022 |
| Net income | $ | 4,090 | | | $ | 6,717 | | | $ | 6,552 | |
| Other comprehensive income (loss), net of reclassification adjustments and taxes: | | | | | |
| (Losses) gains on foreign currency translation adjustments | (76) | | | 50 | | | 496 | |
| Gains (losses) on cash flow hedges | 309 | | | (150) | | | 67 | |
| | | | | |
| Other | (10) | | | 42 | | | 2 | |
| Other comprehensive income (loss), net of reclassification adjustments and taxes | 223 | | | (58) | | | 565 | |
| Comprehensive income | $ | 4,313 | | | $ | 6,659 | | | $ | 7,117 | |
See accompanying notes.
AMGEN INC.
CONSOLIDATED BALANCE SHEETS
December 31, 2024 and 2023
(In millions, except per-share data)
| | | | | | | | | | | |
| 2024 | | 2023 |
| ASSETS |
| Current assets: | | | |
| Cash and cash equivalents | $ | 11,973 | | | $ | 10,944 | |
| | | |
| Trade receivables, net | 6,782 | | | 7,268 | |
| Inventories | 6,998 | | | 9,518 | |
| Other current assets | 3,277 | | | 2,602 | |
| Total current assets | 29,030 | | | 30,332 | |
| | | |
| Property, plant and equipment, net | 6,543 | | | 5,941 | |
| Intangible assets, net | 27,699 | | | 32,641 | |
| Goodwill | 18,637 | | | 18,629 | |
| Other noncurrent assets | 9,930 | | | 9,611 | |
| Total assets | $ | 91,839 | | | $ | 97,154 | |
| | | |
| LIABILITIES AND STOCKHOLDERS’ EQUITY |
| Current liabilities: | | | |
| Accounts payable | $ | 1,908 | | | $ | 1,590 | |
| Accrued liabilities | 17,641 | | | 15,359 | |
| Current portion of long-term debt | 3,550 | | | 1,443 | |
| Total current liabilities | 23,099 | | | 18,392 | |
| | | |
| Long-term debt | 56,549 | | | 63,170 | |
| Long-term deferred tax liabilities | 1,616 | | | 2,354 | |
| Long-term tax liabilities | 2,349 | | | 4,680 | |
| Other noncurrent liabilities | 2,349 | | | 2,326 | |
| | | |
| Contingencies and commitments (see Note 20) | | | |
| | | |
| Stockholders’ equity: | | | |
| Common stock and additional paid-in capital; $0.0001 par value per share; 2,750.0 shares authorized; outstanding—536.9 shares in 2024 and 535.4 shares in 2023 | 33,533 | | | 33,070 | |
| Accumulated deficit | (27,590) | | | (26,549) | |
| Accumulated other comprehensive loss | (66) | | | (289) | |
| Total stockholders’ equity | 5,877 | | | 6,232 | |
| Total liabilities and stockholders’ equity | $ | 91,839 | | | $ | 97,154 | |
See accompanying notes.
AMGEN INC.
CONSOLIDATED STATEMENTS OF STOCKHOLDERS’ EQUITY
Years ended December 31, 2024, 2023 and 2022
(In millions, except per-share data)
| | | | | | | | | | | | | | | | | | | | | | | | | | | | | |
| Number
of shares
of common
stock | | Common
stock and
additional
paid-in capital | | Accumulated
deficit | | Accumulated other comprehensive loss | | Total |
| Balance as of December 31, 2021 | 558.3 | | | $ | 32,096 | | | $ | (24,600) | | | $ | (796) | | | $ | 6,700 | |
| | | | | | | | | |
| Net income | — | | | — | | | 6,552 | | | — | | | 6,552 | |
| Other comprehensive income, net of taxes | — | | | — | | | — | | | 565 | | | 565 | |
| Dividends declared on common stock ($7.95 per share) | — | | | — | | | (4,264) | | | — | | | (4,264) | |
| Issuance of common stock in connection with equity award programs | 1.8 | | | 138 | | | — | | | — | | | 138 | |
| Stock-based compensation expense | — | | | 419 | | | — | | | — | | | 419 | |
| Tax impact related to employee stock-based compensation expense | — | | | (139) | | | — | | | — | | | (139) | |
| Repurchases of common stock | (26.1) | | | — | | | (6,310) | | | — | | | (6,310) | |
| Balance as of December 31, 2022 | 534.0 | | | 32,514 | | | (28,622) | | | (231) | | | 3,661 | |
| | | | | | | | | |
| Net income | — | | | — | | | 6,717 | | | — | | | 6,717 | |
| Other comprehensive loss, net of taxes | — | | | — | | | — | | | (58) | | | (58) | |
| Dividends declared on common stock ($8.64 per share) | — | | | — | | | (4,644) | | | — | | | (4,644) | |
| Issuance of common stock in connection with equity award programs | 1.4 | | | 95 | | | — | | | — | | | 95 | |
| Stock-based compensation expense | — | | | 454 | | | — | | | — | | | 454 | |
| Equity awards issued for Horizon acquisition, net | — | | | 141 | | | — | | | — | | | 141 | |
| Tax impact related to employee stock-based compensation expense | — | | | (134) | | | — | | | — | | | (134) | |
| | | | | | | | | |
| Balance as of December 31, 2023 | 535.4 | | | 33,070 | | | (26,549) | | | (289) | | | 6,232 | |
| | | | | | | | | |
| Net income | — | | | — | | | 4,090 | | | — | | | 4,090 | |
| Other comprehensive income, net of taxes | — | | | — | | | — | | | 223 | | | 223 | |
| Dividends declared on common stock ($9.13 per share) | — | | | — | | | (4,931) | | | — | | | (4,931) | |
| Issuance of common stock in connection with equity award programs | 2.2 | | | 189 | | | — | | | — | | | 189 | |
| Stock-based compensation expense | — | | | 530 | | | — | | | — | | | 530 | |
| Tax impact related to employee stock-based compensation expense | — | | | (256) | | | — | | | — | | | (256) | |
| Repurchases of common stock | (0.7) | | | — | | | (200) | | | — | | | (200) | |
| | | | | | | | | |
| Balance as of December 31, 2024 | 536.9 | | | $ | 33,533 | | | $ | (27,590) | | | $ | (66) | | | $ | 5,877 | |
See accompanying notes.
AMGEN INC.
CONSOLIDATED STATEMENTS OF CASH FLOWS
Years ended December 31, 2024, 2023 and 2022
(In millions)
| | | | | | | | | | | | | | | | | |
| 2024 | | 2023 | | 2022 |
| Cash flows from operating activities: | | | | | |
| Net income | $ | 4,090 | | | $ | 6,717 | | | $ | 6,552 | |
| Noncash adjustments to reconcile net income to net cash provided by operating activities: | | | | | |
| Depreciation, amortization and other | 5,592 | | | 4,071 | | | 3,417 | |
| | | | | |
| Stock-based compensation expense | 530 | | | 431 | | | 401 | |
| Deferred income taxes | (1,228) | | | (1,273) | | | (1,198) | |
| Adjustments for equity method investments | (10) | | | 11 | | | 891 | |
| Loss on divestiture | — | | | — | | | 567 | |
| Losses (gains) on equity securities | 159 | | | (1,565) | | | 127 | |
| Other items, net | (8) | | | 563 | | | (303) | |
| Changes in operating assets and liabilities, net of acquisitions: | | | | | |
| Trade receivables, net | 441 | | | (1,015) | | | (746) | |
| Inventories | 2,532 | | | 491 | | | (742) | |
| Other assets | (652) | | | (564) | | | 258 | |
| Accounts payable | 312 | | | (402) | | | 154 | |
| Accrued income taxes, net | (1,011) | | | (1,031) | | | (647) | |
| Long-term tax liabilities | (492) | | | 371 | | | 229 | |
| Accrued liabilities | 92 | | | 953 | | | 97 | |
| Accrued sales incentives and allowance | 1,194 | | | 935 | | | 846 | |
| Other liabilities | (51) | | | (222) | | | (182) | |
| Net cash provided by operating activities | 11,490 | | | 8,471 | | | 9,721 | |
| Cash flows from investing activities: | | | | | |
| Cash paid for acquisitions, net of cash acquired | — | | | (26,989) | | | (3,839) | |
| Purchases of marketable securities | — | | | (1) | | | (2,587) | |
| Proceeds from sales of marketable securities | — | | | 1,123 | | | 98 | |
| Proceeds from maturities of marketable securities | — | | | 550 | | | 1,120 | |
| Purchases of property, plant and equipment | (1,096) | | | (1,112) | | | (936) | |
| Other | 50 | | | 225 | | | 100 | |
| Net cash used in investing activities | (1,046) | | | (26,204) | | | (6,044) | |
| Cash flows from financing activities: | | | | | |
| Net proceeds from issuance of debt | — | | | 27,777 | | | 6,919 | |
| Extinguishment of debt | (659) | | | (647) | | | (297) | |
| Repayment of debt | (3,600) | | | (1,454) | | | — | |
| Repurchases of common stock | (200) | | | — | | | (6,360) | |
| Dividends paid | (4,832) | | | (4,556) | | | (4,196) | |
| Other | (124) | | | (72) | | | (103) | |
| Net cash (used in) provided by financing activities | (9,415) | | | 21,048 | | | (4,037) | |
| Increase (decrease) in cash and cash equivalents | 1,029 | | | 3,315 | | | (360) | |
| Cash and cash equivalents at beginning of year | 10,944 | | | 7,629 | | | 7,989 | |
| Cash and cash equivalents at end of year | $ | 11,973 | | | $ | 10,944 | | | $ | 7,629 | |
See accompanying notes.
AMGEN INC.
NOTES TO CONSOLIDATED FINANCIAL STATEMENTS
December 31, 2024
1. Summary of significant accounting policies
Business
Amgen Inc. (including its consolidated subsidiaries, referred to as “Amgen,” “the Company,” “we,” “our” or “us”) is a global biotechnology pioneer that discovers, develops, manufactures and delivers innovative human therapeutics. We operate our business in one operating segment: human therapeutics. See Note 2, Segment and other information.
Principles of consolidation
The consolidated financial statements include the accounts of Amgen as well as its majority-owned subsidiaries. In determining whether we are the primary beneficiary of a variable interest entity, we consider whether we have both the power to direct activities of the entity that most significantly impact the entity’s economic performance and the obligation to absorb losses of, or the right to receive benefits from, the entity that could potentially be significant to that entity. We do not have any significant interests in any variable interest entities of which we are the primary beneficiary. All material intercompany transactions and balances have been eliminated in consolidation. Certain reclassifications have been made to prior periods in the consolidated financial statements and accompanying notes to conform with the current presentation.
Use of estimates
The preparation of consolidated financial statements in conformity with GAAP requires management to make estimates and assumptions that affect the amounts reported in the consolidated financial statements and accompanying notes. Actual results may differ from those estimates.
Revenues
Product sales and sales deductions
Revenue from product sales is recognized upon transfer of control of a product to a customer, generally upon delivery, based on an amount that reflects the consideration to which we expect to be entitled, net of accruals for estimated rebates, wholesaler chargebacks, discounts and other deductions (collectively, sales deductions) and returns established at the time of sale.
We analyze the adequacy of our accruals for sales deductions quarterly. Amounts accrued for sales deductions are adjusted when trends or significant events indicate that an adjustment is appropriate. Accruals are also adjusted to reflect actual results. Accruals for sales deductions are based primarily on estimates of the amounts earned or to be claimed on the related sales. These estimates take into consideration current contractual and statutory requirements, specific known market events and trends, internal and external historical data and forecasted customer buying patterns. Sales deductions are substantially product specific and therefore, for any given period, can be affected by the mix of products sold. Included in sales deductions are immaterial net adjustments related to prior-period sales due to changes in estimates.
Returns are estimated through comparison of historical return data with their related sales on a production lot basis. Historical rates of return are determined for each product and are adjusted for known or expected changes in the marketplace specific to each product, when appropriate. Historically, sales return provisions have amounted to less than 1% of gross product sales. Changes in estimates for prior-period sales return provisions have historically been immaterial.
Our payment terms vary by types and locations of customers and by products or services offered. Payment terms differ by jurisdiction and customer, but payment is generally required in a term ranging from 30 to 120 days from date of shipment or satisfaction of the performance obligation. For certain products or services and certain customer types, we may require payment before products are delivered or services are rendered to customers.
Indirect taxes collected from customers and remitted to government authorities that are related to sales of the Company’s products, primarily in Europe, are excluded from revenues.
As a practical expedient, sales commissions are expensed when incurred because the amortization period would have been one year or less. These costs are recorded in SG&A expense in the Consolidated Statements of Income.
Other revenues
Other revenues consist primarily of royalty income and corporate partner revenues. Royalties from licensees are based on third-party sales of licensed products and are recorded when the related third-party product sale occurs. Royalty income is estimated based on historical and forecasted sales trends. Corporate partner revenues are composed mainly of license fees and milestones earned and our share of commercial profits generated from collaborations. See Arrangements with multiple-performance obligations, discussed below.
Arrangements with multiple-performance obligations
From time to time, we enter into arrangements for the R&D, manufacture and/or commercialization of products and product candidates. Such arrangements may require us to deliver various rights, services and/or goods, including intellectual property rights/licenses, R&D services, manufacturing services and/or commercialization services. The underlying terms of these arrangements generally provide for consideration to Amgen in the form of nonrefundable, upfront license fees; development and commercial-performance milestone payments; royalty payments; and/or profit sharing.
In arrangements involving more than one performance obligation, each required performance obligation is evaluated to determine whether it qualifies as a distinct performance obligation based on whether (i) the customer can benefit from the good or service either on its own or together with other resources that are readily available and (ii) the good or service is separately identifiable from other promises in the contract. The consideration under the arrangement is then allocated to each separate distinct performance obligation based on its respective relative stand-alone selling price. The estimated selling price of each deliverable reflects our best estimate of what the selling price would be if the deliverable was regularly sold by us on a stand-alone basis or by using an adjusted market assessment approach if selling price on a stand-alone basis is not available.
The consideration allocated to each distinct performance obligation is recognized as revenue when control of the related goods or services is transferred. Consideration associated with at-risk substantive performance milestones is recognized as revenue when it is probable that a significant reversal of the cumulative revenue recognized will not occur. We utilize the sales- and usage-based royalty exception in arrangements that resulted from the license of intellectual property, recognizing revenues generated from royalties or profit sharing as the underlying sales occur.
Research and development costs
R&D costs are expensed as incurred and primarily include salaries, benefits and other staff-related costs; facilities and overhead costs; clinical trial and related clinical manufacturing costs; contract services and other outside costs; information systems’ costs; and amortization of acquired technology used in R&D with alternative future uses. R&D expenses also include costs and cost recoveries associated with third-party R&D arrangements, including upfront fees and milestones paid to third parties in connection with technologies that had not reached technological feasibility and did not have an alternative future use. Net payment or reimbursement of R&D costs is recognized when the obligations are incurred or as we become entitled to the cost recovery. See Note 9, Collaborations.
Selling, general and administrative costs
SG&A costs are primarily composed of salaries, benefits and other staff-related costs associated with sales and marketing, finance, legal and other administrative personnel; facilities and overhead costs; outside marketing, advertising and legal expenses; the U.S. healthcare reform federal excise fee on Branded Prescription Pharmaceutical Manufacturers and Importers; and other general and administrative costs. Advertising costs are expensed as incurred and were $987 million, $647 million and $841 million during the years ended December 31, 2024, 2023 and 2022, respectively. SG&A expenses also include costs and cost recoveries associated with marketing and promotion efforts under certain collaborative arrangements. Net payment or reimbursement of SG&A costs is recognized when the obligations are incurred or we become entitled to the cost recovery. See Note 9, Collaborations.
Leases
At inception of a contract, we determine whether an arrangement is or contains a lease. For all leases, we determine the classification as either operating or financing. Operating leases are included in Other noncurrent assets, Accrued liabilities and Other noncurrent liabilities in our Consolidated Balance Sheets.
ROU assets represent our right to use an underlying asset for the lease term, and lease liabilities represent our obligation to make lease payments under the lease. Lease recognition occurs at the commencement date, and lease liability amounts are based on the present value of lease payments made during the lease term. Our lease terms may include options to extend or terminate a lease when it is reasonably certain that we will exercise that option. Because most of our leases do not provide information to determine an implicit interest rate, we use our incremental borrowing rate in determining the present value of
lease payments. ROU assets also include any lease payments made prior to the commencement date less lease incentives received. Operating lease expense is recognized on a straight-line basis over the lease term.
We have lease agreements with both lease and nonlease components, which are generally accounted for together as a single lease component. In addition, for certain vehicle and equipment leases, we apply a portfolio approach to determine the lease term and discount rate.
Stock-based compensation
We have stock-based compensation plans under which various types of equity-based awards are granted, including RSUs, performance units and stock options. The fair values of RSUs and stock option awards, which are subject only to service conditions with graded vesting, are recognized as compensation expense, generally on a straight-line basis over the service period, net of estimated forfeitures. The fair values of performance unit awards are recognized as compensation expense, generally on a straight-line basis from the grant date to the end of the performance period. See Note 5, Stock-based compensation.
Income taxes
We provide for income taxes based on pretax income and applicable tax rates in the various jurisdictions in which we operate. Significant judgment is required in determining our provision for income taxes and income tax assets and liabilities, including evaluating uncertainties in the application of accounting principles and complex tax laws. Deferred income taxes are recorded for the expected tax consequences of temporary differences between the bases of assets and liabilities, as well as for loss and tax credit carryforwards for financial reporting purposes and amounts recognized for income tax purposes. We record a valuation allowance to reduce our deferred tax assets to the amount of future tax benefit that is more likely than not to be realized.
We recognize the tax benefit from an uncertain tax position only if it is more likely than not that the tax position will be sustained upon examination by tax authorities based on the technical merits of the position. The tax benefit recognized in the consolidated financial statements for a particular tax position is based on the largest benefit that is more likely than not to be realized. The amount of UTBs is adjusted as appropriate for changes in facts and circumstances, such as significant amendments to existing tax law, new regulations or interpretations by tax authorities, new information obtained during a tax examination or resolution of an examination. We recognize both accrued interest and penalties, when appropriate, related to UTBs in income tax expense. See Note 7, Income taxes.
Amgen is subject to current U.S. minimum tax on foreign subsidiaries. Based on our election beginning in 2022, we have established deferred taxes with respect to the U.S. minimum tax on the earnings of our foreign subsidiaries. This requires us to recognize deferred taxes for temporary basis differences expected to reverse as global intangible low-taxed income in future years. These are ongoing adjustments that are likely to occur in the future.
Acquisitions
We first determine whether a set of assets acquired constitutes a business and should be accounted for as a business combination. If the assets acquired do not constitute a business, we account for the transaction as an asset acquisition. Business combinations are accounted for by means of the acquisition method of accounting. Under the acquisition method, assets acquired, including IPR&D projects, and liabilities assumed are recorded in our consolidated financial statements at their respective fair values as of the acquisition date. The excess of the fair value of consideration transferred over the fair value of the net assets acquired is recorded as goodwill. Contingent consideration obligations incurred in connection with a business combination, including the assumption of an acquiree’s liability arising from an acquisition it consummated prior to our acquisition, are recorded at their fair values on the acquisition date and remeasured at their fair values each subsequent reporting period until the related contingencies have been resolved. The resulting changes in fair values are recorded in earnings. In contrast, asset acquisitions are accounted for by using a cost accumulation and allocation model. Under this model, the cost of the acquisition is allocated to the assets acquired and liabilities assumed. IPR&D projects with no alternative future use are recorded in R&D expense upon acquisition, and contingent consideration obligations incurred in connection with an asset acquisition are recorded when it is probable that they will occur and they can be reasonably estimated. See Note 4, Acquisitions and divestitures, and Note 18, Fair value measurement.
Cash equivalents
We consider cash equivalents to be only those investments that are highly liquid, that are readily convertible to cash and that mature within three months from the date of purchase.
Interest-bearing securities
We consider our interest-bearing securities investment portfolio as available-for-sale, and accordingly, these investments are recorded at fair value, with unrealized gains and losses recorded in AOCI. Investments with maturities beyond one year may be classified as short-term marketable securities in the Consolidated Balance Sheets due to their highly liquid nature and because they represent the Company’s investments that are available for current operations. See Note 10, Investments, and Note 18, Fair value measurement.
Inventories
Inventories are stated at the lower of cost or net realizable value. Cost, which includes amounts related to materials, labor and overhead, is determined in a manner that approximates the first-in, first-out method. Net realizable value is the estimated selling price in the ordinary course of business less reasonably predictable costs of completion, disposal and transportation. See Note 11, Inventories.
Derivatives
We recognize all of our derivative instruments as either assets or liabilities at fair value in the Consolidated Balance Sheets. The accounting for changes in the fair value of a derivative instrument depends on whether the derivative has been formally designated and qualifies as part of a hedging relationship under the applicable accounting standards and, further, on the type of hedging relationship. For derivatives formally designated as hedges, we assess both at inception and quarterly thereafter whether the hedging derivatives are highly effective in offsetting changes in either the fair value or cash flows of the hedged item. Our derivatives that are not designated and do not qualify as hedges are adjusted to fair value through current earnings. See Note 18, Fair value measurement, and Note 19, Derivative instruments.
Property, plant and equipment, net
Property, plant and equipment is recorded at historical cost, net of accumulated depreciation, amortization and, if applicable, impairment charges. We review our property, plant and equipment assets for impairment whenever events or changes in circumstances indicate that the carrying amount of an asset may not be recoverable. Depreciation is recorded over the assets’ useful lives on a straight-line basis. Leasehold improvements are amortized on a straight-line basis over the shorter of their estimated useful lives or lease terms. See Note 12, Property, plant and equipment.
Goodwill and other intangible assets
Finite-lived intangible assets are recorded at cost, net of accumulated amortization and, if applicable, impairment charges. Amortization of finite-lived intangible assets is recorded over the assets’ estimated useful lives on a straight-line basis or based on the pattern in which economic benefits are consumed, if reliably determinable. We review our finite-lived intangible assets for impairment whenever events or changes in circumstances indicate that the carrying amount of an asset may not be recoverable. See Note 13, Goodwill and other intangible assets.
The fair values of IPR&D projects acquired in a business combination that are not complete are capitalized and accounted for as indefinite-lived intangible assets until completion or abandonment of the related R&D efforts. Upon successful completion of the project, the capitalized amount is amortized over its estimated useful life. If a project is abandoned, all remaining capitalized amounts are written off immediately. Major risks and uncertainties are often associated with IPR&D projects because we are required to obtain regulatory approvals before marketing the resulting products. Such approvals require completing clinical trials that demonstrate a product candidate is safe and effective. Consequently, the eventual realized value of the acquired IPR&D project may vary from its fair value at the date of acquisition, and IPR&D impairment charges may occur in future periods.
Capitalized IPR&D projects are reviewed for impairment annually and whenever events or changes in circumstances indicate that the carrying amount may not be recoverable. We consider various factors for potential impairment, including the current legal and regulatory environment and the competitive landscape. Adverse clinical trial results, significant delays in obtaining marketing approval, the inability to bring a product to market and the introduction or advancement of competitors’ products could result in partial or full impairment of the related intangible assets.
We perform an impairment test of goodwill annually and whenever events or changes in circumstances indicate that the carrying amount may not be recoverable. To date, an impairment of goodwill has not been recorded. See Note 13, Goodwill and other intangible assets.
Contingencies
In the ordinary course of business, we are involved in various legal proceedings, government investigations and other matters that are complex in nature and have outcomes that are difficult to predict. Certain of these proceedings are discussed in Note 20, Contingencies and commitments. We record accruals for loss contingencies to the extent that we conclude it is probable that a liability has been incurred and the amount of the related loss can be reasonably estimated. We evaluate, on a quarterly basis, developments in legal proceedings and other matters that could cause an increase or decrease in the amount of the liability that has been accrued previously.
Foreign currency translation
The net assets of international subsidiaries whose functional currencies are not in U.S. dollars are translated into U.S. dollars using current exchange rates. The U.S. dollar effects that arise from translation of the net assets of these subsidiaries at changing rates are recognized in AOCI. The subsidiaries’ earnings are translated into U.S. dollars by using average exchange rates.
Equity investments
Marketable and nonmarketable equity securities
Investments in publicly traded equity securities with readily determinable fair values are recorded at quoted market prices for identical securities, with changes in fair value recorded in Other income (expense), net, in the Consolidated Statements of Income. Investments in equity securities without readily determinable fair values are recorded at cost less impairment, if any, adjusted for changes resulting from observable price changes in orderly transactions for identical or similar securities. Such adjustments are recorded in Other income (expense), net, in the Consolidated Statements of Income.
Equity method investments
Equity investments that give us the ability to exert significant influence, but not control, over an investee for which we have not elected the fair value option are accounted for under the equity method of accounting. In concluding whether we have the ability to exercise significant influence over an investee, we consider factors such as our ownership percentage, voting and other shareholder rights, board of directors representation and the existence of other collaborative or business relationships. The equity method of accounting requires us to allocate the difference between the fair value of securities acquired and our proportionate share of the carrying value of the underlying assets (the basis difference) to various items and amortize such differences over their useful lives. Our share of investees’ earnings or losses and amortization of basis differences, if any, are recorded one quarter in arrears in Other income (expense), net, in the Consolidated Statements of Income. We record impairment losses on our equity method investments if we deem the impairment to be other-than-temporary. We deem an impairment to be other-than-temporary based on various factors, including, but not limited to, the length of time the fair value is below the carrying value, volatility of the security price and our intent and ability to retain the investment to allow for a recovery in fair value.
For equity method investments for which we have elected the fair value option, changes in fair value are recorded in Other income (expense), net, in the Consolidated Statements of Income.
Additionally, we hold investments in limited partnerships, which primarily invest in early-stage biotechnology companies. As a practical expedient, such limited partnership investments are measured by using our proportionate share of the net asset values of the underlying investments held by the limited partnerships, with such changes included in Other income (expense), net, in the Consolidated Statements of Income.
Recently adopted accounting pronouncements
In November 2023, the FASB issued ASU No. 2023-07, Segment Reporting (Topic 280): Improvements to Reportable Segment Disclosures, to improve reportable segment disclosure requirements through enhanced disclosures about significant segment expenses and additional interim segment reporting disclosures, including for companies with a single reportable segment. The standard is effective for public business entities such as Amgen for annual periods beginning after December 15, 2023, and interim periods beginning after December 15, 2024, with retrospective application required for all prior periods presented. We adopted this standard in fiscal year 2024, which resulted in incremental segment disclosures. See Note 2, Segment and other information.
Recent accounting pronouncements not yet adopted
In December 2023, the FASB issued ASU No. 2023-09, Income Taxes (Topic 740): Improvements to Income Tax Disclosures, to improve income tax disclosure requirements by requiring more detailed information on several income tax
disclosures, such as enhancing disclosure of income taxes paid and requiring disaggregation of the effective income tax rate reconciliation. The standard is effective for public business entities such as Amgen for annual periods beginning after December 15, 2024. Early adoption is permitted, and entities may apply the standard prospectively or retrospectively. We are currently evaluating the impact of adopting this standard on our consolidated financial statements and related disclosures.
In November 2024, the FASB issued ASU No. 2024-03, Income Statement—Reporting Comprehensive Income—Expense Disaggregation Disclosures (Subtopic 220-40): Disaggregation of Income Statement Expenses, to improve disclosures about a public business entity’s expenses by requiring disaggregated disclosures of certain types of expenses, including purchases of inventory, employee compensation, depreciation, intangible amortization and depletion, as applicable, for each income statement caption that includes those expenses. In addition, the standard will require entities to define and disclose total selling expenses. The standard is effective for public business entities such as Amgen for annual periods beginning after December 15, 2026, and interim periods beginning after December 15, 2027. Early adoption is permitted, and entities may apply the standard prospectively or retrospectively. We are currently evaluating the impact of adopting this standard on our consolidated financial statements and related disclosures.
2. Segment and other information
We operate our business in one operating segment, which also represents one reportable segment: human therapeutics. Therefore, results of our operations are reported on a consolidated basis for purposes of segment reporting, consistent with internal management reporting.
The human therapeutics segment is engaged in the discovery, development, manufacturing and delivery of innovative medicines to fight some of the world’s toughest diseases. The Company’s Chief Executive Officer has been identified as the chief operating decision maker (CODM). The CODM manages and allocates resources on a consolidated basis. The determination of a single segment is consistent with the financial information regularly reviewed by the CODM for purposes of evaluating performance and allocating resources, which is reviewed on a consolidated basis.
As the Company’s CODM evaluates the financial performance of the Company’s human therapeutics segment on a consolidated basis, the measure of segment performance is net income, as reflected in the Consolidated Statements of Income. The CODM uses net income to allocate resources on a consolidated basis, which enables the CODM to assess both the overall level of resources available and optimize distribution of resources across functions, therapeutic areas, regions and research and development programs in line with our long-term corporate-wide strategic goals. In addition, the CODM may also evaluate financial performance based on net income adjusted for certain items that are unusual and non-recurring. As the Company manages its assets on a consolidated basis, the measure of segment assets is total assets, as reflected in the Consolidated Balance Sheets. See Note 10, Investments, for further information regarding equity method investments, and Net cash used in investing activities in the Consolidated Statements of Cash Flows for further information regarding capital expenditures.
The following table provides segment revenues, significant segment expenses, other segment items, reported segment net income and a reconciliation of segment net income to the Company’s total consolidated net income for the years ended December 31, 2024, 2023 and 2022 (in millions):
| | | | | | | | | | | | | | | | | | | | |
| | Years ended December 31, |
| | 2024 | | 2023 | | 2022 |
| Revenues: | | | | | | |
| Product sales | | $ | 32,026 | | | $ | 26,910 | | | $ | 24,801 | |
| Other revenues | | 1,398 | | | 1,280 | | | 1,522 | |
| Total revenues | | 33,424 | | | 28,190 | | | 26,323 | |
| | | | | | |
| Less: | | | | | | |
Manufacturing cost of sales(1)(2) | | 11,118 | | | 7,347 | | | 5,776 | |
Profit share and royalties in cost of sales(1) | | 1,740 | | | 1,104 | | | 630 | |
Research and development(1) | | 5,964 | | | 4,784 | | | 4,434 | |
Sales and marketing(1) | | 4,713 | | | 3,784 | | | 3,736 | |
General and administrative(1) | | 2,383 | | | 2,395 | | | 1,678 | |
Other segment items(3) | | 262 | | | (743) | | | 777 | |
| Equity in (income) loss of equity method investments | | (10) | | | 14 | | | 667 | |
| Interest income | | (510) | | | (1,225) | | | (127) | |
| Interest expense, net | | 3,155 | | | 2,875 | | | 1,406 | |
| Provision for income taxes | | 519 | | | 1,138 | | | 794 | |
| Segment net income | | 4,090 | | | 6,717 | | | 6,552 | |
| Reconciliation of profit or loss: | | | | | | |
| Adjustments and reconciling items | | — | | | — | | | — | |
| Consolidated net income | | $ | 4,090 | | | $ | 6,717 | | | $ | 6,552 | |
____________
(1) During the years ended December 31, 2024, 2023 and 2022, we recognized amortization expense on our intangible assets of $4.8 billion, $3.2 billion and $2.6 billion, respectively. Amortization of intangible assets is included primarily in Cost of sales in the Consolidated Statements of Income. In addition, during the years ended December 31, 2024, 2023 and 2022, we recognized depreciation and ROU asset amortization expense of $805 million, $824 million and $818 million, respectively.
(2) During the years ended December 31, 2024, 2023 and 2022, manufacturing cost of sales included amortization of step-up to fair value of inventory acquired in business combinations of $2.4 billion, $656 million and $30 million, respectively.
(3) Other segment items included in Segment net income primarily consists of: (i) fair value adjustments on equity securities (see Note 10, Investments) and (ii) net impairment charges on intangible assets (see Note 13, Goodwill and other intangible assets). For the year ended December 31, 2023, other segment items also included expenses related to our restructuring plan that was both initiated and substantially completed in 2023. For the year ended December 31, 2022, other segment items also included a loss on the divestiture of Gensenta (see Note 4, Acquisitions and divestitures).
3. Revenues
We operate our business in one operating segment: human therapeutics. Therefore, results of our operations are reported on a consolidated basis for purposes of segment reporting, consistent with internal management reporting. Revenues by product and by geographic area, based on customers’ locations, are presented below. The majority of ROW product sales relates to products sold in Europe.
Revenues were as follows (in millions):
| | | | | | | | | | | | | | | | | | | | | | | | | | | | | | | | | | | | | | | | | | | | | | | | | | | | | | | | |
| | Year ended December 31, 2024 | | Year ended December 31, 2023 | | Year ended December 31, 2022 |
| | U.S. | | ROW | | Total | | U.S. | | ROW | | Total | | U.S. | | ROW | | Total |
| Prolia | | $ | 2,885 | | | $ | 1,489 | | | $ | 4,374 | | | $ | 2,733 | | | $ | 1,315 | | | $ | 4,048 | | | $ | 2,465 | | | $ | 1,163 | | | $ | 3,628 | |
| ENBREL | | 3,288 | | | 28 | | | 3,316 | | | 3,650 | | | 47 | | | 3,697 | | | 4,044 | | | 73 | | | 4,117 | |
| XGEVA | | 1,507 | | | 718 | | | 2,225 | | | 1,527 | | | 585 | | | 2,112 | | | 1,480 | | | 534 | | | 2,014 | |
| Repatha | | 1,139 | | | 1,083 | | | 2,222 | | | 793 | | | 842 | | | 1,635 | | | 608 | | | 688 | | | 1,296 | |
| Otezla | | 1,699 | | | 427 | | | 2,126 | | | 1,777 | | | 411 | | | 2,188 | | | 1,886 | | | 402 | | | 2,288 | |
TEPEZZA(1) | | 1,835 | | | 16 | | | 1,851 | | | 441 | | | 7 | | | 448 | | | — | | | — | | | — | |
| EVENITY | | 1,131 | | | 432 | | | 1,563 | | | 809 | | | 351 | | | 1,160 | | | 533 | | | 254 | | | 787 | |
| KYPROLIS | | 948 | | | 555 | | | 1,503 | | | 921 | | | 482 | | | 1,403 | | | 850 | | | 397 | | | 1,247 | |
| Nplate | | 970 | | | 486 | | | 1,456 | | | 996 | | | 481 | | | 1,477 | | | 848 | | | 459 | | | 1,307 | |
| Aranesp | | 386 | | | 956 | | | 1,342 | | | 452 | | | 910 | | | 1,362 | | | 521 | | | 900 | | | 1,421 | |
| BLINCYTO | | 800 | | | 416 | | | 1,216 | | | 566 | | | 295 | | | 861 | | | 336 | | | 247 | | | 583 | |
KRYSTEXXA(1) | | 1,185 | | | — | | | 1,185 | | | 272 | | | — | | | 272 | | | — | | | — | | | — | |
| Vectibix | | 519 | | | 526 | | | 1,045 | | | 461 | | | 523 | | | 984 | | | 396 | | | 497 | | | 893 | |
| TEZSPIRE | | 972 | | | — | | | 972 | | | 567 | | | — | | | 567 | | | 170 | | | — | | | 170 | |
Other products(2) | | 4,037 | | | 1,593 | | | 5,630 | | | 3,307 | | | 1,389 | | | 4,696 | | | 3,606 | | | 1,444 | | | 5,050 | |
Total product sales(3) | | 23,301 | | | 8,725 | | | 32,026 | | | 19,272 | | | 7,638 | | | 26,910 | | | 17,743 | | | 7,058 | | | 24,801 | |
| Other revenues | | 562 | | | 836 | | | 1,398 | | | 534 | | | 746 | | | 1,280 | | | 852 | | | 670 | | | 1,522 | |
| Total revenues | | $ | 23,863 | | | $ | 9,561 | | | $ | 33,424 | | | $ | 19,806 | | | $ | 8,384 | | | $ | 28,190 | | | $ | 18,595 | | | $ | 7,728 | | | $ | 26,323 | |
____________
(1) TEPEZZA and KRYSTEXXA were acquired from the acquisition of Horizon on October 6, 2023, and include product sales in the periods after the acquisition date.
(2) Consists of product sales of our non-principal products.
(3) Hedging gains and losses, which are included in product sales, were not material for the years ended December 31, 2024, 2023 and 2022.
In the United States, we sell primarily to pharmaceutical wholesale distributors that we use as the principal means of distributing our products to healthcare providers. Outside the United States, we sell principally to healthcare providers and/or pharmaceutical wholesale distributors depending on the distribution practice in each country. We monitor the financial condition of our larger customers and limit our credit exposure by setting credit limits and, in certain circumstances, by requiring letters of credit or obtaining credit insurance.
For each of the years ended December 31, 2024, 2023 and 2022, we had product sales to three customers that individually accounted for more than 10% of total revenues. For the year ended December 31, 2024, on a combined basis, these customers accounted for 77% of total gross revenues as shown in the following table. Certain information with respect to these customers was as follows (dollar amounts in millions):
| | | | | | | | | | | | | | | | | |
| Years ended December 31, |
| 2024 | | 2023 | | 2022 |
| McKesson Corporation: | | | | | |
| Gross product sales | $ | 22,173 | | | $ | 19,035 | | | $ | 17,305 | |
| % of total gross revenues | 33 | % | | 33 | % | | 35 | % |
| Cencora, Inc.: | | | | | |
| Gross product sales | $ | 18,387 | | | $ | 16,625 | | | $ | 15,443 | |
| % of total gross revenues | 27 | % | | 29 | % | | 31 | % |
| Cardinal Health, Inc.: | | | | | |
| Gross product sales | $ | 11,278 | | | $ | 9,775 | | | $ | 8,319 | |
| % of total gross revenues | 17 | % | | 17 | % | | 16 | % |
As of December 31, 2024 and 2023, amounts due from these three customers each exceeded 10% of gross trade receivables and accounted for 70% and 75%, respectively, of net trade receivables on a combined basis. As of December 31, 2024 and 2023, 26% and 22%, respectively, of net trade receivables were due from customers located outside the United States, the majority of which were from Europe. Our total allowance for doubtful accounts as of December 31, 2024 and 2023, was not material.
4. Acquisitions and divestitures
Acquisition of Horizon Therapeutics plc
On October 6, 2023, Amgen completed its acquisition of Horizon by acquiring all of the outstanding shares of Horizon for $116.50 per share in cash, representing a total consideration of approximately $27.8 billion. Horizon is a global biotechnology company focused on the discovery, development and commercialization of medicines that address critical needs of patients impacted by rare, autoimmune and severe inflammatory diseases. The acquisition, which was accounted for as a business combination, aligns with Amgen’s core strategy of delivering innovative medicines that make a significant difference for patients suffering from serious diseases and strengthens Amgen’s leading rare disease portfolio by adding first-in-class, early-in-lifecycle medicines, including TEPEZZA for thyroid eye disease, KRYSTEXXA for chronic refractory gout and UPLIZNA for neuromyelitis optica spectrum disorder. Upon its acquisition, Horizon became a wholly owned subsidiary of Amgen, and its operations have been included in our consolidated financial statements commencing on the acquisition date.
During the year ended December 31, 2024, the purchase price allocation of the acquisition was completed and measurement period adjustments were finalized, which included changes to the purchase price allocation that resulted in a net increase of approximately $25 million to goodwill. The measurement period adjustments resulted primarily from adjustments to acquired assets and liabilities, including deferred tax attributes, based on facts and circumstances that existed as of the acquisition date and did not result from events subsequent to the acquisition date. The adjustments did not have a significant impact on Amgen’s results of operations during the year ended December 31, 2024, and would not have had a significant impact on prior-period results if the adjustments had been made as of the acquisition date.
The following table summarizes the final total consideration and allocated acquisition date fair values of assets acquired and liabilities assumed, inclusive of measurement-period adjustments (in millions):
| | | | | | | | |
| Cash and cash equivalents | | $ | 681 | |
| Inventories | | 5,014 | |
| Property, plant and equipment, net | | 318 | |
| Finite-lived intangible assets—developed-product-technology rights | | 19,590 | |
| IPR&D | | 1,060 | |
| Goodwill | | 3,136 | |
| Deferred tax asset | | 795 | |
| Deferred tax liability | | (2,488) | |
| Other assets and liabilities, net | | (273) | |
| Total assets acquired, net of liabilities assumed | | $ | 27,833 | |
The $27.8 billion total consideration for this transaction consisted of (i) cash consideration transferred to common shareholders of $26.7 billion; (ii) cash consideration transferred to vested and outstanding options, outstanding RSU awards and outstanding performance share unit awards of $523 million; (iii) fair value of Amgen replacement awards (based on conversion of outstanding employee RSU awards) of $180 million representing noncash consideration; and (iv) a portion of Horizon’s debt, settled by Amgen on the acquisition closing date, of $382 million. Amgen issued 1.7 million replacement equity awards with the original vesting conditions, the fair value of which was determined based on the acquisition date fair value based on the conversion calculation. See Note 5, Stock-based compensation.
The estimated fair values of $20.7 billion for the developed-product-technology rights and IPR&D intangible assets were determined using a multi-period excess earnings income approach that discounts expected future cash flows to present value by applying a discount rate that represents the estimated rate that market participants would use to value the intangible assets. The projected cash flows were based on certain assumptions attributable to the respective intangible asset, including estimates of future revenues and expenses, the time and resources needed to complete development and the probabilities of obtaining marketing approval from the FDA and other regulatory agencies. The developed-product-technology rights are being amortized on a straight-line basis over a weighted-average period of approximately 10 years from the acquisition date using the straight-line methodology.
The estimated fair value of the acquired inventory of $5.0 billion was determined using the comparative sales method, which uses actual or expected selling prices of inventory as the base amount to which adjustments for selling effort and a profit on the buyer’s effort are applied. The inventory fair value adjustment is being amortized using a weighted-average inventory turnover, which we estimate to approximate 27 months from the acquisition date.
A deferred tax liability of $2.5 billion was recognized on the temporary differences related to the book bases and tax bases of the acquired identifiable assets and assumed liabilities, primarily driven by the intangible assets acquired, as well as associated deferred tax asset for anticipatory foreign tax credits of $795 million.
The excess of the acquisition date consideration over the fair values assigned to the assets acquired and the liabilities assumed of $3.1 billion was recorded as goodwill, which is not deductible for tax purposes. The goodwill value represents expected synergies from the marketed products acquired and other benefits.
During the three months ended December 31, 2023, the Company incurred approximately $487 million of acquisition costs related to the closing of our Horizon acquisition, consisting of $167 million for share-based payments to settle non-vested equity awards attributable to post-combination services, severance and other employee-related expenses and $320 million for transaction costs. These costs were included primarily in SG&A expense in the Consolidated Statements of Income.
Supplemental Pro Forma Financial Information
The following table presents the unaudited supplemental pro forma results of a hypothetical combined Amgen and Horizon entity for the years ended December 31, 2023 and 2022, as if the acquisition of Horizon had occurred on January 1, 2022 (in millions):
| | | | | | | | | | | |
| Years ended December 31, |
| 2023 | | 2022 |
| Total revenues | $ | 30,969 | | | $ | 29,964 | |
| Net income | $ | 5,383 | | | $ | 2,381 | |
The unaudited supplemental pro forma combined financial information was prepared using the acquisition method of accounting and was based on the historical financial information of Amgen and Horizon. In order to reflect the occurrence of the acquisition on January 1, 2022, the unaudited supplemental pro forma financial information includes adjustments to reflect: (i) incremental amortization expense based on the fair values of the identifiable intangible assets and inventory step-up; (ii) the additional interest expense associated with the issuance of debt to finance the acquisition; (iii) the reclassification of transaction and other acquisition-related costs incurred during the three months ended December 31, 2023, to the year ended December 31, 2022; and (iv) the income tax impact using an estimated effective tax rate applied to the combined entity. The unaudited supplemental pro forma financial information is not necessarily indicative of what the consolidated results of operations would have been had the acquisition been completed on January 1, 2022. In addition, the unaudited pro forma financial information is not a projection of future results of operations of the combined company, nor does it reflect the expected realization of any synergies or cost savings associated with the acquisition.
Acquisition of ChemoCentryx, Inc.
On October 20, 2022, we acquired all of the outstanding stock of ChemoCentryx, a publicly traded biotechnology company focused on orally administered therapeutics to treat autoimmune diseases, inflammatory disorders and cancer, for $52.00 per share in cash, representing a total consideration of $3.9 billion. The acquisition, which was accounted for as a business combination, includes TAVNEOS, an orally administered selective complement 5a receptor inhibitor that was approved by the FDA in October 2021 as an adjunctive therapy for adults with severe active antineutrophil cytoplasmic autoantibody-associated vasculitis (ANCA-associated vasculitis). TAVNEOS is commercialized by us in the United States; for markets outside the United States, TAVNEOS is commercialized by a collaboration partner, and Amgen is entitled to royalties and milestones based on future sales of the product. Upon its acquisition, ChemoCentryx became a wholly owned subsidiary of Amgen, and its operations became included in our consolidated financial statements commencing on the acquisition date.
Measurement-period adjustments during the year ended December 31, 2023, included changes in the purchase price allocation and total consideration, resulting in a net decrease of approximately $18 million to goodwill. The adjustments did not have a significant impact on Amgen’s results of operations during the year ended December 31, 2023, and would not have had a significant impact on prior-period results if the adjustments had been made as of the acquisition date.
The following table summarizes the final total consideration and allocated acquisition date fair values of assets acquired and liabilities assumed, inclusive of measurement-period adjustments (in millions):
| | | | | | | | |
| | |
| Cash and cash equivalents | | $ | 86 | |
| Marketable securities | | 235 | |
| Inventories | | 41 | |
| Finite-lived intangible assets—developed-product-technology rights | | 3,499 | |
| Goodwill | | 649 | |
| Other liabilities, net | | (83) | |
| Deferred tax liability, net | | (502) | |
| Total assets acquired, net of liabilities assumed | | $ | 3,925 | |
The $3.9 billion total consideration consisted of (i) a $3.7 billion cash payment to outstanding common stockholders of ChemoCentryx and (ii) a $181 million cash payment to equity award holders of ChemoCentryx for services rendered prior to the acquisition date of October 20, 2022, under the ChemoCentryx equity award plans.
The developed-product-technology rights acquired relates to TAVNEOS, which is approved in the United States and the EU for ANCA-associated vasculitis. The estimated fair value of $3.5 billion was determined by using a multi-period excess earnings income approach that discounts expected future cash flows to present value by applying a discount rate that represents the estimated rate that market participants would use to value the intangible assets. The developed-product-technology rights are being amortized on a straight-line basis over a weighted-average period of approximately 11 years from the acquisition date using the straight-line methodology.
The estimated fair value of the acquired inventory of $41 million was determined using the comparative sales method, which uses actual or expected selling prices of inventory as the base amount to which adjustments for selling effort and a profit on the buyer’s effort are applied. The inventory fair value adjustment was amortized as inventory turned over, which we estimated to be approximately 13 months from the acquisition date.
A net deferred tax liability of $502 million was recognized on the temporary differences related to the book bases and tax bases of the acquired identifiable assets and assumed liabilities, primarily driven by the intangible assets acquired.
The excess of the acquisition date consideration over the fair values assigned to the assets acquired and the liabilities assumed of $649 million was recorded as goodwill, which is not deductible for tax purposes. The goodwill value is primarily attributable to the expected synergies from the TAVNEOS asset.
Divestiture of Gensenta İlaç Sanayi ve Ticaret A.Ş.
On November 2, 2022, we sold our shares in Gensenta, a subsidiary in Turkey, to Eczacıbaşı for net cash proceeds of approximately $130 million. The transaction was accounted for as a sale of a business and did not meet the criteria to be classified as discontinued operations. Upon closing of this transaction, net assets related to Gensenta of $86 million were divested, and during the year ended December 31, 2022, we recognized a loss on divestiture of $567 million recorded in Other operating expenses in the Consolidated Statements of Income, primarily due to the reclassification of $615 million of cumulative foreign currency translation losses from AOCI into earnings. See Note 17, Stockholders’ equity.
5. Stock-based compensation
Our Amended 2009 Plan authorizes for issuance to employees of Amgen and nonemployee members of our Board of Directors shares of our common stock pursuant to grants of equity-based awards, including RSUs, stock options and performance units. The pool of shares available under the Amended 2009 Plan is reduced by one share for each stock option granted and by 1.9 shares for other types of awards granted, including full-value awards. In general, if any shares subject to an award granted under the Amended 2009 Plan expire or become forfeited, terminated or canceled without the issuance of shares, the shares subject to such awards are added back into the authorized pool on the same basis that they were removed. In addition, under the Amended 2009 Plan, shares withheld to pay for minimum statutory tax obligations with respect to full-value awards are added back into the authorized pool on the basis of 1.9 shares. As of December 31, 2024, the Amended 2009 Plan provides for future grants and/or issuances of up to approximately 59 million shares of our common stock. Stock-based awards under our employee compensation plans are made with newly issued shares reserved for this purpose.
The following table reflects the components of stock-based compensation expense recognized in our Consolidated Statements of Income (in millions):
| | | | | | | | | | | | | | | | | |
| Years ended December 31, |
| 2024 | | 2023 | | 2022 |
| RSUs | $ | 351 | | | $ | 309 | | | $ | 227 | |
| Performance units | 133 | | | 121 | | | 132 | |
| Stock options | 46 | | | 43 | | | 42 | |
| Total stock-based compensation expense, pretax | 530 | | | 473 | | | 401 | |
| Tax benefit from stock-based compensation expense | (114) | | | (102) | | | (86) | |
| Total stock-based compensation expense, net of tax | $ | 416 | | | $ | 371 | | | $ | 315 | |
Restricted stock units and stock options
Eligible employees generally receive an annual grant of RSUs and, for certain executive-level employees, stock options, with the size and type of award generally determined by the employee’s salary grade and performance level. Certain management and professional-level employees typically receive RSU grants upon commencement of employment. Nonemployee members of our Board of Directors also receive an annual grant of RSUs.
Our RSU and stock option grants provide for accelerated or continued vesting in certain circumstances as defined in the plans and related grant agreements, including upon death, disability, termination in connection with a change in control and the retirement of employees who meet certain service and/or age requirements. RSUs and stock options generally vest in equal amounts on the second, third and fourth anniversaries of the grant date. RSUs accrue dividend equivalents, which are typically payable in shares only when and to the extent the underlying RSUs vest and are issued to the recipient.
Restricted stock units
The grant date fair value of an RSU equals the closing price of our common stock on the grant date, as RSUs accrue dividend equivalents during their vesting period, except with respect to certain holders of Horizon unvested RSUs who were granted replacement Amgen RSUs in 2023 under the original terms of the awards in connection with the Horizon acquisition based on the terms of the transaction. See Note 4, Acquisitions and divestitures. Subsequent to the Horizon acquisition, $42 million of the RSUs were accelerated and cash settled in 2023. The weighted-average grant date fair values per unit of RSUs granted (excluding replacement awards granted to Horizon RSU holders) during the years ended December 31, 2024, 2023 and 2022, were $301.36, $237.70 and $234.47, respectively.
The following table summarizes information regarding our RSUs:
| | | | | | | | | | | |
| Year ended December 31, 2024 |
| Units
(in millions) | | Weighted-average
grant date
fair value |
| Balance nonvested as of December 31, 2023 | 3.9 | | | $ | 246.43 | |
| Granted | 1.5 | | | $ | 301.36 | |
| Vested | (1.6) | | | $ | 250.80 | |
| Forfeited | (0.3) | | | $ | 267.28 | |
| Balance nonvested as of December 31, 2024 | 3.5 | | | $ | 265.07 | |
The total grant date fair values of RSUs that vested during the years ended December 31, 2024, 2023 and 2022, were $401 million, $309 million and $192 million, respectively.
Stock options
The exercise price of stock options is set as the closing price of our common stock on the grant date, and the related number of shares granted is fixed at that point in time. Awards expire 10 years from the date of grant. We use the Black–Scholes option valuation model to estimate the grant date fair value of stock options.
The weighted-average assumptions used in the option valuation model and the resulting weighted-average grant date fair values of stock options granted were as follows:
| | | | | | | | | | | | | | | | | |
| Years ended December 31, |
| 2024 | | 2023 | | 2022 |
| Closing price of our common stock on grant date | $ | 300.30 | | $ | 235.97 | | | $ | 230.92 | |
| Expected volatility (average of implied and historical volatility) | 26.9 | % | | 23.3 | % | | 24.5 | % |
| Expected life (in years) | 5.7 | | 5.7 | | 5.7 |
| Risk-free interest rate | 4.4 | % | | 3.4 | % | | 2.8 | % |
| Expected dividend yield | 3.2 | % | | 3.5 | % | | 3.3 | % |
| Fair value of stock options granted | $ | 69.34 | | $ | 41.86 | | | $ | 42.43 | |
The following table summarizes information regarding our stock options:
| | | | | | | | | | | | | | | | | | | | | | | |
| Year ended December 31, 2024 |
| Options
(in millions) | | Weighted-
average
exercise price | | Weighted-
average
remaining
contractual
life (in years) | | Aggregate
intrinsic
value
(in millions) |
| Balance unexercised as of December 31, 2023 | 5.9 | | | $ | 213.90 | | | | | |
| Granted | 0.8 | | | $ | 300.32 | | | | | |
| Exercised | (0.6) | | | $ | 201.22 | | | | | |
| Expired/forfeited | (0.2) | | | $ | 248.94 | | | | | |
| Balance unexercised as of December 31, 2024 | 5.9 | | | $ | 225.84 | | | 6.3 | | $ | 236 | |
| Vested or expected to vest as of December 31, 2024 | 5.7 | | | $ | 224.34 | | | 6.2 | | $ | 234 | |
| Exercisable as of December 31, 2024 | 3.1 | | | $ | 202.02 | | | 4.6 | | $ | 182 | |
The total intrinsic values of options exercised during the years ended December 31, 2024, 2023 and 2022, were $70 million, $33 million and $67 million, respectively. The actual tax benefits realized from tax deductions from option exercises during the years ended December 31, 2024, 2023 and 2022, were $15 million, $7 million and $14 million, respectively.
As of December 31, 2024, $510 million of unrecognized compensation cost was related to nonvested RSUs and unvested stock options, which is expected to be recognized over a weighted-average period of 1.8 years.
Performance units
Certain management-level employees also receive annual grants of performance units, which give the recipient the right to receive common stock that is contingent upon achievement of specified preestablished goals over the performance period, which is generally three years. The performance goals for the units granted during the years ended December 31, 2024, 2023 and 2022, which are accounted for as equity awards, are based on (i) Amgen’s total stockholder return compared with a comparator group of companies, which are considered market conditions and are therefore reflected in the grant date fair values of the units, and (ii) Amgen’s stand-alone financial performance measures, which are considered performance conditions. The expense recognized for awards is based on the grant date fair value of a unit multiplied by the number of units expected to be earned with respect to the related performance conditions, net of estimated forfeitures. Depending on the outcome of these performance goals, a recipient may ultimately earn a number of units greater or less than the number of units granted. Shares of our common stock are issued on a one-for-one basis for each performance unit earned. In general, performance unit awards vest at the end of the performance period. The performance award program provides for accelerated or continued vesting in certain circumstances as defined in the plan, including upon death, disability, a change in control and retirement of employees who meet certain service and/or age requirements. Performance units accrue dividend equivalents that are typically payable in shares only when and to the extent the underlying performance units vest and are issued to the recipient, including with respect to market and performance conditions that affect the number of performance units earned.
We use a payout simulation model to estimate the grant date fair value of performance units. The weighted-average assumptions used in the payout simulation model and the resulting weighted-average grant date fair values of performance units granted were as follows:
| | | | | | | | | | | | | | | | | |
| Years ended December 31, |
| 2024 | | 2023 | | 2022 |
| Closing price of our common stock on grant date | $ | 300.30 | | | $ | 235.97 | | | $ | 230.92 | |
| Volatility | 22.1 | % | | 21.6 | % | | 28.1 | % |
| Risk-free interest rate | 4.6 | % | | 3.7 | % | | 0.3 | % |
| Fair value of units granted | $ | 321.61 | | | $ | 252.49 | | | $ | 247.48 | |
The payout simulation model assumes correlations of returns of the stock prices of our common stock and the common stocks of the comparator groups of companies and stock price volatilities of the comparator groups of companies to simulate stockholder returns over the performance periods and their resulting impact on the payout percentages based on the contractual terms of the performance units.
As of December 31, 2024 and 2023, 1.4 million and 1.7 million performance units were outstanding, respectively, with weighted-average grant date fair values per unit of $263.86 and $251.41 per unit, respectively. During the year ended December 31, 2024, 0.3 million performance units with a weighted-average grant date fair value per unit of $321.61 were granted, and 0.1 million performance units with a weighted-average grant date fair value per unit of $261.03 were forfeited.
The total fair values of performance units paid during the years ended December 31, 2024, 2023 and 2022, were $182 million, $109 million and $150 million, respectively, based on the number of performance units earned multiplied by the closing stock price of our common stock on the last day of the performance period.
As of December 31, 2024, $87 million of unrecognized compensation cost was related to nonvested performance units, which is expected to be recognized over a weighted-average period of one year.
6. Defined contribution plan
The Company has defined contribution plans to which certain employees of the Company and participating subsidiaries may defer compensation for income tax purposes. Participants are eligible to receive matching contributions based on their contributions, in addition to other Company contributions. Defined contribution plan expenses were $375 million, $311 million and $243 million for the years ended December 31, 2024, 2023 and 2022, respectively.
7. Income taxes
Income before income taxes included the following (in millions):
| | | | | | | | | | | | | | | | | |
| Years ended December 31, |
| 2024 | | 2023 | | 2022 |
| Domestic | $ | 4,040 | | | $ | 4,047 | | | $ | 3,026 | |
| Foreign | 569 | | | 3,808 | | | 4,320 | |
| Total income before income taxes | $ | 4,609 | | | $ | 7,855 | | | $ | 7,346 | |
The provision for income taxes included the following (in millions):
| | | | | | | | | | | | | | | | | |
| Years ended December 31, |
| 2024 | | 2023 | | 2022 |
| Current provision: | | | | | |
| Federal | $ | 965 | | | $ | 1,524 | | | $ | 1,721 | |
| State | 33 | | | 43 | | | 44 | |
| Foreign | 759 | | | 786 | | | 304 | |
| Total current provision | 1,757 | | | 2,353 | | | 2,069 | |
| Deferred benefit: | | | | | |
| Federal | (860) | | | (1,124) | | | (1,185) | |
| State | (18) | | | (25) | | | (27) | |
| Foreign | (360) | | | (66) | | | (63) | |
| Total deferred benefit | (1,238) | | | (1,215) | | | (1,275) | |
| Total provision for income taxes | $ | 519 | | | $ | 1,138 | | | $ | 794 | |
Deferred income taxes reflect the tax effect of temporary differences between the carrying amounts of assets and liabilities for financial reporting purposes and the amounts used for income tax purposes, tax credit carryforwards and the tax effects of NOL carryforwards. As of December 31, 2022, we elected to establish deferred taxes with respect to the U.S. minimum tax on the earnings of our foreign subsidiaries for the reversal of temporary items in future years. Significant components of our deferred tax assets and liabilities were as follows (in millions):
| | | | | | | | | | | |
| December 31, |
| 2024 | | 2023 |
| Deferred income tax assets: | | | |
| NOL and credit carryforwards | $ | 1,352 | | | $ | 1,465 | |
| Accrued expenses | 693 | | | 668 | |
| Capitalized research and development expenses | 1,762 | | | 1,333 | |
| Investments | 1 | | | — | |
| Expenses capitalized for tax | 200 | | | 210 | |
| Earnings of foreign subsidiaries | 1,496 | | | 1,260 | |
| Stock-based compensation | 130 | | | 159 | |
| Other | 361 | | | 416 | |
| Total deferred income tax assets | 5,995 | | | 5,511 | |
| Valuation allowance | (1,019) | | | (957) | |
| Net deferred income tax assets | 4,976 | | | 4,554 | |
| | | |
| Deferred income tax liabilities: | | | |
| Acquired intangible assets | (2,573) | | | (3,028) | |
| Debt | (264) | | | (268) | |
| Fixed assets | (143) | | | (140) | |
| Fair value of acquired inventory | (114) | | | (349) | |
| Investments | — | | | (99) | |
| Other | (244) | | | (224) | |
| Total deferred income tax liabilities | (3,338) | | | (4,108) | |
| Total deferred income taxes, net | $ | 1,638 | | | $ | 446 | |
The Company has determined that unremitted foreign earnings are not considered indefinitely reinvested to the extent foreign earnings can be distributed without a significant tax cost. For the amount considered to be indefinitely reinvested, it is not practicable to determine the amount of the related deferred income tax liability due to the complexities of the tax laws and assumptions we would have to make.
Valuation allowances are provided to reduce the amounts of our deferred tax assets to an amount that is more likely than not to be realized based on an assessment of positive and negative evidence, including estimates of future taxable income necessary to realize future deductible amounts.
The valuation allowance increased in 2024, primarily driven by the Company’s expectation that certain state R&D credits will expire unused.
As of December 31, 2024, we had $195 million of federal tax credit carryforwards available to reduce future federal income taxes and have provided a $17 million valuation allowance on those federal tax credit carryforwards. The federal tax credit carryforwards expire between 2025 and 2045. We had $1.2 billion of state tax credit carryforwards available to reduce future state income taxes and have provided a valuation allowance for $1.1 billion of those state tax credit carryforwards. We had $83 million of tax credit carryforwards related to our foreign jurisdictions available to offset future foreign income taxes for which we have provided a $53 million valuation allowance.
As of December 31, 2024, we had $239 million of federal NOL carryforwards available to reduce future federal income taxes and have provided no valuation allowance on those federal NOL carryforwards. Additionally, $201 million of those federal NOL carryforwards have no expiration; the remainder begin to expire between 2025 and 2033. We had $957 million of state NOL carryforwards available to reduce future state income taxes and have provided a valuation allowance for
$822 million of those state NOL carryforwards. We had $1.1 billion of foreign NOL carryforwards available to reduce future foreign income taxes and have provided a valuation allowance for $164 million of those foreign NOL carryforwards. For the foreign NOLs with no valuation allowance provided, $160 million have no expiration; and the remainder will expire between 2025 and 2034.
The reconciliations of the total gross amounts of UTBs were as follows (in millions):
| | | | | | | | | | | | | | | | | |
| Years ended December 31, |
| 2024 | | 2023 | | 2022 |
| Beginning balance | $ | 4,012 | | | $ | 3,770 | | | $ | 3,546 | |
| Additions based on tax positions related to the current year | 188 | | | 196 | | | 151 | |
| Additions based on tax positions related to prior years | 9 | | | 56 | | | 90 | |
| Reductions for tax positions of prior years | (12) | | | — | | | (14) | |
| Reductions for expiration of statute of limitations | (9) | | | (4) | | | (3) | |
| Settlements | (4) | | | (6) | | | — | |
| Ending balance | $ | 4,184 | | | $ | 4,012 | | | $ | 3,770 | |
Substantially all of the UTBs as of December 31, 2024, if recognized, would affect our effective tax rate. As a result, we remeasured our UTBs accordingly.
Interest and penalties related to UTBs are included in our provision for income taxes. During the years ended December 31, 2024, 2023 and 2022, we recognized $282 million, $287 million and $189 million, respectively, of interest and penalties through the income tax provision in the Consolidated Statements of Income. The decrease in interest expense for the year ended December 31, 2024, was primarily due to an IRS advance deposit of $800 million paid during the first quarter of 2024. As of December 31, 2024 and 2023, accrued interest and penalties associated with UTBs were $1.6 billion and $1.4 billion, respectively.
The reconciliations between the federal statutory tax rate applied to income before income taxes and our effective tax rate were as follows:
| | | | | | | | | | | | | | | | | |
| Years ended December 31, |
| 2024 | | 2023 | | 2022 |
| Federal statutory tax rate | 21.0 | % | | 21.0 | % | | 21.0 | % |
| Foreign earnings | (5.8) | % | | (5.1) | % | | (5.6) | % |
| Foreign-derived intangible income | (3.0) | % | | (1.3) | % | | (1.3) | % |
| Credits, Puerto Rico excise tax | — | % | | 0.3 | % | | (2.8) | % |
| | | | | |
| Interest on uncertain tax positions | 4.2 | % | | 2.6 | % | | 1.9 | % |
| Credits, primarily federal R&D | (5.4) | % | | (3.5) | % | | (2.0) | % |
| | | | | |
| Other, net | 0.3 | % | | 0.5 | % | | (0.4) | % |
| Effective tax rate | 11.3 | % | | 14.5 | % | | 10.8 | % |
The effective tax rates for the years ended December 31, 2024, 2023 and 2022, differ from the federal statutory rate primarily due to impacts of the jurisdictional mix of income and expenses. Substantially all of the benefit to our effective tax rate from foreign earnings results from locations where the Company has significant manufacturing operations, including Singapore, Ireland and Puerto Rico, a territory of the United States that is treated as a foreign jurisdiction for U.S. tax purposes. Our operations in Puerto Rico are subject to tax incentive grants through 2050. Additionally, the Company’s operations conducted in Singapore are subject to a tax incentive grant through 2036. Our foreign earnings are also subject to U.S. tax at a reduced rate of 10.5% and to the OECD’s 15% global minimum tax in jurisdictions where enacted.
Beginning on January 1, 2023, we were no longer subject to a 4% excise tax in the U.S. territory of Puerto Rico on the gross intercompany purchase price of goods and services from our manufacturer in Puerto Rico. We qualify for and are subject to the alternative income tax rate on industrial development income of our Puerto Rico affiliate. In the United States, this income tax qualifies for foreign tax credits. Both this income tax and the associated foreign tax credits are generally recognized in our provision for income taxes. We accounted for the 2022 excise tax that was capitalized in Inventories as an expense in Cost of sales when the related products were sold in the first half of 2023, and a foreign tax credit was not recognized with respect to the excise tax expense in 2023. We did not have this excise tax exposure in 2024.
Income taxes paid during the years ended December 31, 2024, 2023 and 2022, were $2.9 billion, $3.4 billion and $2.4 billion, respectively.
One or more of our legal entities file income tax returns in the U.S. federal jurisdiction, various U.S. state jurisdictions and certain foreign jurisdictions. Our income tax returns are routinely examined by tax authorities in those jurisdictions. Significant disputes can arise and have arisen with tax authorities involving issues regarding the timing and amount of deductions, the use of tax credits and allocations of income and expenses among various tax jurisdictions because of differing interpretations of tax laws, regulations and relevant facts. Tax authorities, including the IRS, are becoming more aggressive and are particularly focused on such matters.
In 2017, we received an RAR and a modified RAR from the IRS for the years 2010–2012, proposing significant adjustments that primarily relate to the allocation of profits between certain of our entities in the United States and the U.S. territory of Puerto Rico. We disagreed with the proposed adjustments and calculations and pursued resolution with the IRS appeals office but were unable to reach resolution. In July 2021, we filed a petition in the U.S. Tax Court to contest two duplicate Statutory Notices of Deficiency (Notices) for the years 2010–2012 that we received in May and July 2021, which seek to increase our U.S. taxable income for the years 2010–2012 by an amount that would result in additional federal tax of approximately $3.6 billion plus interest. Any additional tax that could be imposed for the years 2010–2012 would be reduced by up to approximately $900 million of repatriation tax previously accrued on our foreign earnings.
In 2020, we received an RAR and a modified RAR from the IRS for the years 2013–2015, also proposing significant adjustments that primarily relate to the allocation of profits between certain of our entities in the United States and the U.S. territory of Puerto Rico similar to those proposed for the years 2010–2012. We disagreed with the proposed adjustments and calculations and pursued resolution with the IRS appeals office but were unable to reach resolution. In July 2022, we filed a petition in the U.S. Tax Court to contest a Notice for the years 2013–2015 that we previously reported receiving in April 2022 that seeks to increase our U.S. taxable income for the years 2013–2015 by an amount that would result in additional federal tax of approximately $5.1 billion, plus interest. In addition, the Notice asserts penalties of approximately $2.0 billion. Any additional tax that could be imposed for the years 2013–2015 would be reduced by up to approximately $2.2 billion of repatriation tax previously accrued on our foreign earnings.
We firmly believe that the IRS positions set forth in the 2010–2012 and 2013–2015 Notices are without merit. We are contesting the 2010–2012 and 2013–2015 Notices through the judicial process. The two cases were consolidated in the U.S. Tax Court on December 19, 2022. The trial began on November 4, 2024 and concluded on January 17, 2025. With the conclusion of the trial, the parties will file post-trial briefs and make closing arguments in 2025. The Company expects a decision from the Tax Court no earlier than 2026.
We are currently under examination by the IRS for the years 2016–2018 with respect to issues similar to those for the 2010 through 2015 period. We believe that the IRS may also seek to continue to audit similar issues related to the allocation of income between the United States and the U.S. territory of Puerto Rico for years beyond 2018. In addition, we are under examination by a number of state and foreign tax jurisdictions.
Final resolution of these complex matters is not likely within the next 12 months. We continue to believe our accrual for income tax liabilities is appropriate based on past experience, interpretations of tax law, application of the tax law to our facts and judgments about potential actions by tax authorities; however, due to the complexity of the provision for income taxes and uncertain resolution of these matters, the ultimate outcome of any tax matters may result in payments substantially greater than amounts accrued and could have a material adverse impact on our consolidated financial statements.
We are no longer subject to U.S. federal income tax examinations for years ended on or before December 31, 2009.
8. Earnings per share
The computation of basic EPS is based on the weighted-average number of our common shares outstanding. The computation of diluted EPS is based on the weighted-average number of our common shares outstanding and dilutive potential common shares, which primarily include shares that may be issued under our stock option, restricted stock and performance unit award programs (collectively, dilutive securities), as determined by using the treasury stock method.
The computations for basic and diluted EPS were as follows (in millions, except per-share data):
| | | | | | | | | | | | | | | | | |
| Years ended December 31, |
| 2024 | | 2023 | | 2022 |
| Income (Numerator): | | | | | |
| Net income for basic and diluted EPS | $ | 4,090 | | | $ | 6,717 | | | $ | 6,552 | |
| | | | | |
| Shares (Denominator): | | | | | |
| Weighted-average shares for basic EPS | 537 | | | 535 | | | 538 | |
| Effect of dilutive securities | 4 | | | 3 | | | 3 | |
| Weighted-average shares for diluted EPS | 541 | | | 538 | | | 541 | |
| | | | | |
| Basic EPS | $ | 7.62 | | | $ | 12.56 | | | $ | 12.18 | |
| Diluted EPS | $ | 7.56 | | | $ | 12.49 | | | $ | 12.11 | |
For each of the three years ended December 31, 2024, the number of antidilutive employee stock-based awards excluded from the computation of diluted EPS was not significant.
9. Collaborations
A collaborative arrangement is a contractual arrangement that involves a joint operating activity. Such arrangements involve two or more parties that are both (i) active participants in the activity and (ii) exposed to significant risks and rewards dependent on the commercial success of the activity.
From time to time, we enter into collaborative arrangements for the R&D, manufacture and/or commercialization of products and/or product candidates. These collaborations generally provide for nonrefundable upfront license fees, development and commercial-performance milestone payments, cost sharing, royalties and/or profit sharing. Our collaboration arrangements are performed with no guarantee of either technological or commercial success, and each arrangement is unique in nature. See Note 1, Summary of significant accounting policies, for additional discussion of revenues recognized under these types of arrangements. Operating expenses for costs incurred pursuant to these arrangements are reported in their respective expense line items in the Consolidated Statements of Income, net of any payments due to or reimbursements due from our collaboration partners, with such reimbursements being recognized at the time the party becomes obligated to pay. Our significant arrangements are discussed below.
AstraZeneca plc
We are in a collaboration with AstraZeneca for the development and commercialization of TEZSPIRE. Under our collaboration, both companies share global costs, profits and losses equally after payment by AstraZeneca of a mid-single-digit royalty to Amgen. AstraZeneca leads global development. In North America, Amgen, as the principal, recognizes product sales of TEZSPIRE in the United States, and AstraZeneca, as the principal, recognizes product sales of TEZSPIRE in Canada. AstraZeneca leads commercialization for TEZSPIRE outside North America. Amgen manufactures and supplies TEZSPIRE worldwide.
During the years ended December 31, 2024, 2023 and 2022, global profit and loss share expenses were $412 million, $310 million and $119 million, respectively, and were recorded in Cost of sales in the Consolidated Statements of Income. Net costs due to AstraZeneca for global development and commercialization were not material during the years ended December 31, 2024, 2023 and 2022. TEZSPIRE launched in the United States in January 2022.
UCB
We are in a collaboration with UCB for the development and commercialization of EVENITY. Under our collaboration, UCB has rights to lead commercialization for EVENITY in most countries in Europe. Amgen, as the principal, leads commercialization for EVENITY and recognizes product sales in all other territories, including the United States. Global development costs and commercialization profits and losses related to the collaboration are shared equally. Amgen manufactures and supplies EVENITY worldwide.
During the years ended December 31, 2024, 2023 and 2022, global profit and loss share expenses were $547 million, $396 million and $255 million, respectively, and were recorded in Cost of sales in the Consolidated Statements of Income. Net costs recovered from and due to UCB during the years ended December 31, 2024, 2023 and 2022, were not material.
BeiGene, Ltd.
In January 2020, we acquired an equity stake in BeiGene for approximately $2.8 billion in cash as part of a collaboration to expand our oncology presence in China. For additional information regarding our equity investment in BeiGene, see Note 10, Investments. Under the collaboration, BeiGene began selling XGEVA in 2020, BLINCYTO in 2021 and KYPROLIS in 2022 in China, and Amgen shares profits and losses equally during the initial product-specific commercialization periods; thereafter, product rights may revert to Amgen, and Amgen would pay royalties to BeiGene on sales in China of such products for a specified period. Amgen manufactures and supplies the collaboration products to BeiGene.
In addition, we jointly develop a portion of our oncology portfolio with BeiGene, which shares in global R&D costs by providing cash and development services of up to $1.25 billion. Upon regulatory approval, BeiGene will assume commercialization rights in China for a specified period, and Amgen and BeiGene will share profits and losses equally until certain of these product rights revert to Amgen. Upon return of the product rights, Amgen will pay royalties to BeiGene on sales in China for a specified period. For product sales outside China, Amgen also pays royalties to BeiGene.
During the years ended December 31, 2024, 2023 and 2022, net costs recovered from BeiGene for oncology product candidates were $122 million, $109 million and $199 million, respectively, and were recorded as an offset to R&D expense in the Consolidated Statements of Income. During the years ended December 31, 2024, 2023 and 2022, product sales from Amgen to BeiGene under the collaboration were $259 million, $125 million and $64 million, respectively, and were recorded in Product sales in the Consolidated Statements of Income. Profit and loss share expenses related to the initial product-specific commercialization period were not material during the years ended December 31, 2024, 2023 and 2022.
Kyowa Kirin Co., Ltd.
We are in a collaboration and licensing agreement with Kyowa Kirin to jointly develop and commercialize rocatinlimab, an anti-OX40 fully human monoclonal antibody, worldwide, except in Japan. Rocatinlimab is for the treatment of atopic dermatitis, with potential for treatment of other autoimmune diseases.
Under the terms of the agreement, we lead the global development, manufacture and commercialization of rocatinlimab, except in Japan. Kyowa Kirin will co-promote rocatinlimab with Amgen in the United States and have opt in rights to co-promote rocatinlimab in various other markets outside the United States, including in Europe and Asia.
We made an upfront payment of $400 million to Kyowa Kirin that was recognized in R&D expense in the third quarter of 2021. Amgen and Kyowa Kirin share equally the global development costs, except in Japan, and the U.S. commercialization costs. Outside the United States and Japan, any commercialization costs incurred by Kyowa Kirin will be reimbursed by Amgen. We may also be required to make milestone payments of up to $850 million contingent upon the achievement of certain regulatory events and commercial thresholds. We will also pay Kyowa Kirin significant double-digit royalties on global sales, except in Japan. During the years ended December 31, 2024, 2023 and 2022, net costs recovered from Kyowa Kirin were $166 million, $93 million and $23 million, respectively, and were recorded as an offset to R&D expense in the Consolidated Statements of Income.
Other
In addition to the collaborations discussed above, we have various other collaborations that are not individually significant to our business at this time. Pursuant to the terms of those agreements, we may be required to pay additional amounts, or we may receive additional amounts upon the achievement of various development and commercial milestones that in the aggregate could be significant. We may also incur or have reimbursed to us significant R&D costs if a related product candidate were to advance to late-stage clinical trials. In addition, if any products related to these collaborations are approved for sale, we may be required to pay significant royalties, or we may receive significant royalties on future sales. The payments of these amounts, however, are contingent upon the occurrence of various future events that have high degrees of uncertainty of occurrence.
10. Investments
Available-for-sale investments
The amortized cost, gross unrealized gains, gross unrealized losses and fair values of interest-bearing securities, which are classified as available for sale, by type of security were as follows (in millions):
| | | | | | | | | | | | | | | | | | | | | | | | | | |
| Types of securities as of December 31, 2024 | | Amortized
cost | | Gross
unrealized
gains | | Gross
unrealized
losses | | Fair
values |
| | | | | | | | |
| U.S. Treasury bills | | $ | 997 | | | $ | — | | | $ | — | | | $ | 997 | |
| | | | | | | | |
| | | | | | | | |
| | | | | | | | |
| | | | | | | | |
| | | | | | | | |
| | | | | | | | |
| | | | | | | | |
| Money market mutual funds | | 10,354 | | | — | | | — | | | 10,354 | |
| Other short-term interest-bearing securities | | 135 | | | — | | | — | | | 135 | |
| Total available-for-sale investments | | $ | 11,486 | | | $ | — | | | $ | — | | | $ | 11,486 | |
| | | | | | | | | | | | | | | | | | | | | | | | | | |
| Types of securities as of December 31, 2023 | | Amortized
cost | | Gross
unrealized
gains | | Gross
unrealized
losses | | Fair
values |
| | | | | | | | |
| U.S. Treasury bills | | $ | — | | | $ | — | | | $ | — | | | $ | — | |
| | | | | | | | |
| | | | | | | | |
| | | | | | | | |
| | | | | | | | |
| | | | | | | | |
| | | | | | | | |
| Money market mutual funds | | 10,266 | | | — | | | — | | | 10,266 | |
| Other short-term interest-bearing securities | | 138 | | | — | | | — | | | 138 | |
| | | | | | | | |
| | | | | | | | |
| Total available-for-sale investments | | $ | 10,404 | | | $ | — | | | $ | — | | | $ | 10,404 | |
The fair values of available-for-sale investments by location in the Consolidated Balance Sheets were as follows (in millions):
| | | | | | | | | | | | | | |
| | December 31, |
| Consolidated Balance Sheets locations | | 2024 | | 2023 |
| Cash and cash equivalents | | $ | 11,486 | | | $ | 10,404 | |
| | | | |
| | | | |
| Total available-for-sale investments | | $ | 11,486 | | | $ | 10,404 | |
Cash and cash equivalents in the above table excludes bank account cash of $487 million and $540 million as of December 31, 2024 and 2023, respectively.
All interest-bearing securities as of December 31, 2024 and 2023, mature in one year or less. For the years ended December 31, 2024, 2023 and 2022, interest income on these investments was $510 million, $1.2 billion and $127 million, respectively.
For the years ended December 31, 2024, 2023 and 2022, realized gains and losses on interest-bearing securities were not material. Realized gains and losses on interest-bearing securities are recorded in Other income (expense), net, in the Consolidated Statements of Income. The cost of securities sold is based on the specific-identification method.
The primary objective of our investment portfolio is to maintain safety of principal, prudent levels of liquidity and acceptable levels of risk. Our investment policy limits interest-bearing security investments to certain types of debt and money market instruments issued by institutions with investment-grade credit ratings, and it places restrictions on maturities and concentration by asset class and issuer.
Equity securities
BeiGene, Ltd.
On January 2, 2020, we acquired a 20.5% ownership interest in BeiGene for $2.8 billion, substantially all of which was attributed to the fair value of equity securities, and we began using the equity method of accounting for this investment. Since the fair value of equity securities acquired exceeded our proportionate share of the carrying value of BeiGene’s underlying net assets, we began amortizing the intangible assets that gave rise to this basis difference over their useful lives.
Effective January 30, 2023, we relinquished our right to appoint a director to BeiGene’s Board of Directors. We no longer have the ability to exert significant influence over BeiGene. As a result, in the first quarter of 2023, we began to account for our ownership interest as an equity security with a readily determinable fair value, which is carried at fair value with changes in fair value recorded in Other income (expense), net, in the Consolidated Statements of Income. See Note 18, Fair value measurement. During the years ended December 31, 2024 and 2023, we recognized unrealized gains of $82 million and $1.2 billion, respectively, in Other income (expense), net, in the Consolidated Statements of Income. As of December 31, 2024 and 2023, the fair values of our investment in BeiGene were $3.5 billion and $3.4 billion, respectively, and were included in Other noncurrent assets in the Consolidated Balance Sheets.
During the year ended December 31, 2022, under the equity method of accounting, the carrying value of the investment was reduced by our share of BeiGene’s net losses of $394 million and amortization of the basis difference of $190 million, with such amounts recognized in Other income (expense), net. In addition, during the year ended December 31, 2022, the carrying value increased by $11 million from the impact of other BeiGene ownership transactions. For information on a collaboration agreement we entered into with BeiGene in connection with this investment, see Note 9, Collaborations.
Subject to certain exceptions or otherwise agreed to by BeiGene, while Amgen holds at least 5.0% of BeiGene’s outstanding common stock, (A) we may only sell our BeiGene equity investment via: (i) a registered public offering, (ii) a sale under Rule 144 of the Securities Act of 1933 (the “Securities Act”) or (iii) a private sale exempt from registration requirements under the Securities Act, and (B) we may not sell more than 5.0% of BeiGene’s outstanding common stock in any rolling 12-month period.
Other equity securities
Excluding our equity investments in BeiGene (discussed above) and Neumora (discussed below), we held investments in other equity securities with readily determinable fair values (publicly traded securities) of $314 million and $494 million as of December 31, 2024 and 2023, respectively, which are included in Other noncurrent assets in the Consolidated Balance Sheets. For the years ended December 31, 2024, 2023 and 2022, net unrealized gains and losses on publicly traded securities resulted in a net loss of $21 million, a net gain of $98 million and a net loss of $165 million, respectively. Realized gains and losses on publicly traded securities for the years ended December 31, 2024, 2023 and 2022, were not material.
We held investments of $319 million and $309 million in equity securities without readily determinable fair values as of December 31, 2024 and 2023, respectively, which are included in Other noncurrent assets in the Consolidated Balance Sheets. For the years ended December 31, 2024, 2023 and 2022, gains due to upward adjustments and gains realized upon dispositions of these securities were not material. For the years ended December 31, 2024 and 2023, downward adjustments were not material. For the year ended December 31, 2022, downward adjustments to the carrying values of these securities were $67 million. Adjustments were based on observable price transactions.
Equity Method Investments
Neumora Therapeutics, Inc.
As of December 31, 2024 and 2023, our ownership interests in Neumora were approximately 21.9% and 23.2%, respectively, and the fair values of our investment were $375 million and $603 million, respectively, which are included in Other noncurrent assets in the Consolidated Balance Sheets. Although our equity investment qualifies us for the equity method of accounting, we have elected the fair value option to account for our investment. See Note 18, Fair value measurement. Under the fair value option, changes in the fair value of the investment are recognized through earnings in Other income (expense), net, in the Consolidated Statements of Income each reporting period. We believe the fair value option best reflects the economics of the underlying transaction. During the years ended December 31, 2024, 2023 and 2022, we recognized unrealized losses of $228 million and unrealized gains of $238 million and $105 million, respectively, for the change in fair values in Other income (expense), net, in the Consolidated Statements of Income.
On January 2, 2025, Neumora released results of a Phase 3 study of navacaprant, and Neumora’s stock price declined.
We are contractually restricted from selling more than 5.0% of Neumora’s outstanding common stock in any rolling 12-month period for as long as we hold at least 10.0% of their outstanding common stock, subject to certain exceptions or otherwise agreed to by Neumora.
Limited partnerships
We held limited partnership investments of $262 million and $251 million as of December 31, 2024 and 2023, respectively, which are included in Other noncurrent assets in the Consolidated Balance Sheets. These investments, which are primarily investment funds of early-stage biotechnology companies, are accounted for by using the equity method of accounting and are measured by using our proportionate share of the net asset values of the underlying investments held by the limited partnerships as a practical expedient. These investments are typically redeemable only through distributions upon liquidation of the underlying assets. As of December 31, 2024, unfunded additional commitments to be made for these investments during the next several years were $133 million. For the years ended December 31, 2024 and 2023, net gains and losses recognized from our limited partnership investments were not material. For the year ended December 31, 2022, net losses recognized from our limited partnership investments were $284 million.
11. Inventories
Inventories consisted of the following (in millions):
| | | | | | | | | | | |
| December 31, |
| 2024 | | 2023 |
| Raw materials | $ | 818 | | | $ | 993 | |
| Work in process | 4,120 | | | 5,747 | |
| Finished goods | 2,060 | | | 2,778 | |
Total inventories (1) | $ | 6,998 | | | $ | 9,518 | |
____________
(1) The decrease to Inventories during the year ended December 31, 2024, was primarily due to amortization of the inventory step-up to fair value related to acquired inventory from the Horizon acquisition. See Note 4, Acquisitions and divestitures.
12. Property, plant and equipment
Property, plant and equipment consisted of the following (dollar amounts in millions):
| | | | | | | | | | | | | | | | | |
| | | December 31, |
| Useful life (in years) | | 2024 | | 2023 |
| Land | — | | $ | 346 | | | $ | 339 | |
| Buildings and improvements | 10-40 | | 4,803 | | | 4,507 | |
| Manufacturing equipment | 8-12 | | 3,291 | | | 3,220 | |
| Laboratory equipment | 8-12 | | 1,345 | | | 1,346 | |
| Fixed equipment | 12 | | 2,592 | | | 2,526 | |
| Capitalized software | 3-5 | | 1,442 | | | 1,320 | |
| Other | 5-10 | | 1,059 | | | 941 | |
| Construction in progress | — | | 2,053 | | | 1,550 | |
| Property, plant and equipment, gross | | | 16,931 | | | 15,749 | |
| Less accumulated depreciation and amortization | | | (10,388) | | | (9,808) | |
| Property, plant and equipment, net | | | $ | 6,543 | | | $ | 5,941 | |
During the years ended December 31, 2024, 2023 and 2022, we recognized depreciation and amortization expense associated with our property, plant and equipment of $694 million, $685 million and $661 million, respectively.
Geographic information
Certain geographic information with respect to property, plant and equipment, net, was as follows (in millions):
| | | | | | | | | | | |
| | December 31, |
| | 2024 | | 2023 |
| U.S. | $ | 4,156 | | | $ | 3,658 | |
| Puerto Rico | 1,174 | | | 1,148 | |
| ROW | 1,213 | | | 1,135 | |
| Total property, plant and equipment, net | $ | 6,543 | | | $ | 5,941 | |
13. Goodwill and other intangible assets
Goodwill
The changes in the carrying amounts of goodwill were as follows (in millions):
| | | | | | | | | | | |
| December 31, |
| 2024 | | 2023 |
| Beginning balance | $ | 18,629 | | | $ | 15,529 | |
Changes to goodwill resulting from acquisitions, net(1) | 25 | | | 3,089 | |
| Foreign currency translation adjustments | (17) | | | 11 | |
| Ending balance | $ | 18,637 | | | $ | 18,629 | |
____________
(1) For 2024, changes to Goodwill consisted of measurement-period adjustments related to our Horizon acquisition. For 2023, changes to Goodwill primarily consisted of goodwill resulting from our Horizon acquisition. See Note 4, Acquisitions and divestitures.
Other intangible assets
Other intangible assets consisted of the following (in millions):
| | | | | | | | | | | | | | | | | | | | | | | | | | | | | | | | | | | |
| December 31, |
| | 2024 | | 2023 |
| | Gross
carrying
amounts | | Accumulated
amortization | | Other intangible
assets, net | | Gross
carrying
amounts | | Accumulated
amortization | | Other intangible
assets, net |
| Finite-lived intangible assets: | | | | | | | | | | | |
| Developed-product-technology rights | $ | 48,611 | | | $ | (22,594) | | | $ | 26,017 | | | $ | 48,631 | | | $ | (18,049) | | | $ | 30,582 | |
| Licensing rights | 3,875 | | | (3,392) | | | 483 | | | 3,865 | | | (3,265) | | | 600 | |
| Marketing-related rights | 1,202 | | | (1,202) | | | — | | | 1,339 | | | (1,264) | | | 75 | |
| R&D technology rights | 1,374 | | | (1,235) | | | 139 | | | 1,394 | | | (1,228) | | | 166 | |
| Total finite-lived intangible assets | 55,062 | | | (28,423) | | | 26,639 | | | 55,229 | | | (23,806) | | | 31,423 | |
| Indefinite-lived intangible assets: | | | | | | | | | | | |
| In-process research and development | 1,060 | | | — | | | 1,060 | | | 1,218 | | | — | | | 1,218 | |
| Total other intangible assets | $ | 56,122 | | | $ | (28,423) | | | $ | 27,699 | | | $ | 56,447 | | | $ | (23,806) | | | $ | 32,641 | |
Developed-product-technology rights consists of rights related to marketed products acquired in acquisitions. Licensing rights primarily consists of contractual rights to receive future milestone, royalty and profit-sharing payments; capitalized payments to third parties for milestones related to regulatory approvals to commercialize products; and upfront payments associated with royalty obligations for marketed products. Marketing-related rights primarily consists of rights related to the sale and distribution of marketed products. R&D technology rights pertain to technologies used in R&D that have alternative future uses.
IPR&D consists of R&D projects acquired in a business combination that are not complete at the time of acquisition due to remaining technological risks and/or lack of receipt of required regulatory approvals. All IPR&D projects have major risks
and uncertainties associated with the timely and successful completion of the development and commercialization of product candidates, including our ability to confirm safety and efficacy based on data from clinical trials, our ability to obtain necessary regulatory approvals and our ability to successfully complete these tasks within budgeted costs. We are not permitted to market a human therapeutic without obtaining regulatory approvals, and such approvals require the completion of clinical trials that demonstrate that a product candidate is safe and effective. In addition, the availability and extent of coverage and reimbursement from third-party payers, including government healthcare programs and private insurance plans as well as competitive product launches, affect the revenues a product can generate. Consequently, the eventual realized values, if any, of acquired IPR&D projects may vary from their estimated fair values. We review IPR&D projects for impairment annually, whenever events or changes in circumstances indicate that the carrying amounts may not be recoverable and upon the establishment of technological feasibility or regulatory approval. During the year ended December 31, 2023, the development of AMG 340 acquired in connection with our Teneobio acquisition was terminated, resulting in an impairment charge of $783 million, which was recognized in Other operating expenses in the Consolidated Statements of Income and included in Other items, net, in the Consolidated Statements of Cash Flows. See Note 18, Fair value measurement, for the impact on the related contingent consideration liability.
The Company monitors intangible assets for impairment on a quarterly basis. The Developed-product-technology rights intangible asset related to Otezla has a carrying value of $5.2 billion as of December 31, 2024. In January 2025, Otezla was selected by CMS for Medicare price setting under the IRA that will be applicable beginning on January 1, 2027. Future changes to the Company’s estimates of the impact of the price negotiations under the IRA, as well as regulatory, market and competitive developments, could unfavorably impact the Company’s ability to recover the carrying value of the related intangible asset.
During the years ended December 31, 2024, 2023 and 2022, we recognized amortization associated with our finite-lived intangible assets of $4.8 billion, $3.2 billion and $2.6 billion, respectively. Amortization of intangible assets is included primarily in Cost of sales in the Consolidated Statements of Income. The total estimated amortization for our finite-lived intangible assets for the years ending December 31, 2025, 2026, 2027, 2028 and 2029, is $4.5 billion, $3.9 billion, $3.9 billion, $2.9 billion and $2.2 billion, respectively.
14. Leases
We lease certain facilities and equipment related primarily to R&D, administrative and commercial activities. Leases with terms of 12 months or less are expensed as incurred and are not recorded in the Consolidated Balance Sheets.
Most leases include one or more options to renew, with renewal terms that may extend the lease term up to ten years. The exercise of lease renewal options is at our sole discretion. In addition, some of our lease agreements include rental payments adjusted periodically for inflation. Our lease agreements neither contain residual value guarantees nor impose significant restrictions or covenants. We sublease certain real estate to third parties. Our sublease portfolio consists of operating leases from former R&D and administrative spaces.
The following table summarizes information related to our leases, all of which are classified as operating, included in our Consolidated Balance Sheets (in millions):
| | | | | | | | | | | | | | |
| | December 31, |
| Consolidated Balance Sheets locations | | 2024 | | 2023 |
| Assets: | | | | |
| Other noncurrent assets | | $ | 557 | | | $ | 651 | |
| Liabilities: | | | | |
| Accrued liabilities | | $ | 107 | | | $ | 119 | |
| Other noncurrent liabilities | | 673 | | | 691 | |
| Total lease liabilities | | $ | 780 | | | $ | 810 | |
The components of net lease costs were as follows (in millions):
| | | | | | | | | | | | | | | | | | | | |
| | Years ended December 31, |
| Lease costs | | 2024 | | 2023 | | 2022 |
Operating(1) | | $ | 219 | | | $ | 208 | | | $ | 218 | |
| | | | | | |
| | | | | | |
| | | | | | |
| | | | | | |
| | | | | | |
| | | | | | |
| Sublease income | | (17) | | | (28) | | | (32) | |
| Total net lease costs | | $ | 202 | | | $ | 180 | | | $ | 186 | |
____________
(1) Includes short-term leases and variable lease costs, which were not material for the years ended December 31, 2024, 2023 and 2022.
Maturities of lease liabilities as of December 31, 2024, were as follows (in millions):
| | | | | | | | | | | | |
| Maturity dates | | Amounts | | | | |
| 2025 | | $ | 110 | | | | | |
| 2026 | | 129 | | | | | |
| 2027 | | 112 | | | | | |
| 2028 | | 91 | | | | | |
| 2029 | | 73 | | | | | |
| Thereafter | | 426 | | | | | |
Total lease payments(1) | | 941 | | | | | |
| Less imputed interest | | (161) | | | | | |
| Present value of lease liabilities | | $ | 780 | | | | | |
____________
(1) Includes future rental commitments for abandoned leases of $51 million. We expect to receive total future rental income of $54 million related to noncancellable subleases for abandoned facilities.
The weighted-average remaining lease terms and weighted-average discount rates were as follows:
| | | | | | | | | | | | | | |
| | | | December 31, |
| | | | 2024 | | 2023 |
| Weighted-average remaining lease term (in years) | | | | 9.3 | | 9.7 |
| Weighted-average discount rate | | | | 3.7 | % | | 3.6 | % |
Cash and noncash information related to our leases was as follows (in millions):
| | | | | | | | | | | | | | | | | | | | |
| | | | Years ended December 31, |
| | | | 2024 | | 2023 | | 2022 |
| Cash paid for amounts included in the measurement of lease liabilities: | | | | | | | | |
| Operating cash flows for operating leases | | | | $ | 156 | | | $ | 182 | | | $ | 171 | |
| | | | | | | | |
| | | | | | | | |
| ROU assets obtained in exchange for lease obligations: | | | | | | | | |
| Operating leases | | | | $ | 126 | | | $ | 245 | | | $ | 191 | |
| | | | | | | | |
As of December 31, 2024, there were no future lease payments for leases that have not yet commenced.
15. Other current assets and accrued liabilities
Other current assets consisted of the following (in millions):
| | | | | | | | | | | |
| December 31, |
| 2024 | | 2023 |
| Prepaid expenses | $ | 2,139 | | | $ | 1,647 | |
| Corporate partner receivables | 521 | | | 502 | |
| Tax receivables | 198 | | | 172 | |
| Other | 419 | | | 281 | |
| Total other current assets | $ | 3,277 | | | $ | 2,602 | |
Accrued liabilities consisted of the following (in millions):
| | | | | | | | | | | |
| December 31, |
| 2024 | | 2023 |
| Sales deductions | $ | 8,405 | | | $ | 7,271 | |
| Income taxes payable | 2,583 | | | 1,664 | |
| Employee compensation and benefits | 1,329 | | | 1,381 | |
| Dividends payable | 1,278 | | | 1,205 | |
| Accrued interest payable | 867 | | | 936 | |
| Other | 3,179 | | | 2,902 | |
| Total accrued liabilities | $ | 17,641 | | | $ | 15,359 | |
16. Financing arrangements
Our borrowings consisted of the following (in millions):
| | | | | | | | | | | |
| December 31, |
| 2024 | | 2023 |
| 3.625% notes due 2024 (3.625% 2024 Notes) | $ | — | | | $ | 1,400 | |
| 1.90% notes due 2025 (1.90% 2025 Notes) | 500 | | | 500 | |
| 5.25% notes due 2025 (5.25% 2025 Notes) | 2,000 | | | 2,000 | |
| Term loan due April 2025 | — | | | 2,000 | |
| 3.125% notes due 2025 (3.125% 2025 Notes) | 1,000 | | | 1,000 | |
| 2.00% €750 million notes due 2026 (2.00% 2026 euro Notes) | 777 | | | 828 | |
| 5.507% notes due 2026 (5.507% 2026 Notes) | 1,500 | | | 1,500 | |
| 2.60% notes due 2026 (2.60% 2026 Notes) | 1,250 | | | 1,250 | |
| Term loan due October 2026 | 1,800 | | | 2,000 | |
| 5.50% £475 million notes due 2026 (5.50% 2026 pound sterling Notes) | 595 | | | 605 | |
| 2.20% notes due 2027 (2.20% 2027 Notes) | 1,724 | | | 1,724 | |
| 3.20% notes due 2027 (3.20% 2027 Notes) | 1,000 | | | 1,000 | |
| 5.15% notes due 2028 (5.15% 2028 Notes) | 3,750 | | | 3,750 | |
| 1.65% notes due in 2028 (1.65% 2028 Notes) | 1,234 | | | 1,234 | |
| 3.00% notes due 2029 (3.00% 2029 Notes) | 750 | | | 750 | |
| 4.05% notes due 2029 (4.05% 2029 Notes) | 1,250 | | | 1,250 | |
| 4.00% £700 million notes due 2029 (4.00% 2029 pound sterling Notes) | 876 | | | 892 | |
| 2.45% notes due 2030 (2.45% 2030 Notes) | 1,250 | | | 1,250 | |
| 5.25% notes due 2030 (5.25% 2030 Notes) | 2,750 | | | 2,750 | |
| 2.30% notes due 2031 (2.30% 2031 Notes) | 1,250 | | | 1,250 | |
| 2.00% notes due 2032 (2.00% 2032 Notes) | 1,001 | | | 1,001 | |
| 3.35% notes due 2032 (3.35% 2032 Notes) | 1,000 | | | 1,000 | |
| 4.20% notes due 2033 (4.20% 2033 Notes) | 750 | | | 750 | |
| 5.25% notes due 2033 (5.25% 2033 Notes) | 4,250 | | | 4,250 | |
| 6.375% notes due 2037 (6.375% 2037 Notes) | 478 | | | 478 | |
| 6.90% notes due 2038 (6.90% 2038 Notes) | 254 | | | 254 | |
| 6.40% notes due 2039 (6.40% 2039 Notes) | 333 | | | 333 | |
| 3.15% notes due 2040 (3.15% 2040 Notes) | 1,668 | | | 1,803 | |
| 5.75% notes due 2040 (5.75% 2040 Notes) | 373 | | | 373 | |
| 2.80% notes due 2041 (2.80% 2041 Notes) | 776 | | | 949 | |
| 4.95% notes due 2041 (4.95% 2041 Notes) | 600 | | | 600 | |
| 5.15% notes due 2041 (5.15% 2041 Notes) | 729 | | | 729 | |
| 5.65% notes due 2042 (5.65% 2042 Notes) | 415 | | | 415 | |
| 5.60% notes due 2043 (5.60% 2043 Notes) | 2,750 | | | 2,750 | |
| 5.375% notes due 2043 (5.375% 2043 Notes) | 185 | | | 185 | |
| 4.40% notes due 2045 (4.40% 2045 Notes) | 2,250 | | | 2,250 | |
| 4.563% notes due 2048 (4.563% 2048 Notes) | 1,415 | | | 1,415 | |
| 3.375% notes due 2050 (3.375% 2050 Notes) | 1,764 | | | 2,132 | |
| 4.663% notes due 2051 (4.663% 2051 Notes) | 3,541 | | | 3,541 | |
| 3.00% notes due 2052 (3.00% 2052 Notes) | 890 | | | 999 | |
| 4.20% notes due 2052 (4.20% 2052 Notes) | 895 | | | 950 | |
| 4.875% notes due 2053 (4.875% 2053 Notes) | 1,000 | | | 1,000 | |
| 5.65% notes due 2053 (5.65% 2053 Notes) | 4,250 | | | 4,250 | |
| 2.77% notes due 2053 (2.77% 2053 Notes) | 940 | | | 940 | |
| | | | | | | | | | | |
| December 31, |
| 2024 | | 2023 |
| 4.40% notes due 2062 (4.40% 2062 Notes) | 1,165 | | | 1,200 | |
| 5.75% notes due 2063 (5.75% 2063 Notes) | 2,750 | | | 2,750 | |
| Other notes due 2097 | 100 | | | 100 | |
| Total principal amount of debt | 61,778 | | | 66,330 | |
| Unamortized bond discounts, premiums and issuance costs, net | (1,360) | | | (1,420) | |
| Fair value adjustments | (343) | | | (314) | |
| Other | 24 | | | 17 | |
| Total carrying value of debt | 60,099 | | | 64,613 | |
| Less current portion | (3,550) | | | (1,443) | |
| Total long-term debt | $ | 56,549 | | | $ | 63,170 | |
There are no material differences between the effective interest rates and coupon rates of our notes, except for the 4.563% 2048 Notes, the 4.663% 2051 Notes and the 2.77% 2053 Notes, which have effective interest rates of 6.3%, 5.6% and 5.2%, respectively.
Under the terms of all of our outstanding notes, except our Other notes due 2097, in the event of a change-in-control triggering event we may be required to purchase all or a portion of these debt securities at prices equal to 101% of the principal amounts of the notes plus accrued and unpaid interest. In addition, all of our outstanding notes—except our Other notes due 2097—may be redeemed at any time at our option—in whole or in part—at the principal amounts of the notes being redeemed plus accrued and unpaid interest and make-whole amounts, which are defined by the terms of the notes. Certain of the redeemable notes do not require the payment of make-whole amounts if redeemed during a specified period of time immediately prior to the maturity of the notes. Such time periods range from one month to six months prior to maturity, except for the 5.507% 2026 Notes, which may be redeemed without payment of the make-whole amount if redemption occurs after two years prior to maturity.
Debt issuances and acquisition-related financing
We did not issue debt securities during the year ended December 31, 2024.
In March 2023, in connection with the acquisition of Horizon (see Note 4, Acquisitions and divestitures—Acquisition of Horizon Therapeutics plc), we issued the following series of notes (in millions):
| | | | | |
| Principal Amount |
| 5.25% 2025 Notes | $ | 2,000 | |
| 5.507% 2026 Notes | 1,500 | |
| 5.15% 2028 Notes | 3,750 | |
| 5.25% 2030 Notes | 2,750 | |
| 5.25% 2033 Notes | 4,250 | |
| 5.60% 2043 Notes | 2,750 | |
| 5.65% 2053 Notes | 4,250 | |
| 5.75% 2063 Notes | 2,750 | |
| Total | $ | 24,000 | |
Also in connection with the acquisition of Horizon, we entered into a $4.0 billion term loan credit agreement in December 2022. In October 2023, in connection with the completion of the acquisition of Horizon, we borrowed $4.0 billion under the term loan credit agreement, of which $2.2 billion was repaid during 2024. As of December 31, 2024, we had $1.8 billion of borrowings outstanding under the term loan credit agreement, which has an interest rate of three-month SOFR plus 1.225% and is due in October 2026.
In 2022, we issued $7.0 billion of debt consisting of $750 million of the 3.00% 2029 Notes, $1.25 billion of the 4.05% 2029 Notes, $1.0 billion of the 3.35% 2032 Notes, $750 million of the 4.20% 2033 Notes, $1.0 billion of the 4.20% 2052 Notes, $1.0 billion of the 4.875% 2053 Notes and $1.25 billion of the 4.40% 2062 Notes. The 3.00% 2029 Notes were issued and used to finance eligible projects that met specified criteria to reduce our impact on the environment.
Debt extinguishment
In 2024, we repurchased an aggregate principal amount of our debt of $875 million, including portions of the 3.15% 2040 Notes, 2.80% 2041 Notes, 3.375% 2050 Notes, 3.00% 2052 Notes, 4.20% 2052 Notes and 4.40% 2062 Notes, for an aggregate cost of $659 million, which resulted in a $215 million gain on extinguishment of debt recorded in Other income (expense), net, in the Consolidated Statements of Income.
In 2023, we repurchased an aggregate principal amount of our debt of $881 million, including portions of the 2.00% 2032 Notes, 3.15% 2040 Notes, 2.80% 2041 Notes, 3.375% 2050 Notes, 3.00% 2052 Notes, 4.20% 2052 Notes and 4.40% 2062 Notes, for an aggregate cost of $647 million, which resulted in a $225 million gain on extinguishment of debt recorded in Other income (expense), net, in the Consolidated Statements of Income.
In 2022, we repurchased an aggregate principal amount of our debt of $378 million, including portions of the 2.20% 2027 Notes, 1.65% 2028 Notes, 2.00% 2032 Notes, 2.80% 2041 Notes and 3.00% 2052 Notes, for an aggregate cost of $297 million, which resulted in a $78 million gain on extinguishment of debt recorded in Other income (expense), net, in the Consolidated Statements of Income.
Debt repayments
In 2024, we repaid the full $2.0 billion aggregate principal amount on the term loan due April 2025, $200 million of the aggregate principal amount on the term loan due October 2026 and the full $1.4 billion aggregate principal amount of the 3.625% 2024 Notes.
In 2023, we repaid the full $750 million aggregate principal amount of the 2.25% 2023 Notes and the full CHF700 million aggregate principal amount ($704 million upon settlement of the related cross-currency swap) of the 0.41% 2023 Swiss franc Bonds.
In 2022, no debt was repaid or redeemed.
Interest rate swaps
To achieve a desired mix of fixed-rate and floating-rate debt, we enter into interest rate swap contracts that effectively convert fixed-rate interest coupons for certain of our debt instruments to floating SOFR-based coupons over the terms of the respective debt instruments. These interest rate swap contracts qualify and are designated as fair value hedges. For information regarding the terms of these contracts, see Note 19, Derivative instruments.
Cross-currency swaps
To hedge our exposure to foreign currency exchange rate risk associated with certain of our long-term notes denominated in foreign currencies, we entered into cross-currency swap contracts. The terms of these contracts outstanding as of December 31, 2024, effectively convert the interest payments and principal repayments on our 2.00% 2026 euro Notes, 5.50% 2026 pound sterling Notes and 4.00% 2029 pound sterling Notes from euros and pounds sterling to U.S. dollars. These cross-currency swap contracts have been designated as cash flow hedges. For information regarding the terms of these contracts, see Note 19, Derivative instruments. Cross-currency swap contracts associated with other foreign denominated debt previously outstanding were settled in connection with the repayment of such debt, as discussed above.
Shelf registration statement and other facilities
As of December 31, 2024, we have a commercial paper program that allows us to issue up to $2.5 billion of unsecured commercial paper to fund our working-capital needs. As of December 31, 2024 and 2023, we had no amounts outstanding under our commercial paper program.
In the first quarter of 2023, we amended and restated our syndicated, unsecured, revolving credit agreement, under which we may borrow up to $4.0 billion for general corporate purposes, including as a liquidity backstop for our commercial paper program. The commitments under the revolving credit agreement may be increased by up to $1.25 billion with the agreement of the banks. Each bank that is a party to the agreement has an initial commitment term of five years. This term may be extended for up to two additional one-year periods with the agreement of the banks. Annual commitment fees for this agreement are 0.09% of the unused portion of the facility based on our current credit rating. Generally, we would be charged interest for any amounts borrowed under this facility, based on our current credit rating, at (i) SOFR plus 1.01% or (ii) the highest of (A) the administrative agent bank base commercial lending rate, (B) the overnight federal funds rate plus 0.50% or (C) one-month SOFR plus 1.1%. As of December 31, 2024 and 2023, no amounts were outstanding under this facility.
In February 2023, we filed a shelf registration statement with the SEC that allows us to issue unspecified amounts of debt securities; common stock; preferred stock; warrants to purchase debt securities, common stock, preferred stock or depositary
shares; rights to purchase common stock or preferred stock; securities purchase contracts; securities purchase units; and depositary shares. Under this shelf registration statement, all of the securities available for issuance may be offered from time to time, with terms to be determined at the time of issuance. This shelf registration statement expires in February 2026.
Certain of our financing arrangements contain nonfinancial covenants. In addition, our revolving credit agreement and term loan agreement include a financial covenant, which requires us to maintain a specified minimum interest coverage ratio of (i) the sum of consolidated net income, interest expense, provision for income taxes, depreciation expense, amortization expense, unusual or nonrecurring charges and other noncash items (Consolidated EBITDA) to (ii) Consolidated Interest Expense, each as defined and described in the respective agreements. We were in compliance with all applicable covenants under these arrangements as of December 31, 2024.
Contractual maturities of debt obligations
The aggregate contractual maturities of our debt obligations as of December 31, 2024, were as follows (in millions):
| | | | | | | | |
| Maturity dates | | Amounts |
| 2025 | | $ | 3,500 | |
| 2026 | | 5,922 | |
| 2027 | | 2,724 | |
| 2028 | | 4,984 | |
| 2029 | | 2,876 | |
| Thereafter | | 41,772 | |
| Total | | $ | 61,778 | |
Interest costs
Interest costs are expensed as incurred except to the extent such interest is related to construction in progress, in which case interest is capitalized. Interest costs capitalized for the years ended December 31, 2024, 2023 and 2022, were not material. Interest paid, including the ongoing impact of interest rate and cross-currency swap contracts, during the years ended December 31, 2024, 2023 and 2022 was $3.3 billion, $2.4 billion and $1.2 billion, respectively.
17. Stockholders’ equity
Stock repurchase program
During the year ended December 31, 2024, we repurchased 0.7 million shares of our common stock for a total cost of $200 million under our stock repurchase program. During the year ended December 31, 2023, we did not repurchase any shares of our common stock under our stock repurchase program. During the year ended December 31, 2022, we repurchased 26.1 million shares of our common stock under our stock repurchase program, consisting primarily of 24.8 million shares received under ASR agreements, for a total cost of $6.3 billion. As of December 31, 2024, $6.8 billion remained available under our stock repurchase program.
Dividends
Our Board of Directors declared quarterly dividends per share of $2.25, $2.13 and $1.94, which were paid in each of the four quarters of 2024, 2023 and 2022, respectively.
Historically, we have declared dividends in December of each year, which were paid in the first quarter of the following fiscal year and in March, July and October, which were paid in the second, third and fourth quarters, respectively, of the same fiscal year. Additionally, on December 10, 2024, the Board of Directors declared a quarterly cash dividend of $2.38 per share of common stock, which will be paid in March 2025, to all stockholders of record as of the close of business on February 14, 2025.
Accumulated other comprehensive loss
The components of AOCI were as follows (in millions):
| | | | | | | | | | | | | | | | | | | | | | | | | |
| Foreign currency translation adjustments | | Cash flow
hedges | | | | Other | | AOCI |
| Balance as of December 31, 2021 | $ | (844) | | | $ | 61 | | | | | $ | (13) | | | $ | (796) | |
| Foreign currency translation adjustments | 496 | | | — | | | | | — | | | 496 | |
| Unrealized gains | — | | | 84 | | | | | — | | | 84 | |
| Reclassification adjustments to earnings | — | | | 2 | | | | | — | | | 2 | |
| Other | — | | | — | | | | | 2 | | | 2 | |
| Income taxes | — | | | (19) | | | | | — | | | (19) | |
| Balance as of December 31, 2022 | (348) | | | 128 | | | | | (11) | | | (231) | |
| | | | | | | | | |
| Foreign currency translation adjustments | 50 | | | — | | | | | — | | | 50 | |
| Unrealized gains | — | | | 28 | | | | | — | | | 28 | |
| Reclassification adjustments to earnings | — | | | (222) | | | | | — | | | (222) | |
| Other | — | | | — | | | | | 42 | | | 42 | |
| Income taxes | — | | | 44 | | | | | — | | | 44 | |
| Balance as of December 31, 2023 | (298) | | | (22) | | | | | 31 | | | (289) | |
| | | | | | | | | |
| Foreign currency translation adjustments | (76) | | | — | | | | | — | | | (76) | |
| Unrealized gains | — | | | 506 | | | | | — | | | 506 | |
| Reclassification adjustments to earnings | — | | | (117) | | | | | — | | | (117) | |
| Other | — | | | — | | | | | (10) | | | (10) | |
| Income taxes | — | | | (80) | | | | | — | | | (80) | |
| Balance as of December 31, 2024 | $ | (374) | | | $ | 287 | | | | | $ | 21 | | | $ | (66) | |
With respect to the table above, income tax expenses or benefits for unrealized gains and losses and the related reclassification adjustments to earnings for cash flow hedges were a $105 million expense and a $25 million benefit in 2024, a $6 million expense and a $50 million benefit in 2023 and a $19 million expense and a $0 million benefit in 2022, respectively.
Reclassifications out of AOCI and into earnings were as follows (in millions):
| | | | | | | | | | | | | | | | | | | | | | | | | | |
| | Years ended December 31, | | |
| Components of AOCI | | 2024 | | 2023 | | 2022 | | Consolidated Statements of Income locations |
| Cash flow hedges: | | | | | | | | |
| Foreign currency contract gains | | $ | 192 | | | $ | 180 | | | $ | 231 | | | Product sales |
| Cross-currency swap contract (losses) gains | | (75) | | | 42 | | | (233) | | | Other income (expense), net |
| | | | | | | | |
| | 117 | | | 222 | | | (2) | | | Income before income taxes |
| | (25) | | | (50) | | | — | | | Provision for income taxes |
| | $ | 92 | | | $ | 172 | | | $ | (2) | | | Net income |
| | | | | | | | |
| | | | | | | | |
| | | | | | | | |
| | | | | | | | |
Other
In addition to common stock, our authorized capital includes 5 million shares of preferred stock, $0.0001 par value. As of December 31, 2024 and 2023, no shares of preferred stock were issued or outstanding.
18. Fair value measurement
To estimate the fair value of our financial assets and liabilities, we use valuation approaches within a hierarchy that maximizes the use of observable inputs and minimizes the use of unobservable inputs by requiring that observable inputs be used when available. Observable inputs are inputs that market participants would use in pricing an asset or liability based on market data obtained from sources independent of the Company. Unobservable inputs are inputs that reflect the Company’s assumptions about the inputs that market participants would use in pricing an asset or liability and are developed based on the best information available in the circumstances. The fair value hierarchy is divided into three levels based on the source of inputs as follows:
| | | | | | | | |
| Level 1 | — | Valuations based on unadjusted quoted prices in active markets for identical assets or liabilities that the Company has the ability to access |
| Level 2 | — | Valuations for which all significant inputs are observable either directly or indirectly—other than Level 1 inputs |
| Level 3 | — | Valuations based on inputs that are unobservable and significant to the overall fair value measurement |
The availability of observable inputs can vary among the various types of financial assets and liabilities. To the extent that the valuation is based on models or inputs that are less observable or unobservable in the market, the determination of fair value requires more judgment. In certain cases, the inputs used for measuring fair value may fall into different levels of the fair value hierarchy. In such cases, for financial statement disclosure purposes, the level in the fair value hierarchy within which the fair value measurement is categorized is based on the lowest level of input used that is significant to the overall fair value measurement.
The fair values of each major class of the Company’s financial assets and liabilities measured at fair value on a recurring basis were as follows (in millions):
| | | | | | | | | | | | | | | | | | | | | | | | | | |
| Fair value measurement as of December 31, 2024, using: | | Quoted prices in
active markets for
identical assets
(Level 1) | | Significant other
observable
inputs
(Level 2) | | Significant
unobservable
inputs
(Level 3) | | Total |
| Assets: | | | | | | | | |
| Available-for-sale securities: | | | | | | | | |
| | | | | | | | |
| U.S. Treasury bills | | $ | — | | | $ | 997 | | | $ | — | | | $ | 997 | |
| | | | | | | | |
| | | | | | | | |
| | | | | | | | |
| | | | | | | | |
| | | | | | | | |
| | | | | | | | |
| Money market mutual funds | | 10,354 | | | — | | | — | | | 10,354 | |
| Other short-term interest-bearing securities | | — | | | 135 | | | — | | | 135 | |
| | | | | | | | |
| | | | | | | | |
| Equity securities | | 4,188 | | | — | | | — | | | 4,188 | |
| Derivatives: | | | | | | | | |
| Foreign currency forward contracts | | — | | | 420 | | | — | | | 420 | |
| Cross-currency swap contracts | | — | | | — | | | — | | | — | |
| Interest rate swap contracts | | — | | | — | | | — | | | — | |
| Total assets | | $ | 14,542 | | | $ | 1,552 | | | $ | — | | | $ | 16,094 | |
| Liabilities: | | | | | | | | |
| Derivatives: | | | | | | | | |
| Foreign currency forward contracts | | $ | — | | | $ | 8 | | | $ | — | | | $ | 8 | |
| Cross-currency swap contracts | | — | | | 483 | | | — | | | 483 | |
| Interest rate swap contracts | | — | | | 531 | | | — | | | 531 | |
| | | | | | | | |
| Contingent consideration obligations | | — | | | — | | | 106 | | | 106 | |
| Total liabilities | | $ | — | | | $ | 1,022 | | | $ | 106 | | | $ | 1,128 | |
| | | | | | | | | | | | | | | | | | | | | | | | | | |
| Fair value measurement as of December 31, 2023, using: | | Quoted prices in
active markets for
identical assets
(Level 1) | | Significant other
observable
inputs
(Level 2) | | Significant
unobservable
inputs
(Level 3) | | Total |
| Assets: | | | | | | | | |
| Available-for-sale securities: | | | | | | | | |
| | | | | | | | |
| U.S. Treasury bills | | $ | — | | | $ | — | | | $ | — | | | $ | — | |
| | | | | | | | |
| | | | | | | | |
| | | | | | | | |
| | | | | | | | |
| | | | | | | | |
| | | | | | | | |
| Money market mutual funds | | 10,266 | | | — | | | — | | | 10,266 | |
| Other short-term interest-bearing securities | | — | | | 138 | | | — | | | 138 | |
| | | | | | | | |
| Equity securities | | 4,514 | | | — | | | — | | | 4,514 | |
| Derivatives: | | | | | | | | |
| Foreign currency forward contracts | | — | | | 145 | | | — | | | 145 | |
| Cross-currency swap contracts | | — | | | — | | | — | | | — | |
| Interest rate swap contracts | | — | | | — | | | — | | | — | |
| Total assets | | $ | 14,780 | | | $ | 283 | | | $ | — | | | $ | 15,063 | |
| | | | | | | | |
| Liabilities: | | | | | | | | |
| Derivatives: | | | | | | | | |
| Foreign currency forward contracts | | $ | — | | | $ | 116 | | | $ | — | | | $ | 116 | |
| Cross-currency swap contracts | | — | | | 405 | | | — | | | 405 | |
| Interest rate swap contracts | | — | | | 571 | | | — | | | 571 | |
| | | | | | | | |
| Contingent consideration obligations | | — | | | — | | | 96 | | | 96 | |
| Total liabilities | | $ | — | | | $ | 1,092 | | | $ | 96 | | | $ | 1,188 | |
Interest-bearing and equity securities
The fair values of our U.S. Treasury bills are determined by utilizing third-party pricing services, which obtain pricing data from active market makers and brokers. The fair values of our money market mutual funds and equity investments in publicly traded securities, including our equity investments in BeiGene and Neumora, as of December 31, 2024 and 2023, are based on quoted market prices in active markets, with no valuation adjustment.
Derivatives
All of our foreign currency forward contracts, cross-currency swap contracts and interest rate swap contracts are with counterparties that have minimum credit ratings of A– or equivalent by S&P, Moody’s or Fitch. We estimate the fair values of these contracts by taking into consideration valuations obtained from a third-party valuation service that uses an income-based industry-standard valuation model for which all significant inputs are observable either directly or indirectly. These inputs, as applicable, include foreign currency exchange rates, SOFR, swap rates, obligor credit default swap rates and cross-currency basis swap spreads. Certain inputs, when applicable, are at commonly quoted intervals. See Note 19, Derivative instruments.
Contingent consideration obligations
As a result of our business acquisitions, we have incurred contingent consideration obligations as discussed below. The contingent consideration obligations are recorded at their fair values by using probability-adjusted discounted cash flows, and we revalue these obligations each reporting period until the related contingencies have been resolved. The fair value measurements of these obligations are based on significant unobservable inputs related to licensing rights and product candidates acquired in business combinations, and they are reviewed quarterly by management in our R&D and commercial sales organizations. The inputs include, as applicable, estimated probabilities and the timing of achieving specified development, regulatory and commercial milestones as well as estimated annual sales. Significant changes that increase or decrease the probabilities of achieving the related development, regulatory and commercial events or that shorten or lengthen the time required to achieve such events or that increase or decrease estimated annual sales would result in corresponding increases or decreases in the fair values of the obligations, as applicable. Changes in the fair values of contingent consideration obligations are recognized in Other operating expenses in the Consolidated Statements of Income.
Changes in the carrying amounts of contingent consideration obligations were as follows (in millions):
| | | | | | | | | | | | | | | | | | | | |
| | Years ended December 31, |
| | 2024 | | 2023 | | 2022 |
| Beginning balance | | $ | 96 | | | $ | 270 | | | $ | 342 | |
| | | | | | |
| Payments | | (8) | | | (9) | | | (7) | |
| Net changes in valuations | | 18 | | | (165) | | | (65) | |
| Ending balance | | $ | 106 | | | $ | 96 | | | $ | 270 | |
As of December 31, 2024 and 2023, our contingent consideration obligations are primarily the result of our acquisition of Teneobio in October 2021, which obligates us to make payments to the former shareholders upon achievement of separate development and regulatory milestones with regard to various R&D programs. In 2023, the development of AMG 340 was terminated, resulting in a decrease of the related contingent consideration liability. During the year ended December 31, 2023, the remeasurement of our contingent consideration liability of $165 million, which was primarily related to the termination of AMG 340, was recognized in Other operating expenses in the Consolidated Statements of Income and included in Other items, net, in the Consolidated Statements of Cash Flows. See Note 13, Goodwill and other intangible assets, for the impact on the related IPR&D asset.
Summary of the fair values of other financial instruments
Cash equivalents
The fair values of cash equivalents are approximated at their carrying values due to the short-term nature of such financial instruments.
Borrowings
We estimate the fair values of our fixed-rate notes by using Level 2 inputs. As of December 31, 2024 and 2023, the aggregate fair values of our fixed-rate notes were $54.9 billion and $59.2 billion, respectively, and the carrying values of our fixed-rate notes were $58.3 billion and $60.6 billion, respectively. The estimates of the fair values of our term loans approximate their carrying values as of December 31, 2024 and 2023 as these debt instruments bear interest at floating rates.
During the years ended December 31, 2024 and 2023, there were no transfers of assets or liabilities between fair value measurement levels, and except with respect to the IPR&D intangible impairment of AMG 340 in 2023 as disclosed in Note 13, Goodwill and other intangible assets, there were no material remeasurements to the fair values of assets and liabilities that are not measured at fair value on a recurring basis.
19. Derivative instruments
The Company is exposed to foreign currency exchange rate and interest rate risks related to its business operations. To reduce our risks related to such exposures, we use or have used certain derivative instruments, including foreign currency forward, foreign currency option, cross-currency swap, forward interest rate and interest rate swap contracts. We have designated certain of our derivatives as cash flow and fair value hedges; we also have derivatives not designated as hedges. We do not use derivatives for speculative trading purposes.
Cash flow hedges
We are exposed to possible changes in the values of certain anticipated foreign currency cash flows resulting from changes in foreign currency exchange rates primarily associated with our euro-denominated international product sales. The foreign currency exchange rate fluctuation exposure associated with cash inflows from our international product sales is partially offset by corresponding cash outflows from our international operating expenses. To further reduce this exposure, we enter into foreign currency forward contracts to hedge a portion of our projected international product sales up to a maximum of three years into the future; and at any given point in time, a higher percentage of nearer-term projected product sales is being hedged than in successive periods.
As of December 31, 2024, 2023 and 2022, we had outstanding foreign currency forward contracts with aggregate notional amounts of $7.2 billion, $6.6 billion and $6.0 billion, respectively. We have designated these foreign currency forward contracts, which are primarily euro based, as cash flow hedges. Accordingly, we record unrealized gains and losses on these contracts in AOCI in the Consolidated Balance Sheets, and we reclassify them to Product sales in the Consolidated Statements of Income in the same periods during which the hedged transactions affect earnings.
To hedge our exposure to foreign currency exchange rate risk associated with certain of our long-term debt denominated in foreign currencies, we enter into cross-currency swap contracts. Under the terms of such contracts, we paid euros and pounds sterling and received U.S. dollars for the notional amounts at the inception of the contracts; and based on these notional amounts, we exchange interest payments at fixed rates over the terms of the contracts by paying U.S. dollars and receiving euros and pounds sterling. In addition, we will pay U.S. dollars to and receive euros and pounds sterling from the counterparties at the maturities of the contracts for these same notional amounts. The terms of these contracts correspond to the related hedged debt, thereby effectively converting the interest payments and principal repayment on the debt from euros and pounds sterling to U.S. dollars. We have designated these cross-currency swap contracts as cash flow hedges. Accordingly, the unrealized gains and losses on these contracts are recorded in AOCI in the Consolidated Balance Sheets and reclassified to Other income (expense), net, in the Consolidated Statements of Income in the same periods during which the hedged debt affects earnings.
The notional amounts and interest rates of our cross-currency swaps as of December 31, 2024, were as follows (notional amounts in millions):
| | | | | | | | | | | | | | | | | | | | | | | | | | |
| | Foreign currency | | U.S. dollars |
| Hedged notes | | Notional amounts | | Interest rates | | Notional amounts | | Interest rates |
| | | | | | | | |
| 2.00% 2026 euro Notes | | € | 750 | | | 2.0 | % | | $ | 833 | | | 3.9 | % |
| 5.50% 2026 pound sterling Notes | | £ | 475 | | | 5.5 | % | | $ | 747 | | | 6.0 | % |
| 4.00% 2029 pound sterling Notes | | £ | 700 | | | 4.0 | % | | $ | 1,111 | | | 4.6 | % |
In connection with the anticipated issuance of long-term fixed-rate debt, we occasionally enter into forward interest rate contracts in order to hedge the variability in cash flows due to changes in the applicable U.S. Treasury rate between the time we enter into these contracts and the time the related debt is issued. Gains and losses on forward interest rate contracts, which are designated as cash flow hedges, are recognized in AOCI in the Consolidated Balance Sheets and are amortized into Interest expense, net, in the Consolidated Statements of Income over the terms of the associated debt issuances. Amounts expected to be recognized during the subsequent 12 months on forward interest rate contracts are not material.
The unrealized gains and losses recognized in AOCI for our derivative instruments designated as cash flow hedges were as follows (in millions):
| | | | | | | | | | | | | | | | | | | | | | | | | | |
| | | | Years ended December 31, |
| Derivatives in cash flow hedging relationships | | | | 2024 | | 2023 | | 2022 |
| Foreign currency forward contracts | | | | $ | 585 | | | $ | (14) | | | $ | 308 | |
| Cross-currency swap contracts | | | | (79) | | | 73 | | | (219) | |
| Forward interest rate contracts | | | | — | | | (31) | | | (5) | |
| Total unrealized gains | | | | $ | 506 | | | $ | 28 | | | $ | 84 | |
Fair value hedges
To achieve a desired mix of fixed-rate and floating-rate debt, we enter into interest rate swap contracts that qualify for and were designated as fair value hedges. These interest rate swap contracts effectively convert fixed-rate coupons to floating-rate SOFR-based coupons over the terms of the related hedge contracts. As of both December 31, 2024 and 2023, we had interest rate swap contracts with an aggregate notional amount of $6.7 billion that hedge certain portions of our long-term debt issuances.
During the year ended December 31, 2024, interest rate swap contracts with an aggregate notional amount of $1.4 billion matured in connection with the repayment of the 3.625% 2024 Notes. In addition, we entered into new interest rate swap contracts with respect to the 5.25% 2033 Notes for an aggregate notional amount of $1.4 billion at an interest rate of SOFR plus 1.8%.
As of December 31, 2024 and 2023, the interest rates on the portion of notes for which we have entered into interest rate swap contracts and the related notional amounts of these contracts were as follows (dollar amounts in millions):
| | | | | | | | | | | | | | | | | | | | | | | | | | |
| | December 31, |
| | 2024 | | 2023 |
| Notes | | Notional amounts | | Interest rates | | Notional amounts | | Interest rates |
| 3.625% 2024 Notes | | $ | — | | | N/A | | $ | 1,400 | | | SOFR + 3.4% |
| 3.125% 2025 Notes | | 1,000 | | | SOFR + 2.1% | | 1,000 | | | SOFR + 2.1% |
| 2.60% 2026 Notes | | 1,250 | | | SOFR + 2.1% | | 1,250 | | | SOFR + 2.1% |
| 2.45% 2030 Notes | | 1,000 | | | SOFR + 1.3% | | 1,000 | | | SOFR + 1.3% |
| 2.30% 2031 Notes | | 500 | | | SOFR + 1.1% | | 500 | | | SOFR + 1.1% |
| 5.25% 2033 Notes | | 1,400 | | | SOFR + 1.8% | | — | | | N/A |
| 4.663% 2051 Notes | | 1,500 | | | SOFR + 4.3% | | 1,500 | | | SOFR + 4.3% |
| Total notional amounts | | $ | 6,650 | | | | | $ | 6,650 | | | |
N/A = not applicable
For interest rate swap contracts that qualify for and are designated as fair value hedges, we recognize in Interest expense, net, in the Consolidated Statements of Income the unrealized gain or loss on the derivative resulting from the change in fair value during the period, as well as the offsetting unrealized loss or gain of the hedged item resulting from the change in fair value during the period attributable to the hedged risk. If a hedging relationship involving an interest rate swap contract is terminated, the gain or loss realized on contract termination is recorded as an adjustment to the carrying value of the debt and amortized into Interest expense, net, over the remaining term of the previously hedged debt.
The hedged liabilities and related cumulative-basis adjustments for fair value hedges of those liabilities were recorded in the Consolidated Balance Sheets as follows (in millions):
| | | | | | | | | | | | | | | | | | | | | | | | | | |
| | Carrying amounts of hedged liabilities(1) | | Cumulative amounts of fair value hedging adjustments related to the carrying amounts of the hedged liabilities(2) |
| | December 31, | | December 31, |
| Consolidated Balance Sheets locations | | 2024 | | 2023 | | 2024 | | 2023 |
| Current portion of long-term debt | | $ | 1,045 | | | $ | 1,441 | | | $ | 45 | | | $ | 41 | |
| Long-term debt | | $ | 5,152 | | | $ | 4,788 | | | $ | (388) | | | $ | (355) | |
____________
(1)Current portion of long-term debt includes $56 million and $69 million of carrying value with discontinued hedging relationships as of December 31, 2024 and 2023, respectively. Long-term debt includes $232 million and $288 million of carrying value with discontinued hedging relationships as of December 31, 2024 and 2023, respectively.
(2)Current portion of long-term debt includes $56 million and $69 million of hedging adjustments on discontinued hedging relationships as of December 31, 2024 and 2023, respectively. Long-term debt includes $132 million and $188 million of hedging adjustments on discontinued hedging relationships as of December 31, 2024 and 2023, respectively.
Impact of hedging transactions
The following tables summarize the amounts recorded in income and expense line items and the effects thereon from fair value and cash flow hedging, including discontinued hedging relationships (in millions):
| | | | | | | | | | | | | | | | | | | | |
| | Year ended December 31, 2024 |
| | Product sales | | Other income (expense), net | | Interest expense, net |
| Total amounts recorded in income and (expense) line items presented in the Consolidated Statements of Income | | $ | 32,026 | | | $ | 506 | | | $ | (3,155) | |
| The effects of cash flow and fair value hedging: | | | | | | |
| Gains (losses) on cash flow hedging relationships reclassified out of AOCI: | | | | | | |
| Foreign currency forward contracts | | $ | 192 | | | $ | — | | | $ | — | |
| Cross-currency swap contracts | | $ | — | | | $ | (75) | | | $ | — | |
| Gains on fair value hedging relationships—interest rate swap agreements: | | | | | | |
Hedged items(1) | | $ | — | | | $ | — | | | $ | 29 | |
| Derivatives designated as hedging instruments | | $ | — | | | $ | — | | | $ | 40 | |
| | | | | | | | | | | | | | | | | | | | |
| | Year ended December 31, 2023 |
| | Product sales | | Other income (expense), net | | Interest expense, net |
| Total amounts recorded in income and (expense) line items presented in the Consolidated Statements of Income | | $ | 26,910 | | | $ | 2,833 | | | $ | (2,875) | |
| The effects of cash flow and fair value hedging: | | | | | | |
| Gains on cash flow hedging relationships reclassified out of AOCI: | | | | | | |
| Foreign currency forward contracts | | $ | 180 | | | $ | — | | | $ | — | |
| Cross-currency swap contracts | | $ | — | | | $ | 42 | | | $ | — | |
| (Losses) gains on fair value hedging relationships—interest rate swap agreements: | | | | | | |
Hedged items(1) | | $ | — | | | $ | — | | | $ | (118) | |
| Derivatives designated as hedging instruments | | $ | — | | | $ | — | | | $ | 205 | |
| | | | | | | | | | | | | | | | | | | | |
| | Year ended December 31, 2022 |
| | Product sales | | Other income (expense), net | | Interest expense, net |
| Total amounts recorded in income and (expense) line items presented in the Consolidated Statements of Income | | $ | 24,801 | | | $ | (814) | | | $ | (1,406) | |
| The effects of cash flow and fair value hedging: | | | | | | |
| Gains (losses) on cash flow hedging relationships reclassified out of AOCI: | | | | | | |
| Foreign currency forward contracts | | $ | 231 | | | $ | — | | | $ | — | |
| Cross-currency swap contracts | | $ | — | | | $ | (233) | | | $ | — | |
| | | | | | |
| Gains (losses) on fair value hedging relationships—interest rate swap agreements: | | | | | | |
Hedged items(1) | | $ | — | | | $ | — | | | $ | 716 | |
| Derivatives designated as hedging instruments | | $ | — | | | $ | — | | | $ | (636) | |
__________
(1) Gains (losses) on hedged items do not exactly offset losses (gains) on the related designated hedging instruments due to amortization of the cumulative amounts of fair value hedging adjustments included in the carrying amount of the hedged debt for discontinued hedging relationships and the recognition of gains on terminated hedges when the corresponding hedged item was paid down in the period.
No portions of our cash flow hedge contracts were excluded from the assessment of hedge effectiveness. As of December 31, 2024, we expected to reclassify $170 million of net gains on our foreign currency and cross-currency swap contracts out of AOCI and into earnings during the next 12 months.
Derivatives not designated as hedges
To reduce our exposure to foreign currency fluctuations in certain assets and liabilities denominated in foreign currencies, we enter into foreign currency forward contracts that are not designated as hedging transactions. Most of these exposures are hedged on a month-to-month basis. As of December 31, 2024, 2023 and 2022, the total notional amounts of these foreign currency forward contracts were $148 million, $457 million and $517 million, respectively. Gains and losses recognized in earnings for our derivative instruments not designated as hedging instruments were not material for the years ended December 31, 2024, 2023 and 2022.
Fair values of derivatives
The fair values of derivatives included in the Consolidated Balance Sheets were as follows (in millions):
| | | | | | | | | | | | | | | | | | | | | | | | | | |
| | | Derivative assets | | Derivative liabilities |
| December 31, 2024 | | Consolidated Balance Sheets locations | | Fair values | | Consolidated Balance Sheets locations | | Fair values |
| Derivatives designated as hedging instruments: | | | | | | | | |
| Foreign currency forward contracts | | Other current assets/ Other noncurrent assets | | $ | 420 | | | Accrued liabilities/ Other noncurrent liabilities | | $ | 8 | |
| Cross-currency swap contracts | | Other current assets/ Other noncurrent assets | | — | | | Accrued liabilities/ Other noncurrent liabilities | | 483 | |
| Interest rate swap contracts | | Other current assets/ Other noncurrent assets | | — | | | Accrued liabilities/ Other noncurrent liabilities | | 531 | |
| | | | | | | | |
| Total derivatives designated as hedging instruments | | | | 420 | | | | | 1,022 | |
| | | | | | | | |
| | | | | | | | |
| | | | | | | | |
| Total derivatives | | | | $ | 420 | | | | | $ | 1,022 | |
| | | | | | | | |
| | | Derivative assets | | Derivative liabilities |
| December 31, 2023 | | Consolidated Balance Sheets locations | | Fair values | | Consolidated Balance Sheets locations | | Fair values |
| Derivatives designated as hedging instruments: | | | | | | | | |
| Foreign currency forward contracts | | Other current assets/ Other noncurrent assets | | $ | 145 | | | Accrued liabilities/ Other noncurrent liabilities | | $ | 116 | |
| Cross-currency swap contracts | | Other current assets/ Other noncurrent assets | | — | | | Accrued liabilities/ Other noncurrent liabilities | | 405 | |
| Interest rate swap contracts | | Other current assets/ Other noncurrent assets | | — | | | Accrued liabilities/ Other noncurrent liabilities | | 571 | |
| | | | | | | | |
| Total derivatives designated as hedging instruments | | | | 145 | | | | | 1,092 | |
| | | | | | | | |
| | | | | | | | |
| | | | | | | | |
| Total derivatives | | | | $ | 145 | | | | | $ | 1,092 | |
For additional information, see Note 18, Fair value measurement.
Our derivative contracts that were in liability positions as of December 31, 2024, contain certain credit-risk-related contingent provisions that would be triggered if (i) we were to undergo a change-in-control and (ii) our or the surviving entity’s creditworthiness deteriorates, which is generally defined as having either a credit rating that is below investment grade or a materially weaker creditworthiness after the change-in-control. If these events were to occur, the counterparties would have the right, but not the obligation, to close the contracts under early-termination provisions. In such circumstances, the counterparties
could request immediate settlement of these contracts for amounts that approximate the then current fair values of the contracts. In addition, our derivative contracts are not subject to any type of master netting arrangement, and amounts due either to or from a counterparty under the contracts may be offset against other amounts due either to or from the same counterparty only if an event of default or termination, as defined, were to occur.
The cash flow effects of our derivative contracts in the Consolidated Statements of Cash Flows are included in Net cash provided by operating activities, except for the settlement of notional amounts of cross-currency swaps, which are included in Net cash (used in) provided by financing activities.
20. Contingencies and commitments
Contingencies
In the ordinary course of business, we are involved in various legal proceedings, government investigations and other matters that are complex in nature and have outcomes that are difficult to predict. See Part I, Item 1A. Risk Factors—Our business may be affected by litigation and government investigations. We describe our legal proceedings and other matters that are significant or that we believe could become significant in this footnote.
We record accruals for loss contingencies to the extent that we conclude it is probable that a liability has been incurred and the amount of the related loss can be reasonably estimated. We evaluate, on a quarterly basis, developments in legal proceedings and other matters that could cause an increase or decrease in the amount of the liability that has been accrued previously.
Our legal proceedings involve various aspects of our business and a variety of claims, some of which present novel factual allegations and/or unique legal theories. In each of the matters described in this filing, in which we could incur a liability, our opponents seek an award of a not-yet-quantified amount of damages or an amount that is not material. In addition, a number of the matters pending against us are at very early stages of the legal process, which in complex proceedings of the sort we face often extend for several years. As a result, none of the matters described in this filing, in which we could incur a liability, have progressed sufficiently through discovery and/or the development of important factual information and legal issues to enable us to estimate a range of possible loss, if any, or such amounts are not material. While it is not possible to accurately predict or determine the eventual outcomes of these matters, an adverse determination in one or more of these matters currently pending could have a material adverse effect on our consolidated results of operations, financial position or cash flows.
Certain recent developments concerning our legal proceedings and other matters are discussed below.
Repatha Patent Litigation
Patent Disputes in the International Region
We are involved in and expect future involvement in additional disputes regarding our PCSK9 patents in other jurisdictions and regions. This includes matters filed against us and that we have filed in Germany and Japan.
Germany
In February 2016, the EPO granted European Patent No. 2,215,124 (the EP’124 Patent) to Amgen. This patent describes and claims monoclonal antibodies to PCSK9 and methods of treatment and Sanofi filed an opposition to the patent in the EPO seeking to invalidate it. In November 2016, Sanofi-Aventis Deutschland GmbH, Sanofi-Aventis Groupe S.A. and Sanofi Winthrop Industrie S.A. filed a joint opposition against Amgen’s patent, and each of Lilly, Regeneron Pharmaceuticals, Inc. (Regeneron) and Strawman Ltd. also filed oppositions to Amgen’s patent. In November 2018, the EPO confirmed the validity of Amgen’s EP’124 Patent, which was appealed to the Technical Board of Appeal (TBA). On October 29, 2020, the TBA upheld the validity of certain claims, including claims that protect Repatha, but ruled that broader claims encompassing PRALUENT were invalid. As a result of the TBA’s decision, national litigations regarding PRALUENT in Germany are in the process of being resolved.
In Germany, Sanofi-Aventis Deutschland GmbH and Regeneron filed actions in the Regional Court of Munich seeking damages arising from the provisional enforcement of an injunction against PRALUENT that was lifted after the TBA’s October 2020 ruling. On May 8, 2024, the Regional Court of Munich issued a preliminary decision and scheduled a further oral hearing on January 15, 2025. On November 13, 2024, the Regional Court of Munich scheduled the next hearing in the matter for May 21, 2025.
On July 21, 2022, Sanofi Biotechnology SAS filed an action against Amgen GmbH and Amgen (Europe) B.V. before the Regional Court of Dusseldorf alleging that the marketing and sale of Repatha infringes European Patent No. 2,756,004 (the EP’004 Patent), which Sanofi Biotechnology SAS licensed from Regeneron. Sanofi Biotechnology SAS is seeking
infringement damages and injunctive relief. On May 13, 2024, the Regional Court of Dusseldorf stayed the hearing on Sanofi Biotechnology SAS’ infringement action pending the outcome of Amgen’s Nullity Action against the EP’004 Patent before the German Federal Patent Court.
On August 3, 2023, Amgen GmbH filed a Nullity Action before the German Federal Patent Court seeking invalidation of Regeneron’s EP’004 Patent. Regeneron filed a Statement of Defense on November 20, 2023. On February 29, 2024, the German Federal Patent Court scheduled the main hearing for November 25, 2025.
Unified Patent Court of the European Union
On June 1, 2023, Amgen filed an action before the Munich Local Division of the Unified Patent Court (UPC) against Sanofi-Aventis Deutschland GmbH, Sanofi-Aventis Groupe S.A., Sanofi Winthrop Industrie S.A. (collectively, Sanofi-Aventis), and Regeneron alleging that the importation, marketing, sale and use of PRALUENT infringes European Patent 3,666,797 (the EP’797 Patent) seeking an injunction and damages for past infringement. Regeneron filed counterclaims for revocation, but on February 5, 2024, the court transferred the counterclaims to the Central Division of the UPC that is presiding over Sanofi’s revocation action. The Munich Local Division of the UPC scheduled the hearing on our EP’797 Patent infringement action to begin on October 16, 2024.
On June 29, 2023, the Central Division of the UPC served Amgen with an action that was filed by Sanofi-Aventis that seeks revocation of the EP’797 Patent. The Central Division of the UPC scheduled a hearing on the revocation action and on July 16, 2024, the Central Division of the UPC rendered its decision, concluding that the patent claims are invalid and revoked the EP’797 Patent. Subsequently, on July 29, 2024, the Munich Local Division of the UPC stayed Amgen’s action against Sanofi-Aventis alleging that the importation, marketing, sale and use of PRALUENT infringes the EP’797 Patent. On September 13, 2024, Amgen filed a Statement of Appeal with the Court of Appeals to the UPC to set aside the Central Division of the UPC’s decision to revoke the EP’797 Patent. The Court of Appeals scheduled oral arguments to take place on May 22, 2025.
On January 10, 2024, Sanofi Biotechnologies SAS and Regeneron filed an action against Amgen Inc., Amgen Europe B.V., Amgen N.V., Amgen GmbH, Amgen B.V., Amgen SAS, and Amgen S.R.L before the Dusseldorf Local Division of the UPC, alleging infringement of EP 3,536,712 (the EP’712 Patent), which Sanofi Biotechnology SAS licensed from Regeneron. Sanofi and Regeneron are seeking an injunction against the sale, marketing, use, importation, or storage of Repatha for certain specified uses in Belgium, France, Germany, Italy and the Netherlands. Amgen filed counterclaims for invalidity and non-infringement. On September 25, 2024, Sanofi Biotechnologies SAS and Regeneron filed a brief seeking to expand the ongoing action before the Dusseldorf Local Division of the UPC, alleging that Amgen’s Repatha infringes a newly-issued patent, European Patent No. 4,252,857 (the EP’857 Patent), seeking an injunction against the marketing, use, or importation of Repatha in 18 countries (Austria, Belgium, Bulgaria, Denmark, Estonia, Finland, France, Germany, Italy, Latvia, Lithuania, Luxembourg, Malta, the Netherlands, Portugal, Romania, Slovenia and Sweden) and damages for past infringement. On December 13, 2024, the Dusseldorf Local Division of the UPC denied Sanofi and Regeneron’s request to extend the complaint and ordered that only the issues of infringement and validity of the EP’712 Patent are to be addressed at an oral hearing scheduled for February 25, 2025. On February 4, 2025, the Dusseldorf Local Division of the UPC formally ordered separation of the EP’857 Patent from the ongoing litigation and ordered Sanofi and Regeneron to file a new Statement of Case by February 28, 2025.
European Patent Office
On November 16, 2023 and February 29, 2024, Sanofi-Aventis and Regeneron each filed a notice of opposition against Amgen’s EP’797 Patent before the EPO’s Opposition Division. An oral hearing has been scheduled for March 31 to April 4, 2025.
On February 29, 2024, Amgen filed a Notice of Opposition and Grounds of Opposition before the EPO against Regeneron’s EP’712 Patent. On March 15, 2024, the EPO notified the parties that the opposition will be accelerated in view of the infringement action pending against Amgen on the EP’712 Patent in the Dusseldorf Local Division of the UPC. An oral hearing has been scheduled for March 11 to 12, 2025.
Japan
On April 24, 2020, the Supreme Court of Japan declined to hear Sanofi K.K.’s appeals making final the High Court’s decisions that PRALUENT infringes Amgen’s valid patent rights in Japan. On June 24, 2020, Amgen filed written answers to the invalidity trials initiated by Regeneron on February 12, 2020 before the Japan Patent Office seeking to invalidate Amgen’s Japanese patents that were previously held infringed by PRALUENT and valid over challenges filed by Sanofi K.K. On April 15, 2021, the Japan Patent Office dismissed Regeneron’s invalidity trials, and in August 2021 Regeneron appealed the decisions to the High Court. On January 26, 2023, the High Court found Amgen’s patent claims invalid for lacking adequate support and
Amgen appealed to the Supreme Court of Japan on March 13, 2023. On September 15, 2023, the Supreme Court of Japan declined to hear Amgen’s appeal. The case was remanded to the Japan Patent Office for further proceedings.
Damages proceedings against Sanofi K.K. are ongoing before the Tokyo District Court, where Sanofi K.K. has initiated new validity challenges to Amgen patents in Japan. On September 27, 2023, the Tokyo District Court found Amgen’s patent claims invalid and dismissed Amgen’s lawsuit for damages. Amgen appealed the Tokyo District Court’s decision to the Intellectual Property High Court on December 28, 2023. The Intellectual Property High Court rejected Amgen’s appeal and remanded the case to the Japan Patent Office. Amgen sought amended patent claims before the Japan Patent Office. The Japan Patent Office rejected Amgen’s amended patent claims, and Amgen filed an appeal brief with the Intellectual Property High Court on September 16, 2024 seeking to overturn the Japan Patent Office’s decision.
Prolia/XGEVA Biologics Price Competition and Innovation Act (BPCIA) Litigation
Amgen Inc. et al. v. Celltrion Inc., et al.
On May 28, 2024, Amgen Inc. and Amgen Manufacturing Limited LLC filed a lawsuit in the U.S. District Court for the District of New Jersey (New Jersey District Court) against Celltrion Inc. and Celltrion USA, Inc. (collectively, Celltrion) based on the submission to the FDA of a BLA seeking approval to market and sell a biosimilar version of Amgen’s Prolia and XGEVA products. The complaint asserts infringement of the following 29 patents: U.S. Patent Nos. 7,364,736; 7,427,659; 7,928,205; 8,053,236; 8,460,896; 8,680,248; 9,012,178; 9,228,168; 9,320,816; 9,328,134; 9,359,435; 10,106,829; 10,167,492; 10,227,627; 10,513,723; 10,583,397; 10,822,630; 10,894,972; 11,077,404; 11,098,079; 11,130,980; 11,254,963; 11,299,760; 11,319,568; 11,434,514; 11,459,595; 11,486,883; 11,946,085; and 11,952,605 (collectively, the Asserted Patents against Celltrion). Amgen seeks a judgment from the New Jersey District Court that Celltrion has infringed or will infringe one or more claims of each of the Asserted Patents against Celltrion and based on that judgment, a permanent injunction prohibiting the commercial manufacture, use, offer to sell, or sale within the United States or importation into the United States of Celltrion’s proposed denosumab biosimilar before expiration of each of the Asserted Patents against Celltrion found infringed. Amgen also seeks monetary remedies for any past acts of infringement. Celltrion responded to the complaint on July 11, 2024, denying infringement and asserting affirmative defenses including invalidity and non-infringement. On November 25, 2024, the New Jersey District Court issued a Scheduling Order including a hearing on claim construction scheduled for February 14, 2025 and trial beginning on April 7, 2025. On January 23, 2025, the New Jersey District Court issued a consent judgment and injunction finding the Asserted Patents against Celltrion valid, enforceable and infringed by the Celltrion biosimilar denosumab products in the United States. The injunction prohibits Celltrion, its affiliates and any third party acting on behalf of or in active concert with Celltrion from making using, offering to sell, selling or importing Celltrion’s denosumab biosimilar products into the United States before June 1, 2025, except as specifically authorized by a confidential binding settlement term sheet and 35 U.S.C. 271. Specific financial terms remain confidential. The parties’ remaining claims and counterclaims were dismissed with prejudice.
Amgen Inc. et al. v. Samsung Bioepis Co. Ltd., et al.
On August 12, 2024, Amgen Inc. and Amgen Manufacturing Limited LLC filed a lawsuit in the New Jersey District Court against Samsung Bioepis Co. Ltd. (Bioepis) and Samsung Biologics Co., Ltd., (Biologics, and collectively with Bioepis, Samsung) based on the submission to the FDA of a BLA seeking approval to market and sell a biosimilar version of Amgen’s Prolia and XGEVA products. The complaint asserts infringement of the following 34 patents: U.S. Patent Nos. 7,364,736; 7,888,101; 7,928,205; 8,058,418; 8,247,210; 8,460,896; 8,680,248; 9,012,178; 9,320,816; 9,328,134; 9,359,435; 9,481,901; 10,106,829; 10,167,492; 10,227,627; 10,421,987; 10,513,723; 10,583,397; 10,655,156; 10,822,630; 10,894,972; 10,907,186; 11,098,079; 11,130,980; 11,254,963; 11,292,829; 11,299,760; 11,384,378; 11,427,848; 11,434,514; 11,634,476; 11,685,772; 11,744,950; and 11,946,085 (collectively, the Asserted Patents against Samsung). Amgen seeks a judgment from the New Jersey District Court that Samsung has infringed or will infringe one or more claims of each of the Asserted Patents against Samsung and, based on that judgment, a permanent injunction prohibiting the commercial manufacture, use, offer to sell, or sale within the United States or importation into the United States of Samsung’s proposed denosumab biosimilar before expiration of each of the Asserted Patents against Samsung found infringed. Amgen also seeks monetary remedies for any past acts of infringement. Bioepis filed its Answer and Counterclaims in response to the Complaint on October 1, 2024. On November 12, 2024, Bioepis filed an Amended Answer and Counterclaims, and Amgen responded to the Amended Counterclaims on November 26, 2024. Biologics’ response to the Complaint was submitted on October 28, 2024. A trial date has not yet been set.
Amgen Inc. et al. v. Fresenius Kabi USA, LLC et al.
On October 4, 2024, Amgen Inc. and Amgen Manufacturing Limited LLC filed a lawsuit in the U.S. District Court for the Northern District of Illinois (Illinois District Court) against Fresenius Kabi USA, LLC, Fresenius SwissBiosim GmbH, Fresenius Kabi Deutschland, GmbH, and Fresenius Kabi Austria GmbH (collectively Fresenius) based on the submission to the
FDA of a BLA seeking approval to market and sell a biosimilar version of Amgen’s Prolia and XGEVA products. The complaint asserts infringement of the following 33 patents: U.S. Patent Nos. 7,364,736; 7,888,101; 7,928,205; 8,053,236; 8,058,418; 8,460,896; 8,680,248; 9,012,178; 9,228,168; 9,320,816; 9,328,134; 9,359,435; 10,106,829; 10,167,492; 10,227,627; 10,513,723; 10,583,397; 10,655,156; 10,822,630; 10,894,972; 11,077,404; 11,098,079; 11,130,980; 11,254,963; 11,299,760; 11,319,568; 11,434,514; 11,459,595; 11,744,950; 11,786,866; 11,946,085; 11,952,605; and 12,084,686 (collectively, the Asserted Patents against Fresenius). Amgen seeks a judgment from the Illinois District Court that Fresenius has infringed or will infringe one or more claims of each of the Asserted Patents against Fresenius and based on that judgment, a permanent injunction prohibiting the commercial manufacture, use, offer to sell, or sale within the United States or importation into the United States of Fresenius’s proposed denosumab biosimilar before expiration of each of the Asserted Patents against Fresenius found infringed. Amgen also seeks monetary remedies for any past acts of infringement. Fresenius responded to the complaint on December 4, 2024, denying infringement and asserting affirmative defenses including invalidity and non-infringement.
On February 6, 2025, the Judicial Panel on Multidistrict Litigation granted Amgen’s November 15, 2024 motion to transfer this case from the Illinois District Court to the New Jersey District Court for coordinated and consolidated pretrial proceedings with the other cases involving Prolia/XGEVA biosimilars pending in the district.
Amgen Inc. et al. v. Accord et al.
On November 13, 2024, Amgen Inc. and Amgen Manufacturing Limited LLC filed a lawsuit in the U.S. District Court for the Eastern District of North Carolina (North Carolina District Court) against Accord Biopharma, Inc., Accord Healthcare, Inc. and Intas Pharmaceuticals, Ltd. (collectively Accord) based on the submission to the FDA of a BLA seeking approval to market and sell a biosimilar version of Amgen’s Prolia and XGEVA products. The complaint asserts infringement of the following 34 patents: U.S. Patent Nos. 7,364,736; 7,662,930; 7,888,101; 7,928,205; 8,053,236; 8,058,418; 8,460,896; 8,680,248; 9,012,178; 9,133,493; 9,228,168; 9,320,816; 9,328,134; 9,359,435; 9,388,447; 10,106,829; 10,167,492; 10,227,627; 10,513,723; 10,583,397; 10,655,156; 10,822,630; 10,894,972; 11,077,404; 11,098,079; 11,130,980; 11,254,963; 11,299,760; 11,319,568; 11,434,514; 11,459,595; 11,946,085; 11,952,605; and 12,084,686 (collectively, the Asserted Patents against Accord). Amgen seeks a judgment from the North Carolina District Court that Accord has infringed or will infringe one or more claims of each of the Asserted Patents against Accord and based on that judgment, a permanent injunction prohibiting the commercial manufacture, use, offer to sell, or sale within the United States or importation into the United States of Accord’s proposed denosumab biosimilar before expiration of each of the Asserted Patents against Accord found infringed. Amgen also seeks monetary remedies for any past acts of infringement. Accord responded to the complaint on January 10, 2025, denying infringement and asserting affirmative defenses including invalidity and non-infringement.
On February 6, 2025, the Judicial Panel on Multidistrict Litigation granted Amgen’s November 15, 2024 motion to transfer this case from the North Carolina District Court to the New Jersey District Court for coordinated and consolidated pretrial proceedings with the other cases involving Prolia/XGEVA biosimilars pending in the district.
On December 30, 2024, the parties jointly filed a stipulation agreeing to a consent injunction, which was subsequently entered by the North Carolina District Court, providing that that the Accord biosimilar products at issue will not be made, used, sold, offered for sale or imported into the United States before October 1, 2025, except as permitted by 35 U.S.C. § 271(e)(1).
PAVBLU™ (aflibercept-ayyh) Patent Litigation
On January 10, 2024, Regeneron filed a lawsuit in the U.S. District Court for the Central District of California (California Central District Court) against Amgen alleging infringement of 32 patents listed by Regeneron in the BPCIA exchange. The lawsuit stems from Amgen’s submission of an application under the BPCIA for FDA licensure of PAVBLU as biosimilar to Regeneron’s EYLEA. By its complaint, Regeneron seeks, among other remedies, an injunction prohibiting the commercial manufacture, use, offer for sale or sale in the United States or import into the United States of PAVBLU before the expiration of each of the patents found to be infringed. On January 11, 2024, Regeneron filed a motion with the Judicial Panel on Multidistrict Litigation to transfer this case from the California Central District Court to the U.S. District Court for the Northern District of West Virginia (West Virginia District Court). Amgen responded to Regeneron’s complaint on February 2, 2024, denying infringement and asserting counterclaims seeking a declaratory judgment that the asserted patents are not infringed, invalid, and/or unenforceable.
On April 11, 2024, the Judicial Panel on Multidistrict Litigation granted Regeneron’s motion to transfer Regeneron’s patent infringement lawsuit pending against Amgen in the California Central District Court to the West Virginia District Court for coordinated and consolidated pretrial proceedings with the five other cases involving EYLEA biosimilars pending in that district.
On June 7, 2024, Regeneron filed a motion for a preliminary injunction to prohibit Amgen from engaging in the manufacture, use, offer for sell or sale within the United States, or importation into the United States, of PAVBLU until resolution of this lawsuit or the entry of a permanent injunction, whichever comes first. Regeneron’s motion focused on U.S.
Patent No. 11,084,865, a formulation patent. On September 23, 2024, the West Virginia District Court denied Regeneron’s motion for a preliminary injunction, and Regeneron filed a notice of appeal, a motion to expedite the appeal, and an emergency motion for an injunction pending resolution of the appeal and for an administrative stay with the U.S. Court of Appeals for the Federal Circuit (Federal Circuit Court). On September 25, 2024, the Federal Circuit Court issued an order temporarily enjoining the launch of PAVBLU on an administrative basis while it considered Regeneron’s motion for an injunction pending appeal. On October 22, 2024, the Federal Circuit Court denied Regeneron’s motion for an injunction pending appeal and lifted the temporary injunction that was entered on September 25, 2024. Oral arguments for the appeal were held on January 14, 2025.
Antitrust Class Action
Sensipar Antitrust Class Actions
From February to April 2019, four plaintiffs filed putative class action lawsuits against Amgen and various entities affiliated with Teva Pharmaceuticals USA, Inc. (Teva) alleging anticompetitive conduct in connection with settlements between Amgen and manufacturers of generic cinacalcet product. Two of those actions were brought in the U.S. District Court for the District of Delaware (Delaware District Court), captioned UFCW Local 1500 Welfare Fund v. Amgen Inc., et al. (February 21, 2019) (Local 1500) and Cesar Castillo, Inc. v. Amgen Inc., et al. (February 26, 2019) (Castillo). The third action was brought in the New Jersey District Court, captioned Teamsters Local 237 Welfare Fund, et al. v. Amgen Inc., et al. (March 14, 2019) (Local 237) and the fourth action was brought in the U.S. District Court for the Eastern District of Pennsylvania (Eastern Pennsylvania District Court), captioned KPH Healthcare Services, Inc. a/k/a Kinney Drugs, Inc. v. Amgen Inc., et al (April 10, 2019) (KPH). Each of the lawsuits is brought on behalf of a putative class of direct or indirect purchasers of Sensipar and alleges that the plaintiffs have overpaid for Sensipar as a result of Amgen’s conduct that allegedly improperly delayed market entry by manufacturers of generic cinacalcet products. The lawsuits focus predominantly on the settlement among Amgen, Watson Laboratories, Inc. (Watson) and Teva of the parties’ patent infringement litigation. Each of the lawsuits seeks, among other things, treble damages, equitable relief and attorneys’ fees and costs. On April 10, 2019, the plaintiff in the KPH lawsuit filed a motion seeking to have the four lawsuits consolidated and designated as a multidistrict litigation (MDL) in the Eastern Pennsylvania District Court, and the plaintiff in the Local 1500 lawsuit filed a motion seeking to have the four lawsuits, along with Cipla Ltd. v. Amgen Inc., consolidated and designated as an MDL in the Delaware District Court.
On July 31, 2019, the MDL panel entered an order consolidating in the Delaware District Court the four class action lawsuits. On September 13, 2019, the plaintiffs filed amended complaints, and on October 15, 2019, Amgen filed its motion to dismiss both the direct purchaser plaintiffs’ consolidated class action complaint and the indirect purchaser end payer plaintiffs’ complaint. On December 6, 2019, the plaintiffs responded to Amgen’s motion to dismiss and, on January 10, 2020, Amgen filed its response. On February 6, 2020, the motions in the class action lawsuits were transferred to the U.S. Magistrate Judge for the District of Delaware (Magistrate Judge) for a recommendation. The MDL panel certified its conditional transfer order on February 6, 2020 transferring the additional class action lawsuit brought in the U.S. District Court for the Southern District of Florida, captioned MSP Recovery Claims v. Amgen Inc., et al., to the Delaware District Court.
On July 22, 2020, the Magistrate Judge issued a recommendation to the Delaware District Court that the claims against Amgen be dismissed but leave be given to plaintiffs to amend their complaints. On August 5, 2020, the plaintiffs filed objections to the Magistrate Judge’s report and recommendation. On August 19, 2020, Amgen filed a response to the plaintiffs’ objections. On November 30, 2020, the Delaware District Court adopted the Magistrate Judge’s recommendation in part and denied it in part, denying Amgen’s motion to dismiss on the grounds that plaintiffs adequately alleged reverse payment claims but granted Amgen’s motion to dismiss with respect to the other Federal antitrust claims. On December 23, 2020, Teva, Watson and Actavis filed a motion for interlocutory appeal and for a stay pending appeal and Amgen filed its joinder (the 1292 Motion). On January 5, 2021, a joint status report was filed advising the Delaware District Court that the defendants are still considering whether to withdraw the 1292 Motion and plaintiffs’ offer to stay discovery, pending further rulings on motions to dismiss the amended complaints. On January 19, 2021, a joint status report was filed pursuant to the Delaware District Court’s January 6, 2021 order along with a stipulation to defer the 1292 Motion until after rulings on the amended complaints.
On February 16, 2021, the plaintiffs in the antitrust class action lawsuit brought on behalf of putative classes of direct or indirect purchasers of Sensipar filed their amended complaints. On March 4, 2021, a stipulation and order regarding the filing of a second amended complaint were filed to add another plaintiff: Teamsters Western Region & Local 177 Health Care Fund. On March 17, 2021, a defendant, MSP Recovery Claims, Series LLC, filed its notice of voluntary dismissal. On March 30, 2021, the remaining defendants, including Amgen, filed their motions to dismiss the second amended complaint.
On April 27, 2021, plaintiffs filed their oppositions to defendants’ (including Amgen’s) motion to dismiss, and defendants’ reply was filed on May 25, 2021. A hearing on defendants’ motion to dismiss was held in the Delaware District Court on July 13, 2021.
On March 11, 2022, the Delaware District Court granted defendants’ (including Amgen’s) motion to dismiss except as to the reverse payment claim and various state law claims from ten of the states in which plaintiffs reside. On May 11, 2022, the parties filed motions asking permission to seek interlocutory appeal. The plaintiffs did not oppose Amgen’s motion and instead argued all issues should be appealed at this time. Amgen filed its opposition to plaintiffs’ motion on June 10, 2022, and reply briefs were filed on June 24, 2022.
On February 16, 2023, the Delaware District Court denied Amgen’s motion for interlocutory appeal. On March 2, 2023, Amgen filed a motion for reargument, which the Delaware District Court denied while also certifying a question regarding whether the current judge has the authority to certify a question decided by a predecessor judge. On April 17, 2023, Amgen filed a petition with the U.S. Court of Appeals for the Third Circuit (Third Circuit Court), seeking a grant of our request for interlocutory appeal of the certified question as well as the Delaware District Court’s denial of our motion to dismiss the reverse payment claim. Amgen’s response to the class action complaints is due 30 days after resolution or denial of the interlocutory appeal.
On June 26, 2023, the Third Circuit Court entered an order granting defendants’ (including Amgen’s) petition for interlocutory appeal and denying plaintiffs’ cross-petition. The questions certified are whether (1) the statute for interlocutory decisions authorizes a district court judge to certify for interlocutory appeal an order issued in the same case by a predecessor district court judge; and (2) the settlement of a patent infringement claim that involves the forgiveness of damages associated with that patent’s alleged infringement, on its own or combined with an acceleration clause, constitutes a reverse payment. On July 3, 2023, Amgen and Teva Pharmaceuticals USA, Inc. filed a notice of appeal, and on October 17, 2023, Amgen submitted its initial brief in its appeal before the Third Circuit Court.
On January 12, 2024, Amgen reached an agreement in principle to settle with the putative class of indirect purchasers of Sensipar.
On February 17, 2024, Amgen and the indirect purchasers filed a stipulation in the Delaware District Court to dismiss the indirect purchasers’ claims. On February 22, 2024, Amgen and the indirect purchasers filed a stipulation in the Third Circuit Court dismissing the portion of the Third Circuit Court’s appeal relating to the claims of the indirect purchasers. Amgen and the direct purchasers filed a stipulation on April 12, 2024 in the Delaware District Court, dismissing with prejudice the direct purchasers’ claims that were at issue in the appeal and seeking entry of final judgment in Amgen’s favor. On April 15, 2024, the Delaware District Court entered an order pursuant to the stipulation and closed the case.
On May 14, 2024, the putative class of direct purchasers of Sensipar appealed the claims that were dismissed with prejudice by the Delaware District Court.
On November 12, 2024, Amgen settled with the putative class of direct purchasers of Sensipar, and the remaining claims were dismissed on November 29, 2024.
Regeneron Pharmaceuticals, Inc. Antitrust Action
On May 27, 2022, Regeneron filed suit against Amgen in the Delaware District Court for federal and state antitrust and unfair competition violations and tortious interference with prospective business relations. Regeneron alleges that Amgen’s sales contracting practices for Repatha, ENBREL and Otezla with key insurers, third-party payers and PBMs have harmed the sales of its product PRALUENT and focuses on two primary arguments: that Amgen improperly bundled sales of Repatha with ENBREL, Otezla and potentially other products and sought exclusive or de facto exclusive formulary positioning for Repatha. Amgen’s initial responsive pleading, a motion to dismiss, was filed on August 1, 2022.
On August 11, 2022, Amgen moved to stay the case pending the ultimate decision on the merits of the ongoing patent litigation between Amgen and Regeneron in Amgen Inc., et al. v. Sanofi, et al. On January 6, 2023, the Delaware District Court heard oral argument on the motion to stay and the motion to dismiss. On February 10, 2023, the Delaware District Court denied Amgen’s motion to stay this action, and on March 21, 2023, the Delaware District Court denied Amgen’s motion to dismiss the complaint.
On August 28, 2023, Regeneron filed its amended complaint, and on September 20, 2023, Amgen filed a counterclaim, alleging Regeneron’s own anticompetitive conduct with respect to formulary position for Regeneron’s drug, PRALUENT, at CVS.
Trial was originally scheduled to begin on November 12, 2024, but has been rescheduled for May 2, 2025. On November 20, 2024 the Delaware District Court heard Amgen’s motion for summary judgment and the parties’ motions to exclude expert testimony, and the motions are currently under submission.
CareFirst of Maryland Antitrust Class Action
On August 6, 2024, CareFirst of Maryland, Inc., Group Hospitalization and Medical Services, Inc., and CareFirst BlueChoice, Inc. (collectively, CareFirst), filed a class action antitrust lawsuit against Amgen Inc., Amgen Manufacturing, Limited (corrected to Amgen Manufacturing Limited LLC in CareFirst’s amended complaint on October 11, 2024), and Immunex Corporation in the U.S. District Court for the Eastern District of Virginia, alleging federal and state antitrust claims and state consumer protection claims. The plaintiffs allege that, in 2004, Amgen entered into an anticompetitive agreement with certain F. Hoffman-La Roche AG entities (Roche) and other parties that provided Amgen with rights to Roche’s patents in a manner that enabled Amgen to allegedly unlawfully extend the life of patents applicable to ENBREL and, thereby, delay biosimilar entry. On November 4, 2024, Amgen filed a motion to dismiss, and plaintiffs thereafter filed an amended complaint on November 25, 2024. On January 8, 2025, Amgen filed a motion to dismiss the amended complaint.
U.S. Tax Litigation and Related Matters
Amgen Inc. & Subsidiaries v. Commissioner of Internal Revenue
See Note 7, Income taxes, for discussion of the IRS tax dispute and the Company’s petitions in the U.S. Tax Court.
Securities Class Action Litigation (Roofers Local No. 149 Pension Fund)
On March 13, 2023, Roofers Local No. 149 Pension Fund filed a purported class action against Amgen, Robert Bradway and Peter Griffith in the U.S. District Court for the Southern District of New York (Southern District Court of New York). The action was brought on behalf of an alleged class of Amgen shareholders who owned stock between July 29, 2020 and April 27, 2022 (the alleged class period). Plaintiffs allege that the defendants made a series of materially false and misleading statements and omissions during the alleged class period regarding the failure to timely disclose the potential tax liability claimed by the IRS. Plaintiffs further allege that they and other purported class members suffered losses and damages resulting from declines in the market value of Amgen’s common stock after the potential tax liability claimed by the IRS was disclosed.
On August 31, 2023, plaintiff filed an amended complaint and Amgen filed a motion to dismiss on November 6, 2023, which the Southern District Court of New York denied on September 30, 2024. On November 20, 2024, Amgen filed an answer to the amended complaint.
A Case Management Plan and Scheduling Order was entered on January 16, 2025. Class certification briefing will be completed by December 23, 2025 and the last day to file summary judgment motions is August 12, 2025 but no briefing schedule has been set.
Shareholder Derivative Actions (Martin, Clearwater and DM Cohen)
On August 2, 2023, Leon Martin filed a derivative action (the Martin Derivative Action) captioned Leon Martin v. Robert A. Bradway, et al., No. 1:23-cv-06754 (S.D.N.Y. Aug. 2, 2023), purportedly on behalf of Amgen, against Amgen, Robert Bradway, Peter Griffith and Amgen’s independent Board members. The action was filed in the Southern District Court of New York as related to the pending federal securities class action filed by Roofers Local No. 149 Pension Fund on March 13, 2023 (the Roofers securities class action). The complaint in this matter alleges claims for violations of the Securities Exchange Act of 1934, breach of fiduciary duty, aiding and abetting breach of fiduciary duty, unjust enrichment and waste of corporate assets.
On December 7, 2023, Plaintiff filed a Notice of Voluntary Dismissal as to Board member Michael Drake.
On December 1, 2023, a second derivative action (the Clearwater Derivative Action) was filed, captioned Cheri Clearwater v. Robert A. Bradway, et al., No. 1:23-cv-10538 (S.D.N.Y. Dec. 1, 2023), in the same court as the earlier-filed Martin Derivative Action. The second action is largely duplicative of the Martin Derivative Action, asserting the same claims purportedly on behalf of the Company against the individual directors that sat on Amgen’s Board during the relevant time period (July 29, 2020 through April 27, 2022). The complaint asserts claims for breach of fiduciary duty, unjust enrichment, waste of corporate assets, abuse of control, gross mismanagement, and violations of Section 10(b) of the Exchange Act arising out of Amgen’s disclosures with respect to its transfer pricing dispute with the IRS. However, the Clearwater Derivative Action complaint adds (1) two additional claims for violations of Sections 14(a) and 20(a) of the Exchange Act; (2) allegations that Amgen repurchased its own stock at artificially inflated prices during the relevant period; and (3) more detailed allegations as to why first making a demand on the Board would have been futile.
On January 16, 2024, the Southern District Court of New York consolidated the Martin Derivative Action and Clearwater Derivative Action (the Consolidated Action). The Southern District Court of New York entered an Order staying the Consolidated Action until a final judgment is entered in the federal securities class action.
On February 12, 2025, DM Cohen, Inc. filed a third derivative action (the DM Cohen Derivative Action) captioned DM Cohen, Inc. v. Robert A. Bradway, et al, No. 1:25-mc-00062 (S.D.N.Y. Feb. 12, 2025), purportedly on behalf of Amgen, against Amgen, Robert Bradway, Peter Griffith and Amgen’s independent Board members. The DM Cohen Derivative Action was filed in the same court as the earlier filed Roofers securities class action and the Consolidated Action. The complaint asserts claims for violations of the Securities Exchange Act of 1934, breach of fiduciary duty, waste of corporate assets and unjust enrichment.
The factual allegations that form the basis for the claims in the Consolidated Action and the DM Cohen Derivative Action are essentially the same as the allegations asserted in the Roofers securities class action regarding purportedly false and misleading statements and omissions made from July 29, 2020 through April 27, 2022 relating to Amgen’s tax liabilities, business and finances, and the adequacy and maintenance of its internal controls.
Shareholder Derivative Actions (Hamilton, Blackburn, Bryla)
On October 16, 2024, David Hamilton filed a derivative action in the Delaware Court of Chancery purportedly on behalf of Amgen, against nominal defendant Amgen, Robert Bradway, Peter Griffith and Amgen’s Board members during the relevant time period (the Hamilton Derivative Action). The complaint in this matter alleges claims for breach of fiduciary duty and unjust enrichment.
On November 7, 2024, Charles Blackburn filed a derivative action in the Delaware Court of Chancery purportedly on behalf of Amgen, against nominal defendant Amgen, Robert Bradway, Peter Griffith and Amgen’s Board members during the relevant time period (the Blackburn Derivative Action). The complaint alleges a claim for breach of fiduciary duty.
On December 6, 2024, Robert Bryla filed a derivative action in the Delaware Court of Chancery purportedly on behalf of Amgen, against nominal defendant Amgen, Robert Bradway, Peter Griffith and Amgen’s Board members during the relevant time period (the Bryla Derivative Action). The complaint alleges claims for breach of fiduciary duty and unjust enrichment.
The factual allegations that form the basis for the claims in the Hamilton Derivative Action, Blackburn Derivative Action and Bryla Derivative Action are fundamentally the same as those asserted by the Roofers Local No. 149 Pension Fund on March 13, 2023 (alleging false and misleading statements and omissions made from July 29, 2020 through April 27, 2022 relating to Amgen’s tax liabilities, business and finances, and the adequacy and maintenance of its internal controls).
ChemoCentryx, Inc. Securities Matters
On May 5 and June 8 of 2021, ChemoCentryx and its Chief Executive Officer were named as defendants in two putative shareholder class actions filed in the U.S. District Court for the Northern District of California (Northern District Court of California). These cases were consolidated into Homyk v. ChemoCentryx, Inc. in which the plaintiffs allege violations of Sections 10(b) and 20(a) of the Securities Exchange Act in connection with statements regarding the New Drug Application for TAVNEOS and the underlying Phase 3 clinical trial, seeking an award of damages, interest and attorneys’ fees. On March 28, 2022, the plaintiffs filed their consolidated amended complaint, and on May 19, 2022, ChemoCentryx moved to dismiss these claims.
On February 23, 2023, the Northern District Court of California substantially denied ChemoCentryx’s motion to dismiss the matter in its entirety, while granting the motion to dismiss with respect to certain allegations of the plaintiffs. On April 4, 2023, the parties submitted a case management statement to the Northern District Court of California, and on April 10, 2023, the Northern District Court of California entered an order setting dates for amendment of pleadings and briefing on class certification. On April 27, 2023, ChemoCentryx submitted its answer to the complaint.
On August 25, 2023, the lead plaintiff moved to certify a class composed of all purchasers of ChemoCentryx stock between November 25, 2019 and May 6, 2021.
On March 6, 2024, the Northern District Court of California certified a class of all persons who purchased or otherwise acquired the common stock of ChemoCentryx between November 26, 2019 and May 6, 2021.
On March 20, 2024, ChemoCentryx filed a petition with the U.S. Court of Appeals for the Ninth Circuit (Ninth Circuit Court), seeking permission to have the district court’s order on class certification heard on appeal. The lead plaintiff’s response to ChemoCentryx’s petition was submitted on April 2, 2024, and on May 24, 2024, the Ninth Circuit Court denied ChemoCentryx’s petition to appeal the class certification order. Under the current schedule for the class action in the district court, the parties’ motions to exclude experts will be fully briefed by March 20, 2025, and summary judgment will be fully briefed by May 9, 2025. Trial is set for September 22, 2025. The deadline for class members to opt out of the class action was January 14, 2025.
Prior to the opt-out deadline, on May 2, 2024, RA Capital Healthcare Fund, LP filed two securities cases (which are similar to the class action), in the California Superior Court in Ventura County and in the Northern District Court of California, against ChemoCentryx and its former Chief Executive Officer, Dr. Thomas Schall. On July 2, 2024, the state court stayed the case pending an order on summary judgment in the federal class action. Under the current schedule in the federal case, briefing on the defendants’ motion to dismiss the complaint will be complete by March 11, 2025, and a hearing on that motion is set for May 1, 2025.
Commitments – U.S. repatriation tax
Under the 2017 Tax Act, we elected to pay in eight annual installments the repatriation tax related primarily to prior indefinitely invested earnings of our foreign operations. The final U.S. repatriation tax payment of $1.8 billion will be made in 2025.
SCHEDULE II
AMGEN INC.
VALUATION AND QUALIFYING ACCOUNTS
Years ended December 31, 2024, 2023 and 2022
(In millions)
| | | | | | | | | | | | | | | | | | | | | | | | | | | | | | | | |
| Allowance for doubtful accounts | | Balance
at beginning
of period | | Additions
charged to
costs and
expenses | | Other
additions | | Deductions | | Balance
at end
of period |
| 2024 | | $ | 28 | | | $ | 13 | | | $ | — | | | $ | (3) | | | $ | 38 | |
| 2023 | | $ | 22 | | | $ | 6 | | | $ | — | | | $ | — | | | $ | 28 | |
| 2022 | | $ | 26 | | | $ | — | | | $ | — | | | $ | (4) | | | $ | 22 | |