Table of Contents
UNITED STATES
SECURITIES AND EXCHANGE COMMISSION
Washington, D.C. 20549
SCHEDULE 14A INFORMATION
Proxy Statement Pursuant to Section 14(a) of the
Securities Exchange Act of 1934
| ☑ Filed by the registrant | ☐ Filed by a party other than the registrant |
Check the appropriate box:
| ||||
☐
|
Preliminary Proxy Statement
| |||
☐
|
CONFIDENTIAL, FOR USE OF THE COMMISSION ONLY (AS PERMITTED BY RULE 14A-6(E)(2))
| |||
☑
|
Definitive Proxy Statement
| |||
☐
|
Definitive Additional Materials
| |||
☐
|
Soliciting Material Pursuant to Section 240.14a-12
| |||
AMGEN INC.
(Name of Registrant as Specified in Its Charter)
(Name of Person(s) Filing Proxy Statement, if other than the Registrant)
Payment of filing fee (check the appropriate box):
| ||||
☑
|
No fee required.
| |||
☐
|
Fee computed on table below per Exchange Act Rules 14a-6(i)(1) and 0-11
| |||
(1)
|
Title of each class of securities to which transaction applies:
| |||
(2)
|
Aggregate number of securities to which transaction applies:
| |||
(3)
|
Per unit price or other underlying value of transaction computed pursuant to Exchange Act Rule 0-11 (set forth the amount on which the filing fee is calculated and state how it was determined):
| |||
(4)
|
Proposed maximum aggregate value of transaction:
| |||
(5)
|
Total fee paid:
| |||
☐
|
Fee paid previously with preliminary materials.
| |||
☐ |
Check box if any part of the fee is offset as provided by Exchange Act Rule 0-11(a)(2) and identify the filing for which the offsetting fee was paid previously. Identify the previous filing by registration statement number, or the Form or Schedule and the date of its filing.
| |||
(1)
|
Amount Previously Paid:
| |||
(2)
|
Form, Schedule or Registration Statement No.:
| |||
(3)
|
Filing Party:
| |||
(4)
|
Date Filed: | |||
Table of Contents

Table of Contents
Robert A. Bradway Chairman of the Board, Chief Executive Officer and President | ||
| ||
Amgen Inc. One Amgen Center Drive Thousand Oaks, CA 91320-1799 |

April 8, 2019
Dear Fellow Stockholder:
You are invited to attend the 2019 Annual Meeting of Stockholders, or Annual Meeting, of Amgen Inc. to be held on Tuesday, May 21, 2019, at 11:00 A.M., local time, at the Four Seasons Hotel Westlake Village, Two Dole Drive, Westlake Village, California 91362.
Our Mission and Strategy: We seek to develop innovativemedicines that address important unmet medical needs in the fight against serious illness. This objective is the central underpinning of our strategy which includes an integrated set of activities to strengthen our competitive position in our industry. In addition to our significant commitment to innovative research and development and the commercialization of the medicines we make, we are developing branded biosimilars which utilize our industry-leading biologics manufacturing skills. We are doing this while investing for long-term growth, deploying next-generation biomanufacturing facilities, expanding our global geographic reach, improving drug delivery systems, and building on our recent transformation successes to more efficiently bring our discoveries out of the lab and to patients worldwide. While investing in all these activities, we have simultaneously maintained a disciplined approach to capital allocation through which we invest in our future while also returning capital to stockholders. The consistent, strong execution of our strategy results in solving complex problems in biotechnology that benefit patients, building a long-lasting business, and generating long-term stockholder value.
Execution on Our Strategy in 2018: We launched several medicines, includingAimovig®*, the first calcitonin gene-related peptide (CGRP) inhibitor approved for the preventive treatment of migraine in adults,Parsabiv®, for secondary hyperparathyroidism, and our first two biosimilars, KANJINTI™ (biosimilar trastuzumab (Herceptin®)) andAMGEVITA™(biosimilar adalimumab (HUMIRA®)), in Europe. Recognizing the urgent need presented by cardiovascular disease, we also took significant actions in 2018 to address affordability challenges for patients who would benefit fromRepatha® (our medicine to dramatically reducelow-density lipoprotein (bad) cholesterol), making it available in the U.S. at a 60% reduction from the medicine’s original list price. We advanced our early oncology pipeline. We also broke ground on our new next-generation biomanufacturing plant in Rhode Island in 2018. This new plant will be the first of its kind in the U.S. and will use our proven next-generation biomanufacturing capabilities to reliably supply medicines and meet the need of every patient, every time. In the Compensation Discussion and Analysis section of this proxy, we further discuss our progress against our strategic priorities in 2018.
Our Transformation:2018 was the capstone year for a set of ambitiousnon-GAAP financial commitments we made to our stockholders five years ago, including earnings per share growth, operating margin improvement, and return of capital. As we previously reported, we met and exceeded these targets. The larger goal of our transformation, however, was to enhance our ability to compete. And here too, we’ve made great progress. Over the past five years, we launched nine new products, including in two new therapeutic areas, expanded our global presence to approximately 100 countries, generated our largest ever number of innovative andfirst-in-class molecules in our pipeline, reduced our development cycle time by an average of approximately 36 months, expanded our industry-leading human genetics capabilities, established a biosimilars business, and deployed a first of its kind, highly-efficient, next-generation biologics manufacturing capability. While our transformation is not complete, we’re in a much better position than ever before to serve patients and to deliver long-term growth.
Stockholder Engagement:We are also guided by the perspectives of our stockholders as expressed through direct engagement with us throughout the year and at our Annual Meeting. Since our 2018 annual meeting of stockholders, in addition to outreach by our executives and Investor Relations department to our investors owning approximately 58% of our outstanding shares, we have engaged in governance-focused outreach activities and discussions with the governance teams for stockholders comprising approximately 53% of our outstanding shares. Topics discussed included our business and financial performance, our environmental, sustainability, and governance programs, executive compensation (including its direct link to our business strategy), and product pricing. Feedback received during these meetings is shared with the full Board of Directors and informs Board decisions. We are eager to continue this valuable dialogue with our investors in the coming year.
I look forward to sharing more about our Company at the Annual Meeting. In addition to the business to be transacted and described in the accompanying Notice of Annual Meeting of Stockholders, I will discuss recent developments during the past year, the substantial progress we made on our strategic priorities for 2018, and respond to comments and questions.
On behalf of the Board of Directors, I thank you for your participation and investment in Amgen. We look forward to seeing you on May 21. As a final note, and also on behalf of the Board of Directors, I would like to thank Frank Herringer, who is not standing forre-election, for his years of wise counsel and guidance for Amgen.
Sincerely,

Robert A. Bradway
Chairman of the Board,
Chief Executive Officer and President
| *Jointly | developed in collaboration with Novartis AG. |
Table of Contents
Amgen Inc. One Amgen Center Drive Thousand Oaks, California 91320-1799 |
Notice of Annual Meeting of Stockholders
To be Held on May 21, 2019
To the Stockholders of Amgen Inc.:
Date and Time: | Tuesday, May 21, 2019, at 11:00 A.M., local time | |||
Location: | Four Seasons Hotel Westlake Village, Two Dole Drive, Westlake Village, California 91362 | |||
Record Date: | March 22, 2019. Amgen stockholders of record at the close of business on the record date are entitled to receive notice of, and vote at, the 2019 Annual Meeting of Stockholders, or Annual Meeting, and any continuation, postponement, or adjournment thereof. | |||
Mail Date: | We intend to mail the Notice Regarding the Availability of Proxy Materials, or the proxy statement and proxy card, as applicable, on or about April 8, 2019, to our stockholders of record on the record date. | |||
| Items of Business: | ||||
1. | To elect 12 directors to the Board of Directors of Amgen for a term of office expiring at the 2020 annual meeting of stockholders. The nominees for election to the Board of Directors are Dr. Wanda M. Austin, Mr. Robert A. Bradway, Dr. Brian J. Druker, Mr. Robert A. Eckert, Mr. Greg C. Garland, Mr. Fred Hassan, Dr. Rebecca M. Henderson, Mr. Charles M. Holley, Jr., Dr. Tyler Jacks, Ms. Ellen J. Kullman, Dr. Ronald D. Sugar, and Dr. R. Sanders Williams; | |||
2. | To hold an advisory vote to approve our executive compensation; | |||
3. | To ratify the selection of Ernst & Young LLP as our independent registered public accountants for the fiscal year ending December 31, 2019; and | |||
4. | To transact such other business as may properly come before the Annual Meeting or any continuation, postponement, or adjournment thereof. | |||
Attendance: If you plan to attend the Annual Meeting, you will need an admittance ticket and proof of ownership of our Common Stock as of the close of business on March 22, 2019. Please read “INFORMATION CONCERNING VOTING AND SOLICITATION—Attendance at the Annual Meeting” in the accompanying proxy statement. | ||||
Voting:Your vote is important, regardless of the number of shares that you own. Whether or not you plan to attend the Annual Meeting in person, it is important that your shares be represented and voted. Please read the Notice of Annual Meeting of Stockholders and proxy statement with care and follow the voting instructions to ensure that your shares are represented. By submitting your proxy promptly, you will save the Company the expense of further proxy solicitation. We encourage you to submit your proxy as soon as possible by Internet, by telephone, or by signing, dating, and returning all proxy cards or instruction forms provided to you.
By Order of the Board of Directors

Jonathan P. Graham
Secretary
Thousand Oaks, California
April 8, 2019
Table of Contents
|
Table of Contents
|
|
 ï 2019 Proxy Statement
Table of Contents
|
Proxy Statement Summary
|
|
This summary contains highlights about our Company and the upcoming 2019 Annual Meeting of Stockholders, or Annual Meeting. This summary does not contain all of the information that you should consider in advance of the meeting and we encourage you to read the entire proxy statement before voting.
2019 Annual Meeting of Stockholders
Date and Time: | Tuesday, May 21, 2019, at 11:00 A.M., local time | |
Location: | Four Seasons Hotel Westlake Village, Two Dole Drive, Westlake Village, California 91362 | |
Record Date: | March 22, 2019 | |
Mail Date: | We intend to mail the Notice Regarding the Availability of Proxy Materials, or the proxy statement and proxy card, as applicable, on or about April 8, 2019, to our stockholders. | |
Voting Matters and Board Recommendations
Matter
|
Our Board Vote Recommendation
| |||
Item 1:
| Election of 12 Nominees to the Board of Directors (page 6)
| FOR each Director Nominee
| ||
Item 2:
| Advisory Vote to Approve Our Executive Compensation (page 28)
| FOR
| ||
Item 3:
| Ratification of Selection of Independent Registered Public Accountants (page 91)
| FOR
| ||
How to Vote
| • By Internet: You may submit a proxy over the Internet by following the instructions on the website referred to in the Notice, proxy card, or voting instruction form mailed to you. You will need the control number that appears on your Notice, proxy card, or voting instruction form. | |
| • By Telephone: You may submit a proxy by telephone by following the instructions on the website referred to in the Notice, proxy card, or voting instruction form mailed to you. You will need the control number that appears on your Notice, proxy card, or voting instruction form. | |
| • By Mail: If you received a full paper set of materials, date and sign your proxy card or voting instruction form and mail it in the enclosed, postage-paid envelope. If you received a Notice, you may request a proxy card by following the instructions on your Notice. You do not need to mail the proxy card if you are voting by Internet or telephone. | |
| • In Person: If you plan to attend the Annual Meeting,you will need an admittance ticketand proof of ownership of our Common Stock as of the close of business on March 22, 2019. If you plan to attend the Annual Meeting and wish to vote in person, you may request a ballot at the Annual Meeting.Please note that if your shares are held of record by a broker, bank, trust, or other nominee, and you decide to attend and vote at the Annual Meeting, your vote in person at the Annual Meeting will not be effective unless you present a legal proxy, issued in your name from the record holder (your broker, bank, trust, or other nominee). Please read “INFORMATION CONCERNING VOTING AND SOLICITATION—Attendance at the Annual Meeting.” Even if you intend to attend the Annual Meeting, we encourage you to submit your proxy in advance of the Annual Meeting. |


ï 2019 Proxy Statement 1
Table of Contents
|
Proxy Statement Summary
|
|
Item 1: Election of 12 Nominees to the Board of Directors (Page 6)
Nominee | Independent | Age | | Director Since |
| Audit | | Governance and Nominating |
| Executive | | Compensation and Management Development |
| | Equity Award |
| | Corporate Responsibility and Compliance | ||||||||||||||||||||
Wanda M. Austin
|
| ✓
|
|
| 64
|
|
| 2017
|
|
| M
|
|
| M
|
| |||||||||||||||||||||||
Robert A. Bradway
|
| 56
|
|
| 2011
|
|
| C
|
|
| M
|
| ||||||||||||||||||||||||||
Brian J. Druker
|
| ✓
|
|
| 63
|
|
| 2018
|
|
| M
|
|
| M
|
| |||||||||||||||||||||||
Robert A. Eckert
|
| ✓
|
|
| 64
|
|
| 2012
|
|
| M
|
|
| M
|
|
| C
|
|
| C
|
| |||||||||||||||||
Greg C. Garland
|
| ✓
|
|
| 61
|
|
| 2013
|
|
| C
|
|
| M
|
|
| M
|
|
| M
|
| |||||||||||||||||
Fred Hassan
|
| ✓
|
|
| 73
|
|
| 2015
|
|
| M
|
|
| M
|
| |||||||||||||||||||||||
Rebecca M. Henderson
|
| ✓
|
|
| 58
|
|
| 2009
|
|
| M
|
|
| M
|
| |||||||||||||||||||||||
Charles M. Holley, Jr.
|
| ✓
|
|
| 62
|
|
| 2017
|
|
| C
|
|
| M
|
|
| M
|
| ||||||||||||||||||||
Tyler Jacks
|
| ✓
|
|
| 58
|
|
| 2012
|
|
| M
|
|
| M
|
| |||||||||||||||||||||||
Ellen J. Kullman
|
| ✓
|
|
| 63
|
|
| 2016
|
|
| M
|
|
| M
|
| |||||||||||||||||||||||
Ronald D. Sugar
|
| ✓
|
|
| 70
|
|
| 2010
|
|
| M
|
|
| M
|
|
| C
|
| ||||||||||||||||||||
R. Sanders Williams
|
| ✓
|
|
| 70
|
|
| 2014
|
|
| M
|
|
| M
|
| |||||||||||||||||||||||
| “C” | indicates Chair of the committee. |
| “M” | indicates member of the committee. |
Corporate Governance Highlights and Best Practices

| * | For our director nominees. |
2 ï 2019 Proxy Statement
Table of Contents
|
Proxy Statement Summary
|
|
We Have Implemented Governance Best Practices
We continuously monitor developments and best practices in corporate governance and consider stockholder feedback when enhancing our governance structures. Below are highlights of our key governance practices:
Effective Board Leadership and Independent Oversight |
✓ Highly Independent Board – 11 of our 12 director nominees(page 21)
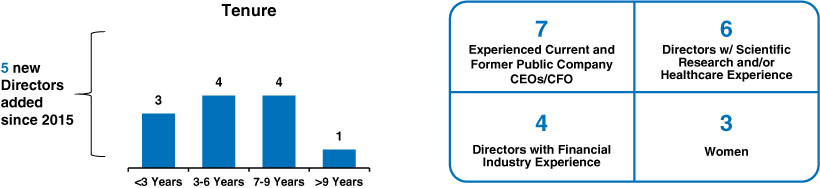
✓ Strong Refreshment Practices With 5 New Directors Since 2015 – Average Board tenure of approximately 5 years for our director nominees(pages 7 and 14)
✓ Annual Anonymous Board and Committee Evaluation Process(pages 14 and 20-21)
✓ All Directors Meet Our Board of Directors Guidelines for Director Qualifications and Evaluations(Appendix A)
✓ Robust Lead Independent Director Role(page 15)
✓ Corporate Responsibility and Compliance Committee(page 23)
✓ Enterprise Risk Management Program and Annual Detailed Compensation Risk Analysis – overseen by Board and Compensation and Management Development Committee, respectively(pages 16-17 and 26-27)
| |||
Focus on Stockholder Rights |
✓ Proxy Access(pages 15 and 99) –up to 20 eligible stockholders that own 3% of shares for 3 years who meet the requirements set forth in our Bylaws can nominate director nominees constituting up to the greater of 20% of the total directors or two nominees
✓ Majority Voting Standard for Director Elections(pages 14 and 97)
✓ Stockholders* May Act By Written Consent(page 15)
✓ Stockholders* Have a Right to Call Special Meetings (15% threshold requirement)(page 15)
✓ No Supermajority Vote Provisions in Certificate of Incorporation or Bylaws(page 15)
✓ No Poison Pill(page 15)
| |||
History of Transparency and Accountability |
✓ Significant Stock Ownership Requirements for Officers and Directors(pages 62 and 84)
✓ Regular Engagement With Stockholders to Seek Feedback (page 41)
✓ We Continue to Seek Mechanisms to Lower the Cost Burden on Society of Serious Diseases
✓ We Have Demonstrated our Commitment to Environmentally Responsible Operations, Improving Patient Access to Medicines, Science Education, and our Community (page 24)
|
THE BOARD OF DIRECTORS RECOMMENDS A VOTE “FOR” EACH OF THE 12 NAMED NOMINEES.
| ||||
|
| * | Who meet the requirements set forth in our Amended and Restated Bylaws. |
ï 2019 Proxy Statement 3
Table of Contents
|
Proxy Statement Summary
|
|
Item 2: Advisory Vote to Approve Our Executive
Compensation (Page 28)
2018 Total Target Direct Compensation Mix
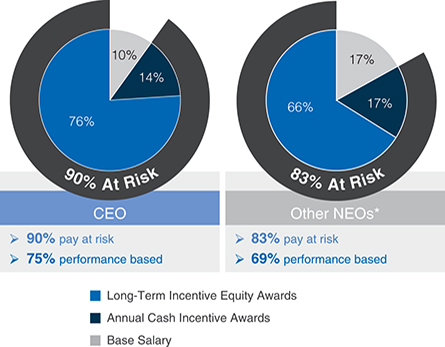
| • | A significant majority of each Named Executive Officer’s, or NEOs, compensation is at-risk and dependent on our performance and execution of our strategic priorities. |
| • | We use median values as the reference point for each element of compensation at all levels, including our NEOs. We consider performance, job scope, and contribution in our final pay decisions. |
| • | Our compensation program is directly linked to our performance and strategy. Each year, our Compensation and Management Development Committee approves Company performance goals under our annual cash incentive programs that are designed to focus our staff on delivering financial and operational objectives to drive annual performance, advance strategic priorities, and position us for longer-term success. |
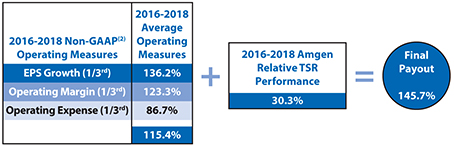
| • | 80% of our annual long-term incentive, or LTI, equity award grants are performance-based, aligning compensation with long-term value creation for our stockholders. Three-year performance units comprise 50% of our LTI equity award grants for the 2016-2018 performance period and the goal design and all measurement targets are established at the beginning of the three-year performance period. Our 2016-2018 performance units were earned for a performance period ending December 31, 2018, based on the Company’s performance on three equally weighted annualnon-Generally Accepted Accounting Principles, ornon-GAAP, operating measures of earnings per share, or EPS, growth, operating margin, and operating expense as measured against thepre-established targets for each of the three years. |
| * | Mr. Gordon and Dr. Reese are not included in the pie chart because they commenced their roles as executive officers of our Company on September 3, 2018, and July 26, 2018, respectively. |
4 ï 2019 Proxy Statement
Table of Contents
|
Proxy Statement Summary
|
|
2018 Performance AgainstPre-Established Goals and Measures
2018 Annual Cash Incentive Program
| 2016-2018 Long-Term Incentive Performance Award Payout
| |||||||
Goal
| Weighting
|
% of Target Earned
|  | |||||
Financial Performance
| ||||||||
Revenues
|
| 30%
|
| 224.7%
| ||||
Non-GAAP Net Income(1)
|
| 30%
|
| 186.5%
| ||||
Progress Innovative Pipeline
| ||||||||
Advance Early Pipeline
|
| 5%
|
| 113.9%
| ||||
Execute Key Clinical Studies and Regulatory Filings
|
| 20%
|
| 120.8%
| ||||
Deliver Annual Priorities
| ||||||||
Execute Critical Launches and Long-Term Commercial Objectives
|
| 10%
|
| 71.3%
| ||||
Achieve Transformation Objectives
|
| 5%
|
| 124.2%
| ||||
Final Score
|
| Achieved 166.6%
| ||||||
| (1) | Non-GAAP net income for purposes of the 2018 Company performance goals of our annual cash incentive award program is reported and reconciled inAppendix B. |
| (2) | The operating measures of the 2016-2018 performance units were based onnon-GAAP financial results for 2016, 2017, and 2018 as reported and reconciled inAppendix B, except that operating measures were further adjusted for the impacts of Hurricane Maria as prescribed by the terms of the 2016-2018 performance goals document. For this purpose, operating expense was reduced by $147 million ($0.16 in EPS) for 2017 and increased by $21 million ($0.03 in EPS) for 2018. |
THE BOARD OF DIRECTORS RECOMMENDS A VOTE “FOR” THE APPROVAL OF THE ADVISORY RESOLUTION INDICATING THE APPROVAL OF THE COMPENSATION OF THE COMPANY’S NAMED EXECUTIVE OFFICERS.
|
Item 3: Ratification of Selection of Independent Registered Public Accountants (Page 91)
| • | The Audit Committee of the Board has selected Ernst & Young LLP, or Ernst & Young, as our independent registered public accountants for the fiscal year ending December 31, 2019. |
| • | Ernst & Young has served as our independent registered public accounting firm since the Company’s inception in 1980. |
| • | Each year, the Audit Committee evaluates the qualifications and performance of the Company’s independent registered public accountants and determines whether tore-engage the current independent registered public accountants. |
| • | Based on this evaluation, the Audit Committee believes that the continued retention of Ernst & Young is in the best interests of the Company and its stockholders. |
THE BOARD OF DIRECTORS RECOMMENDS A VOTE “FOR” RATIFICATION OF OUR INDEPENDENT REGISTERED PUBLIC ACCOUNTANTS.
|
ï 2019 Proxy Statement 5
Table of Contents
|
Item 1 — Election of Directors
|
|
Election of Directors
Under our governing documents, the Board of Directors, or Board, has the power to set the number of directors from time to time by resolution. We currently have 13 authorized directors serving on our Board. Based upon the recommendation of our Governance and Nominating Committee, the Board has nominated each of the director nominees set forth below to stand forre-election, in each case for aone-year term expiring at our 2020 annual meeting of stockholders and until his or her successor is elected and qualified, or until his or her earlier retirement, resignation, disqualification, removal, or death. Frank C. Herringer will retire from our Board and has not been nominated forre-election at the 2019 Annual Meeting of Stockholders, or Annual Meeting.
The Board has fixed the authorized number of directors at 12 to be effective as of the close of the Annual Meeting and the election by stockholdersofthenomineesstandingforelection.Eachnomineehasagreedto serve if elected and the Board has no reason to believe that any nominee will be unable to serve. However, if any nominee should
become unavailable for election prior to the Annual Meeting, the proxies will be voted in favor of the election of a substitute nominee or nominees proposed by the Board or, alternatively, the number of directors may be reduced accordingly by the Board. Vacancies on the Board (including any vacancy created by an increase in the size of the Board) may be filled only by a majority of the directors remaining in office, even though less than a quorum of the Board. A director elected by the Board to fill a vacancy (including a vacancy created by an increase in the size of the Board) will serve until the next annual meeting of stockholders and until such director’s successor is elected and qualified, or until such director’s earlier retirement, resignation, disqualification, removal, or death.
The independent members of the Board have elected Robert A. Eckert to continue to serve as our lead independent director, subject to hisre-election to the Board by our stockholders at the Annual Meeting. As lead independent director, Mr. Eckert will continue to have the specific and significant duties as discussed under “Corporate Governance.”
Nominees to the Board
Nominee | Independent | Age | | Director Since |
| Audit | | Governance and Nominating |
| Executive | | Compensation and Management Development |
| | Equity Award |
| | Corporate Responsibility and Compliance | ||||||||||||||||||||
Wanda M. Austin
|
| ✓
|
|
| 64
|
|
| 2017
|
|
| M
|
|
| M
|
| |||||||||||||||||||||||
Robert A. Bradway
|
| 56
|
|
| 2011
|
|
| C
|
|
| M
|
| ||||||||||||||||||||||||||
Brian J. Druker
|
| ✓
|
|
| 63
|
|
| 2018
|
|
| M
|
|
| M
|
| |||||||||||||||||||||||
Robert A. Eckert
|
| ✓
|
|
| 64
|
|
| 2012
|
|
| M
|
|
| M
|
|
| C
|
|
| C
|
| |||||||||||||||||
Greg C. Garland
|
| ✓
|
|
| 61
|
|
| 2013
|
|
| C
|
|
| M
|
|
| M
|
|
| M
|
| |||||||||||||||||
Fred Hassan
|
| ✓
|
|
| 73
|
|
| 2015
|
|
| M
|
|
| M
|
| |||||||||||||||||||||||
Rebecca M. Henderson
|
| ✓
|
|
| 58
|
|
| 2009
|
|
| M
|
|
| M
|
| |||||||||||||||||||||||
Charles M. Holley, Jr.
|
| ✓
|
|
| 62
|
|
| 2017
|
|
| C
|
|
| M
|
|
| M
|
| ||||||||||||||||||||
Tyler Jacks
|
| ✓
|
|
| 58
|
|
| 2012
|
|
| M
|
|
| M
|
| |||||||||||||||||||||||
Ellen J. Kullman
|
| ✓
|
|
| 63
|
|
| 2016
|
|
| M
|
|
| M
|
| |||||||||||||||||||||||
Ronald D. Sugar
|
| ✓
|
|
| 70
|
|
| 2010
|
|
| M
|
|
| M
|
|
| C
|
| ||||||||||||||||||||
R. Sanders Williams
|
| ✓
|
|
| 70
|
|
| 2014
|
|
| M
|
|
| M
|
| |||||||||||||||||||||||
| “C” | indicates Chair of the committee. |
| “M” | indicates member of the committee. |
6 ï 2019 Proxy Statement
Table of Contents
|
Item 1 — Election of Directors
|
|
Summary of Director Nominee Core Experiences and Skills
Our Board possesses a deep and broad set of skills and experiences that facilitate strong oversight and strategic direction for a leading global innovator in biotechnology. The following chart summarizes the competencies of each director nominee to be represented on our Board. The details of each director’s competencies are included in each director’s profile.
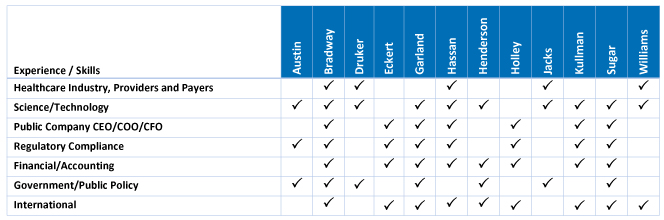
Experience / Skills Austin Bradway Druker Eckert Garland Hassan Henderson Holley Jacks Kullman Sugar Williams Healthcare Industry, Providers and Payers Science/Technology Public Company CEO/COO/CFO Regulatory Compliance Financial/Accounting Government/Public Policy International
The lack of a “✓” for a particular item does not mean that the director does not possess that qualification, characteristic, skill, or experience. Each of our Board members have experience and/or skills in the enumerated areas, however, the✓ is designed to indicate that a director has particular strength in that area.
ï 2019 Proxy Statement 7
Table of Contents
|
Item 1 — Election of Directors
|
|
THE BOARD OF DIRECTORS RECOMMENDS A VOTE “FOR” EACH OF THE NAMED NOMINEES. PROXIES WILL BE VOTED “FOR” THE ELECTION OF THE NOMINEES UNLESS OTHERWISE SPECIFIED.
Set forth below is biographical information for each nominee and a summary of the specific qualifications, attributes, skills, and experiences which led our Board to conclude that each nominee should serve on the Board at this time. All of our directors meet the qualifications and skills of our Amgen Inc. Board of Directors Guidelines for Director Qualifications and Evaluations included in this proxy statement asAppendix A. There are no family relationships among any of our directors or among any of our directors and our executive officers.
Wanda M. Austin
Director since: 2017
Age:64
Committees: • Audit • Corporate Responsibility and Compliance Other Public Company Boards: • Chevron Corporation
|
Wanda M. Austin has served as a director of the Company since 2017. Dr. Austin was appointed Interim President of the University of Southern California in August 2018. She is the retired President and Chief Executive Officer of The Aerospace Corporation, a leading architect of the United States’ national security space programs, where she served from 2008 until her retirement in 2016. From 2004 to 2007, Dr. Austin was Senior Vice President, National Systems Group of The Aerospace Corporation. Dr. Austin joined The Aerospace Corporation in 1979 and served in various positions from 1979 until 2004.
Dr. Austin has served as an Adjunct Research Professor at the University of Southern California’s Viterbi School of Engineering since 2007. She is theco-founder of MakingSpace, Inc., where she serves as a motivational speaker on STEM education. Dr. Austin has been a director of Chevron Corporation, a petroleum, exploration, production and refining company, since 2016, serving on its Board Nominating and Governance Committee and chairing its Public Policy Committee. Dr. Austin is a trustee of the University of Southern California and previously served on the boards of directors of the National Geographic Society and the Space Foundation. Dr. Austin received an undergraduate degree from Franklin & Marshall College, a master’s degree from the University of Pittsburgh, and a doctorate from the University of Southern California. She is a member of the National Academy of Engineering.
Qualifications
The Board concluded that Dr. Austin should serve on the Board based on her leadership and management experience as a chief executive officer, her extensive background in science, technology, and government affairs in a highly regulated industry, and her public board experience. |

Robert A. Bradway
Director since:2011
Age:56
Committees: • Equity Award • Executive (Chair)
Other Public Company Boards: • The Boeing Company
|
Robert A. Bradway has served as our director since 2011 and Chairman of the Board since 2013. Mr. Bradway has been our President since 2010 and Chief Executive Officer since 2012. From 2010 to 2012, Mr. Bradway served as our Chief Operating Officer. Mr. Bradway joined Amgen in 2006 as Vice President, Operations Strategy and served as Executive Vice President and Chief Financial Officer from 2007 to 2010. Prior to joining Amgen, he was a Managing Director at Morgan Stanley in London where, beginning in 2001, he had responsibility for the firm’s banking department and corporate finance activities in Europe.
Mr. Bradway has been a director of The Boeing Company, an aerospace company and manufacturer of commercial airplanes, defense, space and securities systems, since 2016, serving on its Audit and Finance Committees. From 2011 to May 2017, Mr. Bradway was a director of Norfolk Southern Corporation, a transportation company. He has served on the board of trustees of the University of Southern California since 2014 and on the advisory board of the Leonard D. Schaeffer Center for Health Policy and Economics at that university since 2012. Mr. Bradway holds a bachelor’s degree in biology from Amherst College and a master’s degree in business administration from Harvard Business School.
Qualifications
The Board concluded that Mr. Bradway should serve on the Board based on his thorough knowledge of all aspects of our business, combined with his leadership and management skills having previously served as our President and Chief Operating Officer and as our Chief Financial Officer. |

8 ï 2019 Proxy Statement
Table of Contents
|
Item 1 — Election of Directors
|
|
Brian J. Druker
Director since:2018
Age:63
Committees: • Audit • Corporate Responsibility and Compliance
|
Brian J. Druker has served as a director of the Company since May 2018. Dr. Druker joined Oregon Health & Science University, or OHSU, in 1993 and is currently a physician-scientist and professor of medicine. Dr. Druker has served as the director of the OHSU Knight Cancer Institute since 2007, associate dean for oncology of the OHSU School of Medicine since 2010, and theJELD-WEN chair of leukemia research at OHSU since 2001. He has been an investigator with the Howard Hughes Medical Institute, a nonprofit medical research organization, since 2002.
Dr. Druker has served on the scientific advisory boards of Aptose Biosciences Inc., a biotechnology company, since 2013, and Grail, Inc., a biotechnology company, since 2016. In 2011, he founded Blueprint Medicines Corporation, a biopharmaceutical company, and remains as a scientific advisor to this company. In 2006, he founded MolecularMD, a privately-held molecular diagnostics company.
Dr. Druker has received numerous awards, including the Lasker-DeBakey Clinical Research Award in 2009, the Japan Prize in Healthcare and Medical Technology in 2012, the Albany Medical Center Prize in 2013 (for influential work in the development of STI571 (Gleevec®) for the treatment of chronic myeloid leukemia), and the Tang Prize in Biopharmaceutical Science in 2018. He was elected to the National Academy of Sciences in 2012 as well as the National Academy of Medicine in 2007. Dr. Druker received both an undergraduate degree and his doctorate from the University of California, San Diego. |

Qualifications
The Board concluded that Dr. Druker should serve on the Board based on his extensive scientific research and expertise leading an important academic institution, conducting highly significant research in the area of oncology, and directly managing the care of cancer patients.
Robert A. Eckert
Lead Independent Director
Director since:2012
Age:64
Committees: • Compensation and Management Development (Chair) • Equity Award (Chair) • Executive • Governance and Nominating
Other Public Company Boards: • Levi Strauss & Co. • McDonald’s Corporation
|
Robert A. Eckert is our lead independent director. Mr. Eckert has been an Operating Partner at Friedman Fleischer & Lowe, a private equity firm, since 2014. Mr. Eckert was the Chief Executive Officer of Mattel, Inc., a toy design, manufacture and marketing company, having held this position from 2000 through 2011, and its Chairman of the Board from 2000 through 2012. He was President and Chief Executive Officer of Kraft Foods Inc., a consumer packaged food and beverage company, from 1997 to 2000, Group Vice President from 1995 to 1997, President of the Oscar Mayer Foods Division from 1993 to 1995 and held various other senior executive and other positions from 1977 to 1992.
Mr. Eckert has been a director of McDonald’s Corporation, a company which franchises and operates McDonald’s restaurants in the global restaurant industry, since 2003, serving as the Chair of the Public Policy and Strategy Committee and a member of the Executive and Governance Committees. Mr. Eckert also has served as a director of Levi Strauss & Co., a jeans and casual wear manufacturer, since 2010, serving as Chair of the Compensation Committee and a member of the Nominating, Governance and Corporate Citizenship Committee. Levi Strauss & Co. was a privately-held company until March 2019 when it became publicly traded. Mr. Eckert was a director of Smart & Final Stores, Inc., a warehouse store, from 2013 until 2014 prior to it becoming a publicly-traded company. He was appointed director of Eyemart Express Holdings LLC, a privately-held eyewear retailer and portfolio company of Friedman Fleischer & Lowe, in 2015. Mr. Eckert is on the Global Advisory Board of the Kellogg School of Management at Northwestern University and serves on the Eller College National Board of Advisors at the University of Arizona. Mr. Eckert received an undergraduate degree from the University of Arizona and a master’s degree in business administration from the Kellogg School of Management at Northwestern University.
Qualifications
The Board concluded that Mr. Eckert should serve on our Board because of Mr. Eckert’s long-tenured experience as a chief executive officer of large public companies, his broad international experience in marketing and business development, and his valuable leadership experience.
|

ï 2019 Proxy Statement 9
Table of Contents
|
Item 1 — Election of Directors
|
|
Greg C. Garland
Director since:2013
Age:61
Committees: • Compensation and Management Development • Equity Award • Executive • Governance and Nominating (Chair)
Other Public Company Boards: • Phillips 66(1)
|
Greg C. Garland is the Chairman and Chief Executive Officer of Phillips 66, an energy manufacturing and logistics company with midstream, chemical, refining and marketing and specialties businesses created through the repositioning of ConocoPhillips, having held this position since 2012. Mr. Garland chairs the Executive Committee of Phillips 66.(1) Prior to Phillips 66, Mr. Garland served as Senior Vice President, Exploration and Production, Americas of ConocoPhillips from 2010 to 2012. He was President and Chief Executive Officer of Chevron Phillips Chemical Company (now a joint venture between Phillips 66 and Chevron) from 2008 to 2010 and Senior Vice President, Planning and Specialty Chemicals from 2000 to 2008. Mr. Garland served in various positions at Phillips Petroleum Company from 1980 to 2000. Mr. Garland is a member of the Engineering Advisory Council for Texas A&M University. Mr. Garland received an undergraduate degree from Texas A&M University.
Qualifications
The Board concluded that Mr. Garland should serve on our Board because of Mr. Garland’s experience as a chief executive officer and his over 30 years of international experience in a highly regulated industry.
|

| (1) | Mr. Garland also serves as Chairman and Chief Executive Officer of Phillips 66 Partners LP, a master limited partnership and wholly-owned subsidiary of Phillips 66 without any employees. |
Fred Hassan
Director since:2015
Age:73
Committees: • Audit • Compensation and Management Development
Other Public Company Boards: • Intrexon Corporation
Audit Committee financial expert |
Fred Hassan is Director at Warburg Pincus LLC, a global private equity investment institution, since 2018. Mr. Hassan was Special Limited Partner at Warburg Pincus LLC from 2017 to 2018 and Partner and Managing Director from 2011 to 2017 and, prior to that, served as Senior Advisor from 2009 to 2010. Mr. Hassan was Chairman of the Board and Chief Executive Officer of Schering-Plough Corporation from 2003 to 2009. Prior to this, Mr. Hassan was Chairman, President and Chief Executive Officer of Pharmacia Corporation, from 2001 to 2003. Before assuming these roles, he had served as President and Chief Executive Officer of Pharmacia Corporation from its creation in 2000 as a result of the merger of Pharmacia & Upjohn, Inc. with Monsanto Company. He was President and Chief Executive Officer of Pharmacia & Upjohn, Inc. beginning in 1997. Mr. Hassan previously held senior positions with Wyeth (formerly known as American Home Products), including that of Executive Vice President with responsibility for its pharmaceutical and medical products businesses, and served as a member of the board from 1995 to 1997. Prior to that, Mr. Hassan held various roles at Sandoz Pharmaceuticals and headed its U.S. pharmaceuticals businesses.
Mr. Hassan has been a director of Intrexon Corporation, a synthetic biology company, since 2016, serving on its Compensation Committee. Mr. Hassan was a director of Time Warner Inc., a media company, from 2009 until its acquisition by AT&T Inc., a provider of communications and digital entertainment services, in 2018. Mr. Hassan was a director of Avon Products, Inc., a manufacturer and marketer of beauty and related products, from 1999 until 2013 and served on its Compensation and Management Development, Nominating and Corporate Governance and Audit Committees, as lead independent director from 2009 to 2012, and Chairman of the Board between January and April 2013. Mr. Hassan was Chairman of the Board of Bausch & Lomb, from 2010 until its acquisition by Valeant Pharmaceuticals International, Inc., a pharmaceutical company, in 2013. Mr. Hassan served on the board of directors and Compensation and Audit Committees of Valeant Pharmaceuticals International, Inc. from 2013 to 2014. Mr. Hassan received an undergraduate degree from Imperial College of Science and Technology, University of London and a master's degree in business administration from Harvard Business School. |

Qualifications
The Board concluded that Mr. Hassan should serve on the Board based on his global experience as a public company chief executive officer, his particular knowledge and experience in the healthcare and pharmaceutical industries, including overseeing businesses with significant research and development operations, his diversified financial and business expertise, as well as prior public company board experience. Given his financial and leadership experience, Mr. Hassan has been determined to be an Audit Committee financial expert by our Board.
10 ï 2019 Proxy Statement
Table of Contents
|
Item 1 — Election of Directors
|
|
Rebecca M. Henderson
Director since: 2009
Age:58
Committees: • Audit • Corporate Responsibility and Compliance Other Public Company Boards: • IDEXX Laboratories, Inc.
|
Rebecca M. Henderson has been the John and Natty McArthur University Professor at Harvard University since 2011. From 2009 to 2011, Dr. Henderson served as the Senator John Heinz Professor of Environmental Management at Harvard Business School. Prior to this, she was a professor of management at the Massachusetts Institute of Technology, or MIT, for 21 years, having been the Eastman Kodak LFM Professor of Management since 1999. Since 1995, she has also been a Research Associate at the National Bureau of Economic Research. She specializes in technology strategy and the broader strategic problems faced by companies in high technology industries.
Dr. Henderson has been a director of IDEXX Laboratories, Inc., a company which provides diagnostic and information technology-based products and services for veterinary, food and water applications, since 2003, chairing its Finance Committee and serving on its Compensation Committee. Dr. Henderson has also served as a director of the Ember Corporation, a privately-held semiconductor chip manufacturer, and on its Compensation Committee, from 2001 to 2009. She has further been a director of Linbeck Construction Corporation, a privately-held facility solutions company, from 2000 until 2004. Dr. Henderson has published articles, papers and reviews in a range of scholarly journals. Dr. Henderson received an undergraduate degree from MIT and a doctorate from Harvard University.
Qualifications
The Board concluded that Dr. Henderson should serve on the Board because Dr. Henderson’s study of the complex strategy issues faced by high technology companies provides valuable insight into the Company’s strategic and technology issues. |

Charles M. Holley, Jr.
Director since:2017
Age:62
Committees: • Audit (Chair) • Corporate Responsibility and Compliance • Executive
Audit Committee financial expert
|
Charles M. Holley, Jr. is the former Executive Vice President and Chief Financial Officer forWal-Mart Stores, Inc., or Walmart, where he served from 2010 to 2015 and as Executive Vice President between January 1, 2016 and January 31, 2016. Prior to this, Mr. Holley served as Executive Vice President, Finance and Treasurer of Walmart from 2007 to 2010. From 2005 to 2006, he served as Senior Vice President. Prior to that, Mr. Holley was Senior Vice President and Controller from 2003 to 2005. Mr. Holley served various roles inWal-Mart International from 1994 through 2002. Prior to this, Mr. Holley served in various roles at Tandy Corporation. He spent more than ten years with Ernst & Young LLP. Mr. Holley is an Independent Senior Advisor, U.S. CFO Program, at Deloitte LLP, a privately-held provider of audit, consulting, tax, and advisory services, since 2016.
Mr. Holley serves on the Advisory Council for the McCombs School of Business at the University of Texas at Austin and the University of Texas Presidents’ Development Board.
Qualifications
The Board concluded that Mr. Holley should serve on the Board based on his experience as a chief financial officer of a global public company, his financial acumen, and his management and leadership skills. Given his financial and leadership experience, Mr. Holley has been determined to be an Audit Committee financial expert by our Board. |

ï 2019 Proxy Statement 11
Table of Contents
|
Item 1 — Election of Directors
|
|
Tyler Jacks
Director since:2012
Age:58
Committees: • Audit • Compensation and Management Development
Other Public Company Boards: • Thermo Fisher Scientific, Inc.
|
Tyler Jacks joined the faculty of Massachusetts Institute of Technology, or MIT, in 1992 and is currently the David H. Koch Professor of Biology and director of the David H. Koch Institute for Integrative Cancer Research, which brings together biologists and engineers to improve detection, diagnosis and treatment of cancer, a position he has held since 2007. Dr. Jacks has been an investigator with the Howard Hughes Medical Institute, a nonprofit medical research organization, since 1994.
Dr. Jacks has been a director of Thermo Fisher Scientific, Inc., a life sciences supply company, since 2009, serving on its Strategy and Finance Committee and scientific advisory board and chairing its Science and Technology Committee. In 2006, he co-founded T2 Biosystems, Inc., a biotechnology company, and served on its scientific advisory board until 2013. Dr. Jacks has served on the scientific advisory board of SQZ Biotech, a privately-held biotechnology company, since 2015. Dr. Jacks served on the scientific advisory board of Aveo Pharmaceuticals Inc., a biopharmaceutical company, from 2001 until 2013. In 2015, Dr. Jacks founded Dragonfly Therapeutics, Inc., a privately-held biopharmaceutical company, and serves as Chair of its scientific advisory board. He was appointed to the National Cancer Advisory Board, which advises and assists the Director of the National Cancer Institute with respect to the National Cancer Program, in 2011 and served as Chair until 2016. In 2016, Dr. Jacks was named to a blue ribbon panel of scientists and advisors established as a working group of the National Cancer Advisory Board and served as co-Chair advising the Cancer MoonshotSM Task Force. Dr. Jacks was a director of MIT’s Center for Cancer Research from 2001 to 2007 and received numerous awards including the Paul Marks Prize for Cancer Research and the American Association for Cancer Research Award for Outstanding Achievement. He was elected to the National Academy of Sciences as well as the National Academy of Medicine in 2009 and received the MIT Killian Faculty Achievement Award in 2015. Dr. Jacks received an undergraduate degree from Harvard University and his doctorate from the University of California, San Francisco. |

Qualifications
The Board concluded that Dr. Jacks should serve on the Board based on his extensive scientific expertise relevant to our industry, including his broad experience as a cancer researcher, pioneering uses of technology to study cancer-associated genes, and service on several scientific advisory boards and membership in the National Cancer Advisory Board.
Ellen J. Kullman
Director since: 2016
Age:63
Committees: • Audit • Governance and Nominating
Other Public Company Boards: • Dell Technologies Inc. • Goldman Sachs Group, Inc. • United Technologies Corporation
Audit Committee financial expert
|
Ellen J. Kullman is the former President, Chair and Chief Executive Officer of E.I. du Pont de Nemours and Company, or DuPont, a science and technology-based company, where she served from 2009 to 2015. Prior to this, Ms. Kullman served as President of DuPont from 2008 to 2009. From 2006 through 2008, she served as Executive Vice President of DuPont. Prior to that, Ms. Kullman was Group Vice President, DuPont Safety and Protection. Ms. Kullman has been a director of United Technologies Corporation, a technology products and services company, since 2011, and lead director since 2018, serving on its Compensation, Finance and Executive Committees. Ms. Kullman has been a director of Goldman Sachs Group, Inc., an investment banking firm, since 2016, serving on its Compensation, Corporate Governance and Nominating, and Risk Committees. Ms. Kullman has been a director of Dell Technologies Inc., a technology company, since 2016, serving on its Audit and Capital Stock Committees. Dell Technologies was a privately-held company until December 2018 when it became publicly traded. Ms. Kullman served as a director of General Motors, from 2004 to 2008, serving on its Audit Committee.
Ms. Kullman has also served as a director of Carbon3D, Inc., a privately-held 3D printing company, since 2016. Ms. Kullman has served on the Board of Trustees of Northwestern University since 2016 and on the Board of Overseers of Tufts University School of Engineering since 2006. She served as Chair of theUS-China Business Council from 2013 to 2015. In 2016, Ms. Kullman joined the Temasek Americas Advisory Panel of Temasek Holdings (Private) Limited, a privately-held investment company based in Singapore. Ms. Kullman received a bachelor of science in mechanical engineering degree from Tufts University and a master’s degree from the Kellogg School of Management at Northwestern University. |

Qualifications
The Board concluded that Ms. Kullman should serve on the Board based on her lengthy global experience as a public company chief executive officer and board chair, her management and leadership skills, and her experience with scientific operations, all of which provide valuable insight into the operations of our Company. Given her leadership and financial experience, Ms. Kullman has been determined to be an Audit Committee financial expert by our Board.
12 ï 2019 Proxy Statement
Table of Contents
|
Item 1 — Election of Directors
|
|
Ronald D. Sugar
Director since:2010
Age:70
Committees: • Corporate Responsibility and Compliance (Chair) • Executive • Governance and Nominating
Other Public Company Boards: • Air Lease Corporation • Apple Inc. • Chevron Corporation
|
Ronald D. Sugar is the retired Chairman of the Board and Chief Executive Officer of Northrop Grumman Corporation, a global aerospace and defense company, having held these posts from 2003 through 2009.
Dr. Sugar has been a director of Chevron Corporation, a petroleum, exploration, production and refining company, since 2005, serving as the lead director and on the Management Compensation Committee and chairing the Board Nominating and Governance Committee. Dr. Sugar has been a director of Apple Inc., a manufacturer and seller of, among other things, personal computers, mobile communication and media devices, since 2010, chairing the Audit and Finance Committee. Dr. Sugar has been a director of Air Lease Corporation, an aircraft leasing company, since 2010, chairing the Compensation Committee and serving on the Nominating and Corporate Governance Committee. Since 2010, he has been a senior advisor to Ares Management LLC, a privately-held asset manager and registered investment advisor. In 2014, Dr. Sugar joined the Temasek Americas Advisory Panel of Temasek Holdings (Private) Limited, a privately-held investment company based in Singapore. Dr. Sugar is a member of the National Academy of Engineering, trustee of the University of Southern California, member of the UCLA Anderson School of Management Board of Visitors, and director of the Los Angeles Philharmonic Association.
Qualifications
The Board concluded that Dr. Sugar should serve on our Board because of Dr. Sugar’s board and senior executive-level expertise, including his experience as chief executive officer and board chair of a large, highly regulated, public company and his insight in the areas of operations, government affairs, science, technology and finance. |

R. Sanders Williams
Director since:2014
Age:70
Committees: • Corporate Responsibility and Compliance • Governance and Nominating
Other Public Company Boards: • Laboratory Corporation of America Holdings
|
R. Sanders Williams is the President Emeritus of Gladstone Institutes, anon-profit biomedical research enterprise, having served in this position since 2018, and was the Chief Executive Officer of Gladstone Foundation, anot-for-profit organization supporting the Gladstone Institutes during 2018. Dr. Williams has been a Professor of Medicine at the University of California, San Francisco since 2010, and Professor of Medicine at Duke University since 2018. Dr. Williams was both President of Gladstone Institutes and its Robert W. and Linda L. Mahley Distinguished Professor of Medicine, from 2010 to 2017. Prior to this, Dr. Williams served as Senior Vice Chancellor of the Duke University School of Medicine from 2008 to 2010 and Dean of the Duke University School of Medicine from 2001 to 2008. He was the founding Dean of theDuke-NUS Graduate Medical School, Singapore, from 2003 to 2008 and served on its Governing Board from 2003 to 2010. From 1990 to 2001, Dr. Williams was Chief of Cardiology and Director of the Ryburn Center for Molecular Cardiology at the University of Texas, Southwestern Medical Center.
Dr. Williams has been a director of the Laboratory Corporation of America Holdings, a diagnostic technologies company, since 2007, serving on the Audit Committee and chairing the Quality and Compliance Committee. Dr. Williams was a director of Bristol-Myers Squibb Company, a pharmaceutical company, from 2006 until 2013. Dr. Williams has served on the board of directors of the Gladstone Foundation, anon-profit institution that is distinct from Gladstone Institutes, since 2012 and on the board of directors of Exploratorium, anon-profit science museum and learning center located in San Francisco, from 2011 to 2018. Dr. Williams was elected to the National Academy of Medicine in 2002. Dr. Williams received his undergraduate degree from Princeton University and his doctorate from Duke University. |

Qualifications
The Board concluded that Dr. Williams should serve on the Board because of his broad medical and scientific background, including his leadership roles in domestic and academic science settings, his deep experience in cardiology, oversight of governance of multi-hospital healthcare provider systems, leadership and development of international medical programs in Asia, and prior industry board experience.
THE BOARD OF DIRECTORS RECOMMENDS A VOTE “FOR” EACH OF THE ABOVE 12 NAMED NOMINEES.
ï 2019 Proxy Statement 13
Table of Contents
|
Corporate Governance
|
|
Board of Directors Corporate Governance Highlights
Our Board of Directors, or Board, is governed by our Amgen Board of Directors Corporate Governance Principles which are amended from time to time to incorporate certain current best practices in corporate governance. Our Corporate Governance Principles may be found on our website atwww.amgen.com and are available in print upon written request to the Company’s Secretary at our principal executive offices at One Amgen Center Drive, Thousand Oaks, California 91320-1799. The Board’s corporate governance practices and stockholder rights include the following:
Board Governance Practices
| • | Lead Independent Director. The independent members of the Board elect a lead independent director on an annual basis. The lead independent director has robust responsibilities and authorities as discussed below. Robert A. Eckert currently serves as our lead independent director. |
| • | Regular Executive Sessions of Independent Directors.Our independent directors meet privately on a regular basis. Our lead independent director presides at such meetings. |
| • | Majority Approval Required for Director Elections. If an incumbent director up forre-election at a meeting of stockholders fails to receive a majority of the votes cast in favor for his or her election in an uncontested election, the Board will adhere to the director resignation policy as provided in our Amended and Restated Bylaws of Amgen Inc., or Bylaws. |
| • | Board Access to Management. We afford our directors ready access to our management. Key members of management attend Board and committee meetings to present information concerning various aspects of the Company, its operations, and results. The Corporate Responsibility and Compliance Committee, or Compliance Committee, members also have regular meetings in executive session with our Chief Compliance Officer, and the Audit Committee members have regular meetings in executive session with our internal and external auditors and separate meetings in executive session with our head of Corporate Audit. |
| • | Board Authority to Retain Outside Advisors. Our Board committees have the authority to retain outside advisors. The Audit Committee has the sole authority to appoint, compensate, retain, and oversee the independent registered public accountants. The Compensation and Management Development Committee, or Compensation Committee, has the sole authority to appoint, compensate, retain, and oversee compensation advisors for senior management compensation review. The Governance and Nominating Committee, or Governance Committee, has the sole authority to appoint, retain, and replace search firms to identify director candidates and compensation advisors for our directors’ compensation review. |
| • | Director Limitation on Number of Boards. A director who is currently serving as our Chief Executive Officer, or CEO, should not serve on more than two outside public company boards. No director should serve on more than five outside public company boards. |
| • | Board Refreshment and Tenure. Our average Board tenure is approximately 5 years for our director nominees. |
| • | Director Retirement Age. After review of public company data and extensive discussion, in 2018, the Governance Committee recommended, and the Board approved, raising the retirement age of directors from 72 to 75. A director is expected to retire from the Board on the day of the annual meeting of stockholders following his or her 75th birthday. |
| • | Director Changes in Circumstances Evaluated. If a director has a substantial change in principal business or professional affiliation or responsibility, including a change in principal occupation, he or she shall offer his or her resignation to the chairman of the Governance Committee. The Governance Committee determines whether to accept the resignation based on what it believes to be in the best interests of the Company and our stockholders. |
| • | Director Outside Relationships RequirePre-Approval. Without the prior approval of disinterested members of the Board, directors should not enter into any transaction or relationship with the Company in which they will have a financial or a personal interest or any transaction that otherwise involves a conflict of interest. |
| • | Director Conflicts of Interest. If an actual or potential conflict of interest arises for a director or a situation arises giving the appearance of an actual or potential conflict, the director must promptly inform the Chairman of the Board or the chairman of the Governance Committee. All directors are expected to recuse themselves from any discussion or decision found to affect their personal, business, or professional interests. |
| • | Regular Board and Committee Evaluations. The Board and the Audit, Compensation, Compliance, and Governance Committees each have an annual evaluation process. We provide more information regarding the Board and committee evaluations on pages 20 and 21. |
| • | Solicitation of Stockholder Perspectives. The Board believes that engagement with stockholders is the source of valuable information and perspectives on the Company. The Board has requested that management solicit input from investors on behalf of the Board and the lead independent director may also meet directly with stockholders when appropriate. We provide more information regarding the stockholder engagement program on page 41. |
| • | Management Succession Oversight. Our Board oversees CEO and senior management succession planning. Directors engage with potential CEO and senior management successors at Board and |
14 ï 2019 Proxy Statement
Table of Contents
|
Corporate Governance
|
|
committee meetings. Our Board also establishes steps to address succession to respond to unexpected vacancies in the event of an emergency. |
Stockholder Rights
| • | Proxy Access. Our Bylaws permit proxy access for director nominations. Eligible stockholders with an ownership threshold of 3% who have held their shares for at least 3 years and who otherwise meet the requirements set forth in our Bylaws may have their nominees up to the number of directors constituting the greater of 20% of the total number of directors or two nominees of our Board included in our proxy materials. Up to 20 eligible stockholders may group together to reach the 3% ownership threshold. In the course of designing our proxy access provisions, we carefully considered each element in the interest of our stockholders as a whole, including that the number of stockholders who may group together (20) would afford those stockholders likely to utilize proxy access with the opportunity to do so. |
| • | Written Consent. Our Amgen Inc. Restated Certificate of Incorporation permits stockholders to act by written consent in lieu of a meeting upon the request of the holders of at least 15% of our outstanding common shares who otherwise meet the requirements of our Certificate of Incorporation. |
| • | Special Meetings. Our Bylaws permit stockholders to request that the Company call a special meeting upon the written request of the holders of at least 15% of our outstanding common shares who otherwise meet the requirements set forth in our Bylaws. |
| • | NoSupermajorityVoteProvisionsinCertificateofIncorporationor Bylaws. We have a simple majority voting standard to amend our Certificate of Incorporation and Bylaws. |
| • | No Poison Pill. We do not have a shareholder rights plan, or poison pill. |
Our current leadership structure and governing documents permit the roles of Chairman and CEO to be filled by the same or different individuals. The Board has currently determined that it is in the best interests of the Company and our stockholders to have Robert A. Bradway, our CEO and President, serve as Chairman, coupled with an active lead independent director. As such, Mr. Bradway holds the position of Chairman, CEO and President, and Mr. Eckert has served as the lead independent director since the May 2016 annual meeting of stockholders, or 2016 Annual Meeting.
Corporate Governance Structure. The Board believes our corporate governance structure, with its strong emphasis on Board independence, an active lead independent director, and strong Board and committee involvement, provides sound and robust oversight of management.
Lead Independent Director. The lead independent director is elected by the independent members of the Board on an annual basis. Mr. Eckert has been elected annually as the lead independent director since the 2016 Annual Meeting and wasre-elected by our Board on March 7, 2019 to continue to serve as lead independent director subject to hisre-election to the Board by our stockholders at the 2019 Annual Meeting.
The lead independent director is an additional conduit for regular communication between the independent directors and Mr. Bradway, keeping Mr. Bradway apprised of any concerns, issues, or determinations made during the independent sessions, and consults with Mr. Bradway on other matters pertinent to the Company and the Board. The lead independent director’s additional responsibilities include:
| • | Presiding at meetings of the Board at which the Chairman is not present, including executive sessions of the independent directors; |
| • | Serving as a liaison between the Chairman and the independent directors; |
| • | Previewing the information to be provided to the Board; |
| • | Approving meeting agendas for the Board; |
| • | Assuring that there is sufficient time for discussion of all meeting agenda items; |
| • | Organizing and leading the Board’s evaluation of the CEO; |
| • | Being responsible for leading the Board’s annual self-assessment; |
| • | Having the authority to call meetings of the independent directors; and |
| • | If requested by major stockholders, ensuring that he/she is available for consultation and direct communication. |
Key Committees Composed of Independent Directors. The Audit, Compensation, Compliance, and Governance Committees are each composed solely of independent directors and provide independent oversight of management. In addition, the Audit, Compensation, and Compliance Committees meet in executive session on a regular basis with no members of management present (unless otherwise requested by the committee). Each of our committees effectively manages its Board-delegated duties and communicates regularly with the Chairman and members of management. In addition, the Compensation Committee has an effective process for monitoring and evaluating Mr. Bradway’s compensation and performance. Each committee chair provides a report on committee meetings held to the full Board at each regular meeting of the Board.
Independent Directors Sessions. On a regular basis, the independent directors meet in an executive session without Mr. Bradway to review Company performance, management effectiveness, proposed programs
ï 2019 Proxy Statement 15
Table of Contents
|
Corporate Governance
|
|
and transactions and the Board meeting agenda items. These independent sessions are organized and chaired by our lead independent director.
Annual Assessment. As part of the Board’s annual evaluation process, the Board reviews its leadership structure and whether combining or separating the roles of Chairman and CEO is in the best interests of the Company and our stockholders.
Benefits of Combined Leadership Structure. The Board believes that the Company and our stockholders have been best served by having Mr. Bradway in the role of Chairman and CEO for the following reasons:
| • | Mr. Bradway is most familiar with our business and the unique challenges we face. Mr. Bradway’sday-to-day insight into our challenges facilitates a timely deliberation by the Board of important matters. |
| • | Mr. Bradway has and will continue to identify agenda items and lead effective discussions on the important matters affecting us. Mr. Bradway’s knowledge and extensive experience regarding our operations and the highly-regulated industries and markets in which we compete position him to identify and prioritize matters for Board review and deliberation. |
| • | As Chairman and CEO, Mr. Bradway serves as an important bridge between the Board and management and provides critical leadership for carrying out our strategic initiatives and confronting our challenges. The Board believes that Mr. Bradway brings a |
unique, stockholder-focused insight to assist the Company to most effectively execute its strategy and business plans to maximize stockholder value. |
| • | The strength and effectiveness of the communications between Mr. Bradway as our Chairman and Mr. Eckert as our lead independent director result in effective Board oversight of the issues, plans, and prospects of our Company. |
| • | This leadership structure provides the Board with more complete and timely information about the Company, a unified structure and consistent leadership direction internally and externally and provides a collaborative and collegial environment for Board decision making. |
Flexibility of the Leadership Structure. The Board is committed to high standards of corporate governance. The Board values its flexibility to select, from time to time, a leadership structure that is most able to serve the Company’s and stockholders’ best interests based on the qualifications of individuals available and circumstances existing at the time. As such, the Board regularly evaluates whether combining or separating the roles of Chairman and CEO is in the best interests of the Company and our stockholders. The Board believes that a policy limiting its flexibility to choose a leadership structure that will enable the Company to most effectively execute its strategy and business plans to maximize stockholder value would be detrimental to the Company and our stockholders.
The Board’s Role in Risk Oversight
Our Board oversees an enterprise-wide approach to risk management, which is designed to support the achievement of the Company’s objectives, including strategic priorities to improve long-term financial and operational performance and enhance stockholder value. Our Board believes that a fundamental part of risk management is understanding the risks that we face, monitoring these risks, and adopting appropriate control and mitigation of these risks. We believe that the risk management areas that are fundamental to the success of our annual and strategic plans include the areas of product development and safety, supply and quality, value and access, sales and promotion, business development, as well as protecting our assets (financial, intellectual
property, and information (including cybersecurity)), all of which are managed by senior executive management reporting directly to our CEO.
We have implemented an Enterprise Risk Management, or ERM, program, which is a Company-wide effort to identify, assess, manage, report, and monitor enterprise risks that may affect our ability to achieve the Company’s objectives. The ERM program involves our Board and management and is overseen by one of our senior executive officers. Enterprise risks are identified and managed by management and the business functions and, as discussed below, are overseen by the Board or the appropriate Board committee.
16 ï 2019 Proxy Statement
Table of Contents
|
Corporate Governance
|
|
The Board has the ultimate oversight responsibility for the risk management process. The Board discusses enterprise risks with our senior management on a regular basis, including as a part of its annual strategic planning process, annual budget review and approval, capital plan review and approval, and through reviews of compliance issues in the applicable committees of our Board, as appropriate. At each regular meeting, or more frequently as needed, the Board receives and considers reports from each of the committees set forth below, which reports may provide additional detail on risk management issues and management’s response. Important categories of risk are assigned to appropriate Board committees that report back to the full Board:
Committee
|
Primary Risk Oversight Responsibility
| |||
Governance and Nominating | • ��Oversees the assessment of each member of the Board’s independence, as well as the effectiveness of our Corporate Governance Principles and Board of Directors’ Code of Conduct. Also oversees Board and committee evaluations and Board succession.
| |||
Audit | • Oversees financial risk, such as capital risk, tax risk, financial compliance risk and internal controls over financial reporting, and oversees internal audit and independent registered public accountants.
| |||
Compensation and Management Development | • Evaluates whether the right management talent is in place and oversees succession planning. Also oversees our compensation policies and practices and incentive program administration and design, including whether such policies, practices, and incentive programs balance risk-taking and rewards in an appropriate manner as discussed further below, align with stockholders’ interests, and are consistent with emerging best practices.
| |||
Corporate Responsibility and Compliance | • Overseesnon-financial compliance risk, such as regulatory risks associated with the requirements of the Federal health care program, Food and Drug Administration, and risks associated with pricing and access, information security, including cybersecurity, and our reputation. Also oversees staff member compliance with the Code of Conduct.
| |||
Oversight of Cybersecurity—Key Priority.The Compliance Committee receives regular updates on projects to strengthen our cybersecurity, major risk areas, and the Company’s approach to address such risks, and the emerging threat landscape. We have safeguards in place to help protect against unauthorized access to, use or disclosure of our information and data, and dedicated executives whose teams advise on risks and assess the effectiveness of our controls.
Oversight of Pricing—Key Priority. The Compliance Committee receives regular updates on pricing and access. We are committed to producing safe and effective therapies that can be appropriately accessed by the patients who need them most, including by:
| • | investing billions of dollars annually in research and development; |
| • | developing more affordable therapeutic choices in the form of high-quality and reliably-supplied biosimilars; |
| • | partnering with payers to share risk and accountability for health outcomes; |
| • | providing patient support and education programs and helping patients in financial need access our medicines; and |
| • | working with policy makers, patients, and other stakeholders to establish a sustainable healthcare system with access to affordable care and where patients and their healthcare professionals are the primary decision makers. |
ï 2019 Proxy Statement 17
Table of Contents
|
Corporate Governance
|
|
Codes of Ethics and Business Conduct
Our Board has adopted two codes of business conduct and ethics, one that applies to our Board and a second that applies to all our staff and others conducting business on our behalf, including our executive officers and Board. Annual training on the global code of conduct is required and our Board participates in such training. We also have a code of ethics for senior financial officers. To view our codes of
business conduct and ethics, please visit our website atwww.amgen.com. We intend to disclose any future amendments to certain provisions of our codes of business conduct and ethics, or waivers of such provisions, applicable to our directors and executive officers on our website. There were no waivers of any of our codes of business conduct or code of ethics in 2018.
The Board held 11 meetings in 2018 and all of the directors attended at least 75% of the total number of meetings of the Board and committees on which they served. Brian J. Druker was appointed to the Board effective at our 2018 annual meeting of stockholders, or 2018 Annual Meeting, and attended all meetings of the Board and committees on
which he served after the date of his appointment. It is the Company’s policy that all current directors attend our annual meetings of stockholders barring unforeseen circumstances or irresolvable conflicts. Each of our directors were present at our 2018 Annual Meeting.
Our annual meeting of stockholders provides an opportunity each year for stockholders to ask questions of, or otherwise communicate directly with, members of the Board on appropriate matters. In addition, stockholders may communicate in writing with any particular director, any committee of the Board, or the directors as a group, by sending such written communication to our Secretary at our principal executive offices at One Amgen Center Drive, Thousand Oaks, California 91320-1799. Copies of written communications received at such address will be provided to the Board or the relevant director unless such communications are considered, in the reasonable judgment of our Secretary, to be inappropriate for submission to the intended recipient(s). Examples of stockholder communications that would be considered inappropriate for submission to the Board include, without
limitation, customer complaints, solicitations, communications that do not relate directly or indirectly to our business, or communications that relate to improper or irrelevant topics. The Secretary or his designee may analyze and prepare a response to the information contained in communications received and may deliver a copy of the communication to other Company staff members or agents who are responsible for analyzing or responding to complaints or requests. Communications concerning potential director nominees submitted by any of our stockholders will be forwarded to the chairman of the Governance Committee. For information on our engagement with our stockholders since the 2018 Annual Meeting, please see page 41 of our Compensation Discussion and Analysis.
The Board has four key standing committees: Governance Committee; Audit Committee; Compliance Committee; and Compensation Committee. The Compensation Committee has delegated certain responsibilities to an Equity Award Committee. In addition, an Executive Committee of the Board has all of the powers and authority of the Board in the management of our business and affairs, except with respect to certain enumerated matters, including Board composition and compensation, changes to our Certificate of Incorporation, or any other matter expressly prohibited by law or our Certificate of
Incorporation. The Executive Committee did not meet in 2018. The Board maintains charters for each of these standing committees. In addition, the Board has adopted a written set of Corporate Governance Principles and a Board of Directors’ Code of Conduct that generally formalize practices we have in place. To view the charters of our standing Board committees, our Corporate Governance Principles, and the Board of Directors’ code of conduct, please visit our website atwww.amgen.com.
18 ï 2019 Proxy Statement
Table of Contents
|
Corporate Governance
|
|
Process for Selecting Directors, Director Qualifications, and Board Diversity
Our Governance Committee is responsible for determining Board membership qualifications and for selecting, evaluating, and recommending to the Board nominees for annual election to the Board and to fill vacancies as they arise. The Governance Committee reviews regularly and reports to the Board on the composition and size of the Board, and makes recommendations, as necessary, so that the Board reflects the appropriate balance of knowledge, experience, skills, expertise, and diversity advisable for the Board as a whole and contains at least the minimum number of independent directors required by applicable laws and regulations.
The Governance Committee maintains guidelines for selecting nominees to serve on the Board and for considering stockholder recommendations for nominees. The Amgen Inc. Board of Directors Guidelines for Director Qualifications and Evaluations are included in
this proxy statement asAppendix A. Among other things, Board members should possess demonstrated breadth and depth of management and leadership experience, financial and/or business acumen or relevant industry or scientific experience, integrity and high ethical standards, sufficient time to devote to the Company’s business, the ability to oversee, as a director, the Company’s business and affairs for the benefit of our stockholders, the ability to comply with the Amgen Board of Directors Code of Conduct, and a demonstrated ability to think independently and work collaboratively. In addition, although the Governance Committee does not maintain a diversity policy, the Governance Committee considers diversity in its determinations. Diversity includes race, ethnicity, age, and gender and is also broadly construed to take into consideration many other factors, including industry knowledge, operational experience, and scientific and academic expertise, geography, and personal backgrounds.
ï 2019 Proxy Statement 19
Table of Contents
|
Corporate Governance
|
|
Continuous Board Refreshment
The Board, led by the Governance Committee, has an ongoing process for identifying, evaluating and selecting directors.
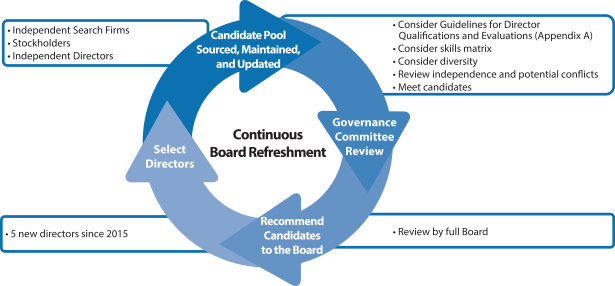
Independent Search Firms Stockholders Independent Directors Candidate Pool Sourced, Maintained, and Updated Consider Guidelines for Director Qualifications and Evaluations (Appendix A) Consider skills matrix Consider diversity Review independence and potential conflicts Meet candidates Select Directors 5 new directors since 2015 Recommend Candidates to the Board Review by full Board
Regular Board and Committee Evaluations
Our Governance Committee leads an annual evaluation process of the Board and its committees. The Board and the Audit, Compensation, Compliance, and Governance Committees each complete an annual assessment focusing on their roles, effectiveness, and fulfillment of fiduciary duties.
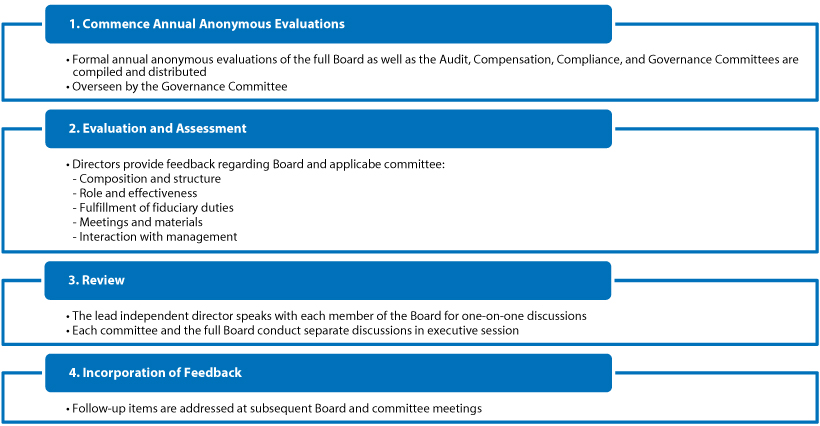
1. Commence Annual Anonymous Evaluations Formal annual anonymous evaluations of the full Board as well as the Audit, Compensation, and Governance Committees are compiled and distributed Overseen by the Governance Committee 2. Evaluation and Assessment Directors provide feedback regarding Board and applicable committee: Composition and structure Role and effectiveness Fulfillment of fiduciary duties Meetings and materials Interaction with management 3. Review The lead independent director speaks with each member of the Board for one-on-one discussions Each committee and the full Board conduct separate discussions in executive session 4. Incorporation of Feedback Follow-up items are addressed at subsequent Board and committee meetings
20 ï 2019 Proxy Statement
Table of Contents
|
Corporate Governance
|
|
The Audit, Compensation, Compliance, and Governance Committees each completed their assessments in October 2018 for further evaluation by the Governance Committee in December 2018. The Board completed its evaluation in December 2018. Each committee and the
Board was satisfied with its performance and each was considered to be operating effectively, with appropriate balance among governance, oversight, strategic, and operational matters.
At least annually, the Governance Committee reviews the independence of eachnon-employee director and makes recommendations to the Board and the Board affirmatively determines whether each director qualifies as independent. Each director must keep the Governance Committee fully and promptly informed as to any development that may affect the director’s independence.
The Board has determined that each of ournon-employee directors is and David Baltimore and François de Carbonnel, who served as directors during part of 2018, were independent during 2018 under The NASDAQ Stock Marketing listing standards and the requirements of the SEC. Mr. Bradway is not independent based on his service as our CEO and President. Mr. Bradway is the only director who also serves us in a management capacity. In making its independence determinations, the Board reviewed direct and indirect transactions and relationships between each director, or any member of his or her immediate family, and us or one of our subsidiaries or affiliates based on information provided by the director, our records, and publicly available information.
All of the reviewed transactions and arrangements were entered into in the ordinary course of business and none of the business transactions, donations, or grants involved an amount that (i) exceeded the greater of 5% of the recipient entity’s revenues or $200,000 with respect to transactions where a director or any member of his or her immediate family or spouse served in any capacity, or (ii) exceeded $10,000 with respect to professional or consulting services provided by entities at which directors serve as professors or employees.
The following types and categories of transactions, relationships, and arrangements were considered by our Board in making its independence determinations:
| • | Each of the independent directors (or their immediate family members) currently serves or has previously served within the last three years as a professor, trustee, director, or member of a board, |
advisory board, council, or committee for one or more colleges, universities, ornon-profit charitable organizations, including research or scientific institutions, to which The Amgen Foundation, Inc. has made matching donations under our Amgen matching gift program that is available to all of our employees and directors, or has made grants. |
| • | Each of the independent directors (or their immediate family members) currently serves or has previously served within the last three years as a member of the board of directors or the board of trustees or an advisory board for an entity with which Amgen has business transactions or to which Amgen makes donations or grants. The business transactions include, among other things, purchasing supplies, equipment and software licenses, payment of fees and expenses relating to repair and maintenance, transportation, utilities, clinical trials, research and development and training, sponsorship of healthcare programs and conferences, financial management, investment advisory and consulting services, and reimbursement of business-related expenses incurred by our staff members (such as for transportation and food purchases). |
| • | Drs. Austin, Baltimore, Druker, Henderson, Jacks, and Williams currently serve as professors for universities to which Amgen has made payments for certain business transactions such as symposiums, conferences and exhibits, postdoctoral research programs, clinical trials, training and research and development, software licenses and maintenance, as well as for grants. |
None of the directors directly or indirectly provides any professional or consulting services to us and none of the directors currently has or has had any direct or indirect material interest in any of the above transactions and arrangements. The Board determined that these transactions and arrangements did not warrant a determination that the director was not independent.
ï 2019 Proxy Statement 21
Table of Contents
|
Corporate Governance
|
|
Governance Committee Processes and Procedures for Considering and Determining Director Compensation
The Governance Committee has the authority to evaluate and make recommendations to our Board regarding director compensation.
| • | The Governance Committee conducts this evaluation periodically by reviewing our director compensation practices against the practices of an appropriate peer group and the Governance Committee may determine to make recommendations to our Board regarding possible changes to director compensation. The Governance Committee conducted such an assessment in 2017 and no changes were made to director compensation. |
| • | The Governance Committee has the authority to retain consultants to advise on director compensation matters. During 2017, the |
Governance Committee engaged Frederic W. Cook and Co., or FW Cook, to provide advice regarding director compensation. FW Cook reported directly to the Governance Committee and attended the Governance Committee meeting to evaluate director compensation. No executive officer has any role in determining or recommending the form or amount of director compensation. |
| • | The Governance Committee has authority to delegate any of these functions to a subcommittee of its members. No delegation of this authority was made in 2018. |
Current Members: Charles M. Holley, Jr.* (Chair) Wanda M. Austin Brian J. Druker (since May 2018) Fred Hassan* Rebecca M. Henderson Frank C. Herringer* Tyler Jacks Ellen J. Kullman*
*Audit Committee financial expert
Others Who Served in 2018: François de Carbonnel (until retirement at 2018 Annual Meeting)
Number of Meetings Held in 2018:10
Each member has been determined by the Board to be independent under The NASDAQ Stock Market listing standards and the requirements of the SEC, including the requirements regarding financial literacy and sophistication.
|
Description and Key Responsibilities:
• Oversees our accounting and financial reporting process and the audits of the financial statements, as required by NASDAQ.
• Assists the Board in fulfilling its fiduciary responsibilities with respect to the oversight of our financial accounting and reporting, the underlying internal controls and procedures over financial reporting, and the audits of the financial statements.
• Has sole authority for the appointment, compensation, retention, and oversight of the work of the independent registered public accountants.
• Reviews and discusses, prior to filing or issuance, with management and the independent registered public accountants (when appropriate) our audited consolidated financial statements to be included in our Annual Report on Form10-K and earnings press releases.
• Approves all related party transactions, as required by NASDAQ.
| |||||||
Oversight of the Independent Registered Public Accountants The Audit Committee: • Auditor Selection. Evaluates the qualifications and performance of our independent registered public accountants each year and determines whether to re-engage the current independent registered public accountants. • Audit Partner Selection. Directly involved in the selection of the lead engagement partner through an interview process. • Audit Firm Evaluation. Considers the quality and efficiency of the services provided, the independent registered public accountants’ technical expertise and knowledge of our operations and industry. • Audit Services. Pre-approves services.
| ||||||||
22 ï 2019 Proxy Statement
Table of Contents
|
Corporate Governance
|
|
Amgen’s Compliance Program is designed to promote ethical business conduct and ensure compliance with applicable laws and regulations. The key objectives of our compliance program operations include:
| • | developing policies and procedures; |
| • | providing ongoing compliance training and education; |
| • | auditing and monitoring of compliance risks; |
| • | maintaining and promoting avenues for staff to raise concerns, including anonymously through a business conduct hotline; |
| • | conducting investigations; |
| • | responding appropriately to any compliance violations; and |
| • | taking appropriate steps to detect and prevent recurrence. |
Our Chief Compliance Officer, who reports to the CEO, oversees the ongoing operations of the compliance program.
ï 2019 Proxy Statement 23
Table of Contents
|
Corporate Governance
|
|
Our Environmental Sustainability and Social Responsibility Efforts
Environmental Sustainability
We have demonstrated our commitment to environmentally responsible operations by reducing our impact on the environment in multiple areas of our global business.
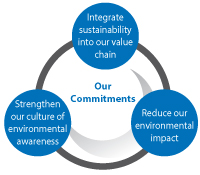
Progress Toward Targets. Our 2020 sustainability targets are set in areas where we can make the most progress in reducing our environmental impact and business costs, including targets for reductions in fleet and facilities carbon, waste, and water use.
Reducing Carbon Through Energy Conservation. Our carbon reduction strategy focuses on eliminating energy use, increasing energy efficiency, and increasing the proportion of energy used from renewable and alternative sources.
Innovation in Operations. Our next-generation biomanufacturing facility in Singapore dramatically reduces the scale and costs of making biologics, vastly reduces water and energy use, while maintaining a reliable, high-quality, compliant supply of medicines. We broke ground on a next-generation biomanufacturing plant in the U.S. in 2018.
United Nations Global Compact.We are a signatory to the United Nations Global Compact, a voluntary initiative based on commitments to implement universal sustainability principles and take steps to support United Nations goals.
Accolades and Where to Find Further Information.In 2018, we earned placement on the Dow Jones Sustainability World Index for the fifth year in a row and on the North America Index for the sixth year in a row. Our Responsibility Highlights Report is available online atwww.amgen.com/responsibility.
Social Responsibility
Improving Patient Access to Medicines. Amgen is committed to assisting patients with no or limited drug coverage to access the medicines they need. We provide patient support and education programs and help patients in financial need access our medicines. Amgen Safety Net Foundation supports qualifying patients in the U.S. who might go without important medicines because of financial barriers, by providing our medicines at no cost. In 2018, Direct Relief, a leadingnon-governmental organization, distributed Amgen-donated medicines in a number of developing countries for patients in need.
We also partner with payers to share risk and accountability for health outcomes, and help patients access the medicines they need without significant financial burden. We have been at the forefront of developing innovative contracting and partnerships designed to improve population health and patient access, as well as outcomes-based and risk-sharing approaches that directly link the price of our medicines to their effectiveness.
Science Education.Through The Amgen Foundation, Inc., established in 1991, we seek to advance excellence in science education to inspire the next generation of innovators, and invest in strengthening communities where our staff members live and work. Since inception, the Amgen Foundation has contributed more than $300 million tonon-profit organizations across the world that reflect our core values and complement Amgen’s dedication to impacting lives in inspiring and innovative ways. Moreover, through what is now a sixteen-year, $74 million commitment from the Amgen Foundation, the Amgen Scholars Program makes it possible for young scientists across the globe to engage in cutting-edge research experiences and learn more about biotechnology and drug discovery. Additionally, the Amgen Foundation supports the Amgen Biotech Experience, an innovative science education program that empowers high school teachers to bring biotechnology into their classrooms.
Our Community.We have provided support following devastating disasters, including immediate relief for victims of Hurricanes Florence and Michael and devastating wildfires in Southern California, as well as a mass shooting in the community of Thousand Oaks, California, the location of our Company headquarters. We also continue to provide support for reconstruction efforts in Puerto Rico following Hurricane Maria.
24 ï 2019 Proxy Statement
Table of Contents
|
Corporate Governance
|
|
Compensation Committee Processes and Procedures for Considering and Determining Executive Compensation in 2018
Compensation Committee Determination of Compensation.By the first calendar quarter of each year, the Compensation Committee reviews and approves Company performance goals and objectives for the current year and evaluates the CEO’s performance for the previous year in light of the Company performance goals and objectives established for the prior year. The Compensation Committee evaluates the performance of the CEO within the context of the financial and operational performance of the Company, considers competitive market data, and establishes the CEO’s compensation based on this evaluation.
Values and Components.The values of each component of total compensation (base salary, target annual cash incentive awards, and equity awards) for the current year, as well as total annual compensation for the prior year (including the value of equity holdings, potential change of control payments, and vested benefits under our Retirement and Savings Plan, Supplemental Retirement Plan, and Nonqualified Deferred Compensation Plan as of the end of the last fiscal year) are considered at this time. Final determinations regarding our CEO’s performance and compensation are made during an executive session of the Compensation Committee and are reported to and reviewed by the Board in an independent directors’ session.
Executive Officers. Our Compensation Committee determines compensation for the executive officers (other than the CEO) based, in part, on the recommendations of our CEO regarding base salary, annual cash incentive awards, and equity awards. In determining his compensation recommendations for each NEO, our CEO reviews comparative peer group data. The Compensation Committee has typically followed these recommendations.
Executive Sessions.The Compensation Committee generally holds executive sessions (with no members of management present, unless requested by the Compensation Committee) at its regular meetings.
Delegation of Authority. The Compensation Committee has authority to delegate any of its functions to a subcommittee of its members. No delegation of this authority was made in 2018.
Independent Compensation Consultant. The Compensation Committee continued to engage FW Cook, an independent compensation consultant, to provide advice regarding executive compensation and executive compensation trends and developments, compensation designs, and equity compensation practices, market data as requested, and opinions on the appropriateness and competitiveness
ï 2019 Proxy Statement 25
Table of Contents
|
Corporate Governance
|
|
of our executive compensation programs relative to market practice. FW Cook reported directly to the Compensation Committee and attended regularly scheduled meetings of the Compensation Committee (including meeting in executive session with the Compensation Committee, as requested). Each year the Compensation Committee reviews the independence of FW Cook and whether any conflicts of interest exist. After review and consultation with FW Cook, the Compensation Committee has determined that FW Cook is independent and there is no conflict of interest resulting from retaining FW Cook currently or during the year ended December 31, 2018. In performing its analysis, the Compensation Committee considers the factors set forth in the SEC rules and The NASDAQ Stock Market listing standards.
Peer Group Review. In setting executive compensation, the Compensation Committee compares the Company’s pay levels and programs to those of the Company’s competitors for executive talent
and uses this comparative data as a guide in its review and determination of compensation. Our Compensation Committee considers and selects an appropriate peer group (consisting of biotechnology and pharmaceutical companies), based, in part, on the recommendations of FW Cook, and, for each Named Executive Officer, or NEO, the Compensation Committee reviews the compensation levels and practices of our peer group, which for our NEOs, other than the CEO, are based on reports prepared by management from information contained in compensation surveys and proxy statements. FW Cook provides the Compensation Committee with market data, an annual report on the compensation levels and practices of our peer group, and recommendations for the CEO position.
Compensation Risk Management.In cooperation with management, FW Cook assesses the potential risks arising from our compensation policies and practices as discussed more fully below.
Annual Risk Management Assessment.On an annual basis, management, working with the Compensation Committee’s independent compensation consultant, conducts an assessment of the Company’s compensation policies and practices for all staff members generally, and for our staff members who participate in our sales incentive compensation program, for material risk to the Company.
Results of Risk Management Assessment.The results of this assessment are reviewed and discussed with the Compensation Committee. Based on this assessment, review and discussion, we believe that, through a combination of risk-mitigating features and incentives guided by relevant market practices and our Company performance goals, our compensation policies and practices do not present risks that are reasonably likely to have a material adverse effect on us.
Factors That Discourage Excessive Risk-Taking.In evaluating our compensation policies and practices, a number of factors were identified which the Company, the Compensation Committee, and its independent consultant believe discourage excessive risk-taking, including:
| • | Mix of Incentives.Our compensation programs consist of a mix of incentives that are tied to varying performance periods and are designed to balance our need to drive our current performance with the need to position the Company for longer-term success. |
| • | Company-wide Results.Company-wide results are the most important factor in determining the amount of an annual cash incentive award, one of our mix of incentives, for each of our staff members. |
| • | Emphasis on Long-Term Performance. We cap short-term incentives and make long-term incentive, or LTI, equity awards a component of compensation for nearly all of our full-time staff members. In particular, the CEO and the other executive officers participate in compensation plans that are designed so that the |
largest component of their compensation is in the form of LTI equity awards to ensure that a significant portion of their compensation is associated with long-term, rather than short-term, outcomes, which aligns these individuals’ interests with those of our stockholders. |
| • | Equity Award Grant Practices.We employ appropriate practices with respect to equity awards: we do not award mega-grants, discounted stock options, or immediately vested stock options to staff members; we have grant guidelines that generally limit the grant date for our equity grants to the third business day after our announcement of quarterly earnings. |
| • | Robust Stock Ownership and Retention Guidelines.We have robust stock ownership guidelines for vice presidents and above that require significant investment by these individuals in our Common Stock. We require that each officer who has not met his or her required ownership guidelines retain shares of our Common Stock acquired through the vesting of restricted stock units, the payout of performance units, and the exercise of stock options (net of shares retained by us to satisfy associated tax withholding requirements and exercise price amounts) until such officer has reached his or her required stock ownership level. |
| • | Comprehensive Performance Evaluations. Our Company values and leadership behaviors are an integral part of the performance assessments of our staff members and are particularly emphasized in our assessment tools at higher positions. These evaluations serve as an important information tool and basis for compensation decisions. |
| • | Discretion to Reduce Awards.The Compensation Committee retains full discretion to reduce or eliminate annual cash incentive awards to our executive officers and can and has modified awards downwards. |
| • | Recoupment Provisions.We have recoupment provisions that expressly allow the Compensation Committee or management, as |
26 ï 2019 Proxy Statement
Table of Contents
|
Corporate Governance
|
|
appropriate, to consider employee misconduct that caused serious financial or reputational damage to the Company when determining whether an employee has earned an annual cash incentive award or the amount of any such award. |
| • | Clawback Policy. We have a clawback policy that requires our Board to consider recapturing past cash or equity compensation payouts awarded to our executive officers if it is subsequently |
determined that the amounts of such compensation were determined based on financial results that are later restated and the executive officer’s misconduct caused or partially caused such restatement. |
| • | No Hedging or Pledging. Our Insider Trading Policy prohibits pledging or purchasing of our Common Stock on margin and hedging the economic risk of our Common Stock. |
Following is a reasonable estimate, prepared under applicable SEC rules, of the ratio of the annual total compensation of our CEO to the median of the annual total compensation of our other staff members, calculated in accordance with the requirements of Item 402(c)(2)(x) of RegulationS-K. The Company determined our median employee based on total direct compensation paid to all of our staff members worldwide (consisting of approximately 21,516 individuals) recorded in our global systems as of December 31, 2018. Total direct compensation included base salary (wages recorded in our payroll records as of December 31, 2018), annual cash incentive awards earned for the period (and target sales incentive awards for our sales force), and the annual grant value of LTI equity awards during 2018. Earnings of our staff members
outside of the U.S. were converted to U.S. dollars using the currency exchange rate as of December 31, 2018. Nocost-of-living adjustments were made. We then determined the annual total compensation of our median employee for 2018 which was $131,375. As disclosed in the “Summary Compensation Table” appearing on page 67, our CEO’s annual total compensation for 2018 was $18,555,266. Based on the foregoing, the ratio of the annual total compensation of our CEO to that of the median staff member was 141 to 1. For information on the determination of executive compensation, please see “Compensation Committee Processes and Procedures for Considering and Determining Executive Compensation in 2018” above and our Compensation Discussion and Analysis beginning on page 33.
The Compensation Committee has reviewed and discussed the Compensation Discussion and Analysis with management, and based on the review and discussions, recommended to the Board of Directors that the Compensation Discussion and Analysis be included in the
Company’s 2019 Annual Meeting proxy statement and incorporated by reference into the Company’s Annual Report on Form10-K for the year ended December 31, 2018.
Compensation Committee of the Board of Directors
Robert A. Eckert, Chairman
Greg C. Garland
Fred Hassan
Tyler Jacks
ï 2019 Proxy Statement 27
Table of Contents
|
Item 2 — Advisory Vote to Approve Our Executive Compensation
|
|
Advisory Vote to Approve Our Executive Compensation
This advisory stockholder vote, commonly known as “Say on Pay,” gives you, as a stockholder, the opportunity to endorse or not endorse our executive pay program and policies. Accordingly, you are being asked to vote on the compensation of our Named Executive Officers, or NEOs, as disclosed in the Compensation Discussion and Analysis (pages 33 through 66) and related compensation tables and the narrative in this proxy statement (pages 67 through 83).
Our executive compensation program is designed to achieve the following objectives:
| • | Pay for performance in a manner that strongly aligns with stockholder interests by rewarding both ourshort- and long-term measurable performance. |
| • | Drive our business strategy by positioning our staff to execute on our strategic priorities in the near- and longer-term. |
| • | Attract, motivate, and retain the highest level of executive talent by providing competitive compensation, consistent with their roles and responsibilities, our success, and their contributions to this success. |
| • | Mitigate compensation riskby maintaining pay practices that reward actions and outcomes consistent with the sound operation of our Company and with the creation of long-term stockholder value. |
| • | Consider all Amgen staff members in the design of our executive compensation programs, to ensure a consistent approach that encourages and rewards all staff members who contribute to our success. |
We Have Implemented Compensation Best Practices
What we do
|
| ✓ | A substantial majority of NEO compensation is performance-based andat-risk |
| ✓ | Recoupment in the case of misconduct causing serious financial or reputational damage |
| ✓ | Clawback policy tied to financial restatement |
| ✓ | Robust stock ownership and retention guidelines |
| ✓ | Minimum vesting periods for equity compensation |
| ✓ | Double-trigger for stock options and restricted stock units in the event of a change of control |
| ✓ | Long-term performance-based equity awards (80% of total target equity) |
| ✓ | Independent compensation consultant |
What we don’t do
|
| × | No hedging or pledging |
| × | Nore-pricing or backdating |
| × | No taxgross-ups (except in connection with relocation) |
| × | No excessive perks |
| × | No employment agreements |
| × | No dividends paid on unvested equity |
| × | No defined benefit pension or supplemental executive retirement plan (SERP) benefits |
28 ï 2019 Proxy Statement
Table of Contents
|
Item 2 — Advisory Vote to Approve Our Executive Compensation
|
|
2018 Executive Compensation Was Aligned With Our Strategy and Performance
As discussed more fully in our Compensation Discussion and Analysis starting on page 33, a significant majority of each NEO’s compensation isat-risk and dependent on our performance and execution of our strategic priorities.
| LTI Equity Award Allocation | 2018 Total Target Direct Compensation Mix | |
| 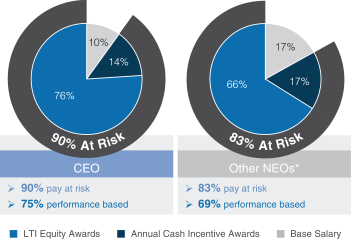 | |
2018 Performance AgainstPre-Established Goals and Measures
2018 Annual Cash Incentive Program
| 2016-2018 Long-Term Incentive Performance Program
| |||||||
Goal
| Weighting
|
% of Target Earned
| | |||||
Financial Performance
| ||||||||
Revenues
|
| 30%
|
| 224.7%
| ||||
Non-GAAP Net Income(1)
|
| 30%
|
| 186.5%
| ||||
Progress Innovative Pipeline
| ||||||||
Advance Early Pipeline
|
| 5%
|
| 113.9%
| ||||
Execute Key Clinical Studies and Regulatory Filings
|
| 20%
|
| 120.8%
| ||||
Deliver Annual Priorities
| ||||||||
Execute Critical Launches and Long-Term Commercial Objectives
|
| 10%
|
| 71.3%
| ||||
Achieve Transformation Objectives
|
| 5%
|
| 124.2%
| ||||
Final Score
|
| Achieved 166.6%
| ||||||
| * | Mr. Gordon and Dr. Reese are not included in the pie chart because they commenced their roles as executive officers of our Company on September 3, 2018, and July 26, 2018, respectively. |
| (1) | Non-Generally Accepted Accounting Principles, ornon-GAAP, net income for purposes of the 2018 Company performance goals of our annual cash incentive award program is reported and reconciled inAppendix B. |
| (2) | The operating measures of the 2016-2018 performance units were based onnon-GAAP financial results for 2016, 2017, and 2018 as reported and reconciled inAppendix B, except that operating measures were further adjusted for the impacts of Hurricane Maria as prescribed by the terms of the 2016-2018 performance goals document. For this purpose, operating expense was reduced by $147 million ($0.16 in EPS) for 2017 and increased by $21 million ($0.03 in EPS) for 2018. |
ï 2019 Proxy Statement 29
Table of Contents
|
Item 2 — Advisory Vote to Approve Our Executive Compensation
|
|
2018 Alignment of Pay with Performance
Our strategy includes a series of integrated activities to strengthen our long-term competitive position in the industry. Key 2018 activities that align our NEO pay with performance and support the execution of our strategic priorities are summarized below.
We delivered strong financial performance.
| • | Revenues were $23.7 billion in 2018, an increase of 4% from 2017, driven primarily by product sales growth. |
| • | Ournon-GAAP net income(1) grew 4% to $9.6 billion in 2018. |
| • | We realized benefits from ongoing transformation initiatives along with increased investment in both research and development and our launch products. |
| • | We delivered aone-year total shareholder return of 15% and a five-year return of 93%, outperforming our peer group and the Standard & Poor’s 500 Index over both time periods. |
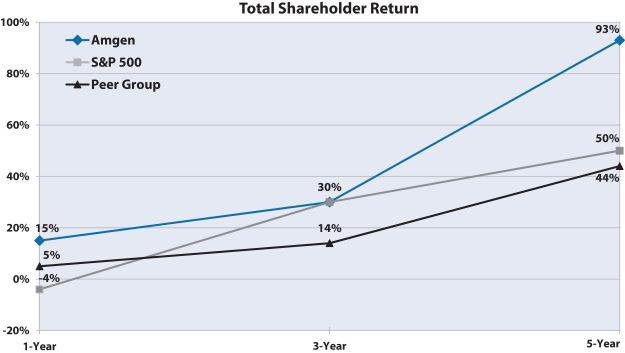
Total Shareholder Return
| • | Our quarterly 2018 dividend of $1.32 per share represented a 15 percent increase from the quarterly dividend for 2017. |
| • | During 2018, we repurchased $17.9 billion of our Common Stock and paid dividends totaling $3.5 billion, resulting in our returning a total of $21.4 billion of capital to our stockholders through stock repurchases and dividends. |
We progressed our pipeline.
We develop innovative and biosimilar medicines that address unmet medical needs to treat serious illnesses. In 2018, we launched two innovative products, two biosimilars, and generated a significant number of innovative andfirst-in-class molecules in our portfolio.
We launched four medicines in 2018.
| v | Innovative Medicines Launched.We launched two important innovative products in 2018 in the U.S. in two different therapeutic areas: |
| • | Aimovig® (migraine), the first calcitonin gene-related peptide (CGRP) inhibitor approved by the U.S. Food and Drug Administration for the preventive treatment of migraine in adults. Migraine is a debilitating condition that continues to have a significant lasting impact on the lives of patients and society at large. In 2018, we served more than 150,000 patients with Aimovig. |
| (1) | Non-GAAP net income for purposes of the 2018 Company performance goals of our annual cash incentive award program is reported and reconciled inAppendix B. |
30 ï 2019 Proxy Statement
Table of Contents
|
Item 2 — Advisory Vote to Approve Our Executive Compensation
|
|
| • | Parsabiv®(nephrology), our medicine for secondary hyperparathyroidism. Parsabiv, which is administered along with dialysis, delivers clinical benefits to patients by putting control in the hands of the health care provider. |
| v | Biosimilars Launched.We also launched two important biosimilars outside the U.S. in 2018: |
| • | KANJINTI™ (biosimilar trastuzumab (Herceptin®)) launched in Europe for the treatment of HER2-positive metastatic breast cancer, HER2-positive early breast cancer, and HER2-positive metastatic adenocarcinoma of the stomach or gastroesophageal junction. |
| • | AMGEVITA™ (biosimilar adalimumab (HUMIRA®)) launched in Europe for the treatment of inflammatory diseases, includingmoderate-to-severe rheumatoid arthritis, psoriatic arthritis, severe active ankylosing spondylitis,moderate-to-severe chronic plaque psoriasis,moderate-to-severe Crohn’s disease, andmoderate-to-severe ulcerative colitis. |
We advanced our early pipeline with approximately 20 unique oncology assets in development.
| • | We initiated 10first-in-human studies, including for small-cell lung cancer, obesity, glioblastoma, relapsed/refractory diffuse largeb-cell lymphoma, mantle cell lymphoma and follicular lymphoma, multiple myeloma, acute myeloid leukemia,non-hodgkins lymphoma, and cardiovascular disease. |
| • | In the oncology pipeline, we are advancing approximately 20 early-stage product candidates in therapeutic indications ranging from solid tumors (including small-cell lung cancer) and hematological malignancies (including multiple myeloma and acute myeloid leukemia). We have designed these development programs to rapidly establishproof-of-concepts and generate data to support our move into the pivotal phase so that we may get these innovative therapies to patients as quickly as possible. |
We executed key clinical studies and regulatory filings.
| v | Innovative Portfolio Developments. We executed key clinical studies and regulatory filings forKYPROLIS®,XGEVA®,BLINCYTO®, andNplate® in oncology, forRepatha® in cardiovascular disease, fortezepelumab(1) in inflammatory disease, and forProlia® andEVENITY™(2)* in bone health. |
| v | Biosimilar Portfolio Developments. In our biosimilars portfolio,MVASI™(3) (biosimilar bevacizumab (Avastin®)) was approved in Europe, we submitted applications in the U.S. and Europe forABP 710 (biosimilar infliximab (REMICADE®)), andABP 798(3) (biosimilar rituximab (RITUXAN®)) met its primary endpoint in our Phase 1/Phase 3 study. |
We delivered on our annual priorities to execute critical launches and long-term commercial objectives.
Revenue growth (4%) benefited from double-digit, volume-driven sales growth from a number of our innovative medicines that address unmet medical needs to treat serious illnesses, including Repatha in cardiovascular disease, Prolia in osteoporosis, and KYPROLIS in cancer.
We realized our 2014-2018 commitments to investors and our transformation objectives.
2018 was the capstone year for a set of ambitiousnon-GAAP financial commitments we made to our stockholders five years ago, including earnings per share growth, operating margin improvement, and return of capital that we met and exceeded through significant transformation and process improvement efforts. The benefits of our transformation continues in the productivity capabilities we have embedded into our business to reallocate resources to our pipeline and growth opportunities, putting us in a better position to serve patients and deliver long-term growth.
We invested for long-term growth while returning substantial capital to our stockholders.
| • | In 2018, we invested $3.7 billion in research and development and $738 million in capital expenditures. |
| • | Between 2011 and 2018, we have increased our global presence to approximately 100 countries from 50. |
| • | Next-generation biomanufacturing plants require a smaller manufacturing footprint and offer greater environmental benefits, including reduced consumption of water and energy and lower levels of carbon emissions. In 2018, we successfully operated our next-generation manufacturing facility in Singapore and broke ground on a next-generation biomanufacturing plant in Rhode Island. This new plant will be the first of its kind in the U.S. and will use our proven next-generation biomanufacturing capabilities to manufacture our products while maintaining a reliable, high-quality, compliant supply of medicines to continue our commitment to meet the need of every patient every time. |
| (1) | Jointly developed in collaboration with AstraZeneca plc. |
| (2) | Jointly developed in collaboration with UCB. *Trade name provisionally approved in U.S. |
| (3) | Jointly developed in collaboration with Allergan plc. |
ï 2019 Proxy Statement 31
Table of Contents
|
Item 2 — Advisory Vote to Approve Our Executive Compensation
|
|
Positive 2018 Say on Pay Vote Outcome and Engagement With Our Stockholders
In 2018, we received approximately 95% stockholder support on our say on pay advisory vote. Consistent with our broad direct stockholder outreach over the past several years, since our 2018 annual meeting of stockholders, in addition to our outreach by our executives and our Investor Relations department to our investors owning approximately 58% of our outstanding shares, we have engaged in governance-focused outreach activities and discussions with stockholders
comprising approximately 53% of our outstanding shares. The compensation-related feedback is reviewed by our Compensation and Management Development Committee, or Compensation Committee. In 2018, the predominant feedback from investors with respect to our compensation and governance practices was that they are satisfied with our compensation program and governance practices. For more detail regarding our stockholder engagement, see page 41.
Board Recommends a Vote “FOR” Our Executive Compensation
Our Board of Directors, or Board, believes that our current executive compensation program aligns the interests of our executives with those of our stockholders and compensation outcomes are primarily based on the performance of our Company. We intend that our compensation programs reward actions and outcomes that are consistent with the sound operation of our Company, advance our strategy, and are aligned with the creation of long-term stockholder value.
For the reasons discussed above and more fully in the Compensation Discussion and Analysis, the Board recommends that stockholders vote “FOR” the following resolution:
“Resolved, that the stockholders approve, on an advisory basis, the compensation paid to the Company’s Named Executive Officers, as
disclosed pursuant to Securities and Exchange Commission rules in the Compensation Discussion and Analysis, the compensation tables and the accompanying narrative disclosure of this proxy statement.”
Although this vote is advisory and is not binding on the Board, our Compensation Committee values the opinions expressed by our stockholders and will consider the outcome of the vote when making future executive compensation decisions.
We currently conduct annual advisory votes on executive compensation, and we expect to conduct the next advisory vote on executive compensation at our 2020 annual meeting of stockholders.
THE BOARD OF DIRECTORS RECOMMENDS A VOTE “FOR” THE ADVISORY RESOLUTION TO APPROVE THE COMPENSATION OF THE COMPANY’S NAMED EXECUTIVE OFFICERS.
32 ï 2019 Proxy Statement
Table of Contents
|
Compensation Discussion and Analysis
|
|
Compensation Discussion and Analysis
Table of Contents
ï 2019 Proxy Statement 33
Table of Contents
|
Compensation Discussion and Analysis
|
|
This Compensation Discussion and Analysis describes our compensation strategy, philosophy, policies, programs, and practices, or compensation program, for our Named Executive Officers, or NEOs, and the positions they held in 2018 below.
| Name | Title | |
Robert A. Bradway | Chairman of the Board, Chief Executive Officer and President | |
Anthony C. Hooper | Former Executive Vice President, Global Commercial Operations (through September 3, 2018) | |
Murdo Gordon | Executive Vice President, Global Commercial Operations | |
Sean E. Harper | Former Executive Vice President, Research and Development (through July 26, 2018) | |
David W. Meline | Executive Vice President and Chief Financial Officer | |
David M. Reese | Executive Vice President, Research and Development | |
Jonathan P. Graham | Senior Vice President, General Counsel and Secretary | |
Planned Succession – Executive Officer Changes in 2018
In 2018, as part of our planned executive succession and to address retirements, we announced transition plans for two Executive Vice Presidents. Sean Harper retired from the role of Executive Vice President, Research and Development on July 26, 2018, after serving in this role since 2012 and for 16 years with Amgen. David Reese, then our Senior Vice President, Translational Sciences and Oncology, was promoted to the role of Executive Vice President, Research and Development, effective July 26, 2018. Dr. Reese joined Amgen in 2005 and has served in a variety of leadership roles since that time. Dr. Harper remained employed with us in anon-executive officer capacity to assist in the transition until January 2019.
Anthony Hooper retired from the role of Executive Vice President, Global Commercial Operations on September 3, 2018, after serving in this role since 2011. Murdo Gordon joined us as our Executive Vice President, Global Commercial Operations, effective September 3, 2018, from Bristol-Myers Squibb Company where he served as Chief Commercial Officer since 2016 and, prior to that, head of worldwide markets. Mr. Hooper continues to be employed in anon-executive officer capacity to assist in the transition, as well as to lead and execute on several corporate strategic objectives.
34 ï 2019 Proxy Statement
Table of Contents
|
Compensation Discussion and Analysis
|
|
Our strategy includes a series of integrated activities to strengthen our long-term competitive position in the industry. Select 2018 activities that support the execution of our strategic priorities and align our NEO pay with performance are summarized below and discussed further in the following pages.
Our Strategic Priorities
| Select 2018 Activities | Description | |||||||||||
Innovative Medicines | • Launched: – Aimovig®(1) (migraine) – Parsabiv® (nephrology) • Progressed pipeline: – 10 investigational – 10 first-in-human studies
| Our research and development strategy is aimed at advancing differentiated,best-in-class orfirst-in-class molecules that deliver large effect sizes against serious illnesses. Our focus on developing innovative, “breakaway” medicines to address important unmet needs guides how we allocate resources across internal and external program possibilities. This results in a productive balance of internal development and external programs and collaborations reflected in our current product portfolio and pipeline.
| ||||||||||
Branded Biosimilars | • Launched: – KANJINTI™ – AMGEVITA™ • 3 biosimilars in Phase 3 | We believe our deep experience in biologics development and unparalleled capabilities in biotechnology manufacturing make the emerging biosimilars market attractive and position us for leadership. | ||||||||||
Transforming Amgen for the Future | • Met and exceeded 2014-2018 • Embedded productivity | We have improved our business and operating model through significant transformation and process improvement efforts. We have driven research and development efficiency through productivity initiatives. Among these programs, we reduced our development cycle time by an average of approximately 36 months, reduced the time it takes to bring new medicines to market, reengineered internal processes to make them more efficient, and explored new technologies with the potential to further enhance the value we deliver to patients. Further, the benefits of our transformation continue in the productivity capabilities we have embedded in our business to reallocate resources to our pipeline and growth opportunities.
| ||||||||||
| Capital Allocation and Investing for Long-Term Growth | • $17.9B in stock repurchases • $3.5B of dividends – 15% per share dividend | We recognize that stockholders who support investment in developing innovative medicines require an appropriate return on the capital they commit to Amgen. In 2018, we returned $21.4 billion in capital to our stockholders, consisting of $17.9 billion in stock repurchases and $3.5 billion of dividends. | ||||||||||
Global Geographic Reach | • Presence in ~100 countries | We are leveraging our global presence to deliver the potential of our products to patients globally. Amgen medicines are now available to patients in approximately 100 countries worldwide.
| ||||||||||
| Next-Generation Biomanufacturing | • Broke ground on U.S. | Next-generation biomanufacturing plants, such as our Singapore facility licensed in 2017, require a smaller manufacturing footprint and offer greater environmental benefits, including reduced consumption of water and energy and lower levels of carbon emissions. Our new plant being built in Rhode Island will be the first of its kind in the U.S. and will use these proven next-generation biomanufacturing capabilities. | ||||||||||
| Improved Drug Delivery Systems | • Invested in delivery devices to enhance patient experience, including our SureClick® autoinjector
| Biologic medicines are, for the most part, injected subcutaneously or administered intravenously. Innovations that make the delivery of our medicines easier and less costly are good for patients and have positive economic benefits to the healthcare system. They also offer important opportunities for differentiation and contribute to our life cycle management strategies for our mature brands.
| ||||||||||
| (1) | Jointly developed in collaboration with Novartis AG. |
ï 2019 Proxy Statement 35
Table of Contents
|
Compensation Discussion and Analysis
|
|
Aligning Pay With Performance and Execution of Our Strategic Priorities
A significant majority of each NEO’s compensation is earned based on our performance and execution of our strategic priorities. Our annual cash incentive and long-term equity incentive programs together promote focus on both near- and long-term stockholder value creation by providing incentive compensation that is earned based on our financial, operating, and stock price performance and is “at risk.” We have been pleased with the 95%+ level of stockholder support we have received on our say on pay advisory vote over time. In 2018, we made significant progress on our 2018 performance goals and advancing our strategic priorities, facilitating execution on our strategy, and mission to serve patients.
Annual Cash Incentive Program Results
Our 2018 annual cash incentive compensation program is tied directly to our performance based onpre-established financial goals of revenues andnon-GAAP net income(1), and operating performance goals of progressing our pipeline and delivering on annual priorities, which were designed to drive execution of strategic priorities. Our 2018 results and the weighting of the goals are as follows:
| ||||||
Goal
| Weighting
|
% of Target
| ||||
Financial Performance
| ||||||
Revenues
|
| 30%
|
| 224.7%
| ||
Non-GAAP Net Income(1)
|
| 30%
|
| 186.5%
| ||
Progress Innovative Pipeline
| ||||||
Advance Early Pipeline
|
| 5%
|
| 113.9%
| ||
Execute Key Clinical Studies and Regulatory Filings
|
| 20%
|
| 120.8%
| ||
Deliver Annual Priorities
| ||||||
Execute Critical Launches and Long-Term Commercial Objectives
|
| 10%
|
| 71.3%
| ||
Achieve Transformation Objectives
|
| 5%
|
| 124.2%
| ||
Final Score
|
| Achieved 166.6%
| ||||
The above-target results under our 2018 incentive program reflect our successes against our strategic priorities as outlined below.
1. Our financial performance was strong.
| • | Revenues were $23.7 billion in 2018, an increase of 4% from 2017, primarily driven by product sales growth. |
| • | Ournon-GAAP net income(1)also grew 4% to $9.6 billion in 2018. We realized benefits from ongoing transformation initiatives along with increased investment in both research and development and our launch products. |
| • | We delivered aone-year total shareholder return, or TSR, of 15% and a five-year return of 93%, outperforming our peer group and the Standard & Poor’s 500 Index, or S&P 500, over both time periods. |
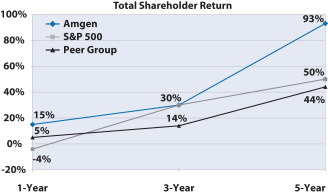
Total Shareholder Return
2. We progressed our pipeline.
We develop innovative and biosimilar medicines that address unmet medical needs to treat serious illnesses. In 2018, we launched two innovative products, two biosimilars, and generated a significant number of innovative andfirst-in-class molecules in our portfolio. (For complete information regarding our significant pipeline advancements, please refer to our Form10-K for the year ended December 31, 2018.)
Pipeline Launches.

We launched two important innovative products in 2018 in the U.S. in two different therapeutic areas:
• | Aimovig (migraine), the first calcitonin gene-related peptide (CGRP) inhibitor approved for the preventive treatment of migraine in adults. Migraine is a debilitating condition that continues to have a significant lasting impact on the lives of patients and society at large. In 2018, we served more than 150,000 patients with Aimovig. |
| • | Parsabiv(nephrology), our medicine for secondary hyperparathyroidism. Parsabiv, which is administered along with dialysis, delivers clinical benefits to patients by putting control in the hands of the health care provider. |
| (1) | Non-Generally Accepted Accounting Principles, ornon-GAAP, net income for purposes of the 2018 Company performance goals of our annual cash incentive award program is reported and reconciled inAppendix B. |
36 ï 2019 Proxy Statement
Table of Contents
|
Compensation Discussion and Analysis
|
|
| We also launched outside the U.S. two important biosimilars in 2018: |

| • | KANJINTI (biosimilar trastuzumab (Herceptin®)) launched in Europe for the treatment of HER2- positive metastatic breast cancer, HER2-positive early breast cancer, and HER2-positive metastatic adenocarcinoma of the stomach or gastroesophageal junction. |
| • | AMGEVITA(biosimilar adalimumab (HUMIRA®)) launched in markets across Europe for the treatment of inflammatory diseases, includingmoderate-to-severe rheumatoid arthritis, psoriatic arthritis, severe active ankylosing spondylitis,moderate-to-severe chronic plaque psoriasis,moderate-to-severe Crohn’s disease, andmoderate-to-severe ulcerative colitis. |
We advanced our early pipeline with approximately 20 unique oncology assets in development.
In the oncology pipeline, we are advancing approximately 20 early-stage product candidates in therapeutic indications ranging from solid tumors (including small-cell lung cancer) and hematological malignancies (including multiple myeloma and acute myeloid leukemia). We have designed these development programs to rapidly establishproofs-of-concept and generate data to support our move into the pivotal phase so that we may get these innovative therapies to patients as quickly as possible.
We executed key clinical studies and regulatory filings.
In Oncology:
| • | ForKYPROLIS® (our medicine for patients with relapsed or refractory multiple myeloma), in 2018: |
| - | The FDA(1)and the European Commission approved label variations for KYPROLIS to include the ENDEAVOR(2) study results (showing a KYPROLIS and dexamethasone regimen reduced the risk of death by 21 percent and increased overall survival by 7.6 months versus Velcade and dexamethasone) and to include the final overall survival data from the Phase 3 ASPIRE(3) study (showing KYPROLIS, lenalidomide and dexamethasone (KRd) significantly reduced the risk of death by 21 percent and extended overall survival by 7.9 months versus lenalidomide and dexamethasone alone). |
| - | The FDA approved our supplemental NDA(4)to allow a once-weekly dosing option. |
| • | ForXGEVA® (our medicine for the prevention of fractures and other skeletal-related events), in 2018 the FDA and the European Commission approved expanded indications for the prevention of skeletal-related events in patients with multiple myeloma. |
| • | ForBLINCYTO® (our medicine for patients with acute lymphoblastic leukemia, or ALL), in 2018: |
| - | The European Commission granted a full marketing authorization based on the overall survival data from the Phase 3 TOWER study in adult patients with Philadelphia chromosome-negative relapsed or refractoryB-cell precursor ALL and approved expanded indications for BLINCYTO as a monotherapy for the treatment of pediatric patients with Philadelphia chromosome-negative CD19 positiveB-cell precursor ALL. In January 2019, the European Commission also approved an expanded indication to include certain adult patients who have small traces of malignant cells remaining after treatment of their Philadelphia chromosome-negative CD19 positiveB-cell precursor ALL. |
| - | In Japan, the Ministry of Health, Labour and Welfare granted marketing authorization approval for use of BLINCYTO(5) to treat relapsed or refractoryB-cell precursor ALL. |
| - | The FDA approved (under accelerated approval) the supplemental BLA(6) for the treatment of certain adults and children who have small traces of malignant cells remaining after treatment of theirB-cell precursor ALL. |
| • | ForNplate® (our medicine to treat low blood platelet counts), in 2018 the FDA approved a supplemental BLA for the treatment of certain pediatric patients with immune thrombocytopenia, or ITP, and accepted a supplemental BLA filing to enable the treatment of adult patients with ITP who have had ITP for 12 months or less. |
In Cardiovascular Disease:
Cardiovascular disease is the costliest disease for society today. In the absence of new therapies to reduce the risk of cardiovascular events for the millions of high risk patients in the U.S. and around the world, the social and financial burden of this disease is projected to rise rapidly. In 2018, we continued to advance our cardiovascular disease program to address this unmet need.
| • | ForRepatha® (our medicine for patients who are unable to get theirlow-density lipoprotein, or LDL, (bad) cholesterol under control): |
| - | The European Commission approved a new Repatha indication for adults with established atherosclerotic cardiovascular disease (myocardial infarction, stroke, or peripheral arterial disease) to reduce cardiovascular risk by lowering LDL cholesterol levels. |
| - | In China, the National Medical Products Administration approved Repatha as the first PCSK9 inhibitor in China for adults with established atherosclerotic cardiovascular disease to reduce the risk of myocardial infarction, stroke, and coronary revascularization. |
| (1) | U.S. Food and Drug Administration. |
| (2) | RandomizEd, OpeN Label, Phase 3 Study of Carfilzomib PlusDExamethAsoneVs Bortezomib Plus DexamethasOne in Patients withRelapsed Multiple Myeloma. |
| (3) | CArfilzomib, Lenaldidomide, and DexamethaSone versus Lenalidomide and Dexamethasone for the treatment ofPatIents withRelapsed Multiple MyEloma. |
| (4) | New Drug Application. |
| (5) | Developed in Japan by Amgen Astellas BioPharma K.K., our joint venture with Astellas Pharma Inc. |
| (6) | Biologics License Application. |
ï 2019 Proxy Statement 37
Table of Contents
|
Compensation Discussion and Analysis
|
|
In Inflammatory Disease:
Respiratory disease is one of the leading causes of death in the world.
| • | Fortezepelumab(1) (our medicine being developed for asthma), in 2018 the FDA granted Breakthrough Therapy Designation in patients with severe asthma without an eosinophilic phenotype supported by our Phase 2b trial data showing a significant reduction in the annual asthma exacerbation rate compared with placebo in a broad population of severe asthma patients. A Phase 3 study of this molecule is enrolling. |
In Bone Health:
Osteoporotic fractures are a significant medical problem for patients, often require hospitalization, and can be very expensive to treat. In 2018, we continued to invest in bone health:
| • | ForProlia® (our medicine for patients with osteoporosis), both the FDA and European Commission approved a new indication for the treatment of glucocorticoid-induced osteoporosis in adult patients at high risk of fracture. |
| • | ForEVENITY™(2)* (our investigational medicine for patients with osteoporosis): |
| - | In January 2019, the Japanese Ministry of Health, Labour and Welfare granted a marketing authorization for the treatment of osteoporosis in men and postmenopausal women at high risk of fracture. |
| - | We resubmitted a BLA to the FDA adding two additional Phase 3 trial results and, in January 2019, the FDA Bone, Reproductive and Urologic Advisory Committee (BRUDAC) voted to recommend approval of EVENITY for the treatment of osteoporosis in postmenopausal women at high risk for fracture. |
In Biosimilars:
Our deep experience in biologics development and capabilities in biotechnology manufacturing is an important contributor to our success in the emerging biosimilars market. In our biosimilars portfolio in 2018, we had the following progress in our clinical studies and regulatory filings:
| • | The EMA(3) approvedMVASI™(4) (biosimilar bevacizumab (Avastin®)) for the treatment of five types of cancer. |
| • | We submitted a BLA to the FDA forABP 710 (biosimilar infliximab (REMICADE®)) and, in January 2019, we submitted a Marketing Authorization Application to the EMA. |
| • | In January 2019, our Phase 1/Phase 3 study forABP 798(4) (biosimilar rituximab (RITUXAN®)) evaluating the pharmacokinetics, |
efficacy, and safety compared to rituximab in patients withmoderate-to-severe rheumatoid arthritis met its primary endpoint. |
3. We delivered on our annual priorities to execute critical launches and long-term commercial objectives.
Revenue growth (4%) benefited from double-digit, volume-driven sales growth from a number of our innovative medicines that address unmet medical needs in serious illnesses, including Repatha in cardiovascular disease, Prolia in osteoporosis, and KYPROLIS in cancer.
| • | Repatha worldwide sales increased 72% in 2018, but this growth fell short of our aspirations due to access and affordability challenges in a competitive market. Given the gravity of the impact of cardiovascular disease, we took significant actions to address these challenges for patients who would benefit from Repatha. |
| - | Efforts to Improve Access.To address access challenges, Amgen has offered payers significant rebates on Repatha in exchange for improved patient access. |
| - | Action to Increase Affordability.We established new National Drug Codes to make Repatha available in the U.S. at a 60% lower list price to address affordability for patients, particularly those on Medicare. |
We realized our 2014-2018 commitments to investors and our transformation objectives.

2018 was the capstone year for a set of ambitiousnon-GAAP financial commitments we made to our stockholders five years ago, including earnings per share, or EPS, growth, operating margin improvement, and return of capital that we met and exceeded through significant transformation and process improvement efforts. The benefits of our transformation continue in the productivity capabilities we have embedded in our business to reallocate resources to our pipeline and growth opportunities putting us in a better position to serve patients and deliver long-term growth.
We invested for long-term growth while returning substantial capital to our stockholders.

Between 2011 and 2018, we have increased our global presence to approximately 100 countries from 50. In 2018, we also marked the milestone of securing our first product approval in China (Repatha) and received the first approval in the world for EVENITY in Japan.
| (1) | Jointly developed in collaboration with AstraZeneca plc. |
| (2) | Jointly developed in collaboration with UCB. Developed in Japan by Amgen Astellas BioPharma K.K., our joint venture with Astellas Pharma Inc. *Trade name provisionally approved in U.S. |
| (3) | European Medicines Agency. |
| (4) | Jointly developed in collaboration with Allergan plc. |
38 ï 2019 Proxy Statement
Table of Contents
|
Compensation Discussion and Analysis
|
|

Our next-generation biomanufacturing plant incorporates multiple innovative technologies and can be built in less time and operate at one half of the operating costs of a traditional plant. Next-generation biomanufacturing plants have a smaller manufacturing footprint and offer greater environmental benefits, including reduced consumption of water and energy and lower levels of carbon emissions. In 2018, we successfully operated our next-generation manufacturing facility in Singapore and broke ground on our U.S. facility.
• | Rhode Island Facility.To support expected product volume growth, we broke ground on a next-generation biomanufacturing plant in Rhode Island in 2018. This new plant will be the first of its kind in the U.S., is anticipated to create a substantial number of additional highly-skilled manufacturing positions in the U.S., and will employ our next-generation biomanufacturing capabilities. |

We have built leading patient- and provider-friendly device capabilities, and continue to invest in such products. Innovations that make the delivery of our medicines easier and less costly are good for patients, have positive economic benefits to the healthcare system, offer important opportunities for differentiation, and contribute to our life cycle management strategies for our mature brands.
• | Our SureClick® autoinjector allows patients the convenience of self-administering Aimovig monthly without a doctor’s visit. |
| • | The Neulasta® Onpro® kit provides physicians the opportunity to initiate the administration of Neulasta on the same day as chemotherapy, with drug delivery of the recommended dose of Neulasta occurring the day after chemotherapy, thereby saving patients a trip back to the doctor. In 2018, we announced that the CHMP(1) of the EMA issued a positive opinion recommending a label variation for Neulasta to include the Neulasta Onpro kit. |

Our strong cash flows and balance sheet allowed continued investment for long-term growth in 2018 through internal research and development ($3.7 billion), capital expenditures ($738 million), and external business development transactions, while simultaneously providing substantial returns to stockholders.
In 2018, whileinvesting $3.7 billion in
research and development and$738 million in capital expenditures, we alsoreturned $21.4 billion of capital to our stockholders ($17.9 billion in stock repurchases and
$3.5 billion of dividends)
Annual Dividend Increases
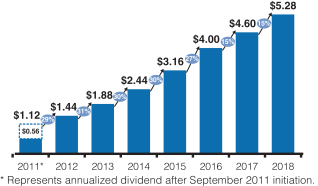
| • | We increased our quarterly dividend per share 15% over 2017 (to $1.32 per share for 2018). Our dividend per share increased 371% since the inception of our dividend in 2011. |
| • | We repurchased approximately $17.9 billion of our shares, including a tender offer to repurchase $10 billion in shares. |
Performance Under Our Long-Term Incentive Program
Our long-term incentive, or LTI, compensation is tied directly to our stock performance and aligns with the interests of our stockholders.
80% of our annual LTI equity award grants are performance-based, aligning compensation with value creation for our stockholders. Performance units comprise 50% of our LTI equity award grants. For 2016-2018, the goal design and all measurement targets were established at the beginning of this three-year performance period and were earned based on our performance on the three equally weightednon-GAAP operating measures of EPS growth, operating margin, and operating expense as measured against each of thepre-established annual targets for each of the three years. Thesenon-GAAP operating measures were chosen to drive performance in alignment with, and focus our executives on, our 2014-2018 investor commitments discussed earlier. At the end of the performance period on December 31, 2018, the operating measure percentages were averaged, resulting in a total operating measures score of 115.4% driven by our strong EPS growth and improved operating margins over the period.
| (1) | Committee for Medicinal Products for Human Use of the European Medicines Agency. |
ï 2019 Proxy Statement 39
Table of Contents
|
Compensation Discussion and Analysis
|
|
The total operating measures score is then increased or decreased based on our relative TSR performance as compared to the companies in the S&P 500. Our strong TSR performance ranking (65.2%) relative to the TSRs of the companies in the S&P 500 over the three year
performance period resulted in a TSR modifier of +30.3% and a payout of 145.7% of target performance units granted. All of the operating performance measure results shown below were determined on anon-GAAP basis.
2016-2018 Operating Measures Score (Operating Measure Percentages 50 – 150% with linear
| ||||||||
Operating Measures Percentages are Equally Weighted for Each of the Three Years
| ||||||||
| Non-GAAP(1) Operating Measures
| 2016
| 2017
| 2018
|
2016-2018
| ||||
EPS Growth ($) |
137.0% ($11.65)
|
128.8% ($12.74) |
142.9% ($14.37) |
136.2% | ||||
Operating Margin (%) |
128.6% (52.3%)
|
134.7% (54.2%) |
106.6% (52.5%) |
123.3% | ||||
Operating Expense (in billions)
| 94.4% ($11.54) | 115.6% ($11.04) | 50.0% ($11.91) | 86.7% | ||||
120.0%
|
126.4% |
99.8% |
115.4% | |||||
2016-2018 S&P 500 Relative TSR Modifier
| ||||||||||
Payout for Performance Relative to S&P 500 TSR Percentage
| ||||||||||
Amgen TSR³ 75th percentile = 50% (Maximum)
| Actual Amgen TSR = 65.2 percentile resulting in a 30.3% score | |||||||||
Amgen TSR = 50th percentile
| ||||||||||
Amgen TSR£ 25th percentile =-50% (Minimum)
| ||||||||||
TSR Measurement Points = Average daily closing price of stock for the first 20 trading days beginning on the grant date (May 3, 2016) and the last 20 trading days of the performance period.
| ||||||||||
 | Payout no greater than 0% (target) if Amgen’s TSR is less than 0. |
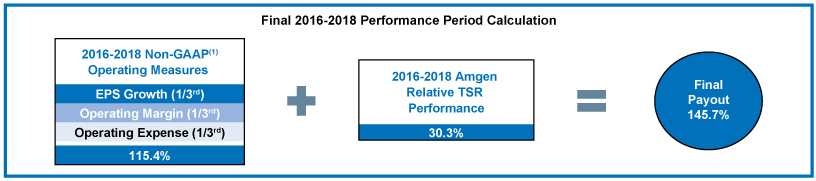
Final 2016-2018 Performance Period Calculation 2016-2018 Non-GAAP(1) Operating Measures EPS Growth (1/3rd) Operating Margin (1/3rd) Operating Expense (1/3rd) 115.4% 2016-2018 Amgen Relative TSR Performance 30.3% Final Payout 145.7%
| (1) | The operating measures of the 2016-2018 performance units were based onNon-GAAP financial results for 2016, 2017, and 2018 as reported and reconciled inAppendix B, except that operating measures were further adjusted for the impacts of Hurricane Maria as prescribed by the terms of the 2016-2018 performance goals document. For this purpose, operating expense was reduced by $147 million ($0.16 in EPS) for 2017 and increased by $21 million ($0.03 in EPS) for 2018. |
40 ï 2019 Proxy Statement
Table of Contents
|
Compensation Discussion and Analysis
|
|
Positive 2018 Say on Pay Vote Outcome and Engagement With Our Stockholders
In 2018, we received approximately 95% stockholder support on our say on pay advisory vote. We have engaged consistently in broad direct stockholder outreach over the past several years. Since our 2018 annual meeting of stockholders, in addition to outreach by our executives and Investor Relations department to our investors owning approximately 58% of our outstanding shares, we have engaged in governance-focused outreach activities and discussions with stockholders owning approximately 53% of our outstanding shares. These discussions have been valuable and informative and we will
continue to engage with our stockholders to further enhance our understanding of the perspectives of our investors.
In 2018, the predominant feedback from investors with respect to our compensation and governance practices was that they are satisfied with our compensation program and governance practices. We are pleased with our say on pay results and stockholder feedback, and will continue to engage with our stockholders to be sure we understand and address any concerns.
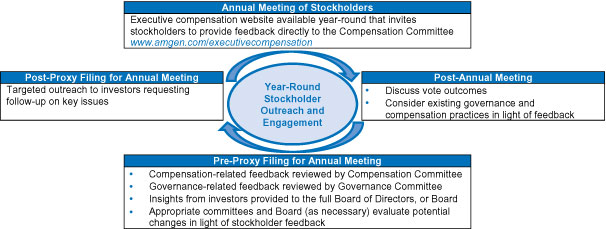
Long-Term Incentive Equity Award Design Changes in 2018
In 2018, the Compensation and Management Development Committee, or Compensation Committee, evaluated potential performance award goal designs for the 2018-2020 performance period (January 1, 2018 to December 31, 2020) to take into account discussions with our stockholders and to continue to drive operating performance and discipline. Our LTI performance units have annual operating performance measures and goals that are established at the beginning of the three year performance period. For the 2018-2020 performance period, the Compensation Committee decided to retain the threenon-GAAP operating measures of EPS growth, operating margin, and operating expense for the annual 2018 operating measures to remain consistent with the 2018 annual performance measures of the 2017-2019 performance period.For the second and third years (2019 and 2020) of the 2018-2020 performance period, the Compensation Committee selected EPS growth and Return on Invested Capital, or ROIC(which are two of the threenon-GAAP operating measures used for2019 of the 2017-2019 performance period). The Compensation Committee retained EPS growth to incentivize continued focus on investor commitments and delivering stockholder value, and added ROIC to emphasize our goal of remaining disciplined in our management of the business and use of capital as we move beyond our 2014-2018 investor commitments discussed earlier. Our performance
against the operating measure targets are calculated for each year of the 2018-2020 performance period and these operating measure percentages are averaged at the end of the performance period, resulting in a total operating measures percentage that can range from 30% for minimum to 170% for maximum performance. The total operating measures percentage is then modified by an increase or decrease of up to 30 percentage points based on how our TSR ranks relative to the TSRs of the companies in the S&P 500 over the performance period. The Compensation Committee determined to reduce the TSR modifier from 50 to 30 percentage points for the 2018-2020 performance period to rebalance the weighting of this period’s goal design in favor of the operating measures to further emphasize the Company’s operational priorities while maintaining alignment of our performance with the long-term value created for our stockholders. The Compensation Committee also retained the requirement that the TSR modifier cannot exceed target (100%) regardless of our relative TSR performance if our absolute TSR over the performance period is less than 0. This feature provides a greater tie to stockholders’ interests and investment experience. A detailed depiction of the 2018-2020 performance period goal design can be found in “Performance Award Goal Design for the 2018-2020 Performance Period—2018-2020 Performance Period Goal Design and Award Calculation.”
ï 2019 Proxy Statement 41
Table of Contents
|
Compensation Discussion and Analysis
|
|
Our 2018 Compensation Program Highlights and Objectives
Total Target Direct Compensation Focuses on “At Risk” Compensation (90% for our Chief Executive Officer, or CEO, and 83% for our other NEOs) |
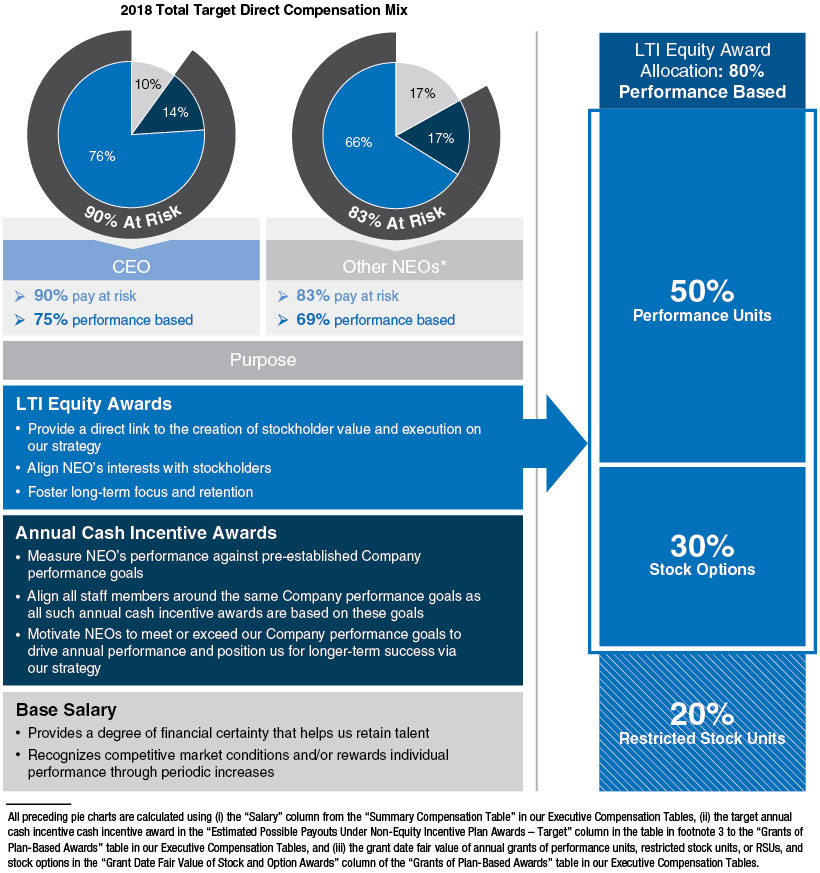
2018 Total Target Direct Compensation Mix 76% 14% 10% 90% At Risk CEO 90% pay at risk 75% performance based 17% 17% 66% 83% At Risk other NEOs* 83% pay at risk 69% performance based Purpose LTI Equity Awards Provide a direct link to the creation of stockholder value and execution on our strategy Align NEO's interests with stockholders Foster long-term focus and retention Annual Cash Incentives Measure NEO's performance against pre-established Company performance goals Align all staff members around the same Company performance goals as all such annual cash incentive awards are based on these goals Motivate NEOs to meet or exceed our Company performance goals to drive annual performance and position us for longer-term success via our strategy Base Salary Provides a degree of financial certainty that helps us retain talent Recognizes competitive market conditions and/or rewards individual performance through periodic increases LTI Equity Award Allocation: 80% Performance Based 50% Performance Units 30% Stock Options 20% Restricted Stock Units All preceding pie charts are calculated using (i) the "Salary" column from the "Summary Compensation Table" in our Executive Compensation Tables (ii) the target annual cash incentive cash incentive award in the "Estimated Possible Payouts Under Non-Equity Incentive Plan Awards - Target" column in the table in footnote 3 to the "Grants of Plan-Based Awards" table in our Executive Compensation Tables and (iii) the grant date fair value of annual grants of performance units, restricted stock units, or RSUs and stock options in the "Grant Date Fair Value of Stock and Option Awards" column of the "Grants of Plan-Based Awards" table in our Executive Compensation Tables.
| * | Mr. Gordon and Dr. Reese are not included in the pie chart because they commenced their roles as executive officers of our Company on September 3, 2018, and July 26, 2018, respectively. |
42 ï 2019 Proxy Statement
Table of Contents
|
Compensation Discussion and Analysis
|
|
LTI Equity Awards (“At Risk”)
| • | Performance Units (50%). Performance units are rights to earn shares of our Common Stock based on pre-established performance goals achieved over a performance period of generally three years. The Compensation Committee establishes the performance award goal design at the beginning of each three-year period of the performance award program. The number of performance units earned is determined by our performance as measured against the pre-established performance goals at the end of the performance period. There is no guarantee of any value realized from the grants as they are earned only if specific long-term performance goals are achieved. |
| • | Stock Options (30%). Aligned with stockholder interests as they only have value if the Company’s stock price increases after grant. |
| • | Restricted Stock Units (20%). Designed to encourage retention and long-term value creation. |
| – | Stock options and RSUs generally vest over four years in three approximately equal installments on the second, third, and fourth anniversaries of the grant date. The delay in the commencement of vesting further emphasizes the long-term performance focus of our LTI equity award program and enhances retention. |
Performance Units Earned for the 2016-2018 Performance Period
The performance units for the 2016-2018 performance period were earned based on the Company’s performance on three pre-established equally weighted annual non-GAAP operating measures(1) (EPS growth, operating margin, and operating expense) as measured against the pre-established targets for each of the three years. At the end of this performance period, the operating measures were averaged resulting in the total operating measures score of 115.4%. This score was then modified based on our three-year TSR performance of +30.3% (at the 65.2% percentile relative to the TSRs of the companies in the S&P 500 for this performance period)(2). These calculations resulted in a payout of 145.7% of target performance units granted.
|
Annual Cash Incentive Awards (“At Risk” and Designed to Drive Execution of Our Strategic Priorities)
Our Compensation Committee annually approves Company performance goals that are designed to focus our staff on delivering on our financial performance and operational objectives and to support our strategic priorities to drive annual performance and position us to execute on our strategy in the near- and longer-term. Our Executive Incentive Plan, or EIP, establishes a maximum award possible for each participant and annual cash incentive awards are made to our NEOs using the Compensation Committee’s negative discretion under the EIP generally based on the Company’s performance against the pre-established Company performance goals. |
Our annual cash incentive awards are earned based on achieving financial performance, operational objectives that drive near- and long-term growth, stockholder value, and support our strategy. In 2018, we established annual Company performance goals that also serve to support our longer-term strategy. These performance goals are composed of revenues (30%), non-GAAP net income(3) (30%), and a number of operational measures supporting “Progress Innovative Pipeline” (25%) (composed of “Advance Early Pipeline” (5%) and “Execute Key Clinical Studies and Regulatory Filings” (20%)) and “Deliver Annual Priorities” (15%) (composed of “Execute Critical Launches and Long-Term Commercial Objectives” (10%) and “Achieve Transformation Objectives” (5%)). Based on our overall performance in 2018 compared to these pre-established Company performance goals, we paid annual cash incentive awards at 166.6% of target bonus opportunity.
|
Base Salaries (the smallest component of compensation for our NEOs)
| • | Based on data provided to the Compensation Committee, including recommendations of Frederic W. Cook & Co., or FW Cook, the Compensation Committee’s independent consultant, the Compensation Committee provided no base salary increases to its NEOs in 2018 consistent with our market positioning and reflective of our continued exercise of financial discipline. |
| (1) | The operating measures of the 2016-2018 performance units were based onnon-GAAP financial results for 2016, 2017, and 2018 as reported and reconciled inAppendix B, except that operating measures were further adjusted for the impacts of Hurricane Maria as prescribed by the terms of the 2016-2018 performance goals document. For this purpose, operating expense was reduced by $147 million ($0.16 in EPS) for 2017 and increased by $21 million ($0.03 in EPS) for 2018. |
| (2) | Based on our average daily closing price of a share of our Common Stock for the first 20 trading days beginning on the grant date (May 3, 2016) and last 20 trading days of the performance period. |
| (3) | Non-GAAP net income for purposes of the 2018 Company performance goals of our annual cash incentive award program is reported and reconciled inAppendix B. |
ï 2019 Proxy Statement 43
Table of Contents
|
Compensation Discussion and Analysis
|
|
| Our Compensation and Governance Best Practices |
What we do
| ✓ | Majority of compensation is performance-based: A substantial majority of NEO compensation is performance-based andat-risk. |
| ✓ | Recoupment: Our incentive compensation plans contain recoupment provisions applicable to all staff members that expressly allow the Compensation Committee to determine that annual cash incentive awards are not earned fully or in part where such employee has engaged in misconduct that causes serious financial or reputational damage to the Company. |
| ✓ | Clawback policy: Our Board is required to consider the recapture of past cash or LTI equity award payouts to our NEOs if the amounts were determined based on financial results that are later restated and the NEOs’ misconduct is determined by the Board to have caused the restatement. |
| ✓ | Robust stock ownership and retention guidelines: We have a six times base salary ownership requirement for our CEO. Our Executive Vice Presidents and Senior Vice Presidents have three times and two times base salary ownership requirements, respectively. Officers are required to retain shares of our Common Stock acquired through the vesting of RSUs, the payout of performance units, or the exercise of stock options until they have reached the required stock ownership level. Compliance with this policy is assessed annually and all executive officers, including our NEOs, who were expected to meet such guidelines by December 31, 2018, were in compliance. |
| ✓ | Minimum vesting periods: Our equity incentive plan provides that our equity awards are subject to a minimum vesting period of no less than one year on 95% of equity awards granted and our grants generally vest over four years, with no vesting in the first year and vesting in three approximately equal annual installments on the second, third, and fourth anniversaries of the grant date. |
| ✓ | Double-trigger in the event of a change of control: We do not have “single-trigger” equity vesting acceleration upon a change of control for RSUs and stock options and do not provide taxgross-ups on change of control payments. |
| ✓ | Performance-based equity: Our LTI equity award grants are primarily (80%) performance-based. |
| ✓ | Independent compensation consultant: The Compensation Committee retained and sought advice from FW Cook to assist the Compensation Committee in its review and determination of executive compensation. |
What we don’t do
× | No hedging or pledging: With respect to our Common Stock, our staff members and Board are prohibited from engaging in short sales, purchasing or pledging our Common Stock on margin, or entering into any hedging, derivative, or similar transactions.
| |
× | Nore-pricing or backdating:We have strong LTI equity award plans and policies that prohibitre-pricing or backdating of equity awards.
| |
× | No taxgross-ups: We do not provide taxgross-ups, except for business-related payments such as reimbursement of certain relocation expenses on behalf of newly-hired and current executives who agree to relocate to work on the Company’s behalf.
| |
× | No excessive perks:Our perquisites are limited to those with a clear business-related rationale.
| |
× | No employment agreements: We do not have employment contracts or guaranteed bonuses, other than in countries where they are required by law.
| |
× | No dividends paid on unvested equity: Dividends equivalents accrue on our performance units and RSUs, but are paid out in shares of our Common Stock only when and to the extent the underlying award is earned and vested. Stock options do not have dividend equivalent rights.
| |
× | No defined benefit pension or supplemental executive retirement plan (SERP) benefits or “above market” interest on deferred compensation. |
44 ï 2019 Proxy Statement
Table of Contents
|
Compensation Discussion and Analysis
|
|
How Compensation Decisions Are Made For Our Named Executive Officers
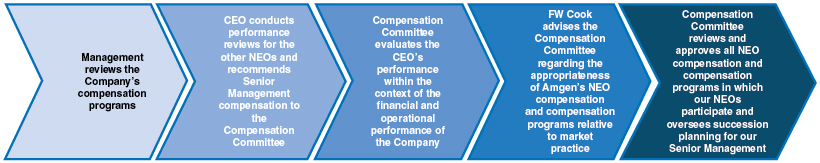
Roles and Responsibilities
Compensation Committee Composed solely of independent directors and reports to the Board
|
• Evaluates the performance of our CEO within the context of the financial and operational performance of the Company.
• Determines and approves compensation packages for our CEO, other NEOs, Executive Vice Presidents, Senior Vice Presidents, and Section 16 officers (collectively, “Senior Management”).
• Reviews and approves all compensation programs in which our NEOs participate.
• Oversees the development and effective succession planning of our CEO and other members of Senior Management annually.
• Exercises the sole authority to select, retain, replace, and/or obtain advice from compensation consultants, legal counsel, and other outside advisors and assesses the independence of each such advisor, taking into consideration the factors set forth in the Securities and Exchange Commission, or SEC, rules and The NASDAQ Stock Market listing standards.
• Oversees the Board’s relationship with and response to stockholders on executive compensation matters and the Compensation Discussion and Analysis.
|
Consultant to the Compensation Committee Frederic W. Cook & Co., Inc., Independent consultant retained directly by the Compensation Committee
|
• Regularly attends Compensation Committee meetings, including meeting in executive session with the Compensation Committee.
• Provides advice and studies on the appropriateness and competitiveness of our compensation program relative to market practice for our NEO compensation.
• Provides advice and studies on our equity programs.
• Provides advice on the selection of our peer group.
• Consults on executive compensation trends and developments.
• Consults and makes recommendations, when requested, on various compensation matters and compensation program designs and practices to support our business strategy and objectives.
• Coordinates and reviews the appropriateness of market data compiled by management.
• Works with management to assess the potential risks arising from our compensation policies and practices.
|
CEO Assisted by the Senior Vice President, Human Resources and other Company staff members |
• Conducts performance reviews of the other NEOs and makes recommendations to the Compensation Committee with respect to compensation of Senior Management other than himself.
• Provides recommendations on the development of and succession planning for the members of Senior Management other than himself.
|
ï 2019 Proxy Statement 45
Table of Contents
|
Compensation Discussion and Analysis
|
|
Use of Independent Compensation Committee Consultant
To assist the Compensation Committee in its review and determination of executive compensation, the Compensation Committee retained and sought advice from FW Cook, an independent consultant. George B. Paulin, the Chairman of FW Cook, worked directly with the Compensation Committee in the roles and undertaking the responsibilities previously described in “How Compensation Decisions Are Made For Our Named Executive Officers” and specifically in 2018 provided consultation regarding regulatory updates, selection of our peer group, consultation on market competitiveness for our LTI equity award practices, competitive practice for CEO compensation, and general market practices for NEO compensation.
On a periodic basis, the Company purchases proprietary executive compensation survey data from FW Cook to inform the Compensation Committee’s decisions, but does not engage FW Cook for any other services to the Company. During 2018, the Compensation Committee, as in past years, had responsibility for engaging FW Cook and directed the nature of the activity and interchange of data between FW Cook and management.
The Compensation Committee recognizes the unique demands of our industry, including its complex regulatory and reimbursement environment, and the challenges of running an enterprise focused on the discovery, development, manufacture, and commercialization of innovative medicines to address serious illness. The Compensation Committee believes that these unique demands require executive talent that has significant industry experience as well as, for certain key functions, specific scientific expertise to oversee research and development activities and the complex manufacturing requirements for biologic products. Further, the Compensation Committee believes that these very particular skills and capabilities limit the pool of talent from which we can recruit and also cause our employees to be highly valued and sought after in our industry.
On an annual basis, FW Cook reviews our peer group with the Compensation Committee to determine whether the peer group remains appropriate. FW Cook recommended adding Regeneron Pharmaceuticals, Inc. to the peer group for 2018 because this company fully satisfies the objective criteria for inclusion described in the following chart and, as such, is appropriate for executive compensation benchmarking. Based in part on these recommendations from FW Cook, as well as a review of the objective criteria, the Compensation Committee added Regeneron Pharmaceuticals, Inc. to the peer group for 2018.
46 ï 2019 Proxy Statement
Table of Contents
|
Compensation Discussion and Analysis
|
|
How We Establish Our Peer Group
2018 Peer Group Companies Biotechnology and pharmaceutical companies with which we compete for executive talent. | ||||
Objective Criteria Considered
|
2018 Peer Group (Companies in blue also list Amgen as a peer)
| |||
• GICS codes of biotechnology (352010) and pharmaceuticals (352020);
• 12-month average market capitalization between 0.25 and 4.0x that of Amgen’s average market capitalization for the same period(1);
• Trailing four-quarter revenues between 0.25 and 4.0x that of Amgen’s revenues(1);
• Non-U.S. peers limited to those commonly identified as a “peer of peers”;
• Competitors for executive talent;
• Companies of comparable scope and complexity;
• Competitors for equity investor capital;
• Companies that identify us as their direct peer; and
• Companies with similar pay practices. |
• AbbVie Inc.
• Allergan plc
• AstraZeneca plc
• Biogen Inc.
• Bristol-Myers Squibb Company
• Celgene Corporation
• Eli Lilly and Company
• Gilead Sciences, Inc.
• GlaxoSmithKline plc
• Johnson & Johnson
• Merck & Co., Inc.
• Novartis AG
• Pfizer Inc.
• Regeneron Pharmaceuticals, Inc.
• Roche Holding AG
• Sanofi S.A. | |||
| (1) | For purposes of the 2018 peer group analyses: |
| Market Capitalization(a) | 2017 Revenues(b) | |||||
Amgen | $127 billion |
| $23 billion |
| ||
Relative Peer Group Position | 3rd Quartile (above median) |
| 2nd Quartile |
| ||
| (a) | Represents the12-month average market capitalization as of May 31, 2018. |
| (b) | Represents revenues for the trailing four quarters ended March 31, 2018. Revenues for GlaxoSmithKline plc, Roche Holding AG, and Sanofi S.A. were converted into U.S. dollars using Standard & Poor’s Capital IQ. |
Peer Group Data Sources
Our primary data sources for evaluating all elements of compensation for our CEO is data compiled by FW Cook from SEC filings of our peer group, including for the 25th, 50th, and 75th percentiles of the specific compensation elements paid to CEOs in our peer group. For our other NEOs, our primary data sources for evaluating all elements of compensation are the Willis Towers Watson Pharmaceutical Human Resources Association Executive Compensation Survey, or PHRA Survey, which provides peer company data, augmented by the available data from proxy statements filed with the SEC for companies in our peer group. The Executive Vice President, Global Commercial Operations role is well-matched in the PHRA Survey. However, the role is not consistently well-represented in the peer group proxy statements
and, as a result, to reflect the scope and criticality of the role, is instead benchmarked to the second highest paid named executive officers in such filings. Solely for the determination of LTI equity awards, we also provide data from the FW Cook Survey of Long-Term Incentives (FW Cook Survey). Based on this data, the Compensation Committee is presented with a comparison of each NEO on a position or pay rank basis with an analysis of each element of direct compensation for such NEO at the 50th and 75th percentile of the peer group. Because PHRA Survey and proxy statement data is only available for the previous calendar year, consistent with generally accepted practice, base pay data is aged forward to the current year based on expected salary movement. Annual cash incentive award and LTI equity award market data are not adjusted for aging.
The “Market Median” is determined for our CEO and our other NEOs based on the prior year’s compensation and is reviewed by the Compensation Committee to inform compensation decisions made in March of each year as follows:
Market Median
|
| |||||
CEO(compiled by FW Cook)
|
Other NEOs
| |||||
• 50th percentile of each compensation element paid to CEOs in our peer group in the previous year from proxy statements. |
• Average of the 50th percentile of each compensation element of our peer group from the PHRA Survey and proxy statements in the previous year (with base pay data aged forward to the current year).
| |||||
ï 2019 Proxy Statement 47
Table of Contents
|
Compensation Discussion and Analysis
|
|
Elements of Compensation and Specific Compensation Decisions
Described below are our three primary elements of executive compensation in order of magnitude: LTI equity awards; annual cash incentive awards; and base salaries.
Long-Term Incentive Equity Awards
Our compensation program aims to achieve the appropriate balance of compensation elements relative to the responsibilities of our staff members, with the result that the largest proportion of compensation for our CEO and the other NEOs is in the form of LTI equity awards that are risk-based and closely aligned with the creation of long-term stockholder value. For 2018, equity-based compensation represents 76% of our CEO’s target compensation and 66% of target compensation for our other NEOs, and 50% of annual equity awards are in the form of performance units. In addition, while being mindful of stockholder dilution (see below), we also grant LTI equity awards each year to nearly all of our staff members worldwide to increase staff awareness of how our performance impacts stockholder value. We believe that our practice of granting equity-based compensation broadly has been a significant factor in advancing our strategic priorities by aligning all of our staff members’ (including our NEOs’) interests with those of our stockholders, rewarding execution of our strategy, fostering long-term focus, and enhancing retention.
We Continue to Exercise Discipline in the Grant of Long-Term Incentive Equity Awards—Monitoring Dilution and Annual Equity Usage
Our compensation philosophy, practices, and approach balance the use of equity to align staff members with our stockholders while being mindful of the level of dilution that our stockholders experience. Annually, LTI equity award grant guidelines are established for each job level within the Company targeting the 50th percentile of our peer group for levels for which equity data is broadly available. For certain lower job levels where data is not as comprehensive, we have developed guidelines that trendin-line with available data and consider internal equity. The Compensation Committee also sets an annual LTI equity award budget at approximately the 50th percentile of our peer group. Further, the Compensation Committee annually reviews the Shareholder Value Transfer (SVT) associated with the proposed aggregate LTI equity award grants to ensure that our SVT is aligned with our peer group practices because, while the Compensation Committee supports delivery of broad-based equity awards to drive alignment of our staff with our stockholders, the Compensation Committee also strives to limit stockholder dilution to that amount which investors would expect to experience with members of our peer group. As illustrated, the resulting dilutive effect has been trending downward to essentially flat over the past seven years.
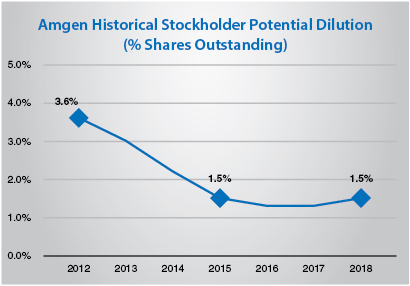
Long-Term Incentive Equity Award Mix
As part of its annual evaluation of our LTI equity award practices, the Compensation Committee reviewed our LTI equity award mix with FW Cook and elected to maintain the previous year’s LTI equity award allocation for 2018 given itspay-for-performance alignment.
LTI Equity Award Allocation
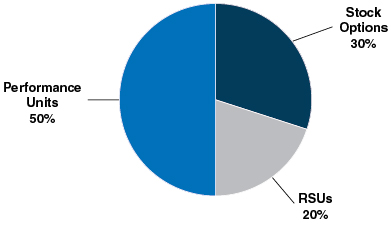
For 2018, 80% of our annual equity award value continued to be delivered as performance-based LTI equity awards consisting of 50% performance units (earned at the end of a three-year performance period) and 30% stock options. Time-vested RSUs, designed to foster retention, continued to comprise the remaining 20% of value. Both our stock options and RSUs generally vest over four years (with no vesting in the first year and vesting in three approximately equal annual installments on the second, third, and fourth anniversaries of the grant date). The delay in the commencement of vesting furthers the longer-term performance emphasis of our LTI equity award program and enhances retention.
48 ï 2019 Proxy Statement
Table of Contents
|
Compensation Discussion and Analysis
|
|
Value of 2018 Long-Term Incentive Equity Awards
Based on a review of Company and executive performance and market data, the Compensation Committee determined to grant the following LTI equity award grant values to our CEO and the other NEOs in March 2018, with an effective grant date of April 27, 2018, the third business day after the announcement of our first quarter 2018 earnings results (with the exception of Mr. Gordon who joined the Company in September 2018). (For more information regarding the determination of the Market Median, see “How Compensation Decisions Are Made For Our Named Executive Officers—Peer Group Data Sources” previously discussed.)
| Named Executive Officer | Performance Units(1) ($) | Stock Options ($) | Restricted Stock Units ($) | Total Equity Value Granted ($) | 2017 Market Median ($) | Difference vs. Market Median Over/ (Under) (%) | ||||||||||||||||||
Robert A. Bradway | 6,250,000 | 3,750,000 | 2,500,000 | 12,500,000 | 11,000,000 | 13.6 | ||||||||||||||||||
Anthony C. Hooper | 2,000,000 | 1,200,000 | 800,000 | 4,000,000 | 3,993,938 | 0.2 | ||||||||||||||||||
Murdo Gordon(2) | n/a | n/a | n/a | n/a | n/a | n/a | ||||||||||||||||||
Sean E. Harper | 2,000,000 | 1,200,000 | 800,000 | 4,000,000 | 3,740,699 | 6.9 | ||||||||||||||||||
David W. Meline | 2,000,000 | 1,200,000 | 800,000 | 4,000,000 | 3,555,907 | 12.5 | ||||||||||||||||||
David M. Reese(3) | 450,000 | 270,000 | 180,000 | 900,000 | n/a | n/a | ||||||||||||||||||
Jonathan P. Graham | 1,400,000 | 840,000 | 560,000 | 2,800,000 | 2,583,298 | 8.4 | ||||||||||||||||||
| (1) | The 2018-2020 performance period runs from January 1, 2018 through December 31, 2020. |
| (2) | Mr. Gordon commenced employment with the Company effective September 3, 2018. For a description of thenew-hire LTI equity awards granted to Mr. Gordon in connection with the commencement of his employment, see the subsection “Initial Hire and Promotion Equity Awards” below. |
| (3) | Dr. Reese was appointed as Executive Vice President, Research and Development, effective July 26, 2018. Prior to that date, and at the time that the 2018 annual LTI equity awards were granted, Dr. Reese served as Senior Vice President, Translational Sciences and Oncology and the grant amounts reflect his level as a Senior Vice President. A Market Median was not available for this position. The table excludes the promotional RSU award with a cash value of $2,400,000 granted on November 2, 2018. See the subsection “Initial Hire and Promotion Equity Awards” below for more details. |
Based on the March 2018 Compensation Committee review of the market data, the Compensation Committee awarded Mr. Bradway a 2018 LTI equity award grant valued at $12.5 million, which is approximately 4% higher than the value of his grant in 2017 of $12 million and 13.6% above the Market Median to reward Mr. Bradway for strong performance and continued and consistent leadership of the Company in a year of transition. In making its decision, the Compensation Committee noted that the Market Median had declined because of leadership turnover at a number of companies in our peer group while peer group LTI equity awards for CEOs who had remained in place had increased by 10%. Further, Mr. Bradway’s total target annual cash compensation was slightly below the Market Median. The Compensation Committee’s determination of the appropriateness of the grant value awarded to Mr. Bradway also took into account that delivery of this value in the form of LTI equity awards (as opposed to an increase in cash compensation) ensures the substantial majority of Mr. Bradway’s compensation is “at risk,” performance-based, and focused on the longer-term.
The March 2018 Compensation Committee review of the market data also resulted in granting Mr. Hooper the same LTI equity award value that he had received in 2017 as this aligned him with the Market Median. For Dr. Harper and Mr. Meline, after reviewing their total target annual cash compensation against the Market Median and noting that both were below the Market Median (see the subsection “Total Target Annual Cash Compensation” below), and to promote internal equity, the Compensation Committee decided to increase Dr. Harper’s and Mr. Meline’s LTI equity award grant values from $3.7 million and $3.5 million, respectively, in 2017, to $4 million in 2018. The
Compensation Committee concluded that these increases in LTI equity award values (as opposed to increases in cash compensation) were appropriate because they address the difference in total target annual cash compensation from the Market Median and target their target total annual direct compensation closer to the Market Median with compensation that is substantially “at risk,” performance-based, and focused on the longer-term. Further, the Compensation Committee also determined to increase Mr. Graham’s LTI equity award value from $2.5 million in 2017 to $2.8 million in 2018 to reflect the breadth and duration of Mr. Graham’s experience in the role of General Counsel at large public companies.
Initial Hire and Promotion Equity Awards
To induce Mr. Gordon to join us and to provide long-term incentives that are in alignment with stockholder interests, a performance unit award valued at $3.5 million was granted with substantially the same terms and conditions as the existing performance award goal design described above for the 2018-2020 performance period except for modifications to address Mr. Gordon’s September 2018 start date. The performance period for Mr. Gordon’s performance unit award began on Mr. Gordon’s equity award grant date (November 2, 2018—the third business day after third quarter 2018 earnings) for purposes of calculating relative TSR and excluded the 2018 operating measures given Mr. Gordon’s late 2018 start date. We also agreed to provide Mr. Gordon with RSUs valued at $6.4 million to compensate Mr. Gordon for equity forfeited as a result of leaving his previous employer, to induce him to join the Company, and to provide long-term incentives that tie a significant portion of Mr. Gordon’s compensation to the value
ï 2019 Proxy Statement 49
Table of Contents
|
Compensation Discussion and Analysis
|
|
of our stock in alignment with our stockholders’ interests. These RSUs were also granted on November 2, 2018, and, to better align with the value of the equity forfeited, will vest over three years beginning on the first anniversary of the equity award grant date through the third anniversary (at a rate of 35%, 35%, and 30% each year), contingent upon Mr. Gordon being actively employed at the time of each vesting date.
In connection with Dr. Reese’s promotion to Executive Vice President, Research and Development, in July 2018, the Compensation Committee granted Dr. Reese a promotion RSU award with a cash value of $2.4 million. This grant was intended to bring Dr. Reese’s annual grant morein-line with Market Median for his new position. These RSUs were granted on November 2, 2018, and will vest over four years in two equal tranches of 33% on the second and third anniversary of the grant date with the remaining 34% vesting on the fourth anniversary of the grant date. To promote his retention and given that Dr. Reese has satisfied the age and service requirements for retirement eligibility, the terms of our RSU equity award agreement providing for continued vesting after retirement were eliminated from this grant. Thus, in the event of Dr. Reese’s retirement prior to vesting, these promotional RSUs will be forfeited.
Performance Award Program—Performance Units Earned for the 2016-2018 Performance Period
Performance units for the 2016-2018 performance period, which ended December 31, 2018, were earned, certified, and converted into shares of Common Stock in March 2019. Thenon-GAAP operating measures(1) of EPS growth, operating margin, and operating expense were chosen to drive performance in alignment with, and focus our executives on, our 2014-2018 investor commitments discussed earlier. At the end of the performance period, the earned percentages from our performance for the three years under eachnon-GAAP operating measure were averaged and the resulting earned operating measure percentages for each of the three measures were averaged, resulting in a total operating measures score of 115.4%. This score was then modified based on our strong three-year TSR performance ranking (65.2%) relative to the TSRs of the companies in the S&P 500 for this performance period, resulting in a TSR modifier of +30.3% and a payout of 145.7% of target performance units granted. The calculation methodology for the 2016-2018 performance period design is depicted on the following page.
| (1) | The operating measures for the 2016-2018 performance units were based onnon-GAAP financial results for 2016, 2017, and 2018 as reported and reconciled inAppendix B, except that operating measures were further adjusted for the impacts of Hurricane Maria as prescribed by the terms of the 2016-2018 performance goals document. For this purpose, operating expense was reduced by $147 million ($0.16 in EPS) for 2017 and increased by $21 million ($0.03 in EPS) for 2018. |
50 ï 2019 Proxy Statement
Table of Contents
|
Compensation Discussion and Analysis
|
|
2016-2018 Performance Period Goal Design and Award Calculation
All operating measures were established in early 2016 at the
beginning of the three-year performance period
2018 Operating Measures and Performance
| Non-GAAP(1) Operating Measures | Minimum (50%) | Target (100%) | Intermediate (125%) | Maximum (150%) | 2018 Performance | |||||||||||||||||||||||
| EPS Growth ($) | 142.9% ($14.37) | ||||||||||||||||||||||||||
£$11.15 | $12.25 | $13.80 | ³$14.60 | |||||||||||||||||||||||||
Operating Margin (%) | 106.6% (52.5%) | |||||||||||||||||||||||||||
£48% | 52% | 54% | ³58% | |||||||||||||||||||||||||
Operating Expense (in billions) | 50.0% ($11.91B) | |||||||||||||||||||||||||||
³$11.5B | $10.9B | – | £$10.3B | |||||||||||||||||||||||||
|
99.8%
| |||||||||||||||||||||||||||


2016-2018 Operating Measures Score (Operating Measure Percentages 50 – 150% with linear | ||||||||
| Operating Measures Percentages are Equally Weighted for Each of the Three Years | ||||||||
| Non-GAAP(1) Operating Measures | 2016(2) | 2017(2) | 2018 | 2016-2018 Average Operating Measures | ||||
EPS Growth ($) | 137.0% ($11.65) | 128.8% ($12.74) | 142.9% ($14.37) | 136.2% | ||||
Operating Margin (%) | 128.6% (52.3%) | 134.7% (54.2%) | 106.6% (52.5%) | 123.3% | ||||
Operating Expense (in billions) | 94.4% ($11.54) | 115.6% ($11.04) | 50.0% ($11.91) | 86.7% | ||||
120.0%
|
126.4%
|
99.8%
|
115.4%
| |||||
2016-2018 S&P 500 Relative TSR Modifier
| ||||||||||
| Payout for Performance Relative to S&P 500 TSR Percentage | ||||||||||
Amgen TSR³75th percentile = 50% (Maximum)
| Actual Amgen TSR = 65.2 percentile – resulting in a +30.3% TSR modifier | |||||||||
Amgen TSR = 50th percentile
| ||||||||||
Amgen TSR£25th percentile =-50% (Minimum)
| ||||||||||
TSR Measurement Points = Average daily closing price of stock for the first 20 trading days from the grant date (May 3, 2016) and the last 20 trading days of the performance period. | ||||||||||
 = 0% (Target)
 | Payout no greater than 0% (target) if Amgen’s TSR is less than 0. |
Final 2016-2018 Performance Period Calculation 2016-2018 Non-GAAP(1) Operating Measures EPS Growth (1/3rd) Operating Margin (1/3rd) Operating Expense (1/3rd) 115.4% 2016-2018 Amgen Relative TSR Performance 30.3% Final Payout 145.7%
| (1) | The operating measures of the 2016-2018 performance goals were based onnon-GAAP financial results for 2016, 2017, and 2018 as reported and reconciled inAppendix B, except that operating measures were further adjusted for the impacts of Hurricane Maria as prescribed by the terms of the 2016-2018 performance goals document. For this purpose, operating expense was reduced by $147 million ($0.16 in EPS) for 2017 and increased by $21 million ($0.03 in EPS) for 2018. |
| (2) | Our targets for our 2016 and 2017 performance under the 2016-2018 performance goals were disclosed in our 2018 proxy statement filed with the Securities and Exchange Commission on April 11, 2018. |
ï 2019 Proxy Statement 51
Table of Contents
|
Compensation Discussion and Analysis
|
|
Performance Units Earned for 2016-2018 Performance Period
Our actual performance of 145.7% for the 2016-2018 performance period resulted in the following number of shares of Common Stock being earned under our performance award program for this performance period. Each earned performance unit converted to one share of Common Stock upon the payout date of March 22, 2019.
| Named Executive Officer | Performance Units Value Granted (Target) ($) | Number of Performance Units Granted (#) | Number of Shares of our Common (#) | |||||||||
Robert A. Bradway | 5,500,000 | 32,246 | 50,962 | |||||||||
Anthony C. Hooper | 2,000,000 | 11,726 | 18,532 | |||||||||
Murdo Gordon(2) | n/a | n/a | n/a | |||||||||
Sean E. Harper | 1,750,000 | 10,260 | 16,215 | |||||||||
David W. Meline | 1,750,000 | 10,260 | 16,215 | |||||||||
David M. Reese | 400,000 | 2,345 | 3,706 | |||||||||
| Jonathan P. Graham | 1,150,000 | 6,742 | 10,655 | |||||||||
| (1) | Includes dividend equivalents earned on these amounts rounded down to the nearest whole number of shares (excluding fractional shares paid in cash). |
| (2) | Mr. Gordon commenced employment with the Company after the participants for the 2016-2018 performance period had been determined and, as such, he did not receive any performance units for the 2016-2018 performance period. For a description of thenew-hire LTI equity awards granted to Mr. Gordon in connection with the commencement of his employment, see the subsection “Initial Hire and Promotion Equity Awards” above. |
Outstanding Performance Units—2017–2019 Performance Period
Based on review and deliberation in December 2016 and March 2017, the Compensation Committee constructed the 2017-2019 performance period (January 1, 2017 to December 31, 2019) design to be similar to that of the 2016-2018 performance period design. For the first and second years of the 2017-2019 performance period, the Compensation Committee retained the threenon-GAAP operating measures of EPS growth, operating margin, and operating expense used for the 2016-2018 performance period as they continued to drive performance in alignment with, and focus our executives on, our 2014-2018 investor commitments discussed earlier.
For the third year of the 2017-2019 performance period (2019), the Compensation Committee replacednon-GAAP operating expense with
non-GAAP ROIC in response to stockholder feedback, as well as to support our 2014-2018 investor commitments and our goal of delivering an efficient, disciplined business model beyond 2018.
To create greater alignment with our stockholders’ interests, the Compensation Committee also retained the requirement that the TSR modifier could not effect a payout greater than target if our absolute TSR over the performance period was less than 0.
The calculation methodology for the 2017-2019 performance period design is substantially similar to that depicted above for the 2016-2018 performance units. The performance metrics and their weightings, as well as our actual performance for the completed annual operating measurement periods of 2017 and 2018 are set forth on the following page.
52 ï 2019 Proxy Statement
Table of Contents
|
Compensation Discussion and Analysis
|
|
2017-2019 Performance Period Goal Design and Award Calculation
All operating measures were established in early 2017 at the
beginning of the three-year performance period
2018 Operating Measures and Performance
| Non-GAAP(1) Operating Measures | Minimum (50%) | Target (100%) | Intermediate (125%) | Maximum (150%) | 2018 Performance | |||||||||||||||||||||||
| EPS Growth ($) | 142.9% ($14.37) | ||||||||||||||||||||||||||
£$11.15 | $12.25 | $13.80 | ³$14.60 | |||||||||||||||||||||||||
Operating Margin (%) | 106.6% (52.5%) | |||||||||||||||||||||||||||
£48% | 52% | 54% | ³58% | |||||||||||||||||||||||||
Operating Expense (in billions) | 50.0% ($11.91B) | |||||||||||||||||||||||||||
³$11.5B | $10.9B | – | £$10.3B | |||||||||||||||||||||||||
|
99.8% | |||||||||||||||||||||||||||

2017-2019 Operating Measures Score (Operating Measure Percentages 50 – 150% with linear | ||||||||||
Operating Measures Percentages are Equally Weighted for Each of the Three Years | ||||||||||
| Non-GAAP(1) Operating Measures | 2017(2) | 2018 | 2019 | 2017-2019 Average Operating Measures | ||||||
EPS Growth ($) |
1/3rd | 133.8% ($12.74) | 142.9% ($14.37) |
Pre-established and to be disclosed(3) | TBD | |||||
Operating Margin (%) |
1/3rd | 114.5% (54.2%) | 106.6% (52.5%) | TBD | ||||||
Operating Expense Years 1 & 2 (in billions) |
1/3rd | 107.0% ($11.04) | 50.0% ($11.91) | Not Applicable for 2019 | TBD | |||||
ROIC Year 3 | Not Applicable for 2017 and 2018 |
Pre-established and to be disclosed(3) | ||||||||
118.4%
|
99.8%
|
TBD
|
TBD
| |||||||
2017-2019 S&P 500 Relative TSR Modifier
|
| Payout for Performance Relative to S&P 500 TSR Percentage |
Amgen TSR³ 75th percentile = 50% (Maximum)
|
Amgen TSR = 50th percentile
|
Amgen TSR£ 25th percentile = -50% (Minimum)
|
TSR Measurement Points = Average daily closing price of stock for the first 20 trading days beginning on the grant date and the last 20 trading days of the performance period. |
| Payout no greater than 0% (target) if Amgen’s TSR is less than 0. |
2018 Targets(2)
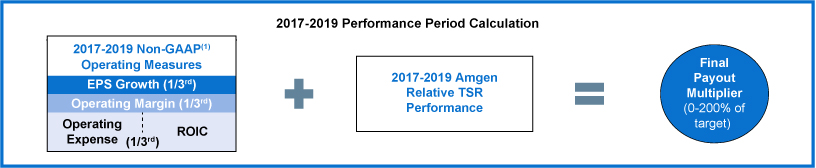
Final 2017-2019 Performance Period Calculation 2017-2019 Non-GAAP(1) Operating Measures EPS Growth (1/3rd) Operating Margin (1/3rd) Operating Expense ROIC (1/3rd) 2017-2019 Amgen Relative TSR Performance Final Payout Multiplier (0-200% of target)
| (1) | The operating measures of the 2017-2019 performance goals were based on non-GAAP financial results for 2017 and 2018 as reported and reconciled inAppendix B, except that operating measures were further adjusted for the impacts of Hurricane Maria as prescribed by the terms of the 2017-2019 performance goals document. For this purpose, operating expense was reduced by $147 million ($0.16 in EPS) for 2017 and increased by $21 million ($0.03 in EPS) for 2018. |
| (2) | Our targets for our 2017 performance were disclosed under the 2017-2019 performance goals in our 2018 proxy statement filed with the Securities and Exchange Commission on April 11, 2018. |
| (3) | 2019 targets are pre-established and to be disclosed. Such 2019 targets are not being disclosed at this time as they are competitively sensitive. |
ï 2019 Proxy Statement 53
Table of Contents
|
Compensation Discussion and Analysis
|
|
Performance Award Goal Design for the 2018–2020 Performance Period
As discussed previously, the Compensation Committee evaluated potential performance award goal designs for the 2018-2020 performance period at its December 2017 and March 2018 meetings, with input from management and FW Cook. The Compensation Committee constructed the 2018-2020 performance period (January 1, 2018 to December 31, 2020) goal design to be similar to that of the 2017-2019 performance period goal design with 2018 annual operating measures remaining the same, while retaining EPS growth and adding ROIC as the other operating measure for 2019 and 2020 of
the 2018-2020 performance period. These two performance measures are also included among the threenon-GAAP operating measures used for 2019 of the 2017-2019 performance period. The TSR modifier was rebalanced for the 2018-2020 performance period from 50 to 30 percentage points. The Compensation Committee retained the requirement that the TSR modifier could not effect a payout greater than target if our absolute TSR over the performance period was less than 0. See “Long-Term Incentive Equity Award Design Changes in 2018” for a full description of the rationale for the performance award goal design for the 2018-2020 performance period. The calculation for the 2018-2020 performance period goal design also is depicted on the following page.
54 ï 2019 Proxy Statement
Table of Contents
|
Compensation Discussion and Analysis
|
|
2018-2020 Performance Period Goal Design and Award Calculation
All operating measures were established in early 2018 at the
beginning of the three-year performance period
2018 Operating Measures and Performance
Non-GAAP(1) Operating Measures | Minimum (30%) | Low (65%) | Target (100%) | High (135%) | Maximum (170%) | 2018 Performance | ||||||||||||||||||||||||||||
| EPS Growth ($) | 132.7% ($14.40) | ||||||||||||||||||||||||||||||||
£$10.60 | $11.40
| $12.95 | $14.50 | ³$15.30 | ||||||||||||||||||||||||||||||
Operating Margin (%) | 105.4% (52.6%) | |||||||||||||||||||||||||||||||||
£46% | 48%
| 52% | 56% | ³58% | ||||||||||||||||||||||||||||||
Operating Expense (in billions) | 30.0% ($11.89B) | |||||||||||||||||||||||||||||||||
³$11.8B | –
| $11.2B | – | £$10.6B | ||||||||||||||||||||||||||||||
|
89.4%
| |||||||||||||||||||||||||||||||||

2018-2020 Operating Measures Score (Operating Measure Percentages 30 – 170% with linear | ||||||||
Operating Measures Percentages are Equally Weighted for Each of the Three Years | ||||||||
| Non-GAAP(1) Operating Measures | 2018 | 2019 | 2020 | 2018-2020 Average Operating Measures | ||||
Operating Margin (%) Year 1 | 105.4% (52.6%) | Not Applicable for 2019 | Not Applicable for 2020 | TBD | ||||
Operating Expense Year 1 (in billions) | 30.0% ($11.89) | TBD | ||||||
EPS Growth ($) Years 1, 2, and 3 | 132.7% ($14.40) | Pre-established and to be disclosed(2) | TBD | |||||
ROIC Years 2 and 3 (in billions) | Not Applicable for 2018 | TBD | ||||||
89.4%
|
TBD
|
TBD
|
TBD
| |||||
2018-2020 S&P 500 Relative TSR Modifier
|
| Payout for Performance Relative to S&P 500 TSR Percentage |
Amgen TSR³75th percentile = 30% (Maximum)
|
Amgen TSR = 50th percentile
|
Amgen TSR£25th percentile = -30% (Minimum)
|
TSR Measurement Points = Average daily closing price of stock for the first 20 trading days beginning on the grant date and the last 20 trading days of the performance period. |
| Payout no greater than 0% (target) if Amgen’s TSR is less than 0. |
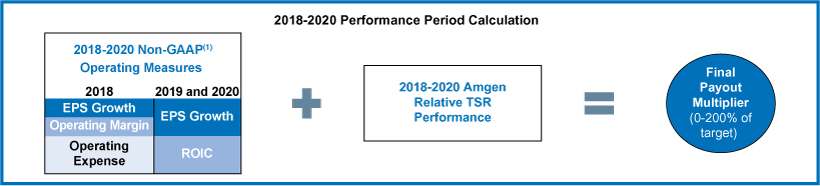
Final 2018-2020 Performance Period Calculation 2018-2020 Non-GAAP(1) Operating Measures 2018 2019 and 2020 EPS Growth EPS Growth Operating Margin ROIC Operating Expense 2018-2020 Amgen Relative TSR Performance
| (1) | The 2018non-GAAP operating measures (EPS growth, operating margin, and operating expense) with respect to the 2018-2020 performance period are as reported and reconciled inAppendix B. |
| (2) | 2019 and 2020 targets arepre-established and to be disclosed. Such 2019 and 2020 targets are not being disclosed at this time as they are competitively sensitive. |
ï 2019 Proxy Statement 55
Table of Contents
|
Compensation Discussion and Analysis
|
|
Performance Award Goal Design for the 2019–2021 Performance Period
As part of its regular review and consideration of the performance award program, the Compensation Committee evaluated potential performance award goal designs for the 2019-2021 performance period (January 1, 2019 to December 31, 2021) with input from management and FW Cook at its December 2018 and March 2019 meetings. Based on such evaluations, the Compensation Committee designed the goals for the 2019-2021 performance period to be similar to that of the 2018-2020 performance period goal design, retaining the operating measures ofnon-GAAP EPS and ROIC used for the last two years of the 2018-2020 performance period for the entire 2019-2021 performance period to reflect our continued focus on remaining operationally disciplined in our management of the business and use of capital. The operating measures ofnon-GAAP EPS growth and ROIC are weighted equally in each year(one-half per measure) and are measured against targets pre-established for each year of the performance period at the beginning of this three year performance period. The Compensation Committee retained the requirement that the TSR modifier could not effect a payout greater than target if our absolute TSR over the performance period was less than 0.
Dividend Equivalents
RSUs and performance units have dividend equivalent rights. Such dividend equivalents are payable only when, and to the extent, the underlying RSUs and performance units are earned and converted to shares of Common Stock. The dividend equivalents may be paid in stock (with cash paid for fractional shares) or in cash at the Compensation Committee’s election. Stock options do not have dividend equivalent rights.
Plan Minimum Vesting Period of One Year; Actual Minimum of Two Years
Mindful of stockholder concerns and best practices, our equity incentive plan requires that at least 95% of all equity awards, including RSUs, restricted stock, stock options, performance awards, and
dividend equivalents granted to staff members (including NEOs) will be subject to a minimum vesting period of no less than one year. Our annual stock option and RSU grants generally vest over four years in three approximately equal annual installments on the second, third, and fourth anniversaries of the grant date. This delayed vesting schedule further underscores the long-term focus of our LTI equity award program and enhances retention of staff members.
Long-Term Incentive Equity Awards Granted to Named Executive Officers in 2019
In March 2019, the Compensation Committee reviewed the LTI equity award grant values proposed to be granted to NEOs in 2019. The Compensation Committee approved an increase in Mr. Bradway’s LTI equity award from $12.5 million to $14 million to reward Mr. Bradway for strong performance and excellent leadership of the Company since 2012. In making its decision, the Compensation Committee noted that, while the Market Median for CEO pay had declined because of turnover in leadership at four of our peer group companies, among continuing incumbents the Market Median increased. The Compensation Committee granted Messrs. Gordon and Meline and Dr. Reese each an LTI equity award grant value of $4 million to position their respective total target direct compensation closer to the Market Median for their respective roles. The Compensation Committee did not grant LTI equity awards for 2019 to Dr. Harper or Mr. Hooper as Dr. Harper left the Company in January 2019 and Mr. Hooper retired from the role of Executive Vice President, Global Commercial Operations in 2018 (although he remains with the Company to assist in the transition to Mr. Gordon as well as to lead and execute on several corporate strategic objectives). In continued recognition of Mr. Graham’s tenure and diversity of experience in the role of General Counsel at large public companies, the Compensation Committee granted Mr. Graham the same LTI equity award value ($2.8 million) that he had received in 2018. The Compensation Committee concluded that the LTI equity award values granted were appropriate because they recognize and reward strong execution by our executives with compensation that is substantially “at risk,” performance-based, and focused on the longer-term.
56 ï 2019 Proxy Statement
Table of Contents
|
Compensation Discussion and Analysis
|
|
Annual Cash Incentive Awards
Executive Incentive Plan
Annual cash incentive awards to our NEOs are generally made under our stockholder-approved EIP, which employs a formula that establishes a maximum award possible for each participant based on ournon-GAAP net income(1). This year, and in the past, actual awards under the EIP are determined by the Compensation Committee using its negative discretion under the EIP, based on the composite final score of thepre-established 2018 Company performance goals. In evaluating and confirming this approach, the Compensation Committee also considers the contributions of each participant’s role to our success during the year. For 2018, each of our NEOs was a participant in the EIP, with the exception of Mr. Gordon, whose award was made under our Global Management Incentive Plan, or GMIP, since he commenced employment in September 2018 and, as such, was not eligible to participate in the EIP.
In March 2018, the Compensation Committee determined for the EIP participants, the definition ofnon-GAAP net income(1), the maximum award payable for each participant, the target annual cash incentive award opportunities and, for the EIP, GMIP, and Global Performance Incentive Plan, or GPIP, the 2018 Company performance goals and the weightings and percentages payable for threshold, target, and maximum performance.
Target Annual Cash Incentive Award Opportunity
After review of market data, the Compensation Committee determined that Mr. Bradway’s target annual cash incentive award opportunity would remain 150% of base salary in 2018 and the target annual cash incentive award opportunity for each of the returning Executive Vice President NEOs would also remain the same in 2018 as it was for 2017 (100% of base salary). Consistent with the target annual cash incentive award opportunity previously established for the other Executive Vice Presidents, Mr. Gordon’s target annual cash incentive award opportunity (under the GMIP) was set at 100% of base salary as part of his September 2018 offer letter based on the Market Median for his position and for internal consistency. Dr. Reese’s target annual cash incentive award opportunity was increased from 65% to 100% of base salary in connection with his promotion to Executive Vice President, Research and Development, based on the Market Median for his position and for internal consistency. Mr. Graham’s target annual cash incentive award opportunity as a Senior Vice President was increased from 80% of base salary to 90% of base salary to align with that of the Market Median for his role.
The maximum award under the EIP continued to be expressed as the EIPnon-GAAP net income(1) definition and, consistent with past years, was 0.125% for our CEO, 0.075% for each of the Executive Vice President NEOs, and 0.05% for the Senior Vice President NEO. As discussed previously, both historically and in 2018, the Compensation Committee has paid well below the maximum award permitted under
the EIP based on a practice of exercising negative discretion from the calculated EIP maximum award payable to each participant by using the Company performance goals composite final score under our GMIP as applied to the participant’s target annual cash incentive award opportunity to determine actual awards.
2018 Company Performance Goals
The 2018 Company performance goals under our GMIP approved by the Compensation Committee were:
| • | “Deliver Results” goals (60%): |
| - | “Revenues” and“Non-GAAP Net Income(2)” are equally focused ontop- and bottom-line growth and were assigned the largest percentage with each element weighted at 30%, consistent with the fundamental importance of financial performance to us and our stockholders in both the near- and long-term. |
| • | “Progress Innovative Pipeline” goals (25%): |
| - | “Advance Early Pipeline” (5%) and “Execute Key Clinical Studies and Regulatory Filings” (20%) which measure progress on both early- and later-stage product candidates to focus us on executing key clinical studies and delivering a robust product pipeline at all stages of the development continuum, which we believe is critical to our continued success over both the near- and long-term. |
| • | “Deliver Annual Priorities” goals (15%): |
| - | “Execute Critical Launches and Long-Term Commercial Objectives” (10%) focuses on executing on our key product launches; and |
| - | “Achieve Transformation Objectives” (5%) focuses on efficiencies and targeted savings in connection with our transformation strategic priority. |
While all of the goals measure single-year performance, taken as a whole, they are intended to positively position us for both near- and longer-term success, support our strategic priorities, and create stockholder value. There are no payouts for below-threshold performance on any of our Company performance goals. Threshold performance on our “Progress Innovative Pipeline” goals results in 50% earned for those metrics. Certain measurements of performance for thenon-financial metrics are more subjective in nature and could result in a very small payout percentage (less than 1% of an annual cash incentive award). Maximum performance under each metric results in earning 225% of target annual cash incentive award opportunity for that metric. Thus, maximum performance under all metrics would result in 225% of target annual cash incentive award opportunity being earned. Annual cash incentive awards are paid in March of the year following the annual performance period and certification of the resulting payouts by the Compensation Committee.
| (1) | Non-GAAP net income for purposes of the EIP is as reported and reconciled inAppendix B. |
| (2) | Non-GAAP net income for purposes of the 2018 Company performance goals of our annual cash incentive award program is reported and reconciled inAppendix B. |
ï 2019 Proxy Statement 57
Table of Contents
|
Compensation Discussion and Analysis
|
|
2018 Company Performance Goals and Results
The table below illustrates the goals established, the weighting of each goal, and our actual performance for 2018. No amounts can be earned for below-threshold performance for our financial metrics.
Deliver Results (60% weighting) |
|
|
Weighted Score Achieved 123.4% |
| ||||||||||||||||
Financial Goals (60%) ($ In Millions) |
| Weighting |
|
| Threshold |
|
| Target |
|
| Maximum |
|
| Achieved |
| |||||
Revenues |
|
30% |
|
|
$20,580 |
|
$ |
21,990 |
|
|
$23,750 |
|
|
$23,747 224.7% |
| |||||
Non-GAAP Net Income(1) | 30% | $7,815 | $8,685 | $9,725 | | $9,573 186.5% |
| |||||||||||||
Progress Innovative Pipeline (25% weighting) |
Weighted Score Achieved 29.9% | |||||||||
Goals | Weighting | Results | Achieved | |||||||
Advance Early Pipeline |
|
5% |
|
• We generated a total of eight product teams (formed when a molecule has been judged to have the potential to be safe and effective in humans). |
|
113.9% |
| |||
• We advanced two programs through theearly-to-late stage portal. | ||||||||||
• We initiated 10first-in-human studies, including for small-cell lung cancer, obesity, glioblastoma, relapsed/refractory diffuse largeb-cell lymphoma, mantle cell lymphoma and follicular lymphoma, multiple myeloma, acute myeloid leukemia,non-hodgkins lymphoma, and cardiovascular disease. | ||||||||||
• We established access to a new large population for genetic analysis and initiated genotyping and sequencing. | ||||||||||
Execute Key Clinical Studies and Regulatory Filings | 20% | • We achieved selected clinical activity milestones for KYPROLIS, BLINCYTO, Nplate, IMLYGIC, and ABP 710 (biosimilar infliximab (REMICADE®)). | 120.8% | |||||||
• We completed regulatory filings for Aimovig, XGEVA (skeletal related events in multiple myeloma), Repatha, BLINCYTO, EVENITY (U.S. submission), and KYPROLIS. | ||||||||||
Deliver Annual Priorities (15% weighting) |
Weighted Score Achieved 13.3% | |||||||||
Goals | Weighting | Results | Achieved | |||||||
Execute Critical Launches and Long-Term Commercial Objectives |
|
10% |
|
• We set aspirational internal goals to focus our entire Company on delivering on the promise of three important medicines, Prolia, KYPROLIS, and Repatha. While all three products delivered double-digit, volume-driven growth, we did not meet all of our aspirational goals. |
|
71.3% |
| |||
Achieve Transformation Objectives | 5% | • We established six transformation initiatives with specific savings targets established for each activity across corporate functions and operations to drive additional savings across the Company, advance internal productivity, and further our full potential initiatives. For this program, we realized approximately $368 million in gross savings that we reinvested in the business including product launches and research and development activities(2).
| 124.2% | |||||||
2018 Company Performance Goals Final Score
|
|
Achieved 166.6%
|
|
| (1) | Non-GAAP net income for purposes of the 2018 Company performance goals of our annual cash incentive award program is reported and reconciled inAppendix B. |
| (2) | Net operating expense savings in the same period were not significant. |
58 ï 2019 Proxy Statement
Table of Contents
|
Compensation Discussion and Analysis
|
|
2018 Annual Cash Incentive Awards
As shown in the table above, our performance against the 2018 Company performance goals yielded a composite final score of 166.6% and the Compensation Committee awarded actual annual cash incentive awards under the EIP to our NEOs based on this composite final score. No further discretion was employed.
| Named Executive Officer | Target Opportunity (% of Base Salary) | Target 2018 Award($) | Actual 2018 Award($)(1) | |||||||||
Robert A. Bradway |
| 150 |
|
| 2,340,000 |
|
| 3,898,000 |
| |||
Anthony C. Hooper |
| 100 |
|
| 1,053,000 |
|
| 1,754,000 |
| |||
Murdo Gordon(2) |
| 100 |
|
| 307,692 |
|
| 513,000 |
| |||
Sean E. Harper |
| 100 |
|
| 974,000 |
|
| 1,623,000 | ||||
David W. Meline |
| 100 |
|
| 974,000 |
|
| 1,623,000 | ||||
David M. Reese |
| 80 | (3) |
| 548,154 |
|
| 913,000 | ||||
Jonathan P. Graham |
| 90 |
|
| 841,500 |
|
| 1,402,000 |
| |||
| (1) | Calculated in accordance with the 2018 Company performance goals composite final score based on actual 2018 earnings. |
| (2) | Mr. Gordon’s award waspro-rated for the number of days he was employed in 2018. |
| (3) | Dr. Reese’s target annual cash incentive award opportunity was increased from 65% to 100% of base salary in connection with his promotion to Executive Vice President, Research and Development, effective as of July 26, 2018. The target opportunity is apro-rated bonus target based on the number of days at each target level before and after the effective date of his promotion. |
Sign-On and Promotional Bonuses
To replace the value of Mr. Gordon’s 2018 bonus with his previous employer which was forfeited upon him leaving his position and to induce Mr. Gordon to accept our offer, we agreed to provide Mr. Gordon with a $2 millionsign-on bonus.
In connection with Dr. Reese’s promotion to Executive Vice President, Research and Development, the Compensation Committee approved a promotional lump sum payment of $300,000 to Dr. Reese.
2019 Company Performance Goals
In March 2019, the Compensation Committee established Company performance goals for 2019 performance under our GMIP as follows:
2019 Company Performance Goals | ||
60% |
Deliver Results | |
• Revenues (30%)
• Non-GAAP Net Income (30%) | ||
30% |
Progress Innovative Pipeline | |
• Execute Key Clinical Studies and Regulatory Filings (20%)
• Advance Early Pipeline (10%) | ||
10% |
Deliver Annual Priorities | |
• Execute Critical Launches and Long-Term Commercial Objectives (5%)
• Achieve Productivity Objectives (5%) |
The Compensation Committee increased the weighting for “Advance Early Pipeline” (from 5% in 2018 to 10% in 2019) to focus the
Company on progressing our programs in development. To provide for the shift of focus towards advancing our early pipeline, the Compensation Committee decreased the weighting for “Execute Critical Launches and Long-Term Commercial Objectives” (from 10% to 5%). The Compensation Committee replaced “Achieve Transformation Objectives” with “Achieve Productivity Objectives” to reflect our movement beyond the 2014-2018 investor commitments and our focus on productivity to support continued reinvestment in opportunities (such as our early pipeline) while striving to maintain appropriate expense discipline.
In March 2019, the Compensation Committee reviewed the target incentive award opportunity for each NEO and determined that the existing target incentive award opportunity for each NEO remains appropriate. No changes were made to the target incentive award opportunity for any NEO.
Base Salaries
Generally, in March of each year, the Compensation Committee reviews the peer group data compared with the Market Median, considers our performance, market conditions, retention and other such other factors deemed relevant, and receives management’s, including our CEO’s, assessment of the performance of each of the other NEOs and recommendations regarding any base salary adjustments for them. The Compensation Committee uses our CEO’s evaluation of the performance of the NEOs (other than himself), the Compensation Committee’s own evaluation of our CEO’s performance, information with respect to each NEO’s experience and other qualifications, the Market Median for each position and market conditions to determine each NEO’s base salary. No increase in base salary is automatic or guaranteed. For more information on how decisions are made, see
ï 2019 Proxy Statement 59
Table of Contents
|
Compensation Discussion and Analysis
|
|
“How Compensation Decisions Are Made For Our Named Executive Officers—Peer Group Data Sources” previously described.
In March 2018, the Compensation Committee reviewed the market competitiveness of each NEO’s base salary employed at the time based on Market Median data and such executive officer’s performance, experience and other qualifications, as well as the Company’s overall
performance. In light of our decision in 2018 to not provide salary increases to our employees at the executive director and officer levels (except in exceptional circumstances) to be consistent with the market for talent as well as with our continuing exercise of financial discipline, the Compensation Committee decided to provide no base salary increases to our NEOs.
2018 Base Salary Market Position
The 2018 base salaries as in effect at the end of 2018 and the Market Median position as reviewed by the Compensation Committee in March 2018 are shown in the table below:
| Named Executive Officer | 2017 Base Salary ($) | Increase (%) | 2018 Base Salary ($) | 2017 Market Median ($) | Difference vs. Market Median Over/(Under) (%) | |||||||||||||||
Robert A. Bradway |
| 1,560,000 |
|
| 0 |
|
| 1,560,000 |
|
| 1,513,000 |
|
| 3.1 |
| |||||
Anthony C. Hooper |
| 1,053,000 |
|
| 0 |
|
| 1,053,000 |
|
| 1,030,952 |
|
| 2.1 |
| |||||
Murdo Gordon(1) |
| n/a |
|
| n/a |
|
| n/a |
|
| n/a |
|
| n/a |
| |||||
Sean E. Harper |
| 974,000 |
|
| 0 |
|
| 974,000 |
|
| 1,025,975 |
|
| (5.1 | ) | |||||
David W. Meline |
| 974,000 |
|
| 0 |
|
| 974,000 |
|
| 1,018,030 |
|
| (4.3 | ) | |||||
David M. Reese(2) |
| 500,000 |
|
| 0 |
|
| 500,000 |
|
| n/a |
|
| n/a |
| |||||
Jonathan P. Graham |
| 935,000 |
|
| 0 |
|
| 935,000 |
|
| 931,759 |
|
| 0.3 |
| |||||
| (1) | Mr. Gordon commenced employment with us in September 2018. His base salary was set at $1,000,000 based on the Market Median for his position and for internal consistency. For further description of the base salary provided to Mr. Gordon in connection with the commencement of his employment, see the subsection “Offer Letter—Mr. Gordon” below. |
| (2) | At the time that the base salaries were determined in March 2018, Dr. Reese served as Senior Vice President, Translational Sciences and Oncology and a Market Median was not available. His base salary for 2018 was initially set at $500,000, reflecting his base salary for 2017. Dr. Reese was promoted to Executive Vice President, Research and Development, effective July 26, 2018, and the Compensation Committee increased Dr. Reese’s base salary by approximately 90% to $950,000 to reflect his new responsibilities and to bring him closer to the Market Median for his new position. |
2019 Base Salary Adjustments
In March 2019, the Compensation Committee reviewed the market competitiveness of each NEO’s base salary based on a review of market data and such executive officer’s performance, experience and other qualifications, as well as the Company’s overall performance. In alignment with the base salary increases made to staff members generally, the Compensation Committee increased Mr. Bradway’s base salary by 2.6% and each of the other NEOs remaining as executive officers with the Company (Messrs. Gordon, Meline, and Graham and Dr. Reese) by 2.5%.
Total Target Annual Cash Compensation
Total target annual cash is the sum of the NEO’s base salary and target annual cash incentive award. The Compensation Committee believes that reviewing our NEOs’ total target annual cash compensation in addition to the Market Median for each element of compensation provides a useful check in making compensation decisions.
In March 2018, the Compensation Committee reviewed total target annual cash compensation for each NEO compared to the market data and historical total target annual cash compensation figures as depicted below. The Compensation Committee noted such total target annual cash compensation was generally below the Market Median with the exception of Messrs. Hooper and Graham, who were slightly above the Market Median as the Market Median for both Messrs. Hooper’s and Graham’s positions had declined in prior years. The Compensation Committee took these metrics into account and elected to increase the value of LTI equity awards to Mr. Meline and Dr. Harper for 2018 to bring their target total annual direct compensation (composed of base salary, target annual cash incentive award, and target LTI equity award) closer to the Market Median, in lieu of increasing total target annual cash compensation, resulting in compensation that is more “at risk” and performance-based. For more information regarding the determination of Market Median and the peer group data reviewed, see “How Compensation Decisions Are Made For Our Named Executive Officers—Peer Group Data Sources” previously described.
60 ï 2019 Proxy Statement
Table of Contents
|
Compensation Discussion and Analysis
|
|
Total Target Annual Cash Compensation
Total target annual cash compensation reviewed by the Compensation Committee in March 2018 prior to the compensation changes being made are shown in the table below:
| Named Executive Officer | 2017 Amgen Target Total Annual Cash ($) | 2017 Market Median ($) | Difference vs. Market Median Over/(Under) (%) | |||||||||
Robert A. Bradway |
| 3,900,000 |
|
| 3,959,000 |
|
| (1.5 | ) | |||
Anthony C. Hooper |
| 2,106,000 |
|
| 2,073,699 |
|
| 1.6 |
| |||
Murdo Gordon(1) |
| n/a |
|
| n/a |
|
| n/a |
| |||
Sean E. Harper |
| 1,948,000 |
|
| 2,116,330 |
|
| (8.0 | ) | |||
David W. Meline |
| 1,948,000 |
|
| 2,063,871 |
|
| (5.6 | ) | |||
David M. Reese(2) |
| 825,000 |
|
| n/a |
|
| n/a |
| |||
Jonathan P. Graham |
| 1,776,500 |
|
| 1,690,870 |
|
| 5.1 |
| |||
| (1) | Mr. Gordon commenced employment with the Company after the March 2018 compensation decisions were made. For a description of total target annual cash compensation provided to Mr. Gordon in connection with the commencement of his employment, see the subsection “Offer Letter—Mr. Gordon” below. |
| (2) | Dr. Reese was appointed as Executive Vice President, Research and Development, effective July 26, 2018. Prior to that date, and at the time that the 2018 compensation decisions were determined, Dr. Reese served as Senior Vice President, Translational Sciences and Oncology and a Market Median was not available for that role. |
Perquisites
Perquisites are limited in both type and monetary value. The Compensation Committee believes, however, that certain perquisites facilitate the efficient operation of our business, allowing our NEOs to better focus their time, attention, and capabilities on our Company, permit them to be accessible to the business as required, alleviate safety and security concerns, and assist us in recruiting and retaining key executives. The perquisites provided to our NEOs generally include an allowance for personal financial planning services, including tax preparation services (not to exceed $15,000 annually in aggregate), annual physical examinations, Company-paid moving and relocation expenses paid on behalf of newly-hired and current executives who agree to relocate to work on the Company’s behalf and, in limited instances, personal expenses when on business travel such as guests accompanying NEOs. Certain of our NEOs also have access to a Company car and driver and, subject to the approval of our CEO, the Company aircraft for personal use. Our CEO is encouraged to use our Company aircraft for all of his travel (business and personal) because the Compensation Committee believes that the value to us of making the aircraft available to our CEO, in terms of safety, security, accessibility, and efficiency, is greater than the incremental cost that we incur. No taxgross-up reimbursements are provided to NEOs, except in connection with reimbursement of moving and relocation expenses consistent with our other staff members and our general relocation policy.
We believe that providing taxgross-up reimbursements on the applicable moving and relocation expenses paid on behalf of newly-hired and current executives who agree to relocate on the Company’s behalf is appropriate because it treats these executives in a similar manner asnon-executives under our Company-wide policy which is designed to incentivize optimal deployment of our human resources in support of the Company’s strategy. It also assists in the attraction and retention of the executive talent necessary to compete successfully.
We provide limited home sale loss assistance for Senior Vice Presidents and above in connection with relocations that benefit us and are at our request, and in certain new hire situations. We do not provide taxgross-ups for assistance with loss on sale of a home. Our limited home sale loss assistance serves as an important tool in inducing senior management to fully commit to their new role and relocation.
Our Company-wide policy includes a repayment provision applicable to all staff members (including our NEOs) that requires a new staff member hired from outside the Company or staff members who accept an assignment and relocate, to repay us for moving and relocation expenses and home loss assistance incurred by us in the event that the staff member does not complete the move, resigns, or is discharged for cause within two years of the employment start date or relocation date, as applicable (with apro-rata refund in the second year).
Compensation Policies and Practices
Recoupment Provisions
Our cash incentive award programs (EIP, GMIP, and GPIP) expressly allow the Compensation Committee, or management, as appropriate, to consider employee misconduct that caused serious financial or reputational damage to the Company when determining whether an employee has earned an annual cash incentive award or the amount of
any such award. This provision is not intended to limit any other action that the Company could take against an employee, including other disciplinary actions (up to termination), ordinary course performance considerations, disclosure of wrongdoing to the government, and pursuit of any other legal claims against such employees.
ï 2019 Proxy Statement 61
Table of Contents
|
Compensation Discussion and Analysis
|
|
Clawback Policy
We have a clawback policy that requires our Board to consider recapturing past cash or equity compensation payouts awarded to our executive officers, including our NEOs, if it is subsequently determined that the amounts of such compensation were determined based on financial results that are later restated and the executive officer’s misconduct caused or partially caused such restatement.
Stock Ownership and Retention Guidelines
Our stock ownership guidelines require our executives to hold a meaningful amount of our Common Stock, promote a long-term
perspective in managing the Company, further aligning the interests of our executives and stockholders and mitigating potential compensation-related risk. Our guidelines require that each officer who has not met their ownership requirements must retain shares of our Common Stock acquired through the vesting of RSUs, the payout of performance units, and the exercise of stock options awarded net of shares retained by us to satisfy associated tax withholding requirements and exercise price amounts, until such officer has reached his or her required stock ownership level.
Stock Ownership Guidelines Requirements
The stock ownership guidelines for 2018 were:
| Position | Stock Ownership Requirement | Compliance | ||
Chief Executive Officer(1) | 6x base salary | ✓ | ||
Executive Vice President | 3x base salary | ✓ | ||
Senior Vice President | 2x base salary | ✓ | ||
Vice President | 1x base salary | ✓ |
| (1) | Mr. Bradway exceeded his ownership requirement and holds approximately 50 times his base salary, or eight times his stock ownership requirement as of November 9, 2018, the effective date of certifications. |
The following holdings count towards satisfying these stock ownership requirements:
| • | shares of our Common Stock beneficially held that are not subject to forfeiture restrictions; |
| • | shares of our Common Stock held through a 401(k) plan or other qualified pension or profit-sharing plan; and |
| • | shares purchasable with funds then allocated under our Employee Stock Purchase Plan. |
Executives are generally given five years following their placement into a given job level to comply with these guidelines. Executives who are promoted to a status with a stock ownership level higher than the executive was previously required to satisfy, have three years to comply with the new ownership level if the executive has been subject to the stock ownership guidelines for five or more years. Once these ownership guidelines are met, executives are required to maintain such ownership until they change job levels or are no longer employed by us. As of November 9, 2018, the effective date of our executive certifications, all executive officers, including our NEOs, who were expected to meet such guidelines, were in compliance. Messrs. Gordon, Meline, and Graham commenced employment with our Company on September 3, 2018, July 21, 2014, and July 13, 2015, and have until 2023, 2019, and 2020, respectively, to meet their guidelines. Dr. Reese was promoted from a Senior Vice President to an Executive Vice President on July 26, 2018 and has until 2021 to comply with the new ownership level associated with the Executive Vice President role.
Insider Trading Policy and Practices
All staff members and our Board are prohibited from: (i) buying or selling our Common Stock while aware of any material nonpublic information; (ii) engaging in short sales with respect to our Common Stock; (iii) pledging or purchasing our Common Stock on margin; or (iv) entering into any derivative, hedging, or similar transactions with respect to our Common Stock.
Policies for Grants of Long-Term Incentive Equity Awards
In accordance with our equity awards policy, our regular annual LTI equity award grants are typically approved at anin-person or telephonic meeting of the Compensation Committee (for grants of equity awards to Senior Management, including our NEOs) or the Equity Award Committee (for grants to all other staff members) with a grant date that is the third business day after the release of our next quarterly or annual earnings announcement after the date of determination by our Compensation Committee or Equity Award Committee, as applicable. In unusual circumstances, LTI equity awards may be approved by the Compensation Committee or Equity Award Committee by unanimous written consent. Our NEOs may also receive special equity awards as determined by the Compensation Committee as new hires or for recognition and retention, promotions, or other purposes, but generally also only on the third business day after the release of our quarterly or annual earnings after the date of determination by our Compensation Committee and the relevant new hire, promotion, or other date.
62 ï 2019 Proxy Statement
Table of Contents
|
Compensation Discussion and Analysis
|
|
Tally Sheets
The Compensation Committee annually reviews tally sheets for each NEO, setting forth all components of compensation, including compensation payable at termination, retirement, or a change of control. These tally sheets summarize the number of shares and the value at a given price of the LTI equity awards held by each NEO, as well as each NEO’s individual cumulative account balances in our benefit plans. These tools are employed by the Compensation Committee as a useful check on total annual compensation and the cumulative impact of our long-term programs and are considered important to understand both the overall and longer-term impact of compensation decisions.
The Compensation Committee may increase or decrease certain individual elements of compensation to align total compensation with peer group market data and to promote internal equity among our
NEOs, other than our CEO, and use the information provided by these tally sheets to make such determination. No material adjustments to total compensation for any of our NEOs were made as a result of the review of these tally sheets by the Compensation Committee in 2018.
Stockholder Outreach—Executive Compensation Website
We maintain a website accessible throughout the year atwww.amgen.com/executivecompensation, which provides a link to our most recent proxy statement and invites our stockholders to fill out a survey to provide input and feedback to the Compensation Committee regarding our executive compensation policies and practices. All input from our stockholders is valuable and the Compensation Committee appreciates your time and effort in completing the survey.
Non-Direct Compensation and Payouts in Certain Circumstances
Change of Control Benefits and Offer Letter With Limited Severance Benefits
Our CEO and other NEOs are participants in our double-trigger Change of Control Severance Plan discussed below. In connection with new hires, we typically enter into offer letters detailing their initial compensation and requirements to pay back certain elements of compensation. To attract talented executives from outside the Company, our offer letters generally include severance terms that apply to terminations initiated by us and occur for reasons other than for “cause” within three years from the date of hire. These benefits are sometimes provided to officer-level candidates to provide an incentive for them to join us by reducing the risks associated with making such a job change. Other than the foregoing, our CEO and NEOs are not covered by contractual arrangements that provide for severance or other benefits in the event of termination.
Offer Letter—Mr. Gordon
Mr. Gordon, who commenced employment as our Executive Vice President, Global Commercial Operations, effective September 3, 2018, is currently subject to an offer letter that was negotiated in connection with his hiring. The terms of the offer letter were approved by the Compensation Committee. Mr. Gordon’s offer letter included our standard relocation assistance to facilitate Mr. Gordon’s relocation from New Jersey to California with a temporary housing allowance of an additional 60 days (for a total of 120 days) and up to $12,000 per month. We agreed to provide Mr. Gordon with a base salary of $1 million, and a target annual cash incentive award opportunity of 100% of base salary, each of which was targeted at the Market Median and such target annual cash incentive award opportunity is consistent with that of each of the other Executive Vice Presidents. We also agreed to provide Mr. Gordon with a $2 millionsign-on bonus to replace the value of Mr. Gordon’s 2018 bonus with his previous employer which was forfeited upon him leaving his current position and to induce Mr. Gordon to accept our offer. We also agreed to provide Mr. Gordon with RSUs valued at $6.4 million. To align with the
value being replaced, this grant will vest over three years beginning on the first anniversary of the grant date through the third anniversary at a rate of 35%, 35%, and 30% each year, respectively, contingent upon Mr. Gordon being actively employed with us through each vesting date. We also agreed to provide Mr. Gordon with performance units valued at $3.5 million which vest at the end of the performance period (November 2, 2018 to December 31, 2020) contingent upon Mr. Gordon being actively employed through the vesting date to further induce Mr. Gordon to join our Company. The Compensation Committee concluded that these LTI equity award values were appropriate because they provide compensation that is focused on the longer-term to compensate Mr. Gordon for equity forfeited as a result of his leaving his previous employer, to induce him to join the Company, and to provide long-term incentives that tie a significant portion of Mr. Gordon’s compensation to the value of our stock in alignment with our stockholders’ interests. See “Initial Hire and Promotion Equity Awards” above for a full description of the LTI equity awards provided to Mr. Gordon. To compensate for Mr. Gordon’s forfeiture of certain pension benefits at his previous employer, Mr. Gordon was also provided with a contribution to his Deferred Compensation Plan of $1 million which will vest at a rate of 33%, 33%, and 34% each year through the third anniversary of his date of employment with us as long as Mr. Gordon remains actively and continuously employed by us. We also agreed to reimburse Mr. Gordon for any claim resulting from Mr. Gordon’s employment with us due to any recoupment from Mr. Gordon by his previous employer for previously earned compensation (up to $2 million). Mr. Gordon’s offer letter provides for cash severance protection for three years following his employment date equal to two year’s annual base salary and target annual cash incentive award, plus up to 18 months of COBRA(1) medical and dental coverage paid for by us. As discussed above, benefits of this type are often provided to officer-level candidates to provide an incentive to them to join our Company by reducing the risk of making such a job change. These severance benefits expire on September 3, 2021, and are payable only if Mr. Gordon is terminated other than for “cause.”
| (1) | The Consolidated Omnibus Budget Reconciliation Act of 1985. |
ï 2019 Proxy Statement 63
Table of Contents
|
Compensation Discussion and Analysis
|
|
Change of Control Benefits
Change of Control Severance Plan
In the event of a change of control and a qualifying termination, our Change of Control Severance Plan provides severance payments to 1,581 U.S. staff members (as of December 31, 2018), including each NEO. There are no taxgross-up payments provided under the plan. The plan is structured so that payments and benefits are provided only if there is both a change of control and a termination of employment, either by us other than for “cause” or “disability” or by the participant for “good reason” (as each is defined in the plan)—sometimes referred to as a “double-trigger”—because the intent of the plan is to provide appropriate severance benefits in the event of a termination following a change of control, rather than to provide a change of control bonus. The cash severance multiple for our CEO and all other NEOs is two times annual cash compensation. The payments and benefit levels under the Change of Control Severance Plan do not influence and were not influenced by other elements of compensation. The Change of Control Severance Plan was adopted, and is continued by the Compensation Committee:
| • | To reinforce and encourage the continued attention and dedication of members of management to their assigned duties without the distraction arising from the possibility of a change of control; |
| • | To enable and encourage management to focus their attention on obtaining the best possible deal for our stockholders and making an independent evaluation of all possible transactions, without being influenced by their personal concerns regarding the possible impact of various transactions on the security of their jobs and benefits; and |
| • | To provide severance benefits to any participant who incurs a termination of employment under the circumstances described within a certain period following a change of control in recognition of their contributions to the Company. |
Change of Control Treatment of Long-Term Incentive Equity Awards
Restricted Stock Units and Stock Options
All unvested RSUs and stock options have “double-trigger” acceleration of vesting that requires a qualifying termination in connection with a change of control. All RSUs and stock options vest in full only if the grantee’s employment is involuntarily terminated other than for “cause” or “disability,” or, in the case of staff members subject to the Change of Control Severance Plan, voluntarily terminated with “good reason,” in each case within two years following a change of control.
Performance Units
The Compensation Committee has maintained change of control features for each of the performance periods under our performance award programs to ensure that these programs reward participants for our performance until the successful closing of any change of control. In general, the performance units are earned based on a truncated performance period and our performance through any change of control
(or target performance for the operating measures if the change of control occurs in the first year of a performance period). If the change of control occurs within the first six months of a performance period, the amount earned ispro-rated based on the number of months of the performance period prior to the change of control. In the event of a termination of employment due to death, disability, or retirement, our performance units provide for potentialearn-out at the end of the performance period based on actual results with the amount earnedpro-rated based on the termination date. For additional information on the levels of payout, see “Potential Payments Upon Termination or Change of Control—Long-Term Incentive Equity Awards—Performance Units” in our Executive Compensation Tables.
Limited Retirement Benefits and Deferred Compensation Plan
Health, retirement, and other benefits programs are generally available to our U.S.-based staff members, including our NEOs, and are typically targeted to align in value with our peer group. The primary survey used to make this comparison is the Aon Hewitt Benefit Index®, last updated as of May 2018, using a comparator group of 14 companies chosen by Amgen as representative of its peer group. The data generated from this survey is used by the Compensation Committee and management in evaluating the competitive positioning and program design of these health, retirement, and other benefit programs.
Retirement and Savings Plan, Supplemental Retirement Plan, and Nonqualified Deferred Compensation Plan
Our Retirement and Savings Plan, or 401(k) Plan, is available to U.S.-based staff members of the Company and participating subsidiaries. All 401(k) Plan participants are eligible to receive the same proportionate level of matching and core contributions from us.
We credit to our Supplemental Retirement Plan, or SRP, which is available to all 401(k) Plan participants, Company core and matching contributions on eligible compensation that cannot be made to the 401(k) Plan because they relate to compensation that is in excess of the maximum amount of recognizable compensation allowed under the Internal Revenue Code’s qualified plan rules. We also credit staff members in the SRP for lost 401(k) Plan Company match and core contributions resulting from making a deferral into the Nonqualified Deferred Compensation Plan, or NDCP. Earnings under the SRP are market-based—there are no “above market” or guaranteed rates of returns offered in this plan and this plan enables us to provide the same percentage of base salary and annual cash incentive award as a retirement contribution to U.S.-based staff members at all levels. SRP and NDCP participants can direct notional account investments using the 401(k) Plan investing structure (excluding self-direct brokerage and our Company stock) as well as a variety of target date funds. Unlike a traditional pension plan, which provides a lifetime annuity that replaces a significant portion of a participant’s final pay, retirement benefits from our 401(k) Plan and SRP are based on the investment return on the staff member’s own investment elections, with the participant bearing the investment risk. The NDCP offers all U.S.-based staff members (including Puerto Rico) at director level and above the
64 ï 2019 Proxy Statement
Table of Contents
|
Compensation Discussion and Analysis
|
|
opportunity to defer eligible base salary and annual cash incentive awards, up to maximum amounts typical at our peer group. We also have the discretion to make contributions to this plan, but we do not make such contributions on a regular basis. We believe that offering the NDCP is appropriate because it provides executives the opportunity to save for retirement in atax-effective fashion that is not readily available without our sponsorship.
Health Savings Account and Retiree Medical Savings Account Plan for all U.S.-based Staff Members
Effective January 1, 2016, we offered a high deductible health plan and a health savings account that is generally available to U.S.-based
(excluding Puerto Rico) staff members. We also maintain a Retiree Medical Savings Account Plan available to U.S.-based (excluding Puerto Rico) staff members that allows all staff members to makeafter-tax deferrals to be used post-termination to reimburse them for eligible medical expenses. Under the Retiree Medical Savings Account Plan, the Company credits all eligible staff members with an annual contribution ($1,000) and makes a matching contribution equal to 50% of a staff member’s deferrals (up to a match of $1,500 per year). Company credits can be accessed to reimburse eligible medical expenses of staff members who terminate having fulfilled the Company’s retirement criteria. We do not offer a traditional Company-paid retiree medical plan to our NEOs or other U.S.-based staff members.
Taxes and Accounting Standards
Tax Deductibility Under Section 162(m) of the Internal Revenue Code
On December 22, 2017, the Tax Cuts and Jobs Act, or Tax Reform Act, was signed into law for taxable years beginning after December 31, 2017. The Tax Reform Act made a number of significant changes to Internal Revenue Code Section 162(m). Section 162(m) places a $1��million limit on the amount of compensation that we may deduct for income tax purposes for any year with respect to compensation paid to “covered employees.”
Prior to the Tax Reform Act, covered employees included the executive who served as our CEO atyear-end, and any of our three other most highly compensated employees who served as executive officers, other than our Chief Financial Officer. The $1 million limit did not apply, however, to performance-based compensation, as defined under Section 162(m). Our 2017 executive compensation program, which was implemented prior to the enactment of the Tax Reform Act, was designed with the intent to provide cash incentive compensation under our EIP, performance units under our performance award program, and stock options under our equity incentive plan as qualifying performance-based compensation. RSUs did not qualify for the performance-based exception.
For tax years beginning after December 31, 2017, the Tax Reform Act revised the definition of covered employee to include an executive officer of a publicly held corporation who holds the positions of either principal executive officer, or PEO, or principal financial officer, or PFO, at any time during the tax year, as well as an executive officer whose total compensation for the tax year is required to be reported to shareholders under the Securities Exchange Act of 1934 by reason of such employee being among the three highest compensated officers for the taxable year (excluding the PEO and PFO), regardless of whether the executive officer is serving at year end. In addition, if an individual is a covered employee for a tax year beginning after December 31, 2016, the individual remains a covered employee for all future years. As a result of the changes to the definition of covered employee, the total number of covered employees in 2018 is higher than in 2017 and can be expected to grow in future years due to the “once a covered employee, always a covered employee” rule.
In addition to changing the definition of covered employee, the Tax Reform Act also eliminated the exception for performance-based compensation.
A transition rule applies to grandfather compensation which is provided pursuant to a written binding contract that was in effect on November 2, 2017, and which is not modified in any material respect on or after such date. An Internal Revenue Service notice has clarified that plans that permit negative discretion do not qualify for grandfathering to the extent that exercise of negative discretion could reduce the compensation. Under the transition rule, compensation related to exercise of stock options issued on or before November 2, 2017, and compensation earned with respect to performance units granted prior to November 2, 2017, should qualify for grandfathering, provided that such contracts are not materially modified after that date. However, our annual cash bonus compensation for the 2017 year that was paid in March 2018 does not qualify for grandfathering since it was performance-based compensation that provided for negative discretion.
Because the performance-based compensation exception was eliminated, compensation grants that we made in 2018 to each covered employee that would have previously qualified for the exception, including stock options, performance units, and annual cash bonuses, will be included in calculation of the amount that is paid to the covered employee that is not deductible to the extent such compensation exceeds the $1 million limit. The cash tax impact for 2018 of compensation not being deductible due to the Section 162(m) limit is approximately $4.2 million, assuming the Company’s U.S. combined effective tax rate for 2018.
Accounting Standards
Financial Accounting Standards Board, or FASB, Accounting Standards Codification, or ASC, Topic 718 requires us to recognize an expense for the fair value of equity-based compensation awards. Grants of stock options, RSUs, and performance units under our LTI equity award plans are accounted for under FASB ASC Topic 718. The Compensation Committee regularly considers the accounting implications of significant compensation decisions, especially in connection with decisions that relate to our LTI equity award plans and programs. For
ï 2019 Proxy Statement 65
Table of Contents
|
Compensation Discussion and Analysis
|
|
example, the Compensation Committee modified our Employee Stock Purchase Plan to make itnon-compensatory under the “safe harbor” provisions of the accounting rules and, therefore, we no longer recognize compensation expense under this plan. As accounting
standards change, we may revise certain programs to appropriately align accounting expenses of our equity awards with our overall executive compensation philosophy and objectives.
66 ï 2019 Proxy Statement
Table of Contents
|
Executive Compensation Tables
|
|
Summary Compensation Table
The following table sets forth summary information concerning the compensation awarded to, paid to, or earned by each of our Named Executive Officers, or NEOs.
| Name and Principal Position | Year | Salary ($)(1) | Bonus ($) | Stock Awards ($)(2) | Option Awards ($)(3) | Non-Equity Incentive Plan Compensation ($)(4) | All Other Compensation ($)(5) | Total ($) | ||||||||||||||||||||||||
Performance Units and Restricted Stock Units | Stock Options | EIP/GMIP | ||||||||||||||||||||||||||||||
Robert A. Bradway Chief Executive Officer and President
|
|
2018 2017 2016 |
|
|
1,566,000 1,555,962 1,531,731 |
|
|
0 0 0 |
|
|
8,749,818 8,399,812 7,699,723 |
|
|
3,749,994 3,599,974 3,299,994 |
|
|
3,898,000 2,683,000 3,650,000 |
|
|
591,454 661,041 668,553 |
|
|
18,555,266 16,899,789 16,850,001 |
| ||||||||
Anthony C. Hooper Former Executive Vice President, Global Commercial Operations
|
|
2018 2017 2016 |
|
|
1,057,050 1,050,173 1,031,788 |
|
|
0 0 0 |
|
|
2,799,925 2,799,937 2,799,874 |
|
|
1,199,995 1,199,973 1,199,995 |
|
|
1,754,000 1,207,000 1,639,000 |
|
|
254,489 295,467 294,528 |
|
|
7,065,459 6,552,550 6,965,185 |
| ||||||||
Murdo Gordon(6) Executive Vice President, Global Commercial Operations
|
|
2018 |
|
|
330,769 |
|
|
2,000,000 |
|
|
9,899,861 |
|
|
0 |
|
|
513,000 |
|
|
1,336,604 |
|
|
14,080,234 |
| ||||||||
Sean E. Harper Former Executive Vice President, Research and Development
|
|
2018 2017 2016 |
|
|
977,746 970,769 946,246 |
|
|
0 0 0 |
|
|
2,799,925 2,589,867 2,449,925 |
|
|
1,199,995 1,110,000 1,049,986 |
|
|
1,623,000 1,116,000 1,502,000 |
|
|
234,212 269,731 264,885 |
|
|
6,834,878 6,056,367 6,213,042 |
| ||||||||
David W. Meline Executive Vice President and Chief Financial Officer
|
|
2018 2017 2016 |
|
|
977,746 970,769 946,733 |
|
|
0 0 0 |
|
|
2,799,925 2,449,878 2,449,925 |
|
|
1,199,995 1,049,990 1,049,986 |
|
|
1,623,000 1,116,000 1,503,000 |
|
|
260,102 271,651 268,821 |
|
|
6,860,768 5,858,288 6,218,465 |
| ||||||||
David M. Reese(7) Executive Vice President, Research and Development
|
|
2018 |
|
|
697,500 |
|
|
300,000 |
|
|
3,029,787 |
|
|
269,966 |
|
|
913,000 |
|
|
129,019 |
|
|
5,339,272 |
| ||||||||
Jonathan P. Graham(8) Senior Vice President, General Counsel and Secretary
|
|
2018 2017 2016 |
|
|
938,596 932,577 916,789 |
|
|
0 0 1,000,000 |
|
|
1,959,878 1,749,939 1,609,898 |
|
|
839,983 749,997 689,990 |
|
|
1,402,000 858,000 1,165,000 |
|
|
204,901 231,695 1,038,668 |
|
|
5,345,358 4,522,208 6,420,345 |
| ||||||||
| (1) | Reflects base salary earned in eachbi-weekly pay period (or portion thereof) during each fiscal year beforepre-tax contributions and, therefore, includes compensation deferred under our qualified deferred compensation plan and nonqualified deferred compensation plan, or NDCP. Under payroll practices for salaried staff members of our U.S. entities, including our NEOs, base salary earned in a pay period is computed by dividing the annual base salary then in effect by 26, which is the number of fullbi-weekly pay periods in a year. |
| (2) | For 2018, reflects the grant date fair values of performance units for the 2018-2020 performance period and restricted stock units, or RSUs, granted during 2018 determined in accordance with Accounting Standards Codification, or ASC, Topic 718 (see footnotes 7, 8, and 10 to the “Grants of Plan-Based Awards” table for information on how these amounts were determined). |
The number of units to be earned for the performance units granted during 2018 is based on the average of our performance against annual operating performance measures established at the commencement of the three year performance period, with the payout on such measures modified up or down by our total shareholder return, or TSR, relative to the TSRs of the companies in the Standard & Poor’s 500 Index, or S&P 500, all computed over the performance period. These operating performance |
ï 2019 Proxy Statement 67
Table of Contents
|
Executive Compensation Tables
|
|
measures are performance conditions, as defined under ASC 718. The values shown in this table and the “Grants of Plan-Based Awards” table are based on probable outcomes of these performance conditions. The table below shows the grant date fair values of these performance unit awards: (1) if the maximum is achieved with regard to all of the operating performance measures which would result in an earnout of 170% based on the operating performance measures with the TSR market condition at target, with no increase or decrease based on the market condition; and (2) if the maximum is achieved with regard to all of the operating performance measures and maximum performance occurs under the TSR market condition which results in an additional 30% earnout, for total earned payout of 200% of performance units granted. |
| Fair Value of Performance Units for the 2018-2020 Performance Period | ||||||||
| Name | Based on the Maximum Performance Regarding the 2018-2020 Operating Performance Measures | Based on the Maximum Performance Regarding the Operating Performance Measures and Maximum Payout for the TSR Modifier | ||||||
Robert A. Bradway |
| $10,624,727 |
|
| $12,499,879 |
| ||
Anthony C. Hooper |
| $3,399,739 |
|
| $3,999,871 |
| ||
Murdo Gordon |
| $5,949,902 |
|
| $6,999,955 |
| ||
Sean E. Harper |
| $3,399,739 |
|
| $3,999,871 |
| ||
David W. Meline |
| $3,399,739 |
|
| $3,999,871 |
| ||
David M. Reese |
| $764,748 |
|
| $899,725 |
| ||
Jonathan P. Graham |
| $2,379,949 |
|
| $2,799,985 |
| ||
| (3) | For 2018, reflects the grant date fair values ofnon-qualified stock options granted during 2018 determined in accordance with ASC 718 (see footnote 9 to the “Grants of Plan-Based Awards” table for information on how these amounts were determined). |
| (4) | Reflects amounts that were earned under our Executive Incentive Plan, or EIP, for 2018 performance which were determined and paid in March 2019. For a description of our EIP, see “Elements of Compensation and Specific Compensation Decisions—Annual Cash Incentive Awards” in our Compensation Discussion and Analysis. |
| (5) | See the subsection “All Other Compensation—Perquisites and Other Compensation” immediately following these footnotes. |
| (6) | Mr. Gordon was hired to serve as Executive Vice President, Global Commercial Operations effective September 3, 2018. This table reflects his compensation earned beginning on that date. The amount shown for Mr. Gordon in the bonus column is asign-on bonus to replace the value of Mr. Gordon’s 2018 bonus with his previous employer which was forfeited upon him leaving his position and to induce Mr. Gordon to accept our offer of employment. |
| (7) | Dr. Reese was promoted to Executive Vice President, Research and Development on July 26, 2018, and this is the first year he is a NEO. Compensation shown reflects his compensation for the full year, and the amount shown in the bonus column was paid to him in connection with his promotion. |
| (8) | The amount shown in the bonus column for 2016 is the second of two installments due to Mr. Graham as asign-on bonus to replace thepro-rata value of Mr. Graham’s 2015 bonus at his previous employer, which was forfeited upon his leaving, and to induce Mr. Graham to accept our offer of employment. |
All Other Compensation—Perquisites and Other Compensation
Perquisites. The amounts reported reflect the aggregate incremental cost of perquisites and other personal benefits provided to our NEOs and are included in the “All Other Compensation” column of the “Summary Compensation Table.” The following table sets forth the perquisites provided to our NEOs in 2018.
| Personal Use of Company Aircraft(1) | Personal Use of Company Car and Driver(2) | Personal Financial Planning Services | Moving and Relocation Expenses(3) | Other(4) | ||||||||||||||||||||||||
| Name | Aggregate Incremental Cost($) | Aggregate Incremental Cost($) | Aggregate Incremental Cost($) | Aggregate Incremental Cost($) | Tax Gross- Up($) | Aggregate Incremental Cost($) | Total($) | |||||||||||||||||||||
Robert A. Bradway |
| 88,884 |
|
| 4,091 |
|
| 15,000 |
|
| 0 |
|
| 0 |
|
| 59,179 |
|
| 167,154 |
| |||||||
Anthony C. Hooper |
| 0 |
|
| 805 |
|
| 15,000 |
|
| 0 |
|
| 0 |
|
| 12,684 |
|
| 28,489 |
| |||||||
Murdo Gordon |
| 0 |
|
| 0 |
|
| 3,904 |
|
| 213,287 |
|
| 94,381 |
|
| 1,955 |
|
| 313,527 |
| |||||||
Sean E. Harper |
| 0 |
|
| 0 |
|
| 15,000 |
|
| 0 |
|
| 0 |
|
| 10,212 |
|
| 25,212 |
| |||||||
David W. Meline |
| 24,237 |
|
| 1,365 |
|
| 15,000 |
|
| 0 |
|
| 0 |
|
| 10,500 |
|
| 51,102 |
| |||||||
David M. Reese |
| 0 |
|
| 0 |
|
| 15,000 |
|
| 0 |
|
| 0 |
|
| 10,500 |
|
| 25,500 |
| |||||||
Jonathan P. Graham |
| 0 |
|
| 79 |
|
| 15,000 |
|
| 0 |
|
| 0 |
|
| 10,522 |
|
| 25,601 |
| |||||||
| (1) | The aggregate incremental cost of use of our aircraft for personal travel by our NEOs is allocated entirely to the highest ranking NEO present on the flight (except foron-board catering costs which are allocated to each NEO present). If each NEO present on the flight is the same level, the aggregate incremental costs of use of our aircraft for personal travel is allocated to each NEO present. The aggregate incremental cost for personal use of our aircraft is calculated based on our variable operating costs, |
68 ï 2019 Proxy Statement
Table of Contents
|
Executive Compensation Tables
|
|
which include crew travel expenses,on-board catering, landing fees, trip-related hangar/parking costs, fuel, trip-related maintenance, and other smaller variable costs. In determining the incremental cost relating to fuel and trip-related maintenance, we applied an estimate derived from our average costs. We believe that the use of this methodology for 2018 is a reasonably accurate method for calculating fuel and trip-related maintenance costs. Because our aircraft are used primarily for business travel, we do not include the fixed costs that do not change based on usage, such as pilots’ salaries, our aircraft purchase costs, and the cost of maintenance not related to trips. |
| (2) | The aggregate incremental cost for personal use of the car and driver provided by us is determined as the sum of the cost of fuel, driver overtime costs allocable to personal usage, and maintenance costs for the total number of personal miles driven. Personal miles include travel to and from work from home. As the cars are used primarily for business travel, fixed costs that would be incurred by us to operate the company cars for business use such as car lease costs and driver salaries are not included. |
| (3) | Mr. Gordon agreed to relocate from New Jersey to Thousand Oaks, California to serve as Executive Vice President, Global Commercial Operations in September 2018. The incremental cost of certain relocation benefits that were provided to Mr. Gordon in 2018 in connection with his relocation in accordance with our relocation policies, include: |
| (a) | $93,488 for costs to sell his previous residence and purchase his new residence; |
| (b) | $34,610 for costs to relocate household goods; |
| (c) | $63,855 for costs for temporary housing; |
| (d) | $21,334 for reimbursed relocation-related travel expenses and miscellaneous other relocation expenses; and |
| (e) | $94,381 for taxgross-up payments on moving and relocation benefits provided. |
| (4) (a) | Other expenses for Mr. Bradway reflect our payment of the required filing fee of $45,000 incurred by Mr. Bradway under the Hart-Scott-Rodino Antitrust Improvements Act of 1976, or HSR Act, as approved by the Compensation and Management Development Committee, or Compensation Committee. During 2018, Mr. Bradway submitted filings under the HSR Act based on his then-current and anticipated future holdings of Amgen Common Stock approaching the reporting threshold under the HSR Act. The Compensation Committee reviewed the legal requirements under the HSR Act. Based on this review, the Compensation Committee approved that the payment of the HSR Act filing fee be made by the Company on Mr. Bradway’s behalf because the stock giving rise to the reporting requirements was granted as part of Mr. Bradway’s compensation for services to the Company and such requirements were triggered because of Mr. Bradway’s election to continue to hold such stock. Mr. Bradway was responsible for any taxes due as a result of the Company paying the HSR Act filing fee and was not provided a taxgross-up payment. |
| (b) | Other expenses also include Company contributions tonon-profit charities designated by the executive in the amount of $9,984 for Messrs. Bradway and Hooper and $10,000 for Drs. Harper and Reese and Messrs. Meline and Graham. |
| (c) | Other expenses also include executive physicals, gifts, personal expenses on business travel, and expenses related to guests accompanying the NEOs on business travel. |
Other Compensation. The following table sets forth compensation for our NEOs in 2018 incurred in connection with our 401(k) Retirement and Savings Plan, or 401(k) Plan, our NDCP, and our Supplemental Retirement Plan, or SRP. These amounts, along with the perquisites and other compensation discussed above, are included in the “All Other Compensation” column of the “Summary Compensation Table.” See “Nonqualified Deferred Compensation” below for a description of these plans.
| Name | Company Contributions to 401(k) Retirement and Savings Plan($) |
Company Credits to Non-Qualified |
Company Credits to Supplemental Retirement Plan($) | Total($) | ||||||||||||
Robert A. Bradway |
| 27,500 |
|
| 0 |
|
| 396,800 |
|
| 424,300 |
| ||||
Anthony C. Hooper |
| 27,500 |
|
| 0 |
|
| 198,500 |
|
| 226,000 |
| ||||
Murdo Gordon |
| 19,808 |
|
| 1,000,000 |
|
| 3,269 |
|
| 1,023,077 |
| ||||
Sean E. Harper |
| 27,500 |
|
| 0 |
|
| 181,500 |
|
| 209,000 |
| ||||
David W. Meline |
| 27,500 |
|
| 0 |
|
| 181,500 |
|
| 209,000 |
| ||||
David M. Reese |
| 27,500 |
|
| 0 |
|
| 76,019 |
|
| 103,519 |
| ||||
Jonathan P. Graham |
| 27,500 |
|
| 0 |
|
| 151,800 |
|
| 179,300 |
| ||||
ï 2019 Proxy Statement 69
Table of Contents
|
Executive Compensation Tables
|
|
Grants of Plan-Based Awards
The following table sets forth summary information regarding all grants of plan-based awards made to our NEOs for the year ended December 31, 2018. All of our equity based awards were granted under the Amgen Inc. 2009 Equity Incentive Plan, as amended.
Estimated Future Payouts |
Estimated Future | All Other | All Other (#)(6) | Exercise ($/Sh) | Grant Date | |||||||||||||||||||||||||||||||||||||||||||||||
Name | Grant Date | Approval Date(1) | Threshold | Target | Maximum | Threshold | Target | Maximum | ||||||||||||||||||||||||||||||||||||||||||||
| EIP/GMIP | Performance Units | RSUs | Stock Options | |||||||||||||||||||||||||||||||||||||||||||||||||
Robert A. Bradway | 3/7/18 | 3/7/18 | (3) | (3) | 11,966,250 | |||||||||||||||||||||||||||||||||||||||||||||||
| 4/27/18 | 3/7/18 | (4) | 33,107 | 66,214 | 6,249,939 | (7) | ||||||||||||||||||||||||||||||||||||||||||||||
| 4/27/18 | 3/7/18 | 14,087 | 2,499,879 | (8) | ||||||||||||||||||||||||||||||||||||||||||||||||
|
| 4/27/18
|
|
| 3/7/18
|
|
| 108,444
|
|
| 177.46
|
| 3,749,994 | (9) | |||||||||||||||||||||||||||||||||||||||
Anthony C. Hooper | 3/7/18 | 3/7/18 | (3) | (3) | 7,179,750 | |||||||||||||||||||||||||||||||||||||||||||||||
| 4/27/18 | 3/7/18 | (4) | 10,594 | 21,188 | 1,999,935 | (7) | ||||||||||||||||||||||||||||||||||||||||||||||
| 4/27/18 | 3/7/18 | 4,508 | 799,990 | (8) | ||||||||||||||||||||||||||||||||||||||||||||||||
|
| 4/27/18
|
|
| 3/7/18
|
|
| 34,702
|
|
| 177.46
|
| 1,199,995 | (9) | |||||||||||||||||||||||||||||||||||||||
Murdo Gordon | 9/3/18 | (2) | 9/3/18 | (2) | (3) | 307,692 | (2) | 692,307 | (2) | |||||||||||||||||||||||||||||||||||||||||||
| 11/2/18 | 7/20/18 | (4) | 17,699 | 35,398 | 3,499,977 | (10) | ||||||||||||||||||||||||||||||||||||||||||||||
|
| 11/2/18
|
|
| 7/20/18
|
|
| 34,213
|
| 6,399,884 | (8) | ||||||||||||||||||||||||||||||||||||||||||
Sean E. Harper | 3/7/18 | 3/7/18 | (3) | (3) | 7,179,750 | |||||||||||||||||||||||||||||||||||||||||||||||
| 4/27/18 | 3/7/18 | (4) | 10,594 | 21,188 | 1,999,935 | (7) | ||||||||||||||||||||||||||||||||||||||||||||||
| 4/27/18 | 3/7/18 | 4,508 | 799,990 | (8) | ||||||||||||||||||||||||||||||||||||||||||||||||
|
| 4/27/18
|
|
| 3/7/18
|
|
| 34,702
|
|
| 177.46
|
| 1,199,995 | (9) | |||||||||||||||||||||||||||||||||||||||
David W. Meline | 3/7/18 | 3/7/18 | (3) | (3) | 7,179,750 | |||||||||||||||||||||||||||||||||||||||||||||||
| 4/27/18 | 3/7/18 | (4) | 10,594 | 21,188 | 1,999,935 | (7) | ||||||||||||||||||||||||||||||||||||||||||||||
| 4/27/18 | 3/7/18 | 4,508 | 799,990 | (8) | ||||||||||||||||||||||||||||||||||||||||||||||||
|
| 4/27/18
|
|
| 3/7/18
|
|
| 34,702
|
|
| 177.46
|
| 1,199,995 | (9) | |||||||||||||||||||||||||||||||||||||||
David M. Reese | 3/7/18 | 3/7/18 | (3) | (3) | 4,786,500 | |||||||||||||||||||||||||||||||||||||||||||||||
| 4/27/18 | 3/7/18 | (4) | 2,383 | 4,766 | 449,863 | (7) | ||||||||||||||||||||||||||||||||||||||||||||||
| 11/2/18 | 5/21/18 | 12,830 | 2,399,980 | (8) | ||||||||||||||||||||||||||||||||||||||||||||||||
| 4/27/18 | 3/7/18 | 1,014 | 179,944 | (8) | ||||||||||||||||||||||||||||||||||||||||||||||||
|
| 4/27/18
|
|
| 3/7/18
|
|
| 7,807
|
|
| 177.46
|
| 269,966 | (9) | |||||||||||||||||||||||||||||||||||||||
Jonathan P. Graham | 3/7/18 | 3/7/18 | (3) | (3) | 4,786,500 | |||||||||||||||||||||||||||||||||||||||||||||||
| 4/27/18 | 3/7/18 | (4) | 7,416 | 14,832 | 1,399,992 | (7) | ||||||||||||||||||||||||||||||||||||||||||||||
| 4/27/18 | 3/7/18 | 3,155 | 559,886 | (8) | ||||||||||||||||||||||||||||||||||||||||||||||||
|
| 4/27/18
|
|
| 3/7/18
|
|
| 24,291
|
|
| 177.46
|
| 839,983 | (9) | |||||||||||||||||||||||||||||||||||||||
| (1) | Reflects the date on which the grants were approved by the Compensation Committee. |
| (2) | Because Mr. Gordon commenced employment with us in September 2018, he received apro-rata 2018 award under the Global Management Incentive Plan, or GMIP, as he was not an employee when participants in the EIP were determined. Amounts shown represent his target and maximum opportunity under the GMIP afterpro-rating based on his hire date. |
| (3) | Represents awards to our NEOs made under our EIP (except for Mr. Gordon) whose award was made under our GMIP since Mr. Gordon commenced employment on September 3, 2018, and was not eligible to participate in the EIP. For our EIP participants, the “maximum” amounts shown in the table above reflect the largest possible payments under our EIP for the 2018 performance period, based onnon-Generally Accepted Accounting Principles, ornon-GAAP, net income, as defined for the EIP and reported and reconciled in Appendix B. There are no thresholds or targets under the EIP. The EIP provides that the Compensation Committee may use “negative discretion” to award any amount that does not exceed the maximum. Consistent with its practice since the EIP was approved by our stockholders, the Compensation Committee employed thepre-established Company performance goals under our GMIP, as illustrated in the table below, in determining the actual amounts awarded under the EIP in 2018. |
Our 2018 Company performance goals were financial and operating performance goals weighted as follows: (1) Deliver Results (60%)—30% Revenues and 30%Non-GAAP Net Income (as reported and reconciled in Appendix B); (2) Progress Innovative Pipeline (25%); and (3) Deliver Annual Priorities (15%). There are no payouts for below-threshold performance on any of our Company performance goals. Threshold performance on our “Progress Innovative Pipeline” goals results in 50% earned for those metrics. Certain measurements of performance for the non-financial metrics are more subjective in nature and could result in a very small payout percentage (less than 1% of an annual cash incentive award) and, as such, no threshold amounts are shown in the table. The 2018 Company performance goals derived target and maximum payout levels, which are based on a multiple of salary, are shown in the table below. Maximum performance under all of the performance metrics results in 225% of target being earned. The actual amounts awarded under our Company performance goals are based on achievement of 166.6% performance against target and |
70 ï 2019 Proxy Statement
Table of Contents
|
Executive Compensation Tables
|
|
are reported as“Non-Equity Incentive Plan Compensation” in our “Summary Compensation Table” and are shown in the table below. For a description of ourpre-established Company performance goals and the use of the GMIP in the Compensation Committee’s exercise of negative discretion see “Elements of Compensation and Specific Compensation Decisions—Annual Cash Incentive Awards” in our Compensation Discussion and Analysis. |
Estimated Possible Payouts Under Non-Equity Incentive Plan Awards($) | Non-Equity Compensation($) | |||||||||||||||||
| Name | Threshold | Target | Maximum | Actual | ||||||||||||||
Robert A. Bradway |
| — |
|
| 2,340,000 |
|
| 5,265,000 |
|
| 3,898,000 |
| ||||||
Anthony C. Hooper |
| — |
|
| 1,053,000 |
|
| 2,369,250 |
|
| 1,754,000 |
| ||||||
Murdo Gordon |
| — |
|
| 307,692 |
|
| 692,307 |
|
| 513,000 |
| ||||||
Sean E. Harper |
| — |
|
| 974,000 |
|
| 2,191,500 |
|
| 1,623,000 |
| ||||||
David W. Meline |
| — |
|
| 974,000 |
|
| 2,191,500 |
|
| 1,623,000 |
| ||||||
David M. Reese |
| — |
|
| 548,154 |
|
| 1,233,347 |
|
| 913,000 |
| ||||||
Jonathan P. Graham |
| — |
|
| 841,500 |
|
| 1,893,375 |
|
| 1,402,000 |
| ||||||
| (4) | Reflects estimated payouts regarding performance units granted during 2018 for the 2018-2020 performance period for NEOs. The number of units granted (which equals the target number of units of the award) will be multiplied by a payout percentage, which can range from 0% to 200%, to determine the number of units earned by the participant at the end of the performance period. Shares of our Common Stock will be issued on aone-for-one basis for each performance unit earned. |
For all the NEOs other than Mr. Gordon, the payout percentage for the 2018-2020 performance period is earned based on three operating measures, with the total of such operating measures ranging from 30% to 170%, which is then modified up or down by up to 30 percentage points based on our relative TSR performance ranking. The operating measures are: (1) annualnon-GAAP earnings per share for 2018, 2019, and 2020; (2) annualnon-GAAP operating expense for 2018; (3) annualnon-GAAP operating margin for 2018; and (4) annualnon-GAAP return on invested capital, or ROIC, for 2019 and 2020. Each of the operating measures are measured againstpre-established goals for every year in the 2018-2020 performance period, which runs from January 1, 2018 through December 31, 2020. All goals are set at the commencement of the three-year performance period. Each applicable operating measure is weighted equally(one-third per measure for 2018 andone-half per measure for 2019 and 2020) to determine the total operating measures percentage for that year. At the end of the performance period, the final annual operating performance percentages for each of the three years are averaged to determine the score for the three-year performance period. The TSR modifier is based on how the TSR of our Common Stock ranks relative to the TSRs of the companies that are listed in the S&P 500, as defined (the Reference Group), over the period from the date of grant through the end of the performance period. If the rank of the TSR of our Common Stock equals or exceeds the 75th percentile or equals or is less than the 25th percentile, the TSR modifier increases or decreases the payout by 30 percentage points, respectively. If the TSR of our Common Stock is at the 50th percentile, the TSR modifier is zero. Linear interpolation is used to determine the TSR modifier if the rank of the TSR of our Common Stock falls between these percentiles. If our absolute TSR over the performance period is less than 0, then the modifier cannot be greater than 0. With respect to the performance units granted to Mr. Gordon, the payout percentage for the 2018-2020 performance period is computed in a similar manner as the performance unit grants to the other NEOs, except that no operating measures for 2018 are used as Mr. Gordon commenced employment with the Company late in 2018 and therefore could not significantly impact 2018 operating results. Accordingly, the payout percentage for Mr. Gordon’s performance units is earned based only on the two operating measures in effect for the 2019 and 2020 years under our 2018-2020 performance period: (1) annualnon-GAAP earnings per share; and (2) annualnon-GAAP ROIC. In addition, the relative TSR for Mr. Gordon’s 2018-2020 performance units is computed over the period from Mr. Gordon’s grant date of November 2, 2018 (instead of April 27, 2018) to December 31, 2020. |
All performance units accrue dividend equivalents deemed reinvested in shares and that are payable in shares only to the extent and when the underlying performance units are earned. For more information, see “Elements of Compensation and Specific Compensation Decisions—Long-Term Incentive Equity Awards” in our Compensation Discussion and Analysis. All 2018non-GAAP operating measures with respect to the 2018-2020 performance period discussed above are reported and reconciled in Appendix B. |
| (5) | Reflects the RSUs granted during 2018, including the annual grant of RSUs to our NEOs, RSUs granted to Mr. Gordon in connection with the commencement of his employment with the Company, and RSUs granted to Dr. Reese for his promotion to Executive Vice President, Research and Development. RSUs accrue dividend equivalents that are deemed reinvested in shares and payable only to the extent and when the underlying RSUs vest and are issued to the recipient. |
| (6) | Reflects the 2018 annual grant ofnon-qualified stock options to our NEOs. Mr. Gordon commenced employment with the Company after the 2018 annual grant and did not receivenon-qualified stock options. |
| (7) | Reflects the grant date fair values of performance units granted to our NEOs, other than Mr. Gordon, for the 2018-2020 performance period determined in accordance with ASC 718, based on the number of performance units granted multiplied by: (i) 100% which is the operating measures percentage earnout based on the probable outcomes of financial performance measures over the three-year performance period as of the grant date; and (ii) the grant date fair value per unit of $188.78, which reflects the impact of the TSR modifier of $11.32 per share, which is a market condition. The grant date fair value per unit was calculated using a payout simulation model with the following key assumptions: risk-free interest rate of 2.6%; volatility of the price of our Common Stock of 23.9%; the closing price of our Common Stock on the grant date of $177.46 per share; volatilities of the prices of the stocks of the Reference Group; and the correlations of returns of our Common Stock and the stocks of the Reference Group to simulate TSRs and their resulting impact on the payout percentages based on the contractual terms of the performance units. |
| (8) | Reflects the grant date fair values of RSUs granted during 2018 determined in accordance with ASC 718 based on the number of RSUs granted multiplied by the grant date fair values per unit of $177.46 and $187.06 on April 27 and November 2, respectively. Because these RSUs accrue dividend equivalents during the vesting period, the grant date fair value per unit equals the closing price of our Common Stock on the grant date. |
| (9) | Reflects the grant date fair values of stock options granted during 2018 determined in accordance with ASC 718 based on the number of options granted multiplied by the grant date fair value per option of $34.58. The grant date fair value of an option was determined using a Black-Scholes option valuation model with the following key assumptions: risk-free interest rate of 2.8%; expected life of 5.8 years; expected volatility of the price of our Common Stock of 24.6%; expected dividend yield of 2.9%; and the exercise price of $177.46. |
| (10) | Reflects the grant date fair value of performance units granted to Mr. Gordon for the 2018-2020 performance period determined in accordance with ASC 718, based on the number of performance units granted multiplied by: (i) 100% which is the operating measures percentage earnout based on the probable outcomes of financial |
ï 2019 Proxy Statement 71
Table of Contents
|
Executive Compensation Tables
|
|
performance measures over the three-year performance period as of the grant date; and (ii) the grant date fair value per unit of $197.75, which reflects the impact of the TSR modifier of $10.69 per share, which is a market condition. The grant date fair value per unit was calculated using a payout simulation model with the following key assumptions: risk-free interest rate of 2.9%; volatility of the price of our Common Stock of 21.6%; the closing price of our Common Stock on the grant date of $187.06 per share; volatilities of the prices of the stocks of the Reference Group; and the correlations of returns of our Common Stock and the stocks of the Reference Group to simulate TSRs and their resulting impact on the payout percentages based on the contractual terms of the performance units. |
Outstanding Equity Awards at Fiscal Year End
The following table sets forth summary information regarding the outstanding equity awards at December 31, 2018 granted to each of our NEOs.
| Option Awards | Stock Awards | |||||||||||||||||||||||||||||||
| Name | Number of Securities Underlying Unexercised Options Exercisable (#) | Number of Securities Underlying Unexercised Options Unexercisable (#) | Option Exercise Price ($/Option) | Option Expiration Date(1) | Number of Shares or Units of Stock That Have Not Vested (#)(2) | Market Value of Shares or Units of Stock That Have Not Vested ($)(3) | Equity Incentive Plan Awards: Number of Unearned Shares, Units or Other Rights That Have Not Vested (#) | Equity Incentive Plan Awards: Market or Payout Value of Unearned Shares, Units or Other Rights That Have Not Vested ($)(3) | ||||||||||||||||||||||||
Stock Options(1)
| Restricted Stock Units and Dividend Equivalents
| Performance Units and Dividend Equivalents
| ||||||||||||||||||||||||||||||
Robert A. Bradway |
|
0 |
|
|
108,444 |
|
|
177.46 |
|
|
4/27/28 |
|
|
45,042 |
|
|
8,768,326 |
| ||||||||||||||
| 0 | 130,718 | 162.60 | 5/1/27 | 67,599 | (4) | 13,159,497 | ||||||||||||||||||||||||||
| 39,528 | 80,254 | 156.35 | 5/3/26 | 70,361 | (5) | 13,697,176 | ||||||||||||||||||||||||||
| 73,500 | 0 | 54.69 | 4/25/21 | 50,557 | (6) | 9,841,931 | ||||||||||||||||||||||||||
| 127,000 | 0 | 58.43 | 4/26/20 | |||||||||||||||||||||||||||||
Anthony C. Hooper | 0 | 34,702 | 177.46 | 4/27/28 | 15,178 | 2,954,701 | 21,631 | (4) | 4,210,907 | |||||||||||||||||||||||
| 0 | 43,572 | 162.60 | 5/1/27 | 23,453 | (5) | 4,565,596 | ||||||||||||||||||||||||||
| 14,373 | 29,184 | 156.35 | 5/3/26 | 18,384 | (6) | 3,578,813 | ||||||||||||||||||||||||||
Murdo Gordon | 0 | 0 | 34,448 | 6,705,992 | 35,642 | (4) | 6,938,428 | |||||||||||||||||||||||||
Sean E. Harper | 0 | 34,702 | 177.46 | 1/4/24 | 14,084 | 2,741,732 | 21,631 | (4) | 4,210,907 | |||||||||||||||||||||||
| 0 | 40,305 | 162.60 | 1/4/24 | 21,693 | (5) | 4,222,976 | ||||||||||||||||||||||||||
| 12,576 | 25,536 | 156.35 | 1/4/24 | 16,086 | (6) | 3,131,462 | ||||||||||||||||||||||||||
David W. Meline | 0 | 34,702 | 177.46 | 4/27/28 | 13,826 | 2,691,507 | 21,631 | (4) | 4,210,907 | |||||||||||||||||||||||
| 0 | 38,126 | 162.60 | 5/1/27 | 20,521 | (5) | 3,994,823 | ||||||||||||||||||||||||||
| 12,576 | 25,536 | 156.35 | 5/3/26 | 16,086 | (6) | 3,131,462 | ||||||||||||||||||||||||||
David M. Reese | 0 | 7,807 | 177.46 | 4/27/28 | 21,229 | 4,132,649 | 4,865 | (4) | 947,070 | |||||||||||||||||||||||
| 0 | 8,714 | 162.60 | 5/1/27 | 4,690 | (5) | 913,002 | ||||||||||||||||||||||||||
| 2,874 | 5,837 | 156.35 | 5/3/26 | 3,676 | (6) | 715,607 | ||||||||||||||||||||||||||
| 2,300 | 0 | 54.69 | 4/25/21 | |||||||||||||||||||||||||||||
| 1,480 | 0 | 58.43 | 4/26/20 | |||||||||||||||||||||||||||||
Jonathan P. Graham | 0 | 24,291 | 177.46 | 4/27/28 | 22,029 | 4,288,385 | 15,142 | (4) | 2,947,693 | |||||||||||||||||||||||
| 0 | 27,233 | 162.60 | 5/1/27 | 14,658 | (5) | 2,853,473 | ||||||||||||||||||||||||||
| 8,264 | 16,781 | 156.35 | 5/3/26 | 10,570 | (6) | 2,057,662 | ||||||||||||||||||||||||||
| (1) | In general, stock options expire on the tenth anniversary of their grant date. If a retirement-eligible staff member retires, their stock options continue to vest and expire on the earlier of: (i) the fifth anniversary of their retirement date; or (ii) the end of the grant term. No stock options were granted to NEOs during 2012 through 2015. |
72 ï 2019 Proxy Statement
Table of Contents
|
Executive Compensation Tables
|
|
| (2) | The following table shows the vesting of RSUs and related accrued dividend equivalents (rounded down to the nearest whole number of units) outstanding as of December 31, 2018. RSUs accrue dividends that are deemed reinvested in shares and payable only when and to the extent the underlying RSUs vest and are issued to the participant. |
| Granted on | ||||||||||||||||||||||||
| Name | November 2, 2017(a) | April 27 2018(b) | May 1, 2017(b) | May 3, 2016(c) | August 4, 2015(d) | January 30, 2015(e) | ||||||||||||||||||
Robert A. Bradway |
| 0 |
|
| 14,381 |
|
| 15,480 |
|
| 10,144 |
|
| 0 |
|
| 5,037 |
| ||||||
Anthony C. Hooper |
| 0 |
|
| 4,602 |
|
| 5,160 |
|
| 3,688 |
|
| 0 |
|
| 1,728 |
| ||||||
Murdo Gordon |
| 34,448 |
|
| 0 |
|
| 0 |
|
| 0 |
|
| 0 |
|
| 0 |
| ||||||
Sean E. Harper |
| 0 |
|
| 4,602 |
|
| 4,773 |
|
| 3,228 |
|
| 0 |
|
| 1,481 |
| ||||||
David W. Meline |
| 0 |
|
| 4,602 |
|
| 4,515 |
|
| 3,228 |
|
| 0 |
|
| 1,481 |
| ||||||
David M. Reese |
| 12,918 |
|
| 1,035 |
|
| 6,192 |
|
| 738 |
|
| 0 |
|
| 346 |
| ||||||
Jonathan P. Graham |
| 0 |
|
| 3,221 |
|
| 3,225 |
|
| 2,121 |
|
| 13,462 |
|
| 0 |
| ||||||
| (a) | With respect to Mr. Gordon, RSUs are scheduled to vest at a rate of approximately 35%, 35%, and 30% on the first, second, and third anniversary of the grant date, respectively. With respect to Dr. Reese, RSUs are scheduled to vest at a rate of approximately 33%, 33%, and 34% on the second, third, and fourth anniversaries of the grant date, respectively. |
| (b) | Scheduled to vest at a rate of approximately 33%, 33%, and 34% on the second, third, and fourth anniversaries of the grant date, respectively. |
| (c) | Scheduled to vest in approximately equal installments on each of the third and fourth anniversaries of the grant date. |
| (d) | Scheduled to vest on the fourth anniversary of the grant date. |
| (e) | All units vested on January 30, 2019. |
| (3) | The market values of RSUs and performance units (and related dividend equivalents) were calculated by multiplying the number of RSUs outstanding or the number of performance units as determined in accordance with Securities and Exchange Commission, or SEC, rules and footnotes 4 through 6 below, as applicable, by the closing price of our Common Stock on December 31, 2018 ($194.67). |
| (4) | Reflects the sum of the number of performance units granted for the 2018–2020 performance period (January 1, 2018 to December 31, 2020) and the related dividend equivalents accrued through December 31, 2018, multiplied by the maximum payout percentage of 200%. As required by SEC rules, the maximum payout percentage is disclosed in the table since the estimated payout percentage as of December 31, 2018, based on the sum of: (1) the estimated outcomes of our operating measures to be achieved; and (2) the TSR modifier based on our TSR percentile rank relative to the TSRs of the companies in the Reference Group for the period from the April 27, 2018 grant date (the November 2, 2018 grant date with respect to Mr. Gordon) to December 31, 2018, exceeds the target payout of 100% of the performance units granted. The number of dividend equivalents multiplied by the 200% payout percentage (rounded down to the nearest whole number of units) included in the table above are as follows: 1,385 units for Mr. Bradway; 443 units for Messrs. Hooper and Meline and Dr. Harper; 244 units for Mr. Gordon; 99 units for Dr. Reese; and 310 units for Mr. Graham. Dividend equivalents are only paid when and to the extent the underlying performance units are earned. |
| (5) | Reflects the sum of the number of performance units granted for the 2017–2019 performance period (January 1, 2017 to December 31, 2019) and the related dividend equivalents accrued through December 31, 2018, multiplied by the maximum payout percentage of 200%. As required by SEC rules, the maximum payout percentage is disclosed in the table since the estimated payout percentage as of December 31, 2018, based on the sum of: (1) the estimated outcomes of our operating measures to be achieved; and (2) the TSR modifier based on our TSR percentile rank relative to the TSRs of the companies in the Reference Group for the period from the May 1, 2017 grant date to December 31, 2018, is greater than the target payout of 100% of the performance units granted. The number of dividend equivalents multiplied by the 200% payout percentage (rounded down to the nearest whole number of units) included in the table above are as follows: 3,275 units for Mr. Bradway; 1,091 units for Mr. Hooper; 1,009 units for Dr. Harper; 955 units for Mr. Meline; 218 units for Dr. Reese; and 682 units for Mr. Graham.Dividend equivalents are only paid when and to the extent the underlying performance units are earned. |
| (6) | Reflects the number of performance units granted for the 2016-2018 performance period (January 1, 2016 to December 31, 2018) and related dividend equivalents accrued through December 31, 2018, multiplied by the payout percentage of 145.7%, which is the relative TSR percentage multiplier based on our TSR percentile rank relative to the TSRs of the companies in the Reference Group for the period from the May 3, 2016 grant date to December 31, 2018. The number of dividend equivalents multiplied by the 145.7% payout percentage noted above (rounded down to the nearest whole number of units) included in the table above are as follows: 3,575 units for Mr. Bradway; 1,300 units for Mr. Hooper; and 1,137 units for Dr. Harper and Mr. Meline; 259 units for Dr. Reese; and 747 units for Mr. Graham. Since these performance units were paid in 2019, they will be reflected in the Option Exercise and Stock Vested table in next year’s proxy statement. |
The estimated payouts of the performance units described above are disclosed in the limited context of our executive compensation program and should not be understood to be statements of our expectations of our stock price or estimates of results or other guidance. We specifically caution investors not to apply these statements to other contexts.
ï 2019 Proxy Statement 73
Table of Contents
|
Executive Compensation Tables
|
|
Option Exercises and Stock Vested
The following table summarizes the exercise of options, the vesting of RSUs, and the payment of performance units earned for the 2015-2017 performance period (and related dividend equivalents, as applicable) for each of our NEOs during the year ended December 31, 2018. The RSUs and performance units vested and converted to one share of our Common Stock for each vested RSU and performance unit. The 2015-2017 performance units had a performance period from January 30, 2015 through January 30, 2018 and became payable as shares upon certification by our Compensation Committee in March 2018.
| Option Awards | Stock Awards | |||||||||||||||
| Name | Number of Securities Acquired on Exercise (#) | Value Realized on Exercise ($)(1) | Number of Shares Acquired on Vesting (#) | Value Realized on Vesting ($)(2) | ||||||||||||
Robert A. Bradway |
| 0 |
|
| 0 |
|
| 67,046 |
|
| 11,963,052 |
| ||||
Anthony C. Hooper |
| 0 |
|
| 0 |
|
| 23,050 |
|
| 4,111,504 |
| ||||
Murdo Gordon |
| 0 |
|
| 0 |
|
| 0 |
|
| 0 |
| ||||
Sean E. Harper |
| 37,000 |
|
| 5,305,445 |
|
| 20,055 |
|
| 3,580,745 |
| ||||
David W. Meline |
| 0 |
|
| 0 |
|
| 33,065 |
|
| 6,147,655 |
| ||||
David M. Reese |
| 1,260 |
|
| 164,304 |
|
| 4,550 |
|
| 804,845 |
| ||||
Jonathan P. Graham |
| 0 |
|
| 0 |
|
| 14,302 |
|
| 2,802,780 |
| ||||
| (1) | The value shown is based on the stock options exercised multiplied by the difference between the price at which they were valued on the date of exercise and stock option exercise price. |
| (2) | The value shown is the closing price of a share of our Common Stock on the business days immediately prior to the vesting dates of RSUs and to the payment date for the performance units, as applicable, multiplied by the number of units vested/paid, including cash received in lieu of fractional dividend equivalents. |
Nonqualified Deferred Compensation
The following table sets forth summary information regarding aggregate contributions to and account balances under our SRP and NDCP for, and as of, the year ended December 31, 2018. There were no withdrawals by any of the NEOs in 2018.
| Name |
2018 Employee Contributions ($)(1) |
2018 Company Contributions ($)(2) |
2018 Earnings (Losses) ($)(3) |
Balance as of 12/31/18 | ||||||||||||
Robert A. Bradway |
| 402,450 |
|
| 396,800 |
|
| (330,808 | ) |
| 12,901,937 |
| ||||
Anthony C. Hooper |
| 201,250 |
|
| 198,500 |
|
| (75,640 | ) |
| 2,145,669 |
| ||||
Murdo Gordon |
|
0 |
| 1,003,269 | (2) | (63,041 | ) | 940,228 | ||||||||
Sean E. Harper |
| 0 |
|
| 181,500 |
|
| (204,789 | ) |
| 3,254,878 |
| ||||
David W. Meline |
| 111,600 |
|
| 181,500 |
|
| (237,215 | ) |
| 5,742,903 |
| ||||
David M. Reese |
| 0 |
|
| 76,019 |
|
| (42,074 | ) |
| 842,508 |
| ||||
Jonathan P. Graham |
| 89,904 |
|
| 151,800 |
|
| (155,770 | ) |
| 2,887,036 |
| ||||
| (1) | Reflects the portions of the annual cash incentive awards deferred and contributed to the NDCP in the amount of $402,450, $100,000, and $111,600 by Messrs. Bradway, Hooper, and Meline, respectively, that were included in the“Non-Equity Incentive Plan Compensation” column of the “Summary Compensation Table” in 2017, the year they were earned. Also reflects a portion of salaries deferred and contributed to the NDCP in the amount of $101,250 and $89,904 by Messrs. Hooper and Graham, respectively, that were included in the “Salary” column of the “Summary Compensation Table” in 2018, the year they were earned. |
| (2) | Reflects credits to the SRP. To compensate for Mr. Gordon’s forfeiture of certain pension benefits at his previous employer, Mr. Gordon was provided with a $1,000,000 Company contribution to his NDCP in connection with his initial hiring. The SRP vests on the third anniversary of Mr. Gordon’s hire date. The NDCP vests in approximately equal installments of 33% on the first and second anniversaries and 34% on the third anniversary of his hire date, subject to continued employment with us through such dates, and which are included in the “All Other Compensation” column of the “Summary Compensation Table.” |
| (3) | Reflects earnings (losses) in the NDCP and SRP for 2018. |
| (4) | Reflects balances in the NDCP and SRP on December 31, 2018. All amounts are vested, except amounts with respect to: $936,942, $869,657, and $916,262 for Mr. Gordon, Mr. Meline, and Mr. Graham, respectively, related to Company contributions in their NDCP accounts and related earnings and losses and $3,286 for Mr. Gordon related to Company contributions and related gains and losses to his SRP account. These balances include the following aggregate amounts that are reported as compensation in this proxy statement in the “Summary Compensation Table” in 2018, 2017, and 2016: $1,802,927 for Mr. Bradway; $1,043,211 for Mr. Hooper; $1,003,269 for Mr. Gordon; $617,008 for Dr. Harper; $1,063,809 for Mr. Meline; $76,019 for Dr. Reese; and $547,112 for Mr. Graham. |
74 ï 2019 Proxy Statement
Table of Contents
|
Executive Compensation Tables
|
|
General Provisions of the Supplemental Retirement Plan and Nonqualified Deferred Compensation Plan
The SRP is designed to provide a “make-whole” benefit to 401(k) Plan participants who have eligible compensation in excess of the Internal Revenue Code’s qualified plan compensation limit. The Company credits to the SRP a 10% contribution on such compensation to represent the equivalent percentage of Company contributions that would have been made to the 401(k) Plan if the compensation had been eligible for deferral into the 401(k) Plan. For the same reason, the Company also credits to the SRP a 10% contribution on amounts deferred into the NDCP. No “above market” crediting rates are offered under the SRP and employee contributions are not permitted.
The SRP and the NDCP are unfunded plans for tax purposes and for purposes of Title I of the Employee Retirement Income Security Act of 1974, as amended. Deferred amounts are our general unsecured obligations and are subject to ouron-going financial solvency. We have established a grantor trust (aso-called “rabbi” trust) for the purpose of accumulating funds to assist us in satisfying our obligations under the NDCP. Earnings on amounts contributed to our SRP and NDCP, like our 401(k) Plan, are based on participant selections among the investment
options selected by a committee of our executives. This committee has the sole discretion to discontinue, substitute, or add investment options at any time. Participants can select from among these investment options for purposes of determining the earnings or losses that we will credit to their plan accounts, but they do not have an ownership interest in the investment options they select. Unlike our 401(k) Plan, we do not offer the opportunity to invest through a brokerage window or in our Common Stock under our NDCP or SRP. The investment options in the NDCP and the SRP also differ in that they include six portfolios based on different target retirement dates, referred to as “Target Retirement Portfolios,” that have been created for use as default investment options. The investment options during 2018 are described in the subsection “Investment Options Under the Supplemental Retirement Plan and Nonqualified Deferred Compensation Plan” below. Invested credits can be transferred among available plan investment options on any business day and effective at the close of business on that day (subject to the time of the request and the market being open).
Retirement and Savings Plan and Supplemental Retirement Plan
Our 401(k) Plan is a qualified plan that is available to regular U.S.-based staff members of the Company and participating subsidiaries. All 401(k) Plan participants, including our NEOs, are eligible to receive the same proportionate level of matching and nonelective or “core” contributions from us. Company contributions on eligible compensation earned above the Internal Revenue Code qualified plan compensation limit and on amounts that were deferred to the NDCP are credited to our SRP, a nonqualified plan that is available to all 401(k) Plan eligible staff members.
Contributions. We make a core contribution of 5% of eligible compensation to all regular U.S.-based staff members under the 401(k) Plan, regardless of whether the staff members elect to defer any of their compensation to the 401(k) Plan. In addition, under the 401(k) Plan, participants are eligible to receive matching contributions of up to 5% of their eligible compensation that they contribute to the 401(k) Plan. Under our SRP, we credit 10% of each participant’s eligible compensation in excess of the maximum recognizable compensation limit for qualified plans, which equals the combined percentage of our core contributions and maximum matching contributions under our 401(k) Plan. We also credit 10% of each participant’s compensation that is not eligible for deferral into our 401(k) Plan because the participant deferred it to the NDCP.
Distributions. Participants receive distributions from the SRP following their termination of employment. Distributions for most participants are made in a lump sum payment in the first or second year following termination of employment, or, for balances in excess of a de minimis amount, in installments that commence in the year following termination. For our NEOs, Section 409A of the Internal Revenue Code generally requires that their distributions may not occur earlier than six months following our NEO’s termination of employment.
Vesting. Participants in the 401(k) Plan are immediately vested in participant and Company contributions and related earnings and losses on such amounts. Participants in the SRP are immediately vested in contributions that are made with respect to amounts the participants deferred under the NDCP and related earnings and losses on such amounts, and are fully vested in the remainder of their accounts upon the earlier of: (i) three continuous years of their service to us; (ii) termination of their employment on or after their normal retirement date (as defined in the 401(k) Plan); (iii) their disability (as defined in the 401(k) Plan); (iv) their death; or (v) a change of control and termination of their employment as described below in “Potential Payments Upon Termination or Change of Control—Change of Control Severance Plan.”
Nonqualified Deferred Compensation Plan
Our NDCP allows participants to defer receipt of a portion of their eligible compensation to a future date, with an opportunity to earntax-deferred returns on the deferrals. Members of our Board of Directors, or Board, and our U.S.- and Puerto Rico-based staff members at the director level or above, who include our NEOs, are eligible to participate in this plan. Our NEOs may participate in this plan on the same basis as the other participants in the plan.
Contributions. Participants who are staff members may elect to defer up to a maximum of 50% of their eligible base salary, up to a maximum of 100% of their annual cash incentive award, and up to 100% of sales commissions.Non-employee members of our Board may defer all or a portion of their fees, including retainers and meeting fees. In addition, we may, in our sole discretion, contribute additional amounts to any
ï 2019 Proxy Statement 75
Table of Contents
|
Executive Compensation Tables
|
|
participant’s account at any time, such as contributingsign-on bonuses to the accounts of newly-hired staff members or for retention purposes.
Distributions. Participants may elect to receive distributions as a lump sum or, for balances in excess of a de minimis amount, in annual installments for up to ten years. For most participants, distributions commence in the first or second year following the participant’s termination of employment. For our NEOs, Section 409A of the Internal Revenue Code generally requires that distributions may not occur earlier than six months following our NEO’s termination of employment. Participants may also elect to receive anin-service distribution of an elective deferral (called a short-term deferral) that is paid no earlier than three full years after the end of the plan year in which the deferral was made. Participants may also petition for a distribution due to an unforeseeable financial hardship.
Vesting. Participants are at all times 100% vested in the amounts that they elect to defer and related earnings and losses on such amounts. As part of his initial hire package, and to replace the forfeiture of certain pension benefits at his former employer, we contributed $1 million to Mr. Gordon’s NDCP account. This contribution and related earnings and losses thereon vest at the rate of 33%, 33%, and 34% per
year on the anniversary of his hire date in 2019, 2020, and 2021, respectively, as long as Mr. Gordon remains continuously employed by us, which vesting accelerates upon a change of control consistent with the terms of the NDCP. As part of his initial hire package, and to replace the forfeiture of certain pension benefits at his former employer, we contributed $1.6 million to Mr. Meline’s NDCP account. This contribution and related earnings and losses thereon vest at the rate of 12.5% per year from 2015 through 2022 as long as Mr. Meline remains continuously employed by us, which vesting accelerates upon a change of control consistent with the terms of the NDCP. As part of his initial hire package and to replace forfeiture of certain benefits at his former employer and to induce Mr. Graham to accept the Company’s offer of employment, Mr. Graham was provided with a contribution to his NDCP account of $2 million. This contribution and related earnings and losses thereon vest at the rate of 20% per year from 2016 through 2020 as long as Mr. Graham remains actively and continuously employed by us, which vesting accelerates upon death, disability, termination of employment not for cause, or a change of control consistent with the terms of the NDCP.
Investment Options Under the Supplemental Retirement Plan and Nonqualified Deferred Compensation Plan
The investment options under the SRP and the NDCP and their annual rates of return for 2018 are contained in the tables below. The 401(k) Plan offers the same investment options as the SRP and the NDCP except: (i) the 401(k) Plan also allows investments in our Common Stock (no more than 20%) and offers a brokerage window; and (ii) the 401(k) Plan does not offer the six portfolios based on different target retirement dates, referred to as “Target Retirement Portfolios” below.
The Target Retirement Portfolios are designed to provide anall-in-one investment option for creating a diversified portfolio. Each portfolio is an asset allocation strategy built around a combination of investments from the plan’s investment options (provided below) and is adjusted over time to gradually become more conservative as the target maturity date of the portfolio approaches. We retain the right to change, at our discretion, the available investment options.
| Name of Investment Option | Rate of Return for 2018 | Name of Investment Option | Rate of Return for 2018 | |||||||
Amgen Target Retirement Portfolio Income |
| (3.11)% |
| Large Cap Value |
| (6.58)% |
| |||
Amgen Target Retirement Portfolio 2020 |
| (3.50)% |
| Large Cap Index |
| (4.42)% |
| |||
Amgen Target Retirement Portfolio 2030 |
| (4.73)% |
| Large Cap Growth |
| 1.51% |
| |||
Amgen Target Retirement Portfolio 2040 |
| (6.88)% |
| Small-Mid Cap Value |
| (18.60)% |
| |||
Amgen Target Retirement Portfolio 2050 |
| (7.97)% |
| Small-Mid Cap Index |
| (9.53)% |
| |||
Amgen Target Retirement Portfolio 2060 |
| (12.11)% | * | Small-Mid Cap Growth |
| 0.16% |
| |||
Capital Preservation |
| 2.19% |
| International Value |
| (12.96)% |
| |||
Fixed Income Index |
| 0.00% |
| International Index |
| (13.82)% |
| |||
Fixed Income |
| 0.38% |
| International Growth |
| (10.79)% |
| |||
High Yield |
| (1.92)% |
| Emerging Markets |
| (10.23)% |
| |||
Inflation-Protection |
| (1.32)% |
| REIT Index |
| (5.83)% |
| |||
| * | Inception to date. |
76 ï 2019 Proxy Statement
Table of Contents
|
Executive Compensation Tables
|
|
Potential Payments Upon Termination or Change of Control
Change of Control Severance Plan
Our Amended and Restated Change of Control Severance Plan, or Change of Control Severance Plan, provides a lump sum payment and certain other benefits for each participant in the plan who separates from employment with us in connection with a change of control. Our Compensation Committee periodically reviews the terms of the Change of Control Severance Plan, which was originally adopted in 1998, to ensure it is aligned with current governance best practices. No taxgross-up payments are provided under the Change of Control Severance Plan.
If a change of control occurs and a participant’s employment is terminated by us other than for cause or disability or by the participant for good reason within two years after the change of control, a participant under the Change of Control Severance Plan would be entitled to:
| • | a lump sum cash payment in an amount equal to: |
| - | the product of: |
| • | a benefits multiple of one or two based on the participant’s position (each of our NEOs has a benefits multiple of two); and |
| • | the sum of (i) the participant’s annual base salary immediately prior to termination or, if higher, immediately prior to the change of control, plus (ii) the participant’s targeted annual cash incentive award for the year in which the termination occurs; |
| • | if, as a result of the participant’s termination of employment, the participant becomes entitled to, and timely elects to continue, healthcare (including any applicable vision benefits) and/or dental coverage under Consolidated Omnibus Budget Reconciliation Act of 1985, or COBRA, Company-paid group health and dental insurance continuation coverage for the participant and his or her dependents under COBRA until the earlier of (i) the expiration of a participant’s eligibility for coverage under COBRA, or (ii) the expiration of the18-month period immediately following the participant’s termination (whichever occurs earlier); |
| • | fully-vested benefits accrued under our 401(k) Plan and our SRP; |
| • | either alump-sum cash payment or a contribution to our SRP, as determined by us in our sole discretion, in an amount equal to the sum of (1) the product of $2,500 and the participant’s benefits multiple, and (2) the product of (x) 10%, (y) the sum of (i) the participant’s annual base salary as in effect immediately prior to the participant’s termination or, if higher, as in effect immediately prior to the change of control, plus (ii) the participant’s targeted annual cash incentive award for the year in which the termination occurs (which equals the participant’s annual base salary multiplied by the participant’s target annual cash incentive award percentage, each as in effect immediately prior to the termination or, if higher, as in |
effect immediately prior to the change of control), and (z) the benefits multiple; and |
| • | indemnification and, if applicable, directors’ and officers’ liability insurance provided by us for four years following the participant’s termination (each of our NEOs would receive such liability insurance benefits, which would result in no additional cost to us). |
If all payments or benefits received under the Change of Control Severance Plan or any other plan, arrangement, or agreement would cause the participant to be subject to excise tax, then the payments will be reduced to the extent necessary to avoid the excise tax, provided that the reduced payments, net of federal, state, and local income taxes, are greater than the payments without such reduction, net of federal, state, and local income taxes, and excise tax.
The plan provides that the benefits described above would be provided in lieu of any other severance benefits that may be payable by us (other than accrued vacation and similar benefits otherwise payable to all staff members upon a termination). The plan also provides that the benefits described above may be forfeited if the participant discloses our confidential information or solicits or offers employment to any of our staff members during a period of years equal to the participant’s benefits multiple following the participant’s termination.
The plan is subject to automaticone-year extensions unless we notify participants no later than November 30 that the term will not be extended. If a change of control occurs during the term of the plan, the plan will continue in effect for at least 24 months following the change of control. Prior to a change of control, we can amend the plan at any time. After a change of control, the plan may not be terminated or amended in any way that adversely affects a participant’s interests under the plan, unless the participant consents in writing.
During 2018, Mr. Hooper and Dr. Harper continued to remain as participants in the Change of Control Severance Plan following their change in positions from Executive Vice Presidents tonon-executive employees in anticipation of their retirements.
“Change of Control” is defined in the plan as the occurrence of any of the following:
| • | any person, entity, or group has acquired beneficial ownership of 50% or more of (i) our then outstanding common shares, or (ii) the combined voting power of our then outstanding securities entitled to vote in the election of directors; |
| • | individuals making up the incumbent Board (as defined in the plan) cease for any reason to constitute at least a majority of our Board; |
| • | immediately prior to our consummation of a reorganization, merger, or consolidation with respect to which persons who were the stockholders of the Company immediately prior to such transaction do not, immediately thereafter, own more than 50% of the then |
ï 2019 Proxy Statement 77
Table of Contents
|
Executive Compensation Tables
|
|
outstanding shares of the reorganized, merged, or consolidated company entitled to vote generally in the election of directors; |
| • | a liquidation or dissolution of the Company or the sale of all or substantially all of the assets of the Company; or |
| • | any other event which the incumbent Board (as defined in the plan), in its sole discretion, determines is a change of control. |
“Cause” is defined in the plan as (i) conviction of a felony or (ii) engaging in conduct that constitutes willful gross neglect or willful gross misconduct in carrying out the participant’s duties, resulting in material economic harm to us, unless the participant believed in good faith that the conduct was in, or not contrary to, our best interests.
“Disability” under the plan is determined based on our long-term disability plan as is in effect immediately prior to a change of control.
“Good reason” is defined in the plan as (i) an adverse and material diminution of a participant’s authority, duties, or responsibilities, (ii) a material reduction in a participant’s base salary, (iii) an increase in a participant’s daily commute by more than 100 miles roundtrip, or (iv) any other action or inaction by the Company that constitutes a material breach of the agreement under which the participant provides services. In order to terminate with “good reason,” a participant must provide written notice to the Company of the existence of the condition within the required period, the Company must fail to remedy the condition within the required time period and the participant must then terminate employment within the required time period.
Long-Term Incentive Equity Awards
Stock Options and Restricted Stock Units
Our stock plans (or the related grant agreements approved for use under such stock plans) provide for accelerated vesting or continued vesting of unvested stock options and RSUs in the circumstances described below.
Double-Trigger Qualifying Termination in Connection with a Change of Control. Unvested stock options and RSUs will vest in full in connection with a Change of Control (as defined in the stock plans or related grant agreements approved for use under such stock plans) only if and when, within 24 months following the Change of Control, the grantee’s employment is involuntarily terminated other than for “cause” or “disability,” and, in the case of staff members subject to the Change of Control Severance Plan, voluntarily terminated with “good reason” (as each is defined in the grant agreements).
Death or Disability. In general, unvested stock options and RSUs granted in calendar years prior to the year death or disability occurs vest in full upon the occurrence of such event. For unvested stock options and RSUs granted in the calendar year death or disability occurs, apro-rata amount of these stock options and RSUs immediately vests based on the number of completed months of employment during the calendar year such event occurs. Under our stock plans, a disability has the same meaning as under Section 22(e)(3) of the Internal Revenue Code and occurs where the disability has been certified by either the Social Security Administration, the comparable government authority in another country with respect tonon-U.S. staff members, or an independent medical advisor appointed by us.
Retirement.In general, unvested stock options and RSUs granted in calendar years prior to the year in which an employee retires continue to vest on their original vesting schedule following the retirement of the holder if the holder has been continuously employed for at least ten years and is age 55 or older or is age 65 or older, regardless of service (a retirement-eligible participant), provided that, beginning with RSUs granted in 2018, any unvested RSUs will vest in full in the event of death following such holders’ retirement from the Company. If a retirement-eligible participant receives a grant of stock options or RSUs in the calendar year such retirement occurs, generally, the participant will vest in apro-rata amount of the award he or she would be otherwise entitled based upon the number of complete months of employment during the calendar year such retirement occurs. Holders have the lesser of five years from the date of retirement or the remaining period before expiration to exercise any vested stock options. Mr. Bradway and Drs. Harper and Reese are generally eligible to receive this benefit because each has met the above-mentioned retirement requirements.
In March 2019, the Compensation Committee approved retirement provisions for Mr. Meline’s LTI equity awards for 2019 (composed of his 2019 annual performance unit, RSU, and stock option awards) by providing that, contingent upon Mr. Meline’s continued employment through the end of the 2019 calendar year, retirement eligibility would be met for the 2019 awards at age 62. In making these determinations, the Compensation Committee took into consideration Mr. Meline’s lengthy tenure as a Chief Financial Officer of large public companies and the importance of retaining his expertise and experience.
Performance Units
Performance units are generally forfeited unless a participant is continuously employed through the last business day of the performance period. The underlying principle is that the participant needs to have been an active employee during the entire performance period in order to have contributed to the results on which the earned awards are based. Exceptions to this treatment are a termination of employment in connection with a change of control or the death, disability, or retirement of a participant.
Change of Control. Generally, with respect to grants of outstanding performance units, the performance period terminates as of the last business day of the last completed fiscal quarter preceding the change of control. The TSR market condition performance is based on: (A) our TSR performance for which our ending Common Stock price is computed on the greater of (i) the average daily closing price of our Common Stock for the last twenty (20) trading days of such shortened period, or (ii) the value of consideration paid for a share of our Common Stock in the change of control (whether such consideration is paid in cash, stock or other property, or any combination thereof); and (B) the TSR performance of the companies in the applicable reference group based on such companies’ average daily closing stock price for the last twenty (20) trading days of such shortened performance period. With respect to the operating performance measures, if the change of control occurs: (i) during the first fiscal year of the performance period, target levels of performance shall be used to calculate the payment; and (ii) subsequent to the first fiscal year of the performance period,
78 ï 2019 Proxy Statement
Table of Contents
|
Executive Compensation Tables
|
|
actual levels of performance for completed fiscal year(s) shall be used to calculate the payment. In the event of a change of control during the first six months of the performance period, however, the participant is entitled to a payment equal to an amount calculated in the manner described above, butpro-rated for the number of complete months elapsed during the shortened performance period. Change of control provisions for performance units granted to Mr. Gordon are the same as described above, except for design modifications to address Mr. Gordon’s hire date of September 3, 2018. If the change of control occurred in 2018, he would have received the grant date fair value of the award of $3.5 million (as reflected in the change in control table below). If the change of control occurs (i) in 2019, Mr. Gordon would receive an amount based on target levels of performance, and (ii) in 2020, an amount based on actual levels of performance for the first fully completed fiscal year.
Death or Disability. For all performance unit grants made in calendar years prior to the year death or disability occurs, the participant will be paid the full amount of the award he or she would be otherwise entitled to, if any, as determined at the end of the performance period. For a performance unit grant made in the calendar year in which death or disability occurs, a participant will be paid apro-rata amount of the award he or she would otherwise be entitled to, if any, as determined at the end of the performance period, based upon the number of complete months of employment in the calendar year such event occurs.
Retirement. In the event of retirement of a participant who is a retirement-eligible participant, for performance unit grants made in calendar years prior to the year in which retirement occurs, the participant will be paid the full amount of the award he or she would be otherwise entitled to, if any, as determined at the end of the performance period. If a retirement-eligible participant receives a performance unit grant in the calendar year such retirement occurs, the participant will be paid apro-rata amount of the award he or she would be otherwise entitled to, if any, as determined at the end of the performance period, based upon the number of complete months of employment during the calendar year such retirement occurs. Mr. Bradway and Drs. Harper and Reese generally are eligible to receive this benefit because each has met the above-mentioned retirement requirements.
In March 2019, the Compensation Committee approved retirement provisions for Mr. Meline’s LTI equity awards for 2019 (composed of his 2019 annual performance unit, RSU, and stock option awards) by providing that, contingent upon Mr. Meline’s continued employment through the end of the 2019 calendar year, retirement eligibility would be met for the 2019 awards at age 62. In making these determinations, the Compensation Committee took into consideration Mr. Meline’s lengthy tenure as a Chief Financial Officer of large public companies and the importance of retaining his expertise and experience.
Severance Terms in Mr. Gordon’s Offer Letter
We entered into an offer letter with Mr. Gordon in connection with his initial hiring as Executive Vice President, Global Commercial Operations, effective September 3, 2018, which provides for limited
severance benefits in the event of termination of employment by us, other than for “cause.” As discussed previously, we generally provide these terms in our offer letters with newly hired executive officers. Specifically, the offer letter provides for cash severance protection for three years following his employment date equal to two year’s annual base salary and target annual cash incentive award, plus up to 18 months of COBRA medical and dental coverage paid for by us. Benefits of this type are provided to officer-level candidates to provide an incentive to them to join our Company by reducing the risk of making such a job change. These severance benefits expire on September 3, 2021, and are payable only if Mr. Gordon is terminated other than for “cause.” For purposes of the offer letter, “cause” is defined as: (i) unfitness for service, inattention to or neglect of duties, or incompetence; (ii) dishonesty; (iii) disregard or violation of the policies or procedures of the Company; (iv) refusal or failure to follow lawful directions of the Company; (v) illegal, unethical, or immoral conduct; or (vi) breach of our Proprietary Information and Inventions Agreement.
Estimated Potential Payments
The tables below set forth the estimated current value of payments and benefits: (i) to each of our NEOs upon a change of control, upon a qualifying termination within two years following a change of control, or upon death or disability; (ii) to Mr. Bradway and Dr. Reese upon retirement; and (iii) to Mr. Gordon, upon termination without “cause.” All amounts shown in the tables below assume that the triggering events occurred on December 31, 2018 and do not include: (i) the 2016-2018 performance unit awards and the 2018 EIP payouts, which were earned as of December 31, 2018; (ii) other benefits earned during the term of our NEO’s employment that are available to all salaried staff members, such as accrued vacation; (iii) benefits paid by insurance providers under life and disability policies; and (iv) benefits previously accrued and vested under the SRP and the NDCP. For information on the accrued amounts payable under these plans, see the “Nonqualified Deferred Compensation” table above. The actual amounts of payments and benefits that would be provided can only be determined at the time of a change of control and/or the NEO’s separation from the Company. In addition, as Dr. Harper retired from the Company on January 4, 2019, the table below for Dr. Harper sets forth the estimated value of payments and benefits resulting from his retirement on that date. In accordance with SEC rules, the value of accelerated equity awards shown in the tables below was calculated using the closing price of our Common Stock on December 31, 2018 ($194.67) except with respect to Dr. Harper’s awards, which reflect the closing price of our Common Stock ($195.44) as of his actual retirement date of January 4, 2019. The amounts shown for accelerated stock options is the difference between the closing price at December 31, 2018 ($194.67) and, for Dr. Harper, January 4, 2019 ($195.44), and the exercise price of unvested stock options multiplied by the number of unvested stock options. The value per unit of accelerated RSUs and performance units, including the related accrued dividend equivalents (rounded down to the nearest whole number of units), equals the applicable closing price multiplied by the number of units and dividend equivalents vested or earned, as applicable, as a result of such event.
ï 2019 Proxy Statement 79
Table of Contents
|
Executive Compensation Tables
|
|
Estimated Payments to Robert A. Bradway
| Triggering Event | ||||||||||||||||
| Estimated Potential Payment or Benefit | Change in Control($) | Change in Control and Termination($) | Retirement($) | Death or Disability($) | ||||||||||||
Lump sum cash severance payment | 0 | 7,800,000 | 0 | 0 | ||||||||||||
Intrinsic value of accelerated unvested stock options | 0 | 9,133,781 | 9,133,781 | 9,133,781 | ||||||||||||
Intrinsic value of accelerated unvested RSUs | 0 | 8,768,326 | 8,768,326 | 8,768,326 | ||||||||||||
Value of 2018-2020 performance units | 8,553,605 | (1) | 8,553,605 | (1) | 8,546,986 | (2) | 8,546,986 | (2) | ||||||||
Value of 2017-2019 performance units | 10,834,359 | (1) | 10,834,359 | (1) | 10,567,272 | (2) | 10,567,272 | (2) | ||||||||
Continuing health care benefits for 18 months(3) | 0 | 36,923 | 0 | 0 | ||||||||||||
Continuing retirement plan contributions for two years(4) | 0 | 785,000 | 0 | 0 | ||||||||||||
Total | 19,387,964 | 45,911,994 | 37,016,365 | 37,016,365 | ||||||||||||
Estimated Payments to Anthony C. Hooper
| Triggering Event | ||||||||||||
| Estimated Potential Payment or Benefit | Change in Control($) | Change in Control and Termination($) | Death or Disability($) | |||||||||
Lump sum cash severance payment | 0 | 4,212,000 | 0 | |||||||||
Intrinsic value of accelerated unvested stock options | 0 | 3,112,906 | 3,112,906 | |||||||||
Intrinsic value of accelerated unvested RSUs | 0 | 2,954,701 | 2,954,701 | |||||||||
Value of 2018-2020 performance units | 2,737,060 | (1) | 2,737,060 | (1) | 2,734,919 | (2) | ||||||
Value of 2017-2019 performance units | 3,611,323 | (1) | 3,611,323 | (1) | 3,522,359 | (2) | ||||||
Continuing health care benefits for 18 months(3) | 0 | 25,024 | 0 | |||||||||
Continuing retirement plan contributions for two years(4) | 0 | 426,200 | 0 | |||||||||
Total | 6,348,383 | 17,079,214 | 12,324,885 | |||||||||
Estimated Payments to Murdo Gordon
| Triggering Event | ||||||||||||||||
| Estimated Potential Payment or Benefit | Change in Control($) | Change in Control and Termination($) | Termination Without Cause($)(7) | Death or Disability($) | ||||||||||||
Lump sum cash severance payment | 0 | 4,000,000 | 4,000,000 | 0 | ||||||||||||
Intrinsic value of accelerated unvested RSUs | 0 | 6,705,992 | 0 | 1,676,366 | (9) | |||||||||||
Value of 2018-2020 performance units | 3,500,000 | (1) | 3,500,000 | (1) | 0 | 912,418 | (2) | |||||||||
Continuing health care benefits for 18 months(3) | 0 | 36,923 | 36,923 | 0 | ||||||||||||
Continuing retirement plan contributions for two years(4) | 0 | 405,000 | 0 | 0 | ||||||||||||
Acceleration of unvested balance of SRP account | 0 | 3,286 | 0 | 3,286 | ||||||||||||
Acceleration of unvested balance of DCP account | 936,942 | 936,942 | 936,942 | 936,942 | ||||||||||||
Total | 4,436,942 | 15,588,143 | 4,973,865 | 3,529,012 | ||||||||||||
80 ï 2019 Proxy Statement
Table of Contents
|
Executive Compensation Tables
|
|
Estimated Payments to Sean E. Harper(10)
| Triggering Event | ||||
| Estimated Potential Payment or Benefit | Retirement($) | |||
Intrinsic value of accelerated unvested stock options |
| 2,945,760 |
| |
Intrinsic value of accelerated unvested RSUs |
| 2,752,578 |
| |
Value of 2018-2020 performance units |
| 2,745,737 |
| |
Value of 2017-2019 performance units |
| 3,270,884 |
| |
Total |
| 11,714,959 |
| |
Estimated Payments to David W. Meline
| Triggering Event | ||||||||||||
| Estimated Potential Payment or Benefit | Change in Control($) | Change in Control and Termination($) | Death or Disability($) | |||||||||
Lump sum cash severance payment |
| 0 |
|
| 3,896,000 |
|
| 0 |
| |||
Intrinsic value of accelerated unvested stock options |
| 0 |
|
| 2,798,462 |
|
| 2,798,462 |
| |||
Intrinsic value of accelerated unvested RSUs |
| 0 |
|
| 2,691,507 |
|
| 2,691,507 |
| |||
Value of 2018-2020 performance units |
| 2,737,060 | (1) |
| 2,737,060 | (1) |
| 2,734,919 | (2) | |||
Value of 2017-2019 performance units |
| 3,159,883 | (1) |
| 3,159,883 | (1) |
| 3,082,015 | (2) | |||
Continuing health care benefits for 18 months(3) |
| 0 |
|
| 36,923 |
|
| 0 |
| |||
Continuing retirement plan contributions for two years(4) |
| 0 |
|
| 394,600 |
|
| 0 |
| |||
Acceleration of unvested balance of DCP account |
| 835,142 | (5) |
| 835,142 | (5) |
| 0 |
| |||
Total |
| 6,732,085 |
|
| 16,549,577 |
|
| 11,306,903 |
| |||
Estimated Payments to David M. Reese
| Triggering Event | ||||||||||||||||
| Estimated Potential Payment or Benefit | Change in Control($) | Change in Control and Termination($) | Retirement($) | Death or Disability($) | ||||||||||||
Lump sum cash severance payment |
| 0 |
|
| 2,880,400 | (6) |
| 0 |
|
| 0 |
| ||||
Intrinsic value of accelerated unvested stock options |
| 0 |
|
| 637,490 |
|
| 637,490 |
|
| 637,490 |
| ||||
Intrinsic value of accelerated unvested RSUs |
| 0 |
|
| 4,132,649 |
|
| 613,573 | (8) |
| 4,132,649 |
| ||||
Value of 2018-2020 performance units |
| 615,547 | (1) |
| 615,547 | (1) |
| 615,157 | (2) |
| 615,157 | (2) | ||||
Value of 2017-2019 performance units |
| 722,226 | (1) |
| 722,226 | (1) |
| 704,316 | (2) |
| 704,316 | (2) | ||||
Continuing health care benefits for 18 months(3) |
| 0 |
|
| 36,923 |
|
| 0 |
|
| 0 |
| ||||
Continuing retirement plan contributions for two years(4) |
| 0 |
|
| 347,000 |
|
| 0 |
|
| 0 |
| ||||
Total |
| 1,337,773 |
|
| 9,372,235 |
|
| 2,570,536 |
|
| 6,089,612 |
| ||||
ï 2019 Proxy Statement 81
Table of Contents
|
Executive Compensation Tables
|
|
Estimated Payments to Jonathan P. Graham
| Triggering Event | ||||||||||||
| Estimated Potential Payment or Benefit | Change in Control($) | Change in Control and Termination($) | Death or Disability($) | |||||||||
Lump sum cash severance payment |
| 0 |
|
| 3,553,000 |
|
| 0 |
| |||
Intrinsic value of accelerated unvested stock options |
| 0 |
|
| 1,934,458 |
|
| 1,934,458 |
| |||
Intrinsic value of accelerated unvested RSUs |
| 0 |
|
| 4,288,385 |
|
| 4,288,385 |
| |||
Value of 2018-2020 performance units |
| 1,915,942 | (1) |
| 1,915,942 | (1) |
| 1,914,385 | (2) | |||
Value of 2017-2019 performance units |
| 2,257,004 | (1) |
| 2,257,004 | (1) |
| 2,201,328 | (2) | |||
Continuing health care benefits for 18 months(3) |
| 0 |
|
| 36,923 |
|
| 0 |
| |||
Continuing retirement plan contributions for two years(4) |
| 0 |
|
| 360,300 |
|
| 0 |
| |||
Acceleration of unvested balance of DCP account |
| 916,262 |
|
| 916,262 |
|
| 916,262 |
| |||
Total |
| 5,089,208 |
|
| 15,262,274 |
|
| 11,254,818 |
| |||
| (1) | In the event of a change of control occurring after the first six months of the 2018-2020 performance period, other than for performance units granted to Mr. Gordon, the number of performance units that would have been earned is the sum of the number of performance units granted and related dividend equivalents accrued through December 31, 2018, multiplied by a payout percentage of 130%, which employs the plan dictated target level of performance for the operating performance measures of 100% modified up by 30 percentage points by the TSR modifier which is based on our TSR percentile rank relative to the TSRs of the companies in the Reference Group for the period from the April 27, 2018 grant date through September 30, 2018, the last business day of the last fiscal quarter before the change in control. With respect to Mr. Gordon’s grant of performance units for the 2018-2020 performance period, in the event of a change in control that occurs during 2018, he is entitled to the grant value of the award of $3,500,000. |
In the event of a change of control occurring during the second year of the 2017-2019 performance period, the number of performance units that would have been earned is the sum of the number of performance units granted and related dividend equivalents accrued through December 31, 2018, multiplied by a payout percentage of 158.2%, which is the percentage based on the estimated outcomes of our operating performance measures achieved during the first year of the performance period of 118.4% increased by the TSR modifier by 39.8 percentage points based on our TSR percentile rank relative to the TSRs of the companies in the Reference Group for the period from the May 1, 2017 grant date to September 30, 2018, the last business day of the last fiscal quarter before the change in control. |
Our TSRs for purposes of determining the payout percentages of these awards would be based on the higher of: (i) the average closing price of our Common Stock for the last 20 trading days of the shortened performance period ended on September 30, 2018; and (ii) the value of consideration the acquirer paid for a share of our Common Stock in the change of control. For purposes of the payout values shown in the tables, the TSRs for our Common Stock were based on the respective actual TSRs over the respective averaging periods ending September 30, 2018 the last business day of the last fiscal quarter before the change in control. The resulting number of units that would have been so earned was multiplied by $194.67, the closing price of our Common Stock on December 31, 2018. |
For information on the actual number of units to be earned for these performance unit grants, see “Elements of Compensation and Specific Compensation Decisions—Long-Term Incentive Equity Awards” in our Compensation Discussion and Analysis. |
| (2) | In the event death or disability occurs, the participant is entitled to the number of performance units that would have been earned by the NEO if he had remained employed for the entire performance period. For purposes of the payout values shown in the tables, the number of units that would have been earned was multiplied by $194.67, the closing price of our Common Stock on December 31, 2018. |
For the 2018-2020 performance period for NEOs other than Mr. Gordon, the number of performance units that would have been earned is the sum of the number of performance units granted and related dividend equivalents accrued through December 31, 2018, multiplied by the payout percentage of 129.9%. The payout percentage is based on the estimated outcomes as of December 31, 2018, of our operating performance measures to be achieved during the performance period of 99.9%, which was increased by the TSR modifier by 30 percentage points based on our TSR percentile rank relative to the TSRs of the companies in the Reference Group for the period from the April 27, 2018 grant date to December 31, 2018. With respect to Mr. Gordon’s grant of performance units for 2018-2020 performance period, the number of performance units that would have been earned is the sum of the number of performance units granted and related dividend equivalents accrued through December 31, 2018, multiplied by the payout percentage of 105.2%. The payout percentage is based on estimated outcomes as of December 31, 2018, of our operating measures to be achieved during the performance period of 105.2% with no adjustment by the TSR modifier as our TSR for the period from the November 2, 2018 grant date to December 31, 2018 was negative, even though it exceeded the 75th percentile rank relative to the TSRs of the companies in the Reference Group during this period. Also, since the termination events were assumed to occur in the year the award is granted, and Mr. Gordon commenced employment with the company in 2018, the amount in the table above reflects apro-rata reduction of the performance units to be paid out based on the number of complete months of service provided by Mr. Gordon in 2018. |
For the 2017-2019 performance period, the number of performance units that would have been earned is the sum of the number of performance units granted and related dividend equivalents accrued through December 31, 2018, multiplied by the payout percentage of 154.3%. The payout percentage is based on the estimated outcomes as of December 31, 2018, of our operating performance measures to be achieved during the performance period of 104.3%, which was increased by the TSR modifier by 50 percentage points based on our TSR percentile rank relative to the TSRs of the companies in the Reference Group for the period from the May 1, 2017 grant date to December 31, 2018. |
In the event of actual death or disability, payout of shares in satisfaction of amounts earned for grants for the 2018-2020 and 2017-2019 performance periods would not occur until after the end of the performance periods. For more information, see “Elements of Compensation and Specific Compensation Decisions—Long-Term Incentive Equity Awards” in our Compensation Discussion and Analysis. |
As Mr. Bradway and Dr. Reese were retirement-eligible as of December 31, 2018, the retirement payout amounts for performance units for the 2018-2020 and 2017-2019 performance periods were calculated in the same manner as the respective death and disability amounts. |
82 ï 2019 Proxy Statement
Table of Contents
|
Executive Compensation Tables
|
|
| (3) | Reflects the estimated cost of medical, dental, and vision insurance coverage based on rates charged to our staff members for post-employment coverage provided in accordance with COBRA for the first 18 months following termination adjusted for the last six months of this period by an 8% inflation factor for medical coverage and a 6% inflation factor for dental coverage. |
| (4) | Reflects the value of retirement plan contributions for two years calculated as two times the sum of: (i) $2,500; and (ii) the product of: (a) 10%; and (b) the sum of the NEO’s annual base salary as of December 31, 2018, and the NEO’s targeted annual cash incentive award for 2018 (which equals the NEO’s annual base salary as of December 31, 2018, multiplied by the NEO’s target annual cash incentive award percentage). |
| (5) | Reflects a reduction of $34,515 from Mr. Meline’s unvested balance in the NDCP that would otherwise become immediately vested in the event of a change in control to avoid excise tax he would be liable for if all benefits pursuant to the Change of Control Severance Plan were provided to Mr. Meline. For purposes of determining whether a reduction in the amount in the NDCP subject to accelerated vesting should be made, we applied the highest applicable federal and state income tax rates to the benefits subject to income taxes that would be provided to Mr. Meline pursuant to the Change of Control Severance Plan in the table above. |
| (6) | Reflects the cash severance payment pursuant to our Change of Control Severance Plan described above. The payment to Dr. Reese was reduced by $539,600 from the amount otherwise due to him to avoid excise tax he would be liable for if all benefits pursuant to the Change of Control Severance Plan were paid to Dr. Reese. For purposes of determining whether the cash severance payment reduction should be made, we applied the highest applicable federal and state income tax rates to the benefits subject to income taxes that would be payable to Dr. Reese pursuant to the Change of Control Severance Plan in the table above. |
| (7) | Reflects amounts that would be paid to Mr. Gordon pursuant to his offer letter in the event Mr. Gordon was terminated without “cause,” including two years of annual salary and annual target incentive bonus, as defined, and the cost of providing continuing medical and dental insurance coverage for 18 months in accordance with COBRA calculated in the same manner as described in footnote 3 above. The terms of Mr. Gordon’s offer letter relating to these benefits expire at the end of the third year of his employment on September 3, 2021. |
| (8) | Excludes the value of unvested RSUs (including related accrued dividend equivalents rounded down to the nearest whole number of units) granted to Dr. Reese on May 1, 2017 and November 2, 2018, totaling 18,078 units which do not provide for continued vesting after retirement. |
| (9) | In accordance with the terms of our award agreements, the termination events in the year an award is granted reflects apro-rata reduction of the RSUs (including related accrued dividend equivalents rounded down to the nearest whole number of units) granted to Mr. Gordon in connection with the commencement of his employment in 2018 based on the number of complete months of service provided by Mr. Gordon during 2018. |
| (10) | Dr. Harper retired from the Company on January 4, 2019, when the closing price of our stock was $195.44. Since Dr. Harper became retirement-eligible prior to his retirement, his unvested stock options, RSUs and performance units will continue to vest on their original schedules subsequent to his termination. For presentation purposes in the table above, these awards are valued as if they were fully vested on January 4, 2019. The payout of shares in satisfaction of amounts earned for grants for the 2018-2020 and 2017-2019 performance periods will not occur until after the end of the performance periods. |
ï 2019 Proxy Statement 83
Table of Contents
|
Director Compensation
|
|
The compensation program for ournon-employee directors is intended to be competitive and fair so that we can attract the best talent to our Board of Directors, or Board, and recognize the time and effort required of a director given the size and complexity of our operations. In addition to cash compensation, we provide equity grants and have stock ownership guidelines to align the directors’ interests with all of our stockholders’ interests and to motivate our directors to focus on our long-term growth and success. Directors who are our employees are not paid any fees for serving on our Board or for attending Board meetings. In October 2017, the Governance and Nominating
Committee, or Governance Committee, reviewed our director compensation. The Governance Committee hired Frederic W. Cook & Co., Inc., or FW Cook, as an independent consultant to the Governance Committee to advise on director compensation. FW Cook provided detailed competitive comparisons against our peer group and recommended no changes to our director compensation levels. Based on this review and recommendation by FW Cook, the Governance Committee recommended to the Board that no changes be made to the compensation levels for directors.
2018 Director Compensation
Cash Compensation. Eachnon-employee director receives an annual cash retainer of $100,000. In addition, chairs of the four key standing committees receive an additional $20,000 annual retainer as follows: (i) Audit Committee; (ii) Compensation and Management Development Committee; (iii) Corporate Responsibility and Compliance Committee; and (iv) Governance and Nominating Committee. The lead independent director receives an additional $35,000 annual retainer. Directors are not additionally compensated for Board meeting attendance. Directors are compensated $2,000 for each committee meeting they attend ($1,000 for telephonic attendance). Directors also may be compensated for attending meetings of committees of which they are not members or special meetings if they are invited to attend by the Chairman of the Board or the committee chair. Directors are entitled to reimbursement of their expenses incurred in connection with attendance at Board and committee meetings and conferences with our senior management. We make taxgross-up payments to our directors to reimburse them for additional income taxes imposed when we are required to impute income on perquisites that we provide.
Equity Incentives. Under the provisions of our revised Director Equity Incentive Program, eachnon-employee director receives an automatic annual grant of restricted stock units, or RSUs, on the third business day after the release of our first fiscal quarter earnings, with a grant date fair market value of $200,000, based on the closing price of our Common Stock on the grant date (rounded down to the nearest whole number). The RSUs vest immediately, and the director may choose to defer receipt of the shares. Directors that elect to defer receipt of the shares accrue dividend equivalents on the vested RSUs during the deferral period. A director may also elect to receive deferred RSUs in lieu of up to 100% of his or her cash compensation.
Deferred Compensation and Other Benefits. Non-employee directors are eligible to participate in the Nonqualified Deferred Compensation Plan, or NDCP, that we maintain for our staff members (see “Nonqualified Deferred Compensation” in our Executive Compensation Tables above for more information). Earnings under this plan are market-based—there are no “above market” or guaranteed rates of returns.
Through The Amgen Foundation, Inc., the Company maintains a charitable contributions matching gift program for all eligible staff members andnon-employee directors. Our directors participate in the program on the same terms as our staff members. The Amgen Foundation, Inc. matches, on adollar-for-dollar basis, qualifying donations made by directors and staff members to eligible organizations, up to $20,000 per person, per year. Separate and in addition to this ongoing annual program, The Amgen Foundation, Inc. matches, on adollar-for-dollar basis, donations to specified disaster relief organizations, up to $20,000 per deployment per person.
Guests of our Board members are occasionally invited to Board events, and we may pay or reimburse travel expenses and may provide transportation on our aircraft for both the director and his or her guest.
Director Stock Ownership Guidelines. Allnon-employee directors are expected to hold the equivalent of five times the Board annual cash retainer (currently $500,000) in our Common Stock while serving as anon-employee director.
Allnon-employee directors are expected to comply with the stock ownership guidelines on or before December 31st of the calendar year in which the fifth anniversary of their first date of election by stockholders or the Board falls. For purposes of the Board stock ownership guidelines, issued and outstanding shares of our Common Stock held beneficially or of record by thenon-employee director, issued and outstanding shares of our Common Stock held in a qualifying trust (as defined in the guidelines), and vested RSUs that are deferred will count towards satisfying the stock ownership guidelines. All directors with compliance dates that were on or prior to December 31, 2018, met the stock ownership guidelines as of that date.
Board members are subject to our insider trading policy that prohibits them from engaging in short sales with respect to the Company’s securities, purchasing or pledging the Company’s stock on margin, or entering into any hedging, derivative or similar transactions with respect to the Company’s securities.
84 ï 2019 Proxy Statement
Table of Contents
|
Director Compensation
|
|
Director Compensation Table
The following table shows compensation of thenon-employee members of our Board for 2018. Robert A. Bradway, our Chairman of the Board, Chief Executive Officer and President is not included in the table as he is an employee and thus receives no compensation for his service as a director.
Non-Employee Director
|
Fees Earned or
|
Stock Awards($)(5)(6)
|
All Other Compensation($)(7)
| Total($)
| ||||||||||||
Wanda M. Austin
|
|
124,000
|
|
|
216,602
|
|
|
22,401
|
|
|
363,003
|
| ||||
David Baltimore(1)
|
|
58,000
|
|
|
199,997
|
|
|
34,009
|
|
|
292,006
|
| ||||
François de Carbonnel(1)
|
|
59,000
|
|
|
199,997
|
|
|
26,873
|
|
|
285,870
|
| ||||
Brian J. Druker(1)
|
|
84,667
|
|
|
133,261
|
|
|
12,959
|
|
|
230,887
|
| ||||
Robert A. Eckert
|
|
179,000
|
|
|
199,997
|
|
|
20,762
|
|
|
399,759
|
| ||||
Greg C. Garland
|
|
144,000
|
|
|
199,997
|
|
|
20,000
|
|
|
363,997
|
| ||||
Fred Hassan
|
|
126,000
|
|
|
199,997
|
|
|
21,472
|
|
|
347,469
|
| ||||
Rebecca M. Henderson
|
|
124,000
|
|
|
199,997
|
|
|
30,478
|
|
|
354,475
|
| ||||
Frank C. Herringer(2)
|
|
122,000
|
|
|
199,997
|
|
|
84,657
|
|
|
406,654
|
| ||||
Charles M. Holley, Jr.(3)
|
|
73,000
|
|
|
272,639
|
|
|
10,000
|
|
|
355,639
|
| ||||
Tyler Jacks
|
|
126,000
|
|
|
199,997
|
|
|
20,000
|
|
|
345,997
|
| ||||
Ellen J. Kullman(3)
|
|
0
|
|
|
323,605
|
|
|
20,225
|
|
|
343,830
|
| ||||
Ronald D. Sugar
|
|
138,000
|
|
|
199,997
|
|
|
608
|
|
|
338,605
|
| ||||
R. Sanders Williams
|
|
118,000
|
|
|
199,997
|
|
|
20,224
|
|
|
338,221
|
| ||||
| (1) | Dr. Baltimore and Mr. de Carbonnel retired from our Board in May 2018 and Dr. Druker was elected to our Board effective May 22, 2018. Accordingly, fees earned by each director in 2018 consist of apro-rata amount of the annual retainer fee(pro-rated on a monthly basis) and fees for committee meetings attended in 2018. |
| (2) | All cash fees for Mr. Herringer were deferred under our NDCP. |
| (3) | Mr. Holley and Ms. Kullman elected to receive 50% and 100%, respectively, of their annual retainer and committee meeting fees in the form of deferred RSUs. |
| (4) | Reflects all fees earned by members of our Board for participation in regular, telephonic, and special meetings of Board committees and annual retainers, as applicable. |
| (5) | Reflects the grant date fair values of RSUs determined in accordance with Accounting Standards Codification Topic 718 consisting of 1,127 RSUs granted on April 27, 2018, to each director named above, except Dr. Druker who was not yet a member of our Board. Dr. Druker was granted 678 RSUs on July 31, 2018, based on apro-rata value consistent with his length of service on the Board during 2018. The grant date fair values of all of these awards are based on the closing prices of our Common Stock on the grant dates of $177.46 and $196.55 on April 27, 2018, and July 31, 2018, respectively, multiplied by the number of RSUs granted. Such grants occur on the third business day after release of our annual or quarterly earnings, as applicable. Directors that elect to defer receipt of the shares accrue dividend equivalents on the vested RSUs during the deferral period. All of the RSUs granted to directors were fully vested upon grant. |
In addition to the grants discussed above, Mr. Holley and Ms. Kullman were granted RSUs in lieu of cash fees for 50% and 100%, respectively, of their annual retainer and committee meeting fees as follows:
Granted on
| ||||||||||||||||
Non-Employee Director
|
April 27, 2018
|
July 31, 2018
|
November 2, 2018
|
February 1, 2019
| ||||||||||||
Charles M. Holley, Jr.
|
|
101
|
|
|
89
|
|
|
93
|
|
|
106
|
| ||||
Ellen J. Kullman
|
|
174
|
|
|
152
|
|
|
149
|
|
|
187
|
| ||||
The grant date fair values per unit for these awards were $177.46, $196.55, $187.06, and $187.07 for April 27, 2018, July 31, 2018, November 2, 2018, and February 1, 2019, respectively. In addition to the stock awards discussed above, Dr. Austin, who was appointed to our Board in December 2017, was granted 94 RSUs on February 6, 2018, the third business day after release of our annual earnings for 2017, with a grant date fair value per unit of $176.65 and aggregate fair value of $16,605, representing herpro-rated 2017 equity award consistent with her length of service on the Board during 2017.
ï 2019 Proxy Statement 85
Table of Contents
|
Director Compensation
|
|
| (6) | The table below shows the aggregate numbers of stock awards and stock option awards outstanding for eachnon-employee director as of December 31, 2018. Stock awards consist of vested RSUs for which receipt of the underlying shares of our Common Stock has been deferred (vested/deferred RSUs) and dividends on vested/deferred RSUs deemed automatically reinvested to acquire additional vested/deferred RSUs (rounded down to the nearest whole number of units). Directors may elect to defer issuance of shares until a later date, which would result in a deferral of taxable income to the director until the stock issuance date. Upon the passage of any applicable deferral period, the vested/deferred RSUs are paid in shares of our Common Stock on aone-for-one basis. Option awards consist of fully exercisable stock options. |
Non-Employee Director
|
Aggregate Stock Awards Outstanding as of December 31, 2018(a)
|
Aggregate Option Awards Outstanding as of December 31, 2018(b)
| ||||||
Restricted Stock Units and Dividend Equivalents
| Stock Options
| |||||||
Wanda M. Austin
|
|
0
|
|
|
0
|
| ||
David Baltimore
|
|
0
|
|
|
15,000
|
| ||
François de Carbonnel
|
|
2,338
|
|
|
0
|
| ||
Brian J. Druker
|
|
687
|
|
|
0
|
| ||
Robert A. Eckert
|
|
9,242
|
|
|
20,000
|
| ||
Greg C. Garland
|
|
0
|
|
|
0
|
| ||
Fred Hassan
|
|
0
|
|
|
0
|
| ||
Rebecca M. Henderson
|
|
12,235
|
|
|
5,000
|
| ||
Frank C. Herringer
|
|
23,636
|
|
|
15,000
|
| ||
Charles M. Holley, Jr.
|
|
1,437
|
|
|
0
|
| ||
Tyler Jacks
|
|
7,137
|
|
|
0
|
| ||
Ellen J. Kullman
|
|
2,922
|
|
|
0
|
| ||
Ronald D. Sugar
|
|
12,988
|
|
|
30,000
|
| ||
R. Sanders Williams
|
|
0
|
|
|
0
|
| ||
| (a) | Restricted stock units and related dividend equivalents are all vested, but receipt has been deferred. |
| (b) | All options are vested. |
86 ï 2019 Proxy Statement
Table of Contents
|
Director Compensation
|
|
| (7) | The table below provides a summary of amounts paid by the Company for perquisites and other special benefits. |
Non-Employee Director
| Matching of Charitable Contributions ($)(a)
| Personal Use of Company Aircraft(b)
|
Reimbursement of Expenses in
| Other(d)
| Dividends Accrued on Vested/ Deferred RSUs($)(e)
| Total($)
| ||||||||||||||||||||||||||||||
Aggregate Incremental Amounts($)
|
Tax Gross- Up($)
|
Aggregate Incremental Amounts($)
|
Tax Gross- Up($)
|
Aggregate Incremental Amounts($)
|
Tax Gross- Up($)
| |||||||||||||||||||||||||||||||
Wanda M. Austin
|
|
22,000
|
|
|
0
|
|
|
0
|
|
|
286
|
|
|
115
|
|
|
0
|
|
|
0
|
|
|
0
|
|
|
22,401
|
| |||||||||
David Baltimore
|
|
20,000
|
|
|
0
|
|
|
0
|
|
|
346
|
|
|
139
|
|
|
9,716
|
|
|
3,808
|
|
|
0
|
|
|
34,009
|
| |||||||||
François de Carbonnel
|
|
0
|
|
|
0
|
|
|
0
|
|
|
869
|
|
|
585
|
|
|
9,611
|
|
|
3,671
|
|
|
12,137
|
|
|
26,873
|
| |||||||||
Brian J. Druker
|
|
12,500
|
|
|
0
|
|
|
459
|
|
|
0
|
|
|
0
|
|
|
0
|
|
|
0
|
|
|
0
|
|
|
12,959
|
| |||||||||
Robert A. Eckert
|
|
20,000
|
|
|
0
|
|
|
762
|
|
|
0
|
|
|
0
|
|
|
0
|
|
|
0
|
|
|
0
|
|
|
20,762
|
| |||||||||
Greg C. Garland
|
|
20,000
|
|
|
0
|
|
|
0
|
|
|
0
|
|
|
0
|
|
|
0
|
|
|
0
|
|
|
0
|
|
|
20,000
|
| |||||||||
Fred Hassan
|
|
20,000
|
|
|
316
|
|
|
891
|
|
|
0
|
|
|
0
|
|
|
207
|
|
|
58
|
|
|
0
|
|
|
21,472
|
| |||||||||
Rebecca M. Henderson
|
|
20,000
|
|
|
0
|
|
|
0
|
|
|
0
|
|
|
0
|
|
|
0
|
|
|
0
|
|
|
10,478
|
|
|
30,478
|
| |||||||||
Frank C. Herringer
|
|
30,000
|
|
|
0
|
|
|
0
|
|
|
0
|
|
|
0
|
|
|
0
|
|
|
0
|
|
|
54,657
|
|
|
84,657
|
| |||||||||
Charles M. Holley, Jr.
|
|
10,000
|
|
|
0
|
|
|
0
|
|
|
0
|
|
|
0
|
|
|
0
|
|
|
0
|
|
|
0
|
|
|
10,000
|
| |||||||||
Tyler Jacks
|
|
20,000
|
|
|
0
|
|
|
0
|
|
|
0
|
|
|
0
|
|
|
0
|
|
|
0
|
|
|
0
|
|
|
20,000
|
| |||||||||
Ellen J. Kullman
|
|
20,000
|
|
|
206
|
|
|
19
|
|
|
0
|
|
|
0
|
|
|
0
|
|
|
0
|
|
|
0
|
|
|
20,225
|
| |||||||||
Ronald D. Sugar
|
|
0
|
|
|
0
|
|
|
0
|
|
|
434
|
|
|
174
|
|
|
0
|
|
|
0
|
|
|
0
|
|
|
608
|
| |||||||||
R. Sanders Williams
|
|
20,000
|
|
|
0
|
|
|
0
|
|
|
0
|
|
|
0
|
|
|
160
|
|
|
64
|
|
|
0
|
|
|
20,224
|
| |||||||||
| (a) | These are charitable contributions of The Amgen Foundation, Inc. that matched the directors’ charitable contributions made in 2018, including contribution to disaster relief organizations of $2,000 by Dr. Austin and $10,000 by Mr. Herringer. |
| (b) | Where we have guests accompany directors on our aircraft or where the director, fornon-business purposes, accompanies executives using our aircraft for business purposes, we typically incur de minimis incremental cost for transporting that person, but we are required to impute income to the director for his or her income tax purposes. We reimburse the director for the additional income taxes imposed on the director in these circumstances. The aggregate incremental cost of use of our aircraft is calculated based on our variable operating costs, which include crew travel expenses,on-board catering, landing fees, trip-related hangar/parking costs, fuel, maintenance, and other smaller variable costs. In determining the incremental cost relating to fuel and trip-related maintenance, we applied an estimate derived from our average costs. We believe that the use of this methodology is a reasonably accurate method for calculating fuel and trip-related maintenance costs. Because our aircraft are used primarily for business travel, we do not include the fixed costs that do not change based on usage, such as pilots’ salaries, our aircraft purchase costs, and the cost of maintenance not related to trips. |
| (c) | These amounts reflect the incremental costs of personal expenses incurred while on business travel and related imputed income to the director for his or her income tax purposes. We reimburse the director for the additional income taxes imposed on the director in these circumstances. Where we have guests accompanying directors for business purposes, we may incur incremental costs for the guest and may be required to impute income to the director for his or her income tax purposes. We reimburse the director for the additional income taxes imposed on the director in these circumstances. |
| (d) | Amounts for Dr. Baltimore and Mr. de Carbonnel reflect costs and related taxgross-up for gifts given to them related to retirement from our Board. Amounts for Mr. Hassan and Dr. Williams reflect costs and related taxgross-ups for personal expenses while on business travel. |
| (e) | Amounts reflect dividends accrued on vested/deferred RSUs granted prior to 2011 as the impact of dividends was not considered in determining the grant date fair values of these awards for purposes of reporting compensation in the “Stock Awards” column in the “Director Compensation Table” in the Company’s proxy statements in prior years. |
ï 2019 Proxy Statement 87
Table of Contents
|
Security Ownership of Directors and Executive Officers
|
|
Security Ownership of Directors and Executive Officers
The following table sets forth certain information regarding the beneficial ownership of our Common Stock as of March 22, 2019 by: (i) each current director and nominee; (ii) our Named Executive Officers, or NEOs (as specified on page 34); and (iii) all of our current directors and executive officers as a group. There were 615,949,381 shares of our Common Stock outstanding as of March 22, 2019. None of our directors, nominees, NEOs, or executive officers, individually or as a group, beneficially owns greater than 1% of our outstanding shares of Common Stock.
Amgen Inc.
| ||||||||||||
Beneficial Owner
|
Total Common Stock Beneficially Owned
|
Shares Acquirable Within 60 Days
|
Percent of Total
| |||||||||
Non-Employee Directors and Nominees
| ||||||||||||
Wanda M. Austin
|
|
1,221
|
|
|
0
|
|
|
*
|
| |||
Brian J. Druker
|
|
0
|
|
|
0
|
|
|
*
|
| |||
Robert A. Eckert
|
|
20,435
|
|
|
20,000
|
|
|
*
|
| |||
Greg C. Garland
|
|
7,051
|
|
|
0
|
|
|
*
|
| |||
Fred Hassan
|
|
7,218
|
|
|
0
|
|
|
*
|
| |||
Rebecca M. Henderson
|
|
8,150
|
|
|
5,000
|
|
|
*
|
| |||
Frank C. Herringer(3)
|
|
42,722
|
|
|
15,000
|
|
|
*
|
| |||
Charles M. Holley, Jr.(4)
|
|
1,260
|
|
|
0
|
|
|
*
|
| |||
Tyler Jacks
|
|
1,890
|
|
|
0
|
|
|
*
|
| |||
Ellen J. Kullman
|
|
410
|
|
|
0
|
|
|
*
|
| |||
Ronald D. Sugar
|
|
26,000
|
|
|
26,000
|
|
|
*
|
| |||
R. Sanders Williams
|
|
5,136
|
|
|
0
|
|
|
*
|
| |||
| ||||||||||||
Named Executive Officers
| ||||||||||||
Robert A. Bradway
|
|
748,691
|
|
|
332,876
|
|
|
*
|
| |||
Anthony C. Hooper
|
|
257,406
|
|
|
46,670
|
|
|
*
|
| |||
Murdo Gordon
|
|
0
|
|
|
0
|
|
|
*
|
| |||
Sean E. Harper
|
|
80,428
|
|
|
29,065
|
|
|
*
|
| |||
David W. Meline
|
|
83,326
|
|
|
40,837
|
|
|
*
|
| |||
David M. Reese
|
|
26,528
|
|
|
14,827
|
|
|
*
|
| |||
Jonathan P. Graham
|
|
52,533
|
|
|
27,638
|
|
|
*
|
| |||
All current directors, NEOs and executive officers as a group (23 individuals)(5)
|
|
1,511,565
|
|
|
600,394
|
|
|
*
|
| |||
| * | Less than 1%. |
| (1) | Information in this table is based on our records and information provided by directors, NEOs, executive officers, and in public filings. Unless otherwise indicated in the footnotes and subject to community property laws, where applicable, each of the directors and nominees, NEOs, and executive officers has sole voting and/or investment power with respect to such shares, including shares held in trust. |
88 ï 2019 Proxy Statement
Table of Contents
|
Security Ownership of Directors and Executive Officers
|
|
| (2) | Includes shares which the individuals shown have the right to acquire (a) upon vesting of restricted stock units, or RSUs, and related dividend equivalents (excluding fractional shares), where the shares are issuable as of March 22, 2019, or within 60 days thereafter, and (b) upon exercise of stock options that are vested as of March 22, 2019, or within 60 days thereafter, as set forth in the table below. Such shares are deemed to be outstanding in calculating the percentage ownership of such individual (and the group), but are not deemed to be outstanding as to any other person. Excludes vested RSUs, and related dividend equivalents, for which receipt has been deferred by certain of thenon-employee directors to a date later than 60 days after March 22, 2019. Dividend equivalents credited on RSUs are deemed reinvested and are paid out with the vested RSUs in shares of our Common Stock. |
Name
| RSUs and Dividend Equivalents Included
| Stock Options Included
|
RSUs and Dividend Equivalents Excluded Because of Deferrals
| |||||||||
Wanda M. Austin
|
|
0
|
|
|
0
|
|
|
0
|
| |||
Brian J. Druker
|
|
0
|
|
|
0
|
|
|
692
|
| |||
Robert A. Eckert
|
|
0
|
|
|
20,000
|
|
|
9,316
|
| |||
Greg C. Garland
|
|
0
|
|
|
0
|
|
|
0
|
| |||
Fred Hassan
|
|
0
|
|
|
0
|
|
|
0
|
| |||
Rebecca M. Henderson
|
|
0
|
|
|
5,000
|
|
|
12,333
|
| |||
Frank C. Herringer
|
|
0
|
|
|
15,000
|
|
|
23,825
|
| |||
Charles M. Holley, Jr.
|
|
0
|
|
|
0
|
|
|
1,555
|
| |||
Tyler Jacks
|
|
0
|
|
|
0
|
|
|
7,195
|
| |||
Ellen J. Kullman
|
|
0
|
|
|
0
|
|
|
3,134
|
| |||
Ronald D. Sugar
|
|
0
|
|
|
26,000
|
|
|
13,092
|
| |||
R. Sanders Williams
|
|
0
|
|
|
0
|
|
|
0
|
| |||
Robert A. Bradway
|
|
10,184
|
|
|
322,692
|
|
|
0
|
| |||
Anthony C. Hooper
|
|
3,545
|
|
|
43,125
|
|
|
0
|
| |||
Murdo Gordon
|
|
0
|
|
|
0
|
|
|
0
|
| |||
Sean E. Harper
|
|
3,188
|
|
|
25,877
|
|
|
0
|
| |||
David W. Meline
|
|
3,103
|
|
|
37,734
|
|
|
0
|
| |||
David M. Reese
|
|
2,423
|
|
|
12,404
|
|
|
0
|
| |||
Jonathan P. Graham
|
|
2,123
|
|
|
25,515
|
|
|
0
|
| |||
| (3) | Includes 17,152 shares held by family trusts. |
| (4) | Shares held through the Holley Family Trust. |
| (5) | Includes 140,890 shares (excluding fractional shares) held by the four executive officers who are not NEOs and who have a right to acquire such shares upon the vesting of RSUs that have not been deferred to a date later than 60 days after March 22, 2019, or upon exercise of vested stock options as of March 22, 2019, or within 60 days thereafter. All current directors, NEOs, and executive officers as a group have the right to acquire a total of 28,234 shares upon vesting of RSUs, and related dividend equivalents, where the shares are issuable as of March 22, 2019, or within 60 days thereafter and 572,160 shares upon exercise of stock options that are vested as of March 22, 2019, or within 60 days thereafter. |
ï 2019 Proxy Statement 89
Table of Contents
|
Security Ownership of Certain Beneficial Owners
|
|
Security Ownership of Certain Beneficial Owners
The following table shows the number of shares of our Common Stock owned by each person or entity known to the Company to be the beneficial owners of more than 5% of our Common Stock as of March 22, 2019, based on a review of publicly available statements of beneficial ownership filed with the Securities and Exchange Commission, or SEC, on Schedules 13D and 13G through March 22, 2019.
Common Stock
| ||||||||
Name and Address of Beneficial Owner
|
Number of Shares
|
Percent of Total(1)
| ||||||
The Vanguard Group(2) 100 Vanguard Blvd. Malvern, PA 19355
|
| 49,919,229
|
|
| 8.1%
|
| ||
BlackRock, Inc.(3) 55 East 52nd Street New York, NY 10055
|
| 46,127,396
|
|
| 7.5%
|
| ||
Capital Research Global Investors(4) 333 South Hope Street Los Angeles, CA 90071
|
| 35,144,975
|
|
| 5.7%
|
| ||
FMR LLC(5) 245 Summer Street Boston, MA 02210
|
| 33,118,396
|
|
| 5.4%
|
| ||
| (1) | The “Percent of Total” reported in this column has been calculated based upon the numbers of shares of Common Stock outstanding as of March 22, 2019, and may differ from the “Percent of Class” reported in statements of beneficial ownership filed with the SEC. |
| (2) | The amounts shown and the following information was provided by The Vanguard Group pursuant to a Schedule 13G/A filed with the SEC on February 11, 2019. The Vanguard Group reports that it has sole voting power over 788,654 of these shares and sole dispositive power over 49,000,381 shares. |
| (3) | The amounts shown and the following information was provided by BlackRock, Inc. pursuant to a Schedule 13G/A filed with the SEC on February 11, 2019. BlackRock, Inc. reports that it has sole voting power over 40,088,491 of these shares and sole dispositive power over 46,127,396 shares. |
| (4) | The amounts shown and the following information was provided by Capital Research Global Investors pursuant to a Schedule 13G/A filed with the SEC on February 14, 2019. Capital Research Global Investors reports that it has sole voting and dispositive power over all 35,144,975 shares. |
| (5) | The amounts shown and the following information was provided by FMR LLC pursuant to a Schedule 13G/A filed with the SEC on February 13, 2019. FMR LLC reports that it has sole voting power over 4,050,724 of these shares and sole dispositive power over 33,118,396 shares. |
90 ï 2019 Proxy Statement
Table of Contents
|
Item 3 — Ratification of Selection of Independent Registered Public Accountants
|
|
Ratification of Selection of Independent Registered Public Accountants
The Audit Committee of the Board of Directors, or Board, has selected Ernst & Young LLP, or Ernst & Young, as our independent registered public accountants for the fiscal year ending December 31, 2019, and the Board has directed that management submit this selection for ratification by the stockholders at our 2019 Annual Meeting of Stockholders, or Annual Meeting. Ernst & Young has served as our independent registered public accounting firm and has audited our financial statements since the Company’s inception in 1980. The Audit Committee periodically considers whether there should be a rotation of our independent registered public accountants. Each year, the Audit Committee evaluates the qualifications and performance of the Company’s independent registered public accountants and determines whether tore-engage the current independent registered public accountants. In doing so, the Audit Committee considers the quality and efficiency of the services provided by the independent registered public accountants, their technical expertise, and knowledge of our operations and industry. Based on this evaluation,the members of the Audit Committee believe that the continued retention of Ernst & Young as our independent registered public accountants is in the best interests of the Company and its stockholders. In conjunction with the mandated rotation of Ernst & Young’s lead engagement partner, the
Audit Committee and its chairperson are directly involved in the selection of Ernst & Young’s new lead engagement partner. The process for selection of Ernst & Young’s lead engagement partner involves a meeting between the Audit Committee’s chairperson and the candidate, as well as an assessment by the full Audit Committee and management. A representative of Ernst & Young is expected to be present at the Annual Meeting and will have an opportunity to make a statement and respond to appropriate questions.
Stockholder ratification of the selection of Ernst & Young as our independent registered public accountants is not required by the Amgen Inc. Restated Certificate of Incorporation, the Amended and Restated Bylaws of Amgen Inc., or otherwise. However, the Board is submitting the selection of Ernst & Young to the stockholders for ratification because we believe it is a matter of good corporate governance practice. If our stockholders fail to ratify the selection, the Audit Committee will reconsider whether or not to retain Ernst & Young, but still may retain them. Even if the selection is ratified, the Audit Committee in its discretion may direct the appointment of a different independent registered public accounting firm at any time during the year if the Audit Committee determines that such a change would be in our best interests and that of our stockholders.
THE BOARD OF DIRECTORS RECOMMENDS A VOTE “FOR” RATIFICATION OF OUR INDEPENDENT REGISTERED PUBLIC ACCOUNTANTS.
ï 2019 Proxy Statement 91
Table of Contents
|
Audit Matters
|
|
Audit Committee Report
The Audit Committee has reviewed and discussed with management the Company’s audited consolidated financial statements as of and for the year ended December 31, 2018.
The Audit Committee has also discussed with Ernst & Young LLP, or Ernst & Young, the matters required to be discussed by the Public Company Accounting Oversight Board (PCAOB) Auditing Standard No. 1301,Communications with Audit Committees.
The Audit Committee has received and reviewed the written disclosures and the letter from Ernst & Young required by the applicable
requirements of the PCAOB regarding Ernst & Young’s communication with the Audit Committee concerning independence and has discussed with Ernst & Young their independence.
Based on the reviews and discussions referred to above, the Audit Committee has recommended to the Board of Directors that the audited consolidated financial statements referred to above be included in the Company’s Annual Report onForm 10-K for the year ended December 31, 2018 for filing with the Securities and Exchange Commission.
Audit Committee of the Board of Directors
Charles M. Holley, Jr., Chairman
Wanda M. Austin
Brian J. Druker
Fred Hassan
Rebecca M. Henderson
Frank C. Herringer
Tyler Jacks
Ellen J. Kullman
Independent Registered Public Accountants
The following table presents fees for professional services provided or to be provided by Ernst & Young for audits of the years ended December 31, 2018 and December 31, 2017, and fees for other services rendered by Ernst & Young during these periods.
2018
|
2017
| |||||||
Audit
|
$
|
7,876,000
|
|
$
|
8,332,000
|
| ||
Audit-Related
|
|
752,000
|
|
|
290,000
|
| ||
Tax
|
|
0
|
|
|
0
|
| ||
All Other Fees
|
|
0
|
|
|
0
|
| ||
Total Fees
|
$
|
8,628,000
|
|
$
|
8,622,000
|
| ||
Included in Audit fees above are professional services associated with the integrated audit of our consolidated financial statements and our internal control over financial reporting and the statutory audits of various subsidiaries of the Company. Audit-Related fees are attributable to assurance and related services that are also performed by our independent registered public accountants, including attest related services, accounting consultations, and audits of employee benefit plan information. The Audit Committee has considered whether the Audit-Related services provided by Ernst & Young are compatible with maintaining that firm’s independence.
The Audit Committee has approved all audit and permissiblenon-audit services prior to such services being provided by Ernst & Young. The Audit Committee, or the Chairman of the Audit Committee who has been granted authority by the Audit Committee, approves each audit ornon-audit service prior to the engagement of Ernst & Young for such service. Each such service approved by the Chairman of the Audit Committee is presented to the entire Audit Committee at a subsequent meeting.
92 ï 2019 Proxy Statement
Table of Contents
|
Annual Report on Form 10-K
|
|
The Company’s Annual Report on Form10-K for fiscal 2018, which contains the consolidated financial statements of the Company for fiscal 2018, accompanies this proxy statement, but is not a part of the Company’s soliciting materials.
Stockholders may obtain, without charge, a copy of the Company’s Annual Report on Form10-K for fiscal 2018, filed with the Securities and Exchange Commission, including the financial statements and schedules thereto, without the accompanying
exhibits, by writing to: Investor Relations, Senior Manager, AmgenInc., One Amgen Center Drive, Thousand Oaks, CA 91320-1799, or contact Investor Relations by telephone at(805) 447-1060 or emailat investor.relations@amgen.com. The Company’s Annual Report on Form10-K is also available online on the Company’s website atwww.amgen.com. A list of exhibits is included in the Form10-K and exhibits are available from the Company upon payment to the Company of the cost of furnishing them.
ï 2019 Proxy Statement 93
Table of Contents
|
Certain Relationships and Related Transactions
|
|
Certain Relationships and Related Transactions
Under our written Approval of Related Party Transactions policy, a Securities and Exchange Commission, or SEC, related party transaction (as defined below) may be consummated or may continue only if the Audit Committee approves or ratifies the transaction in accordance with the guidelines set forth in the policy. The policy applies to: (1) any person who is, or at any time since the beginning of our last fiscal year was, a member of our Board of Directors, or Board, one of our executive officers or a nominee to become a member of our Board; (2) any person who is known to be the beneficial owner of more than 5% of any class of our voting securities; (3) any immediate family member, as defined in the policy, of, or sharing a household with, any of the foregoing persons; and (4) any firm, corporation or other entity in which any of the foregoing persons is employed, or is a partner or principal or in a similar position or in which such person has a 5% or greater beneficial ownership interest.
All potential related party transactions are presented to the Audit Committee for its consideration and, if the Audit Committee deems it appropriate, approval. The Audit Committee considers all relevant facts and circumstances available to it, including the recommendation of management. No member of the Audit Committee participates in any review, consideration, or approval of any related party transaction involving such member or any of his or her immediate family members, except that such member is required to provide all material information concerning the related party transaction to the Audit Committee.
Related party transactions may be preliminarily entered into by management subject to ratification by the Audit Committee; provided that if ratification shall not be forthcoming, management shall make all reasonable efforts to cancel or annul such transaction. At each scheduled meeting of the Audit Committee, management is required to update the Audit Committee as to any material changes to any approved or ratified related party transaction. A “SEC Related Party Transaction” is defined in the policy as a transaction, arrangement or relationship, or series of similar transactions, arrangements or relationships (including but not limited to any indebtedness or guarantee of indebtedness) between us and any of the persons listed in the first paragraph of this section. A related party transaction also includes any material amendment or modification to an existing related party transaction.
The Audit Committee has excluded each of the following related party transactions under the terms of our Approval of Related Party Transactions policy:
| 1. | Any matters related to compensation or benefits to the extent such compensation or benefits would not be required to be disclosed under Item 404 of RegulationS-K under the Securities Act of 1933; |
| 2. | Transactions involving less than $120,000 (or such different amount as may require disclosure or approval under any future amendment to the rules and regulations of the SEC, including Item 404 of RegulationS-K, or the listing requirements of The NASDAQ Stock Market LLC, including Rule 5630) when aggregated with all similar transactions; or |
| 3. | Transactions approved by another independent committee of the Board. |
In deciding whether to approve or ratify a related party transaction, the Audit Committee will consider the following factors:
| • | Whether the terms of the transaction are (i) fair to the Company and (ii) at least as favorable to the Company as would apply if the transaction did not involve a related party; |
| • | Whether there are demonstrable business reasons for the Company to enter into the transaction; |
| • | Whether the transaction would impair the independence of an outside director; and |
| • | Whether the transaction would present an improper conflict of interest for any director or executive officer, taking into account the size of the transaction, the overall financial position of the related party, the direct or indirect nature of the related party’s interest in the transaction and the ongoing nature of any proposed relationship, and any other factors the Audit Committee deems relevant. |
Separately, to avoid even the appearance of a conflict of interest related to service on our Board, we require appropriate reporting of such service in scientific publications and presentations.
94 ï 2019 Proxy Statement
Table of Contents
|
Information Concerning Voting and Solicitation
|
|
Information Concerning Voting and Solicitation
General
The enclosed proxy is solicited on behalf of the Board of Directors, or Board, of Amgen Inc., a Delaware corporation, for use at our 2019 Annual Meeting of Stockholders, or Annual Meeting, to be held on Tuesday, May 21, 2019, at 11:00 A.M., local time, or any continuation, postponement, or adjournment thereof, for the purposes discussed in this proxy statement and in the accompanying Notice of Annual Meeting of Stockholders and any business properly brought before the Annual Meeting. Proxies are solicited to give all stockholders of record an opportunity to vote on matters properly presented at the Annual Meeting. The Annual Meeting will be held at the Four Seasons Hotel Westlake Village, Two Dole Drive, Westlake Village, California 91362.
Pursuant to the rules adopted by the Securities and Exchange Commission, we have elected to provide access to our proxy materials over the Internet. Accordingly, we are sending a Notice Regarding the Availability of Proxy Materials, or Notice, to certain of our stockholders of record, and we are sending a paper copy of the proxy materials and proxy card to other stockholders of record who we believe would prefer receiving such materials in paper form. Brokers and other nominees who hold shares on behalf of beneficial owners will be sending their own similar Notice. Stockholders will have the ability to access the proxy materials on the website referred to in the Notice or request to receive a printed set of the proxy materials. Instructions on how to request a printed copy by mail or electronically may be found on the Notice and on the website referred to in the Notice, including an option to request paper copies on an ongoing basis. We intend to make this proxy statement available on the Internet and to mail the Notice, or to mail the proxy statement and proxy card, as applicable, on or about April 8, 2019, to all stockholders entitled to notice of and to vote at the Annual Meeting.
Important Notice Regarding the Availability of Proxy Materials for the 2019 Stockholder Meeting to Be Held on May 21, 2019.
This proxy statement, our 2018 annual report and our other proxy materials are available at: www.astproxyportal.com/ast/Amgen. At this website, you will find a complete set of the following proxy materials: notice of 2019 Annual Meeting of Stockholders; proxy statement; 2018 annual report; and form proxy card. You are encouraged to access and review all of the important information contained in the proxy materials before submitting a proxy or voting at the meeting.
What Are You Voting On?
You will be entitled to vote on the following proposals at the Annual Meeting:
| • | The election of the 12 director nominees named herein to serve on our Board for a term of office expiring at the 2020 annual meeting of stockholders; |
| • | The advisory vote to approve our executive compensation; |
| • | The ratification of the selection of Ernst & Young LLP as our independent registered public accountants for the fiscal year ending December 31, 2019; and |
| • | Any other business as may properly come before the Annual Meeting. |
Who Can Vote
The Board has set March 22, 2019, as the record date for the Annual Meeting. You are entitled to notice and to vote if you were a stockholder of record of our Common Stock, $.0001 par value per share, or Common Stock, as of the close of business on March 22, 2019. You are entitled to one vote on each proposal for each share of Common Stock you held on the record date. Your shares may be voted at the Annual Meeting only if you are present in person or your shares are represented by a valid proxy.
Difference Between a Stockholder of Record and a “Street Name” Holder
If your shares are registered directly in your name in the records of the Company’s transfer agent, you are considered the stockholder of record with respect to those shares.
If your shares are held in a stock brokerage account or by a bank, trust, or other nominee, then the broker, bank, trust, or other nominee is considered to be the stockholder of record with respect to those shares. However, you are still considered to be the beneficial owner of those shares, and your shares are said to be held in “street name.” Street name holders generally cannot submit a proxy or vote their shares directly and must instead instruct the broker, bank, trust, or other nominee how to vote their shares using the methods described below.
Shares Outstanding and Quorum
At the close of business on March 22, 2019, there were 615,949,381 shares of our Common Stock outstanding and entitled to vote at the Annual Meeting. The presence of the holders of a majority of the outstanding shares of our Common Stock entitled to vote constitutes a quorum, which is required to hold and conduct business at the Annual Meeting. Shares are counted as present at the Annual Meeting if:
| • | You are present in person at the Annual Meeting; or |
| • | Your shares are represented by a properly authorized and submitted proxy (submitted by mail, by telephone, or over the Internet). |
If you are a record holder and you submit your proxy, regardless of whether you abstain from voting on one or more matters, your shares will be counted as present at the Annual Meeting for the purpose of determining a quorum. If your shares are held in “street name,” your
ï 2019 Proxy Statement 95
Table of Contents
|
Information Concerning Voting and Solicitation
|
|
shares are counted as present for purposes of determining a quorum if your broker, bank, trust, or other nominee submits a proxy covering your shares. Your broker, bank, trust, or other nominee is entitled to submit a proxy covering your shares as to certain “routine” matters, even if you have not instructed your broker, bank, trust, or other nominee on how to vote on those matters. Please see the subsection “If You Do Not Specify How You Want Your Shares Voted” below. In the absence of a quorum, the Annual Meeting may be adjourned, from time to time, by the chairman of the meeting or by the vote of the holders of a majority of the shares represented thereat, but no other business shall be transacted at such meeting.
Voting Your Shares
You may vote by attending the Annual Meeting and voting in person or by submitting a proxy. The method of voting by proxy differs (1) depending on whether you are viewing this proxy statement on the Internet or receiving a paper copy and (2) for shares held as a record holder and shares held in “street name.”
Shares Held as a Record Holder. If you hold your shares of Common Stock as a record holder and you are viewing this proxy statement on the Internet, you may submit a proxy over the Internet by following the instructions on the website referred to in the Notice previously mailed to you. You may request paper copies of the proxy statement and proxy card by following the instructions on the Notice. If you hold your shares of Common Stock as a record holder and you are reviewing a paper copy of this proxy statement, you may submit a proxy over the Internet or by telephone by following the instructions on the proxy card, or by completing, dating, and signing the proxy card that was included with the proxy statement and promptly returning it in thepre-addressed, postage-paid envelope provided to you.
Shares Held in Street Name. If you hold your shares of Common Stock in street name, you will receive a Notice from your broker, bank, trust, or other nominee that includes instructions on how to vote your shares. Your broker, bank, trust, or other nominee may allow you to deliver your voting instructions over the Internet and may also permit you to submit your voting instructions by telephone. In addition, you may request paper copies of the proxy statement and proxy card from your broker by following the instructions on the Notice provided by your broker, bank, trust, or other nominee.
The Internet(1) and telephone voting facilities will close at 11:59 P.M., Eastern Time, on May 20, 2019. Stockholders who submit a proxy by Internet or telephone need not return a proxy card or the form forwarded by your broker, bank, trust, or other holder of record by mail.
YOUR VOTE IS VERY IMPORTANT.
You should submit your proxy even if you plan to
attend the Annual Meeting.
Voting in Person
If you plan to attend the Annual Meeting and wish to vote in person, you may request a ballot at the Annual Meeting. Please note that if your shares are held of record by a broker, bank, trust, or other nominee, and you decide to attend and vote at the Annual Meeting, your vote in person at the Annual Meeting will not be effective unless you present a legal proxy, issued in your name from the record holder (your broker, bank, trust, or other nominee).Even if you intend to attend the Annual Meeting, we encourage you to submit your proxy in advance of the Annual Meeting.Please see the important instructions and requirements below regarding “Attendance at the Annual Meeting.”
Changing Your Vote
As a stockholder of record, if you submit a proxy, you may revoke that proxy at any time before it is voted at the Annual Meeting. Stockholders of record may revoke a proxy by (i) duly submitting a later-dated proxy over the Internet, by mail, or by telephone, (ii) delivering a written notice of revocation to the attention of the Secretary at our principal executive offices at One Amgen Center Drive, Thousand Oaks, California 91320-1799, or (iii) attending the Annual Meeting in person and voting in person. Attendance at the Annual Meeting will not, by itself, revoke a proxy. If your shares are held in the name of a broker, bank, trust, or other nominee, you may change your voting instructions by following the instructions of your broker, bank, trust, or other nominee.
If You Receive More Than One Proxy Card or Notice
If you receive more than one proxy card or Notice, it means you hold shares that are registered in more than one account. To ensure that all of your shares are voted, sign and return each proxy card or, if you submit a proxy by telephone or the Internet, submit one proxy for each proxy card or Notice you receive.
How Will Your Shares Be Voted
Stockholders of record as of the close of business on March 22, 2019, are entitled to one vote for each share of our Common Stock held on all matters to be voted upon at the Annual Meeting. All shares entitled to vote and represented by properly submitted proxies received before the polls are closed at the Annual Meeting, and not revoked or superseded, will be voted at the Annual Meeting in accordance with the instructions indicated on those proxies.YOUR VOTE IS VERY IMPORTANT.
| (1) | Stockholders who submit a proxy through the Internet or telephone should be aware that they may incur costs to access the Internet or telephone, such as usage charges from telephone companies or Internet service providers and that these costs must be borne by the stockholder. |
96 ï 2019 Proxy Statement
Table of Contents
|
Information Concerning Voting and Solicitation
|
|
If You Do Not Specify How You Want Your Shares Voted
As a stockholder of record, if you submit a signed proxy card or submit your proxy by telephone or Internet and do not specify how you want your shares voted, the proxy holder will vote your shares:
| • | FOR the election of the 12 nominees listed in this proxy statement to serve on our Board for a term of office expiring at the 2020 annual meeting of stockholders; |
| • | FOR the advisory vote to approve our executive compensation; and |
| • | FOR the ratification of the selection of Ernst & Young LLP as our independent registered public accountants for the fiscal year ending December 31, 2019. |
A “brokernon-vote” occurs when a nominee holding shares for a beneficial owner has not received voting instructions from the beneficial owner and the nominee does not have discretionary authority to vote the shares. If you hold your shares in street name and do not provide voting instructions to your broker or other nominee, your shares will be considered to be brokernon-votes and will not be voted on any proposal on which your broker or other nominee does not have discretionary authority to vote. Shares that constitute brokernon-votes will be counted as present at the Annual Meeting for the purpose of determining a quorum, but will not be considered entitled to vote on the proposal in question and therefore will have no effect on the outcome of the vote. Brokers generally have discretionary authority to vote on the ratification of the selection of Ernst & Young LLP as our independent registered public accountants. Brokers, however, do not have discretionary authority to vote on the election of directors to serve on our Board or on the advisory vote to approve our executive compensation.
In their discretion, the proxy holders named in the proxy solicited by the Company are authorized to vote the proxies in their discretion on any other matters that may properly come before the Annual Meeting and any continuation, postponement, or adjournment thereof. The Board knows of no other items of business that will be presented for consideration at the Annual Meeting other than those described in this proxy statement. In addition, no stockholder proposal or nomination (that was not subsequently withdrawn or excluded) was received on a timely basis, so no such matters may be brought to a vote at the Annual Meeting.
Inspector of Election and Counting of Votes
All votes will be tabulated as required by Delaware law, the state of our incorporation, by the inspector of election appointed for the Annual Meeting, who will separately tabulate affirmative and negative votes, abstentions, and brokernon-votes. Shares held by persons attending the Annual Meeting but not voting, shares represented by proxies that reflect abstentions as to one or more proposals, and brokernon-votes will be counted as present for purposes of determining a quorum.
Election of Directors.We have a majority voting standard for the election of directors in an uncontested election, which is generally defined as an election in which the number of nominees does not
exceed the number of directors to be elected at the meeting. In the election of directors, you may either vote “for,” “against,” or “abstain” for each nominee. Cumulative voting is not permitted. Under our majority voting standard, in uncontested elections of directors, such as this election, each director must be elected by the affirmative vote of a majority of the votes cast by the shares present in person or represented by proxy. A “majority of the votes cast” means that the number of votes cast “for” a director nominee exceeds the number of votes cast “against” the nominee. For these purposes, abstentions will not count as a vote “for” or “against” a nominee’s election and thus will have no effect in determining whether a director nominee has received a majority of the votes cast. Brokers do not have discretionary authority to vote on this proposal. Brokernon-votes will have no effect on the election of directors as brokers are not entitled to vote for or against a nominee without instruction from the beneficial owner.
If a director nominee is an incumbent director and does not receive a majority of the votes cast in an uncontested election, that director will continue to serve on the Board as a “holdover” director, but must tender his or her resignation to the Board promptly after certification of the election results of the stockholder vote. The Governance and Nominating Committee of the Board will then recommend to the Board whether to accept the resignation or whether other action should be taken. The Board will act on the tendered resignation, taking into account the recommendation of the Governance and Nominating Committee, and the Board’s decision will be publicly disclosed within 90 days after certification of the election results of the stockholder vote. A director who tenders his or her resignation after failing to receive a majority of the votes cast will not participate in the recommendation of the Governance and Nominating Committee or the decision of the Board with respect to his or her resignation.
Management Proposals (Advisory Vote to Approve Our Executive Compensation and Ratification of Ernst & Young LLP).The approval of the advisory vote to approve our executive compensation and the ratification of the selection of Ernst & Young LLP each require the affirmative votes of the holders of a majority of the shares present or represented by proxy at the Annual Meeting and entitled to vote on the matter. Abstentions will have the same effect as votes “against” each proposal.
Because brokers have discretionary authority to vote on the ratification of the selection of Ernst & Young LLP, we do not expect any brokernon-votes in connection with the ratification. Brokers do not have discretionary authority to vote on the advisory vote to approve our executive compensation. Brokernon-votes, therefore, will have no effect on the advisory votes to approve our executive compensation as brokers are not entitled to vote on such proposals in the absence of voting instructions from the beneficial owner.
Solicitation of Proxies
We will bear the entire cost of solicitation of proxies, including preparation, assembly, and mailing of this proxy statement, the proxy, the Notice, and any additional information furnished to stockholders. Copies of solicitation materials will be furnished to banks, brokerage houses, fiduciaries, and custodians holding shares of our Common
ï 2019 Proxy Statement 97
Table of Contents
|
Information Concerning Voting and Solicitation
|
|
Stock in their names that are beneficially owned by others to forward to those beneficial owners. We may reimburse persons representing beneficial owners for their costs of forwarding the solicitation materials to the beneficial owners. Original solicitation of proxies may be supplemented by telephone, facsimile, electronic mail, or personal solicitation by our directors, officers, or staff members. No additional compensation will be paid to our directors, officers, or staff members for such services. In addition, we have retained D.F. King & Co. to assist in the solicitation of proxies for a fee of approximately $100,000 plus distribution costs and other costs and expenses. A list of stockholders entitled to vote at the Annual Meeting will be available for examination by any stockholder for any purpose germane to the Annual Meeting during ordinary business hours at our principal executive offices at One Amgen Center Drive, Thousand Oaks, California, 91320-1799 for the ten days prior to the Annual Meeting and also at the Annual Meeting.
Attendance at the Annual Meeting
To attend the Annual Meeting, you will need an admittance ticket and proof of ownership of our Common Stock as of the close of business on March 22, 2019. If you have received a paper copy of the proxy statement, to receive an admittance ticket you will need to complete and return the postage-paid reply card included in this proxy statement. If you received electronic delivery of this proxy statement, you will receive ane-mail with instructions for obtaining an admittance ticket. If you are viewing the proxy statement over the Internet, please follow the instructions indicated on the website referred to in the Notice. Each stockholder is entitled to one admittance ticket. Directions to attend the Annual Meeting will be sent with your admittance ticket and are available at the website referred to in the Notice andwww.astproxyportal.com/ast/Amgen.
You must bring certain documents with you to be admitted to the Annual Meeting. The purpose of this requirement is to help us verify that you are actually a stockholder of the Company. Please read the following rules carefully, because they specify the documents that you must bring with you to the Annual Meeting to be admitted. The items
that you must bring with you differ depending upon whether or not you were a record holder of our Common Stock as of the close of business on March 22, 2019. See “Difference Between a Stockholder of Record and a ‘Street Name’ Holder” previously discussed.
All persons must bring a valid personal photo identification (such as a driver’s license or passport). If you are a record holder, at the Annual Meeting, we will check your name for verification purposes against our list of record holders as of the close of business on March 22, 2019.
If a broker, bank, trust, or other nominee was the record holder of your shares of Common Stock as of the close of business on March 22, 2019, then in addition to the applicable items above, you must also bring to the Annual Meeting:
| • | Proof that you owned shares of our Common Stock as of the close of business on March 22, 2019; and |
| • | If you intend to vote at the Annual Meeting, the executed proxy naming you as the proxy holder, signed by the broker, bank, trust, or other nominee who was the record holder of your shares of Common Stock as of the close of business on March 22, 2019. |
Examples of proof of ownership include the following: (1) an original or a copy of the voting information form from your bank or broker with your name on it; (2) a letter from your bank or broker stating that you owned shares of our Common Stock as of the close of business on March 22, 2019; or (3) a brokerage account statement indicating that you owned shares of our Common Stock as of the close of business on March 22, 2019.
If you are a proxy holder for a stockholder of the Company who owned shares of our Common Stock as of the close of business on March 22, 2019, then you must also bring to the Annual Meeting:
| • | The executed proxy naming you as the proxy holder, signed by a stockholder of the Company who owned shares of our Common Stock as of the close of business on March 22, 2019. |
98 ï 2019 Proxy Statement
Table of Contents
|
Other Matters
|
|
Section 16(a) Beneficial Ownership Reporting Compliance
Section 16(a) of the Securities Exchange Act of 1934, as amended, or Exchange Act, requires our executive officers and directors, and persons who own more than 10% of a registered class of our equity securities (collectively, Reporting Persons), to file reports of ownership and changes in ownership with the Securities and Exchange Commission, or SEC. Copies of the Section 16 reports are also required
to be supplied to the Company and such reports are available on our website atwww.amgen.com.Based solely on our review of the reports filed by Reporting Persons and written representations from certain Reporting Persons that no other reports were required for those persons, during the year ended December 31, 2018, the Reporting Persons met all applicable Section 16(a) filing requirements.
Stockholder Proposals for the 2020 Annual Meeting
Stockholder Proposals and Director Nominees for Inclusion in our 2020 Proxy Statement
Proposals Pursuant to Rule14a-8. Pursuant to Rule14a-8 under the Exchange Act, stockholders may present proper proposals for inclusion in our proxy statement and for consideration at our 2020 annual meeting of stockholders. To be eligible for inclusion in our 2020 proxy statement, your proposal must be received by our Secretary at our principal executive offices at One Amgen Center Drive, Thousand Oaks, California 91320-1799, no later than December 10, 2019, and must otherwise comply with Rule14a-8 under the Exchange Act. While our Board of Directors, or Board, will consider stockholder proposals, we reserve the right to omit from our proxy statement stockholder proposals that we are not required to include under the Exchange Act, including Rule14a-8.
Director Nominations Pursuant to Our Bylaws. Our Amended and Restated Bylaws of Amgen Inc., or Bylaws, permit an eligible stockholder, or group of up to 20 eligible stockholders, owning Amgen stock continuously for at least three years and shares representing an aggregate of at least 3% of our outstanding shares, to nominate and include in Amgen’s proxy materials director nominees constituting up to the greater of 20% of the Board or two directors, provided that the stockholder(s) and nominee(s) satisfy the requirements of the Bylaws (“Proxy Access”). To nominate a director pursuant to Proxy Access at the 2020 annual meeting of stockholders, you must comply with all of the procedures, information requirements, qualifications and conditions set forth in our Bylaws. A fully compliant nomination notice must be received by us no earlier than November 10, 2019, and no later than December 10, 2019, assuming the date of the 2020 annual meeting of stockholders is not more than thirty days before and not more than seventy days after the anniversary date of the 2019 Annual Meeting of Stockholders, or Annual Meeting, and such nomination notice must be delivered to our Secretary at our principal executive offices at One Amgen Center Drive, Thousand Oaks, California 91320-1799.
Stockholder Proposals and Nominees Brought at the 2020 Annual Meeting Without Inclusion in our 2020 Proxy Statement
Business Proposals and Nominations Pursuant to our Bylaws. To nominate a director or bring any other business before the stockholders at the 2020 annual meeting of stockholders that will not be included in our 2020 proxy statement pursuant to Rule14a-8 or the Proxy Access provisions of our Bylaws, you must comply with all of the procedures, information requirements, qualifications and conditions set forth in our Bylaws. In addition, assuming the date of the 2020 annual meeting of stockholders is not more than thirty days before and not more than seventy days after the anniversary date of the Annual Meeting, you must notify us in writing and such notice must be delivered to our Secretary at our principal executive offices at One Amgen Center Drive, Thousand Oaks, California 91320-1799 no earlier than January 22, 2020, and no later than February 21, 2020.
You may write to our Secretary at our principal executive offices at One Amgen Center Drive, Thousand Oaks, California 91320-1799, to deliver the notices discussed above and for a copy of the relevant Bylaw provisions regarding the requirements for making stockholder proposals and nominating director candidates pursuant to our Bylaws. Also, our Bylaws are filed with the SEC as an exhibit to our Exchange Act reports and can be accessed through the SEC’s EDGAR system.
The chairman of the Annual Meeting has the sole authority to determine whether any nomination or other proposal has been properly brought before the meeting in accordance with our Bylaws. If we receive a proposal other than pursuant to Rule14a-8 or a nomination for the 2020 annual meeting of stockholders, and such nomination or other proposal is not delivered within the time frame specified in our Bylaws, then the person(s) appointed by the Board and named in the proxies for the 2020 annual meeting of stockholders may exercise discretionary voting power if a vote is taken with respect to that nomination or other proposal.
ï 2019 Proxy Statement 99
Table of Contents
|
Other Matters
|
|
Householding of Proxy Materials
The SEC has adopted rules that permit companies and intermediaries (such as brokers and banks) to satisfy the delivery requirements for proxy statements and annual reports with respect to two or more stockholders sharing the same address by delivering a single proxy statement addressed to those stockholders. This process, which is commonly referred to as “householding,” is also permissible under the General Corporation Law of the State of Delaware and potentially means extra convenience for stockholders and cost savings for companies.
This year, a number of brokers and banks with account holders who are our stockholders will be householding our proxy materials. A single Notice of Annual Meeting of Stockholders or proxy statement will be
delivered to multiple stockholders sharing an address unless contrary instructions have been received from the affected stockholders. Once you have received notice from your broker or bank that it will be householding communications to your address, householding will continue until you are notified otherwise or until you revoke your consent. If, at any time, you no longer wish to participate in householding and would prefer to receive a separate proxy statement and annual report, please notify your broker or bank.
Stockholders who currently receive multiple copies of the proxy statement at their address and would like to request householding of their communications should contact their broker or bank.
No Incorporation by Reference
To the extent that this proxy statement is incorporated by reference into any other filing by us under the Securities Act of 1933 or the Exchange Act, the sections of this proxy statement entitled “Audit Committee Report” or “Compensation Committee Report” to the extent permitted by the rules of the SEC will not be deemed incorporated, unless specifically provided otherwise in such filing.
In addition, references to our website are not intended to function as a hyperlink and the information contained on our website is not intended to be part of this proxy statement. Information on our website, other than our proxy statement, Notice of Annual Meeting of Stockholders, and form of proxy, is not part of the proxy soliciting material and is not incorporated herein by reference.
Disclaimer
This proxy statement contains statements regarding future individual and Company performance targets and Company performance goals. These targets and Company performance goals are disclosed in the limited context of our compensation programs and should not be
understood to be statements of management’s expectations or estimates of results or other guidance. We specifically caution investors not to apply these statements to other contexts.
Forward-Looking Statements
This proxy statement contains forward-looking statements that are based on the current expectations and beliefs of Amgen. All statements, other than statements of historical fact, are statements that could be deemed forward-looking statements, including estimates of revenues, operating margins, capital expenditures, cash, other financial metrics, expected legal, arbitration, political, regulatory or clinical results or practices, customer and prescriber patterns or practices, reimbursement activities and outcomes, and other such estimates and results. Forward-looking statements involve significant risks and uncertainties, including those discussed below and more fully described in the Securities and Exchange Commission reports filed by Amgen, including our most recent annual report on Form10-K and any subsequent periodic reports on Form10-Q and current reports on Form8-K. Unless otherwise noted, Amgen is providing this information as of the date of this proxy statement and does not undertake any obligation to update any forward-looking statements contained in this document as a result of new information, future events, or otherwise.
No forward-looking statement can be guaranteed and actual results may differ materially from those we project. Our results may be affected by our ability to successfully market both new and existing products domestically and internationally, clinical and regulatory developments involving current and future products, sales growth of recently launched products, competition from other products including biosimilars, difficulties or delays in manufacturing our products, and global economic conditions. In addition, sales of our products are affected by pricing pressure, political and public scrutiny, and reimbursement policies imposed by third-party payers, including governments, private insurance plans and managed care providers and may be affected by regulatory, clinical, and guideline developments and domestic and international trends toward managed care and healthcare cost containment. Furthermore, our research, testing, pricing, marketing, and other operations are subject to extensive regulation by domestic and foreign government regulatory authorities. We or others could identify safety, side effects, or manufacturing problems with our
100 ï 2019 Proxy Statement
Table of Contents
|
Other Matters
|
|
products, including our devices, after they are on the market. Our business may be impacted by government investigations, litigation, and product liability claims. In addition, our business may be impacted by the adoption of new tax legislation or exposure to additional tax liabilities.
Further, while we routinely obtain patents for our products and technology, the protection offered by our patents and patent applications may be challenged, invalidated, or circumvented by our competitors, or we may fail to prevail in present and future intellectual property litigation. We perform a substantial amount of our commercial manufacturing activities at a few key facilities, including in Puerto Rico, and also depend on third parties for a portion of our manufacturing activities, and limits on supply may constrain sales of certain of our current products and product candidate development. We rely on collaborations with third parties for the development of some of our product candidates and for the commercialization and sales of some of our commercial products. In addition, we compete with other companies with respect to many of our marketed products as well as for the discovery and development of new products. Discovery or identification of new product candidates or development of new
indications for existing products cannot be guaranteed and movement from concept to product is uncertain; consequently, there can be no guarantee that any particular product candidate or development of a new indication for an existing product will be successful and become a commercial product. Further, some raw materials, medical devices, and component parts for our products are supplied by sole third-party suppliers. Certain of our distributors, customers, and payers have substantial purchasing leverage in their dealings with us. The discovery of significant problems with a product similar to one of our products that implicate an entire class of products could have a material adverse effect on sales of the affected products and on our business and results of operations. Our efforts to acquire other companies or products and to integrate the operations of companies we have acquired may not be successful. A breakdown, cyberattack, or information security breach could compromise the confidentiality, integrity, and availability of our systems and our data. Our stock price is volatile and may be affected by a number of events. Our business performance could affect or limit the ability of our Board of Directors to declare a dividend or our ability to pay a dividend or repurchase our Common Stock. We may not be able to access the capital and credit markets on terms that are favorable to us, or at all.
Other Matters
The Board knows of no matters other than those listed in the attached Notice of Annual Meeting of Stockholders that are likely to be brought before the Annual Meeting. However, if any other matter properly comes before the Annual Meeting, the persons named on the enclosed proxy card will vote the proxy in accordance with their best judgment on such matter.
By Order of the Board of Directors
Jonathan P. Graham
Secretary
April 8, 2019
ï 2019 Proxy Statement 101
Table of Contents
|
Appendix A
|
|
Amgen Inc. Board of Directors
Guidelines for Director Qualifications and Evaluations
These guidelines set forth (1) the minimum qualifications that the Governance and Nominating Committee of the Board of Directors (the “Committee”) of Amgen Inc. (“Amgen”) believes are important for directors to possess, and (2) a description of the Committee’s process for identifying and evaluating nominees for director, including nominees recommended by stockholders. These guidelines are only guidelines and may be waived and/or changed by the Committee and/or the Board of Directors as appropriate.
1. Candidate Qualifications
In seeking individuals to join the Board of Directors or to fill director vacancies on the Board of Directors, the Committee considers the following to be minimum qualifications that a candidate must possess:
| • | Demonstrated breadth and depth of management and leadership experience, preferably in a senior leadership role in a large or recognized organization; |
| • | Financial and/or business acumen or relevant industry or scientific experience; |
| • | Integrity and high ethical standards; |
| • | Sufficient time to devote to Amgen’s business as a member of the Board; |
| • | Ability to oversee, as a director, Amgen’s business and affairs for the benefit of Amgen’s stockholders; |
| • | Ability to comply with the Board’s Code of Conduct; and |
| • | Demonstrated ability to think independently and work collaboratively. |
In addition, the Committee may consider the following where necessary and appropriate:
| • | A candidate’s independence, as defined by The NASDAQ Stock Market, Inc.; |
| • | A candidate’s ability to satisfy the composition requirements for the Audit Committee and the Compensation and Management Development Committee; |
| • | Maintaining a Board that reflects diversity; and |
| • | The Board’s overall size, structure and composition. |
2. Candidate Identification and Evaluation Process
(a) For purposes of identifying nominees for the Board of Directors, the Committee relies on professional and personal contacts of the Committee, other members of the Board of Directors and senior management, as well as candidates recommended by independent search firms retained by the Committee from time to time. The Committee also will consider candidates recommended by stockholders. Any director nominations submitted by stockholders will be evaluated in the same manner that nominees suggested by Board members, management or other parties are evaluated.
(b) In evaluating potential candidates, the Committee will determine whether the candidate is qualified for service on the Board of Directors by evaluating the candidate under the guidelines set forth above and by determining if any individual candidate suits the Committee’s and the Board of Director’s overall objectives at the time the candidate is being evaluated.
ï 2019 Proxy Statement A-1
Table of Contents
|
Appendix B
|
|
Reconciliations of GAAP toNon-GAAP Measures
Amgen Inc.
GAAP to Non-GAAP Reconciliations
(Dollars in millions)
(Unaudited)
| Years ended December 31, | ||||||||||||
| ||||||||||||
| 2018 | 2017 | 2016 | ||||||||||
GAAP cost of sales | $ | 4,101 | $ | 4,069 | $ | 4,162 | ||||||
Adjustments to cost of sales: | ||||||||||||
Acquisition-related expenses(a) | (1,099) | (1,126) | (1,248) | |||||||||
Certain net charges pursuant to our restructuring initiative | (1) | — | (1) | |||||||||
|
|
|
|
|
| |||||||
Total adjustments to cost of sales | (1,100) | (1,126) | (1,249) | |||||||||
|
|
|
|
|
| |||||||
Non-GAAP cost of sales | $ | 3,001 | $ | 2,943 | $ | 2,913 | ||||||
|
|
|
|
|
| |||||||
GAAP cost of sales as a percentage of product sales | 18.2% | 18.7% | 19.0% | |||||||||
Acquisition-related expenses(a) | -4.9 | -5.2 | -5.7 | |||||||||
Certain net charges pursuant to our restructuring initiative | 0.0 | 0.0 | 0.0 | |||||||||
|
|
|
|
|
| |||||||
Non-GAAP cost of sales as a percentage of product sales | 13.3% | 13.5% | 13.3% | |||||||||
|
|
|
|
|
| |||||||
GAAP research and development expenses | $ | 3,737 | $ | 3,562 | $ | 3,840 | ||||||
Adjustments to research and development expenses: | ||||||||||||
Acquisition-related expenses(a) | (78) | (77) | (78) | |||||||||
Certain net charges pursuant to our restructuring initiative | (2) | (3) | (7) | |||||||||
|
|
|
|
|
| |||||||
Total adjustments to research and development expenses | (80) | (80) | (85) | |||||||||
|
|
|
|
|
| |||||||
Non-GAAP research and development expenses | $ | 3,657 | $ | 3,482 | $ | 3,755 | ||||||
|
|
|
|
|
| |||||||
GAAP research and development expenses as a percentage of product sales | 16.6% | 16.3% | 17.5% | |||||||||
Acquisition-related expenses(a) | -0.4 | -0.3 | -0.3 | |||||||||
Certain net charges pursuant to our restructuring initiative | 0.0 | 0.0 | 0.0 | |||||||||
|
|
|
|
|
| |||||||
Non-GAAP research and development expenses as a percentage of product sales | 16.2% | 16.0% | 17.2% | |||||||||
|
|
|
|
|
| |||||||
GAAP selling, general and administrative expenses | $ | 5,332 | $ | 4,870 | $ | 5,062 | ||||||
Adjustments to selling, general and administrative expenses: | ||||||||||||
Acquisition-related expenses(a) | (84) | (99) | (180) | |||||||||
Certain net charges pursuant to our restructuring initiative | (16) | (2) | (5) | |||||||||
Other | — | (3) | — | |||||||||
|
|
|
|
|
| |||||||
Total adjustments to selling, general and administrative expenses | (100) | (104) | (185) | |||||||||
|
|
|
|
|
| |||||||
Non-GAAP selling, general and administrative expenses | $ | 5,232 | $ | 4,766 | $ | 4,877 | ||||||
|
|
|
|
|
| |||||||
GAAP selling, general and administrative expenses as a percentage of product sales | 23.7% | 22.3% | 23.1% | |||||||||
Acquisition-related expenses(a) | -0.4 | -0.4 | -0.8 | |||||||||
Certain net charges pursuant to our restructuring initiative | -0.1 | 0.0 | 0.0 | |||||||||
Other | 0.0 | 0.0 | 0.0 | |||||||||
|
|
|
|
|
| |||||||
Non-GAAP selling, general and administrative expenses as a percentage of product sales | 23.2% | 21.9% | 22.3% | |||||||||
|
|
|
|
|
| |||||||
B-1 ï 2019 Proxy Statement
Table of Contents
|
Appendix B
|
|
| Years ended December 31, | ||||||||||||
| ||||||||||||
| 2018 | 2017 | 2016 | ||||||||||
GAAP operating expenses | $ | 13,484 | $ | 12,876 | $ | 13,197 | ||||||
Adjustments to operating expenses: | ||||||||||||
Adjustments to cost of sales | (1,100) | (1,126) | (1,249) | |||||||||
Adjustments to research and development expenses | (80) | (80) | (85) | |||||||||
Adjustments to selling, general and administrative expenses | (100) | (104) | (185) | |||||||||
Certain net charges pursuant to our restructuring initiative(b) | 7 | (83) | (24) | |||||||||
Certain other expenses | (25) | — | — | |||||||||
Acquisition-related adjustments(c) | (296) | (292) | (4) | |||||||||
Expense related to legal proceedings | — | — | (105) | |||||||||
|
|
|
|
|
| |||||||
Total adjustments to operating expenses | (1,594) | (1,685) | (1,652) | |||||||||
|
|
|
|
|
| |||||||
Non-GAAP operating expenses | $ | 11,890 | $ | 11,191 | $ | 11,545 | ||||||
|
|
|
|
|
| |||||||
GAAP operating income | $ | 10,263 | $ | 9,973 | $ | 9,794 | ||||||
Adjustments to operating expenses | 1,594 | 1,685 | 1,652 | |||||||||
|
|
|
|
|
| |||||||
Non-GAAP operating income | $ | 11,857 | $ | 11,658 | $ | 11,446 | ||||||
|
|
|
|
|
| |||||||
GAAP operating income as a percentage of product sales | 45.5% | 45.8% | 44.7% | |||||||||
Adjustments to cost of sales | 4.9 | 5.2 | 5.7 | |||||||||
Adjustments to research and development expenses | 0.4 | 0.3 | 0.3 | |||||||||
Adjustments to selling, general and administrative expenses | 0.5 | 0.4 | 0.8 | |||||||||
Certain net charges pursuant to our restructuring initiative(b) | 0.0 | 0.4 | 0.2 | |||||||||
Certain other expenses | 0.0 | 0.0 | 0.0 | |||||||||
Acquisition-related adjustments(c) | 1.3 | 1.4 | 0.0 | |||||||||
Expense related to legal proceedings | 0.0 | 0.0 | 0.6 | |||||||||
|
|
|
|
|
| |||||||
Non-GAAP operating income as a percentage of product sales | 52.6% | 53.5% | 52.3% | |||||||||
|
|
|
|
|
| |||||||
GAAP interest and other income, net | $ | 674 | $ | 928 | $ | 629 | ||||||
Adjustments to other income(d) | (68) | — | — | |||||||||
|
|
|
|
|
| |||||||
Non-GAAP interest and other income, net | $ | 606 | $ | 928 | $ | 629 | ||||||
|
|
|
|
|
| |||||||
GAAP income before income taxes | $ | 9,545 | $ | 9,597 | $ | 9,163 | ||||||
Adjustments to operating expenses | 1,594 | 1,685 | 1,652 | |||||||||
Adjustments to other income(d) | (68) | — | — | |||||||||
|
|
|
|
|
| |||||||
Non-GAAP income before income taxes | $ | 11,071 | $ | 11,282 | $ | 10,815 | ||||||
|
|
|
|
|
| |||||||
GAAP provision for income taxes | $ | 1,151 | $ | 7,618 | $ | 1,441 | ||||||
Adjustments to provision for income taxes: | ||||||||||||
Income tax effect of the above adjustments(e) | 362 | 538 | 525 | |||||||||
Other income tax adjustments(f) | (15) | (6,120) | 64 | |||||||||
|
|
|
|
|
| |||||||
Total adjustments to provision for income taxes | 347 | (5,582) | 589 | |||||||||
|
|
|
|
|
| |||||||
Non-GAAP provision for income taxes | $ | 1,498 | $ | 2,036 | $ | 2,030 | ||||||
|
|
|
|
|
| |||||||
GAAP tax as a percentage of income before taxes | 12.1% | 79.4% | 15.7% | |||||||||
Adjustments to provision for income taxes: | ||||||||||||
Income tax effect of the above adjustments(e) | 1.6 | -7.1 | 2.5 | |||||||||
Other income tax adjustments(f) | -0.2 | -54.3 | 0.6 | |||||||||
|
|
|
|
|
| |||||||
Total adjustments to provision for income taxes | 1.4 | -61.4 | 3.1 | |||||||||
|
|
|
|
|
| |||||||
Non-GAAP tax as a percentage of income before taxes | 13.5% | 18.0% | 18.8% | |||||||||
|
|
|
|
|
| |||||||
GAAP net income | $ | 8,394 | $ | 1,979 | $ | 7,722 | ||||||
Adjustments to net income: | ||||||||||||
Adjustments to income before income taxes, net of the income tax effect | 1,164 | 1,147 | 1,127 | |||||||||
Other income tax adjustments(f) | 15 | 6,120 | (64) | |||||||||
|
|
|
|
|
| |||||||
Total adjustments to net income | 1,179 | 7,267 | 1,063 | |||||||||
|
|
|
|
|
| |||||||
Non-GAAP net income | $ | 9,573 | $ | 9,246 | $ | 8,785 | ||||||
|
|
|
|
|
| |||||||
ï 2019 Proxy Statement B-2
Table of Contents
|
Appendix B
|
|
Amgen Inc.
GAAP toNon-GAAP Reconciliations
(In millions, except per-share data)
(Unaudited)
The following table presents the computations for GAAP andnon-GAAP diluted earnings per share.
| Years ended December 31, | ||||||||||||||||||||||||
| 2018 | 2017 | 2016 | ||||||||||||||||||||||
| GAAP | Non-GAAP | GAAP | Non-GAAP | GAAP | Non-GAAP | |||||||||||||||||||
Net income | $ | 8,394 | $ | 9,573 | $ | 1,979 | $ | 9,246 | $ | 7,722 | $ | 8,785 | ||||||||||||
|
|
|
|
|
|
|
|
|
|
|
| |||||||||||||
Shares | ||||||||||||||||||||||||
Weight-average shares for basic EPS | 661 | 661 | 731 | 731 | 748 | 748 | ||||||||||||||||||
Effect of dilutive securities | 4 | 4 | 4 | 4 | 6 | 6 | ||||||||||||||||||
|
|
|
|
|
|
|
|
|
|
|
| |||||||||||||
Weighted-average shares for diluted EPS | 665 | 665 | 735 | 735 | 754 | 754 | ||||||||||||||||||
|
|
|
|
|
|
|
|
|
|
|
| |||||||||||||
Diluted earnings per share | $ | 12.62 | $ | 14.40 | $ | 2.69 | $ | 12.58 | $ | 10.24 | $ | 11.65 | ||||||||||||
|
|
|
|
|
|
|
|
|
|
|
| |||||||||||||
| (a) | The adjustments related primarily to noncash amortization of intangible assets acquired in business combinations. |
| (b) | For the year ended December 31, 2017, the adjustment related primarily to severance expenses associated with our restructuring initiative. For the year ended December 31, 2016, the adjustment related primarily to asset-related charges associated with our site closures. |
| (c) | For the years ended December 31, 2018 and 2017, the adjustments related primarily to impairments of intangible assets acquired in business combinations. |
| (d) | For the year ended December 31, 2018, the adjustment related to the net gain associated with the Kirin-Amgen share acquisition. |
| (e) | The tax effect of the adjustments between our GAAP andnon-GAAP results takes into account the tax treatment and related tax rate(s) that apply to each adjustment in the applicable tax jurisdiction(s). Generally, this results in a tax impact at the U.S. marginal tax rate for certain adjustments, including the majority of amortization of intangible assets, whereas the tax impact of other adjustments, including restructuring expense, depends on whether the amounts are deductible in the respective tax jurisdictions and the applicable tax rate(s) in those jurisdictions. Due to these factors, the effective tax rates for the adjustments to our GAAP income before income taxes, for the year ended December 31, 2018, was 23.7% compared with 31.9% and 31.8% for 2017 and 2016, respectively. |
| (f) | For the year ended December 31, 2017, the adjustment related primarily to the impact of U.S. Corporate tax reform, including the repatriation tax on accumulated foreign earnings and the remeasurement of certain net deferred and other tax liabilities. |
B-3 ï 2019 Proxy Statement
Table of Contents
| ||
Amgen Inc. One Amgen Center Drive Thousand Oaks, CA 91320-1799 |

 Printed on recycled paper Printed on recycled paper | ©2019 Amgen Inc. All Rights Reserved |
Table of Contents
 | ||||||||||||
SAMPLE |
| NO POSTAGE NECESSARY IF MAILED IN THE UNITED STATES | ||||||||||
| ||||||||||||
BUSINESS REPLY MAIL FIRST-CLASS MAIL PERMIT NO. 67 THOUSAND OAKS CA | ||||||||||||
| POSTAGE WILL BE PAID BY ADDRESSEE | ||||||||||||
ANNUAL MEETING AMGEN | ||||||||||||
PO BOX 2605 | ||||||||||||
SEAL BEACH CA 90740-9906 | ||||||||||||


Table of Contents
SAMPLE
Only Amgen Inc. stockholders with admittance tickets will be admitted to the 2019 Annual Meeting of Stockholders. Each stockholder is entitled to one admittance ticket. If you come to the meeting and do not have an admittance ticket, you will be admitted only upon presentation of proper identification and evidence of stock ownership as of March 22, 2019. Ensuring the 2019 Annual Meeting of Stockholders is safe and productive is our top priority. As such, failure to follow these admission procedures may result in being denied admission. Because seating in the main meeting room is limited, and in order to be able to address security concerns, we reserve the right to direct attendees to view the meeting in an overflow room.
| ☐ | Please send me an admittance ticket for the Amgen Inc. 2019 Annual Meeting of Stockholders to be held on Tuesday, May 21, 2019, at 11:00 A.M., local time, in Westlake Village, California. |
| ||||||||
Name | (Please print) | |||||||
| ||||||||
| Address | ||||||||
| ( ) | |||||||
| ||||||||
| City | State | Zip | Telephone No. (Please provide) | |||||
YOU DO NOT NEED TO RETURN THIS CARD IF YOU DO NOT PLAN TO ATTEND
THE 2019 ANNUAL MEETING OF STOCKHOLDERS.
Table of Contents
SAMPLE
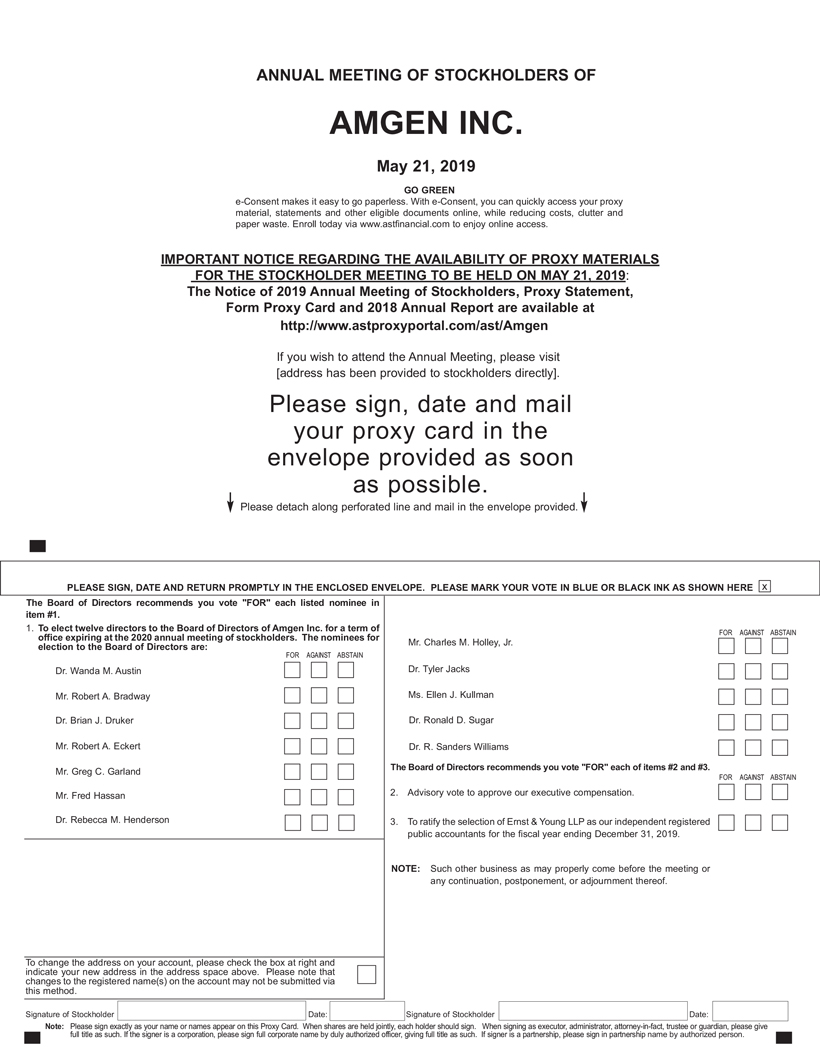
ANNUAL MEETING OF STOCKHOLDERS OF AMGEN INC. May 21, 2019 GO GREEN e-Consent makes it easy to go paperless. With e-Consent, you can quickly access your proxy material, statements and other eligible documents online, while reducing costs, clutter and paper waste. Enroll today via www.astfinancial.com to enjoy online access. IMPORTANT NOTICE REGARDING THE AVAILABILITY OF PROXY MATERIALS FOR THE STOCKHOLDER MEETING TO BE HELD ON MAY 21, 2019: The Notice of 2019 Annual Meeting of Stockholders, Proxy Statement, Form Proxy Card and 2018 Annual Report are available at http://www.astproxyportal.com/ast/Amgen If you wish to attend the Annual Meeting, please visit [address has been provided to stockholders directly]. Please sign, date and mail your proxy card in the envelope provided as soon as possible. Please detach along perforated line and mail in the envelope provided. PLEASE SIGN, DATE AND RETURN PROMPTLY IN THE ENCLOSED ENVELOPE. PLEASE MARK YOUR VOTE IN BLUE OR BLACK INK AS SHOWN HERE x The Board of Directors recommends you vote “FOR” each listed nominee in item #1. 1. To elect twelve directors to the Board of Directors of Amgen Inc. for a term of office expiring at the 2020 annual meeting of stockholders. The nominees for election to the Board of Directors are: FOR AGAINST ABSTAIN Dr. Wanda M. Austin Mr. Robert A. Bradway Dr. Brian J. Druker Mr. Robert A. Eckert Mr. Greg C. Garland Mr. Fred Hassan Dr. Rebecca M. Henderson Mr. Charles M. Holley, Jr. Dr. Tyler Jacks Ms. Ellen J. Kullman Dr. Ronald D. Sugar Dr. R. Sanders Williams The Board of Directors recommends you vote “FOR” each of items #2 and #3. 2. Advisory vote to approve our executive compensation. 3. To ratify the selection of Ernst & Young LLP as our independent registered public accountants for the fiscal year ending December 31, 2019. NOTE: Such other business as may properly come before the meeting or any continuation , postponement, or adjournment thereof. To change the address on your account, please check the box at right and indicate your new address in the address space above. Please note that changes to the registered name(s) on the account may not be submitted via this method. Signature of Stockholder Date: Signature of Stockholder Date: Note: Please sign exactly as your name or names appear on this Proxy Card. When shares are held jointly, each holder should sign. When signing as executor, administrator, attorney-in-fact, trustee or guardian, please give full title as such. If the signer is a corporation, please sign full corporate name by duly authorized officer, giving full title as such. If signer is a partnership, please sign in partnership name by authorized person.
Table of Contents
SAMPLE
This Proxy Card will be voted as specified or, if no choice is specified, will be voted FOR the election of the named director nominees, FOR the advisory vote to approve our executive compensation, and FOR ratification of the selection of Ernst & Young LLP as our independent registered public accountant. As of the date hereof, the undersigned hereby acknowledges receipt of the 2019 Proxy Statement and accompanying Notice of 2019 Annual Meeting of Stockholders to be held on May 21, 2019, Form Proxy Card and the 2018 Annual Report. In their discretion, the Proxy Holders (as defined below) are authorized to vote upon such other matters as may properly come before the 2019 Annual Meeting of Stockholders and at any continuation, postponement, or adjournment thereof. The Board of Directors, at present, knows of no other business to be presented at the 2019 Annual Meeting of Stockholders. By signing this proxy you revoke all prior proxies. This proxy will be governed by the laws of the State of Delaware and federal securities laws. AMGEN INC. ONE AMGEN CENTER DRIVE, THOUSAND OAKS, CA 91320-1799 PROXY SOLICITED BY THE BOARD OF DIRECTORS FOR THE 2019 ANNUAL MEETING OF STOCKHOLDERS TO BE HELD ON MAY 21, 2019 Robert A. Bradway, David W. Meline and Jonathan P. Graham (the “Proxy Holders”), or any of them, each with the power of substitution, hereby are authorized to represent the undersigned, with all powers which the undersigned would possess if personally present, to vote the shares of Amgen Inc. Common Stock of the undersigned at the 2019 Annual Meeting of Stockholders of Amgen Inc., to be held on Tuesday, May 21, 2019, at 11:00 A.M., local time, at the Four Seasons Hotel Westlake Village, Two Dole Drive, Westlake Village, CA 91362, and at any continuation, postponement, or adjournment of that meeting, upon and in respect of the following matters and in accordance with the following instructions, with discretionary authority as to any and all other business that may properly come before the meeting. You are encouraged to specify your choices by marking the appropriate boxes, SEE REVERSE SIDE, but you need not mark any boxes if you wish to vote in accordance with the Board of Directors’ recommendations. PLEASE MARK, SIGN, DATE, AND RETURN PROMPTLY USING THE ENCLOSED ENVELOPE. (Continued and to be signed on the reverse side) 1-1 14475
Table of Contents
SAMPLE
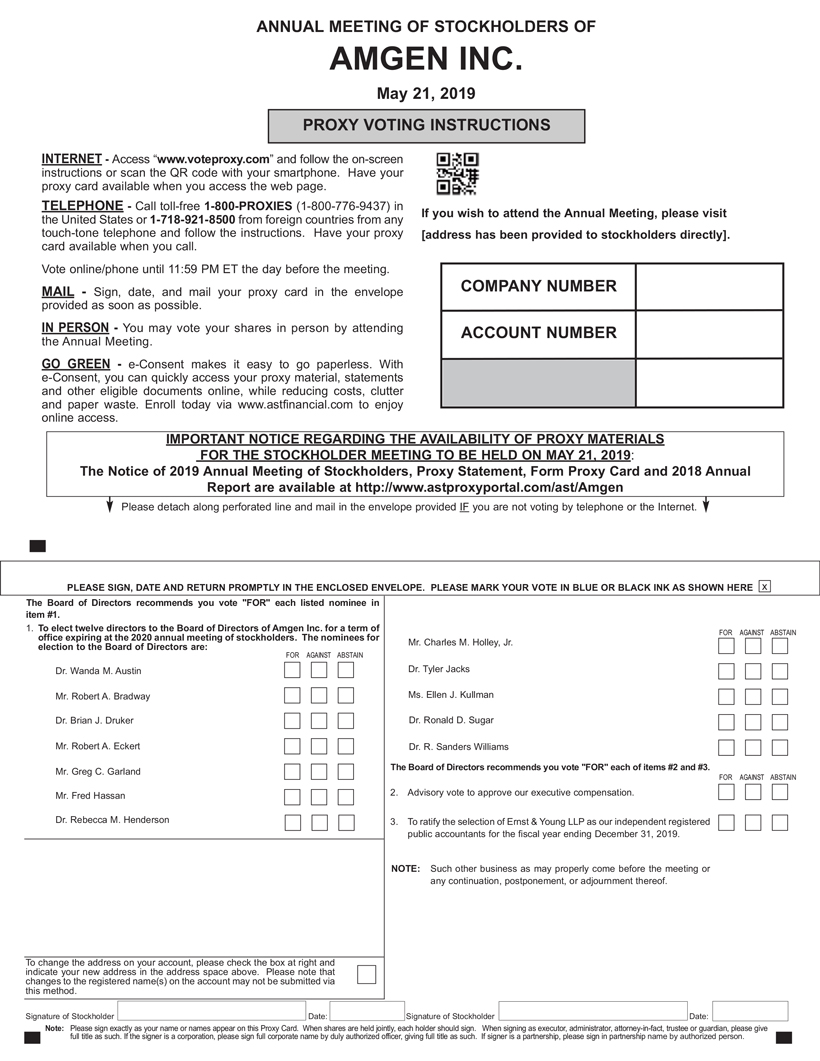
ANNUAL MEETING OF STOCKHOLDERS OF AMGEN INC. May 21, 2019 PROXY VOTING INSTRUCTIONS INTERNET - Access “www.voteproxy.com” and follow the on-screen instructions or scan the QR code with your smartphone. Have your proxy card available when you access the web page. TELEPHONE - Call toll-free 1-800-PROXIES (1-800-776-9437) in the United States or 1-718-921-8500 from foreign countries from any touch-tone telephone and follow the instructions. Have your proxy card available when you call. Vote online/phone until 11:59 PM ET the day before the meeting. MAIL - Sign, date, and mail your proxy card in the envelope provided as soon as possible. IN PERSON- You may vote your shares in person by attending the Annual Meeting. GO GREEN - e-Consent makes it easy to go paperless. With e-Consent, you can quickly access your proxy material, statements and other eligible documents online, while reducing costs, clutter and paper waste. Enroll today via www.astfinancial.com to enjoy online access. If you wish to attend the Annual Meeting, please visit [address has been provided to stockholders directly]. COMPANY NUMBER ACCOUNT NUMBER IMPORTANT NOTICE REGARDING THE AVAILABILITY OF PROXY MATERIALS FOR THE STOCKHOLDER MEETING TO BE HELD ON MAY 21, 2019: The Notice of 2019 Annual Meeting of Stockholders, Proxy Statement, Form Proxy Card and 2018 Annual Report are available at http://www.astproxyportal.com/ast/Amgen Please detach along perforated line and mail in the envelope provided IF you are not voting by telephone or the Internet. PLEASE SIGN, DATE AND RETURN PROMPTLY IN THE ENCLOSED ENVELOPE. PLEASE MARK YOUR VOTE IN BLUE OR BLACK INK AS SHOWN HERE x The Board of Directors recommends you vote ”FOR” each listed nominee in item #1. 1. To elect twelve directors to the Board of Directors of Amgen Inc. for a term of office expiring at the 2020 annual meeting of stockholders. The nominees for election to the Board of Directors are: FOR AGAINST ABSTAIN Dr. Wanda M. Austin Mr. Robert A. Bradway Dr. Brian J. Druker Mr. Robert A. Eckert Mr. Greg C. Garland Mr. Fred Hassan Dr. Rebecca M. Henderson Mr. Charles M. Holley, Jr. Dr. Tyler Jacks Ms. Ellen J. Kullman Dr. Ronald D. Sugar Dr. R. Sanders Williams The Board of Directors recommends you vote “FOR” each of items #2 and #3. 2. Advisory vote to approve our executive compensation. 3. To ratify the selection of Ernst & Young LLP as our independent registered public accountants for the fiscal Year ending December 31, 2019. NOTE: Such other business as may properly come before the meeting or any continuation, postponement, or adjournment thereof. To change the address on your account, please check the box at right and indicate your new address in the address space above. Please note that changes to the registered name(s) on the account may not be submitted via this method. Signature of Stockholder Date: Signature of Stockholder Date: Note: Please sign exactly as your name or names appear on this Proxy Card. When shares are held jointly, each holder should sign. When signing as executor, administrator, attorney-in-fact, trustee or guardian, please give full title as such. If the signer is a corporation, please sign full corporate name by duly authorized officer, giving full title as such. If signer is a partnership, please sign in partnership name by authorized person.
Table of Contents
SAMPLE

This Proxy Card will be voted as specified or, if no choice is specified, will be voted FOR the election of the named director nominees, FOR the advisory vote to approve our executive compensation, and FOR ratification of the selection of Ernst & Young LLP as our independent registered public accountant. As of the date hereof, the undersigned hereby acknowledges receipt of the 2019 Proxy Statement and accompanying Notice of 2019 Annual Meeting of Stockholders to be held on May 21, 2019, Form Proxy Card and the 2018 Annual Report. In their discretion, the Proxy Holders (as defined below) are authorized to vote upon such other matters as may properly come before the 2019 Annual Meeting of Stockholders and at any continuation, postponement, or adjournment thereof. The Board of Directors, at present, knows of no other business to be presented at the 2019 Annual Meeting of Stockholders. By signing this proxy you revoke all prior proxies. This proxy will be governed by the laws of the State of Delaware and federal securities laws. AMGEN INC. ONE AMGEN CENTER DRIVE, THOUSAND OAKS, CA 91320-1799 PROXY SOLICITED BY THE BOARD OF DIRECTORS FOR THE 2019 ANNUAL MEETING OF STOCKHOLDERS TO BE HELD ON MAY 21, 2019 Robert A. Bradway, David W. Meline and Jonathan P. Graham (the “Proxy Holders”), or any of them, each with the power of substitution, hereby are authorized to represent the undersigned, with all powers which the undersigned would possess if personally present, to vote the shares of Amgen Inc. Common Stock of the undersigned at the 2019 Annual Meeting of Stockholders of Amgen Inc., to be held on Tuesday, May 21, 2019, at 11:00 A.M., local time, at the Four Seasons Hotel Westlake Village, Two Dole Drive, Westlake Village, CA 91362, and at any continuation, postponement, or adjournment of that meeting, upon and in respect of the following matters and in accordance with the following instructions, with discretionary authority as to any and all other business that may properly come before the meeting. You are encouraged to specify your choices by marking the appropriate boxes, SEE REVERSE SIDE, but you need not mark any boxes if you wish to vote in accordance with the Board of Directors’ recommendations. PLEASE MARK, SIGN, DATE, AND RETURN PROMPTLY USING THE ENCLOSED ENVELOPE. (Continued and to be signed on the reverse side) 1-1 14475