Table of Contents
UNITED STATES
SECURITIES AND EXCHANGE COMMISSION
Washington, D.C. 20549
FORM N-CSR
CERTIFIED SHAREHOLDER REPORT OF REGISTERED
MANAGEMENT INVESTMENT COMPANIES
Investment Company Act file number 811-03074
Northeast Investors Growth Fund
(Exact name of registrant as specified in charter)
100 High Street
Boston, MA 02110
(Address of principal executive offices) (Zip code)
Robert Kane
100 High Street
Boston, MA 02110
(Name and address of agent for service)
Registrant’s telephone number, including area code: 617-523-3588
Date of fiscal year end: December 31
Date of reporting period: June 30, 2012
Form N-CSR is to be used by management investment companies to file reports with the Commission not later than 10 days after the transmission to stockholders of any report that is required to be transmitted to stockholders under Rule 30e-1 under the Investment Company Act of 1940 (17 CFR 270.30e-1). The Commission may use the information provided on Form N-CSR in its regulatory, disclosure review, inspection, and policymaking roles.
A registrant is required to disclose the information specified by Form N-CSR, and the Commission will make this information public. A registrant is not required to respond to the collection of information contained in Form N-CSR unless the Form displays a currently valid Office of Management and Budget (“OMB”) control number. Please direct comments concerning the accuracy of the information collection burden estimate and any suggestions for reducing the burden to Secretary, Securities and Exchange Commission, 450 Fifth Street, NW, Washington, DC 20549-0609. The OMB has reviewed this collection of information under the clearance requirements of 44 U.S.C. 3507.
Table of Contents
| Item 1. | Reports to Stockholders. |
Table of Contents

A NO-LOAD FUND
Semi-Annual Report
For the Period Ended
June 30, 2012
Table of Contents
| 1 | ||||
| 3 | ||||
| 6 | ||||
| 8 | ||||
| 10 | ||||
| 13 | ||||
| 14 | ||||
| 19 |
Table of Contents
The Northeast Investors Growth Fund (the “Fund”) performed well on an absolute level, with a total return of +7.89%, during the first half of 2012; on a relative basis, though, we underperformed our benchmark, the S&P 500 Index, which returned +9.49%. The first half of this year was interesting, but a bit reminiscent of recent years. The U.S. equity markets rose on positive U.S. economic and corporate news in the first quarter, and then retrenched on negative macroeconomic news, largely emanating from Europe, in the second quarter. This push and pull effect, depending upon the macro-environment, has not been fully resolved. However, the market reacted favorably in June to news emanating from the EU Summit which may help to stabilize the Euro zone and world markets.
The first quarter of this year was tremendous. We saw dramatic movements in the performance of the most economically sensitive sectors — Financials, Information Technology, Consumer Discretionary, Industrials and Materials — as these sectors were up between 10% to 21%. It appeared that the U.S. job market was recovering, our housing market was bottoming, unemployment numbers were improving, and Europe was not going to fall into the abyss.
Markets turned sharply in the second quarter as it seemed that Europe was actually falling into the abyss. Asia, the growth engine for the world, was slowing, and the world feared its slowdown could compound the recession in Europe and negatively impact growth in the U.S. In addition, the warm U.S. winter pulled forward some economic activity from the second quarter into the first. Markets reacted swiftly, and cyclically sensitive sectors retreated quickly. Financials, Information Technology, and Energy pulled back roughly 7% while the more defensive sectors, Telecom and Utilities, rallied sharply. This rapid change in leadership among sectors was harmful to our performance as we are more cyclically positioned and had no exposure to companies in the Telecom or Utility sectors. Still, the Fund had a number of strong performers for the first half that helped us maintain honorable performance in a less than perfect investing environment: Apple Inc. (+44%), Walt Disney Co. (+29%), Wells Fargo & Co. (+23%), Visa Inc (+22%), U.S. Bancorp (+20%) and American Tower (+17%).
As mentioned, Financials had a robust start to 2012 after ending 2011 as the year’s worst performing sector. The Fund benefited from our investments in Wells Fargo, U.S. Bancorp and American Tower (which, when it converted to a REIT, was reclassified to this sector). We maintained a modest overweight in this sector and focused on high-quality companies with more exposure to the recovering U.S. economy. This served the Fund relatively well as quality, domestically-focused banks held steady. On balance, we see continued gains for the Fund in this area as the U.S. economy continues its recovery, and we maintain this sector exposure.
The decision to concentrate exposure in Technology has proved to be a good one. We maintained a healthy position in Apple Inc., approximately 7% of the Fund’s holding. Though Apple pulled back from its peak of $644 per share in the first quarter, it still ended the first half as the best performer in the Fund. Sales of iPhones continued to be brisk. We are confident continued innovation will allow Apple to maintain a favorable position in the expanding smartphone market, as well as attract more worldwide users to its iPads and computers. Other companies in the Technology space that have done well — EMC, and Oracle, for instance — are leaders in the movement toward out-sourcing, remote data storage, and virtualizing workspaces. They all fall under the growing movement of cloud computing. As businesses work to increase efficiencies and decrease technology costs, these companies provide the necessary software and hardware to achieve these goals.
Performance was hindered by the Fund’s slight overweight in the Energy area. Demand for commodities decreased as the world economies slowed. Additional supplies of oil also
Page 1
Table of Contents
came on the market, only serving to push prices lower. West Texas Intermediate crude, which reached a peak of $110 per barrel on March 1st, slid to a low of $77 per barrel on June 28th — a fall of about 30% in four months. Our investments in the Energy sector were affected because of this near-term threat of a slower-growing global economy. But, as the macroeconomic news improved at the end of June, these companies staged a rally. WTI now is trading in the range of $94 per barrel and the performance of many of our Energy investments have turned positive.
Looking toward the end of year, there are a few issues that give us pause, despite the favorable year-to-date performance in the stock market. The “Bush-era” tax cuts are set to expire at the end of this year, and a number of automatic spending cuts are set to go into effect. Many are referring to this as a “fiscal cliff.” The impact of these changes on the moderate GDP growth we are now experiencing could be significant. Some economists predict it could result in anywhere from a 2% - 5% drag on the U.S. economy, bringing GDP growth into negative territory from its current levels of less than 2%. Congress needs to act in a coordinated manner and make some compromises to prevent this event. We are concerned, in today’s partisan environment, that Congress will not be able to make the necessary compromise before the November elections, and also concerned they will not be able to act quickly enough during the 21 working days between the election and the end of the year. While we optimistically believe that Congress will ultimately pull some sort of rabbit out of the hat in the end and prevent us from falling off the “fiscal cliff” in its entirety, we expect there will be some degree of fiscal tightening.
Still, when reviewing the state of the U.S. economy, we see many areas that give us hope. The U.S. housing market appears to have bottomed, possibly setting the stage for a strengthening recovery. Low mortgage rates, rising rental rates, and a more confident consumer are serving to boost this lagging sector. Seeing signs of life again in the sector that largely caused the “Great Recession” should provide a stronger backbone to both the domestic and global economic recoveries. We also see some improvement in our job market; though more so in the private sector as the public sector continues to shed jobs to balance state budgets. Additionally, consumers continue to repair their balance sheets from years of overleverage. Lastly, the Euro zone is working on a framework to allow the Euro to move toward a banking union. Though this will take time, it would help their banking system recapitalize. In sum, we are cautiously optimistic going into the second half of 2012.
We welcome and encourage you to contact us with any questions, concerns or comments. Please call us directly or visit our website at www.northeastinvest.com where you can view the Fund’s closing price, portfolio composition, and historical performance. If you follow your investments on-line, the ticker symbol for the Fund is NTHFX. Our lines of communication are always open to our most important partners, our fellow shareholders. We continue to appreciate your support.
 |  | |
William A. Oates, Jr. | John F. Francini | |
| ||
Nancy M. Mulligan | ||
August 2012 | ||

Page 2
Table of Contents
Average Annual Total Return (unaudited)
| One year ended June 30, 2012 | -0.85 | % | ||
| Five years ended June 30, 2012 | -1.47 | % | ||
| Ten years ended June 30, 2012 | 4.23 | % |
Performance Graph — (Ten Years) (unaudited)
The following graph compares the cumulative total shareholder return on the Northeast Investors Growth Fund shares over the ten preceding years to the cumulative total return on the Standard & Poor’s 500 Index, assuming an investment of $10,000 in both at their closing prices on December 31, 2001 and reinvestment of dividends and capital gains. The graph does not reflect the deduction of taxes that a shareholder would pay on Fund distributions or the redemption of Fund shares. Keep in mind that past performance does not guarantee future returns, and an investment in the Fund is not guaranteed. For management’s discussion of the Growth Fund’s 2012 performance, including strategies and market conditions which influenced such performance, see the President’s letter to shareholders.
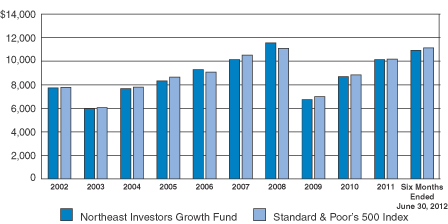
| 2002 | 2003 | 2004 | 2005 | 2006 | 2007 | 2008 | 2009 | 2010 | 2011 | Six Months Ended June 30, 2012 | ||||||||||||||||||||||||||||||||||
| Northeast Investors Growth Fund | $ | 7,733 | $ | 5,980 | $ | 7,678 | $ | 8,335 | $ | 9,283 | $ | 10,141 | $ | 11,551 | $ | 6,744 | $ | 8,704 | $ | 10,129 | $ | 10,929 | ||||||||||||||||||||||
| Standard & Poor’s 500 Index | $ | 7,790 | $ | 6,068 | $ | 7,809 | $ | 8,658 | $ | 9,084 | $ | 10,518 | $ | 11,094 | $ | 6,989 | $ | 8,839 | $ | 10,172 | $ | 11,137 | ||||||||||||||||||||||
Page 3
Table of Contents
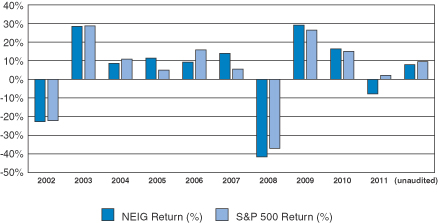
Returns and Per Share Data
Year Ended December 31, | Six Months Ended June 30, 2012 (unaudited) | |||||||||||||||||||||||||||||||||||||||||||
| 2002 | 2003 | 2004 | 2005 | 2006 | 2007 | 2008 | 2009 | 2010 | 2011 | |||||||||||||||||||||||||||||||||||
| Net Asset Value | 11.91 | 15.26 | 16.52 | 18.40 | 20.10 | 20.19 | 11.74 | 15.15 | 17.60 | 16.22 | 17.50 | |||||||||||||||||||||||||||||||||
| Income Dividend | 0.02 | 0.03 | 0.05 | 0.00 | 0.00 | 0.04 | 0.05 | 0.00 | 0.03 | 0.00 | 0.00 | |||||||||||||||||||||||||||||||||
| Capital Gains Dist. | 0.00 | 0.00 | 0.00 | 0.00 | 0.00 | 2.60 | 0.00 | 0.00 | 0.00 | 0.00 | 0.00 | |||||||||||||||||||||||||||||||||
| NEIG Return (%) | -22.67 | 28.39 | 8.56 | 11.38 | 9.24 | 13.90 | -41.61 | 29.05 | 16.38 | -7.84 | 7.89 | |||||||||||||||||||||||||||||||||
| S&P 500 Return (%) | -22.10 | 28.68 | 10.88 | 4.91 | 15.79 | 5.48 | -37.00 | 26.47 | 15.07 | 2.11 | 9.49 | |||||||||||||||||||||||||||||||||
Quarterly Portfolio Holdings
Each fiscal quarter-end the Fund is required to file a complete schedule of investments with the Securities and Exchange Commission. The schedules of portfolio holdings for the second and fourth quarters appear in the semi-annual and annual reports to shareholders. For the first and third quarters, the Fund files the schedules of portfolio holdings with the SEC on Form N-Q. The Fund makes the information on Form N-Q available on its website at www.northeastinvest.com or upon request.
Shareholders may also access and review information and reports of the Fund, including Form N-Q, at the SEC’s Public Reference Room in Washington, D.C. You can call the SEC at 1-202-942-8090 for information about the operation of the Public Reference Room. Reports and other information about the Fund are available on the SEC’s internet site at http://www.sec.gov. and copies may be obtained for a duplicating fee by electronic request at the following e-mail address: publicinfo@sec.gov or by writing the Public Reference Center of the Securities and Exchange Commission, Washington, D.C. 20549-0102. The Fund’s reference number as a registrant under the Investment Company Act of 1940 is 811-3074.
Page 4
Table of Contents
About your Fund’s Expenses (unaudited)
| Annualized Expense Ratio | Beginning Account Value 12/31/2011 | Ending Account Value 6/30/2012 | Expenses Paid During Period 12/31/2011 - 6/30/2012 | |||||||||||||
Actual Return | 1.46 | % | $ | 1,000.00 | $ | 1,078.90 | $ | 7.81 | ||||||||
Hypothetical | 1.46 | % | $ | 1,000.00 | $ | 1,017.67 | $ | 7.32 | ||||||||
Example:
As a shareholder of the Fund, you incur ongoing costs, including management fees, and other fund expenses. This example is intended to help you understand these expenses of investing in the fund and to compare these costs with the ongoing costs of investing in other mutual funds.
The Example is based on an investment of $1,000 invested at the beginning of the period and held for the entire period, 12/31/2011 - 6/30/2012.
Actual Expenses:
The first line of the table above provides information about actual account values and actual expenses. You may use the information in this line, together with the amount you invested, to estimate the expenses that you paid over the period. Simply divide your account value by $1,000 (for example, an $8,600 account value divided by $1,000 = 8.6), then multiply the result by the number in the first line under the heading entitled “Expenses Paid During Period” to estimate the expenses you paid on you account during this period.
Hypothetical Example for Comparison Purposes:
The second line of the table above provides information about hypothetical account values and hypothetical expenses based on the Fund’s actual expense ratio and an assumed rate of return of 5% per year before expenses, which is not the Fund’s actual return. The hypothetical account values and expenses may not be used to estimate the actual ending account balance or expenses you paid for the period. You may use this information to compare the ongoing costs of investing in the Fund and other funds. To do so, compare this 5% hypothetical example with the 5% hypothetical examples that appear in the shareholder reports of other funds.
Page 5
Table of Contents
Ten Largest Investment Holdings (unaudited)
June 30, 2012
| Market Value | Percent of Net Assets | |||||||
Apple, Inc. | $ | 5,402,000 | 7.07% | |||||
American Tower Corp., Class A | 2,896,441 | 3.79% | ||||||
Walt Disney Co. | 2,869,988 | 3.75% | ||||||
Wells Fargo & Co. | 2,775,520 | 3.63% | ||||||
Qualcomm, Inc. | 2,544,576 | 3.33% | ||||||
Exxon Mobil Corp. | 2,462,876 | 3.22% | ||||||
EMC Corp. | 2,434,850 | 3.18% | ||||||
Oracle Corp. | 2,390,850 | 3.13% | ||||||
Schlumberger Ltd. | 2,291,323 | 3.00% | ||||||
Diageo PLC, ADR | 2,277,847 | 2.98% | ||||||
Summary of Sector Weightings as a Percentage of Net Assets (unaudited)
June 30, 2012
| Major Sectors | Market Value | Northeast Investors Growth Fund | S&P 500 Index | |||||||||
Consumer Discretionary | $ | 9,210,310 | 12.05% | 10.96% | ||||||||
Consumer Staples | $ | 8,163,933 | 10.68% | 11.29% | ||||||||
Energy | $ | 10,236,424 | 13.39% | 10.80% | ||||||||
Financials | $ | 12,244,216 | 16.01% | 14.41% | ||||||||
Health Care | $ | 9,284,017 | 12.14% | 11.99% | ||||||||
Industrials | $ | 9,026,754 | 11.81% | 10.46% | ||||||||
Information Technology | $ | 17,744,414 | 23.21% | 19.74% | ||||||||
Materials | $ | — | 0.00% | 3.41% | ||||||||
Telecommunication Services | $ | — | 0.00% | 3.21% | ||||||||
Utilities | $ | — | 0.00% | 3.73% | ||||||||
Cash, other assets and liabilities | $ | 539,005 | 0.71% | 0.00% | ||||||||
|
|
|
| |||||||||
| 100.00% | 100.00% | |||||||||||
|
|
|
| |||||||||
Page 6
Table of Contents
Summary of Net Assets by Industry
June 30, 2012 (unaudited)
| Market Value | % of Net Assets | |||||||
Common Stocks | ||||||||
Aerospace & Defense | $ | 2,358,200 | 3.09% | |||||
Air Freight & Logistics | 1,756,348 | 2.30% | ||||||
Apparel & Accessories | 2,923,133 | 3.82% | ||||||
Asset Management & Custodian | 1,706,216 | 2.23% | ||||||
Beverages | 4,231,345 | 5.54% | ||||||
Communications Equipment | 2,544,576 | 3.33% | ||||||
Computer Hardware | 5,402,000 | 7.07% | ||||||
Computer Storage & Peripherals | 2,434,850 | 3.18% | ||||||
Construction & Farming | 1,767,009 | 2.31% | ||||||
Data Processing & Outsourced Services | 1,755,546 | 2.30% | ||||||
Diversified Banks | 4,949,536 | 6.47% | ||||||
Drug Retail | 2,079,485 | 2.72% | ||||||
Footwear | 2,080,386 | 2.72% | ||||||
Health Care Equipment | 1,916,113 | 2.51% | ||||||
Industrial Conglomerate | 1,200,444 | 1.57% | ||||||
Integrated Oil & Gas | 6,121,449 | 8.01% | ||||||
Internet Software & Services | 1,065,212 | 1.39% | ||||||
Investment Banking & Brokerage | 1,437,900 | 1.88% | ||||||
IT Consulting & Other Services | 2,151,380 | 2.81% | ||||||
Movies & Entertainment | 2,869,988 | 3.75% | ||||||
Oil & Gas Equipment | 4,114,975 | 5.38% | ||||||
Other Diversified Financial Services | 1,254,123 | 1.64% | ||||||
Pharmaceuticals | 7,367,904 | 9.64% | ||||||
Railroads | 1,944,753 | 2.54% | ||||||
Restaurants | 1,336,803 | 1.75% | ||||||
Soft Drinks | 1,853,103 | 2.42% | ||||||
Specialized REITs | 2,896,441 | 3.79% | ||||||
Systems Software | 2,390,850 | 3.13% | ||||||
|
|
|
| |||||
Total Common Stocks | $ | 75,910,068 | 99.29% | |||||
Total Cash Equivalents | 9,461,635 | 12.38% | ||||||
|
|
|
| |||||
Total Investment Portfolio | 85,371,703 | 111.67% | ||||||
Net Other Assets and Liabilities | (8,922,630 | ) | -11.67% | |||||
|
|
|
| |||||
Total Net Assets | $ | 76,449,073 | 100.00% | |||||
|
|
|
| |||||
Page 7
Table of Contents
6/30/2012 (unaudited)
Common Stock Sector Name of Issuer | Number of Shares | Market Value (Note B) | Percent of Net Assets | |||||||||
Consumer Discretionary | ||||||||||||
Coach, Inc. | 27,850 | $ | 1,628,668 | |||||||||
McDonald’s Corp. | 15,100 | 1,336,803 | ||||||||||
Nike, Inc. | 23,700 | 2,080,386 | ||||||||||
VF Corp.# | 9,700 | 1,294,465 | ||||||||||
Walt Disney Co. | 59,175 | 2,869,988 | ||||||||||
|
| |||||||||||
| 9,210,310 | 12.05 | % | ||||||||||
Consumer Staples | ||||||||||||
Coca-Cola Co. | 23,700 | 1,853,103 | ||||||||||
CVS Caremark Corp. | 44,500 | 2,079,485 | ||||||||||
Diageo PLC, ADR | 22,100 | 2,277,847 | ||||||||||
Nestle SA, ADR# | 32,700 | 1,953,498 | ||||||||||
|
| |||||||||||
| 8,163,933 | 10.68 | % | ||||||||||
Energy | ||||||||||||
Chevron Corp. | 18,500 | 1,951,750 | ||||||||||
Exxon Mobil Corp. | 28,782 | 2,462,876 | ||||||||||
National Oilwell Varco, Inc. | 28,300 | 1,823,652 | ||||||||||
Occidental Petroleum Corp. | 19,900 | 1,706,823 | ||||||||||
Schlumberger Ltd. | 35,300 | 2,291,323 | ||||||||||
|
| |||||||||||
| 10,236,424 | 13.39 | % | ||||||||||
Financials | ||||||||||||
American Tower Corp., Class A | 41,431 | 2,896,441 | ||||||||||
Goldman Sachs Group | 15,000 | 1,437,900 | ||||||||||
JPMorgan Chase & Co. | 35,100 | 1,254,123 | ||||||||||
T. Rowe Price Group, Inc.# | 27,100 | 1,706,216 | ||||||||||
U.S. Bancorp# | 67,600 | 2,174,016 | ||||||||||
Wells Fargo & Co. | 83,000 | 2,775,520 | ||||||||||
|
| |||||||||||
| 12,244,216 | 16.01 | % | ||||||||||
Health Care | ||||||||||||
Abbot Laboratories | 28,600 | 1,843,842 | ||||||||||
Allergan, Inc. | 21,300 | 1,971,741 | ||||||||||
Intuitive Surgical, Inc.^ | 3,460 | 1,916,113 | ||||||||||
Novartis AG, ADR | 28,000 | 1,565,200 | ||||||||||
Perrigo Co.# | 16,850 | 1,987,121 | ||||||||||
|
| |||||||||||
| 9,284,017 | 12.14 | % | ||||||||||
Page 8
Table of Contents
Common Stock Sector—(continued) Name of Issuer | Number of Shares | Market Value (Note B) | Percent of Net Assets | |||||||||||
Industrials | ||||||||||||||
Danaher Corp. | 23,050 | $ | 1,200,444 | |||||||||||
Deere & Co.# | 21,850 | 1,767,009 | ||||||||||||
Honeywell International, Inc. | 26,000 | 1,451,840 | ||||||||||||
Union Pacific Corp. | 16,300 | 1,944,753 | ||||||||||||
United Parcel Service, Inc., Class B | 22,300 | 1,756,348 | ||||||||||||
United Technologies Corp. | 12,000 | 906,360 | ||||||||||||
|
| |||||||||||||
| 9,026,754 | 11.81 | % | ||||||||||||
Information Technology | ||||||||||||||
Akamai Technologies, Inc.^ | 33,550 | 1,065,212 | ||||||||||||
Apple, Inc.^ | 9,250 | 5,402,000 | ||||||||||||
EMC Corp.^ | 95,000 | 2,434,850 | ||||||||||||
International Business Machines Corp. | 11,000 | 2,151,380 | ||||||||||||
Oracle Corp. | 80,500 | 2,390,850 | ||||||||||||
Qualcomm, Inc. | 45,700 | 2,544,576 | ||||||||||||
Visa, Inc., Class A | 14,200 | 1,755,546 | ||||||||||||
|
| |||||||||||||
| 17,744,414 | 23.21 | % | ||||||||||||
|
| |||||||||||||
Total Common Stocks — (cost—$58,393,961) | $ | 75,910,068 | 99.29 | % | ||||||||||
|
| |||||||||||||
Cash Equivalents | ||||||||||||||
State Street Bank & Trust Navigator Prime~ | 9,461,635 | |||||||||||||
|
| |||||||||||||
Total Cash Equivalents — (cost—$9,461,635) | $ | 9,461,635 | 12.38 | % | ||||||||||
|
| |||||||||||||
Total Investment Portfolio — (cost—$68,195,783) | 85,371,703 | 111.67 | % | |||||||||||
|
| |||||||||||||
Net Other Assets and Liabilities | (8,922,630 | ) | (11.67 | )% | ||||||||||
|
| |||||||||||||
Total Net Assets | $ | 76,449,073 | 100.00 | % | ||||||||||
|
| |||||||||||||
| ^ | Non-income producing security |
| # | All or a portion of this security is currently out on loan (See Note K) |
| ~ | Security held as collateral for securities on loan |
The accompanying notes are an integral part of the financial statements.
Page 9
Table of Contents
and Liabilities (unaudited)
June 30, 2012 | ||||
Assets | ||||
Investments—at market value (including securities loaned of $9,256,212) (cost $68,195,783) | $ | 85,371,703 | ||
Cash | 545,610 | |||
Dividends receivable | 117,813 | |||
Receivable for shares sold | 200 | |||
|
| |||
Total Assets | 86,035,326 | |||
Liabilities | ||||
Collateral on securities loaned, at value | 9,461,635 | |||
Accrued audit expense | 12,995 | |||
Accrued investment advisory fee | 39,210 | |||
Accrued other expenses | 58,495 | |||
Payable for shares repurchased | 13,918 | |||
|
| |||
Total Liabilities | 9,586,253 | |||
Net Assets | $ | 76,449,073 | ||
|
| |||
Net Assets Consist of: | ||||
Capital paid-in | $ | 55,818,778 | ||
Undistributed net investment income | 247,566 | |||
Accumulated net realized gain/(loss) | 2,866,621 | |||
Net unrealized appreciation/(depreciation) of investments | 17,516,108 | |||
|
| |||
Net Assets | $ | 76,449,073 | ||
|
| |||
Net Asset Value, offering price and redemption price per share | $17.50 | |||
|
| |||
The accompanying notes are an integral part of the financial statements.
Page 10
Table of Contents
Statement of Operations (unaudited)
Six Months Ended June 30, 2012 | ||||
Investment Income | ||||
Dividend income | $ | 693,241 | ||
Security lending income | 4,157 | |||
Other income | 50 | |||
|
| |||
Total Income | 697,448 | |||
Expenses | ||||
Investment advisory fee | $ | 246,246 | ||
Administration | 85,854 | |||
Legal fees | 47,775 | |||
Insurance | 34,944 | |||
Audit fees | 33,670 | |||
Transfer Agent (see note E) | 30,030 | |||
Printing, postage, and stationery | 27,300 | |||
Registration and Filing fees | 18,200 | |||
Trustee fees | 15,000 | |||
Custodian fees | 13,650 | |||
Commitment fee | 6,573 | |||
Retirement | 2,730 | |||
Interest fee | 1,236 | |||
Miscellaneous fees | 4,550 | |||
|
| |||
Total Expenses | 567,758 | |||
|
| |||
Net Investment Income | 129,690 | |||
|
| |||
Realized and Unrealized Gain (Loss) on Investments: | ||||
Net realized gain (loss) from investment transactions | $ | 3,309,265 | ||
Change in unrealized appreciation (depreciation) of investments | 2,568,113 | |||
|
| |||
Net gain (loss) on investments | 5,877,378 | |||
Net Increase (Decrease) in Net Assets Resulting from Operations | $ | 6,007,068 | ||
|
| |||
The accompanying notes are an integral part of the financial statements.
Page 11
Table of Contents
Statement of Changes
in Net Assets
Six Months Ended | Year Ended December 31, 2011 | |||||||
Increase (Decrease) in Net Assets | ||||||||
From Operations: | ||||||||
Net investment income (loss) | $ | 129,690 | $ | 117,876 | ||||
Net realized gain (loss) from investment transactions | 3,309,265 | 4,842,748 | ||||||
Change in unrealized appreciation (depreciation) of investments | 2,568,113 | (11,762,650 | ) | |||||
|
|
|
| |||||
Net Increase (Decrease) in Net Assets Resulting from Operations | 6,007,068 | (6,802,026 | ) | |||||
|
|
|
| |||||
Distributions to Shareholders from Net Investment Income | — | — | ||||||
|
|
|
| |||||
Total Distributions to Shareholders | — | — | ||||||
From Net Fund Share Transactions | (5,748,680 | ) | (10,271,070 | ) | ||||
|
|
|
| |||||
Total Increase (Decrease) in Net Assets | 258,388 | (17,073,096 | ) | |||||
Net Assets: | ||||||||
Beginning of Period | 76,190,685 | 93,263,781 | ||||||
|
|
|
| |||||
End of Period | $ | 76,449,073 | $ | 76,190,685 | ||||
|
|
|
| |||||
Undistributed Net Investment Income | $ | 247,566 | $ | 117,876 | ||||
The accompanying notes are an integral part of the financial statements.
Page 12
Table of Contents
| Six Months Ended June 30, 2012 | Year Ended December 31, | |||||||||||||||||||||||
| Per Share Data^ | (unaudited) | 2011 | 2010 | 2009 | 2008 | 2007 | ||||||||||||||||||
Net Asset Value: | ||||||||||||||||||||||||
Beginning of Period | $ | 16.22 | $ | 17.60 | $ | 15.15 | $ | 11.74 | $ | 20.19 | $ | 20.10 | ||||||||||||
|
|
|
|
|
|
|
|
|
|
|
| |||||||||||||
Income From Investment Operations: | ||||||||||||||||||||||||
Net investment income (loss) | 0.03 | 0.02 | 0.01 | 0.02 | 0.05 | 0.02 | ||||||||||||||||||
Net realized and unrealized gain (loss) on investment | 1.25 | (1.40 | ) | 2.47 | 3.39 | (8.45 | ) | 2.71 | ||||||||||||||||
|
|
|
|
|
|
|
|
|
|
|
| |||||||||||||
Total from investment operations | 1.28 | (1.38 | ) | 2.48 | 3.41 | (8.40 | ) | 2.73 | ||||||||||||||||
|
|
|
|
|
|
|
|
|
|
|
| |||||||||||||
Less Distributions: | ||||||||||||||||||||||||
Net investment income | 0.00 | 0.00 | (0.03 | ) | 0.00 | �� | (0.05 | ) | (0.04 | ) | ||||||||||||||
Capital Gain | 0.00 | 0.00 | 0.00 | 0.00 | 0.00 | –2.60 | ||||||||||||||||||
|
|
|
|
|
|
|
|
|
|
|
| |||||||||||||
Total Distributions | 0.00 | 0.00 | (0.03 | ) | 0.00 | (0.05 | ) | (2.64 | ) | |||||||||||||||
Net Asset Value: | ||||||||||||||||||||||||
End of Period | $ | 17.50 | $ | 16.22 | $ | 17.60 | $ | 15.15 | $ | 11.74 | $ | 20.19 | ||||||||||||
|
|
|
|
|
|
|
|
|
|
|
| |||||||||||||
Total Return | 7.89 | %# | –7.84 | % | 16.38 | % | 29.05 | % | –41.61 | % | 13.90 | % | ||||||||||||
Ratios & Supplemental Data | ||||||||||||||||||||||||
Net assets end of period (in thousands) | $ | 76,449 | $ | 76,191 | $ | 93,264 | $ | 92,364 | $ | 78,453 | $ | 145,440 | ||||||||||||
Ratio of operating expenses to average net assets (includes interest expense) | 1.45 | %~ | 1.40 | % | 1.39 | % | 1.60 | % | 1.27 | % | 1.10 | % | ||||||||||||
Ratio of interest expense to average net assets | 0.00 | %*~ | 0.00 | %* | 0.01 | % | 0.00 | %* | 0.00 | %* | 0.01 | % | ||||||||||||
Ratio of net investment income to average net assets | 0.33 | %~ | 0.14 | % | 0.03 | % | 0.16 | % | 0.29 | % | 0.11 | % | ||||||||||||
Portfolio turnover rate | 23 | %# | 49 | % | 15 | % | 36 | % | 45 | % | 40 | % | ||||||||||||
| ^ | Average share method used to calculate per share data |
| * | Amount is less than 0.01% |
| ~ | Annualized |
| # | Not annualized |
The accompanying notes are an integral part of the financial statements.
Page 13
Table of Contents
Note A–Organization
Northeast Investors Growth Fund (the “Fund”) is a diversified, no-load, open-end, series-type management investment company registered under the Investment Company Act of 1940, as amended. The Fund presently consists of one portfolio and is organized as a Massachusetts business trust.
The Fund’s objective is to produce long term growth for its shareholders.
Note B–Fund Administration, Accounting, Transfer Agency and Shareholder Servicing
Prior to August 29, 2011 the Fund acted as its own fund administrator, accountant, transfer agent and shareholder servicing agent. Effective August 29, 2011 the Fund appointed ALPS Fund Services, Inc. (“ALPS”) as its fund accountant, transfer agent and shareholder servicing agent. ALPS carries out all functions related to the maintenance of shareholder accounts, acquisition and redemption of shares and mailings to shareholders. ALPS also determines the Fund’s Net Asset Value. Effective September 1, 2011, the Fund appointed Northeast Management and Research Co., Inc. (“NMR”) as its fund administrator.
Note C–Significant Accounting Policies
Significant accounting policies of the Fund are as follows:
Valuation of Investments: Investments in securities traded on national securities exchanges are valued based upon closing prices on the exchanges. Securities traded in the over-the-counter market and listed securities with no sales on the date of valuation are valued at closing bid prices. Repurchase agreements are valued at cost with earned interest included in interest receivable. Other short-term investments, when held by the Fund, are valued at cost plus earned discount or interest which approximates market value.
Securities and other assets for which market quotations are not readily available (including restricted securities, if any) are valued at their fair value as determined in good faith under consistently applied procedures approved by the Board of Trustees. Methodologies and factors used to fair value securities may include, but are not limited to, information of any recent sales, the analysis of the company’s financial statements, quotations or evaluated prices from broker-dealers and/or pricing services and information obtained from analysts. The Fund may use fair value pricing for foreign securities if a material event occurs that may effect the price of a security after the close of the foreign market or exchange (or on days the foreign market is closed) but before the Fund prices it’s portfolio, generally at 4:00 p.m. ET. Fair value pricing may also be used for securities acquired as a result of corporate restructurings or reorganizations as reliable market quotations for such issues may not be readily available. At December 31, 2011 there were no securities priced at fair value as determined in good faith.
Security Transactions: Security transactions are accounted for as of trade date. Gains and losses on securities sold are determined on the basis of identified cost.
Federal Income Taxes: No provision for federal income taxes is necessary since the Fund has elected to qualify under subchapter M of the Internal Revenue Code and its policy is to distribute all of its taxable income, including net realized capital gains, within the prescribed time periods.
The Fund has reviewed the tax positions for the open tax years as of December 31, 2011 and has determined that no provision for income tax is required in the Fund’s financial statements. The Fund’s federal tax returns for the prior three fiscal years remain subject to examination by the Internal Revenue Service.
Page 14
Table of Contents
Notes to Financial Statements
continued
State Income Taxes: Because the Fund has been organized by an Agreement and Declaration of Trust executed under the laws of the Commonwealth of Massachusetts, it is not subject to state income or excise taxes.
Distributions and Income: Income and capital gain distributions are determined in accordance with income tax regulations which may differ from U.S. generally accepted accounting principles. These differences are primarily due to differing treatments for capital loss carryovers and losses deferred due to wash sales. Permanent book and tax differences relating to shareholder distributions will result in reclassifications to paid-in-capital. The Fund’s distributions and dividend income are recorded on the ex-dividend date. Interest income, which consists of interest from repurchase agreements, is accrued as earned.
Net Asset Value: In determining the net asset value per share, rounding adjustments are made for fractions of a cent to the next higher cent.
Use of Estimates: The preparation of financial statements in conformity with U.S. generally accepted accounting principles requires management to make estimates and assumptions that affect the reported amounts of assets and liabilities and disclosure of contingent assets and liabilities at the date of the financial statements and the reported amounts of revenues and expenses during the reporting period. Actual results could differ from those estimates.
Note D–Investment Advisory and Service Contract
The Fund has its investment advisory and service contract with Northeast Management & Research Company, Inc. (the “Advisor”). Under the contract, the Fund pays the Advisor an annual fee at a maximum rate of 1% of the first $10,000,000 of the Fund’s average daily net assets, 3/4 of 1% of the next $20,000,000 and 1/2 of 1% of the average daily net assets in excess of $30,000,000, in monthly installments on the basis of the average daily net assets during the month preceding payment.
Under the Fund’s Investment Advisory Agreement (the “Agreement”), personnel of the Advisor provide the Fund with advice and assistance in the choice of investments and the execution of securities transactions, and otherwise maintain the Fund’s organization. The Advisor also provides the Fund with necessary office space and portfolio accounting and bookkeeping services. The salaries of all officers of the Fund or of the Advisor performing services relating to research, statistical and investment activities are paid by the Advisor. Messrs. John C. Emery, Michael Baldwin, and F. Washington Jarvis, the Fund’s disinterested Trustees, are not officers or directors of the Advisor. The compensation of all disinterested Trustees of the Fund is borne by the Fund.
Note E–Expenses
Prior to August 29, 2011 the Fund paid expenses for salaries and benefits of employees responsible for transfer agency, shareholder servicing, and fund administration. Pursuant to agreements effective August 29, 2011 and September 1, 2011, the Fund pays ALPS and NMR, respectively, for these services. Payments to ALPS for transfer agency and shareholder servicing appear under Transfer Agent. Payments to NMR for fund administration are included in administrative expenses and salaries. NMR is responsible for the payments to ALPS for fund accounting services. The Fund continues to bear other expenses including — but not limited to — taxes and other government charges, interest on borrowed money, legal fees, auditing fees, registration and filing fees, insurance premiums, fees and expenses of the custodian, compensation of the Fund’s disinterested trustees and the costs of reports to shareholders.
Page 15
Table of Contents
Notes to Financial Statements
continued
Note F–Purchases and Sales of Investments
The cost of purchases and proceeds from sales of investments, other than short-term securities, aggregated $ and $, respectively, for the six months ended June 30, 2012.
Note G–Shares of Beneficial Interest
At June 30, 2012, there was an unlimited number of shares of beneficial interest authorized with no par value. Transactions in shares of beneficial interest were as follows:
| June 30, 2012 | December 31, 2011 | |||||||||||||||
| Shares | Amount | Shares | Amount | |||||||||||||
Shares sold | 43,553 | $ | 773,997 | 121,028 | $ | 2,042,710 | ||||||||||
Shares issued to shareholders in reinvestment of distributions from net investment income and realized gains from security transactions | — | — | — | — | ||||||||||||
|
|
|
|
|
|
|
| |||||||||
| 43,553 | 773,997 | 121,028 | 2,042,710 | |||||||||||||
Shares repurchased | (372,376 | ) | (6,522,677 | ) | (722,022 | ) | (12,313,780 | ) | ||||||||
|
|
|
|
|
|
|
| |||||||||
Net Increase | (328,823 | ) | $ | (5,748,680 | ) | (600,994 | ) | $ | (10,271,070 | ) | ||||||
|
|
|
|
|
|
|
| |||||||||
Note H–Repurchase Agreement
On a daily basis, the Fund invests any cash balances into repurchase agreements hypothecated by U.S. Government obligations. Securities pledged as collateral for repurchase agreements are held by the Fund’s custodian bank until maturity of the repurchase agreement. Provisions of the agreement ensure that the market value of the collateral is sufficient in the event of default. However, in the event of default or bankruptcy by the other party to the agreement, realization and/ or retention of the collateral may be subject to legal proceedings. At June 30, 2012 the Fund was not invested in a repurchase agreement.
Note I–Committed Line of Credit
Short-term bank borrowings, which do not require maintenance of compensating balances, are generally on a demand basis and are at rates equal to adjusted money market interest rates in effect during the period in which such loans are outstanding. At June 30, 2012, the Fund had an unused line of credit amounting to $10,000,000. In addition the Fund pays a commitment fee of 0.125% per annum, payable at the end of each quarter based on the unused portion of the line of credit. The committed line of credit may be terminated at the bank’s option at the annual renewal date.
The following information relates to aggregate short-term borrowings during the six months ended June 30, 2012:
| Average amount outstanding (total of daily outstanding principal balances divided by number of days with debt outstanding during the period) | $ | 599,764 | ||
| Weighted average interest rate | 1.43 | % |
Note J–Additional Tax Information
Dividends paid during the fiscal years ended December 31, 2010 and December 31, 2011 were $164,278 and $0 respectively, and such dividends were classified for tax purposes as ordinary income.
Page 16
Table of Contents
Notes to Financial Statements
continued
As of December 31, 2011 the components of accumulated earnings (losses) on a tax basis were as follows:
Undistributed net investment income | $ | 117,876 | ||
Timing Differences | (442,644 | ) | ||
Unrealized gains (losses)—net | 14,947,995 | |||
|
| |||
Total accumulated earnings (losses)—net | 14,623,227 |
During the year, the capital loss carryfoward utilized was $4,274,091
At December 31, 2011 the Fund’s post October loss deferral was $(442,644)
At December 31, 2011 the Fund’s aggregate security unrealized gains and losses based on cost for U.S. federal income tax purposes was as follows:
| 2011 | ||||
Tax cost | $ | 65,089,905 | ||
Gross unrealized gain | 17,123,360 | |||
Gross unrealized loss | (2,175,365 | ) | ||
|
| |||
Net unrealized security gain (loss) | $ | 14,947,995 | ||
|
| |||
On December 22, 2010, the Regulated Investment Company Modernization Act of 2010 (the “Act”) was enacted. Under the Act, net capital losses may be carried forward indefinitely, and their character is retained as short-term and/or long-term losses. Previously, net capital losses were carried forward for eight years and treated as short-term losses. As a transition rule, the Act requires that post-enactment net capital losses be used before pre-enactment net capital losses. As a result of this ordering rule, pre-enactment capital loss carryforwards may expire unused, whereas under the previous rules these losses may have been utilized. This change is effective for fiscal years beginning after the date of enactment.
The Fund has reviewed the tax positions for each of the three open tax years as of December 31, 2011 and has determined that no provision for income tax is required in the Fund’s financial statements. The Fund’s federal tax returns for the prior three fiscal years remain open subject to examination by the Internal Revenue Service.
Note K–Securities Lending
The Fund may seek additional income by lending portfolio securities to qualified institutions. The Fund will receive cash as collateral in an amount equal to at least 102% of the current market value of any loaned securities plus accrued interest. By reinvesting any cash collateral it receives in these transactions, the Fund could realize additional gains and losses. If the borrower fails to return the securities and the value of the collateral has declined during the term of the loan, the Fund will bear the loss. At June 30, 2012, the value of securities loaned and the value of collateral was $9,256,212 and $9,461,635, respectively. During the six months ended June 30, 2012, income from securities lending amounted to $4,157.
Note L–Fair Value Measurements
Accounting Standards Codification ASC 820, “Fair Value Measurements and Disclosures” (ASC 820) established a fair value hierarchy that distinguishes between market data obtained from independent sources (observable inputs) and the Fund’s own market assumptions (unobservable inputs). The inputs or methodologies used for valuing securities are not necessarily an indication of
Page 17
Table of Contents
Notes to Financial Statements
continued
the risk associated with investing in those securities. The various inputs that may be used to determine the value of the Fund’s investments are summarized in the following fair value hierarchy:
Level 1 — Unadjusted quoted prices in active markets for identical securities.
Level 2 — Other significant observable inputs (including quoted prices for similar securities, interest rates, prepayment speeds, credit risk, etc.)
Level 3 — Significant unobservable inputs (including the Fund’s own assumptions used to determine the fair value of investments).
The following table summarizes the Fund’s investments as of June 30, 2012, based on the inputs used to value them.
| Level 1 | Level 2 | Level 3 | Total | |||||||||||||
Common Stock | $ | 75,910,068 | — | — | $ | 75,910,068 | ||||||||||
Cash Equivalents | $ | 9,461,635 | — | — | $ | 9,461,635 | ||||||||||
Repurchase Agreement | — | — | — | — | ||||||||||||
|
|
|
|
|
|
|
| |||||||||
| $ | 85,371,703 | — | — | $ | 85,371,703 | |||||||||||
Page 18
Table of Contents
The Trustees of the Fund are William A. Oates Jr., John C. Emery, Michael Baldwin, and F. Washington Jarvis. Under Massachusetts law, the Trustees are generally responsible for overseeing the operation and management of the Fund. The table below provides certain information about the Fund’s Trustees and Officers. The mailing address for the Trustees and Officers of the Fund is 100 High Street, Suite 1000, Boston, MA 02110-2301.
Name/Age/Service* | Position | Principal Occupation(s) and | ||
| INTERESTED TRUSTEES AND FUND OFFICERS | ||||
William A. Oates, Jr.** Age: 70 Years of Service: 31 | Trustee and President | Trustee and President of Northeast Investors Growth Fund; President and Director of Northeast Investment Management, Inc.; President and Director of Northeast Management & Research Co., Inc.; | ||
Robert B. Minturn Age: 73 Years of Service: 31 | Clerk; Vice President; Chief Legal Officer | Officer of Northeast Investors Trust, Northeast Investors Growth Fund (Trustee until Nov. 2008) and Northeast Investment Management, Inc. | ||
Richard M. Manoogian Age: 49 Years of Service: 1 | Chief Compliance Officer | Chief Compliance Officer of Northeast Investment Management, Inc.; Chief Compliance Officer of Northeast Management & Research Co., Inc. | ||
John F. Francini, Jr Age: 44 Years of Service: 5 | Chief Financial Officer | Officer of Northeast Investors Growth Fund; Officer of Northeast Investment Management, Inc. | ||
Robert Kane Age: 37 Years of Service: 12 | Vice President | Fund Accountant of Northeast Investors Growth Fund | ||
Nancy M. Mulligan Age: 44 Years of Service: 5 | Vice President | Officer of Northeast Investors Growth Fund; Officer of Northeast Investment Management, Inc. | ||
| INDEPENDENT TRUSTEES | ||||
John C. Emery Age: 81 Years of Service: 31 | Trustee | Of Counsel, Law Firm of Sullivan & Worcester LLP; President of Boston Investment Company | ||
Michael Baldwin Age: 71 Years of Service: 12 | Trustee | Partner, Baldwin Brothers, Registered Investment Advisor | ||
F. Washington Jarvis Age: 73 Years of Service: 8 | Trustee | Director, ELM Program, Yale Divinity School | ||
| * | The Trustees serve until their resignation or the appointment of a successor and the officers serve at the pleasure of the Trustees. |
| ** | Mr. Oates is an interested Trustee because of his affiliation with the Fund’s investment adviser. |
Page 19
Table of Contents
Board Approval of Investment Advisory Contract
At its meeting held on June 1, 2012, the Board of Trustees of the Fund, including the Independent Trustees voting separately, voted to extend the Fund’s investment management agreement with Northeast Management & Research Company, Inc. (the “Investment Adviser”).
The Investment Adviser presented detailed information to the Board requested by the Independent Trustees. Such information included (i) information confirming the financial condition of the Investment Adviser and the Investment Adviser’s profitability derived from its relationship with the Fund; (ii) a description of the personnel and services provided by the Investment Adviser; (iii) comparative information on investment performance; and (iv) information regarding brokerage and portfolio transactions.
The Board reviewed and discussed financial information provided by the Investment Adviser, including fees, income and expenses, and the Investment Adviser’s profitability derived from its relationship with the Fund. The Board determined that the Investment Adviser is solvent and in a position to perform the ongoing responsibilities to the Fund and to satisfy its obligations under the Act and the advisory agreement.
The Board reviewed the advisory fee and the effective investment advisory fee rate paid by the Fund and the appropriateness of such advisory fee. The Board reviewed and considered any economies of scale which might be realized by the Fund and how the current advisory fee for the Fund reflects the economies of scale for the benefit of the shareholders of the Fund.
The Board also reviewed and considered the fees or other payments received by the Investment Adviser. The Board reviewed and considered comparison of fees charged by investment advisers to fund peers of the Fund. The Board also considered and reviewed information regarding brokerage.
The Board reviewed and considered the qualifications of the current and anticipated portfolio managers to manage the portfolio of the Fund, including their history managing investments generally and growth oriented investments in particular, as well as the background and expertise of the key personnel and amount of time they would be able to devote to the affairs of the Fund. The Board concluded, in light of the particular requirements of the Fund, that it was satisfied with the professional qualifications and overall commitment to the Fund of the anticipated portfolio management team.
The Board considered the nature, extent and quality of services rendered to the Fund by the Investment Adviser and the investment performance of the Fund based on the data provided which included comparisons with index data and data concerning performance relative to other funds with generally similar objectives and management policies. The Board determined that in light of the data taken as a whole and the nature of the investment program of the Fund, the investment performance was reasonable and acceptable. The Board discussed the Investment Adviser’s profitability, and it was determined to be reasonable, given the services rendered and the Fund’s performance and services provided. The Board concluded that the Fund’s fees paid to the Investment Adviser were reasonable in light of comparative performance and advisory fee information, costs of the services provided and profits to be realized and benefits derived by the Investment Adviser from the relationship with the Fund.
Page 20
Table of Contents
Trustees
| William A. Oates, Jr. | Michael Baldwin | |
| John C. Emery | F. Washington Jarvis |
Officers
William A. Oates, Jr., President
Robert M. Minturn, Vice President, Clerk & Chief Legal Officer
John F. Francini, Jr., Vice President & Chief Financial Officer
Richard M. Manoogian, Vice President & Chief Compliance Officer
Nancy M. Mulligan, Vice President
Robert M. Kane, Vice President
Investment Advisor
Northeast Management & Research Company, Inc.
100 High Street
Boston, Massachusetts 02110
Custodian
State Street Bank & Trust Company
200 Clarendon Street
Boston, Massachusetts 02116
Legal Counsel
Wilmer Cutler Pickering Hale and Dorr LLP
60 State Street
Boston, Massachusetts 02109
Transfer Agent
ALPS Fund Services, Inc.
1290 Broadway Suite 1100
Denver, Colorado 80203
This report is prepared for the information of the shareholders of Northeast Investors Growth Fund and must not be given to others unless preceded or accompanied by a copy of the current Prospectus by which all offerings of the Fund shares are made. It should be noted in reading this report and the letter to shareholders that the record of past performance is not a representation as to the Fund’s future performance, and that the Fund’s investments are subject to market risks.
For a free copy of the Fund’s proxy voting guidelines and proxy voting record visit www.northeastinvestors/growth/proxypolicy.stm, call 1-800-225-6704 or visit the Securities and Exchange Commission (SEC)’s website at www.sec.gov. Beginning August 29, 2011 the Fund’s new phone number is 855-755-NEIG (6344); the new website is www.northeastinvest.com
Shares of the Fund are sold to investors at net asset value by
Northeast Investors Growth Fund
100 High Street
Boston, Massachusetts 02110
855-755-NEIG (6344)
www.northeastinvest.com
Table of Contents
| Item 2. | Code of Ethics. |
Not applicable for semi-annual report.
| Item 3. | Audit Committee Financial Expert. |
Not applicable for semi-annual report.
| Item 4. | Principal Accountant Fees and Services. |
Not applicable for semi-annual report.
| Item 5. | Audit Committee of Listed Registrants. |
Not applicable to the registrant.
| Item 6. | Schedule of Investments |
Included as part of Item 1 above.
| Item 7. | Disclosure of Proxy Voting Policies and Procedures for Closed-End Management Investment Companies. |
Not applicable to the registrant.
| Item 8. | Portfolio Managers of Closed-End Management Investment Companies. |
Not applicable to the registrant.
| Item 9. | Purchase of Equity Securities by Closed-End Management Company and Affiliated Purchasers |
Not applicable to the registrant.
| Item 10. | Submission of Matters to a Vote of Security Holders. |
The registrant has not adopted procedures for the submission of nominees for Trustee. In the event that a shareholder’s meeting is called for the purpose of electing Trustees, registrant will follow the procedures required by Rule 14a-11 under the Securities Exchange Act of 1934.
| Item 11. | Controls and Procedures. |
(a) The registrant’s principal executive and financial officers, after evaluating the effectiveness of the registrant’s disclosure controls and procedures (as defined in Rule 30a-2(c) under the Investment Company Act of 1940, as amended), have concluded that, based on such evaluation, the registrant’s disclosure controls and procedures were effective as of a date within 90 days of the filing of this report.
(b) The registrant’s principal executive officer and principal financial officer are aware of no changes in the registrant’s internal control over financial reporting that occurred during the registrant’s most recent fiscal half-year that has materially affected, or is reasonably likely to materially affect, the registrant’s internal control over financial reporting.
| Item 12. | Exhibits. |
(a) 99.CERT Separate certifications by the registrant’s principal executive officer and principal financial officer, pursuant to Section 302 of the Sarbanes-Oxley Act of 2002 and required by Rule 30a-2(a) under the Investment Company Act of 1940, are attached.
(b) 99.906CERT A certification by the registrant’s principal executive officer and principal financial officer, pursuant to Section 906 of the Sarbanes-Oxley Act of 2002 and required by Rule 30a-2(b) under the Investment Company Act of 1940, is attached.
Table of Contents
SIGNATURES
Pursuant to the requirements of the Securities Exchange Act of 1934 and the Investment Company Act of 1940, the registrant has duly caused this report to be signed on its behalf by the undersigned, thereunto duly authorized.
| Northeast Investors Growth Fund | ||||||
| Date: September 6, 2012 | By | /s/ William A. Oates, Jr. | ||||
| William A. Oates, Jr. | ||||||
| President | ||||||
| (principal executive officer) | ||||||
| Date: September 6, 2012 | By | /s/ John F. Francini | ||||
| John F. Francini | ||||||
| Chief Financial Officer | ||||||
| (principal financial officer) | ||||||
Pursuant to the requirements of the Securities Exchange Act of 1934 and the Investment Company Act of 1940, this report has been signed below by the following persons on behalf of the registrant and in the capacities and on the dates indicated.
| Date: September 6, 2012 | By | /s/ William A. Oates, Jr. | ||||
| William A. Oates, Jr. | ||||||
| President | ||||||
| (principal executive officer) | ||||||
| Date: September 6, 2012 | By | /s/ John F. Francini | ||||
| John F. Francini | ||||||
| Chief Financial Officer | ||||||
| (principal financial officer) | ||||||