
1 Second Quarter 2024 Earnings Conference Call July 23, 2024

1 Statements in this presentation which are not historical are “forward-looking statements” within the meaning of Section 27A of the Securities Act of 1933, as amended, Section 21E of the Securities Exchange Act of 1934, as amended, and the Private Securities Litigation Reform Act of 1995. These forward-looking statements may include discussions of the strategic plans and objectives or anticipated future performance and events of Peoples Bancorp Inc. (“Peoples”). The information contained in this presentation should be read in conjunction with Peoples’ Annual Report on Form 10-K for the fiscal year ended December 31, 2023 (the “2023 Form 10-K”), Peoples’ Quarterly Report on Form 10-Q for the quarter ended March 31, 2024, and Peoples’ earnings release for the quarter ended June 30, 2024 (the “Second Quarter Earnings Release”), included in Peoples’ current report on Form 8-K furnished to the Securities and Exchange Commission (“SEC”) on July 23, 2024, each of which is available on the SEC’s website (sec.gov) or at Peoples’ website (peoplesbancorp.com). Peoples expects to file its quarterly report on Form 10-Q for the quarter ended June 30, 2024 (the “Second Quarter Form 10-Q”) with the SEC on or about August 1, 2024. As required by U.S. generally excepted accounting principles, Peoples is required to evaluate the impact of subsequent events through the issuance date of its June 30, 2024, consolidated financial statements as part of its Second Quarter Form 10-Q. Accordingly, subsequent events could occur that may cause Peoples to update its critical accounting estimates and to revise its financial information from that which is contained in this presentation. Investors are cautioned that forward-looking statements, which are not historical fact, involve risks and uncertainties, including those detailed in the 2023 Form 10-K under the section “Risk Factors” in Part I, Item 1A and in the Second Quarter Earning Release. As such, actual results could differ materially from those contemplated by forward-looking statements made in this presentation. Management believes that the expectations in these forward-looking statements are based upon reasonable assumptions within the bounds of management’s knowledge of Peoples’ business and operations. Peoples disclaims any responsibility to update these forward-looking statements to reflect events or circumstances after the date of this presentation. Safe Harbor Statement
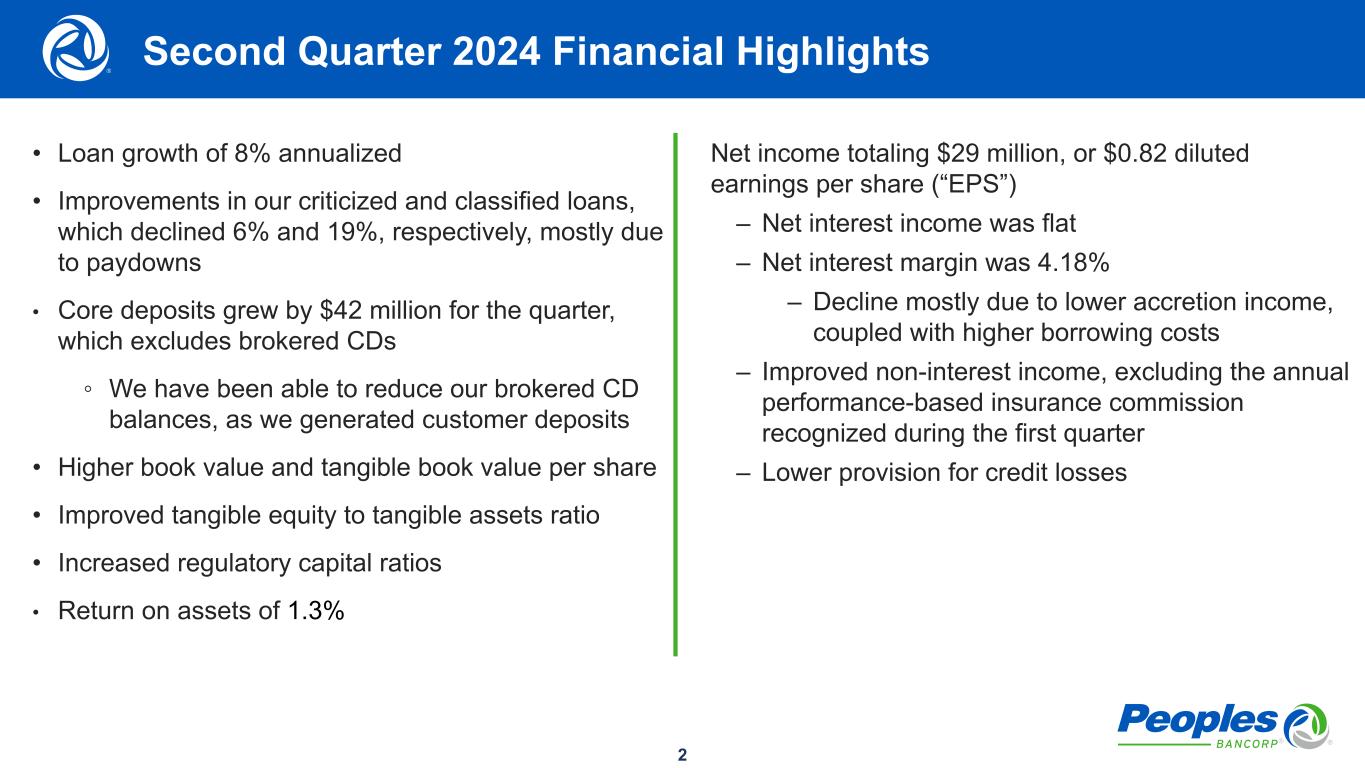
2 • Loan growth of 8% annualized • Improvements in our criticized and classified loans, which declined 6% and 19%, respectively, mostly due to paydowns • Core deposits grew by $42 million for the quarter, which excludes brokered CDs ◦ We have been able to reduce our brokered CD balances, as we generated customer deposits • Higher book value and tangible book value per share • Improved tangible equity to tangible assets ratio • Increased regulatory capital ratios • Return on assets of 1.3% Net income totaling $29 million, or $0.82 diluted earnings per share (“EPS”) – Net interest income was flat – Net interest margin was 4.18% – Decline mostly due to lower accretion income, coupled with higher borrowing costs – Improved non-interest income, excluding the annual performance-based insurance commission recognized during the first quarter – Lower provision for credit losses Second Quarter 2024 Financial Highlights

3 Loans Balances by Segment 29% 12%20% 11% 28% Consumer loans Owner occupied commercial real estate Non-owner occupied commercial real estate Specialty finance Other commercial loans Loan Balances and Yields (Dollars in billions) $2.03 $1.93 $1.83 $1.76 $1.69 $3.94 $4.16 $4.33 $4.45 $4.64 6.55% 7.13% 7.12% 7.13% 7.16% Acquired loans and leases Originated loans and leases Quarterly loan yield 6/30/2023 9/30/2023 12/31/2023 3/31/2024 6/30/2024 – Second quarter 2024 annualized loan growth was 8%, compared to linked quarter-end – At June 30, 2024, 47% of loans were fixed rate, with the remaining 53% at a variable rate Loans
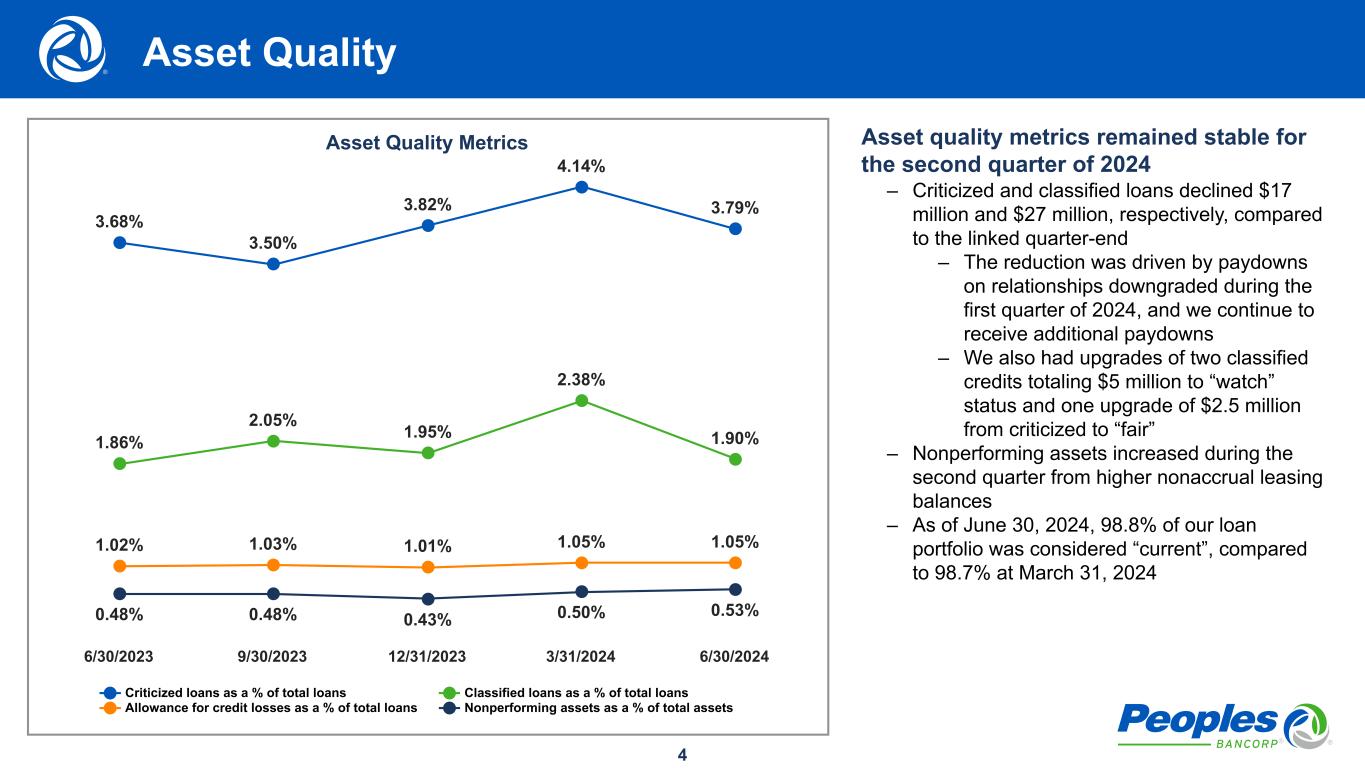
4 Asset Quality Metrics 3.68% 3.50% 3.82% 4.14% 3.79% 1.86% 2.05% 1.95% 2.38% 1.90% 1.02% 1.03% 1.01% 1.05% 1.05% 0.48% 0.48% 0.43% 0.50% 0.53% Criticized loans as a % of total loans Classified loans as a % of total loans Allowance for credit losses as a % of total loans Nonperforming assets as a % of total assets 6/30/2023 9/30/2023 12/31/2023 3/31/2024 6/30/2024 Asset quality metrics remained stable for the second quarter of 2024 – Criticized and classified loans declined $17 million and $27 million, respectively, compared to the linked quarter-end – The reduction was driven by paydowns on relationships downgraded during the first quarter of 2024, and we continue to receive additional paydowns – We also had upgrades of two classified credits totaling $5 million to “watch” status and one upgrade of $2.5 million from criticized to “fair” – Nonperforming assets increased during the second quarter from higher nonaccrual leasing balances – As of June 30, 2024, 98.8% of our loan portfolio was considered “current”, compared to 98.7% at March 31, 2024 Asset Quality
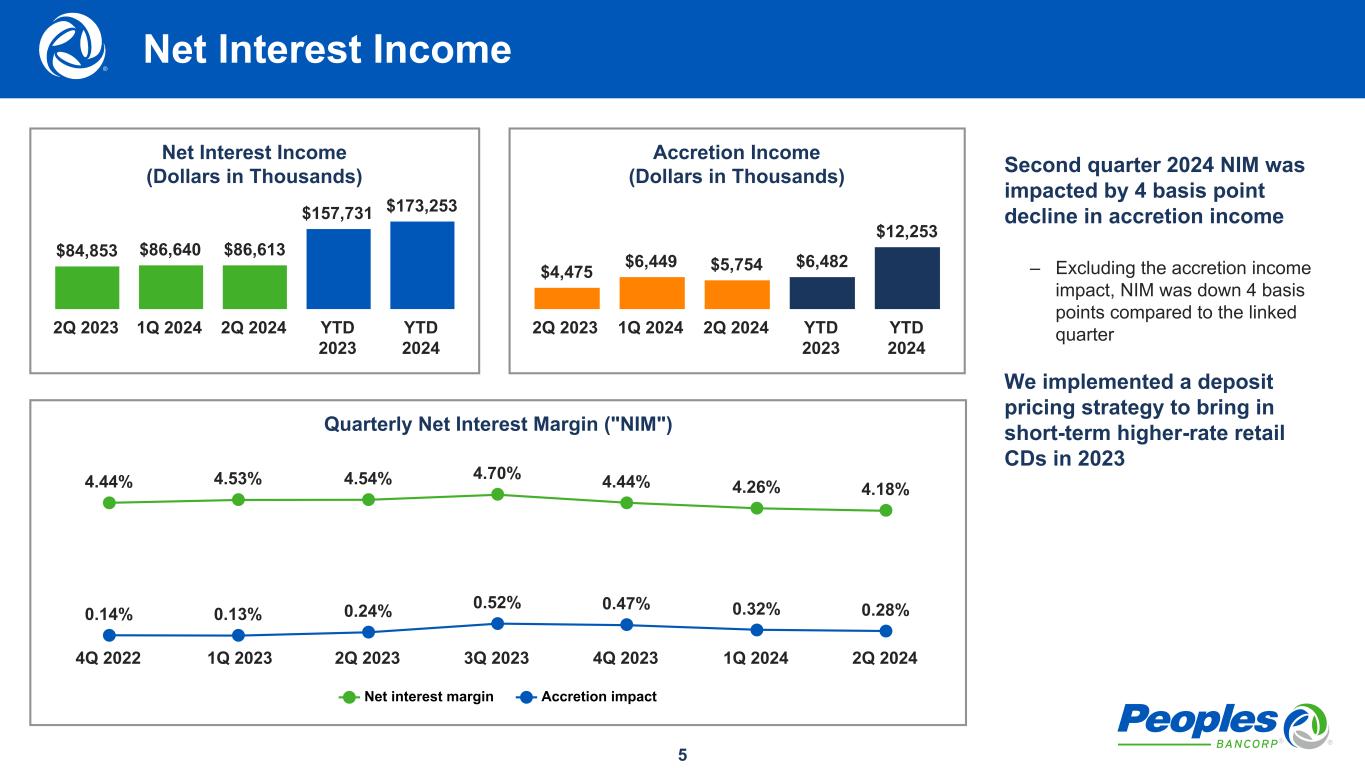
5 Second quarter 2024 NIM was impacted by 4 basis point decline in accretion income – Excluding the accretion income impact, NIM was down 4 basis points compared to the linked quarter We implemented a deposit pricing strategy to bring in short-term higher-rate retail CDs in 2023 Net Interest Income (Dollars in Thousands) $84,853 $86,640 $86,613 $157,731 $173,253 2Q 2023 1Q 2024 2Q 2024 YTD 2023 YTD 2024 Quarterly Net Interest Margin ("NIM") 4.44% 4.53% 4.54% 4.70% 4.44% 4.26% 4.18% 0.14% 0.13% 0.24% 0.52% 0.47% 0.32% 0.28% Net interest margin Accretion impact 4Q 2022 1Q 2023 2Q 2023 3Q 2023 4Q 2023 1Q 2024 2Q 2024 Accretion Income (Dollars in Thousands) $4,475 $6,449 $5,754 $6,482 $12,253 2Q 2023 1Q 2024 2Q 2024 YTD 2023 YTD 2024 Net Interest Income
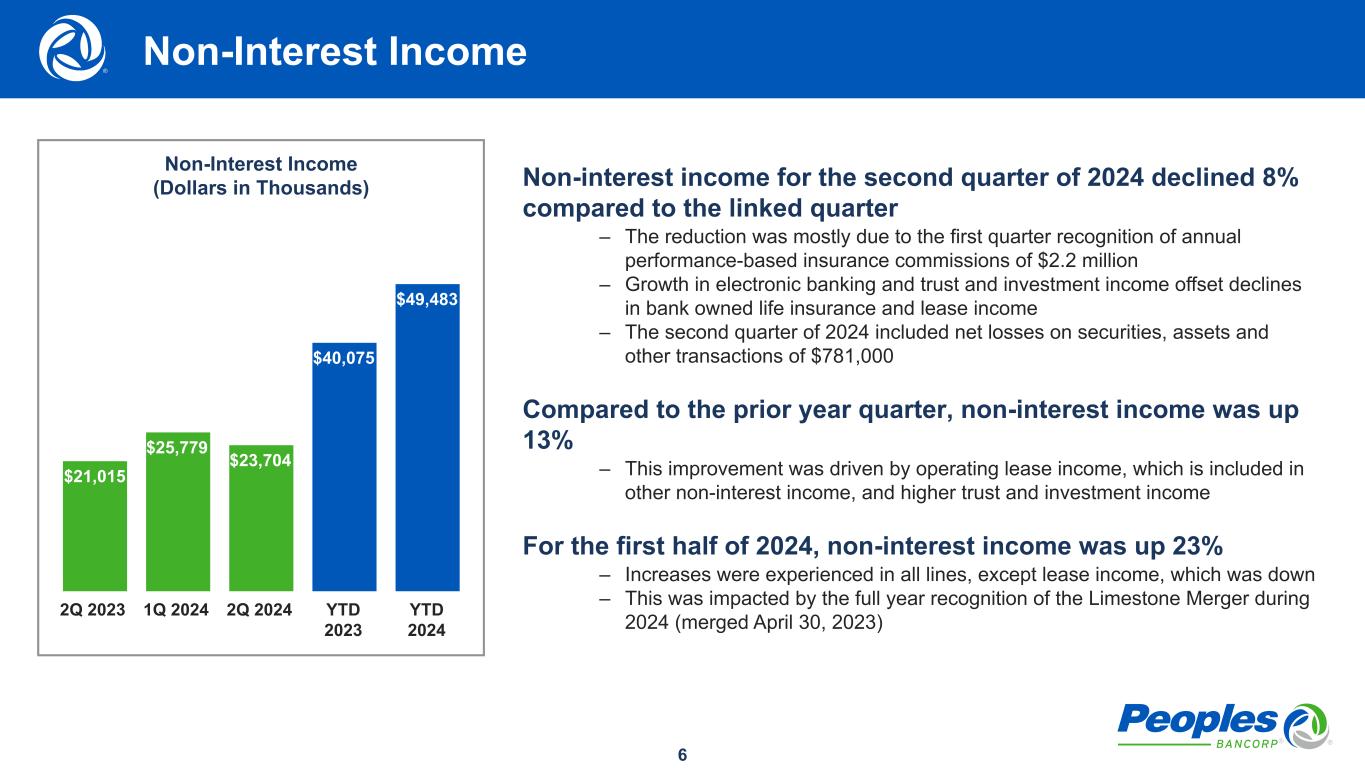
6 Non-interest income for the second quarter of 2024 declined 8% compared to the linked quarter – The reduction was mostly due to the first quarter recognition of annual performance-based insurance commissions of $2.2 million – Growth in electronic banking and trust and investment income offset declines in bank owned life insurance and lease income – The second quarter of 2024 included net losses on securities, assets and other transactions of $781,000 Compared to the prior year quarter, non-interest income was up 13% – This improvement was driven by operating lease income, which is included in other non-interest income, and higher trust and investment income For the first half of 2024, non-interest income was up 23% – Increases were experienced in all lines, except lease income, which was down – This was impacted by the full year recognition of the Limestone Merger during 2024 (merged April 30, 2023) Non-Interest Income (Dollars in Thousands) $21,015 $25,779 $23,704 $40,075 $49,483 2Q 2023 1Q 2024 2Q 2024 YTD 2023 YTD 2024 Non-Interest Income
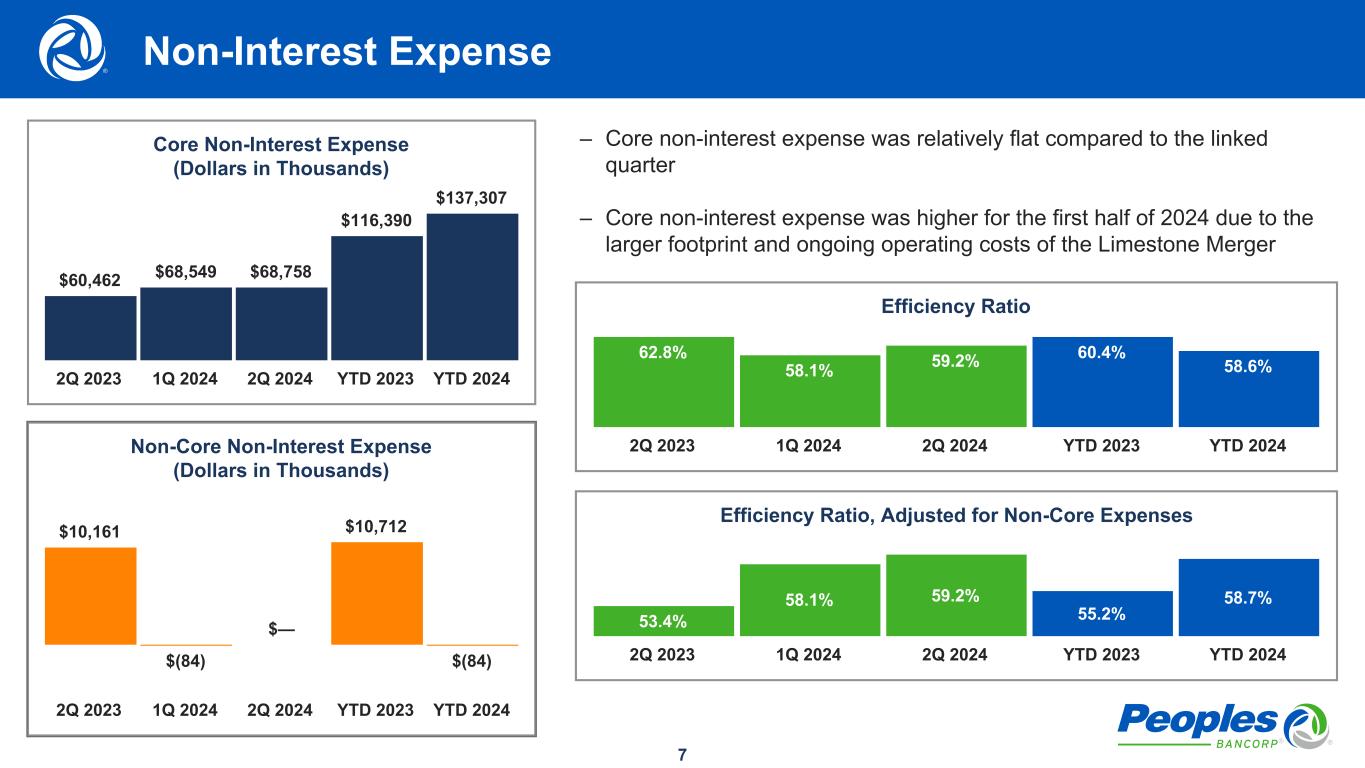
7 – Core non-interest expense was relatively flat compared to the linked quarter – Core non-interest expense was higher for the first half of 2024 due to the larger footprint and ongoing operating costs of the Limestone Merger Core Non-Interest Expense (Dollars in Thousands) $60,462 $68,549 $68,758 $116,390 $137,307 2Q 2023 1Q 2024 2Q 2024 YTD 2023 YTD 2024 Non-Core Non-Interest Expense (Dollars in Thousands) $10,161 $(84) $— $10,712 $(84) 2Q 2023 1Q 2024 2Q 2024 YTD 2023 YTD 2024 Efficiency Ratio 62.8% 58.1% 59.2% 60.4% 58.6% 2Q 2023 1Q 2024 2Q 2024 YTD 2023 YTD 2024 Efficiency Ratio, Adjusted for Non-Core Expenses 53.4% 58.1% 59.2% 55.2% 58.7% 2Q 2023 1Q 2024 2Q 2024 YTD 2023 YTD 2024 Non-Interest Expense
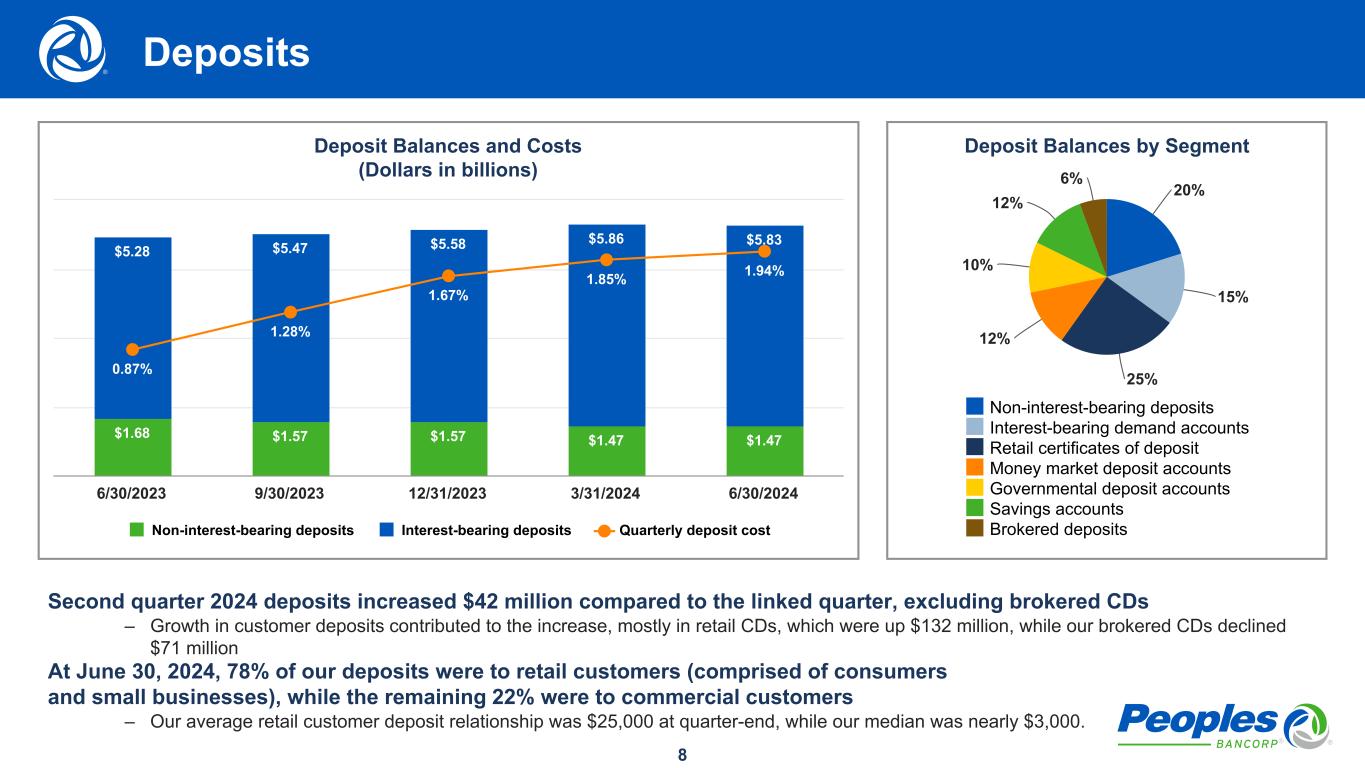
8 Deposit Balances by Segment 20% 15% 25% 12% 10% 12% 6% Non-interest-bearing deposits Interest-bearing demand accounts Retail certificates of deposit Money market deposit accounts Governmental deposit accounts Savings accounts Brokered deposits Deposit Balances and Costs (Dollars in billions) $1.68 $1.57 $1.57 $1.47 $1.47 $5.28 $5.47 $5.58 $5.86 $5.83 0.87% 1.28% 1.67% 1.85% 1.94% Non-interest-bearing deposits Interest-bearing deposits Quarterly deposit cost 6/30/2023 9/30/2023 12/31/2023 3/31/2024 6/30/2024 Second quarter 2024 deposits increased $42 million compared to the linked quarter, excluding brokered CDs – Growth in customer deposits contributed to the increase, mostly in retail CDs, which were up $132 million, while our brokered CDs declined $71 million At June 30, 2024, 78% of our deposits were to retail customers (comprised of consumers and small businesses), while the remaining 22% were to commercial customers – Our average retail customer deposit relationship was $25,000 at quarter-end, while our median was nearly $3,000. Deposits

9 Capital Metrics 11.36% 11.57% 11.75% 11.69% 11.76% 12.10% 12.31% 12.58% 12.50% 12.55% 12.92% 13.14% 13.38% 13.40% 13.47% 9.64% 9.34% 9.57% 9.43% 9.65% 7.00% 6.85% 7.33% 7.37% 7.61% Common equity tier 1 capital ratio Tier 1 risk-based capital ratio Total risk-based capital ratio Leverage ratio Tangible equity to tangible assets 6/30/2023 9/30/2023 12/31/2023 3/31/2024 6/30/2024 Most of our regulatory capital ratios (which excludes the tangible equity to tangible assets ratio) have improved after the Limestone Merger – The leverage ratio has been relatively steady over the periods presented Tangible equity to tangible assets improved during the second quarter largely due to earnings outpacing dividends – This ratio has been negatively impacted by accumulated other comprehensive losses on available-for-sale investment securities for the last several quarters due to market rate increases Capital

10 Our 2024 full year expectations are as follows: Net Interest Income – Benefit from the full year impact of the Limestone Merger, but also affected by projected market interest rate reductions during 2024, estimating quarterly net interest margin of between 4.10% and 4.30%, which assumes no significant rate changes for 2024 Non-Interest Income Excluding Gains and Losses – Growth compared to 2023 results will be between 6% and 8% Non-Interest Expense – Quarterly non-interest expense of between $67 to $69 million for the third and fourth quarters of 2024 Loans/Asset Quality – Loan growth will be between 5% and 7% for the full year of 2024, compared to 2023 – The slight reduction in our estimate is partly the result of paydowns and expected payments on criticized and classified loans, which will offset some of our anticipated loan production, coupled with some expected declines from our leasing business due to recent credit quality and net charge-off trends – Provision for credit losses for the third and fourth quarters of 2024 to be relatively consistent with the amounts recognized during the first two quarters of 2024 – Net charge-off rate will be between 25-30 basis points for 2024, primarily driven by expected small-ticket lease charge-offs for 2024 2024 Outlook


