| UNITED STATES | |||
| SECURITIES AND EXCHANGE COMMISSION | |||
| Washington, D.C. 20549 | |||
| FORM N-CSR | |||
| CERTIFIED SHAREHOLDER REPORT OF REGISTERED MANAGEMENT | |||
| INVESTMENT COMPANIES | |||
| Investment Company Act file number: 811-3081 | |||
| DREYFUS APPRECIATION FUND, INC. | |||
| (Exact name of Registrant as specified in charter) | |||
| c/o The Dreyfus Corporation | |||
| 200 Park Avenue | |||
| New York, New York 10166 | |||
| (Address of principal executive offices) | (Zip code) | ||
| Mark N. Jacobs, Esq. | |||
| 200 Park Avenue | |||
| New York, New York 10166 | |||
| (Name and address of agent for service) | |||
| Registrant's telephone number, including area code: | (212) 922-6000 | ||
| Date of fiscal year end: | 12/31 | ||
| Date of reporting period: | 12/31/03 | ||
Error! Unknown document property name.
FORM N-CSR
Item 1. Reports to Stockholders.
| Dreyfus |
| Appreciation Fund, Inc. |
ANNUAL REPORT December 31, 2003
![]()
| The views expressed in this report reflect those of the portfolio |
| manager only through the end of the period covered and do not |
| necessarily represent the views of Dreyfus or any other person in |
| the Dreyfus organization. Any such views are subject to change at |
| any time based upon market or other conditions and Dreyfus dis- |
| claims any responsibility to update such views.These views may not |
| be relied on as investment advice and, because investment decisions |
| for a Dreyfus fund are based on numerous factors, may not be relied |
| on as an indication of trading intent on behalf of any Dreyfus fund. |
| Not FDIC-Insured • Not Bank-Guaranteed • May Lose Value |
Contents
T H E F U N D
| 2 | Letter from the Chairman |
| 3 | Discussion of Fund Performance |
| 6 | Fund Performance |
| 7 | Statement of Investments |
| 10 | Statement of Assets and Liabilities |
| 11 | Statement of Operations |
| 12 | Statement of Changes in Net Assets |
| 13 | Financial Highlights |
| 14 | Notes to Financial Statements |
| 19 | Report of Independent Auditors |
| 20 | Important Tax Information |
| 21 | Board Members Information |
| 23 | Officers of the Fund |
F O R M O R E I N F O R M AT I O N
Back Cover
| Dreyfus Appreciation Fund, Inc. |
The Fund

LETTER FROM THE CHAIRMAN
Dear Shareholder:
This annual report for Dreyfus Appreciation Fund, Inc. covers the 12-month period from January 1, 2003, through December 31, 2003. Inside, you’ll find valuable information about how the fund was managed during the reporting period, including a discussion with the fund’s portfolio manager, Fayez Sarofim, of Fayez Sarofim & Co., the fund’s sub-investment adviser.
Despite headwinds caused by economic and geopolitical uncertainty early in the year, stocks generally bounced back in 2003, with many stock market indexes generating their first full calendar year of gains since 1999. The combination of historically low interest rates, lower federal income tax rates, progress in the war on terrorism and above-trend economic growth during the second half of the year helped propel stock prices higher.
While stocks in general may no longer be priced as attractively as they were at the start of the year, we believe that market fundamentals remain favorable based on recent forecasts of continued economic growth. However, our optimism is tempered by the understanding that some companies, industries and market sectors always perform better than others.As always, we urge you to speak regularly with your financial advisor, who may be in the best position to suggest the Dreyfus funds designed to meet your current needs, future goals and tolerance for risk.
Thank you for your continued confidence and support.
Sincerely,

| Stephen E. Canter |
| Chairman and Chief Executive Officer |
| The Dreyfus Corporation |
| January 15, 2004 |
2

DISCUSSION OF FUND PERFORMANCE
Fayez Sarofim, Portfolio Manager
Fayez Sarofim & Co., Sub-Investment Adviser
How did Dreyfus Appreciation Fund, Inc. perform relative to its benchmark?
For the 12-month period ended December 31, 2003, the fund produced a total return of 20.39%.1 For the same period, the total return of the fund’s benchmark, the Standard & Poor’s 500 Composite Stock Price Index (“S&P 500 Index”), was 28.67%.2
After three years of declines, the U.S. stock market began to rally during 2003 as investors looked forward to a stronger economy. Although the rally persisted through year-end, it was led by smaller, more speculative stocks, and the high-quality, blue-chip stocks in which the fund invests generally lagged the averages. As a result, the fund’s returns trailed the S&P 500 Index.
What is the fund’s investment approach?
The fund invests primarily in large, well-established multinational growth companies that we believe are well-positioned to weather difficult economic climates and thrive in more favorable environments. We focus on purchasing growth stocks at a price we consider to be justified by a company’s fundamentals. The result is a portfolio of stocks in prominent companies selected for their sustained patterns of profitability, strong balance sheets, expanding global presence and above-average growth potential.
At the same time, we manage the fund in a manner particularly well-suited to long-term investors. Our investment approach is based on targeting long-term growth rather than short-term profit. Generally, we buy and sell relatively few stocks during the course of the year, helping to minimize investors’ tax liabilities and reduce trading costs.3
The Fund 3
DISCUSSION OF FUND PERFORMANCE (continued)
What other factors influenced the fund’s performance?
When 2003 began, persistent economic weakness, corporate scandals, rising geopolitical tensions and lackluster corporate earnings had taken their toll on stock prices. Despite the ongoing efforts of the Federal Reserve Board to stimulate renewed growth, the U.S. economy failed to gain momentum through the first quarter of 2003, and stocks continued to languish.
However, a veil of uncertainty was lifted from the economy when the allied coalition entered Iraq in late March, and investors became more optimistic about business conditions. As their appetite for risk increased, investors turned their attention to lower-quality companies, many with no earnings, that had performed poorly during the three-year bear market. Among higher-quality stocks, investors generally favored those with economically sensitive businesses, such as companies in the technology and basic materials sectors.
In this changing environment, blue-chip companies with consistent and predictable earnings growth fell out of favor. For example, consumer staples stocks, which represented the fund’s greatest area of concentration and had performed relatively strongly during the bear market, lagged the overall market as investors turned their attention to other, more growth-oriented areas, such as technology.While technology holdings Intel and International Business Machines gained value, the fund’s relatively light exposure to the technology sector contributed to its lagging relative performance.
In addition, the fund encountered more disappointing results among large pharmaceutical companies in the health care sector which were hurt by concerns regarding potential government regulation and price controls, imports of lower-cost drugs from Canada and a slowdown in prescription writing. We believe that these concerns are likely to be temporary, and we have maintained our positions in drug companies that, in our view, should benefit from long-term demographic trends. While some of the fund’s financial services holdings such as Citigroup and J. P. Morgan Chase & Co. performed well when the financial
4
markets began to recover, other financial services holdings detracted from performance. Most notably, government-sponsored enterprise Freddie Mac suffered in the wake of the discovery of accounting and management irregularities.
The fund received positive contributions to performance from a number of its holdings. In addition to Intel, the fund enjoyed above-average returns from food and tobacco giant Altria Group, which benefited from an easing of litigation concerns, and General Electric, which owns a number of cyclical businesses expected to do well in a stronger economy. However, the greatest positive contributor to the fund’s relative performance was a continual reduction of holdings in the telecommunications services sector, where competitive pressures hurt the stocks of the local telephone companies.
What is the fund’s current strategy?
We have maintained our focus on well-established companies with records of steady and consistent growth. In our judgment, blue-chip companies with dominant market positions and strong balance sheets are likely to reward investors over the long term.
Historically, lower-quality stocks typically have led the market during the early stages of economic recoveries, and higher-quality stocks have tended to do better later in the economic cycle.Therefore, we believe that the fund remains well-positioned for the long term.
January 15, 2004
| 1 | Total return includes reinvestment of dividends and any capital gains paid. Past performance is no guarantee of future results. Share price and investment return fluctuate such that upon redemption, fund shares may be worth more or less than their original cost. |
| 2 | SOURCE: LIPPER INC. — Reflects reinvestment of dividends and, where applicable, capital gain distributions.The Standard & Poor’s 500 Composite Stock Price Index is a widely accepted, unmanaged index of U.S. stock market performance. |
| 3 | Achieving tax efficiency is not a part of the fund’s investment objective, and there can be no guarantee that the fund will achieve any particular level of taxable distributions in future years. In periods when the manager has to sell significant amounts of securities (e.g., during periods of significant net redemptions or changes in index components) funds can be expected to be less tax efficient than during periods of more stable market conditions and asset flows. |
The Fund 5
FUND PERFORMANCE

| Average Annual Total Returns as of 12/31/03 | ||||||
| 1 Year | 5 Years | 10 Years | ||||
| Fund | 20.39% | (0.07)% | 11.59% |
† Source: Lipper Inc.
Past performance is not predictive of future performance.The fund’s performance shown in the graph and table does not reflect the deduction of taxes that a shareholder would pay on fund distributions or the redemption of fund shares. The above graph compares a $10,000 investment made in Dreyfus Appreciation Fund, Inc. on 12/31/93 to a $10,000 investment made in the Standard & Poor’s 500 Composite Stock Price Index (the “Index”) on that date.All dividends and capital gain distributions are reinvested.
The fund’s performance shown in the line graph takes into account all applicable fees and expenses.The Index is a widely accepted, unmanaged index of U.S. stock market performance, which does not take into account charges, fees and other expenses. Further information relating to fund performance, including expense reimbursements, if applicable, is contained in the Financial Highlights section of the prospectus and elsewhere in this report.
STATEMENT OF INVESTMENTS
December 31, 2003
| Common Stocks—96.6% | Shares | Value ($) | ||
| Apparel—.9% | ||||
| Christian Dior | 600,000 a | 36,255,926 | ||
| Automobiles & Components—.1% | ||||
| Ford Motor | 280,905 | 4,494,480 | ||
| Banking—7.8% | ||||
| Bank of America | 800,000 | 64,344,000 | ||
| Federal Home Loan Mortgage | 950,000 | 55,404,000 | ||
| Federal National Mortgage Association | 1,900,000 | 142,614,000 | ||
| SunTrust Banks | 675,000 | 48,262,500 | ||
| 310,624,500 | ||||
| Capital Goods—5.3% | ||||
| Emerson Electric | 850,000 | 55,037,500 | ||
| General Electric | 5,000,000 | 154,900,000 | ||
| 209,937,500 | ||||
| Diversified Financials—7.5% | ||||
| American Express | 1,500,000 | 72,345,000 | ||
| Citigroup | 2,500,333 | 121,366,164 | ||
| J.P. Morgan Chase & Co. | 1,650,000 | 60,604,500 | ||
| Merrill Lynch | 780,000 | 45,747,000 | ||
| 300,062,664 | ||||
| Energy—11.3% | ||||
| BP, ADR | 2,100,000 | 103,635,000 | ||
| ChevronTexaco | 950,000 | 82,070,500 | ||
| Exxon Mobil | 5,302,598 | 217,406,518 | ||
| Royal Dutch Petroleum, ADR | 900,000 | 47,151,000 | ||
| 450,263,018 | ||||
| Food, Beverage & Tobacco—16.6% | ||||
| Altria Group | 3,800,000 | 206,796,000 | ||
| Anheuser-Busch Cos. | 1,350,000 | 71,118,000 | ||
| Coca-Cola | 3,100,000 | 157,325,000 | ||
| Kraft Foods | 1,600,000 | 51,552,000 | ||
| Nestle, ADR | 1,250,000 | 78,062,500 | ||
| PepsiCo | 2,050,000 | 95,571,000 | ||
| 660,424,500 | ||||
| Food & Staples Retailing—5.5% | ||||
| Wal-Mart Stores | 2,000,000 | 106,100,000 | ||
| Walgreen | 3,150,000 | 114,597,000 | ||
| 220,697,000 |
The Fund 7
| STATEMENT OF INVESTMENTS (continued) | |||||
| Common Stocks (continued) | Shares | Value ($) | |||
| Health Care—15.0% | |||||
| Abbott Laboratories | 1,400,000 | 65,240,000 | |||
| Eli Lilly & Co. | 700,000 | 49,231,000 | |||
| Johnson & Johnson | 2,800,000 | 144,648,000 | |||
| Medco Health Solutions | 222,507 b | 7,563,013 | |||
| Merck & Co. | 1,845,000 | 85,239,000 | |||
| Pfizer | 6,075,000 | 214,629,750 | |||
| Roche Holdings, ADR | 300,000 | 30,174,151 | |||
| 596,724,914 | |||||
| Hotels Restaurants & Leisure—.9% | |||||
| McDonald’s | 1,525,000 | 37,865,750 | |||
| Household & Personal Products—5.6% | |||||
| Colgate-Palmolive | 1,000,000 | 50,050,000 | |||
| Estee Lauder Cos, Cl. A | 800,000 | 31,408,000 | |||
| Procter & Gamble | 1,400,000 | 139,832,000 | |||
| 221,290,000 | |||||
| Insurance—5.7% | |||||
| American International Group | 1,100,000 | 72,908,000 | |||
| Berkshire Hathaway, Cl. A | 820 b | 69,085,000 | |||
| Marsh & McLennan Cos. | 1,750,000 | 83,807,500 | |||
| 225,800,500 | |||||
| Media/Entertainment—3.2% | |||||
| Fox Entertainment Group, Cl. A | 782,700 b | 22,815,705 | |||
| McGraw-Hill Cos. | 1,100,000 | 76,912,000 | |||
| News Corp, ADR | 120,000 a | 4,332,000 | |||
| Time Warner | 1,407,500 b | 25,320,925 | |||
| 129,380,630 | |||||
| Retailing—1.3% | |||||
| Target | 1,300,000 | 49,920,000 | |||
| Semiconductors & Semiconductor Equipment—5.1% | |||||
| Intel | 6,300,000 | 202,860,000 | |||
| Software & Services—2.9% | |||||
| Microsoft | 4,200,000 | 115,668,000 | |||
| Technology Hardware & Equipment—.3% | |||||
| International Business Machines | 150,000 | 13,902,000 | |||
| Telecommunication Services—.5% | |||||
| BellSouth | 350,000 | 9,905,000 | |||
| SBC Communications | 350,192 | 9,129,505 | |||
| 19,034,505 | |||||
| 8 |
| Common Stocks (continued) | Shares | Value ($) | |||
| Transportation—1.1% | |||||
| United Parcel Service, Cl. B | 575,000 | 42,866,250 | |||
| Total Common Stocks | |||||
| (cost $ | 2,809,134,594) | 3,848,072,137 | |||
| Preferred Stocks—1.2% | |||||
| Automobiles & Components—.6% | |||||
| Ford Motor Capital Trust II, Conv., 6.50% | 450,000 | 25,132,500 | |||
| Media/Entertainment—.6% | |||||
| News, ADR, Cum., $.4428 | 800,000 | 24,200,000 | |||
| Total Preferred Stocks | |||||
| (cost $ | 41,636,726) | 49,332,500 | |||
| Principal | ||||||
| Short-Term Investments—2.3% | Amount ($) | Value ($) | ||||
| U.S. Treasury Bills; | ||||||
| .89%, 1/2/2004 | 3,552,000 | 3,552,000 | ||||
| .85%, 1/15/2004 | 23,277,000 | 23,269,552 | ||||
| .80%, 2/26/2004 | 27,590,000 | 27,556,064 | ||||
| .84%, 3/11/2004 | 3,008,000 | 3,003,247 | ||||
| .83%, 3/18/2004 | 1,896,000 | 1,892,663 | ||||
| .82%, 3/25/2004 | 30,000,000 | 29,940,300 | ||||
| Total Short-Term Investments | ||||||
| (cost $ | 89,215,235) | 89,213,826 | ||||
| Investments of Cash Collateral | ||||||
| for Securities Loaned—.1% | Shares | Value ($) | ||||
| Registered Investment Company; | ||||||
| Dreyfus Institutional Preferred Money Market Fund | ||||||
| (cost $ | 5,487,057) | 5,487,057 | 5,487,057 | |||
| Total Investments (cost $ | 2,945,473,612) | 100.2% | 3,992,105,520 | |||
| Liabilities, Less Cash and Receivables | (.2%) | (10,065,590) | ||||
| Net Assets | 100.0% | 3,982,039,930 | ||||
a A portion of this securities are on loan.At December 31, 2003, the total market value of the fund’s secutities on loan is $5,335,594 and the total market value of the collateral held by the fund is $5,487,057. b Non-income producing.
See notes to financial statements.
The Fund 9
STATEMENT OF ASSETS AND LIABILITIES
December 31, 2003
| Cost | Value | ||||
| Assets ($): | |||||
| Investments in securities—See Statement of Investments | |||||
| (including securities on loan, | |||||
| valued at $5,335,594)—Note 1(c) | 2,945,473,612 | 3,992,105,520 | |||
| Cash | 4,980,037 | ||||
| Dividends and interest receivable | 6,582,283 | ||||
| Receivable for shares of Common Stock subscribed | 4,776,864 | ||||
| Prepaid expenses | 101,632 | ||||
| 4,008,546,336 | |||||
| Liabilities ($): | |||||
| Due to The Dreyfus Corporation and affiliates | 1,905,969 | ||||
| Due to Fayez Sarofim & Co. | 888,909 | ||||
| Payable for shares of Common Stock redeemed | 17,454,205 | ||||
| Liability for securities on loan—Note 1(c) | 5,487,057 | ||||
| Accrued expenses | 770,266 | ||||
| 26,506,406 | |||||
| Net Assets ( | $) | 3,982,039,930 | |||
| Composition of Net Assets ($): | |||||
| Paid-in capital | 2,963,904,514 | ||||
| Accumulated undistributed investment income—net | 746,842 | ||||
| Accumulated net realized gain (loss) on investments | (29,248,877) | ||||
| Accumulated net unrealized appreciation (depreciation) | |||||
| on investments and foreign currency transactions | 1,046,637,451 | ||||
| Net Assets ( | $) | 3,982,039,930 | |||
| Shares Outstanding | |||||
| (300 million shares of $.001 par value Common Stock authorized) | 107,228,159 | ||||
| Net Asset Value, | offering and redemption price per share ($) | 37.14 | |||
| See notes to financial statements. | |||||
10
STATEMENT OF OPERATIONS
Year Ended December 31, 2003
| Investment Income ( | $): | ||
| Income: | |||
| Cash dividends (net of $859,874 foreign taxes withheld at source) | 75,554,223 | ||
| Interest | 718,436 | ||
| Income from securities lending | 43,195 | ||
| Total Income | 76,315,854 | ||
| Expenses: | |||
| Investment advisory fee—Note 3(a) | 9,541,708 | ||
| Sub-Investment advisory fee—Note 3(a) | 9,196,708 | ||
| Shareholder servicing costs—Note 3(b) | 13,240,300 | ||
| Prospectus and shareholders’ reports | 230,766 | ||
| Custodian fees—Note 3(b) | 212,604 | ||
| Registration fees | 93,195 | ||
| Directors’ fees and expenses—Note 3(c) | 82,847 | ||
| Professional fees | 58,003 | ||
| Loan commitment fees—Note 2 | 35,458 | ||
| Interest expense—Note 2 | 3,100 | ||
| Miscellaneous | 47,731 | ||
| Total Expenses | 32,742,420 | ||
| Investment Income—Net | 43,573,434 | ||
| Realized and Unrealized Gain (Loss) on Investments—Note 4 ($): | |||
| Net realized gain (loss) on investments and foreign currency transactions | (28,231,960) | ||
| Net unrealized appreciation (depreciation) on investments | |||
| and foreign currency transactions | 641,172,330 | ||
| Net Realized and Unrealized Gain (Loss) on Investments | 612,940,370 | ||
| Net Increase in Net Assets Resulting from Operations | 656,513,804 | ||
| See notes to financial statements. | |||
The Fund 11
STATEMENT OF CHANGES IN NET ASSETS
| Year Ended December 31, | ||||
| 2003 | 2002 | |||
| Operations ($): | ||||
| Investment income—net | 43,573,434 | 29,925,846 | ||
| Net realized gain (loss) on investments | (28,231,960) | (782,041) | ||
| Net unrealized appreciation | ||||
| (depreciation) on investments | 641,172,330 | (660,260,523) | ||
| Net Increase (Decrease) in Net Assets | ||||
| Resulting from Operations | 656,513,804 | (631,116,718) | ||
| Dividends to Shareholders from ($): | ||||
| Investment income—net | (43,629,479) | (29,490,937) | ||
| Net realized gain on investments | — | (1,409,168) | ||
| Total Dividends | (43,629,479) | (30,900,105) | ||
| Capital Stock Transactions ($): | ||||
| Net proceeds from shares sold | 1,115,149,789 | 1,407,661,089 | ||
| Dividends reinvested | 40,095,009 | 28,644,573 | ||
| Cost of shares redeemed | (914,570,827) | (1,040,328,890) | ||
| Increase (Decrease) in Net Assets | ||||
| from Capital Stock Transactions | 240,673,971 | 395,976,772 | ||
| Total Increase (Decrease) in Net Assets | 853,558,296 | (266,040,051) | ||
| Net Assets ($): | ||||
| Beginning of Period | 3,128,481,634 | 3,394,521,685 | ||
| End of Period | 3,982,039,930 | 3,128,481,634 | ||
| Undistributed investment income—net | 746,842 | 568,011 | ||
| Capital Share Transactions (Shares): | ||||
| Shares sold | 33,593,113 | 40,350,613 | ||
| Shares issued for dividends reinvested | 1,104,628 | 891,861 | ||
| Shares redeemed | (27,727,163) | (30,276,063) | ||
| Net Increase (Decrease) in Shares Outstanding | 6,970,578 | 10,966,411 | ||
| See notes to financial statements. | ||||
12
| FINANCIAL HIGHLIGHTS |
| The following table describes the performance for the fiscal periods indicated.Total |
| return shows how much your investment in the fund would have increased (or |
| decreased) during each period, assuming you had reinvested all dividends and dis- |
| tributions.These figures have been derived from the fund’s financial statements. |
| Year Ended December 31, | ||||||||||
| 2003 | 2002 | 2001 | 2000 | 1999 | ||||||
| Per Share Data ($): | ||||||||||
| Net asset value, | ||||||||||
| beginning of period | 31.20 | 38.02 | 42.93 | 45.73 | 42.07 | |||||
| Investment Operations: | ||||||||||
| Investment income—neta | .42 | .31 | .28 | .29 | .23 | |||||
| Net realized and unrealized | ||||||||||
| gain (loss) on investments | 5.93 | (6.81) | (4.88) | .42 | 3.97 | |||||
| Total from Investment Operations | 6.35 | (6.50) | (4.60) | .71 | 4.20 | |||||
| Distributions: | ||||||||||
| Dividends from investment | ||||||||||
| income—net | (.41) | (.30) | (.31) | (.29) | (.23) | |||||
| Dividends from net realized | ||||||||||
| gain on investments | — | (.02) | — | (3.09) | (.31) | |||||
| Dividends in excess of net realized | ||||||||||
| gain on investments | — | — | — | (.13) | — | |||||
| Total Distributions | (.41) | (.32) | (.31) | (3.51) | (.54) | |||||
| Net asset value, end of period | 37.14 | 31.20 | 38.02 | 42.93 | 45.73 | |||||
| Total Return (%) | 20.39 | (17.14) | (10.75) | 1.80 | 9.97 | |||||
| Ratios/Supplemental Data (%): | ||||||||||
| Ratio of operating expenses | ||||||||||
| to average net assets | .96 | .97 | .91 | .88 | .88 | |||||
| Ratio of interest expense and | ||||||||||
| loan commitment fees | ||||||||||
| to average net assets | .00b | .00b | .00b | .01 | .01 | |||||
| Ratio of net investment income | ||||||||||
| to average net assets | 1.28 | .90 | .72 | .64 | .51 | |||||
| Portfolio Turnover Rate | 4.73 | 1.77 | 5.03 | 4.28 | 11.77 | |||||
| Net Assets, end of period | ||||||||||
| ($ x 1,000) | 3,982,040 | 3,128,482 | 3,394,522 | 3,846,196 | 4,742,081 | |||||

The Fund
13
NOTES TO FINANCIAL STATEMENTS
NOTE 1—Significant Accounting Policies:
Dreyfus Appreciation Fund, Inc. (the “fund”) is registered under the Investment Company Act of 1940, as amended (the “Act”), as a diversified open-end management investment company.The fund’s investment objective is to provide investors with long-term capital growth consistent with the preservation of capital. The Dreyfus Corporation (“Dreyfus”) serves as the fund’s investment adviser. Dreyfus is a wholly-owned subsidiary of Mellon Bank, N.A. (“Mellon”), which is a wholly-owned subsidiary of Mellon Financial Corporation. Fayez Sarofim & Co. (“Sarofim”) serves as the fund’s sub-investment adviser. Dreyfus Service Corporation (the “Distributor”), a wholly-owned subsidiary of Dreyfus, is the distributor of the fund’s shares, which are sold to the public without a sales charge.
The fund’s financial statements are prepared in accordance with accounting principles generally accepted in the United States, which may require the use of management estimates and assumptions. Actual results could differ from those estimates.
(a) Portfolio valuation: Investments in securities are valued at the last sales price on the securities exchange on which such securities are primarily traded or at the last sales price on the national securities market. Effective April 14, 2003, the fund began pricing securities traded on the NASDAQ stock market using the NASDAQ official closing price. Securities not listed on an exchange or the national securities market, or securities for which there were no transactions, are valued at the average of the most recent bid and asked prices. Bid price is used when no asked price is available.Securities for which there are no such valuations are valued at fair value as determined in good faith under the direction of the Board of Directors. Investments denominated in foreign currencies are translated to U.S. dollars at the prevailing rates of exchange.
(b) Foreign currency transactions: The fund does not isolate that portion of the results of operations resulting from changes in foreign exchange rates on investments from the fluctuations arising from changes in market prices of securities held. Such fluctuations are included with the net realized and unrealized gain or loss from investments.
Net realized foreign exchange gains or losses arise from sales and maturities of short-term securities, sales of foreign currencies, currency gains or losses realized on securities transactions and the difference between the amounts of dividends, interest, and foreign withholding taxes recorded on the fund’s books and the U.S. dollar equivalent of the amounts actually received or paid. Net unrealized foreign exchange gains and losses arise from changes in the value of assets and liabilities other than investments in securities, resulting from changes in exchange rates. Such gains and losses are included with net realized and unrealized gain or loss on investments.
(c) Securities transactions and investment income: Securities transactions are recorded on a trade date basis. Realized gain and loss from securities transactions are recorded on the identified cost basis. Dividend income is recognized on the ex-dividend date and interest income, including, where applicable, amortization of discount and premium on investments, is recognized on the accrual basis. Under the terms of the custody agreement, the fund receives net earnings credits based on available cash balances left on deposit.
The fund may lend securities to qualified institutions. At origination, all loans are secured by collateral of at least 102% of the value of U.S. securities loaned and 105% of the value of foreign securities loaned. Collateral equivalent to at least 100% of the market value of securities on loan will be maintained at all times. Cash collateral is invested in certain other money market mutual funds managed by Dreyfus as shown in the fund’s Statement of Investments. The fund will be entitled to receive all income on securities loaned, in addition to income earned as a result of the lending transaction. Although each security loaned is fully collateralized, the fund would bear the risk of delay in recovery of, or loss of rights in, the securities loaned should a borrower fail to return the securities in a timely manner.
(d) Dividends to shareholders: Dividends are recorded on the ex-dividend date. Dividends from investment income-net and dividends from net realized capital gain, if any, are normally declared and paid
The Fund
15
NOTES TO FINANCIAL STATEMENTS (continued)
annually but the fund may make distributions on a more frequent basis to comply with the distribution requirements of the Internal Revenue Code of 1986, as amended (the “Code”).To the extent that net realized capital gain can be offset by capital loss carryovers, if any, it is the policy of the fund not to distribute such gain. Income and capital gain distributions are determined in accordance with income tax regulations, which may differ from accounting principles generally accepted in the United States.
(e) Federal income taxes: It is the policy of the fund to continue to qualify as a regulated investment company, if such qualification is in the best interests of its shareholders, by complying with the applicable provisions of the Code, and to make distributions of taxable income sufficient to relieve it from substantially all federal income and excise taxes.
At December 31, 2003, the components of accumulated earnings on a tax basis were as follows: undistributed ordinary income $746,842, accumulated capital losses $16,524,064 and unrealized appreciation $1,046,637,451. In addition, the fund had $12,724,813 of capital losses realized after October 31, 2003, which were deferred for tax purposes to the first day of the following fiscal year.
The accumulated capital loss carryover is available to be applied against future net securities profits, if any, realized subsequent to December 31, 2003. If not applied, $264,160 of the carryover expires in fiscal 2010 and $16,259,904 expires in fiscal 2011.
The tax character of distributions paid to shareholders during the fiscal periods ended December 31, 2003 and December 31, 2002, were as follows: ordinary income $43,629,479 and $29,490,937 and long-term capital gains $0 and $1,409,168, respectively.
During the period ended December 31, 2003, as a result of permanent book to tax differences, the fund increased accumulated undistributed investment income-net by $234,876 and decreased accumulated net realized gain (loss) on investments by the same amount. Net assets were not affected by this reclassification.
16
NOTE 2—Bank Line of Credit:
The fund participates with other Dreyfus-managed funds in a $350 million redemption credit facility (the “Facility”) to be utilized for temporary or emergency purposes, including the financing of redemptions. In connection therewith, the fund has agreed to pay commitment fees on its pro rata portion of the Facility. Interest is charged to the fund based on prevailing market rates in effect at the time of borrowings.
The average daily amount of borrowings outstanding under the Facility during the period ended December 31, 2003, was $197,500 with a related weighted average annualized interest rate of 1.55%.
NOTE 3—Investment Advisory Fee, Sub-Investment Advisory Fee and Other Transactions With Affiliates:
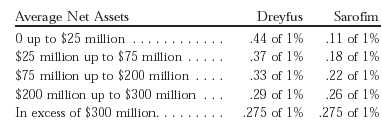
(a) Fees payable by the fund pursuant to the provisions of an Investment Advisory Agreement with Dreyfus and a Sub-Investment Advisory Agreement with Sarofim are payable monthly, computed on the average daily value of the fund’s net assets at the following annual rates:
(b) Under the Shareholder Services Plan, the fund pays the Distributor for the provision of certain services at the annual rate of .25 of 1% of the value of the fund’s average daily net assets.The services provided may include personal services relating to shareholder accounts, such as answering shareholder inquiries regarding the fund and providing reports and other information, and services related to the maintenance of shareholder accounts. The Distributor may make payments to
The Fund
17
| NOTES TO FINANCIAL STATEMENTS (continued) |
Service Agents (a securities dealer, financial institution or other industry professional) in respect of these services. The Distributor determines the amounts to be paid to Service Agents. During the period ended December 31, 2003, the fund was charged $8,517,462 pursuant to the Shareholder Services Plan.
The fund compensates Dreyfus Transfer, Inc., a wholly-owned subsidiary of Dreyfus, under a transfer agency agreement for providing personnel and facilities to perform transfer agency services for the fund. During the period ended December 31, 2003, the fund was charged $1,299,738 pursuant to the transfer agency agreement.
The fund compensates Mellon under a custody agreement for providing custodial services for the fund. During the period ended December 31, 2003, the fund was charged $212,604 pursuant to the custody agreement.
(c) Each Board member also serves as a Board member of other funds within the Dreyfus complex. Annual retainer fees and attendance fees are allocated to each fund based on net assets.
(d) During the period ended December 31, 2003, the fund incurred total brokerage commissions of $745,856, of which $6,000 was paid to Harborside Plus Inc., a wholly-owned subsidiary of Mellon Financial Corporation.
NOTE 4—Securities Transactions:
The aggregate amount of purchases and sales of investment securities, excluding short-term securities, during the period ended December 31, 2003, amounted to $381,685,249 and $153,547,012, respectively.
At December 31, 2003, the cost of investments for federal income tax purposes was $2,945,473,612; accordingly, accumulated net unrealized appreciation on investments was $1,046,631,908, consisting of $1,126,634,783 gross unrealized appreciation and $80,002,875 gross unrealized depreciation.
18
REPORT OF INDEPENDENT AUDITORS
Shareholders and Board of Directors Dreyfus Appreciation Fund, Inc.
We have audited the accompanying statement of assets and liabilities of Dreyfus Appreciation Fund, Inc., including the statement of investments, as of December 31, 2003, and the related statement of operations for the year then ended, the statement of changes in net assets for each of the two years in the period then ended, and financial highlights for each of the years indicated therein.These financial statements and financial highlights are the responsibility of the Fund’s management. Our responsibility is to express an opinion on these financial statements and financial highlights based on our audits.
We conducted our audits in accordance with auditing standards generally accepted in the United States. Those standards require that we plan and perform the audit to obtain reasonable assurance about whether the financial statements and financial highlights are free of material misstatement. An audit includes examining, on a test basis, evidence supporting the amounts and disclosures in the financial statements and financial highlights. Our procedures included verification by examination of securities held by the custodian as of December 31, 2003 and confirmation of securities not held by the custodian by correspondence with others.An audit also includes assessing the accounting principles used and significant estimates made by management, as well as evaluating the overall financial statement presentation. We believe that our audits provide a reasonable basis for our opinion.
In our opinion, the financial statements and financial highlights referred to above present fairly, in all material respects, the financial position of Dreyfus Appreciation Fund, Inc. at December 31, 2003, the results of its operations for the year then ended, the changes in its net assets for each of the two years in the period then ended, and the financial highlights for each of the indicated years, in conformity with accounting principles generally accepted in the United States.
![]()
| New York, New York |
| February 9, 2004 |
The Fund 19
IMPORTANT TAX INFORMATION (Unaudited)
For federal tax purposes, the fund hereby designates 100% of the ordinary dividends paid during the fiscal year ended December 31, 2003 as qualifying for the corporate dividends received deduction.The fund also designates 98.80% of the ordinary dividends paid during 2003 as qualified dividends subject to a maximum tax rate of 15% as provided for by the Jobs and Growth Tax Relief Reconciliation Act of 2003.
20
BOARD MEMBERS INFORMATION (Unaudited)
| Joseph S. DiMartino (60) | |
| Chairman of the Board (1995) | |
| Principal Occupation During Past 5 Years: | |
| • Corporate Director and Trustee | |
| Other Board Memberships and Affiliations: | |
| • The Muscular Dystrophy Association, Director | |
| • Levcor International, Inc., an apparel fabric processor, Director | |
| • Century Business Services, Inc., a provider of outsourcing functions for small and | medium |
| size companies, Director | |
| • The Newark Group, a provider of a national market of paper recovery facilities, | paperboard |
| mills and paperboard converting plants, Director | |
| No. of Portfolios for which Board Member Serves: 186 | |
| ——————— | |
| Clifford L. Alexander, Jr. (70) | |
| Board Member (1981) | |
| Principal Occupation During Past 5 Years: | |
| • President of Alexander & Associates, Inc., a management consulting firm | |
| (January 1981-present) | |
| • Chairman of the Board of Moody’s Corporation (October 2000-October 2003) | |
| • Chairman of the Board and Chief Executive Officer of The Dun and Bradstreet Corporation | |
| (October 1999-September 2000) | |
| Other Board Memberships and Affiliations: | |
| • Wyeth (formerly, American Home Products Corporation), a global leader in | pharmaceuticals, |
| consumer healthcare products and animal health products, Director | |
| • Mutual of America Life Insurance Company, Director | |
| No. of Portfolios for which Board Member Serves: 65 | |
| ——————— | |
| Peggy C. Davis (60) | |
| Board Member (1990) | |
| Principal Occupation During Past 5 Years: | |
| • Shad Professor of Law, New York University School of Law (1983-present) | |
| • She writes and teaches in the fields of evidence, constitutional theory, family law, social | |
| sciences and the law, legal process and professional methodology and training | |
| No. of Portfolios for which Board Member Serves: 26 | |
The Fund 21
BOARD MEMBERS INFORMATION (Unaudited) (continued)
| Ernest Kafka (71) | |
| Board Member (1981) | |
| Principal Occupation During Past 5 Years: | |
| • Physician engaged in private practice specializing in the psychoanalysis of adults and | |
| adolescents (1962-present) | |
| • Instructor,The New York Psychoanalytic Institute (1981-present) | |
| • Associate Clinical Professor of Psychiatry at Cornell Medical School (1987-2002) | |
| No. of Portfolios for which Board Member Serves: 26 | |
| ——————— | |
| Nathan Leventhal (60) | |
| Board Member (1989) | |
| Principal Occupation During Past 5 Years: | |
| • Chairman of the Avery-Fisher Artist Program (November 1997-present) | |
| • President of Lincoln Center for the Performing Arts, Inc. (March 1984-December | 2000) |
| Other Board Memberships and Affiliations: | |
| • Movado Group, Inc., Director | |
| No. of Portfolios for which Board Member Serves: 26 | |
Once elected all Board Members serve for an indefinite term.Additional information about the Board Members, including their address is available in the fund’s Statement of Additional Information which can be obtained from Dreyfus free of charge by calling this toll free number: 1-800-554-4611.
Saul B. Klaman, Emeritus Board Member
22
OFFICERS OF THE FUND (Unaudited)
STEPHEN E. CANTER, President since March 2000.
Chairman of the Board, Chief Executive Officer and Chief Operating Officer of Dreyfus, and an officer of 95 investment companies (comprised of 185 portfolios) managed by Dreyfus. Mr. Canter also is a Board member and, where applicable, an Executive Committee Member of the other investment management subsidiaries of Mellon Financial Corporation, each of which is an affiliate of Dreyfus. He is 58 years old and has been an employee of Dreyfus since May 1995.
STEPHEN R. BYERS, Executive Vice President since November 2002.
Chief Investment Officer,Vice Chairman and Director of Dreyfus, and an officer of 95 investment companies (comprised of 185 portfolios) managed by Dreyfus. Mr. Byers also is an officer, director or an Executive Committee Member of certain other investment management subsidiaries of Mellon Financial Corporation, each of which is an affiliate of Dreyfus. He is 50 years old and has been an employee of Dreyfus since January 2000. Prior to joining Dreyfus, he served as an Executive Vice President-Capital Markets, Chief Financial Officer and Treasurer at Gruntal & Co., L.L.C.
MARK N. JACOBS, Vice President since March 2000.
Executive Vice President, Secretary and General Counsel of Dreyfus, and an officer of 96 investment companies (comprised of 201 portfolios) managed by Dreyfus. He is 57 years old and has been an employee of Dreyfus since June 1977.
STEVEN F. NEWMAN, Secretary since March 2000.
Associate General Counsel and Assistant Secretary of Dreyfus, and an officer of 96 investment companies (comprised of 201 portfolios) managed by Dreyfus. He is 54 years old and has been an employee of Dreyfus since July 1980.
JANETTE E. FARRAGHER, Assistant Secretary since March 2000.
Associate General Counsel of Dreyfus, and an officer of 15 investment companies (comprised of 26 portfolios) managed by Dreyfus. She is 41 years old and has been an employee of Dreyfus since February 1984.
MICHAEL A. ROSENBERG, Assistant Secretary since March 2000.
Associate General Counsel of Dreyfus, and an officer of 93 investment companies (comprised of 194 portfolios) managed by Dreyfus. He is 43 years old and has been an employee of Dreyfus since October 1991.
JAMES WINDELS, Treasurer since November 2001.
Director – Mutual Fund Accounting of Dreyfus, and an officer of 96 investment companies (comprised of 201 portfolios) managed by Dreyfus. He is 45 years old and has been an employee of Dreyfus since April 1985.
ROBERT SVAGNA, Assistant Treasurer since December 2002.
Senior Accounting Manager – Equity Funds of Dreyfus, and an officer of 25 investment companies (comprised of 101 portfolios) managed by Dreyfus. He is 36 years old and has been an employee of Dreyfus since November 1990.
The Fund 23
OFFICERS OF THE FUND (Unaudited) (continued)
RICHARD CASSARO, Assistant Treasurer since August 2003.
Senior Accounting Manager – Equity Funds of Dreyfus, and an officer of 25 investment companies (comprised of 100 portfolios) managed by Dreyfus. He is 44 years old and has been an employee of Dreyfus since September 1982.
KENNETH J. SANDGREN, Assistant Treasurer since November 2001.
Mutual Funds Tax Director of Dreyfus, and an officer of 96 investment companies (comprised of 201 portfolios) managed by Dreyfus. He is 49 years old and has been an employee of Dreyfus since June 1993.
WILLIAM GERMENIS, Anti-Money Laundering Compliance Officer since September 2002.
Vice President and Anti-Money Laundering Compliance Officer of the Distributor, and the Anti-Money Laundering Compliance Officer of 91 investment companies (comprised of 196 portfolios) managed by Dreyfus. He is 33 years old and has been an employee of the Distributor since October 1998. Prior to joining the Distributor, he was a Vice President of Compliance Data Center, Inc.
24
For More Information
| Dreyfus Appreciation Fund, Inc. |
| 200 Park Avenue |
| New York, NY 10166 |
| Investment Adviser |
| The Dreyfus Corporation |
| 200 Park Avenue |
| New York, NY 10166 |
| Sub-Investment Adviser |
| Fayez Sarofim & Co. |
| Two Houston Center |
| Suite 2907 |
| Houston,TX 77010 |
| Custodian |
| Mellon Bank, N.A. |
| One Mellon Bank Center |
| Pittsburgh, PA 15258 |
| Transfer Agent & |
| Dividend Disbursing Agent |
| Dreyfus Transfer, Inc. |
| 200 Park Avenue |
| New York, NY 10166 |
| Distributor |
| Dreyfus Service Corporation |
| 200 Park Avenue |
| New York, NY 10166 |
To obtain information:
| By telephone |
| Call 1-800-645-6561 |
| By mail Write to: |
| The Dreyfus Family of Funds |
| 144 Glenn Curtiss Boulevard |
| Uniondale, NY 11556-0144 |
| By E-mail Send your request |
| to info@dreyfus.com |
On the Internet Information can be viewed online or downloaded from: http://www.dreyfus.com
A description of the policies and procedures that the fund uses to determine how to vote proxies relating to portfolio securities is available, without charge, by calling the telephone number listed above, or by visiting the SEC’s website at http://www.sec.gov
© 2004 Dreyfus Service Corporation 141AR1203
Item 2. Code of Ethics.
The Registrant has adopted a code of ethics that applies to the Registrant's principal executive officer, principal financial officer, principal accounting officer or controller, or persons performing similar functions.
Item 3. Audit Committee Financial Expert.
The Registrant's Board has determined that Joseph S. DiMartino, a member of the Audit Committee of the Board, is an audit committee financial expert as defined by the Securities and Exchange Commission (the "SEC"). Mr. DiMartino is "independent" as defined by the SEC for purposes of audit committee financial expert determinations.
Item 4. Principal Accountant Fees and Services.
(a) Audit Fees. The aggregate fees billed for each of the last two fiscal years (the "Reporting Periods") for professional services rendered by the Registrant's principal accountant (the "Auditor") for the audit of the Registrant's annual financial statements, or services that are normally provided by the Auditor in connection with the statutory and regulatory filings or engagements for the Reporting Periods, were $26,300 in 2002 and $27,500 in 2003.
(b) Audit-Related Fees. The aggregate fees billed in the Reporting Periods for assurance and related services by the Auditor that are reasonably related to the performance of the audit of the Registrant's financial statements and are not reported under paragraph (a) of this Item 4 were $4,500 in 2002 and $4,500 in 2003. These services consisted of (i) security counts required by Rule 17f-2 under the Investment Company Act of 1940, as amended.
The aggregate fees billed in the Reporting Periods for non-audit assurance and related services by the Auditor to the Registrant's investment adviser (not including any sub-investment adviser whose role is primarily portfolio management and is subcontracted with or overseen by another investment adviser), and any entity controlling, controlled by or under common control with the investment adviser that provides ongoing services to the Registrant ("Service Affiliates"), that were reasonably related to the performance of the annual audit of the Service Affiliate, which required pre-approval by the Audit Committee were $15,000 in 2002 and $288,500 in 2003.
Note: For the second paragraph in each of (b) through (d) of this Item 4, certain of such services were not pre-approved prior to May 6, 2003, when such services were required to be pre-approved. On and after May 6, 2003, 100% of all services provided by the Auditor were pre-approved as required. For comparative purposes, the fees shown assume that all such services were pre-approved, including services that were not pre-approved prior to the compliance date of the pre-approval requirement.
(c) Tax Fees. The aggregate fees billed in the Reporting Periods for professional services rendered by the Auditor for tax compliance, tax advice and tax planning ("Tax Services") were $2,909 in 2002 and $3,237 in 2003.
The aggregate fees billed in the Reporting Periods for Tax Services by the Auditor to Service Affiliates which required pre-approval by the Audit Committee were $0 in 2002 and $0 in 2003.
(d) All Other Fees. The aggregate fees billed in the Reporting Periods for products and services provided by the Auditor, other than the services reported in paragraphs (a) through (c) of this Item, were less than $0 in 2002 and $600 in 2003. These services consisted of a review of the Registrant's anti-money laundering program.
The aggregate fees billed in the Reporting Periods for Non-Audit Services by the Auditor to Service Affiliates, other than the services reported in paragraphs (b) and (c) of this Item, which required pre-approval by the Audit Committee were $0 in 2002 and $0 in 2003.
Audit Committee Pre-Approval Policies and Procedures. The Registrant's Audit Committee has established policies and procedures (the "Policy") for pre-approval (within specified fee limits) of the Auditor's engagements for non-audit services to the Registrant and Service Affiliates without specific case-by-case consideration. Pre-approval considerations include whether the proposed services are compatible with maintaining the Auditor's independence. Pre-approvals pursuant to the Policy are considered annually.
Non-Audit Fees. The aggregate non-audit fees billed by the Auditor for services rendered to the Registrant, and rendered to Service Affiliates, for the Reporting Periods were $471,337 in 2002 and $521,764 in 2003.
Auditor Independence. The Registrant's Audit Committee has considered whether the provision of non-audit services that were rendered to Service Affiliates which were not pre-approved (not requiring pre-approval) is compatible with maintaining the Auditor's independence.
Item 5. Audit Committee of Listed Registrants.
Not applicable.
Item 6. [Reserved]
Item 7. Disclosure of Proxy Voting Policies and Procedures for Closed-End
Management Investment Companies.
Not applicable.
Item 8. Purchases of Equity Securities by Closed-End Management Investment
Companies and Affiliated Purchasers.
Not applicable.
Item 9. Submission of Matters to a Vote of Security Holders.
Not applicable.
Item 10. Controls and Procedures.
(a) The Registrant's principal executive and principal financial officers have concluded, based on their evaluation of the Registrant's disclosure controls and procedures as of a date within 90 days of the filing date of this report, that the Registrant's disclosure controls and procedures are reasonably designed to ensure that information required to be disclosed by the Registrant on Form N-CSR is recorded, processed, summarized and reported within the required time periods and that information required to be disclosed by the Registrant in the reports that it files or submits on Form N-CSR is accumulated and communicated to the Registrant's management, including its principal executive and principal financial officers, as appropriate to allow timely decisions regarding required disclosure.
(b) There were no changes to the Registrant's internal control over financial reporting that occurred during the Registrant's most recently ended fiscal half-year that have materially affected, or are reasonably likely to materially affect, the Registrant's internal control over financial reporting.
Item 11. Exhibits.
(a)(1) Code of ethics referred to in Item 2.
(a)(2) Certifications of principal executive and principal financial officers as required by Rule 30a-2(a) under the Investment Company Act of 1940.
(a)(3) Not applicable.
(b) Certification of principal executive and principal financial officers as required by Rule 30a-2(b) under the Investment Company Act of 1940.
SIGNATURES
Pursuant to the requirements of the Securities Exchange Act of 1934 and the Investment
Company Act of 1940, the Registrant has duly caused this Report to be signed on its behalf by the undersigned, thereunto duly authorized.
| DREYFUS APPRECIATION FUND, INC. | |
| By: | /s/ Stephen E. Canter |
| Stephen E. Canter | |
| President | |
| Date: | February 25, 2004 |
Pursuant to the requirements of the Securities Exchange Act of 1934 and the Investment Company Act of 1940, this Report has been signed below by the following persons on behalf of the Registrant and in the capacities and on the dates indicated.
| By: | /s/ Stephen E. Canter |
| Stephen E. Canter | |
| Chief Executive Officer | |
| Date: | February 25, 2004 |
| By: | /s/ James Windels |
| James Windels | |
| Chief Financial Officer | |
| Date: | February 25, 2004 |
EXHIBIT INDEX
(a)(1) Code of ethics referred to in Item 2.
(a)(2) Certifications of principal executive and principal financial officers as required by Rule 30a-2(a) under the Investment Company Act of 1940. (EX-99.CERT)
(b) Certification of principal executive and principal financial officers as required by Rule 30a-2(b) under the Investment Company Act of 1940. (EX-99.906CERT)