 Description of Quest Integrity Group Acquisition 1 November 2010 Exhibit 99.2 |
 2 Recent Purchase of Quest Integrity Group Transaction Details • Team purchased 95% of Quest Integrity Group (“Quest Integrity”) for $42.6 million ($ 39.1 million – cash, $3.5 million in TISI restricted stock, approximately 186 thousand shares). • Team expects to purchase the remaining 5% ownership of Quest (with TISI common shares) in 2015 with value tied to business performance. • Current management will continue to lead business which will operate as separate business group within TCM Division. – Will seek joint business opportunities with Team’s inspection service and other service offerings – Will continue to purse and develop independent business opportunities • Estimated CY2010 revenues and EBITDA are $22 million and $5 million respectively. • Acquisition is expected to be earnings neutral in first year. |
 3 Strategic Goals for Quest Integrity Acquisition • Expand the revenues and margins of Team’s inspection services business – Enhance reputation to provide state-of-the-art, value-based solutions to customers – Create growth opportunities in several new market segments and possibly accelerate growth opportunities in existing market segments – Sustain strategic leadership in service segment via access to new and emerging technologies over time • Capitalize on and accelerate, where appropriate, the future growth and performance of Quest Integrity Group – Collaborate on North American market opportunities and increase market access/penetration for Quest Integrity Group services – Provide appropriate corporate support and oversight for the high growth technology-enabled inspection services and capabilities |
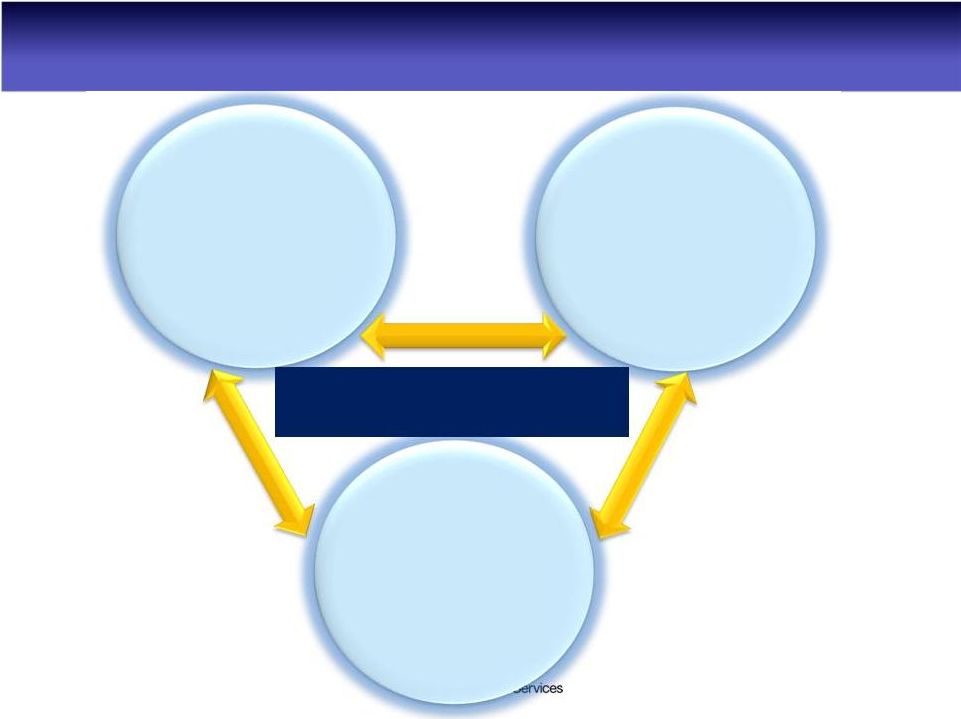 Quest Integrity’s Capabilities Quantitative Inspection Services Proprietary technology-enabled and specialized inspection services Engineering Assessment Specialized knowledge and operating experience applied through consultation services Advanced NDT & Software Tools Development Proprietary data collection, assessment and assistance tools Asset Integrity and Reliability Management Solutions 4 |
 Engineering Assessment Expertise and Applications Core Competencies • Fitness-for-Service (FFS) Assessment • Fracture Mechanics • Finite Element Analysis (FEA) • Computational Fluid Dynamics (CFD) • Failure Analysis • Corrosion Engineering • Materials Performance - Creep and High Temperature • Risked-Based Inspection/Assessment • Software Development Key Industries Served • Process Plants Refinery Chemical & petrochemical Syngas, including ammonia, methane, and hydrogen plants Pulp & paper • Pipeline • Electric Power Fossil Geothermal Wind Hydroelectric • Oil & Gas Production Key Equipment Types • Heaters & Boilers • Pipelines • Process Piping • Reformers • Pressure Vessels • Storage Tanks • Turbines • Heat Exchangers 5 |
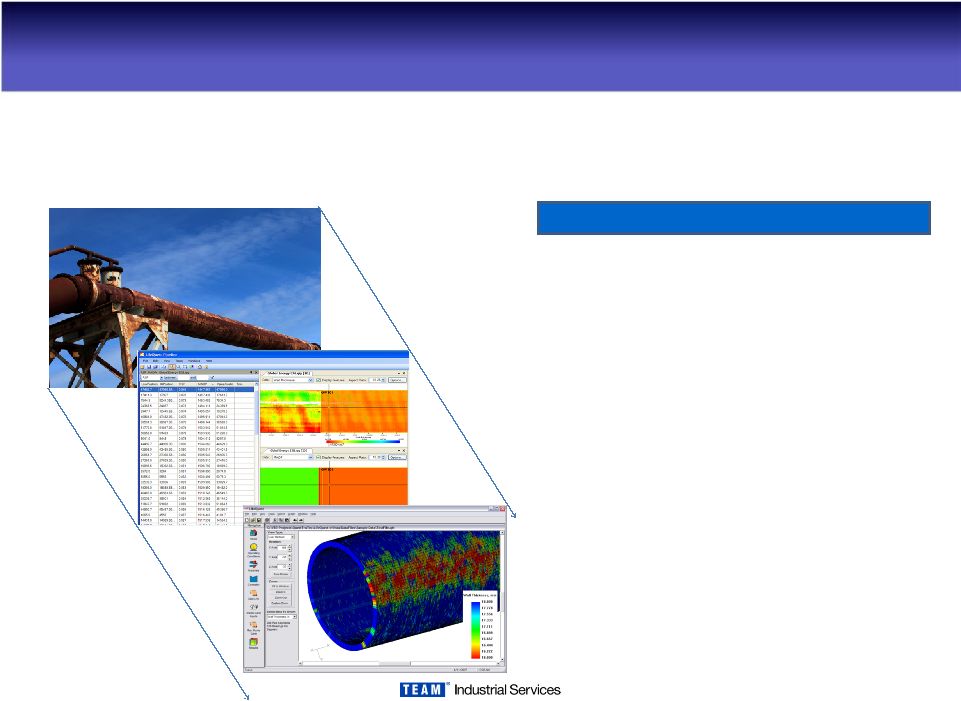 Technology-Enabled Inspection Services Example – Inspection of non-piggable pipeline using Quest Integrity’s proprietary InVista NDT inspection tools High-Fidelity Ultrasonic ILI Survey •Onsite technician certified NDT L II or greater •Standard condition reports provided within 7 days, customized final reports provided within 30 days Fitness-for-Service Engineering Assessment •Provides remaining strength and maximum allowable operating pressure (MAOPr) for entire length of pipe vs. limited locations only •Follows API 579-1/ASME FFS-1 local thinning assessment methodology (accepted Level 2 methodology in ASME B31G-2009) LifeQuest™ Visualization and Analysis Software •High resolution 2D and 3D views of wall-thickness and inner profile for 100% of data •Synchronized data display windows for rapid examination of inspection results •Client configurable feature table compatible with GIS systems and exportable to Microsoft Excel ® InVista™ Example 6 |
 Automated Assessment/Software Tools • Tied to Quest Integrity’s proprietary inspection technology and specific critical assets • Imports data from the corresponding inspection tool, and then performs FFS and RLA • Used to visually inspect and present data and FFS results in a operator-intuitive format • Asset Class Õ Inspection Technology Õ Software Tool Fired Heaters Õ FTIS™ Õ LifeQuest™ Heater Pipelines Õ InVista™ Õ LifeQuest™ Pipeline Steam Reformers Õ LOTIS® + External Crawler with EC Õ LifeQuest™ Reformer 7 |
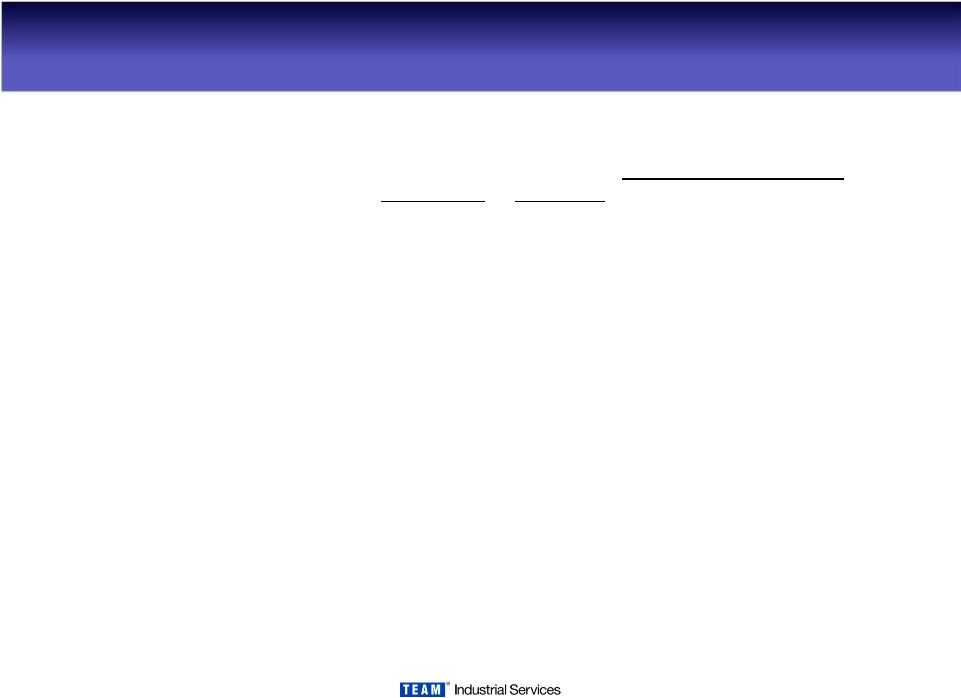
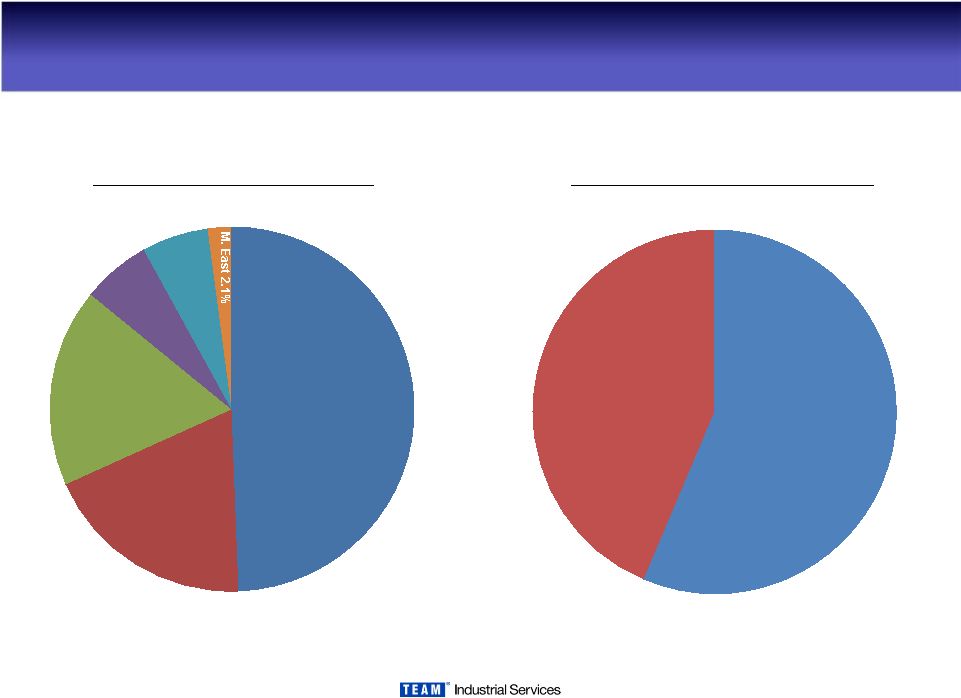 Quest Integrity Group Business Mix 2010YTD Revenue by Office 2010YTD Revenue by Division Inspection 56.4% Engineering Assessment 43.6% USA 49.4% New Zealand 18.9% Canada 17.6% Europe 6.1% Australia 6.0% M. East 2.1% 8 |
 Quest Integrity Group Profiles and Locations • Engineering Assessment Offices – Houston – Boulder – New Zealand • Inspection Services Offices – Seattle – Houston – Calgary – The Netherlands – Australia – UAE Key Locations Backgrounds of Personnel • Educational Backgrounds – 13 PhDs – 13 Other Advanced Engineering Degrees • Noteworthy Industry Leadership – CTO is author of leading Fracture Mechanics text book and one of original architects of API 579 FFS – Active leadership and participation in various industry association committees – Only outside participant on two major oil company mechanical integrity committees 9 |
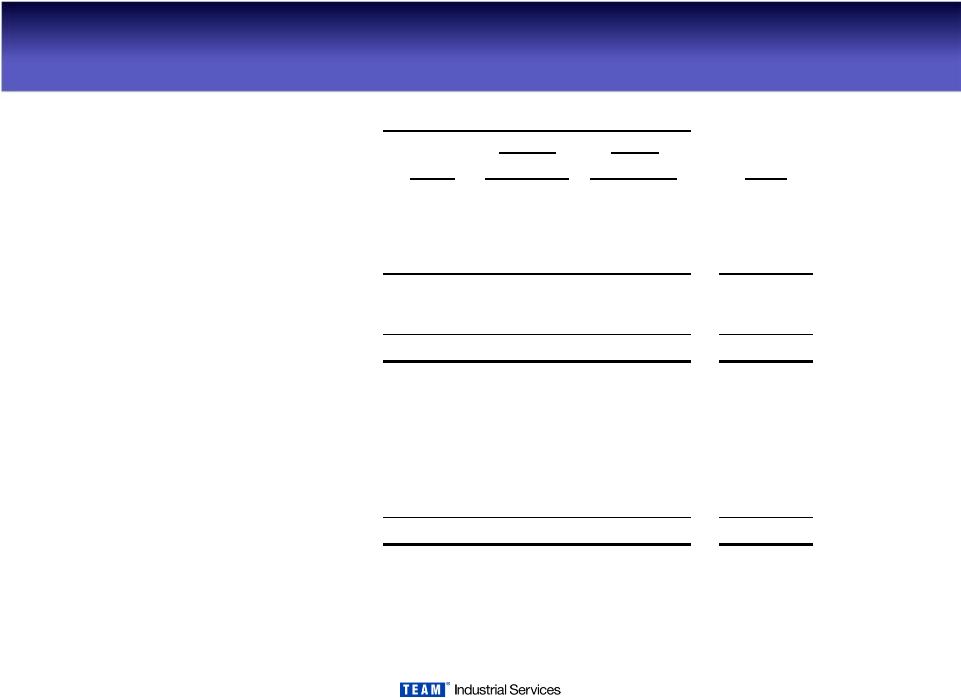 10 Summary Balance Sheets (in millions) Quest Team May 31, Team Pro-forma Pro-Forma 2010 Cash 17.1 $ 1.2 $ 18.3 $ 12.6 $ Accounts Receivable 93.2 4.0 97.2 109.4 Other current assets 27.4 0.6 28.0 28.3 Tota current assets 137.7 5.8 143.5 150.3 Non-current assets 114.1 45.1 159.2 114.7 Total assets 251.8 $ 50.9 $ 302.7 $ 265.0 $ Current debt 0.3 0.3 0.3 Other current liabilities 36.5 $ 2.4 $ 38.9 $ 42.8 $ Long-Term Debt 38.3 42.6 80.9 47.8 Other 8.5 8.5 8.9 Stockholders' equity 168.2 5.9 174.1 165.2 Total liabilities and equity 251.8 $ 50.9 $ 302.7 $ 265.0 $ Net debt 21.5 $ 41.4 $ 62.9 $ 35.5 $ Net debt to TTM EBITDA (1) 0.4 1.2 0.8 (1) excludes non routine charges Aug. 31, 2010 unaudited, proforma |
 11 FY 2011 Guidance (in millions, except per share amounts) FY2011 Guidance (1) FY2010 (2) $ % Revenue $470-$500 454 $ $16-$46 4%-10% Field operating income $55-$60 48 $ $7-$12 15%-25% Corporate expenses ($20) (19) $ ($1) EBIT $35-$40 29 $ $6-$11 20%-35% Net income $20-$23 16 $ $4-$7 25%-40% EPS $1.00-$1.15 0.80 $ $0.20-$0.35 (1) FY2011 Guidance unchanged for Quest acquisition. (2) excludes impact of non-routine charges Change |