UNITED STATES
SECURITIES AND EXCHANGE COMMISSION Washington, D.C. 20549
FORM N-CSR
CERTIFIED SHAREHOLDER REPORT OF REGISTERED MANAGEMENT INVESTMENT COMPANIES
Investment Company Act file number 811-03090
MFS SERIES TRUST VII
(Exact name of registrant as specified in charter)
111 Huntington Avenue, Boston, Massachusetts 02199 (Address of principal executive offices) (Zip code)
Christopher R. Bohane
Massachusetts Financial Services Company
111Huntington Avenue Boston, Massachusetts 02199
(Name and address of agents for service)
Registrant's telephone number, including area code: (617) 954-5000
Date of fiscal year end: July 31
Date of reporting period: January 31, 2023
ITEM 1. REPORTS TO STOCKHOLDERS.
Item 1(a):
Semiannual Report
January 31, 2023
The report is prepared for the general information of shareholders. It is authorized for distribution to prospective investors only when preceded or accompanied by a current prospectus.
NOT FDIC INSURED • MAY LOSE VALUE • NO BANK GUARANTEE
LETTER FROM THE CHAIR AND CEO
Dear Shareholders:
Markets — which rallied in late 2022 and early 2023 on signs of peaking inflation, hopes that monetary policy tightening cycles may be nearing an end, and a rapid reopening of China’s economy — have recently run into turbulence. Inflation data suggest that price pressures will prove more persistent than expected, putting renewed upward pressure on interest rates. On a positive note, markets have largely adjusted to the challenges posed by Russia’s invasion of Ukraine, thanks in part to mild European winter weather that has alleviated concerns over potential shortages of natural gas. Resilient labor markets in much of the developed world have further contributed to a brighter-than-expected economic backdrop. However, investors are mindful that the lagged effects of ongoing monetary policy tightening have yet to fully work their way through the global economy.
Tighter global financial conditions represent a headwind for richly valued growth equities and interest rate–sensitive parts of the economy, such as housing. Over the near term, we feel companies will face a challenging earnings backdrop as they are forced to absorb higher input and labor costs while pricing power dwindles. As for fixed income, the rise in interest rates has made bonds more attractive than they have been in years, which may provide balance for investors’ portfolios.
During times of market transition, it is important to have a deep understanding of company fundamentals, and we have built our unique global research platform to do just that.
At MFS®, we put our clients’ assets to work responsibly by carefully navigating increasingly complex global capital markets. Our investment team is guided by a commitment to long-term fundamental investing. Our global investment platform — combining collective expertise, long-term discipline, and thoughtful risk management — seeks to uncover what we believe are the best, most durable investment ideas in markets around the world, enabling us to potentially create value for investors.
Respectfully,
Michael W. Roberge
Chair and Chief Executive Officer
MFS Investment Management
March 17, 2023
The opinions expressed in this letter are subject to change and may not be relied upon for investment advice. No forecasts can be guaranteed.
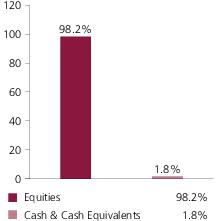
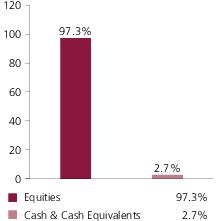
Portfolio structure
Top ten holdings
| Microsoft Corp. | 5.0% |
| Apple, Inc. | 3.4% |
| JPMorgan Chase & Co. | 3.0% |
| Merck & Co., Inc. | 3.0% |
| Valero Energy Corp. | 2.6% |
| Cigna Corp. | 2.4% |
| McKesson Corp. | 2.4% |
| Alphabet, Inc., “A” | 2.2% |
| Rio Tinto PLC | 2.1% |
| Home Depot, Inc. | 2.1% |
GICS equity sectors (g)
| Financials | 18.0% |
| Information Technology | 15.6% |
| Health Care | 14.4% |
| Industrials | 8.9% |
| Consumer Discretionary | 8.2% |
| Energy | 6.6% |
| Materials | 5.9% |
| Real Estate | 5.4% |
| Consumer Staples | 5.0% |
| Communication Services | 4.8% |
| Utilities | 3.8% |
| Convertible Debt | 1.6% |
| (g) | The Global Industry Classification Standard (GICS®) was developed by and/or is the exclusive property of MSCI, Inc. and S&P Global Market Intelligence Inc. (“S&P Global Market Intelligence”). GICS is a service mark of MSCI and S&P Global Market Intelligence and has been licensed for use by MFS. MFS has applied its own internal sector/industry classification methodology for equity securities and non-equity securities that are unclassified by GICS. |
Cash & Cash Equivalents includes any cash, investments in money market funds, short-term securities, and other assets less liabilities. Please see the Statement of Assets and Liabilities for additional information related to the fund’s cash position and other assets and liabilities.
Percentages are based on net assets as of January 31, 2023.
The portfolio is actively managed and current holdings may be different.
Expense Table
Fund expenses borne by the shareholders during the period,
August 1, 2022 through January 31, 2023
As a shareholder of the fund, you incur two types of costs: (1) transaction costs, including sales charges (loads) on certain purchase or redemption payments, and (2) ongoing costs, including management fees; distribution and service (12b-1) fees; and other fund expenses. This example is intended to help you understand your ongoing costs (in dollars) of investing in the fund and to compare these costs with the ongoing costs of investing in other mutual funds.
The example is based on an investment of $1,000 invested at the beginning of the period and held for the entire period August 1, 2022 through January 31, 2023.
Actual Expenses
The first line for each share class in the following table provides information about actual account values and actual expenses. You may use the information in this line, together with the amount you invested, to estimate the expenses that you paid over the period. Simply divide your account value by $1,000 (for example, an $8,600 account value divided by $1,000 = 8.6), then multiply the result by the number in the first line under the heading entitled “Expenses Paid During Period” to estimate the expenses you paid on your account during this period.
Hypothetical Example for Comparison Purposes
The second line for each share class in the following table provides information about hypothetical account values and hypothetical expenses based on the fund’s actual expense ratio and an assumed rate of return of 5% per year before expenses, which is not the fund’s actual return. The hypothetical account values and expenses may not be used to estimate the actual ending account balance or expenses you paid for the period. You may use this information to compare the ongoing costs of investing in the fund and other funds. To do so, compare this 5% hypothetical example with the 5% hypothetical examples that appear in the shareholder reports of the other funds.
Please note that the expenses shown in the table are meant to highlight your ongoing costs only and do not reflect any transactional costs, such as sales charges (loads). Therefore, the second line for each share class in the table is useful in comparing ongoing costs only, and will not help you determine the relative total costs of owning different funds. In addition, if these transactional costs were included, your costs would have been higher.
Expense Table - continued
Share
Class | | Annualized
Expense
Ratio | Beginning
Account Value
8/01/22 | Ending
Account Value
1/31/23 | Expenses
Paid During
Period (p)
8/01/22-1/31/23 |
| A | Actual | 0.88% | $1,000.00 | $1,066.69 | $4.58 |
| Hypothetical (h) | 0.88% | $1,000.00 | $1,020.77 | $4.48 |
| B | Actual | 1.63% | $1,000.00 | $1,062.64 | $8.47 |
| Hypothetical (h) | 1.63% | $1,000.00 | $1,016.99 | $8.29 |
| C | Actual | 1.63% | $1,000.00 | $1,062.62 | $8.47 |
| Hypothetical (h) | 1.63% | $1,000.00 | $1,016.99 | $8.29 |
| I | Actual | 0.63% | $1,000.00 | $1,068.08 | $3.28 |
| Hypothetical (h) | 0.63% | $1,000.00 | $1,022.03 | $3.21 |
| R1 | Actual | 1.63% | $1,000.00 | $1,062.55 | $8.47 |
| Hypothetical (h) | 1.63% | $1,000.00 | $1,016.99 | $8.29 |
| R2 | Actual | 1.13% | $1,000.00 | $1,065.53 | $5.88 |
| Hypothetical (h) | 1.13% | $1,000.00 | $1,019.51 | $5.75 |
| R3 | Actual | 0.88% | $1,000.00 | $1,066.63 | $4.58 |
| Hypothetical (h) | 0.88% | $1,000.00 | $1,020.77 | $4.48 |
| R4 | Actual | 0.63% | $1,000.00 | $1,068.10 | $3.28 |
| Hypothetical (h) | 0.63% | $1,000.00 | $1,022.03 | $3.21 |
| R6 | Actual | 0.55% | $1,000.00 | $1,068.05 | $2.87 |
| Hypothetical (h) | 0.55% | $1,000.00 | $1,022.43 | $2.80 |
| (h) | 5% class return per year before expenses. |
| (p) | “Expenses Paid During Period” are equal to each class’s annualized expense ratio, as shown above, multiplied by the average account value over the period, multiplied by 184/365 (to reflect the one-half year period). Expenses paid do not include any applicable sales charges (loads). If these transaction costs had been included, your costs would have been higher. |
Portfolio of Investments
1/31/23 (unaudited)
The Portfolio of Investments is a complete list of all securities owned by your fund. It is categorized by broad-based asset classes.
| Issuer | | | Shares/Par | Value ($) |
| Common Stocks – 94.9% |
| Aerospace & Defense – 2.7% | |
| General Dynamics Corp. | | 34,211 | $7,973,216 |
| Honeywell International, Inc. | | 12,444 | 2,594,325 |
| | | | | $10,567,541 |
| Automotive – 1.3% | |
| Lear Corp. | | 16,213 | $2,363,531 |
| Magna International, Inc. | | 44,910 | 2,915,581 |
| | | | | $5,279,112 |
| Biotechnology – 0.8% | |
| Gilead Sciences, Inc. | | 38,832 | $3,259,558 |
| Brokerage & Asset Managers – 0.8% | |
| Raymond James Financial, Inc. | | 29,288 | $3,302,808 |
| Business Services – 0.8% | |
| Accenture PLC, “A” | | 7,259 | $2,025,624 |
| Amdocs Ltd. | | 13,043 | 1,199,043 |
| | | | | $3,224,667 |
| Cable TV – 0.9% | |
| Comcast Corp., “A” | | 93,123 | $3,664,390 |
| Chemicals – 0.5% | |
| Nutrien Ltd. | | 22,653 | $1,875,442 |
| Computer Software – 5.0% | |
| Microsoft Corp. | | 79,277 | $19,645,633 |
| Computer Software - Systems – 4.9% | |
| Apple, Inc. | | 93,720 | $13,522,859 |
| Hitachi Ltd. | | 35,900 | 1,885,057 |
| Seagate Technology Holdings PLC | | 57,373 | 3,888,742 |
| | | | | $19,296,658 |
| Consumer Services – 1.1% | |
| Booking Holdings, Inc. (a) | | 1,393 | $3,390,701 |
| Expedia Group, Inc. (a) | | 9,198 | 1,051,332 |
| | | | | $4,442,033 |
| Electrical Equipment – 1.2% | |
| Johnson Controls International PLC | | 69,636 | $4,844,576 |
| Electronics – 3.9% | |
| Applied Materials, Inc. | | 11,477 | $1,279,571 |
| Lam Research Corp. | | 4,203 | 2,101,920 |
| Taiwan Semiconductor Manufacturing Co. Ltd., ADR | | 39,588 | 3,670,995 |
Portfolio of Investments (unaudited) – continued
| Issuer | | | Shares/Par | Value ($) |
| Common Stocks – continued |
| Electronics – continued | |
| Texas Instruments, Inc. | | 47,356 | $8,391,957 |
| | | | | $15,444,443 |
| Energy - Independent – 2.6% | |
| Valero Energy Corp. | | 74,306 | $10,405,069 |
| Energy - Integrated – 2.5% | |
| Eni S.p.A. | | 281,753 | $4,345,447 |
| Exxon Mobil Corp. | | 15,502 | 1,798,387 |
| Suncor Energy, Inc. | | 43,461 | 1,508,421 |
| TotalEnergies SE | | 35,366 | 2,197,195 |
| | | | | $9,849,450 |
| Food & Beverages – 1.2% | |
| Archer Daniels Midland Co. | | 33,040 | $2,737,364 |
| Cal-Maine Foods, Inc. | | 37,751 | 2,160,112 |
| | | | | $4,897,476 |
| Forest & Paper Products – 0.4% | |
| Weyerhaeuser Co., REIT | | 44,211 | $1,522,185 |
| Gaming & Lodging – 0.9% | |
| International Game Technology PLC | | 127,545 | $3,373,565 |
| Health Maintenance Organizations – 2.5% | |
| Cigna Corp. | | 30,592 | $9,687,569 |
| Insurance – 6.3% | |
| Ameriprise Financial, Inc. | | 12,980 | $4,544,558 |
| Equitable Holdings, Inc. | | 188,711 | 6,051,962 |
| Everest Re Group Ltd. | | 5,473 | 1,913,853 |
| Hartford Financial Services Group, Inc. | | 24,764 | 1,921,934 |
| MetLife, Inc. | | 63,665 | 4,648,818 |
| Reinsurance Group of America, Inc. | | 18,244 | 2,768,892 |
| Zurich Insurance Group AG | | 6,027 | 2,980,803 |
| | | | | $24,830,820 |
| Internet – 2.2% | |
| Alphabet, Inc., “A” (a) | | 88,484 | $8,745,758 |
| Leisure & Toys – 1.2% | |
| Nintendo Co. Ltd. | | 89,700 | $3,876,330 |
| Polaris, Inc. | | 8,209 | 942,722 |
| | | | | $4,819,052 |
| Machinery & Tools – 1.8% | |
| PACCAR, Inc. | | 13,447 | $1,469,892 |
| Timken Co. | | 26,013 | 2,142,171 |
| Volvo Group | | 171,651 | 3,402,154 |
| | | | | $7,014,217 |
Portfolio of Investments (unaudited) – continued
| Issuer | | | Shares/Par | Value ($) |
| Common Stocks – continued |
| Major Banks – 9.5% | |
| Bank of America Corp. | | 153,139 | $5,433,372 |
| BNP Paribas | | 94,964 | 6,509,319 |
| JPMorgan Chase & Co. | | 85,014 | 11,898,559 |
| Morgan Stanley | | 25,971 | 2,527,757 |
| Regions Financial Corp. | | 261,716 | 6,160,795 |
| Wells Fargo & Co. | | 111,040 | 5,204,445 |
| | | | | $37,734,247 |
| Medical & Health Technology & Services – 2.4% | |
| McKesson Corp. | | 24,731 | $9,365,135 |
| Metals & Mining – 3.5% | |
| Glencore PLC | | 799,489 | $5,367,808 |
| Rio Tinto PLC | | 108,604 | 8,490,264 |
| | | | | $13,858,072 |
| Natural Gas - Pipeline – 1.5% | |
| Enterprise Products Partners LP | | 191,608 | $4,905,165 |
| Plains All American Pipeline LP | | 80,737 | 1,005,983 |
| | | | | $5,911,148 |
| Other Banks & Diversified Financials – 2.4% | |
| SLM Corp. | | 136,690 | $2,401,643 |
| Visa, Inc., “A” | | 18,819 | 4,332,322 |
| Zions Bancorp NA | | 53,008 | 2,817,905 |
| | | | | $9,551,870 |
| Pharmaceuticals – 8.1% | |
| Bayer AG | | 75,721 | $4,696,760 |
| Johnson & Johnson | | 36,457 | 5,957,803 |
| Merck & Co., Inc. | | 110,171 | 11,833,467 |
| Organon & Co. | | 57,940 | 1,745,732 |
| Roche Holding AG | | 15,587 | 4,871,458 |
| Sanofi | | 30,675 | 3,014,331 |
| | | | | $32,119,551 |
| Railroad & Shipping – 0.8% | |
| CSX Corp. | | 107,072 | $3,310,666 |
| Real Estate – 5.0% | |
| Extra Space Storage, Inc., REIT | | 18,653 | $2,944,003 |
| Host Hotels & Resorts, Inc., REIT | | 81,658 | 1,539,253 |
| National Retail Properties, Inc., REIT | | 38,494 | 1,822,691 |
| Phillips Edison & Co., REIT | | 92,995 | 3,117,193 |
| Simon Property Group, Inc., REIT | | 44,309 | 5,691,934 |
| Spirit Realty Capital, Inc., REIT | | 51,907 | 2,277,679 |
| W.P. Carey, Inc., REIT | | 26,958 | 2,305,718 |
| | | | | $19,698,471 |
Portfolio of Investments (unaudited) – continued
| Issuer | | | Shares/Par | Value ($) |
| Common Stocks – continued |
| Restaurants – 1.1% | |
| Cracker Barrel Old Country Store, Inc. | | 10,577 | $1,180,182 |
| Starbucks Corp. | | 29,600 | 3,230,544 |
| | | | | $4,410,726 |
| Specialty Chemicals – 1.4% | |
| Chemours Co. | | 156,284 | $5,687,175 |
| Specialty Stores – 5.5% | |
| Amazon.com, Inc. (a) | | 30,558 | $3,151,446 |
| Home Depot, Inc. | | 25,940 | 8,408,970 |
| Target Corp. | | 15,108 | 2,600,691 |
| Walmart Stores, Inc. | | 53,631 | 7,715,892 |
| | | | | $21,876,999 |
| Telephone Services – 0.7% | |
| AT&T, Inc. | | 125,786 | $2,562,261 |
| Tobacco – 1.8% | |
| Altria Group, Inc. | | 49,737 | $2,240,153 |
| British American Tobacco PLC | | 72,815 | 2,784,750 |
| Philip Morris International, Inc. | | 19,416 | 2,023,924 |
| | | | | $7,048,827 |
| Trucking – 1.9% | |
| United Parcel Service, Inc., “B” | | 39,879 | $7,386,787 |
| Utilities - Electric Power – 3.8% | |
| Algonquin Power & Utilities Corp. (l) | | 150,942 | $1,100,400 |
| American Electric Power Co., Inc. | | 30,841 | 2,897,821 |
| Edison International | | 41,968 | 2,891,595 |
| Exelon Corp. | | 86,354 | 3,643,275 |
| National Grid PLC | | 185,979 | 2,365,624 |
| Vistra Corp. | | 90,498 | 2,086,884 |
| | | | | $14,985,599 |
| Total Common Stocks (Identified Cost, $297,972,418) | | $375,499,556 |
| Convertible Preferred Stocks – 2.3% |
| Medical Equipment – 2.3% | |
| Boston Scientific Corp., 5.5% | | 56,523 | $6,450,970 |
| Danaher Corp., 5% | | 2,000 | 2,688,000 |
| Total Convertible Preferred Stocks (Identified Cost, $8,993,779) | $9,138,970 |
| Preferred Stocks – 1.0% |
| Computer Software - Systems – 0.5% | | | | |
| Samsung Electronics Co. Ltd. | | 39,862 | $1,796,231 |
Portfolio of Investments (unaudited) – continued
| Issuer | | | Shares/Par | Value ($) |
| Preferred Stocks – continued |
| Metals & Mining – 0.5% | | | | |
| Gerdau S.A. | | 324,600 | $2,093,534 |
| Total Preferred Stocks (Identified Cost, $3,307,386) | | $3,889,765 |
| Investment Companies (h) – 1.5% |
| Money Market Funds – 1.5% | |
| MFS Institutional Money Market Portfolio, 4.29% (v) (Identified Cost, $5,989,564) | | | 5,989,433 | $5,990,032 |
| Collateral for Securities Loaned – 0.2% |
| State Street Navigator Securities Lending Government Money Market Portfolio, 4.35% (j) (Identified Cost, $550,018) | | | 550,018 | $550,018 |
|
|
| Other Assets, Less Liabilities – 0.1% | | 583,347 |
| Net Assets – 100.0% | $395,651,688 |
| (a) | Non-income producing security. | | | |
| (h) | An affiliated issuer, which may be considered one in which the fund owns 5% or more of the outstanding voting securities, or a company which is under common control. At period end, the aggregate values of the fund's investments in affiliated issuers and in unaffiliated issuers were $5,990,032 and $389,078,309, respectively. | | | |
| (j) | The rate quoted is the annualized seven-day yield of the fund at period end. | | | |
| (l) | A portion of this security is on loan. See Note 2 for additional information. | | | |
| (v) | Affiliated issuer that is available only to investment companies managed by MFS. The rate quoted for the MFS Institutional Money Market Portfolio is the annualized seven-day yield of the fund at period end. | | | |
| The following abbreviations are used in this report and are defined: |
| ADR | American Depositary Receipt |
| REIT | Real Estate Investment Trust |
See Notes to Financial Statements
Financial Statements
Statement of Assets and Liabilities
At 1/31/23 (unaudited)
This statement represents your fund’s balance sheet, which details the assets and liabilities comprising the total value of the fund.
| Assets | |
| Investments in unaffiliated issuers, at value, including $531,092 of securities on loan (identified cost, $310,823,601) | $389,078,309 |
| Investments in affiliated issuers, at value (identified cost, $5,989,564) | 5,990,032 |
| Receivables for | |
| Fund shares sold | 781,644 |
| Interest and dividends | 657,539 |
| Receivable from investment adviser | 11,320 |
| Other assets | 45,715 |
| Total assets | $396,564,559 |
| Liabilities | |
| Payables for | |
| Fund shares reacquired | $214,077 |
| Collateral for securities loaned, at value | 550,018 |
| Payable to affiliates | |
| Administrative services fee | 376 |
| Shareholder servicing costs | 85,981 |
| Distribution and service fees | 4,639 |
| Payable for independent Trustees' compensation | 1,129 |
| Accrued expenses and other liabilities | 56,651 |
| Total liabilities | $912,871 |
| Net assets | $395,651,688 |
| Net assets consist of | |
| Paid-in capital | $318,275,326 |
| Total distributable earnings (loss) | 77,376,362 |
| Net assets | $395,651,688 |
| Shares of beneficial interest outstanding | 20,990,562 |
Statement of Assets and Liabilities (unaudited) – continued
| | Net assets | Shares
outstanding | Net asset value
per share (a) |
| Class A | $262,926,010 | 13,964,666 | $18.83 |
| Class B | 3,499,596 | 185,681 | 18.85 |
| Class C | 14,629,226 | 776,435 | 18.84 |
| Class I | 64,851,245 | 3,442,331 | 18.84 |
| Class R1 | 990,841 | 52,460 | 18.89 |
| Class R2 | 140,745 | 7,447 | 18.90 |
| Class R3 | 2,400,427 | 127,249 | 18.86 |
| Class R4 | 2,336,852 | 124,025 | 18.84 |
| Class R6 | 43,876,746 | 2,310,268 | 18.99 |
| (a) | Maximum offering price per share was equal to the net asset value per share for all share classes, except for Class A, for which the maximum offering price per share was $19.98 [100 / 94.25 x $18.83]. On sales of $50,000 or more, the maximum offering price of Class A shares is reduced. A contingent deferred sales charge may be imposed on redemptions of Class A, Class B, and Class C shares. Redemption price per share was equal to the net asset value per share for Classes I, R1, R2, R3, R4, and R6. |
See Notes to Financial Statements
Financial Statements
Statement of Operations
Six months ended 1/31/23 (unaudited)
This statement describes how much your fund earned in investment income and accrued in expenses. It also describes any gains and/or losses generated by fund operations.
| Net investment income (loss) | |
| Income | |
| Dividends | $4,960,987 |
| Dividends from affiliated issuers | 87,689 |
| Other | 7,194 |
| Income on securities loaned | 2,329 |
| Foreign taxes withheld | (89,676) |
| Total investment income | $4,968,523 |
| Expenses | |
| Management fee | $886,284 |
| Distribution and service fees | 394,902 |
| Shareholder servicing costs | 152,016 |
| Administrative services fee | 32,052 |
| Independent Trustees' compensation | 3,676 |
| Custodian fee | 19,219 |
| Shareholder communications | 13,035 |
| Audit and tax fees | 30,155 |
| Legal fees | 733 |
| Registration fees | 83,576 |
| Miscellaneous | 16,523 |
| Total expenses | $1,632,171 |
| Reduction of expenses by investment adviser and distributor | (137,279) |
| Net expenses | $1,494,892 |
| Net investment income (loss) | $3,473,631 |
| Realized and unrealized gain (loss) |
| Realized gain (loss) (identified cost basis) | |
| Unaffiliated issuers | $(157,278) |
| Affiliated issuers | (51) |
| Foreign currency | (24,822) |
| Net realized gain (loss) | $(182,151) |
| Change in unrealized appreciation or depreciation | |
| Unaffiliated issuers | $21,504,336 |
| Affiliated issuers | 258 |
| Translation of assets and liabilities in foreign currencies | 7,365 |
| Net unrealized gain (loss) | $21,511,959 |
| Net realized and unrealized gain (loss) | $21,329,808 |
| Change in net assets from operations | $24,803,439 |
See Notes to Financial Statements
Financial Statements
Statements of Changes in Net Assets
These statements describe the increases and/or decreases in net assets resulting from operations, any distributions, and any shareholder transactions.
| | Six months ended | Year ended |
| | 1/31/23
(unaudited) | 7/31/22 |
| Change in net assets | | |
| From operations | | |
| Net investment income (loss) | $3,473,631 | $5,667,581 |
| Net realized gain (loss) | (182,151) | 17,988,859 |
| Net unrealized gain (loss) | 21,511,959 | (29,889,324) |
| Change in net assets from operations | $24,803,439 | $(6,232,884) |
| Total distributions to shareholders | $(17,427,321) | $(25,512,630) |
| Change in net assets from fund share transactions | $40,251,283 | $83,126,318 |
| Total change in net assets | $47,627,401 | $51,380,804 |
| Net assets | | |
| At beginning of period | 348,024,287 | 296,643,483 |
| At end of period | $395,651,688 | $348,024,287 |
See Notes to Financial Statements
Financial Statements
Financial Highlights
The financial highlights table is intended to help you understand the fund's financial performance for the semiannual period and the past 5 fiscal years. Certain information reflects financial results for a single fund share. The total returns in the table represent the rate that an investor would have earned (or lost) on an investment in the fund share class (assuming reinvestment of all distributions) held for the entire period.
| Class A | Six months
ended | Year ended |
| | 1/31/23
(unaudited) | 7/31/22 | 7/31/21 | 7/31/20 | 7/31/19
| 7/31/18 |
| Net asset value, beginning of period | $18.56 | $20.45 | $15.29 | $15.40 | $16.05 | $15.25 |
| Income (loss) from investment operations |
| Net investment income (loss) (d) | $0.18 | $0.34 | $0.33 | $0.31 | $0.30 | $0.31 |
| Net realized and unrealized gain (loss) | 1.15 | (0.60) | 5.42 | (0.06) | 0.00(w) | 1.32 |
| Total from investment operations | $1.33 | $(0.26) | $5.75 | $0.25 | $0.30 | $1.63 |
| Less distributions declared to shareholders |
| From net investment income | $(0.31) | $(0.31) | $(0.30) | $(0.32) | $(0.31) | $(0.34) |
| From net realized gain | (0.75) | (1.32) | (0.29) | (0.04) | (0.64) | (0.49) |
| Total distributions declared to shareholders | $(1.06) | $(1.63) | $(0.59) | $(0.36) | $(0.95) | $(0.83) |
| Net asset value, end of period (x) | $18.83 | $18.56 | $20.45 | $15.29 | $15.40 | $16.05 |
| Total return (%) (r)(s)(t)(x) | 6.67(n) | (1.60) | 38.34 | 1.69 | 2.56 | 10.91 |
Ratios (%) (to average net assets)
and Supplemental data: |
| Expenses before expense reductions | 0.96(a) | 0.97 | 0.99 | 1.02 | 1.02 | 1.03 |
| Expenses after expense reductions | 0.88(a) | 0.88 | 0.88 | 0.89 | 0.89 | 0.89 |
| Net investment income (loss) | 1.92(a) | 1.72 | 1.81 | 2.05 | 1.97 | 1.95 |
| Portfolio turnover | 17(n) | 42 | 43 | 42 | 39 | 51 |
| Net assets at end of period (000 omitted) | $262,926 | $233,755 | $200,391 | $139,563 | $138,043 | $135,139 |
See Notes to Financial Statements
Financial Highlights – continued
| Class B | Six months
ended | Year ended |
| | 1/31/23
(unaudited) | 7/31/22 | 7/31/21 | 7/31/20 | 7/31/19
| 7/31/18 |
| Net asset value, beginning of period | $18.57 | $20.45 | $15.29 | $15.39 | $16.03 | $15.23 |
| Income (loss) from investment operations |
| Net investment income (loss) (d) | $0.11 | $0.19 | $0.19 | $0.20 | $0.19 | $0.19 |
| Net realized and unrealized gain (loss) | 1.08 | (0.59) | 5.42 | (0.06) | 0.00(w) | 1.32 |
| Total from investment operations | $1.19 | $(0.40) | $5.61 | $0.14 | $0.19 | $1.51 |
| Less distributions declared to shareholders |
| From net investment income | $(0.16) | $(0.16) | $(0.16) | $(0.20) | $(0.19) | $(0.22) |
| From net realized gain | (0.75) | (1.32) | (0.29) | (0.04) | (0.64) | (0.49) |
| Total distributions declared to shareholders | $(0.91) | $(1.48) | $(0.45) | $(0.24) | $(0.83) | $(0.71) |
| Net asset value, end of period (x) | $18.85 | $18.57 | $20.45 | $15.29 | $15.39 | $16.03 |
| Total return (%) (r)(s)(t)(x) | 6.26(n) | (2.32) | 37.26 | 0.92 | 1.86 | 10.07 |
Ratios (%) (to average net assets)
and Supplemental data: |
| Expenses before expense reductions | 1.71(a) | 1.72 | 1.74 | 1.77 | 1.77 | 1.78 |
| Expenses after expense reductions | 1.63(a) | 1.63 | 1.63 | 1.64 | 1.64 | 1.64 |
| Net investment income (loss) | 1.18(a) | 0.97 | 1.07 | 1.32 | 1.21 | 1.20 |
| Portfolio turnover | 17(n) | 42 | 43 | 42 | 39 | 51 |
| Net assets at end of period (000 omitted) | $3,500 | $3,307 | $3,911 | $3,534 | $4,604 | $4,378 |
See Notes to Financial Statements
Financial Highlights – continued
| Class C | Six months
ended | Year ended |
| | 1/31/23
(unaudited) | 7/31/22 | 7/31/21 | 7/31/20 | 7/31/19
| 7/31/18 |
| Net asset value, beginning of period | $18.56 | $20.45 | $15.29 | $15.39 | $16.03 | $15.23 |
| Income (loss) from investment operations |
| Net investment income (loss) (d) | $0.11 | $0.19 | $0.19 | $0.20 | $0.19 | $0.19 |
| Net realized and unrealized gain (loss) | 1.08 | (0.60) | 5.42 | (0.06) | 0.00(w) | 1.32 |
| Total from investment operations | $1.19 | $(0.41) | $5.61 | $0.14 | $0.19 | $1.51 |
| Less distributions declared to shareholders |
| From net investment income | $(0.16) | $(0.16) | $(0.16) | $(0.20) | $(0.19) | $(0.22) |
| From net realized gain | (0.75) | (1.32) | (0.29) | (0.04) | (0.64) | (0.49) |
| Total distributions declared to shareholders | $(0.91) | $(1.48) | $(0.45) | $(0.24) | $(0.83) | $(0.71) |
| Net asset value, end of period (x) | $18.84 | $18.56 | $20.45 | $15.29 | $15.39 | $16.03 |
| Total return (%) (r)(s)(t)(x) | 6.26(n) | (2.37) | 37.27 | 0.95 | 1.84 | 10.06 |
Ratios (%) (to average net assets)
and Supplemental data: |
| Expenses before expense reductions | 1.71(a) | 1.71 | 1.74 | 1.77 | 1.77 | 1.78 |
| Expenses after expense reductions | 1.63(a) | 1.63 | 1.63 | 1.64 | 1.64 | 1.64 |
| Net investment income (loss) | 1.19(a) | 0.97 | 1.07 | 1.31 | 1.21 | 1.20 |
| Portfolio turnover | 17(n) | 42 | 43 | 42 | 39 | 51 |
| Net assets at end of period (000 omitted) | $14,629 | $14,440 | $16,922 | $15,705 | $19,000 | $19,927 |
See Notes to Financial Statements
Financial Highlights – continued
| Class I | Six months
ended | Year ended |
| | 1/31/23
(unaudited) | 7/31/22 | 7/31/21 | 7/31/20 | 7/31/19
| 7/31/18 |
| Net asset value, beginning of period | $18.57 | $20.46 | $15.30 | $15.41 | $16.06 | $15.26 |
| Income (loss) from investment operations |
| Net investment income (loss) (d) | $0.20 | $0.39 | $0.37 | $0.35 | $0.34 | $0.34 |
| Net realized and unrealized gain (loss) | 1.18 | (0.60) | 5.43 | (0.06) | 0.00(w) | 1.33 |
| Total from investment operations | $1.38 | $(0.21) | $5.80 | $0.29 | $0.34 | $1.67 |
| Less distributions declared to shareholders |
| From net investment income | $(0.36) | $(0.36) | $(0.35) | $(0.36) | $(0.35) | $(0.38) |
| From net realized gain | (0.75) | (1.32) | (0.29) | (0.04) | (0.64) | (0.49) |
| Total distributions declared to shareholders | $(1.11) | $(1.68) | $(0.64) | $(0.40) | $(0.99) | $(0.87) |
| Net asset value, end of period (x) | $18.84 | $18.57 | $20.46 | $15.30 | $15.41 | $16.06 |
| Total return (%) (r)(s)(t)(x) | 6.81(n) | (1.36) | 38.66 | 1.95 | 2.82 | 11.18 |
Ratios (%) (to average net assets)
and Supplemental data: |
| Expenses before expense reductions | 0.71(a) | 0.72 | 0.73 | 0.77 | 0.77 | 0.78 |
| Expenses after expense reductions | 0.63(a) | 0.63 | 0.63 | 0.64 | 0.64 | 0.64 |
| Net investment income (loss) | 2.18(a) | 1.97 | 2.05 | 2.31 | 2.20 | 2.19 |
| Portfolio turnover | 17(n) | 42 | 43 | 42 | 39 | 51 |
| Net assets at end of period (000 omitted) | $64,851 | $52,365 | $40,722 | $21,344 | $23,261 | $13,878 |
See Notes to Financial Statements
Financial Highlights – continued
| Class R1 | Six months
ended | Year ended |
| | 1/31/23
(unaudited) | 7/31/22 | 7/31/21 | 7/31/20 | 7/31/19
| 7/31/18 |
| Net asset value, beginning of period | $18.62 | $20.54 | $15.36 | $15.47 | $16.11 | $15.30 |
| Income (loss) from investment operations |
| Net investment income (loss) (d) | $0.11 | $0.18 | $0.19 | $0.19 | $0.19 | $0.19 |
| Net realized and unrealized gain (loss) | 1.12 | (0.58) | 5.45 | (0.05) | 0.01 | 1.33 |
| Total from investment operations | $1.23 | $(0.40) | $5.64 | $0.14 | $0.20 | $1.52 |
| Less distributions declared to shareholders |
| From net investment income | $(0.21) | $(0.20) | $(0.17) | $(0.21) | $(0.20) | $(0.22) |
| From net realized gain | (0.75) | (1.32) | (0.29) | (0.04) | (0.64) | (0.49) |
| Total distributions declared to shareholders | $(0.96) | $(1.52) | $(0.46) | $(0.25) | $(0.84) | $(0.71) |
| Net asset value, end of period (x) | $18.89 | $18.62 | $20.54 | $15.36 | $15.47 | $16.11 |
| Total return (%) (r)(s)(t)(x) | 6.25(n) | (2.32) | 37.27 | 0.92 | 1.85 | 10.09 |
Ratios (%) (to average net assets)
and Supplemental data: |
| Expenses before expense reductions | 1.71(a) | 1.73 | 1.73 | 1.77 | 1.77 | 1.78 |
| Expenses after expense reductions | 1.63(a) | 1.63 | 1.63 | 1.64 | 1.64 | 1.64 |
| Net investment income (loss) | 1.15(a) | 0.93 | 1.06 | 1.28 | 1.21 | 1.20 |
| Portfolio turnover | 17(n) | 42 | 43 | 42 | 39 | 51 |
| Net assets at end of period (000 omitted) | $991 | $740 | $177 | $121 | $103 | $85 |
See Notes to Financial Statements
Financial Highlights – continued
| Class R2 | Six months
ended | Year ended |
| | 1/31/23
(unaudited) | 7/31/22 | 7/31/21 | 7/31/20 | 7/31/19
| 7/31/18 |
| Net asset value, beginning of period | $18.62 | $20.51 | $15.34 | $15.44 | $16.08 | $15.28 |
| Income (loss) from investment operations |
| Net investment income (loss) (d) | $0.15 | $0.29 | $0.28 | $0.28 | $0.26 | $0.26 |
| Net realized and unrealized gain (loss) | 1.14 | (0.60) | 5.43 | (0.06) | 0.01 | 1.34 |
| Total from investment operations | $1.29 | $(0.31) | $5.71 | $0.22 | $0.27 | $1.60 |
| Less distributions declared to shareholders |
| From net investment income | $(0.26) | $(0.26) | $(0.25) | $(0.28) | $(0.27) | $(0.31) |
| From net realized gain | (0.75) | (1.32) | (0.29) | (0.04) | (0.64) | (0.49) |
| Total distributions declared to shareholders | $(1.01) | $(1.58) | $(0.54) | $(0.32) | $(0.91) | $(0.80) |
| Net asset value, end of period (x) | $18.90 | $18.62 | $20.51 | $15.34 | $15.44 | $16.08 |
| Total return (%) (r)(s)(t)(x) | 6.55(n) | (1.89) | 37.92 | 1.46 | 2.38 | 10.63 |
Ratios (%) (to average net assets)
and Supplemental data: |
| Expenses before expense reductions | 1.21(a) | 1.21 | 1.24 | 1.27 | 1.27 | 1.28 |
| Expenses after expense reductions | 1.13(a) | 1.13 | 1.13 | 1.14 | 1.14 | 1.14 |
| Net investment income (loss) | 1.67(a) | 1.45 | 1.57 | 1.80 | 1.69 | 1.64 |
| Portfolio turnover | 17(n) | 42 | 43 | 42 | 39 | 51 |
| Net assets at end of period (000 omitted) | $141 | $128 | $242 | $210 | $369 | $298 |
See Notes to Financial Statements
Financial Highlights – continued
| Class R3 | Six months
ended | Year ended |
| | 1/31/23
(unaudited) | 7/31/22 | 7/31/21 | 7/31/20 | 7/31/19
| 7/31/18 |
| Net asset value, beginning of period | $18.59 | $20.48 | $15.32 | $15.43 | $16.08 | $15.27 |
| Income (loss) from investment operations |
| Net investment income (loss) (d) | $0.17 | $0.33 | $0.33 | $0.31 | $0.31 | $0.31 |
| Net realized and unrealized gain (loss) | 1.17 | (0.59) | 5.43 | (0.06) | (0.01) | 1.33 |
| Total from investment operations | $1.34 | $(0.26) | $5.76 | $0.25 | $0.30 | $1.64 |
| Less distributions declared to shareholders |
| From net investment income | $(0.32) | $(0.31) | $(0.31) | $(0.32) | $(0.31) | $(0.34) |
| From net realized gain | (0.75) | (1.32) | (0.29) | (0.04) | (0.64) | (0.49) |
| Total distributions declared to shareholders | $(1.07) | $(1.63) | $(0.60) | $(0.36) | $(0.95) | $(0.83) |
| Net asset value, end of period (x) | $18.86 | $18.59 | $20.48 | $15.32 | $15.43 | $16.08 |
| Total return (%) (r)(s)(t)(x) | 6.66(n) | (1.61) | 38.29 | 1.69 | 2.57 | 10.94 |
Ratios (%) (to average net assets)
and Supplemental data: |
| Expenses before expense reductions | 0.96(a) | 0.97 | 0.97 | 1.02 | 1.02 | 1.03 |
| Expenses after expense reductions | 0.88(a) | 0.88 | 0.87 | 0.89 | 0.89 | 0.89 |
| Net investment income (loss) | 1.89(a) | 1.73 | 1.74 | 2.05 | 2.04 | 1.97 |
| Portfolio turnover | 17(n) | 42 | 43 | 42 | 39 | 51 |
| Net assets at end of period (000 omitted) | $2,400 | $1,918 | $806 | $201 | $182 | $98 |
See Notes to Financial Statements
Financial Highlights – continued
| Class R4 | Six months
ended | Year ended |
| | 1/31/23
(unaudited) | 7/31/22 | 7/31/21 | 7/31/20 | 7/31/19
| 7/31/18 |
| Net asset value, beginning of period | $18.57 | $20.47 | $15.31 | $15.42 | $16.06 | $15.26 |
| Income (loss) from investment operations |
| Net investment income (loss) (d) | $0.20 | $0.30 | $0.39 | $0.35 | $0.34 | $0.35 |
| Net realized and unrealized gain (loss) | 1.18 | (0.52) | 5.41 | (0.06) | 0.01 | 1.32 |
| Total from investment operations | $1.38 | $(0.22) | $5.80 | $0.29 | $0.35 | $1.67 |
| Less distributions declared to shareholders |
| From net investment income | $(0.36) | $(0.36) | $(0.35) | $(0.36) | $(0.35) | $(0.38) |
| From net realized gain | (0.75) | (1.32) | (0.29) | (0.04) | (0.64) | (0.49) |
| Total distributions declared to shareholders | $(1.11) | $(1.68) | $(0.64) | $(0.40) | $(0.99) | $(0.87) |
| Net asset value, end of period (x) | $18.84 | $18.57 | $20.47 | $15.31 | $15.42 | $16.06 |
| Total return (%) (r)(s)(t)(x) | 6.81(n) | (1.40) | 38.64 | 1.95 | 2.88 | 11.18 |
Ratios (%) (to average net assets)
and Supplemental data: |
| Expenses before expense reductions | 0.71(a) | 0.73 | 0.72 | 0.77 | 0.77 | 0.78 |
| Expenses after expense reductions | 0.63(a) | 0.64 | 0.63 | 0.64 | 0.64 | 0.64 |
| Net investment income (loss) | 2.18(a) | 1.61 | 2.09 | 2.29 | 2.25 | 2.22 |
| Portfolio turnover | 17(n) | 42 | 43 | 42 | 39 | 51 |
| Net assets at end of period (000 omitted) | $2,337 | $2,187 | $424 | $101 | $88 | $56 |
See Notes to Financial Statements
Financial Highlights – continued
| Class R6 | Six months
ended | Year ended |
| | 1/31/23
(unaudited) | 7/31/22 | 7/31/21 | 7/31/20 | 7/31/19
| 7/31/18 |
| Net asset value, beginning of period | $18.72 | $20.61 | $15.41 | $15.52 | $16.15 | $15.35 |
| Income (loss) from investment operations |
| Net investment income (loss) (d) | $0.21 | $0.41 | $0.39 | $0.36 | $0.36 | $0.36 |
| Net realized and unrealized gain (loss) | 1.19 | (0.60) | 5.46 | (0.06) | 0.01 | 1.33 |
| Total from investment operations | $1.40 | $(0.19) | $5.85 | $0.30 | $0.37 | $1.69 |
| Less distributions declared to shareholders |
| From net investment income | $(0.38) | $(0.38) | $(0.36) | $(0.37) | $(0.36) | $(0.40) |
| From net realized gain | (0.75) | (1.32) | (0.29) | (0.04) | (0.64) | (0.49) |
| Total distributions declared to shareholders | $(1.13) | $(1.70) | $(0.65) | $(0.41) | $(1.00) | $(0.89) |
| Net asset value, end of period (x) | $18.99 | $18.72 | $20.61 | $15.41 | $15.52 | $16.15 |
| Total return (%) (r)(s)(t)(x) | 6.80(n) | (1.28) | 38.76 | 2.03 | 3.02 | 11.23 |
Ratios (%) (to average net assets)
and Supplemental data: |
| Expenses before expense reductions | 0.63(a) | 0.64 | 0.65 | 0.68 | 0.68 | 0.68 |
| Expenses after expense reductions | 0.55(a) | 0.55 | 0.55 | 0.55 | 0.55 | 0.54 |
| Net investment income (loss) | 2.25(a) | 2.05 | 2.14 | 2.39 | 2.31 | 2.30 |
| Portfolio turnover | 17(n) | 42 | 43 | 42 | 39 | 51 |
| Net assets at end of period (000 omitted) | $43,877 | $39,184 | $33,049 | $24,451 | $25,922 | $25,684 |
| (a) | Annualized. |
| (d) | Per share data is based on average shares outstanding. |
| (n) | Not annualized. |
| (r) | Certain expenses have been reduced without which performance would have been lower. |
| (s) | From time to time the fund may receive proceeds from litigation settlements, without which performance would be lower. |
| (t) | Total returns do not include any applicable sales charges. |
| (w) | Per share amount was less than $0.01. |
| (x) | The net asset values and total returns have been calculated on net assets which include adjustments made in accordance with U.S. generally accepted accounting principles required at period end for financial reporting purposes. |
See Notes to Financial Statements
Notes to Financial Statements
(unaudited)
(1) Business and Organization
MFS Equity Income Fund (the fund) is a diversified series of MFS Series Trust VII (the trust). The trust is organized as a Massachusetts business trust and is registered under the Investment Company Act of 1940, as amended, as an open-end management investment company.
The fund is an investment company and accordingly follows the investment company accounting and reporting guidance of the Financial Accounting Standards Board (FASB) Accounting Standards Codification Topic 946 Financial Services - Investment Companies.
(2) Significant Accounting Policies
General — The preparation of financial statements in conformity with U.S. generally accepted accounting principles requires management to make estimates and assumptions that affect the reported amounts of assets and liabilities, and disclosure of contingent assets and liabilities at the date of the financial statements and the reported amounts of increases and decreases in net assets from operations during the reporting period. Actual results could differ from those estimates. In the preparation of these financial statements, management has evaluated subsequent events occurring after the date of the fund’s Statement of Assets and Liabilities through the date that the financial statements were issued. The fund invests in foreign securities. Investments in foreign securities are vulnerable to the effects of changes in the relative values of the local currency and the U.S. dollar and to the effects of changes in each country’s market, economic, industrial, political, regulatory, geopolitical, environmental, public health, and other conditions.
Balance Sheet Offsetting — The fund's accounting policy with respect to balance sheet offsetting is that, absent an event of default by the counterparty or a termination of the agreement, the International Swaps and Derivatives Association (ISDA) Master Agreement, or similar agreement, does not result in an offset of reported amounts of financial assets and financial liabilities in the Statement of Assets and Liabilities across transactions between the fund and the applicable counterparty. The fund's right to setoff may be restricted or prohibited by the bankruptcy or insolvency laws of the particular jurisdiction to which a specific master netting agreement counterparty is subject. Balance sheet offsetting disclosures, to the extent applicable to the fund, have been included in the fund’s Significant Accounting Policies note under the captions for each of the fund’s in-scope financial instruments and transactions.
Investment Valuations — Subject to its oversight, the fund's Board of Trustees has delegated primary responsibility for determining or causing to be determined the value of the fund’s investments to MFS as the fund's adviser, pursuant to the fund’s valuation policy and procedures which have been adopted by the adviser and approved by the Board. Effective September 8, 2022, and in accordance with Rule 2a-5 under the Investment Company Act of 1940, the Board of Trustees designated the adviser as the “valuation designee” of the fund. If the adviser, as valuation designee, determines that reliable market quotations are not readily available for an investment, the investment is valued at fair value as determined in good faith by the adviser in accordance with the adviser’s fair valuation policy and procedures.
Notes to Financial Statements (unaudited) - continued
Under the fund's valuation policy and procedures, equity securities, including restricted equity securities, are generally valued at the last sale or official closing price on their primary market or exchange as provided by a third-party pricing service. Equity securities, for which there were no sales reported that day, are generally valued at the last quoted daily bid quotation on their primary market or exchange as provided by a third-party pricing service. Short-term instruments with a maturity at issuance of 60 days or less may be valued at amortized cost, which approximates market value.
Open-end investment companies are generally valued at net asset value per share. The values of foreign securities and other assets and liabilities expressed in foreign currencies are converted to U.S. dollars using the mean of bid and asked prices for rates provided by a third-party pricing service.
Under the fund’s valuation policy and procedures, market quotations are not considered to be readily available for debt instruments, floating rate loans, and many types of derivatives. These investments are generally valued at fair value based on information from third-party pricing services or otherwise determined by the adviser in accordance with the adviser’s fair valuation policy and procedures. Securities and other assets generally valued on the basis of information from a third-party pricing service may also be valued at a broker/dealer bid quotation. In determining values, third-party pricing services can utilize both transaction data and market information such as yield, quality, coupon rate, maturity, type of issue, trading characteristics, spreads and other market data. An investment may also be valued at fair value if the adviser determines that the investment’s value has been materially affected by events occurring after the close of the exchange or market on which the investment is principally traded (such as foreign exchange or market) and prior to the determination of the fund’s net asset value, or after the halt of trading of a specific security where trading does not resume prior to the close of the exchange or market on which the security is principally traded. Events that occur after foreign markets close (such as developments in foreign markets and significant movements in the U.S. markets) and prior to the determination of the fund’s net asset value may be deemed to have a material effect on the value of securities traded in foreign markets. Accordingly, the fund’s foreign equity securities may often be valued at fair value. The adviser generally relies on third-party pricing services or other information (such as the correlation with price movements of similar securities in the same or other markets; the type, cost and investment characteristics of the security; the business and financial condition of the issuer; and trading and other market data) to assist in determining whether to fair value and at what value to fair value an investment. The value of an investment for purposes of calculating the fund’s net asset value can differ depending on the source and method used to determine value. When fair valuation is used, the value of an investment used to determine the fund’s net asset value may differ from quoted or published prices for the same investment. There can be no assurance that the fund could obtain the fair value assigned to an investment if it were to sell the investment at the same time at which the fund determines its net asset value per share.
Various inputs are used in determining the value of the fund's assets or liabilities. These inputs are categorized into three broad levels. In certain cases, the inputs used to measure fair value may fall into different levels of the fair value hierarchy. In such cases, an investment's level within the fair value hierarchy is based on the lowest level of input that is significant to the fair value measurement. The fund's assessment of the significance of a particular input to the fair value measurement in its entirety requires judgment, and considers factors specific to the investment. Level 1 includes unadjusted
Notes to Financial Statements (unaudited) - continued
quoted prices in active markets for identical assets or liabilities. Level 2 includes other significant observable market-based inputs (including quoted prices for similar securities, interest rates, prepayment speed, and credit risk). Level 3 includes significant unobservable inputs, which may include the adviser's own assumptions in determining the fair value of investments. The following is a summary of the levels used as of January 31, 2023 in valuing the fund's assets and liabilities:
| Financial Instruments | Level 1 | Level 2 | Level 3 | Total |
| Equity Securities: | | | | |
| United States | $316,780,387 | $— | $— | $316,780,387 |
| United Kingdom | — | 19,008,446 | — | 19,008,446 |
| France | — | 11,720,845 | — | 11,720,845 |
| Switzerland | — | 7,852,261 | — | 7,852,261 |
| Canada | 7,399,844 | — | — | 7,399,844 |
| Japan | 3,876,330 | 1,885,057 | — | 5,761,387 |
| Germany | — | 4,696,760 | — | 4,696,760 |
| Italy | — | 4,345,447 | — | 4,345,447 |
| Taiwan | 3,670,995 | — | — | 3,670,995 |
| Other Countries | 2,093,534 | 5,198,385 | — | 7,291,919 |
| Mutual Funds | 6,540,050 | — | — | 6,540,050 |
| Total | $340,361,140 | $54,707,201 | $— | $395,068,341 |
For further information regarding security characteristics, see the Portfolio of Investments.
Foreign Currency Translation — Purchases and sales of foreign investments, income, and expenses are converted into U.S. dollars based upon currency exchange rates prevailing on the respective dates of such transactions or on the reporting date for foreign denominated receivables and payables. Gains and losses attributable to foreign currency exchange rates on sales of securities are recorded for financial statement purposes as net realized gains and losses on investments. Gains and losses attributable to foreign exchange rate movements on receivables, payables, income and expenses are recorded for financial statement purposes as foreign currency transaction gains and losses. That portion of both realized and unrealized gains and losses on investments that results from fluctuations in foreign currency exchange rates is not separately disclosed.
Security Loans — Under its Securities Lending Agency Agreement with the fund, State Street Bank and Trust Company, as lending agent, loans the securities of the fund to certain qualified institutions (the “Borrowers”) approved by the fund. Security loans can be terminated at the discretion of either the lending agent or the fund and the related securities must be returned within the earlier of the standard trade settlement period for such securities or within three business days. The loans are collateralized by cash and/or U.S. Treasury and federal agency obligations in an amount typically at least equal to the market value of the securities loaned. On loans collateralized by cash, the cash collateral is invested in a money market fund. The market value of the loaned securities is determined at the close of business of the fund and any additional required collateral is delivered to the fund on the next business day. The lending agent provides the fund with indemnification against Borrower default. In the event of Borrower default, the lending agent will, for the benefit of the fund, either purchase securities identical to those loaned or, when such purchase is commercially impracticable, pay the
Notes to Financial Statements (unaudited) - continued
fund the market value of the loaned securities. In return, the lending agent assumes the fund's rights to the related collateral. If the collateral value is less than the cost to purchase identical securities, the lending agent is responsible for the shortfall, but only to the extent that such shortfall is not due to a decline in collateral value resulting from collateral reinvestment for which the fund bears the risk of loss. At period end, the fund had investment securities on loan, all of which were classified as equity securities in the fund’s Portfolio of Investments, with a fair value of $531,092. The fair value of the fund’s investment securities on loan and a related liability of $550,018 for cash collateral received on securities loaned are both presented gross in the Statement of Assets and Liabilities. The collateral on securities loaned exceeded the value of securities on loan at period end. The liability for cash collateral for securities loaned is carried at fair value, which is categorized as level 2 within the fair value hierarchy. A portion of the income generated upon investment of the collateral is remitted to the Borrowers, and the remainder is allocated between the fund and the lending agent. On loans collateralized by U.S. Treasury and/or federal agency obligations, a fee is received from the Borrower, and is allocated between the fund and the lending agent. Income from securities lending is separately reported in the Statement of Operations. The dividend and interest income earned on the securities loaned is accounted for in the same manner as other dividend and interest income.
Indemnifications — Under the fund's organizational documents, its officers and Trustees may be indemnified against certain liabilities and expenses arising out of the performance of their duties to the fund. Additionally, in the normal course of business, the fund enters into agreements with service providers that may contain indemnification clauses. The fund's maximum exposure under these agreements is unknown as this would involve future claims that may be made against the fund that have not yet occurred.
Investment Transactions and Income — Investment transactions are recorded on the trade date. Dividends received in cash are recorded on the ex-dividend date. Certain dividends from foreign securities will be recorded when the fund is informed of the dividend if such information is obtained subsequent to the ex-dividend date. Dividend payments received in additional securities are recorded on the ex-dividend date in an amount equal to the value of the security on such date. In determining the net gain or loss on securities sold, the cost of securities is determined on the identified cost basis.
The fund may receive proceeds from litigation settlements. Any proceeds received from litigation involving portfolio holdings are reflected in the Statement of Operations in realized gain/loss if the security has been disposed of by the fund or in unrealized gain/loss if the security is still held by the fund. Any other proceeds from litigation not related to portfolio holdings are reflected as other income in the Statement of Operations.
Tax Matters and Distributions — The fund intends to qualify as a regulated investment company, as defined under Subchapter M of the Internal Revenue Code, and to distribute all of its taxable income, including realized capital gains. As a result, no provision for federal income tax is required. The fund’s federal tax returns, when filed, will remain subject to examination by the Internal Revenue Service for a three year period. Management has analyzed the fund’s tax positions taken on federal and state tax returns for all open tax years and does not believe that there are any uncertain tax positions that require recognition of a tax liability. Foreign taxes, if any, have been
Notes to Financial Statements (unaudited) - continued
accrued by the fund in the accompanying financial statements in accordance with the applicable foreign tax law. Foreign income taxes may be withheld by certain countries in which the fund invests. Additionally, capital gains realized by the fund on securities issued in or by certain foreign countries may be subject to capital gains tax imposed by those countries.
Distributions to shareholders are recorded on the ex-dividend date. Income and capital gain distributions are determined in accordance with income tax regulations, which may differ from U.S. generally accepted accounting principles. Certain capital accounts in the financial statements are periodically adjusted for permanent differences in order to reflect their tax character. These adjustments have no impact on net assets or net asset value per share. Temporary differences which arise from recognizing certain items of income, expense, gain or loss in different periods for financial statement and tax purposes will reverse at some time in the future.
Book/tax differences primarily relate to wash sale loss deferrals, treating a portion of the proceeds from redemptions as a distribution for tax purposes, and partnership adjustments.
The tax character of distributions made during the current period will be determined at fiscal year end. The tax character of distributions declared to shareholders for the last fiscal year is as follows:
| | Year ended
7/31/22 |
| Ordinary income (including any short-term capital gains) | $9,158,251 |
| Long-term capital gains | 16,354,379 |
| Total distributions | $25,512,630 |
The federal tax cost and the tax basis components of distributable earnings were as follows:
| As of 1/31/23 | |
| Cost of investments | $317,994,580 |
| Gross appreciation | 79,106,570 |
| Gross depreciation | (2,032,809) |
| Net unrealized appreciation (depreciation) | $77,073,761 |
| As of 7/31/22 | |
| Undistributed long-term capital gain | 13,292,883 |
| Post-October capital loss deferral | (652,128) |
| Other temporary differences | 1,790,322 |
| Net unrealized appreciation (depreciation) | 55,569,167 |
The aggregate cost above includes prior fiscal year end tax adjustments, if applicable.
Multiple Classes of Shares of Beneficial Interest — The fund offers multiple classes of shares, which differ in their respective distribution and service fees. The fund's income, realized and unrealized gain (loss), and common expenses are allocated to shareholders based on the daily net assets of each class. Dividends are declared separately for each class. Differences in per share dividend rates are generally due to differences in separate class expenses. Class B and Class C shares will convert to
Notes to Financial Statements (unaudited) - continued
Class A shares approximately eight years after purchase. The fund’s distributions declared to shareholders as reported in the Statements of Changes in Net Assets are presented by class as follows:
| | Six months
ended
1/31/23 | | Year
ended
7/31/22 |
| Class A | $11,956,319 | | $16,977,657 |
| Class B | 151,150 | | 265,980 |
| Class C | 615,553 | | 1,179,020 |
| Class I | 2,460,864 | | 4,020,739 |
| Class R1 | 43,502 | | 15,208 |
| Class R2 | 6,200 | | 18,674 |
| Class R3 | 109,370 | | 55,743 |
| Class R4 | 109,908 | | 46,083 |
| Class R6 | 1,974,455 | | 2,933,526 |
| Total | $17,427,321 | | $25,512,630 |
(3) Transactions with Affiliates
Investment Adviser — The fund has an investment advisory agreement with MFS to provide overall investment management and related administrative services and facilities to the fund. The management fee is computed daily and paid monthly at the following annual rates based on the fund's average daily net assets:
| Up to $1 billion | 0.50% |
| In excess of $1 billion and up to $2.5 billion | 0.475% |
| In excess of $2.5 billion | 0.45% |
MFS has agreed in writing to reduce its management fee by a specified amount if certain MFS mutual fund assets exceed thresholds agreed to by MFS and the fund's Board of Trustees. MFS has also agreed in writing to waive at least 0.01% of its management fee as part of this agreement. The agreement to waive at least 0.01% of the management fee will continue until modified by the fund's Board of Trustees, but such agreement will continue at least until November 30, 2023. For the six months ended January 31, 2023, this management fee reduction amounted to $23,943, which is included in the reduction of total expenses in the Statement of Operations. The management fee incurred for the six months ended January 31, 2023 was equivalent to an annual effective rate of 0.49% of the fund's average daily net assets.
The investment adviser has agreed in writing to pay a portion of the fund’s total annual operating expenses, excluding interest, taxes, extraordinary expenses, brokerage and transaction costs, certain tax reclaim recovery expenses (including contingency fees and closing agreement expenses), and investment-related expenses, such that total fund operating expenses do not exceed the following rates annually of each class’s average daily net assets:
| | | | | Classes | | | | |
| A | B | C | I | R1 | R2 | R3 | R4 | R6 |
| 0.89% | 1.64% | 1.64% | 0.64% | 1.64% | 1.14% | 0.89% | 0.64% | 0.55% |
Notes to Financial Statements (unaudited) - continued
This written agreement will continue until modified by the fund’s Board of Trustees, but such agreement will continue at least until November 30, 2023. For the six months ended January 31, 2023, this reduction amounted to $113,334, which is included in the reduction of total expenses in the Statement of Operations.
Distributor — MFS Fund Distributors, Inc. (MFD), a wholly-owned subsidiary of MFS, as distributor, received $48,341 for the six months ended January 31, 2023, as its portion of the initial sales charge on sales of Class A shares of the fund.
The Board of Trustees has adopted a distribution plan for certain share classes pursuant to Rule 12b-1 of the Investment Company Act of 1940.
The fund's distribution plan provides that the fund will pay MFD for services provided by MFD and financial intermediaries in connection with the distribution and servicing of certain share classes. One component of the plan is a distribution fee paid to MFD and another component of the plan is a service fee paid to MFD. MFD may subsequently pay all, or a portion, of the distribution and/or service fees to financial intermediaries.
Distribution Plan Fee Table:
| | Distribution
Fee Rate (d) | Service
Fee Rate (d) | Total
Distribution
Plan (d) | Annual
Effective
Rate (e) | Distribution
and Service
Fee |
| Class A | — | 0.25% | 0.25% | 0.25% | $ 301,283 |
| Class B | 0.75% | 0.25% | 1.00% | 1.00% | 16,653 |
| Class C | 0.75% | 0.25% | 1.00% | 1.00% | 69,541 |
| Class R1 | 0.75% | 0.25% | 1.00% | 1.00% | 4,454 |
| Class R2 | 0.25% | 0.25% | 0.50% | 0.50% | 322 |
| Class R3 | — | 0.25% | 0.25% | 0.25% | 2,649 |
| Total Distribution and Service Fees | | | | | $394,902 |
| (d) | In accordance with the distribution plan for certain classes, the fund pays distribution and/or service fees equal to these annual percentage rates of each class’s average daily net assets. The distribution and service fee rates disclosed by class represent the current rates in effect at the end of the reporting period. Any rate changes, if applicable, are detailed below. |
| (e) | The annual effective rates represent actual fees incurred under the distribution plan for the six months ended January 31, 2023 based on each class's average daily net assets. MFD has voluntarily agreed to rebate a portion of each class's 0.25% service fee attributable to accounts for which there is no financial intermediary specified on the account except for accounts attributable to MFS or its affiliates' seed money. For the six months ended January 31, 2023, this rebate amounted to $1 and $1 for Class A and Class B shares, respectively, and is included in the reduction of total expenses in the Statement of Operations. |
Certain Class A shares are subject to a contingent deferred sales charge (CDSC) in the event of a shareholder redemption within 18 months of purchase. Class B shares are subject to a CDSC in the event of a shareholder redemption within six years of
Notes to Financial Statements (unaudited) - continued
purchase. Class C shares are subject to a CDSC in the event of a shareholder redemption within 12 months of purchase. All contingent deferred sales charges are paid to MFD and during the six months ended January 31, 2023, were as follows:
| | Amount |
| Class A | $3,876 |
| Class B | 976 |
| Class C | 18 |
Shareholder Servicing Agent — MFS Service Center, Inc. (MFSC), a wholly-owned subsidiary of MFS, receives a fee from the fund for its services as shareholder servicing agent calculated as a percentage of the average daily net assets of the fund as determined periodically under the supervision of the fund's Board of Trustees. For the six months ended January 31, 2023, the fee was $17,006, which equated to 0.0096% annually of the fund's average daily net assets. MFSC also receives reimbursement from the fund for out-of-pocket expenses, sub-accounting and other shareholder servicing costs which may be paid to affiliated and unaffiliated service providers. Class R6 shares do not incur sub-accounting fees. For the six months ended January 31, 2023, these out-of-pocket expenses, sub-accounting and other shareholder servicing costs amounted to $135,010.
Administrator — MFS provides certain financial, legal, shareholder communications, compliance, and other administrative services to the fund. Under an administrative services agreement, the fund reimburses MFS the costs incurred to provide these services. The fund is charged an annual fixed amount of $17,500 plus a fee based on average daily net assets. The administrative services fee incurred for the six months ended January 31, 2023 was equivalent to an annual effective rate of 0.0181% of the fund's average daily net assets.
Trustees’ and Officers’ Compensation — The fund pays compensation to independent Trustees in the form of a retainer, attendance fees, and additional compensation to Board and Committee chairpersons. The fund does not pay compensation directly to Trustees or officers of the fund who are also officers of the investment adviser, all of whom receive remuneration from MFS for their services to the fund. Certain officers and Trustees of the fund are officers or directors of MFS, MFD, and MFSC.
Other — The fund invests in the MFS Institutional Money Market Portfolio which is managed by MFS and seeks current income consistent with preservation of capital and liquidity. This money market fund does not pay a management fee to MFS but does incur investment and operating costs.
On August 3, 2022, MFS redeemed 4,280 shares of Class R3 and 4,338 shares of Class R4 for an aggregate amount of $159,777.
At January 31, 2023, MFS held approximately 60% of the outstanding shares of Class R2.
The adviser has voluntarily undertaken to reimburse the fund from its own resources on a quarterly basis for the cost of investment research embedded in the cost of the fund’s securities trades. This agreement may be rescinded at any time. For the six months ended January 31, 2023, this reimbursement amounted to $7,096, which is included in “Other” income in the Statement of Operations.
Notes to Financial Statements (unaudited) - continued
(4) Portfolio Securities
For the six months ended January 31, 2023, purchases and sales of investments, other than short-term obligations, aggregated $83,557,873 and $59,288,476, respectively.
(5) Shares of Beneficial Interest
The fund's Declaration of Trust permits the Trustees to issue an unlimited number of full and fractional shares of beneficial interest. Transactions in fund shares were as follows:
| | Six months ended
1/31/23 | | Year ended
7/31/22 |
| | Shares | Amount | | Shares | Amount |
| Shares sold | | | | | |
| Class A | 1,653,105 | $29,888,482 | | 3,177,962 | $61,779,580 |
| Class B | 20,141 | 357,524 | | 25,127 | 482,579 |
| Class C | 97,873 | 1,762,016 | | 179,726 | 3,519,480 |
| Class I | 1,511,523 | 27,080,970 | | 1,357,422 | 26,748,905 |
| Class R1 | 12,772 | 224,651 | | 30,587 | 566,198 |
| Class R2 | 394 | 7,184 | | 1,121 | 21,361 |
| Class R3 | 28,485 | 509,025 | | 93,068 | 1,828,441 |
| Class R4 | 4,708 | 86,540 | | 95,903 | 1,825,206 |
| Class R6 | 357,407 | 6,493,240 | | 693,619 | 13,557,970 |
| | 3,686,408 | $66,409,632 | | 5,654,535 | $110,329,720 |
Shares issued to shareholders
in reinvestment of distributions | | | | | |
| Class A | 672,335 | $11,948,327 | | 865,025 | $16,967,328 |
| Class B | 8,480 | 151,150 | | 13,439 | 265,011 |
| Class C | 34,531 | 615,338 | | 59,702 | 1,176,831 |
| Class I | 137,318 | 2,440,674 | | 203,055 | 3,982,777 |
| Class R1 | 2,435 | 43,502 | | 782 | 15,208 |
| Class R2 | 347 | 6,200 | | 942 | 18,674 |
| Class R3 | 6,142 | 109,370 | | 2,887 | 55,743 |
| Class R4 | 6,183 | 109,908 | | 2,428 | 46,083 |
| Class R6 | 105,809 | 1,895,136 | | 141,554 | 2,796,922 |
| | 973,580 | $17,319,605 | | 1,289,814 | $25,324,577 |
Notes to Financial Statements (unaudited) - continued
| | Six months ended
1/31/23 | | Year ended
7/31/22 |
| | Shares | Amount | | Shares | Amount |
| Shares reacquired | | | | | |
| Class A | (956,381) | $(17,276,232) | | (1,246,210) | $(24,230,059) |
| Class B | (21,023) | (381,484) | | (51,733) | (1,000,229) |
| Class C | (133,951) | (2,419,302) | | (289,037) | (5,674,934) |
| Class I | (1,026,249) | (18,564,945) | | (730,806) | (14,022,335) |
| Class R1 | (2,499) | (44,941) | | (243) | (4,307) |
| Class R2 | (192) | (3,534) | | (6,941) | (136,504) |
| Class R3 | (10,509) | (190,613) | | (32,191) | (649,675) |
| Class R4 | (4,591) | (85,040) | | (1,307) | (25,855) |
| Class R6 | (246,663) | (4,511,863) | | (345,268) | (6,784,081) |
| | (2,402,058) | $(43,477,954) | | (2,703,736) | $(52,527,979) |
| Net change | | | | | |
| Class A | 1,369,059 | $24,560,577 | | 2,796,777 | $54,516,849 |
| Class B | 7,598 | 127,190 | | (13,167) | (252,639) |
| Class C | (1,547) | (41,948) | | (49,609) | (978,623) |
| Class I | 622,592 | 10,956,699 | | 829,671 | 16,709,347 |
| Class R1 | 12,708 | 223,212 | | 31,126 | 577,099 |
| Class R2 | 549 | 9,850 | | (4,878) | (96,469) |
| Class R3 | 24,118 | 427,782 | | 63,764 | 1,234,509 |
| Class R4 | 6,300 | 111,408 | | 97,024 | 1,845,434 |
| Class R6 | 216,553 | 3,876,513 | | 489,905 | 9,570,811 |
| | 2,257,930 | $40,251,283 | | 4,240,613 | $83,126,318 |
Effective June 1, 2019, purchases of the fund’s Class B shares were closed to new and existing investors subject to certain exceptions.
(6) Line of Credit
The fund and certain other funds managed by MFS participate in a $1.45 billion unsecured committed line of credit of which $1.2 billion is reserved for use by the fund and certain other MFS U.S. funds. The line of credit is provided by a syndicate of banks under a credit agreement. Borrowings may be made for temporary financing needs. Interest is charged to each fund, based on its borrowings, generally at a rate equal to the highest of 1) Daily Simple SOFR (Secured Overnight Financing Rate) plus 0.10%, 2) the Federal Funds Effective Rate, or 3) the Overnight Bank Funding Rate, each plus an agreed upon spread. A commitment fee, based on the average daily unused portion of the committed line of credit, is allocated among the participating funds. The line of credit expires on March 14, 2024 unless extended or renewed. In addition, the fund and other funds managed by MFS have established unsecured uncommitted borrowing arrangements with certain banks for temporary financing needs. Interest is charged to each fund, based on its borrowings, at rates equal to customary reference rates plus an
Notes to Financial Statements (unaudited) - continued
agreed upon spread. For the six months ended January 31, 2023, the fund’s commitment fee and interest expense were $866 and $0, respectively, and are included in “Miscellaneous” expense in the Statement of Operations.
(7) Investments in Affiliated Issuers
An affiliated issuer may be considered one in which the fund owns 5% or more of the outstanding voting securities, or a company which is under common control. For the purposes of this report, the following were affiliated issuers:
| Affiliated Issuers | Beginning
Value | Purchases | Sales
Proceeds | Realized
Gain
(Loss) | Change in
Unrealized
Appreciation or
Depreciation | Ending
Value |
| MFS Institutional Money Market Portfolio | $4,222,824 | $29,198,015 | $27,431,014 | $(51) | $258 | $5,990,032 |
| Affiliated Issuers | Dividend
Income | Capital Gain
Distributions |
| MFS Institutional Money Market Portfolio | $87,689 | $— |
(8) LIBOR Transition
Certain of the fund's investments, including investments in certain debt instruments and derivatives (if any), as well as borrowings by the fund and certain other contractual arrangements of the fund, may be based on the London Interbank Offered Rate (“LIBOR”). In 2017, the regulatory authority that oversees financial services firms in the United Kingdom announced plans to transition away from LIBOR by the end of 2021. In March 2021, the administrator of LIBOR announced the extension of the publication of the more commonly used U.S. dollar LIBOR settings to the end of June 2023. Although the full impacts of the transition away from LIBOR are not fully known, the transition may result in, among other things, an increase in volatility or illiquidity of the markets for instruments that currently rely on LIBOR to determine interest rates and this could have an adverse impact on the fund's performance. With respect to the fund's accounting for investments, including investments in certain debt instruments and derivatives, as well as borrowings by the fund and any other contractual arrangements of the fund that undergo reference rate-related modifications as a result of the transition, management will rely upon the relief provided by FASB Codification Topic 848 – Reference Rate Reform (Topic 848). The guidance in Topic 848 permits the fund to account for those modified contracts as a continuation of the existing contracts. The situation remains fluid, and management believes, based on best available information, that the impact of the transition will not be material to the fund.
Proxy Voting Policies and Information
MFS votes proxies on behalf of the fund pursuant to proxy voting policies and procedures that are available without charge, upon request, by calling 1-800-225-2606, by visiting mfs.com/proxyvoting, or by visiting the SEC’s Web site at http://www.sec.gov.
Information regarding how the fund voted proxies relating to portfolio securities during the most recent twelve-month period ended June 30 is available by August 31 of each year without charge by visiting mfs.com/proxyvoting, or by visiting the SEC’s Web site at http://www.sec.gov.
Quarterly Portfolio Disclosure
The fund files a complete schedule of portfolio holdings with the SEC for the first and third quarters of each fiscal year as an exhibit to its reports on Form N-PORT. The fund's Form N-PORT reports are available on the SEC's Web site at http://www.sec.gov. A shareholder can obtain the portfolio holdings report for the first and third quarters of the fund's fiscal year at mfs.com/openendfunds by choosing the fund's name and then scrolling to the “Resources” section and clicking on the “Prospectus and Reports” tab.
Further Information
From time to time, MFS may post important information about the fund or the MFS Funds on the MFS Web site (mfs.com). This information is available at https://www.mfs.com/announcements or at mfs.com/openendfunds by choosing the fund’s name and then scrolling to the “Resources” section and clicking on the “Announcements” tab, if any.
Information About Fund Contracts and Legal Claims
The fund has entered into contractual arrangements with an investment adviser, administrator, distributor, shareholder servicing agent, and custodian who each provide services to the fund. Unless expressly stated otherwise, shareholders are not parties to, or intended beneficiaries of these contractual arrangements, and these contractual arrangements are not intended to create any shareholder right to enforce them against the service providers or to seek any remedy under them against the service providers, either directly or on behalf of the fund.
Under the Trust’s By-Laws and Declaration of Trust, any claims asserted against or on behalf of the MFS Funds, including claims against Trustees and Officers, must be brought in state and federal courts located within the Commonwealth of Massachusetts.
Provision of Financial Reports and Summary Prospectuses
The fund produces financial reports every six months and updates its summary prospectus and prospectus annually. To avoid sending duplicate copies of materials to households, only one copy of the fund’s annual and semiannual report and summary prospectus may be mailed to shareholders having the same last name and residential address on the fund’s records. However, any shareholder may contact MFSC (please see back cover for address and telephone number) to request that copies of these reports and summary prospectuses be sent personally to that shareholder.
Save paper with eDelivery.
MFS® will send you prospectuses, reports, and proxies directly via e-mail so you will get information faster with less mailbox clutter.
To sign up:
1. Go to mfs.com.
2. Log in via MFS® Access.
3. Select eDelivery.
If you own your MFS fund shares through a financial institution or a retirement plan, MFS® TALK, MFS® Access, or eDelivery may not be available to you.
CONTACT
WEB SITE
mfs.com
MFS TALK
1-800-637-8255
24 hours a day
ACCOUNT SERVICE AND LITERATURE
Shareholders
1-800-225-2606
Financial advisors
1-800-343-2829
Retirement plan services
1-800-637-1255
MAILING ADDRESS
MFS Service Center, Inc.
P.O. Box 219341
Kansas City, MO 64121-9341
OVERNIGHT MAIL
MFS Service Center, Inc.
Suite 219341
430 W 7th Street
Kansas City, MO 64105-1407
Semiannual Report
January 31, 2023
MFS® Emerging Markets
Equity Research Fund
MFS® Emerging Markets
Equity Research Fund
The report is prepared for the general information of shareholders. It is authorized for distribution to prospective investors only when preceded or accompanied by a current prospectus.
NOT FDIC INSURED • MAY LOSE VALUE • NO BANK GUARANTEE
LETTER FROM THE CHAIR AND CEO
Dear Shareholders:
Markets — which rallied in late 2022 and early 2023 on signs of peaking inflation, hopes that monetary policy tightening cycles may be nearing an end, and a rapid reopening of China’s economy — have recently run into turbulence. Inflation data suggest that price pressures will prove more persistent than expected, putting renewed upward pressure on interest rates. On a positive note, markets have largely adjusted to the challenges posed by Russia’s invasion of Ukraine, thanks in part to mild European winter weather that has alleviated concerns over potential shortages of natural gas. Resilient labor markets in much of the developed world have further contributed to a brighter-than-expected economic backdrop. However, investors are mindful that the lagged effects of ongoing monetary policy tightening have yet to fully work their way through the global economy.
Tighter global financial conditions represent a headwind for richly valued growth equities and interest rate–sensitive parts of the economy, such as housing. Over the near term, we feel companies will face a challenging earnings backdrop as they are forced to absorb higher input and labor costs while pricing power dwindles. As for fixed income, the rise in interest rates has made bonds more attractive than they have been in years, which may provide balance for investors’ portfolios.
During times of market transition, it is important to have a deep understanding of company fundamentals, and we have built our unique global research platform to do just that.
At MFS®, we put our clients’ assets to work responsibly by carefully navigating increasingly complex global capital markets. Our investment team is guided by a commitment to long-term fundamental investing. Our global investment platform — combining collective expertise, long-term discipline, and thoughtful risk management — seeks to uncover what we believe are the best, most durable investment ideas in markets around the world, enabling us to potentially create value for investors.
Respectfully,
Michael W. Roberge
Chair and Chief Executive Officer
MFS Investment Management
March 17, 2023
The opinions expressed in this letter are subject to change and may not be relied upon for investment advice. No forecasts can be guaranteed.
Portfolio structure
Top ten holdings
Taiwan Semiconductor
Manufacturing Co. Ltd. | 8.2% |
| Samsung Electronics Co. Ltd. | 5.7% |
| Tencent Holdings Ltd. | 5.0% |
| Yum China Holdings, Inc. | 3.6% |
| AIA Group Ltd. | 2.6% |
| Techtronic Industries Co. Ltd. | 2.5% |
| Chailease Holding Co. Ltd. | 2.3% |
| BYD Co. Ltd. | 2.2% |
| PT United Tractors Tbk | 2.2% |
| China Resources Beer Holdings Co. Ltd. | 2.1% |
GICS equity industries (g)
| Financials | 21.7% |
| Information Technology | 16.6% |
| Consumer Staples | 12.9% |
| Communication Services | 11.8% |
| Consumer Discretionary | 10.7% |
| Energy | 8.4% |
| Materials | 5.7% |
| Industrials | 5.6% |
| Utilities | 2.6% |
| Real Estate | 1.0% |
| Health Care | 0.8% |
Issuer country weightings (x)
| China | 31.0% |
| Taiwan | 11.3% |
| South Korea | 11.1% |
| India | 9.5% |
| Hong Kong | 7.9% |
| Brazil | 7.3% |
| Mexico | 3.7% |
| Indonesia | 3.0% |
| United States | 2.2% |
| Other Countries | 13.0% |
Currency exposure weightings (y)
| Hong Kong Dollar | 25.6% |
| Taiwan Dollar | 11.3% |
| South Korean Won | 11.1% |
| Chinese Renminbi | 9.7% |
| Indian Rupee | 9.5% |
| United States Dollar | 7.4% |
| Brazilian Real | 7.3% |
| Mexican Peso | 3.7% |
| Indonesian Rupiah | 3.0% |
| Other Currencies | 11.4% |
Portfolio Composition - continued
| (g) | The Global Industry Classification Standard (GICS®) was developed by and/or is the exclusive property of MSCI, Inc. and S&P Global Market Intelligence Inc. (“S&P Global Market Intelligence”). GICS is a service mark of MSCI and S&P Global Market Intelligence and has been licensed for use by MFS. MFS has applied its own internal sector/industry classification methodology for equity securities and non-equity securities that are unclassified by GICS. |
| (x) | Represents the portfolio’s exposure to issuer countries as a percentage of a portfolio’s net assets. For purposes of this presentation, United States includes Cash & Cash Equivalents. |
| (y) | Represents the portfolio’s exposure to a particular currency as a percentage of a portfolio's net assets. For purposes of this presentation, United States Dollar includes Cash & Cash Equivalents. |
Cash & Cash Equivalents includes any cash, investments in money market funds, short-term securities, and other assets less liabilities. Please see the Statement of Assets and Liabilities for additional information related to the fund’s cash position and other assets and liabilities.
Percentages are based on net assets as of January 31, 2023.
The portfolio is actively managed and current holdings may be different.
Expense Table
Fund expenses borne by the shareholders during the period,
August 1, 2022 through January 31, 2023
As a shareholder of the fund, you incur two types of costs: (1) transaction costs, including sales charges (loads) on certain purchase or redemption payments, and (2) ongoing costs, including management fees; distribution and service (12b-1) fees; and other fund expenses. This example is intended to help you understand your ongoing costs (in dollars) of investing in the fund and to compare these costs with the ongoing costs of investing in other mutual funds.
The example is based on an investment of $1,000 invested at the beginning of the period and held for the entire period August 1, 2022 through January 31, 2023.
Actual Expenses
The first line for each share class in the following table provides information about actual account values and actual expenses. You may use the information in this line, together with the amount you invested, to estimate the expenses that you paid over the period. Simply divide your account value by $1,000 (for example, an $8,600 account value divided by $1,000 = 8.6), then multiply the result by the number in the first line under the heading entitled “Expenses Paid During Period” to estimate the expenses you paid on your account during this period.
Hypothetical Example for Comparison Purposes
The second line for each share class in the following table provides information about hypothetical account values and hypothetical expenses based on the fund’s actual expense ratio and an assumed rate of return of 5% per year before expenses, which is not the fund’s actual return. The hypothetical account values and expenses may not be used to estimate the actual ending account balance or expenses you paid for the period. You may use this information to compare the ongoing costs of investing in the fund and other funds. To do so, compare this 5% hypothetical example with the 5% hypothetical examples that appear in the shareholder reports of the other funds.
Please note that the expenses shown in the table are meant to highlight your ongoing costs only and do not reflect any transactional costs, such as sales charges (loads). Therefore, the second line for each share class in the table is useful in comparing ongoing costs only, and will not help you determine the relative total costs of owning different funds. In addition, if these transactional costs were included, your costs would have been higher.
Expense Table - continued
Share
Class | | Annualized
Expense
Ratio | Beginning
Account Value
8/01/22 | Ending
Account Value
1/31/23 | Expenses
Paid During
Period (p)
8/01/22-1/31/23 |
| A | Actual | 1.25% | $1,000.00 | $1,062.92 | $6.50 |
| Hypothetical (h) | 1.25% | $1,000.00 | $1,018.90 | $6.36 |
| C | Actual | 2.00% | $1,000.00 | $1,058.21 | $10.38 |
| Hypothetical (h) | 2.00% | $1,000.00 | $1,015.12 | $10.16 |
| I | Actual | 1.00% | $1,000.00 | $1,064.35 | $5.20 |
| Hypothetical (h) | 1.00% | $1,000.00 | $1,020.16 | $5.09 |
| R1 | Actual | 2.00% | $1,000.00 | $1,058.42 | $10.38 |
| Hypothetical (h) | 2.00% | $1,000.00 | $1,015.12 | $10.16 |
| R2 | Actual | 1.50% | $1,000.00 | $1,061.20 | $7.79 |
| Hypothetical (h) | 1.50% | $1,000.00 | $1,017.64 | $7.63 |
| R3 | Actual | 1.25% | $1,000.00 | $1,062.04 | $6.50 |
| Hypothetical (h) | 1.25% | $1,000.00 | $1,018.90 | $6.36 |
| R4 | Actual | 1.00% | $1,000.00 | $1,064.28 | $5.20 |
| Hypothetical (h) | 1.00% | $1,000.00 | $1,020.16 | $5.09 |
| R6 | Actual | 0.99% | $1,000.00 | $1,064.36 | $5.15 |
| Hypothetical (h) | 0.99% | $1,000.00 | $1,020.21 | $5.04 |
| (h) | 5% class return per year before expenses. |
| (p) | “Expenses Paid During Period” are equal to each class’s annualized expense ratio, as shown above, multiplied by the average account value over the period, multiplied by 184/365 (to reflect the one-half year period). Expenses paid do not include any applicable sales charges (loads). If these transaction costs had been included, your costs would have been higher. |
Portfolio of Investments
1/31/23 (unaudited)
The Portfolio of Investments is a complete list of all securities owned by your fund. It is categorized by broad-based asset classes.
| Issuer | | | Shares/Par | Value ($) |
| Common Stocks – 97.8% |
| Alcoholic Beverages – 5.4% | |
| China Resources Beer Holdings Co. Ltd. | | 8,000 | $60,144 |
| Kweichow Moutai Co. Ltd. | | 200 | 54,633 |
| Wuliangye Yibin Co. Ltd. | | 1,200 | 37,118 |
| | | | | $151,895 |
| Automotive – 2.2% | |
| BYD Co. Ltd. | | 2,000 | $62,975 |
| Biotechnology – 0.7% | |
| Hugel, Inc. (a) | | 161 | $18,573 |
| Brokerage & Asset Managers – 3.2% | |
| B3 Brasil Bolsa Balcao S.A. | | 16,200 | $41,359 |
| Hong Kong Exchanges & Clearing Ltd. | | 1,100 | 49,437 |
| Moscow Exchange MICEX-RTS PJSC (a)(u) | | 15,769 | 0 |
| | | | | $90,796 |
| Business Services – 1.9% | |
| Tata Consultancy Services Ltd. | | 1,011 | $41,671 |
| Tech Mahindra Ltd. | | 993 | 12,349 |
| | | | | $54,020 |
| Chemicals – 1.5% | |
| UPL Ltd. | | 4,598 | $42,667 |
| Computer Software – 3.9% | |
| Kingsoft Corp. Ltd. | | 10,000 | $37,030 |
| NAVER Corp. | | 225 | 37,491 |
| NetEase.com, Inc., ADR | | 380 | 33,672 |
| | | | | $108,193 |
| Computer Software - Systems – 5.7% | |
| Samsung Electronics Co. Ltd. | | 3,179 | $158,899 |
| Construction – 6.6% | |
| Anhui Conch Cement Co. Ltd. | | 8,500 | $32,196 |
| Midea Group Co. Ltd., “A” | | 7,200 | 59,036 |
| Techtronic Industries Co. Ltd. | | 5,500 | 70,910 |
| Zhejiang Supor Co. Ltd. | | 3,100 | 23,747 |
| | | | | $185,889 |
| Consumer Products – 1.4% | |
| Amorepacific Corp. (a) | | 328 | $39,113 |
| Consumer Services – 2.0% | |
| Localiza Rent a Car S.A. | | 4,811 | $56,116 |
Portfolio of Investments (unaudited) – continued
| Issuer | | | Shares/Par | Value ($) |
| Common Stocks – continued |
| Electrical Equipment – 0.8% | |
| Advantech Co. Ltd. | | 2,000 | $22,835 |
| Electronics – 8.2% | |
| Taiwan Semiconductor Manufacturing Co. Ltd. | | 13,000 | $229,348 |
| Energy - Independent – 1.7% | |
| Reliance Industries Ltd. | | 1,660 | $47,812 |
| Energy - Integrated – 4.6% | |
| China Petroleum & Chemical Corp. | | 42,000 | $22,715 |
| Galp Energia SGPS S.A., “B” | | 3,508 | 47,958 |
| LUKOIL PJSC (u) | | 471 | 0 |
| Petroleo Brasileiro S.A., ADR | | 3,728 | 43,245 |
| Petroleo Brasileiro S.A., ADR | | 1,417 | 14,623 |
| | | | | $128,541 |
| Engineering - Construction – 1.0% | |
| Doosan Bobcat, Inc. | | 1,027 | $29,204 |
| Food & Beverages – 3.8% | |
| Gruma S.A.B. de C.V. | | 4,106 | $59,722 |
| Inner Mongolia Yili Industrial Group Co. Ltd., “A” | | 9,500 | 45,982 |
| | | | | $105,704 |
| Food & Drug Stores – 0.8% | |
| BIM Birlesik Magazalar A.S. | | 3,526 | $23,397 |
| Insurance – 2.6% | |
| AIA Group Ltd. | | 6,400 | $72,275 |
| Internet – 5.0% | |
| Tencent Holdings Ltd. | | 2,900 | $141,354 |
| Major Banks – 2.1% | |
| Bandhan Bank Ltd. (a) | | 10,303 | $30,797 |
| Nedbank Group Ltd. | | 2,174 | 28,198 |
| | | | | $58,995 |
| Medical & Health Technology & Services – 0.1% | |
| Burning Rock Biotech Ltd., ADR (a) | | 1,017 | $2,959 |
| Metals & Mining – 3.2% | |
| PT United Tractors Tbk | | 37,200 | $60,925 |
| Vale S.A., ADR | | 1,567 | 29,271 |
| | | | | $90,196 |
| Natural Gas - Distribution – 1.9% | |
| China Resources Gas Group Ltd. | | 12,600 | $52,948 |
Portfolio of Investments (unaudited) – continued
| Issuer | | | Shares/Par | Value ($) |
| Common Stocks – continued |
| Other Banks & Diversified Financials – 13.8% | |
| Bank Central Asia Tbk PT | | 43,400 | $24,596 |
| Chailease Holding Co. Ltd. | | 8,560 | 64,768 |
| China Merchants Bank Co Ltd. “A” | | 8,200 | 50,249 |
| Credicorp Ltd. | | 324 | 43,513 |
| Emirates NBD PJSC (a) | | 11,890 | 41,920 |
| HDFC Bank Ltd. | | 2,770 | 54,501 |
| KB Financial Group, Inc. | | 645 | 29,389 |
| Komercni Banka A.S. | | 1,241 | 41,805 |
| Kotak Mahindra Bank Ltd. | | 1,800 | 38,153 |
| Sberbank of Russia PJSC (a)(u) | | 11,152 | 0 |
| TCS Group Holding PLC (a)(u) | | 262 | 0 |
| | | | | $388,894 |
| Precious Metals & Minerals – 0.3% | |
| Polymetal International PLC (a) | | 3,376 | $9,738 |
| Real Estate – 1.0% | |
| ESR Group Ltd. | | 14,400 | $28,966 |
| Restaurants – 3.6% | |
| Yum China Holdings, Inc. | | 1,631 | $100,486 |
| Specialty Chemicals – 1.6% | |
| Borouge PLC | | 18,807 | $13,313 |
| Saudi Basic Industries Corp. | | 1,294 | 32,133 |
| | | | | $45,446 |
| Specialty Stores – 3.5% | |
| JD.com, Inc., “A” | | 1,602 | $47,658 |
| Meituan, “B” (a) | | 310 | 6,903 |
| Walmart de Mexico S.A.B. de C.V. | | 11,032 | 43,213 |
| | | | | $97,774 |
| Telecommunications - Wireless – 1.7% | |
| Advanced Info Service Public Co. Ltd. | | 8,100 | $47,972 |
| Telephone Services – 1.3% | |
| Hellenic Telecommunications Organization S.A. | | 2,248 | $35,363 |
| Utilities - Electric Power – 0.7% | |
| Energisa S.A., IEU | | 2,400 | $19,975 |
| Total Common Stocks (Identified Cost, $3,131,739) | | $2,749,318 |
| | Strike
Price | First
Exercise | | |
| Rights – 0.0% |
| Consumer Services – 0.0% |
| Localiza Rent a Car S.A. (1 share for 1 right, Expiration 3/10/2023) (a) (Identified Cost, $175) | BRL 42.25 | 3/10/23 | 21 | $245 |
Portfolio of Investments (unaudited) – continued
| Issuer | | | Shares/Par | Value ($) |
| Investment Companies (h) – 3.1% |
| Money Market Funds – 3.1% | |
| MFS Institutional Money Market Portfolio, 4.29% (v) (Identified Cost, $88,212) | | | 88,212 | $88,221 |
|
|
| Other Assets, Less Liabilities – (0.9)% | | (25,519) |
| Net Assets – 100.0% | $2,812,265 |
| (a) | Non-income producing security. | | | |
| (h) | An affiliated issuer, which may be considered one in which the fund owns 5% or more of the outstanding voting securities, or a company which is under common control. At period end, the aggregate values of the fund's investments in affiliated issuers and in unaffiliated issuers were $88,221 and $2,749,563, respectively. | | | |
| (u) | The security was valued using significant unobservable inputs and is considered level 3 under the fair value hierarchy. For further information about the fund’s level 3 holdings, please see Note 2 in the Notes to Financial Statements. | | | |
| (v) | Affiliated issuer that is available only to investment companies managed by MFS. The rate quoted for the MFS Institutional Money Market Portfolio is the annualized seven-day yield of the fund at period end. | | | |
| The following abbreviations are used in this report and are defined: |
| ADR | American Depositary Receipt |
| IEU | International Equity Unit |
| Abbreviations indicate amounts shown in currencies other than the U.S. dollar. All amounts are stated in U.S. dollars unless otherwise indicated. A list of abbreviations is shown below: |
| BRL | Brazilian Real |
See Notes to Financial Statements
Financial Statements
Statement of Assets and Liabilities
At 1/31/23 (unaudited)
This statement represents your fund’s balance sheet, which details the assets and liabilities comprising the total value of the fund.
| Assets | |
| Investments in unaffiliated issuers, at value (identified cost, $3,131,914) | $2,749,563 |
| Investments in affiliated issuers, at value (identified cost, $88,212) | 88,221 |
| Receivables for | |
| Dividends | 3,915 |
| Receivable from investment adviser | 675 |
| Other assets | 79 |
| Total assets | $2,842,453 |
| Liabilities | |
| Payable to custodian | $175 |
| Payable to affiliates | |
| Administrative services fee | 96 |
| Shareholder servicing costs | 254 |
| Distribution and service fees | 11 |
| Payable for independent Trustees' compensation | 511 |
| Deferred country tax expense payable | 450 |
| Accrued expenses and other liabilities | 28,691 |
| Total liabilities | $30,188 |
| Net assets | $2,812,265 |
| Net assets consist of | |
| Paid-in capital | $3,487,895 |
| Total distributable earnings (loss) | (675,630) |
| Net assets | $2,812,265 |
| Shares of beneficial interest outstanding | 364,854 |
Statement of Assets and Liabilities (unaudited) – continued
| | Net assets | Shares
outstanding | Net asset value
per share (a) |
| Class A | $145,243 | 18,842 | $7.71 |
| Class C | 63,362 | 8,268 | 7.66 |
| Class I | 53,871 | 6,994 | 7.70 |
| Class R1 | 53,513 | 6,985 | 7.66 |
| Class R2 | 53,926 | 7,003 | 7.70 |
| Class R3 | 54,134 | 7,027 | 7.70 |
| Class R4 | 54,343 | 7,050 | 7.71 |
| Class R6 | 2,333,873 | 302,685 | 7.71 |
| (a) | Maximum offering price per share was equal to the net asset value per share for all share classes, except for Class A, for which the maximum offering price per share was $8.18 [100 / 94.25 x $7.71]. On sales of $50,000 or more, the maximum offering price of Class A shares is reduced. A contingent deferred sales charge may be imposed on redemptions of Class A and Class C shares. Redemption price per share was equal to the net asset value per share for Classes I, R1, R2, R3, R4, and R6. |
See Notes to Financial Statements
Financial Statements
Statement of Operations
Six months ended 1/31/23 (unaudited)
This statement describes how much your fund earned in investment income and accrued in expenses. It also describes any gains and/or losses generated by fund operations.
| Net investment income (loss) | |
| Income | |
| Dividends | $24,325 |
| Non-cash dividends | 7,489 |
| Dividends from affiliated issuers | 792 |
| Other | 46 |
| Foreign taxes withheld | (2,891) |
| Total investment income | $29,761 |
| Expenses | |
| Management fee | $11,824 |
| Distribution and service fees | 855 |
| Shareholder servicing costs | 863 |
| Administrative services fee | 8,823 |
| Independent Trustees' compensation | 1,512 |
| Custodian fee | 9,813 |
| Shareholder communications | 3,610 |
| Audit and tax fees | 31,189 |
| Legal fees | 19 |
| Registration fees | 92,420 |
| Miscellaneous | 13,413 |
| Total expenses | $174,341 |
| Fees paid indirectly | (15) |
| Reduction of expenses by investment adviser | (161,131) |
| Net expenses | $13,195 |
| Net investment income (loss) | $16,566 |
| Realized and unrealized gain (loss) |
| Realized gain (loss) (identified cost basis) | |
| Unaffiliated issuers (net of $997 country tax) | $(175,832) |
| Affiliated issuers | 35 |
| Foreign currency | (396) |
| Net realized gain (loss) | $(176,193) |
| Change in unrealized appreciation or depreciation | |
| Unaffiliated issuers (net of $208 decrease in deferred country tax) | $336,566 |
| Affiliated issuers | 4 |
| Translation of assets and liabilities in foreign currencies | 16 |
| Net unrealized gain (loss) | $336,586 |
| Net realized and unrealized gain (loss) | $160,393 |
| Change in net assets from operations | $176,959 |
See Notes to Financial Statements
Financial Statements
Statements of Changes in Net Assets
These statements describe the increases and/or decreases in net assets resulting from operations, any distributions, and any shareholder transactions.
| | Six months ended | Year ended |
| | 1/31/23
(unaudited) | 7/31/22 |
| Change in net assets | | |
| From operations | | |
| Net investment income (loss) | $16,566 | $30,844 |
| Net realized gain (loss) | (176,193) | (124,945) |
| Net unrealized gain (loss) | 336,586 | (533,990) |
| Change in net assets from operations | $176,959 | $(628,091) |
| Total distributions to shareholders | $(28,099) | $(24,810) |
| Change in net assets from fund share transactions | $207,260 | $1,050,762 |
| Total change in net assets | $356,120 | $397,861 |
| Net assets | | |
| At beginning of period | 2,456,145 | 2,058,284 |
| At end of period | $2,812,265 | $2,456,145 |
See Notes to Financial Statements
Financial Statements
Financial Highlights
The financial highlights table is intended to help you understand the fund's financial performance for the semiannual period and the past 5 fiscal years (or life of a particular share class, if shorter). Certain information reflects financial results for a single fund share. The total returns in the table represent the rate that an investor would have earned (or lost) on an investment in the fund share class (assuming reinvestment of all distributions) held for the entire period.
| Class A | Six months
ended | Year ended |
| | 1/31/23
(unaudited) | 7/31/22 | 7/31/21(c) |
| Net asset value, beginning of period | $7.32 | $9.22 | $10.00 |
| Income (loss) from investment operations |
| Net investment income (loss) (d) | $0.04 | $0.08 | $0.04 |
| Net realized and unrealized gain (loss) | 0.42 | (1.93) | (0.82) |
| Total from investment operations | $0.46 | $(1.85) | $(0.78) |
| Less distributions declared to shareholders |
| From net investment income | $(0.07) | $(0.02) | $— |
| From net realized gain | — | (0.03) | — |
| Total distributions declared to shareholders | $(0.07) | $(0.05) | $— |
| Net asset value, end of period (x) | $7.71 | $7.32 | $9.22 |
| Total return (%) (r)(s)(t)(x) | 6.29(n) | (20.10) | (7.80)(n) |
Ratios (%) (to average net assets)
and Supplemental data: |
| Expenses before expense reductions (f) | 14.14(a) | 9.91 | 9.75(a) |
| Expenses after expense reductions (f) | 1.25(a) | 1.25 | 1.25(a) |
| Net investment income (loss) | 1.12(a) | 0.95 | 0.97(a) |
| Portfolio turnover | 28(n) | 39 | 17(n) |
| Net assets at end of period (000 omitted) | $145 | $135 | $166 |
See Notes to Financial Statements
Financial Highlights – continued
| Class C | Six months
ended | Year ended |
| | 1/31/23
(unaudited) | 7/31/22 | 7/31/21(c) |
| Net asset value, beginning of period | $7.26 | $9.19 | $10.00 |
| Income (loss) from investment operations |
| Net investment income (loss) (d) | $0.01 | $0.02 | $0.01 |
| Net realized and unrealized gain (loss) | 0.41 | (1.92) | (0.82) |
| Total from investment operations | $0.42 | $(1.90) | $(0.81) |
| Less distributions declared to shareholders |
| From net investment income | $(0.02) | $— | $— |
| From net realized gain | — | (0.03) | — |
| Total distributions declared to shareholders | $(0.02) | $(0.03) | $— |
| Net asset value, end of period (x) | $7.66 | $7.26 | $9.19 |
| Total return (%) (r)(s)(t)(x) | 5.82(n) | (20.70) | (8.10)(n) |
Ratios (%) (to average net assets)
and Supplemental data: |
| Expenses before expense reductions (f) | 14.74(a) | 10.69 | 10.51(a) |
| Expenses after expense reductions (f) | 2.00(a) | 2.00 | 2.00(a) |
| Net investment income (loss) | 0.40(a) | 0.22 | 0.20(a) |
| Portfolio turnover | 28(n) | 39 | 17(n) |
| Net assets at end of period (000 omitted) | $63 | $43 | $47 |
See Notes to Financial Statements
Financial Highlights – continued
| Class I | Six months
ended | Year ended |
| | 1/31/23
(unaudited) | 7/31/22 | 7/31/21(c) |
| Net asset value, beginning of period | $7.32 | $9.23 | $10.00 |
| Income (loss) from investment operations |
| Net investment income (loss) (d) | $0.05 | $0.10 | $0.05 |
| Net realized and unrealized gain (loss) | 0.41 | (1.94) | (0.82) |
| Total from investment operations | $0.46 | $(1.84) | $(0.77) |
| Less distributions declared to shareholders |
| From net investment income | $(0.08) | $(0.04) | $— |
| From net realized gain | — | (0.03) | — |
| Total distributions declared to shareholders | $(0.08) | $(0.07) | $— |
| Net asset value, end of period (x) | $7.70 | $7.32 | $9.23 |
| Total return (%) (r)(s)(t)(x) | 6.43(n) | (20.02) | (7.70)(n) |
Ratios (%) (to average net assets)
and Supplemental data: |
| Expenses before expense reductions (f) | 13.89(a) | 9.83 | 9.51(a) |
| Expenses after expense reductions (f) | 1.00(a) | 1.00 | 1.00(a) |
| Net investment income (loss) | 1.37(a) | 1.22 | 1.20(a) |
| Portfolio turnover | 28(n) | 39 | 17(n) |
| Net assets at end of period (000 omitted) | $54 | $48 | $47 |
See Notes to Financial Statements
Financial Highlights – continued
| Class R1 | Six months
ended | Year ended |
| | 1/31/23
(unaudited) | 7/31/22 | 7/31/21(c) |
| Net asset value, beginning of period | $7.26 | $9.19 | $10.00 |
| Income (loss) from investment operations |
| Net investment income (loss) (d) | $0.01 | $0.02 | $0.01 |
| Net realized and unrealized gain (loss) | 0.41 | (1.92) | (0.82) |
| Total from investment operations | $0.42 | $(1.90) | $(0.81) |
| Less distributions declared to shareholders |
| From net investment income | $(0.02) | $— | $— |
| From net realized gain | — | (0.03) | — |
| Total distributions declared to shareholders | $(0.02) | $(0.03) | $— |
| Net asset value, end of period (x) | $7.66 | $7.26 | $9.19 |
| Total return (%) (r)(s)(t)(x) | 5.84(n) | (20.70) | (8.10)(n) |
Ratios (%) (to average net assets)
and Supplemental data: |
| Expenses before expense reductions (f) | 14.90(a) | 10.66 | 10.51(a) |
| Expenses after expense reductions (f) | 2.00(a) | 2.00 | 2.00(a) |
| Net investment income (loss) | 0.38(a) | 0.19 | 0.21(a) |
| Portfolio turnover | 28(n) | 39 | 17(n) |
| Net assets at end of period (000 omitted) | $54 | $36 | $46 |
See Notes to Financial Statements
Financial Highlights – continued
| Class R2 | Six months
ended | Year ended |
| | 1/31/23
(unaudited) | 7/31/22 | 7/31/21(c) |
| Net asset value, beginning of period | $7.31 | $9.21 | $10.00 |
| Income (loss) from investment operations |
| Net investment income (loss) (d) | $0.03 | $0.06 | $0.03 |
| Net realized and unrealized gain (loss) | 0.41 | (1.93) | (0.82) |
| Total from investment operations | $0.44 | $(1.87) | $(0.79) |
| Less distributions declared to shareholders |
| From net investment income | $(0.05) | $(0.00)(w) | $— |
| From net realized gain | — | (0.03) | — |
| Total distributions declared to shareholders | $(0.05) | $(0.03) | $— |
| Net asset value, end of period (x) | $7.70 | $7.31 | $9.21 |
| Total return (%) (r)(s)(t)(x) | 6.12(n) | (20.31) | (7.90)(n) |
Ratios (%) (to average net assets)
and Supplemental data: |
| Expenses before expense reductions (f) | 14.40(a) | 10.16 | 10.01(a) |
| Expenses after expense reductions (f) | 1.50(a) | 1.50 | 1.50(a) |
| Net investment income (loss) | 0.87(a) | 0.69 | 0.70(a) |
| Portfolio turnover | 28(n) | 39 | 17(n) |
| Net assets at end of period (000 omitted) | $54 | $37 | $46 |
See Notes to Financial Statements
Financial Highlights – continued
| Class R3 | Six months
ended | Year ended |
| | 1/31/23
(unaudited) | 7/31/22 | 7/31/21(c) |
| Net asset value, beginning of period | $7.32 | $9.22 | $10.00 |
| Income (loss) from investment operations |
| Net investment income (loss) (d) | $0.04 | $0.08 | $0.04 |
| Net realized and unrealized gain (loss) | 0.41 | (1.93) | (0.82) |
| Total from investment operations | $0.45 | $(1.85) | $(0.78) |
| Less distributions declared to shareholders |
| From net investment income | $(0.07) | $(0.02) | $— |
| From net realized gain | — | (0.03) | — |
| Total distributions declared to shareholders | $(0.07) | $(0.05) | $— |
| Net asset value, end of period (x) | $7.70 | $7.32 | $9.22 |
| Total return (%) (r)(s)(t)(x) | 6.20(n) | (20.11) | (7.80)(n) |
Ratios (%) (to average net assets)
and Supplemental data: |
| Expenses before expense reductions (f) | 14.15(a) | 9.91 | 9.76(a) |
| Expenses after expense reductions (f) | 1.25(a) | 1.25 | 1.25(a) |
| Net investment income (loss) | 1.12(a) | 0.94 | 0.95(a) |
| Portfolio turnover | 28(n) | 39 | 17(n) |
| Net assets at end of period (000 omitted) | $54 | $37 | $46 |
See Notes to Financial Statements
Financial Highlights – continued
| Class R4 | Six months
ended | Year ended |
| | 1/31/23
(unaudited) | 7/31/22 | 7/31/21(c) |
| Net asset value, beginning of period | $7.33 | $9.23 | $10.00 |
| Income (loss) from investment operations |
| Net investment income (loss) (d) | $0.05 | $0.10 | $0.05 |
| Net realized and unrealized gain (loss) | 0.41 | (1.93) | (0.82) |
| Total from investment operations | $0.46 | $(1.83) | $(0.77) |
| Less distributions declared to shareholders |
| From net investment income | $(0.08) | $(0.04) | $— |
| From net realized gain | — | (0.03) | — |
| Total distributions declared to shareholders | $(0.08) | $(0.07) | $— |
| Net asset value, end of period (x) | $7.71 | $7.33 | $9.23 |
| Total return (%) (r)(s)(t)(x) | 6.43(n) | (19.91) | (7.70)(n) |
Ratios (%) (to average net assets)
and Supplemental data: |
| Expenses before expense reductions (f) | 13.90(a) | 9.66 | 9.51(a) |
| Expenses after expense reductions (f) | 1.00(a) | 1.00 | 1.00(a) |
| Net investment income (loss) | 1.38(a) | 1.19 | 1.19(a) |
| Portfolio turnover | 28(n) | 39 | 17(n) |
| Net assets at end of period (000 omitted) | $54 | $37 | $46 |
See Notes to Financial Statements
Financial Highlights – continued
| Class R6 | Six months
ended | Year ended |
| | 1/31/23
(unaudited) | 7/31/22 | 7/31/21(c) |
| Net asset value, beginning of period | $7.33 | $9.23 | $10.00 |
| Income (loss) from investment operations |
| Net investment income (loss) (d) | $0.05 | $0.10 | $0.05 |
| Net realized and unrealized gain (loss) | 0.41 | (1.93) | (0.82) |
| Total from investment operations | $0.46 | $(1.83) | $(0.77) |
| Less distributions declared to shareholders |
| From net investment income | $(0.08) | $(0.04) | $— |
| From net realized gain | — | (0.03) | — |
| Total distributions declared to shareholders | $(0.08) | $(0.07) | $— |
| Net asset value, end of period (x) | $7.71 | $7.33 | $9.23 |
| Total return (%) (r)(s)(t)(x) | 6.44(n) | (19.91) | (7.70)(n) |
Ratios (%) (to average net assets)
and Supplemental data: |
| Expenses before expense reductions (f) | 13.95(a) | 9.57 | 9.50(a) |
| Expenses after expense reductions (f) | 0.99(a) | 0.99 | 0.99(a) |
| Net investment income (loss) | 1.40(a) | 1.19 | 1.20(a) |
| Portfolio turnover | 28(n) | 39 | 17(n) |
| Net assets at end of period (000 omitted) | $2,334 | $2,083 | $1,615 |
| (a) | Annualized. |
| (c) | For the period from the commencement of the fund’s investment operations, February 23, 2021, through the stated period end. |
| (d) | Per share data is based on average shares outstanding. |
| (f) | Ratios do not reflect reductions from fees paid indirectly, if applicable. See Note 2 in the Notes to Financial Statements for additional information. |
| (n) | Not annualized. |
| (r) | Certain expenses have been reduced without which performance would have been lower. |
| (s) | From time to time the fund may receive proceeds from litigation settlements, without which performance would be lower. |
| (t) | Total returns do not include any applicable sales charges. |
| (w) | Per share amount was less than $0.01. |
| (x) | The net asset values and total returns have been calculated on net assets which include adjustments made in accordance with U.S. generally accepted accounting principles required at period end for financial reporting purposes. |
See Notes to Financial Statements
Notes to Financial Statements
(unaudited)
(1) Business and Organization
MFS Emerging Markets Equity Research Fund (the fund) is a non-diversified series of MFS Series Trust VII (the trust). The trust is organized as a Massachusetts business trust and is registered under the Investment Company Act of 1940, as amended, as an open-end management investment company.
The fund is an investment company and accordingly follows the investment company accounting and reporting guidance of the Financial Accounting Standards Board (FASB) Accounting Standards Codification Topic 946 Financial Services - Investment Companies.
(2) Significant Accounting Policies
General — The preparation of financial statements in conformity with U.S. generally accepted accounting principles requires management to make estimates and assumptions that affect the reported amounts of assets and liabilities, and disclosure of contingent assets and liabilities at the date of the financial statements and the reported amounts of increases and decreases in net assets from operations during the reporting period. Actual results could differ from those estimates. In the preparation of these financial statements, management has evaluated subsequent events occurring after the date of the fund’s Statement of Assets and Liabilities through the date that the financial statements were issued. The fund invests in foreign securities, including securities of emerging market issuers. Investments in foreign securities are vulnerable to the effects of changes in the relative values of the local currency and the U.S. dollar and to the effects of changes in each country’s market, economic, industrial, political, regulatory, geopolitical, environmental, public health, and other conditions. Investments in emerging markets can involve additional and greater risks than the risks associated with investments in developed foreign markets. Emerging markets can have less developed markets, greater custody and operational risk, less developed legal, regulatory, accounting, and auditing systems, greater government involvement in the economy, greater risk of new or inconsistent government treatment of or restrictions on issuers and instruments, and greater political, social, and economic instability than developed markets.
Balance Sheet Offsetting — The fund's accounting policy with respect to balance sheet offsetting is that, absent an event of default by the counterparty or a termination of the agreement, the International Swaps and Derivatives Association (ISDA) Master Agreement, or similar agreement, does not result in an offset of reported amounts of financial assets and financial liabilities in the Statement of Assets and Liabilities across transactions between the fund and the applicable counterparty. The fund's right to setoff may be restricted or prohibited by the bankruptcy or insolvency laws of the particular jurisdiction to which a specific master netting agreement counterparty is subject. Balance sheet offsetting disclosures, to the extent applicable to the fund, have been included in the fund’s Significant Accounting Policies note under the captions for each of the fund’s in-scope financial instruments and transactions.
Investment Valuations — Subject to its oversight, the fund's Board of Trustees has delegated primary responsibility for determining or causing to be determined the value of the fund’s investments to MFS as the fund's adviser, pursuant to the fund’s valuation policy and procedures which have been adopted by the adviser and approved by the Board. Effective September 8, 2022, and in accordance with Rule 2a-5 under the
Notes to Financial Statements (unaudited) - continued
Investment Company Act of 1940, the Board of Trustees designated the adviser as the “valuation designee” of the fund. If the adviser, as valuation designee, determines that reliable market quotations are not readily available for an investment, the investment is valued at fair value as determined in good faith by the adviser in accordance with the adviser’s fair valuation policy and procedures.
Under the fund's valuation policy and procedures, equity securities, including restricted equity securities, are generally valued at the last sale or official closing price on their primary market or exchange as provided by a third-party pricing service. Equity securities, for which there were no sales reported that day, are generally valued at the last quoted daily bid quotation on their primary market or exchange as provided by a third-party pricing service. Short-term instruments with a maturity at issuance of 60 days or less may be valued at amortized cost, which approximates market value.
Open-end investment companies are generally valued at net asset value per share. The values of foreign securities and other assets and liabilities expressed in foreign currencies are converted to U.S. dollars using the mean of bid and asked prices for rates provided by a third-party pricing service.
Under the fund’s valuation policy and procedures, market quotations are not considered to be readily available for debt instruments, floating rate loans, and many types of derivatives. These investments are generally valued at fair value based on information from third-party pricing services or otherwise determined by the adviser in accordance with the adviser’s fair valuation policy and procedures. Securities and other assets generally valued on the basis of information from a third-party pricing service may also be valued at a broker/dealer bid quotation. In determining values, third-party pricing services can utilize both transaction data and market information such as yield, quality, coupon rate, maturity, type of issue, trading characteristics, spreads and other market data. An investment may also be valued at fair value if the adviser determines that the investment’s value has been materially affected by events occurring after the close of the exchange or market on which the investment is principally traded (such as foreign exchange or market) and prior to the determination of the fund’s net asset value, or after the halt of trading of a specific security where trading does not resume prior to the close of the exchange or market on which the security is principally traded. Events that occur after foreign markets close (such as developments in foreign markets and significant movements in the U.S. markets) and prior to the determination of the fund’s net asset value may be deemed to have a material effect on the value of securities traded in foreign markets. Accordingly, the fund’s foreign equity securities may often be valued at fair value. The adviser generally relies on third-party pricing services or other information (such as the correlation with price movements of similar securities in the same or other markets; the type, cost and investment characteristics of the security; the business and financial condition of the issuer; and trading and other market data) to assist in determining whether to fair value and at what value to fair value an investment. The value of an investment for purposes of calculating the fund’s net asset value can differ depending on the source and method used to determine value. When fair valuation is used, the value of an investment used to determine the fund’s net asset value may differ from quoted or published prices for the same investment. There can be no assurance that the fund could obtain the fair value assigned to an investment if it were to sell the investment at the same time at which the fund determines its net asset value per share.
Notes to Financial Statements (unaudited) - continued
Various inputs are used in determining the value of the fund's assets or liabilities. These inputs are categorized into three broad levels. In certain cases, the inputs used to measure fair value may fall into different levels of the fair value hierarchy. In such cases, an investment's level within the fair value hierarchy is based on the lowest level of input that is significant to the fair value measurement. The fund's assessment of the significance of a particular input to the fair value measurement in its entirety requires judgment, and considers factors specific to the investment. Level 1 includes unadjusted quoted prices in active markets for identical assets or liabilities. Level 2 includes other significant observable market-based inputs (including quoted prices for similar securities, interest rates, prepayment speed, and credit risk). Level 3 includes significant unobservable inputs, which may include the adviser's own assumptions in determining the fair value of investments. The following is a summary of the levels used as of January 31, 2023 in valuing the fund's assets and liabilities:
| Financial Instruments | Level 1 | Level 2 | Level 3 | Total |
| Equity Securities: | | | | |
| China | $522,413 | $349,392 | $— | $871,805 |
| Taiwan | — | 316,951 | — | 316,951 |
| South Korea | — | 312,669 | — | 312,669 |
| India | — | 267,950 | — | 267,950 |
| Hong Kong | 121,712 | 99,876 | — | 221,588 |
| Brazil | 204,589 | 245 | — | 204,834 |
| Mexico | 102,935 | — | — | 102,935 |
| Indonesia | 60,925 | 24,596 | — | 85,521 |
| United Arab Emirates | 55,233 | — | — | 55,233 |
| Other Countries | 174,806 | 135,271 | 0 | 310,077 |
| Mutual Funds | 88,221 | — | — | 88,221 |
| Total | $1,330,834 | $1,506,950 | $0 | $2,837,784 |
For further information regarding security characteristics, see the Portfolio of Investments. At January 31, 2023, the fund held four level 3 securities valued at $0.
Foreign Currency Translation — Purchases and sales of foreign investments, income, and expenses are converted into U.S. dollars based upon currency exchange rates prevailing on the respective dates of such transactions or on the reporting date for foreign denominated receivables and payables. Gains and losses attributable to foreign currency exchange rates on sales of securities are recorded for financial statement purposes as net realized gains and losses on investments. Gains and losses attributable to foreign exchange rate movements on receivables, payables, income and expenses are recorded for financial statement purposes as foreign currency transaction gains and losses. That portion of both realized and unrealized gains and losses on investments that results from fluctuations in foreign currency exchange rates is not separately disclosed.
Indemnifications — Under the fund's organizational documents, its officers and Trustees may be indemnified against certain liabilities and expenses arising out of the performance of their duties to the fund. Additionally, in the normal course of business, the fund enters into agreements with service providers that may contain indemnification clauses. The fund's maximum exposure under these agreements is unknown as this would involve future claims that may be made against the fund that have not yet occurred.
Notes to Financial Statements (unaudited) - continued
Investment Transactions and Income — Investment transactions are recorded on the trade date. Dividends received in cash are recorded on the ex-dividend date. Certain dividends from foreign securities will be recorded when the fund is informed of the dividend if such information is obtained subsequent to the ex-dividend date. Dividend payments received in additional securities are recorded on the ex-dividend date in an amount equal to the value of the security on such date. In determining the net gain or loss on securities sold, the cost of securities is determined on the identified cost basis.
The fund may receive proceeds from litigation settlements. Any proceeds received from litigation involving portfolio holdings are reflected in the Statement of Operations in realized gain/loss if the security has been disposed of by the fund or in unrealized gain/loss if the security is still held by the fund. Any other proceeds from litigation not related to portfolio holdings are reflected as other income in the Statement of Operations.
Fees Paid Indirectly — The fund's custody fee may be reduced by a credit earned under an arrangement that measures the value of U.S. dollars deposited with the custodian by the fund. The amount of the credit, for the six months ended January 31, 2023, is shown as a reduction of total expenses in the Statement of Operations.
Tax Matters and Distributions — The fund intends to qualify as a regulated investment company, as defined under Subchapter M of the Internal Revenue Code, and to distribute all of its taxable income, including realized capital gains. As a result, no provision for federal income tax is required. The fund’s federal tax returns, when filed, will remain subject to examination by the Internal Revenue Service for a three year period. Management has analyzed the fund’s tax positions taken on federal and state tax returns for all open tax years and does not believe that there are any uncertain tax positions that require recognition of a tax liability. Foreign taxes, if any, have been accrued by the fund in the accompanying financial statements in accordance with the applicable foreign tax law. Foreign income taxes may be withheld by certain countries in which the fund invests. Additionally, capital gains realized by the fund on securities issued in or by certain foreign countries may be subject to capital gains tax imposed by those countries.
Distributions to shareholders are recorded on the ex-dividend date. Income and capital gain distributions are determined in accordance with income tax regulations, which may differ from U.S. generally accepted accounting principles. Certain capital accounts in the financial statements are periodically adjusted for permanent differences in order to reflect their tax character. These adjustments have no impact on net assets or net asset value per share. Temporary differences which arise from recognizing certain items of income, expense, gain or loss in different periods for financial statement and tax purposes will reverse at some time in the future.
Book/tax differences primarily relate to passive foreign investment companies and wash sale loss deferrals.
Notes to Financial Statements (unaudited) - continued
The tax character of distributions made during the current period will be determined at fiscal year end. The tax character of distributions declared to shareholders for the last fiscal year is as follows:
| | Year ended
7/31/22 |
| Ordinary income (including any short-term capital gains) | $24,810 |
The federal tax cost and the tax basis components of distributable earnings were as follows:
| As of 1/31/23 | |
| Cost of investments | $3,250,915 |
| Gross appreciation | 106,230 |
| Gross depreciation | (519,361) |
| Net unrealized appreciation (depreciation) | $(413,131) |
| As of 7/31/22 | |
| Undistributed ordinary income | 27,401 |
| Capital loss carryforwards | (105,646) |
| Other temporary differences | (609) |
| Net unrealized appreciation (depreciation) | (745,636) |
The aggregate cost above includes prior fiscal year end tax adjustments, if applicable.
As of July 31, 2022, the fund had capital loss carryforwards available to offset future realized gains. These net capital losses may be carried forward indefinitely and their character is retained as short-term and/or long-term losses. Such losses are characterized as follows:
| Short-Term | $(60,369) |
| Long-Term | (45,277) |
| Total | $(105,646) |
Multiple Classes of Shares of Beneficial Interest — The fund offers multiple classes of shares, which differ in their respective distribution and service fees. The fund's income, realized and unrealized gain (loss), and common expenses are allocated to shareholders based on the daily net assets of each class. Dividends are declared separately for each class. Differences in per share dividend rates are generally due to differences in separate class expenses. Class C shares will convert to Class A shares
Notes to Financial Statements (unaudited) - continued
approximately eight years after purchase. The fund’s distributions declared to shareholders as reported in the Statements of Changes in Net Assets are presented by class as follows:
| | Six months
ended
1/31/23 | | Year
ended
7/31/22 |
| Class A | $1,218 | | $1,051 |
| Class C | 159 | | 188 |
| Class I | 582 | | 389 |
| Class R1 | 155 | | 173 |
| Class R2 | 369 | | 189 |
| Class R3 | 477 | | 289 |
| Class R4 | 587 | | 390 |
| Class R6 | 24,552 | | 22,141 |
| Total | $28,099 | | $24,810 |
(3) Transactions with Affiliates
Investment Adviser — The fund has an investment advisory agreement with MFS to provide overall investment management and related administrative services and facilities to the fund. The management fee is computed daily and paid monthly at the following annual rates based on the fund's average daily net assets:
| Up to $1 billion | 0.95% |
| In excess of $1 billion and up to $2.5 billion | 0.90% |
| In excess of $2.5 billion and up to $5 billion | 0.85% |
| In excess of $5 billion | 0.825% |
MFS has agreed in writing to reduce its management fee by a specified amount if certain MFS mutual fund assets exceed thresholds agreed to by MFS and the fund's Board of Trustees. MFS has also agreed in writing to waive at least 0.01% of its management fee as part of this agreement. The agreement to waive at least 0.01% of the management fee will continue until modified by the fund's Board of Trustees, but such agreement will continue at least until November 30, 2023. For the six months ended January 31, 2023, this management fee reduction amounted to $168, which is included in the reduction of total expenses in the Statement of Operations. The management fee incurred for the six months ended January 31, 2023 was equivalent to an annual effective rate of 0.94% of the fund's average daily net assets.
The investment adviser has agreed in writing to pay a portion of the fund’s total annual operating expenses, excluding interest, taxes, extraordinary expenses, brokerage and transaction costs, certain tax reclaim recovery expenses (including contingency fees and closing agreement expenses), and investment-related expenses, such that total fund operating expenses do not exceed the following rates annually of each class’s average daily net assets:
| Classes | |
| A | C | I | R1 | R2 | R3 | R4 | R6 | |
| 1.31% | 2.06% | 1.06% | 2.06% | 1.56% | 1.31% | 1.06% | 0.99% | |
Notes to Financial Statements (unaudited) - continued
This written agreement will continue until modified by the fund’s Board of Trustees, but such agreement will continue at least until November 30, 2023. For the six months ended January 31, 2023, this reduction amounted to $160,963, which is included in the reduction of total expenses in the Statement of Operations.
Distributor — MFS Fund Distributors, Inc. (MFD), a wholly-owned subsidiary of MFS, as distributor, received $3 for the six months ended January 31, 2023, as its portion of the initial sales charge on sales of Class A shares of the fund.
The Board of Trustees has adopted a distribution plan for certain share classes pursuant to Rule 12b-1 of the Investment Company Act of 1940.
The fund's distribution plan provides that the fund will pay MFD for services provided by MFD and financial intermediaries in connection with the distribution and servicing of certain share classes. One component of the plan is a distribution fee paid to MFD and another component of the plan is a service fee paid to MFD. MFD may subsequently pay all, or a portion, of the distribution and/or service fees to financial intermediaries.
Distribution Plan Fee Table:
| | Distribution
Fee Rate (d) | Service
Fee Rate (d) | Total
Distribution
Plan (d) | Annual
Effective
Rate (e) | Distribution
and Service
Fee |
| Class A | — | 0.25% | 0.25% | 0.25% | $ 165 |
| Class C | 0.75% | 0.25% | 1.00% | 1.00% | 264 |
| Class R1 | 0.75% | 0.25% | 1.00% | 1.00% | 243 |
| Class R2 | 0.25% | 0.25% | 0.50% | 0.50% | 122 |
| Class R3 | — | 0.25% | 0.25% | 0.25% | 61 |
| Total Distribution and Service Fees | | | | | $855 |
| (d) | In accordance with the distribution plan for certain classes, the fund pays distribution and/or service fees equal to these annual percentage rates of each class’s average daily net assets. The distribution and service fee rates disclosed by class represent the current rates in effect at the end of the reporting period. Any rate changes, if applicable, are detailed below. |
| (e) | The annual effective rates represent actual fees incurred under the distribution plan for the six months ended January 31, 2023 based on each class's average daily net assets. MFD has voluntarily agreed to rebate a portion of each class's 0.25% service fee attributable to accounts for which there is no financial intermediary specified on the account except for accounts attributable to MFS or its affiliates' seed money. There were no service fee rebates for the six months ended January 31, 2023. |
Certain Class A shares are subject to a contingent deferred sales charge (CDSC) in the event of a shareholder redemption within 18 months of purchase. Class C shares are subject to a CDSC in the event of a shareholder redemption within 12 months of purchase. There were no contingent deferred sales charges imposed during the six months ended January 31, 2023.
Shareholder Servicing Agent — MFS Service Center, Inc. (MFSC), a wholly-owned subsidiary of MFS, receives a fee from the fund for its services as shareholder servicing agent calculated as a percentage of the average daily net assets of the fund as determined periodically under the supervision of the fund's Board of Trustees. For the six months ended January 31, 2023, the fee was $142, which equated to 0.0114% annually of the fund's average daily net assets. MFSC also receives reimbursement from the fund for out-of-pocket expenses, sub-accounting and other shareholder servicing
Notes to Financial Statements (unaudited) - continued
costs which may be paid to affiliated and unaffiliated service providers. Class R6 shares do not incur sub-accounting fees. For the six months ended January 31, 2023, these out-of-pocket expenses, sub-accounting and other shareholder servicing costs amounted to $721.
Administrator — MFS provides certain financial, legal, shareholder communications, compliance, and other administrative services to the fund. Under an administrative services agreement, the fund reimburses MFS the costs incurred to provide these services. The fund is charged an annual fixed amount of $17,500 plus a fee based on average daily net assets. The administrative services fee incurred for the six months ended January 31, 2023 was equivalent to an annual effective rate of 0.7087% of the fund's average daily net assets.
Trustees’ and Officers’ Compensation — The fund pays compensation to independent Trustees in the form of a retainer, attendance fees, and additional compensation to Board and Committee chairpersons. The fund does not pay compensation directly to Trustees or officers of the fund who are also officers of the investment adviser, all of whom receive remuneration from MFS for their services to the fund. Certain officers and Trustees of the fund are officers or directors of MFS, MFD, and MFSC.
Other — The fund invests in the MFS Institutional Money Market Portfolio which is managed by MFS and seeks current income consistent with preservation of capital and liquidity. This money market fund does not pay a management fee to MFS but does incur investment and operating costs.
On September 15, 2021, MFS purchased 106,724 shares of Class R6 for an aggregate amount of $1,000,000.
On August 3, 2022, MFS purchased 1,111 shares of Class C, 413 shares of Class I, 1,944 shares of Class R1, 1,931 shares of Class R2, 1,929 shares of Class R3, and 1,926 shares of Class R4 for an aggregate amount of $67,000.
At January 31, 2023, MFS held approximately 81%, 74%, 79%, and 95% of the outstanding shares of Class A, Class C, Class I, and Class R6, respectively, and 100% of the outstanding shares of Class R1, Class R2, Class R3, and Class R4.
The adviser has voluntarily undertaken to reimburse the fund from its own resources on a quarterly basis for the cost of investment research embedded in the cost of the fund’s securities trades. This agreement may be rescinded at any time. For the six months ended January 31, 2023, this reimbursement amounted to $6, which is included in “Other” income in the Statement of Operations.
(4) Portfolio Securities
For the six months ended January 31, 2023, purchases and sales of investments, other than short-term obligations, aggregated $855,719 and $668,841, respectively.
Notes to Financial Statements (unaudited) - continued
(5) Shares of Beneficial Interest
The fund's Declaration of Trust permits the Trustees to issue an unlimited number of full and fractional shares of beneficial interest. Transactions in fund shares were as follows:
| | Six months ended
1/31/23 | | Year ended
7/31/22 |
| | Shares | Amount | | Shares | Amount |
| Shares sold | | | | | |
| Class A | 187 | $1,281 | | 1,134 | $9,557 |
| Class C | 2,282 | 16,306 | | 851 | 7,545 |
| Class I | 414 | 3,000 | | 11,051 | 85,549 |
| Class R1 | 1,944 | 14,000 | | — | — |
| Class R2 | 1,931 | 14,000 | | — | — |
| Class R3 | 1,929 | 14,000 | | — | — |
| Class R4 | 1,926 | 14,000 | | — | — |
| Class R6 | 44,702 | 316,804 | | 106,724 | 1,000,000 |
| | 55,315 | $393,391 | | 119,760 | $1,102,651 |
Shares issued to shareholders
in reinvestment of distributions | | | | | |
| Class A | 171 | $1,218 | | 114 | $1,051 |
| Class C | 22 | 159 | | 21 | 188 |
| Class I | 82 | 582 | | 42 | 389 |
| Class R1 | 22 | 155 | | 19 | 173 |
| Class R2 | 52 | 369 | | 20 | 189 |
| Class R3 | 67 | 477 | | 31 | 289 |
| Class R4 | 82 | 587 | | 42 | 390 |
| Class R6 | 3,448 | 24,552 | | 2,399 | 22,141 |
| | 3,946 | $28,099 | | 2,688 | $24,810 |
| Shares reacquired | | | | | |
| Class A | (21) | $(148) | | (718) | $(5,522) |
| Class C | (3) | (25) | | (3) | (25) |
| Class I | — | — | | (9,652) | (71,152) |
| Class R6 | (29,588) | (214,057) | | — | — |
| | (29,612) | $(214,230) | | (10,373) | $(76,699) |
Notes to Financial Statements (unaudited) - continued
| | Six months ended
1/31/23 | | Year ended
7/31/22 |
| | Shares | Amount | | Shares | Amount |
| Net change | | | | | |
| Class A | 337 | $2,351 | | 530 | $5,086 |
| Class C | 2,301 | 16,440 | | 869 | 7,708 |
| Class I | 496 | 3,582 | | 1,441 | 14,786 |
| Class R1 | 1,966 | 14,155 | | 19 | 173 |
| Class R2 | 1,983 | 14,369 | | 20 | 189 |
| Class R3 | 1,996 | 14,477 | | 31 | 289 |
| Class R4 | 2,008 | 14,587 | | 42 | 390 |
| Class R6 | 18,562 | 127,299 | | 109,123 | 1,022,141 |
| | 29,649 | $207,260 | | 112,075 | $1,050,762 |
(6) Line of Credit
The fund and certain other funds managed by MFS participate in a $1.45 billion unsecured committed line of credit of which $1.2 billion is reserved for use by the fund and certain other MFS U.S. funds. The line of credit is provided by a syndicate of banks under a credit agreement. Borrowings may be made for temporary financing needs. Interest is charged to each fund, based on its borrowings, generally at a rate equal to the highest of 1) Daily Simple SOFR (Secured Overnight Financing Rate) plus 0.10%, 2) the Federal Funds Effective Rate, or 3) the Overnight Bank Funding Rate, each plus an agreed upon spread. A commitment fee, based on the average daily unused portion of the committed line of credit, is allocated among the participating funds. The line of credit expires on March 14, 2024 unless extended or renewed. In addition, the fund and other funds managed by MFS have established unsecured uncommitted borrowing arrangements with certain banks for temporary financing needs. Interest is charged to each fund, based on its borrowings, at rates equal to customary reference rates plus an agreed upon spread. For the six months ended January 31, 2023, the fund’s commitment fee and interest expense were $6 and $0, respectively, and are included in “Miscellaneous” expense in the Statement of Operations.
(7) Investments in Affiliated Issuers
An affiliated issuer may be considered one in which the fund owns 5% or more of the outstanding voting securities, or a company which is under common control. For the purposes of this report, the following were affiliated issuers:
| Affiliated Issuers | Beginning
Value | Purchases | Sales
Proceeds | Realized
Gain
(Loss) | Change in
Unrealized
Appreciation or
Depreciation | Ending
Value |
| MFS Institutional Money Market Portfolio | $88,697 | $695,432 | $695,947 | $35 | $4 | $88,221 |
Notes to Financial Statements (unaudited) - continued
| Affiliated Issuers | Dividend
Income | Capital Gain
Distributions |
| MFS Institutional Money Market Portfolio | $792 | $— |
(8) LIBOR Transition
Certain of the fund's investments, including investments in certain debt instruments and derivatives (if any), as well as borrowings by the fund and certain other contractual arrangements of the fund, may be based on the London Interbank Offered Rate (“LIBOR”). In 2017, the regulatory authority that oversees financial services firms in the United Kingdom announced plans to transition away from LIBOR by the end of 2021. In March 2021, the administrator of LIBOR announced the extension of the publication of the more commonly used U.S. dollar LIBOR settings to the end of June 2023. Although the full impacts of the transition away from LIBOR are not fully known, the transition may result in, among other things, an increase in volatility or illiquidity of the markets for instruments that currently rely on LIBOR to determine interest rates and this could have an adverse impact on the fund's performance. With respect to the fund's accounting for investments, including investments in certain debt instruments and derivatives, as well as borrowings by the fund and any other contractual arrangements of the fund that undergo reference rate-related modifications as a result of the transition, management will rely upon the relief provided by FASB Codification Topic 848 – Reference Rate Reform (Topic 848). The guidance in Topic 848 permits the fund to account for those modified contracts as a continuation of the existing contracts. The situation remains fluid, and management believes, based on best available information, that the impact of the transition will not be material to the fund.
(9) Russia and Ukraine Conflict
The fund invests in securities and/or derivative instruments that are economically tied to Russia and/or Ukraine. Escalation of the conflict between Russia and Ukraine in late February 2022 caused market volatility and disruption in the tradability of Russian securities, including closure of the local securities market, temporary restriction on securities sales by non-residents, and disruptions to clearance and payment systems. To the extent that the fund is unable to sell securities, whether due to market constraints or to the sanctions imposed on Russia by the United States and other countries, those securities are considered illiquid and the value of those securities reflects their illiquid classification. Management continues to monitor these events and to evaluate the related impacts on fund performance.
Proxy Voting Policies and Information
MFS votes proxies on behalf of the fund pursuant to proxy voting policies and procedures that are available without charge, upon request, by calling 1-800-225-2606, by visiting mfs.com/proxyvoting, or by visiting the SEC’s Web site at http://www.sec.gov.
Information regarding how the fund voted proxies relating to portfolio securities during the most recent twelve-month period ended June 30 is available by August 31 of each year without charge by visiting mfs.com/proxyvoting, or by visiting the SEC’s Web site at http://www.sec.gov.
Quarterly Portfolio Disclosure
The fund files a complete schedule of portfolio holdings with the SEC for the first and third quarters of each fiscal year as an exhibit to its reports on Form N-PORT. The fund's Form N-PORT reports are available on the SEC's Web site at http://www.sec.gov. A shareholder can obtain the portfolio holdings report for the first and third quarters of the fund's fiscal year at mfs.com/openendfunds by choosing the fund's name and then scrolling to the “Resources” section and clicking on the “Prospectus and Reports” tab.
Further Information
From time to time, MFS may post important information about the fund or the MFS Funds on the MFS Web site (mfs.com). This information is available at https://www.mfs.com/announcements or at mfs.com/openendfunds by choosing the fund’s name and then scrolling to the “Resources” section and clicking on the “Announcements” tab, if any.
Information About Fund Contracts and Legal Claims
The fund has entered into contractual arrangements with an investment adviser, administrator, distributor, shareholder servicing agent, and custodian who each provide services to the fund. Unless expressly stated otherwise, shareholders are not parties to, or intended beneficiaries of these contractual arrangements, and these contractual arrangements are not intended to create any shareholder right to enforce them against the service providers or to seek any remedy under them against the service providers, either directly or on behalf of the fund.
Under the Trust’s By-Laws and Declaration of Trust, any claims asserted against or on behalf of the MFS Funds, including claims against Trustees and Officers, must be brought in state and federal courts located within the Commonwealth of Massachusetts.
Provision of Financial Reports and Summary Prospectuses
The fund produces financial reports every six months and updates its summary prospectus and prospectus annually. To avoid sending duplicate copies of materials to households, only one copy of the fund’s annual and semiannual report and summary prospectus may be mailed to shareholders having the same last name and residential address on the fund’s records. However, any shareholder may contact MFSC (please see back cover for address and telephone number) to request that copies of these reports and summary prospectuses be sent personally to that shareholder.
Save paper with eDelivery.
MFS® will send you prospectuses, reports, and proxies directly via e-mail so you will get information faster with less mailbox clutter.
To sign up:
1. Go to mfs.com.
2. Log in via MFS® Access.
3. Select eDelivery.
If you own your MFS fund shares through a financial institution or a retirement plan, MFS® TALK, MFS® Access, or eDelivery may not be available to you.
CONTACT
WEB SITE
mfs.com
MFS TALK
1-800-637-8255
24 hours a day
ACCOUNT SERVICE AND LITERATURE
Shareholders
1-800-225-2606
Financial advisors
1-800-343-2829
Retirement plan services
1-800-637-1255
MAILING ADDRESS
MFS Service Center, Inc.
P.O. Box 219341
Kansas City, MO 64121-9341
OVERNIGHT MAIL
MFS Service Center, Inc.
Suite 219341
430 W 7th Street
Kansas City, MO 64105-1407
Semiannual Report
January 31, 2023
MFS® Intrinsic Value Fund
MFS® Intrinsic Value Fund
The report is prepared for the general information of shareholders. It is authorized for distribution to prospective investors only when preceded or accompanied by a current prospectus.
NOT FDIC INSURED • MAY LOSE VALUE • NO BANK GUARANTEE
LETTER FROM THE CHAIR AND CEO
Dear Shareholders:
Markets — which rallied in late 2022 and early 2023 on signs of peaking inflation, hopes that monetary policy tightening cycles may be nearing an end, and a rapid reopening of China’s economy — have recently run into turbulence. Inflation data suggest that price pressures will prove more persistent than expected, putting renewed upward pressure on interest rates. On a positive note, markets have largely adjusted to the challenges posed by Russia’s invasion of Ukraine, thanks in part to mild European winter weather that has alleviated concerns over potential shortages of natural gas. Resilient labor markets in much of the developed world have further contributed to a brighter-than-expected economic backdrop. However, investors are mindful that the lagged effects of ongoing monetary policy tightening have yet to fully work their way through the global economy.
Tighter global financial conditions represent a headwind for richly valued growth equities and interest rate–sensitive parts of the economy, such as housing. Over the near term, we feel companies will face a challenging earnings backdrop as they are forced to absorb higher input and labor costs while pricing power dwindles. As for fixed income, the rise in interest rates has made bonds more attractive than they have been in years, which may provide balance for investors’ portfolios.
During times of market transition, it is important to have a deep understanding of company fundamentals, and we have built our unique global research platform to do just that.
At MFS®, we put our clients’ assets to work responsibly by carefully navigating increasingly complex global capital markets. Our investment team is guided by a commitment to long-term fundamental investing. Our global investment platform — combining collective expertise, long-term discipline, and thoughtful risk management — seeks to uncover what we believe are the best, most durable investment ideas in markets around the world, enabling us to potentially create value for investors.
Respectfully,
Michael W. Roberge
Chair and Chief Executive Officer
MFS Investment Management
March 17, 2023
The opinions expressed in this letter are subject to change and may not be relied upon for investment advice. No forecasts can be guaranteed.
Portfolio structure
Top ten holdings
| Microsoft Corp. | 3.5% |
| Colgate-Palmolive Co. | 3.4% |
| Charles Schwab Corp. | 2.9% |
| Cadence Design Systems, Inc. | 2.5% |
| Mastercard, Inc., “A” | 2.4% |
| Agilent Technologies, Inc. | 2.3% |
| Costco Wholesale Corp. | 2.2% |
| Vulcan Materials Co. | 2.2% |
| Aon PLC | 2.1% |
| Moody's Corp. | 2.1% |
GICS equity sectors (g)
| Information Technology | 26.9% |
| Industrials | 21.9% |
| Financials | 14.4% |
| Materials | 9.2% |
| Health Care | 8.0% |
| Consumer Staples | 7.9% |
| Communication Services | 2.6% |
| Energy | 2.6% |
| Consumer Discretionary | 2.5% |
| Real Estate | 1.3% |
| (g) | The Global Industry Classification Standard (GICS®) was developed by and/or is the exclusive property of MSCI, Inc. and S&P Global Market Intelligence Inc. (“S&P Global Market Intelligence”). GICS is a service mark of MSCI and S&P Global Market Intelligence and has been licensed for use by MFS. MFS has applied its own internal sector/industry classification methodology for equity securities and non-equity securities that are unclassified by GICS. |
Cash & Cash Equivalents includes any cash, investments in money market funds, short-term securities, and other assets less liabilities. Please see the Statement of Assets and Liabilities for additional information related to the fund’s cash position and other assets and liabilities.
Percentages are based on net assets as of January 31, 2023.
The portfolio is actively managed and current holdings may be different.
Expense Table
Fund expenses borne by the shareholders during the period,
August 1, 2022 through January 31, 2023
As a shareholder of the fund, you incur two types of costs: (1) transaction costs, including sales charges (loads) on certain purchase or redemption payments, and (2) ongoing costs, including management fees; distribution and service (12b-1) fees; and other fund expenses. This example is intended to help you understand your ongoing costs (in dollars) of investing in the fund and to compare these costs with the ongoing costs of investing in other mutual funds.
The example is based on an investment of $1,000 invested at the beginning of the period and held for the entire period August 1, 2022 through January 31, 2023.
Actual Expenses
The first line for each share class in the following table provides information about actual account values and actual expenses. You may use the information in this line, together with the amount you invested, to estimate the expenses that you paid over the period. Simply divide your account value by $1,000 (for example, an $8,600 account value divided by $1,000 = 8.6), then multiply the result by the number in the first line under the heading entitled “Expenses Paid During Period” to estimate the expenses you paid on your account during this period.
Hypothetical Example for Comparison Purposes
The second line for each share class in the following table provides information about hypothetical account values and hypothetical expenses based on the fund’s actual expense ratio and an assumed rate of return of 5% per year before expenses, which is not the fund’s actual return. The hypothetical account values and expenses may not be used to estimate the actual ending account balance or expenses you paid for the period. You may use this information to compare the ongoing costs of investing in the fund and other funds. To do so, compare this 5% hypothetical example with the 5% hypothetical examples that appear in the shareholder reports of the other funds.
Please note that the expenses shown in the table are meant to highlight your ongoing costs only and do not reflect any transactional costs, such as sales charges (loads). Therefore, the second line for each share class in the table is useful in comparing ongoing costs only, and will not help you determine the relative total costs of owning different funds. In addition, if these transactional costs were included, your costs would have been higher.
Expense Table - continued
Share
Class | | Annualized
Expense
Ratio | Beginning
Account Value
8/01/22 | Ending
Account Value
1/31/23 | Expenses
Paid During
Period (p)
8/01/22-1/31/23 |
| A | Actual | 0.88% | $1,000.00 | $1,018.56 | $4.48 |
| Hypothetical (h) | 0.88% | $1,000.00 | $1,020.77 | $4.48 |
| C | Actual | 1.63% | $1,000.00 | $1,016.09 | $8.28 |
| Hypothetical (h) | 1.63% | $1,000.00 | $1,016.99 | $8.29 |
| I | Actual | 0.63% | $1,000.00 | $1,020.66 | $3.21 |
| Hypothetical (h) | 0.63% | $1,000.00 | $1,022.03 | $3.21 |
| R1 | Actual | 1.63% | $1,000.00 | $1,016.09 | $8.28 |
| Hypothetical (h) | 1.63% | $1,000.00 | $1,016.99 | $8.29 |
| R2 | Actual | 1.13% | $1,000.00 | $1,017.54 | $5.75 |
| Hypothetical (h) | 1.13% | $1,000.00 | $1,019.51 | $5.75 |
| R3 | Actual | 0.88% | $1,000.00 | $1,019.64 | $4.48 |
| Hypothetical (h) | 0.88% | $1,000.00 | $1,020.77 | $4.48 |
| R4 | Actual | 0.63% | $1,000.00 | $1,020.67 | $3.21 |
| Hypothetical (h) | 0.63% | $1,000.00 | $1,022.03 | $3.21 |
| R6 | Actual | 0.62% | $1,000.00 | $1,020.74 | $3.16 |
| Hypothetical (h) | 0.62% | $1,000.00 | $1,022.08 | $3.16 |
| (h) | 5% class return per year before expenses. |
| (p) | “Expenses Paid During Period” are equal to each class’s annualized expense ratio, as shown above, multiplied by the average account value over the period, multiplied by 184/365 (to reflect the one-half year period). Expenses paid do not include any applicable sales charges (loads). If these transaction costs had been included, your costs would have been higher. |
Portfolio of Investments
1/31/23 (unaudited)
The Portfolio of Investments is a complete list of all securities owned by your fund. It is categorized by broad-based asset classes.
| Issuer | | | Shares/Par | Value ($) |
| Common Stocks – 97.3% |
| Aerospace & Defense – 1.2% | |
| Honeywell International, Inc. | | 178 | $37,110 |
| Alcoholic Beverages – 1.5% | |
| Diageo PLC | | 522 | $22,653 |
| Pernod Ricard S.A. | | 109 | 22,553 |
| | | | | $45,206 |
| Apparel Manufacturers – 1.8% | |
| LVMH Moet Hennessy Louis Vuitton SE | | 33 | $28,828 |
| NIKE, Inc., “B” | | 207 | 26,358 |
| | | | | $55,186 |
| Brokerage & Asset Managers – 4.5% | |
| Charles Schwab Corp. | | 1,132 | $87,639 |
| CME Group, Inc. | | 188 | 33,212 |
| NASDAQ, Inc. | | 314 | 18,900 |
| | | | | $139,751 |
| Business Services – 5.4% | |
| Accenture PLC, “A” | | 176 | $49,113 |
| Equifax, Inc. | | 190 | 42,218 |
| Ferguson PLC | | 213 | 30,318 |
| TransUnion | | 228 | 16,359 |
| Verisk Analytics, Inc., “A” | | 154 | 27,996 |
| | | | | $166,004 |
| Computer Software – 14.4% | |
| Activision Blizzard, Inc. | | 267 | $20,444 |
| Adobe Systems, Inc. (a) | | 96 | 35,553 |
| Altair Engineering, Inc., “A” (a) | | 254 | 13,487 |
| ANSYS, Inc. (a) | | 153 | 40,753 |
| Autodesk, Inc. (a) | | 147 | 31,629 |
| Cadence Design Systems, Inc. (a) | | 421 | 76,971 |
| LiveRamp Holdings, Inc. (a) | | 166 | 4,442 |
| Microsoft Corp. | | 436 | 108,045 |
| PTC, Inc. (a) | | 111 | 14,972 |
| Salesforce, Inc. (a) | | 273 | 45,856 |
| Synopsys, Inc. (a) | | 147 | 52,001 |
| | | | | $444,153 |
Portfolio of Investments (unaudited) – continued
| Issuer | | | Shares/Par | Value ($) |
| Common Stocks – continued |
| Computer Software - Systems – 0.7% | |
| Workday, Inc. (a) | | 124 | $22,497 |
| Construction – 8.1% | |
| Martin Marietta Materials, Inc. | | 119 | $42,797 |
| Otis Worldwide Corp. | | 745 | 61,261 |
| Sherwin-Williams Co. | | 121 | 28,628 |
| Simpson Manufacturing Co., Inc. | | 143 | 15,317 |
| Vulcan Materials Co. | | 372 | 68,199 |
| Watsco, Inc. | | 117 | 33,622 |
| | | | | $249,824 |
| Consumer Products – 4.2% | |
| Colgate-Palmolive Co. | | 1,408 | $104,938 |
| Estee Lauder Cos., Inc., “A” | | 91 | 25,215 |
| | | | | $130,153 |
| Electrical Equipment – 3.5% | |
| Johnson Controls International PLC | | 611 | $42,507 |
| Rockwell Automation, Inc. | | 181 | 51,048 |
| TE Connectivity Ltd. | | 122 | 15,512 |
| | | | | $109,067 |
| Electronics – 7.8% | |
| Analog Devices, Inc. | | 379 | $64,987 |
| Applied Materials, Inc. | | 195 | 21,741 |
| KLA Corp. | | 65 | 25,511 |
| Lam Research Corp. | | 53 | 26,505 |
| Micron Technology, Inc. | | 215 | 12,964 |
| Novanta, Inc. (a) | | 66 | 10,657 |
| Power Integrations, Inc. | | 85 | 7,318 |
| Silicon Laboratories, Inc. (a) | | 139 | 21,810 |
| Taiwan Semiconductor Manufacturing Co. Ltd., ADR | | 249 | 23,090 |
| Texas Instruments, Inc. | | 146 | 25,873 |
| | | | | $240,456 |
| Energy - Independent – 1.3% | |
| ConocoPhillips | | 321 | $39,120 |
| Energy - Integrated – 1.3% | |
| TotalEnergies SE | | 632 | $39,265 |
| Forest & Paper Products – 0.7% | |
| Rayonier, Inc., REIT | | 572 | $20,815 |
Portfolio of Investments (unaudited) – continued
| Issuer | | | Shares/Par | Value ($) |
| Common Stocks – continued |
| Insurance – 5.6% | |
| Aon PLC | | 206 | $65,648 |
| Arthur J. Gallagher & Co. | | 236 | 46,190 |
| Marsh & McLennan Cos., Inc. | | 224 | 39,180 |
| Willis Towers Watson PLC | | 80 | 20,335 |
| | | | | $171,353 |
| Internet – 1.0% | |
| Alphabet, Inc., “A” (a) | | 316 | $31,233 |
| Leisure & Toys – 0.9% | |
| Electronic Arts, Inc. | | 142 | $18,273 |
| Take-Two Interactive Software, Inc. (a) | | 84 | 9,511 |
| | | | | $27,784 |
| Machinery & Tools – 10.3% | |
| Fastenal Co. | | 287 | $14,508 |
| Graco, Inc. | | 354 | 24,185 |
| IDEX Corp. | | 188 | 45,060 |
| Ingersoll Rand, Inc. | | 491 | 27,496 |
| MSA Safety Inc. | | 136 | 18,549 |
| Nordson Corp. | | 120 | 29,196 |
| Pentair PLC | | 254 | 14,067 |
| RBC Bearings, Inc. (a) | | 85 | 20,737 |
| Regal Rexnord Corp. | | 98 | 13,642 |
| Trane Technologies PLC | | 192 | 34,391 |
| Wabtec Corp. | | 153 | 15,883 |
| Watts Water Technologies, “A” | | 360 | 58,867 |
| | | | | $316,581 |
| Medical & Health Technology & Services – 0.9% | |
| ICON PLC (a) | | 113 | $26,070 |
| Medical Equipment – 7.2% | |
| Agilent Technologies, Inc. | | 464 | $70,565 |
| Bio-Techne Corp. | | 120 | 9,559 |
| Bruker BioSciences Corp. | | 797 | 55,886 |
| Danaher Corp. | | 171 | 45,209 |
| Envista Holdings Corp. (a) | | 785 | 30,607 |
| Maravai Lifesciences Holdings, Inc., “A” (a) | | 605 | 8,869 |
| | | | | $220,695 |
| Other Banks & Diversified Financials – 6.7% | |
| Mastercard, Inc., “A” | | 201 | $74,491 |
| Moody's Corp. | | 203 | 65,518 |
| Northern Trust Corp. | | 210 | 20,364 |
Portfolio of Investments (unaudited) – continued
| Issuer | | | Shares/Par | Value ($) |
| Common Stocks – continued |
| Other Banks & Diversified Financials – continued | |
| S&P Global, Inc. | | 124 | $46,492 |
| | | | | $206,865 |
| Precious Metals & Minerals – 3.5% | |
| Franco-Nevada Corp. | | 321 | $47,086 |
| Royal Gold, Inc. | | 281 | 35,695 |
| Wheaton Precious Metals Corp. | | 542 | 24,783 |
| | | | | $107,564 |
| Real Estate – 0.7% | |
| CBRE Group, Inc., “A” (a) | | 239 | $20,437 |
| Specialty Chemicals – 1.1% | |
| Corteva, Inc. | | 305 | $19,657 |
| RPM International, Inc. | | 168 | 15,105 |
| | | | | $34,762 |
| Specialty Stores – 3.0% | |
| Amazon.com, Inc. (a) | | 219 | $22,585 |
| Costco Wholesale Corp. | | 134 | 68,493 |
| | | | | $91,078 |
| Total Common Stocks (Identified Cost, $3,033,641) | | $2,993,029 |
| Investment Companies (h) – 3.8% |
| Money Market Funds – 3.8% | |
| MFS Institutional Money Market Portfolio, 4.29% (v) (Identified Cost, $116,962) | | | 116,965 | $116,976 |
|
|
| Other Assets, Less Liabilities – (1.1)% | | (34,600) |
| Net Assets – 100.0% | $3,075,405 |
| (a) | Non-income producing security. | | | |
| (h) | An affiliated issuer, which may be considered one in which the fund owns 5% or more of the outstanding voting securities, or a company which is under common control. At period end, the aggregate values of the fund's investments in affiliated issuers and in unaffiliated issuers were $116,976 and $2,993,029, respectively. | | | |
| (v) | Affiliated issuer that is available only to investment companies managed by MFS. The rate quoted for the MFS Institutional Money Market Portfolio is the annualized seven-day yield of the fund at period end. | | | |
| The following abbreviations are used in this report and are defined: |
| ADR | American Depositary Receipt |
| REIT | Real Estate Investment Trust |
See Notes to Financial Statements
Financial Statements
Statement of Assets and Liabilities
At 1/31/23 (unaudited)
This statement represents your fund’s balance sheet, which details the assets and liabilities comprising the total value of the fund.
| Assets | |
| Investments in unaffiliated issuers, at value (identified cost, $3,033,641) | $2,993,029 |
| Investments in affiliated issuers, at value (identified cost, $116,962) | 116,976 |
| Receivables for | |
| Dividends | 1,765 |
| Other assets | 423 |
| Total assets | $3,112,193 |
| Liabilities | |
| Payable to affiliates | |
| Investment adviser | $6,187 |
| Administrative services fee | 96 |
| Distribution and service fees | 18 |
| Payable for independent Trustees' compensation | 524 |
| Accrued expenses and other liabilities | 29,963 |
| Total liabilities | $36,788 |
| Net assets | $3,075,405 |
| Net assets consist of | |
| Paid-in capital | $3,169,219 |
| Total distributable earnings (loss) | (93,814) |
| Net assets | $3,075,405 |
| Shares of beneficial interest outstanding | 323,293 |
Statement of Assets and Liabilities (unaudited) – continued
| | Net assets | Shares
outstanding | Net asset value
per share (a) |
| Class A | $587,979 | 61,880 | $9.50 |
| Class C | 81,766 | 8,635 | 9.47 |
| Class I | 514,293 | 54,043 | 9.52 |
| Class R1 | 54,431 | 5,748 | 9.47 |
| Class R2 | 54,681 | 5,749 | 9.51 |
| Class R3 | 54,807 | 5,760 | 9.52 |
| Class R4 | 53,915 | 5,664 | 9.52 |
| Class R6 | 1,673,533 | 175,814 | 9.52 |
| (a) | Maximum offering price per share was equal to the net asset value per share for all share classes, except for Class A, for which the maximum offering price per share was $10.08 [100 / 94.25 x $9.50]. On sales of $50,000 or more, the maximum offering price of Class A shares is reduced. A contingent deferred sales charge may be imposed on redemptions of Class A and Class C shares. Redemption price per share was equal to the net asset value per share for Classes I, R1, R2, R3, R4, and R6. |
See Notes to Financial Statements
Financial Statements
Statement of Operations
Six months ended 1/31/23 (unaudited)
This statement describes how much your fund earned in investment income and accrued in expenses. It also describes any gains and/or losses generated by fund operations.
| Net investment income (loss) | |
| Income | |
| Dividends | $15,838 |
| Dividends from affiliated issuers | 1,273 |
| Other | 26 |
| Foreign taxes withheld | (350) |
| Total investment income | $16,787 |
| Expenses | |
| Management fee | $7,975 |
| Distribution and service fees | 1,202 |
| Shareholder servicing costs | 383 |
| Administrative services fee | 8,823 |
| Independent Trustees' compensation | 1,512 |
| Custodian fee | 5,060 |
| Shareholder communications | 2,110 |
| Audit and tax fees | 25,620 |
| Legal fees | 45 |
| Registration fees | 92,331 |
| Miscellaneous | 13,246 |
| Total expenses | $158,307 |
| Reduction of expenses by investment adviser | (148,807) |
| Net expenses | $9,500 |
| Net investment income (loss) | $7,287 |
| Realized and unrealized gain (loss) |
| Realized gain (loss) (identified cost basis) | |
| Unaffiliated issuers | $(31,976) |
| Affiliated issuers | (1) |
| Foreign currency | (9) |
| Net realized gain (loss) | $(31,986) |
| Change in unrealized appreciation or depreciation | |
| Unaffiliated issuers | $98,828 |
| Affiliated issuers | 11 |
| Translation of assets and liabilities in foreign currencies | 3 |
| Net unrealized gain (loss) | $98,842 |
| Net realized and unrealized gain (loss) | $66,856 |
| Change in net assets from operations | $74,143 |
See Notes to Financial Statements
Financial Statements
Statement of Changes in Net Assets
This statement describes the increases and/or decreases in net assets resulting from operations, any distributions, and any shareholder transactions.
| | Six months ended | Year ended |
| | 1/31/23
(unaudited) | 7/31/22(c) |
| Change in net assets | | |
| From operations | | |
| Net investment income (loss) | $7,287 | $3,672 |
| Net realized gain (loss) | (31,986) | (21,051) |
| Net unrealized gain (loss) | 98,842 | (139,439) |
| Change in net assets from operations | $74,143 | $(156,818) |
| Total distributions to shareholders | $(11,550) | $— |
| Change in net assets from fund share transactions | $531,616 | $2,638,014 |
| Total change in net assets | $594,209 | $2,481,196 |
| Net assets | | |
| At beginning of period | 2,481,196 | — |
| At end of period | $3,075,405 | $2,481,196 |
| (c) | For the period from the commencement of the fund’s investment operations, February 8, 2022, through the stated period end. |
See Notes to Financial Statements
Financial Statements
Financial Highlights
The financial highlights table is intended to help you understand the fund's financial performance for the semiannual period and the past 5 fiscal years (or life of a particular share class, if shorter). Certain information reflects financial results for a single fund share. The total returns in the table represent the rate that an investor would have earned (or lost) on an investment in the fund share class (assuming reinvestment of all distributions) held for the entire period.
| Class A | Six months
ended | Year ended |
| | 1/31/23
(unaudited) | 7/31/22(c) |
| Net asset value, beginning of period | $9.36 | $10.00 |
| Income (loss) from investment operations |
| Net investment income (loss) (d) | $0.02 | $0.01 |
| Net realized and unrealized gain (loss) | 0.15 | (0.65) |
| Total from investment operations | $0.17 | $(0.64) |
| Less distributions declared to shareholders |
| From net investment income | $(0.03) | $— |
| Net asset value, end of period (x) | $9.50 | $9.36 |
| Total return (%) (r)(s)(t)(x) | 1.86(n) | (6.40)(n) |
Ratios (%) (to average net assets)
and Supplemental data: |
| Expenses before expense reductions (f) | 12.58(a) | 7.90(a) |
| Expenses after expense reductions (f) | 0.88(a) | 0.88(a) |
| Net investment income (loss) | 0.40(a) | 0.15(a) |
| Portfolio turnover | 6(n) | 7(n) |
| Net assets at end of period (000 omitted) | $588 | $154 |
See Notes to Financial Statements
Financial Highlights – continued
| Class C | Six months
ended | Year ended |
| | 1/31/23
(unaudited) | 7/31/22(c) |
| Net asset value, beginning of period | $9.32 | $10.00 |
| Income (loss) from investment operations |
| Net investment income (loss) (d) | $(0.02) | $(0.03) |
| Net realized and unrealized gain (loss) | 0.17 | (0.65) |
| Total from investment operations | $0.15 | $(0.68) |
| Less distributions declared to shareholders |
| From net investment income | $— | $— |
| Net asset value, end of period (x) | $9.47 | $9.32 |
| Total return (%) (r)(s)(t)(x) | 1.61(n) | (6.80)(n) |
Ratios (%) (to average net assets)
and Supplemental data: |
| Expenses before expense reductions (f) | 13.07(a) | 8.46(a) |
| Expenses after expense reductions (f) | 1.63(a) | 1.63(a) |
| Net investment income (loss) | (0.36)(a) | (0.59)(a) |
| Portfolio turnover | 6(n) | 7(n) |
| Net assets at end of period (000 omitted) | $82 | $56 |
| Class I | Six months
ended | Year ended |
| | 1/31/23
(unaudited) | 7/31/22(c) |
| Net asset value, beginning of period | $9.37 | $10.00 |
| Income (loss) from investment operations |
| Net investment income (loss) (d) | $0.03 | $0.02 |
| Net realized and unrealized gain (loss) | 0.16 | (0.65) |
| Total from investment operations | $0.19 | $(0.63) |
| Less distributions declared to shareholders |
| From net investment income | $(0.04) | $— |
| Net asset value, end of period (x) | $9.52 | $9.37 |
| Total return (%) (r)(s)(t)(x) | 2.07(n) | (6.30)(n) |
Ratios (%) (to average net assets)
and Supplemental data: |
| Expenses before expense reductions (f) | 11.78(a) | 7.34(a) |
| Expenses after expense reductions (f) | 0.63(a) | 0.63(a) |
| Net investment income (loss) | 0.63(a) | 0.37(a) |
| Portfolio turnover | 6(n) | 7(n) |
| Net assets at end of period (000 omitted) | $514 | $444 |
See Notes to Financial Statements
Financial Highlights – continued
| Class R1 | Six months
ended | Year ended |
| | 1/31/23
(unaudited) | 7/31/22(c) |
| Net asset value, beginning of period | $9.32 | $10.00 |
| Income (loss) from investment operations |
| Net investment income (loss) (d) | $(0.02) | $(0.03) |
| Net realized and unrealized gain (loss) | 0.17 | (0.65) |
| Total from investment operations | $0.15 | $(0.68) |
| Less distributions declared to shareholders |
| From net investment income | $— | $— |
| Net asset value, end of period (x) | $9.47 | $9.32 |
| Total return (%) (r)(s)(t)(x) | 1.61(n) | (6.80)(n) |
Ratios (%) (to average net assets)
and Supplemental data: |
| Expenses before expense reductions (f) | 12.73(a) | 8.71(a) |
| Expenses after expense reductions (f) | 1.63(a) | 1.63(a) |
| Net investment income (loss) | (0.37)(a) | (0.59)(a) |
| Portfolio turnover | 6(n) | 7(n) |
| Net assets at end of period (000 omitted) | $54 | $47 |
| Class R2 | Six months
ended | Year ended |
| | 1/31/23
(unaudited) | 7/31/22(c) |
| Net asset value, beginning of period | $9.35 | $10.00 |
| Income (loss) from investment operations |
| Net investment income (loss) (d) | $0.01 | $(0.01) |
| Net realized and unrealized gain (loss) | 0.15 | (0.64) |
| Total from investment operations | $0.16 | $(0.65) |
| Less distributions declared to shareholders |
| From net investment income | $(0.00)(w) | $— |
| Net asset value, end of period (x) | $9.51 | $9.35 |
| Total return (%) (r)(s)(t)(x) | 1.75(n) | (6.50)(n) |
Ratios (%) (to average net assets)
and Supplemental data: |
| Expenses before expense reductions (f) | 12.23(a) | 8.21(a) |
| Expenses after expense reductions (f) | 1.13(a) | 1.13(a) |
| Net investment income (loss) | 0.12(a) | (0.11)(a) |
| Portfolio turnover | 6(n) | 7(n) |
| Net assets at end of period (000 omitted) | $55 | $47 |
See Notes to Financial Statements
Financial Highlights – continued
| Class R3 | Six months
ended | Year ended |
| | 1/31/23
(unaudited) | 7/31/22(c) |
| Net asset value, beginning of period | $9.36 | $10.00 |
| Income (loss) from investment operations |
| Net investment income (loss) (d) | $0.02 | $0.01 |
| Net realized and unrealized gain (loss) | 0.16 | (0.65) |
| Total from investment operations | $0.18 | $(0.64) |
| Less distributions declared to shareholders |
| From net investment income | $(0.02) | $— |
| Net asset value, end of period (x) | $9.52 | $9.36 |
| Total return (%) (r)(s)(t)(x) | 1.96(n) | (6.40)(n) |
Ratios (%) (to average net assets)
and Supplemental data: |
| Expenses before expense reductions (f) | 11.98(a) | 7.95(a) |
| Expenses after expense reductions (f) | 0.88(a) | 0.88(a) |
| Net investment income (loss) | 0.38(a) | 0.13(a) |
| Portfolio turnover | 6(n) | 7(n) |
| Net assets at end of period (000 omitted) | $55 | $47 |
| Class R4 | Six months
ended | Year ended |
| | 1/31/23
(unaudited) | 7/31/22(c) |
| Net asset value, beginning of period | $9.37 | $10.00 |
| Income (loss) from investment operations |
| Net investment income (loss) (d) | $0.03 | $0.02 |
| Net realized and unrealized gain (loss) | 0.16 | (0.65) |
| Total from investment operations | $0.19 | $(0.63) |
| Less distributions declared to shareholders |
| From net investment income | $(0.04) | $— |
| Net asset value, end of period (x) | $9.52 | $9.37 |
| Total return (%) (r)(s)(t)(x) | 2.07(n) | (6.30)(n) |
Ratios (%) (to average net assets)
and Supplemental data: |
| Expenses before expense reductions (f) | 11.73(a) | 7.70(a) |
| Expenses after expense reductions (f) | 0.63(a) | 0.63(a) |
| Net investment income (loss) | 0.64(a) | 0.39(a) |
| Portfolio turnover | 6(n) | 7(n) |
| Net assets at end of period (000 omitted) | $54 | $47 |
See Notes to Financial Statements
Financial Highlights – continued
| Class R6 | Six months
ended | Year ended |
| | 1/31/23
(unaudited) | 7/31/22(c) |
| Net asset value, beginning of period | $9.37 | $10.00 |
| Income (loss) from investment operations |
| Net investment income (loss) (d) | $0.03 | $0.02 |
| Net realized and unrealized gain (loss) | 0.16 | (0.65) |
| Total from investment operations | $0.19 | $(0.63) |
| Less distributions declared to shareholders |
| From net investment income | $(0.04) | $— |
| Net asset value, end of period (x) | $9.52 | $9.37 |
| Total return (%) (r)(s)(t)(x) | 2.07(n) | (6.30)(n) |
Ratios (%) (to average net assets)
and Supplemental data: |
| Expenses before expense reductions (f) | 11.72(a) | 7.69(a) |
| Expenses after expense reductions (f) | 0.62(a) | 0.62(a) |
| Net investment income (loss) | 0.64(a) | 0.40(a) |
| Portfolio turnover | 6(n) | 7(n) |
| Net assets at end of period (000 omitted) | $1,674 | $1,639 |
| (a) | Annualized. |
| (c) | For the period from the commencement of the fund’s investment operations, February 8, 2022, through the stated period end. |
| (d) | Per share data is based on average shares outstanding. |
| (f) | Ratios do not reflect reductions from fees paid indirectly, if applicable. See Note 2 in the Notes to Financial Statements for additional information. |
| (n) | Not annualized. |
| (r) | Certain expenses have been reduced without which performance would have been lower. |
| (s) | From time to time the fund may receive proceeds from litigation settlements, without which performance would be lower. |
| (t) | Total returns do not include any applicable sales charges. |
| (w) | Per share amount was less than $0.01. |
| (x) | The net asset values and total returns have been calculated on net assets which include adjustments made in accordance with U.S. generally accepted accounting principles required at period end for financial reporting purposes. |
See Notes to Financial Statements
Notes to Financial Statements
(unaudited)
(1) Business and Organization
MFS Intrinsic Value Fund (the fund) is a diversified series of MFS Series Trust VII (the trust). The trust is organized as a Massachusetts business trust and is registered under the Investment Company Act of 1940, as amended, as an open-end management investment company.
The fund is an investment company and accordingly follows the investment company accounting and reporting guidance of the Financial Accounting Standards Board (FASB) Accounting Standards Codification Topic 946 Financial Services - Investment Companies.
(2) Significant Accounting Policies
General — The preparation of financial statements in conformity with U.S. generally accepted accounting principles requires management to make estimates and assumptions that affect the reported amounts of assets and liabilities, and disclosure of contingent assets and liabilities at the date of the financial statements and the reported amounts of increases and decreases in net assets from operations during the reporting period. Actual results could differ from those estimates. In the preparation of these financial statements, management has evaluated subsequent events occurring after the date of the fund’s Statement of Assets and Liabilities through the date that the financial statements were issued. The fund invests in foreign securities. Investments in foreign securities are vulnerable to the effects of changes in the relative values of the local currency and the U.S. dollar and to the effects of changes in each country’s market, economic, industrial, political, regulatory, geopolitical, environmental, public health, and other conditions.
Balance Sheet Offsetting — The fund's accounting policy with respect to balance sheet offsetting is that, absent an event of default by the counterparty or a termination of the agreement, the International Swaps and Derivatives Association (ISDA) Master Agreement, or similar agreement, does not result in an offset of reported amounts of financial assets and financial liabilities in the Statement of Assets and Liabilities across transactions between the fund and the applicable counterparty. The fund's right to setoff may be restricted or prohibited by the bankruptcy or insolvency laws of the particular jurisdiction to which a specific master netting agreement counterparty is subject. Balance sheet offsetting disclosures, to the extent applicable to the fund, have been included in the fund’s Significant Accounting Policies note under the captions for each of the fund’s in-scope financial instruments and transactions.
Investment Valuations — Subject to its oversight, the fund's Board of Trustees has delegated primary responsibility for determining or causing to be determined the value of the fund’s investments to MFS as the fund's adviser, pursuant to the fund’s valuation policy and procedures which have been adopted by the adviser and approved by the Board. Effective September 8, 2022, and in accordance with Rule 2a-5 under the Investment Company Act of 1940, the Board of Trustees designated the adviser as the “valuation designee” of the fund. If the adviser, as valuation designee, determines that reliable market quotations are not readily available for an investment, the investment is valued at fair value as determined in good faith by the adviser in accordance with the adviser’s fair valuation policy and procedures.
Notes to Financial Statements (unaudited) - continued
Under the fund's valuation policy and procedures, equity securities, including restricted equity securities, are generally valued at the last sale or official closing price on their primary market or exchange as provided by a third-party pricing service. Equity securities, for which there were no sales reported that day, are generally valued at the last quoted daily bid quotation on their primary market or exchange as provided by a third-party pricing service. Short-term instruments with a maturity at issuance of 60 days or less may be valued at amortized cost, which approximates market value.
Open-end investment companies are generally valued at net asset value per share. The values of foreign securities and other assets and liabilities expressed in foreign currencies are converted to U.S. dollars using the mean of bid and asked prices for rates provided by a third-party pricing service.
Under the fund’s valuation policy and procedures, market quotations are not considered to be readily available for debt instruments, floating rate loans, and many types of derivatives. These investments are generally valued at fair value based on information from third-party pricing services or otherwise determined by the adviser in accordance with the adviser’s fair valuation policy and procedures. Securities and other assets generally valued on the basis of information from a third-party pricing service may also be valued at a broker/dealer bid quotation. In determining values, third-party pricing services can utilize both transaction data and market information such as yield, quality, coupon rate, maturity, type of issue, trading characteristics, spreads and other market data. An investment may also be valued at fair value if the adviser determines that the investment’s value has been materially affected by events occurring after the close of the exchange or market on which the investment is principally traded (such as foreign exchange or market) and prior to the determination of the fund’s net asset value, or after the halt of trading of a specific security where trading does not resume prior to the close of the exchange or market on which the security is principally traded. Events that occur after foreign markets close (such as developments in foreign markets and significant movements in the U.S. markets) and prior to the determination of the fund’s net asset value may be deemed to have a material effect on the value of securities traded in foreign markets. Accordingly, the fund’s foreign equity securities may often be valued at fair value. The adviser generally relies on third-party pricing services or other information (such as the correlation with price movements of similar securities in the same or other markets; the type, cost and investment characteristics of the security; the business and financial condition of the issuer; and trading and other market data) to assist in determining whether to fair value and at what value to fair value an investment. The value of an investment for purposes of calculating the fund’s net asset value can differ depending on the source and method used to determine value. When fair valuation is used, the value of an investment used to determine the fund’s net asset value may differ from quoted or published prices for the same investment. There can be no assurance that the fund could obtain the fair value assigned to an investment if it were to sell the investment at the same time at which the fund determines its net asset value per share.
Various inputs are used in determining the value of the fund's assets or liabilities. These inputs are categorized into three broad levels. In certain cases, the inputs used to measure fair value may fall into different levels of the fair value hierarchy. In such cases, an investment's level within the fair value hierarchy is based on the lowest level of input that is significant to the fair value measurement. The fund's assessment of the significance of a particular input to the fair value measurement in its entirety requires judgment, and considers factors specific to the investment. Level 1 includes unadjusted
Notes to Financial Statements (unaudited) - continued
quoted prices in active markets for identical assets or liabilities. Level 2 includes other significant observable market-based inputs (including quoted prices for similar securities, interest rates, prepayment speed, and credit risk). Level 3 includes significant unobservable inputs, which may include the adviser's own assumptions in determining the fair value of investments. The following is a summary of the levels used as of January 31, 2023 in valuing the fund's assets and liabilities:
| Financial Instruments | Level 1 | Level 2 | Level 3 | Total |
| Equity Securities: | | | | |
| United States | $2,784,771 | $— | $— | $2,784,771 |
| France | — | 90,646 | — | 90,646 |
| Canada | 71,869 | — | — | 71,869 |
| Taiwan | 23,090 | — | — | 23,090 |
| United Kingdom | 22,653 | — | — | 22,653 |
| Mutual Funds | 116,976 | — | — | 116,976 |
| Total | $3,019,359 | $90,646 | $— | $3,110,005 |
For further information regarding security characteristics, see the Portfolio of Investments.
Foreign Currency Translation — Purchases and sales of foreign investments, income, and expenses are converted into U.S. dollars based upon currency exchange rates prevailing on the respective dates of such transactions or on the reporting date for foreign denominated receivables and payables. Gains and losses attributable to foreign currency exchange rates on sales of securities are recorded for financial statement purposes as net realized gains and losses on investments. Gains and losses attributable to foreign exchange rate movements on receivables, payables, income and expenses are recorded for financial statement purposes as foreign currency transaction gains and losses. That portion of both realized and unrealized gains and losses on investments that results from fluctuations in foreign currency exchange rates is not separately disclosed.
Indemnifications — Under the fund's organizational documents, its officers and Trustees may be indemnified against certain liabilities and expenses arising out of the performance of their duties to the fund. Additionally, in the normal course of business, the fund enters into agreements with service providers that may contain indemnification clauses. The fund's maximum exposure under these agreements is unknown as this would involve future claims that may be made against the fund that have not yet occurred.
Investment Transactions and Income — Investment transactions are recorded on the trade date. Dividends received in cash are recorded on the ex-dividend date. Certain dividends from foreign securities will be recorded when the fund is informed of the dividend if such information is obtained subsequent to the ex-dividend date. Dividend payments received in additional securities are recorded on the ex-dividend date in an amount equal to the value of the security on such date. In determining the net gain or loss on securities sold, the cost of securities is determined on the identified cost basis.
Notes to Financial Statements (unaudited) - continued
The fund may receive proceeds from litigation settlements. Any proceeds received from litigation involving portfolio holdings are reflected in the Statement of Operations in realized gain/loss if the security has been disposed of by the fund or in unrealized gain/loss if the security is still held by the fund. Any other proceeds from litigation not related to portfolio holdings are reflected as other income in the Statement of Operations.
Fees Paid Indirectly — The fund's custody fee may be reduced by a credit earned under an arrangement that measures the value of U.S. dollars deposited with the custodian by the fund. For the six months ended January 31, 2023, custody fees were not reduced.
Tax Matters and Distributions — The fund intends to qualify as a regulated investment company, as defined under Subchapter M of the Internal Revenue Code, and to distribute all of its taxable income, including realized capital gains. As a result, no provision for federal income tax is required. The fund’s federal tax returns, when filed, will remain subject to examination by the Internal Revenue Service for a three year period. Management has analyzed the fund’s tax positions taken on federal and state tax returns for all open tax years and does not believe that there are any uncertain tax positions that require recognition of a tax liability. Foreign taxes, if any, have been accrued by the fund in the accompanying financial statements in accordance with the applicable foreign tax law. Foreign income taxes may be withheld by certain countries in which the fund invests. Additionally, capital gains realized by the fund on securities issued in or by certain foreign countries may be subject to capital gains tax imposed by those countries.
Distributions to shareholders are recorded on the ex-dividend date. Income and capital gain distributions are determined in accordance with income tax regulations, which may differ from U.S. generally accepted accounting principles. Certain capital accounts in the financial statements are periodically adjusted for permanent differences in order to reflect their tax character. These adjustments have no impact on net assets or net asset value per share. Temporary differences which arise from recognizing certain items of income, expense, gain or loss in different periods for financial statement and tax purposes will reverse at some time in the future.
Book/tax differences primarily relate to wash sale loss deferrals.
The fund declared no distributions for the year ended July 31, 2022.
The federal tax cost and the tax basis components of distributable earnings were as follows:
| As of 1/31/23 | |
| Cost of investments | $3,155,917 |
| Gross appreciation | 130,821 |
| Gross depreciation | (176,733) |
| Net unrealized appreciation (depreciation) | $(45,912) |
| As of 7/31/22 | |
| Undistributed ordinary income | 4,164 |
| Capital loss carryforwards | (15,818) |
| Other temporary differences | (2) |
| Net unrealized appreciation (depreciation) | (144,751) |
The aggregate cost above includes prior fiscal year end tax adjustments, if applicable.
Notes to Financial Statements (unaudited) - continued
As of July 31, 2022, the fund had capital loss carryforwards available to offset future realized gains. These net capital losses may be carried forward indefinitely and their character is retained as short-term and/or long-term losses. Such losses are characterized as follows:
Multiple Classes of Shares of Beneficial Interest — The fund offers multiple classes of shares, which differ in their respective distribution and service fees. The fund's income, realized and unrealized gain (loss), and common expenses are allocated to shareholders based on the daily net assets of each class. Dividends are declared separately for each class. Differences in per share dividend rates are generally due to differences in separate class expenses. Class C shares will convert to Class A shares approximately eight years after purchase. The fund’s distributions declared to shareholders as reported in the Statements of Changes in Net Assets are presented by class as follows:
| | Six months ended
1/31/23 | Year ended
7/31/22 (c) |
| Class A | $1,651 | $— |
| Class I | 2,172 | — |
| Class R2 | 22 | — |
| Class R3 | 129 | — |
| Class R4 | 233 | — |
| Class R6 | 7,343 | — |
| Total | $11,550 | $— |
| (c) | For the period from the commencement of the fund’s investment operations, February 8, 2022, through the stated period end. |
(3) Transactions with Affiliates
Investment Adviser — The fund has an investment advisory agreement with MFS to provide overall investment management and related administrative services and facilities to the fund. The management fee is computed daily and paid monthly at the following annual rates based on the fund's average daily net assets:
| Up to $1 billion | 0.60% |
| In excess of $1 billion and up to $2.5 billion | 0.55% |
| In excess of $2.5 billion and up to $5 billion | 0.45% |
| In excess of $5 billion and up to $10 billion | 0.42% |
| In excess of $10 billion | 0.40% |
MFS has agreed in writing to reduce its management fee by a specified amount if certain MFS mutual fund assets exceed thresholds agreed to by MFS and the fund's Board of Trustees. MFS has also agreed in writing to waive at least 0.01% of its management fee as part of this agreement. The agreement to waive at least 0.01% of the management fee will continue until modified by the fund's Board of Trustees, but such agreement will continue at least until November 30, 2023. For the six months ended January 31, 2023, this management fee reduction amounted to $179, which is included in the reduction of total expenses in the Statement of Operations. The management fee incurred for the six months ended January 31, 2023 was equivalent to an annual effective rate of 0.59% of the fund's average daily net assets.
Notes to Financial Statements (unaudited) - continued
The investment adviser has agreed in writing to pay a portion of the fund’s total annual operating expenses, excluding interest, taxes, extraordinary expenses, brokerage and transaction costs, certain tax reclaim recovery expenses (including contingency fees and closing agreement expenses), and investment-related expenses, such that total fund operating expenses do not exceed the following rates annually of each class’s average daily net assets:
| Classes |
| A | C | I | R1 | R2 | R3 | R4 | R6 |
| 0.94% | 1.69% | 0.69% | 1.69% | 1.19% | 0.94% | 0.69% | 0.62% |
This written agreement will continue until modified by the fund’s Board of Trustees, but such agreement will continue at least until November 30, 2023. For the six months ended January 31, 2023, this reduction amounted to $148,628, which is included in the reduction of total expenses in the Statement of Operations.
Distributor — MFS Fund Distributors, Inc. (MFD), a wholly-owned subsidiary of MFS, as distributor, received $1,435 for the six months ended January 31, 2023, as its portion of the initial sales charge on sales of Class A shares of the fund.
The Board of Trustees has adopted a distribution plan for certain share classes pursuant to Rule 12b-1 of the Investment Company Act of 1940.
The fund's distribution plan provides that the fund will pay MFD for services provided by MFD and financial intermediaries in connection with the distribution and servicing of certain share classes. One component of the plan is a distribution fee paid to MFD and another component of the plan is a service fee paid to MFD. MFD may subsequently pay all, or a portion, of the distribution and/or service fees to financial intermediaries.
Distribution Plan Fee Table:
| | Distribution
Fee Rate (d) | Service
Fee Rate (d) | Total
Distribution
Plan (d) | Annual
Effective
Rate (e) | Distribution
and Service
Fee |
| Class A | — | 0.25% | 0.25% | 0.25% | $ 445 |
| Class C | 0.75% | 0.25% | 1.00% | 1.00% | 308 |
| Class R1 | 0.75% | 0.25% | 1.00% | 1.00% | 256 |
| Class R2 | 0.25% | 0.25% | 0.50% | 0.50% | 129 |
| Class R3 | — | 0.25% | 0.25% | 0.25% | 64 |
| Total Distribution and Service Fees | | | | | $1,202 |
| (d) | In accordance with the distribution plan for certain classes, the fund pays distribution and/or service fees equal to these annual percentage rates of each class’s average daily net assets. The distribution and service fee rates disclosed by class represent the current rates in effect at the end of the reporting period. Any rate changes, if applicable, are detailed below. |
| (e) | The annual effective rates represent actual fees incurred under the distribution plan for the six months ended January 31, 2023 based on each class's average daily net assets. MFD has voluntarily agreed to rebate a portion of each class's 0.25% service fee attributable to accounts for which there is no financial intermediary specified on the account except for accounts attributable to MFS or its affiliates' seed money. There were no service fee rebates for the six months ended January 31, 2023. |
Notes to Financial Statements (unaudited) - continued
Certain Class A shares are subject to a contingent deferred sales charge (CDSC) in the event of a shareholder redemption within 18 months of purchase. Class C shares are subject to a CDSC in the event of a shareholder redemption within 12 months of purchase. There were no contingent deferred sales charges imposed during the six months ended January 31, 2023.
Shareholder Servicing Agent — MFS Service Center, Inc. (MFSC), a wholly-owned subsidiary of MFS, receives a fee from the fund for its services as shareholder servicing agent calculated as a percentage of the average daily net assets of the fund as determined periodically under the supervision of the fund's Board of Trustees. For the six months ended January 31, 2023, the fee was $186, which equated to 0.0140% annually of the fund's average daily net assets. MFSC also receives reimbursement from the fund for out-of-pocket expenses, sub-accounting and other shareholder servicing costs which may be paid to affiliated and unaffiliated service providers. Class R6 shares do not incur sub-accounting fees. For the six months ended January 31, 2023, these out-of-pocket expenses, sub-accounting and other shareholder servicing costs amounted to $197.
Administrator — MFS provides certain financial, legal, shareholder communications, compliance, and other administrative services to the fund. Under an administrative services agreement, the fund reimburses MFS the costs incurred to provide these services. The fund is charged an annual fixed amount of $17,500 plus a fee based on average daily net assets. The administrative services fee incurred for the six months ended January 31, 2023 was equivalent to an annual effective rate of 0.6637% of the fund's average daily net assets.
Trustees’ and Officers’ Compensation — The fund pays compensation to independent Trustees in the form of a retainer, attendance fees, and additional compensation to Board and Committee chairpersons. The fund does not pay compensation directly to Trustees or officers of the fund who are also officers of the investment adviser, all of whom receive remuneration from MFS for their services to the fund. Certain officers and Trustees of the fund are officers or directors of MFS, MFD, and MFSC.
Other — The fund invests in the MFS Institutional Money Market Portfolio which is managed by MFS and seeks current income consistent with preservation of capital and liquidity. This money market fund does not pay a management fee to MFS but does incur investment and operating costs.
On February 8, 2022, MFS purchased the following shares as an initial investment in the fund:
| Class | Shares | Amount |
| Class A | 15,000 | $150,000 |
| Class C | 5,000 | 50,000 |
| Class I | 5,000 | 50,000 |
| Class R1 | 5,000 | 50,000 |
| Class R2 | 5,000 | 50,000 |
| Class R3 | 5,000 | 50,000 |
| Class R4 | 5,000 | 50,000 |
| Class R6 | 175,000 | 1,750,000 |
Notes to Financial Statements (unaudited) - continued
On August 3, 2022, MFS purchased the following shares:
| Class | Shares | Amount |
| Class R1 | 748 | $7,000 |
| Class R2 | 746 | 7,000 |
| Class R3 | 746 | 7,000 |
| Class R4 | 638 | 6,000 |
At January 31, 2023, MFS held approximately 58% of the outstanding shares of Class C, and 100% of the outstanding shares of Class R1, Class R2, Class R3, Class R4, and Class R6.
(4) Portfolio Securities
For the six months ended January 31, 2023, purchases and sales of investments, other than short-term obligations, aggregated $647,214 and $155,469, respectively.
(5) Shares of Beneficial Interest
The fund's Declaration of Trust permits the Trustees to issue an unlimited number of full and fractional shares of beneficial interest. Transactions in fund shares were as follows:
| | Six months ended
1/31/23 | | Year ended
7/31/22 (c) |
| | Shares | Amount | | Shares | Amount |
| Shares sold | | | | | |
| Class A | 45,504 | $415,653 | | 18,732 | $184,633 |
| Class C | 2,602 | 23,678 | | 6,034 | 58,864 |
| Class I | 6,363 | 56,440 | | 47,444 | 464,037 |
| Class R1 | 748 | 7,000 | | 5,000 | 50,000 |
| Class R2 | 746 | 7,000 | | 5,000 | 50,000 |
| Class R3 | 746 | 7,000 | | 5,000 | 50,000 |
| Class R4 | 638 | 6,000 | | 5,000 | 50,000 |
| Class R6 | — | — | | 175,000 | 1,750,000 |
| | 57,347 | $522,771 | | 267,210 | $2,657,534 |
Shares issued to shareholders
in reinvestment of distributions | | | | | |
| Class A | 183 | $1,651 | | — | $— |
| Class I | 241 | 2,172 | | — | — |
| Class R2 | 3 | 22 | | — | — |
| Class R3 | 14 | 129 | | — | — |
| Class R4 | 26 | 233 | | — | — |
| Class R6 | 814 | 7,343 | | — | — |
| | 1,281 | $11,550 | | — | $— |
Notes to Financial Statements (unaudited) - continued
| | Six months ended
1/31/23 | | Year ended
7/31/22 (c) |
| | Shares | Amount | | Shares | Amount |
| Shares reacquired | | | | | |
| Class A | (280) | $(2,656) | | (2,259) | $(19,520) |
| Class C | (1) | (6) | | — | — |
| Class I | (5) | (43) | | — | — |
| | (286) | $(2,705) | | (2,259) | $(19,520) |
| Net change | | | | | |
| Class A | 45,407 | $414,648 | | 16,473 | $165,113 |
| Class C | 2,601 | 23,672 | | 6,034 | 58,864 |
| Class I | 6,599 | 58,569 | | 47,444 | 464,037 |
| Class R1 | 748 | 7,000 | | 5,000 | 50,000 |
| Class R2 | 749 | 7,022 | | 5,000 | 50,000 |
| Class R3 | 760 | 7,129 | | 5,000 | 50,000 |
| Class R4 | 664 | 6,233 | | 5,000 | 50,000 |
| Class R6 | 814 | 7,343 | | 175,000 | 1,750,000 |
| | 58,342 | $531,616 | | 264,951 | $2,638,014 |
| (c) | For the period from the commencement of the fund’s investment operations, February 8, 2022, through the stated period end. |
(6) Line of Credit
The fund and certain other funds managed by MFS participate in a $1.45 billion unsecured committed line of credit of which $1.2 billion is reserved for use by the fund and certain other MFS U.S. funds. The line of credit is provided by a syndicate of banks under a credit agreement. Borrowings may be made for temporary financing needs. Interest is charged to each fund, based on its borrowings, generally at a rate equal to the highest of 1) Daily Simple SOFR (Secured Overnight Financing Rate) plus 0.10%, 2) the Federal Funds Effective Rate, or 3) the Overnight Bank Funding Rate, each plus an agreed upon spread. A commitment fee, based on the average daily unused portion of the committed line of credit, is allocated among the participating funds. The line of credit expires on March 14, 2024 unless extended or renewed. In addition, the fund and other funds managed by MFS have established unsecured uncommitted borrowing arrangements with certain banks for temporary financing needs. Interest is charged to each fund, based on its borrowings, at rates equal to customary reference rates plus an agreed upon spread. For the six months ended January 31, 2023, the fund’s commitment fee and interest expense were $6 and $0, respectively, and are included in “Miscellaneous” expense in the Statement of Operations.
Notes to Financial Statements (unaudited) - continued
(7) Investments in Affiliated Issuers
An affiliated issuer may be considered one in which the fund owns 5% or more of the outstanding voting securities, or a company which is under common control. For the purposes of this report, the following were affiliated issuers:
| Affiliated Issuers | Beginning
Value | Purchases | Sales
Proceeds | Realized
Gain
(Loss) | Change in
Unrealized
Appreciation or
Depreciation | Ending
Value |
| MFS Institutional Money Market Portfolio | $104,008 | $617,799 | $604,841 | $(1) | $11 | $116,976 |
| Affiliated Issuers | Dividend
Income | Capital Gain
Distributions |
| MFS Institutional Money Market Portfolio | $1,273 | $— |
(8) LIBOR Transition
Certain of the fund's investments, including investments in certain debt instruments and derivatives (if any), as well as borrowings by the fund and certain other contractual arrangements of the fund, may be based on the London Interbank Offered Rate (“LIBOR”). In 2017, the regulatory authority that oversees financial services firms in the United Kingdom announced plans to transition away from LIBOR by the end of 2021. In March 2021, the administrator of LIBOR announced the extension of the publication of the more commonly used U.S. dollar LIBOR settings to the end of June 2023. Although the full impacts of the transition away from LIBOR are not fully known, the transition may result in, among other things, an increase in volatility or illiquidity of the markets for instruments that currently rely on LIBOR to determine interest rates and this could have an adverse impact on the fund's performance. With respect to the fund's accounting for investments, including investments in certain debt instruments and derivatives, as well as borrowings by the fund and any other contractual arrangements of the fund that undergo reference rate-related modifications as a result of the transition, management will rely upon the relief provided by FASB Codification Topic 848 – Reference Rate Reform (Topic 848). The guidance in Topic 848 permits the fund to account for those modified contracts as a continuation of the existing contracts. The situation remains fluid, and management believes, based on best available information, that the impact of the transition will not be material to the fund.
Proxy Voting Policies and Information
MFS votes proxies on behalf of the fund pursuant to proxy voting policies and procedures that are available without charge, upon request, by calling 1-800-225-2606, by visiting mfs.com/proxyvoting, or by visiting the SEC’s Web site at http://www.sec.gov.
Information regarding how the fund voted proxies relating to portfolio securities during the most recent twelve-month period ended June 30 is available by August 31 of each year without charge by visiting mfs.com/proxyvoting, or by visiting the SEC’s Web site at http://www.sec.gov.
Quarterly Portfolio Disclosure
The fund files a complete schedule of portfolio holdings with the SEC for the first and third quarters of each fiscal year as an exhibit to its reports on Form N-PORT. The fund's Form N-PORT reports are available on the SEC's Web site at http://www.sec.gov. A shareholder can obtain the portfolio holdings report for the first and third quarters of the fund's fiscal year at mfs.com/openendfunds by choosing the fund's name and then scrolling to the “Resources” section and clicking on the “Prospectus and Reports” tab.
Further Information
From time to time, MFS may post important information about the fund or the MFS Funds on the MFS Web site (mfs.com). This information is available at https://www.mfs.com/announcements or at mfs.com/openendfunds by choosing the fund’s name and then scrolling to the “Resources” section and clicking on the “Announcements” tab, if any.
Information About Fund Contracts and Legal Claims
The fund has entered into contractual arrangements with an investment adviser, administrator, distributor, shareholder servicing agent, and custodian who each provide services to the fund. Unless expressly stated otherwise, shareholders are not parties to, or intended beneficiaries of these contractual arrangements, and these contractual arrangements are not intended to create any shareholder right to enforce them against the service providers or to seek any remedy under them against the service providers, either directly or on behalf of the fund.
Under the Trust’s By-Laws and Declaration of Trust, any claims asserted against or on behalf of the MFS Funds, including claims against Trustees and Officers, must be brought in state and federal courts located within the Commonwealth of Massachusetts.
Provision of Financial Reports and Summary Prospectuses
The fund produces financial reports every six months and updates its summary prospectus and prospectus annually. To avoid sending duplicate copies of materials to households, only one copy of the fund’s annual and semiannual report and summary prospectus may be mailed to shareholders having the same last name and residential address on the fund’s records. However, any shareholder may contact MFSC (please see back cover for address and telephone number) to request that copies of these reports and summary prospectuses be sent personally to that shareholder.
Save paper with eDelivery.
MFS® will send you prospectuses, reports, and proxies directly via e-mail so you will get information faster with less mailbox clutter.
To sign up:
1. Go to mfs.com.
2. Log in via MFS® Access.
3. Select eDelivery.
If you own your MFS fund shares through a financial institution or a retirement plan, MFS® TALK, MFS® Access, or eDelivery may not be available to you.
CONTACT
WEB SITE
mfs.com
MFS TALK
1-800-637-8255
24 hours a day
ACCOUNT SERVICE AND LITERATURE
Shareholders
1-800-225-2606
Financial advisors
1-800-343-2829
Retirement plan services
1-800-637-1255
MAILING ADDRESS
MFS Service Center, Inc.
P.O. Box 219341
Kansas City, MO 64121-9341
OVERNIGHT MAIL
MFS Service Center, Inc.
Suite 219341
430 W 7th Street
Kansas City, MO 64105-1407
Item 1(b):
Not applicable.
ITEM 2. CODE OF ETHICS.
During the period covered by this report, the Registrant has not amended any provision in its Code of Ethics (the "Code") that relates to an element of the Code's definition enumerated in paragraph (b) of Item 2 of this Form N-CSR. During the period covered by this report, the Registrant did not grant a waiver, including an implicit waiver, from any provision of the Code.
ITEM 3. AUDIT COMMITTEE FINANCIAL EXPERT.
Not applicable for semi-annual reports.
ITEM 4. PRINCIPAL ACCOUNTANT FEES AND SERVICES.
Not applicable for semi-annual reports.
ITEM 5. AUDIT COMMITTEE OF LISTED REGISTRANTS.
Not applicable to the Registrant.
ITEM 6. INVESTMENTS
A schedule of investments for each series covered by this Form N-CSR is included as part of the report to shareholders of such series under Item 1(a) of this Form N-CSR.
ITEM 7. DISCLOSURE OF PROXY VOTING POLICIES AND PROCEDURES FOR CLOSED-END MANAGEMENT INVESTMENT COMPANIES.
Not applicable to the Registrant.
ITEM 8. PORTFOLIO MANAGERS OF CLOSED-END MANAGEMENT INVESTMENT COMPANIES.
Not applicable to the Registrant.
ITEM 9. PURCHASES OF EQUITY SECURITIES BY CLOSED-END MANAGEMENT INVESTMENT COMPANY AND AFFILIATED PURCHASERS.
Not applicable to the Registrant.
ITEM 10. SUBMISSION OF MATTERS TO A VOTE OF SECURITY HOLDERS.
There were no material changes to the procedures by which shareholders may send recommendations to the Board for nominees to the Registrant's Board since the Registrant last provided disclosure as to such procedures in response to the requirements of Item 407 (c)(2)(iv) of Regulation S-K or this Item.
ITEM 11. CONTROLS AND PROCEDURES.
(a)Based upon their evaluation of the effectiveness of the registrant's disclosure controls and procedures (as defined in Rule 30a-3(c) under the Investment Company Act of 1940 (the "Act")) as conducted within 90 days of the filing date of this report on Form N-CSR, the Registrant's principal financial officer and principal executive officer have concluded that those disclosure controls and procedures provide reasonable assurance that the material information required to be disclosed by the Registrant on this report is recorded, processed, summarized and reported within the time periods specified in the Securities and Exchange Commission's rules and forms.
(b)There were no changes in the Registrant's internal controls over financial reporting (as defined in Rule 30a-3(d) under the Act) that occurred during the period covered by the report that have materially affected, or are reasonably likely to materially affect, the Registrant's internal control over financial reporting.
ITEM 12. DISCLOSURE OF SECURITIES LENDING ACTIVITIES FOR CLOSED-END MANAGEMENT INVESTMENT COMPANIES.
Not applicable to the Registrant.
ITEM 13. EXHIBITS.
(a)(1) Any code of ethics, or amendment thereto, that is the subject of the disclosure required by Item 2, to the extent that the registrant intends to satisfy the Item 2 requirements through filing of an exhibit: Not applicable.
(2)A separate certification for each principal executive officer and principal financial officer of the registrant as required by Rule 30a-2(a) under the Act (17 CFR 270.30a-2): Attached hereto as EX-99.302CERT.
(3)Any written solicitation to purchase securities under Rule 23c-1 under the Act (17 CFR 270.23c-1) sent or given during the period covered by the report by or on behalf of the registrant to 10 or more persons. Not applicable.
(4)Change in the registrant's independent public accountant. Not applicable.
(b)If the report is filed under Section 13(a) or 15(d) of the Exchange Act, provide the certifications required by Rule 30a-2(b) under the Act (17 CFR 270.30a-2(b)), Rule 13a-14(b) or Rule 15d-14(b) under the Exchange Act (17 CFR 240.13a-14(b) or 240.15d-14(b)) and Section 1350 of Chapter 63 of Title 18 of the United States Code (18 U.S.C. 1350) as an exhibit. A certification furnished pursuant to this paragraph will not be deemed "filed" for the purposes of Section 18 of the Exchange Act (15 U.S.C. 78r), or otherwise subject to the liability of that section. Such certification will not be deemed to be incorporated by reference into any filing under the Securities Act of 1933 or the Exchange Act, except to the extent that the registrant specifically incorporates it by reference. Attached hereto as EX-99.906CERT.
Notice
A copy of the Amended and Restated Declaration of Trust, as amended, of the Registrant is on file with the Secretary of State of The Commonwealth of Massachusetts and notice is hereby given that this instrument is executed on behalf of the Registrant by an officer of the Registrant as an officer and not individually and the obligations of or arising out of this instrument are not binding upon any of the Trustees or shareholders individually, but are binding only upon the assets and property of the respective constituent series of the Registrant.
SIGNATURES
Pursuant to the requirements of the Securities Exchange Act of 1934 and the Investment Company Act of 1940, the registrant has duly caused this report to be signed on its behalf by the undersigned, thereunto duly authorized.
(Registrant) MFS SERIES TRUST VII
By (Signature and Title)*
/S/ DAVID L. DILORENZO
David L. DiLorenzo, President
Date: March 17, 2023
Pursuant to the requirements of the Securities Exchange Act of 1934 and the Investment Company Act of 1940, this report has been signed below by the following persons on behalf of the registrant and in the capacities and on the dates indicated.
By (Signature and Title)*
/S/ DAVID L. DILORENZO
David L. DiLorenzo, President (Principal Executive Officer)
Date: March 17, 2023
By (Signature and Title)*
/S/ JAMES O. YOST
James O. Yost, Treasurer (Principal Financial Officer and Accounting Officer) Date: March 17, 2023
* Print name and title of each signing officer under his or her signature.