Exhibit 99.1
Scotia Howard Weil 43rd Annual Energy Conference
March 24, 2015
Dick Alario
Chairman, President and Chief Executive Officer
+Safe Harbor
This presentation and related commentary may contain “forward-looking statements” within the meaning of the Private Securities Litigation Reform Act of 1995. Any statements as to matters that are not of historic fact are forward-looking statements. These forward-looking statements are based on Key’s current expectations, estimates and projections about Key, its industry, its management’s beliefs and certain assumptions made by management, and include statements regarding estimated capital expenditures, future operational and activity expectations, international growth, and anticipated financial performance for the first quarter and full-year 2015. No assurance can be given that such expectations, estimates or projections will prove to have been correct. Whenever possible, these “forward-looking statements” are identified by words such as “expects,”
“believes,” “anticipates” and similar phrases.
Readers and any audience are cautioned that any such forward-looking statements are not guarantees of future performance and are subject to certain risks, uncertainties and assumptions that are difficult to predict, including, but not limited to: risks that Key will be unable to achieve its financial, capital expenditure and operational projections, including quarterly and annual projections of revenue and/or operating income and risks that Key’s expectations regarding future activity levels, customer demand, and pricing stability may not materialize (whether for Key as a whole or for geographic regions and/or business segments individually); risks that fundamentals in the U.S. oil and gas markets may not yield anticipated future growth in Key’s businesses, or could further deteriorate or worsen from the recent market declines, and/or that Key could experience further unexpected declines in activity and demand for its rig service, fluid management service, coiled tubing service, and fishing and rental service businesses; risks relating to Key’s ability to implement technological developments and enhancements; risks relating to compliance with environmental, health and safety laws and regulations, as well as actions by governmental and regulatory authorities; risks that Key may not be able to refinance its credit facility as expected; risks that Key may not have sufficient liquidity; risks that Key may not be able to maintain its covenant compliance on its current credit facility or that it may not be able to obtain a waiver from its current lenders in the event of breach of a financial covenant; risks that fundamentals in the U.S. oil and gas markets could further deteriorate or worsen from the recent market declines, risks of as actions by governmental and regulatory authorities, including substantial fines and penalties; risks relating to compliance with the FCPA and anti-corruption laws, including risks related to increased costs in connection with FCPA investigations; risks regarding the timing or conclusion of the FCPA investigations and other risks affecting Key’s ability to maintain or improve operations; risks affecting Key’s international operations, including risks that Key may not be able to achieve its international growth and mobilization strategy in the foreign countries in which Key operates; risks that Key may be unable to achieve the benefits expected from acquisition and disposition transactions, and risks associated with integration of the acquired operations into Key’s operations; risks, in responding to changing or declining market conditions, that Key may not be able to reduce, and could even experience increases in, the costs of labor, fuel, equipment and supplies employed and used in Key’s businesses; risks relating to changes in the demand for or the price of oil and natural gas; risks that Key may not be able to execute its capital expenditure program and/or that any such capital expenditure investments, if made, will not generate adequate returns; and other risks affecting Key’s ability to maintain or improve operations, including its ability to maintain prices for services under market pricing pressures, weather risks, and the impact of potential increases in general and administrative expenses.
Because such statements involve risks and uncertainties, many of which are outside of Key’s control, Key’s actual results and performance may differ materially from the results expressed or implied by such forward-looking statements. Given these risks and uncertainties, readers are cautioned not to place undue reliance on such forward-looking statements. Other important risk factors that may affect Key’s business, results of operations and financial position are discussed in its most recently filed Annual Report on Form 10-K, recent Quarterly Reports on Form 10-Q, recent Current Reports on Form 8-K and in other Securities and Exchange Commission filings. Unless otherwise required by law, Key also disclaims any obligation to update its view of any such risks or uncertainties or to announce publicly the result of any revisions to the forward-looking statements made here. However, readers should review carefully reports and documents that Key files periodically with the Securities and Exchange Commission.
|
|
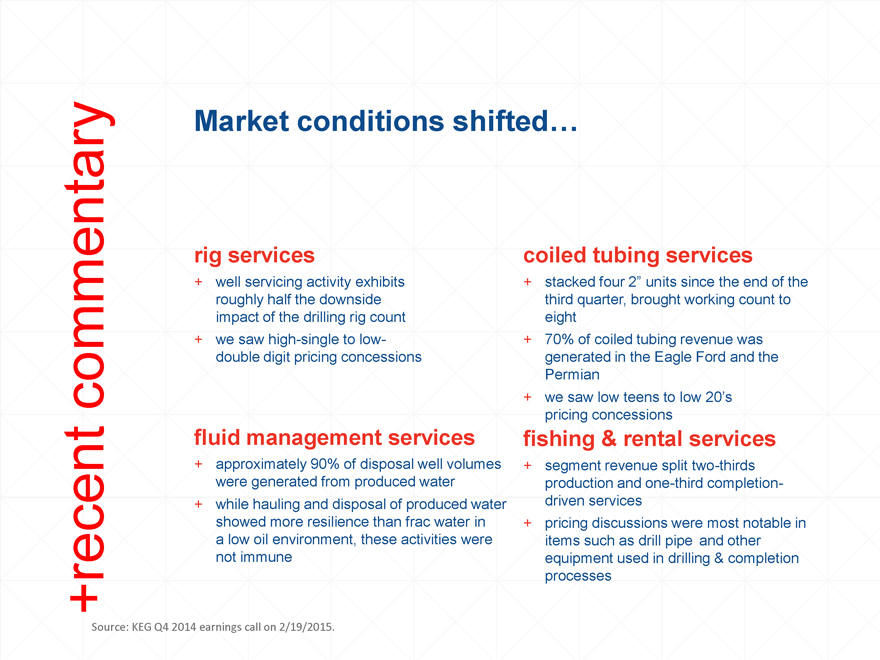
+recent commentary
Market conditions shifted…
rig services coiled tubing services
+ well servicing activity exhibits + stacked four 2” units since the end of the
roughly half the downside third quarter, brought working count to
impact of the drilling rig count eight
+ we saw high-single to low- + 70% of coiled tubing revenue was
double digit pricing concessions generated in the Eagle Ford and the
Permian
+ we saw low teens to low 20’s
pricing concessions
fluid management services fishing & rental services
+ approximately 90% of disposal well volumes + segment revenue split two-thirds
were generated from produced water production and one-third completion-
+ while hauling and disposal of produced water driven services
showed more resilience than frac water in + pricing discussions were most notable in
a low oil environment, these activities were items such as drill pipe and other
not immune equipment used in drilling & completion
processes
Source: KEG Q4 2014 earnings call on 2/19/2015.
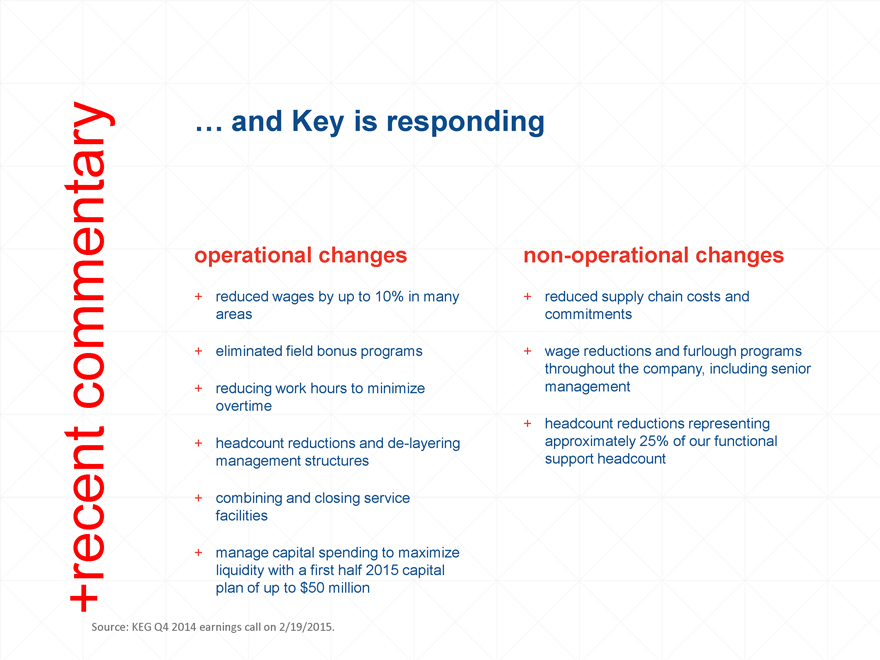
… and Key is responding
+recent commentary
operational changes non-operational changes
+ reduced wages by up to 10% in many + reduced supply chain costs and
areas commitments
+ eliminated field bonus programs + wage reductions and furlough programs
throughout the company, including senior
+ reducing work hours to minimize management
overtime
+ headcount reductions representing
+ headcount reductions and de-layering approximately 25% of our functional
management structures support headcount
+ combining and closing service
facilities
+ manage capital spending to maximize
liquidity with a first half 2015 capital
plan of up to $50 million
Source: KEG Q4 2014 earnings call on 2/19/2015.
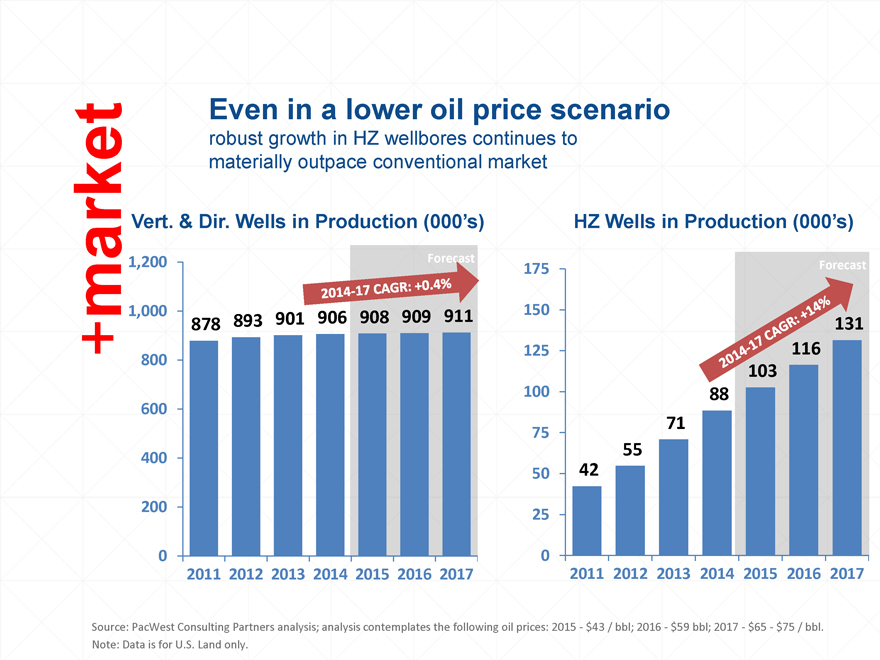
Even in a lower oil price scenario
robust growth in HZ wellbores continues to materially outpace conventional market
+market
Vert. & Dir. Wells in Production (000’s)
1,200 Forecast
1,000 878 893 901 906 908 909 911
800
600
400
200
0
2011 2012 2013 2014 2015 2016 2017
HZ Wells in Production (000’s)
175 Forecast
150
131
125 116
103
100 88
75 71
55
50 42
25
0
2011 2012 2013 2014 2015 2016 2017
Source: PacWest Consulting Partners analysis; analysis contemplates the following oil prices: 2015—$43 / bbl; 2016—$59 bbl; 2017—$65—$75 / bbl. Note: Data is for U.S. Land only.
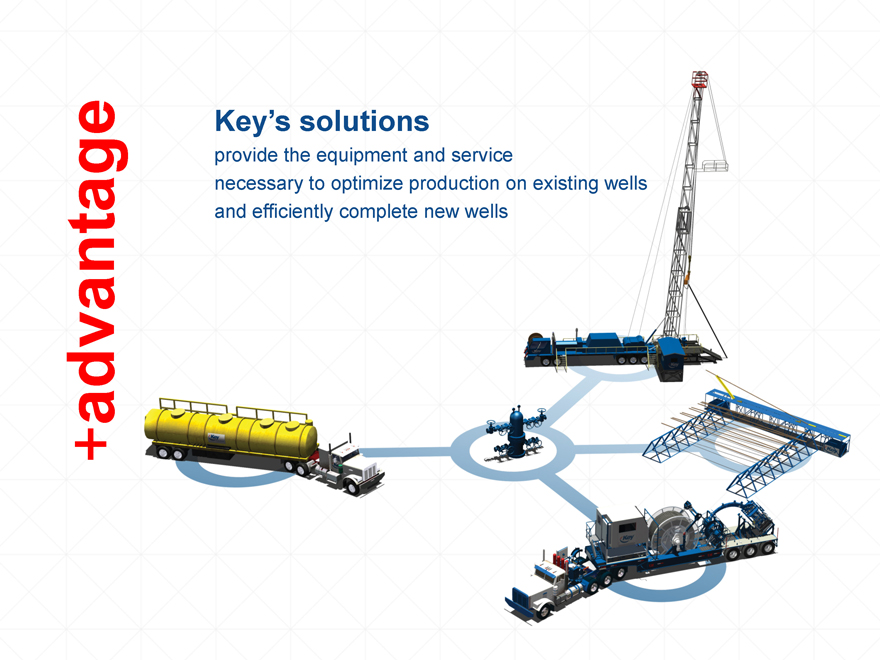
Key’s solutions
provide the equipment and service necessary to optimize production on existing wells and efficiently complete new wells
+advantage
+rig services
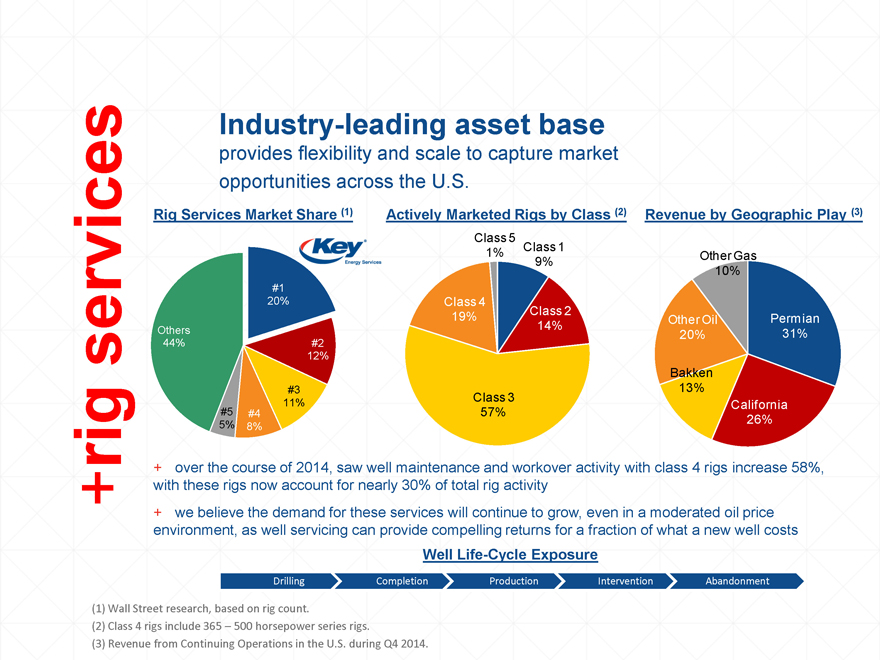
Industry-leading asset base
provides flexibility and scale to capture market opportunities across the U.S.
Rig Services Market Share (1) Actively Marketed Rigs by Class (2) Revenue by Geographic Play (3)
Class 5
Class 1
1% ?Other Gas
9%
10%
#1
20% Class 4
Class 2
19% ?Other Oil ?Permian
14%
Others 20% 31%
44% #2
12%
?Bakken
#3 13%
Class 3
11% ?California
#5 #4 57%
5% 8% 26%
+ over the course of 2014, saw well maintenance and workover activity with class 4 rigs increase 58%, with these rigs now account for nearly 30% of total rig activity + we believe the demand for these services will continue to grow, even in a moderated oil price environment, as well servicing can provide compelling returns for a fraction of what a new well costs
Well Life-Cycle Exposure
Drilling Completion Production Intervention Abandonment
(1) Wall Street research, based on rig count.
(2) Class 4 rigs include 365 – 500 horsepower series rigs.
(3) Revenue from Continuing Operations in the U.S. during Q4 2014.
+rig services
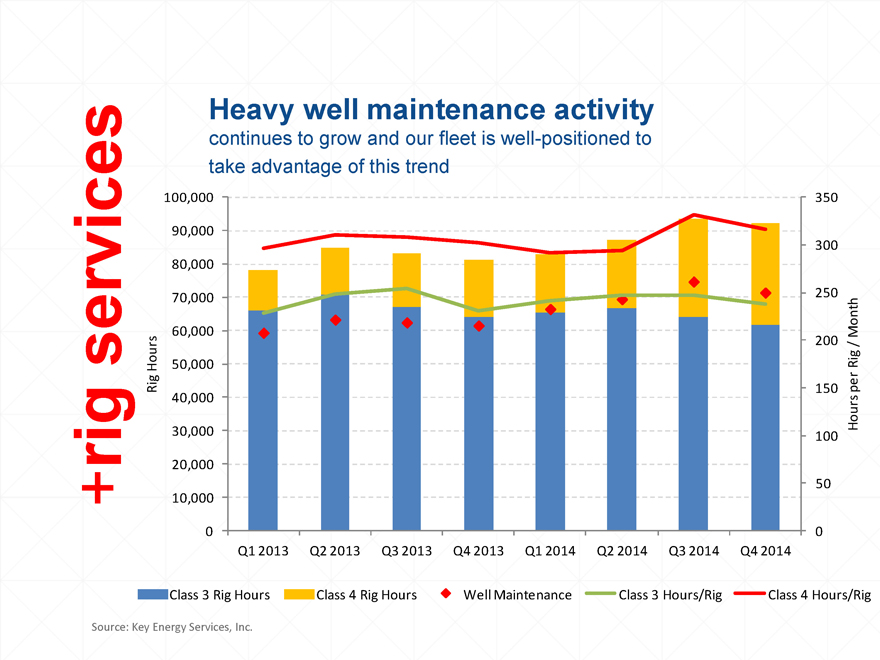
Heavy well maintenance activity
continues to grow and our fleet is well-positioned to
take advantage of this trend
100,000 350
90,000
300
80,000
70,000 250
h
t
60,000 Mon
s 200 /
Hour 50,000 Rig
Rig 150 per
40,000 s
r
u
o
30,000 100 H
20,000
50
10,000
0 0
Q1 2013 Q2 2013 Q3 2013 Q4 2013 Q1 2014 Q2 2014 Q3 2014 Q4 2014
Class 3 Rig Hours Class 4 Rig Hours Well Maintenance Class 3 Hours/Rig Class 4 Hours/Rig
Source: Key Energy Services, Inc.
+fluid management
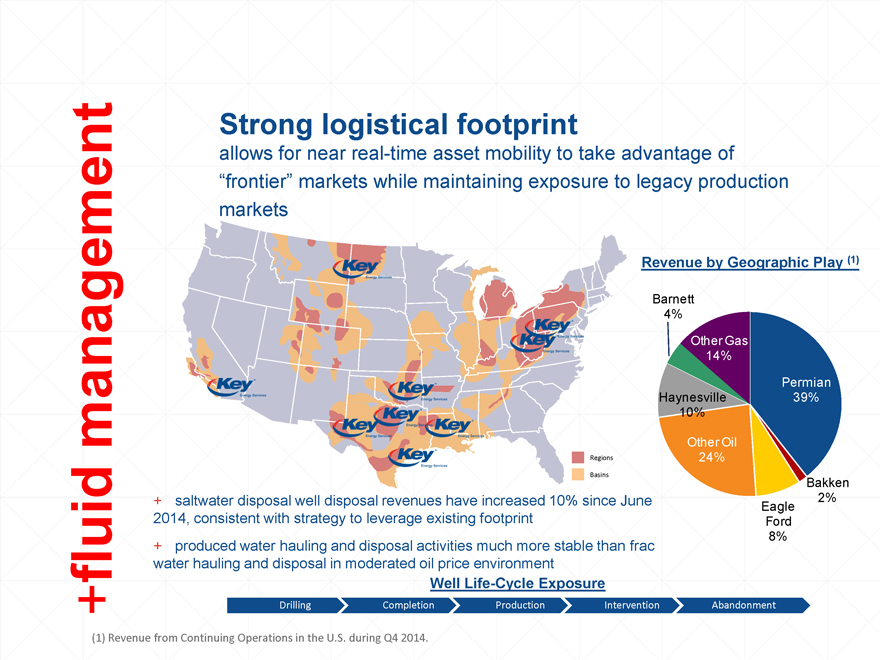
Strong logistical footprint
allows for near real-time asset mobility to take advantage of
“frontier” markets while maintaining exposure to legacy production markets
Revenue by Geographic Play (1)
?Barnett
4%
?Other Gas
14%
?Permian
?Haynesville 39%
10%
?Other Oil
24%
?Bakken
?Eagle 2%
Ford
8%
Regions
Basins
+ saltwater disposal well disposal revenues have increased 10% since June 2014, consistent with strategy to leverage existing footprint + produced water hauling and disposal activities much more stable than frac water hauling and disposal in moderated oil price environment
Well Life-Cycle Exposure
Drilling Completion Production Intervention Abandonment
(1) Revenue from Continuing Operations in the U.S. during Q4 2014.
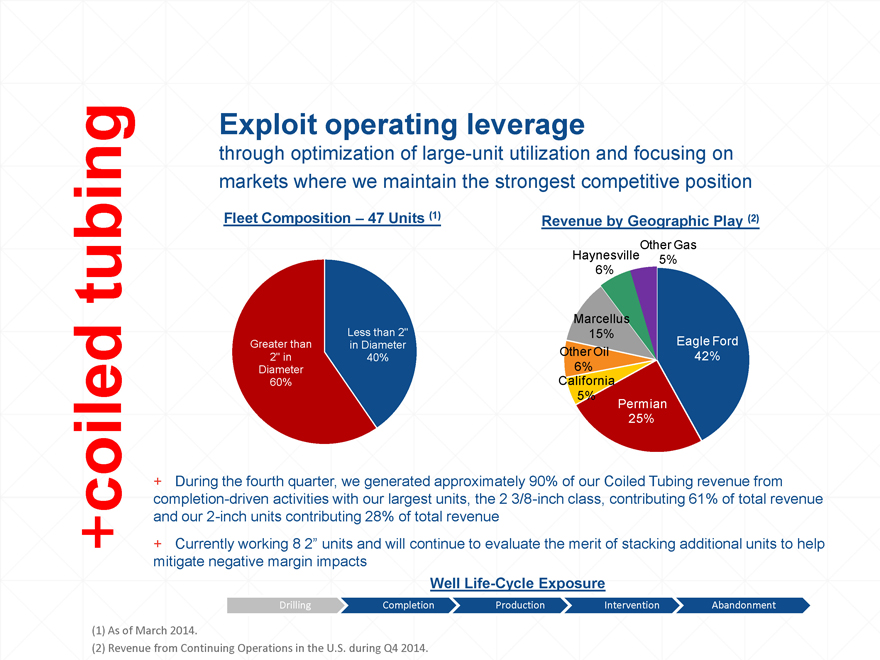
+coiled tubing
Exploit operating leverage
through optimization of large-unit utilization and focusing on markets where we maintain the strongest competitive position
Fleet Composition – 47 Units (1) Revenue by Geographic Play (2)
?Other Gas
?Haynesville 5%
6%
Marcellus
Less than 2” 15%
Greater than in Diameter ?Eagle Ford
2” in 40% ?Other Oil 42%
Diameter 6%
60% ?California
5% ?Permian
25%
+ During the fourth quarter, we generated approximately 90% of our Coiled Tubing revenue from completion-driven activities with our largest units, the 2 3/8-inch class, contributing 61% of total revenue and our 2-inch units contributing 28% of total revenue
+ Currently working 8 2” units and will continue to evaluate the merit of stacking additional units to help mitigate negative margin impacts
Well Life-Cycle Exposure
Drilling Completion Production Intervention Abandonment
(1) As of March 2014.
(2) Revenue from Continuing Operations in the U.S. during Q4 2014.
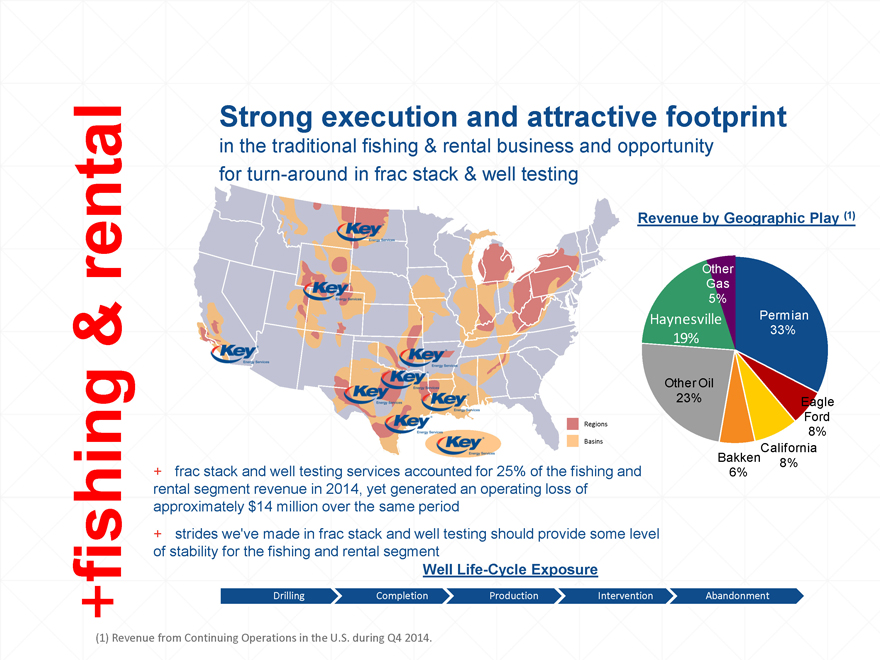
+fishing & rental
Strong execution and attractive footprint
in the traditional fishing & rental business and opportunity for turn-around in frac stack & well testing
Revenue by Geographic Play (1)
?Other
Gas
5%
?Haynesville ?Permian
19% 33%
?Other Oil
23% Eagle
Ford
8%
?Bakken ?California
6% 8%
Regions
Basins
+ frac stack and well testing services accounted for 25% of the fishing and rental segment revenue in 2014, yet generated an operating loss of approximately $14 million over the same period + strides we’ve made in frac stack and well testing should provide some level of stability for the fishing and rental segment
Well Life-Cycle Exposure
Drilling Completion Production Intervention Abandonment
(1) Revenue from Continuing Operations in the U.S. during Q4 2014.
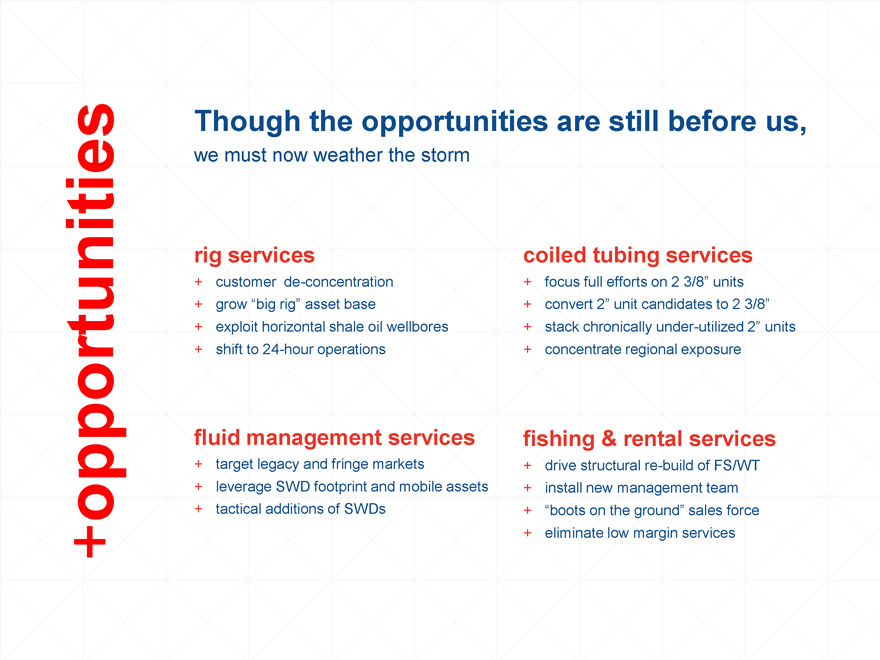
+opportunities
Though the opportunities are still before us,
we must now weather the storm
rig services
+ customer de-concentration
+ grow “big rig” asset base
+ exploit horizontal shale oil wellbores + shift to 24-hour operations
coiled tubing services
+ focus full efforts on 2 3/8” units + convert 2” unit candidates to 2 3/8”
+ stack chronically under-utilized 2” units + concentrate regional exposure
fluid management services fishing & rental services
+ target legacy and fringe markets + drive structural re-build of FS/WT
+ leverage SWD footprint and mobile assets + install new management team
+ tactical additions of SWDs + “boots on the ground” sales force
+ eliminate low margin services
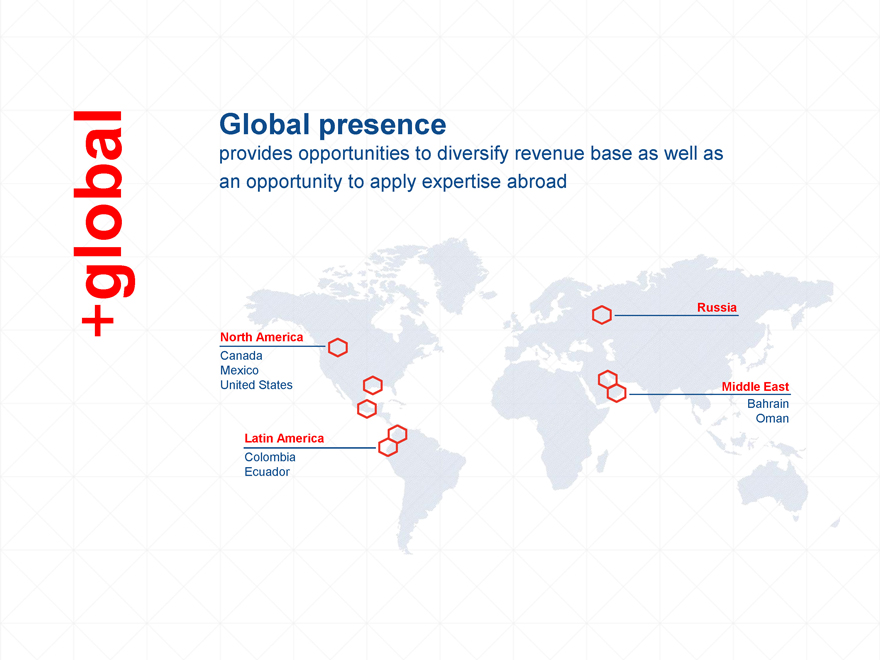
+global
Global presence
provides opportunities to diversify revenue base as well as an opportunity to apply expertise abroad
Russia
North America
Canada
Mexico
United States Middle East
Bahrain
Oman
Latin America
Colombia
Ecuador
+highlights
+ We are the global leader in onshore, rig-based well services
+ We have a strong reputation as a production-enhancement service provider
+ We are well-positioned to benefit from long-term secular trends
+ We have developed a differentiated asset base
+ We believe that our assets, differentiated technology and market position provide the leverage to deliver value to shareholders
Get More
WITH KEY ENERGY SERVICES