UNITED STATES
SECURITIES AND EXCHANGE COMMISSION
Washington, D.C. 20549
FORM N-CSR
CERTIFIED SHAREHOLDER REPORT OF REGISTERED MANAGEMENT INVESTMENT COMPANIES
Investment Company Act file number: 811-03091
Name of Fund: BlackRock Series Fund, Inc.
BlackRock Advantage Large Cap Core Portfolio (Formerly BlackRock Large Cap Core Portfolio)
BlackRock Balanced Capital Portfolio
BlackRock Capital Appreciation Portfolio
BlackRock Global Allocation Portfolio
BlackRock Government Money Market Portfolio
BlackRock High Yield Portfolio
BlackRock Total Return Portfolio
BlackRock U.S. Government Bond Portfolio
Fund Address: 100 Bellevue Parkway, Wilmington, DE 19809
Name and address of agent for service: John M. Perlowski, Chief Executive Officer, BlackRock Series Fund, Inc., 55 East 52nd Street, New York, NY 10055
Registrant’s telephone number, including area code: (800) 441-7762
Date of fiscal year end: 12/31/2017
Date of reporting period: 06/30/2017
Item 1 – Report to Stockholders
JUNE 30, 2017
| | | | |
SEMI-ANNUAL REPORT (UNAUDITED) | | | | BLACKROCK® |
BlackRock Series Fund, Inc.
▶ BlackRock Advantage Large Cap Core Portfolio
▶ BlackRock Balanced Capital Portfolio
▶ BlackRock Capital Appreciation Portfolio
▶ BlackRock Global Allocation Portfolio
▶ BlackRock Government Money Market Portfolio
▶ BlackRock High Yield Portfolio
▶ BlackRock Total Return Portfolio
▶ BlackRock U.S. Government Bond Portfolio
| | |
| Not FDIC Insured ◾ May Lose Value ◾ No Bank Guarantee | | |
| | | | |
| | | | Page | |
The Markets in Review | | | 3 | |
Semi-Annual Report: | | | | |
Fund Summaries | | | 4 | |
The Benefits and Risks of Leveraging | | | 22 | |
Disclosure of Expenses | | | 22 | |
Derivative Financial Instruments | | | 22 | |
Financial Statements: | | | | |
Schedules of Investments | | | 23 | |
Statements of Assets and Liabilities | | | 140 | |
Statements of Operations | | | 144 | |
Statements of Changes in Net Assets | | | 146 | |
Financial Highlights | | | 150 | |
Notes to Financial Statements | | | 158 | |
Disclosure of Investment Advisory Agreement | | | 181 | |
Officers and Directors | | | 186 | |
Additional Information | | | 187 | |
| | | | | | |
| 2 | | BLACKROCK SERIES FUND, INC. | | JUNE 30, 2017 | | |
Dear Shareholder,
In the 12 months ended June 30, 2017, risk assets, such as stocks and high-yield bonds, delivered strong performance. These markets showed great resilience during a period with big surprises, including the aftermath of the U.K.’s vote to leave the European Union and the outcome of the U.S. presidential election, which brought only brief spikes in equity market volatility. However, interest rates rose, which worked against high-quality assets with more interest rate sensitivity. Aside from the shortest-term Treasury bills, most U.S. Treasuries posted negative returns, as rising energy prices, modest wage increases and steady job growth led to expectations of higher inflation and anticipation of interest rate increases by the U.S. Federal Reserve (the “Fed”).
The global reflationary theme — rising nominal growth, wages and inflation — was the dominant driver of asset returns during the period, outweighing significant political upheavals and economic uncertainty. Reflationary expectations accelerated after the U.S. election in November 2016 and continued into the beginning of 2017, stoked by expectations that the new administration’s policies would provide an extra boost to U.S. growth.
The Fed has responded to these positive developments by increasing interest rates three times in the last six months, setting expectations for additional interest rate increases and moving toward normalizing monetary policy. For its part, the European Central Bank also began to signal its intent to wind down asset purchases and begin the long move toward policy normalization, contingent upon further improvement in economic growth.
In recent months, growing skepticism about the near-term likelihood of significant U.S. tax reform and infrastructure spending has tempered enthusiasm around the reflation trade. Similarly, renewed concern about oversupply has weighed on energy prices. Nonetheless, financial markets — and to an extent the Fed — have adopted a “wait-and-see” approach to the economic data and potential fiscal stimulus. Although uncertainty has persisted, benign credit conditions, modest inflation and the outlook for economic growth have kept markets relatively tranquil.
In the fifth edition of our Global Investor Pulse Survey, we heard from 28,000 individuals across 18 countries, including more than 4,000 respondents from the United States. While retirement remains the single most important issue for American investors, only a third of respondents feel confident that they will have enough retirement income, and nearly 40% of respondents have yet to begin saving for retirement. We encourage you to talk with your financial advisor and visit blackrock.com for further insight about investing in today’s markets.
Sincerely,

Rob Kapito
President, BlackRock Advisors, LLC

Rob Kapito
President, BlackRock Advisors, LLC
| | | | | | | | |
| Total Returns as of June 30, 2017 | |
| | | 6-month | | | 12-month | |
U.S. large cap equities
(S&P 500® Index) | | | 9.34 | % | | | 17.90 | % |
U.S. small cap equities
(Russell 2000® Index) | | | 4.99 | | | | 24.60 | |
International equities
(MSCI Europe, Australasia, Far East Index) | | | 13.81 | | | | 20.27 | |
Emerging market equities
(MSCI Emerging Markets Index) | | | 18.43 | | | | 23.75 | |
3-month Treasury bill
(BofA Merrill Lynch
3-Month U.S. Treasury
Bill Index) | | | 0.31 | | | | 0.49 | |
U.S. Treasury securities
(BofA Merrill Lynch 10- Year U.S. Treasury Index) | | | 2.08 | | | | (5.58 | ) |
U.S. investment grade bonds
(Bloomberg Barclays U.S. Aggregate Bond Index) | | | 2.27 | | | | (0.31 | ) |
Tax-exempt municipal
bonds (S&P Municipal Bond Index) | | | 3.26 | | | | (0.28 | ) |
U.S. high yield bonds
(Bloomberg Barclays U.S. Corporate High Yield 2% Issuer Capped Index) | | | 4.92 | | | | 12.69 | |
|
| Past performance is no guarantee of future results. Index performance is shown for illustrative purposes only. You cannot invest directly in an index. | |
| | | | | | |
| | | THIS PAGE NOT PART OF YOUR FUND REPORT | | | | 3 |
| | | | |
| Fund Summary as of June 30, 2017 | | | BlackRock Advantage Large Cap Core Portfolio | |
BlackRock Advantage Large Cap Core Portfolio’s (the “Fund”) investment objective is to seek long-term capital appreciation.
On March 27, 2017, the Fund’s Board approved a proposal to change the name of BlackRock Large Cap Core Portfolio to BlackRock Advantage Large Cap Core Portfolio. The Board also approved certain changes to the Fund’s investment objective and investment strategies. These changes were effective on June 12, 2017.
|
| Portfolio Management Commentary |
How did the Fund perform?
| • | | For the six-month period ended June 30, 2017, the Fund outperformed its benchmark, the Russell 1000® Index. |
What factors influenced performance?
| • | | In sector terms, information technology (“IT”) was the prime contributor to relative performance due to strength among semiconductor and software holdings. Consumer discretionary also aided results, in particular media, household durables and hotels, restaurants & leisure. Selection in materials and underweight exposure to telecommunication services benefited as well. The main detractors from performance were health care and financials. Pharmaceutical and biotechnology weakness weighed in health care, while banks and capital markets were a drag in financials. |
| • | | On a stock-specific basis, IT holdings Lam Research Corp. and Activision Blizzard Inc. were the top individual contributors. Lam performed very well on the back of strong execution and growing demand for its products, driven by the build-out of 3D NAND capacity, for which the company is a key supplier. The valuation remained reasonable, reflecting ongoing concerns that this may be the peak of the cycle, resulting in strong stock performance while the fundamentals continued to improve. Activision outperformed amid consistently strong earnings results, allaying investor worries earlier in the period about weak Call of Duty sales. Investor excitement continued to grow around the company’s new content like Overwatch and Destiny 2, and the secular shifts in the industry such as the movement to digital monetization and eSports. |
| • | | Cruise operator Carnival Corp. also added value. Carnival outperformed early in the period after a report from competitor Royal Caribbean confirmed strengthening demand in both the Caribbean and Mediterranean markets. Later, the company delivered strong earnings results, which |
| | indicated ongoing favorable supply/demand dynamics in all of the developed cruise markets, leading to continued improvement in pricing power. Elsewhere, an underweight to poor-performing Exxon Mobil Corp. proved advantageous. |
| • | | Conversely, financial holdings JPMorgan Chase & Co. and Goldman Sachs Group Inc. detracted from relative results. JPMorgan underperformed as the yield curve flattened and optimism around the Trump administration’s pro-growth policy initiatives weakened, reflecting the current uncertain environment in Washington DC. Goldman underperformed after the company reported an uncharacteristically weak quarter reflecting poor performance in its core FICC (fixed income, currencies and commodities) trading business. |
| • | | Underweights to Amazon.com Inc. and Facebook Inc., two of the so-called “FANG” stocks, also weighed as both posted gains of more than 25% for the first half of the year. |
Describe recent portfolio activity.
| • | | During the six-month period, the Fund’s exposure to the industrials and real estate sectors materially increased, particularly within machinery, industrial conglomerates and equity real estate investment trusts. Exposure to utilities increased as well. The largest reductions were in IT and financials, largely with respect to communications equipment and banks. Energy exposure also declined. |
Describe portfolio positioning at period end.
| • | | Relative to the Russell 1000® Index, the Fund ended the period with its largest sector overweight in consumer discretionary, followed by materials and industrials. The most notable underweights were financials, energy and consumer staples. That said, the Fund remained diversified across stock selection insights. |
The views expressed reflect the opinions of BlackRock as of the date of this report and are subject to change based on changes in market, economic or other conditions. These views are not intended to be a forecast of future events and are no guarantee of future results.
| | | | | | |
| 4 | | BLACKROCK SERIES FUND, INC. | | JUNE 30, 2017 | | |
| | |
| | | BlackRock Advantage Large Cap Core Portfolio |
| | | | | |
| Sector Allocation | | Percent of
Net Assets |
Information Technology | | | | 22 | % |
Health Care | | | | 14 | |
Financials | | | | 14 | |
Consumer Discretionary | | | | 13 | |
Industrials | | | | 11 | |
Consumer Staples | | | | 8 | |
Energy | | | | 5 | |
Materials | | | | 4 | |
Real Estate | | | | 3 | |
Utilities | | | | 3 | |
Telecommunication Services | | | | 2 | |
Short-Term Securities | | | | 8 | |
Liabilities in Excess of Other Assets | | | | (7 | ) |
For Fund compliance purposes, the Fund’s sector classifications refer to one or more of the sector sub-classifications used by one or more widely recognized market indexes or ratings group indexes, and/or as defined by the investment adviser. These definitions may not apply for purposes of this report, which may combine sector sub classifications for reporting ease.
| | | | | | |
| | | BLACKROCK SERIES FUND, INC. | | JUNE 30, 2017 | | 5 |
| | | | |
| | | | BlackRock Advantage Large Cap Core Portfolio | |
|
| Total Return Based on a $10,000 Investment |
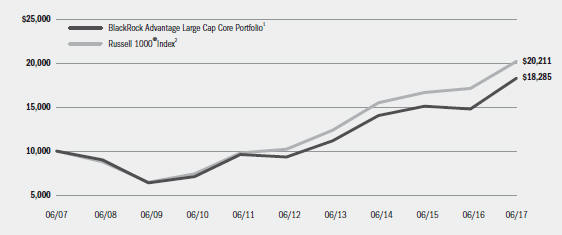
| | 1 | | Assuming transaction costs and other operating expenses, including investment advisory fees, if any. Does not include insurance-related fees and expenses. Under normal circumstances, the Fund invests at least 80% of its net assets, plus the amount of any borrowings for investment purposes, in large cap equity securities and derivatives that have similar economic characteristics to such securities. The Fund’s total returns prior to June 12, 2017 are the returns of the Fund when it followed different investment strategies under the name BlackRock Large Cap Core Portfolio. |
| | 2 | | The index measures the performance of the large cap segment of the U.S. equity universe. It is a subset of the Russell 3000® Index and includes approximately 1,000 of the largest securities based on a combination of their market capitalization and current index membership. The index represents approximately 92% of the total market capitalization of the Russell 3000® Index. |
|
| Performance Summary for the Period Ended June 30, 2017 |
| | | | | | | | | | | | | | | | | | | | |
| | | | | Average Annual Total Returns1,3 |
| | | 6-Month
Total Returns1,3 | | 1 Year | | 5 Years | | 10 Years |
BlackRock Advantage Large Cap Core Portfolio | | | | 9.54 | % | | | | 23.67 | % | | | | 14.45 | % | | | | 6.22 | % |
Russell 1000® Index | | | | 9.27 | | | | | 18.03 | | | | | 14.67 | | | | | 7.29 | |
| | 3 | | Cumulative and average annual total returns are based on changes in net asset value for the periods shown and assume reinvestment of all distributions at net asset value on the ex-dividend date. Insurance-related fees and expenses are not reflected in these returns. |
| | | | Past performance is not indicative of future results. Performance results do not reflect the deduction of taxes that a shareholder would pay on Fund distributions or the redemption of Fund shares. |
| | | | Performance results may include adjustments made for financial reporting purposes in accordance with U.S. generally accepted accounting principles. |
| | | | | | | | | | | | | | | | | | | | | | | | | | | | | | | | | | | |
| | | Actual | | Hypothetical5 | | |
| | | Beginning
Account Value
January 1, 2017 | | Ending
Account Value
June 30, 2017 | | Expenses Paid During
the Period4 | | Beginning
Account Value
January 1, 2017 | | Ending
Account Value
June 30, 2017 | | Expenses Paid During
the Period4 | | Annualized
Expense
Ratio |
BlackRock Advantage Large Cap Core Portfolio | | | | $1,000.00 | | | | | $1,095.40 | | | | | $2.60 | | | | | $1,000.00 | | | | | $1,022.32 | | | | | $2.51 | | | | | 0.50 | % |
| | 4 | | Expenses are equal to the annualized expense ratio, multiplied by the average account value over the period, multiplied by 181/365 (to reflect the one-half year period shown). |
| | 5 | | Hypothetical 5% annual return before expenses is calculated by prorating the number of days in the most recent fiscal half year divided by 365. |
| | | | See “Disclosure of Expenses” on page 22 for further information on how expenses were calculated. |
| | | | | | |
| 6 | | BLACKROCK SERIES FUND, INC. | | JUNE 30, 2017 | | |
| | | | |
| Fund Summary as of June 30, 2017 | | | BlackRock Balanced Capital Portfolio | |
BlackRock Balanced Capital Portfolio’s (the “Fund”) investment objective is to seek high total investment return.
|
| Portfolio Management Commentary |
How did the Fund perform?
| • | | For the six-month period ended June 30, 2017, the Fund returned 6.94%, outperforming its blended benchmark (60% Russell 1000® Index/40% Bloomberg Barclays U.S. Aggregate Bond Index), which returned 6.44% for the period. The Russell 1000® Index advanced 9.27%, while the Bloomberg Barclays U.S. Aggregate Bond Index returned 2.27%. |
What factors influenced performance?
| • | | Within equities, exposure to international developed markets contributed as both European and Japanese stocks posted solid gains. In terms of sector positioning within U.S. equities, an allocation to information technology was a significant positive contributor. Currency views provided an additional tailwind to returns, as a more upbeat tone to communication from the European Central Bank pushed the euro higher against the U.S. dollar. In terms of fixed income holdings, high-yield corporate and nonagency mortgage-backed securities supported returns, while an overweight to emerging markets debt was also additive given weakness in the U.S. dollar. |
| • | | From a broad asset allocation perspective, an underweight to U.S. equities weighed on performance as the combination of strong economic activity and loose financial conditions supported domestic stocks. Within U.S. equities, exposure to financials detracted from performance as a waning in investor optimism around reflation and lower U.S. bond yields led the sector to underperform. Within fixed income, the Fund’s stance with respect to duration (and corresponding interest rate sensitivity) and curve positioning weighed on returns. |
Describe recent portfolio activity.
| • | | The Fund began 2017 with a preference for equities relative to fixed income, and retained this positioning throughout the period given ongoing strength in the global growth backdrop, with notable improvement in Europe and Japan. Given these trends, the Fund entered 2017 with an active tilt to international developed stocks relative to domestic stocks. This was based on continued signs that the Federal Reserve System was set to continue to raise policy rates, while activity in Europe and Japan remained solid in the context of persistently loose monetary policy. In terms of currency positioning, the Fund held an overweight position in the euro relative to the U.S. dollar given a view that the market’s pricing of monetary policy divergence had become too stretched. The Fund took profits and reduced the magnitude of this position toward the end of the period. |
| • | | At period end, the Fund’s cash position was slightly above 5%. The Fund’s cash position did not have a material impact on results for the six-month period. |
Describe portfolio positioning at period end.
| • | | Relative to the blended benchmark, the Fund ended the period overweight in equities relative to fixed income. The Fund held out-of-benchmark exposure to international equities, with a tilt toward Japan. Relative to the Russell 1000® Index, the Fund’s U.S. equity allocation was overweight in the consumer discretionary and industrial sectors, and was underweight in the real estate and energy sectors. The Fund held a slightly underweight position in fixed income along with a modest overweight position in the euro against the U.S. dollar. |
The views expressed reflect the opinions of BlackRock as of the date of this report and are subject to change based on changes in market, economic or other conditions. These views are not intended to be a forecast of future events and are no guarantee of future results.
| | |
| Portfolio Composition | | Percent of
Total Investments1 |
Common Stocks | | 59% |
U.S. Government Sponsored Agency Securities | | 14 |
Corporate Bonds | | 9 |
U.S. Treasury Obligations | | 5 |
Asset-Backed Securities | | 4 |
Investment Companies | | 4 |
Non-Agency Mortgage-Backed Securities | | 2 |
Taxable Municipal Bonds | | 2 |
Foreign Government Obligations | | 1 |
Other2 | | — |
| | 1 | | Total Investments exclude short-term securities, options purchased, borrowed bonds, options written and TBA sale commitments. |
| | 2 | | Includes foreign agency obligations, other interests and preferred securities, all of which are less than 1%. |
| | | | | | |
| | | BLACKROCK SERIES FUND, INC. | | JUNE 30, 2017 | | 7 |
| | |
| | | BlackRock Balanced Capital Portfolio |
|
Total Return Based on a $10,000 Investment |
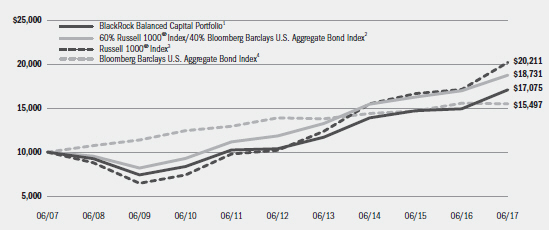
| | 1 | Assuming transaction costs and other operating expenses, including investment advisory fees, if any. Does not include insurance-related fees and expenses. The Fund invests in U.S. and foreign equity and fixed income securities of any maturity. |
| | 2 | The Fund compares its performance to that of a customized weighted index comprised of the returns of the Russell 1000® Index (60%) and Bloomberg Barclays U.S. Aggregate Bond Index (40%). |
| | 3 | The index measures the performance of the large cap segment of the U.S. equity universe. It is a subset of the Russell 3000® Index and includes approximately 1,000 of the largest securities based on a combination of their market capitalization and current index membership. The index represents approximately 92% of the total market capitalization of the Russell 3000® Index. |
| | 4 | A widely recognized unmanaged market-weighted index comprised of investment-grade corporate bonds rated BBB or better, mortgages and U.S. Treasury and U.S. Government agency issues with at least one year to maturity. |
|
Performance Summary for the Period Ended June 30, 2017 |
| | | | | | | | |
| | | | | Average Annual Total Returns5 |
| | | 6-Month
Total Returns5 | | 1 Year | | 5 Years | | 10 Years |
BlackRock Balanced Capital Portfolio | | 6.94% | | 14.54% | | 10.48% | | 5.50% |
60% Russell 1000® Index/40% Bloomberg Barclays U.S. Aggregate Bond Index | | 6.44 | | 10.41 | | 9.66 | | 6.48 |
Russell 1000® Index | | 9.27 | | 18.03 | | 14.67 | | 7.29 |
Bloomberg Barclays U.S. Aggregate Bond Index | | 2.27 | | (0.31) | | 2.21 | | 4.48 |
| | 5 | | Cumulative and average annual total returns are based on changes in net asset value for the periods shown and assume reinvestment of all distributions at net asset value on the ex-dividend date. Insurance-related fees and expenses are not reflected in these returns. |
| | | Past performance is not indicative of future results. Performance results do not reflect the deduction of taxes that a shareholder would pay on Fund distributions or the redemption of Fund shares. |
| | | Performance results may include adjustments made for financial reporting purposes in accordance with U.S. generally accepted accounting principles. |
| | | | | | | | | | | | | | | | | | |
| | | Actual | | Hypothetical8 |
| | | | | | | Including
Interest Expense | | Excluding
Interest Expense | | | | Including
Interest Expense | | Excluding
Interest Expense |
| | | Beginning
Account Value
January 1,
2017 | | Ending
Account Value
June 30,
2017 | | Expenses Paid During the Period6 | | Expenses Paid During the Period7 | | Beginning
Account Value
January 1, 2017 | | Ending
Account Value
June 30, 2017 | | Expenses Paid During the Period6 | | Ending
Account Value
June 30, 2017 | | Expenses Paid During the Period7 |
BlackRock Balanced Capital Portfolio | | $1,000.00 | | $1,069.40 | | $2.62 | | $2.51 | | $1,000.00 | | $1,022.27 | | $2.56 | | $1,022.36 | | $2.46 |
| | 6 | | Expenses are equal to the annualized expense ratio (0.51%), multiplied by the average account value over the period, multiplied by 181/365 (to reflect the one-half year period shown). |
| | 7 | | Expenses are equal to the annualized expense ratio (0.49%), multiplied by the average account value over the period, multiplied by 181/365 (to reflect the one-half year period shown). |
| | 8 | | Hypothetical 5% annual return before expenses is calculated by prorating the number of days in the most recent fiscal half year divided by 365. |
See “Disclosure of Expenses” on page 22 for further information on how expenses were calculated.
| | | | | | |
| 8 | | BLACKROCK SERIES FUND, INC. | | JUNE 30, 2017 | | |
| | | | |
| Fund Summary as of June 30, 2017 | | | BlackRock Capital Appreciation Portfolio | |
BlackRock Capital Appreciation Portfolio’s (the “Fund”) investment objective is to seek long term growth of capital.
|
Portfolio Management Commentary |
How did the Fund perform?
| • | | For the six-month period ended June 30, 2017, the Fund returned 17.61%, outperforming its benchmark, the Russell 1000® Growth Index, which returned 13.99%, and the broad-market S&P 500® Index, which returned 9.34%. The following discussion of relative performance pertains to the Russell 1000® Growth Index. |
What factors influenced performance?
| • | | In sector terms, information technology (“IT”) was the largest contributor to relative performance, led by internet software & services holdings. The consumer sectors also aided results. Internet & direct marketing retail names, positioning within specialty retail and lack of exposure to media companies benefited in consumer discretionary, while beverages and an underweight to food & staples retailing added in consumer staples. Conversely, health care was a prime detractor from returns due to weakness in biotechnology. Financials also weighed on performance, in particular bank and diversified financial services holdings. |
| • | | In stock specifics, the top individual contributor was Tencent Holdings Ltd. Tencent continues to outperform as its revenue growth accelerates, proving the investment adviser’s thesis of growing monetization of the company’s dominant WeChat communication platform. |
| • | | Positions in Activision Blizzard Inc. and Amazon.com Inc. also added value. Activision shares gained following strong earnings performance and increased investor confidence in video game secular growth. Amazon outperformed as continued underperformance among traditional retailers focused investors on its share gain opportunities. In addition, the company’s advertising opportunity has come to the fore. |
| • | | The largest individual detractor was Alexion Pharmaceuticals Inc. Early in the period, Alexion underperformed despite reporting fourth-quarter 2016 earn- |
| | | ings and 2017 guidance that was in line with expectations. Later, the company disclosed that its regional office in Brazil is being investigated for alleged sales irregularities pertaining to its flagship product Soliris. While Soliris sales in Brazil account for less than 5% of overall revenue, the news heightened investor concerns over the company’s sales practices and management’s control of its operations. The company then also announced the departure of its interim Chief Financial Officer, head of R&D and head of Human Resources. While not entirely surprising, the departures further contributed to negative sentiment. |
| • | | Elsewhere, the position in Acuity Brands Inc. was a drag. The LED-lighting leader underperformed after reporting weaker than expected results in its fiscal 2017 first and second quarters due to an industry slowing in short-cycle business. While management does not expect the business to rebound substantially until 2018, its fiscal third quarter (reported in late June) showed improvement and Acuity beat consensus expectations on both top line and margin. An underweight to Apple Inc. also weighed on returns. Despite first-half strength, the investment adviser maintains its underweight. |
Describe recent portfolio activity.
| • | | Due to a combination of portfolio trading activity and market movement during the six-month period, the portfolio’s weighting in IT substantially increased, particularly within software and internet software & services. Health care and real estate exposures also increased. Exposure to financials and industrials decreased, largely with respect to diversified financial services, banks and airlines. Energy saw declines as well. |
Describe portfolio positioning at period end.
| • | | As of period end, the Fund’s largest sector overweight relative to the Russell 1000® Growth Index was IT, followed by financials and health care. Industrials and consumer staples were the largest portfolio underweights. |
The views expressed reflect the opinions of BlackRock as of the date of this report and are subject to change based on changes in market, economic or other conditions. These views are not intended to be a forecast of future events and are no guarantee of future results.
| | | | | | |
| | | BLACKROCK SERIES FUND, INC. | | JUNE 30, 2017 | | 9 |
| | | | |
| | | | BlackRock Capital Appreciation Portfolio | |
| | |
| Sector Allocation | | Percent of
Net Assets |
| | | | |
Information Technology | | | 42 | % |
Consumer Discretionary | | | 20 | |
Health Care | | | 16 | |
Financials | | | 7 | |
Industrials | | | 6 | |
Consumer Staples | | | 4 | |
Materials | | | 2 | |
Real Estate | | | 2 | |
Energy | | | 1 | |
Short-Term Securities | | | 6 | |
Liabilities in Excess of Other Assets | | | (6 | ) |
For Fund compliance purposes, the Fund’s sector classifications refer to one or more of the sector sub-classifications used by one or more widely recognized market indexes or ratings group indexes, and/or as defined by the investment adviser. These definitions may not apply for purposes of this report, which may combine sector sub classifications for reporting ease.
| | | | | | |
| 10 | | BLACKROCK SERIES FUND, INC. | | JUNE 30, 2017 | | |
| | | | |
| | | | BlackRock Capital Appreciation Portfolio | |
|
| Total Return Based on a $10,000 Investment |
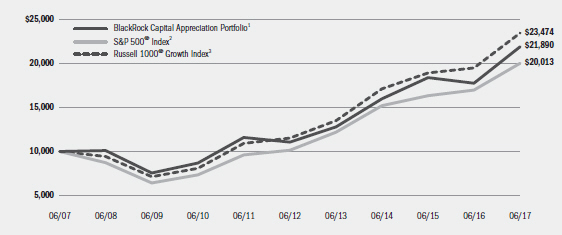
| | 1 | | Assuming transaction costs and other operating expenses, including investment advisory fees, if any. Does not include insurance-related fees and expenses. The Fund invests primarily in a diversified portfolio consisting primarily of common stock of U.S. companies that the investment advisor believes have exhibited above-average growth rates in earnings over the long term. |
| | 2 | | This unmanaged index covers 500 leading companies and captures approximately 80% coverage of available market capitalization. |
| | 3 | | This unmanaged index measures the performance of the large cap growth segment of the U.S. equity universe and consists of those Russell 1000® securities with higher price-to-book ratios and higher forecasted growth values. |
| | | | | | | | |
| Performance Summary for the Period Ended June 30, 2017 |
| | | | | | | | | | | | | | | | | | | | |
| | | | | Average Annual Total Returns4 |
| | | 6-Month Total Returns4 | | 1 Year | | 5 Years | | 10 Years |
BlackRock Capital Appreciation Portfolio | | | | 17.61 | % | | | | 23.21 | % | | | | 14.63 | % | | | | 8.15 | % |
S&P 500® Index | | | | 9.34 | | | | | 17.90 | | | | | 14.63 | | | | | 7.18 | |
Russell 1000® Growth Index | | | | 13.99 | | | | | 20.42 | | | | | 15.30 | | | | | 8.91 | |
| | 4 | | Cumulative and average annual total returns are based on changes in net asset value for the periods shown and assume reinvestment of all distributions at net asset value on the ex-dividend date. Insurance-related fees and expenses are not reflected in these returns. |
| | | | Past performance is not indicative of future results. Performance results do not reflect the deduction of taxes that a shareholder would pay on Fund distributions or the redemption of Fund shares. |
| | | | Performance results may include adjustments made for financial reporting purposes in accordance with U.S. generally accepted accounting principles. |
| | | | | | | | | | | | | | |
| Expense Example |
| | | Actual | | Hypothetical6 | | |
| | | Beginning
Account Value
January 1, 2017 | | Ending
Account Value
June 30, 2017 | | Expenses Paid
During the Period5 | | Beginning
Account Value
January 1, 2017 | | Ending
Account Value
June 30, 2017 | | Expenses Paid
During the Period5 | | Annualized
Expense
Ratio |
BlackRock Capital Appreciation Portfolio | | $1,000.00 | | $1,176.10 | | $2.81 | | $1,000.00 | | $1,022.22 | | $2.61 | | 0.52% |
| | 5 | | Expenses are equal to the annualized net expense ratio, multiplied by the average account value over the period, multiplied by 181/365 (to reflect the one-half year period shown). |
| | 6 | | Hypothetical 5% annual return before expenses is calculated by prorating the number of days in the most recent fiscal half year divided by 365. |
| | | | See “Disclosure of Expenses” on page 22 for further information on how expenses were calculated. |
| | | | | | |
| | | BLACKROCK SERIES FUND, INC. | | JUNE 30, 2017 | | 11 |
| | | | |
| Fund Summary as of June 30, 2017 | | | BlackRock Global Allocation Portfolio | |
BlackRock Global Allocation Portfolio’s (the “Fund”) investment objective is to seek high total investment return.
|
| Portfolio Management Commentary |
How did the Fund perform?
| • | | For the six-month period ended June 30, 2017, the Fund underperformed both its Reference Benchmark and the broad based all-equity benchmark, the FTSE World Index. The Reference Benchmark is comprised as follows: 36% S&P 500® Index; 24% FTSE World (ex-U.S.) Index; 24% BofA Merrill Lynch Current 5-Year U.S. Treasury Index; and 16% Citigroup Non-US Dollar World Government Bond Index. The Fund invests in both equities and bonds, and therefore, the Reference Benchmark provides a more accurate representation of the Fund’s composition and is a more comparable means for measurement. The following discussion of relative performance pertains to the Reference Benchmark. The following commentary (and referenced allocation percentages) are based on the economic exposures of the Fund, which reflect adjustments for futures, swaps and options (except with respect to fixed income securities), and convertible bonds, and may vary relative to the market value. |
What factors influenced performance?
| • | | Within equities, an overweight to Japan detracted from performance. From a sector perspective, stock selection in financials weighed on returns. An overweight in energy also detracted, although this was partially offset by stock selection within the sector. Stock selection in telecommunication services (“telecom”), materials, and utilities contributed to performance. |
| • | | An underweight to fixed income contributed to performance. Within fixed income, exposure to credit was additive. Exposure to commodities, notably gold related securities, and to cash and cash equivalents detracted from performance. Finally, currency management negatively impacted returns, principally due to an overweight to the U.S. dollar. |
| • | | The Fund uses derivatives, which may include options, futures, swaps and forward contracts both to seek to enhance returns of the Fund and to hedge (or protect) against adverse movements in currency exchange rates, interest rates and movements in the securities markets. |
Describe recent portfolio activity.
| • | | During the six-month period, the Fund’s overall equity allocation decreased from 57% to 55% of net assets. Within equities, the Fund reduced exposure to the United States and Japan. From a sector perspective, the Fund increased exposure to energy, utilities, telecom, materials, and consumer discretionary, and decreased exposure to financials, information technology (“IT”), consumer staples, health care and industrials. |
| • | | The Fund’s overall allocation to fixed income increased from 26% to 32% of net assets. Within fixed income, the Fund increased exposure to government and corporate bonds. |
| • | | The Fund’s exposure to commodity-related securities increased from 3% to 4% of net assets. |
| • | | Reflecting the above changes, the Fund’s cash and cash equivalent holdings decreased from 14% to 9% of net assets. During the six-month period, the Fund’s cash position helped mitigate portfolio volatility and served as a source of funds for new investments. |
Describe portfolio positioning at period end.
| • | | Relative to its Reference Benchmark, the Fund was underweight equities and fixed income, and overweight commodity-related securities and cash and cash equivalents. Within equities, the Fund was overweight Japan and Europe, and underweight the United States. Within Europe, the Fund was overweight France and the Netherlands, and underweight Switzerland. From a sector perspective, the Fund was overweight energy, consumer discretionary, telecom and utilities, and underweight financials, consumer staples, IT, health care, real estate and industrials. Within fixed income, the Fund was underweight developed market government bonds, and overweight corporate debt. With respect to currency exposure, the Fund was overweight the U.S. dollar and Indian rupee, and underweight the Canadian dollar, Japanese yen, Swiss franc and Australian dollar. |
The views expressed reflect the opinions of BlackRock as of the date of this report and are subject to change based on changes in market, economic or other conditions. These views are not intended to be a forecast of future events and are no guarantee of future results.
| | | | | | |
| | | Percent of Fund’s Net Assets1 | | Reference
Benchmark2 |
| Portfolio Composition | | 6/30/17 | | 12/31/16 | | Percentage |
U.S. Equities | | 26% | | 28% | | 35% |
European Equities | | 15 | | 14 | | 13 |
Asia Pacific Equities | | 13 | | 14 | | 9 |
Other Equities | | 1 | | 1 | | 3 |
Total Equities | | 55 | | 57 | | 60 |
U.S. Dollar Denominated Fixed Income Securities | | 22 | | 17 | | 24 |
U.S. Issuers | | 19 | | 13 | | — |
Non-U.S. Issuers | | 3 | | 4 | | — |
Non-U.S. Dollar Denominated Fixed Income Securities | | 10 | | 9 | | 16 |
Total Fixed Income Securities | | 32 | | 26 | | 40 |
Commodity-Related Securities | | 4 | | 3 | | — |
Cash & Short-Term Securities | | 9 | | 14 | | — |
| | 1 | | Exposure based on market value and adjusted for the economic value of futures, swaps and options (except with respect to fixed income securities), and convertible bonds. |
| | 2 | | The Reference Benchmark is an unmanaged weighted index comprised as follows: 36% of the S&P 500 Index® ; 24% FTSE World (ex-U.S.) Index; 24% BofA Merrill Lynch Current 5-Year U.S. Treasury Index; and 16% Citigroup Non-U.S. Dollar World Government Bond Index. Descriptions of these indexes are found on page 13 of this report to share-holders in the “Performance Summary” section. |
| | | | | | |
| 12 | | BLACKROCK SERIES FUND, INC. | | JUNE 30, 2017 | | |
| | |
| | | BlackRock Global Allocation Portfolio |
|
| Total Return Based on a $10,000 Investment |
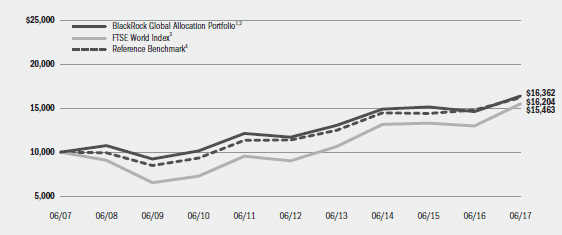
| | 1 | | Assuming transaction costs, if any, and other operating expenses, including investment advisory fees. Does not include insurance-related fees and expenses. |
| | 2 | | The Fund invests in a portfolio of U.S. and foreign equity securities, debt and money market securities, the combination of which will be varied from time to time with respect to types of securities and markets in response to changing markets and economic trends. |
| | 3 | | This unmanaged capitalization-weighted index is comprised of 2,539 equities from 35 countries in 4 regions, including the United States. |
| | 4 | | The Reference Benchmark is an unmanaged weighted index comprised as follows: 36% S&P 500® Index; 24% FTSE World (ex-U.S.) Index; 24% BofA Merrill Lynch Current 5-Year U.S. Treasury Index; and 16% Citigroup Non-U.S. Dollar World Government Bond Index. |
| | | | | | | | |
| Performance Summary for the Period Ended June 30, 2017 |
| | | | | | | | | | | | | | | | | | | | |
| | | | | Average Annual Total Returns5 |
| | | 6-Month
Total Returns5 | | 1 Year | | 5 Years | | 10 Years |
BlackRock Global Allocation Portfolio | | | | 7.81% | | | | | 12.07% | | | | | 6.95% | | | | | 5.05% | |
FTSE World Index | | | | 11.60 | | | | | 19.40 | | | | | 11.48 | | | | | 4.45 | |
Reference Benchmark | | | | 7.91 | | | | | 9.61 | | | | | 7.33 | | | | | 4.95 | |
U.S. Stocks: S&P 500® Index6 | | | | 9.34 | | | | | 17.90 | | | | | 14.63 | | | | | 7.18 | |
Non-U.S. Stocks: FTSE World (ex-U.S.) Index7 | | | | 14.11 | | | | | 20.86 | | | | | 8.14 | | | | | 1.74 | |
U.S. Bonds: BofA Merrill Lynch Current 5-Year U.S. Treasury Index8 | | | | 1.18 | | | | | (2.52) | | | | | 0.90 | | | | | 4.18 | |
Non-U.S. Bonds: Citigroup Non-U.S. Dollar World Government Bond Index9 | | | | 5.91 | | | | | (5.01) | | | | | (0.80) | | | | | 3.21 | |
| | 5 | | Cumulative and average annual total returns are based on changes in net asset value for the periods shown and assume reinvestment of all distributions at net asset value on the ex-dividend date. Insurance-related fees and expenses are not reflected in these returns. |
| | 6 | | This unmanaged index covers 500 leading companies and captures approximately 80% coverage of available market capitalization. |
| | 7 | | An unmanaged capitalization-weighted index comprised of over 1,927 equities from 34 countries, excluding the United States. |
| | 8 | | This unmanaged index is designed to track the total return of the current coupon five-year U.S. Treasury bond. |
| | 9 | | This unmanaged market capitalization-weighted index tracks 22 government bond indexes, excluding the United States. |
| | | | Past performance is not indicative of future results. Performance results do not reflect the deduction of taxes that a shareholder would pay on Fund distributions or the redemption of Fund shares. |
| | | | Performance results may include adjustments made for financial reporting purposes in accordance with U.S. generally accepted accounting principles. |
| | | | | | | | | | | | | | | | | | |
| | | Actual | | Hypothetical12 |
| | | | | | | Including
Dividend Expense | | Excluding
Dividend Expense | | | | Including
Dividend Expense | | Excluding
Dividend Expenses |
| | | Beginning
Account Value
January 1,
2017 | | Ending
Account Value
June 30,
2017 | | Expenses
Paid During
the Period10 | | Expenses
Paid During
the Period11 | | Beginning
Account Value
January 1,
2017 | | Ending
Account Value
June 30,
2017 | | Expenses
Paid During
the Period10 | | Ending
Account Value
June 30,
2017 | | Expense
Paid During
the Period11 |
BlackRock Global
Allocation Portfolio | | $1,000.00 | | $1,078.10 | | $3.09 | | $2.94 | | $1,000.00 | | $1,021.82 | | $3.01 | | $1,021.97 | | $2.86 |
| | 10 | | Expenses are equal to the annualized expense ratio (0.60%), multiplied by the average account value over the period, multiplied by 181/365 (to reflect the one-half year period shown). |
| | 11 | | Expenses are equal to the annualized expense ratio (0.57%), multiplied by the average account value over the period, multiplied by 181/365 (to reflect the one-half year period shown). |
| | 12 | | Hypothetical 5% annual return before expenses is calculated by prorating the number of days in the most recent fiscal half year divided by 365. |
| | | | See “Disclosure of Expenses” on page 22 for further information on how expenses were calculated. |
| | | | | | |
| | | BLACKROCK SERIES FUND, INC. | | JUNE 30, 2017 | | 13 |
| | | | |
| Fund Summary as of June 30, 2017 | | | BlackRock Government Money Market Portfolio | |
|
| For the Six-Month Period Ended June 30, 2017 |
On the heels of a 0.25% rate hike at end of 2016, remarks from members of the Federal Open Market Committee (“FOMC”) during the first quarter of 2017 generally indicated an openness to the further removal of monetary accommodation. Indeed, after clearly telegraphing its intentions in the weeks immediately preceding the March 15, 2017 meeting, the FOMC delivered a 0.25% increase in the federal funds target range to 0.75% — 1.00%. The strength of the U.S. labor market and continued progress toward the FOMC’s inflation target of 2% were cited as factors contributing to the decision to continue along the path toward the normalization of interest rates. Specifically, the FOMC’s preferred measure of inflation — the core PCE index — increased 1.8% on an annual basis in February, while broader measures of inflation came in above 2% during the quarter.
More recently, while there has been moderate weakness in inflation, the FOMC stated that it believes this to be transitory and delivered a third consecutive quarterly 0.25% interest rate increase at the June 14, 2017 FOMC meeting. During this meeting, the FOMC also gave an update on its balance sheet normalization strategy, confirming that it would likely kick off “this year.” The amounts of Treasury and agency mortgage-backed securities that will not be reinvested will be relatively small at the outset. Similarly, the pace at which such securities will “roll off” of the balance sheet willbe measured. While the FOMC appears committed to interest rate and balance sheet normalization, market participants appear less convinced about the outlook set forth by policy makers. Specifically, futures contracts for federal funds are priced in for less than two 0.25% rate hikes by the end of 2018, as compared with four increases stated in the FOMC’s Summary of Economic Projections.
During the first half of 2017, the credit curve inside of a year remained extremely tight with issuers being reluctant to increase issuance and demand in the short term credit markets continuing to exceed supply. Floating rate note issuance remained strong as demand has outpaced supply with investors preferring floating rate notes over fixed rate investments with the FOMC continuing to tighten monetary policy. The gradual removal of monetary accommodation translated into higher yields for taxable and municipal money market funds during the second quarter. On an average net yield basis, institutional prime money market funds are out-yielding institutional government money market funds by 28 basis points (0.28%) according to iMoneyNet as of June month-end.
We anticipate an additional 0.25% interest rate hike during the balance of 2017, along with the initiation of balance sheet “tapering;” however, the sequencing of such events is unclear. In our view, the path for interest rate hikes remains subject to inflation moving toward the FOMC’s 2% target later this year and financial conditions remaining accommodative. We also believe that the gradual pace of balance sheet normalization activity as laid out by the FOMC will not be disruptive to markets.
Past performance is no guarantee of future results. Index performance is shown for illustrative purposes only. You cannot invest directly in an index.
| | | | | | |
| 14 | | BLACKROCK SERIES FUND, INC. | | JUNE 30, 2017 | | |
| | |
| | | BlackRock Government Money Market Portfolio |
BlackRock Government Money Market Portfolio’s (the “Fund”) investment objective is to seek to preserve capital, to maintain liquidity and achieve the highest possible current income consistent with the foregoing.
| | | | |
| | | 7-Day SEC Yields | | 7-Day Yields |
BlackRock Government Money Market Portfolio | | 0.52% | | 0.52% |
| | | | The 7-Day SEC Yield may differ from the 7-Day Yield shown above due to the fact that the 7-Day SEC Yield excludes distributed capital gains. Past performance is not indicative of future results. Performance results do not reflect the deduction of taxes that a shareholder would pay on Fund distributions or the redemption of Fund shares. |
| | | | |
| | | Percent of
Net Assets | |
U.S. Government Sponsored Agency Obligations | | | 55% | |
Repurchase Agreements | | | 40 | |
U.S. Treasury Obligations | | | 6 | |
Liabilities in Excess of Other Assets | | | (1) | |
| | | | |
Total | | | 100% | |
| | | | |
| | | | | | | | | | | | | | |
| | | Actual | | Hypothetical2 | | |
| | | Beginning
Account Value
January 1,
2017 | | Ending
Account Value
June 30,
2017 | | Expenses Paid
During the Period1 | | Beginning
Account Value
January 1,
2017 | | Ending
Account Value
June 30,
2017 | | Expenses Paid
During the Period1 | | Annualized
Expense
Ratio |
BlackRock Government Money Market Portfolio | | $1,000.00 | | $1,001.30 | | $2.48 | | $1,000.00 | | $1,022.32 | | $2.51 | | 0.50% |
| | 1 | | Expenses are equal to the annualized expense ratio, multiplied by the average account value over the period, multiplied by 181/365 (to reflect the one-half year period shown). |
| | 2 | | Hypothetical 5% annual return before expenses is calculated by prorating the number of days in the most recent fiscal half year divided by 365. |
| | | | See “Disclosure of Expenses” on page 22 for further information on how expenses were calculated. |
| | | | | | |
| | | BLACKROCK SERIES FUND, INC. | | JUNE 30, 2017 | | 15 |
| | | | |
| Fund Summary as of June 30, 2017 | | | BlackRock High Yield Portfolio | |
BlackRock High Yield Portfolio’s (the “Fund”) investment objective is to seek to maximize total return, consistent with income generation and prudent investment management.
|
Portfolio Management Commentary |
How did the Fund perform?
| • | | For the six-month period ended June 30, 2017, the Fund underperformed its benchmark, the Bloomberg Barclays U.S. Corporate High Yield 2% Issuer Capped Index. |
What factors influenced performance?
| • | | High yield bonds delivered a strong gain in the first half of the year, as an improvement in global growth supported credit conditions and boosted investor sentiment. The Fund, while producing a positive return, finished short of its benchmark. Security selection in the electric utilities sector, where the Fund was hurt by being underweight in Dynegy, Inc., was the largest detractor from performance. Selection in retail, where the Fund was overweight in Rite Aid Corp., also detracted, as did an underweight in the outperforming home construction sector. The largest contributions came from security selection in the gaming, technology and wireless sectors, led by overweight positions in Amaya, Inc., BMC Software, Inc. and Sprint Corp., respectively. |
Describe recent portfolio activity.
| • | | The Fund increased its exposure to the technology and cable & satellite sectors. In technology, the investment adviser was particularly focused on software companies. |
| • | | The Fund reduced exposure to the independent energy, midstream energy and retail sectors. Although the Fund began the year with an overweight position in energy, it moved to an underweight by the end of the first quarter. The Fund remained underweight at the close of the period, particularly within the oil field services subsector, but it retained positions in certain higher-quality issuers. The investment adviser believes the oil field services group will continue to face pressure with oil |
| | | prices in their current range, given that companies in the industry generally have higher break-even levels than those in the independent energy and midstream categories. |
Describe portfolio positioning at period end.
| • | | The Fund’s general investment themes and core positions reflected the investment adviser’s views regarding issuer cash flows, firm or industry catalysts, and idiosyncratic factors. The portfolio’s leading issuer overweights included Next Luxembourg SCSp, Freeport-McMoran, Inc. and iHeartCommunications, Inc. |
| • | | Relative to the Bloomberg Barclays U.S. Corporate High Yield 2% Issuer Capped Index, the Fund was underweight in BB rated credits (which are more interest-rate sensitive), overweight in single B issuers and moderately overweight in bonds rated CCC and below. The Fund remained underweight in the distressed part of the spectrum, focusing instead on select CCC-rated issues with improving credit positions and/or attractive yields. |
| • | | In addition to bonds, the investment adviser sought opportunities in equity and equity-like instruments, such as preferred stocks and convertible bonds, to enhance the Fund’s total return profile. The Fund implements a strategy to mitigate risk on a tactical basis when market conditions warrant. |
| • | | The Fund maintained a strategic allocation to bank loans, which have little duration risk and, as senior secured instruments, help offset the portfolio’s underweight in BB-rated bonds. (Duration is a measure of interest rate sensitivity.) The Fund had a slightly short duration relative to the benchmark, but this is not a core aspect of its strategy. |
The views expressed reflect the opinions of BlackRock as of the date of this report and are subject to change based on changes in market, economic or other conditions. These views are not intended to be a forecast of future events and are no guarantee of future results.
| | | | | | |
| Credit Quality Allocations1 | | | | | Percent of
Total Investments2 |
BBB/Baa | | | 6% |
BB/Ba | | | 35 |
B | | | | | | 44 |
CCC/Caa | | | 11 |
N/R | | | 4 |
| | 1 | | For financial reporting purposes, credit quality ratings shown above reflect the highest rating assigned by either S&P Global Ratings or Moody’s Investors Service if ratings differ. These rating agencies are independent, nationally recognized statistical rating organizations and are widely used. Investment grade ratings are credit ratings of BBB/Baa or higher. Below investment grade ratings are credit ratings of BB/Ba or lower. Investments designated N/R are not rated by either rating agency. Unrated investments do not necessarily indicate low credit quality. Credit quality ratings are subject to change. |
| | 2 | | Total Investments exclude short-term securities, options purchased and options written. |
| | | | | | |
| 16 | | BLACKROCK SERIES FUND, INC. | | JUNE 30, 2017 | | |
| | |
| | | BlackRock High Yield Portfolio |
|
| Total Return Based on a $10,000 Investment |
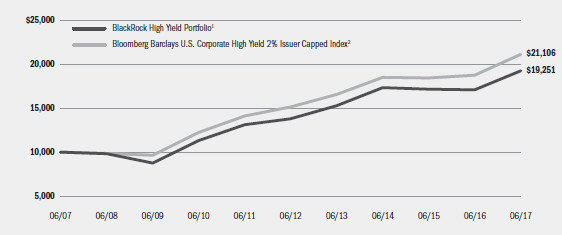
| | 1 | | Assuming transaction costs and other operating expenses, including investment advisory fees, if any. Does not include insurance-related fees and expenses. The Fund invests primarily in non-investment grade bonds with maturities of ten years or less. The Fund’s total returns prior to October 1, 2011, are the returns of the Fund when it followed a different investment objective and different investment strategies under the name “BlackRock High Income Portfolio.” |
| | 2 | | This unmanaged index is comprised of issues that meet the following criteria: at least $150 million par value outstanding; maximum credit rating of Ba1; at least one year to maturity; and no issuer represents more than 2% of the index. |
| | | | | | | | | | | | |
Performance Summary for the Period Ended June 30, 2017 |
| | | | | | | | | | | | | | | | | | | | | | | | | | | | | | |
| | | | | | | | | Average Annual Total Returns1,4 |
| | | Standardized
30-Day Yield3 | | Unsubsidized
30-Day Yield3 | | 6-Month
Total Returns4 | | 1 Year | | 5 Years | | 10 Years |
BlackRock High Yield Portfolio | | | | 5.37% | | | | | 4.86% | | | | | 4.86 | % | | | | 12.32 | % | | | | 6.82 | % | | | | 6.77 | % |
Bloomberg Barclays U.S. Corporate High Yield 2% Issuer Capped Index | | | | — | | | | | — | | | | | 4.92 | | | | | 12.69 | | | | | 6.90 | | | | | 7.76 | |
| | 3 | | The standardized 30-day yield includes the effects of any waivers and/or reimbursements. The unsubsidized 30-day yield excludes the effects of any waivers and/or reimbursements. |
| | 4 | | Cumulative and average annual total returns are based on changes in net asset value for the periods shown and assume reinvestment of all distributions at net asset value on the ex-dividend/payable date. Insurance-related fees and expenses are not reflected in these returns. |
| | | | Past performance is not indicative of future results. Performance results do not reflect the deduction of taxes that a shareholder would pay on Fund distributions or the redemption of Fund shares. |
| | | | Performance results may include adjustments made for financial reporting purposes in accordance with U.S. generally accepted accounting principles. |
| | | | | | | | | | | | | | |
Expense Example |
| | | Actual | | Hypothetical7 | | |
| | | Beginning
Account Value
January 1, 2017 | | Ending
Account Value
June 30, 2017 | | Expenses Paid During the Period6 | | Beginning
Account Value
January 1, 2017 | | Ending
Account Value
June 30, 2017 | | Expenses Paid During the Period6 | | Annualized
Expense Ratio |
BlackRock High Yield Portfolio | | $1,000.00 | | $1,048.60 | | $2.54 | | $1,000.00 | | $1,022.32 | | $2.51 | | 0.50% |
| | 6 | | Expenses are equal to the annualized expense ratio, multiplied by the average account value over the period, multiplied by 181/365 (to reflect the one-half year period shown). |
| | 7 | | Hypothetical 5% annual return before expenses is calculated by prorating the number of days in the most recent fiscal half year divided by 365. |
| | | | See “Disclosure of Expenses” on page 22 for further information on how expenses were calculated. |
| | | | | | |
| | | BLACKROCK SERIES FUND, INC. | | JUNE 30, 2017 | | 17 |
| | | | |
| Fund Summary as of June 30, 2017 | | | BlackRock Total Return Portfolio | |
BlackRock Total Return Portfolio’s (the “Fund”) investment objective is to seek to maximize total return, consistent with income generation and prudent investment management.
|
| Portfolio Management Commentary |
How did the Fund perform?
| • | | For the six-month period ended June 30, 2017, the Fund returned 2.71%, outperforming its benchmark, the Bloomberg Barclays U.S. Aggregate Bond Index, which returned 2.27%. |
What factors influenced performance?
| • | | Positive contributions to performance for the period came from allocations to U.S. securitized assets including non-agency mortgage-backed securities (“MBS”), and collateralized loan obligations (“CLOs”). Security selection within commercial mortgage-backed securities (“CMBS”) also aided performance. Out-of-benchmark exposure to emerging market bonds, high yield corporates, and municipal bonds contributed positively as well. |
| • | | The Fund’s U.S. absolute return and macro strategies modestly detracted from performance relative to the benchmark. |
Describe recent portfolio activity.
| • | | The Fund began 2017 positioned to benefit from reflation driven by firming global growth, with an underweight stance with respect to duration (and corresponding interest rate sensitivity) and an emphasis on carry-oriented (income) opportunities to be found lower in the capital structure. Within these overall themes, the Fund held an allocation to high yield credit and overweight exposure to securitized assets including |
| | | CMBS, asset-backed securities, CLO’s and non-agency MBS, as well as emerging markets. In addition, the Fund maintained exposure to Treasury inflation-protected securities to capture any benefit from rising market expectations for inflation. |
| • | | During the second quarter of 2017, the Fund reduced its duration underweight as volatility remained low, global growth started to plateau following a strong recovery, and inflation expectations declined. This shift was designed to increase the Fund’s income generation given the lack of any catalyst for rate volatility to increase substantially, and made with the view that the market should favor strategies designed to generate income given the large demand for fixed income assets and low supply. |
Describe portfolio positioning at period end.
| • | | The Fund ended the period positioned with a less-pronounced underweight stance with respect to duration, as softening domestic economic activity and inflation data alongside strong fixed income demand kept rates subdued. Rich valuations in credit sectors led to the Fund to favor idiosyncratic stories within investment grade and high yield corporate bonds rather than broad exposure to those segments. The Fund ended the period with an increased overweight in emerging markets based on the view that synchronized developed market growth bodes well for the sector. Finally, the Fund continued to favor securitized assets for yield, as a strong technical backdrop should support segments such as nonagency MBS and CLOs. |
The views expressed reflect the opinions of BlackRock as of the date of this report and are subject to change based on changes in market, economic or other conditions. These views are not intended to be a forecast of future events and are no guarantee of future results.
| | | | | |
| Portfolio Composition | | Percent of
Total Investments1 |
U.S. Government Sponsored Agency Securities | | | | 36 | % |
Corporate Bonds | | | | 23 | |
U.S. Treasury Obligations | | | | 16 | |
Asset-Backed Securities | | | | 9 | |
Non-Agency Mortgage-Backed Securities | | | | 5 | |
Taxable Municipal Bonds | | | | 5 | |
Foreign Government Obligations | | | | 4 | |
Investment Companies | | | | 1 | |
Floating Rate Loan Interests | | | | 1 | |
Other2 | | | | — | |
| | 1 | | Total Investments exclude short-term securities, options purchased, borrowed bonds, options written and TBA sale commitments. |
| | 2 | | Includes foreign agency obligations, other interests and preferred securities, all of which are less than 1%. |
| | | | | |
| Credit Quality Allocation3 | | Percent of
Total Investments4 |
AAA/Aaa5 | | | | 59 | % |
AA/Aa | | | | 5 | |
A | | | | 10 | |
BBB/Baa | | | | 15 | |
BB/Ba | | | | 2 | |
B | | | | 1 | |
CCC/Caa | | | | 1 | |
N/R | | | | 7 | |
| | 3 | | For financial reporting purposes, credit quality ratings shown above reflect the highest rating assigned by either S&P Global Ratings or Moody’s Investors Service (“Moody’s”). These rating agencies are independent, nationally recognized statistical rating organizations and are widely used. Investment grade ratings are credit ratings of BBB/Baa or higher. Below investment grade ratings are credit ratings of BB/Ba or lower. Investments designated N/R are not rated by either rating agency. Unrated investments do not necessarily indicate low credit quality. Credit quality ratings are subject to change. |
| | 4 | | Total Investments exclude short-term securities, options purchased, borrowed bonds, options written and TBA sale commitments. |
| | 5 | | The investment adviser evaluates the credit quality of unrated investments based upon certain factors including, but not limited to, credit ratings for similar investments and financial analysis of sectors, individual investments and/or issuers. Using this approach, the investment advisor has deemed unrated U.S. Government Sponsored Agency Securities and U.S. Treasury Obligations to be of similar credit quality as investments rated AAA/Aaa. |
| | | | | | |
| 18 | | BLACKROCK SERIES FUND, INC. | | JUNE 30, 2017 | | |
| | | | |
| | | | BlackRock Total Return Portfolio | |
|
| Total Return Based on a $10,000 Investment |
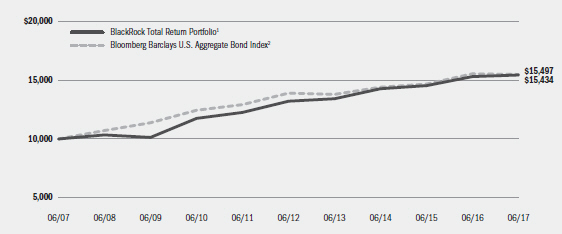
| | 1 | | Assuming transaction costs and other operating expenses, including investment advisory fees, if any. Does not include insurance-related fees and expenses. The Fund, under normal circumstances, will invest at least 80%, and typically invests 90% or more, of its assets in fixed-income securities such as corporate bonds and notes, mortgage-backed securities, asset-backed securities, convertible securities, preferred securities and government obligations. |
| | 2 | | A widely recognized unmanaged market-weighted index, comprised of investment-grade corporate bonds rated BBB or better, mortgages and U.S. Treasury and U.S. Government agency issues with at least one year to maturity. |
| | | | | | | | | | | | |
| Performance Summary for the Period Ended June 30, 2017 |
| | | | | | | | | | | | | | | | | | | | | | | | | | | | | | |
| | | | | | | | | Average Annual Total Returns4 |
| | | Standardized
30-Day Yield3 | | Unsubsidized
30-Day Yield3 | | 6-Month
Total Returns4 | | 1 Year | | 5 Years | | 10 Years |
BlackRock Total Return Portfolio | | | | 2.64% | | | | | 2.13% | | | | | 2.71 | % | | | | 0.63 | % | | | | 3.12 | % | | | | 4.44 | % |
Bloomberg Barclays U.S. Aggregate Bond Index | | | | — | | | | | — | | | | | 2.27 | | | | | (0.31 | ) | | | | 2.21 | | | | | 4.48 | |
| | 3 | | The standardized 30-day yield includes the effects of any waivers and/or reimbursements. The unsubsidized 30-day yield excludes the effects of any waivers and/or reimbursements. |
| | 4 | | Cumulative and average annual total returns are based on changes in net asset value for the periods shown and assume reinvestment of all distributions at net asset value on the ex-dividend/payable date. Insurance-related fees and expenses are not reflected in these returns. |
Past performance is not indicative of future results. Performance results do not reflect the deduction of taxes that a shareholder would pay on Fund distributions or the redemption of Fund shares.
Performance results may include adjustments made for financial reporting purposes in accordance with U.S. generally accepted accounting principles.
| | | | | | | | | | | | | | | | | | |
| Expense Example |
| | | Actual | | Hypothetical7 |
| | | | | | | Including
Interest Expense | | Excluding
Interest Expense | | | | Including
Interest Expense | | Excluding
Interest Expense |
| | | Beginning
Account Value
January 1,
2017 | | Ending
Account Value
June 30, 2017 | | Expenses Paid During the Period5 | | Expenses Paid During the Period6 | | Beginning
Account Value
January 1, 2017 | | Ending
Account Value
June 30, 2017 | | Expenses Paid During the Period5 | | Ending
Account Value
June 30, 2017 | | Expenses Paid During
the Period6 |
BlackRock Total Return Portfolio | | $1,000.00 | | $1,027.10 | | $2.86 | | $2.51 | | $1,000.00 | | $1,021.97 | | $2.86 | | $1,022.32 | | $2.51 |
| | 5 | | Expenses are equal to the annualized expense ratio (0.57%), multiplied by the average account value over the period, multiplied by 181/365 (to reflect the one-half year period shown). |
| | 6 | | Expenses are equal to the annualized expense ratio (0.50%), multiplied by the average account value over the period, multiplied by 181/365 (to reflect the one-half year period shown). |
| | 7 | | Hypothetical 5% annual return before expenses is calculated by prorating the number of days in the most recent fiscal half year divided by 365. |
See “Disclosure of Expenses” on page 22 for further information on how expenses were calculated.
| | | | | | |
| | | BLACKROCK SERIES FUND, INC. | | JUNE 30, 2017 | | 19 |
| | |
| Fund Summary as of June 30, 2017 | | BlackRock U.S. Government Bond Portfolio |
BlackRock U.S. Government Bond Portfolio’s (the “Fund”) investment objective is to seek to maximize total return, consistent with income generation and prudent investment management.
|
Portfolio Management Commentary |
How did the Fund perform?
| • | | For the six-month period ended June 30, 2017, the Fund returned 1.46%, underperforming its benchmark, the Bloomberg Barclays U.S. Government/Mortgage Index, which returned 1.64%. |
What factors influenced performance?
| • | | The most significant detractor from relative performance was the Fund’s stance with respect to U.S. interest rates. This included the Fund’s stance with respect to duration and corresponding interest rate sensitivity, as well as the Fund’s positioning along the Treasury yield curve. An underweight to U.S. agency securities constrained performance, as did positioning with respect to global interest rates and currency exposures. |
| • | | The principal positive contributors to performance were allocation-based strategies within securitized assets such as commercial mortgage-backed securities (“CMBS”) and collateralized loan obligations. These segments benefited as the global search for yield and limited supply created a favorable technical backdrop and the fundamentals around the U.S. consumer, housing and commercial real estate continued to strengthen. Overweight positioning with respect to both 15-year and 30-year agency residential mortgage-backed securities (“MBS”) also added value. Allocations to high-quality, longer- |
| | | duration agency collateralized mortgage obligations contributed to performance as well. Finally, the Fund’s allocation to Treasury inflation-protected securities added to performance. |
Describe recent portfolio activity.
| • | | During the six-month period, the Fund increased its exposure to U.S. Treasuries, while paring back holdings of agency MBS. The Fund also slightly reduced exposure to CMBS. |
Describe portfolio positioning at period end.
| • | | The Fund closed the period with underweight exposure to U.S. duration, on the view that yields will continue to rise in the context of strong domestic economic growth and the Federal Reserve System hiking cycle. This thesis was also expressed through a long position in Treasury inflation protected securities. Outside of the U.S., the Fund held short positions in German interest rates and U.K. inflation forward contracts. The Fund maintained exposure to the agency MBS sector and continues to be positioned modestly overweight agency mortgages versus the benchmark. Overall, the Fund was positioned with the expectation that the Federal Reserve System’s announced plan for trimming its balance sheet would not give rise to any sort of worst-case scenario for the agency MBS market. |
The views expressed reflect the opinions of BlackRock as of the date of this report and are subject to change based on changes in market, economic or other conditions. These views are not intended to be a forecast of future events and are no guarantee of future results.
| | |
| Portfolio Composition | | Percent of
Total Investments1 |
U.S. Government Sponsored Agency Securities | | 56% |
U.S. Treasury Obligations | | 38 |
Asset-Backed Securities | | 3 |
Non-Agency Mortgage-Backed Securities | | 2 |
Foreign Government Obligations | | 1 |
Other2 | | — |
| | 1 | | Total Investments exclude short-term securities, options purchased, options written, borrowed bonds and TBA sale commitments. |
| | 2 | | Includes corporate bonds, which are less than 1%. |
| | | | | | |
| 20 | | BLACKROCK SERIES FUND, INC. | | JUNE 30, 2017 | | |
| | |
| | | BlackRock U.S. Government Bond Portfolio |
|
| Total Return Based on a $10,000 Investment |
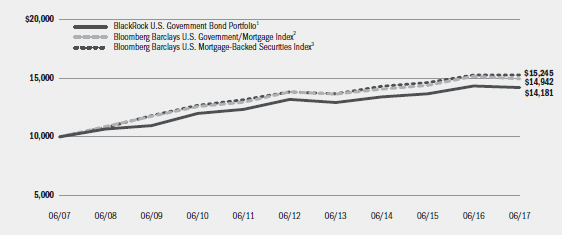
| | 1 | | Assuming transaction costs and other operating expenses, including investment advisory fees, if any. Does not include insurance-related fees and expenses. The Fund, under normal circumstances, will invest at least 80% of its assets in bonds that are issued or guaranteed by the U.S. Government and its agencies. The Fund’s total returns prior to October 1, 2011, are the returns of the Fund when it followed a different investment objective and different investment strategies under the name “BlackRock Government Income Portfolio.” |
| | 2 | | This index measures debt issued by the U.S. Government, and its agencies, as well as mortgage-backed pass-through securities of Ginnie Mae, Fannie Mae and Freddie Mac. |
| | 3 | | This unmanaged index includes the mortgage-backed pass-through securities of Ginnie Mae, Fannie Mae and Freddie Mac that meet certain maturity and liquidity criteria. |
| | | | | | | | | | | | |
| Performance Summary for the Period Ended June 30, 2017 |
| | | | | | | | | | | | | | | | | | | | | | | | | | | | | | |
| | | | | | | | | Average Annual Total Returns1,5 |
| | | Standardized
30-Day Yield4 | | Unsubsidized
30-Day Yield4 | | 6-Month
Total Returns5 | | 1 Year | | 5 Years | | 10 Years |
BlackRock U.S. Government Bond Portfolio | | | | 1.97% | | | | | 1.57% | | | | | 1.46 | % | | | | (1.21 | )% | | | | 1.44 | % | | | | 3.55 | % |
Bloomberg Barclays U.S. Government/Mortgage Index | | | | — | | | | | — | | | | | 1.64 | | | | | (1.30 | ) | | | | 1.59 | | | | | 4.10 | |
Bloomberg Barclays U.S. Mortgage-Backed Securities Index | | | | — | | | | | — | | | | | 1.35 | | | | | (0.06 | ) | | | | 2.00 | | | | | 4.31 | |
| | 4 | | The standardized 30-day yield includes the effects of any waivers and/or reimbursements. The unsubsidized 30-day yield excludes the effects of any waivers and/or reimbursements. |
| | 5 | | Cumulative and average annual total returns are based on changes in net asset value for the periods shown and assume reinvestment of all distributions at net asset value on the ex-dividend/payable date. Insurance-related fees and expenses are not reflected in these returns. |
| | | | Past performance is not indicative of future results. Performance results do not reflect the deduction of taxes that a shareholder would pay on Fund distributions or the redemption of Fund shares. |
| | | | Performance results may include adjustments made for financial reporting purposes in accordance with U.S. generally accepted accounting principles. |
| | | | | | | | | | | | | | | | | | |
| Expense Example |
| | | Actual | | Hypothetical8 |
| | | | | | | Including
Interest Expense | | Excluding
Interest Expense | | | | Including Interest Expense | | Excluding Interest Expense |
| | | Beginning
Account Value
January 1,
2017 | | Ending
Account Value
June 30, 2017 | | Expenses Paid During the Period6 | | Expenses Paid During the Period7 | | Beginning
Account Value
January 1,
2017 | | Ending
Account Value
June 30, 2017 | | Expenses
Paid During
the Period6 | | Ending
Account Value
June 30, 2017 | | Expenses
Paid During
the Period7 |
BlackRock U.S. Government Bond Portfolio | | $1,000.00 | | $1,014.60 | | $2.90 | | $2.50 | | $1,000.00 | | $1,021.92 | | $2.91 | | $1,022.32 | | $2.51 |
| | 6 | | Expenses are equal to the annualized expense ratio (0.58%), multiplied by the average account value over the period, multiplied by 181/365 (to reflect the one-half year period shown). |
| | 7 | | Expenses are equal to the annualized expense ratio (0.50%), multiplied by the average account value over the period, multiplied by 181/365 (to reflect the one-half year period shown). |
| | 8 | | Hypothetical 5% annual return before expenses is calculated by prorating the number of days in the most recent fiscal half year divided by 365. |
| | | See “Disclosure of Expenses” on page 22 for further information on how expenses were calculated. |
| | | | | | |
| | | BLACKROCK SERIES FUND, INC. | | JUNE 30, 2017 | | 21 |
| | | | |
| The Benefits and Risks of Leveraging | | | | |
The Funds may utilize leverage to seek to enhance returns and net asset value (“NAV”). However, these objectives cannot be achieved in all interest rate environments.
The Funds may utilize leverage by entering into reverse repurchase agreements.
In general, the concept of leveraging is based on the premise that the financing cost of leverage, which is based on short-term interest rates, is normally lower than the income earned by each Fund on its longer-term portfolio investments purchased with the proceeds from leverage. To the extent that the total assets of each Fund (including the assets obtained from leverage) are invested in higher-yielding portfolio investments, the Funds’ shareholders benefit from the incremental net income.
The interest earned on securities purchased with the proceeds from leverage is distributed to the Funds’ shareholders, and the value of these portfolio holdings is reflected in the Funds’ per share NAV. However, in order to benefit shareholders, the return on assets purchased with leverage proceeds must exceed the ongoing costs associated with the leverage. If interest and other ongoing costs of leverage exceed a Fund’s return on assets purchased with leverage proceeds, income to shareholders is lower than if the Funds had not used leverage.
Furthermore, the value of each Fund’s portfolio investments generally varies inversely with the direction of long-term interest rates, although other factors can also influence the value of portfolio investments. As a result, changes in interest rates can influence each Fund’s NAV positively or negatively in addition to the impact on each Fund’s performance from leverage. Changes in the direction of interest rates are difficult to predict accurately, and there is no assurance that a Fund’s leveraging strategy will be successful.
The use of leverage also generally causes greater changes in each Fund’s NAV and dividend rates than comparable portfolios without leverage. In a declining market, leverage is likely to cause a greater decline in the NAV of a Fund’s shares than if the Fund were not leveraged. In addition, each Fund may be required to sell portfolio securities at inopportune times or at distressed values in order to comply with regulatory requirements applicable to the use of leverage or as required by the terms of the leverage instruments, which may cause the Funds to incur losses. The use of leverage may limit a Fund’s ability to invest in certain types of securities or use certain types of hedging strategies. Each Fund incurs expenses in connection with the use of leverage, all of which are borne by each Fund’s shareholders and may reduce income.
Shareholders of these Funds may incur the following charges: (a) transactional expenses, such as sales charges; and (b) operating expenses, including investment advisory fees, service and distribution fees, including 12b-1 fees, acquired fund fees and expenses, and other fund expenses. The expense examples on previous pages (which are based on a hypothetical investment of $1,000 invested on January 1, 2017 and held through June 30, 2017) are intended to assist shareholders both in calculating expenses based on an investment in each Fund and in comparing these expenses with similar costs of investing in other mutual funds.
The expense examples provide information about actual account values and actual expenses. In order to estimate the expenses a shareholder paid during the period covered by this report, shareholders can divide their account value by $1,000 and then multiply the result by the number corresponding to their Fund under the headings entitled “Expenses Paid During the Period.”
The expense examples also provide information about hypothetical account values and hypothetical expenses based on a Fund’s actual expense ratio and an assumed rate of return of 5% per year before expenses. In order to assist shareholders in comparing the ongoing expenses of investing in these Funds and other funds, compare the 5% hypothetical examples with the 5% hypothetical examples that appear in shareholder reports of other funds.
The expenses shown in the expense examples are intended to highlight shareholders’ ongoing costs only and do not reflect any transactional expenses, such as sales charges, if any. Therefore, the hypothetical examples are useful in comparing ongoing expenses only, and will not help shareholders determine the relative total expenses of owning different funds. If these transactional expenses were included, shareholder expenses would have been higher.
|
| Derivative Financial Instruments |
The Funds may invest in various derivative financial instruments. These instruments are used to obtain exposure to a security, commodity, index, market, and/or other asset without owning or taking physical custody of securities, commodities and/or other referenced assets or to manage market, equity, credit, interest rate, foreign currency exchange rate, commodity and/or other risks. Derivative financial instruments may give rise to a form of economic leverage and involve risks, including the imperfect correlation between the value of a derivative financial instrument and the underlying asset, possible default of the counterparty to the
transaction or illiquidity of the instrument. The Funds’ successful use of a derivative financial instrument depends on the investment adviser’s ability to predict pertinent market movements accurately, which cannot be assured. The use of these instruments may result in losses greater than if they had not been used, may limit the amount of appreciation a Fund can realize on an investment and/or may result in lower distributions paid to shareholders. The Funds’ investments in these instruments, if any, are discussed in detail in the Notes to Financial Statements.
| | | | | | |
| 22 | | BLACKROCK SERIES FUND, INC. | | JUNE 30, 2017 | | |
| | | | |
| Schedule of Investments June 30, 2017 (Unaudited) | | | BlackRock Advantage Large Cap Core Portfolio | |
| | | (Percentages shown are based on Net Assets) | |
| | | | | | | | |
| Common Stocks | | Shares | | | Value | |
Aerospace & Defense — 1.5% | | | | | | | | |
L3 Technologies, Inc. | | | 2,818 | | | $ | 470,831 | |
Raytheon Co. | | | 13,489 | | | | 2,178,204 | |
| | | | | | | | |
| | | | | | | | 2,649,035 | |
Air Freight & Logistics — 0.2% | | | | | | | | |
XPO Logistics, Inc. (a) | | | 6,658 | | | | 430,306 | |
Auto Components — 0.2% | | | | | | | | |
Delphi Automotive PLC | | | 3,769 | | | | 330,353 | |
Automobiles — 0.3% | | | | | | | | |
Thor Industries, Inc. | | | 5,818 | | | | 608,097 | |
Banks — 5.3% | | | | | | | | |
Bank of America Corp. (b) | | | 154,670 | | | | 3,752,294 | |
Citigroup, Inc. | | | 4,597 | | | | 307,447 | |
Citizens Financial Group, Inc. | | | 58,065 | | | | 2,071,759 | |
JPMorgan Chase & Co. | | | 5,556 | | | | 507,818 | |
Popular, Inc. | | | 7,512 | | | | 313,325 | |
SunTrust Banks, Inc. | | | 29,371 | | | | 1,665,923 | |
Synovus Financial Corp. | | | 15,543 | | | | 687,622 | |
U.S. Bancorp | | | 1,161 | | | | 60,279 | |
Western Alliance Bancorp (a) | | | 506 | | | | 24,895 | |
| | | | | | | | |
| | | | | | | | 9,391,362 | |
Beverages — 1.3% | | | | | | | | |
Coca-Cola European Partners PLC | | | 5,535 | | | | 225,108 | |
Dr. Pepper Snapple Group, Inc. | | | 21,951 | | | | 1,999,956 | |
| | | | | | | | |
| | | | | | | | 2,225,064 | |
Biotechnology — 4.8% | | | | | | | | |
Amgen, Inc. | | | 11,337 | | | | 1,952,571 | |
Biogen, Inc. (a) | | | 7,081 | | | | 1,921,500 | |
Celgene Corp. (a) | | | 15,048 | | | | 1,954,284 | |
Gilead Sciences, Inc. | | | 36,719 | | | | 2,598,971 | |
| | | | | | | | |
| | | | | | | | 8,427,326 | |
| | | | | | | | |
| Common Stocks | | Shares | | | Value | |
Building Products — 0.9% | | | | | | | | |
JELD-WEN Holding, Inc. (a) | | | 3,661 | | | $ | 118,836 | |
Masco Corp. | | | 36,961 | | | | 1,412,280 | |
| | | | | | | | |
| | | | | | | | 1,531,116 | |
Capital Markets — 3.8% | | | | | | | | |
CME Group, Inc. | | | 3,493 | | | | 437,463 | |
Evercore Partners, Inc., Class A | | | 7,543 | | | | 531,781 | |
Intercontinental Exchange, Inc. | | | 31,067 | | | | 2,047,937 | |
Morningstar, Inc. | | | 2,317 | | | | 181,514 | |
S&P Global, Inc. | | | 14,866 | | | | 2,170,287 | |
SEI Investments Co. | | | 23,086 | | | | 1,241,565 | |
| | | | | | | | |
| | | | | | | | 6,610,547 | |
Chemicals — 1.7% | | | | | | | | |
AdvanSix, Inc. (a) | | | 4,088 | | | | 127,709 | |
Cabot Corp. | | | 18,473 | | | | 987,012 | |
Eastman Chemical Co. | | | 22,409 | | | | 1,882,132 | |
| | | | | | | | |
| | | | | | | | 2,996,853 | |
Commercial Services & Supplies — 0.2% | | | | | | | | |
LSC Communications, Inc. | | | 5,851 | | | | 125,211 | |
R.R. Donnelley & Sons Co. | | | 11,984 | | | | 150,279 | |
| | | | | | | | |
| | | | | | | | 275,490 | |
Communications Equipment — 0.0% | | | | | | | | |
Cisco Systems, Inc. | | | 1,373 | | | | 42,975 | |
Consumer Finance — 0.3% | | | | | | | | |
Discover Financial Services | | | 9,807 | | | | 609,897 | |
Containers & Packaging — 1.4% | | | | | | | | |
Avery Dennison Corp. | | | 8,821 | | | | 779,512 | |
Packaging Corp. of America | | | 4,463 | | | | 497,134 | |
Silgan Holdings, Inc. | | | 22,563 | | | | 717,052 | |
WestRock Co. | | | 7,735 | | | | 438,265 | |
| | | | | | | | |
| | | | | | | | 2,431,963 | |
Diversified Financial Services — 0.6% | | | | | | | | |
Berkshire Hathaway, Inc., Class B (a) | | | 6,218 | | | | 1,053,143 | |
| | | | | | | | | | |
| Portfolio Abbreviations | | | | | | | | |
| ABS | | Asset-Backed Security | | EUR | | Euro | | PIK | | Payment-in-kind |
| ADR | | American Depositary Receipts | | EURIBOR | | Euro Interbank Offered Rate | | PLN | | Polish Zloty |
| AGC | | Assured Guaranty Corporation | | FKA | | Formerly Known As | | PSF | | Permanent School Fund |
| AGM | | Assured Guaranty Municipal Corporation | | HUF | | Hungarian Forint | | RB | | Revenue Bonds |
| AKA | | Also Known As | | GBP | | British Pound | | RPI | | Retail Price Index |
| AMBAC | | AMBAC Assurance Corp. | | GO | | General Obligation Bonds | | RUB | | Russian Ruble |
| AUD | | Australian Dollar | | IDR | | Indonesian Rupiah | | S&P | | S&P Global Ratings |
| BRL | | Brazilian Real | | JPY | | Japanese Yen | | SEK | | Swedish Krona |
| BZDIOVER | | Overnight Brazil CETIP - | | KRW | | South Korean Won | | SGD | | Singapore Dollar |
| | Interbank Rate | | LIBOR | | London Interbank Offered Rate | | SGX | | Singapore Exchange Ltd. |
| CAD | | Canadian Dollar | | MXIBTIIE | | Mexico Interbank TIIE 28 Day | | SPDR | | S&P Depositary Receipts |
| CHF | | Swiss Franc | | MXN | | Mexican Peso | | TBA | | To Be Announced |
| CLO | | Collateralized Loan Obligation | | MYR | | Malaysian Ringgit | | TOPIX | | Tokyo Price Index |
| CLP | | Chilean Peso | | NOK | | Norwegian Krone | | TRY | | Turkish Lira |
| COP | | Colombian Peso | | NVDR | | Non-Voting Depository Receipts | | TWD | | Taiwan New Dollar |
| CNH | | Chinese Yuan Offshore | | NZD | | New Zealand Dollar | | USD | | US Dollar |
| CVA | | Certification Van Aandelon | | OTC | | Over-the-counter | | ZAR | | South African Rand |
| | (Dutch Certificate) | | PCL | | Public Company Limited | | | | |
| ETF | | Exchange-Traded Fund | | | | | | | | |
See Notes to Financial Statements.
| | | | | | |
| | | BLACKROCK SERIES FUND, INC. | | JUNE 30, 2017 | | 23 |
| | | | |
| Schedule of Investments (continued) | | | BlackRock Advantage Large Cap Core Portfolio | |
| | | | |
| | | | | | | | |
| Common Stocks | | Shares | | | Value | |
Diversified Telecommunication Services — 0.3% | | | | | | | | |
Level 3 Communications, Inc. (a) | | | 2,212 | | | $ | 131,172 | |
Verizon Communications, Inc. | | | 3,354 | | | | 149,790 | |
Zayo Group Holdings, Inc. (a) | | | 5,985 | | | | 184,937 | |
| | | | | | | | |
| | | | | | | | 465,899 | |
Electric Utilities — 1.8% | | | | | | | | |
Portland General Electric Co. | | | 27,465 | | | | 1,254,876 | |
Westar Energy, Inc. | | | 37,158 | | | | 1,970,117 | |
| | | | | | | | |
| | | | | | | | 3,224,993 | |
Electrical Equipment — 1.2% | | | | | | | | |
Rockwell Automation, Inc. | | | 12,908 | | | | 2,090,580 | |
Electronic Equipment, Instruments & Components — 1.8% | | | | | |
CDW Corp. | | | 4,018 | | | | 251,246 | |
Dolby Laboratories, Inc., Class A | | | 5,283 | | | | 258,656 | |
Flex Ltd. (a) | | | 7,965 | | | | 129,909 | |
FLIR Systems, Inc. | | | 1,578 | | | | 54,693 | |
TE Connectivity Ltd | | | 6,368 | | | | 501,034 | |
Tech Data Corp. (a) | | | 9,130 | | | | 922,130 | |
Zebra Technologies Corp., Class A (a) | | | 10,265 | | | | 1,031,838 | |
| | | | | | | | |
| | | | | | | | 3,149,506 | |
Equity Real Estate Investment Trusts (REITs) — 3.3% | | | | | |
Brixmor Property Group, Inc. | | | 1,380 | | | | 24,674 | |
Duke Realty Corp. | | | 8,065 | | | | 225,417 | |
Gaming and Leisure Properties, Inc. | | | 12,485 | | | | 470,310 | |
Outfront Media, Inc. | | | 20,139 | | | | 465,614 | |
Prologis, Inc. | | | 2,885 | | | | 169,176 | |
Simon Property Group, Inc. | | | 12,175 | | | | 1,969,428 | |
Ventas, Inc. | | | 29,626 | | | | 2,058,414 | |
Weingarten Realty Investors | | | 12,556 | | | | 377,936 | |
| | | | | | | | |
| | | | | | | | 5,760,969 | |
Food & Staples Retailing — 1.9% | | | | | | | | |
Walgreens Boots Alliance, Inc. | | | 11,076 | | | | 867,362 | |
Wal-Mart Stores, Inc. | | | 33,199 | | | | 2,512,500 | |
| | | | | | | | |
| | | | | | | | 3,379,862 | |
Food Products — 2.0% | | | | | | | | |
Archer-Daniels-Midland Co. | | | 49,881 | | | | 2,064,076 | |
Hershey Co. | | | 2,047 | | | | 219,786 | |
Ingredion, Inc. | | | 4,013 | | | | 478,390 | |
McCormick & Co, Inc., Non-Voting Shares | | | 856 | | | | 83,469 | |
Tyson Foods, Inc., Class A | | | 10,437 | | | | 653,669 | |
| | | | | | | | |
| | | | | | | | 3,499,390 | |
Health Care Equipment & Supplies — 3.0% | | | | | | | | |
Baxter International, Inc. | | | 34,954 | | | | 2,116,115 | |
IDEXX Laboratories, Inc. (a) | | | 11,418 | | | | 1,843,094 | |
Masimo Corp. (a) | | | 9,479 | | | | 864,295 | |
West Pharmaceutical Services, Inc. | | | 5,105 | | | | 482,525 | |
| | | | | | | | |
| | | | | | | | 5,306,029 | |
Health Care Providers & Services — 2.8% | | | | | | | | |
Aetna, Inc. | | | 652 | | | | 98,993 | |
AmerisourceBergen Corp. | | | 1,694 | | | | 160,134 | |
Centene Corp. (a) | | | 6,073 | | | | 485,111 | |
Express Scripts Holding Co. (a) | | | 4,575 | | | | 292,068 | |
Humana, Inc. | | | 2,085 | | | | 501,693 | |
McKesson Corp. | | | 2,369 | | | | 389,795 | |
UnitedHealth Group, Inc. | | | 16,177 | | | | 2,999,539 | |
| | | | | | | | |
| | | | | | | | 4,927,333 | |
Health Care Technology — 0.6% | | | | | | | | |
Veeva Systems, Inc., Class A (a) | | | 16,689 | | | | 1,023,203 | |
Hotels, Restaurants & Leisure — 3.2% | | | | | | | | |
Carnival Corp. | | | 29,428 | | | | 1,929,594 | |
| | | | | | | | |
| Common Stocks | | Shares | | | Value | |
Hotels, Restaurants & Leisure (continued) | | | | | | | | |
Choice Hotels International, Inc. | | | 1,953 | | | $ | 125,480 | |
Extended Stay America, Inc. | | | 42,233 | | | | 817,631 | |
Hilton Grand Vacations, Inc. (a) | | | 5,245 | | | | 189,135 | |
McDonald’s Corp. | | | 17,081 | | | | 2,616,126 | |
| | | | | | | | |
| | | | | | | | 5,677,966 | |
Household Products — 0.5% | | | | | | | | |
Energizer Holdings, Inc. | | | 20,077 | | | | 964,098 | |
Industrial Conglomerates — 2.6% | | | | | | | | |
3M Co. | | | 13,542 | | | | 2,819,309 | |
Honeywell International, Inc. | | | 12,982 | | | | 1,730,371 | |
| | | | | | | | |
| | | | | | | | 4,549,680 | |
Insurance — 4.0% | | | | | | | | |
Aon PLC | | | 1,088 | | | | 144,650 | |
First American Financial Corp. | | | 9,302 | | | | 415,706 | |
FNF Group | | | 1,417 | | | | 63,524 | |
Hartford Financial Services Group, Inc. | | | 2,693 | | | | 141,571 | |
Lincoln National Corp. | | | 23,040 | | | | 1,557,043 | |
Marsh & McLennan Cos., Inc. | | | 28,459 | | | | 2,218,664 | |
Principal Financial Group, Inc. | | | 283 | | | | 18,132 | |
Prudential Financial, Inc. | | | 20,184 | | | | 2,182,698 | |
Unum Group | | | 5,886 | | | | 274,464 | |
| | | | | | | | |
| | | | | | | | 7,016,452 | |
Internet & Direct Marketing Retail — 1.4% | | | | | | | | |
Amazon.com, Inc. (a) | | | 2,438 | | | | 2,359,984 | |
Priceline Group, Inc. (a) | | | 73 | | | | 136,548 | |
| | | | | | | | |
| | | | | | | | 2,496,532 | �� |
Internet Software & Services — 4.7% | | | | | | | | |
Alphabet, Inc., Class A (a) | | | 4,023 | | | | 3,740,103 | |
Alphabet, Inc., Class C (a) | | | 2,267 | | | | 2,060,091 | |
Facebook, Inc., Class A (a) | | | 14,006 | | | | 2,114,626 | |
VeriSign, Inc. (a) | | | 2,492 | | | | 231,656 | |
Yelp, Inc. (a) | | | 4,389 | | | | 131,758 | |
| | | | | | | | |
| | | | | | | | 8,278,234 | |
IT Services — 4.0% | | | | | | | | |
Accenture PLC, Class A (b) | | | 18,046 | | | | 2,231,929 | |
Booz Allen Hamilton Holding Corp | | | 8,261 | | | | 268,813 | |
Fidelity National Information Services, Inc. | | | 24,763 | | | | 2,114,760 | |
Mastercard, Inc., Class A | | | 19,734 | | | | 2,396,694 | |
| | | | | | | | |
| | | | | | | | 7,012,196 | |
Leisure Products — 1.0% | | | | | | | | |
Hasbro, Inc. | | | 16,271 | | | | 1,814,379 | |
Life Sciences Tools & Services — 0.2% | | | | | | | | |
Mettler-Toledo International, Inc. (a) | | | 520 | | | | 306,041 | |
Machinery — 3.2% | | | | | | | | |
Dover Corp. | | | 3,184 | | | | 255,420 | |
Illinois Tool Works, Inc. | | | 12,110 | | | | 1,734,757 | |
Ingersoll-Rand PLC | | | 13,857 | | | | 1,266,391 | |
PACCAR, Inc. (b) | | | 21,955 | | | | 1,449,908 | |
Stanley Black & Decker, Inc. | | | 6,873 | | | | 967,237 | |
| | | | | | | | |
| | | | | | | | 5,673,713 | |
Media — 2.9% | | | | | | | | |
CBS Corp., Class B, Non-Voting Shares | | | 17,991 | | | | 1,147,466 | |
Comcast Corp., Class A | | | 74,536 | | | | 2,900,941 | |
Lions Gate Entertainment Corp., Class B (a) | | | 11,342 | | | | 298,068 | |
Scripps Networks Interactive, Inc., Class A (b) | | | 2,663 | | | | 181,910 | |
Time Warner, Inc. | | | 5,838 | | | | 586,194 | |
| | | | | | | | |
| | | | | | | | 5,114,579 | |
See Notes to Financial Statements.
| | | | | | |
| 24 | | BLACKROCK SERIES FUND, INC. | | JUNE 30, 2017 | | |
| | | | |
| Schedule of Investments (continued) | | | BlackRock Advantage Large Cap Core Portfolio | |
| | | | |
| | | | | | | | |
| Common Stocks | | Shares | | | Value | |
Metals & Mining — 0.3% | | | | | | | | |
Newmont Mining Corp. | | | 3,071 | | | $ | 99,470 | |
Reliance Steel & Aluminum Co. | | | 5,321 | | | | 387,422 | |
| | | | | | | | |
| | | | | | | | 486,892 | |
Multiline Retail — 1.0% | | | | | | | | |
Target Corp. | | | 32,784 | | | | 1,714,275 | |
Multi-Utilities — 1.2% | | | | | | | | |
Black Hills Corp. | | | 2,883 | | | | 194,516 | |
CMS Energy Corp. | | | 43,252 | | | | 2,000,405 | |
| | | | | | | | |
| | | | | | | | 2,194,921 | |
Oil, Gas & Consumable Fuels — 5.2% | | | | | | | | |
Anadarko Petroleum Corp. | | | 32,124 | | | | 1,456,502 | |
Chevron Corp. | | | 12,803 | | | | 1,335,737 | |
ConocoPhillips | | | 42,097 | | | | 1,850,584 | |
Devon Energy Corp. | | | 34,150 | | | | 1,091,775 | |
Exxon Mobil Corp. | | | 9,331 | | | | 753,292 | |
Phillips 66 | | | 3,911 | | | | 323,401 | |
Suncor Energy, Inc. | | | 18,624 | | | | 543,821 | |
Tellurian, Inc. (a)(b) | | | 6,894 | | | | 69,147 | |
Valero Energy Corp. | | | 25,384 | | | | 1,712,405 | |
| | | | | | | | |
| | | | | | | | 9,136,664 | |
Paper & Forest Products — 0.4% | | | | | | | | |
Domtar Corp. | | | 16,083 | | | | 617,909 | |
Personal Products — 1.0% | | | | | | | | |
Estee Lauder Cos., Inc., Class A | | | 18,537 | | | | 1,779,181 | |
Herbalife Ltd. (b) | | | 526 | | | | 37,520 | |
| | | | | | | | |
| | | | | | | | 1,816,701 | |
Pharmaceuticals — 2.9% | | | | | | | | |
Bristol-Myers Squibb Co. | | | 29,330 | | | | 1,634,268 | |
Catalent, Inc. (a) | | | 628 | | | | 22,043 | |
Johnson & Johnson | | | 5,972 | | | | 790,036 | |
Merck & Co., Inc. | | | 36,448 | | | | 2,335,952 | |
Zoetis, Inc. | | | 5,362 | | | | 334,482 | |
| | | | | | | | |
| | | | | | | | 5,116,781 | |
Professional Services — 0.7% | | | | | | | | |
Equifax, Inc. | | | 3,735 | | | | 513,264 | |
ManpowerGroup, Inc. | | | 4,892 | | | | 546,192 | |
Robert Half International, Inc. | | | 3,848 | | | | 184,435 | |
| | | | | | | | |
| | | | | | | | 1,243,891 | |
Real Estate Management & Development — 0.1% | | | | | | | | |
CBRE Group, Inc., Class A (a) | | | 6,242 | | | | 227,209 | |
Retail — 0.1% | | | | | | | | |
Blue Apron Holdings, Inc., Class A (a) | | | 25,735 | | | | 240,365 | |
Road & Rail — 0.4% | | | | | | | | |
Norfolk Southern Corp. | | | 4,484 | | | | 545,703 | |
Union Pacific Corp. | | | 784 | | | | 85,385 | |
| | | | | | | | |
| | | | | | | | 631,088 | |
Semiconductors & Semiconductor Equipment — 3.6% | | | | | |
Analog Devices, Inc. | | | 23,781 | | | | 1,850,162 | |
Intel Corp. | | | 80,985 | | | | 2,732,434 | |
KLA-Tencor Corp. | | | 1,610 | | | | 147,331 | |
Maxim Integrated Products, Inc. | | | 34,674 | | | | 1,556,863 | |
| | | | | | | | |
| | | | | | | | 6,286,790 | |
| | | | | | | | |
| Common Stocks | | Shares | | | Value | |
Software — 4.4% | | | | | | | | |
Activision Blizzard, Inc. | | | 7,192 | | | $ | 414,043 | |
Adobe Systems, Inc. (a) | | | 17,232 | | | | 2,437,294 | |
CDK Global, Inc. | | | 5,195 | | | | 322,402 | |
Dell Technologies, Inc., Class V (a) | | | 9,873 | | | | 603,339 | |
Fortinet, Inc. (a) | | | 3,010 | | | | 112,694 | |
Microsoft Corp. | | | 28,256 | | | | 1,947,686 | |
VMware, Inc., Class A (a)(b) | | | 21,948 | | | | 1,918,914 | |
| | | | | | | | |
| | | | | | | | 7,756,372 | |
Specialty Retail — 2.5% | | | | | | | | |
Aaron’s, Inc. | | | 388 | | | | 15,093 | |
Best Buy Co., Inc. | | | 2,692 | | | | 154,332 | |
Home Depot, Inc. | | | 11,961 | | | | 1,834,817 | |
Lowe’s Cos., Inc. | | | 31,309 | | | | 2,427,387 | |
| | | | | | | | |
| | | | | | | | 4,431,629 | |
Technology Hardware, Storage & Peripherals — 3.4% | | | | | |
Apple Inc. | | | 29,894 | | | | 4,305,334 | |
HP, Inc. | | | 11,628 | | | | 203,257 | |
NCR Corp. (a) | | | 23,057 | | | | 941,648 | |
NetApp, Inc. | | | 12,348 | | | | 494,537 | |
| | | | | | | | |
| | | | | | | | 5,944,776 | |
Textiles, Apparel & Luxury Goods — 0.4% | | | | | | | | |
Carter’s, Inc. | | | 619 | | | | 55,060 | |
NIKE, Inc., Class B | | | 10,021 | | | | 591,239 | |
| | | | | | | | |
| | | | | | | | 646,299 | |
Tobacco — 1.1% | | | | | | | | |
Altria Group, Inc. | | | 18,225 | | | | 1,357,216 | |
Philip Morris International, Inc. | | | 1,795 | | | | 210,823 | |
Reynolds American, Inc. | | | 6,194 | | | | 402,858 | |
| | | | | | | | |
| | | | | | | | 1,970,897 | |
Wireless Telecommunication Services — 1.3% | | | | | | | | |
Telephone & Data Systems, Inc. | | | 15,487 | | | | 429,764 | |
T-Mobile U.S., Inc. (a) | | | 29,818 | | | | 1,807,567 | |
| | | | | | | | |
| | | | | | | | 2,237,331 | |
Total Common Stocks — 98.9% | | | | | | | 174,045,951 | |
| | | | | | | | |
Total Long-Term Investments (Cost — $161,638,013) — 98.9% | | | | | 174,045,951 | |
| | | | | | | | |
| Short-Term Securities | | | | | | |
BlackRock Liquidity Funds, T-Fund, Institutional
Class, 0.84% (c)(d) | | | 6,791,609 | | | | 6,791,609 | |
SL Liquidity Series, LLC, Money Market
Series, 1.27% (c)(d)(e) | | | 8,090,229 | | | | 8,091,038 | |
Total Short-Term Securities (Cost — $14,883,280) — 8.5% | | | | | | | 14,882,647 | |
Total Investments (Cost — $176,521,293) — 107.4% | | | | | | | 188,928,598 | |
Liabilities in Excess of Other Assets — (7.4)% | | | | | | | (13,009,013 | ) |
| | | | | | | | |
Net Assets — 100.0% | | | | | | $ | 175,919,585 | |
| | | | | | | | |
|
| Notes to Schedule of Investments |
| (a) | Non-income producing security. |
| (b) | Security, or a portion of the security, is on loan. |
See Notes to Financial Statements.
| | | | | | |
| | | BLACKROCK SERIES FUND, INC. | | JUNE 30, 2017 | | 25 |
| | |
| Schedule of Investments (continued) | | BlackRock Advantage Large Cap Core Portfolio |
| (c) | During the six months ended June 30, 2017, investments in issuers considered to be an affiliate of the Fund for purposes of Section 2(a)(3) of the Investment Company Act of 1940, as amended, were as follows: |
| | | | | | | | | | | | | | | | | | | | | | | | | | |
| Affiliate | | Shares Held at
December 31,
2016 | | | Net Activity | | | Shares Held at
June 30, 2017 | | | Value at
June 30, 2017 | | | Income | | | Net Realized Loss | | | Change in
Unrealized
Appreciation
(Depreciation) |
BlackRock Liquidity Funds, T-Fund, Institutional Class | | | 5,419,707 | | | | 1,371,902 | | | | 6,791,609 | | | $ | 6,791,609 | | | $ | 15,595 | | | | — | | | — |
SL Liquidity Series, LLC, Money Market Series | | | 5,189,486 | | | | 2,900,743 | | | | 8,090,229 | | | | 8,091,038 | | | | 9,097 | 1 | | $ | (1,055 | ) | | $(263) |
Total | | | | | | | | | | | | | | $ | 14,882,647 | | | $ | 24,692 | | | $ | (1,055 | ) | | $(263) |
| | | | | | | | | | | | | | | |
| | 1 | | Represents securities lending income earned from the reinvestment of cash collateral from loaned securities, net of fees and collateral investment expenses, and other payments to and from borrowers of securities. |
| (d) | Current yield as of period end. |
| (e) | Security was purchased with the cash collateral from loaned securities. |
| • | | For Fund compliance purposes, the Fund’s industry classifications refer to one or more of the industry sub-classifications used by one or more widely recognized market indexes or ratings group indexes, and/or as defined by the investment adviser. These definitions may not apply for purposes of this report, which may combine such industry sub-classifications for reporting ease. |
| | |
| Derivative Financial Instruments Outstanding as of Period End |
| | | | | | | | | | |
| Futures Contracts |
Contracts Short | | Issue | | Expiration | | Notional Value | | | Unrealized
Depreciation |
17 | | S&P 500 E-Mini Index | | September 2017 | | USD | $2,057,765 | | | $(6,506) |
|
| Derivative Financial Instruments Categorized by Risk Exposure |
As of period end, fair values of derivative financial instruments located in the Statements of Assets and Liabilities were as follows:
| | | | | | | | | | | | | | | | | | | | | | | | | | | | | | | | | | | |
Liabilities — Derivative Financial Instruments | | Commodity Contracts | | Credit
Contracts | | Equity
Contracts | | Foreign
Currency
Exchange
Contracts | | Interest
Rate
Contracts | | Other Contracts | | Total |
Futures contracts Net unrealized depreciation1 | | — | | — | | $6,506 | | — | | — | | — | | $6,506 |
| | 1 | | Includes cumulative appreciation (depreciation) on futures contracts, if any, as reported in the Schedule of Investments. Only current day’s variation margin is reported within the Statements of Assets and Liabilities. |
For the six months ended June 30, 2017, the effect of derivative financial instruments in the Statements of Operations were we follows:
| | | | | | | | | | | | | | | | | | | | | | | | | | | | | | | | | | | |
| Net Realized Gain from: | | Commodity
Contracts | | Credit
Contracts | | Equity
Contracts | | Foreign
Currency
Exchange
Contracts | | Interest
Rate
Contracts | | Other
Contracts | | Total |
Futures contracts | | | | — | | | | | — | | | | $ | 108,049 | | | | | — | | | | | — | | | | | — | | | | $ | 108,049 | |
| | | | | | | |
Net Change in Unrealized Depreciation on: | | | | | | | | | | | | | | | | | | | | | | | | | | | | | | | | | | | |
Futures contracts | | | | — | | | | | — | | | | $ | 10,773 | | | | | — | | | | | — | | | | | — | | | | $ | 10,773 | |
| | |
| Average Quarterly Balances of Outstanding Derivative Financial Instruments | | |
| | | | |
Futures contracts:
Average notional value of contracts — long | | $ | 1,913,583 | |
For more information about the Fund’s investment risks regarding derivative financial instruments, refer to the Notes to Financial Statements.
See Notes to Financial Statements.
| | | | | | |
| 26 | | BLACKROCK SERIES FUND, INC. | | JUNE 30, 2017 | | |
| | |
| Schedule of Investments (concluded) | | BlackRock Advantage Large Cap Core Portfolio |
|
| Fair Value Hierarchy as of Period End |
Various inputs are used in determining the fair value of investments and derivative financial instruments. For information about the Fund’s policy regarding valuation of investments and derivative financial instruments, refer to the Notes to Financial Statements.
The following tables summarize the Fund’s investments and derivative financial instruments categorized in the disclosure hierarchy:
| | | | | | | | | | | | | | | | | | | | |
| | | Level 1 | | Level 2 | | Level 3 | | Total |
Assets: | | | | | | | | | | | | | | | | | | | | |
Investments: | | | | | | | | | | | | | | | | | | | | |
Long-Term Investments: | | | | | | | | | | | | | | | | | | | | |
Common Stocks1 | | | $ | 174,045,951 | | | | | — | | | | | — | | | | $ | 174,045,951 | |
Short-Term Securities | | | | 6,791,609 | | | | | — | | | | | — | | | | | 6,791,609 | |
| | | | | |
Subtotal | | | $ | 180,837,560 | | | | | — | | | | | — | | | | $ | 180,837,560 | |
| | | | | |
Investments Valued at NAV2 | | | | | | | | | | | | | | | | | | | 8,091,038 | |
| | | | | | | | | | | | | | | | | | | | |
Total Investments | | | | | | | | | | | | | | | | | | $ | 188,928,598 | |
| | | | | | | | | | | | | | | | | | | | |
1 See above Schedule of Investments for values in each industry. 2 As of June 30, 2017, certain investments of the Fund were fair valued using NAV per share as no quoted market value is available and therefore have been excluded from the fair value of hierarchy. | |
| | | Level 1 | | Level 2 | | Level 3 | | Total |
Derivative Financial Instruments3 | | | | | | | | | | | | | | | | | | | | |
Liabilities: | | | | | | | | | | | | | | | | | | | | |
Equity contracts | | | $ | (6,506 | ) | | | | — | | | | | — | | | | $ | (6,506 | ) |
| | | | | |
| | 3 | Derivative financial instruments are futures contracts, which are valued at the unrealized appreciation (depreciation) on the instrument. |
During the six months ended June 30, 2017, there were no transfers between levels.
See Notes to Financial Statements.
| | | | | | |
| | | BLACKROCK SERIES FUND, INC. | | JUNE 30, 2017 | | 27 |
| | | | |
| Schedule of Investments June 30, 2017 (Unaudited) | | | BlackRock Balanced Capital Portfolio | |
| | | (Percentages shown are based on Net Assets) | |
| | | | | | | | | | | | |
| Asset-Backed Securities | | | | | Par
(000) | | | Value | |
ACE Securities Corp. Home Equity Loan Trust,
Series 2007-HE4, Class A2A, 1.35%, 5/25/37 (a) | | | USD | | | | 54 | | | $ | 17,523 | |
Ajax Mortgage Loan Trust, Series 2016-B, Class A,
4.00%, 9/25/65 (b)(c) | | | | | | | 90 | | | | 90,294 | |
AJAX Mortgage Loan Trust, Series 2017-A, Class A, 3.47%, 4/25/57 (b)(c) | | | | | | | 160 | | | | 159,678 | |
Allegro CLO II Ltd., Series 2014-1A, Class A1R,
2.33%, 1/21/27 (a)(c)(d) | | | | | | | 250 | | | | 250,057 | |
ALM XI Ltd., Series 2014-11A, Class A1R,
2.23%, 10/17/26 (a)(c)(d) | | | | | | | 250 | | | | 250,000 | |
ALM XIV Ltd.: | | | | | | | | | | | | |
Series 2014-14A, Class A1R, 2.32%, 7/28/26 (a)(c) | | | | | | | 250 | | | | 250,063 | |
Series 2014-14A, Class BR, 3.27%, 7/28/26 (a)(c) | | | | | | | 250 | | | | 250,423 | |
AMMC CLO 18 Ltd., Series 2016-18A, Class AL1, 2.77%, 5/26/28 (a)(c) | | | | | | | 100 | | | | 100,693 | |
Anchorage Capital CLO 6 Ltd., Series 2015-6A, Class AR, 0.00%, 7/15/30 (a)(c)(d) | | | | | | | 250 | | | | 250,000 | |
Anchorage Capital CLO Ltd., Series 2013-1A, Class A2A, 2.91%, 7/13/25 (a)(c) | | | | | | | 250 | | | | 250,073 | |
Apidos CLO XII, Series 2013-12A, Class A,
2.26%, 4/15/25 (a)(c) | | | | | | | 500 | | | | 500,542 | |
Arbor Realty Commercial Real Estate Notes Ltd., Series 2016-FL1A, Class A,
2.86%, 9/15/26 (a)(c)(d) | | | | | | | 100 | | | | 100,000 | |
Argent Mortgage Loan Trust, Series 2005-W1, Class A2, 1.70%, 5/25/35 (a)(d) | | | | | | | 100 | | | | 76,370 | |
Atlas Senior Loan Fund IV Ltd., Series 2013-2A, Class A1L, 2.68%, 2/17/26 (a)(c) | | | | | | | 250 | | | | 249,977 | |
Atlas Senior Loan Fund V Ltd., Series 2014-1A, Class BR, 3.16%, 7/16/26 (a)(c) | | | | | | | 250 | | | | 249,995 | |
Atrium X, Series 10A, Class B1R,
2.54%, 7/16/25 (a)(c)(d) | | | | | | | 250 | | | | 250,000 | |
B2R Mortgage Trust: | | | | | | | | | | | | |
Series 2015-1, Class A1, 2.52%, 5/15/48 (c) | | | | | | | 84 | | | | 83,352 | |
Series 2015-2, Class A, 3.34%, 11/15/48 (c) | | | | | | | 95 | | | | 96,153 | |
Babson CLO Ltd., Series 2013-IA, Class A,
2.26%, 4/20/25 (a)(c) | | | | | | | 250 | | | | 250,271 | |
Battalion CLO IV Ltd., Series 2013-4A, Class A1R, 2.29%, 10/22/25 (a)(c) | | | | | | | 250 | | | | 250,077 | |
BCMSC Trust: | | | | | | | | | | | | |
Series 2000-A, Class A2, 7.58%, 6/15/30 (a) | | | | | | | 53 | | | | 22,352 | |
Series 2000-A, Class A3, 7.83%, 6/15/30 (a) | | | | | | | 49 | | | | 21,435 | |
Series 2000-A, Class A4, 8.29%, 6/15/30 (a) | | | | | | | 83 | | | | 38,767 | |
Bear Stearns Asset Backed Securities I Trust, Series 2004-HE7, Class M2, 2.94%, 8/25/34 (a) | | | | | | | 6 | | | | 6,276 | |
Bear Stearns Asset-Backed Securities I Trust: | | | | | | | | | | | | |
Series 2006-HE7, Class 1A2,
1.39%, 9/25/36-1/25/37 (a) | | | | | | | 293 | | | | 303,887 | |
Series 2006-HE9, Class 2A,
1.36%, 11/25/36-3/25/37 (a) | | | | | | | 213 | | | | 197,034 | |
Series 2007-HE1, Class 21A2, 1.38%, 1/25/37 (a) | | | | | | | 65 | | | | 61,015 | |
Bear Stearns Asset-Backed Securities Trust, Series 2005-4, Class M2, 2.42%, 1/25/36 (a) | | | | | | | 24 | | | | 23,232 | |
BlueMountain CLO Ltd., Series 2013-3A, Class A, 2.57%, 10/29/25 (a)(c) | | | | | | | 250 | | | | 249,999 | |
Bsprt Issuer Ltd., Series 2017-FL1, Class A,
2.43%, 6/15/27 (a)(c)(d) | | | | | | | 100 | | | | 100,125 | |
Carrington Mortgage Loan Trust: | | | | | | | | | | | | |
Series 2005-FRE1, Class M1, 1.69%, 12/25/35 (a) | | | | | | | 70 | | | | 67,398 | |
| | | | | | | | | | | | |
| Asset-Backed Securities | | | | | Par
(000) | | | Value | |
Series 2006-FRE2, Class A2, 1.34%, 10/25/36 (a) | | | USD | | | | 84 | | | $ | 54,240 | |
Series 2006-FRE2, Class A3, 1.38%, 10/25/36 (a) | | | | | | | 170 | | | | 130,648 | |
Series 2006-NC5, Class A5, 1.28%, 1/25/37 (a) | | | | | | | 50 | | | | 43,646 | |
Series 2007-HE1, Class A2, 1.37%, 6/25/37 (a) | | | | | | | 54 | | | | 51,066 | |
Cavalry CLO IV Ltd., Series 2014-4A, Class A,
2.66%, 10/15/26 (a)(c) | | | | | | | 250 | | | | 249,998 | |
C-BASS Trust: | | | | | | | | | | | | |
Series 2007-CB1, Class AF4, 3.77%, 1/25/37 (b) | | | | | | | 78 | | | | 38,980 | |
Series 2007-CB5, Class A2, 1.39%, 4/25/37 (a) | | | | | | | 67 | | | | 50,061 | |
CHLUPA Trust, Series 2013-VM, Class A, 3.33%, 8/15/20 (c)(d) | | | | | | | 8 | | | | 7,779 | |
CIFC Funding Ltd.: | | | | | | | | | | | | |
Series 2013-1A, Class A2, 3.06%, 4/16/25 (a)(c) | | | | | | | 250 | | | | 250,228 | |
Series 2014-2A, Class A1LR, 2.39%, 5/24/26 (a)(c)(d) | | | | | | | 480 | | | | 480,019 | |
Series 2014-5A, Class A1R, 2.56%, 1/17/27 (a)(c) | | | | | | | 250 | | | | 250,824 | |
Series 2015-2A, Class A, 2.61%, 4/15/27 (a)(c) | | | | | | | 250 | | | | 250,563 | |
Citigroup Mortgage Loan Trust: | | | | | | | | | | | | |
Series 2006-NC1, Class A2D, 1.47%, 8/25/36 (a) | | | | | | | 90 | | | | 72,049 | |
Series 2007-AHL2, Class A3B, 1.22%, 5/25/37 (a) | | | | | | | 235 | | | | 175,494 | |
Series 2007-AHL2, Class A3C, 1.29%, 5/25/37 (a) | | | | | | | 107 | | | | 80,150 | |
Conseco Finance Corp., Series 2001-D, Class B1, 3.66%, 11/15/32 (a) | | | | | | | 108 | | | | 107,328 | |
Conseco Finance Securitizations Corp.: | | | | | | | | | | | | |
Series 2000-1, Class A5, 8.06%, 9/01/29 (a) | | | | | | | 32 | | | | 17,936 | |
Series 2000-4, Class A5, 7.97%, 5/01/32 | | | | | | | 96 | | | | 50,867 | |
Series 2000-4, Class A6, 8.31%, 5/01/32 (a) | | | | | | | 43 | | | | 23,763 | |
Series 2000-5, Class A6, 7.96%, 5/01/31 | | | | | | | 42 | | | | 29,139 | |
Conseco Financial Corp.: | | | | | | | | | | | | |
Series 1998-8, Class A1, 6.28%, 9/01/30 | | | | | | | 35 | | | | 36,216 | |
Series 1998-8, Class M1, 6.98%, 9/01/30 (a) | | | | | | | 64 | | | | 53,019 | |
Countrywide Asset-Backed Certificates: | | | | | | | | | | | | |
Series 2006-8, Class 2A3, 1.38%, 1/25/46 (a) | | | | | | | 65 | | | | 61,795 | |
Series 2006-S3, Class A4, 6.40%, 1/25/29 (b) | | | | | | | 29 | | | | 28,921 | |
Series 2006-SPS1, Class A, 1.44%, 12/25/25 (a) | | | | | | | 5 | | | | 4,952 | |
Credit Suisse First Boston Mortgage Securities Corp., Series 2001-MH29, Class B1, 8.10%, 9/25/31 (a) | | | | | | | 30 | | | | 32,562 | |
Credit-Based Asset Servicing & Securitization LLC,
Series 2006-MH1, Class B1,
6.25%, 10/25/36 (b)(c) | | | | | | | 100 | | | | 103,256 | |
CWHEQ Home Equity Loan Trust: | | | | | | | | | | | | |
Series 2006-S5, Class A4, 5.84%, 6/25/35 | | | | | | | 27 | | | | 28,326 | |
Series 2006-S5, Class A5, 6.16%, 6/25/35 | | | | | | | 21 | | | | 21,240 | |
Series 2007-S1, Class A3, 5.81%, 11/25/36 (a) | | | | | | | 15 | | | | 14,503 | |
See Notes to Financial Statements.
| | | | | | |
| 28 | | BLACKROCK SERIES FUND, INC. | | JUNE 30, 2017 | | |
| | | | |
| Schedule of Investments (continued) | | | BlackRock Balanced Capital Portfolio | |
| | | | |
| | | | | | | | | | | | |
| Asset-Backed Securities | | | | | Par
(000) | | | Value | |
CWHEQ Revolving Home Equity Loan Resuritization Trust, Series 2006-RES, Class 4Q1B,
1.29%, 12/15/33 (a)(c)(d) | | | USD | | | | 42 | | | $ | 36,134 | |
CWHEQ Revolving Home Equity Loan Trust, Series 2005-B, Class 2A, 1.34%, 5/15/35 (a) | | | | | | | 32 | | | | 27,935 | |
DCP Rights LLC, Series 2014-1A, Class A,
5.46%, 10/25/44 (c) | | | | | | | 287 | | | | 291,307 | |
First Franklin Mortgage Loan Trust, Series 2006-FFH1, Class M2, 1.62%, 1/25/36 (a) | | | | | | | 56 | | | | 22,111 | |
Ford Credit Floorplan Master Owner Trust, Series 2012-5, Class C, 2.14%, 9/15/19 | | | | | | | 115 | | | | 115,084 | |
GCAT LLC, Series 2017-4, Class A1, 3.23%, 5/25/22 (b)(c) | | | | | | | 99 | | | | 98,918 | |
GE-WMC Mortgage Securities Trust, Series 2006-1, Class A2B, 1.17%, 8/25/36 (a) | | | | | | | 369 | | | | 234,001 | |
GSAA Home Equity Trust, Series 2007-4, Class A3B, 1.57%, 3/25/37 (a) | | | | | | | 50 | | | | 7,051 | |
GSAMP Trust, Series 2007-H1, Class A1B, 1.42%, 1/25/47 (a) | | | | | | | 33 | | | | 21,420 | |
GT Loan Financing I Ltd., Series 2013-1A, Class A, 2.44%, 10/28/24 (a)(c) | | | | | | | 280 | | | | 280,049 | |
Home Equity Mortgage Trust, Series 2006-2, Class 1A1, 5.87%, 7/25/36 (b) | | | | | | | 195 | | | | 81,870 | |
Home Loan Mortgage Loan Trust, Series 2005-1, Class A3, 1.88%, 4/15/36 (a) | | | | | | | 52 | | | | 47,839 | |
Invitation Homes Trust, Series 2014-SFR2, Class A, 2.31%, 9/17/31 (a)(c) | | | | | | | 95 | | | | 95,634 | |
Lehman ABS Manufactured Housing Contract Trust: | | | | | | | | | | | | |
Series 2001-B, Class M1, 6.63%, 4/15/40 (a) | | | | | | | 130 | | | | 139,097 | |
Series 2001-B, Class M2, 7.17%, 4/15/40 (a) | | | | | | | 23 | | | | 15,626 | |
Series 2002-A, Class C, 0.00%, 6/15/33 | | | | | | | 10 | | | | 7,843 | |
Lendmark Funding Trust, Series 2017-1A, Class A, 2.83%, 1/22/24 (c) | | | | | | | 210 | | | | 209,957 | |
Litigation Fee Residual Funding LLC, Series 2015-1, Class A, 4.00%, 10/01/27 (d) | | | | | | | 170 | | | | 167,806 | |
Long Beach Mortgage Loan Trust: | | | | | | | | | | | | |
Series 2006-10, Class 2A4, 1.44%, 11/25/36 (a) | | | | | | | 18 | | | | 8,704 | |
Series 2006-2, Class 2A3, 1.41%, 3/25/46 (a) | | | | | | | 342 | | | | 170,627 | |
Series 2006-2, Class 2A4, 1.51%, 3/25/46 (a) | | | | | | | 108 | | | | 55,161 | |
Series 2006-3, Class 2A3, 1.40%, 5/25/46 (a) | | | | | | | 33 | | | | 15,005 | |
Series 2006-5, Class 2A3, 1.37%, 6/25/36 (a) | | | | | | | 32 | | | | 17,088 | |
Merrill Lynch First Franklin Mortgage Loan Trust, Series 2007-2, Class A2C, 1.46%, 5/25/37 (a) | | | | | | | 28 | | | | 17,602 | |
Morgan Stanley ABS Capital I, Inc., Trust, Series 2005-HE1, Class A2MZ, 1.82%, 12/25/34 (a) | | | | | | | 78 | | | | 74,434 | |
Morgan Stanley Mortgage Loan Trust, Series 2007-9SL, Class A, 1.54%, 7/25/37 (a) | | | | | | | 26 | | | | 23,552 | |
Navient Private Education Loan Trust: | | | | | | | | | | | | |
Series 2014-CTA, Class B, 2.91%, 10/17/44 (a)(c) | | | | | | | 250 | | | | 239,702 | |
Series 2016-AA, Class B, 3.50%, 12/16/58 (a)(c) | | | | | | | 100 | | | | 90,838 | |
| | | | | | | | | | | | |
| Asset-Backed Securities | | | | | Par
(000) | | | Value | |
Northwoods Capital IX Ltd., Series 2012-9A, Class A, 2.58%, 1/18/24 (a)(c) | | | USD | | | | 217 | | | $ | 216,851 | |
Oakwood Mortgage Investors, Inc., Series 2001-D, Class A4, 6.93%, 9/15/31 (a)(d) | | | | | | | 15 | | | | 13,410 | |
Octagon Investment Partners XVI Ltd., Series 2013-1A, Class A, 2.28%, 7/17/25 (a)(c) | | | | | | | 305 | | | | 305,377 | |
OFSI Fund VI Ltd., Series 2014-6A, Class A2, 3.06%, 3/20/25 (a)(c) | | | | | | | 210 | | | | 210,191 | |
OHA Loan Funding Ltd., Series 2013-2A, Class A, 2.46%, 8/23/24 (a)(c) | | | | | | | 285 | | | | 285,055 | |
OneMain Financial Issuance Trust, Series 2014-2A, Class D, 5.31%, 9/18/24 (c) | | | | | | | 100 | | | | 100,776 | |
Option One Mortgage Loan Trust, Series 2007-CP1, Class 2A3, 1.43%, 3/25/37 (a) | | | | | | | 40 | | | | 26,214 | |
Ownit Mortgage Loan Trust Series, Series 2006-2, Class A2C, 6.00%, 1/25/37 (b) | | | | | | | 30 | | | | 27,844 | |
OZLM Funding II Ltd., Series 2012-2A, Class A1R, 2.61%, 10/30/27 (a)(c) | | | | | | | 250 | | | | 250,707 | |
OZLM Funding III Ltd., Series 2013-3A, Class BR, 4.15%, 1/22/29 (a)(c) | | | | | | | 250 | | | | 253,031 | |
OZLM Funding IV Ltd., Series 2013-4A, Class A1, 2.30%, 7/22/25 (a)(c) | | | | | | | 495 | | | | 495,251 | |
OZLM IX Ltd., Series 2014-9A, Class CR,
4.71%, 1/20/27 (a)(c) | | | | | | | 250 | | | | 250,291 | |
Palmer Square CLO Ltd., Series 2013-1A, Class A2R, 2.68%, 5/15/25 (a)(c) | | | | | | | 76 | | | | 76,001 | |
Preston Ridge Partners Mortgage LLC, Series 2017-1A, Class A1, 4.25%, 1/25/22 (b)(c)(d) | | | | | | | 81 | | | | 81,346 | |
Pretium Mortgage Credit Partners I LLC, Series 2017-NPL2, Class A1, 3.25%, 3/28/57 (b)(c) | | | | | | | 297 | | | | 297,011 | |
Progress Residential Trust: | | | | | | | | | | | | |
Series 2016-SFR1, Class A, 2.71%, 9/17/33 (a)(c) | | | | | | | 100 | | | | 101,240 | |
Series 2016-SFR1, Class E, 5.06%, 9/17/33 (a)(c) | | | | | | | 100 | | | | 104,362 | |
Series 2016-SFR2, Class E, 4.72%, 1/17/34 (a)(c) | | | | | | | 100 | | | | 104,235 | |
RCO Mortgage LLC, Series 2015-NQM1, Class A, 4.52%, 11/25/45 (a)(c) | | | | | | | 16 | | | | 15,593 | |
Rockford Tower CLO Ltd., Series 2017-1A, Class B, 3.17%, 4/15/29 (a)(c)(d) | | | | | | | 250 | | | | 248,725 | |
Scholar Funding Trust, Series 2013-A, Class A, 1.69%, 1/30/45 (a)(c) | | | | | | | 334 | | | | 330,589 | |
SG Mortgage Securities Trust, Series 2006-FRE2, Class A2C, 1.18%, 7/25/36 (a) | | | | | | | 18 | | | | 6,724 | |
SLM Private Credit Student Loan Trust: | | | | | | | | | | | | |
Series 2004-B, Class A3, 1.58%, 3/15/24 (a) | | | | | | | 210 | | | | 204,553 | |
Series 2005-A, Class A3, 1.45%, 6/15/23 (a) | | | | | | | 121 | | | | 120,623 | |
Series 2006-C, Class A4, 1.42%, 3/15/23 (a) | | | | | | | 3 | | | | 2,820 | |
Sound Point CLO XII Ltd., Series 2016-2A, Class A, 2.82%, 10/20/28 (a)(c) | | | | | | | 250 | | | | 252,764 | |
Sound Point CLO XIV Ltd., Series 2016-3A, Class C, 3.80%, 1/23/29 (a)(c) | | | | | | | 250 | | | | 250,950 | |
Springleaf Funding Trust, Series 2015-AA, Class B, 3.62%, 11/15/24 (c) | | | | | | | 320 | | | | 322,675 | |
See Notes to Financial Statements.
| | | | | | |
| | | BLACKROCK SERIES FUND, INC. | | JUNE 30, 2017 | | 29 |
| | | | |
| Schedule of Investments (continued) | | | BlackRock Balanced Capital Portfolio | |
| | | | |
| | | | | | | | | | | | |
| Asset-Backed Securities | | | | | Par
(000) | | | Value | |
Stanwich Mortgage Loan Co. LLC,
Series 2017-NPB1, Class A1,
3.60%, 5/17/22 (b)(c)(d) | | | USD | | | | 270 | | | $ | 270,000 | |
Structured Asset Investment Loan Trust,
Series 2004-8, Class M4,
2.72%, 9/25/34 (a) | | | | | | | 53 | | | | 49,411 | |
Structured Asset Securities Corp. Mortgage Pass-Through Certificates, Series 2004-23XS, Class 2A1, 1.52%, 1/25/35 (a) | | | | | | | 81 | | | | 75,959 | |
SWAY Residential Trust, Series 2014-1, Class A, 2.51%, 1/17/32 (a)(c) | | | | | | | 5 | | | | 5,306 | |
Symphony CLO XII Ltd., Series 2013-12A, Class AR,
2.19%, 10/15/25 (a)(c) | | | | | | | 380 | | | | 379,705 | |
THL Credit Wind River CLO Ltd., Series 2013-2A, Class B1, 3.01%, 1/18/26 (a)(c) | | | | | | | 250 | | | | 250,136 | |
U.S. Residential Opportunity Fund II Trust: | | | | | | | | | | | | |
Series 2016-2II, Class A,
3.47%, 8/27/36 (b)(c) | | | | | | | 117 | | | | 116,566 | |
Series 2016-3II, Class A,
3.60%, 10/27/36 (b)(c) | | | | | | | 84 | | | | 84,327 | |
U.S. Residential Opportunity Fund III Trust: | | | | | | | | | | | | |
Series 2016-1III, Class A,
3.47%, 7/27/36-8/27/36 (b)(c) | | | | | | | 448 | | | | 447,573 | |
Series 2016-3III, Class A,
3.60%, 10/27/36 (b)(c) | | | | | | | 177 | | | | 175,845 | |
U.S. Residential Opportunity Fund IV Trust: | | | | | | | | | | | | |
Series 2016-1IV, Class A,
3.47%, 7/27/36-8/27/36 (b)(c) | | | | | | | 274 | | | | 272,901 | |
Series 2016-3IV, Class A,
3.60%, 10/27/36 (b)(c) | | | | | | | 202 | | | | 202,753 | |
Venture XIX CLO Ltd., Series 2014-19A, Class AR, 2.53%, 1/15/27 (a)(c)(d) | | | | | | | 250 | | | | 250,469 | |
VOLT LIX LLC, Series 2017-NPL6, Class A1,
3.25%, 5/25/47 (b)(c) | | | | | | | 301 | | | | 301,758 | |
VOLT LX LLC, Series 2017-NPL7, Class A1,
3.25%, 4/25/59 (b)(c) | | | | | | | 270 | | | | 269,759 | |
Voya CLO Ltd.: | | | | | | | | | | | | |
Series 2012-2A, Class BR,
3.11%, 10/15/22 (a)(c) | | | | | | | 250 | | | | 250,108 | |
Series 2013-3A, Class A1R,
2.21%, 1/18/26 (a)(c) | | | | | | | 250 | | | | 250,337 | |
Wachovia Asset Securitization Issuance II LLC Trust, Series 2007-HE2A, Class A, 1.35%, 7/25/37 (a)(c) | | | | | | | 86 | | | | 78,997 | |
Washington Mutual Asset-Backed Certificates Trust, Series 2007-HE2, Class 2A2, 1.24%, 2/25/37 (a) | | | | | | | 100 | | | | 41,096 | |
West CLO Ltd., Series 2013-1A, Class A1AR, 2.34%, 11/07/25 (a)(c)(d) | | | | | | | 250 | | | | 250,000 | |
WVUE, Series 2015-1A, Class A,
4.50%, 9/25/20 (b)(c)(d) | | | | | | | 47 | | | | 47,883 | |
Total Asset-Backed Securities — 3.9% | | | | | | | | | | | 19,505,122 | |
| | | | | | | | | | | | |
| Common Stocks | | | | | Shares | | | | |
Aerospace & Defense — 1.0% | | | | | | | | | | | | |
HEICO Corp., Class A | | | | | | | 9 | | | | 558 | |
L3 Technologies, Inc. | | | | | | | 5,662 | | | | 946,007 | |
Raytheon Co. | | | | | | | 24,491 | | | | 3,954,807 | |
| | | | | | | | | | | | |
| | | | | | | | | | | | 4,901,372 | |
Air Freight & Logistics — 0.2% | | | | | | | | | | | | |
XPO Logistics, Inc. (e) | | | | | | | 11,884 | | | | 768,063 | |
Auto Components — 0.1% | | | | | | | | | | | | |
Delphi Automotive PLC | | | | | | | 4,754 | | | | 416,688 | |
Automobiles — 0.2% | | | | | | | | | | | | |
Thor Industries, Inc. | | | | | | | 9,877 | | | | 1,032,344 | |
| | | | | | | | |
| Common Stocks | | Shares | | | Value | |
Banks — 3.2% | | | | | | | | |
Bank of America Corp. (f) | | | 265,214 | | | $ | 6,434,092 | |
Citigroup, Inc. | | | 8,985 | | | | 600,917 | |
Citizens Financial Group, Inc. | | | 100,693 | | | | 3,592,726 | |
JPMorgan Chase & Co. | | | 9,700 | | | | 886,580 | |
Popular, Inc. | | | 5,092 | | | | 212,387 | |
SunTrust Banks, Inc. | | | 59,697 | | | | 3,386,014 | |
Synovus Financial Corp. | | | 22,390 | | | | 990,534 | |
U.S. Bancorp | | | 2,014 | | | | 104,567 | |
| | | | | | | | |
| | | | | | | | 16,207,817 | |
Beverages — 0.8% | | | | | | | | |
Coca-Cola European Partners PLC | | | 7,767 | | | | 315,884 | |
Dr. Pepper Snapple Group, Inc. | | | 37,915 | | | | 3,454,436 | |
| | | | | | | | |
| | | | | | | | 3,770,320 | |
Biotechnology — 2.9% | | | | | | | | |
Amgen, Inc. | | | 20,601 | | | | 3,548,110 | |
Biogen, Inc. (e) | | | 12,596 | | | | 3,418,051 | |
Celgene Corp. (e) | | | 25,103 | | | | 3,260,127 | |
Gilead Sciences, Inc. | | | 63,543 | | | | 4,497,574 | |
| | | | | | | | |
| | | | | | | | 14,723,862 | |
Building Products — 0.6% | | | | | | | | |
Allegion PLC | | | 620 | | | | 50,294 | |
JELD-WEN Holding, Inc. (e) | | | 6,008 | | | | 195,020 | |
Masco Corp. | | | 71,282 | | | | 2,723,685 | |
| | | | | | | | |
| | | | | | | | 2,968,999 | |
Capital Markets — 2.3% | | | | | | | | |
CME Group, Inc. | | | 6,965 | | | | 872,297 | |
Evercore Partners, Inc., Class A | | | 13,044 | | | | 919,602 | |
Intercontinental Exchange, Inc. | | | 53,071 | | | | 3,498,440 | |
Morningstar, Inc. | | | 2,560 | | | | 200,550 | |
S&P Global, Inc. | | | 25,987 | | | | 3,793,842 | |
SEI Investments Co. | | | 40,053 | | | | 2,154,050 | |
| | | | | | | | |
| | | | | | | | 11,438,781 | |
Chemicals — 1.0% | | | | | | | | |
AdvanSix, Inc. (e) | | | 7,905 | | | | 246,952 | |
Cabot Corp. | | | 32,615 | | | | 1,742,619 | |
Eastman Chemical Co. | | | 35,037 | | | | 2,942,758 | |
LyondellBasell Industries NV, Class A | | | 783 | | | | 66,077 | |
| | | | | | | | |
| | | | | | | | 4,998,406 | |
Commercial Services & Supplies — 0.1% | | | | | | | | |
LSC Communications, Inc. | | | 8,470 | | | | 181,258 | |
R.R. Donnelley & Sons Co. (f) | | | 19,373 | | | | 242,937 | |
| | | | | | | | |
| | | | | | | | 424,195 | |
Communications Equipment — 0.0% | | | | | | | | |
Cisco Systems, Inc. | | | 1,872 | | | | 58,594 | |
InterDigital, Inc. | | | 936 | | | | 72,353 | |
| | | | | | | | |
| | | | | | | | 130,947 | |
Consumer Finance — 0.2% | | | | | | | | |
Discover Financial Services | | | 18,991 | | | | 1,181,050 | |
Containers & Packaging — 0.9% | | | | | | | | |
Avery Dennison Corp. | | | 15,611 | | | | 1,379,544 | |
Packaging Corp. of America | | | 11,891 | | | | 1,324,538 | |
Silgan Holdings, Inc. | | | 27,385 | | | | 870,295 | |
WestRock Co. | | | 12,230 | | | | 692,952 | |
| | | | | | | | |
| | | | | | | | 4,267,329 | |
Diversified Consumer Services — 0.0% | | | | | | | | |
H&R Block, Inc. | | | 2,863 | | | | 88,495 | |
See Notes to Financial Statements.
| | | | | | |
| 30 | | BLACKROCK SERIES FUND, INC. | | JUNE 30, 2017 | | |
| | | | |
| Schedule of Investments (continued) | | | BlackRock Balanced Capital Portfolio | |
| | | | |
| | | | | | | | |
| Common Stocks | | Shares | | | Value | |
Diversified Financial Services — 0.4% | | | | | | | | |
Berkshire Hathaway, Inc., Class B (e) | | | 10,779 | | | $ | 1,825,639 | |
Diversified Telecommunication Services — 0.1% | | | | | | | | |
Level 3 Communications, Inc. (e) | | | 3,850 | | | | 228,305 | |
Verizon Communications, Inc. | | | 4,427 | | | | 197,710 | |
Zayo Group Holdings, Inc. (e) | | | 7,694 | | | | 237,745 | |
| | | | | | | | |
| | | | | | | | 663,760 | |
Electric Utilities — 1.1% | | | | | | | | |
Portland General Electric Co. | | | 46,694 | | | | 2,133,449 | |
Westar Energy, Inc. | | | 64,438 | | | | 3,416,503 | |
| | | | | | | | |
| | | | | | | | 5,549,952 | |
Electrical Equipment — 0.7% | | | | | | | | |
Rockwell Automation, Inc. | | | 22,384 | | | | 3,625,313 | |
Electronic Equipment, Instruments & Components — 1.1% | | | | | | | | |
CDW Corp. | | | 6,974 | | | | 436,084 | |
Dolby Laboratories, Inc., Class A | | | 4,789 | | | | 234,469 | |
Flex Ltd. (e) | | | 44,078 | | | | 718,912 | |
FLIR Systems, Inc. | | | 4,312 | | | | 149,454 | |
TE Connectivity Ltd | | | 11,682 | | | | 919,140 | |
Tech Data Corp. (e) | | | 13,803 | | | | 1,394,103 | |
Zebra Technologies Corp., Class A (e) | | | 17,285 | | | | 1,737,488 | |
| | | | | | | | |
| | | | | | | | 5,589,650 | |
Equity Real Estate Investment Trusts (REITs) — 2.0% | | | | | | | | |
Brixmor Property Group, Inc. | | | 2,388 | | | | 42,697 | |
Duke Realty Corp. | | | 11,500 | | | | 321,425 | |
Gaming and Leisure Properties, Inc. | | | 20,956 | | | | 789,413 | |
Host Hotels & Resorts, Inc. | | | 158 | | | | 2,887 | |
Outfront Media, Inc. | | | 31,074 | | | | 718,431 | |
Prologis, Inc. | | | 6,667 | | | | 390,953 | |
Simon Property Group, Inc. | | | 21,142 | | | | 3,419,930 | |
Ventas, Inc. | | | 51,376 | | | | 3,569,604 | |
Weingarten Realty Investors | | | 19,815 | | | | 596,432 | |
| | | | | | | | |
| | | | | | | | 9,851,772 | |
Food & Staples Retailing — 1.2% | | | | | | | | |
Walgreens Boots Alliance, Inc. | | | 21,442 | | | | 1,679,123 | |
Wal-Mart Stores, Inc. | | | 57,528 | | | | 4,353,719 | |
| | | | | | | | |
| | | | | | | | 6,032,842 | |
Food Products — 1.2% | | | | | | | | |
Archer-Daniels-Midland Co. | | | 86,481 | | | | 3,578,584 | |
Hershey Co. | | | 4,746 | | | | 509,578 | |
Ingredion, Inc. | | | 6,962 | | | | 829,940 | |
Tyson Foods, Inc., Class A | | | 18,812 | | | | 1,178,196 | |
| | | | | | | | |
| | | | | | | | 6,096,298 | |
Health Care Equipment & Supplies — 1.9% | | | | | | | | |
Baxter International, Inc. | | | 60,528 | | | | 3,664,365 | |
IDEXX Laboratories, Inc. (e) | | | 20,640 | | | | 3,331,709 | |
Masimo Corp. (e) | | | 16,870 | | | | 1,538,207 | |
West Pharmaceutical Services, Inc. | | | 9,846 | | | | 930,644 | |
| | | | | | | | |
| | | | | | | | 9,464,925 | |
Health Care Providers & Services — 1.6% | | | | | | | | |
Aetna, Inc. | | | 778 | | | | 118,124 | |
AmerisourceBergen Corp. | | | 2,385 | | | | 225,454 | |
Centene Corp. (e) | | | 6,204 | | | | 495,576 | |
Express Scripts Holding Co. (e) | | | 6,470 | | | | 413,045 | |
Humana, Inc. | | | 4,376 | | | | 1,052,953 | |
McKesson Corp. | | | 4,524 | | | | 744,379 | |
UnitedHealth Group, Inc. | | | 28,032 | | | | 5,197,693 | |
| | | | | | | | |
| | | | | | | | 8,247,224 | |
Health Care Technology — 0.4% | | | | | | | | |
Veeva Systems, Inc., Class A (e) | | | 29,562 | | | | 1,812,446 | |
| | | | | | | | |
| Common Stocks | | Shares | | | Value | |
Hotels, Restaurants & Leisure — 1.9% | | | | | | | | |
Carnival Corp. | | | 50,993 | | | $ | 3,343,611 | |
Choice Hotels International, Inc. | | | 4,213 | | | | 270,685 | |
Extended Stay America, Inc. | | | 64,266 | | | | 1,244,190 | |
Hilton Grand Vacations, Inc. (e) | | | 8,386 | | | | 302,399 | |
McDonald’s Corp. | | | 29,599 | | | | 4,533,383 | |
| | | | | | | | |
| | | | | | | | 9,694,268 | |
Household Products — 0.3% | | | | | | | | |
Energizer Holdings, Inc. | | | 32,324 | | | | 1,552,198 | |
Industrial Conglomerates — 1.6% | | | | | | | | |
3M Co. | | | 23,434 | | | | 4,878,724 | |
Honeywell International, Inc. | | | 21,811 | | | | 2,907,188 | |
| | | | | | | | |
| | | | | | | | 7,785,912 | |
Insurance — 2.4% | | | | | | | | |
Aon PLC | | | 2,181 | | | | 289,964 | |
First American Financial Corp. | | | 14,498 | | | | 647,916 | |
FNF Group | | | 3,231 | | | | 144,846 | |
Hartford Financial Services Group, Inc. | | | 631 | | | | 33,172 | |
Lincoln National Corp. | | | 40,378 | | | | 2,728,745 | |
Marsh & McLennan Cos., Inc. | | | 48,919 | | | | 3,813,725 | |
Principal Financial Group, Inc. | | | 1,841 | | | | 117,953 | |
Prudential Financial, Inc. | | | 35,659 | | | | 3,856,164 | |
Unum Group | | | 9,115 | | | | 425,032 | |
| | | | | | | | |
| | | | | | | | 12,057,517 | |
Internet & Direct Marketing Retail — 0.9% | | | | | | | | |
Amazon.com, Inc. (e) | | | 4,227 | | | | 4,091,736 | |
Priceline Group, Inc. (e) | | | 134 | | | | 250,650 | |
| | | | | | | | |
| | | | | | | | 4,342,386 | |
Internet Software & Services — 2.8% | | | | | | | | |
Alphabet, Inc., Class A (e) | | | 6,970 | | | | 6,479,870 | |
Alphabet, Inc., Class C (e) | | | 3,921 | | | | 3,563,130 | |
Facebook, Inc., Class A (e) | | | 24,289 | | | | 3,667,153 | |
VeriSign, Inc. (e) | | | 4,556 | | | | 423,526 | |
Yelp, Inc. (e) | | | 1,210 | | | | 36,324 | |
| | | | | | | | |
| | | | | | | | 14,170,003 | |
IT Services — 2.4% | | | | | | | | |
Accenture PLC, Class A (f) | | | 29,749 | | | | 3,679,356 | |
Booz Allen Hamilton Holding Corp | | | 16,990 | | | | 552,855 | |
Fidelity National Information Services, Inc. | | | 42,943 | | | | 3,667,332 | |
Mastercard, Inc., Class A | | | 34,151 | | | | 4,147,639 | |
| | | | | | | | |
| | | | | | | | 12,047,182 | |
Leisure Products — 0.6% | | | | | | | | |
Hasbro, Inc. | | | 28,962 | | | | 3,229,553 | |
Life Sciences Tools & Services — 0.1% | | | | | | | | |
Mettler-Toledo International, Inc. (e) | | | 620 | | | | 364,895 | |
Machinery — 2.0% | | | | | | | | |
Dover Corp. | | | 4,688 | | | | 376,071 | |
Illinois Tool Works, Inc. | | | 21,335 | | | | 3,056,239 | |
Ingersoll-Rand PLC | | | 24,927 | | | | 2,278,079 | |
PACCAR, Inc. | | | 37,757 | | | | 2,493,472 | |
Stanley Black & Decker, Inc. | | | 11,922 | | | | 1,677,783 | |
| | | | | | | | |
| | | | | | | | 9,881,644 | |
Media — 1.8% | | | | | | | | |
CBS Corp., Class B, Non-Voting Shares | | | 30,890 | | | | 1,970,164 | |
Comcast Corp., Class A | | | 129,156 | | | | 5,026,752 | |
Lions Gate Entertainment Corp., Class B (e) | | | 14,179 | | | | 372,624 | |
Scripps Networks Interactive, Inc., Class A (f) | | | 5,846 | | | | 399,340 | |
Time Warner, Inc. | | | 10,101 | | | | 1,014,241 | |
| | | | | | | | |
| | | | | | | | 8,783,121 | |
See Notes to Financial Statements.
| | | | | | |
| | | BLACKROCK SERIES FUND, INC. | | JUNE 30, 2017 | | 31 |
| | | | |
| Schedule of Investments (continued) | | | BlackRock Balanced Capital Portfolio | |
| | | | |
| | | | | | | | |
| | |
| Common Stocks | | Shares | | | Value | |
Metals & Mining — 0.2% | | | | | | | | |
Newmont Mining Corp. | | | 6,911 | | | $ | 223,847 | |
Reliance Steel & Aluminum Co. | | | 9,172 | | | | 667,813 | |
| | | | | | | | |
| | | | | | | | 891,660 | |
Multiline Retail — 0.6% | | | | | | | | |
Target Corp. | | | 58,271 | | | | 3,046,991 | |
Multi-Utilities — 0.8% | | | | | | | | |
Black Hills Corp. | | | 5,264 | | | | 355,162 | |
CMS Energy Corp. | | | 75,006 | | | | 3,469,028 | |
| | | | | | | | |
| | | | | | | | 3,824,190 | |
Oil, Gas & Consumable Fuels — 3.2% | | | | | | | | |
Anadarko Petroleum Corp. | | | 56,073 | | | | 2,542,350 | |
Chevron Corp. | | | 18,672 | | | | 1,948,050 | |
ConocoPhillips | | | 70,990 | | | | 3,120,720 | |
Devon Energy Corp. | | | 60,989 | | | | 1,949,818 | |
Exxon Mobil Corp. | | | 20,687 | | | | 1,670,062 | |
Phillips 66 | | | 7,272 | | | | 601,322 | |
Suncor Energy, Inc. | | | 32,321 | | | | 943,773 | |
Tellurian, Inc. (e)(f) | | | 12,127 | | | | 121,634 | |
Valero Energy Corp. | | | 43,060 | | | | 2,904,828 | |
| | | | | | | | |
| | | | | | | | 15,802,557 | |
Paper & Forest Products — 0.2% | | | | | | | | |
Domtar Corp. | | | 30,280 | | | | 1,163,358 | |
Personal Products — 0.6% | | | | | | | | |
Estee Lauder Cos., Inc., Class A | | | 31,430 | | | | 3,016,651 | |
Herbalife Ltd. (f) | | | 911 | | | | 64,982 | |
| | | | | | | | |
| | | | | | | | 3,081,633 | |
Pharmaceuticals — 1.8% | | | | | | | | |
Bristol-Myers Squibb Co. | | | 49,480 | | | | 2,757,026 | |
Catalent, Inc. (e) | | | 1,972 | | | | 69,217 | |
Johnson & Johnson | | | 10,382 | | | | 1,373,435 | |
Merck & Co., Inc. | | | 63,411 | | | | 4,064,011 | |
Zoetis, Inc. | | | 9,596 | | | | 598,598 | |
| | | | | | | | |
| | | | | | | | 8,862,287 | |
Professional Services — 0.4% | | | | | | | | |
Equifax, Inc. | | | 4,664 | | | | 640,927 | |
ManpowerGroup, Inc. | | | 8,477 | | | | 946,457 | |
Robert Half International, Inc. | | | 11,490 | | | | 550,716 | |
| | | | | | | | |
| | | | | | | | 2,138,100 | |
Real Estate Management & Development — 0.1% | | | | | | | | |
CBRE Group, Inc., Class A (e) | | | 10,630 | | | | 386,932 | |
Retail — 0.1% | | | | | | | | |
Blue Apron Holdings, Inc., Class A (e) | | | 44,595 | | | | 416,517 | |
Road & Rail — 0.1% | | | | | | | | |
Norfolk Southern Corp. | | | 3,167 | | | | 385,424 | |
Union Pacific Corp. | | | 1,356 | | | | 147,682 | |
| | | | | | | | |
| | | | | | | | 533,106 | |
Semiconductors & Semiconductor Equipment — 2.2% | | | | | | | | |
Analog Devices, Inc. | | | 41,573 | | | | 3,234,379 | |
Intel Corp. | | | 139,372 | | | | 4,702,411 | |
KLA-Tencor Corp. | | | 3,093 | | | | 283,040 | |
Maxim Integrated Products, Inc. | | | 61,565 | | | | 2,764,269 | |
| | | | | | | | |
| | | | | | | | 10,984,099 | |
Software — 2.7% | | | | | | | | |
Activision Blizzard, Inc. | | | 13,414 | | | | 772,244 | |
Adobe Systems, Inc. (e) | | | 29,820 | | | | 4,217,741 | |
CDK Global, Inc. | | | 8,543 | | | | 530,179 | |
Dell Technologies, Inc., Class V (e) | | | 17,490 | | | | 1,068,838 | |
Fortinet, Inc. (e) | | | 5,521 | | | | 206,706 | |
| | | | | | | | | | | | |
| Common Stocks | | | | | Shares | | | Value | |
Software (concluded) | | | | | | | | | | | | |
Microsoft Corp. | | | | | | | 48,664 | | | $ | 3,354,410 | |
VMware, Inc., Class A (e)(f) | | | | | | | 38,061 | | | | 3,327,673 | |
| | | | | | | | | | | | |
| | | | | | | | | | | | 13,477,791 | |
Specialty Retail — 1.5% | | | | | | | | | | | | |
Aaron’s, Inc. | | | | | | | 822 | | | | 31,976 | |
Best Buy Co., Inc. | | | | | | | 1,875 | | | | 107,494 | |
Home Depot, Inc. | | | | | | | 21,670 | | | | 3,324,178 | |
Lowe’s Cos., Inc. | | | | | | | 54,251 | | | | 4,206,080 | |
Staples, Inc. | | | | | | | 5,346 | | | | 53,834 | |
| | | | | | | | | | | | |
| | | | | | | | | | | | 7,723,562 | |
Technology Hardware, Storage & Peripherals — 2.0% | | | | | | | | | |
Apple Inc. | | | | | | | 52,318 | | | | 7,535,024 | |
HP, Inc. | | | | | | | 14,216 | | | | 248,496 | |
NCR Corp. (e) | | | | | | | 40,550 | | | | 1,656,062 | |
NetApp, Inc. | | | | | | | 19,907 | | | | 797,275 | |
| | | | | | | | | | | | |
| | | | | | | | | | | | 10,236,857 | |
Textiles, Apparel & Luxury Goods — 0.3% | | | | | | | | | | | | |
Carter’s, Inc. | | | | | | | 1,827 | | | | 162,512 | |
NIKE, Inc., Class B | | | | | | | 18,436 | | | | 1,087,724 | |
| | | | | | | | | | | | |
| | | | | | | | | | | | 1,250,236 | |
Tobacco — 0.7% | | | | | | | | | | | | |
Altria Group, Inc. | | | | | | | 34,560 | | | | 2,573,683 | |
Philip Morris International, Inc. | | | | | | | 1,833 | | | | 215,286 | |
Reynolds American, Inc. | | | | | | | 10,794 | | | | 702,042 | |
| | | | | | | | | | | | |
| | | | | | | | | | | | 3,491,011 | |
Wireless Telecommunication Services — 0.8% | | | | | | | | | | | | |
Telephone & Data Systems, Inc. | | | | | | | 32,032 | | | | 888,888 | |
T-Mobile U.S., Inc. (e) | | | | | | | 51,584 | | | | 3,127,022 | |
| | | | | | | | | | | | |
| | | | | | | | | | | | 4,015,910 | |
Total Common Stocks — 60.3% | | | | | | | | | | | 301,313,965 | |
| | | | | | | | | | | | |
| Corporate Bonds | | | | | Par
(000) | | | | |
Aerospace & Defense — 0.1% | | | | | | | | | | | | |
BAE Systems Holdings, Inc.: | | | | | | | | | | | | |
2.85%, 12/15/20 (c) | | | USD | | | | 38 | | | | 38,518 | |
4.75%, 10/07/44 (c) | | | | | | | 8 | | | | 8,667 | |
Huntington Ingalls Industries, Inc.,
5.00%, 12/15/21 (c) | | | | | | | 15 | | | | 15,525 | |
Lockheed Martin Corp.: | | | | | | | | | | | | |
3.55%, 1/15/26 | | | | | | | 43 | | | | 44,557 | |
3.60%, 3/01/35 | | | | | | | 60 | | | | 59,201 | |
4.50%, 5/15/36 | | | | | | | 17 | | | | 18,540 | |
4.07%, 12/15/42 | | | | | | | 9 | | | | 9,199 | |
4.70%, 5/15/46 | | | | | | | 29 | | | | 32,586 | |
Northrop Grumman Corp., 3.85%, 4/15/45 | | | | | | | 43 | | | | 42,642 | |
United Technologies Corp.: | | | | | | | | | | | | |
1.78%, 5/04/18 (b) | | | | | | | 166 | | | | 166,213 | |
4.15%, 5/15/45 | | | | | | | 27 | | | | 27,955 | |
4.05%, 5/04/47 | | | | | | | 115 | | | | 117,795 | |
| | | | | | | | | | | | |
| | | | | | | | | | | | 581,398 | |
See Notes to Financial Statements.
| | | | | | |
| 32 | | BLACKROCK SERIES FUND, INC. | | JUNE 30, 2017 | | |
| | | | |
| Schedule of Investments (continued) | | | BlackRock Balanced Capital Portfolio | |
| | | | |
| | | | | | | | | | | | |
| Corporate Bonds | | | | | Par
(000) | | | Value | |
Air Freight & Logistics — 0.1% | | | | | | | | | | | | |
FedEx Corp.: | | | | | | | | | | | | |
4.90%, 1/15/34 | | | USD | | | | 50 | | | $ | 55,655 | |
3.90%, 2/01/35 | | | | | | | 48 | | | | 47,644 | |
4.10%, 2/01/45 | | | | | | | 55 | | | | 53,958 | |
4.75%, 11/15/45 | | | | | | | 55 | | | | 59,393 | |
4.55%, 4/01/46 | | | | | | | 31 | | | | 32,563 | |
4.40%, 1/15/47 | | | | | | | 73 | | | | 75,084 | |
| | | | | | | | | | | | |
| | | | | | | | | | | | 324,297 | |
Airlines — 0.1% | | | | | | | | | | | | |
American Airlines Group, Inc., 4.63%, 3/01/20 (c) | | | | | | | 91 | | | | 94,119 | |
American Airlines Pass-Through Trust, Series 2015-1, Class A, 3.38%, 5/01/27 | | | | | | | 87 | | | | 87,211 | |
Delta Air Lines, Inc., 2.88%, 3/13/20 | | | | | | | 338 | | | | 342,419 | |
Turkish Airlines Pass-Through Trust, Series 2015-1, Class A, 4.20%, 3/15/27 (c) | | | | | | | 57 | | | | 54,975 | |
United Airlines Pass-Through Trust, Series 2014-1, Class B, 4.75%, 10/11/23 | | | | | | | 15 | | | | 16,054 | |
| | | | | | | | | | | | |
| | | | | | | | | | | | 594,778 | |
Auto Components — 0.0% | | | | | | | | | | | | |
Delphi Automotive PLC: | | | | | | | | | | | | |
4.25%, 1/15/26 | | | | | | | 62 | | | | 65,672 | |
4.40%, 10/01/46 | | | | | | | 52 | | | | 51,851 | |
| | | | | | | | | | | | |
| | | | | | | | | | | | 117,523 | |
Automobiles — 0.1% | | | | | | | | | | | | |
Ford Motor Credit Co. LLC, 3.81%, 1/09/24 | | | | | | | 379 | | | | 383,746 | |
Banks — 2.1% | | | | | | | | | | | | |
Bank of America Corp.: | | | | | | | | | | | | |
2.25%, 4/21/20 | | | | | | | 145 | | | | 145,059 | |
3.30%, 1/11/23 | | | | | | | 110 | | | | 112,167 | |
3.88%, 8/01/25 | | | | | | | 201 | | | | 207,937 | |
3.50%, 4/19/26 | | | | | | | 132 | | | | 132,450 | |
3.25%, 10/21/27 | | | | | | | 70 | | | | 67,643 | |
4.88%, 4/01/44 | | | | | | | 15 | | | | 16,794 | |
4.44%, 1/20/48 (a) | | | | | | | 175 | | | | 185,094 | |
Barclays PLC: | | | | | | | | | | | | |
4.84%, 5/09/28 | | | | | | | 200 | | | | 204,458 | |
4.95%, 1/10/47 | | | | | | | 200 | | | | 213,428 | |
BB&T Corp.: | | | | | | | | | | | | |
2.45%, 1/15/20 | | | | | | | 92 | | | | 93,028 | |
2.75%, 4/01/22 | | | | | | | 579 | | | | 587,554 | |
BNP Paribas SA, 2.95%, 5/23/22 (c) | | | | | | | 240 | | | | 242,390 | |
Citigroup, Inc.: | | | | | | | | | | | | |
1.80%, 2/05/18 | | | | | | | 205 | | | | 205,155 | |
2.50%, 9/26/18 | | | | | | | 208 | | | | 209,410 | |
2.50%, 7/29/19 | | | | | | | 285 | | | | 287,560 | |
2.90%, 12/08/21 | | | | | | | 835 | | | | 843,461 | |
3.50%, 5/15/23 | | | | | | | 66 | | | | 66,962 | |
3.88%, 3/26/25 | | | | | | | 53 | | | | 53,328 | |
4.13%, 7/25/28 | | | | | | | 223 | | | | 226,373 | |
4.75%, 5/18/46 | | | | | | | 191 | | | | 200,492 | |
Citizens Bank N.A.: | | | | | | | | | | | | |
2.25%, 3/02/20 | | | | | | | 277 | | | | 276,741 | |
2.65%, 5/26/22 | | | | | | | 250 | | | | 249,327 | |
HSBC Holdings PLC: | | | | | | | | | | | | |
2.65%, 1/05/22 | | | | | | | 477 | | | | 475,900 | |
4.04%, 3/13/28 (a) | | | | | | | 200 | | | | 207,156 | |
ING Groep NV, 3.95%, 3/29/27 | | | | | | | 200 | | | | 207,969 | |
Intesa Sanpaolo SpA, 5.02%, 6/26/24 (c) | | | | | | | 206 | | | | 208,916 | |
JPMorgan Chase & Co.: | | | | | | | | | | | | |
2.20%, 10/22/19 | | | | | | | 111 | | | | 111,355 | |
2.75%, 6/23/20 | | | | | | | 29 | | | | 29,485 | |
2.55%, 10/29/20 | | | | | | | 171 | | | | 172,435 | |
| | | | | | | | | | | | |
| Corporate Bonds | | | | | Par
(000) | | | Value | |
Banks (continued) | | | | | | | | | | | | |
2.97%, 1/15/23 | | | USD | | | | 420 | | | $ | 424,996 | |
3.88%, 9/10/24 | | | | | | | 130 | | | | 134,127 | |
3.90%, 7/15/25 | | | | | | | 104 | | | | 108,458 | |
4.25%, 10/01/27 | | | | | | | 65 | | | | 67,802 | |
3.78%, 2/01/28 (a) | | | | | | | 137 | | | | 140,099 | |
Mizuho Financial Group, Inc., 2.95%, 2/28/22 | | | | | | | 472 | | | | 476,064 | |
Royal Bank of Scotland Group PLC: | | | | | | | | | | | | |
3.50%, 5/15/23 (a) | | | | | | | 210 | | | | 211,362 | |
2.65%, 5/15/23 (a) | | | | | | | 580 | | | | 584,698 | |
3.88%, 9/12/23 | | | | | | | 383 | | | | 391,085 | |
Santander UK Group Holdings PLC, 2.88%, 8/05/21 | | | | | | | 215 | | | | 215,494 | |
Sumitomo Mitsui Trust Bank Ltd., 2.05%, 3/06/19 (c) | | | | | | | 505 | | | | 504,996 | |
U.S. Bancorp: | | | | | | | | | | | | |
2.95%, 7/15/22 | | | | | | | 135 | | | | 137,318 | |
3.15%, 4/27/27 | | | | | | | 80 | | | | 80,133 | |
Washington Mutual Bank: | | | | | | | | | | | | |
0.00%, 5/01/09 (e)(g) | | | | | | | 400 | | | | 89,250 | |
0.00%, 11/06/09 (e)(g) | | | | | | | 100 | | | | 22,313 | |
Wells Fargo & Co.: | | | | | | | | | | | | |
2.60%, 7/22/20 | | | | | | | 68 | | | | 68,959 | |
2.55%, 12/07/20 | | | | | | | 90 | | | | 91,032 | |
2.10%, 7/26/21 | | | | | | | 70 | | | | 69,061 | |
3.00%, 4/22/26 | | | | | | | 54 | | | | 52,739 | |
3.58%, 5/22/28 (a) | | | | | | | 250 | | | | 252,658 | |
4.90%, 11/17/45 | | | | | | | 52 | | | | 56,700 | |
4.75%, 12/07/46 | | | | | | | 137 | | | | 146,271 | |
| | | | | | | | | | | | |
| | | | | | | | | | | | 10,565,642 | |
Beverages — 0.2% | | | | | | | | | | | | |
Anheuser-Busch InBev Finance, Inc.: | | | | | | | | | | | | |
2.65%, 2/01/21 | | | | | | | 84 | | | | 85,126 | |
3.30%, 2/01/23 | | | | | | | 140 | | | | 144,162 | |
4.70%, 2/01/36 | | | | | | | 65 | | | | 71,542 | |
4.90%, 2/01/46 | | | | | | | 358 | | | | 404,053 | |
Anheuser-Busch InBev Worldwide, Inc., 3.75%, 7/15/42 | | | | | | | 46 | | | | 44,521 | |
| | | | | | | | | | | | |
| | | | | | | | | | | | 749,404 | |
Biotechnology — 0.2% | | | | | | | | | | | | |
AbbVie, Inc.: | | | | | | | | | | | | |
2.50%, 5/14/20 | | | | | | | 100 | | | | 101,159 | |
2.90%, 11/06/22 | | | | | | | 103 | | | | 103,969 | |
4.50%, 5/14/35 | | | | | | | 120 | | | | 126,556 | |
Amgen, Inc.: | | | | | | | | | | | | |
2.13%, 5/01/20 | | | | | | | 87 | | | | 87,130 | |
4.40%, 5/01/45 | | | | | | | 85 | | | | 87,308 | |
Gilead Sciences, Inc.: | | | | | | | | | | | | |
2.35%, 2/01/20 | | | | | | | 25 | | | | 25,239 | |
2.50%, 9/01/23 | | | | | | | 60 | | | | 59,111 | |
4.60%, 9/01/35 | | | | | | | 29 | | | | 31,094 | |
4.00%, 9/01/36 | | | | | | | 240 | | | | 238,653 | |
4.50%, 2/01/45 | | | | | | | 39 | | | | 40,429 | |
| | | | | | | | | | | | |
| | | | | | | | | | | | 900,648 | |
Building Products — 0.0% | | | | | | | | | | | | |
Johnson Controls International PLC, 5.13%, 9/14/45 | | | | | | | 63 | | | | 72,445 | |
Capital Markets — 0.7% | | | | | | | | | | | | |
Bank of New York Mellon Corp., 2.05%, 5/03/21 | | | | | | | 231 | | | | 228,886 | |
Credit Suisse Group Funding Guernsey Ltd., 2.75%, 3/26/20 | | | | | | | 250 | | | | 251,966 | |
Goldman Sachs Group, Inc.: 2.63%, 1/31/19 | | | | | | | 297 | | | | 300,002 | |
See Notes to Financial Statements.
| | | | | | |
| | | BLACKROCK SERIES FUND, INC. | | JUNE 30, 2017 | | 33 |
| | | | |
| Schedule of Investments (continued) | | | BlackRock Balanced Capital Portfolio | |
| | | | |
| | | | | | | | | | | | |
| Corporate Bonds | | | | | Par
(000) | | | Value | |
Capital Markets (continued) | | | | | | | | | | | | |
2.00%, 4/25/19 | | | USD | | | | 48 | | | $ | 47,979 | |
2.75%, 9/15/20 | | | | | | | 71 | | | | 71,855 | |
2.63%, 4/25/21 | | | | | | | 103 | | | | 103,204 | |
2.35%, 11/15/21 | | | | | | | 254 | | | | 250,582 | |
3.50%, 1/23/25 | | | | | | | 60 | | | | 60,652 | |
3.75%, 5/22/25 | | | | | | | 89 | | | | 91,135 | |
Jefferies Group LLC, 6.50%, 1/20/43 | | | | | | | 30 | | | | 33,903 | |
Moody’s Corp.: | | | | | | | | | | | | |
2.75%, 12/15/21 | | | | | | | 117 | | | | 117,982 | |
3.25%, 1/15/28 (c) | | | | | | | 140 | | | | 137,849 | |
Morgan Stanley: | | | | | | | | | | | | |
2.80%, 6/16/20 | | | | | | | 130 | | | | 131,890 | |
2.63%, 11/17/21 | | | | | | | 478 | | | | 477,295 | |
2.75%, 5/19/22 | | | | | | | 660 | | | | 659,857 | |
3.75%, 2/25/23 | | | | | | | 85 | | | | 88,384 | |
3.70%, 10/23/24 | | | | | | | 119 | | | | 122,125 | |
Northern Trust Corp., 3.38%, 5/08/32 (a) | | | | | | | 85 | | | | 84,963 | |
State Street Corp., 2.65%, 5/19/26 | | | | | | | 38 | | | | 36,830 | |
| | | | | | | | | | | | |
| | | | | | | | | | | | 3,297,339 | |
Chemicals — 0.1% | | | | | | | | | | | | |
Agrium, Inc., 4.13%, 3/15/35 (h) | | | | | | | 55 | | | | 54,733 | |
Dow Chemical Co.: | | | | | | | | | | | | |
4.38%, 11/15/42 | | | | | | | 32 | | | | 33,051 | |
4.63%, 10/01/44 | | | | | | | 20 | | | | 21,287 | |
E.I. du Pont de Nemours & Co., 2.20%, 5/01/20 | | | | | | | 45 | | | | 45,244 | |
Eastman Chemical Co., 4.80%, 9/01/42 | | | | | | | 28 | | | | 30,057 | |
Monsanto Co., 3.60%, 7/15/42 | | | | | | | 48 | | | | 41,751 | |
Sherwin-Williams Co.: | | | | | | | | | | | | |
4.00%, 12/15/42 | | | | | | | 26 | | | | 24,952 | |
4.50%, 6/01/47 | | | | | | | 35 | | | | 36,674 | |
| | | | | | | | | | | | |
| | | | | | | | | | | | 287,749 | |
Commercial Services & Supplies — 0.1% | | | | | | | | | | | | |
Aviation Capital Group Corp., 2.88%, 9/17/18 (c) | | | | | | | 155 | | | | 156,492 | |
Cia Latinoamericana de Infraestructura & Servicios SA, 9.50%, 7/20/23 (c) | | | | | | | 1 | | | | 1,037 | |
Pitney Bowes, Inc., 3.88%, 5/15/22 | | | | | | | 460 | | | | 459,883 | |
Waste Management, Inc., 3.90%, 3/01/35 | | | | | | | 42 | | | | 43,358 | |
| | | | | | | | | | | | |
| | | | | | | | | | | | 660,770 | |
Communications Equipment — 0.0% | | | | | | | | | | | | |
Harris Corp., 2.70%, 4/27/20 | | | | | | | 39 | | | | 39,404 | |
Juniper Networks, Inc., 3.30%, 6/15/20 | | | | | | | 79 | | | | 80,902 | |
| | | | | | | | | | | | |
| | | | | | | | | | | | 120,306 | |
Construction Materials — 0.0% | | | | | | | | | | | | |
LafargeHolcim Finance U.S. LLC, 4.75%, 9/22/46 (c) | | | | | | | 200 | | | | 208,043 | |
Consumer Finance — 0.4% | | | | | | | | | | | | |
American Express Credit Corp.: | | | | | | | | | | | | |
2.25%, 8/15/19 | | | | | | | 119 | | | | 120,025 | |
3.30%, 5/03/27 | | | | | | | 35 | | | | 34,971 | |
Capital One Financial Corp.: | | | | | | | | | | | | |
4.75%, 7/15/21 | | | | | | | 5 | | | | 5,395 | |
3.75%, 3/09/27 | | | | | | | 140 | | | | 139,492 | |
Discover Financial Services, 4.10%, 2/09/27 | | | | | | | 47 | | | | 47,081 | |
General Motors Financial Co., Inc.: | | | | | | | | | | | | |
2.63%, 7/10/17 | | | | | | | 250 | | | | 250,025 | |
3.10%, 1/15/19 | | | | | | | 43 | | | | 43,588 | |
3.70%, 11/24/20 | | | | | | | 117 | | | | 121,056 | |
3.20%, 7/06/21 | | | | | | | 202 | | | | 204,270 | |
3.15%, 6/30/22 | | | | | | | 555 | | | | 555,859 | |
| | | | | | | | | | | | |
| Corporate Bonds | | | | | Par
(000) | | | Value | |
Consumer Finance (continued) | | | | | | | | | | | | |
4.00%, 1/15/25 | | | USD | | | | 55 | | | $ | 55,234 | |
Synchrony Financial: | | | | | | | | | | | | |
2.60%, 1/15/19 | | | | | | | 90 | | | | 90,481 | |
2.70%, 2/03/20 | | | | | | | 52 | | | | 52,264 | |
4.50%, 7/23/25 | | | | | | | 30 | | | | 30,851 | |
| | | | | | | | | | | | |
| | | | | | | | | | | | 1,750,592 | |
Containers & Packaging — 0.0% | | | | | | | | | | | | |
Reynolds Group Issuer, Inc., 5.75%, 10/15/20 | | | | | | | 90 | | | | 92,101 | |
Diversified Consumer Services — 0.0% | | | | | | | | | | | | |
Wesleyan University, 4.78%, 7/01/16 | | | | | | | 79 | | | | 77,271 | |
Diversified Financial Services — 0.4% | | | | | | | | | | | | |
AerCap Ireland Capital DAC/AerCap Global Aviation Trust: | | | | | | | | | |
4.63%, 10/30/20 | | | | | | | 220 | | | | 233,810 | |
3.50%, 5/26/22 | | | | | | | 190 | | | | 194,986 | |
BHP Billiton Finance USA Ltd., 5.00%, 9/30/43 | | | | | | | 58 | | | | 67,117 | |
BP Capital Markets PLC, 3.22%, 4/14/24 | | | | | | | 210 | | | | 212,074 | |
Enel Finance International NV: | | | | | | | | | | | | |
2.88%, 5/25/22 (c) | | | | | | | 200 | | | | 200,277 | |
3.63%, 5/25/27 (c) | | | | | | | 200 | | | | 198,069 | |
Glencore Funding LLC, 4.00%, 3/27/27 (c) | | | | | | | 173 | | | | 170,214 | |
Hyundai Capital America, 2.55%, 4/03/20 (c) | | | | | | | 402 | | | | 400,994 | |
Shell International Finance BV: | | | | | | | | | | | | |
4.13%, 5/11/35 | | | | | | | 88 | | | | 91,623 | |
3.63%, 8/21/42 | | | | | | | 46 | | | | 43,032 | |
UBS Group Funding Switzerland AG,
4.25%, 3/23/28 (c) | | | | | | | 310 | | | | 323,866 | |
Woodside Finance Ltd., 3.65%, 3/05/25 (c) | | | | | | | 15 | | | | 14,946 | |
| | | | | | | | | | | | |
| | | | | | | | | | | | 2,151,008 | |
Diversified Telecommunication Services — 0.4% | | | | | | | | | | | | |
AT&T Inc.: | | | | | | | | | | | | |
3.80%, 3/01/24 | | | | | | | 120 | | | | 122,713 | |
5.25%, 3/01/37 | | | | | | | 125 | | | | 133,172 | |
6.38%, 3/01/41 | | | | | | | 45 | | | | 52,550 | |
4.30%, 12/15/42 | | | | | | | 17 | | | | 15,787 | |
4.75%, 5/15/46 | | | | | | | 45 | | | | 44,127 | |
Orange SA, 5.50%, 2/06/44 | | | | | | | 35 | | | | 41,784 | |
Telefonica Emisiones SAU, 4.10%, 3/08/27 | | | | | | | 173 | | | | 178,734 | |
Verizon Communications, Inc.: | | | | | | | | | | | | |
1.72%, 5/22/20 (a) | | | | | | | 1,120 | | | | 1,120,840 | |
4.40%, 11/01/34 | | | | | | | 68 | | | | 67,378 | |
4.86%, 8/21/46 | | | | | | | 182 | | | | 182,031 | |
| | | | | | | | | | | | |
| | | | | | | | | | | | 1,959,116 | |
Electric Utilities — 0.1% | | | | | | | | | | | | |
Baltimore Gas & Electric Co., 3.50%, 8/15/46 | | | | | | | 35 | | | | 33,369 | |
Emera U.S. Finance LP: | | | | | | | | | | | | |
2.15%, 6/15/19 | | | | | | | 101 | | | | 100,906 | |
2.70%, 6/15/21 | | | | | | | 72 | | | | 72,110 | |
Exelon Corp.: | | | | | | | | | | | | |
2.85%, 6/15/20 | | | | | | | 90 | | | | 91,434 | |
2.45%, 4/15/21 | | | | | | | 28 | | | | 27,923 | |
4.95%, 6/15/35 | | | | | | | 21 | | | | 22,990 | |
Great Plains Energy, Inc., 3.90%, 4/01/27 | | | | | | | 168 | | | | 169,953 | |
Southern California Edison Co., 1.25%, 11/01/17 | | | | | | | 49 | | | | 48,971 | |
Southern Co. Gas Capital Corp., 4.40%, 5/30/47 | | | | | | | 85 | | | | 86,694 | |
Trans-Allegheny Interstate Line Co.,
3.85%, 6/01/25 (c) | | | | | | | 79 | | | | 81,924 | |
| | | | | | | | | | | | |
| | | | | | | | | | | | 736,274 | |
See Notes to Financial Statements.
| | | | | | |
| 34 | | BLACKROCK SERIES FUND, INC. | | JUNE 30, 2017 | | |
| | | | |
| Schedule of Investments (continued) | | | BlackRock Balanced Capital Portfolio | |
| | | | |
| | | | | | | | | | | | |
| Corporate Bonds | | | | | Par
(000) | | | Value | |
Electronic Equipment, Instruments & Components — 0.0% | | | | | |
Amphenol Corp., 3.20%, 4/01/24 | | | USD | | | | 59 | | | $ | 59,601 | |
Energy Equipment & Services — 0.0% | | | | | | | | | | | | |
Halliburton Co., 3.80%, 11/15/25 | | | | | | | 110 | | | | 112,731 | |
Nabors Industries, Inc., 5.50%, 1/15/23 (c) | | | | | | | 46 | | | | 43,585 | |
Schlumberger Holdings Corp., 3.00%, 12/21/20 (c) | | | | | | | 77 | | | | 78,401 | |
| | | | | | | | | | | | |
| | | | | | | | | | | | 234,717 | |
Equity Real Estate Investment Trusts (REITs) — 0.1% | | | | | | | | | |
American Tower Corp.: | | | | | | | | | | | | |
3.30%, 2/15/21 | | | | | | | 71 | | | | 72,855 | |
3.50%, 1/31/23 | | | | | | | 19 | | | | 19,486 | |
4.40%, 2/15/26 | | | | | | | 14 | | | | 14,674 | |
Crown Castle International Corp.: | | | | | | | | | | | | |
3.40%, 2/15/21 | | | | | | | 33 | | | | 33,886 | |
2.25%, 9/01/21 | | | | | | | 120 | | | | 118,056 | |
| | | | | | | | | | | | |
| | | | | | | | | | | | 258,957 | |
Food & Staples Retailing — 0.0% | | | | | | | | | | | | |
Walgreens Boots Alliance, Inc.: | | | | | | | | | | | | |
4.80%, 11/18/44 | | | | | | | 126 | | | | 134,083 | |
4.65%, 6/01/46 | | | | | | | 6 | | | | 6,280 | |
| | | | | | | | | | | | |
| | | | | | | | | | | | 140,363 | |
Food Products — 0.0% | | | | | | | | | | | | |
Arcor SAIC, 6.00%, 7/06/23 (c) | | | | | | | 14 | | | | 14,875 | |
Post Holdings, Inc., 6.00%, 12/15/22 (c) | | | | | | | 90 | | | | 95,400 | |
| | | | | | | | | | | | |
| | | | | | | | | | | | 110,275 | |
Health Care Equipment & Supplies — 0.2% | | | | | | | | | | | | |
Becton Dickinson and Co.: | | | | | | | | | | | | |
2.13%, 6/06/19 | | | | | | | 255 | | | | 255,387 | |
2.68%, 12/15/19 | | | | | | | 61 | | | | 61,747 | |
2.89%, 6/06/22 | | | | | | | 185 | | | | 185,578 | |
4.69%, 12/15/44 | | | | | | | 20 | | | | 20,597 | |
Boston Scientific Corp., 2.65%, 10/01/18 | | | | | | | 101 | | | | 101,927 | |
Medtronic Global Holdings SCA, 3.35%, 4/01/27 | | | | | | | 170 | | | | 173,310 | |
Medtronic, Inc., 4.38%, 3/15/35 | | | | | | | 10 | | | | 10,923 | |
Stryker Corp., 4.63%, 3/15/46 | | | | | | | 23 | | | | 25,127 | |
| | | | | | | | | | | | |
| | | | | | | | | | | | 834,596 | |
Health Care Providers & Services — 0.3% | | | | | | | | | | | | |
Aetna, Inc.: | | | | | | | | | | | | |
4.50%, 5/15/42 | | | | | | | 27 | | | | 29,163 | |
4.13%, 11/15/42 | | | | | | | 25 | | | | 25,454 | |
4.75%, 3/15/44 | | | | | | | 30 | | | | 33,724 | |
Anthem, Inc.: | | | | | | | | | | | | |
1.88%, 1/15/18 | | | | | | | 287 | | | | 287,238 | |
2.30%, 7/15/18 | | | | | | | 194 | | | | 195,092 | |
Series A, 3.70%, 8/15/21 | | | | | | | 7 | | | | 7,302 | |
Baylor Scott & White Holdings, 4.19%, 11/15/45 | | | | | | | 40 | | | | 40,896 | |
Catholic Health Initiatives, 4.35%, 11/01/42 | | | | | | | 30 | | | | 27,077 | |
Cigna Corp., 3.25%, 4/15/25 | | | | | | | 105 | | | | 105,409 | |
HCA, Inc., 3.75%, 3/15/19 | | | | | | | 90 | | | | 91,800 | |
Kaiser Foundation Hospitals, 4.15%, 5/01/47 | | | | | | | 56 | | | | 58,024 | |
Laboratory Corp. of America Holdings, 2.63%, 2/01/20 | | | | | | | 85 | | | | 85,700 | |
New York & Presbyterian Hospital, 3.56%, 8/01/36 | | | | | | | 27 | | | | 26,205 | |
Ochsner Clinic Foundation, 5.90%, 5/15/45 | | | | | | | 35 | | | | 43,481 | |
RWJ Barnabas Health, Inc., 3.95%, 7/01/46 | | | | | | | 15 | | | | 14,759 | |
Southern Baptist Hospital of Florida, Inc., 4.86%, 7/15/45 | | | | | | | 35 | | | | 38,940 | |
| | | | | | | | | | | | |
| Corporate Bonds | | | | | Par
(000) | | | Value | |
Health Care Providers & Services (continued) | | | | | | | | | |
SSM Health Care Corp., 3.82%, 6/01/27 | | | USD | | | | 54 | | | $ | 55,337 | |
UnitedHealth Group, Inc.: | | | | | | | | | | | | |
2.70%, 7/15/20 | | | | | | | 48 | | | | 49,010 | |
4.63%, 7/15/35 | | | | | | | 20 | | | | 22,478 | |
4.20%, 1/15/47 | | | | | | | 25 | | | | 26,372 | |
| | | | | | | | | | | | |
| | | | | | | | | | | | 1,263,461 | |
Hotels, Restaurants & Leisure — 0.0% | | | | | | | | | | | | |
Caesars Growth Properties Holdings LLC/Caesars Growth Properties Finance, Inc., 9.38%, 5/01/22 | | | | | | | 80 | | | | 86,800 | |
McDonald’s Corp.: | | | | | | | | | | | | |
4.70%, 12/09/35 | | | | | | | 23 | | | | 25,385 | |
4.88%, 12/09/45 | | | | | | | 27 | | | | 30,101 | |
4.45%, 3/01/47 | | | | | | | 56 | | | | 58,906 | |
| | | | | | | | | | | | |
| | | | | | | | | | | | 201,192 | |
Household Durables — 0.0% | | | | | | | | | | | | |
Newell Brands, Inc., 2.88%, 12/01/19 | | | | | | | 30 | | | | 30,515 | |
Independent Power and Renewable Electricity Producers — 0.0% | | | | | |
Genneia SA, 8.75%, 1/20/22 (c) | | | | | | | 12 | | | | 12,760 | |
Industrial Conglomerates — 0.0% | | | | | | | | | | | | |
Eaton Corp., 2.75%, 11/02/22 | | | | | | | 49 | | | | 49,267 | |
General Electric Co., 4.50%, 3/11/44 | | | | | | | 114 | | | | 126,649 | |
| | | | | | | | | | | | |
| | | | | | | | | | | | 175,916 | |
Insurance — 0.1% | | | | | | | | | | | | |
Allstate Corp., 4.20%, 12/15/46 | | | | | | | 69 | | | | 71,934 | |
American International Group, Inc.: | | | | | | | | | | | | |
3.75%, 7/10/25 | | | | | | | 79 | | | | 80,468 | |
3.88%, 1/15/35 | | | | | | | 22 | | | | 21,328 | |
4.50%, 7/16/44 | | | | | | | 30 | | | | 30,506 | |
Aon PLC, 4.75%, 5/15/45 | | | | | | | 70 | | | | 75,740 | |
Marsh & McLennan Cos., Inc.: | | | | | | | | | | | | |
3.75%, 3/14/26 | | | | | | | 19 | | | | 19,782 | |
4.35%, 1/30/47 | | | | | | | 27 | | | | 28,855 | |
Principal Financial Group, Inc., 4.30%, 11/15/46 | | | | | | | 100 | | | | 104,026 | |
Travelers Cos., Inc.: | | | | | | | | | | | | |
4.60%, 8/01/43 | | | | | | | 45 | | | | 50,191 | |
4.00%, 5/30/47 | | | | | | | 75 | | | | 76,723 | |
Willis North America, Inc., 3.60%, 5/15/24 | | | | | | | 11 | | | | 11,111 | |
| | | | | | | | | | | | |
| | | | | | | | | | | | 570,664 | |
IT Services — 0.1% | | | | | | | | | | | | |
DXC Technology Co., 2.88%, 3/27/20 (c) | | | | | | | 63 | | | | 63,792 | |
Fidelity National Information Services, Inc.: | | | | | | | | | | | | |
3.63%, 10/15/20 | | | | | | | 13 | | | | 13,618 | |
4.50%, 8/15/46 | | | | | | | 150 | | | | 153,872 | |
Total System Services, Inc., 4.80%, 4/01/26 | | | | | | | 124 | | | | 134,980 | |
Visa, Inc., 4.15%, 12/14/35 | | | | | | | 51 | | | | 55,256 | |
| | | | | | | | | | | | |
| | | | | | | | | | | | 421,518 | |
Machinery — 0.0% | | | | | | | | | | | | |
Ingersoll-Rand Luxembourg Finance SA, 4.65%, 11/01/44 | | | | | | | 16 | | | | 17,255 | |
Media — 0.5% | | | | | | | | | | | | |
21st Century Fox America, Inc.: | | | | | | | | | | | | |
4.75%, 9/15/44 | | | | | | | 10 | | | | 10,527 | |
4.95%, 10/15/45 | | | | | | | 12 | | | | 12,990 | |
CBS Corp., 2.30%, 8/15/19 | | | | | | | 107 | | | | 107,699 | |
Charter Communications Operating LLC/Charter Communications Operating Capital: | | | | | | | | | | | | |
4.46%, 7/23/22 | | | | | | | 225 | | | | 239,730 | |
See Notes to Financial Statements.
| | | | | | |
| | | BLACKROCK SERIES FUND, INC. | | JUNE 30, 2017 | | 35 |
| | | | |
| Schedule of Investments (continued) | | | BlackRock Balanced Capital Portfolio | |
| | | | |
| | | | | | | | | | | | |
| Corporate Bonds | | | | | Par
(000) | | | Value | |
Media (continued) | | | | | | | | | | | | |
4.91%, 7/23/25 | | | USD | | | | 39 | | | $ | 42,132 | |
3.75%, 2/15/28 (c) | | | | | | | 370 | | | | 364,540 | |
6.38%, 10/23/35 | | | | | | | 76 | | | | 90,087 | |
6.48%, 10/23/45 | | | | | | | 280 | | | | 336,060 | |
5.38%, 5/01/47 (c) | | | | | | | 120 | | | | 126,953 | |
Comcast Corp.: | | | | | | | | | | | | |
3.38%, 8/15/25 | | | | | | | 91 | | | | 93,358 | |
4.25%, 1/15/33 | | | | | | | 35 | | | | 37,302 | |
4.40%, 8/15/35 | | | | | | | 79 | | | | 84,920 | |
3.20%, 7/15/36 | | | | | | | 140 | | | | 131,028 | |
4.75%, 3/01/44 | | | | | | | 85 | | | | 94,586 | |
4.60%, 8/15/45 | | | | | | | 54 | | | | 58,886 | |
3.40%, 7/15/46 | | | | | | | 42 | | | | 38,245 | |
CSC Holdings LLC, 7.63%, 7/15/18 | | | | | | | 80 | | | | 84,400 | |
Discovery Communications LLC, 3.80%, 3/13/24 | | | | | | | 67 | | | | 67,747 | |
Interpublic Group of Cos., Inc., 4.00%, 3/15/22 | | | | | | | 72 | | | | 75,502 | |
NBCUniversal Media LLC, 4.45%, 1/15/43 | | | | | | | 55 | | | | 58,392 | |
Time Warner Cable LLC: | | | | | | | | | | | | |
5.00%, 2/01/20 | | | | | | | 89 | | | | 94,945 | |
4.00%, 9/01/21 | | | | | | | 25 | | | | 26,133 | |
5.50%, 9/01/41 | | | | | | | 29 | | | | 31,165 | |
4.50%, 9/15/42 | | | | | | | 9 | | | | 8,563 | |
Time Warner, Inc.: | | | | | | | | | | | | |
2.10%, 6/01/19 | | | | | | | 143 | | | | 143,059 | |
3.60%, 7/15/25 | | | | | | | 64 | | | | 63,855 | |
4.85%, 7/15/45 | | | | | | | 47 | | | | 48,395 | |
Viacom, Inc., 2.75%, 12/15/19 | | | | | | | 31 | | | | 31,351 | |
| | | | | | | | | | | | |
| | | | | | | | | | | | 2,602,550 | |
Metals & Mining — 0.1% | | | | | | | | | | | | |
Barrick Gold Corp., 5.25%, 4/01/42 | | | | | | | 59 | | | | 67,130 | |
Newmont Mining Corp.: | | | | | | | | | | | | |
3.50%, 3/15/22 | | | | | | | 120 | | | | 124,094 | |
4.88%, 3/15/42 | | | | | | | 69 | | | | 72,908 | |
Nucor Corp., 5.20%, 8/01/43 | | | | | | | 21 | | | | 24,641 | |
Rio Tinto Finance USA PLC, 4.13%, 8/21/42 | | | | | | | 70 | | | | 72,233 | |
Steel Dynamics, Inc., 5.13%, 10/01/21 | | | | | | | 38 | | | | 39,025 | |
| | | | | | | | | | | | |
| | | | | | | | | | | | 400,031 | |
Multi-Utilities — 0.1% | | | | | | | | | | | | |
Dominion Energy Gas Holdings LLC, 4.60%, 12/15/44 | | | | | | | 54 | | | | 56,425 | |
NiSource Finance Corp., 3.49%, 5/15/27 | | | | | | | 90 | | | | 90,619 | |
Pacific Gas & Electric Co.: | | | | | | | | | | | | |
4.75%, 2/15/44 | | | | | | | 19 | | | | 21,624 | |
4.30%, 3/15/45 | | | | | | | 46 | | | | 49,272 | |
Virginia Electric & Power Co.: | | | | | | | | | | | | |
3.50%, 3/15/27 | | | | | | | 97 | | | | 99,740 | |
4.45%, 2/15/44 | | | | | | | 26 | | | | 28,405 | |
4.20%, 5/15/45 | | | | | | | 28 | | | | 29,395 | |
| | | | | | | | | | | | |
| | | | | | | | | | | | 375,480 | |
Oil, Gas & Consumable Fuels — 0.7% | | | | | | | | | | | | |
Anadarko Petroleum Corp.: | | | | | | | | | | | | |
7.95%, 6/15/39 | | | | | | | 41 | | | | 51,612 | |
4.50%, 7/15/44 | | | | | | | 30 | | | | 27,492 | |
Apache Corp., 4.25%, 1/15/44 | | | | | | | 53 | | | | 49,643 | |
Canadian Natural Resources Ltd.: | | | | | | | | | | | | |
2.95%, 1/15/23 | | | | | | | 130 | | | | 128,964 | |
3.85%, 6/01/27 | | | | | | | 170 | | | | 168,623 | |
Cenovus Energy, Inc., 4.25%, 4/15/27 (c) | | | | | | | 190 | | | | 180,999 | |
Devon Energy Corp.: | | | | | | | | | | | | |
3.25%, 5/15/22 | | | | | | | 95 | | | | 94,415 | |
| | | | | | | | | | | | |
| Corporate Bonds | | | | | Par
(000) | | | Value | |
Oil, Gas & Consumable Fuels (continued) | | | | | | | | | | | | |
5.85%, 12/15/25 | | | USD | | | | 125 | | | $ | 142,048 | |
5.60%, 7/15/41 | | | | | | | 75 | | | | 77,893 | |
Enbridge, Inc.: | | | | | | | | | | | | |
2.90%, 7/15/22 | | | | | | | 90 | | | | 89,820 | |
3.70%, 7/15/27 | | | | | | | 70 | | | | 69,948 | |
Endeavor Energy Resources LP/EER Finance, Inc., 7.00%, 8/15/21 (c) | | | | | | | 90 | | | | 93,150 | |
Energy Transfer LP, 6.13%, 12/15/45 | | | | | | | 95 | | | | 102,826 | |
Enterprise Products Operating LLC: | | | | | | | | | | | | |
5.10%, 2/15/45 | | | | | | | 23 | | | | 25,257 | |
4.90%, 5/15/46 | | | | | | | 67 | | | | 72,047 | |
EOG Resources, Inc.: | | | | | | | | | | | | |
4.15%, 1/15/26 | | | | | | | 52 | | | | 54,635 | |
3.90%, 4/01/35 | | | | | | | 10 | | | | 9,698 | |
Exxon Mobil Corp.: | | | | | | | | | | | | |
1.82%, 3/15/19 | | | | | | | 84 | | | | 84,331 | |
4.11%, 3/01/46 | | | | | | | 65 | | | | 68,569 | |
Halcon Resources Corp., 12.00%, 2/15/22 (c) | | | | | | | 30 | | | | 33,900 | |
Hess Corp., 4.30%, 4/01/27 | | | | | | | 199 | | | | 194,380 | |
Kinder Morgan Energy Partners LP: | | | | | | | | | | | | |
3.50%, 3/01/21 | | | | | | | 85 | | | | 87,038 | |
3.95%, 9/01/22 | | | | | | | 100 | | | | 103,319 | |
Kinder Morgan, Inc.: | | | | | | | | | | | | |
3.05%, 12/01/19 | | | | | | | 40 | | | | 40,695 | |
5.05%, 2/15/46 | | | | | | | 39 | | | | 39,164 | |
MPLX LP, 5.20%, 3/01/47 | | | | | | | 35 | | | | 36,046 | |
NGPL PipeCo LLC, 7.12%, 12/15/17 (c) | | | | | | | 85 | | | | 86,594 | |
Noble Energy, Inc., 5.05%, 11/15/44 | | | | | | | 58 | | | | 59,567 | |
Petro-Canada, 6.80%, 5/15/38 (h) | | | | | | | 50 | | | | 65,162 | |
Pioneer Natural Resources Co., 4.45%, 1/15/26 | | | | | | | 30 | | | | 31,544 | |
Plains All American Pipeline LP/PAA Finance Corp., 4.65%, 10/15/25 | | | | | | | 70 | | | | 71,749 | |
Resolute Energy Corp., 8.50%, 5/01/20 | | | | | | | 90 | | | | 89,550 | |
Sabine Pass Liquefaction LLC: | | | | | | | | | | | | |
5.63%, 4/15/23 | | | | | | | 100 | | | | 111,160 | |
4.20%, 3/15/28 (c) | | | | | | | 60 | | | | 60,619 | |
Spectra Energy Partners LP, 4.50%, 3/15/45 | | | | | | | 89 | | | | 87,714 | |
Sunoco Logistics Partners Operations LP: | | | | | | | | | | | | |
3.90%, 7/15/26 | | | | | | | 21 | | | | 20,605 | |
5.35%, 5/15/45 | | | | | | | 30 | | | | 29,405 | |
Tesoro Logistics LP/Tesoro Logistics Finance Corp., 5.50%, 10/15/19 | | | | | | | 90 | | | | 94,950 | |
TransCanada PipeLines Ltd.: | | | | | | | | | | | | |
1.88%, 1/12/18 | | | | | | | 59 | | | | 59,079 | |
2.50%, 8/01/22 | | | | | | | 70 | | | | 69,914 | |
Western Refining Logistics LP/WNRL Finance Corp., 7.50%, 2/15/23 | | | | | | | 90 | | | | 96,975 | |
Williams Partners LP, 4.00%, 9/15/25 | | | | | | | 118 | | | | 120,172 | |
| | | | | | | | | | | | |
| | | | | | | | | | | | 3,281,271 | |
Paper & Forest Products — 0.0% | | | | | | | | | | | | |
Georgia-Pacific LLC, 7.38%, 12/01/25 | | | | | | | 67 | | | | 85,248 | |
Pharmaceuticals — 0.3% | | | | | | | | | | | | |
Allergan Funding SCS: | | | | | | | | | | | | |
2.35%, 3/12/18 | | | | | | | 195 | | | | 195,814 | |
3.00%, 3/12/20 | | | | | | | 316 | | | | 322,705 | |
3.80%, 3/15/25 | | | | | | | 331 | | | | 342,370 | |
4.55%, 3/15/35 | | | | | | | 69 | | | | 73,646 | |
4.75%, 3/15/45 | | | | | | | 51 | | | | 55,053 | |
Mylan NV, 5.25%, 6/15/46 | | | | | | | 41 | | | | 44,850 | |
Pfizer, Inc., 4.00%, 12/15/36 | | | | | | | 107 | | | | 113,041 | |
Teva Pharmaceutical Finance Co. BV, 3.65%, 11/10/21 | | | | | | | 56 | | | | 57,827 | |
See Notes to Financial Statements.
| | | | | | |
| 36 | | BLACKROCK SERIES FUND, INC. | | JUNE 30, 2017 | | |
| | | | |
| Schedule of Investments (continued) | | | BlackRock Balanced Capital Portfolio | |
| | | | |
| | | | | | | | | | | | |
| Corporate Bonds | | | | | Par
(000) | | | Value | |
Pharmaceuticals (continued) | | | | | | | | | | | | |
Teva Pharmaceutical Finance Netherlands III BV, 2.80%, 7/21/23 | | | USD | | | | 56 | | | $ | 54,468 | |
| | | | | | | | | | | | |
| | | | | | | | | | | | 1,259,774 | |
Road & Rail — 0.1% | | | | | | | | | | | | |
Burlington Northern Santa Fe LLC: | | | | | | | | | | | | |
4.15%, 4/01/45 | | | | | | | 16 | | | | 16,725 | |
4.70%, 9/01/45 | | | | | | | 11 | | | | 12,388 | |
4.13%, 6/15/47 | | | | | | | 73 | | | | 76,764 | |
CSX Corp., 4.25%, 11/01/66 | | | | | | | 43 | | | | 42,388 | |
Norfolk Southern Corp., 6.00%, 5/23/2111 | | | | | | | 31 | | | | 37,325 | |
Penske Truck Leasing Co. LP/PTL Finance Corp., 3.40%, 11/15/26 (c) | | | | | | | 139 | | | | 136,591 | |
Union Pacific Corp.: | | | | | | | | | | | | |
3.38%, 2/01/35 | | | | | | | 34 | | | | 33,625 | |
3.88%, 2/01/55 | | | | | | | 37 | | | | 35,714 | |
Union Pacific Railroad Co. Pass-Through Trust,
Series 2014-1, 3.23%, 5/14/26 | | | | | | | 57 | | | | 58,156 | |
| | | | | | | | | | | | |
| | | | | | | | | | | | 449,676 | |
Semiconductors & Semiconductor Equipment — 0.5% | | | | | |
Analog Devices, Inc.: | | | | | | | | | | | | |
3.90%, 12/15/25 | | | | | | | 19 | | | | 19,749 | |
3.50%, 12/05/26 | | | | | | | 164 | | | | 165,277 | |
5.30%, 12/15/45 | | | | | | | 18 | | | | 20,617 | |
Applied Materials, Inc.: | | | | | | | | | | | | |
3.30%, 4/01/27 | | | | | | | 112 | | | | 113,820 | |
4.35%, 4/01/47 | | | | | | | 39 | | | | 41,395 | |
Broadcom Corp./Broadcom Cayman Finance Ltd.: | | | | | | | | | | | | |
2.38%, 1/15/20 (c) | | | | | | | 545 | | | | 545,792 | |
3.00%, 1/15/22 (c) | | | | | | | 527 | | | | 531,710 | |
3.63%, 1/15/24 (c) | | | | | | | 483 | | | | 494,108 | |
Lam Research Corp.: | | | | | | | | | | | | |
2.75%, 3/15/20 | | | | | | | 60 | | | | 60,764 | |
2.80%, 6/15/21 | | | | | | | 80 | | | | 81,152 | |
QUALCOMM, Inc.: | | | | | | | | | | | | |
2.60%, 1/30/23 | | | | | | | 125 | | | | 124,544 | |
4.80%, 5/20/45 | | | | | | | 41 | | | | 44,999 | |
Xilinx, Inc., 2.95%, 6/01/24 | | | | | | | 55 | | | | 55,148 | |
| | | | | | | | | | | | |
| | | | | | | | | | | | 2,299,075 | |
Software — 0.2% | | | | | | | | | | | | |
Autodesk, Inc., 3.50%, 6/15/27 | | | | | | | 185 | | | | 181,927 | |
Microsoft Corp.: | | | | | | | | | | | | |
3.50%, 2/12/35 | | | | | | | 69 | | | | 69,569 | |
3.45%, 8/08/36 | | | | | | | 114 | | | | 114,071 | |
3.70%, 8/08/46 | | | | | | | 243 | | | | 240,458 | |
4.25%, 2/06/47 | | | | | | | 310 | | | | 335,623 | |
Oracle Corp.: | | | | | | | | | | | | |
3.25%, 5/15/30 | | | | | | | 66 | | | | 66,320 | |
3.90%, 5/15/35 | | | | | | | 39 | | | | 40,189 | |
4.00%, 7/15/46 | | | | | | | 74 | | | | 74,732 | |
4.38%, 5/15/55 | | | | | | | 26 | | | | 27,303 | |
| | | | | | | | | | | | |
| | | | | | | | | | | | 1,150,192 | |
Technology Hardware, Storage & Peripherals — 0.3% | | | | | |
Apple Inc.: | | | | | | | | | | | | |
3.00%, 2/09/24 | | | | | | | 138 | | | | 140,093 | |
2.85%, 5/11/24 | | | | | | | 445 | | | | 447,156 | |
3.45%, 2/09/45 | | | | | | | 44 | | | | 41,345 | |
4.65%, 2/23/46 | | | | | | | 318 | | | | 356,453 | |
Dell International LLC/EMC Corp.: | | | | | | | | | | | | |
5.45%, 6/15/23 (c) | | | | | | | 176 | | | | 190,990 | |
8.35%, 7/15/46 (c) | | | | | | | 73 | | | | 94,212 | |
Hewlett Packard Enterprise Co.: | | | | | | | | | | | | |
2.85%, 10/05/18 | | | | | | | 205 | | | | 206,754 | |
| | | | | | | | | | | | |
| Corporate Bonds | | | | | Par
(000) | | | Value | |
Technology Hardware, Storage & Peripherals (continued) | | | | | |
3.60%, 10/15/20 | | | USD | | | | 101 | | | $ | 104,141 | |
HP, Inc., 3.75%, 12/01/20 | | | | | | | 21 | | | | 21,980 | |
Seagate HDD Cayman, 5.75%, 12/01/34 | | | | | | | 3 | | | | 3,001 | |
| | | | | | | | | | | | |
| | | | | | | | | | | | 1,606,125 | |
Tobacco — 0.0% | | | | | | | | | | | | |
Reynolds American, Inc.: | | | | | | | | | | | | |
2.30%, 6/12/18 | | | | | | | 70 | | | | 70,305 | |
3.25%, 6/12/20 | | | | | | | 30 | | | | 30,886 | |
| | | | | | | | | | | | |
| | | | | | | | | | | | 101,191 | |
Trading Companies & Distributors — 0.1% | | | | | | | | | |
Air Lease Corp.: | | | | | | | | | | | | |
2.63%, 7/01/22 | | | | | | | 175 | | | | 173,449 | |
3.00%, 9/15/23 | | | | | | | 209 | | | | 207,798 | |
3.63%, 4/01/27 | | | | | | | 103 | | | | 103,010 | |
GATX Corp.: | | | | | | | | | | | | |
2.60%, 3/30/20 | | | | | | | 67 | | | | 67,694 | |
3.85%, 3/30/27 | | | | | | | 43 | | | | 43,276 | |
| | | | | | | | | | | | |
| | | | | | | | | | | | 595,227 | |
Wireless Telecommunication Services — 0.1% | | | | | | | | | |
Rogers Communications, Inc., 5.00%, 3/15/44 | | | | | | | 20 | | | | 22,622 | |
Sprint Spectrum Co. LLC/Sprint Spectrum Co. II LLC/Sprint Spectrum Co. III LLC, 3.36%, 9/20/21 (c) | | | | | | | 281 | | | | 283,459 | |
Vodafone Group PLC, 4.38%, 2/19/43 | | | | | | | 40 | | | | 39,500 | |
| | | | | | | | | | | | |
| | | | | | | | | | | | 345,581 | |
Total Corporate Bonds — 8.9% | | | | | | | | | | | 44,513,661 | |
| | | | | | | | | | | | |
| Foreign Agency Obligations | | | | | | | | | |
Argentina — 0.0% | | | | | | | | | | | | |
Petrobras Argentina SA, 7.38%, 7/21/23 (c) | | | | | | | 27 | | | | 28,478 | |
YPF SA: | | | | | | | | | | | | |
8.88%, 12/19/18 (c) | | | | | | | 33 | | | | 35,356 | |
8.50%, 3/23/21 (c) | | | | | | | 6 | | | | 6,674 | |
| | | | | | | | | | | | |
| | | | | | | | | | | | 70,508 | |
Brazil — 0.1% | | | | | | | | | | | | |
Petrobras Global Finance BV: | | | | | | | | | | | | |
5.75%, 1/20/20 | | | | | | | 12 | | | | 12,452 | |
4.88%, 3/17/20 | | | | | | | 12 | | | | 12,241 | |
5.38%, 1/27/21 | | | | | | | 143 | | | | 145,388 | |
8.38%, 5/23/21 | | | | | | | 192 | | | | 214,921 | |
6.13%, 1/17/22 | | | | | | | 11 | | | | 11,347 | |
8.75%, 5/23/26 | | | | | | | 2 | | | | 2,300 | |
7.38%, 1/17/27 | | | | | | | 14 | | | | 14,812 | |
| | | | | | | | | | | | |
| | | | | | | | | | | | 413,461 | |
Mexico — 0.0% | | | | | | | | | | | | |
Petroleos Mexicanos, 6.50%, 3/13/27 (c) | | | | | | | 134 | | �� | | 143,949 | |
Total Foreign Agency Obligations — 0.1% | | | | | | | | 627,918 | |
| | | | | | | | | | | | |
| | | | | | | | | | |
See Notes to Financial Statements.
| | | | | | |
| | | BLACKROCK SERIES FUND, INC. | | JUNE 30, 2017 | | 37 |
| | | | |
| Schedule of Investments (continued) | | | BlackRock Balanced Capital Portfolio | |
| | | | |
| | | | | | | | | | | | |
| Foreign Government Obligations | | | | | Par (000) | | | Value | |
Argentina — 0.1% | | | | | | | | | | | | |
Republic of Argentina: | | | | | | | | | | | | |
6.25%, 4/22/19 | | | USD | | | | 303 | | | $ | 317,393 | |
5.63%, 1/26/22 | | | | | | | 173 | | | | 177,152 | |
7.82%, 12/31/33 | | | EUR | | | | 54 | | | | 64,993 | |
7.13%, 6/28/2117 (c) | | | USD | | | | 42 | | | | 38,115 | |
| | | | | | | | | | | | |
| | | | | | | | | | | | 597,653 | |
Colombia — 0.1% | | | | | | | | | | | | |
Republic of Colombia, 4.00%, 2/26/24 | | | | | | | 480 | | | | 498,240 | |
Hungary — 0.0% | | | | | | | | | | | | |
Republic of Hungary, 5.38%, 3/25/24 | | | | | | | 140 | | | | 157,600 | |
Indonesia — 0.1% | | | | | | | | | | | | |
Republic of Indonesia: | | | | | | | | | | | | |
8.38%, 3/15/24 | | | IDR | | | | 404,000 | | | | 32,909 | |
8.38%, 9/15/26 | | | 2,182,000 | | | | 180,585 | |
7.00%, 5/15/27 | | | 1,108,000 | | | | 84,176 | |
9.00%, 3/15/29 | | | | | | | 135,000 | | | | 11,536 | |
| | | | | | | | | | | | |
| | | | | | | | | | | | 309,206 | |
Lebanon — 0.0% | | | | | | | | | | | | |
Lebanese Republic, 6.85%, 3/23/27 | | | USD | | | | 87 | | | | 87,590 | |
Mexico — 0.6% | | | | | | | | | | | | |
United Mexican States: | | | | | | | | | | | | |
Series M, 4.75%, 6/14/18 | | | MXN | | | | 36 | | | | 194,396 | |
Series M, 5.00%, 12/11/19 | | | | | | | 314 | | | | 1,667,273 | |
4.15%, 3/28/27 | | | USD | | | | 832 | | | | 861,536 | |
| | | | | | | | | | | | |
| | | | | | | | | | | | 2,723,205 | |
Panama — 0.0% | | | | | | | | | | | | |
Republic of Panama, 3.75%, 3/16/25 | | | | | | | 200 | | | | 206,000 | |
Peru — 0.0% | | | | | | | | | | | | |
Republic of Peru, 7.35%, 7/21/25 | | | | | | | 150 | | | | 195,900 | |
Philippines — 0.1% | | | | | | | | | | | | |
Republic of the Philippines, 5.50%, 3/30/26 | | | | | | | 200 | | | | 240,256 | |
Russia — 0.3% | | | | | | | | | | | | |
Russian Federation: | | | | | | | | | | | | |
7.50%, 8/18/21 | | | RUB | | | | 35,146 | | | | 588,498 | |
7.40%, 12/07/22 | | | | | | | 7,185 | | | | 119,756 | |
7.75%, 9/16/26 | | | | | | | 10,156 | | | | 172,381 | |
8.15%, 2/03/27 | | | | | | | 25,523 | | | | 450,261 | |
7.05%, 1/19/28 | | | | | | | 15,036 | | | | 242,845 | |
| | | | | | | | | | | | |
| | | | | | | | | | | | 1,573,741 | |
South Africa — 0.1% | | | | | | | | | | | | |
Republic of South Africa, 6.25%, 3/31/36 | | | ZAR | | | | 4,796 | | | | 258,793 | |
Turkey — 0.2% | | | | | | | | | | | | |
Republic of Turkey: | | | | | | | | | | | | |
10.50%, 1/15/20 | | | TRY | | | | 440 | | | | 124,880 | |
7.00%, 6/05/20 | | | USD | | | | 117 | | | | 127,931 | |
9.20%, 9/22/21 | | | TRY | | | | 580 | | | | 157,675 | |
11.00%, 3/02/22 | | | | | | | 1,205 | | | | 348,987 | |
8.80%, 9/27/23 | | | | | | | 330 | | | | 87,390 | |
7.38%, 2/05/25 | | | USD | | | | 88 | | | | 101,907 | |
| | | | | | | | | | | | |
| | | | | | | | | | | | 948,770 | |
Uruguay — 0.0% | | | | | | | | | | | | |
Republic of Uruguay, 4.38%, 10/27/27 | | | | | | | 140 | | | | 148,750 | |
Total Foreign Government Obligations — 1.6% | | | | | | | | | | | 7,945,704 | |
| | | | | | | | | | | | |
| | | | | | | | | | |
| | | | | | | | | | | | |
| Investment Companies | | | | | Shares | | | Value | |
iShares Core U.S. Aggregate Bond ETF (i) | | | | | | | 162,425 | | | $ | 17,787,162 | |
iShares iBoxx $ High Yield Corporate Bond ETF (i) | | | | | | | 18,030 | | | | 1,593,672 | |
Total Investment Companies — 3.9% | | | | | | | | | | | 19,380,834 | |
| | | | | | | | | | | | |
| | | | |
| Non-Agency Mortgage-Backed Securities | | | | | Par
(000) | | | | |
Ajax Mortgage Loan Trust, Series 2016-A, Class A, 4.25%, 8/25/64 (b)(c) | | | USD | | | | 88 | | | | 89,074 | |
American Home Mortgage Assets Trust, Series 2006-3, Class 2A11, 1.67%, 10/25/46 (a) | | | | | | | 84 | | | | 70,974 | |
Angel Oak Mortgage Trust I LLC, Series 2016-1, Class A1, 3.50%, 7/25/46 (b)(c) | | | | | | | 67 | | | | 66,784 | |
Angel Oak Mortgage Trust LLC, Series 2015-1, Class A, 4.50%, 11/25/45 (b)(c) | | | | | | | 22 | | | | 22,400 | |
APS Resecuritization Trust: | | | | | | | | | | | | |
Series 2016-3, Class 3A,
3.84%, 9/27/46 (a)(c)(d) | | | | | | | 153 | | | | 154,697 | |
Series 2016-3, Class 4A,
3.59%, 4/27/47 (a)(c)(d) | | | | | | | 85 | | | | 85,564 | |
Banc of America Funding Trust, Series 2016-R2,
Class 1A1, 4.70%, 5/01/33 (a)(c)(d) | | | | | | | 183 | | | | 185,778 | |
COLT LLC, Series 2015-1, Class A1V,
4.02%, 12/26/45 (a)(c) | | | | | | | 26 | | | | 25,920 | |
Countrywide Alternative Loan Trust: | | | | | | | | | | | | |
Series 2005-72, Class A3, 1.52%, 1/25/36 (a) | | | | | | | 34 | | | | 30,109 | |
Series 2006-OA21, Class A1, 1.40%, 3/20/47 (a) | | | | | | | 1,183 | | | | 991,978 | |
Series 2007-OA3, Class 1A1, 1.36%, 4/25/47 (a) | | | | | | | 49 | | | | 43,871 | |
Countrywide Home Loan Mortgage Pass-Through Trust, Series 2006-OA4, Class A1, 1.69%, 4/25/46 (a) | | | | | | | 71 | | | | 36,952 | |
Deephaven Residential Mortgage Trust,
Series 2016-1A, Class A1, 4.00%, 7/25/46 (c)(d) | | | | | | | 125 | | | | 126,540 | |
Deutsche ALT-A Securities, Inc., Series 2007-RS1, Class A2, 1.72%, 1/27/37 (a)(c) | | | | | | | 16 | | | | 30,408 | |
GreenPoint Mortgage Funding Trust, Series 2006-AR2, Class 4A1, 2.73%, 3/25/36 (a) | | | | | | | 12 | | | | 10,940 | |
GSMPS Mortgage Loan Trust: | | | | | | | | | | | | |
Series 2005-RP2, Class 1AF, 1.57%, 3/25/35 (a)(c) | | | | | | | 46 | | | | 40,846 | |
Series 2006-RP1, Class 1AF1, 1.37%, 1/25/36 (a)(c) | | | | | | | 34 | | | | 28,719 | |
Impac Secured Assets CMN Owner Trust,
Series 2004-3, Class 1A4, 1.82%, 11/25/34 (a) | | | | | | | 26 | | | | 25,411 | |
JPMorgan Alternative Loan Trust, Series 2007-A1, Class 1A4, 1.43%, 3/25/37 (a) | | | | | | | 70 | | | | 52,842 | |
JPMorgan Mortgage Trust, Series 2017-2, Class A6, 3.00%, 5/25/47 (a)(c)(d) | | | | | | | 149 | | | | 150,518 | |
LSTAR Securities Investment Ltd., Series 2017-2, Class A1, 3.05%, 2/01/22 (a)(c)(d) | | | | | | | 204 | | | | 204,233 | |
LSTAR Securities Investment Trust, Series 2016-5, Class A1, 3.05%, 11/01/21 (a)(c)(d) | | | | | | | 143 | | | | 144,265 | |
See Notes to Financial Statements.
| | | | | | |
| 38 | | BLACKROCK SERIES FUND, INC. | | JUNE 30, 2017 | | |
| | | | |
| Schedule of Investments (continued) | | | BlackRock Balanced Capital Portfolio | |
| | | | |
| | | | | | | | | | | | |
| Non-Agency Mortgage-Backed Securities | | | | | Par
(000) | | | Value | |
Morgan Stanley Resecuritization Trust, Series 2014-R8, Class 3B1, 1.41%, 6/26/47 (a)(c)(d) | | | USD | | | | 87 | | | $ | 81,405 | |
Nomura Resecuritization Trust, Series 2014-3R, Class 3A9, 1.51%, 11/26/35 (a)(c) | | | | | | | 100 | | | | 90,776 | |
RALI Trust: | | | | | | | | | | | | |
Series 2006-QO6, Class A2,
1.45%, 6/25/46 (a) | | | | | | | 35 | | | | 15,538 | |
Series 2007-QH6, Class A1,
1.41%, 7/25/37 (a) | | | | | | | 52 | | | | 46,860 | |
Structured Asset Mortgage Investments II Trust, Series 2006-AR4, Class 3A1, 1.21%, 6/25/36 (a) | | | | | | | 24 | | | | 21,702 | |
Structured Asset Securities Corp. Mortgage Loan Trust, Series 2006-RF4, Class 2A1, 6.00%, 10/25/36 (c) | | | | | | | 35 | | | | 30,852 | |
Wells Fargo Mortgage-Backed Securities Trust, Series 2005-AR16, Class CRB1, 3.28%, 10/25/35 (a) | | | | | | | 34 | | | | 26,610 | |
| | | | | | | | | | | | |
| | | | | | | | | | | | 2,932,566 | |
245 Park Avenue Trust, Series 2017-245P, Class E, 3.78%, 6/05/37 (a)(c) | | | | | | | 250 | | | | 234,507 | |
Banc of America Commercial Mortgage Trust: | | | | | | | | | | | | |
Series 2007-1, Class AMFX, 5.48%, 1/15/49 (a) | | | | | | | 11 | | | | 10,939 | |
Series 2007-3, Class AJ, 5.87%, 6/10/49 (a) | | | | | | | 5 | | | | 5,082 | |
Series 2007-5, Class AM, 5.77%, 2/10/51 (a) | | | | | | | 130 | | | | 131,444 | |
Barclays Commercial Mortgage Trust: | | | | | | | | | | | | |
Series 2015-SLP, Class D, 4.36%, 2/15/28 (a)(c) | | | | | | | 100 | | | | 100,153 | |
Series 2015-SRCH, Class A1, 3.31%, 8/10/35 (c) | | | | | | | 100 | | | | 102,433 | |
Bayview Commercial Asset Trust: | | | | | | | | | | | | |
Series 2005-4A, Class A1, 1.52%, 1/25/36 (a)(c) | | | | | | | 37 | | | | 34,510 | |
Series 2005-4A, Class M1, 1.67%, 1/25/36 (a)(c) | | | | | | | 28 | | | | 26,068 | |
Series 2006-1A, Class A2, 1.58%, 4/25/36 (a)(c) | | | | | | | 19 | | | | 16,969 | |
Series 2006-3A, Class A2, 1.52%, 10/25/36 (a)(c) | | | | | | | 27 | | | | 24,729 | |
Series 2007-4A, Class A1, 1.67%, 9/25/37 (a)(c) | | | | | | | 92 | | | | 80,791 | |
Series 2007-5A, Class A3, 2.22%, 10/25/37 (a)(c) | | | | | | | 77 | | | | 74,369 | |
Series 2008-4, Class A3, 3.97%, 7/25/38 (a)(c) | | | | | | | 40 | | | | 41,822 | |
BHMS Mortgage Trust, Series 2014-ATLS, Class AFL, 2.49%, 7/05/33 (a)(c) | | | | | | | 334 | | | | 333,700 | |
BWAY Mortgage Trust: | | | | | | | | | | | | |
Series 2013-1515, Class C, 3.45%, 3/10/33 (c) | | | | | | | 100 | | | | 99,703 | |
Series 2013-1515, Class F, 4.06%, 3/10/33 (a)(c) | | | | | | | 100 | | | | 97,302 | |
BXP Trust, Series 2017-GM, Class A,
3.38%, 6/13/39 (c)(d) | | | | | | | 35 | | | | 36,047 | |
CCRESG Commercial Mortgage Trust, Series 2016-HEAT, Class D, 5.67%, 4/10/29 (a)(c) | | | | | | | 10 | | | | 10,158 | |
CDGJ Commercial Mortgage Trust, Series 2014-BXCH, Class A, 2.56%, 12/15/27 (a)(c) | | | | | | | 186 | | | | 185,810 | |
Chicago Skyscraper Trust: | | | | | | | | | | | | |
Series 2017-SKY, Class D, 3.66%, 2/15/30 (a)(c) | | | | | | | 100 | | | | 101,252 | |
Series 2017-SKY, Class E, 4.46%, 2/15/30 (a)(c) | | | | | | | 100 | | | | 101,252 | |
| | | | | | | | | | | | |
| Non-Agency Mortgage-Backed Securities | | | | | Par
(000) | | | Value | |
Citigroup Commercial Mortgage Trust: | | | | | | | | | | | | |
Series 2013-GC11, Class D, 4.60%, 4/10/46 (a)(c) | | | USD | | | | 190 | | | $ | 176,288 | |
Series 2016-C1, Class C, 5.12%, 5/10/49 (a) | | | | | | | 30 | | | | 30,392 | |
Series 2017-P7, Class A4, 3.71%, 4/14/50 | | | | | | | 40 | | | | 41,755 | |
Citigroup/Deutsche Bank Commercial Mortgage Trust: | | | | | | | | | | | | |
Series 2007-CD5, Class AMA, 6.51%, 11/15/44 (a) | | | | | | | 138 | | | | 139,154 | |
Series 2017-CD3, Class A4, 3.63%, 2/10/50 (a) | | | | | | | 10 | | | | 10,410 | |
Citigroup/Deutsche Bank Mortgage Trust, Series 2006-CD3, Class AM, 5.65%, 10/15/48 | | | | | | | 220 | | | | 223,736 | |
CLNS Trust, Series 2017-IKPR, Class E,
4.50%, 6/11/32 (a)(c) | | | | | | | 50 | | | | 50,187 | |
Commercial Mortgage Pass-Through Certificates: | | | | | | | | | | | | |
Series 2007-C9, Class AJFL, 1.68%, 12/10/49 (a)(c) | | | | | | | 59 | | | | 59,335 | |
Series 2014-CR16, Class A4, 4.05%, 4/10/47 | | | | | | | 87 | | | | 92,677 | |
Series 2014-CR17, Class A5, 3.98%, 5/10/47 | | | | | | | 123 | | | | 130,515 | |
Series 2014-CR18, Class A4, 3.55%, 5/15/24 | | | | | | | 10 | | | | 10,332 | |
Series 2014-CR19, Class A5, 3.80%, 8/10/24 | | | | | | | 30 | | | | 31,502 | |
Series 2014-LC15, Class A4, 4.01%, 4/10/47 | | | | | | | 20 | | | | 21,243 | |
Series 2014-TWC, Class B, 2.83%, 2/13/32 (a)(c) | | | | | | | 100 | | | | 100,343 | |
Series 2015-CR23, Class C, 4.40%, 5/10/48 | | | | | | | 10 | | | | 9,493 | |
Series 2015-CR23, Class CMD,
3.81%, 5/10/48 (a)(c) | | | | | | | 110 | | | | 107,643 | |
Series 2015-CR25, Class C, 4.70%, 8/10/48 (a) | | | | | | | 110 | | | | 110,833 | |
Core Industrial Trust, Series 2015-TEXW, Class F, 3.98%, 2/10/34 (a)(c) | | | | | | | 100 | | | | 96,309 | |
Cosmopolitan Hotel Trust, Series 2016-CSMO, Class A, 2.56%, 11/15/33 (a)(c) | | | | | | | 100 | | | | 100,751 | |
Countrywide Alternative Loan Trust, Series 2006-OA9, Class 2A1B 1.41%, 7/20/46 (a) | | | | | | | 191 | | | | 116,383 | |
Countrywide Commercial Mortgage Trust, Series 2007-MF1, Class A, 6.48%, 11/12/43 (a)(c) | | | | | | | 7 | | | | 6,989 | |
Credit Suisse Commercial Mortgage Trust, Series 2008-C1, Class A3, 6.52%, 2/15/41 (a) | | | | | | | 39 | | | | 39,408 | |
Credit Suisse Mortgage Capital Certificates: | | | | | | | | | | | | |
Series 17-1, Class A, 4.50%, 3/25/21 | | | | | | | 407 | | | | 406,929 | |
Series 2015-GLPB, Class A, 3.64%, 11/15/34 (c) | | | | | | | 100 | | | | 104,960 | |
CSAIL Commercial Mortgage Trust, Series 2017-C8, Class A4, 3.39%, 6/15/50 (d) | | | | | | | 20 | | | | 20,407 | |
Deutsche Bank JPMorgan Mortgage Trust, Series 2016-C3, Class D, 3.64%, 9/10/49 (a)(c) | | | | | | | 73 | | | | 58,706 | |
FREMF Mortgage Trust: | | | | | | | | | | | | |
Series 2017-K64, Class B, 4.12%, 3/25/27 (a)(c) | | | | | | | 30 | | | | 30,197 | |
Series 2017-K725, Class B, 3.88%, 2/25/24 (a)(c) | | | | | | | 70 | | | | 69,977 | |
GAHR Commercial Mortgage Trust, Series 2015-NRF, Class FFX, 3.49%, 12/15/34 (a)(c) | | | | | | | 30 | | | | 29,669 | |
See Notes to Financial Statements.
| | | | | | |
| | | BLACKROCK SERIES FUND, INC. | | JUNE 30, 2017 | | 39 |
| | | | |
| Schedule of Investments (continued) | | | BlackRock Balanced Capital Portfolio | |
| | | | |
| | | | | | | | | | | | |
| Non-Agency Mortgage-Backed Securities | | | | | Par
(000) | | | Value | |
GS Mortgage Securities Corp. II, Series 2013-KING, Class E, 3.55%, 12/10/27 (a)(c) | | | USD | | | | 350 | | | $ | 348,294 | |
GS Mortgage Securities Trust, Series 2014-GC24, Class A5, 3.93%, 9/10/47 | | | | | | | 20 | | | | 21,175 | |
HMH Trust, Series 2017-NSS, Class A,
3.06%, 6/05/22 (c)(d) | | | | | | | 100 | | | | 101,008 | |
IMT Trust, Series 2017-APTS, Class AFX,
3.48%, 6/15/34 (a)(c) | | | | | | | 100 | | | | 102,994 | |
JPMorgan Chase Commercial Mortgage Securities Trust: | | | | | | | | | | | | |
Series 2014-C21, Class A5,
3.77%, 6/15/24 | | | | | | | 30 | | | | 31,534 | |
Series 2014-C22, Class A4,
3.80%, 9/15/47 | | | | | | | 10 | | | | 10,466 | |
Series 2014-CBM, Class E,
5.01%, 10/15/29 (a)(c) | | | | | | | 100 | | | | 100,311 | |
Series 2014-FL6, Class A,
2.56%, 11/15/31 (a)(c) | | | | | | | 32 | | | | 32,219 | |
Series 2016-ATRM, Class D,
5.35%, 10/05/28 (c) | | | | | | | 100 | | | | 101,287 | |
Series 2016-NINE, Class A,
2.85%, 10/06/38 (a)(c) | | | | | | | 100 | | | | 98,053 | |
Lehman Brothers Small Balance Commercial Mortgage Trust, Series 2007-1A, Class 1A,
1.47%, 3/25/37 (a)(c) | | | | | | | 37 | | | | 34,137 | |
Lone Star Portfolio Trust: | | | | | | | | | | | | |
Series 2015-LSP, Class A1A2,
2.96%, 9/15/28 (a)(c) | | | | | | | 50 | | | | 50,261 | |
Series 2015-LSP, Class D,
5.16%, 9/15/28 (a)(c) | | | | | | | 179 | | | | 182,291 | |
Morgan Stanley Bank of America Merrill Lynch Trust: | | | | | | | | | | | | |
Series 2014-C16, Class A5,
3.89%, 6/15/47 | | | | | | | 50 | | | | 52,891 | |
Series 2015-C26, Class D,
3.06%, 10/15/48 (c) | | | | | | | 65 | | | | 50,974 | |
Morgan Stanley Re-REMIC Trust, Series 2012-XA, Class A, 2.00%, 7/27/49 (c) | | | | | | | 9 | | | | 9,207 | |
Resource Capital Corp. Ltd.: | | | | | | | | | | | | |
Series 2014-CRE2, Class A,
2.05%, 4/15/32 (a)(c) | | | | | | | 17 | | | | 17,399 | |
Series 2017-CRE5, Class A,
1.89%, 7/15/34 (a)(c) | | | | | | | 50 | | | | 50,000 | |
Series 2017-CRE5, Class B,
3.09%, 7/15/34 (a)(c)(d) | | | | | | | 20 | | | | 20,000 | |
STRIPs Ltd., Series 2012-1A, Class B,
0.50%, 12/25/44 (c)(d) | | | | | | | 65 | | | | 63,676 | |
Velocity Commercial Capital Loan Trust, Series 2016-2, Class AFL, 3.02%, 10/25/46 (a) | | | | | | | 89 | | | | 89,973 | |
Waldorf Astoria Boca Raton Trust, Series 2016-BOCA, Class A, 2.51%, 6/15/29 (a)(c) | | | | | | | 100 | | | | 100,310 | |
Wells Fargo Commercial Mortgage Trust: | | | | | | | | | | | | |
Series 2014-TISH, Class SCH1,
3.91%, 1/15/27 (a)(c) | | | | | | | 300 | | | | 295,782 | |
Series 2015-C27, Class C,
3.89%, 2/15/48 | | | | | | | 47 | | | | 43,606 | |
Series 2015-C31, Class D,
3.85%, 11/15/48 | | | | | | | 10 | | | | 7,606 | |
Series 2017-C38, Class A5,
3.45%, 7/15/50 | | | | | | | 20 | | | | 20,461 | |
WF-RBS Commercial Mortgage Trust, Series 2014-C21, Class A5, 3.68%, 7/15/24 | | | | | | | 30 | | | | 31,279 | |
WF-RBS Commercial Mortgage Trust 2014-C22,
3.91%, 9/15/24 (a) | | | | | | | 120 | | | | 113,208 | |
| | | | | | | | | | | | |
| | | | | | | | | | | | 6,455,965 | |
| | | | | | | | | | | | |
| Non-Agency Mortgage-Backed Securities | | | Par
(000) | | | Value | |
Banc of America Commercial Mortgage Trust, Series 2017-BNK3, Class XB, 0.78%, 2/15/50 (a) | | | USD | | | | 1,000 | | | $ | 52,520 | |
Barclays Commercial Mortgage Trust, Series 2015-SRCH, Class XA,
1.12%, 8/10/35 (a)(c) | | | | | | | 1,000 | | | | 71,550 | |
BB-UBS Trust, Series 2012-SHOW, Class XA, 0.73%, 11/05/36 (a)(c) | | | | | | | 4,250 | | | | 170,439 | |
CFCRE Commercial Mortgage Trust: | | | | | | | | | | | | |
Series 2016-C4, Class XA,
1.92%, 5/10/58 (a) | | | | | | | 127 | | | | 14,435 | |
Series 2016-C4, Class XB,
0.89%, 5/10/58 (a) | | | | | | | 120 | | | | 6,611 | |
Citigroup/Deutsche Bank Mortgage Trust, Series 2017-CD3, Class XA,
1.20%, 2/10/50 | | | | | | | 300 | | | | 23,238 | |
Commercial Mortgage Pass-Through Certificates: | | | | | | | | | | | | |
Series 2015-3BP, Class XA,
0.17%, 2/10/35 (a)(c) | | | | | | | 2,522 | | | | 17,276 | |
Series 2016-DC2, Class XA,
1.22%, 2/10/49 (a) | | | | | | | 229 | | | | 15,372 | |
Core Industrial Trust, Series 2015-TEXW, Class XA, 0.90%, 2/10/34 (a)(c) | | | | | | | 1,000 | | | | 31,733 | |
GS Mortgage Securities Trust: | | | | | | | | | | | | |
Series 2016-GS3, Class XA,
1.40%, 10/10/49 (a) | | | | | | | 996 | | | | 86,059 | |
Series 2017-GS5, Class XA,
0.97%, 3/10/50 (a) | | | | | | | 999 | | | | 65,756 | |
JPMDB Commercial Mortgage Securities Trust, Series 2016-C4, Class XC,
0.75%, 12/15/49 (a)(c)(d) | | | | | | | 1,800 | | | | 91,260 | |
LSTAR Commercial Mortgage Trust, Series 2017-5, Class X,
1.39%, 3/10/50 (a)(c) | | | | | | | 999 | | | | 56,382 | |
Morgan Stanley Bank of America Merrill Lynch Trust, Series 2014-C19, Class XF,
1.34%, 12/15/47 (a)(c)(d) | | | | | | | 100 | | | | 6,346 | |
One Market Plaza Trust: | | | | | | | | | | | | |
Series 2017-1MKT, Class XCP,
0.22%, 2/10/32 (a)(c) | | | | | | | 1,000 | | | | 6,300 | |
Series 2017-1MKT, Class XNCP,
0.00%, 2/10/32 (a)(c) | | | | | | | 200 | | | | — | |
Wells Fargo Commercial Mortgage Trust: | | | | | | | | | | | | |
Series 2015-C27, Class XA,
1.12%, 2/15/48 (a) | | | | | | | 981 | | | | 54,162 | |
Series 2016-C33,
1.97%, 3/15/59 (a) | | | | | | | 396 | | | | 42,921 | |
| | | | | | | | | | | | |
| | | | | | | | | | | | 812,360 | |
Total Non-Agency Mortgage-Backed Securities — 2.0% | | | | 10,200,891 | |
| | | | | | | | | | | | |
| Other Interests (j) | | | | | Beneficial
Interest
(000) | | | | |
Capital Markets — 0.0% | | | | | | | | | | | | |
Lehman Brothers Holdings Capital Trust VII (d)(e)(g) | | | | | | | 130 | | | | — | |
Lehman Brothers Holdings,
Inc. (d)(e)(g) | | | | | | | 490 | | | | — | |
Total Other Interests — 0.0% | | | | | | | | | | | — | |
| | | | | | | | | | | | |
| Preferred Securities | | | | | | | | | |
| Capital Trusts | | | | | Par
(000) | | | | |
Banks — 0.1% | | | | | | | | | | | | |
HSBC Holdings PLC, 6.00% (a)(k) | | | | | | | 200 | | | | 206,800 | |
See Notes to Financial Statements.
| | | | | | |
| 40 | | BLACKROCK SERIES FUND, INC. | | JUNE 30, 2017 | | |
| | | | |
Schedule of Investments (continued) | | | BlackRock Balanced Capital Portfolio | |
| | | | |
| | | | | | | | | | | | |
| Preferred Securities | | | | | Par
(000) | | | Value | |
Capital Markets — 0.0% | | | | | | | | | | | | |
Bank of New York Mellon Corp., Series F, 4.63% (a)(k) | | | USD | | | | 137 | | | $ | 138,178 | |
State Street Corp., 2.25%, 6/15/37 (a) | | | | | | | 28 | | | | 25,778 | |
| | | | | | | | | | | | |
| | | | | | | | | | | | 163,956 | |
Media — 0.0% | | | | | | | | | | | | |
NBCUniversal Enterprise, Inc., 5.25% (c)(k) | | | | | | | 80 | | | | 85,029 | |
Multi-Utilities — 0.0% | | | | | | | | | | | | |
Dominion Energy, Inc., 2.58%, 7/01/20 | | | | | | | 105 | | | | 105,542 | |
Total Capital Trusts — 0.1% | | | | | | | | | | | 561,327 | |
| | | | | | | | | | | | |
| Trust Preferreds | | | | | Shares | | | | |
Banks — 0.1% | | | | | | | | | | | | |
Citigroup Capital XIII, 7.54%, 10/30/40 (a) | | | | | | | 16,773 | | | | 435,763 | |
Total Preferred Securities — 0.2% | | | | | | | USD | | | | 997,090 | |
| | | | | | | | | | | | |
| | | | |
| Taxable Municipal Bonds | | | | | Par
(000) | | | | |
American Municipal Power, Inc. RB, 6.45%, 2/15/44 | | | USD | | | | 15 | | | | 19,609 | |
Arizona Health Facilities Authority RB, 1.58%, 1/01/37 (a) | | | | | | | 40 | | | | 35,171 | |
Bay Area Toll Authority RB: | | | | | | | | | | | | |
6.92%, 4/01/40 | | | | | | | 80 | | | | 112,330 | |
7.04%, 4/01/50 | | | | | | | 95 | | | | 145,364 | |
Board of Water Commissioners City & County of Denver RB, 5.00%, 9/15/47 | | | | | | | 60 | | | | 71,179 | |
Brooklyn Arena Local Development Corp. RB, 5.00%, 7/15/42 | | | | | | | 40 | | | | 44,796 | |
Buckeye Tobacco Settlement Financing Authority RB, 5.88%, 6/01/47 (g) | | | | | | | 80 | | | | 77,909 | |
California Health Facilities Financing Authority RB, 5.00%, 8/15/33 | | | | | | | 20 | | | | 23,521 | |
California Housing Finance Agency RB, 3.66%, 2/01/29 | | | | | | | 35 | | | | 35,145 | |
California Infrastructure & Economic Development Bank RB, 5.00%, 10/01/35-10/01/36 | | | | | | | 20 | | | | 24,082 | |
California State Public Works Board RB, 8.36%, 10/01/34 | | | | | | | 40 | | | | 59,964 | |
Central Texas Regional Mobility Authority RB, 5.00%, 1/01/45-1/01/46 | | | | | | | 40 | | | | 45,093 | |
Chesapeake Bay Bridge & Tunnel District RB, 5.00%, 7/01/51 | | | | | | | 10 | | | | 11,174 | |
Chesapeake Bay Bridge & Tunnel District RB AGM, 5.00%, 7/01/41 | | | | | | | 20 | | | | 22,999 | |
Chino Valley Unified School District GO, 5.25%, 8/01/47 | | | | | | | 40 | | | | 47,974 | |
City of Atlanta, GA Water & Wastewater Revenue RB, 5.00%, 11/01/37 | | | | | | | 20 | | | | 23,727 | |
City of Aurora, CO Water Revenue RB, 5.00%, 8/01/46 | | | | | | | 30 | | | | 34,974 | |
City of Houston, TX Combined Utility System Revenue RB, 5.00%, 11/15/35 | | | | | | | 20 | | | | 23,443 | |
City of Riverside, CA Electric Revenue RB, 7.61%, 10/01/40 | | | | | | | 25 | | | | 36,876 | |
City Public Service Board of San Antonio, TX RB, 5.81%, 2/01/41 | | | | | | | 45 | | | | 57,504 | |
Clark County School District GO, 5.00%, 6/15/23-6/15/28 | | | | | | | 85 | | | | 101,652 | |
Colorado Health Facilities Authority RB, 5.25%, 2/01/31 | | | | | | | 10 | | | | 10,557 | |
| | | | | | | | | | | | |
| Taxable Municipal Bonds | | | | | Par
(000) | | | Value | |
Commonwealth Financing Authority RB, 4.14%, 6/01/38 | | | USD | | | | 35 | | | $ | 36,234 | |
Commonwealth of Massachusetts GO, 5.00%, 7/01/28 | | | | | | | 15 | | | | 18,942 | |
Commonwealth of Puerto Rico GO, 8.00%, 7/01/35 (e)(g) | | | | | | | 715 | | | | 433,469 | |
Connecticut State Health & Educational Facility Authority RB, 5.00%, 7/01/45 | | | | | | | 70 | | | | 77,916 | |
Contra Costa Community College District GO, 6.50%, 8/01/34 | | | | | | | 25 | | | | 32,272 | |
County of Clark Department of Aviation RB, 5.00%, 7/01/21 | | | | | | | 30 | | | | 33,927 | |
County of Clark, NV RB, 5.00%, 7/01/28 | | | | | | | 20 | | | | 25,013 | |
County of Guilford, NC GO, 5.00%, 5/01/25-5/01/28 | | | | | | | 60 | | | | 75,294 | |
County of Miami-Dade, FL Aviation Revenue RB: | | | | | | | | | | | | |
2.50%, 10/01/24 | | | | | | | 50 | | | | 48,417 | |
5.00%, 10/01/38 | | | | | | | 45 | | | | 50,797 | |
County of Miami-Dade, FL GO, 5.00%, 7/01/35 | | | | | | | 20 | | | | 23,376 | |
County of Orange, FL Tourist Development Tax Revenue RB, 5.00%, 10/01/28 | | | | | | | 20 | | | | 25,139 | |
Dallas Area Rapid Transit RB, 5.00%, 12/01/41-12/01/46 | | | | | | | 70 | | | | 80,091 | |
District of Columbia GO, 5.00%, 6/01/34-6/01/36 | | | | | | | 90 | | | | 106,968 | |
District of Columbia RB, 5.59%, 12/01/34 | | | | | | | 50 | | | | 61,826 | |
District of Columbia Water & Sewer Authority RB, 5.00%, 10/01/52 | | | | | | | 40 | | | | 46,116 | |
Dutchess County Local Development Corp. RB, 5.00%, 7/01/46 | | | | | | | 50 | | | | 55,913 | |
Eastern Municipal Water District Financing Authority RB,
5.00%, 7/01/47 | | | | | | | 30 | | | | 35,351 | |
Geisinger Authority RB, 5.00%, 2/15/45 | | | | | | | 30 | | | | 34,335 | |
Golden State Tobacco Securitization Corp. RB: | | | | | | | | | | | | |
5.13%, 6/01/47 (g) | | | | | | | 75 | | | | 74,712 | |
5.75%, 6/01/47 | | | | | | | 10 | | | | 10,072 | |
Grant County Public Utility District No. 2 RB, 4.58%, 1/01/40 | | | | | | | 15 | | | | 15,523 | |
Great Lakes Water Authority Water Supply System Revenue RB, 5.25%, 7/01/33 | | | | | | | 5 | | | | 6,040 | |
Health & Educational Facilities Authority of the State of Missouri RB: | | | | | | | | | | | | |
5.00%, 11/15/29 | | | | | | | 15 | | | | 17,575 | |
3.65%, 8/15/57 | | | | | | | 40 | | | | 39,517 | |
Horry County School District, SC GO, 5.00%, 3/01/25 | | | | | | | 15 | | | | 18,364 | |
Kentucky Economic Development Finance Authority RB, 5.25%, 6/01/50 | | | | | | | 10 | | | | 10,926 | |
Lone Star College System GO, 5.00%, 8/15/42 | | | | | | | 40 | | | | 46,753 | |
Los Angeles Community College District GO, 6.60%, 8/01/42 | | | | | | | 95 | | | | 136,904 | |
Los Angeles County Metropolitan Transportation Authority RB, 5.00%, 7/01/38 | | | | | | | 10 | | | | 11,898 | |
Los Angeles Department of Water & Power RB, 6.60%, 7/01/50 | | | | | | | 30 | | | | 44,208 | |
Los Angeles Department of Water RB, 5.00%, 7/01/44 | | | | | | | 90 | | | | 105,682 | |
Los Angeles Unified School District GO: | | | | | | | | | | | | |
5.00%, 7/01/26 | | | | | | | 30 | | | | 37,592 | |
6.76%, 7/01/34 | | | | | | | 60 | | | | 82,584 | |
Massachusetts Clean Water Trust RB, 5.00%, 2/01/27-2/01/28 | | | | | | | 40 | | | | 49,227 | |
Massachusetts Development Finance Agency RB, 5.00%, 7/01/47 | | | | | | | 20 | | | | 22,494 | |
Metropolitan Government Nashville & Davidson County Health & Educational Facilities Board RB, 5.00%, 7/01/46 | | | | | | | 30 | | | | 33,696 | |
See Notes to Financial Statements.
| | | | | | |
| | | BLACKROCK SERIES FUND, INC. | | JUNE 30, 2017 | | 41 |
| | | | |
| Schedule of Investments (continued) | | | BlackRock Balanced Capital Portfolio | |
| | | | |
| | | | | | | | | | | | |
| Taxable Municipal Bonds | | | | | Par
(000) | | | Value | |
Metropolitan Transportation Authority RB: | | | | | | | | | | | | |
5.00%, 11/15/35-11/15/47 | | | USD | | | | 90 | | | $ | 105,637 | |
6.69%, 11/15/40 | | | | | | | 30 | | | | 41,005 | |
5.25%, 11/15/57 | | | | | | | 60 | | | | 70,341 | |
Metropolitan Washington Airports Authority Dulles Toll Road Revenue RB, 7.46%, 10/01/46 | | | | | | | 30 | | | | 43,739 | |
Metropolitan Washington Airports Authority Dulles Toll Road Revenue RB AGC, 0.00%, 10/01/39 (l) | | | | | | | 20 | | | | 8,275 | |
Miami-Dade County Educational Facilities Authority RB, 5.07%, 4/01/50 | | | | | | | 30 | | | | 33,172 | |
Michigan Finance Authority RB, 5.00%, 11/15/41 | | | | | | | 20 | | | | 22,413 | |
Mississippi Hospital Equipment & Facilities Authority RB, 5.00%, 9/01/46 | | | | | | | 30 | | | | 33,229 | |
Municipal Electric Authority of Georgia RB: | | | | | | | | | | | | |
5.00%, 1/01/20 | | | | | | | 30 | | | | 32,423 | |
6.64%, 4/01/57 | | | | | | | 45 | | | | 55,242 | |
New Caney Independent School District GO PSF, 5.00%, 2/15/47 | | | | | | | 30 | | | | 35,034 | |
New Jersey State Turnpike Authority RB, 7.41%, 1/01/40 | | | | | | | 66 | | | | 99,133 | |
New Jersey Transportation Trust Fund Authority RB, 5.00%, 6/15/29 | | | | | | | 20 | | | | 21,482 | |
New York City Transitional Finance Authority Building Aid Revenue RB, 5.00%, 7/15/40 | | | | | | | 20 | | | | 23,009 | |
New York City Transitional Finance Authority Future Tax Secured Revenue RB: | | | | | | | | | | | | |
2.28%, 5/01/26 | | | | | | | 25 | | | | 23,352 | |
3.05%, 5/01/27 (g) | | | | | | | 70 | | | | 69,236 | |
5.00%, 8/01/31-2/01/43 | | | | | | | 110 | | | | 128,369 | |
New York City Water & Sewer System RB: | | | | | | | | | | | | |
5.75%, 6/15/41 | | | | | | | 35 | | | | 46,265 | |
5.38%, 6/15/43 (g) | | | | | | | 215 | | | | 242,546 | |
5.50%, 6/15/43 (g) | | | | | | | 255 | | | | 288,925 | |
5.88%, 6/15/44 | | | | | | | 50 | | | | 67,633 | |
5.00%, 6/15/47 | | | | | | | 145 | | | | 168,596 | |
New York Convention Center Development Corp. RB, 5.00%, 11/15/40-11/15/46 | | | | | | | 60 | | | | 69,352 | |
New York State Dormitory Authority RB: | | | | | | | | | | | | |
5.00%, 2/15/27-3/15/32 | | | | | | | 100 | | | | 121,048 | |
5.39%, 3/15/40 | | | | | | | 50 | | | | 62,119 | |
New York State Environmental Facilities Corp. RB, 5.00%, 6/15/46 | | | | | | | 50 | | | | 58,978 | |
New York State Urban Development Corp. RB: | | | | | | | | | | | | |
2.86%, 3/15/24 | | | | | | | 80 | | | | 80,798 | |
5.00%, 3/15/25-3/15/27 | | | | | | | 25 | | | | 30,785 | |
New York Transportation Development Corp. RB: | | | | | | | | | | | | |
5.00%, 7/01/46 | | | | | | | 30 | | | | 32,541 | |
5.25%, 1/01/50 | | | | | | | 100 | | | | 109,434 | |
Northwest Independent School District GO PSF, 5.00%, 2/15/42 | | | | | | | 30 | | | | 34,727 | |
Ohio Water Development Authority Water Pollution Control Loan Fund RB, 5.00%, 12/01/31 | | | | | | | 10 | | | | 12,174 | |
Orange County Local Transportation Authority RB, 6.91%, 2/15/41 | | | | | | | 75 | | | | 103,730 | |
Oregon School Boards Association GO AMBAC, 4.76%, 6/30/28 | | | | | | | 80 | | | | 88,443 | |
Oregon State Lottery RB, 5.00%, 4/01/30-4/01/37 | | | | | | | 60 | | | | 71,887 | |
Oxnard School District GO BAM, 5.00%, 8/01/45 | | | | | | | 20 | | | | 23,175 | |
Pennsylvania Economic Development Financing Authority RB, 5.00%, 12/31/38 | | | | | | | 25 | | | | 27,813 | |
Pennsylvania State University RB, 5.00%, 9/01/42 | | | | | | | 30 | | | | 35,253 | |
| | | | | | | | | | | | |
| Taxable Municipal Bonds | | | | | Par
(000) | | | Value | |
Port Authority of New York & New Jersey RB: | | | | | | | | | | | | |
4.96%, 8/01/46 | | | USD | | | | 15 | | | $ | 17,808 | |
4.46%, 10/01/62 | | | | | | | 60 | | | | 65,371 | |
4.81%, 10/15/65 | | | | | | | 30 | | | | 34,616 | |
Port of Seattle, WA GO, 5.00%, 1/01/33-1/01/42 | | | | | | | 110 | | | | 130,145 | |
Regents of the University of California Medical Center Pooled Revenue RB, 6.58%, 5/15/49 | | | | | | | 75 | | | | 101,888 | |
Royal Oak Hospital Finance Authority RB, 5.00%, 9/01/39 | | | | | | | 20 | | | | 22,184 | |
Salt Lake City Corp. Airport Revenue RB, 5.00%, 7/01/47 | | | | | | | 50 | | | | 57,605 | |
Salt River Project Agricultural Improvement & Power District RB, 5.00%, 12/01/36 | | | | | | | 20 | | | | 23,306 | |
San Diego County Regional Transportation Commission RB, 5.00%, 4/01/48 | | | | | | | 60 | | | | 69,827 | |
San Diego Public Facilities Financing Authority Sewer Revenue RB, 5.00%, 5/15/39 | | | | | | | 25 | | | | 29,188 | |
San Francisco Bay Area Rapid Transit District GO, 5.00%, 8/01/36-8/01/47 | | | | | | | 50 | | | | 59,919 | |
San Francisco City & County Airport Comm-San Francisco International Airport RB, 5.00%, 5/01/41 | | | | | | | 30 | | | | 34,052 | |
South Carolina Public Service Authority RB: | | | | | | | | | | | | |
2.39%, 12/01/23 | | | | | | | 51 | | | | 48,138 | |
5.00%, 12/01/49-12/01/50 | | | | | | | 60 | | | | 65,083 | |
State of California GO: | | | | | | | | | | | | |
5.00%, 8/01/26-9/01/27 | | | | | | | 95 | | | | 117,796 | |
7.50%, 4/01/34 | | | | | | | 60 | | | | 87,132 | |
7.55%, 4/01/39 | | | | | | | 30 | | | | 45,779 | |
7.30%, 10/01/39 | | | | | | | 15 | | | | 21,935 | |
7.35%, 11/01/39 | | | | | | | 30 | | | | 44,028 | |
7.60%, 11/01/40 | | | | | | | 60 | | | | 93,432 | |
State of Georgia GO, 5.00%, 7/01/26-2/01/33 | | | | | | | 180 | | | | 221,208 | |
State of Illinois GO, 5.10%, 6/01/33 | | | | | | | 70 | | | | 65,512 | |
State of Kansas Department of Transportation RB, 5.00%, 9/01/35 | | | | | | | 10 | | | | 11,780 | |
State of Maryland GO, 5.00%, 3/15/28- 3/15/29 | | | | | | | 50 | | | | 62,305 | |
State of Ohio GO, 5.00%, 5/01/27-5/01/37 | | | | | | | 220 | | | | 259,049 | |
State of Oregon GO, 5.00%, 8/01/42 | | | | | | | 55 | | | | 65,142 | |
State of Texas GO, 5.00%, 8/01/42 | | | | | | | 20 | | | | 23,650 | |
State of Washington GO, 5.00%, 7/01/28-8/01/30 | | | | | | | 85 | | | | 102,540 | |
State of Wisconsin GO, 5.00%, 5/01/24-11/01/27 | | | | | | | 90 | | | | 110,795 | |
State of Wisconsin RB, 3.15%, 5/01/27 | | | | | | | 70 | | | | 70,316 | |
Texas A&M University RB: | | | | | | | | | | | | |
2.76%, 5/15/26 | | | | | | | 75 | | | | 74,566 | |
2.84%, 5/15/27 | | | | | | | 30 | | | | 29,887 | |
Texas Private Activity Bond Surface Transportation Corp. RB, 5.00%, 12/31/55 | | | | | | | 25 | | | | 27,177 | |
Texas Water Development Board RB, 5.00%, 10/15/40-10/15/45 | | | | | | | 40 | | | | 46,246 | |
Tobacco Settlement Financing Corp. RB, 5.00%, 6/01/41 (g) | | | | | | | 30 | | | | 29,400 | |
University of California RB: | | | | | | | | | | | | |
3.06%, 7/01/25 | | | | | | | 25 | | | | 25,179 | |
4.86%, 5/15/12 | | | | | | | 50 | | | | 51,637 | |
University of Houston RB, 5.00%, 2/15/33- 2/15/36 | | | | | | | 130 | | | | 151,453 | |
University of Massachusetts Building Authority RB, 5.00%, 11/01/31 | | | | | | | 20 | | | | 23,658 | |
University of New Mexico RB, 5.00%, 6/01/47 | | | | | | | 30 | | | | 34,724 | |
University of Virginia RB, 5.00%, 4/01/44-4/01/46 | | | | | | | 70 | | | | 83,135 | |
See Notes to Financial Statements.
| | | | | | |
| 42 | | BLACKROCK SERIES FUND, INC. | | JUNE 30, 2017 | | |
| | | | |
| Schedule of Investments (continued) | | | BlackRock Balanced Capital Portfolio | |
| | | | |
| | | | | | | | | | | | |
| Taxable Municipal Bonds | | | | | Par
(000) | | | Value | |
Weld County School District No. RE-4 GO, 5.25%, 12/01/41 | | | USD | | | | 20 | | | $ | 23,813 | |
West Virginia Hospital Finance Authority RB, 5.00%, 6/01/19-6/01/24 | | | | | | | 120 | | | | 135,649 | |
Wisconsin Health & Educational Facilities Authority RB, 5.00%, 12/15/44 | | | | | | | 10 | | | | 10,970 | |
Total Taxable Municipal Bonds — 1.7% | | | | | | | | | | | 8,660,542 | |
| | | | | | | | | | | | |
| U.S. Government Sponsored Agency Securities | | | | |
Collateralized Mortgage Obligations — 0.3% | | | | | | | | | |
Fannie Mae: | | | | | | | | | | | | |
Series 2013-C01, Class M2, 6.27%, 10/25/23 (a) | | | | | | | 590 | | | | 693,348 | |
Series 2017-C01, Class 1B1, 6.77%, 7/25/29 (a) | | | | | | | 30 | | | | 34,115 | |
Series 2017-C01, Class 1M2, 4.57%, 7/25/29 (a) | | | | | | | 70 | | | | 73,923 | |
Series 2017-C02, Class 2M2, 4.67%, 9/25/29 (a) | | | | | | | 62 | | | | 65,785 | |
Freddie Mac: | | | | | | | | | | | | |
Series 2017-DNA1, Class M2, 4.27%, 7/25/29 (a) | | | | | | | 250 | | | | 260,789 | |
Series 2017-DNA2, Class M2, 4.47%, 10/25/29 (a) | | | | | | | 250 | | | | 264,025 | |
Series 2017-HQA1, Class M2, 4.77%, 8/25/29 (a) | | | | | | | 260 | | | | 274,843 | |
| | | | | | | | | | | | |
| | | | | | | | | | | | 1,666,828 | |
Commercial Mortgage-Backed Securities — 0.1% | | | | | | | | | |
Fannie Mae, Series 2017-M7, Class A2, 2.96%, 2/25/27 (a)(d) | | | | | | | 56 | | | | 56,674 | |
Freddie Mac: | | | | | | | | | | | | |
Series K034, Class A2, 3.53%, 7/25/23 (a) | | | | | | | 20 | | | | 21,208 | |
Series K059, Class A2, 3.12%, 9/25/26 (a) | | | | | | | 80 | | | | 81,781 | |
Series K060, Class A2, 3.30%, 10/25/26 | | | | | | | 110 | | | | 113,935 | |
Series K061, Class A2, 3.35%, 11/25/26 | | | | | | | 50 | | | | 51,979 | |
Series K063, Class A2, 3.43%, 1/25/27 (a) | | | | | | | 30 | | | | 31,492 | |
| | | | | | | | | | | | |
| | | | | | | | | | | | 357,069 | |
Interest Only Commercial Mortgage-Backed Securities — 0.1% | | | | | |
Fannie Mae, Series 2014-M13, Class X2, 1.29%, 8/25/24 (a) | | | | | | | 4,871 | | | | 43,504 | |
Freddie Mac: | | | | | | | | | | | | |
Series K056, Class X1, 1.40%, 5/25/26 (a) | | | | | | | 189 | | | | 16,985 | |
Series K718, Class X1, 0.77%, 1/25/22 (a) | | | | | | | 192 | | | | 4,836 | |
Ginnie Mae: | | | | | | | | | | | | |
Series 2012-120, Class IO, 0.79%, 2/16/53 (a) | | | | | | | 947 | | | | 45,857 | |
Series 2014-172, Class IO, 0.84%, 1/16/49 (a) | | | | | | | 379 | | | | 18,693 | |
Series 2014-40, Class AI, 1.00%, 2/16/39 | | | | | | | 312 | | | | 7,402 | |
Series 2014-52, Class AI, 0.83%, 8/16/41 | | | | | | | 222 | | | | 5,431 | |
Series 2016-110, Class IO, 1.05%, 5/16/58 (a) | | | | | | | 119 | | | | 9,218 | |
Series 2016-113, Class IO, 1.19%, 2/16/58 (a) | | | | | | | 139 | | | | 12,266 | |
Series 2016-87, Class IO, 1.01%, 8/16/58 (a) | | | | | | | 187 | | | | 14,237 | |
| | | | | | | | | | | | |
| | | | | | | | | | | | 178,429 | |
| | | | | | | | | | | | |
| U.S. Government Sponsored Agency Securities | | | Par
(000) | | | Value | |
Mortgage-Backed Securities — 14.5% | | | | | | | | | | | | |
Fannie Mae Mortgage-Backed Securities: | | | | | | | | | | | | |
2.50%, 5/01/26-7/01/32 (m) | | | USD | | | | 2,051 | | | $ | 2,063,676 | |
3.00%, 4/01/29-7/01/47 (m) | | | | | | | 16,786 | | | | 16,872,996 | |
3.50%, 7/01/26-7/01/47 (m) | | | | | | | 8,703 | | | | 8,996,494 | |
4.00%, 2/01/25-7/01/47 (m) | | | | | | | 4,191 | | | | 4,439,705 | |
4.50%, 2/01/25-7/01/47 (m) | | | | | | | 1,485 | | | | 1,596,302 | |
5.00%, 9/01/35-7/01/47 (m) | | | | | | | 652 | | | | 714,200 | |
5.50%, 2/01/35-4/01/41 | | | | | | | 885 | | | | 989,007 | |
6.00%, 12/01/27-7/01/47 (m) | | | | | | | 819 | | | | 928,338 | |
6.50%, 5/01/40 | | | | | | | 160 | | | | 178,661 | |
Freddie Mac Mortgage-Backed Securities: | | | | | | | | | | | | |
2.50%, 3/01/30-7/01/32 (m) | | | | | | | 962 | | | | 968,540 | |
3.00%, 1/01/30-7/01/47 (m) | | | | | | | 11,035 | | | | 11,048,229 | |
3.50%, 7/01/32-7/01/47 (m) | | | | | | | 4,492 | | | | 4,624,871 | |
4.00%, 8/01/40-7/01/47 (m) | | | | | | | 3,115 | | | | 3,278,116 | |
4.50%, 2/01/39-7/01/47 (m) | | | | | | | 978 | | | | 1,049,870 | |
5.00%, 10/01/41-11/01/41 | | | | | | | 370 | | | | 404,479 | |
5.50%, 6/01/41 | | | | | | | 152 | | | | 168,982 | |
6.00%, 1/01/34 | | | | | | | 104 | | | | 117,335 | |
Ginnie Mae Mortgage-Backed Securities: | | | | | | | | | | | | |
3.00%, 7/15/47 (m) | | | | | | | 3,771 | | | | 3,809,106 | |
3.50%, 12/20/41-7/15/47 (m) | | | | | | | 4,891 | | | | 5,074,218 | |
4.00%, 7/20/39-7/15/47 (m) | | | | | | | 2,920 | | | | 3,079,292 | |
4.50%, 12/20/39-11/20/44 | | | | | | | 1,569 | | | | 1,692,015 | |
5.00%, 12/15/38-7/20/42 | | | | | | | 248 | | | | 272,495 | |
5.50%, 7/15/46 (m) | | | | | | | 295 | | | | 327,634 | |
7.50%, 3/15/32 | | | | | | | 4 | | | | 4,488 | |
| | | | | | | | | | | | |
| | | | | | | | | | | | 72,699,049 | |
Total U.S. Government Sponsored Agency Securities — 15.0% | | | | 74,901,375 | |
| | | | | | | | | | | | |
| U.S. Treasury Obligations | | | | | | | | | |
U.S. Treasury Bonds: | | | | | | | | | | | | |
2.13%, 3/31/24 | | | | | | | 440 | | | | 440,326 | |
2.88%, 11/15/46 | | | | | | | 1,129 | | | | 1,135,219 | |
3.00%, 2/15/47 (n)(o) | | | | | | | 1,072 | | | | 1,105,834 | |
3.00%, 5/15/47 (n) | | | | | | | 2,732 | | | | 2,819,509 | |
U.S. Treasury Notes: | | | | | | | | | | | | |
1.25%, 3/31/19-5/31/19 (n) | | | | | | | 4,977 | | | | 4,965,119 | |
1.63%, 3/15/20 | | | | | | | 4,114 | | | | 4,127,017 | |
1.50%, 4/15/20-5/15/20 (o) | | | | | | | 6,691 | | | | 6,685,197 | |
1.88%, 3/31/22-4/30/22 | | | | | | | 538 | | | | 538,106 | |
1.75%, 5/31/22 (n) | | | | | | | 12 | | | | 11,930 | |
2.00%, 4/30/24-11/15/26 (n) | | | | | | | 1,988 | | | | 1,948,385 | |
2.25%, 2/15/27 | | | | | | | 1,378 | | | | 1,371,595 | |
2.38%, 5/15/27 | | | | | | | 3 | | | | 3,019 | |
Total U.S. Treasury Obligations — 5.0% | | | | | | | | | | | 25,151,256 | |
Total Long-Term Investments (Cost — $493,058,297) — 102.6% | | | | | | | | | | | 513,198,358 | |
| | | | | | | | | | | | |
| | | | | | | | | | |
See Notes to Financial Statements.
| | | | | | |
| | | BLACKROCK SERIES FUND, INC. | | JUNE 30, 2017 | | 43 |
| | | | |
| Schedule of Investments (continued) | | | BlackRock Balanced Capital Portfolio | |
| | | | |
| | | | | | | | | | | | |
| Short-Term Securities | | | | | Par (000) | | | Value | |
Borrowed Bond Agreements — 0.2% (p) | | | | | | | | | |
Barclays Bank PLC, 0.14%, Open (q) (Purchased on 6/09/17 to be repurchased at GBP 310,932, collateralized by United Kingdom Gilt Inflation Linked Bonds, 0.13%due at 3/22/26, par and fair value of GBP 247,000 and $396,949, respectively) | | | USD | | | | 311 | | | $ | 404,942 | |
Barclays Capital, Inc., 1.13%, 7/03/17 (Purchased on 6/30/17 to be repurchased at $703,066, collateralized by U.S. Treasury Notes, 1.50% due at 6/15/20, par and fair value of USD 703,000 and $702,012,respectively) | | | | | | | 703 | | | | 703,000 | |
| | | | | | | | | | | | |
| | | | | | | | | | | | 1,107,942 | |
| | | | | | | | | | | | |
| Money Market Funds | | | | | Shares | | | | |
BlackRock Liquidity Funds, T-Fund, Institutional Class, 0.84% (i)(r) | | | | | | | 27,038,565 | | | | 27,038,565 | |
SL Liquidity Series, LLC, Money Market Series, 1.27% (i)(r)(s) | | | | | | | 10,284,911 | | | | 10,285,939 | |
Total Money Market Funds — 7.5% | | | | | | | | | | | 37,324,504 | |
Total Short-Term Securities (Cost — $38,424,486) — 7.7% | | | | 38,432,446 | |
| | | | | | | | | | | | |
| Options Purchased | | | | | | | | | |
(Cost — $65,318) — 0.0% | | | | | | | | | | | 30,135 | |
Total Investments Before Borrowed Bonds, Options Written and TBA Sale Commitments (Cost — $531,548,101) — 110.3% | | | | 551,660,939 | |
| | | | | | | | | | | | |
| Borrowed Bonds | | | | | Par (000) | | | | |
Foreign Government Obligations — (0.1)% | | | | | | | | | |
United Kingdom Gilt Inflation Linked Bonds, 0.13%, 3/22/26 | | | GBP | | | | 247 | | | | (396,949 | ) |
| | | | | | | | | | | | |
| Borrowed Bonds | | | | | Par
(000) | | | Value | |
U.S. Treasury Obligations — (0.1)% | | | | | | | | | | | | |
U.S. Treasury Notes, 1.50%, 6/15/20 | | | USD | | | | 703 | | | $ | (702,012 | ) |
(Proceeds — $1,084,779) — (0.2)% | | | | | | | | | | | (1,098,961 | ) |
| | | | | | | | | | | | |
| Options Written | | | | | | | | | |
(Premiums Received — $ 27,297) — (0.0)% | | | | (9,025 | ) |
| | | | | | | | | | | | |
| TBA Sale Commitments (m) | | | | | | | | | |
Mortgage-Backed Securities — (6.1)% | | | | | | | | | | | | |
Fannie Mae Mortgage-Backed Securities: | | | | | | | | | | | | |
2.50%, 7/01/31-7/01/32 | | | | | | | 1,020 | | | | (1,024,853 | ) |
3.00%, 7/01/32-7/01/47 | | | | | | | 11,624 | | | | (11,632,125 | ) |
3.50%, 7/01/32-7/01/47 | | | | | | | 3,369 | | | | (3,477,246 | ) |
4.00%, 7/01/32-7/01/47 | | | | | | | 732 | | | | (763,599 | ) |
4.50%, 7/01/47 | | | | | | | 160 | | | | (171,631 | ) |
5.50%, 7/01/47 | | | | | | | 615 | | | | (681,305 | ) |
6.00%, 7/01/47 | | | | | | | 560 | | | | (630,091 | ) |
Freddie Mac Mortgage-Backed Securities: | | | | | | | | | | | | |
3.00%, 7/01/47 | | | | | | | 7,392 | | | | (7,372,072 | ) |
3.50%, 7/01/47 | | | | | | | 1,110 | | | | (1,140,322 | ) |
4.00%, 7/01/47 | | | | | | | 1,287 | | | | (1,353,527 | ) |
4.50%, 7/01/47 | | | | | | | 302 | | | | (323,521 | ) |
Ginnie Mae Mortgage-Backed Securities: | | | | | | | | | | | | |
3.50%, 7/15/47 | | | | | | | 254 | | | | (262,682 | ) |
4.00%, 7/15/47 | | | | | | | 836 | | | | (879,106 | ) |
4.50%, 7/15/47 | | | | | | | 734 | | | | (784,421 | ) |
Total TBA Sale Commitments (Proceeds — $30,623,466) — (6.1)% | | | | | | | | | | | (30,496,501 | ) |
Total Investments Net of Borrowed Bonds, Options Written and TBA Sale Commitments — 104.0% | | | | 520,056,452 | |
Liabilities in Excess of Other Assets — (4.0)% | | | | (19,879,798 | ) |
| | | | | | | | | | | | |
Net Assets — 100.0% | | | | | | | | | | $ | 500,176,654 | |
| | | | | | | | | | | | |
See Notes to Financial Statements.
| | | | | | |
| 44 | | BLACKROCK SERIES FUND, INC. | | JUNE 30, 2017 | | |
| | | | |
| Schedule of Investments (continued) | | | BlackRock Balanced Capital Portfolio | |
|
| Notes to Schedule of Investments |
| (a) | Variable rate security. Rate as of period end. |
| (b) | Step-up bond that pays an initial coupon rate for the first period and then a higher coupon rate for the following periods. Rate as of period end. |
| (c) | Security exempt from registration pursuant to Rule 144A under the Securities Act of 1933, as amended. These securities may be resold in transactions exempt from registration to qualified institutional investors. |
| (d) | Security is valued using significant unobservable inputs and is classified as Level 3 in the fair value hierarchy. |
| (e) | Non-income producing security. |
| (f) | Security, or a portion of the security, is on loan. |
| (g) | Issuer filed for bankruptcy and/or is in default. |
| (h) | Issuer is a U.S. branch of a foreign domiciled bank. |
| (i) | During the six months ended June 30, 2017, investments in issuers considered to be an affiliate of the Fund for purposes of Section 2(a)(3) of the Investment Company Act of 1940, as amended, were as follows: |
| | | | | | | | | | | | | | | | | | | | | | | | | | | | | | | | |
| Affiliate | | Shares Held at
December 31,
2016 | | | Shares
Purchased | | | Shares
Sold | | | Shares Held at
June 30,
2017 | | | Value at
June 30,
2017 | | | Income | | | Net
Realized
Gain
(Loss) | | | Change in
Unrealized
Appreciation
(Depreciation) | |
BlackRock Liquidity Funds, T-Fund, Institutional Class | | | 16,049,913 | | | | 10,988,652 | 1 | | | — | | | | 27,038,565 | | | $ | 27,038,565 | | | $ | 64,331 | | | | — | | | | — | |
iShares Core U.S. Aggregate Bond ETF | | | 209,199 | | | | — | | | | (46,774 | ) | | | 162,425 | | | | 17,787,162 | | | | 204,044 | | | $ | (250,701 | ) | | $ | 454,522 | |
iShares iBoxx $ High Yield Corporate Bond ETF | | | — | | | | 69,830 | | | | (51,800 | ) | | | 18,030 | | | | 1,593,672 | | | | 33,240 | | | | 67,847 | | | | 13,936 | |
SL Liquidity Series, LLC, Money Market Series | | | 9,007,190 | | | | 1,277,721 | 1 | | | — | | | | 10,284,911 | | | | 10,285,939 | | | | 16,300 | 2 | | | (518 | ) | | | 55 | |
Total | | | | | | | | | | | | | | | | | | $ | 56,705,338 | | | $ | 317,915 | | | $ | (183,372 | ) | | $ | 468,513 | |
| | | | | | | | | | | | | | | | | | | | |
| | 1 | | Represents net shares purchased. |
| | 2 | | Represents securities lending income earned from the reinvestment of cash collateral from loaned securities, net of fees and collateral investment expenses, and other payments to and from borrowers of securities. |
| (j) | Other interests represent beneficial interests in liquidation trusts and other reorganization or private entities. |
| (k) | Perpetual security with no stated maturity date. |
| (m) | Represents or includes a TBA transaction. As of period end, unsettled TBA transactions were as follows: |
| | | | | | | | |
| Counterparty | | Value | | | Unrealized
Appreciation
(Depreciation) | |
Barclays Capital, Inc. | | $ | (1,906,570 | ) | | $ | 6,912 | |
Citigroup Global Markets, Inc. | | $ | (1,685,981 | ) | | $ | 8,838 | |
Credit Suisse Securities (USA) LLC | | $ | (666,615 | ) | | $ | 12,363 | |
Daiwa Capital Markets America, Inc. | | $ | 404,031 | | | $ | (2,719 | ) |
Deutsche Bank Securities, Inc. | | $ | (507,327 | ) | | $ | 2,164 | |
Goldman Sachs & Co. | | $ | 1,268,531 | | | $ | (9,514 | ) |
J.P. Morgan Securities LLC | | $ | (413,413 | ) | | $ | 3,815 | |
Merrill Lynch, Pierce, Fenner & Smith, Inc. | | $ | (770,967 | ) | | $ | 6,266 | |
Mizuho Securities USA LLC | | $ | (376,845 | ) | | $ | 1,733 | |
Morgan Stanley & Co. LLC | | $ | (1,522,959 | ) | | $ | 4,736 | |
Nomura Securities International, Inc. | | $ | (69,796 | ) | | $ | 195 | |
RBC Capital Markets, LLC | | $ | 1,269,161 | | | $ | (8,424 | ) |
Wells Fargo Securities, LLC | | $ | (991,292 | ) | | $ | 6,004 | |
| (n) | All or a portion of the security has been pledged as collateral in connection with outstanding reverse repurchase agreements. |
| (o) | All or a portion of the security has been pledged in connection with outstanding futures contracts. |
| (p) | Certain agreements have no stated maturity and can be terminated by either party at any time. |
| (q) | The amount to be repurchased assumes the maturity will be the day after the period end. |
| (r) | Current yield as of period end. |
| (s) | Security was purchased with the cash collateral from loaned securities. |
| (t) | Rates are discount rates or a range of discount rates at the time of purchase. |
| ● | For Fund compliance purposes, the Fund’s industry classifications refer to one or more of the industry sub-classifications used by one or more widely recognized market indexes or rating group indexes, and/or as defined by the investment adviser. These definitions may not apply for purposes of this report, which may combine such industry sub-classifications for reporting ease. |
See Notes to Financial Statements.
| | | | | | |
| | | BLACKROCK SERIES FUND, INC. | | JUNE 30, 2017 | | 45 |
| | | | |
| Schedule of Investments (continued) | | | BlackRock Balanced Capital Portfolio | |
|
| Derivative Financial Instruments Outstanding as of Period End |
Reverse repurchase agreements
| | | | | | | | | | | | | | | | | | | | |
| Counterparty | | Interest
Rate | | Trade
Date | | Maturity
Date | | Face Value | | | Face Value
Including
Accrued
Interest | | | Type of Non-Cash
Underlying Collateral | | Remaining
Contractual
Maturity of the
Agreements | |
Credit Suisse Securities (USA) LLC | | 1.48% | | 6/30/17 | | 7/03/17 | | $ | 2,559,195 | | | $ | 2,559,300 | | | U.S. Treasury Obligations | | | Overnight | |
Deutsche Bank Securities, Inc. | | 1.45% | | 6/30/17 | | 7/03/17 | | | 2,841,280 | | | | 2,841,394 | | | U.S. Treasury Obligations | | | Overnight | |
J.P. Morgan Securities LLC | | 0.50% | | 6/30/17 | | 7/03/17 | | | 3,492,629 | | | | 3,492,678 | | | U.S. Treasury Obligations | | | Overnight | |
Merrill Lynch, Pierce, Fenner & Smith, Inc. | | 1.18% | | 6/30/17 | | 7/03/17 | | | 11,970 | | | | 11,970 | | | U.S. Treasury Obligations | | | Overnight | |
Merrill Lynch, Pierce, Fenner & Smith, Inc. | | 1.30% | | 6/30/17 | | 7/03/17 | | | 984,650 | | | | 984,686 | | | U.S. Treasury Obligations | | | Overnight | |
Merrill Lynch, Pierce, Fenner & Smith, Inc. | | 1.35% | | 6/30/17 | | 7/03/17 | | | 127,520 | | | | 127,525 | | | U.S. Treasury Obligations | | | Overnight | |
Total | | | | | | | | $ | 10,017,244 | | | $ | 10,017,553 | | | | | | | |
| | | | | | | | | | | | | | | | |
Futures Contracts
| | | | | | | | | | | | | | | | | | |
Contracts
Long (Short) | | Issue | | Expiration | | | Notional
Value | | | Unrealized
Appreciation
(Depreciation) | |
| 48 | | CAC 40 10 Euro Index | | | July 2017 | | | | USD | | | | 2,805,035 | | | | $ (82,189) | |
| 8 | | DAX Index | | | September 2017 | | | | USD | | | | 2,814,263 | | | | (95,101) | |
| (22) | | Euro-Bobl | | | September 2017 | | | | USD | | | | 3,309,272 | | | | 9,667 | |
| (9) | | Euro-Bund | | | September 2017 | | | | USD | | | | 1,663,922 | | | | 9,528 | |
| 3 | | Long Gilt British | | | September 2017 | | | | USD | | | | 490,648 | | | | (8,404 | ) |
| 58 | | Nikkei 225 Index | | | September 2017 | | | | USD | | | | 10,323,716 | | | | 10,233 | |
| (138) | | S&P 500 E-Mini Index | | | September 2017 | | | | USD | | | | 23,482,730 | | | | 34,609 | |
| 19 | | U.S. Treasury Bonds (30 Year) | | | September 2017 | | | | USD | | | | 2,920,063 | | | | 16,610 | |
| 33 | | U.S. Treasury Notes (2 Year) | | | September 2017 | | | | USD | | | | 7,131,609 | | | | (6,952 | ) |
| 110 | | U.S. Treasury Notes (5 Year) | | | September 2017 | | | | USD | | | | 12,961,953 | | | | (33,483 | ) |
| (12) | | U.S. Treasury Notes (10 Year) | | | September 2017 | | | | USD | | | | 19,331,813 | | | | 20,406 | |
| 7 | | U.S. Ultra Treasury Bonds | | | September 2017 | | | | USD | | | | 1,161,125 | | | | 8,473 | |
| (13) | | Euro Dollar | | | March 2019 | | | | USD | | | | 3,189,713 | | | | (11,093 | ) |
| Total | | | | | | | | | | | | | | | | | $(127,696) | |
| | | | | | | | | | | | | | | | | | |
Forward Foreign Currency Exchange Contracts
| | | | | | | | | | | | | | | | | | | | |
Currency
Purchased | | | | | Currency
Sold | | | Counterparty | | Settlement
Date | | | Unrealized
Appreciation
(Depreciation) | |
| BRL | | | 155,376 | | | USD | | | 46,800 | | | BNP Paribas S.A. | | | 7/03/17 | | | $ | 68 | |
| USD | | | 39,000 | | | BRL | | | 128,622 | | | Barclays Bank PLC | | | 7/03/17 | | | | 202 | |
| USD | | | 47,152 | | | BRL | | | 155,376 | | | BNP Paribas S.A. | | | 7/03/17 | | | | 284 | |
| USD | | | 39,000 | | | BRL | | | 128,856 | | | Citibank N.A. | | | 7/03/17 | | | | 132 | |
| USD | | | 31,047 | | | BRL | | | 102,305 | | | Deutsche Bank AG | | | 7/03/17 | | | | 187 | |
| USD | | | 39,000 | | | RUB | | | 2,279,160 | | | BNP Paribas S.A. | | | 7/03/17 | | | | 379 | |
| CNH | | | 5,087,508 | | | USD | | | 749,000 | | | HSBC Bank PLC | | | 7/05/17 | | | | 1,167 | |
| EUR | | | 271,894 | | | USD | | | 310,000 | | | Morgan Stanley & Co. International PLC | | | 7/05/17 | | | | 631 | |
| GBP | | | 238,976 | | | USD | | | 310,000 | | | Morgan Stanley & Co. International PLC | | | 7/05/17 | | | | 1,309 | |
| HUF | | | 18,489,354 | | | USD | | | 68,132 | | | Deutsche Bank AG | | | 7/05/17 | | | | 258 | |
| HUF | | | 505,485 | | | USD | | | 1,863 | | | JPMorgan Chase Bank N.A. | | | 7/05/17 | | | | 6 | |
| HUF | | | 1,850,276 | | | USD | | | 6,813 | | | Morgan Stanley & Co. International PLC | | | 7/05/17 | | | | 31 | |
| HUF | | | 63,330,195 | | | USD | | | 233,192 | | | Morgan Stanley & Co. International PLC | | | 7/05/17 | | | | 1,060 | |
| JPY | | | 34,990,749 | | | USD | | | 310,000 | | | BNP Paribas S.A. | | | 7/05/17 | | | | 1,169 | |
| SEK | | | 2,637,832 | | | USD | | | 310,000 | | | Deutsche Bank AG | | | 7/05/17 | | | | 3,202 | |
| TRY | | | 1,107,072 | | | USD | | | 310,000 | | | BNP Paribas S.A. | | | 7/05/17 | | | | 4,189 | |
| TRY | | | 211,911 | | | USD | | | 60,000 | | | HSBC Bank PLC | | | 7/05/17 | | | | 141 | |
See Notes to Financial Statements.
| | | | | | |
| 46 | | BLACKROCK SERIES FUND, INC. | | JUNE 30, 2017 | | |
| | | | |
| Schedule of Investments (continued) | | | BlackRock Balanced Capital Portfolio | |
| | | | | | | | | | | | | | | | | | | | |
Currency
Purchased | | | | | Currency
Sold | | | Counterparty | | Settlement
Date | | | Unrealized
Appreciation
(Depreciation) | |
| USD | | | 59,851 | | | BRL | | | 198,000 | | | Morgan Stanley & Co. International PLC | | | 7/05/17 | | | | $ 154 | |
| USD | | | 310,000 | | | JPY | | | 34,230,820 | | | Royal Bank of Scotland PLC | | | 7/05/17 | | | | 5,589 | |
| USD | | | 9,200 | | | TRY | | | 32,369 | | | Barclays Bank PLC | | | 7/05/17 | | | | 14 | |
| USD | | | 46,000 | | | TRY | | | 161,803 | | | Citibank N.A. | | | 7/05/17 | | | | 80 | |
| USD | | | 310,000 | | | ZAR | | | 4,035,723 | | | BNP Paribas S.A. | | | 7/05/17 | | | | 1,807 | |
| ZAR | | | 4,111,980 | | | USD | | | 310,000 | | | BNP Paribas S.A. | | | 7/05/17 | | | | 4,017 | |
| CLP | | | 38,254,125 | | | USD | | | 57,000 | | | Credit Suisse International | | | 7/06/17 | | | | 617 | |
| COP | | | 165,798,750 | | | USD | | | 54,353 | | | Credit Suisse International | | | 7/06/17 | | | | 1 | |
| RUB | | | 3,724,656 | | | USD | | | 62,400 | | | JPMorgan Chase Bank N.A. | | | 7/06/17 | | | | 674 | |
| USD | | | 310,000 | | | BRL | | | 1,021,295 | | | BNP Paribas S.A. | | | 7/06/17 | | | | 2,148 | |
| USD | | | 57,000 | | | COP | | | 165,798,750 | | | Credit Suisse International | | | 7/06/17 | | | | 2,647 | |
| USD | | | 105,000 | | | COP | | | 319,200,000 | | | Barclays Bank PLC | | | 7/07/17 | | | | 374 | |
| USD | | | 205,000 | | | COP | | | 620,979,235 | | | BNP Paribas S.A. | | | 7/07/17 | | | | 1,458 | |
| CLP | | | 43,184,400 | | | USD | | | 63,600 | | | BNP Paribas S.A. | | | 7/10/17 | | | | 1,435 | |
| EUR | | | 60,000 | | | USD | | | 68,292 | | | Deutsche Bank AG | | | 7/10/17 | | | | 276 | |
| EUR | | | 60,000 | | | USD | | | 67,727 | | | Goldman Sachs International | | | 7/10/17 | | | | 840 | |
| RUB | | | 2,068,766 | | | USD | | | 35,000 | | | JPMorgan Chase Bank N.A. | | | 7/10/17 | | | | 2 | |
| RUB | | | 2,098,760 | | | USD | | | 35,500 | | | JPMorgan Chase Bank N.A. | | | 7/10/17 | | | | 10 | |
| TRY | | | 117,428 | | | USD | | | 33,123 | | | Deutsche Bank AG | | | 7/10/17 | | | | 154 | |
| TRY | | | 117,991 | | | USD | | | 33,277 | | | Goldman Sachs International | | | 7/10/17 | | | | 161 | |
| USD | | | 70,838 | | | RUB | | | 4,157,476 | | | Credit Suisse International | | | 7/10/17 | | | | 496 | |
| USD | | | 70,162 | | | RUB | | | 4,116,516 | | | Deutsche Bank AG | | | 7/10/17 | | | | 514 | |
| JPY | | | 7,204,768 | | | USD | | | 64,000 | | | Goldman Sachs International | | | 7/11/17 | | | | 89 | |
| TRY | | | 311,195 | | | USD | | | 88,009 | | | Goldman Sachs International | | | 7/14/17 | | | | 77 | |
| MYR | | | 137,760 | | | USD | | | 32,000 | | | BNP Paribas S.A. | | | 7/17/17 | | | | 68 | |
| MYR | | | 65,160 | | | USD | | | 15,000 | | | JPMorgan Chase Bank N.A. | | | 7/17/17 | | | | 168 | |
| MYR | | | 154,280 | | | USD | | | 35,000 | | | JPMorgan Chase Bank N.A. | | | 7/17/17 | | | | 913 | |
| TRY | | | 404,187 | | | USD | | | 114,000 | | | BNP Paribas S.A. | | | 7/21/17 | | | | 176 | |
| TRY | | | 177,945 | | | USD | | | 50,000 | | | Citibank N.A. | | | 7/21/17 | | | | 266 | |
| USD | | | 14,230 | | | MXN | | | 257,278 | | | BNP Paribas S.A. | | | 7/21/17 | | | | 105 | |
| USD | | | 35,771 | | | MXN | | | 646,699 | | | JPMorgan Chase Bank N.A. | | | 7/21/17 | | | | 268 | |
| USD | | | 2,000 | | | ZAR | | | 26,021 | | | Citibank N.A. | | | 7/21/17 | | | | 19 | |
| USD | | | 50,000 | | | ZAR | | | 643,638 | | | Citibank N.A. | | | 7/21/17 | | | | 995 | |
| RUB | | | 3,748,368 | | | USD | | | 62,400 | | | BNP Paribas S.A. | | | 7/24/17 | | | | 826 | |
| RUB | | | 3,722,784 | | | USD | | | 62,400 | | | Deutsche Bank AG | | | 7/24/17 | | | | 395 | |
| TRY | | | 118,184 | | | USD | | | 33,200 | | | Deutsche Bank AG | | | 8/04/17 | | | | 46 | |
| USD | | | 50,000 | | | COP | | | 146,700,000 | | | BNP Paribas S.A. | | | 8/09/17 | | | | 2,146 | |
| IDR | | | 403,950,000 | | | USD | | | 30,000 | | | Bank of America N.A. | | | 8/15/17 | | | | 144 | |
| IDR | | | 386,357,135 | | | USD | | | 28,698 | | | Citibank N.A. | | | 8/15/17 | | | | 134 | |
| IDR | | | 552,034,031 | | | USD | | | 40,998 | | | Citibank N.A. | | | 8/15/17 | | | | 197 | |
| IDR | | | 287,029,116 | | | USD | | | 21,325 | | | JPMorgan Chase Bank N.A. | | | 8/15/17 | | | | 95 | |
| IDR | | | 430,706,640 | | | USD | | | 31,980 | | | JPMorgan Chase Bank N.A. | | | 8/15/17 | | | | 161 | |
| MYR | | | 354,609 | | | USD | | | 82,000 | | | Morgan Stanley & Co. International PLC | | | 8/17/17 | | | | 437 | |
| USD | | | 50,000 | | | COP | | | 149,400,000 | | | Barclays Bank PLC | | | 8/22/17 | | | | 1,339 | |
| USD | | | 50,000 | | | COP | | | 151,775,000 | | | Credit Suisse International | | | 8/22/17 | | | | 566 | |
| EUR | | | 25,000 | | | USD | | | 28,268 | | | JPMorgan Chase Bank N.A. | | | 9/07/17 | | | | 392 | |
| USD | | | 161,026 | | | RUB | | | 9,344,741 | | | BNP Paribas S.A. | | | 9/15/17 | | | | 5,155 | |
| USD | | | 161,021 | | | RUB | | | 9,329,978 | | | BNP Paribas S.A. | | | 9/15/17 | | | | 5,396 | |
| USD | | | 401,084 | | | RUB | | | 23,338,448 | | | Deutsche Bank AG | | | 9/15/17 | | | | 11,796 | |
See Notes to Financial Statements.
| | | | | | |
| | | BLACKROCK SERIES FUND, INC. | | JUNE 30, 2017 | | 47 |
| | | | |
Schedule of Investments (continued) | | | BlackRock Balanced Capital Portfolio | |
| | | | | | | | | | | | | | | | | | | | |
Currency Purchased | | | Currency Sold | | | Counterparty | | Settlement
Date | | | Unrealized
Appreciation
(Depreciation) | |
| USD | | | 405,274 | | | RUB | | | 23,497,176 | | | Deutsche Bank AG | | | 9/15/17 | | | | $ 13,338 | |
| USD | | | 59,784 | | | RUB | | | 3,549,256 | | | HSBC Bank PLC | | | 9/15/17 | | | | 582 | |
| USD | | | 363,870 | | | RUB | | | 21,101,530 | | | JPMorgan Chase Bank N.A. | | | 9/15/17 | | | | 11,894 | |
| AUD | | | 40,000 | | | NZD | | | 41,825 | | | Bank of America N.A. | | | 9/20/17 | | | | 110 | |
| AUD | | | 886,000 | | | USD | | | 669,832 | | | Citibank N.A. | | | 9/20/17 | | | | 10,432 | |
| AUD | | | 76,000 | | | USD | | | 57,478 | | | Credit Suisse International | | | 9/20/17 | | | | 874 | |
| AUD | | | 40,000 | | | USD | | | 30,166 | | | Deutsche Bank AG | | | 9/20/17 | | | | 546 | |
| CAD | | | 26,557 | | | USD | | | 20,000 | | | UBS AG | | | 9/20/17 | | | | 506 | |
| EUR | | | 40,000 | | | USD | | | 44,697 | | | BNP Paribas S.A. | | | 9/20/17 | | | | 1,190 | |
| EUR | | | 20,000 | | | USD | | | 22,441 | | | Deutsche Bank AG | | | 9/20/17 | | | | 503 | |
| EUR | | | 490,000 | | | USD | | | 558,990 | | | Goldman Sachs International | | | 9/20/17 | | | | 3,134 | |
| EUR | | | 490,000 | | | USD | | | 554,721 | | | Goldman Sachs International | | | 9/20/17 | | | | 7,403 | |
| EUR | | | 5,747,000 | | | USD | | | 6,440,525 | | | Goldman Sachs International | | | 9/20/17 | | | | 152,393 | |
| JPY | | | 1,681,942 | | | USD | | | 15,000 | | | BNP Paribas S.A. | | | 9/20/17 | | | | 9 | |
| JPY | | | 1,681,942 | | | USD | | | 15,000 | | | BNP Paribas S.A. | | | 9/20/17 | | | | 9 | |
| KRW | | | 34,314,000 | | | USD | | | 30,000 | | | JPMorgan Chase Bank N.A. | | | 9/20/17 | | | | 28 | |
| NOK | | | 176,638 | | | CHF | | | 20,000 | | | Morgan Stanley & Co. International PLC | | | 9/20/17 | | | | 223 | |
| NOK | | | 263,559 | | | CHF | | | 30,000 | | | UBS AG | | | 9/20/17 | | | | 166 | |
| NOK | | | 253,475 | | | USD | | | 30,000 | | | Morgan Stanley & Co. International PLC | | | 9/20/17 | | | | 410 | |
| NZD | | | 42,010 | | | AUD | | | 40,000 | | | Goldman Sachs International | | | 9/20/17 | | | | 27 | |
| NZD | | | 30,000 | | | USD | | | 21,833 | | | Deutsche Bank AG | | | 9/20/17 | | | | 118 | |
| SEK | | | 584,851 | | | EUR | | | 60,000 | | | HSBC Bank PLC | | | 9/20/17 | | | | 920 | |
| TRY | | | 30,000 | | | EUR | | | 34,279 | | | JPMorgan Chase Bank N.A. | | | 9/20/17 | | | | 211 | |
| TRY | | | 72,204 | | | USD | | | 20,000 | | | BNP Paribas S.A. | | | 9/20/17 | | | | 43 | |
| USD | | | 30,000 | | | JPY | | | 3,358,674 | | | BNP Paribas S.A. | | | 9/20/17 | | | | 29 | |
| USD | | | 30,000 | | | JPY | | | 3,323,367 | | | Goldman Sachs International | | | 9/20/17 | | | | 344 | |
| USD | | | 103,420 | | | MXN | | | 1,879,946 | | | Deutsche Bank AG | | | 9/20/17 | | | | 1,186 | |
| USD | | | 101,370 | | | MXN | | | 1,836,276 | | | Deutsche Bank AG | | | 9/20/17 | | | | 1,512 | |
| USD | | | 413,680 | | | MXN | | | 7,520,712 | | | Goldman Sachs International | | | 9/20/17 | | | | 4,696 | |
| USD | | | 101,370 | | | MXN | | | 1,837,849 | | | Royal Bank of Scotland PLC | | | 9/20/17 | | | | 1,426 | |
| USD | | | 135,160 | | | MXN | | | 2,453,540 | | | Royal Bank of Scotland PLC | | | 9/20/17 | | | | 1,734 | |
| USD | | | 128,186 | | | TRY | | | 461,323 | | | Citibank N.A. | | | 9/20/17 | | | | 131 | |
| USD | | | 88,045 | | | ZAR | | | 1,160,745 | | | Bank of America N.A. | | | 9/20/17 | | | | 555 | |
| USD | | | 20,000 | | | ZAR | | | 262,780 | | | Citibank N.A. | | | 9/20/17 | | | | 193 | |
| USD | | | 89,217 | | | ZAR | | | 1,173,597 | | | Citibank N.A. | | | 9/20/17 | | | | 758 | |
| USD | | | 89,319 | | | ZAR | | | 1,175,133 | | | JPMorgan Chase Bank N.A. | | | 9/20/17 | | | | 744 | |
| ZAR | | | 265,936 | | | USD | | | 20,000 | | | BNP Paribas S.A. | | | 9/20/17 | | | | 45 | |
| USD | | | 237,807 | | | TRY | | | 862,169 | | | BNP Paribas S.A. | | | 10/23/17 | | | | 609 | |
| TRY | | | 2,049,831 | | | USD | | | 529,570 | | | BNP Paribas S.A. | | | 6/25/18 | | | | 13 | |
| | | | | | | | | | | | | | | | | | | | |
| | | | | | | | | | | | | | | | | | | 289,296 | |
| | | | | | | | | | | | | | | | | | | | |
| BRL | | | 128,622 | | | USD | | | 39,033 | | | Barclays Bank PLC | | | 7/03/17 | | | | (235 | ) |
| BRL | | | 128,856 | | | USD | | | 39,104 | | | Citibank N.A. | | | 7/03/17 | | | | (236 | ) |
| BRL | | | 102,305 | | | USD | | | 31,200 | | | Deutsche Bank AG | | | 7/03/17 | | | | (341 | ) |
| MXN | | | 258,297 | | | USD | | | 14,286 | | | Barclays Bank PLC | | | 7/03/17 | | | | (61 | ) |
| MXN | | | 258,267 | | | USD | | | 14,286 | | | Deutsche Bank AG | | | 7/03/17 | | | | (63 | ) |
| MXN | | | 387,374 | | | USD | | | 21,429 | | | Morgan Stanley & Co. International PLC | | | 7/03/17 | | | | (95 | ) |
| RUB | | | 2,252,250 | | | USD | | | 39,000 | | | Deutsche Bank AG | | | 7/03/17 | | | | (835 | ) |
| BRL | | | 198,000 | | | USD | | | 59,851 | | | JPMorgan Chase Bank N.A. | | | 7/05/17 | | | | (154 | ) |
| RUB | | | 17,746,415 | | | USD | | | 310,000 | | | BNP Paribas S.A. | | | 7/05/17 | | | | (9,415 | ) |
See Notes to Financial Statements.
| | | | | | |
| 48 | | BLACKROCK SERIES FUND, INC. | | JUNE 30, 2017 | | |
| | | | |
| Schedule of Investments (continued) | | | BlackRock Balanced Capital Portfolio | |
| | | | | | | | | | | | | | | | | | | | |
Currency Purchased | | | Currency Sold | | | Counterparty | | Settlement
Date | | | Unrealized
Appreciation
(Depreciation) | |
| USD | | | 749,000 | | | CNH | | | 5,087,508 | | | Citibank N.A. | | | 7/05/17 | | | | $(1,044) | |
| USD | | | 310,000 | | | EUR | | | 275,189 | | | Deutsche Bank AG | | | 7/05/17 | | | | (4,395 | ) |
| USD | | | 310,000 | | | GBP | | | 239,881 | | | Deutsche Bank AG | | | 7/05/17 | | | | (2,488 | ) |
| USD | | | 310,000 | | | HUF | | | 84,888,850 | | | BNP Paribas S.A. | | | 7/05/17 | | | | (3,995 | ) |
| USD | | | 180,000 | | | RUB | | | 10,670,760 | | | Deutsche Bank AG | | | 7/05/17 | | | | (739 | ) |
| USD | | | 130,000 | | | RUB | | | 7,699,029 | | | JPMorgan Chase Bank N.A. | | | 7/05/17 | | | | (405 | ) |
| USD | | | 310,000 | | | SEK | | | 2,684,104 | | | Royal Bank of Scotland PLC | | | 7/05/17 | | | | (8,697 | ) |
| USD | | | 310,000 | | | TRY | | | 1,094,788 | | | BNP Paribas S.A. | | | 7/05/17 | | | | (702 | ) |
| BRL | | | 1,012,615 | | | USD | | | 310,000 | | | Goldman Sachs International | | | 7/06/17 | | | | (4,765 | ) |
| COP | | | 87,720,000 | | | USD | | | 30,000 | | | Royal Bank of Scotland PLC | | | 7/06/17 | | | | (1,243 | ) |
| COP | | | 78,921,000 | | | USD | | | 27,000 | | | UBS AG | | | 7/06/17 | | | | (1,128 | ) |
| USD | | | 57,000 | | | CLP | | | 37,882,770 | | | Royal Bank of Scotland PLC | | | 7/06/17 | | | | (57 | ) |
| USD | | | 62,400 | | | RUB | | | 3,747,744 | | | Goldman Sachs International | | | 7/06/17 | | | | (1,065 | ) |
| COP | | | 367,000,000 | | | USD | | | 125,000 | | | JPMorgan Chase Bank N.A. | | | 7/07/17 | | | | (4,706 | ) |
| COP | | | 543,160,000 | | | USD | | | 185,000 | | | UBS AG | | | 7/07/17 | | | | (6,965 | ) |
| RUB | | | 2,076,348 | | | USD | | | 35,250 | | | Barclays Bank PLC | | | 7/10/17 | | | | (120 | ) |
| RUB | | | 2,077,283 | | | USD | | | 35,250 | | | Barclays Bank PLC | | | 7/10/17 | | | | (104 | ) |
| USD | | | 63,600 | | | CLP | | | 42,456,180 | | | Deutsche Bank AG | | | 7/10/17 | | | | (338 | ) |
| USD | | | 67,339 | | | EUR | | | 60,000 | | | Citibank N.A. | | | 7/10/17 | | | | (1,229 | ) |
| USD | | | 33,200 | | | TRY | | | 118,738 | | | Citibank N.A. | | | 7/10/17 | | | | (449 | ) |
| USD | | | 33,200 | | | TRY | | | 117,362 | | | Deutsche Bank AG | | | 7/10/17 | | | | (59 | ) |
| USD | | | 86,882 | | | TRY | | | 311,195 | | | Bank of America N.A. | | | 7/14/17 | | | | (1,205 | ) |
| USD | | | 67,752 | | | EUR | | | 60,000 | | | Goldman Sachs International | | | 7/17/17 | | | | (843 | ) |
| USD | | | 56,923 | | | GBP | | | 44,500 | | | JPMorgan Chase Bank N.A. | | | 7/17/17 | | | | (1,070 | ) |
| USD | | | 82,000 | | | MYR | | | 353,830 | | | Morgan Stanley & Co. International PLC | | | 7/17/17 | | | | (364 | ) |
| MXN | | | 903,091 | | | USD | | | 50,000 | | | Barclays Bank PLC | | | 7/21/17 | | | | (422 | ) |
| ZAR | | | 465,376 | | | USD | | | 35,771 | | | Barclays Bank PLC | | | 7/21/17 | | | | (338 | ) |
| ZAR | | | 26,026 | | | USD | | | 2,000 | | | Barclays Bank PLC | | | 7/21/17 | | | | (18 | ) |
| ZAR | | | 185,212 | | | USD | | | 14,230 | | | BNP Paribas S.A. | | | 7/21/17 | | | | (128 | ) |
| IDR | | | 747,040,000 | | | USD | | | 56,000 | | | BNP Paribas S.A. | | | 7/24/17 | | | | (109 | ) |
| IDR | | | 1,800,900,000 | | | USD | | | 135,000 | | | JPMorgan Chase Bank N.A. | | | 7/24/17 | | | | (262 | ) |
| MXN | | | 922,937 | | | USD | | | 51,000 | | | Morgan Stanley & Co. International PLC | | | 7/27/17 | | | | (385 | ) |
| CLP | | | 6,498,954 | | | USD | | | 9,800 | | | Bank of America N.A. | | | 7/28/17 | | | | (18 | ) |
| CLP | | | 18,564,980 | | | USD | | | 28,000 | | | BNP Paribas S.A. | | | 7/28/17 | | | | (56 | ) |
| CLP | | | 19,899,000 | | | USD | | | 30,000 | | | BNP Paribas S.A. | | | 7/28/17 | | | | (48 | ) |
| CLP | | | 2,785,440 | | | USD | | | 4,200 | | | Goldman Sachs International | | | 7/28/17 | | | | (7 | ) |
| RUB | | | 4,745,600 | | | USD | | | 80,000 | | | Deutsche Bank AG | | | 7/28/17 | | | | (22 | ) |
| TRY | | | 123,040 | | | USD | | | 34,852 | | | BNP Paribas S.A. | | | 7/28/17 | | | | (166 | ) |
| TRY | | | 65,145 | | | USD | | | 18,443 | | | BNP Paribas S.A. | | | 7/28/17 | | | | (78 | ) |
| TRY | | | 123,074 | | | USD | | | 34,852 | | | Goldman Sachs International | | | 7/28/17 | | | | (157 | ) |
| TRY | | | 297,661 | | | USD | | | 84,000 | | | HSBC Bank PLC | | | 7/28/17 | | | | (87 | ) |
| TRY | | | 157,679 | | | USD | | | 44,500 | | | HSBC Bank PLC | | | 7/28/17 | | | | (49 | ) |
| TRY | | | 123,018 | | | USD | | | 34,852 | | | JPMorgan Chase Bank N.A. | | | 7/28/17 | | | | (172 | ) |
| BRL | | | 301,874 | | | USD | | | 90,841 | | | Barclays Bank PLC | | | 8/02/17 | | | | (401 | ) |
| BRL | | | 180,000 | | | USD | | | 54,279 | | | BNP Paribas S.A. | | | 8/02/17 | | | | (352 | ) |
| BRL | | | 23,103 | | | USD | | | 7,043 | | | Goldman Sachs International | | | 8/02/17 | | | | (121 | ) |
| USD | | | 46,800 | | | BRL | | | 156,401 | | | BNP Paribas S.A. | | | 8/02/17 | | | | (57 | ) |
| USD | | | 151,272 | | | BRL | | | 504,977 | | | BNP Paribas S.A. | | | 8/02/17 | | | | (16 | ) |
| COP | | | 152,200,000 | | | USD | | | 50,000 | | | Barclays Bank PLC | | | 8/09/17 | | | | (352 | ) |
See Notes to Financial Statements.
| | | | | | |
| | | BLACKROCK SERIES FUND, INC. | | JUNE 30, 2017 | | 49 |
| | | | |
| Schedule of Investments (continued) | | | BlackRock Balanced Capital Portfolio | |
| | | | | | | | | | | | | | | | | | |
Currency Purchased | | | Currency Sold | | | Counterparty | | Settlement
Date | | Unrealized
Appreciation (Depreciation) | |
| USD | | | 14,890 | | | EUR | | | 13,648 | | | Bank of America N.A. | | 8/11/17 | | | $ (734) | |
| USD | | | 49,854 | | | EUR | | | 44,373 | | | Citibank N.A. | | 8/11/17 | | | (942 | ) |
| USD | | | 87,315 | | | TRY | | | 311,195 | | | Goldman Sachs International | | 8/11/17 | | | (39 | ) |
| USD | | | 153,000 | | | IDR | | | 2,084,104,800 | | | BNP Paribas S.A. | | 8/15/17 | | | (2,524 | ) |
| USD | | | 12,066 | | | IDR | | | 162,050,000 | | | Barclays Bank PLC | | 8/16/17 | | | (25 | ) |
| USD | | | 11,677 | | | IDR | | | 156,820,000 | | | Barclays Bank PLC | | 8/16/17 | | | (24 | ) |
| USD | | | 3,991 | | | IDR | | | 53,595,000 | | | Barclays Bank PLC | | 8/16/17 | | | (8 | ) |
| USD | | | 13,266 | | | IDR | | | 177,900,000 | | | BNP Paribas S.A. | | 8/16/17 | | | (8 | ) |
| USD | | | 12,838 | | | IDR | | | 172,155,000 | | | BNP Paribas S.A. | | 8/16/17 | | | (8 | ) |
| USD | | | 4,387 | | | IDR | | | 58,835,000 | | | BNP Paribas S.A. | | 8/16/17 | | | (3 | ) |
| USD | | | 14,356 | | | IDR | | | 192,920,000 | | | Deutsche Bank AG | | 8/16/17 | | | (38 | ) |
| USD | | | 13,893 | | | IDR | | | 186,690,000 | | | Deutsche Bank AG | | 8/16/17 | | | (37 | ) |
| USD | | | 13,505 | | | IDR | | | 181,375,000 | | | Deutsche Bank AG | | 8/16/17 | | | (28 | ) |
| USD | | | 13,069 | | | IDR | | | 175,520,000 | | | Deutsche Bank AG | | 8/16/17 | | | (27 | ) |
| USD | | | 4,748 | | | IDR | | | 63,805,000 | | | Deutsche Bank AG | | 8/16/17 | | | (13 | ) |
| USD | | | 14,455 | | | IDR | | | 193,875,000 | | | Deutsche Bank AG | | 8/16/17 | | | (11 | ) |
| USD | | | 14,325 | | | IDR | | | 192,130,000 | | | Deutsche Bank AG | | 8/16/17 | | | (11 | ) |
| USD | | | 13,989 | | | IDR | | | 187,615,000 | | | Deutsche Bank AG | | 8/16/17 | | | (10 | ) |
| USD | | | 13,863 | | | IDR | | | 185,925,000 | | | Deutsche Bank AG | | 8/16/17 | | | (10 | ) |
| USD | | | 4,466 | | | IDR | | | 59,985,000 | | | Deutsche Bank AG | | 8/16/17 | | | (9 | ) |
| USD | | | 4,781 | | | IDR | | | 64,120,000 | | | Deutsche Bank AG | | 8/16/17 | | | (4 | ) |
| USD | | | 4,738 | | | IDR | | | 63,545,000 | | | Deutsche Bank AG | | 8/16/17 | | | (3 | ) |
| USD | | | 8,041 | | | IDR | | | 108,034,626 | | | Goldman Sachs International | | 8/16/17 | | | (20 | ) |
| USD | | | 7,782 | | | IDR | | | 104,547,528 | | | Goldman Sachs International | | 8/16/17 | | | (19 | ) |
| USD | | | 2,659 | | | IDR | | | 35,727,445 | | | Goldman Sachs International | | 8/16/17 | | | (7 | ) |
| USD | | | 13,407 | | | IDR | | | 180,060,000 | | | JPMorgan Chase Bank N.A. | | 8/16/17 | | | (28 | ) |
| USD | | | 12,974 | | | IDR | | | 174,245,000 | | | JPMorgan Chase Bank N.A. | | 8/16/17 | | | (27 | ) |
| USD | | | 4,434 | | | IDR | | | 59,550,000 | | | JPMorgan Chase Bank N.A. | | 8/16/17 | | | (9 | ) |
| USD | | | 14,414 | | | IDR | | | 193,390,000 | | | UBS AG | | 8/16/17 | | | (16 | ) |
| USD | | | 13,948 | | | IDR | | | 187,145,000 | | | UBS AG | | 8/16/17 | | | (15 | ) |
| USD | | | 14,708 | | | IDR | | | 197,255,000 | | | UBS AG | | 8/16/17 | | | (10 | ) |
| USD | | | 14,233 | | | IDR | | | 190,885,000 | | | UBS AG | | 8/16/17 | | | (9 | ) |
| USD | | | 4,767 | | | IDR | | | 63,960,000 | | | UBS AG | | 8/16/17 | | | (5 | ) |
| USD | | | 4,865 | | | IDR | | | 65,240,000 | | | UBS AG | | 8/16/17 | | | (3 | ) |
| USD | | | 389,693 | | | TRY | | | 1,394,379 | | | BNP Paribas S.A. | | 8/21/17 | | | (510 | ) |
| COP | | | 152,608,500 | | | USD | | | 50,000 | | | UBS AG | | 8/22/17 | | | (294 | ) |
| USD | | | 194,827 | | | MXN | | | 3,693,050 | | | JPMorgan Chase Bank N.A. | | 8/23/17 | | | (6,868 | ) |
| USD | | | 28,267 | | | EUR | | | 25,000 | | | BNP Paribas S.A. | | 9/07/17 | | | (392 | ) |
| USD | | | 44,826 | | | RUB | | | 2,736,859 | | | Credit Suisse International | | 9/15/17 | | | (825 | ) |
| USD | | | 14,761 | | | RUB | | | 889,596 | | | Credit Suisse International | | 9/15/17 | | | (77 | ) |
| CHF | | | 30,000 | | | NOK | | | 263,082 | | | Citibank N.A. | | 9/20/17 | | | (109 | ) |
| EUR | | | 30,000 | | | SEK | | | 292,415 | | | Morgan Stanley & Co. International PLC | | 9/20/17 | | | (459 | ) |
| EUR | | | 22,853 | | | USD | | | 20,000 | | | JPMorgan Chase Bank N.A. | | 9/20/17 | | | (91 | ) |
| JPY | | | 3,338,587 | | | USD | | | 30,000 | | | Barclays Bank PLC | | 9/20/17 | | | (208 | ) |
| KRW | | | 22,600,600 | | | USD | | | 20,000 | | | Deutsche Bank AG | | 9/20/17 | | | (222 | ) |
| MXN | | | 467,120 | | | GBP | | | 20,000 | | | Deutsche Bank AG | | 9/20/17 | | | (714 | ) |
| MXN | | | 473,474 | | | GBP | | | 20,000 | | | JPMorgan Chase Bank N.A. | | 9/20/17 | | | (368 | ) |
| MXN | | | 546,552 | | | USD | | | 30,000 | | | Deutsche Bank AG | | 9/20/17 | | | (278 | ) |
| NOK | | | 270,000 | | | SEK | | | 275,225 | | | JPMorgan Chase Bank N.A. | | 9/20/17 | | | (431 | ) |
See Notes to Financial Statements.
| | | | | | |
| 50 | | BLACKROCK SERIES FUND, INC. | | JUNE 30, 2017 | | |
| | | | |
| Schedule of Investments (continued) | | | BlackRock Balanced Capital Portfolio | |
| | | | | | | | | | | | | | | | | | | | | | |
Currency
Purchased | | | | | Currency Sold | | | Counterparty | | Settlement
Date | | | Unrealized
Appreciation
(Depreciation) | |
| USD | | | 363,535 | | | | AUD | | | | 481,000 | | | Goldman Sachs International | | | 9/20/17 | | | $ | (5,773 | ) |
| USD | | | 363,350 | | | | AUD | | �� | | 480,000 | | | Goldman Sachs International | | | 9/20/17 | | | | (5,190 | ) |
| USD | | | 30,392 | | | | AUD | | | | 40,000 | | | Goldman Sachs International | | | 9/20/17 | | | | (319 | ) |
| USD | | | 20,000 | | | | CAD | | | | 25,919 | | | Citibank N.A. | | | 9/20/17 | | | | (13 | ) |
| USD | | | 20,000 | | | | CAD | | | | 26,399 | | | HSBC Bank PLC | | | 9/20/17 | | | | (384 | ) |
| USD | | | 20,000 | | | | CAD | | | | 26,260 | | | HSBC Bank PLC | | | 9/20/17 | | | | (276 | ) |
| USD | | | 10,000 | | | | CAD | | | | 13,176 | | | JPMorgan Chase Bank N.A. | | | 9/20/17 | | | | (174 | ) |
| USD | | | 1,102,804 | | | | EUR | | | | 980,000 | | | Barclays Bank PLC | | | 9/20/17 | | | | (21,445 | ) |
| USD | | | 33,753 | | | | EUR | | | | 30,000 | | | Citibank N.A. | | | 9/20/17 | | | | (663 | ) |
| USD | | | 33,901 | | | | EUR | | | | 30,000 | | | Citibank N.A. | | | 9/20/17 | | | | (514 | ) |
| USD | | | 22,631 | | | | EUR | | | | 20,000 | | | JPMorgan Chase Bank N.A. | | | 9/20/17 | | | | (313 | ) |
| USD | | | 38,322 | | | | GBP | | | | 30,000 | | | JPMorgan Chase Bank N.A. | | | 9/20/17 | | | | (852 | ) |
| USD | | | 25,716 | | | | GBP | | | | 20,000 | | | Morgan Stanley & Co. International PLC | | | 9/20/17 | | | | (400 | ) |
| USD | | | 20,000 | | | | NOK | | | | 167,063 | | | Bank of America N.A. | | | 9/20/17 | | | | (43 | ) |
| USD | | | 30,000 | | | | NOK | | | | 252,803 | | | Deutsche Bank AG | | | 9/20/17 | | | | (330 | ) |
| USD | | | 18,234 | | | | NZD | | | | 25,000 | | | BNP Paribas S.A. | | | 9/20/17 | | | | (58 | ) |
| USD | | | 10,971 | | | | NZD | | | | 15,000 | | | BNP Paribas S.A. | | | 9/20/17 | | | | (5 | ) |
| USD | | | 14,465 | | | | NZD | | | | 20,000 | | | Standard Chartered Bank | | | 9/20/17 | | | | (169 | ) |
| USD | | | 34,279 | | | | SEK | | | | 290,913 | | | JPMorgan Chase Bank N.A. | | | 9/20/17 | | | | (416 | ) |
| USD | | | 118,425 | | | | TRY | | | | 427,036 | | | Bank of America N.A. | | | 9/20/17 | | | | (112 | ) |
| USD | | | 563,218 | | | | TRY | | | | 2,049,831 | | | BNP Paribas S.A. | | | 10/23/17 | | | | (727 | ) |
| TRY | | | 862,169 | | | | USD | | | | 223,667 | | | BNP Paribas S.A. | | | 6/25/18 | | | | (922 | ) |
| | | | | | | | | | | | | | | | | | | | | | |
| | | | | | | | | | | | | | | | | | | | | | (119,059 | ) |
Net Unrealized Appreciation | | | | | | | | | | | | | $ | 170,237 | |
| | | | | | | | | | | | | | | | | | | | | | |
| | | | | | | | | | | | | | | | | | | | |
Exchange-Traded Options Purchased | | | | | | | | | | | | | | | | | | | | |
Description | | Put/
Call | | Expiration
Date | | | Strike Price | | | Contracts | | | Value | |
Euro Dollar 90-Day | | Put | | | 10/13/17 | | | USD | | | 98.00 | | | | 140 | | | $ | 14,875 | |
| | | | | | | | | | | | | | | | | | | | | | | | | | | | | | | | | | | | | | | | | | |
OTC Barriers Options Purchased | | | | | | | | | | | | | | | | | | | | | | | | | | | | | | | | | | | | | |
Description | | Put/ Call | | Type
of Option | | | Counterparty | | | Expiration
Date | | | Strike Price | | | Barrier Price | | | Notional Amount (000) | | | Value | |
USD Currency | | Put | | | Down-and-Out | | | | BNP Paribas S.A. | | | | 7/03/17 | | | | TRY | | | | 3.50 | | | | USD | | | | 3.35 | | | | USD | | | | 92 | | | $ | 72 | |
| | | | | | | | | | | | | | | | | | | | | | | | | | |
OTC Options Purchased | | | | | | | | | | | | | | | | | | | | |
| Description | | Put/
Call | | | Counterparty | | Expiration
Date | | | Strike
Price | | Notional
Amount
(000) | | | Value | |
USD Currency1 | | | Call | | | Barclays Bank PLC | | | 7/03/17 | | | MXN | | 19.00 | | | USD | | | | 54 | | | | — | |
| | | | | | Morgan Stanley & Co. | | | | | | | | | | | | | | | | | | | | |
USD Currency1 | | | Call | | | International PLC | | | 7/03/17 | | | MXN | | 20.00 | | | USD | | | | 134 | | | | — | |
| | | | | | Morgan Stanley & Co. | | | | | | | | | | | | | | | | | | | | |
USD Currency1 | | | Call | | | International PLC | | | 7/03/17 | | | MXN | | 21.50 | | | USD | | | | 50 | | | | — | |
USD Currency | | | Call | | | Barclays Bank PLC | | | 7/07/17 | | | JPY | | 111.00 | | | USD | | | | 64 | | | $ | 853 | |
USD Currency | | | Call | | | Deutsche Bank AG | | | 8/07/17 | | | RUB | | 58.00 | | | USD | | | | 50 | | | | 1,650 | |
USD Currency | | | Call | | | HSBC Bank PLC | | | 9/01/17 | | | TWD | | 30.50 | | | USD | | | | 116 | | | | 934 | |
USD Currency | | | Put | | | Citibank N.A. | | | 7/03/17 | | | CNH | | 6.79 | | | USD | | | | 3,030 | | | | 8,336 | |
EUR Currency | | | Put | | | JPMorgan Chase Bank N.A. | | | 7/06/17 | | | MXN | | 20.80 | | | EUR | | | | 72 | | | | 851 | |
USD Currency | | | Put | | | Citibank N.A. | | | 7/06/17 | | | BRL | | 3.18 | | | USD | | | | 78 | | | | — | |
See Notes to Financial Statements.
| | | | | | |
| | | BLACKROCK SERIES FUND, INC. | | JUNE 30, 2017 | | 51 |
| | | | |
| Schedule of Investments (continued) | | | BlackRock Balanced Capital Portfolio | |
| | | | | | | | | | | | | | | | | | | | | | | | | | | | | | |
| Description | | Put/
Call | | | Counterparty | | Expiration
Date | | | Strike Price | | | Notional
Amount (000) | | | Value | |
AUD Currency | | | Put | | | Barclays Bank PLC | | | 7/27/17 | | | | USD | | | | 0.75 | | | | AUD | | | | 92 | | | | $ 100 | |
AUD Currency | | | Put | | | JPMorgan Chase Bank N.A. | | | 7/27/17 | | | | USD | | | | 0.72 | | | | AUD | | | | 92 | | | | 4 | |
EUR Currency | | | Put | | | BNP Paribas S.A. | | | 8/25/17 | | | | USD | | | | 1.12 | | | | EUR | | | | 72 | | | | 263 | |
USD Currency | | | Put | | | Citibank N.A. | | | 8/25/17 | | | | TRY | | | | 3.52 | | | | USD | | | | 153 | | | | 1,451 | |
EUR Currency | | | Put | | | JPMorgan Chase Bank N.A. | | | 8/29/17 | | | | MXN | | | | 20.50 | | | | EUR | | | | 62 | | | | 746 | |
Total | | | | | | | | | | | | | | | | | | | | | | | | | | | | | $15,188 | |
| | | | | | | | | | | | | | | | | | | | | | | | | | | | | | |
| | 1 | Security is valued using significant unobservable inputs and is classified as Level 3 in the fair value hierarchy. |
Exchange-Traded Options Written
| | | | | | | | | | | | | | | | | | | | | | | | |
| Description | | Put/
Call | | | Expiration
Date | | | Strike
Price | | | Contracts | | | Value | |
Euro Dollar 90-Day | | | Put | | | | 10/13/17 | | | | USD | | | | 97.50 | | | | 70 | | | | $ (875) | |
Euro Dollar 90-Day | | | Put | | | | 10/13/17 | | | | USD | | | | 97.63 | | | | 140 | | | | (2,625) | |
Total | | | | | | | | | | | | | | | | | | | | | | | $(3,500) | |
| | | | | | | | | | | | | | | | | | | | | | | | |
| | | | | | | | | | | | | | | | | | | | | | | | | | | | | | | | |
OTC Options Written | | | | | | | | | | | | | | | | | | | | | | | | | | | | | | | | |
| Description | | Put/
Call | | | Counterparty | | | Expiration
Date | | | Strike
Price | | | Notional
Amount (000) | | | Value | |
USD Currency | | | Call | | | | Goldman Sachs International | | | | 07/03/17 | | | | MXN | | | | 22.60 | | | | USD | | | | 100 | | | | — | |
USD Currency | | | Call | | |
| Morgan Stanley &Co.
International PLC |
| | | 07/03/17 | | | | MXN | | | | 19.00 | | | | USD | | | | 54 | | | | — | |
USD Currency | | | Call | | | | Citibank N.A. | | | | 07/06/17 | | | | BRL | | | | 3.31 | | | | USD | | | | 78 | | | | $ (439 | ) |
USD Currency | | | Call | | | | Deutsche Bank AG | | | | 07/17/17 | | | | ZAR | | | | 14.00 | | | | USD | | | | 45 | | | | (45 | ) |
USD Currency | | | Call | | | | Citibank N.A. | | | | 07/27/17 | | | | TRY | | | | 3.65 | | | | USD | | | | 153 | | | | (566 | ) |
TRY Currency | | | Call | | | | BNP Paribas S.A. | | | | 07/28/17 | | | | ZAR | | | | 3.68 | | | | TRY | | | | 183 | | | | (908 | ) |
USD Currency | | | Call | | | | Barclays Bank PLC | | | | 08/10/17 | | | | BRL | | | | 3.40 | | | | USD | | | | 46 | | | | (485 | ) |
EUR Currency | | | Call | | | | JPMorgan Chase Bank N.A. | | | | 08/29/17 | | | | MXN | | | | 21.50 | | | | EUR | | | | 62 | | | | (636 | ) |
USD Currency | | | Put | | | | Citibank N.A. | | | | 07/03/17 | | | | CNH | | | | 6.75 | | | | USD | | | | 3,030 | | | | (1,147 | ) |
USD Currency | | | Put | | | | Deutsche Bank AG | | | | 07/17/17 | | | | ZAR | | | | 13.00 | | | | USD | | | | 45 | | | | (369 | ) |
AUD Currency | | | Put | | | | Barclays Bank PLC | | | | 07/27/17 | | | | USD | | | | 0.72 | | | | AUD | | | | 92 | | | | (4 | ) |
USD Currency | | | Put | | | | Barclays Bank PLC | | | | 08/10/17 | | | | BRL | | | | 3.30 | | | | USD | | | | 46 | | | | (562 | ) |
USD Currency | | | Put | | | | HSBC Bank PLC | | | | 09/01/17 | | | | TWD | | | | 30.00 | | | | USD | | | | 116 | | | | (364 | ) |
Total | | | | | | | | | | | | | | | | | | | | | | | | | | | | | | | $(5,525 | ) |
| | | | | | | | | | | | | | | | | | | | | | | | | | | | | | | | |
See Notes to Financial Statements.
| | | | | | |
| 52 | | BLACKROCK SERIES FUND, INC. | | JUNE 30, 2017 | | |
| | | | |
| Schedule of Investments (continued) | | | BlackRock Balanced Capital Portfolio | |
| | | | | | | | | | | | | | | | | | |
Centrally Cleared Credit Default Swaps — Sell Protection | | | | | | | | |
| Index | | Receive
Fixed
Rate | | Expiration
Date | | Credit
Rating1 | | Notional
Amount
(000)2 | | | Unrealized Depreciation | |
CDX.NA.IG.28.V1 | | 1.00% | | 6/20/22 | | BBB+ | | | USD | | | | 530 | | | | $(218) | |
| | 1 | | Using S&P’s rating of the issuer or the underlying securities of the index, as applicable. |
| | 2 | | The maximum potential amount the Fund may pay should a negative credit event take place as defined under the terms of the agreement. |
| | | | | | | | | | | | | | |
Centrally Cleared Interest Rate Swaps | | | | | | |
| | | | | | | | | | | | | | | | |
Fixed
Rate | | Floating
Rate | | Expiration
Date | | Notional
Amount
(000) | | | Unrealized
Appreciation
(Depreciation) | |
| 7.36%1 | | 28-day MXIBTIIE | | 1/28/19 | | | MXN | | | | 12,895 | | | | $ (4,112 | ) |
| 7.32%2 | | 28-day MXIBTIIE | | 2/20/20 | | | MXN | | | | 11,928 | | | | 9,389 | |
| 7.16%2 | | 28-day MXIBTIIE | | 4/29/20 | | | MXN | | | | 10,190 | | | | 6,060 | |
| 7.45%2 | | 28-day MXIBTIIE | | 3/07/22 | | | MXN | | | | 4,082 | | | | 5,977 | |
| 7.48%2 | | 28-day MXIBTIIE | | 3/07/22 | | | MXN | | | | 2,041 | | | | 3,192 | |
| 7.47%2 | | 28-day MXIBTIIE | | 3/07/22 | | | MXN | | | | 2,041 | | | | 3,146 | |
| 7.16%2 | | 28-day MXIBTIIE | | 6/01/22 | | | MXN | | | | 4,905 | | | | 4,076 | |
| 6.32%2 | | 28-day MXIBTIIE | | 7/17/25 | | | MXN | | | | 2,027 | | | | (5,187 | ) |
| 2.13%2 | | 3-month LIBOR | | 8/25/25 | | | USD | | | | 65 | | | | 193 | |
| 3.46%2 | | UK RPI All Items Monthly | | 10/15/26 | | | GBP | | | | 370 | | | | 2,454 | |
| 3.43%2 | | UK RPI All Items Monthly | | 10/15/26 | | | GBP | | | | 355 | | | | 653 | |
| 3.45%2 | | UK RPI All Items Monthly | | 10/15/26 | | | GBP | | | | 260 | | | | 1,208 | |
| 7.41%2 | | 28-day MXIBTIIE | | 5/25/27 | | | MXN | | | | 2,812 | | | | 2,618 | |
| 7.38%2 | | 28-day MXIBTIIE | | 5/25/27 | | | MXN | | | | 458 | | | | 357 | |
| 7.82%2 | | 28-day MXIBTIIE | | 3/04/37 | | | MXN | | | | 993 | | | | 1,405 | |
| 7.92%2 | | 28-day MXIBTIIE | | 5/01/37 | | | MXN | | | | 1,293 | | | | 2,437 | |
| 7.95%2 | | 28-day MXIBTIIE | | 5/01/37 | | | MXN | | | | 1,189 | | | | 2,572 | |
Total | | | | | | | | | | | | | | | $36,438 | |
| | | | | | | | | | | | | | | | |
| | 1 | | The Fund pays the fixed rate and receives the floating rate. |
| | 2 | | The Fund pays the floating rate and receives the fixed rate. |
| | | | | | | | | | | | | | | | | | | | | | | | |
OTC Credit Default Swaps — Buy Protection |
| Issuer | | Pay
Fixed
Rate | | | Counterparty | | Expiration
Date | | Notional
Amount (000) | | | Value | | | Premiums
Paid
(Received) | | | Unrealized
Appreciation
(Depreciation) |
United Mexican States | | | 1.00 | % | | JPMorgan Chase Bank N.A. | | 6/20/20 | | USD | | | 209 | | | | $(2,347) | | | | $ 1,096 | | | $(3,443) |
United Mexican States | | | 1.00 | % | | Bank of America N.A. | | 9/20/20 | | USD | | | 209 | | | | (2,078) | | | | 1,699 | | | (3,777) |
Loews Corp. | | | 1.00 | % | | Barclays Bank PLC | | 12/20/20 | | USD | | | 110 | | | | (3,289) | | | | (2,888) | | | (401) |
| | | | | | Morgan Stanley & Co. | | | | | | | | | | | | | | | | | | |
Valero Energy Corp. | | | 1.00 | % | | International PLC | | 12/20/20 | | USD | | | 115 | | | | (2,164) | | | | 1,972 | | | (4,136) |
Russian Federation | | | 1.00 | % | | Bank of America N.A. | | 12/20/21 | | USD | | | 10 | | | | 222 | | | | 529 | | | (307) |
Republic of South Africa | | | 1.00 | % | | Bank of America N.A. | | 6/20/22 | | USD | | | 70 | | | | 3,007 | | | | 3,419 | | | (412) |
Republic of Argentina | | | 5.00 | % | | Barclays Bank PLC | | 6/20/22 | | USD | | | 103 | | | | (7,990) | | | | (4,703) | | | (3,287) |
Republic of Argentina | | | 5.00 | % | | Barclays Bank PLC | | 6/20/22 | | USD | | | 27 | | | | (2,100) | | | | (2,000) | | | (100) |
Republic of Argentina | | | 5.00 | % | | Barclays Bank PLC | | 6/20/22 | | USD | | | 18 | | | | (1,400) | | | | (1,446) | | | 46 |
Republic of Argentina | | | 5.00 | % | | Barclays Bank PLC | | 6/20/22 | | USD | | | 17 | | | | (1,323) | | | | (1,390) | | | 67 |
Republic of Argentina | | | 5.00 | % | | Barclays Bank PLC | | 6/20/22 | | USD | | | 16 | | | | (1,245) | | | | (1,308) | | | 63 |
Republic of South Africa | | | 1.00 | % | | Citibank N.A. | | 6/20/22 | | USD | | | 174 | | | | 7,476 | | | | 8,499 | | | (1,023) |
| | | | | | Goldman Sachs | | | | | | | | | | | | | | | | | | |
Republic of South Africa | | | 1.00 | % | | International | | 6/20/22 | | USD | | | 44 | | | | 1,890 | | | | 2,144 | | | (254) |
Republic of South Africa | | | 1.00 | % | | HSBC Bank PLC | | 6/20/22 | | USD | | | 100 | | | | 4,296 | | | | 4,788 | | | (492) |
Republic of the Philippines | | | 1.00 | % | | JPMorgan Chase Bank N.A. | | 6/20/22 | | USD | | | 277 | | | | (3,142) | | | | (685) | | | (2,457) |
See Notes to Financial Statements.
| | | | | | |
| | | BLACKROCK SERIES FUND, INC. | | JUNE 30, 2017 | | 53 |
| | | | |
| Schedule of Investments (continued) | | | BlackRock Balanced Capital Portfolio | |
| | | | | | | | | | | | | | | | | | | | | | | | | | | | | | | | |
| Issuer | | Pay
Fixed
Rate | | | Counterparty | | | Expiration
Date | | | Notional
Amount (000) | | | Value | | | Premiums
Paid
(Received) | | | Unrealized
Appreciation
(Depreciation) | |
CMBX.NA.9.AAA | | | 0.50 | % | | | Credit Suisse International | | | | 9/17/58 | | | | USD | | | | 60 | | | | $817 | | | | $739 | | | | $ 78 | |
CMBX.NA.9.AAA | | | 0.50 | % | | | Deutsche Bank AG | | | | 9/17/58 | | | | USD | | | | 50 | | | | 681 | | | | 625 | | | | 56 | |
| | | | | | | Morgan Stanley & Co. | | | | | | | | | | | | | | | | | | | | | | | | | |
CMBX.NA.9.AAA | | | 0.50 | % | | | International PLC | | | | 9/17/58 | | | | USD | | | | 90 | | | | 1,225 | | | | 1,333 | | | | (108 | ) |
| | | | | | | Morgan Stanley & Co. | | | | | | | | | | | | | | | | | | | | | | | | | |
CMBX.NA.9.AAA | | | 0.50 | % | | | International PLC | | | | 9/17/58 | | | | USD | | | | 50 | | | | 681 | | | | 616 | | | | 65 | |
| | | | | | | Morgan Stanley & Co. | | | | | | | | | | | | | | | | | | | | | | | | | |
CMBX.NA.9.AAA | | | 0.50 | % | | | International PLC | | | | 9/17/58 | | | | USD | | | | 40 | | | | 545 | | | | 493 | | | | 52 | |
CMBX.NA.6.AAA | | | 0.50 | % | | | Deutsche Bank AG | | | | 5/11/63 | | | | USD | | | | 119 | | | | (203 | ) | | | 39 | | | | (242 | ) |
CMBX.NA.6.AAA | | | 0.50 | % | | | Deutsche Bank AG | | | | 5/11/63 | | | | USD | | | | 99 | | | | (169 | ) | | | (33 | ) | | | (136 | ) |
CMBX.NA.6.AAA | | | 0.50 | % | | | Deutsche Bank AG | | | | 5/11/63 | | | | USD | | | | 69 | | | | (118 | ) | | | 14 | | | | (132 | ) |
CMBX.NA.6.BBB- | | | 3.00 | % | | | Deutsche Bank AG | | | | 5/11/63 | | | | USD | | | | 30 | | | | 3,490 | | | | 2,756 | | | | 734 | |
CMBX.NA.6.BBB- | | | 3.00 | % | | | J.P. Morgan Securities LLC | | | | 5/11/63 | | | | USD | | | | 20 | | | | 2,327 | | | | 1,305 | | | | 1,022 | |
CMBX.NA.6.BBB- | | | 3.00 | % | | | J.P. Morgan Securities LLC | | | | 5/11/63 | | | | USD | | | | 20 | | | | 2,327 | | | | 1,305 | | | | 1,022 | |
CMBX.NA.6.BBB- | | | 3.00 | % | | | J.P. Morgan Securities LLC | | | | 5/11/63 | | | | USD | | | | 20 | | | | 2,327 | | | | 2,010 | | | | 317 | |
| | | | | | | Morgan Stanley & Co. | | | | | | | | | | | | | | | | | | | | | | | | | |
CMBX.NA.6.BBB- | | | 3.00 | % | | | International PLC | | | | 5/11/63 | | | | USD | | | | 20 | | | | 2,327 | | | | 1,199 | | | | 1,128 | |
Total | | | | | | | | | | | | | | | | | | | | | | | $6,070 | | | | $22,127 | | | | $(16,057 | ) |
| | | | | | | | | | | | | | | | | | | | | | | | |
| | | | | | | | | | | | | | | | | | | | | | | | | | | | | | | | | | |
OTC Credit Default Swaps — Sell Protection | | | | | | | | | | | | | | | | | | | | | |
| Issuer/Index | | Receive
Fixed
Rate | | | Counterparty | | Expiration
Date | | | Credit
Rating1 | | | Notional
Amount
(000)2 | | | Value | | | Premiums
Received | | | Unrealized
Appreciation
(Depreciation) | |
CMBX.NA.8.A | | | 2.00% | | | Goldman Sachs International | | | 10/17/57 | | | | Not Rated | | | | USD | | | | 20 | | | | $ (1,005 | ) | | | $ (2,039 | ) | | | $ 1,034 | |
Transocean Ltd. | | | 1.00% | | | Goldman Sachs International | | | 6/20/19 | | | | B+ | | | | USD | | | | 25 | | | | (463 | ) | | | (308 | ) | | | (155 | ) |
United Mexican States | | | 1.00% | | | Bank of America N.A. | | | 6/20/20 | | | | BBB+ | | | | USD | | | | 209 | | | | 2,346 | | | | (1,271 | ) | | | 3,617 | |
United Mexican States | | | 1.00% | | | JPMorgan Chase Bank N.A. | | | 9/20/20 | | | | BBB+ | | | | USD | | | | 209 | | | | 2,079 | | | | (1,816 | ) | | | 3,895 | |
CMBX.NA.3.AM | | | 0.50% | | | Credit Suisse International | | | 12/13/49 | | | | BBB+ | | | | USD | | | | 72 | | | | (344 | ) | | | (6,337 | ) | | | 5,993 | |
CMBX.NA.3.AM | | | 0.50% | | | Goldman Sachs International | | | 12/13/49 | | | | BBB+ | | | | USD | | | | 142 | | | | (680 | ) | | | (12,644 | ) | | | 11,964 | |
CMBX.NA.4.AM | | | 0.50% | | | Deutsche Bank AG | | | 2/17/51 | | | | BBB- | | | | USD | | | | 52 | | | | (304 | ) | | | (6,945 | ) | | | 6,641 | |
CMBX.NA.8.A | | | 2.00% | | | Goldman Sachs International | | | 10/17/57 | | | | Not Rated | | | | USD | | | | 30 | | | | (1,508 | ) | | | (1,709 | ) | | | 201 | |
CMBX.NA.9.A | | | 2.00% | | | Credit Suisse International | | | 9/17/58 | | | | Not Rated | | | | USD | | | | 20 | | | | (740 | ) | | | (1,039 | ) | | | 299 | |
CMBX.NA.9.A | | | 2.00% | | | Deutsche Bank AG | | | 9/17/58 | | | | Not Rated | | | | USD | | | | 30 | | | | (1,110 | ) | | | (1,496 | ) | | | 386 | |
CMBX.NA.9.A | | | 2.00% | | | Morgan Stanley & Co. International PLC | | | 9/17/58 | | | | Not Rated | | | | USD | | | | 100 | | | | (3,701 | ) | | | (2,300 | ) | | | (1,401 | ) |
CMBX.NA.9.A | | | 2.00% | | | Morgan Stanley & Co. International PLC | | | 9/17/58 | | | | Not Rated | | | | USD | | | | 30 | | | | (1,110 | ) | | | (1,633 | ) | | | 523 | |
CMBX.NA.9.A | | | 2.00% | | | Morgan Stanley & Co. International PLC | | | 9/17/58 | | | | Not Rated | | | | USD | | | | 20 | | | | (741 | ) | | | (983 | ) | | | 242 | |
CMBX.NA.9.BBB- | | | 3.00% | | | Credit Suisse International | | | 9/17/58 | | | | Not Rated | | | | USD | | | | 40 | | | | (4,708 | ) | | | (4,230 | ) | | | (478 | ) |
| | | | | | Morgan Stanley & Co. | | | | | | | | | | | | | | | | | | | | | | | | | | | | |
CMBX.NA.9.BBB- | | | 3.00% | | | International PLC | | | 9/17/58 | | | | Not Rated | | | | USD | | | | 40 | | | | (4,708 | ) | | | (4,311 | ) | | | (397 | ) |
CMBX.NA.9.BBB- | | | 3.00% | | | Morgan Stanley & Co. International PLC | | | 9/17/58 | | | | Not Rated | | | | USD | | | | 10 | | | | (1,177 | ) | | | (1,105 | ) | | | (72 | ) |
CMBX.NA.10.BBB- | | | 3.00% | | | J.P. Morgan Securities LLC | | | 11/17/59 | | | | BBB- | | | | USD | | | | 5 | | | | (539 | ) | | | (448 | ) | | | (91 | ) |
CMBX.NA.6.BBB- | | | 3.00% | | | Credit Suisse International | | | 5/11/63 | | | | BBB- | | | | USD | | | | 20 | | | | (2,327 | ) | | | (1,628 | ) | | | (699 | ) |
Total | | | | | | | | | | | | | | | | | | | | | | | | | $(20,740) | | | | $(52,242) | | | | $31,502 | |
| | | | | | | | | | | | | | | | | | | | | | | | | | |
| | 1 | | Using S&P’s rating of the issuer or the underlying securities of the index, as applicable. |
| | 2 | | The maximum potential amount the Fund may pay should a negative credit event take place as defined under the terms of the agreement. |
See Notes to Financial Statements.
| | | | | | |
| 54 | | BLACKROCK SERIES FUND, INC. | | JUNE 30, 2017 | | |
| | | | |
| Schedule of Investments (continued) | | | BlackRock Balanced Capital Portfolio | |
| | | | | | | | | | | | | | | | | | | | | | | | | | | | | | | | |
OTC Interest Rate Swaps | |
Fixed
Rate | | Floating
Rate | | | Counterparty | | | Expiration
Date | | | Notional
Amount
(000) | | | Value | | | Premiums
Paid
(Received) | | | Unrealized
Appreciation
(Depreciation) | |
13.13%1 | | | 1-day BZDIOVER | | | | Bank of America N.A. | | | | 7/03/17 | | | | BRL | | | | 688 | | | $ | (836 | ) | | | — | | | $ | (836 | ) |
13.11%1 | | | 1-day BZDIOVER | | | | Citibank N.A. | | | | 7/03/17 | | | | BRL | | | | 826 | | | | (964 | ) | | | — | | | | (964 | ) |
12.85%1 | | | 1-day BZDIOVER | | | | JPMorgan Chase Bank N.A. | | | | 7/03/17 | | | | BRL | | | | 117 | | | | (90 | ) | | | — | | | | (90 | ) |
9.50%1 | | | 1-day BZDIOVER | | | | Bank of America N.A. | | | | 10/02/17 | | | | BRL | | | | 1,867 | | | | (52 | ) | | | — | | | | (52 | ) |
1.92%2 | | | 3-month KRW Certificate of Deposit | | | | Deutsche Bank AG | | | | 11/10/17 | | | | KRW | | | | 311,432 | | | | 708 | | | $ | 152 | | | | 556 | |
1.69%1 | | | 3-month KRW Certificate of Deposit | | | | Deutsche Bank AG | | | | 11/10/17 | | | | KRW | | | | 311,432 | | | | (393 | ) | | | — | | | | (393 | ) |
9.99%1 | | | 1-day BZDIOVER | | | | Citibank N.A. | | | | 1/02/18 | | | | BRL | | | | 1,632 | | | | (1,707 | ) | | | — | | | | (1,707 | ) |
8.98%1 | | | 1-day BZDIOVER | | | | Citibank N.A. | | | | 1/02/18 | | | | BRL | | | | 455 | | | | 214 | | | | — | | | | 214 | |
9.98%1 | | | 1-day BZDIOVER | | | | JPMorgan Chase Bank N.A. | | | | 1/02/18 | | | | BRL | | | | 1,632 | | | | (1,120 | ) | | | — | | | | (1,120 | ) |
4.55%1 | | | 28-day MXIBTIIE | | | | Barclays Bank PLC | | | | 3/21/18 | | | | MXN | | | | 1,273 | | | | 1,467 | | | | 16 | | | | 1,451 | |
4.85%1 | | | 28-day MXIBTIIE | | | | Bank of America N.A. | | | | 11/01/18 | | | | MXN | | | | 959 | | | | 1,548 | | | | 3 | | | | 1,545 | |
7.07%2 | | | 28-day MXIBTIIE | | | | Citibank N.A. | | | | 11/21/18 | | | | MXN | | | | 4,102 | | | | 144 | | | | — | | | | 144 | |
7.06%2 | | | 28-day MXIBTIIE | | | | JPMorgan Chase Bank N.A. | | | | 11/21/18 | | | | MXN | | | | 4,922 | | | | 138 | | | | — | | | | 138 | |
6.98%2 | | | 28-day MXIBTIIE | | | | Citibank N.A. | | | | 11/28/18 | | | | MXN | | | | 7,000 | | | | (278 | ) | | | (10 | ) | | | (268 | ) |
6.98%2 | | | 28-day MXIBTIIE | | | | JPMorgan Chase Bank N.A. | | | | 11/28/18 | | | | MXN | | | | 3,971 | | | | (158 | ) | | | (6 | ) | | | (152 | ) |
9.25%2 | | | 1-day BZDIOVER | | | | Citibank N.A. | | | | 1/02/19 | | | | BRL | | | | 1,230 | | | | 1,159 | | | | — | | | | 1,159 | |
9.28%2 | | | 1-day BZDIOVER | | | | JPMorgan Chase Bank N.A. | | | | 1/02/19 | | | | BRL | | | | 1,168 | | | | 1,213 | | | | — | | | | 1,213 | |
9.73%2 | | | 1-day BZDIOVER | | | | JPMorgan Chase Bank N.A. | | | | 1/02/20 | | | | BRL | | | | 979 | | | | 1,004 | | | | — | | | | 1,004 | |
3.27%1 | | | 3-month LIBOR | | | | Deutsche Bank AG | | | | 5/16/21 | | | | USD | | | | 550 | | | | (31,129 | ) | | | — | | | | (31,129 | ) |
3.78%2 | | | 7-day China Fixing Repo Rates | | | | Bank of America N.A. | | | | 6/02/22 | | | | CNY | | | | 396 | | | | 82 | | | | (3 | ) | | | 85 | |
5.73%1 | | | 28-day MXIBTIIE | | | | Bank of America N.A. | | | | 1/03/25 | | | | MXN | | | | 940 | | | | 3,972 | | | | 13 | | | | 3,959 | |
6.43%2 | | | 28-day MXIBTIIE | | | | Bank of America N.A. | | | | 6/06/25 | | | | MXN | | | | 836 | | | | (1,792 | ) | | | (14 | ) | | | (1,778 | ) |
6.33%2 | | | 28-day MXIBTIIE | | | | Citibank N.A. | | | | 7/17/25 | | | | MXN | | | | 1,010 | | | | (2,551 | ) | | | (5 | ) | | | (2,546 | ) |
6.31%1 | | | 28-day MXIBTIIE | | | | Deutsche Bank AG | | | | 8/11/25 | | | | MXN | | | | 3,807 | | | | 9,994 | | | | 16 | | | | 9,978 | |
6.27%2 | | | 28-day MXIBTIIE | | | | Bank of America N.A. | | | | 12/05/25 | | | | MXN | | | | 116 | | | | (336 | ) | | | (2 | ) | | | (334 | ) |
Total | | | | | | | | | | | | | | | | | | | | | | | $(19,763) | | | | $160 | | | | $(19,923 | ) |
| | | | | | | | | | | | | | | | | | | | | | | | |
| | 1 | | The Fund pays the fixed rate and receives the floating rate. |
| | 2 | | The Fund pays the floating rate and receives the fixed rate. |
|
| Transactions in Options Written for the Six Months Ended June 30, 2017 |
| | | | | | | | | | | | | | | | | | | | | | | | | | | | |
| | | Calls | |
| | | | |
| | | Notional (000) | | | | |
| | | | | | | | | | | | |
| | | Contracts | | | AUD | | | EUR | | | MXN | | | TRY | | | USD | | | Premiums
Received | |
| | | | |
Outstanding options, beginning of period | | | — | | | | — | | | | 2,579 | | | | — | | | | — | | | | 195 | | | $ | 20,136 | |
Options written | | | 91 | | | | 212 | | | | 5,168 | | | | 6,220 | | | | 183 | | | | 2,084 | | | | 97,851 | |
Options expired | | | (91 | ) | | | (212 | ) | | | (5,480 | ) | | | — | | | | — | | | | (1,184 | ) | | | (59,663 | ) |
Options closed | | | — | | | | — | | | | (2,205 | ) | | | (6,220 | ) | | | — | | | | (619 | ) | | | (48,957 | ) |
| | | | |
Outstanding options, end of period | | | — | | | | — | | | | 62 | | | | — | | | | 183 | | | | 476 | | | $ | 9,367 | |
| | | | |
See Notes to Financial Statements.
| | | | | | |
| | | BLACKROCK SERIES FUND, INC. | | JUNE 30, 2017 | | 55 |
| | | | |
| Schedule of Investments (continued) | | | BlackRock Balanced Capital Portfolio | |
| | | | | | | | | | | | | | | | | | | | | | | | |
| | | Puts | |
| | | | |
| | | | | | Notional (000) | | | | |
| | | | | | | | | | | | |
| | | Contracts | | | AUD | | | EUR | | | MXN | | | USD | | | Premiums
Received | |
| | | | |
Outstanding options, beginning of period | | | — | | | | — | | | | — | | | | — | | | | 610 | | | $ | 3,169 | |
Options written | | | 210 | | | | 198 | | | | 7,477 | | | | 2,227 | | | | 7,004 | | | | 106,954 | |
Options expired | | | — | | | | (106 | ) | | | (1,355 | ) | | | (1,160 | ) | | | (3,550 | ) | | | (13,797 | ) |
Options closed | | | — | | | | — | | | | (6,122 | ) | | | (1,067 | ) | | | (827 | ) | | | (78,396 | ) |
| | | | |
Outstanding options, end of period | | | 210 | | | | 92 | | | | — | | | | — | | | | 3,237 | | | $ | 17,930 | |
| | | | |
|
| Derivative Financial Instruments Categorized by Risk Exposure |
As of period end, the fair values of derivative financial instruments located in the Statements of Assets and Liabilities were as follows:
| | | | | | | | | | | | | | | | | | | | | | | | | | | | |
| Assets - Derivative Financial Instruments | | Commodity
Contracts | | Credit
Contracts | | | Equity Contracts | | | Foreign
Currency
Exchange Contracts | | | Interest
Rate Contracts | | | Other Contracts | | | Total | |
Futures contracts | | Net unrealized appreciation1 | | — | | | — | | | | $55,027 | | | | — | | | | $91,226 | | | | — | | | | $146,253 | |
Forward foreign currency exchange contracts | | Unrealized appreciation on forward foreign currency exchange contracts | | — | | | — | | | | — | | | | $289,296 | | | | — | | | | — | | | | 289,296 | |
Options purchased | | Investments at value — unaffiliated2 | | — | | | — | | | | — | | | | 15,260 | | | | 14,875 | | | | — | | | | 30,135 | |
Swaps - centrally cleared | | Net unrealized appreciation1 | | — | | | — | | | | — | | | | — | | | | 41,422 | | | | $4,315 | | | | 45,737 | |
Swaps - OTC | | Unrealized appreciation on OTC swaps; Swap premiums paid | | — | | | $ 76,025 | | | | — | | | | — | | | | 21,646 | | | | — | | | | 97,671 | |
| | | |
Total | | | | — | | | $ 76,025 | | | | $55,027 | | | | $304,556 | | | | $169,169 | | | | $4,315 | | | | $609,092 | |
| | | |
| | | | | | | | | | | | | | | | | | | | | | | | | | | | |
| Liabilities - Derivative Financial Instruments | | | | | | | | | | | | | | | | | | | | |
Futures contracts | | Net unrealized depreciation1 | | — | | | — | | | | $187,475 | | | | — | | | | $86,474 | | | | — | | | | $273,949 | |
Forward foreign currency exchange contracts | | Unrealized depreciation on forward foreign currency exchange contracts | | — | | | — | | | | — | | | | $119,059 | | | | — | | | | — | | | | 119,059 | |
Options written | | Options written, at value | | — | | | — | | | | — | | | | 5,525 | | | | 3,500 | | | | — | | | | 9,025 | |
Swaps - centrally cleared | | Net unrealized depreciation1 | | — | | | $ 218 | | | | — | | | | — | | | | 9,299 | | | | — | | | | 9,517 | |
Swaps - OTC | | Unrealized depreciation on OTC swaps; Swap premiums received | | — | | | 90,695 | | | | — | | | | — | | | | 41,409 | | | | — | | | | 132,104 | |
| | | |
Total | | | | — | | | $ 90,913 | | | | $187,475 | | | | $124,584 | | | | $140,682 | | | | — | | | | $543,654 | |
| | | |
| | 1 | | Includes cumulative appreciation (depreciation) on futures contracts and centrally cleared swaps, if any, as reported in the Schedule of Investments. Only current day’s variation margin is reported within the Statements of Assets and Liabilities. |
| | 2 | | Includes options purchased at value as reported in the Schedule of Investments. |
See Notes to Financial Statements.
| | | | | | |
| 56 | | BLACKROCK SERIES FUND, INC. | | JUNE 30, 2017 | | |
| | | | |
| Schedule of Investments (continued) | | | BlackRock Balanced Capital Portfolio | |
For the six months ended June 30, 2017, the effect of derivative financial instruments in the Statements of Operations were as follows:
| | | | | | | | | | | | | | | | | | | | | | | | | | |
| Net Realized Gain (Loss) from: | | Commodity
Contracts | | Credit
Contracts | | | Equity
Contracts | | | Foreign
Currency
Exchange
Contracts | | | Interest
Rate
Contracts | | | Other
Contracts | | | Total | |
Futures contracts | | — | | | — | | | | $510,316 | | | | $ 310,599 | | | | $591,864 | | | | — | | | | $1,412,779 | |
Foreign currency transactions | | — | | | — | | | | — | | | | (114,084 | ) | | | — | | | | — | | | | (114,084) | |
Options purchased1 | | — | | | — | | | | — | | | | (113,749 | ) | | | (79,800 | ) | | | — | | | | (193,549) | |
Options written | | — | | | — | | | | — | | | | 47,864 | | | | 22,946 | | | | — | | | | 70,810 | |
Swaps | | — | | | $3,925 | | | | — | | | | (38,968 | ) | | | 15,681 | | | | — | | | | (19,362) | |
| | | |
Total | | — | | | $3,925 | | | | $510,316 | | | | $ 91,662 | | | | $550,691 | | | | — | | | | $1,156,594 | |
| | | |
| | | | | | | | | | | | | | | | | | | | | | | | | | |
Net Change in Unrealized Appreciation (Depreciation) on: | | | | | | | | | | | | | | | | | | | | |
Futures contracts | | — | | | — | | | | $(115,978) | | | | $60,482 | | | | $84,672 | | | | — | | | | $ 29,176 | |
Foreign currency translations | | — | | | — | | | | — | | | | 101,407 | | | | — | | | | — | | | | 101,407 | |
Options purchased1 | | — | | | — | | | | — | | | | (22,328 | ) | | | (23,836 | ) | | | — | | | | (46,164) | |
Options written | | — | | | — | | | | — | | | | (2,983 | ) | | | 5,808 | | | | — | | | | 2,825 | |
Swaps | | — | | | $(100,610) | | | | — | | | | — | | | | 71,331 | | | | $12,839 | | | | (16,440) | |
| | | |
Total | | — | | | $(100,610) | | | | $(115,978) | | | | $136,578 | | | | $137,975 | | | | $12,839 | | | | $70,804 | |
| | | |
| | 1 | | Options purchased are included in the net realized gain (loss) from investments and the net change in unrealized appreciation (depreciation) on investments. |
| | |
| Average Quarterly Balances of Outstanding Derivative Financial Instruments | | |
| | | | |
Futures contracts: | | | | |
Average notional value of contracts - long | | $ | 46,382,688 | |
Average notional value of contracts - short | | $ | 34,305,243 | |
Forward foreign currency exchange contracts: | | | | |
Average amounts purchased - in USD | | $ | 11,002,656 | |
Average amounts sold - USD | | $ | 11,413,726 | |
Options: | | | | |
Average value of option contracts purchased | | $ | 53,774 | |
Average value of option contracts written | | $ | 9,230 | |
Credit default swaps: | | | | |
Average notional value - buy protection | | $ | 4,831,214 | |
Average notional value - sell protection | | $ | 1,612,500 | |
Interest rate swaps: | | | | |
Average notional value - pays fixed rate | | $ | 5,346,429 | |
Average notional value - receives fixed rate | | $ | 6,867,806 | |
Total return swaps: | | | | |
Average notional value | | $ | 2,771,021 | |
For more information about the Fund’s investment risks regarding derivative financial instruments, refer to the Notes to Financial Statements.
| | |
| Derivative Financial Instruments - Offsetting as of Period End | | |
The Fund’s derivative assets and liabilities (by type) were as follows:
| | | | | | | | |
| | | Assets | | | Liabilities | |
Derivative Financial Instruments: | | | | | | | | |
Futures contracts | | $ | 24,378 | | | | $ 199,585 | |
Forward foreign currency exchange contracts | | | 289,296 | | | | 119,059 | |
Options | | | 30,135 | 1 | | | 9,025 | |
Swaps - Centrally cleared | | | — | | | | 12,453 | |
Swaps - OTC2 | | | 97,671 | | | | 132,104 | |
| | | | |
Total derivative assets and liabilities in the Statements of Assets and Liabilities | | $ | 441,480 | | | | $472,226 | |
Derivatives not subject to a Master Netting Agreement or similar agreement (“MNA”) | | | (39,253 | ) | | | (215,538 | ) |
| | | | |
Total derivative assets and liabilities subject to an MNA | | $ | 402,227 | | | | $256,688 | |
| | | | |
| | 1 | | Includes options purchased at value which is included in Investments at value - unaffiliated in the Statements of Assets and Liabilities and reported in the Schedule of Investments. |
| | 2 | | Includes unrealized appreciation (depreciation) on OTC swaps and swap premiums paid/received in the Statements of Assets and Liabilities. |
See Notes to Financial Statements.
| | | | | | |
| | | BLACKROCK SERIES FUND, INC. | | JUNE 30, 2017 | | 57 |
| | | | |
| Schedule of Investments (continued) | | | BlackRock Balanced Capital Portfolio | |
The following tables present the Fund’s derivative assets and liabilities by counterparty net of amounts available for offset under an MNA and net of the related collateral received and pledged by the Fund.
| | | | | | | | | | | | | | | | | | | | | | | | | |
| Counterparty | | Derivative Assets
Subject to an MNA by
Counterparty | | Derivatives Available
for Offset1 | | Non-cash
Collateral
Received | | Cash
Collateral
Received | | Net Amount of
Derivative Assets2 |
Bank of America N.A. | | | $ | 15,678 | | | | $ | (10,898 | ) | | | | — | | | | | — | | | | $ | 4,780 | |
Barclays Bank PLC | | | | 4,525 | | | | | (4,525 | ) | | | | — | | | | | — | | | | | — | |
BNP Paribas S.A. | | | | 33,108 | | | | | (21,187 | ) | | | | — | | | | | — | | | | | 11,921 | |
Citibank N.A. | | | | 33,140 | | | | | (13,874 | ) | | | | — | | | | | — | | | | | 19,266 | |
Credit Suisse International | | | | 12,310 | | | | | (12,310 | ) | | | | — | | | | | — | | | | | — | |
Deutsche Bank AG | | | | 57,634 | | | | | (51,945 | ) | | | | — | | | | | — | | | | | 5,689 | |
Goldman Sachs International | | | | 184,507 | | | | | (35,434 | ) | | | | — | | | | | — | | | | | 149,073 | |
HSBC Bank PLC | | | | 8,532 | | | | | (1,652 | ) | | | | — | | | | | — | | | | | 6,880 | |
J.P. Morgan Securities LLC | | | | 6,981 | | | | | (539 | ) | | | | — | | | | | — | | | | | 6,442 | |
JPMorgan Chase Bank N.A. | | | | 24,513 | | | | | (24,513 | ) | | | | — | | | | | — | | | | | — | |
Morgan Stanley & Co. International PLC | | | | 11,878 | | | | | (11,878 | ) | | | | — | | | | | — | | | | | — | |
Royal Bank of Scotland PLC | | | | 8,749 | | | | | (8,749 | ) | | | | — | | | | | — | | | | | — | |
UBS AG | | | | 672 | | | | | (672 | ) | | | | — | | | | | — | | | | | — | |
Total | | | $ | 402,227 | | | | $ | (198,176 | ) | | | | — | | | | | — | | | | $ | 204,051 | |
| | | | | | | | | | | | | | | | | | | | | | | | | |
| Counterparty | | Derivative Liabilities
Subject to an MNA by
Counterparty | | Derivatives Available
for Offset1 | | Non-cash
Collateral
Pledged | | Cash
Collateral
Pledged | | Net Amount of
Derivative Liabilities3 |
Bank of America N.A. | | | $ | 10,898 | | | | $ | (10,898 | ) | | | | — | | | | | — | | | | | — | |
Barclays Bank PLC | | | | 42,335 | | | | | (4,525 | ) | | | | — | | | | | — | | | | $ | 37,810 | |
BNP Paribas S.A. | | | | 21,187 | | | | | (21,187 | ) | | | | — | | | | | — | | | | | — | |
Citibank N.A. | | | | 13,874 | | | | | (13,874 | ) | | | | — | | | | | — | | | | | — | |
Credit Suisse International | | | | 15,313 | | | | | (12,310 | ) | | | | — | | | | | — | | | | | 3,003 | |
Deutsche Bank AG | | | | 51,945 | | | | | (51,945 | ) | | | | — | | | | | — | | | | | — | |
Goldman Sachs International | | | | 35,434 | | | | | (35,434 | ) | | | | — | | | | | — | | | | | — | |
HSBC Bank PLC | | | | 1,652 | | | | | (1,652 | ) | | | | — | | | | | — | | | | | — | |
J.P. Morgan Securities LLC | | | | 539 | | | | | (539 | ) | | | | — | | | | | — | | | | | — | |
JPMorgan Chase Bank N.A. | | | | 26,751 | | | | | (24,513 | ) | | | | — | | | | | — | | | | | 2,238 | |
Morgan Stanley & Co. International PLC | | | | 18,149 | | | | | (11,878 | ) | | | | — | | | | | — | | | | | 6,271 | |
Royal Bank of Scotland PLC | | | | 9,997 | | | | | (8,749 | ) | | | | — | | | | | — | | | | | 1,248 | |
Standard Chartered Bank | | | | 169 | | | | | — | | | | | — | | | | | — | | | | | 169 | |
UBS AG | | | | 8,445 | | | | | (672 | ) | | | | — | | | | | — | | | | | 7,773 | |
Total | | | $ | 256,688 | | | | $ | (198,176 | ) | | | | — | | | | | — | | | | $ | 58,512 | |
| | 1 | | The amount of derivatives available for offset is limited to the amount of assets and/or liabilities that are subject to an MNA. |
| | 2 | | Net amount represents the net amount receivable from the counterparty in the event of default. |
| | 3 | | Net amount represents the net amount payable due to the counterparty in the event of default. |
See Notes to Financial Statements.
| | | | | | |
| 58 | | BLACKROCK SERIES FUND, INC. | | JUNE 30, 2017 | | |
| | | | |
| Schedule of Investments (continued) | | | BlackRock Balanced Capital Portfolio | |
|
| Fair Value Hierarchy as of Period End |
Various inputs are used in determining the fair value of investments and derivative financial instruments. For information about the Fund’s policy regarding valuation of investments and derivative financial instruments, refer to the Notes to Financial Statements.
The following tables summarize the Fund’s investments and derivative financial instruments in the disclosure hierarchy:
| | | | | | | | | | | | | | | | |
| | | Level 1 | | | Level 2 | | | Level 3 | | | Total | |
Assets: | | | | | | | | | | | | | | | | |
Investments: | | | | | | | | | | | | | | | | |
Long-Term Investments: | | | | | | | | | | | | | | | | |
Asset-Backed Securities | | | — | | | $ | 16,374,999 | | | $ | 3,130,123 | | | $ | 19,505,122 | |
Common Stocks | | $ | 301,313,965 | | | | — | | | | — | | | | 301,313,965 | |
Corporate Bonds | | | — | | | | 44,513,661 | | | | — | | | | 44,513,661 | |
Foreign Agency Obligations | | | — | | | | 627,918 | | | | — | | | | 627,918 | |
Foreign Government Obligations | | | — | | | | 7,945,704 | | | | — | | | | 7,945,704 | |
Investment Companies | | | 19,380,834 | | | | — | | | | — | | | | 19,380,834 | |
Non-Agency Mortgage-Backed Securities | | | — | | | | 8,729,147 | | | | 1,471,744 | | | | 10,200,891 | |
Other Interests | | | — | | | | — | | | | — | | | | — | |
Preferred Securities | | | 435,763 | | | | 561,327 | | | | — | | | | 997,090 | |
Taxable Municipal Bonds | | | — | | | | 8,660,542 | | | | — | | | | 8,660,542 | |
U.S. Government Sponsored Agency Securities | | | — | | | | 74,844,701 | | | | 56,674 | | | | 74,901,375 | |
U.S. Treasury Obligations | | | — | | | | 25,151,256 | | | | — | | | | 25,151,256 | |
Short Term Investments: | | | | | | | | | | | | | | | | |
Borrowed Bond Agreements | | | — | | | | 1,107,942 | | | | — | | | | 1,107,942 | |
Money Market Funds | | | 27,038,565 | | | | — | | | | — | | | | 27,038,565 | |
Options Purchased: | | | | | | | | | | | | | | | | |
Foreign currency exchange contracts | | | — | | | | 15,260 | | | | — | | | | 15,260 | |
Interest rate contracts | | | 14,875 | | | | — | | | | — | | | | 14,875 | |
Liabilities: | | | | | | | | | | | | | | | | |
TBA Sale Commitments | | | — | | | | (30,496,501 | ) | | | — | | | | (30,496,501 | ) |
Borrowed Bonds | | | — | | | | (1,098,961 | ) | | | — | | | | (1,098,961 | ) |
| | | | |
Subtotal | | $ | 348,184,002 | | | $ | 156,936,995 | | | $ | 4,658,541 | | | $ | 509,779,538 | |
| | | | |
Investments Valued at NAV1 | | | | | | | | | | | | | | | 10,285,939 | |
| | | | | | | | | | | | | | | | |
Total Investments | | | | | | | | | | | | | | $ | 520,065,477 | |
| | | | | | | | | | | | | | | | |
| 1 | | As of June 30, 2017, certain investments of the Fund were fair valued using NAV per share as no quoted market value is available and therefore have been excluded from the fair value hierarchy. |
| | | | | | | | | | | | | | | | |
Derivative Financial Instruments1 | | | | | | | | | | | | | | | | |
Assets: | | | | | | | | | | | | | | | | |
Credit contracts | | | — | | | $ | 39,445 | | | | — | | | $ | 39,445 | |
Equity contracts | | $ | 44,842 | | | | — | | | | — | | | | 44,842 | |
Foreign Currency Exchange Contracts | | | — | | | | 289,296 | | | | — | | | | 289,296 | |
Interest rate contracts | | | 64,684 | | | | 62,868 | | | | — | | | | 127,552 | |
Other contracts | | | — | | | | 4,315 | | | | — | | | | 4,315 | |
Liabilities: | | | | | | | | | | | | | | | | |
Credit contracts | | | — | | | | (24,218 | ) | | | — | | | | (24,218 | ) |
Equity contracts | | | (177,290 | ) | | | — | | | | — | | | | (177,290 | ) |
Foreign Currency Exchange Contracts | | | — | | | | (124,584 | ) | | | — | | | | (124,584 | ) |
Interest rate contracts | | | (63,432 | ) | | | (50,668 | ) | | | — | | | | (114,100 | ) |
Other contracts | | | — | | | | — | | | | — | | | | — | |
| | | | |
Total | | $ | (131,196 | ) | | $ | 196,454 | | | | — | | | $ | 65,258 | |
| | | | |
| | 1 | | Derivative financial instruments are swaps, futures contracts, forward foreign currency exchange contracts and options written. Swaps, futures contracts and forward foreign currency exchange contracts are valued at the unrealized appreciation (depreciation) on the instrument and options written are shown at value. |
The Fund may hold liabilities in which the fair value approximates the carrying amount or face value, including accrued interest, for financial statement purposes. As of period end, reverse repurchase agreements of $10,017,553 are categorized as level 2 within the disclosure hierarchy.
During the six months ended June 30, 2017, there were no transfers between Level 1 and Level 2.
See Notes to Financial Statements.
| | | | | | |
| | | BLACKROCK SERIES FUND, INC. | | JUNE 30, 2017 | | 59 |
| | | | |
| Schedule of Investments (concluded) | | | BlackRock Balanced Capital Portfolio | |
A reconciliation of Level 3 investments is presented when the Fund had a significant amount of Level 3 investments at the beginning and/or end of the year in relation to net assets. The following table is a reconciliation of Level 3 investments for which significant unobservable inputs were used in determining fair value:
| | | | | | | | | | | | | | | | | | | | |
| | | Asset-
Backed
Securities | | | Non-Agency
Mortgage-Backed
Securities | | | Options
Purchased | | | US Government
Sponsored
Agency
Securities | | | Total | |
Assets: | | | | | | | | | | | | | | | | | | | | |
Opening Balance, as of December 31, 2016 | | | $4,592,036 | | | | $1,252,877 | | | | — | | | | — | | | | $5,844,913 | |
Transfers into Level 3 | | | 84,514 | | | | 392,791 | | | | — | | | | — | | | | 477,305 | |
Transfers out of Level 3 | | | (3,144,988 | ) | | | — | | | | — | | | | — | | | | (3,144,988 | ) |
Accrued discounts/premiums | | | 1,134 | | | | 3,285 | | | | — | | | | — | | | | 4,419 | |
Net realized gain (loss) | | | 7,577 | | | | 10,277 | | | | — | | | | $75 | | | | 17,929 | |
Net change in unrealized appreciation (depreciation)1,2 | | | (18,511 | ) | | | (5,911 | ) | | | $(2,386) | | | | (168 | ) | | | (26,976 | ) |
Purchases | | | 2,449,608 | | | | 572,836 | | | | 2,386 | | | | 87,139 | | | | 3,111,969 | |
Sales | | | (841,247 | ) | | | (754,411 | ) | | | — | | | | (30,372 | ) | | | (1,626,030 | ) |
| | | | |
Closing Balance, as of June 30, 2017 | | | $3,130,123 | | | | $1,471,744 | | | | — | | | | $56,674 | | | | $4,658,541 | |
| | | | |
Net change in unrealized appreciation (depreciation) on investments still held at June 30, 20172 | | | $(10,344 | ) | | | $(2,314 | ) | | | — | | | | $(168 | ) | | | $(12,826 | ) |
| | | | |
| | 1 | | Included in the related change in unrealized appreciation (depreciation) in the Statements of Operations. |
| | 2 | | Any difference between net change in unrealized appreciation (depreciation) and net change in unrealized appreciation (depreciation) on investments still held at June 30, 2017 is generally due to investments no longer held or categorized as Level 3 at year end. |
The Fund’s investments that are categorized as Level 3 were valued utilizing third party pricing information without adjustment. Such valuations are based on unobservable inputs. A significant change in third party information could result in a significantly lower or higher value of such Level 3 investments.
See Notes to Financial Statements.
| | | | | | |
| 60 | | BLACKROCK SERIES FUND, INC. | | JUNE 30, 2017 | | |
| | | | |
| Schedule of Investments June 30, 2017 (Unaudited) | | | BlackRock Capital Appreciation Portfolio | |
| | | (Percentages shown are based on Net Assets) | |
| | | | | | | | |
| Common Stocks | | Shares | | | Value | |
Aerospace & Defense — 1.2% | | | | | | | | |
TransDigm Group, Inc. (a) | | | 6,787 | | | $ | 1,824,821 | |
Banks — 5.3% | | | | | | | | |
Bank of America Corp. | | | 147,697 | | | | 3,583,129 | |
First Republic Bank | | | 22,407 | | | | 2,242,941 | |
SunTrust Banks, Inc. | | | 14,392 | | | | 816,314 | |
SVB Financial Group (b) | | | 4,223 | | | | 742,361 | |
Wells Fargo & Co. | | | 17,329 | | | | 960,200 | |
| | | | | | | | |
| | | | | | | | 8,344,945 | |
Beverages — 3.4% | | | | | | | | |
Constellation Brands, Inc., Class A | | | 23,104 | | | | 4,475,938 | |
Dr. Pepper Snapple Group, Inc. | | | 10,169 | | | | 926,498 | |
| | | | | | | | |
| | | | | | | | 5,402,436 | |
Biotechnology — 7.7% | | | | | | | | |
Alexion Pharmaceuticals, Inc. (b) | | | 38,371 | | | | 4,668,600 | |
Biogen, Inc. (b) | | | 9,787 | | | | 2,655,800 | |
Celgene Corp. (b) | | | 24,245 | | | | 3,148,698 | |
Regeneron Pharmaceuticals, Inc. (b) | | | 1,698 | | | | 833,956 | |
Vertex Pharmaceuticals, Inc. (b) | | | 6,115 | | | | 788,040 | |
| | | | | | | | |
| | | | | | | | 12,095,094 | |
Capital Markets — 0.4% | | | | | | | | |
S&P Global, Inc. | | | 4,281 | | | | 624,983 | |
Chemicals — 2.3% | | | | | | | | |
Monsanto Co. | | | 12,928 | | | | 1,530,158 | |
Sherwin-Williams Co. | | | 6,040 | | | | 2,119,798 | |
| | | | | | | | |
| | | | | | | | 3,649,956 | |
Diversified Financial Services — 1.4% | | | | | | | | |
Berkshire Hathaway, Inc., Class B (b) | | | 12,798 | | | | 2,167,597 | |
Diversified Telecommunication Services — 0.4% | | | | | | | | |
Zayo Group Holdings, Inc. (b) | | | 22,606 | | | | 698,525 | |
Electrical Equipment — 1.9% | | | | | | | | |
Acuity Brands, Inc. (a) | | | 14,675 | | | | 2,983,134 | |
Equity Real Estate Investment Trusts (REITs) — 2.1% | | | | | | | | |
Equinix, Inc. | | | 4,499 | | | | 1,930,791 | |
SBA Communications Corp. (b) | | | 9,859 | | | | 1,329,979 | |
| | | | | | | | |
| | | | | | | | 3,260,770 | |
Health Care Equipment & Supplies — 3.0% | | | | | | | | |
Becton Dickinson and Co. | | | 11,169 | | | | 2,179,184 | |
Boston Scientific Corp. (b) | | | 92,229 | | | | 2,556,588 | |
| | | | | | | | |
| | | | | | | | 4,735,772 | |
Health Care Providers & Services — 4.6% | | | | | | | | |
UnitedHealth Group, Inc. | | | 39,096 | | | | 7,249,180 | |
Hotels, Restaurants & Leisure — 1.2% | | | | | | | | |
Domino’s Pizza, Inc. | | | 8,864 | | | | 1,875,002 | |
Industrial Conglomerates — 1.0% | | | | | | | | |
Roper Technologies, Inc. | | | 6,932 | | | | 1,604,966 | |
Internet & Direct Marketing Retail — 13.4% | | | | | | | | |
Amazon.com, Inc. (b) | | | 12,311 | | | | 11,917,048 | |
Netflix, Inc. (b) | | | 27,578 | | | | 4,120,429 | |
Priceline Group, Inc. (b) | | | 2,650 | | | | 4,956,878 | |
| | | | | | | | |
| | | | | | | | 20,994,355 | |
Internet Software & Services — 14.9% | | | | | | | | |
Alibaba Group Holding Ltd. - ADR (a)(b) | | | 16,479 | | | | 2,321,891 | |
Alphabet, Inc., Class A (b) | | | 11,542 | | | | 10,730,367 | |
Facebook, Inc., Class A (b) | | | 32,560 | | | | 4,915,909 | |
Tencent Holdings Ltd. | | | 149,500 | | | | 5,363,307 | |
| | | | | | | | |
| | | | | | | | 23,331,474 | |
| | | | | | | | |
| Common Stocks | | Shares | | | Value | |
IT Services — 6.6% | | | | | | | | |
Cognizant Technology Solutions Corp., Class A | | | 24,941 | | | $ | 1,656,082 | |
Global Payments, Inc. | | | 23,596 | | | | 2,131,191 | |
PayPal Holdings, Inc. (b) | | | 16,559 | | | | 888,722 | |
Visa, Inc., Class A | | | 59,702 | | | | 5,598,854 | |
| | | | | | | | |
| | | | | | | | 10,274,849 | |
Multiline Retail — 0.9% | | | | | | | | |
Dollar Tree, Inc. (b) | | | 19,323 | | | | 1,351,064 | |
Oil, Gas & Consumable Fuels — 0.8% | | | | | | | | |
Pioneer Natural Resources Co. | | | 7,885 | | | | 1,258,288 | |
Pharmaceuticals — 0.9% | | | | | | | | |
Zoetis, Inc. | | | 22,468 | | | | 1,401,554 | |
Professional Services — 2.0% | | | | | | | | |
Equifax, Inc. | | | 22,553 | | | | 3,099,233 | |
Semiconductors & Semiconductor Equipment — 5.6% | | | | | |
Advanced Micro Devices, Inc. (a)(b) | | | 89,016 | | | | 1,110,920 | |
ASML Holding NV | | | 18,361 | | | | 2,392,622 | |
Broadcom Ltd. | | | 12,848 | | | | 2,994,226 | |
NVIDIA Corp. | | | 9,293 | | | | 1,343,396 | |
Teradyne, Inc. | | | 30,503 | | | | 916,005 | |
| | | | | | | | |
| | | | | | | | 8,757,169 | |
Software — 11.8% | | | | | | | | |
Activision Blizzard, Inc. | | | 31,132 | | | | 1,792,269 | |
Adobe Systems, Inc. (b) | | | 18,189 | | | | 2,572,652 | |
Autodesk, Inc. (b) | | | 31,500 | | | | 3,175,830 | |
Microsoft Corp. | | | 126,159 | | | | 8,696,140 | |
salesforce.com, Inc. (b) | | | 8,487 | | | | 734,974 | |
Snap, Inc., Class A (a)(b) | | | 53,398 | | | | 948,882 | |
Zendesk, Inc. (b) | | | 18,141 | | | | 503,957 | |
| | | | | | | | |
| | | | | | | | 18,424,704 | |
Specialty Retail — 3.1% | | | | | | | | |
Home Depot, Inc. | | | 21,034 | | | | 3,226,616 | |
Ulta Beauty, Inc. (b) | | | 5,415 | | | | 1,555,946 | |
| | | | | | | | |
| | | | | | | | 4,782,562 | |
Technology Hardware, Storage & Peripherals — 1.7% | | | | | |
Apple Inc. | | | 18,687 | | | | 2,691,302 | |
Textiles, Apparel & Luxury Goods — 1.5% | | | | | | | | |
NIKE, Inc., Class B | | | 41,031 | | | | 2,420,829 | |
Total Common Stocks — 99.1% | | | | | | | 155,304,564 | |
| | | | | | | | |
| Preferred Stocks | | | | | | |
Software — 1.0% | | | | | | | | |
Palantir Technologies, Inc., Series I (Acquired 2/11/14, cost $1,152,906), 0.00% (b)(c)(d) | | | 188,076 | | | | 1,506,489 | |
Total Preferred Stocks — 1.0% | | | | | | | 1,506,489 | |
Total Long-Term Investments (Cost — $121,415,086) — 100.1% | | | | | | | 156,811,053 | |
Short-Term Securities | | | | | | |
BlackRock Liquidity Funds, T-Fund, Institutional Class, 0.84% (e)(f) | | | 68,206 | | | | 68,206 | |
SL Liquidity Series, LLC, Money Market Series, 1.27% (e)(f)(g) | | | 8,688,130 | | | | 8,688,999 | |
Total Short-Term Securities (Cost — $8,757,900) — 5.6% | | | | | | | 8,757,205 | |
See Notes to Financial Statements.
| | | | | | |
| | | BLACKROCK SERIES FUND, INC. | | JUNE 30, 2017 | | 61 |
| | | | |
| Schedule of Investments (continued) | | | BlackRock Capital Appreciation Portfolio | |
| | | | |
| | | | | | | | |
| | | | | | Value | |
Total Investments (Cost — $ 130,172,986) — 105.7% | | | | | | $ | 165,568,258 | |
Liabilities in Excess of Other Assets — (5.7)% | | | | | | | (8,854,443 | ) |
| | | | | | | | |
Net Assets — 100.0% | | | | | | $ | 156,713,815 | |
| | | | | | | | |
|
| Notes to Schedule of Investments |
| (a) | Security, or a portion of the security, is on loan. |
| (b) | Non-income producing security. |
| (c) | Restricted security as to resale, excluding 144A securities. The Fund held restricted securities with a current value of $1,506,489, representing 1.0% of its net assets as of period end, and an original cost of $1,152,906. |
| (d) | Security is valued using significant unobservable inputs and is classified as Level 3 in the fair value hierarchy. |
| (e) | During the six months ended June 30, 2017, investments in issuers considered to be affiliates of the Fund for purposes of Section 2(a)(3) of the Investment Company Act of 1940, as amended, were as follows: |
| | | | | | | | | | | | | | | | | | | | | | | | | | | | |
| Affiliate | | Shares Held at
December 31, 2016 | | | Net Activity | | | Shares Held at
June 30, 2017 | | | Value at June 30,
2017 | | | Income | | | Net Realized Gain | | | Change in Unrealized Appreciation (Depreciation) | |
BlackRock Liquidity Funds, T-Fund, Institutional Class | | | 1,604,140 | | | | (1,535,934 | ) | | | 68,206 | | | | $ 68,206 | | | | $ 2,679 | | | | — | | | | — | |
SL Liquidity Series, LLC, Money Market Series | | | 588,197 | | | | 8,099,933 | | | | 8,688,130 | | | | 8,688,999 | | | | 32,727 | 1 | | | $148 | | | | $(636 | ) |
Total | | | | | | | | | | | | | | | $8,757,205 | | | | $35,406 | | | | $148 | | | | $(636 | ) |
| | | | | | | | | | | | | | | | |
| | 1 | | Represents securities lending income earned from the reinvestment of cash collateral from loaned securities, net of fees and collateral investment expenses, and other payments to and from borrowers of securities. |
| (f) | Current yield as of period end. |
| (g) | Security was purchased with the cash collateral from loaned securities. |
| • | For Fund compliance purposes, the Fund’s industry classifications refer to one or more of the industry sub-classifications used by one or more widely recognized market indexes or ratings group indexes, and/or as defined by the investment adviser. These definitions may not apply for purposes of this report, which may combine such industry sub-classifications for reporting ease. |
|
| Fair Value Hierarchy as of Period End |
Various inputs are used in determining the fair value of investments. For information about the Fund’s policy regarding valuation of investments, refer to the Notes to Financial Statements.
The following table summarizes the Fund’s investments categorized in the disclosure hierarchy:
| | | | | | | | | | | | | | | | | | | | |
| | | Level 1 | | Level 2 | | Level 3 | | Total |
Assets: | | | | | | | | | | | | | | | | | | | | |
Investments: | | | | | | | | | | | | | | | | | | | | |
Long-Term Investments: | | | | | | | | | | | | | | | | | | | | |
Common Stocks: | | | | | | | | | | | | | | | | | | | | |
Aerospace & Defense | | | $ | 1,824,821 | | | | | — | | | | | — | | | | $ | 1,824,821 | |
Banks | | | | 8,344,945 | | | | | — | | | | | — | | | | | 8,344,945 | |
Beverages | | | | 5,402,436 | | | | | — | | | | | — | | | | | 5,402,436 | |
Biotechnology | | | | 12,095,094 | | | | | — | | | | | — | | | | | 12,095,094 | |
Capital Markets | | | | 624,983 | | | | | — | | | | | — | | | | | 624,983 | |
Chemicals | | | | 3,649,956 | | | | | — | | | | | — | | | | | 3,649,956 | |
Diversified Financial Services | | | | 2,167,597 | | | | | — | | | | | — | | | | | 2,167,597 | |
Diversified Telecommunication Services | | | | 698,525 | | | | | — | | | | | — | | | | | 698,525 | |
Electrical Equipment | | | | 2,983,134 | | | | | — | | | | | — | | | | | 2,983,134 | |
Equity Real Estate Investment Trusts (REITs) | | | | 3,260,770 | | | | | — | | | | | — | | | | | 3,260,770 | |
Health Care Equipment & Supplies | | | | 4,735,772 | | | | | — | | | | | — | | | | | 4,735,772 | |
Health Care Providers & Services | | | | 7,249,180 | | | | | — | | | | | — | | | | | 7,249,180 | |
Hotels, Restaurants & Leisure | | | | 1,875,002 | | | | | — | | | | | — | | | | | 1,875,002 | |
Industrial Conglomerates | | | | 1,604,966 | | | | | — | | | | | — | | | | | 1,604,966 | |
Internet & Direct Marketing Retail | | | | 20,994,355 | | | | | — | | | | | — | | | | | 20,994,355 | |
Internet Software & Services | | | | 17,968,167 | | | | $ | 5,363,307 | | | | | — | | | | | 23,331,474 | |
IT Services | | | | 10,274,849 | | | | | — | | | | | — | | | | | 10,274,849 | |
Multiline Retail | | | | 1,351,064 | | | | | — | | | | | — | | | | | 1,351,064 | |
Oil, Gas & Consumable Fuels | | | | 1,258,288 | | | | | — | | | | | — | | | | | 1,258,288 | |
Pharmaceuticals | | | | 1,401,554 | | | | | — | | | | | — | | | | | 1,401,554 | |
See Notes to Financial Statements.
| | | | | | |
| 62 | | BLACKROCK SERIES FUND, INC. | | JUNE 30, 2017 | | |
| | | | |
| Schedule of Investments (concluded) | | | BlackRock Capital Appreciation Portfolio | |
| | | | | | | | | | | | | | | | | | | | |
| | | Level 1 | | Level 2 | | Level 3 | | Total |
Professional Services | | | $ | 3,099,233 | | | | | — | | | | | — | | | | $ | 3,099,233 | |
Semiconductors & Semiconductor Equipment | | | | 8,757,169 | | | | | — | | | | | — | | | | | 8,757,169 | |
Software | | | | 18,424,704 | | | | | — | | | | | — | | | | | 18,424,704 | |
Specialty Retail | | | | 4,782,562 | | | | | — | | | | | — | | | | | 4,782,562 | |
Technology Hardware, Storage & Peripherals | | | | 2,691,302 | | | | | — | | | | | — | | | | | 2,691,302 | |
Textiles, Apparel & Luxury Goods | | | | 2,420,829 | | | | | — | | | | | — | | | | | 2,420,829 | |
Preferred Stock: | | | | | | | | | | | | | | | | | | | | |
Software | | | | — | | | | | — | | | | $ | 1,506,489 | | | | | 1,506,489 | |
Short-Term Securities | | | | 68,206 | | | | | — | | | | | — | | | | | 68,206 | |
| | | | | |
Subtotal | | | $ | 150,009,463 | | | | $ | 5,363,307 | | | | $ | 1,506,489 | | | | $ | 156,879,259 | |
| | | | | |
Investments Valued at NAV1 | | | | | | | | | | | | | | | | | | | 8,688,999 | |
| | | | | | | | | | | | | | | | | | | | |
Total Investments | | | | | | | | | | | | | | | | | | $ | 165,568,258 | |
| | | | | | | | | | | | | | | | | | | | |
| 1 | As of June 30, 2017, certain investments of the Fund were fair valued using NAV per share as no quoted market value is available and therefore have been excluded from the fair value hierarchy. |
During the six months ended June 30, 2017, there were no transfers between Level 1 and Level 2.
A reconciliation of Level 3 investments is presented when the Fund had a significant amount of Level 3 investments at the beginning and/or end of the period in relation to net assets. The following table is a reconciliation of Level 3 investments for which significant unobservable inputs were used in determining fair value:
| | | | |
| | | Preferred Stocks | |
Assets: | | | | |
Opening Balance, as of December 31, 2016 | | $ | 1,521,535 | |
Transfers into Level 3 | | | — | |
Transfers out of Level 3 | | | — | |
Accrued discounts/premiums | | | — | |
Net realized gain (loss) | | | — | |
Net change in unrealized appreciation/depreciation1,2 | | | (15,046 | ) |
Purchases | | | — | |
Sales | | | — | |
Closing Balance, as of June 30, 2017 | | $ | 1,506,489 | |
| | | | |
Net change in unrealized appreciation (depreciation) on investments still held at June 30, 20172 | | $ | (15,046 | ) |
| | | �� | |
| | 1 | | Included in the related net change in unrealized appreciation (depreciation) in the Statements of Operations. |
| | 2 | | Any difference between net change in unrealized appreciation (depreciation) and net change in unrealized appreciation (depreciation) on investments still held at June 30, 2017 is generally due to investments no longer held or categorized as Level 3 at period end. |
The following table summarizes the valuation approaches used and unobservable inputs utilized by the BlackRock Global Valuation Methodologies Committee (the “Global Valuation Committee”) to determine the value of certain of the Fund’s Level 3 investments as of period end.
| | | | | | | | | | | | | | |
| | | Value | | | Valuation Approach | | | Unobservable Inputs | | Range of
Unobservable Inputs
Utilized | |
Preferred Stocks | | $ | 1,506,489 | | | | Market | | | Revenue Multiple1 | | | 10.75x | |
| | | | | | | | | | | Revenue Growth Rate1 | | | 131.00% | |
| | 1 | | Increase in unobservable input may result in a significant increase to value, while a decrease in the unobservable input may result in a significant decrease to value. |
See Notes to Financial Statements.
| | | | | | |
| | | BLACKROCK SERIES FUND, INC. | | JUNE 30, 2017 | | 63 |
| | | | |
| Consolidated Schedule of Investments June 30, 2017 (Unaudited) | | | BlackRock Global Allocation Portfolio | |
| | | (Percentages shown are based on Net Assets) | |
| | | | | | | | |
| Common Stocks | | Shares | | | Value | |
Belgium — 0.5% | | | | | | | | |
Anheuser-Busch InBev SA | | | 7,636 | | | $ | 843,387 | |
Umicore SA | | | 3,802 | | | | 264,472 | |
| | | | | | | | |
| | | | | | | | 1,107,859 | |
Brazil — 0.1% | | | | | | | | |
Azul SA — ADR (a)(b) | | | 8,413 | | | | 177,346 | |
Canada — 0.3% | | | | | | | | |
Encana Corp. | | | 66,438 | | | | 584,654 | |
Platinum Group Metals Ltd. (a)(b) | | | 39,828 | | | | 33,280 | |
Platinum Group Metals Ltd. (a) | | | 8,522 | | | | 7,163 | |
| | | | | | | | |
| | | | | | | | 625,097 | |
China — 0.6% | | | | | | | | |
Alibaba Group Holding Ltd. — ADR (a)(b) | | | 6,027 | | | | 849,204 | |
Brilliance China Automotive Holdings Ltd. | | | 76,000 | | | | 138,420 | |
China Mobile Ltd. — ADR | | | 1,209 | | | | 64,186 | |
CLP Holdings Ltd. | | | 7,000 | | | | 74,020 | |
Want Want China Holdings Ltd. | | | 57,000 | | | | 38,461 | |
| | | | | | | | |
| | | | | | | | 1,164,291 | |
Czech Republic — 0.0% | | | | | | | | |
CEZ AS | | | 3,395 | | | | 59,093 | |
Finland — 0.3% | | | | | | | | |
Nokia OYJ | | | 115,627 | | | | 708,995 | |
France — 2.8% | | | | | | | | |
Accor SA | | | 6,717 | | | | 315,090 | |
AXA SA | | | 12,748 | | | | 349,084 | |
Cie Generale des Etablissements Michelin | | | 2,273 | | | | 302,523 | |
Compagnie de Saint-Gobain | | | 5,438 | | | | 290,417 | |
Danone SA | | | 18,489 | | | | 1,387,743 | |
Dassault Aviation SA | | | 241 | | | | 336,799 | |
Safran SA | | | 8,386 | | | | 769,051 | |
Sanofi | | | 5,176 | | | | 495,965 | |
Sodexo SA | | | 2,274 | | | | 293,898 | |
TOTAL SA | | | 9,007 | | | | 447,172 | |
TOTAL SA — ADR (b) | | | 345 | | | | 17,109 | |
Ubisoft Entertainment SA (a) | | | 4,923 | | | | 279,485 | |
Unibail-Rodamco SE | | | 1,356 | | | | 341,681 | |
Vinci SA | | | 3,465 | | | | 295,570 | |
| | | | | | | | |
| | | | | | | | 5,921,587 | |
Germany — 1.7% | | | | | | | | |
Bayer AG, Registered Shares | | | 7,123 | | | | 923,215 | |
Deutsche Telekom AG, Registered Shares | | | 27,595 | | | | 497,400 | |
Evonik Industries AG | | | 6,764 | | | | 216,487 | |
GEA Group AG | | | 5,554 | | | | 228,054 | |
Innogy SE (c) | | | 27,561 | | | | 1,084,706 | |
Siemens AG, Registered Shares | | | 2,007 | | | | 276,071 | |
Vonovia SE | | | 7,872 | | | | 313,197 | |
| | | | | | | | |
| | | | | | | | 3,539,130 | |
Hong Kong — 0.6% | | | | | | | | |
CK Infrastructure Holdings Ltd. | | | 7,000 | | | | 58,802 | |
Hang Lung Properties Ltd. | | | 14,000 | | | | 34,988 | |
HKT Trust & HKT Ltd. (d) | | | 42,000 | | | | 55,086 | |
Jardine Matheson Holdings Ltd. | | | 900 | | | | 57,776 | |
Link REIT | | | 8,500 | | | | 64,660 | |
Power Assets Holdings Ltd. | | | 6,000 | | | | 52,962 | |
Sino Land Co. Ltd. | | | 26,000 | | | | 42,598 | |
Sun Hung Kai Properties Ltd. | | | 56,666 | | | | 832,433 | |
Swire Pacific Ltd., Class A | | | 5,500 | | | | 53,689 | |
Wharf Holdings Ltd. | | | 9,000 | | | | 74,472 | |
| | | | | | | | |
| | | | | | | | 1,327,466 | |
| | | | | | | | |
| Common Stocks | | Shares | | | Value | |
India — 1.0% | | | | | | | | |
Coal India Ltd. | | | 59,538 | | | $ | 224,865 | |
Hero MotoCorp Ltd. | | | 1,356 | | | | 77,589 | |
Infosys Ltd. | | | 31,350 | | | | 453,784 | |
Kotak Mahindra Bank Ltd. | | | 17,430 | | | | 264,979 | |
Maruti Suzuki India Ltd. | | | 1,793 | | | | 200,060 | |
Oil & Natural Gas Corp. Ltd. (a) | | | 17,121 | | | | 41,641 | |
Reliance Industries Ltd. (a) | | | 33,994 | | | | 725,265 | |
State Bank of India | | | 23,160 | | | | 98,050 | |
Yes Bank Ltd. (e) | | | 5,321 | | | | 120,476 | |
| | | | | | | | |
| | | | | | | | 2,206,709 | |
Indonesia — 0.1% | | | | | | | | |
Siloam International Hospitals Tbk PT (a) | | | 231,486 | | | | 196,270 | |
Ireland — 0.0% | | | | | | | | |
Medtronic PLC | | | 973 | | | | 86,354 | |
Italy — 0.9% | | | | | | | | |
Ei Towers SpA | | | 6,624 | | | | 383,198 | |
Enel SpA | | | 91,030 | | | | 488,240 | |
Luxottica Group SpA | | | 5,642 | | | | 328,410 | |
RAI Way SpA (c) | | | 34,108 | | | | 170,084 | |
Snam SpA | | | 6,954 | | | | 30,348 | |
Telecom Italia SpA (a) | | | 552,467 | | | | 511,128 | |
Telecom Italia SpA, Non-Convertible Savings Shares | | | 15,437 | | | | 11,424 | |
| | | | | | | | |
| | | | | | | | 1,922,832 | |
Japan — 8.4% | | | | | | | | |
Aisin Seiki Co. Ltd. | | | 5,020 | | | | 258,061 | |
Ajinomoto Co., Inc. | | | 19,400 | | | | 419,509 | |
Alfresa Holdings Corp. | | | 2,300 | | | | 44,466 | |
Alpine Electronics, Inc. | | | 1,500 | | | | 22,505 | |
Asahi Group Holdings Ltd. | | | 7,400 | | | | 278,686 | |
Asahi Kasei Corp. | | | 27,900 | | | | 300,994 | |
Astellas Pharma, Inc. | | | 2,650 | | | | 32,480 | |
Bridgestone Corp. | | | 10,800 | | | | 466,901 | |
Canon Marketing Japan, Inc. | | | 1,900 | | | | 43,313 | |
Chiyoda Corp. | | | 6,000 | | | | 35,441 | |
Chubu Electric Power Co., Inc. | | | 6,700 | | | | 89,101 | |
COMSYS Holdings Corp. | | | 2,300 | | | | 47,489 | |
Daikin Industries Ltd. | | | 2,600 | | | | 266,739 | |
Denso Corp. | | | 12,030 | | | | 510,531 | |
East Japan Railway Co. | | | 9,327 | | | | 893,491 | |
Exedy Corp. | | | 1,300 | | | | 36,754 | |
FUJIFILM Holdings Corp. | | | 1,400 | | | | 50,480 | |
Futaba Industrial Co. Ltd. | | | 4,070 | | | | 36,927 | |
GS Yuasa Corp. | | | 20,000 | | | | 87,293 | |
Hino Motors Ltd. | | | 4,000 | | | | 44,662 | |
Hirose Electric Co. Ltd. | | | 400 | | | | 57,242 | |
Hitachi Chemical Co. Ltd. | | | 8,400 | | | | 251,837 | |
Hoya Corp. | | | 12,001 | | | | 624,789 | |
Inpex Corp. | | | 39,699 | | | | 383,312 | |
Japan Airlines Co. Ltd. | | | 22,100 | | | | 684,563 | |
Japan Tobacco, Inc. | | | 1,600 | | | | 56,237 | |
Kamigumi Co. Ltd. | | | 4,000 | | | | 42,047 | |
KDDI Corp. | | | 7,200 | | | | 190,423 | |
Keyence Corp. | | | 200 | | | | 88,046 | |
Kinden Corp. | | | 6,900 | | | | 111,403 | |
Koito Manufacturing Co. Ltd. | | | 2,700 | | | | 139,618 | |
Komatsu Ltd. | | | 15,200 | | | | 390,145 | |
Kubota Corp. | | | 15,880 | | | | 268,416 | |
Kuraray Co. Ltd. | | | 2,900 | | | | 52,806 | |
Kurita Water Industries Ltd. | | | 1,600 | | | | 43,767 | |
Kyocera Corp. | | | 1,100 | | | | 63,933 | |
Kyushu Railway Co. | | | 5,000 | | | | 162,171 | |
See Notes to Financial Statements.
| | | | | | |
| 64 | | BLACKROCK SERIES FUND, INC. | | JUNE 30, 2017 | | |
| | | | |
| Consolidated Schedule of Investments (continued) | | | BlackRock Global Allocation Portfolio | |
| | | | |
| | | | | | | | |
| Common Stocks | | Shares | | | Value | |
Japan (continued) | | | | | | | | |
Mabuchi Motor Co. Ltd. | | | 1,100 | | | $ | 54,981 | |
Maeda Road Construction Co. Ltd. | | | 3,000 | | | | 59,895 | |
Makita Corp. | | | 1,300 | | | | 48,144 | |
Medipal Holdings Corp. | | | 2,600 | | | | 48,209 | |
Mitsubishi Electric Corp. | | | 50,400 | | | | 728,915 | |
Mitsubishi Estate Co. Ltd. | | | 17,700 | | | | 330,863 | |
Murata Manufacturing Co. Ltd. | | | 3,540 | | | | 540,438 | |
Nintendo Co. Ltd. | | | 1,100 | | | | 368,271 | |
Nippo Corp. | | | 3,000 | | | | 60,377 | |
Nippon Telegraph & Telephone Corp. | | | 1,720 | | | | 81,191 | |
Nippon Television Holdings, Inc. | | | 3,900 | | | | 65,754 | |
Nitto Denko Corp. | | | 4,400 | | | | 363,358 | |
NTT DOCOMO, Inc. | | | 5,000 | | | | 118,253 | |
Okumura Corp. | | | 18,270 | | | | 123,130 | |
Otsuka Holdings Co. Ltd. | | | 1,500 | | | | 64,043 | |
Renesas Electronics Corp. (a) | | | 15,300 | | | | 133,773 | |
Rinnai Corp. | | | 1,450 | | | | 135,468 | |
Rohm Co. Ltd. | | | 6,160 | | | | 474,945 | |
Sawai Pharmaceutical Co. Ltd. | | | 800 | | | | 44,930 | |
Secom Co. Ltd. | | | 800 | | | | 60,868 | |
Seino Holdings Co. Ltd. | | | 2,900 | | | | 38,661 | |
Seven & i Holdings Co. Ltd. | | | 700 | | | | 28,885 | |
Shimamura Co. Ltd. | | | 400 | | | | 49,037 | |
Shin-Etsu Chemical Co. Ltd. | | | 9,820 | | | | 893,746 | |
SHO-BOND Holdings Co. Ltd. | | | 500 | | | | 25,269 | |
SKY Perfect JSAT Holdings, Inc. | | | 4,300 | | | | 18,521 | |
Stanley Electric Co. Ltd. | | | 1,800 | | | | 54,549 | |
Subaru Corp. | | | 9,860 | | | | 334,333 | |
Sumitomo Electric Industries Ltd. | | | 16,400 | | | | 253,715 | |
Sumitomo Mitsui Financial Group, Inc. | | | 19,700 | | | | 769,176 | |
Suzuken Co. Ltd. | | | 1,100 | | | | 36,617 | |
Suzuki Motor Corp. | | | 20,161 | | | | 960,429 | |
Toda Corp. | | | 19,000 | | | | 118,678 | |
Toho Co. Ltd. | | | 1,700 | | | | 52,428 | |
Tokio Marine Holdings, Inc. | | | 10,502 | | | | 437,023 | |
Tokyo Gas Co. Ltd. | | | 114,581 | | | | 596,817 | |
Tokyo Steel Manufacturing Co. Ltd. | | | 5,200 | | | | 44,071 | |
Toray Industries, Inc. | | | 30,500 | | | | 255,885 | |
Toyota Industries Corp. | | | 12,714 | | | | 672,447 | |
Trend Micro, Inc. | | | 1,500 | | | | 77,525 | |
TV Asahi Holdings Corp. | | | 2,600 | | | | 46,970 | |
Ube Industries Ltd. | | | 77,600 | | | | 200,309 | |
West Japan Railway Co. | | | 3,600 | | | | 254,720 | |
Yamada Denki Co. Ltd. | | | 6,600 | | | | 32,815 | |
Yamaha Corp. | | | 1,500 | | | | 51,928 | |
Yamato Kogyo Co. Ltd. | | | 1,200 | | | | 30,825 | |
| | | | | | | | |
| | | | | | | | 17,817,763 | |
Netherlands — 1.1% | | | | | | | | |
ABN AMRO Group NV — CVA (c) | | | 12,248 | | | | 324,473 | |
ING Groep NV | | | 40,100 | | | | 692,238 | |
Koninklijke Philips NV | | | 29,721 | | | | 1,058,031 | |
Randstad Holding NV | | | 4,496 | | | | 262,122 | |
Unilever NV CVA | | | 874 | | | | 48,246 | |
| | | | | | | | |
| | | | | | | | 2,385,110 | |
Portugal — 0.1% | | | | | | | | |
Jeronimo Martins SGPS SA | | | 1,308 | | | | 25,537 | |
NOS SGPS SA | | | 18,413 | | | | 111,749 | |
| | | | | | | | |
| | | | | | | | 137,286 | |
| | | | | | | | |
| Common Stocks | | Shares | | | Value | |
Singapore — 0.3% | | | | | | | | |
CapitaLand Ltd. | | | 162,900 | | | $ | 413,932 | |
ComfortDelGro Corp. Ltd. | | | 38,700 | | | | 64,641 | |
Singapore Telecommunications Ltd. | | | 33,000 | | | | 93,195 | |
| | | | | | | | |
| | | | | | | | 571,768 | |
South Korea — 0.5% | | | | | | | | |
Coway Co. Ltd. | | | 700 | | | | 63,617 | |
Doosan Bobcat, Inc. | | | 10,915 | | | | 340,046 | |
Hyundai Motor Co. | | | 2,098 | | | | 292,514 | |
KT&G Corp. | | | 2,204 | | | | 225,451 | |
LG Chem Ltd. | | | 316 | | | | 80,414 | |
POSCO | | | 245 | | | | 61,371 | |
SK Telecom Co. Ltd. | | | 285 | | | | 66,259 | |
| | | | | | | | |
| | | | | | | | 1,129,672 | |
Spain — 0.3% | | | | | | | | |
Cellnex Telecom SAU (c) | | | 27,512 | | | | 568,577 | |
Gas Natural SDG SA | | | 6,869 | | | | 160,793 | |
| | | | | | | | |
| | | | | | | | 729,370 | |
Sweden — 0.6% | | | | | | | | |
SKF AB, Class B | | | 42,469 | | | | 862,392 | |
Svenska Handelsbanken AB, Class A | | | 24,615 | | | | 352,539 | |
| | | | | | | | |
| | | | | | | | 1,214,931 | |
Switzerland — 0.7% | | | | | | | | |
Nestle SA, Registered Shares | | | 11,555 | | | | 1,007,800 | |
Novartis AG, Registered Shares | | | 772 | | | | 64,483 | |
UBS Group AG, Registered Shares (a) | | | 24,171 | | | | 411,049 | |
| | | | | | | | |
| | | | | | | | 1,483,332 | |
Taiwan — 0.4% | | | | | | | | |
Cathay Financial Holding Co. Ltd. | | | 35,000 | | | | 57,611 | |
Cheng Shin Rubber Industry Co. Ltd. | | | 57,341 | | | | 121,947 | |
Chunghwa Telecom Co. Ltd. | | | 21,000 | | | | 74,497 | |
Far EasTone Telecommunications Co. Ltd. | | | 22,000 | | | | 56,034 | |
Formosa Chemicals & Fibre Corp. | | | 15,000 | | | | 47,058 | |
Formosa Petrochemical Corp. | | | 10,000 | | | | 34,489 | |
Formosa Plastics Corp. | | | 16,000 | | | | 48,745 | |
Fubon Financial Holding Co. Ltd. | | | 34,000 | | | | 54,105 | |
Hon Hai Precision Industry Co. Ltd. | | | 20,200 | | | | 77,649 | |
Nan Ya Plastics Corp. | | | 20,000 | | | | 49,607 | |
Taiwan Mobile Co. Ltd. (a) | | | 23,000 | | | | 86,576 | |
Uni-President Enterprises Corp. | | | 39,000 | | | | 78,169 | |
| | | | | | | | |
| | | | | | | | 786,487 | |
Thailand — 0.2% | | | | | | | | |
Advanced Info Service PCL | | | 15,400 | | | | 80,468 | |
Intouch Holdings PCL, Class F | | | 45,500 | | | | 75,244 | |
PTT Global Chemical PCL | | | 32,500 | | | | 65,613 | |
Siam Cement PCL | | | 4,400 | | | | 64,993 | |
Siam Cement PCL — NVDR | | | 400 | | | | 5,932 | |
Thai Oil PCL | | | 14,800 | | | | 34,419 | |
| | | | | | | | |
| | | | | | | | 326,669 | |
United Arab Emirates — 0.3% | | | | | | | | |
NMC Health PLC | | | 18,659 | | | | 531,695 | |
United Kingdom — 3.7% | | | | | | | | |
BAE Systems PLC | | | 34,321 | | | | 283,331 | |
Berkeley Group Holdings PLC | | | 5,868 | | | | 246,748 | |
BP PLC | | | 28,583 | | | | 164,987 | |
See Notes to Financial Statements.
| | | | | | |
| | | BLACKROCK SERIES FUND, INC. | | JUNE 30, 2017 | | 65 |
| | | | |
| Consolidated Schedule of Investments (Continued) | | | BlackRock Global Allocation Portfolio | |
| | | | |
| | | | | | | | |
| Common Stocks | | Shares | | | Value | |
United Kingdom (continued) | | | | | | | | |
BP PLC — ADR (b) | | | 18,705 | | | $ | 648,128 | |
GlaxoSmithKline PLC | | | 46,590 | | | | 991,778 | |
GW Pharmaceuticals PLC — ADR (a)(b) | | | 442 | | | | 44,311 | |
HSBC Holdings PLC | | | 114,525 | | | | 1,063,022 | |
Liberty Global PLC, Class A (a) | | | 3,303 | | | | 106,092 | |
Meggitt PLC | | | 36,160 | | | | 224,691 | |
Michael Kors Holdings Ltd. (a) | | | 12,838 | | | | 465,377 | |
National Grid PLC | | | 1,956 | | | | 24,238 | |
Royal Dutch Shell PLC, A Shares | | | 20,565 | | | | 546,823 | |
Royal Dutch Shell PLC, Class A — ADR (b) | | | 19,140 | | | | 1,018,057 | |
Shire PLC | | | 3,263 | | | | 179,919 | |
Smiths Group PLC | | | 13,886 | | | | 288,718 | |
Spire Healthcare Group PLC (c) | | | 50,221 | | | | 212,277 | |
Vodafone Group PLC | | | 328,924 | | | | 934,133 | |
Vodafone Group PLC — ADR | | | 10,845 | | | | 311,577 | |
| | | | | | | | |
| | | | | | | | 7,754,207 | |
United States — 25.5% | | | | | | | | |
3M Co. | | | 123 | | | | 25,607 | |
AbbVie, Inc. | | | 413 | | | | 29,947 | |
Acadia Healthcare Co., Inc. (a)(b) | | | 6,137 | | | | 303,045 | |
Accenture PLC, Class A | | | 274 | | | | 33,888 | |
Adobe Systems, Inc. (a) | | | 247 | | | | 34,936 | |
Advance Auto Parts, Inc. | | | 2,852 | | | | 332,515 | |
Aetna, Inc. | | | 7,017 | | | | 1,065,391 | |
Air Products & Chemicals, Inc. | | | 7,103 | | | | 1,016,155 | |
Alliance Data Systems Corp. | | | 80 | | | | 20,535 | |
Allstate Corp. (m) | | | 5,680 | | | | 502,339 | |
Alphabet, Inc., Class C (a) | | | 1,110 | | | | 1,008,690 | |
Altria Group, Inc. | | | 699 | | | | 52,055 | |
Amazon.com, Inc. (a) | | | 1,923 | | | | 1,861,464 | |
Amdocs Ltd. | | | 567 | | | | 36,549 | |
American International Group, Inc. | | | 246 | | | | 15,380 | |
American Tower Corp. | | | 329 | | | | 43,533 | |
Ameriprise Financial, Inc. | | | 151 | | | | 19,221 | |
Amgen, Inc. | | | 240 | | | | 41,335 | |
Anadarko Petroleum Corp. | | | 18,939 | | | | 858,694 | |
Analog Devices, Inc. | | | 186 | | | | 14,471 | |
Anthem, Inc. | | | 2,989 | | | | 562,321 | |
Apple Inc. | | | 14,357 | | | | 2,067,695 | |
Axalta Coating Systems Ltd. (a) | | | 20,605 | | | | 660,184 | |
Axis Capital Holdings Ltd. | | | 422 | | | | 27,287 | |
Bank of America Corp. | | | 71,392 | | | | 1,731,970 | |
Bank of New York Mellon Corp. | | | 305 | | | | 15,561 | |
Baxter International, Inc. | | | 1,429 | | | | 86,512 | |
Bed Bath & Beyond, Inc. (b) | | | 3,420 | | | | 103,968 | |
Berkshire Hathaway, Inc., Class B (a) | | | 4,426 | | | | 749,632 | |
Biogen, Inc. (a) | | | 1,140 | | | | 309,350 | |
Boeing Co. | | | 153 | | | | 30,256 | |
Bristol-Myers Squibb Co. | | | 812 | | | | 45,245 | |
Brookdale Senior Living, Inc. (a) | | | 22,158 | | | | 325,944 | |
Capital One Financial Corp. | | | 298 | | | | 24,621 | |
Cardinal Health, Inc. | | | 416 | | | | 32,415 | |
Catalent, Inc. (a) | | | 7,854 | | | | 275,675 | |
CenterPoint Energy, Inc. | | | 429 | | | | 11,746 | |
Charles Schwab Corp. | | | 9,746 | | | | 418,688 | |
Charter Communications, Inc., Class A (a) | | | 1,741 | | | | 586,456 | |
Chevron Corp. | | | 113 | | | | 11,789 | |
Chubb Ltd. | | | 4,175 | | | | 606,961 | |
Cisco Systems, Inc. | | | 632 | | | | 19,782 | |
Citigroup, Inc. | | | 14,576 | | | | 974,843 | |
Colgate-Palmolive Co. | | | 915 | | | | 67,829 | |
Comcast Corp., Class A | | | 38,890 | | | | 1,513,599 | |
CommScope Holding Co, Inc. (a) | | | 15,703 | | | | 597,185 | |
Constellation Brands, Inc., Class A | | | 190 | | | | 36,809 | |
Cooper Cos, Inc. | | | 33 | | | | 7,901 | |
| | | | | | | | |
| Common Stocks | | Shares | | | Value | |
United States (continued) | | | | | | | | |
Crown Holdings, Inc. (a) | | | 411 | | | $ | 24,520 | |
Cummins, Inc. | | | 112 | | | | 18,169 | |
CVS Health Corp. | | | 3,692 | | | | 297,058 | |
Delta Air Lines, Inc. | | | 10,696 | | | | 574,803 | |
Discover Financial Services | | | 5,111 | | | | 317,853 | |
DISH Network Corp., Class A (a) | | | 4,619 | | | | 289,888 | |
E.I. du Pont de Nemours & Co. | | | 15,378 | | | | 1,241,158 | |
Edgewell Personal Care Co. (a) | | | 10,957 | | | | 832,951 | |
Electronic Arts, Inc. (a) | | | 3,024 | | | | 319,697 | |
EQT Corp. (b) | | | 5,864 | | | | 343,572 | |
Expedia, Inc. | | | 2,221 | | | | 330,818 | |
Facebook, Inc., Class A (a) | | | 8,046 | | | | 1,214,785 | |
Fifth Third Bancorp | | | 531 | | | | 13,785 | |
Ford Motor Co. | | | 23,232 | | | | 259,966 | |
Fortune Brands Home & Security, Inc. | | | 6,173 | | | | 402,727 | |
General Dynamics Corp. | | | 197 | | | | 39,026 | |
General Electric Co. | | | 3,389 | | | | 91,537 | |
Gilead Sciences, Inc. | | | 15,469 | | | | 1,094,896 | |
Global Payments, Inc. | | | 3,139 | | | | 283,514 | |
Goldman Sachs Group, Inc. | | | 2,481 | | | | 550,534 | |
Goodyear Tire & Rubber Co. | | | 526 | | | | 18,389 | |
H&R Block, Inc. (b) | | | 1,326 | | | | 40,987 | |
Hartford Financial Services Group, Inc. | | | 1,142 | | | | 60,035 | |
HCA Healthcare, Inc. (a) | | | 6,901 | | | | 601,767 | |
Helmerich & Payne, Inc. (b) | | | 315 | | | | 17,117 | |
Home Depot, Inc. | | | 2,963 | | | | 454,524 | |
Illinois Tool Works, Inc. | | | 167 | | | | 23,923 | |
Intel Corp. | | | 734 | | | | 24,765 | |
International Paper Co. | | | 570 | | | | 32,268 | |
Intuit, Inc. | | | 1,021 | | | | 135,599 | |
Invitae Corp. (a) | | | 4,635 | | | | 44,311 | |
Jawbone Health Hub, Inc. (Acquired 1/24/17, cost $0) (a)(e)(f) | | | 6,968 | | | | 19,004 | |
Johnson & Johnson | | | 661 | | | | 87,444 | |
JPMorgan Chase & Co. | | | 9,402 | | | | 859,343 | |
Kansas City Southern | | | 7,540 | | | | 789,061 | |
KLA-Tencor Corp. | | | 293 | | | | 26,812 | |
Lear Corp. | | | 167 | | | | 23,727 | |
Liberty Broadband Corp., Class A (a) | | | 1,414 | | | | 121,307 | |
Liberty Broadband Corp., Class C (a) | | | 3,453 | | | | 299,548 | |
Liberty Media Corp. — Liberty Formula One (Acquired 1/24/17, cost $67,351) (a)(f) | | | 2,454 | | | | 89,316 | |
Liberty Media Corp. — Liberty SiriusXM Group, Class A (a) | | | 5,069 | | | | 212,797 | |
Liberty Media Corp. — Liberty SiriusXM Group, Class C (a) | | | 8,408 | | | | 350,614 | |
Lookout, Inc. (Acquired 3/04/15, cost $16,643) (a)(e)(f) | | | 1,457 | | | | 932 | |
Lowe’s Cos., Inc. | | | 13,704 | | | | 1,062,471 | |
ManpowerGroup, Inc. | | | 153 | | | | 17,082 | |
Marathon Oil Corp. | | | 36,008 | | | | 426,695 | |
Marathon Petroleum Corp. | | | 21,528 | | | | 1,126,560 | |
Marsh & McLennan Cos., Inc. | | | 5,698 | | | | 444,216 | |
Masco Corp. | | | 10,976 | | | | 419,393 | |
Mastercard, Inc., Class A | | | 3,095 | | | | 375,888 | |
McDonald’s Corp. | | | 266 | | | | 40,741 | |
McKesson Corp. | | | 132 | | | | 21,719 | |
MetLife, Inc. | | | 9,451 | | | | 519,238 | |
Microsoft Corp. | | | 6,062 | | | | 417,854 | |
Mohawk Industries, Inc. (a) | | | 1,647 | | | | 398,063 | |
Mondelez International, Inc., Class A | | | 1,913 | | | | 82,622 | |
Morgan Stanley | | | 18,302 | | | | 815,537 | |
NextEra Energy Partners LP | | | 7,518 | | | | 278,091 | |
NextEra Energy, Inc. | | | 7,140 | | | | 1,000,528 | |
Northrop Grumman Corp. | | | 140 | | | | 35,939 | |
Nuance Communications, Inc. (a) | | | 4,047 | | | | 70,458 | |
See Notes to Financial Statements.
| | | | | | |
| 66 | | BLACKROCK SERIES FUND, INC. | | JUNE 30, 2017 | | |
| | | | |
| Consolidated Schedule of Investments (continued) | | | BlackRock Global Allocation Portfolio | |
| | | | |
| | | | | | | | | | | | |
| Common Stocks | | | | | Shares | | | Value | |
United States (continued) | | | | | | | | | | | | |
Omnicom Group, Inc. (b) | | | | | | | 173 | | | $ | 14,342 | |
O’Reilly Automotive, Inc. (a) | | | | | | | 1,340 | | | | 293,112 | |
Packaging Corp. of America | | | | | | | 357 | | | | 39,766 | |
PepsiCo, Inc. | | | | | | | 660 | | | | 76,223 | |
Perrigo Co. PLC | | | | | | | 8,419 | | | | 635,803 | |
Pfizer, Inc. | | | | | | | 40,344 | | | | 1,355,155 | |
Phillips 66 | | | | | | | 311 | | | | 25,717 | |
Prudential Financial, Inc. | | | | | | | 287 | | | | 31,036 | |
Pure Storage, Inc., Class A (a)(b) | | | | | | | 24,490 | | | | 313,717 | |
PVH Corp. | | | | | | | 127 | | | | 14,542 | |
QUALCOMM, Inc. | | | | | | | 24,548 | | | | 1,355,540 | |
Ralph Lauren Corp. (b) | | | | | | | 3,365 | | | | 248,337 | |
Raytheon Co. | | | | | | | 159 | | | | 25,675 | |
Reinsurance Group of America, Inc. | | | | | | | 245 | | | | 31,456 | |
Rockwell Automation, Inc. | | | | | | | 145 | | | | 23,484 | |
Royal Caribbean Cruises Ltd. | | | | | | | 130 | | | | 14,200 | |
Sabre Corp. (b) | | | | | | | 14,664 | | | | 319,235 | |
Schlumberger Ltd. | | | | | | | 4,905 | | | | 322,945 | |
Scripps Networks Interactive, Inc., Class A (b) | | | | | | | 301 | | | | 20,561 | |
Sempra Energy | | | | | | | 3,741 | | | | 421,798 | |
Simon Property Group, Inc. | | | | | | | 152 | | | | 24,588 | |
Snap, Inc., Class A (a)(b) | | | | | | | 13,632 | | | | 242,241 | |
St. Joe Co. (a) | | | | | | | 26,899 | | | | 504,356 | |
Starbucks Corp. | | | | | | | 4,829 | | | | 281,579 | |
Stryker Corp. | | | | | | | 112 | | | | 15,543 | |
SunTrust Banks, Inc. | | | | | | | 5,572 | | | | 316,044 | |
Target Corp. | | | | | | | 10,492 | | | | 548,627 | |
Tenet Healthcare Corp. (a)(b) | | | | | | | 21,554 | | | | 416,854 | |
TESARO, Inc. (a)(b) | | | | | | | 940 | | | | 131,468 | |
Thermo Fisher Scientific, Inc. | | | | | | | 376 | | | | 65,601 | |
Travelers Cos., Inc. | | | | | | | 602 | | | | 76,171 | |
TripAdvisor, Inc. (a) | | | | | | | 5,235 | | | | 199,977 | |
Tyson Foods, Inc., Class A | | | | | | | 276 | | | | 17,286 | |
United Continental Holdings, Inc. (a) | | | | | | | 12,876 | | | | 968,919 | |
United Rentals, Inc. (a) | | | | | | | 229 | | | | 25,811 | |
UnitedHealth Group, Inc. | | | | | | | 524 | | | | 97,160 | |
Unum Group | | | | | | | 4,763 | | | | 222,099 | |
Urban Outfitters, Inc. (a)(b) | | | | | | | 7,485 | | | | 138,772 | |
Valero Energy Corp. | | | | | | | 648 | | | | 43,714 | |
VeriFone Systems, Inc. (a)(b) | | | | | | | 14,490 | | | | 262,269 | |
VeriSign, Inc. (a)(b) | | | | | | | 392 | | | | 36,440 | |
Verizon Communications, Inc. | | | | | | | 20,353 | | | | 908,965 | |
Visa, Inc., Class A | | | | | | | 3,831 | | | | 359,271 | |
Vistra Energy Corp. | | | | | | | 6,883 | | | | 115,566 | |
VMware, Inc., Class A (a)(b) | | | | | | | 3,207 | | | | 280,388 | |
WABCO Holdings, Inc. (a) | | | | | | | 177 | | | | 22,569 | |
Western Digital Corp. | | | | | | | 201 | | | | 17,809 | |
WestRock Co. | | | | | | | 6,083 | | | | 344,663 | |
Williams Cos., Inc. | | | | | | | 28,244 | | | | 855,228 | |
Williams-Sonoma, Inc. (b) | | | | | | | 6,333 | | | | 307,151 | |
Wyndham Worldwide Corp. | | | | | | | 351 | | | | 35,244 | |
Zimmer Biomet Holdings, Inc. | | | | | | | 6,297 | | | | 808,535 | |
| | | | | | | | | | | | |
| | | | | | | | | | | | 53,919,468 | |
Total Common Stocks — 51.0% | | | | | | | | | | | 107,830,787 | |
| | | | | | | | | | | | |
| Corporate Bonds | | | | | Par
(000) | | | | |
Australia — 0.2% | | | | | | | | | | | | |
Quintis Ltd., 8.75%, 8/01/23 (c) | | | USD | | | | 577 | | | | 432,750 | |
| | | | | | | | | | | | |
| Corporate Bonds | | | | | Par
(000) | | | Value | |
Canada — 0.0% | | | | | | | | | | | | |
BC ULC/New Red Finance, Inc., 4.25%, 5/15/24 (c) | | | USD | | | | 54 | | | $ | 53,659 | |
Chile — 0.0% | | | | | | | | | | | | |
Inversiones Alsacia SA, 8.00%, 12/31/18 (a)(c)(g) | | | | | | | 167 | | | | 5,837 | |
China — 0.0% | | | | | | | | | | | | |
Celestial Nutrifoods Ltd., 0.00%, 6/12/11 (a)(e)(g)(h) | | | SGD | | | | 400 | | | | — | |
China Milk Products Group Ltd.,
0.00%, 1/05/12 (a)(e)(g)(h) | | | USD | | | | 300 | | | | 1,500 | |
| | | | | | | | | | | | |
| | | | | | | | | | | | 1,500 | |
France — 0.2% | | | | | | | | | | | | |
BNP Paribas SA, 2.40%, 12/12/18 | | | | | | | 249 | | | | 251,109 | |
Danone SA, 2.59%, 11/02/23 (c) | | | | | | | 200 | | | | 195,135 | |
| | | | | | | | | | | | |
| | | | | | | | | | | | 446,244 | |
Germany — 0.2% | | | | | | | | | | | | |
Bayer Capital Corp. BV, 5.63%, 11/22/19 (c)(h) | | | EUR | | | | 300 | | | | 417,137 | |
India — 0.0% | | | | | | | | | | | | |
REI Agro Ltd.: | | | | | | | | | | | | |
5.50%, 11/13/14 (a)(c)(e)(g)(h) | | | USD | | | | 220 | | | | 1,100 | |
5.50%, 11/13/14 (a)(e)(g)(h) | | | | | | | 152 | | | | 760 | |
Suzlon Energy Ltd., 5.75%, 7/16/19 (c)(h)(i) | | | | | | | 30 | | | | 33,000 | |
| | | | | | | | | | | | |
| | | | | | | | | | | | 34,860 | |
Italy — 0.2% | | | | | | | | | | | | |
Intesa Sanpaolo SpA, 3.88%, 1/15/19 | | | | | | | 300 | | | | 307,402 | |
Telecom Italia SpA, 5.30%, 5/30/24 (c) | | | | | | | 200 | | | | 214,500 | |
| | | | | | | | | | | | |
| | | | | | | | | | | | 521,902 | |
Luxembourg — 0.2% | | | | | | | | | | | | |
Allergan Funding SCS, 3.45%, 3/15/22 | | | | | | | 153 | | | | 157,715 | |
Intelsat Jackson Holdings SA: | | | | | | | | | | | | |
7.50%, 4/01/21 | | | | | | | 137 | | | | 126,383 | |
8.00%, 2/15/24 (c) | | | | | | | 45 | | | | 48,487 | |
| | | | | | | | | | | | |
| | | | | | | | | | | | 332,585 | |
Netherlands — 0.1% | | | | | | | | | | | | |
Bio City Development Co. BV,
8.00%, 7/06/18 (a)(c)(e)(g)(h) | | | | | | | 800 | | | | 252,400 | |
Singapore — 0.3% | | | | | | | | | | | | |
CapitaLand Ltd., 1.95%, 10/17/23 (c)(h) | | | SGD | | | | 250 | | | | 185,945 | |
Global Logistic Properties Ltd., 3.88%, 6/04/25 | | | USD | | | | 382 | | | | 363,237 | |
| | | | | | | | | | | | |
| | | | | | | | | | | | 549,182 | |
Spain — 0.2% | | | | | | | | | | | | |
Telefonica Participaciones SAU, 4.90%, 9/25/17 (c)(h) | | | EUR | | | | 200 | | | | 212,212 | |
Telefonica SA, 6.00%, 7/24/17 (h) | | | | | | | 100 | | | | 107,682 | |
| | | | | | | | | | | | |
| | | | | | | | | | | | 319,894 | |
Switzerland — 0.1% | | | | | | | | | | | | |
UBS Group Funding Switzerland AG, 4.13%, 9/24/25 (c) | | | USD | | | | 200 | | | | 209,647 | |
United Arab Emirates — 0.2% | | | | | | | | | | | | |
Dana Gas Sukuk Ltd., 7.00%, 10/31/17 (c)(h) | | | | | | | 418 | | | | 322,176 | |
United Kingdom — 0.0% | | | | | | | | | | | | |
Delta Topco Ltd. (2.00% PIK) (Acquired 1/24/17, cost $35,209), 2.00%, 7/23/19 (e)(f)(j) | | | | | | | 28 | | | | 42,112 | |
See Notes to Financial Statements.
| | | | | | |
| | | BLACKROCK SERIES FUND, INC. | | JUNE 30, 2017 | | 67 |
| | | | |
| Consolidated Schedule of Investments (continued) | | | BlackRock Global Allocation Portfolio | |
| | | | |
| | | | | | | | | | | | |
| Corporate Bonds | | | | | Par
(000) | | | Value | |
United States — 3.4% | | | | | | | | | | | | |
AbbVie, Inc.: | | | | | | | | | | | | |
2.50%, 5/14/20 | | | USD | | | | 178 | | | $ | 180,064 | |
2.30%, 5/14/21 | | | | | | | 144 | | | | 143,643 | |
AliphCom (Acquired 11/11/15, cost $48,000),
15.00%, 4/28/20 (a)(e)(f)(g)(h)(k) | | | | | | | 48 | | | | 1,205 | |
AliphCom (Acquired 4/27/15-7/21/15, cost $945,000), 15.00%, 4/28/20 (a)(e)(f)(g)(h)(k) | | | | | | | 945 | | | | 23,719 | |
Ally Financial, Inc., 3.50%, 1/27/19 | | | | | | | 101 | | | | 102,389 | |
American Express Credit Corp., 2.70%, 3/03/22 | | | | | | | 320 | | | | 322,948 | |
American Tower Corp., 3.40%, 2/15/19 | | | | | | | 69 | | | | 70,442 | |
Apple Inc.: | | | | | | | | | | | | |
3.35%, 2/09/27 | | | | | | | 276 | | | | 282,164 | |
3.20%, 5/11/27 | | | | | | | 265 | | | | 268,095 | |
AT&T Inc., 3.00%, 6/30/22 | | | | | | | 328 | | | | 328,170 | |
Bank of America Corp.: | | | | | | | | | | | | |
Series L, 2.60%, 1/15/19 | | | | | | | 82 | | | | 82,772 | |
3.30%, 1/11/23 | | | | | | | 176 | | | | 179,467 | |
Becton Dickinson and Co.: | | | | | | | | | | | | |
2.68%, 12/15/19 | | | | | | | 68 | | | | 68,833 | |
3.13%, 11/08/21 | | | | | | | 155 | | | | 157,881 | |
2.89%, 6/06/22 | | | | | | | 130 | | | | 130,406 | |
Berkshire Hathaway, Inc., 2.75%, 3/15/23 | | | | | | | 116 | | | | 117,537 | |
Cablevision Systems Corp., 5.88%, 9/15/22 | | | | | | | 58 | | | | 60,973 | |
CCO Holdings LLC/CCO Holdings Capital Corp.,
5.13%, 5/01/27 (c) | | | | | | | 135 | | | | 138,037 | |
Citigroup, Inc.: | | | | | | | | | | | | |
2.70%, 3/30/21 | | | | | | | 162 | | | | 163,075 | |
2.90%, 12/08/21 | | | | | | | 76 | | | | 76,770 | |
Cobalt International Energy, Inc.: | | | | | | | | | | | | |
2.63%, 12/01/19 (h) | | | | | | | 267 | | | | 69,420 | |
3.13%, 5/15/24 (h) | | | | | | | 309 | | | | 61,800 | |
E.I. du Pont de Nemours & Co., 2.20%, 5/01/20 | | | | | | | 178 | | | | 178,966 | |
eBay, Inc., 3.80%, 3/09/22 | | | | | | | 82 | | | | 85,690 | |
Edgewell Personal Care Co.: | | | | | | | | | | | | |
4.70%, 5/19/21 | | | | | | | 91 | | | | 96,915 | |
4.70%, 5/24/22 | | | | | | | 85 | | | | 90,737 | |
Ford Motor Credit Co. LLC, 5.00%, 5/15/18 | | | | | | | 200 | | | | 205,116 | |
Forest Laboratories LLC, 5.00%, 12/15/21 (c) | | | | | | | 78 | | | | 85,161 | |
General Electric Co., 5.55%, 5/04/20 | | | | | | | 21 | | | | 23,069 | |
General Motors Financial Co., Inc., 3.45%, 4/10/22 | | | | | | | 67 | | | | 68,099 | |
Goldman Sachs Group, Inc., 2.60%, 12/27/20 | | | | | | | 523 | | | | 525,785 | |
Hilton Worldwide Finance LLC/Hilton Worldwide Finance Corp., 4.63%, 4/01/25 (c) | | | | | | | 117 | | | | 120,656 | |
Hughes Satellite Systems Corp., 7.63%, 6/15/21 | | | | | | | 30 | | | | 34,087 | |
JPMorgan Chase & Co.: | | | | | | | | | | | | |
2.30%, 8/15/21 | | | | | | | 224 | | | | 222,697 | |
4.35%, 8/15/21 | | | | | | | 69 | | | | 73,855 | |
2.16%, 1/15/23 (k) | | | | | | | 182 | | | | 183,103 | |
Medtronic, Inc., 3.15%, 3/15/22 | | | | | | | 187 | | | | 193,515 | |
Mylan, Inc., 2.55%, 3/28/19 | | | | | | | 114 | | | | 114,823 | |
Oracle Corp., 1.90%, 9/15/21 | | | | | | | 254 | | | | 251,767 | |
QUALCOMM, Inc.: | | | | | | | | | | | | |
3.00%, 5/20/22 | | | | | | | 196 | | | | 201,005 | |
2.60%, 1/30/23 | | | | | | | 170 | | | | 169,380 | |
Sherwin-Williams Co.: | | | | | | | | | | | | |
2.25%, 5/15/20 | | | | | | | 101 | | | | 101,226 | |
2.75%, 6/01/22 | | | | | | | 60 | | | | 59,964 | |
| | | | | | | | | | | | |
| Corporate Bonds | | | | | Par
(000) | | | Value | |
T-Mobile USA, Inc.: | | | | | | | | | | | | |
4.00%, 4/15/22 | | | USD | | | | 27 | | | $ | 28,099 | |
6.00%, 4/15/24 | | | | | | | 106 | | | | 113,420 | |
Verizon Communications, Inc.: | | | | | | | | | | | | |
3.13%, 3/16/22 | | | | | | | 799 | | | | 810,792 | |
2.45%, 11/01/22 | | | | | | | 41 | | | | 40,189 | |
2.63%, 8/15/26 | | | | | | | 80 | | | | 73,584 | |
| | | | | | | | | | | | |
| | | | | | | | | | | | 7,181,510 | |
Total Corporate Bonds — 5.3% | | | | | | | | | | | 11,123,395 | |
| | | | | | | | | | | | |
| Floating Rate Loan Interests (k) | | | | | | | | | |
Norway — 0.1% | | | | | | | | | | | | |
Drillships Financing Holding, Inc. (Ocean Rig), Tranche B-1 Term Loan, 8.25%, 3/31/21 | | | | | | | 145 | | | | 92,986 | |
United States — 0.4% | | | | | | | | | | | | |
Fieldwood Energy LLC: | | | | | | | | | | | | |
Closing Date Loan (Second Lien),
8.42%, 9/30/20 | | | | | | | 127 | | | | 69,893 | |
FLLO Facility (First Lien), 8.42%, 9/30/20 | | | | | | | 75 | | | | 59,192 | |
Reserve Based Term Loan, 8.30%, 8/31/20 | | | | | | | 56 | | | | 51,920 | |
Hilton Worldwide Finance LLC, Series B-2 Term Loan,
3.22%, 10/25/23 | | | | | | | 268 | | | | 268,642 | |
Neiman Marcus Group, Inc., Other Term Loan,
4.34%, 10/25/20 | | | | | | | 80 | | | | 59,521 | |
Seadrill Operating LP (Seadrill Partners Finco LLC), Initial Term Loan, 4.30%, 2/21/21 | | | | | | | 193 | | | | 122,495 | |
Sheridan Investment Partners II LP, Senior Secured Term Loan, 4.71%, 12/16/20 | | | | | | | 288 | | | | 244,544 | |
Sheridan Production Partners II-A LP, Senior Secured Term Loan, 4.71%, 12/16/20 | | | | | | | 40 | | | | 34,013 | |
Sheridan Production Partners II-M LP, Senior Secured Term Loan, 4.71%, 12/16/20 | | | | | | | 15 | | | | 12,687 | |
| | | | | | | | | | | | |
| | | | | | | | | | | | 922,907 | |
Total Floating Rate Loan Interests — 0.5% | | | | | | | | | | | 1,015,893 | |
| | | | | | | | | | | | |
| Foreign Agency Obligations | | | | | | | | | |
Brazil — 0.1% | | | | | | | | | | | | |
Petrobras Global Finance BV, 6.13%, 1/17/22 | | | | | | | 321 | | | | 331,111 | |
Mexico — 0.2% | | | | | | | | | | | | |
Petroleos Mexicanos: | | | | | | | | | | | | |
4.88%, 3/11/22 (c)(k) | | | | | | | 169 | | | | 182,267 | |
4.63%, 9/21/23 | | | | | | | 178 | | | | 180,136 | |
| | | | | | | | | | | | |
| | | | | | | | | | | | 362,403 | |
South Korea — 0.1% | | | | | | | | | | | | |
Export-Import Bank of Korea, 2.63%, 12/30/20 | | | | | | | 252 | | | | 253,097 | |
Total Foreign Agency Obligations — 0.4% | | | | | | | | | | | 946,611 | |
| | | | | | | | | | | | |
| | | | | | | | | | |
See Notes to Financial Statements.
| | | | | | |
| 68 | | BLACKROCK SERIES FUND, INC. | | JUNE 30, 2017 | | |
| | | | |
| Consolidated Schedule of Investments (continued) | | | BlackRock Global Allocation Portfolio | |
| | | | |
| | | | | | | | | | | | |
| Foreign Government Obligations | | | | | Par
(000) | | | Value | |
Argentina — 0.5% | | | | | | | | | | | | |
Republic of Argentina: | | | | | | | | | | | | |
6.88%, 4/22/21 | | | USD | | | | 218 | | | $ | 233,260 | |
3.88%, 1/15/22 | | | EUR | | | | 100 | | | | 113,501 | |
5.63%, 1/26/22 | | | USD | | | | 180 | | | | 184,320 | |
7.50%, 4/22/26 | | | | | | | 357 | | | | 384,667 | |
6.88%, 1/26/27 | | | | | | | 267 | | | | 276,612 | |
| | | | | | | | | | | | |
| | | | | | | | | | | | 1,192,360 | |
Australia — 1.5% | | | | | | | | | | | | |
Commonwealth of Australia: | | | | | | | | | | | | |
5.75%, 5/15/21 | | | AUD | | | | 1,001 | | | | 874,322 | |
5.75%, 7/15/22 | | | | | | | 1,798 | | | | 1,615,115 | |
5.50%, 4/21/23 | | | | | | | 307 | | | | 277,039 | |
3.00%, 3/21/47 | | | | | | | 673 | | | | 470,614 | |
| | | | | | | | | | | | |
| | | | | | | | | | | | 3,237,090 | |
Brazil — 1.0% | | | | | | | | | | | | |
Brazil Notas do Tesouro Nacional: | | | | | | | | | | | | |
Series B, 6.00%, 8/15/22 | | | BRL | | | | 1 | | | | 568,905 | |
Series F, 10.00%, 1/01/18 | | | | | | | 1 | | | | 394,749 | |
Series F, 10.00%, 1/01/23 | | | | | | | 3 | | | | 964,948 | |
Federative Republic of Brazil: | | | | | | | | | | | | |
4.88%, 1/22/21 | | | USD | | | | 137 | | | | 143,576 | |
2.63%, 1/05/23 | | | | | | | 200 | | | | 185,250 | |
| | | | | | | | | | | | |
| | | | | | | | | | | | 2,257,428 | |
Canada — 1.0% | | | | | | | | | | | | |
Canadian Government Bonds: | | | | | | | | | | | | |
0.50%, 8/01/18 | | | CAD | | | | 2,152 | | | | 1,651,155 | |
0.75%, 3/01/21 | | | | | | | 529 | | | | 399,977 | |
| | | | | | | | | | | | |
| | | | | | | | | | | | 2,051,132 | |
Germany — 0.5% | | | | | | | | | | | | |
Bundesrepublik Deutschland, 0.00%, 8/15/26 | | | EUR | | | | 900 | | | | 991,604 | |
Hungary — 0.3% | | | | | | | | | | | | |
Republic of Hungary: | | | | | | | | | | | | |
6.25%, 1/29/20 | | | USD | | | | 163 | | | | 178,322 | |
6.38%, 3/29/21 | | | | | | | 454 | | | | 510,523 | |
| | | | | | | | | | | | |
| | | | | | | | | | | | 688,845 | |
Indonesia — 0.2% | | | | | | | | | | | | |
Republic of Indonesia: | | | | | | | | | | | | |
6.88%, 1/17/18 (c) | | | | | | | 100 | | | | 102,600 | |
2.63%, 6/14/23 (c) | | | EUR | | | | 275 | | | | 329,571 | |
| | | | | | | | | | | | |
| | | | | | | | | | | | 432,171 | |
Japan — 1.1% | | | | | | | | | | | | |
Government of Japan (2 Year): | | | | | | | | | | | | |
0.10%, 3/15/18 | | | JPY | | | | 124,300 | | | | 1,106,936 | |
0.10%, 10/15/18 | | | | | | | 130,500 | | | | 1,163,402 | |
| | | | | | | | | | | | |
| | | | | | | | | | | | 2,270,338 | |
Mexico — 1.2% | | | | | | | | | | | | |
United Mexican States: | | | | | | | | | | | | |
Series M, 6.50%, 6/10/21 | | | MXN | | | | 304 | | | | 1,667,916 | |
Series M-10, 8.50%, 12/13/18 | | | | | | | 152 | | | | 854,987 | |
| | | | | | | | | | | | |
| | | | | | | | | | | | 2,522,903 | |
New Zealand — 0.5% | | | | | | | | | | | | |
New Zealand Government Bonds, 6.00%, 5/15/21 | | | NZD | | | | 1,194 | | | | 990,678 | |
Poland — 1.3% | | | | | | | | | | | | |
Republic of Poland: | | | | | | | | | | | | |
5.00%, 3/23/22 | | | USD | | | | 73 | | | | 81,030 | |
3.25%, 7/25/25 | | | PLN | | | | 1,985 | | | | 540,146 | |
2.50%, 7/25/26 | | | | | | | 1,987 | | | | 506,610 | |
| | | | | | | | | | | | |
| Foreign Government Obligations | | | | | Par
(000) | | | Value | |
Poland (continued) | | | | | | | | | | | | |
2.50%, 7/25/27 | | | PLN | | | | 6,569 | | | $ | 1,649,319 | |
| | | | | | | | | | | | |
| | | | | | | | | | | | 2,777,105 | |
Saudi Arabia — 0.1% | | | | | | | | | | | | |
Kingdom of Saudi Arabia, 2.38%, 10/26/21 (c) | | | USD | | | | 250 | | | | 246,000 | |
Turkey — 0.3% | | | | | | | | | | | | |
Republic of Turkey, 11.00%, 3/02/22 | | | TRY | | | | 2,024 | | | | 586,183 | |
United Kingdom — 1.1% | | | | | | | | | | | | |
United Kingdom Gilt: | | | | | | | | | | | | |
0.50%, 7/22/22 | | | GBP | | | | 508 | | | | 654,955 | |
2.75%, 9/07/24 | | | | | | | 1,078 | | | | 1,580,850 | |
2.00%, 9/07/25 | | | | | | | 25 | | | | 34,915 | |
| | | | | | | | | | | | |
| | | | | | | | | | | | 2,270,720 | |
Total Foreign Government Obligations — 10.6% | | | | | | | | 22,514,557 | |
| | | | | | | | | | | | |
| Investment Companies | | | | | Shares | | | | |
ETFS Physical Palladium Shares (a)(l) | | | | | | | 1,649 | | | | 133,057 | |
ETFS Physical Platinum Shares (a)(l) | | | | | | | 1,392 | | | | 122,983 | |
ETFS Physical Swiss Gold Shares (a)(l)(m) | | | | | | | 5,694 | | | | 685,728 | |
iShares Gold Trust (a)(l)(n) | | | | | | | 55,980 | | | | 668,401 | |
SPDR Gold Shares ETF (a)(l)(m) | | | | | | | 52,372 | | | | 6,180,944 | |
Total Investment Companies — 3.7% | | | | | | | | | | | 7,791,113 | |
| | | | | | | | | | | | |
| Non-Agency Mortgage-Backed Securities | | | | | Par
(000) | | | | |
Commercial Mortgage-Backed Securities — 0.1% | | | | | | | | | |
Logistics UK PLC, Series 2015-1A, Class F,
3.90%, 8/20/25 (c)(e)(k) | | | GBP | | | | 140 | | | | 182,344 | |
| | | | | | | | | | | | |
| Preferred Securities | | | | | | | | | |
Capital Trusts | | | | | | | | | | | | |
United Kingdom — 0.3% | | | | | | | | | | | | |
HSBC Holdings PLC, 6.38% (k)(o) | | | USD | | | | 235 | | | | 246,163 | |
Lloyds Bank PLC, 13.00% (k)(o) | | | GBP | | | | 155 | | | | 378,829 | |
| | | | | | | | | | | | |
| | | | | | | | | | | | 624,992 | |
United States — 0.7% | | | | | | | | | | | | |
American Express Co., Series C, 4.90% (k)(o) | | | USD | | | | 104 | | | | 105,716 | |
Citigroup, Inc., Series O, 5.88% (k)(o) | | | | | | | 194 | | | | 203,741 | |
General Electric Co.: | | | | | | | | | | | | |
6.38%, 11/15/67 (k) | | | | | | | 95 | | | | 95,950 | |
Series D, 5.00% (k)(o) | | | | | | | 167 | | | | 177,254 | |
Goldman Sachs Group, Inc.: | | | | | | | | | | | | |
Series L, 5.70% (k)(o) | | | | | | | 162 | | | | 168,601 | |
Series M, 5.38% (k)(o) | | | | | | | 170 | | | | 178,636 | |
Morgan Stanley, Series H, 5.45% (k)(o) | | | | | | | 118 | | | | 122,189 | |
NBCUniversal Enterprise, Inc., 5.25% (c)(o) | | | | | | | 100 | | | | 106,286 | |
Prudential Financial, Inc.: | | | | | | | | | | | | |
5.88%, 9/15/42 (k) | | | | | | | 93 | | | | 103,621 | |
5.63%, 6/15/43 (k) | | | | | | | 63 | | | | 69,221 | |
USB Capital IX, 3.50% (k)(o) | | | | | | | 42 | | | | 37,292 | |
| | | | | | | | | | | | |
| | | | | | | | | | | | 1,368,507 | |
Total Capital Trusts — 1.0% | | | | | | | | | | | 1,993,499 | |
| | | | | | | | | | | | |
| | | | | | | | | | |
See Notes to Financial Statements.
| | | | | | |
| | | BLACKROCK SERIES FUND, INC. | | JUNE 30, 2017 | | 69 |
| | | | |
| Consolidated Schedule of Investments (continued) | | | BlackRock Global Allocation Portfolio | |
| | | | | | | | | | | | |
| Preferred Stocks | | | | | Shares | | | Value | |
United States — 2.1% | | | | | | | | | | | | |
Anthem, Inc., 5.25% (h) | | | | | | | 8,230 | | | $ | 434,709 | |
Dominion Resources, Inc.: | | | | | | | | | | | | |
6.38% (h) | | | | | | | 1,795 | | | | 85,801 | |
Series A, 6.75% (h) | | | | | | | 6,755 | | | | 339,912 | |
Domo, Inc., Series D-2, (Acquired 4/01/15-4/12/17, cost $469,893), 0.00% (a)(e)(f) | | | | | | | 55,730 | | | | 492,653 | |
Dropbox, Inc., Series C (Acquired 1/28/14, cost $695,990), 0.00% (e)(f) | | | | | | | 36,437 | | | | 437,608 | |
Grand Rounds, Inc., Series C (Acquired 3/31/15, cost $127,944), 0.00% (a)(e)(f) | | | | | | | 46,081 | | | | 140,086 | |
Lookout, Inc., Series F (Acquired 9/19/14-10/22/14, cost $243,061), 0.00% (e)(f) | | | | | | | 21,278 | | | | 211,929 | |
Palantir Technologies, Inc., Series I (Acquired 3/27/14, cost $272,246), 0.00% (a)(e)(f) | | | | | | | 44,412 | | | | 355,740 | |
Stericycle, Inc., 5.25% (h) | | | | | | | 1,043 | | | | 69,818 | |
U.S. Bancorp, Series F, 6.50% (k) | | | | | | | 3,530 | | | | 104,806 | |
Uber Technologies, Inc., Series D (Acquired 6/06/14, cost $418,728), 0.00% (a)(e)(f) | | | | | | | 26,992 | | | | 1,454,329 | |
Wells Fargo & Co., Series L, 7.50% (h) | | | | | | | 66 | | | | 86,533 | |
Welltower, Inc., Series I, 6.50% (h) | | | | | | | 3,194 | | | | 211,634 | |
| | | | | | | | | | | | |
| | | | | | | | | | | | 4,425,558 | |
Total Preferred Stocks — 2.1% | | | | | | | | | | | 4,425,558 | |
| | | | | | | | | | | | |
| Trust Preferreds | | | | | | | | | |
United States — 0.4% | | | | | | | | | | | | |
Citigroup Capital XIII, 7.54%, 10/30/40 (k) | | | | | | | 7,450 | | | | 193,551 | |
GMAC Capital Trust I, Series 2,
6.97%, 2/15/40 (b)(k) | | | | | | | 8,183 | | | | 214,395 | |
Mandatory Exchangeable Trust,
5.75%, 6/03/19 (a)(c)(h) | | | | | | | 3,217 | | | | 525,690 | |
Total Trust Preferreds — 0.4% | | | | | | | | | | | 933,636 | |
Total Preferred Securities — 3.5% | | | | | | | | | | | 7,352,693 | |
| | | | | | | | | | | | |
| U.S. Treasury Obligations | | | | | Par
(000) | | | | |
U.S. Treasury Inflation Indexed Notes: | | | | | | | | | | | | |
0.38%, 1/15/27 | | | USD | | | | 1,970 | | | | 1,935,546 | |
U.S. Treasury Notes: | | | | | | | | | | | | |
0.75%, 12/31/17 (l) | | | | | | | 2,500 | | | | 2,494,988 | |
1.13%, 7/31/21 | | | | | | | 453 | | | | 441,144 | |
1.88%, 4/30/22 | | | | | | | 7,200 | | | | 7,198,496 | |
1.75%, 5/31/22-6/30/22 | | | | | | | 14,012 | | | | 13,925,255 | |
2.25%, 2/15/27 | | | | | | | 4,185 | | | | 4,165,448 | |
Total U.S. Treasury Obligations — 14.3% | | | | | | | | | | | 30,160,877 | |
| | | | | | | | | | | | |
| Warrants | | | | | Shares | | | | |
Australia — 0.0% | | | | | | | | | | | | |
Quintis Ltd. (Issued/exercisable 8/01/11, 1 share for 1 warrant, Expires 7/15/18, Strike Price AUD 1.28) (a) | | | | | | | 124,320 | | | | 6,122 | |
Total Long-Term Investments (Cost — $177,438,149) — 89.4% | | | | | | | | | | | 188,924,392 | |
| | | | | | | | | | | | |
| Short-Term Securities | | | | | | | | | |
| Money Market Funds | | | | | Shares | | | Value | |
BlackRock Liquidity Funds, T-Fund, Institutional Class, 0.84% (n)(p) | | | | | | | 7,234,771 | | | $ | 7,234,771 | |
SL Liquidity Series, LLC, Money Market Series, 1.27% (n)(p)(q) | | | 4,799,010 | | | | 4,799,490 | |
Total Money Market Funds — 5.7% | | | | | | | | | | | 12,034,261 | |
| Time Deposits | | | | | Par (000) | | | | |
Canada — 0.0% | | | | | | | | | | | | |
Brown Brothers Harriman & Co., 0.05%, 7/03/17 | | | CAD | | | | 8 | | | | 8,327 | |
United Kingdom — 0.0% | | | | | | | | | | | | |
Brown Brothers Harriman & Co., 0.05%, 7/03/17 | | | GBP | | | | 3 | | | | 3,441 | |
Total Time Deposits — 0.0% | | | | | | | | | | | 11,768 | |
| | | | | | | | | | | | |
| U.S. Treasury Obligations | | | | | | | | | |
U.S. Treasury Bills (r): | | | | | | | | | | | | |
0.78%, 7/13/17 | | | USD | | | | 4,000 | | | | 3,999,140 | |
0.85%, 8/17/17 | | | | | | | 10,000 | | | | 9,988,701 | |
Total U.S. Treasury Obligations — 6.6% | | | | | | | | | | | 13,987,841 | |
Total Short-Term Securities (Cost — $26,034,383) — 12.3% | | | | | | | | | | | 26,033,870 | |
| | | |
Options Purchased | | | | | | | | | | | | |
(Cost — $875,154) — 0.4% | | | | | | | | | | | 844,057 | |
Total Investments Before Investments Sold Short and Options Written (Cost — $204,347,686) — 102.1% | | | | | | | | | | | 215,802,319 | |
| | | | | | | | | | | | |
| Investments Sold Short | | | | | Shares | | | | |
Canada — (0.3)% | | | | | | | | | | | | |
Bank of Montreal | | | | | | | 3,616 | | | | (265,512 | ) |
Royal Bank of Canada | | | | | | | 4,524 | | | | (328,485 | ) |
| | | | | | | | | | | | |
| | | | | | | | | | | | (593,997 | ) |
United States — (0.5)% | | | | | | | | | | | | |
Caterpillar, Inc. | | | | | | | 2,999 | | | | (322,273 | ) |
Procter & Gamble Co. | | | | | | | 3,613 | | | | (314,873 | ) |
Prologis, Inc. | | | | | | | 7,960 | | | | (466,774 | ) |
| | | | | | | | | | | | |
| | | | | | | | | | | | (1,103,920 | ) |
Total Investments Sold Short (Proceeds — $1,535,060) — (0.8)% | | | | | | | | | | | (1,697,917 | ) |
| | | | | | | | | | | | |
| Options Written | | | | | | | | | |
(Premiums Received — $402,403) — (0.2)% | | | | | | | | | | | (323,698 | ) |
Total Investments Net of Investments Sold Short and Options Written — 101.1% | | | | | | | | | | | 213,780,704 | |
Liabilities in Excess of Other Assets — (1.1)% | | | | | | | | | | | (2,375,722 | ) |
| | | | | | | | | | | | |
Net Assets — 100.0% | | | | | | | | | | $ | 211,404,982 | |
| | | | | | | | | | | | |
See Notes to Financial Statements.
| | | | | | |
| 70 | | BLACKROCK SERIES FUND, INC. | | JUNE 30, 2017 | | |
| | |
| Consolidated Schedule of Investments (continued) | | BlackRock Global Allocation Portfolio |
|
| Notes to Consolidated Schedule of Investments |
| (a) | Non-income producing security. |
| (b) | Security, or a portion of the security, is on loan. |
| (c) | Security exempt from registration pursuant to Rule 144A under the Securities Act of 1933, as amended. These securities may be resold in transactions exempt from registration to qualified institutional investors. |
| (d) | A security contractually bound to one or more other securities to form a single saleable unit which cannot be sold separately. |
| (e) | Security is valued using significant unobservable inputs and is classified as Level 3 in the fair value hierarchy. |
| (f) | Restricted security as to resale, excluding 144A securities. The Fund held restricted securities with a current value of $3,268,633, representing 1.5% of its net assets as of period end, and an original cost of $3,340,065. |
| (g) | Issuer filed for bankruptcy and/or is in default. |
| (i) | Step-up bond that pays an initial coupon rate for the first period and then a higher coupon rate for the following periods. Rate as of period end. |
| (j) | Payment-in-kind security which may pay interest/dividends in additional par/shares and/or in cash. Rates shown are the current rate and possible payment rates. |
| (k) | Variable rate security. Rate as of period end. |
| (l) | All or a portion of the security is held by a wholly-owned subsidiary. See Note 1 of the Notes to Consolidated Financial Statements for details on the wholly-owned subsidiary. |
| (m) | All or a portion of the security has been pledged as collateral in connection with outstanding OTC derivatives. |
| (n) | During the six months ended June 30, 2017, investments in issuers considered to be affiliates of the Fund for purposes of Section 2(a)(3) of the Investment Company Act of 1940, as amended, were as follows: |
| | | | | | | | | | | | | | | | | | | | | | | | | | | | | | | | |
| Affiliate | | Shares Held at
December 31, 2016 | | | Shares
Purchased | | | Shares
Sold | | | Shares Held at
June 30, 2017 | | | Value at
June 30,
2017 | | | Income | | | Net Realized
Gain | | | Change in
Unrealized
Appreciation
(Depreciation) | |
BlackRock Liquidity Funds, T-Fund, Institutional Class | | | 7,555,606 | | | | — | | | | (320,835 | )1 | | | 7,234,771 | | | $ | 7,234,771 | | | $ | 12,121 | | | | — | | | | — | |
iShares Gold Trust | | | 55,980 | | | | — | | | | — | | | | 55,980 | | | | 668,401 | | | | — | | | | — | | | | $48,143 | |
iShares iBoxx $ High Yield Corporate Bond ETF | | | 2,422 | | | | — | | | | (2,422 | ) | | | — | | | | — | | | | 1,856 | | | | $7,270 | | | | (6,984 | ) |
SL Liquidity Series, LLC, Money Market Series | | | 4,503,029 | | | | 295,981 | 2 | | | — | | | | 4,799,010 | | | | 4,799,490 | | | | 22,417 | 3 | | | 906 | | | | (199 | ) |
Total | | | | | | | | | | | | | | | | | | $ | 12,702,662 | | | $ | 36,394 | | | | $8,176 | | | | $40,960 | |
| | | | | | | | | | | | | | | | | | | | |
| | 1 | | Represents net shares sold. |
| | 2 | | Represents net shares purchased. |
| | 3 | | Represents securities lending income earned from the reinvestment of cash collateral from loaned securities, net of fees and collateral investment expenses, and other payments to and from borrowers of securities. |
| (o) | Perpetual security with no stated maturity date. |
| (p) | Current yield as of period end. |
| (q) | Security was purchased with the cash collateral from loaned securities. |
| (r) | Rates are discount rates or a range of discount rates at the time of purchase. |
|
| Derivative Financial Instruments Outstanding as of Period End |
Futures Contracts
| | | | | | | | | | | | | | | | |
Contracts
Long (Short) | | | Issue | | Expiration | | Notional Value | | | Unrealized
Appreciation
(Depreciation) | |
| | 18 | | | SGX Nifty 50 Index | | July 2017 | | USD | | | 342,666 | | | $ | (1,469 | ) |
| | (2 | ) | | Euro STOXX 50 Index | | September 2017 | | USD | | | 78,374 | | | | 2,418 | |
| | (7 | ) | | NASDAQ 100 E-Mini Index | | September 2017 | | USD | | | 791,385 | | | | 11,031 | |
| | (4 | ) | | Nikkei 225 Yen Index | | September 2017 | | USD | | | 356,790 | | | | (1,445 | ) |
| | (26 | ) | | Russell 2000 Mini Index | | September 2017 | | USD | | | 1,838,590 | | | | (8,155 | ) |
| | (6 | ) | | S&P 500 E-Mini Index | | September 2017 | | USD | | | 726,270 | | | | 5,085 | |
| | Total | | | | | | | | | | | | | $ | 7,465 | |
| | | | | | | | | | | | | | | | |
| | | | | | | | | | | | | | | | | | | | |
| | | |
Forward Foreign Currency Exchange Contracts | | | | | | | | |
Currency
Purchased | | | | | Currency
Sold | | | | | Counterparty | | Settlement
Date | | | Unrealized
Appreciation
(Depreciation) | |
| NOK | | | 1,673,000 | | | USD | | | 195,496 | | | Morgan Stanley & Co. International PLC | | | 7/27/17 | | | $ | 5,015 | |
| EUR | | | 610,000 | | | USD | | | 687,433 | | | Deutsche Bank AG | | | 8/31/17 | | | | 11,576 | |
| EUR | | | 610,000 | | | USD | | | 688,355 | | | UBS AG | | | 9/14/17 | | | | 11,200 | |
| EUR | | | 281,000 | | | PLN | | | 1,194,643 | | | Deutsche Bank AG | | | 9/26/17 | | | | 204 | |
| EUR | | | 472,000 | | | USD | | | 537,116 | | | Goldman Sachs International | | | 10/12/17 | | | | 5,034 | |
See Notes to Financial Statements.
| | | | | | |
| | | BLACKROCK SERIES FUND, INC. | | JUNE 30, 2017 | | 71 |
| | |
| Consolidated Schedule of Investments (continued) | | BlackRock Global Allocation Portfolio |
| | | | | | | | | | | | | | | | | | | | |
Currency
Purchased | | | | | Currency
Sold | | | | | Counterparty | | Settlement
Date | | | Unrealized
Appreciation
(Depreciation) | |
| EUR | | | 467,000 | | | USD | | | 532,735 | | | UBS AG | | | 10/19/17 | | | $ | 3,887 | |
| | | | | | | | | | | | | | | | | | | | |
| | | | | | | | | | | | | | | | | | | 36,916 | |
| | | | | | | | | | | | | | | | | | | | |
| USD | | | 485,344 | | | NZD | | | 703,000 | | | UBS AG | | | 9/07/17 | | | | (29,155 | ) |
| EUR | | | 188,000 | | | PLN | | | 801,012 | | | Deutsche Bank AG | | | 9/26/17 | | | | (335 | ) |
| USD | | | 189,560 | | | AUD | | | 254,000 | | | Deutsche Bank AG | | | 9/29/17 | | | | (5,436 | ) |
| USD | | | 479,882 | | | AUD | | | 650,000 | | | Citibank N.A. | | | 10/12/17 | | | | (19,042 | ) |
| USD | | | 472,138 | | | AUD | | | 640,000 | | | Goldman Sachs International | | | 10/12/17 | | | | (19,111 | ) |
| USD | | | 514,250 | | | NZD | | | 748,000 | | | JPMorgan Chase Bank N.A. | | | 10/19/17 | | | | (32,743 | ) |
| | | | | | | | | | | | | | | | | | | | |
| | | | | | | | | | | | | | | | | | | | (105,822 | ) |
| Net Unrealized Depreciation | | | | | | | | | $ | (68,906 | ) |
| | | | | | | | | | | | | | | | | | | | |
| | | | | | | | | | | | | | | | | | | | |
| | | | | | | | | | | | | | | | | |
Exchange-Traded Options Purchased
| | | | | | | | | | | | | | | | |
| Description | | Put/
Call | | | Expiration Date | | Strike Price | | Contracts | | Value | |
Wynn Resorts Ltd. | | | Call | | | 9/15/17 | | USD | | 140.00 | | 2 | | $ | 1,175 | |
OTC Options Purchased
| | | | | | | | | | | | | | | | | | | | | | | | | | |
| Description | | Put/ Call | | Counterparty | | Expiration Date | | Strike Price | | | Notional Amount (000) | | | Contracts | | | Value | |
TOPIX Index | | Call | | Goldman Sachs International | | 7/14/17 | | | JPY | | | | 1,600.00 | | | | — | | | | 66,062 | | | $ | 13,260 | |
SPDR Gold Trust ETF1 | | Call | | Morgan Stanley & Co.International PLC | | 7/21/17 | | | USD | | | | 121.00 | | | | — | | | | 6,026 | | | | 1,476 | |
SPDR Gold Trust ETF1 | | Call | | Morgan Stanley & Co. International PLC | | 7/21/17 | | | USD | | | | 123.00 | | | | — | | | | 3,515 | | | | 404 | |
TOPIX Index | | Call | | Société Générale | | 8/10/17 | | | JPY | | | | 1,600.00 | | | | — | | | | 66,842 | | | | 19,772 | |
SPDR Gold Trust ETF1 | | Call | | Morgan Stanley & Co. International PLC | | 8/18/17 | | | USD | | | | 121.00 | | | | — | | | | 5,685 | | | | 4,349 | |
GBP Currency | | Call | | JPMorgan Chase Bank N.A. | | 8/21/17 | | | USD | | | | 1.28 | | | | GBP 1,327 | | | | — | | | | 36,910 | |
EUR Currency | | Call | | UBS AG | | 9/08/17 | | | USD | | | | 1.14 | | | | EUR 1,344 | | | | — | | | | 25,869 | |
TOPIX Index | | Call | | UBS AG | | 9/08/17 | | | JPY | | | | 1,600.00 | | | | — | | | | 44,924 | | | | 16,953 | |
EUR Currency | | Call | | BNP Paribas S.A. | | 9/14/17 | | | USD | | | | 1.14 | | | | EUR 1,350 | | | | — | | | | 23,282 | |
ETFS Gold Trust1 | | Call | | Morgan Stanley & Co. International PLC | | 9/15/17 | | | USD | | | | 125.00 | | | | — | | | | 6,773 | | | | 5,418 | |
EUR Currency | | Call | | UBS AG | | 9/27/17 | | | USD | | | | 1.14 | | | | EUR 1,356 | | | | — | | | | 25,376 | |
SPDR Gold Trust ETF1 | | Call | | Morgan Stanley & Co. International PLC | | 9/29/17 | | | USD | | | | 122.00 | | | | — | | | | 7,586 | | | | 9,938 | |
SPDR Gold Trust ETF1 | | Call | | JPMorgan Chase Bank N.A. | | 10/20/17 | | | USD | | | | 122.00 | | | | — | | | | 4,701 | | | | 7,544 | |
USD Currency | | Call | | BNP Paribas S.A. | | 10/27/17 | | | BRL | | | | 3.19 | | | | USD 678 | | | | — | | | | 43,641 | |
SPDR Gold Trust ETF1 | | Call | | JPMorgan Chase Bank N.A. | | 11/17/17 | | | USD | | | | 120.00 | | | | — | | | | 5,787 | | | | 15,300 | |
Euro STOXX 50 Index | | Call | | Citibank N.A. | | 12/15/17 | | | EUR | | | | 3,650.00 | | | | — | | | | 169 | | | | 9,246 | |
SPDR Gold Trust ETF1 | | Call | | Morgan Stanley & Co. International PLC | | 12/15/17 | | | USD | | | | 120.00 | | | | — | | | | 5,447 | | | | 18,520 | |
Aflac, Inc. | | Call | | Goldman Sachs International | | 1/19/18 | | | USD | | | | 85.00 | | | | — | | | | 3,284 | | | | 2,693 | |
Allstate Corp. | | Call | | Goldman Sachs International | | 1/19/18 | | | USD | | | | 80.00 | | | | — | | | | 1,201 | | | | 11,890 | |
BB&T Corp. | | Call | | Goldman Sachs International | | 1/19/18 | | | USD | | | | 40.00 | | | | — | | | | 2,333 | | | | 14,523 | |
Capital One Financial Corp. | | Call | | Goldman Sachs International | | 1/19/18 | | | USD | | | | 80.00 | | | | — | | | | 2,388 | | | | 17,074 | |
Charles Schwab Corp. | | Call | | Goldman Sachs International | | 1/19/18 | | | USD | | | | 40.00 | | | | — | | | | 3,810 | | | | 19,812 | |
CIT Group, Inc. | | Call | | Goldman Sachs International | | 1/19/18 | | | USD | | | | 42.00 | | | | — | | | | 1,435 | | | | 10,834 | |
CME Group, Inc. | | Call | | Goldman Sachs International | | 1/19/18 | | | USD | | | | 115.00 | | | | — | | | | 1,337 | | | | 14,707 | |
E*Trade Financial Corp. | | Call | | Goldman Sachs International | | 1/19/18 | | | USD | | | | 35.00 | | | | — | | | | 5,115 | | | | 26,726 | |
Fifth Third Bancorp | | Call | | Goldman Sachs International | | 1/19/18 | | | USD | | | | 25.00 | | | | — | | | | 3,810 | | | | 9,182 | |
Franklin Resources, Inc. | | Call | | Goldman Sachs International | | 1/19/18 | | | USD | | | | 45.00 | | | | — | | | | 5,523 | | | | 14,360 | |
See Notes to Financial Statements.
| | | | | | |
| 72 | | BLACKROCK SERIES FUND, INC. | | JUNE 30, 2017 | | |
| | |
| Consolidated Schedule of Investments (continued) | | BlackRock Global Allocation Portfolio |
| | | | | | | | | | | | | | | | | | | | | | | | | | | | |
| Description | | Put/ Call | | | Counterparty | | Expiration Date | | | Strike Price | | | Notional
Amount (000) | | Contracts | | | Value | |
Manulife Financial Corp. | | | Call | | | Goldman Sachs International | | | 1/19/18 | | | | CAD | | | | 22.00 | | | — | | | 4,789 | | | $ | 9,749 | |
MetLife, Inc. | | | Call | | | Goldman Sachs International | | | 1/19/18 | | | | USD | | | | 52.50 | | | — | | | 3,810 | | | | 18,097 | |
SunTrust Banks, Inc. | | | Call | | | Goldman Sachs International | | | 1/19/18 | | | | USD | | | | 55.00 | | | — | | | 3,273 | | | | 15,301 | |
Synchrony Financial | | | Call | | | Goldman Sachs International | | | 1/19/18 | | | | USD | | | | 35.00 | | | — | | | 6,118 | | | | 4,283 | |
TD Ameritrade Holding Corp. | | | Call | | | Goldman Sachs International | | | 1/19/18 | | | | USD | | | | 40.00 | | | — | | | 6,173 | | | | 29,013 | |
Travelers Cos., Inc. | | | Call | | | Goldman Sachs International | | | 1/19/18 | | | | USD | | | | 135.00 | | | — | | | 2,240 | | | | 3,752 | |
Wells Fargo & Co. | | | Call | | | Goldman Sachs International | | | 1/19/18 | | | | USD | | | | 55.00 | | | — | | | 8,100 | | | | 27,135 | |
EUR Currency | | | Call | | | UBS AG | | | 3/27/18 | | | | USD | | | | 1.20 | | | EUR 5,338 | | | — | | | | 69,971 | |
EUR Currency | | | Call | | | Barclays Bank PLC | | | 5/18/18 | | | | USD | | | | 1.19 | | | EUR 2,690 | | | — | | | | 53,975 | |
Euro STOXX 50 Index | | | Call | | | Deutsche Bank AG | | | 9/21/18 | | | | EUR | | | | 3,426.55 | | | — | | | 77 | | | | 18,410 | |
BP PLC | | | Call | | | UBS AG | | | 1/18/19 | | | | USD | | | | 40.00 | | | — | | | 18,146 | | | | 17,057 | |
Chevron Corp. | | | Call | | | UBS AG | | | 1/18/19 | | | | USD | | | | 125.00 | | | — | | | 5,754 | | | | 11,537 | |
ConocoPhillips Co. | | | Call | | | UBS AG | | | 1/18/19 | | | | USD | | | | 52.50 | | | — | | | 9,378 | | | | 22,038 | |
Exxon Mobil Corp. | | | Call | | | UBS AG | | | 1/18/19 | | | | USD | | | | 95.00 | | | — | | | 3,912 | | | | 5,359 | |
Occidental Petroleum Corp. | | | Call | | | UBS AG | | | 1/18/19 | | | | USD | | | | 75.00 | | | — | | | 8,407 | | | | 9,752 | |
Royal Dutch Shell PLC - ADR, Class A | | | Call | | | UBS AG | | | 1/18/19 | | | | USD | | | | 60.00 | | | — | | | 10,358 | | | | 13,983 | |
Schlumberger Ltd. | | | Call | | | UBS AG | | | 1/18/19 | | | | USD | | | | 90.00 | | | — | | | 5,663 | | | | 4,247 | |
Suncor Energy, Inc. | | | Call | | | UBS AG | | | 1/18/19 | | | | USD | | | | 35.00 | | | — | | | 12,217 | | | | 14,172 | |
TOTAL SA - ADR | | | Call | | | UBS AG | | | 1/18/19 | | | | USD | | | | 60.00 | | | — | | | 12,477 | | | | 8,110 | |
Total | | | | | | | | | | | | | | | | | | | | | | | | | | $ | 775,000 | |
| | | | | | | | | | | | | | | | | | | | | | | | | | | | |
| | 1 | | All or a portion of the security is held by a wholly-owned subsidiary. See Note 1 of the Notes to Consolidated Financial Statements for details on the wholly-owned subsidiary. |
OTC Interest Rate Swaptions Purchased
| | | | | | | | | | | | | | | | | | | | | | | | | | | | | | | | | | | | |
| Description | | Counterparty | | | Put/
Call | | | Exercise Rate | | | Pay/Receive
Exercise Rate | | | Floating Rate Index | | | Expiration
Date | | | Notional Amount (000) | | | Value | |
10-Year Interest Rate Swap | | | Bank of America N.A. | | | | Call | | | | 2.06% | | | | Receive | | | | 3-month LIBOR | | | | 9/05/17 | | | | USD | | | | 2,720 | | | $ | 7,718 | |
10-Year Interest Rate Swap | | | Bank of America N.A. | | | | Call | | | | 2.10% | | | | Receive | | | | 3-month LIBOR | | | | 10/16/17 | | | | USD | | | | 2,719 | | | | 15,263 | |
30-Year Interest Rate Swap | | | Goldman Sachs International | | | | Put | | | | 1.50% | | | | Pay | | | | 6-month EURIBOR | | | | 7/10/17 | | | | EUR | | | | 501 | | | | 8,356 | |
5-Year Interest Rate Swap | | | Goldman Sachs International | | | | Put | | | | 0.46% | | | | Pay | | | | 6-month EURIBOR | | | | 10/03/17 | | | | EUR | | | | 5,387 | | | | 13,478 | |
5-Year Interest Rate Swap | | | Deutsche Bank AG | | | | Put | | | | 1.07% | | | | Pay | | | | 6-month JPY LIBOR | | | | 4/04/18 | | | | JPY | | | | 64,546 | | | | 42 | |
30-Year Interest Rate Swap | | | Goldman Sachs International | | | | Put | | | | 2.75% | | | | Pay | | | | 3-month LIBOR | | | | 5/02/18 | | | | USD | | | | 637 | | | | 23,025 | |
Total | | | | | | | | | | | | | | | | | | | | | | | | | | | | | | | | | | $ | 67,882 | |
| | | | | | | | | | | | | | | | | | | | | | | | | | | | | | | | | | | | |
|
| |
| Exchange-Traded Options Written |
| | | | | | | | | | | | |
| Description | | Put/
Call | | Expiration Date | | Strike Price | | Contracts | | Value |
| Wynn Resorts Ltd. | | Put | | 9/15/17 | | USD | | 125.00 | | 2 | | $(985) |
OTC Barrier Options Written
| | | | | | | | | | | | | | | | | | | | | | | | | | | | | | | | | | |
| Description | | Put/ Call | | | Type of Option | | | Counterparty | | | Expiration Date | | Strike Price | | | Barrier Price | | | Contracts | | | Value | |
Euro STOXX 50 Index | | | Put | | | | Down-and-In | | | | Deutsche Bank AG | | | 9/21/18 | | | EUR | | | | 2,586.07 | | | | EUR 2,165.83 | | | | 77 | | | $ | (5,142 | ) |
See Notes to Financial Statements.
| | | | | | |
| | | BLACKROCK SERIES FUND, INC. | | JUNE 30, 2017 | | 73 |
| | | | |
| Consolidated Schedule of Investments (continued) | | | BlackRock Global Allocation Portfolio | |
OTC Options Written
| | | | | | | | | | | | | | | | | | | | | | | | | | | | |
| Description | | Put/
Call | | | Counterparty | | Expiration
Date | | Strike Price | | | Notional
Amount
(000) | | | Contracts | | | Value | |
TOPIX Index | | | Call | | | Société Générale | | 8/10/17 | | | JPY | | | | 1,700.00 | | | | — | | | | 66,842 | | | $ | (1,029 | ) |
GBP Currency | | | Call | | | JPMorgan Chase Bank N.A. | | 8/21/17 | | | USD | | | | 1.34 | | | | GBP 2,654 | | | | — | | | | (8,462 | ) |
USD Currency | | | Call | | | Deutsche Bank AG | | 8/24/17 | | | ZAR | | | | 13.95 | | | | USD 673 | | | | — | | | | (5,632 | ) |
TOPIX Index | | | Call | | | UBS AG | | 9/08/17 | | | JPY | | | | 1,750.00 | | | | — | | | | 44,924 | | | | (614 | ) |
ETFS Gold Trust1 | | | Call | | | Morgan Stanley & Co. International PLC | | 9/15/17 | | | USD | | | | 140.00 | | | | — | | | | 6,773 | | | | (1,016 | ) |
SPDR Gold Trust ETF1 | | | Call | | | JPMorgan Chase Bank N.A. | | 10/20/17 | | | USD | | | | 146.00 | | | | — | | | | 4,701 | | | | (558 | ) |
USD Currency | | | Call | | | BNP Paribas S.A. | | 10/27/17 | | | BRL | | | | 3.55 | | | | USD 1,356 | | | | — | | | | (20,066 | ) |
SPDR Gold Trust ETF1 | | | Call | | | JPMorgan Chase Bank N.A. | | 11/17/17 | | | USD | | | | 137.00 | | | | — | | | | 5,787 | | | | (2,425 | ) |
SPDR Gold Trust ETF1 | | | Call | | | Morgan Stanley & Co. International PLC | | 12/15/17 | | | USD | | | | 137.00 | | | | — | | | | 5,447 | | | | (2,669 | ) |
TOPIX Index | | | Put | | | Goldman Sachs International | | 7/14/17 | | | JPY | | | | 1,475.00 | | | | — | | | | 33,031 | | | | (234 | ) |
EUR Currency | | | Put | | | UBS AG | | 9/08/17 | | | USD | | | | 1.07 | | | | EUR 1,344 | | | | — | | | | (391 | ) |
SPDR Gold Trust ETF1 | | | Put | | | Morgan Stanley & Co. International PLC | | 9/29/17 | | | USD | | | | 105.00 | | | | — | | | | 7,586 | | | | (1,050 | ) |
SPDR Gold Trust ETF1 | | | Put | | | JPMorgan Chase Bank N.A. | | 10/20/17 | | | USD | | | | 105.00 | | | | — | | | | 4,701 | | | | (1,053 | ) |
USD Currency | | | Put | | | BNP Paribas S.A. | | 10/27/17 | | | BRL | | | | 3.00 | | | | USD 678 | | | | — | | | | (675 | ) |
SPDR Gold Trust ETF1 | | | Put | | | JPMorgan Chase Bank N.A. | | 11/17/17 | | | USD | | | | 103.00 | | | | — | | | | 5,787 | | | | (1,627 | ) |
BP PLC | | | Put | | | UBS AG | | 1/18/19 | | | USD | | | | 25.00 | | | | — | | | | 18,146 | | | | (18,872 | ) |
Chevron Corp. | | | Put | | | UBS AG | | 1/18/19 | | | USD | | | | 80.00 | | | | — | | | | 5,754 | | | | (19,564 | ) |
ConocoPhillips Co. | | | Put | | | UBS AG | | 1/18/19 | | | USD | | | | 35.00 | | | | — | | | | 9,378 | | | | (22,601 | ) |
Exxon Mobil Corp. | | | Put | | | UBS AG | | 1/18/19 | | | USD | | | | 60.00 | | | | — | | | | 3,912 | | | | (7,159 | ) |
Occidental Petroleum Corp. | | | Put | | | UBS AG | | 1/18/19 | | | USD | | | | 45.00 | | | | — | | | | 8,407 | | | | (18,411 | ) |
Royal Dutch Shell PLC - ADR, Class A | | | Put | | | UBS AG | | 1/18/19 | | | USD | | | | 40.00 | | | | — | | | | 10,358 | | | | (18,644 | ) |
Schlumberger Ltd. | | | Put | | | UBS AG | | 1/18/19 | | | USD | | | | 60.00 | | | | — | | | | 5,663 | | | | (29,164 | ) |
Suncor Energy, Inc. | | | Put | | | UBS AG | | 1/18/19 | | | USD | | | | 25.00 | | | | — | | | | 12,217 | | | | (27,610 | ) |
TOTAL SA - ADR | | | Put | | | UBS AG | | 1/18/19 | | | USD | | | | 40.00 | | | | — | | | | 12,477 | | | | (31,193 | ) |
Total | | | | | | | | | | | | | | | | | | | | | | | | | | $ | (240,719 | ) |
| | | | | | | | | | | | | | | | | | | | | | | | | | | | |
| | 1 | | All or a portion of the security is held by a wholly-owned subsidiary. See Note 1 of the Notes to Consolidated Financial Statements for details on the wholly-owned subsidiary. |
OTC Interest Rate Swaptions Written
| | | | | | | | | | | | | | | | | | | | | | | | |
| Description | | Counterparty | | Put/
Call | | | Exercise Rate | | Pay/Receive
Exercise Rate | | Floating Rate
Index | | Expiration
Date | | Notional
Amount (000) | | | Value | |
10-Year Interest Rate Swap | | Bank of America N.A. | | | Call | | | 1.81% | | Pay | | 3-month LIBOR | | 9/05/17 | | USD | | | 2,720 | | | $ | (1,940 | ) |
10-Year Interest Rate Swap | | Bank of America N.A. | | | Call | | | 1.85% | | Pay | | 3-month LIBOR | | 10/16/17 | | USD | | | 2,719 | | | | (5,464 | ) |
10-Year Interest Rate Swap | | Bank of America N.A. | | | Put | | | 2.51% | | Receive | | 3-month LIBOR | | 9/05/17 | | USD | | | 2,720 | | | | (7,884 | ) |
5-Year Interest Rate Swap | | Goldman Sachs International | | | Put | | | 0.76% | | Receive | | 6-month EURIBOR | | 10/03/17 | | EUR | | | 5,387 | | | | (2,357 | ) |
10-Year Interest Rate Swap | | Bank of America N.A. | | | Put | | | 2.42% | | Receive | | 3-month LIBOR | | 10/16/17 | | USD | | | 2,719 | | | | (22,990 | ) |
5-Year Forward/5-Year Interest Rate Swap | | Goldman Sachs International | | | Put | | | 2.70% | | Receive | | 3-month LIBOR | | 11/02/17 | | USD | | | 3,264 | | | | (21,554 | ) |
5-Year Interest Rate Swap | | Goldman Sachs International | | | Put | | | 2.50% | | Receive | | 3-month LIBOR | | 5/02/18 | | USD | | | 2,912 | | | | (14,663 | ) |
Total | | | | | | | | | | | | | | | | | | | | | | $ | (76,852 | ) |
| | | | | | | | | | | | | | | | | | | | | | | | |
See Notes to Financial Statements.
| | | | | | |
| 74 | | BLACKROCK SERIES FUND, INC. | | JUNE 30, 2017 | | |
| | | | |
| Consolidated Schedule of Investments (continued) | | | BlackRock Global Allocation Portfolio | |
Centrally Cleared Credit Default Swaps — Buy Protection
| | | | | | | | | | | | | | | | | | | | |
| Index | | Pay Fixed Rate | | | Expiration Date | | | Notional Amount (000) | | | Unrealized Appreciation (Depreciation) | |
CDX.NA.HY.27.V2 | | | 5.00% | | | | 12/20/21 | | | | USD | | | | 126 | | | $ | (1,421 | ) |
CDX.NA.HY.28.V1 | | | 5.00% | | | | 6/20/22 | | | | USD | | | | 114 | | | | 247 | |
Total | | | | | | | | | | | | | | | | | | $ | (1,174 | ) |
| | | | | | | | | | | | | | | | | | | | |
Centrally Cleared Interest Rate Swaps
| | | | | | | | | | | | | | | | |
Fixed Rate | | Floating Rate | | Effective Date | | Expiration Date | | | | | Notional
Amount (000) | | Unrealized
Appreciation
(Depreciation) | |
0.42%1 | | 6-month EURIBOR | | 3/07/182 | | 3/07/23 | | | EUR | | | 2,368 | | | $ 5,019 | |
2.40%3 | | 3-month LIBOR | | 3/07/182 | | 3/07/23 | | | USD | | | 2,675 | | | 38,913 | |
0.37%1 | | 6-month EURIBOR | | N/A | | 8/15/26 | | | EUR | | | 900 | | | 37,286 | |
3.03%1 | | 3-month LIBOR | | 4/19/222 | | 4/19/27 | | | USD | | | 3,568 | | | (63,639 | ) |
Total | | | | | | | | | | | | | | | $17,579 | |
| | | | | | | | | | | | | | | | |
| | 1 | | The Fund pays the fixed rate and receives the floating rate. |
| | 3 | | The Fund pays the floating rate and receives the fixed rate. |
| | | | | | | | | | | | | | | | | | | | | | | | | | | | |
| | | | | Notional Amount (000) | | | | | | | | | | | | | |
Fund Pays | | Fund Receives | | Notional
Delivered | | | Notional
Received | | | Counterparty | | Expiration
Date1 | | Value | | | Premiums Paid (Received) | | Unrealized
Appreciation | |
0.10% JPY | | 1.84% | | | JPY 49,750 | | | | USD | | | | 442 | | | Bank of America N.A. | | 3/15/2018 | | $ | 4,351 | | | — | | | $ 4,351 | |
0.10% JPY | | 1.96% | | | JPY 74,550 | | | | USD | | | | 657 | | | Bank of America N.A. | | 3/15/2018 | | | 2,737 | | | — | | | 2,737 | |
0.10% JPY | | 2.01% | | | JPY 130,500 | | | | USD | | | | 1,261 | | | Bank of America N.A. | | 10/15/2018 | | | 112,493 | | | — | | | 112,493 | |
Total | | | | | | | | | | | | | | | | | | | | $ | 119,581 | | | — | | | $119,581 | |
| | | | | | | | | | | | | | | | | | | | | | |
| | 1 | | At expiration date, the notional amount delivered will be exchanged for the notional amount received. |
OTC Total Return Swaps
| | | | | | | | | | | | | | | | | | |
| Reference Entity | | Fixed Amount/ Floating Rate | | Counterparty | | Expiration Date | | Contract Amount | | Value | | | Premiums Paid (Received) | | Unrealized Appreciation (Depreciation) | |
SGX Nikkei Stock Average Dividend Point Index Future December 2017 | | JPY 13,220,4001 | | BNP Paribas S.A. | | 4/02/18 | | JPY 4 | | $ | 12,444 | | | — | | | $12,444 | |
SGX Nikkei Stock Average Dividend Point Index Future December 2017 | | JPY 6,675,0001 | | BNP Paribas S.A. | | 4/02/18 | | JPY 2 | | | 5,646 | | | — | | | 5,646 | |
Euro STOXX 50 Index Dividend Future December 2018 | | EUR 90,7801 | | BNP Paribas S.A. | | 12/21/18 | | EUR 8 | | | 7,972 | | | — | | | 7,972 | |
Euro STOXX 50 Index Dividend Future December 2018 | | EUR 67,8001 | | BNP Paribas S.A. | | 12/21/18 | | EUR 6 | | | 6,305 | | | — | | | 6,305 | |
Euro STOXX 50 Index Dividend Future December 2018 | | EUR 54,6501 | | BNP Paribas S.A. | | 12/21/18 | | EUR 5 | | | 7,367 | | | — | | | 7,367 | |
See Notes to Financial Statements.
| | | | | | |
| | | BLACKROCK SERIES FUND, INC. | | JUNE 30, 2017 | | 75 |
| | | | |
| Consolidated Schedule of Investments (continued) | | | BlackRock Global Allocation Portfolio | |
| | | | | | | | | | | | | | | | | | |
| Reference Entity | | Fixed Amount/ Floating Rate | | Counterparty | | Expiration Date | | Contract Amount | | Value | | | Premiums Paid (Received) | | Unrealized Appreciation (Depreciation) | |
S&P 500 Annual Dividend Index Future December 2018 | | USD 140,2501 | | BNP Paribas S.A. | | 12/21/18 | | USD 12 | | $ | 16,350 | | | — | | | $16,350 | |
SGX Nikkei Stock Average Dividend Point Index Future December 2018 | | JPY 13,676,0001 | | BNP Paribas S.A. | | 4/01/19 | | JPY 4 | | | 20,093 | | | — | | | 20,093 | |
SGX Nikkei Stock Average Dividend Point Index Future December 2018 | | JPY 6,875,0001 | | BNP Paribas S.A. | | 4/01/19 | | JPY 2 | | | 9,718 | | | — | | | 9,718 | |
Euro STOXX 50 Index Dividend Future December 2019 | | EUR 70,7701 | | BNP Paribas S.A. | | 12/20/19 | | EUR 7 | | | 14,871 | | | — | | | 14,871 | |
Euro STOXX 50 Index Dividend Future December 2019 | | EUR 61,0201 | | BNP Paribas S.A. | | 12/20/19 | | EUR 6 | | | 12,335 | | | — | | | 12,335 | |
Euro STOXX 50 Index Dividend Future December 2019 | | EUR 51,6001 | | BNP Paribas S.A. | | 12/20/19 | | EUR 5 | | | 9,708 | | | — | | | 9,708 | |
Euro STOXX 50 Index Dividend Future December 2019 | | EUR 30,1501 | | BNP Paribas S.A. | | 12/20/19 | | EUR 3 | | | 6,579 | | | — | | | 6,579 | |
SGX Nikkei Stock Average Dividend Point Index Future December 2019 | | JPY 10,200,0001 | | BNP Paribas S.A. | | 4/01/20 | | JPY 3 | | | 21,872 | | | — | | | 21,872 | |
SGX Nikkei Stock Average Dividend Point Index Future December 2019 | | JPY 6,980,0001 | | BNP Paribas S.A. | | 4/01/20 | | JPY 2 | | | 12,981 | | | — | | | 12,981 | |
SGX Nikkei Stock Average Dividend Point Index Future December 2019 | | JPY 6,992,0001 | | BNP Paribas S.A. | | 4/01/20 | | JPY 2 | | | 12,874 | | | — | | | 12,874 | |
Euro STOXX 50 Index Dividend Future December 2020 | | EUR 58,1401 | | BNP Paribas S.A. | | 12/18/20 | | EUR 6 | | | 12,815 | | | — | | | 12,815 | |
Euro STOXX 50 Index Dividend Future December 2020 | | EUR 53,4501 | | BNP Paribas S.A. | | 12/18/20 | | EUR 5 | | | 5,025 | | | — | | | 5,025 | |
Euro STOXX 50 Index Dividend Future December 2020 | | EUR 38,5201 | | BNP Paribas S.A. | | 12/18/20 | | EUR 4 | | | 8,863 | | | — | | | 8,863 | |
Euro STOXX 50 Index Dividend Future December 2020 | | EUR 19,2401 | | BNP Paribas S.A. | | 12/18/20 | | EUR 2 | | | 4,454 | | | — | | | 4,454 | |
Euro STOXX 50 Index Dividend Future December 2020 | | EUR 19,2801 | | BNP Paribas S.A. | | 12/18/20 | | EUR 2 | | | 4,409 | | | — | | | 4,409 | |
Euro STOXX 50 Index Dividend Future December 2020 | | EUR 19,2401 | | BNP Paribas S.A. | | 12/18/20 | | EUR 2 | | | 4,272 | | | — | | | 4,272 | |
Euro STOXX 50 Index Dividend Future December 2020 | | EUR 9,6201 | | BNP Paribas S.A. | | 12/18/20 | | EUR 1 | | | 2,250 | | | — | | | 2,250 | |
See Notes to Financial Statements.
| | | | | | |
| 76 | | BLACKROCK SERIES FUND, INC. | | JUNE 30, 2017 | | |
| | | | |
| Consolidated Schedule of Investments (continued) | | | BlackRock Global Allocation Portfolio | |
| | | | | | | | | | | | | | | | | | | | | | |
| Reference Entity | | Fixed Amount/ Floating Rate | | Counterparty | | Expiration Date | | | Contract Amount | | | Value | | | Premiums Paid (Received) | | Unrealized Appreciation (Depreciation) | |
S&P 500 Annual Dividend Index Future December 2020 | | USD 59,9691 | | Goldman Sachs International | | | 12/18/20 | | | | USD 5 | | | $ | 8,656 | | | — | | | $ 8,656 | |
SGX Nikkei Stock Average Dividend Point Index Future December 2020 | | JPY 7,760,0001 | | BNP Paribas S.A. | | | 4/01/21 | | | | JPY 2 | | | | 6,828 | | | — | | | 6,828 | |
SGX Nikkei Stock Average Dividend Point Index Future December 2020 | | JPY 3,827,5001 | | BNP Paribas S.A. | | | 4/01/21 | | | | JPY 1 | | | | 3,881 | | | — | | | 3,881 | |
SGX Nikkei Stock Average Dividend Point Index Future December 2020 | | JPY 3,855,0001 | | BNP Paribas S.A. | | | 4/01/21 | | | | JPY 1 | | | | 3,636 | | | — | | | 3,636 | |
SGX Nikkei Stock Average Dividend Point Index Future December 2020 | | JPY 4,215,0001 | | BNP Paribas S.A. | | | 4/01/21 | | | | JPY 1 | | | | 436 | | | — | | | 436 | |
Euro STOXX 50 Index Dividend Future December 2021 | | EUR 30,9001 | | BNP Paribas S.A. | | | 12/17/21 | | | | EUR 3 | | | | 2,775 | | | — | | | 2,775 | |
Euro STOXX 50 Index Dividend Future December 2021 | | EUR 33,8701 | | BNP Paribas S.A. | | | 12/17/21 | | | | EUR 3 | | | | (514 | ) | | — | | | (514 | ) |
Euro STOXX 50 Index Dividend Future December 2021 | | EUR 21,3601 | | BNP Paribas S.A. | | | 12/17/21 | | | | EUR 2 | | | | 1,051 | | | — | | | 1,051 | |
S&P 500 Annual Dividend Index Future December 2021 | | USD 72,8251 | | BNP Paribas S.A. | | | 12/17/21 | | | | USD 6 | | | | 12,000 | | | — | | | 12,000 | |
SGX Nikkei Stock Average Dividend Point Index Future December 2021 | | JPY 7,860,0001 | | BNP Paribas S.A. | | | 4/01/22 | | | | JPY 2 | | | | 6,633 | | | — | | | 6,633 | |
SGX Nikkei Stock Average Dividend Point Index Future December 2021 | | JPY 3,975,0001 | | BNP Paribas S.A. | | | 4/01/22 | | | | JPY 1 | | | | 2,916 | | | — | | | 2,916 | |
SGX Nikkei Stock Average Dividend Point Index Future December 2021 | | JPY 3,985,0001 | | BNP Paribas S.A. | | | 4/01/22 | | | | JPY 1 | | | | 2,827 | | | — | | | 2,827 | |
SGX Nikkei Stock Average Dividend Point Index Future December 2021 | | JPY 4,260,0001 | | BNP Paribas S.A. | | | 4/01/22 | | | | JPY 1 | | | | 382 | | | — | | | 382 | |
Euro STOXX 50 Index Dividend Future December 2022 | | EUR 33,2401 | | BNP Paribas S.A. | | | 12/16/22 | | | | EUR 3 | | | | (788 | ) | | — | | | (788 | ) |
Euro STOXX 50 Index Dividend Future December 2022 | | EUR 32,6701 | | BNP Paribas S.A. | | | 12/16/22 | | | | EUR 3 | | | | (137 | ) | | — | | | (137 | ) |
SGX Nikkei Stock Average Dividend Point Index Future December 2022 | | JPY 4,230,0001 | | BNP Paribas S.A. | | | 4/03/23 | | | | JPY 1 | | | | 1,218 | | | — | | | 1,218 | |
Total | | | | | | | | | | | | | | $ | 271,003 | | | — | | | $271,003 | |
| | | | | | | | | | | | | | | | |
| | 1 | | The Fund receives the total return of the reference entity and pays the fixed amount. Net payment made at termination. |
See Notes to Financial Statements.
| | | | | | |
| | | BLACKROCK SERIES FUND, INC. | | JUNE 30, 2017 | | 77 |
| | | | |
| Consolidated Schedule of Investments (continued) | | | BlackRock Global Allocation Portfolio | |
|
| Transactions in Options Written for the Six Months Ended June 30, 2017 |
| | | | | | | | | | | | | | | | | | | | | | | | |
| | | Calls | |
| | | | | | Notional (000) | | | | |
| | | Contracts | | | EUR | | | GBP | | | NZD | | | USD | | | Premiums Received | |
| | | | |
Outstanding options, beginning of period | | | 65,880 | | | | 2,419 | | | | — | | | | 912 | | | | 5,776 | | | | $178,602 | |
Options written | | | 230,853 | | | | — | | | | 2,654 | | | | — | | | | 73,338 | | | | 319,365 | |
Options exercised | | | (5,419 | ) | | | — | | | | — | | | | — | | | | — | | | | (34,795) | |
Options expired | | | (46,394 | ) | | | — | | | | — | | | | (912 | ) | | | (6,515 | ) | | | (117,473) | |
Options closed | | | (110,446 | ) | | | (2,419 | ) | | | — | | | | — | | | | (65,131 | ) | | | (247,795) | |
| | | | |
Outstanding options, end of period | | | 134,474 | | | | — | | | | 2,654 | | | | — | | | | 7,468 | | | | $97,904 | |
| | | | |
| | | | | | | | | | | | | | | | | | | | |
| | | Puts | |
| | | | |
| | | | | | Notional (000) | | | | |
| | | Contracts | | | EUR | | | NZD | | | USD | | | Premiums Received | |
| | | | |
Outstanding options, beginning of period | | | 18,967 | | | | 5,506 | | | | 912 | | | | 25,142 | | | | $ 300,609 | |
Options written | | | 193,423 | | | | 12,048 | | | | — | | | | 38,235 | | | | 560,086 | |
Options exercised | | | — | | | | — | | | | — | | | | — | | | | — | |
Options expired | | | (4,540 | ) | | | (2,168) | | | | (912) | | | | (6,569) | | | | (162,910) | |
Options closed | | | (70,354 | ) | | | (8,655) | | | | — | | | | (44,515) | | | | (393,286) | |
| | | | |
Outstanding options, end of period | | | 137,496 | | | | 6,731 | | | | — | | | | 12,293 | | | | $ 304,499 | |
| | | | |
| | As of period end, the value of portfolio holdings subject to covered call options written was $2,566,377. |
|
| Derivative Financial Instruments Categorized by Risk Exposure |
As of period end, the fair values of derivative financial instruments located in the Statements of Assets and Liabilities were as follows:
| | | | | | | | | | | | | | | | | | | | | | | | | | |
| | | Commodity
Contracts | | Credit
Contracts | | | Equity
Contracts | | | Foreign
Currency
Exchange
Contracts | | | Interest
Rate
Contracts | | | Other
Contracts | | Total | |
| Assets - Derivative Financial Instruments | |
Futures contracts | | Net unrealized appreciation1 | | — | | | — | | | | $ 18,534 | | | | — | | | | — | | | — | | | $ 18,534 | |
Forward foreign currency exchange
contracts | | Unrealized appreciation on forward foreign currency exchange contracts | | — | | | — | | | | — | | | | $ 36,916 | | | | — | | | — | | | 36,916 | |
Options purchased | | Investments at value - unaffiliated2 | | — | | | — | | | | 497,151 | | | | 279,024 | | | | $ 67,882 | | | — | | | 844,057 | |
Swaps - centrally cleared | | Net unrealized appreciation1 | | — | | | $ 247 | | | | — | | | | — | | | | 81,218 | | | — | | | 81,465 | |
Swaps - OTC | | Unrealized appreciation on OTC swaps | | — | | | — | | | | 272,442 | | | | — | | | | 119,581 | | | — | | | 392,023 | |
| | | |
Total | | | | — | | | $ 247 | | | | $788,127 | | | | $315,940 | | | | $268,681 | | | — | | | $1,372,995 | |
| | | |
| Liabilities - Derivative Financial Instruments | |
Futures contracts | | Net unrealized depreciation1 | | — | | | — | | | | $ 11,069 | | | | — | | | | — | | | — | | | $ 11,069 | |
Forward foreign currency exchange
contracts | | Unrealized depreciation on forward foreign currency exchange contracts | | — | | | — | | | | — | | | | $105,822 | | | | — | | | — | | | 105,822 | |
Options written | | Options written, at value | | — | | | — | | | | 211,620 | | | | 35,226 | | | | $ 76,852 | | | — | | | 323,698 | |
Swaps - centrally cleared | | Net unrealized depreciation1 | | — | | | $1,421 | | | | — | | | | — | | | | 63,639 | | | — | | | 65,060 | |
Swaps - OTC | | Unrealized depreciation on OTC swaps | | — | | | — | | | | 1,439 | | | | — | | | | — | | | — | | | 1,439 | |
| | | |
Total | | | | — | | | $1,421 | | | | $224,128 | | | | $141,048 | | | | $140,491 | | | — | | | $ 507,088 | |
| | | |
| | 1 | | Includes cumulative appreciation (depreciation) on futures contracts and centrally cleared swaps, if any, as reported in the Consolidated Schedule of Investments. Only current day’s variation margin is reported within the Consolidated Statements of Assets and Liabilities. |
| | 2 | | Includes options purchased at value as reported in the Consolidated Schedule of Investments. |
See Notes to Financial Statements.
| | | | | | |
| 78 | | BLACKROCK SERIES FUND, INC. | | JUNE 30, 2017 | | |
| | | | |
| Consolidated Schedule of Investments (continued) | | | BlackRock Global Allocation Portfolio | |
For the six months ended June 30, 2017, the effect of derivative financial instruments in the Statements of Operations were as follows:
| | | | | | | | | | | | | | | | | | | | | | | | |
| Net Realized Gain (Loss) from: | | Commodity
Contracts | | Credit
Contracts | | | Equity
Contracts | | | Foreign
Currency
Exchange
Contracts | | | Interest
Rate
Contracts | | | Other
Contracts | | Total | |
Futures contracts | | — | | | — | | | $ | (572,628 | ) | | | — | | | | — | | | — | | $ | (572,628) | |
Foreign currency transactions | | — | | | — | | | | — | | | $ | 592,462 | | | | — | | | — | | | 592,462 | |
Options purchased1 | | — | | | — | | | | 533,457 | | | | (108,966 | ) | | $ | 40,382 | | | — | | | 464,873 | |
Options written | | — | | | — | | | | 69,382 | | | | 267,126 | | | | (86,387 | ) | | — | | | 250,121 | |
Swaps | | — | | | $66,309 | | | | 83,401 | | | | 65 | | | | (98,150 | ) | | — | | | 51,625 | |
| | | |
Total | | — | | | $66,309 | | | $ | 113,612 | | | $ | 750,687 | | | $ | (144,155 | ) | | — | | $ | 786,453 | |
| | | |
| | | | | | | | | | | | | | | | | | | | | | | | |
Net Change in Unrealized Appreciation (Depreciation) on: | | | | | | | | | | | | | | | | | | | |
Futures contracts | | — | | | — | | | $ | 26,496 | | | | — | | | | — | | | — | | $ | 26,496 | |
Foreign currency translations | | — | | | — | | | | — | | | $ | (1,438,022 | ) | | | — | | | — | | | (1,438,022) | |
Options purchased1 | | — | | | — | | | | (1,331,255 | ) | | | (49,879 | ) | | $ | (160,030 | ) | | — | | | (1,541,164) | |
Options written | | — | | | — | | | | (16,175 | ) | | | 61,279 | | | | 188,935 | | | — | | | 234,039 | |
Swaps | | — | | $ | (37,473 | ) | | | 92,477 | | | | — | | | | 142,690 | | | — | | | 197,694 | |
| | | |
Total | | — | | $ | (37,473 | ) | | $ | (1,228,457 | ) | | $ | (1,426,622 | ) | | $ | 171,595 | | | — | | $ | (2,520,957) | |
| | | |
| | 1 | | Options purchased are included in the net realized gain (loss) from investments and the net change in unrealized appreciation (depreciation) on investments. |
|
| Average Quarterly Balances of Outstanding Derivative Financial Instruments |
| | | | |
Futures contracts: | | | | |
Average notional value of contracts - long | | $ | 336,897 | |
Average notional value of contracts - short | | $ | 4,248,773 | |
Forward foreign currency exchange contracts: | | | | |
Average amounts purchased - in USD | | $ | 7,072,488 | |
Average amounts sold - USD | | $ | 2,464,306 | |
Options: | | | | |
Average value of option contracts purchased | | $ | 1,214,901 | |
Average value of option contracts written | | $ | 279,898 | |
Average notional value of swaption contracts purchased | | $ | 25,952,383 | |
Average notional value of swaption contracts written | | $ | 31,053,387 | |
Credit default swaps: | | | | |
Average notional value - buy protection | | $ | 228,000 | |
Interest rate swaps: | | | | |
Average notional value - pays fixed rate | | $ | 7,867,122 | |
Average notional value - receives fixed rate | | $ | 8,648,000 | |
Currency swaps: | | | | |
Average notional value - pays | | $ | 2,360,000 | |
Average notional value - receives | | $ | 2,277,042 | |
Total return swaps: | | | | |
Average notional value | | $ | 2,270,250 | |
For more information about the Fund’s investment risks regarding derivative financial instruments, refer to the Notes to Financial Statements.
|
| Derivative Financial Instruments - Offsetting as of Period End |
The Fund’s derivative assets and liabilities (by type) were as follows:
| | | | | | | | |
| | | Assets | | | Liabilities | |
Derivative Financial Instruments: | | | | | | | | |
Futures contracts | | | $ 5,530 | | | | $ 2,248 | |
Forward foreign currency exchange contracts | | | 36,916 | | | | 105,822 | |
Options | | | 844,057 | 1 | | | 323,698 | |
Swaps - Centrally cleared | | | 1,107 | | | | — | |
Swaps - OTC2 | | | 392,023 | | | | 1,439 | |
Total derivative assets and liabilities in the Statements of Assets and Liabilities | | | $1,279,633 | | | | $433,207 | |
Derivatives not subject to a Master Netting Agreement or similar agreement (“MNA”) | | | (7,812 | ) | | | (3,233 | ) |
Total derivative assets and liabilities subject to an MNA | | | $1,271,821 | | | | $429,974 | |
| | 1 | | Includes options purchased at value which is included in Investments at value — unaffiliated in the Consolidated Statements of Assets and Liabilities and reported in the Consolidated Schedule of Investments. |
| | 2 | | Includes unrealized appreciation (depreciation) on OTC swaps in the Consolidated Statements of Assets and Liabilities. |
See Notes to Financial Statements.
| | | | | | |
| | | BLACKROCK SERIES FUND, INC. | | JUNE 30, 2017 | | 79 |
| | | | |
| Consolidated Schedule of Investments (continued) | | | BlackRock Global Allocation Portfolio | |
The following tables present the Fund’s derivative assets and liabilities by counterparty net of amounts available for offset under an MNA and net of the related collateral received and pledged by the Fund.
| | | | | | | | | | | | | | | | | | |
| Counterparty | | Derivative Assets
Subject to an MNA by
Counterparty | | | Derivatives Available
for Offset1 | | | Non-cash
Collateral
Received | | Cash
Collateral
Received | | | Net Amount of
Derivative Assets2 | |
Bank of America N.A. | | $ | 142,562 | | | | $ (38,278) | | | — | | | — | | | | $ 104,284 | |
Barclays Bank PLC | | | 53,975 | | | | — | | | — | | | — | | | | 53,975 | |
BNP Paribas S.A. | | | 330,709 | | | | (22,180) | | | — | | | — | | | | 308,529 | |
Citibank N.A. | | | 9,246 | | | | (9,246) | | | — | | | — | | | | — | |
Deutsche Bank AG | | | 30,232 | | | | (16,545) | | | — | | | — | | | | 13,687 | |
Goldman Sachs International | | | 320,940 | | | | (57,919) | | | — | | | $(263,021) | | | | — | |
JPMorgan Chase Bank N.A. | | | 59,754 | | | | (46,868) | | | — | | | — | | | | 12,886 | |
Morgan Stanley & Co. International PLC | | | 45,120 | | | | (4,735) | | | — | | | — | | | | 40,385 | |
Société Générale | | | 19,772 | | | | (1,029) | | | — | | | — | | | | 18,743 | |
UBS AG | | | 259,511 | | | | (223,378) | | | — | | | — | | | | 36,133 | |
| | | | |
Total | | $ | 1,271,821 | | | | $(420,178) | | | — | | | $(263,021) | | | | $588,622 | |
| | | | |
| | | | | | | | | | | | | | | | | | |
| Counterparty | | Derivative Liabilities
Subject to an MNA by
Counterparty | | | Derivatives Available
for Offset1 | | | Non-cash
Collateral
Pledged | | Cash
Collateral
Pledged | | | Net Amount of
Derivative Liabilities3 | |
Bank of America N.A. | | | $ 38,278 | | | | $(38,278) | | | — | | | — | | | | — | |
BNP Paribas S.A. | | | 22,180 | | | | (22,180) | | | — | | | — | | | | — | |
Citibank N.A. | | | 19,042 | | | | (9,246) | | | — | | | — | | | | $9,796 | |
Deutsche Bank AG | | | 16,545 | | | | (16,545) | | | — | | | — | | | | — | |
Goldman Sachs International | | | 57,919 | | | | (57,919) | | | — | | | — | | | | — | |
JPMorgan Chase Bank N.A. | | | 46,868 | | | | (46,868) | | | — | | | — | | | | — | |
Morgan Stanley & Co. International PLC | | | 4,735 | | | | (4,735) | | | — | | | — | | | | — | |
Société Générale | | | 1,029 | | | | (1,029) | | | — | | | — | | | | — | |
UBS AG | | | 223,378 | | | | (223,378) | | | — | | | — | | | | — | |
| | | | |
Total | | | $429,974 | | | | $(420,178) | | | — | | | — | | | | $9,796 | |
| | | | |
| | 1 | | The amount of derivatives available for offset is limited to the amount of assets and/or liabilities that are subject to an MNA. |
| | 2 | | Net amount represents the net amount receivable from the counterparty in the event of default. |
| | 3 | | Net amount represents the net amount payable due to the counterparty in the event of default. Net amount may be offset further by the options written receivable/payable on the Statements of Assets and Liabilities. |
|
| Fair Value Hierarchy as of Period End |
| | Various inputs are used in determining the fair value of investments and derivative financial instruments. For information about the Fund’s policy regarding valuation of investments and derivative financial instruments, refer to the Notes to Financial Statements. |
See Notes to Financial Statements.
| | | | | | |
| 80 | | BLACKROCK SERIES FUND, INC. | | JUNE 30, 2017 | | |
| | | | |
| Consolidated Schedule of Investments (continued) | | | BlackRock Global Allocation Portfolio | |
The following tables summarize the Fund’s investments and derivative financial instruments in the disclosure hierarchy:
| | | | | | | | | | | | | | | | |
| | | Level 1 | | | Level 2 | | | Level 3 | | | Total | |
Assets: | | | | | | | | | | | | | | | | |
Investments: | | | | | | | | | | | | | | | | |
Long-Term Investments: | | | | | | | | | | | | | | | | |
Common Stocks: | | | | | | | | | | | | | | | | |
Belgium | | | — | | | $ | 1,107,859 | | | | — | | | $ | 1,107,859 | |
Brazil | | $ | . 177,346 | | | | — | | | | — | | | | 177,346 | |
Canada | | | 625,097 | | | | — | | | | — | | | | 625,097 | |
China | | | 913,390 | | | | 250,901 | | | | — | | | | 1,164,291 | |
Czech Republic | | | — | | | | 59,093 | | | | — | | | | 59,093 | |
Finland | | | — | | | | 708,995 | | | | — | | | | 708,995 | |
France | | | 17,109 | | | | 5,904,478 | | | | — | | | | 5,921,587 | |
Germany | | | — | | | | 3,539,130 | | | | — | | | | 3,539,130 | |
Hong Kong | | | 55,086 | | | | 1,272,380 | | | | — | | | | 1,327,466 | |
India | | | — | | | | 2,086,233 | | | $ | 120,476 | | | | 2,206,709 | |
Indonesia | | | 196,270 | | | | — | | | | — | | | | 196,270 | |
Ireland | | | 86,354 | | | | — | | | | — | | | | 86,354 | |
Italy | | | 553,282 | | | | 1,369,550 | | | | — | | | | 1,922,832 | |
Japan | | | — | | | | 17,817,763 | | | | — | | | | 17,817,763 | |
Netherlands | | | — | | | | 2,385,110 | | | | — | | | | 2,385,110 | |
Portugal | | | — | | | | 137,286 | | | | — | | | | 137,286 | |
Singapore | | | — | | | | 571,768 | | | | — | | | | 571,768 | |
South Korea | | | 66,259 | | | | 1,063,413 | | | | — | | | | 1,129,672 | |
Spain | | | — | | | | 729,370 | | | | — | | | | 729,370 | |
Sweden | | | — | | | | 1,214,931 | | | | — | | | | 1,214,931 | |
Switzerland | | | — | | | | 1,483,332 | | | | — | | | | 1,483,332 | |
Taiwan | | | — | | | | 786,487 | | | | — | | | | 786,487 | |
Thailand | | | 80,468 | | | | 246,201 | | | | — | | | | 326,669 | |
United Arab Emirates | | | — | | | | 531,695 | | | | — | | | | 531,695 | |
United Kingdom | | | 2,593,542 | | | | 5,160,665 | | | | — | | | | 7,754,207 | |
United States | | | 53,810,216 | | | | 89,316 | | | | 19,936 | | | | 53,919,468 | |
Corporate Bonds | | | — | | | | 10,800,599 | | | | 322,796 | | | | 11,123,395 | |
Floating Rate Loan Interests | | | — | | | | 1,015,893 | | | | — | | | | 1,015,893 | |
Foreign Agency Obligations | | | — | | | | 946,611 | | | | — | | | | 946,611 | |
Foreign Government Obligations | | | — | | | | 22,514,557 | | | | — | | | | 22,514,557 | |
Investment Companies | | | 7,791,113 | | | | — | | | | — | | | | 7,791,113 | |
Non-Agency Mortgage-Backed Securities | | | — | | | | — | | | | 182,344 | | | | 182,344 | |
Preferred Securities | | | 1,741,159 | | | | 2,519,189 | | | | 3,092,345 | | | | 7,352,693 | |
U.S. Treasury Obligations | | | — | | | | 30,160,877 | | | | — | | | | 30,160,877 | |
Warrants | | | 6,122 | | | | — | | | | — | | | | 6,122 | |
Short Term Investments: | | | | | | | | | | | | | | | | |
Money Market Funds | | | 7,234,771 | | | | — | | | | — | | | | 7,234,771 | |
Time Deposits | | | — | | | | 11,768 | | | | — | | | | 11,768 | |
U.S. Treasury Obligations | | | — | | | | 13,987,841 | | | | — | | | | 13,987,841 | |
Options Purchased: | | | | | | | | | | | | | | | | |
Equity contracts | | | 1,175 | | | | 495,976 | | | | — | | | | 497,151 | |
Foreign currency exchange contracts | | | — | | | | 279,024 | | | | — | | | | 279,024 | |
Interest rate contracts | | | — | | | | 67,882 | | | | — | | | | 67,882 | |
Liabilities: | | | | | | | | | | | | | | | | |
Investments Sold Short | | | (1,697,917 | ) | | | — | | | | — | | | | (1,697,917 | ) |
| | | | |
Subtotal | | $ | 74,250,842 | | | $ | 131,316,173 | | | $ | 3,737,897 | | | $ | 209,304,912 | |
| | | | |
Investments Valued at NAV1 | | | | | | | | | | | | | | | 4,799,490 | |
| | | | | | | | | | | | | | | | |
Total Investments | | | | | | | | | | | | | | $ | 214,104,402 | |
| | | | | | | | | | | | | | | | |
| | 1 | | As of June 30, 2017, certain investments of the Fund were fair valued using NAV per share as no quoted market value is available and therefore have been excluded from the fair value hierarchy. |
See Notes to Financial Statements.
| | | | | | |
| | | BLACKROCK SERIES FUND, INC. | | JUNE 30, 2017 | | 81 |
| | | | |
| Consolidated Schedule of Investments (continued) | | | BlackRock Global Allocation Portfolio | |
| | | | | | | | | | | | | | | | |
| | | Level 1 | | | Level 2 | | | Level 3 | | | Total | |
Derivative Financial Instruments1 | | | | | | | | | | | | | | | | |
Assets: | | | | | | | | | | | | | | | | |
Credit contracts | | | — | | | $ | 247 | | | | — | | | $ | 247 | |
Equity contracts | | $ | 18,534 | | | | 272,442 | | | | — | | | | 290,976 | |
Foreign Currency Exchange Contracts | | | — | | | | 36,916 | | | | — | | | | 36,916 | |
Interest rate contracts | | | — | | | | 200,799 | | | | — | | | | 200,799 | |
Liabilities: | | | | | | | | | | | | | | | | |
Credit contracts | | | — | | | | (1,421 | ) | | | — | | | | (1,421 | ) |
Equity contracts | | | (12,054 | ) | | | (212,074 | ) | | | — | | | | (224,128 | ) |
Foreign Currency Exchange Contracts | | | — | | | | (141,048 | ) | | | — | | | | (141,048 | ) |
Interest rate contracts | | | — | | | | (140,491 | ) | | | — | | | | (140,491 | ) |
| | | | |
Total | | $ | 6,480 | | | $ | 15,370 | | | | — | | | $ | 21,850 | |
| | | | |
| | 1 | | Derivative financial instruments are swaps, futures contracts, forward foreign currency exchange contracts and options written. Swaps, futures contracts and forward foreign currency exchange contracts are valued at the unrealized appreciation (depreciation) on the instrument and options written are shown at value. |
During the six months ended June 30, 2017, there were no transfers between Level 1 and Level 2.
A reconciliation of Level 3 investments and derivative financial instruments is presented when the Fund had a significant amount of Level 3 investments and derivative financial instruments at the beginning and/or end of the period in relation to net assets. The following table is a reconciliation of Level 3 investments for which significant unobservable inputs were used in determining fair value:
| | | | | | | | | | | | | | | | | | | | | | | | |
| | | Common
Stocks | | | Corporate
Bonds | | | Floating
Rate Loan
Interests | | | Non-Agency
Mortgage-
Backed
Securities | | | Preferred
Securities | | | Total | |
Assets: | | | | | | | | | | | | | | | | | | | | | | | | |
Opening balance, as of December 31, 2016 | | $ | 26,557 | | | $ | 730,297 | | | $ | 361,469 | | | | — | | | $ | 2,787,601 | | | $ | 3,905,924 | |
Transfers into Level 3 | | | — | | | | — | | | | — | | | $ | 164,781 | | | | — | | | | 164,781 | |
Transfers out of Level 3 | | | — | | | | — | | | | (88,552 | ) | | | — | | | | — | | | | (88,552 | ) |
Accrued discounts/premiums | | | — | | | | (247 | ) | | | 29 | | | | 1,151 | | | | — | | | | 933 | |
Net realized gain (loss) | | | (152,150 | ) | | | (81,261 | ) | | | 1,307 | | | | — | | | | — | | | | (232,104 | ) |
Net change in unrealized appreciation (depreciation)2,3 | | | 219,833 | | | | (62,467 | ) | | | 636 | | | | 16,412 | | | | 304,744 | | | | 479,158 | |
Purchases | | | 122,020 | | | | 72,942 | | | | — | | | | — | | | | — | | | | 194,962 | |
Sales | | | (75,848 | ) | | | (336,468 | ) | | | (274,889 | ) | | | — | | | | — | | | | (687,205 | ) |
| | | | |
Closing Balance, as of June 30, 2017 | | $ | 140,412 | | | $ | 322,796 | | | | — | | | $ | 182,344 | | | $ | 3,092,345 | | | $ | 3,737,897 | |
| | | | |
Net change in unrealized appreciation (depreciation) on investments still held at June 30, 20173 | | $ | 10,306 | | | $ | (56,599 | ) | | | — | | | $ | 16,412 | | | $ | 304,746 | | | $ | 274,865 | |
| | | | |
| | 2 | | Included in the related change in unrealized appreciation (depreciation) in the Consolidated Statements of Operations. |
| | 3 | | Any difference between net change in unrealized appreciation (depreciation) and net change in unrealized appreciation (depreciation) on investments still held at June 30, 2017 is generally due to investments no longer held or categorized as Level 3 at period end. |
See Notes to Financial Statements.
| | | | | | |
| 82 | | BLACKROCK SERIES FUND, INC. | | JUNE 30, 2017 | | |
| | | | |
| Consolidated Schedule of Investments (concluded) | | | BlackRock Global Allocation Portfolio | |
The following table summarizes the valuation approaches used and unobservable inputs utilized by the BlackRock Global Valuation Methodologies Committee (“Global Valuation Committee”) to determine the value of certain of the Fund’s Level 3 investments as of period end. The table does not include Level 3 investments with values based upon unadjusted third party pricing information in the amount of $306,180.
| | | | | | | | | | | | | | | | |
| | | Value | | | Valuation Approach | | Unobservable Inputs | | Range of
Unobservable Inputs
Utilized | | | Weighted Average of
Unobservable Inputs | |
Assets: | | | | | | | | | | | | | | | | |
Common Stocks4 | | $ | 19,936 | | | Market | | Priced to Last Financing Round1 | | | — | | | | — | |
| | | | | | | | Revenue Growth Rate1 | | | 25.00% | | | | — | |
| | | | | | | | Revenue Multiple1 | | | 6.75x | | | | — | |
| | | | | | | | Time to Exit1 | | | 1 year | | | | — | |
| | | | | | | | Volatility1 | | | 33.00% | | | | — | |
Corporate Bonds | | | 319,436 | | | Income | | Discount Rate2 | | | 17.50% | | | | — | |
| | | | | | Market | | Estimated Recovery Value1 | | | — | | | | — | |
| | | | | | | | Volatility1 | | | 36.30% | | | | — | |
| | | | | | | | Yield2 | | | 11.25% | | | | — | |
Preferred Stocks3,4 | | | 3,092,345 | | | Market | | Discount Rate2 | | | 20.00% | | | | — | |
| | | | | | | | Revenue Growth Rate1 | | | 83.00% - 131.00% | | | | 103.68 | % |
| | | | | | | | Revenue Growth Rate1 | | | 25.00% | | | | — | |
| | | | | | | | Revenue Multiple1 | | | 6.75x - 19.50x | | | | 9.64x | |
| | | | | | | | Scenario Probability1 | | | 1.00% - 79.00% | | | | — | |
| | | | | | | | Time to Exit2 | | | 1 year | | | | — | |
| | | | | | | | Volatility1 | | | 33.00% - 61.00% | | | | 44.14 | % |
| | | | |
Total | | $ | 3,431,717 | | | | | | | | | | | | | |
| | | | |
| | 1 | | Increase in unobservable input may result in a significant increase to value, while a decrease in unobservable input may result in a significant decrease to value. |
| | 2 | | Decrease in unobservable input may result in a significant increase to value, while an increase in unobservable input may result in a significant decrease to value. |
| | 3 | | For the six months ended June 30, 2017, the valuation technique changed for certain investments in preferred stocks with a total value of $492,653 from a hybrid model using Probability-Weighted Expected Return Model (“PWERM”) and Option Pricing Model (“OPM”) to using only PWERM. The change was due to consideration of liquidation preferences and exit strategy. |
| | 4 | | For the six months ended June 30, 2017, the valuation technique changed for certain investments in common stocks and preferred stocks with a total value of $212,861 from a hybrid model using Probability-Weighted Expected Return Model (“PWERM”) and Option Pricing Model (“OPM”) to using only OPM. The change was due to consideration of liquidation preferences and exit strategy. |
See Notes to Financial Statements.
| | | | | | |
| | | BLACKROCK SERIES FUND, INC. | | JUNE 30, 2017 | | 83 |
| | | | |
| Schedule of Investments June 30, 2017 (Unaudited) | | | BlackRock Government Money Market Portfolio | |
| | | (Percentages shown are based on Net Assets) | |
| | | | | | | | |
U.S. Government Sponsored Agency Obligations | | Par (000) | | | Value | |
Fannie Mae: | | | | | | | | |
0.88%, 8/28/17 | | $ | 500 | | | $ | 499,968 | |
1.00%, 9/27/17 | | | 500 | | | | 500,033 | |
0.88%, 3/28/18 | | | 1,800 | | | | 1,797,009 | |
Fannie Mae Variable Rate Notes: (a) | | | | | | | | |
1.23%, 07/20/17 | | | 2,000 | | | | 1,999,995 | |
1.18%, 08/16/17 | | | 1,500 | | | | 1,499,982 | |
1.09%, 10/05/17 | | | 1,000 | | | | 999,961 | |
Federal Farm Credit Bank Discount Notes: (b) | | | | | | | | |
0.69%, 9/29/17 | | | 575 | | | | 574,030 | |
0.76%, 11/03/17 | | | 285 | | | | 284,260 | |
0.90%, 11/28/17 | | | 2,500 | | | | 2,490,750 | |
0.82%, 12/15/17 | | | 995 | | | | 991,260 | |
Federal Farm Credit Bank Variable Rate Notes: (a) | | | | | | | | |
1.23%, 9/22/17 | | | 2,000 | | | | 1,999,977 | |
1.28%, 11/20/17 | | | 1,000 | | | | 999,981 | |
1.07%, 1/23/18 | | | 430 | | | | 430,002 | |
Federal Home Loan Bank: | | | | | | | | |
0.84%, 9/08/17 | | | 1,670 | | | | 1,669,660 | |
0.88%, 3/19/18 | | | 1,000 | | | | 998,389 | |
Federal Home Loan Bank Discount Notes: (b) | | | | | | | | |
0.85%, 7/14/17 | | | 980 | | | | 979,747 | |
0.63%, 7/19/17 | | | 2,000 | | | | 1,999,444 | |
0.95%, 7/26/17 | | | 490 | | | | 489,703 | |
0.97%, 7/28/17 | | | 740 | | | | 739,501 | |
0.64%, 8/01/17 | | | 2,810 | | | | 2,806,864 | |
0.94%, 8/09/17 | | | 2,000 | | | | 1,998,070 | |
0.68%, 8/22/17 | | | 695 | | | | 694,344 | |
0.68%, 8/25/17 | | | 730 | | | | 729,274 | |
0.90%, 8/28/17 | | | 780 | | | | 778,914 | |
0.70%, 8/30/17 | | | 1,500 | | | | 1,498,320 | |
0.89%, 9/06/17 | | | 885 | | | | 883,578 | |
0.92%, 9/20/17 | | | 1,000 | | | | 997,988 | |
1.05%, 9/20/17 | | | 1,380 | | | | 1,376,835 | |
1.05%, 9/25/17 | | | 1,500 | | | | 1,496,325 | |
1.04%, 9/27/17 | | | 1,500 | | | | 1,496,277 | |
1.08%, 10/12/17 | | | 2,800 | | | | 2,791,516 | |
1.04%, 11/08/17 | | | 1,500 | | | | 1,494,459 | |
1.00%, 12/05/17 | | | 1,500 | | | | 1,493,542 | |
1.14%, 12/29/17 | | | 1,000 | | | | 994,332 | |
Federal Home Loan Bank Variable Rate Notes: (a) | | | | | | | | |
1.14%, 07/06/17 | | | 1,475 | | | | 1,475,000 | |
| | | | | | | | |
U.S. Government Sponsored Agency Obligations | | Par (000) | | | Value | |
1.14%, 07/07/17 | | $ | 3,000 | | | $ | 3,000,000 | |
1.15%, 08/22/17 | | | 700 | | | | 699,997 | |
1.12%, 08/25/17 | | | 880 | | | | 880,000 | |
1.09%, 10/27/17 | | | 1,270 | | | | 1,270,000 | |
1.09%, 10/27/17 | | | 1,000 | | | | 999,977 | |
1.06%, 04/17/18 | | | 1,070 | | | | 1,070,000 | |
1.07%, 04/17/18 | | | 1,800 | | | | 1,800,000 | |
0.83%, 05/09/18 | | | 1,000 | | | | 1,000,000 | |
0.95%, 06/05/18 | | | 750 | | | | 750,000 | |
1.06%, 06/08/18 | | | 500 | | | | 500,000 | |
1.11%, 10/03/18 | | | 1,000 | | | | 1,000,000 | |
1.11%, 06/20/19 | | | 470 | | | | 470,000 | |
1.11%, 06/20/19 | | | 385 | | | | 385,000 | |
Freddie Mac: | | | | | | | | |
0.75%, 7/14/17 | | | 500 | | | | 500,018 | |
1.00%, 9/29/17 | | | 790 | | | | 790,512 | |
Freddie Mac Discount Notes: (b) | | | | | | | | |
0.80%, 8/02/17 | | | 950 | | | | 949,367 | |
0.83%, 8/03/17 | | | 1,765 | | | | 1,763,738 | |
Total U.S. Government Sponsored Agency Obligations — 55.2% | | | | 62,777,899 | |
| | | | | | | | |
| U.S. Treasury Obligations | | | | | | |
U.S. Treasury Bills, 0.91%, 9/28/17 (b) | | | 937 | | | | 934,951 | |
U.S. Treasury Notes: | | | | | | | | |
0.88%, 10/15/17 | | | 1,200 | | | | 1,200,464 | |
1.17%, 10/31/17 (a) | | | 1,249 | | | | 1,248,486 | |
1.14%, 1/31/19 (a) | | | 3,000 | | | | 3,000,000 | |
Total U.S. Treasury Obligations — 5.6% | | | | | | | 6,383,901 | |
| | | | | | | | |
| Total Repurchase Agreements — 39.7% | | | | | 45,200,000 | |
Total Investments (Cost — $114,361,800*) — 100.5% | | | | 114,361,800 | |
Liabilities in Excess of Other Assets — (0.5)% | | | | | | | (576,040 | ) |
| | | | | | | | |
Net Assets — 100.0% | | | | | | $ | 113,785,760 | |
| | | | | | | | |
|
| Notes to Schedule of Investments |
| * | Cost for U.S. federal income tax purposes. |
| (a) | Variable rate security. Rate as of period end. |
| (b) | Rates are discount rates or a range of discount rates at the time of purchase. |
See Notes to Financial Statements.
| | | | | | |
| 84 | | BLACKROCK SERIES FUND, INC. | | JUNE 30, 2017 | | |
| | | | |
| Schedule of Investments (continued) | | | BlackRock Government Money Market Portfolio | |
| | | | | | | | | | | | | | | | | | | | | | | | | | | | | | | | | | |
Repurchase Agreement | |
| | | | | | | | | |
| | | | | | | | | | | | | | | | | | | | | | | | | | | | | | | | | | | |
| | | Repurchase Agreements | | | | | | Collateral | |
| Counterparty | | Coupon
Rate | | | Purchase
Date | | | Maturity
Date | | | Par
(000) | | | at Value
(000) | | | Proceeds
including
Interest | | | Position | | Original
Par | | | Position
received,
at Value | |
Bank of Montreal | | | 1.07 | % | | | 6/30/17 | | | | 7/03/17 | | | $ | 6,000 | | | $ | 6,000 | | | $ | 6,000,535 | | | U.S. government sponsored agency obligations and U.S. Treasury obligations, 0.13% to 4.50% due from 4/15/20 to 5/01/47 | | $ | 5,847,077 | | | $ | 6,140,074 | |
BNP Paribas Securities Corp. | | | | | | | | | | | | | | | | | | | | | | | | | | | |
| | | 1.12 | % | | | 6/30/17 | | | | 7/03/17 | | | | 5,000 | | | | 5,000 | | | | 5,000,467 | | | U.S. government sponsored agency obligations and U.S. Treasury obligations, 0.75% to 8.00% due from 7/31/18 to 6/20/47 | | | 21,703,999 | | | | 5,110,206 | |
| | | 1.08 | %(a) | | | 6/15/17 | | | | 7/14/17 | | | | 1,000 | | | | 1,000 | | | | 1,000,870 | | | U.S. Treasury obligations, 0.00% to 5.50% due from 7/13/17 to 5/15/45 | | | 1,413,521 | | | | 1,020,090 | |
| | | | | | | | | | | | | | | | | | | | | | | | | | | | | | | | | | |
Total BNP Paribas Securities Corp. | | | | | | | | | | | $ | 6,000 | | | | | | | | | | | | | $ | 6,130,296 | |
Goldman Sachs & Co. | | | 1.12 | % | | | 6/29/17 | | | | 7/06/17 | | | | 1,500 | | | | 1,500 | | | | 1,500,327 | | | U.S. government sponsored agency obligations, 2.50% to 6.00% due from 11/15/17 to 3/15/28 | | | 34,559,299 | | | | 1,530,000 | |
J.P. Morgan Securities LLC | | | | | | | | | | | | | | | | | | | | | | | | | | | | | | | | | | |
| | | | | | | | | | | | | | | | | | | | | | | | | | U.S. Treasury obligation, 1.63% due at 8/15/22 | | | 7,900,000 | | | | 7,854,102 | |
| | | 1.12 | % | | | 6/30/17 | | | | 7/03/17 | | | | 7,700 | | | | 7,700 | | | | 7,700,719 | | | U.S. government sponsored agency obligations, 4.50% to 5.50% due from 11/01/35 to | | | | | | | | |
| | | 1.39 | %(a) | | | 6/30/17 | | | | 8/04/17 | | | | 2,500 | | | | 2,500 | | | | 2,503,378 | | | 5/25/39 | | | 264,191,830 | | | | 2,859,014 | |
| | | | | | | | | | | | | | | | | | | | | | | | | | | | | | | | | | |
Total J.P. Morgan Securities LLC | | | | | | | | | | | $ | 10,200 | | | | | | | | | | | | | $ | 10,713,116 | |
Merrill Lynch, Pierce, Fenner & Smith Inc. | | | | | | | | | | | | | | | | | | | | | | | |
| | | 1.10 | % | | | 6/30/17 | | | | 7/03/17 | | | | 5,000 | | | | 5,000 | | | | 5,000,458 | | | U.S. government sponsored agency obligations, 3.10% to 4.67% due from 3/20/62 to 10/20/65 | | | 6,077,795 | | | | 5,100,000 | |
See Notes to Financial Statements.
| | | | | | |
| | | BLACKROCK SERIES FUND, INC. | | JUNE 30, 2017 | | 85 |
| | | | |
| Schedule of Investments (concluded) | | | BlackRock Government Money Market Portfolio | |
| | | | | | | | | | | | | | | | | | | | | | | | | | | | | | | | | | |
| Repurchase Agreements | | | Collateral | |
| Counterparty | | Coupon
Rate | | | Purchase
Date | | | Maturity
Date | | | Par
(000) | | | at Value
(000) | | | Proceeds
including
Interest | | | Position | | Original
Par | | | Position
received,
at Value | |
| | | 1.16 | % | | | 6/29/17 | | | | 7/06/17 | | | $ | 1,500 | | | $ | 1,500 | | | $ | 1,500,338 | | | U.S. government sponsored agency obligation, 4.00% due at 7/25/53 | | $ | 1,517,903 | | | $ | 1,605,001 | |
| | | | | | | | | | | | | | | | | | | | | | | | | | | | | | | | | | |
Total Merrill Lynch, Pierce, Fenner & Smith Inc. | | | | | | | | | | | $ | 6,500 | | | | | | | | | | | | | $ | 6,705,001 | |
Mizuho Securities USA, Inc. | | | 1.16 | % | | | 6/30/17 | | | | 7/03/17 | | | | 7,000 | | | | 7,000 | | | | 7,000,677 | | | U.S. government sponsored agency obligation, 0.98% due at 1/14/19 | | | 7,111,000 | | | | 7,140,659 | |
Societe Generale | | | 1.10 | % | | | 6/30/17 | | | | 7/03/17 | | | | 6,000 | | | | 6,000 | | | | 6,000,550 | | | U.S. Treasury obligation, 3.75% due at 11/15/43 | | | 5,163,200 | | | | 6,120,031 | |
Wells Fargo Securities LLC | | | | | | | | | | | | | | | | | | | | | | | |
| | | 1.06 | % | | | 6/28/17 | | | | 7/05/17 | | | | 1,000 | | | | 1,000 | | | | 1,000,206 | | | U.S. government sponsored agency obligation, 4.00% due at 3/01/47 | | | 991,859 | | | | 1,030,001 | |
| | | 1.10 | % | | | 6/30/17 | | | | 7/07/17 | | | | 1,000 | | | | 1,000 | | | | 1,000,214 | | | U.S. government sponsored agency obligations, 3.50% to 4.00% due from 6/01/32 to 6/01/47 | | | 990,769 | | | | 1,030,000 | |
| | | | | | | | | | | | | | | | | | | | | | | | | | | | | | | | | | |
Total Wells Fargo Securities LLC | | | | | | | $ | 2,000 | | | | | | | | | | | | | $ | 2,060,001 | |
Total | | | | | | | | | | | | | | | | | | $ | 45,200 | | | | | | | | | | | | | $ | 46,539,178 | |
| | | | | | | | | | | | | | | | | | | | | | | | | | | | | | | | | | |
| (a) | Variable rate security. Rate as of period end and maturity is the date the principal owed can be recovered through demand. |
|
| Fair Value Hierarchy as of Period End |
Various inputs are used in determining the fair value of investments. For information about the Fund’s policy regarding valuation of investments, refer to the Notes to Financial Statements.
The following table summarizes the Fund’s investments categorized in the disclosure hierarchy:
| | | | | | | | | | | | | | | | |
| | | Level 1 | | | Level 2 | | | Level 3 | | | Total | |
Assets: | | | | | | | | | | | | | | | | |
Investments: | | | | | | | | | | | | | | | | |
Short-Term Securities1 | | | — | | | $ | 114,361,800 | | | | — | | | $ | 114,361,800 | |
1 See above Schedule of Investments for values in each security type. | | | | | | | | | | | | | | | | |
During the six months ended June 30, 2017, there were no transfers between levels.
See Notes to Financial Statements.
| | | | | | |
| 86 | | BLACKROCK SERIES FUND, INC. | | JUNE 30, 2017 | | |
| | | | |
| Schedule of Investments June 30, 2017 (Unaudited) | | | BlackRock High Yield Portfolio | |
| | | (Percentages shown are based on Net Assets) | |
| | | | | | | | | | | | |
| Common Stocks | | | | | Shares | | | Value | |
Chemicals — 0.0% | | | | | | | | | | | | |
Advanced Emissions Solutions, Inc. | | | | | | | 660 | | | $ | 6,046 | |
Hotels, Restaurants & Leisure — 0.9% | | | | | | | | | | | | |
Amaya, Inc. (a) | | | | | | | 16,288 | | | | 291,144 | |
Media — 0.1% | | | | | | | | | | | | |
Altice USA, Inc., Class A (a) | | | | | | | 762 | | | | 24,613 | |
Metals & Mining — 0.0% | | | | | | | | | | | | |
Teck Resources Ltd., Class B | | | | | | | 810 | | | | 14,037 | |
Wireless Telecommunication Services — 0.2% | | | | | | | | | | | | |
T-Mobile U.S., Inc. (a) | | | | | | | 1,150 | | | | 69,713 | |
Total Common Stocks — 1.2% | | | | | | | | | | | 405,553 | |
| | | | | | | | | | | | |
| Corporate Bonds | | | | | Par (000) | | | | |
Aerospace & Defense — 2.1% | | | | | | | | | | | | |
Arconic, Inc.: | | | | | | | | | | | | |
5.13%, 10/01/24 | | | USD | | | | 104 | | | | 107,900 | |
5.90%, 2/01/27 | | | | | | | 17 | | | | 18,296 | |
6.75%, 1/15/28 | | | | | | | 7 | | | | 7,735 | |
5.95%, 2/01/37 | | | | | | | 13 | | | | 13,097 | |
Bombardier, Inc.: | | | | | | | | | | | | |
8.75%, 12/01/21 (b) | | | | | | | 103 | | | | 114,330 | |
6.00%, 10/15/22 (b) | | | | | | | 21 | | | | 21,000 | |
6.13%, 1/15/23 (b) | | | | | | | 14 | | | | 14,035 | |
7.50%, 3/15/25 (b) | | | | | | | 59 | | | | 61,213 | |
Engility Corp., 8.88%, 9/01/24 | | | | | | | 26 | | | | 28,243 | |
KLX, Inc., 5.88%, 12/01/22 (b) | | | | | | | 80 | | | | 84,000 | |
Kratos Defense & Security Solutions, Inc., 7.00%, 5/15/19 | | | | | | | 10 | | | | 10,175 | |
TransDigm, Inc.: | | | | | | | | | | | | |
5.50%, 10/15/20 | | | | | | | 17 | | | | 17,340 | |
6.00%, 7/15/22 | | | | | | | 87 | | | | 89,610 | |
6.50%, 7/15/24 | | | | | | | 71 | | | | 73,307 | |
6.50%, 5/15/25 | | | | | | | 25 | | | | 25,437 | |
6.38%, 6/15/26 | | | | | | | 8 | | | | 8,120 | |
| | | | | | | | | | | | |
| | | | | | | | | | | | 693,838 | |
Air Freight & Logistics — 0.4% | | | | | | | | | | | | |
XPO Logistics, Inc., 6.50%, 6/15/22 (b) | | | | | | | 137 | | | | 143,850 | |
Airlines — 0.6% | | | | | | | | | | | | |
Air Medical Group Holdings, Inc., 6.38%, 5/15/23 (b) | | | | | | | 19 | | | | 18,003 | |
Continental Airlines Pass-Through Trust, Series 2012-3, Class C, 6.13%, 4/29/18 | | | | | | | 120 | | | | 123,000 | |
Virgin Australia Pass-Through Trust, Series 2013-1C, 7.13%, 10/23/18 (b) | | | | | | | 45 | | | | 45,691 | |
| | | | | | | | | | | | |
| | | | | | | | | | | | 186,694 | |
Auto Components — 0.4% | | | | | | | | | | | | |
Icahn Enterprises LP/Icahn Enterprises Finance Corp.: | | | | | | | | | | | | |
4.88%, 3/15/19 | | | | | | | 52 | | | | 52,520 | |
6.25%, 2/01/22 | | | | | | | 29 | | | | 30,233 | |
6.75%, 2/01/24 | | | | | | | 65 | | | | 67,769 | |
| | | | | | | | | | | | |
| | | | | | | | | | | | 150,522 | |
Banks — 0.5% | | | | | | | | | | | | |
Banco Espirito Santo SA, 4.75%, 1/15/18 (a)(c) | | | EUR | | | | 100 | | | | 34,265 | |
CIT Group, Inc., 5.00%, 8/01/23 | | | USD | | | | 120 | | | | 129,300 | |
| | | | | | | | | | | | |
| | | | | | | | | | | | 163,565 | |
| | | | | | | | | | | | |
| Corporate Bonds | | | | | Par
(000) | | | Value | |
Building Products — 0.5% | | | | | | | | | | | | |
CPG Merger Sub LLC, 8.00%, 10/01/21 (b) | | | USD | | | | 59 | | | $ | 61,507 | |
Masonite International Corp., 5.63%, 3/15/23 (b) | | | | | | | 17 | | | | 17,765 | |
Ply Gem Industries, Inc., 6.50%, 2/01/22 | | | | | | | 25 | | | | 26,185 | |
Standard Industries, Inc.: | | | | | | | | | | | | |
5.38%, 11/15/24 (b) | | | | | | | 13 | | | | 13,699 | |
6.00%, 10/15/25 (b) | | | | | | | 36 | | | | 38,520 | |
USG Corp., 4.88%, 6/01/27 (b) | | | | | | | 22 | | | | 22,633 | |
| | | | | | | | | | | | |
| | | | | | | | | | | | 180,309 | |
Capital Markets — 0.0% | | | | | | | | | | | | |
LPL Holdings, Inc., 5.75%, 9/15/25 (b) | | | | | | | 7 | | | | 7,280 | |
Chemicals — 2.1% | | | | | | | | | | | | |
Blue Cube Spinco, Inc.: | | | | | | | | | | | | |
9.75%, 10/15/23 | | | | | | | 22 | | | | 26,620 | |
10.00%, 10/15/25 | | | | | | | 15 | | | | 18,487 | |
CF Industries, Inc.: | | | | | | | | | | | | |
7.13%, 5/01/20 | | | | | | | 10 | | | | 11,050 | |
5.15%, 3/15/34 | | | | | | | 15 | | | | 13,875 | |
4.95%, 6/01/43 | | | | | | | 14 | | | | 12,005 | |
Chemours Co.: | | | | | | | | | | | | |
6.63%, 5/15/23 | | | | | | | 23 | | | | 24,323 | |
7.00%, 5/15/25 | | | | | | | 15 | | | | 16,350 | |
5.38%, 5/15/27 | | | | | | | 20 | | | | 20,648 | |
Hexion, Inc., 10.38%, 2/01/22 (b) | | | | | | | 26 | | | | 25,740 | |
Huntsman International LLC: | | | | | | | | | | | | |
4.88%, 11/15/20 | | | | | | | 43 | | | | 45,257 | |
5.13%, 11/15/22 | | | | | | | 5 | | | | 5,350 | |
Koppers, Inc., 6.00%, 2/15/25 (b) | | | | | | | 27 | | | | 28,687 | |
Momentive Performance Materials, Inc.: | | | | | | | | | | | | |
3.88%, 10/24/21 | | | | | | | 126 | | | | 125,055 | |
Escrow, 8.88%, 10/15/20 (a)(c)(d) | | | | | | | 82 | | | | — | |
Platform Specialty Products Corp.: | | | | | | | | | | | | |
10.38%, 5/01/21 (b) | | | | | | | 6 | | | | 6,638 | |
6.50%, 2/01/22 (b) | | | | | | | 198 | | | | 204,435 | |
PQ Corp., 6.75%, 11/15/22 (b) | | | | | | | 41 | | | | 44,075 | |
Tronox Finance LLC: | | | | | | | | | | | | |
6.38%, 8/15/20 | | | | | | | 23 | | | | 23,057 | |
7.50%, 3/15/22 (b) | | | | | | | 8 | | | | 8,240 | |
WR Grace & Co-Conn, 5.13%, 10/01/21 (b) | | | | | | | 38 | | | | 40,755 | |
| | | | | | | | | | | | |
| | | | | | | | | | | | 700,647 | |
Commercial Services & Supplies — 2.4% | | | | | | | | | | | | |
ACCO Brands Corp., 5.25%, 12/15/24 (b) | | | | | | | 10 | | | | 10,387 | |
Acosta, Inc., 7.75%, 10/01/22 (b) | | | | | | | 38 | | | | 28,785 | |
ADT Corp.: | | | | | | | | | | | | |
3.50%, 7/15/22 | | | | | | | 40 | | | | 38,688 | |
4.13%, 6/15/23 | | | | | | | 28 | | | | 27,755 | |
4.88%, 7/15/32 (b) | | | | | | | 44 | | | | 38,500 | |
Advanced Disposal Services, Inc., 5.63%, 11/15/24 (b) | | | | | | | 27 | | | | 27,810 | |
Ceridian HCM Holding, Inc., 11.00%, 3/15/21 (b) | | | | | | | 39 | | | | 41,194 | |
Covanta Holding Corp., 5.88%, 7/01/25 | | | | | | | 25 | | | | 24,250 | |
GW Honos Security Corp., 8.75%, 5/15/25 (b) | | | | | | | 11 | | | | 11,509 | |
KAR Auction Services, Inc., 5.13%, 6/01/25 (b) | | | | | | | 47 | | | | 47,881 | |
Mobile Mini, Inc., 5.88%, 7/01/24 | | | | | | | 77 | | | | 79,887 | |
Prime Security Services Borrower LLC/Prime Finance, Inc., 9.25%, 5/15/23 (b) | | | | | | | 232 | | | | 252,105 | |
Ritchie Bros. Auctioneers, Inc., 5.38%, 1/15/25 (b) | | | | | | | 20 | | | | 20,850 | |
Tempo Acquisition LLC/Tempo Acquisition Finance Corp., 6.75%, 6/01/25 (b) | | | | | | | 22 | | | | 22,495 | |
Tervita Escrow Corp., 7.63%, 12/01/21 (b) | | | | | | | 45 | | | | 45,337 | |
See Notes to Financial Statements.
| | | | | | |
| | | BLACKROCK SERIES FUND, INC. | | JUNE 30, 2017 | | 87 |
| | | | |
| Schedule of Investments (continued) | | | BlackRock High Yield Portfolio | |
| | | | |
| | | | | | | | | | | | |
| Corporate Bonds | | | | | Par (000) | | | Value | |
Commercial Services & Supplies (continued) | | | | | | | | | | | | |
WaveDivision Escrow LLC/WaveDivision Escrow Corp., 8.13%, 9/01/20 (b) | | | USD | | | | 97 | | | $ | 100,473 | |
| | | | | | | | | | | | |
| | | | | | | | | | | | 817,906 | |
Communications Equipment — 1.0% | | | | | | | | | | | | |
CommScope Technologies LLC, 5.00%, 3/15/27 (b) | | | | | | | 56 | | | | 55,860 | |
CommScope, Inc., 5.50%, 6/15/24 (b) | | | | | | | 3 | | | | 3,123 | |
Hughes Satellite Systems Corp.: | | | | | | | | | | | | |
7.63%, 6/15/21 | | | | | | | 10 | | | | 11,363 | |
5.25%, 8/01/26 | | | | | | | 90 | | | | 94,050 | |
6.63%, 8/01/26 | | | | | | | 3 | | | | 3,225 | |
Nokia OYJ: | | | | | | | | | | | | |
5.38%, 5/15/19 | | | | | | | 3 | | | | 3,170 | |
3.38%, 6/12/22 | | | | | | | 13 | | | | 13,099 | |
4.38%, 6/12/27 | | | | | | | 18 | | | | 18,326 | |
6.63%, 5/15/39 | | | | | | | 65 | | | | 74,831 | |
Riverbed Technology, Inc., 8.88%, 3/01/23 (b) | | | | | | | 51 | | | | 51,829 | |
| | | | | | | | | | | | |
| | | | | | | | | | | | 328,876 | |
Construction & Engineering — 0.3% | | | | | | | | | | | | |
AECOM, 5.13%, 3/15/27 (b) | | | | | | | 5 | | | | 5,019 | |
Brand Energy & Infrastructure Services, Inc.,
8.50%, 7/15/25 (b) | | | | | | | 68 | | | | 70,380 | |
Tutor Perini Corp., 6.88%, 5/01/25 (b) | | | | | | | 17 | | | | 17,893 | |
| | | | | | | | | | | | |
| | | | | | | | | | | | 93,292 | |
Construction Materials — 0.1% | | | | | | | | | | | | |
New Enterprise Stone & Lime Co., Inc., 10.13%, 4/01/22 (b) | | | | | | | 19 | | | | 20,591 | |
Consumer Finance — 1.5% | | | | | | | | | | | | |
Ally Financial, Inc.: | | | | | | | | | | | | |
5.13%, 9/30/24 | | | | | | | 40 | | | | 42,197 | |
8.00%, 11/01/31 | | | | | | | 183 | | | | 224,175 | |
DFC Finance Corp., 12.00% (12.00% Cash or 11.00% PIK), 6/16/20 (b)(e) | | | | | | | 42 | | | | 25,818 | |
Navient Corp.: | | | | | | | | | | | | |
6.63%, 7/26/21 | | | | | | | 36 | | | | 38,745 | |
6.50%, 6/15/22 | | | | | | | 9 | | | | 9,540 | |
5.50%, 1/25/23 | | | | | | | 20 | | | | 20,325 | |
7.25%, 9/25/23 | | | | | | | 17 | | | | 18,317 | |
6.13%, 3/25/24 | | | | | | | 7 | | | | 7,210 | |
5.88%, 10/25/24 | | | | | | | 13 | | | | 13,231 | |
6.75%, 6/25/25 | | | | | | | 22 | | | | 22,674 | |
5.63%, 8/01/33 | | | | | | | 24 | | | | 20,047 | |
OneMain Financial Holdings LLC: | | | | | | | | | | | | |
6.75%, 12/15/19 (b) | | | | | | | 28 | | | | 29,400 | |
7.25%, 12/15/21 (b) | | | | | | | 9 | | | | 9,479 | |
Springleaf Finance Corp., 6.13%, 5/15/22 | | | | | | | 10 | | | | 10,550 | |
| | | | | | | | | | | | |
| | | | | | | | | | | | 491,708 | |
Containers & Packaging — 3.5% | | | | | | | | | | | | |
Ardagh Packaging Finance PLC/Ardagh Holdings USA, Inc.: | | | | | | | | | | | | |
6.00%, 6/30/21 (b) | | | | | | | 200 | | | | 207,000 | |
4.63%, 5/15/23 (b) | | | | | | | 200 | | | | 204,918 | |
7.25%, 5/15/24 (b) | | | | | | | 200 | | | | 218,750 | |
Ball Corp., 5.00%, 3/15/22 | | | | | | | 21 | | | | 22,417 | |
BWAY Holding Co., 5.50%, 4/15/24 (b) | | | | | | | 70 | | | | 71,487 | |
Flex Acquisition Co., Inc., 6.88%, 1/15/25 (b) | | | | | | | 3 | | | | 3,120 | |
Reynolds Group Issuer, Inc.: | | | | | | | | | | | | |
5.75%, 10/15/20 | | | | | | | 42 | | | | 42,980 | |
6.88%, 2/15/21 | | | | | | | 65 | | | | 66,596 | |
4.66%, 7/15/21 (b)(f) | | | | | | | 40 | | | | 40,650 | |
5.13%, 7/15/23 (b) | | | | | | | 24 | | | | 24,930 | |
7.00%, 7/15/24 (b) | | | | | | | 171 | | | | 183,434 | |
| | | | | | | | | | | | |
| Corporate Bonds | | | | | Par (000) | | | Value | |
Containers & Packaging (continued) | | | | | | | | | | | | |
Sealed Air Corp.: | | | | | | | | | | | | |
4.88%, 12/01/22 (b) | | | USD | | | | 11 | | | $ | 11,715 | |
6.88%, 7/15/33 (b) | | | | | | | 9 | | | | 10,350 | |
Signode Industrial Group Lux SA/Signode Industrial Group U.S., Inc., 6.38%, 5/01/22 (b) | | | | | | | 50 | | | | 52,250 | |
| | | | | | | | | | | | |
| | | | | | | | | | | | 1,160,597 | |
Distributors — 0.1% | | | | | | | | | | | | |
American Tire Distributors, Inc., 10.25%, 3/01/22 (b) | | | | | | | 39 | | | | 40,365 | |
Diversified Consumer Services — 0.2% | | | | | | | | | | | | |
Laureate Education, Inc., 8.25%, 5/01/25 (b) | | | | | | | 29 | | | | 31,103 | |
Service Corp. International, 4.50%, 11/15/20 | | | | | | | 20 | | | | 20,375 | |
Sotheby’s, 5.25%, 10/01/22 (b) | | | | | | | 12 | | | | 12,270 | |
| | | | | | | | | | | | |
| | | | | | | | | | | | 63,748 | |
Diversified Financial Services — 3.7% | | | | | | | | | | | | |
Alpine Finance Merger Sub LLC, 6.88%, 8/01/25 (b) | | | | | | | 19 | | | | 19,333 | |
Altice Financing SA, 7.50%, 5/15/26 (b) | | | | | | | 200 | | | | 222,000 | |
Altice U.S. Finance I Corp., 5.38%, 7/15/23 (b) | | | | | | | 200 | | | | 208,125 | |
ASP AMC Merger Sub, Inc., 8.00%, 5/15/25 (b) | | | | | | | 14 | | | | 13,265 | |
Eagle Holding Co. II LLC, 7.63% (7.63% Cash or 8.38% PIK), 5/15/22 (b)(e) | | | | | | | 30 | | | | 30,863 | |
Exela Intermediate LLC/Exela Finance, Inc., 10.00%, 7/15/23 (b) | | | | | | | 28 | | | | 27,650 | |
FBM Finance, Inc., 8.25%, 8/15/21 (b) | | | | | | | 20 | | | | 21,425 | |
Jefferies Finance LLC/JFIN Co-Issuer Corp., 7.38%, 4/01/20 (b) | | | | | | | 200 | | | | 205,000 | |
Nielsen Co. Luxembourg S.à r.l., 5.00%, 2/01/25 (b) | | | | | | | 51 | | | | 52,275 | |
Veritas U.S., Inc./Veritas Bermuda Ltd., 7.50%, 2/01/23 (b) | | | | | | | 200 | | | | 215,000 | |
Virgin Media Finance PLC, 5.75%, 1/15/25 (b) | | | | | | | 200 | | | | 207,500 | |
| | | | | | | | | | | | |
| | | | | | | | | | | | 1,222,436 | |
Diversified Telecommunication Services — 3.9% | | | | | | | | | | | | |
CenturyLink, Inc.: | | | | | | | | | | | | |
Series P, 7.60%, 9/15/39 | | | | | | | 2 | | | | 1,860 | |
Series S, 6.45%, 6/15/21 | | | | | | | 88 | | | | 95,040 | |
Series T, 5.80%, 3/15/22 | | | | | | | 32 | | | | 33,280 | |
Series U, 7.65%, 3/15/42 | | | | | | | 39 | | | | 36,221 | |
Series W, 6.75%, 12/01/23 | | | | | | | 6 | | | | 6,461 | |
Series Y, 7.50%, 4/01/24 | | | | | | | 9 | | | | 9,855 | |
Cincinnati Bell, Inc., 7.00%, 7/15/24 (b) | | | | | | | 52 | | | | 54,350 | |
Frontier Communications Corp.: | | | | | | | | | | | | |
8.13%, 10/01/18 | | | | | | | 13 | | | | 13,731 | |
7.13%, 3/15/19 | | | | | | | 5 | | | | 5,213 | |
6.25%, 9/15/21 | | | | | | | 36 | | | | 32,130 | |
7.13%, 1/15/23 | | | | | | | 36 | | | | 29,970 | |
7.63%, 4/15/24 | | | | | | | 18 | | | | 14,827 | |
6.88%, 1/15/25 | | | | | | | 124 | | | | 97,650 | |
Intelsat Jackson Holdings SA: | | | | | | | | | | | | |
7.25%, 4/01/19 | | | | | | | 49 | | | | 49,012 | |
7.25%, 10/15/20 | | | | | | | 40 | | | | 37,800 | |
5.50%, 8/01/23 | | | | | | | 30 | | | | 24,825 | |
9.75%, 7/15/25 (b) | | | | | | | 43 | | | | 42,946 | |
Level 3 Financing, Inc.: | | | | | | | | | | | | |
5.38%, 8/15/22 | | | | | | | 41 | | | | 42,230 | |
5.63%, 2/01/23 | | | | | | | 30 | | | | 31,200 | |
5.13%, 5/01/23 | | | | | | | 13 | | | | 13,496 | |
5.38%, 1/15/24 | | | | | | | 52 | | | | 54,275 | |
5.38%, 5/01/25 | | | | | | | 23 | | | | 24,207 | |
5.25%, 3/15/26 | | | | | | | 64 | | | | 66,407 | |
See Notes to Financial Statements.
| | | | | | |
| 88 | | BLACKROCK SERIES FUND, INC. | | JUNE 30, 2017 | | |
| | | | |
| Schedule of Investments (continued) | | | BlackRock High Yield Portfolio | |
| | | | |
| | | | | | | | | | | | |
| Corporate Bonds | | | | | Par (000) | | | Value | |
Qwest Corp., 6.75%, 12/01/21 | | | USD | | | | 10 | | | $ | 11,048 | |
SBA Communications Corp., 4.88%, 9/01/24 (b) | | | | | | | 23 | | | | 23,403 | |
Telecom Italia Capital SA: | | | | | | | | | | | | |
6.38%, 11/15/33 | | | | | | | 25 | | | | 27,000 | |
6.00%, 9/30/34 | | | | | | | 100 | | | | 105,736 | |
7.20%, 7/18/36 | | | | | | | 20 | | | | 23,187 | |
Telesat Canada/Telesat LLC, 8.88%, 11/15/24 (b) | | | | | | | 48 | | | | 53,880 | |
Xplornet Communications, Inc., 9.63% (9.63% Cash or 10.63% PIK), 6/01/22 (b)(e) | | | | | | | 11 | | | | 11,440 | |
Zayo Group LLC/Zayo Capital, Inc.: | | | | | | | | | | | | |
6.00%, 4/01/23 | | | | | | | 111 | | | | 116,827 | |
6.38%, 5/15/25 | | | | | | | 35 | | | | 37,778 | |
5.75%, 1/15/27 (b) | | | | | | | 83 | | | | 86,839 | |
| | | | | | | | | | | | |
| | | | | | | | | | | | 1,314,124 | |
Electrical Equipment — 0.4% | | | | | | | | | | | | |
GrafTech International Ltd., 6.38%, 11/15/20 | | | | | | | 17 | | | | 15,087 | |
Sensata Technologies BV: | | | | | | | | | | | | |
5.63%, 11/01/24 (b) | | | | | | | 7 | | | | 7,508 | |
5.00%, 10/01/25 (b) | | | | | | | 63 | | | | 65,885 | |
Vertiv Group Corp., 9.25%, 10/15/24 (b) | | | | | | | 51 | | | | 55,080 | |
| | | | | | | | | | | | |
| | | | | | | | | | | | 143,560 | |
Electronic Equipment, Instruments & Components — 0.3% | |
Anixter, Inc., 5.63%, 5/01/19 | | | | | | | 5 | | | | 5,263 | |
CDW LLC/CDW Finance Corp.: | | | | | | | | | | | | |
5.00%, 9/01/23 | | | | | | | 31 | | | | 32,279 | |
5.50%, 12/01/24 | | | | | | | 49 | | | | 52,996 | |
5.00%, 9/01/25 | | | | | | | 13 | | | | 13,487 | |
| | | | | | | | | | | | |
| | | | | | | | | | | | 104,025 | |
Energy Equipment & Services — 1.4% | | | | | | | | | | | | |
Ensco PLC: | | | | | | | | | | | | |
4.50%, 10/01/24 | | | | | | | 15 | | | | 11,550 | |
5.20%, 3/15/25 | | | | | | | 5 | | | | 4,063 | |
Noble Holding International Ltd.: | | | | | | | | | | | | |
4.63%, 3/01/21 | | | | | | | 2 | | | | 1,635 | |
7.75%, 1/15/24 | | | | | | | 28 | | | | 22,155 | |
Noble Holding U.S. LLC/Noble Drilling Services 6 LLC/Noble Drilling Holding LLC, 7.50%, 3/15/19 | | | | | | | 15 | | | | 15,037 | |
Parker Drilling Co., 7.50%, 8/01/20 | | | | | | | 23 | | | | 19,895 | |
Pioneer Energy Services Corp., 6.13%, 3/15/22 | | | | | | | 45 | | | | 34,875 | |
Precision Drilling Corp.: | | | | | | | | | | | | |
6.63%, 11/15/20 | | | | | | | 3 | | | | 2,922 | |
6.50%, 12/15/21 | | | | | | | 5 | | | | 4,894 | |
7.75%, 12/15/23 (b) | | | | | | | 15 | | | | 14,925 | |
5.25%, 11/15/24 | | | | | | | 13 | | | | 11,343 | |
Rowan Cos., Inc.: | | | | | | | | | | | | |
4.88%, 6/01/22 | | | | | | | 10 | | | | 9,275 | |
7.38%, 6/15/25 | | | | | | | 67 | | | | 62,477 | |
SESI LLC: | | | | | | | | | | | | |
6.38%, 5/01/19 | | | | | | | 10 | | | | 9,875 | |
7.13%, 12/15/21 | | | | | | | 10 | | | | 9,525 | |
Transocean, Inc.: | | | | | | | | | | | | |
6.00%, 3/15/18 | | | | | | | 16 | | | | 16,360 | |
5.80%, 10/15/22 | | | | | | | 20 | | | | 18,550 | |
9.00%, 7/15/23 (b) | | | | | | | 74 | | | | 76,775 | |
6.80%, 3/15/38 | | | | | | | 17 | | | | 12,410 | |
Weatherford International LLC, 6.80%, 6/15/37 | | | | | | | 12 | | | | 10,260 | |
| | | | | | | | | | | | |
| Corporate Bonds | | | | | Par (000) | | | Value | |
Weatherford International Ltd.: | | | | | | | | | | | | |
7.75%, 6/15/21 | | | USD | | | | 31 | | | $ | 31,155 | |
8.25%, 6/15/23 | | | | | | | 5 | | | | 5,000 | |
9.88%, 2/15/24 (b) | | | | | | | 5 | | | | 5,225 | |
6.50%, 8/01/36 | | | | | | | 26 | | | | 22,100 | |
7.00%, 3/15/38 | | | | | | | 31 | | | | 26,505 | |
5.95%, 4/15/42 | | | | | | | 13 | | | | 10,140 | |
| | | | | | | | | | | | |
| | | | | | | | | | | | 468,926 | |
Equity Real Estate Investment Trusts (REITs) — 1.6% | | | | | | | | | | | | |
CyrusOne LP/CyrusOne Finance Corp., 5.00%, 3/15/24 (b) | | | | | | | 35 | | | | 36,050 | |
Equinix, Inc., 5.88%, 1/15/26 | | | | | | | 35 | | | | 38,161 | |
ESH Hospitality, Inc., 5.25%, 5/01/25 (b) | | | | | | | 11 | | | | 11,399 | |
GEO Group, Inc.: | | | | | | | | | | | | |
5.13%, 4/01/23 | | | | | | | 17 | | | | 17,085 | |
5.88%, 10/15/24 | | | | | | | 50 | | | | 51,625 | |
6.00%, 4/15/26 | | | | | | | 7 | | | | 7,263 | |
GLP Capital LP/GLP Financing II, Inc., 5.38%, 4/15/26 | | | | | | | 9 | | | | 9,831 | |
iStar, Inc., 6.00%, 4/01/22 | | | | | | | 11 | | | | 11,275 | |
MGM Growth Properties Operating Partnership LP/MGP Finance Co-Issuer, Inc.: | | | | | | | | | | | | |
5.63%, 5/01/24 | | | | | | | 146 | | | | 159,140 | |
4.50%, 9/01/26 | | | | | | | 82 | | | | 82,513 | |
Uniti Group, Inc./CSL Capital LLC: | | | | | | | | | | | | |
6.00%, 4/15/23 (b) | | | | | | | 3 | | | | 3,122 | |
8.25%, 10/15/23 | | | | | | | 61 | | | | 62,830 | |
7.13%, 12/15/24 (b) | | | | | | | 35 | | | | 34,749 | |
Uniti Group, Inc./Uniti Fiber Holdings, Inc./CSL Capital LLC, 7.13%, 12/15/24 (b) | | | | | | | 18 | | | | 17,843 | |
| | | | | | | | | | | | |
| | | | | | | | | | | | 542,886 | |
Food & Staples Retailing — 0.2% | | | | | | | | | | | | |
Albertsons Cos. LLC/Safeway, Inc./New Albertson’s, Inc./Albertson’s LLC, 5.75%, 3/15/25 (b) | | | | | | | 28 | | | | 26,040 | |
Rite Aid Corp.: | | | | | | | | | | | | |
6.75%, 6/15/21 | | | | | | | 2 | | | | 2,054 | |
6.13%, 4/01/23 (b) | | | | | | | 8 | | | | 7,855 | |
7.70%, 2/15/27 | | | | | | | 39 | | | | 39,390 | |
| | | | | | | | | | | | |
| | | | | | | | | | | | 75,339 | |
Food Products — 0.6% | | | | | | | | | | | | |
B&G Foods, Inc., 5.25%, 4/01/25 | | | | | | | 16 | | | | 16,320 | |
Chobani LLC/Chobani Finance Corp., Inc., 7.50%, 4/15/25 (b) | | | | | | | 36 | | | | 38,025 | |
JBS USA LUX SA/JBS USA Finance, Inc.: | | | | | | | | | | | | |
5.88%, 7/15/24 (b) | | | | | | | 16 | | | | 15,000 | |
5.75%, 6/15/25 (b) | | | | | | | 56 | | | | 52,640 | |
Post Holdings, Inc.: | | | | | | | | | | | | |
5.50%, 3/01/25 (b) | | | | | | | 34 | | | | 35,063 | |
5.00%, 8/15/26 (b) | | | | | | | 20 | | | | 19,950 | |
TreeHouse Foods, Inc., 6.00%, 2/15/24 (b) | | | | | | | 8 | | | | 8,520 | |
WhiteWave Foods Co., 5.38%, 10/01/22 | | | | | | | 25 | | | | 28,200 | |
| | | | | | | | | | | | |
| | | | | | | | | | | | 213,718 | |
Health Care Equipment & Supplies — 0.4% | | | | | | | | | | | | |
Alere, Inc.: | | | | | | | | | | | | |
6.50%, 6/15/20 | | | | | | | 13 | | | | 13,195 | |
6.38%, 7/01/23 (b) | | | | | | | 18 | | | | 19,327 | |
DJO Finco, Inc./DJO Finance LLC/DJO Finance Corp., 8.13%, 6/15/21 (b) | | | | | | | 88 | | | | 81,840 | |
Teleflex, Inc., 4.88%, 6/01/26 | | | | | | | 12 | | | | 12,270 | |
| | | | | | | | | | | | |
| | | | | | | | | | | | 126,632 | |
See Notes to Financial Statements.
| | | | | | |
| | | BLACKROCK SERIES FUND, INC. | | JUNE 30, 2017 | | 89 |
| | | | |
| Schedule of Investments (continued) | | | BlackRock High Yield Portfolio | |
| | | | |
| | | | | | | | | | | | |
| Corporate Bonds | | | | | Par (000) | | | Value | |
Health Care Providers & Services — 6.0% | | | | | | | | | | | | |
Acadia Healthcare Co., Inc.: | | | | | | | | | | | | |
5.13%, 7/01/22 | | | USD | | | | 11 | | | $ | 11,357 | |
5.63%, 2/15/23 | | | | | | | 47 | | | | 48,616 | |
6.50%, 3/01/24 | | | | | | | 26 | | | | 27,755 | |
Centene Corp.: | | | | | | | | | | | | |
5.63%, 2/15/21 | | | | | | | 45 | | | | 46,913 | |
4.75%, 5/15/22 | | | | | | | 37 | | | | 38,619 | |
6.13%, 2/15/24 | | | | | | | 5 | | | | 5,406 | |
4.75%, 1/15/25 | | | | | | | 40 | | | | 41,100 | |
CHS/Community Health Systems, Inc.: | | | | | | | | | | | | |
8.00%, 11/15/19 | | | | | | | 35 | | | | 35,175 | |
7.13%, 7/15/20 | | | | | | | 37 | | | | 36,029 | |
5.13%, 8/01/21 | | | | | | | 11 | | | | 11,137 | |
6.88%, 2/01/22 | | | | | | | 24 | | | | 20,970 | |
6.25%, 3/31/23 | | | | | | | 91 | | | | 93,944 | |
DaVita, Inc.: | | | | | | | | | | | | |
5.13%, 7/15/24 | | | | | | | 4 | | | | 4,060 | |
5.00%, 5/01/25 | | | | | | | 33 | | | | 33,083 | |
Envision Healthcare Corp.: | | | | | | | | | | | | |
5.13%, 7/01/22 (b) | | | | | | | 55 | | | | 56,444 | |
5.63%, 7/15/22 | | | | | | | 97 | | | | 100,516 | |
6.25%, 12/01/24 (b) | | | | | | | 20 | | | | 21,350 | |
Fresenius Medical Care U.S. Finance II, Inc., 5.88%, 1/31/22 (b) | | | | | | | 5 | | | | 5,538 | |
HCA, Inc.: | | | | | | | | | | | | |
5.88%, 3/15/22 | | | | | | | 23 | | | | 25,501 | |
4.75%, 5/01/23 | | | | | | | 8 | | | | 8,460 | |
5.00%, 3/15/24 | | | | | | | 87 | | | | 92,111 | |
5.38%, 2/01/25 | | | | | | | 132 | | | | 139,234 | |
5.25%, 4/15/25 | | | | | | | 57 | | | | 61,275 | |
5.88%, 2/15/26 | | | | | | | 48 | | | | 51,840 | |
5.25%, 6/15/26 | | | | | | | 104 | | | | 112,164 | |
4.50%, 2/15/27 | | | | | | | 40 | | | | 41,150 | |
5.50%, 6/15/47 | | | | | | | 108 | | | | 111,780 | |
Series 1, 5.88%, 5/01/23 | | | | | | | 17 | | | | 18,509 | |
HealthSouth Corp.: | | | | | | | | | | | | |
5.13%, 3/15/23 | | | | | | | 50 | | | | 51,500 | |
5.75%, 11/01/24 | | | | | | | 3 | | | | 3,079 | |
IASIS Healthcare LLC/IASIS Capital Corp., 8.38%, 5/15/19 | | | | | | | 28 | | | | 28,140 | |
MEDNAX, Inc., 5.25%, 12/01/23 (b) | | | | | | | 26 | | | | 26,780 | |
Molina Healthcare, Inc., 4.88%, 6/15/25 (b) | | | | | | | 12 | | | | 12,090 | |
MPH Acquisition Holdings LLC, 7.13%, 6/01/24 (b) | | | | | | | 92 | | | | 98,095 | |
RegionalCare Hospital Partners Holdings, Inc., 8.25%, 5/01/23 (b) | | | | | | | 38 | | | | 40,755 | |
Surgery Center Holdings, Inc.: | | | | | | | | | | | | |
8.88%, 4/15/21 (b) | | | | | | | 10 | | | | 10,837 | |
6.75%, 7/01/25 (b) | | | | | | | 29 | | | | 29,363 | |
Team Health Holdings, Inc., 6.38%, 2/01/25 (b) | | | | | | | 80 | | | | 77,600 | |
Tenet Healthcare Corp.: | | | | | | | | | | | | |
6.00%, 10/01/20 | | | | | | | 40 | | | | 42,850 | |
7.50%, 1/01/22 (b) | | | | | | | 16 | | | | 17,357 | |
8.13%, 4/01/22 | | | | | | | 78 | | | | 82,777 | |
6.75%, 6/15/23 | | | | | | | 86 | | | | 86,000 | |
4.63%, 7/15/24 (b) | | | | | | | 9 | | | | 9,011 | |
THC Escrow Corp. III: | | | | | | | | | | | | |
4.63%, 7/15/24 (b) | | | | | | | 11 | | | | 11,030 | |
5.13%, 5/01/25 (b) | | | | | | | 18 | | | | 18,067 | |
7.00%, 8/01/25 (b) | | | | | | | 55 | | | | 54,794 | |
Vizient, Inc., 10.38%, 3/01/24 (b) | | | | | | | 5 | | | | 5,750 | |
WellCare Health Plans, Inc., 5.25%, 4/01/25 | | | | | | | 11 | | | | 11,523 | |
| | | | | | | | | | | | |
| | | | | | | | | | | | 2,017,434 | |
| | | | | | | | | | | | |
| Corporate Bonds | | | | | Par (000) | | | Value | |
Health Care Technology — 0.1% | | | | | | | | | | | | |
Change Healthcare Holdings LLC/Change Healthcare Finance, Inc., 5.75%, 3/01/25 (b) | | | USD | | | | 26 | | | $ | 26,520 | |
Hotels, Restaurants & Leisure — 3.4% | | | | | | | | | | | | |
Aramark Services, Inc., 5.13%, 1/15/24 | | | | | | | 29 | | | | 30,486 | |
BC ULC/New Red Finance, Inc.: | | | | | | | | | | | | |
6.00%, 4/01/22 (b) | | | | | | | 50 | | | | 51,813 | |
4.25%, 5/15/24 (b) | | | | | | | 67 | | | | 66,577 | |
Caesars Entertainment Resort Properties LLC, 8.00%, 10/01/20 | | | | | | | 93 | | | | 95,790 | |
Eldorado Resorts, Inc., 6.00%, 4/01/25 (b) | | | | | | | 10 | | | | 10,600 | |
Hilton Domestic Operating Co., Inc., 4.25%, 9/01/24 (b) | | | | | | | 17 | | | | 17,234 | |
Jacobs Entertainment, Inc., 7.88%, 2/01/24 (b) | | | | | | | 10 | | | | 10,850 | |
KFC Holding Co./Pizza Hut Holdings LLC/Taco Bell of America LLC: | | | | | | | | | | | | |
5.00%, 6/01/24 (b) | | | | | | | 10 | | | | 10,425 | |
5.25%, 6/01/26 (b) | | | | | | | 13 | | | | 13,683 | |
4.75%, 6/01/27 (b) | | | | | | | 18 | | | | 18,383 | |
MGM Resorts International: | | | | | | | | | | | | |
5.25%, 3/31/20 | | | | | | | 22 | | | | 23,293 | |
6.75%, 10/01/20 | | | | | | | 47 | | | | 52,071 | |
6.63%, 12/15/21 | | | | | | | 128 | | | | 143,680 | |
7.75%, 3/15/22 | | | | | | | 10 | | | | 11,737 | |
4.63%, 9/01/26 | | | | | | | 3 | | | | 3,030 | |
Scientific Games International, Inc.: | | | | | | | | | | | | |
7.00%, 1/01/22 (b) | | | | | | | 119 | | | | 126,735 | |
10.00%, 12/01/22 | | | | | | | 119 | | | | 130,454 | |
Six Flags Entertainment Corp.: | | | | | | | | | | | | |
4.88%, 7/31/24 (b) | | | | | | | 73 | | | | 73,447 | |
5.50%, 4/15/27 (b) | | | | | | | 37 | | | | 38,110 | |
Station Casinos LLC, 7.50%, 3/01/21 | | | | | | | 45 | | | | 46,800 | |
Sterling Entertainment Enterprises LLC, 9.75%, 12/25/19 (b)(d) | | | | | | | 150 | | | | 148,500 | |
Yum! Brands, Inc., 3.88%, 11/01/23 | | | | | | | 2 | | | | 1,975 | |
| | | | | | | | | | | | |
| | | | | | | | | | | | 1,125,673 | |
Household Durables — 1.2% | | | | | | | | | | | | |
AV Homes, Inc., 6.63%, 5/15/22 (b) | | | | | | | 12 | | | | 12,375 | |
CalAtlantic Group, Inc.: | | | | | | | | | | | | |
6.63%, 5/01/20 | | | | | | | 6 | | | | 6,645 | |
8.38%, 1/15/21 | | | | | | | 56 | | | | 66,220 | |
5.38%, 10/01/22 | | | | | | | 2 | | | | 2,155 | |
5.25%, 6/01/26 | | | | | | | 14 | | | | 14,525 | |
Lennar Corp.: | | | | | | | | | | | | |
4.75%, 4/01/21 | | | | | | | 4 | | | | 4,240 | |
4.13%, 1/15/22 | | | | | | | 28 | | | | 28,945 | |
4.75%, 11/15/22 | | | | | | | 24 | | | | 25,500 | |
Mattamy Group Corp., 6.88%, 12/15/23 (b) | | | | | | | 12 | | | | 12,255 | |
Meritage Homes Corp., 5.13%, 6/06/27 (b) | | | | | | | 12 | | | | 12,015 | |
PulteGroup, Inc.: | | | | | | | | | | | | |
5.50%, 3/01/26 | | | | | | | 50 | | | | 53,250 | �� |
6.38%, 5/15/33 | | | | | | | 22 | | | | 22,990 | |
6.00%, 2/15/35 | | | | | | | 6 | | | | 6,015 | |
Tempur Sealy International, Inc., 5.50%, 6/15/26 | | | | | | | 56 | | | | 56,910 | |
TRI Pointe Group, Inc.: | | | | | | | | | | | | |
4.38%, 6/15/19 | | | | | | | 10 | | | | 10,242 | |
4.88%, 7/01/21 | | | | | | | 15 | | | | 15,787 | |
5.88%, 6/15/24 | | | | | | | 15 | | | | 15,825 | |
5.25%, 6/01/27 | | | | | | | 20 | | | | 20,050 | |
William Lyon Homes, Inc., 5.88%, 1/31/25 | | | | | | | 10 | | | | 10,300 | |
| | | | | | | | | | | | |
| | | | | | | | | | | | 396,244 | |
See Notes to Financial Statements.
| | | | | | |
| 90 | | BLACKROCK SERIES FUND, INC. | | JUNE 30, 2017 | | |
| | | | |
| Schedule of Investments (continued) | | | BlackRock High Yield Portfolio | |
| | | | |
| | | | | | | | | | | | |
| Corporate Bonds | | | | | Par (000) | | | Value | |
Household Products — 0.2% | | | | | | | | | | | | |
HRG Group, Inc., 7.88%, 7/15/19 | | | USD | | | | 26 | | | $ | 26,650 | |
Spectrum Brands, Inc.: | | | | | | | | | | | | |
6.63%, 11/15/22 | | | | | | | 35 | | | | 36,663 | |
5.75%, 7/15/25 | | | | | | | 11 | | | | 11,799 | |
| | | | | | | | | | | | |
| | | | | | | | | | | | 75,112 | |
Independent Power and Renewable Electricity Producers — 0.9% | |
AES Corp., 4.88%, 5/15/23 | | | | | | | 2 | | | | 2,038 | |
Calpine Corp.: | | | | | | | | | | | | |
5.38%, 1/15/23 | | | | | | | 6 | | | | 5,850 | |
5.88%, 1/15/24 (b) | | | | | | | 25 | | | | 25,750 | |
Dynegy, Inc.: | | | | | | | | | | | | |
6.75%, 11/01/19 | | | | | | | 60 | | | | 61,875 | |
7.38%, 11/01/22 | | | | | | | 35 | | | | 34,563 | |
7.63%, 11/01/24 | | | | | | | 7 | | | | 6,790 | |
NRG Energy, Inc.: | | | | | | | | | | | | |
7.88%, 5/15/21 | | | | | | | 5 | | | | 5,163 | |
6.63%, 3/15/23 | | | | | | | 5 | | | | 5,138 | |
6.25%, 5/01/24 | | | | | | | 14 | | | | 14,140 | |
6.63%, 1/15/27 | | | | | | | 74 | | | | 74,093 | |
NRG Yield Operating LLC, 5.38%, 8/15/24 | | | | | | | 15 | | | | 15,731 | |
Pattern Energy Group, Inc., 5.88%, 2/01/24 (b) | | | | | | | 16 | | | | 16,840 | |
Talen Energy Supply LLC, 6.50%, 6/01/25 | | | | | | | 9 | | | | 6,345 | |
TerraForm Power Operating LLC, 6.38%, 2/01/23 (b)(g) | | | | | | | 23 | | | | 23,920 | |
| | | | | | | | | | | | |
| | | | | | | | | | | | 298,236 | |
Insurance — 1.0% | | | | | | | | | | | | |
Alliant Holdings Intermediate LLC, 8.25%, 8/01/23 (b) | | | | | | | 67 | | | | 71,187 | |
HUB International Ltd., 7.88%, 10/01/21 (b) | | | | | | | 107 | | | | 111,547 | |
Radian Group, Inc., 5.25%, 6/15/20 | | | | | | | 28 | | | | 29,750 | |
Solera LLC/Solera Finance, Inc., 10.50%, 3/01/24 (b) | | | | | | | 106 | | | | 121,767 | |
USIS Merger Sub, Inc., 6.88%, 5/01/25 (b) | | | | | | | 15 | | | | 15,263 | |
| | | | | | | | | | | | |
| | | | | | | | | | | | 349,514 | |
Internet & Direct Marketing Retail — 0.3% | | | | | | | | | | | | |
Netflix, Inc.: | | | | | | | | | | | | |
5.50%, 2/15/22 | | | | | | | 42 | | | | 45,609 | |
4.38%, 11/15/26 (b) | | | | | | | 56 | | | | 55,860 | |
| | | | | | | | | | | | |
| | | | | | | | | | | | 101,469 | |
Internet Software & Services — 0.1% | | | | | | | | | | | | |
Genesys Telecommunications Laboratories, Inc./Greeneden Lux 3 S.à r.l./Greeneden U.S. Holdings II LLC, 10.00%, 11/30/24 (b) | | | | | | | 20 | | | | 22,475 | |
GTT Communications, Inc., 7.88%, 12/31/24 (b) | | | | | | | 14 | | | | 14,980 | |
| | | | | | | | | | | | |
| | | | | | | | | | | | 37,455 | |
IT Services — 2.3% | | | | | | | | | | | | |
Alliance Data Systems Corp.: | | | | | | | | | | | | |
5.88%, 11/01/21 (b) | | | | | | | 49 | | | | 50,715 | |
5.38%, 8/01/22 (b) | | | | | | | 65 | | | | 65,650 | |
APX Group, Inc.: | | | | | | | | | | | | |
6.38%, 12/01/19 | | | | | | | 8 | | | | 8,220 | |
8.75%, 12/01/20 | | | | | | | 42 | | | | 43,365 | |
7.88%, 12/01/22 | | | | | | | 46 | | | | 49,910 | |
Booz Allen Hamilton, Inc., 5.13%, 5/01/25 (b) | | | | | | | 49 | | | | 48,143 | |
First Data Corp.: | | | | | | | | | | | | |
7.00%, 12/01/23 (b) | | | | | | | 129 | | | | 137,707 | |
5.75%, 1/15/24 (b) | | | | | | | 246 | | | | 255,533 | |
Gartner, Inc., 5.13%, 4/01/25 (b) | | | | | | | 21 | | | | 22,059 | |
| | | | | | | | | | | | |
| Corporate Bonds | | | | | Par (000) | | | Value | |
Sabre GLBL, Inc.: | | | | | | | | | | | | |
5.38%, 4/15/23 (b) | | | USD | | | | 11 | | | $ | 11,467 | |
5.25%, 11/15/23 (b) | | | | | | | 16 | | | | 16,600 | |
WEX, Inc., 4.75%, 2/01/23 (b) | | | | | | | 50 | | | | 50,250 | |
| | | | | | | | | | | | |
| | | | | | | | | | | | 759,619 | |
Life Sciences Tools & Services — 0.8% | | | | | | | | | | | | |
inVentiv Group Holdings, Inc./inVentiv Health, Inc./inVentiv Health Clinical, Inc., 7.50%, 10/01/24 (b) | | | | | | | 44 | | | | 47,740 | |
Jaguar Holding Co. II/Pharmaceutical Product Development LLC, 6.38%, 8/01/23 (b) | | | | | | | 98 | | | | 103,267 | |
Ortho-Clinical Diagnostics, Inc./Ortho-Clinical Diagnostics SA, 6.63%, 5/15/22 (b) | | | | | | | 105 | | | | 100,275 | |
Sterigenics-Nordion Holdings LLC, 6.50%, 5/15/23 (b) | | | | | | | 12 | | | | 12,360 | |
| | | | | | | | | | | | |
| | | | | | | | | | | | 263,642 | |
Machinery — 1.2% | | | | | | | | | | | | |
Accudyne Industries Borrower/Accudyne Industries LLC, 7.75%, 12/15/20 (b) | | | | | | | 150 | | | | 150,000 | |
EnPro Industries, Inc., 5.88%, 9/15/22 (b) | | | | | | | 13 | | | | 13,553 | |
Gates Global LLC/Gates Global Co., 6.00%, 7/15/22 (b) | | | | | | | 97 | | | | 97,243 | |
Grinding Media, Inc./MC Grinding Media Canada, Inc., 7.38%, 12/15/23 (b) | | | | | | | 21 | | | | 22,837 | |
Mercer International, Inc., 6.50%, 2/01/24 (b) | | | | | | | 9 | | | | 9,398 | |
Navistar International Corp., 8.25%, 11/01/21 | | | | | | | 18 | | | | 18,180 | |
SPX FLOW, Inc.: | | | | | | | | | | | | |
5.63%, 8/15/24 (b) | | | | | | | 16 | | | | 16,480 | |
5.88%, 8/15/26 (b) | | | | | | | 20 | | | | 20,650 | |
Terex Corp., 5.63%, 2/01/25 (b) | | | | | | | 41 | | | | 42,179 | |
| | | | | | | | | | | | |
| | | | | | | | | | | | 390,520 | |
Media — 9.4% | | | | | | | | | | | | |
AMC Networks, Inc.: | | | | | | | | | | | | |
4.75%, 12/15/22 | | | | | | | 16 | | | | 16,509 | |
5.00%, 4/01/24 | | | | | | | 68 | | | | 69,615 | |
Cablevision Systems Corp.: | | | | | | | | | | | | |
8.63%, 9/15/17 | | | | | | | 4 | | | | 4,050 | |
7.75%, 4/15/18 | | | | | | | 45 | | | | 46,687 | |
8.00%, 4/15/20 | | | | | | | 15 | | | | 16,706 | |
CBS Radio, Inc., 7.25%, 11/01/24 (b) | | | | | | | 7 | | | | 7,210 | |
CCO Holdings LLC/CCO Holdings Capital Corp.: | | | | | | | | | | | | |
5.13%, 5/01/23 (b) | | | | | | | 33 | | | | 34,650 | |
5.13%, 5/01/27 (b) | | | | | | | 337 | | | | 344,583 | |
Cequel Communications Holdings I LLC/Cequel Capital Corp.: | | | | | | | | | | | | |
6.38%, 9/15/20 (b) | | | | | | | 45 | | | | 45,900 | |
5.13%, 12/15/21 (b) | | | | | | | 78 | | | | 79,365 | |
5.13%, 12/15/21 (b) | | | | | | | 100 | | | | 101,843 | |
Clear Channel International BV, 8.75%, 12/15/20 (b) | | | | | | | 90 | | | | 95,400 | |
Clear Channel Worldwide Holdings, Inc.: | | | | | | | | | | | | |
Series A, 6.50%, 11/15/22 | | | | | | | 17 | | | | 17,340 | |
Series B, 7.63%, 3/15/20 | | | | | | | 119 | | | | 118,405 | |
Series B, 6.50%, 11/15/22 | | | | | | | 299 | | | | 307,282 | |
CSC Holdings LLC: | | | | | | | | | | | | |
10.13%, 1/15/23 (b) | | | | | | | 400 | | | | 464,022 | |
5.25%, 6/01/24 | | | | | | | 35 | | | | 35,703 | |
DISH DBS Corp.: | | | | | | | | | | | | |
5.88%, 7/15/22 | | | | | | | 103 | | | | 110,725 | |
5.00%, 3/15/23 | | | | | | | 25 | | | | 25,625 | |
5.88%, 11/15/24 | | | | | | | 17 | | | | 18,138 | |
7.75%, 7/01/26 | | | | | | | 129 | | | | 152,865 | |
DISH Network Corp., 3.38%, 8/15/26 (b)(h) | | | | | | | 43 | | | | 52,137 | |
See Notes to Financial Statements.
| | | | | | |
| | | BLACKROCK SERIES FUND, INC. | | JUNE 30, 2017 | | 91 |
| | | | |
| Schedule of Investments (continued) | | | BlackRock High Yield Portfolio | |
| | | | |
| | | | | | | | | | | | |
| Corporate Bonds | | | | | Par (000) | | | Value | |
Media (continued) | | | | | | | | | | | | |
iHeartCommunications, Inc.: | | | | | | | | | | | | |
9.00%, 12/15/19 | | | USD | | | | 39 | | | $ | 30,615 | |
9.00%, 3/01/21 | | | | | | | 31 | | | | 23,250 | |
9.00%, 9/15/22 | | | | | | | 80 | | | | 59,200 | |
10.63%, 3/15/23 | | | | | | | 35 | | | | 26,425 | |
Lions Gate Entertainment Corp., 5.88%, 11/01/24 (b) | | | | | | | 10 | | | | 10,525 | |
McGraw-Hill Global Education Holdings LLC/McGraw-Hill Global Education Finance, 7.88%, 5/15/24 (b) | | | | | | | 12 | | | | 11,610 | |
MDC Partners, Inc., 6.50%, 5/01/24 (b) | | | | | | | 42 | | | | 41,895 | |
Midcontinent Communications/Midcontinent Finance Corp.: | | | | | | | | | | | | |
6.25%, 8/01/21 (b) | | | | | | | 40 | | | | 41,320 | |
6.88%, 8/15/23 (b) | | | | | | | 14 | | | | 15,085 | |
Nexstar Broadcasting, Inc., 5.63%, 8/01/24 (b) | | | | | | | 11 | | | | 11,137 | |
Outfront Media Capital LLC/Outfront Media Capital Corp.: | | | | | | | | | | | | |
5.25%, 2/15/22 | | | | | | | 10 | | | | 10,363 | |
5.88%, 3/15/25 | | | | | | | 5 | | | | 5,238 | |
SFR Group SA, 7.38%, 5/01/26 (b) | | | | | | | 248 | | | | 269,080 | |
Sirius XM Radio, Inc.: | | | | | | | | | | | | |
4.63%, 5/15/23 (b) | | | | | | | 5 | | | | 5,144 | |
5.38%, 4/15/25 (b) | | | | | | | 15 | | | | 15,506 | |
TEGNA, Inc., 5.50%, 9/15/24 (b) | | | | | | | 8 | | | | 8,240 | |
Townsquare Media, Inc., 6.50%, 4/01/23 (b) | | | | | | | 24 | | | | 24,120 | |
Tribune Media Co., 5.88%, 7/15/22 | | | | | | | 32 | | | | 33,520 | |
Unitymedia GmbH, 6.13%, 1/15/25 (b) | | | | | | | 200 | | | | 214,500 | |
Univision Communications, Inc.: | | | | | | | | | | | | |
6.75%, 9/15/22 (b) | | | | | | | 5 | | | | 5,200 | |
5.13%, 5/15/23 (b) | | | | | | | 40 | | | | 40,387 | |
5.13%, 2/15/25 (b) | | | | | | | 25 | | | | 24,781 | |
Urban One, Inc., 7.38%, 4/15/22 (b) | | | | | | | 10 | | | | 10,350 | |
Videotron Ltd./Videotron Ltee, 5.13%, 4/15/27 (b) | | | | | | | 38 | | | | 39,045 | |
| | | | | | | | | | | | |
| | | | | | | | | | | | 3,141,296 | |
Metals & Mining — 6.0% | | | | | | | | | | | | |
ArcelorMittal: | | | | | | | | | | | | |
7.50%, 10/15/39 | | | | | | | 8 | | | | 8,970 | |
7.25%, 3/01/41 | | | | | | | 39 | | | | 42,997 | |
Cliffs Natural Resources, Inc., 8.25%, 3/31/20 (b) | | | | | | | 23 | | | | 25,070 | |
Constellium NV, 8.00%, 1/15/23 (b) | | | | | | | 250 | | | | 257,500 | |
First Quantum Minerals Ltd.: | | | | | | | | | | | | |
7.00%, 2/15/21 (b) | | | | | | | 112 | | | | 114,800 | |
7.25%, 5/15/22 (b) | | | | | | | 30 | | | | 30,675 | |
FMG Resources August 2006 Property Ltd., 9.75%, 3/01/22 (b) | | | | | | | 15 | | | | 17,081 | |
Freeport-McMoRan, Inc.: | | | | | | | | | | | | |
2.30%, 11/14/17 | | | | | | | 21 | | | | 20,947 | |
2.38%, 3/15/18 | | | | | | | 224 | | | | 222,880 | |
3.10%, 3/15/20 | | | | | | | 77 | | | | 75,364 | |
4.00%, 11/14/21 | | | | | | | 22 | | | | 21,505 | |
3.55%, 3/01/22 | | | | | | | 59 | | | | 55,294 | |
3.88%, 3/15/23 | | | | | | | 164 | | | | 152,520 | |
5.40%, 11/14/34 | | | | | | | 17 | | | | 15,257 | |
5.45%, 3/15/43 | | | | | | | 151 | | | | 130,207 | |
Joseph T. Ryerson & Son, Inc., 11.00%, 5/15/22 (b) | | | | | | | 22 | | | | 24,887 | |
Kaiser Aluminum Corp., 5.88%, 5/15/24 | | | | | | | 14 | | | | 14,735 | |
Kinross Gold Corp.: | | | | | | | | | | | | |
4.50%, 7/15/27 (b) | | | | | | | 13 | | | | 12,967 | |
6.88%, 9/01/41 | | | | | | | 10 | | | | 10,675 | |
| | | | | | | | | | | | |
| Corporate Bonds | | | | | Par (000) | | | Value | |
Novelis Corp.: | | | | | | | | | | | | |
6.25%, 8/15/24 (b) | | | USD | | | | 173 | | | $ | 181,650 | |
5.88%, 9/30/26 (b) | | | | | | | 45 | | | | 46,350 | |
Steel Dynamics, Inc.: | | | | | | | | | | | | |
5.13%, 10/01/21 | | | | | | | 35 | | | | 35,944 | |
5.25%, 4/15/23 | | | | | | | 52 | | | | 54,015 | |
5.50%, 10/01/24 | | | | | | | 38 | | | | 40,375 | |
SunCoke Energy Partners LP/SunCoke Energy Partners Finance Corp., 7.50%, 6/15/25 (b) | | | | | | | 25 | | | | 24,687 | |
Teck Resources Ltd.: | | | | | | | | | | | | |
4.50%, 1/15/21 | | | | | | | 8 | | | | 8,340 | |
3.75%, 2/01/23 | | | | | | | 66 | | | | 64,267 | |
8.50%, 6/01/24 (b) | | | | | | | 67 | | | | 77,385 | |
6.13%, 10/01/35 | | | | | | | 13 | | | | 13,553 | |
6.00%, 8/15/40 | | | | | | | 72 | | | | 72,360 | |
5.20%, 3/01/42 | | | | | | | 73 | | | | 67,890 | |
5.40%, 2/01/43 | | | | | | | 22 | | | | 20,673 | |
United States Steel Corp., 8.38%, 7/01/21 (b) | | | | | | | 41 | | | | 45,100 | |
| | | | | | | | | | | | |
| | | | | | | | | | | | 2,006,920 | |
Mortgage Real Estate Investment Trusts (REITs) — 0.1% | |
Starwood Property Trust, Inc., 5.00%, 12/15/21 (b) | | | | | | | 27 | | | | 28,080 | |
Multiline Retail — 0.4% | | | | | | | | | | | | |
Dollar Tree, Inc., 5.75%, 3/01/23 | | | | | | | 84 | | | | 88,645 | |
Family Dollar Stores, Inc., 5.00%, 2/01/21 | | | | | | | 36 | | | | 38,520 | |
JC Penney Corp., Inc.: | | | | | | | | | | | | |
8.13%, 10/01/19 | | | | | | | 5 | | | | 5,463 | |
6.38%, 10/15/36 | | | | | | | 8 | | | | 5,750 | |
7.40%, 4/01/37 | | | | | | | 3 | | | | 2,273 | |
| | | | | | | | | | | | |
| | | | | | | | | | | | 140,651 | |
Oil, Gas & Consumable Fuels — 9.7% | | | | | | | | | | | | |
Alta Mesa Holdings LP/Alta Mesa Finance Services Corp., 7.88%, 12/15/24 (b) | | | | | | | 14 | | | | 14,105 | |
Antero Midstream Partners LP/Antero Midstream Finance Corp., 5.38%, 9/15/24 (b) | | | | | | | 5 | | | | 5,113 | |
Antero Resources Corp.: | | | | | | | | | | | | |
5.13%, 12/01/22 | | | | | | | 12 | | | | 12,026 | |
5.63%, 6/01/23 | | | | | | | 5 | | | | 5,063 | |
Ascent Resources Utica Holdings LLC/ARU Finance Corp., 10.00%, 4/01/22 (b) | | | | | | | 33 | | | | 33,000 | |
California Resources Corp., 8.00%, 12/15/22 (b) | | | | | | | 15 | | | | 9,487 | |
Callon Petroleum Co.: | | | | | | | | | | | | |
6.13%, 10/01/24 | | | | | | | 20 | | | | 20,350 | |
6.13%, 10/01/24 (b) | | | | | | | 24 | | | | 24,420 | |
Carrizo Oil & Gas, Inc.: | | | | | | | | | | | | |
6.25%, 4/15/23 | | | | | | | 12 | | | | 11,550 | |
8.25%, 7/15/25 | | | | | | | 10 | | | | 10,225 | |
Cheniere Corpus Christi Holdings LLC: | | | | | | | | | | | | |
7.00%, 6/30/24 | | | | | | | 100 | | | | 111,250 | |
5.88%, 3/31/25 | | | | | | | 45 | | | | 47,981 | |
5.13%, 6/30/27 (b) | | | | | | | 68 | | | | 69,700 | |
Chesapeake Energy Corp.: | | | | | | | | | | | | |
6.88%, 11/15/20 | | | | | | | 26 | | | | 26,000 | |
8.00%, 1/15/25 (b) | | | | | | | 6 | | | | 5,940 | |
8.00%, 6/15/27 (b) | | | | | | | 12 | | | | 11,790 | |
CONSOL Energy, Inc., 5.88%, 4/15/22 | | | | | | | 309 | | | | 303,593 | |
Continental Resources, Inc.: | | | | | | | | | | | | |
3.80%, 6/01/24 | | | | | | | 27 | | | | 24,722 | |
4.90%, 6/01/44 | | | | | | | 26 | | | | 21,710 | |
Covey Park Energy LLC/Covey Park Finance Corp., 7.50%, 5/15/25 (b) | | | | | | | 21 | | | | 21,000 | |
See Notes to Financial Statements.
| | | | | | |
| 92 | | BLACKROCK SERIES FUND, INC. | | JUNE 30, 2017 | | |
| | | | |
| Schedule of Investments (continued) | | | BlackRock High Yield Portfolio | |
| | | | |
| | | | | | | | | | | | |
| Corporate Bonds | | | | | Par (000) | | | Value | |
Oil, Gas & Consumable Fuels (continued) | | | | | | | | | | | | |
Crestwood Midstream Partners LP/Crestwood Midstream Finance Corp., 6.25%, 4/01/23 | | | USD | | | | 5 | | | $ | 5,075 | |
CrownRock LP/CrownRock Finance, Inc.: | | | | | | | | | | | | |
7.13%, 4/15/21 (b) | | | | | | | 46 | | | | 47,265 | |
7.75%, 2/15/23 (b) | | | | | | | 25 | | | | 26,375 | |
DCP Midstream Operating LP: | | | | | | | | | | | | |
4.75%, 9/30/21 (b) | | | | | | | 35 | | | | 35,700 | |
6.45%, 11/03/36 (b) | | | | | | | 17 | | | | 17,935 | |
6.75%, 9/15/37 (b) | | | | | | | 29 | | | | 31,175 | |
Denbury Resources, Inc.: | | | | | | | | | | | | |
9.00%, 5/15/21 (b) | | | | | | | 42 | | | | 40,005 | |
5.50%, 5/01/22 | | | | | | | 22 | | | | 12,320 | |
4.63%, 7/15/23 | | | | | | | 5 | | | | 2,650 | |
Diamondback Energy, Inc., 5.38%, 5/31/25 (b) | | | | | | | 25 | | | | 25,375 | |
Eclipse Resources Corp., 8.88%, 7/15/23 | | | | | | | 5 | | | | 4,975 | |
Energy Transfer Equity LP: | | | | | | | | | | | | |
7.50%, 10/15/20 | | | | | | | 21 | | | | 23,467 | |
5.88%, 1/15/24 | | | | | | | 66 | | | | 69,960 | |
5.50%, 6/01/27 | | | | | | | 59 | | | | 61,065 | |
EP Energy LLC/Everest Acquisition Finance, Inc.: | | | | | | | | | | | | |
9.38%, 5/01/20 | | | | | | | 48 | | | | 37,860 | |
8.00%, 11/29/24 (b) | | | | | | | 21 | | | | 20,947 | |
Extraction Oil & Gas, Inc./Extraction Finance Corp., 7.88%, 7/15/21 (b) | | | | | | | 58 | | | | 59,595 | |
Genesis Energy LP/Genesis Energy Finance Corp., 5.75%, 2/15/21 | | | | | | | 14 | | | | 13,965 | |
Great Western Petroleum LLC/Great Western Finance Corp., 9.00%, 9/30/21 (b) | | | | | | | 46 | | | | 45,425 | |
Gulfport Energy Corp.: | | | | | | | | | | | | |
6.63%, 5/01/23 | | | | | | | 14 | | | | 14,035 | |
6.00%, 10/15/24 (b) | | | | | | | 14 | | | | 13,615 | |
Halcon Resources Corp., 6.75%, 2/15/25 (b) | | | | | | | 89 | | | | 80,100 | |
Matador Resources Co., 6.88%, 4/15/23 | | | | | | | 85 | | | | 88,187 | |
MEG Energy Corp.: | | | | | | | | | | | | |
6.38%, 1/30/23 (b) | | | | | | | 53 | | | | 40,943 | |
7.00%, 3/31/24 (b) | | | | | | | 27 | | | | 20,993 | |
6.50%, 1/15/25 (b) | | | | | | | 91 | | | | 82,810 | |
Murphy Oil Corp.: | | | | | | | | | | | | |
4.70%, 12/01/22 | | | | | | | 14 | | | | 13,517 | |
6.13%, 12/01/42 | | | | | | | 8 | | | | 7,540 | |
Newfield Exploration Co., 5.63%, 7/01/24 | | | | | | | 14 | | | | 14,595 | |
NGL Energy Partners LP/NGL Energy Finance Corp.: | | | | | | | | | | | | |
5.13%, 7/15/19 | | | | | | | 10 | | | | 9,925 | |
6.88%, 10/15/21 | | | | | | | 27 | | | | 26,797 | |
7.50%, 11/01/23 (b) | | | | | | | 27 | | | | 26,629 | |
NGPL PipeCo LLC: | | | | | | | | | | | | |
7.12%, 12/15/17 (b) | | | | | | | 68 | | | | 69,275 | |
7.77%, 12/15/37 (b) | | | | | | | 62 | | | | 73,780 | |
Oasis Petroleum, Inc.: | | | | | | | | | | | | |
6.50%, 11/01/21 | | | | | | | 16 | | | | 15,520 | |
6.88%, 3/15/22 | | | | | | | 5 | | | | 4,850 | |
6.88%, 1/15/23 | | | | | | | 6 | | | | 5,805 | |
ONEOK, Inc.: | | | | | | | | | | | | |
7.50%, 9/01/23 | | | | | | | 37 | | | | 44,123 | |
6.00%, 6/15/35 | | | | | | | 5 | | | | 5,382 | |
Parsley Energy LLC/Parsley Finance Corp.: | | | | | | | | | | | | |
6.25%, 6/01/24 (b) | | | | | | | 9 | | | | 9,450 | |
5.38%, 1/15/25 (b) | | | | | | | 42 | | | | 42,315 | |
5.25%, 8/15/25 (b) | | | | | | | 9 | | | | 8,977 | |
PBF Holding Co. LLC/PBF Finance Corp., 7.25%, 6/15/25 (b) | | | | | | | 24 | | | | 23,130 | |
| | | | | | | | | | | | |
| Corporate Bonds | | | | | Par (000) | | | Value | |
Peabody Energy Corp.: | | | | | | | | | | | | |
6.00%, 3/31/22 (b) | | | USD | | | | 2 | | | $ | 1,985 | |
6.38%, 3/31/25 (b) | | | | | | | 13 | | | | 12,805 | |
QEP Resources, Inc., 5.38%, 10/01/22 | | | | | | | 12 | | | | 11,550 | |
Range Resources Corp.: | | | | | | | | | | | | |
5.88%, 7/01/22 (b) | | | | | | | 17 | | | | 17,255 | |
5.00%, 3/15/23 (b) | | | | | | | 25 | | | | 24,437 | |
4.88%, 5/15/25 | | | | | | | 6 | | | | 5,700 | |
Resolute Energy Corp.: | | | | | | | | | | | | |
8.50%, 5/01/20 | | | | | | | 29 | | | | 28,855 | |
8.50%, 5/01/20 (b) | | | | | | | 15 | | | | 14,925 | |
Rockies Express Pipeline LLC: | | | | | | | | | | | | |
6.85%, 7/15/18 (b) | | | | | | | 5 | | | | 5,206 | |
6.00%, 1/15/19 (b) | | | | | | | 17 | | | | 17,723 | |
5.63%, 4/15/20 (b) | | | | | | | 15 | | | | 15,937 | |
6.88%, 4/15/40 (b) | | | | | | | 57 | | | | 62,130 | |
RSP Permian, Inc.: | | | | | | | | | | | | |
6.63%, 10/01/22 | | | | | | | 40 | | | | 41,500 | |
5.25%, 1/15/25 (b) | | | | | | | 18 | | | | 18,023 | |
Sanchez Energy Corp.: | | | | | | | | | | | | |
7.75%, 6/15/21 | | | | | | | 53 | | | | 47,965 | |
6.13%, 1/15/23 | | | | | | | 130 | | | | 104,000 | |
Seven Generations Energy Ltd.: | | | | | | | | | | | | |
8.25%, 5/15/20 (b) | | | | | | | 16 | | | | 16,680 | |
6.88%, 6/30/23 (b) | | | | | | | 75 | | | | 78,187 | |
SM Energy Co.: | | | | | | | | | | | | |
6.50%, 11/15/21 | | | | | | | 20 | | | | 19,450 | |
6.13%, 11/15/22 | | | | | | | 9 | | | | 8,550 | |
6.50%, 1/01/23 | | | | | | | 6 | | | | 5,715 | |
5.00%, 1/15/24 | | | | | | | 33 | | | | 29,205 | |
5.63%, 6/01/25 | | | | | | | 9 | | | | 8,123 | |
6.75%, 9/15/26 | | | | | | | 12 | | | | 11,456 | |
Southern Star Central Corp., 5.13%, 7/15/22 (b) | | | | | | | 3 | | | | 3,053 | |
Southwestern Energy Co., 5.80%, 1/23/20 | | | | | | | 110 | | | | 112,337 | |
Tallgrass Energy Partners LP/Tallgrass Energy Finance Corp., 5.50%, 9/15/24 (b) | | | | | | | 30 | | | | 30,375 | |
Targa Resources Partners LP/Targa Resources Partners Finance Corp.: | | | | | | | | | | | | |
5.25%, 5/01/23 | | | | | | | 2 | | | | 2,050 | |
5.13%, 2/01/25 (b) | | | | | | | 24 | | | | 24,720 | |
5.38%, 2/01/27 (b) | | | | | | | 9 | | | | 9,315 | |
Tesoro Logistics LP/Tesoro Logistics Finance Corp.: | | | | | | | | | | | | |
6.13%, 10/15/21 | | | | | | | 6 | | | | 6,240 | |
6.25%, 10/15/22 | | | | | | | 60 | | | | 63,750 | |
Trinidad Drilling Ltd., 6.63%, 2/15/25 (b) | | | | | | | 41 | | | | 38,950 | |
Whiting Petroleum Corp.: | | | | | | | | | | | | |
5.00%, 3/15/19 | | | | | | | 65 | | | | 64,594 | |
5.75%, 3/15/21 | | | | | | | 13 | | | | 12,220 | |
Williams Cos., Inc.: | | | | | | | | | | | | |
4.55%, 6/24/24 | | | | | | | 4 | | | | 4,110 | |
5.75%, 6/24/44 | | | | | | | 108 | | | | 111,510 | |
WPX Energy, Inc.: | | | | | | | | | | | | |
7.50%, 8/01/20 | | | | | | | 10 | | | | 10,500 | |
6.00%, 1/15/22 | | | | | | | 23 | | | | 22,770 | |
8.25%, 8/01/23 | | | | | | | 3 | | | | 3,255 | |
5.25%, 9/15/24 | | | | | | | 5 | | | | 4,750 | |
| | | | | | | | | | | | |
| | | | | | | | | | | | 3,244,313 | |
See Notes to Financial Statements.
| | | | | | |
| | | BLACKROCK SERIES FUND, INC. | | JUNE 30, 2017 | | 93 |
| | | | |
| Schedule of Investments (continued) | | | BlackRock High Yield Portfolio | |
| | | | |
| | | | | | | | | | | | |
| Corporate Bonds | | | | | Par (000) | | | Value | |
Paper & Forest Products — 0.1% | | | | | | | | | | | | |
Norbord, Inc., 6.25%, 4/15/23 (b) | | | USD | | | | 20 | | | $ | 21,350 | |
PH Glatfelter Co., 5.38%, 10/15/20 | | | | | | | 8 | | | | 8,180 | |
| | | | | | | | | | | | |
| | | | | | | | | | | | 29,530 | |
Personal Products — 0.2% | | | | | | | | | | | | |
Nature’s Bounty Co., 7.63%, 5/15/21 (b) | | | | | | | 56 | | | | 59,500 | |
Pharmaceuticals — 1.8% | | | | | | | | | | | | |
Endo Finance LLC/Endo Finco, Inc.: | | | | | | | | | | | | |
7.25%, 1/15/22 (b) | | | | | | | 5 | | | | 4,788 | |
5.38%, 1/15/23 (b) | | | | | | | 78 | | | | 65,130 | |
Mallinckrodt International Finance SA/Mallinckrodt CB LLC: | | | | | | | | | | | | |
4.88%, 4/15/20 (b) | | | | | | | 9 | | | | 8,764 | |
5.75%, 8/01/22 (b) | | | | | | | 5 | | | | 4,700 | |
5.63%, 10/15/23 (b) | | | | | | | 8 | | | | 7,300 | |
5.50%, 4/15/25 (b) | | | | | | | 61 | | | | 53,375 | |
Prestige Brands, Inc., 6.38%, 3/01/24 (b) | | | | | | | 27 | | | | 28,856 | |
Valeant Pharmaceuticals International, Inc.: | | | | | | | | | | | | |
6.75%, 8/15/18 (b) | | | | | | | 5 | | | | 5,013 | |
7.00%, 10/01/20 (b) | | | | | | | 55 | | | | 54,106 | |
6.38%, 10/15/20 (b) | | | | | | | 28 | | | | 27,125 | |
7.50%, 7/15/21 (b) | | | | | | | 68 | | | | 65,875 | |
6.75%, 8/15/21 (b) | | | | | | | 43 | | | | 40,850 | |
5.63%, 12/01/21 (b) | | | | | | | 20 | | | | 18,050 | |
6.50%, 3/15/22 (b) | | | | | | | 36 | | | | 37,755 | |
5.50%, 3/01/23 (b) | | | | | | | 6 | | | | 5,092 | |
5.88%, 5/15/23 (b) | | | | | | | 60 | | | | 51,450 | |
7.00%, 3/15/24 (b) | | | | | | | 56 | | | | 58,870 | |
6.13%, 4/15/25 (b) | | | | | | | 94 | | | | 79,547 | |
| | | | | | | | | | | | |
| | | | | | | | | | | | 616,646 | |
Real Estate Management & Development — 0.5% | | | | | | | | | | | | |
Howard Hughes Corp., 5.38%, 3/15/25 (b) | | | | | | | 20 | | | | 20,450 | |
Realogy Group LLC/Realogy Co-Issuer Corp.: | | | | | | | | | | | | |
4.50%, 4/15/19 (b) | | | | | | | 5 | | | | 5,163 | |
5.25%, 12/01/21 (b) | | | | | | | 42 | | | | 44,016 | |
4.88%, 6/01/23 (b) | | | | | | | 97 | | | | 97,727 | |
| | | | | | | | | | | | |
| | | | | | | | | | | | 167,356 | |
Road & Rail — 0.6% | | | | | | | | | | | | |
Avis Budget Car Rental LLC/Avis Budget Finance, Inc., 5.13%, 6/01/22 (b) | | | | | | | 64 | | | | 63,360 | |
Florida East Coast Holdings Corp., 6.75%, 5/01/19 (b) | | | | | | | 41 | | | | 42,041 | |
Hertz Corp., 7.63%, 6/01/22 (b) | | | | | | | 31 | | | | 30,926 | |
Park Aerospace Holdings Ltd., 5.25%, 8/15/22 (b) | | | | | | | 28 | | | | 29,269 | |
Watco Cos. LLC/Watco Finance Corp., 6.38%, 4/01/23 (b) | | | | | | | 34 | | | | 35,445 | |
| | | | | | | | | | | | |
| | | | | | | | | | | | 201,041 | |
Semiconductors & Semiconductor Equipment — 1.0% | | | | | | | | | | | | |
Advanced Micro Devices, Inc., 7.50%, 8/15/22 | | | | | | | 10 | | | | 11,100 | |
Micron Technology, Inc.: | | | | | | | | | | | | |
5.25%, 8/01/23 (b) | | | | | | | 36 | | | | 37,386 | |
7.50%, 9/15/23 | | | | | | | 10 | | | | 11,180 | |
5.50%, 2/01/25 | | | | | | | 2 | | | | 2,110 | |
Series G, 3.00%, 11/15/43 (h) | | | | | | | 28 | | | | 31,500 | |
Microsemi Corp., 9.13%, 4/15/23 (b) | | | | | | | 3 | | | | 3,435 | |
NXP BV/NXP Funding LLC, 4.13%, 6/01/21 (b) | | | | | | | 200 | | | | 210,600 | |
Versum Materials, Inc., 5.50%, 9/30/24 (b) | | | | | | | 13 | | | | 13,666 | |
| | | | | | | | | | | | |
| | | | | | | | | | | | 320,977 | |
Software — 2.7% | | | | | | | | | | | | |
BMC Software Finance, Inc., 8.13%, 7/15/21 (b) | | | | | | | 175 | | | | 181,181 | |
| | | | | | | | | | | | |
| Corporate Bonds | | | | | Par (000) | | | Value | |
Software (continued) | | | | | | | | | | | | |
CDK Global, Inc., 4.88%, 6/01/27 (b) | | | USD | | | | 31 | | | $ | 31,853 | |
Infinity Acquisition LLC/Infinity Acquisition Finance Corp., 7.25%, 8/01/22 (b) | | | | | | | 5 | | | | 4,813 | |
Infor Software Parent LLC/Infor Software Parent, Inc., 7.13% (7.13% Cash or 7.88% PIK), 5/01/21 (b)(e) | | | | | | | 42 | | | | 43,260 | |
Infor U.S., Inc., 6.50%, 5/15/22 | | | | | | | 224 | | | | 231,840 | |
Informatica LLC, 7.13%, 7/15/23 (b) | | | | | | | 25 | | | | 25,445 | |
Nuance Communications, Inc.: | | | | | | | | | | | | |
5.38%, 8/15/20 (b) | | | | | | | 1 | | | | 1,016 | |
6.00%, 7/01/24 | | | | | | | 25 | | | | 26,625 | |
5.63%, 12/15/26 (b) | | | | | | | 12 | | | | 12,810 | |
PTC, Inc., 6.00%, 5/15/24 | | | | | | | 14 | | | | 15,155 | |
Rackspace Hosting, Inc., 8.63%, 11/15/24 (b) | | | | | | | 57 | | | | 60,705 | |
RP Crown Parent LLC, 7.38%, 10/15/24 (b) | | | | | | | 35 | | | | 36,400 | |
Sophia LP/Sophia Finance, Inc., 9.00%, 9/30/23 (b) | | | | | | | 31 | | | | 32,240 | |
SS&C Technologies Holdings, Inc., 5.88%, 7/15/23 | | | | | | | 82 | | | | 87,347 | |
Symantec Corp., 5.00%, 4/15/25 (b) | | | | | | | 22 | | | | 23,024 | |
TIBCO Software, Inc., 11.38%, 12/01/21 (b) | | | | | | | 96 | | | | 105,840 | |
| | | | | | | | | | | | |
| | | | | | | | | | | | 919,554 | |
Specialty Retail — 0.4% | | | | | | | | | | | | |
Asbury Automotive Group, Inc., 6.00%, 12/15/24 | | | | | | | 32 | | | | 32,560 | |
Group 1 Automotive, Inc., 5.00%, 6/01/22 | | | | | | | 10 | | | | 10,150 | |
L Brands, Inc., 6.88%, 11/01/35 | | | | | | | 40 | | | | 38,600 | |
Neiman Marcus Group Ltd. LLC, 8.00%, 10/15/21 (b) | | | | | | | 29 | | | | 16,023 | |
Penske Automotive Group, Inc.: | | | | | | | | | | | | |
5.75%, 10/01/22 | | | | | | | 21 | | | | 21,683 | |
5.50%, 5/15/26 | | | | | | | 8 | | | | 7,960 | |
PetSmart, Inc., 5.88%, 6/01/25 (b) | | | | | | | 11 | | | | 10,601 | |
| | | | | | | | | | | | |
| | | | | | | | | | | | 137,577 | |
Technology Hardware, Storage & Peripherals — 0.7% | | | | | | | | | | | | |
Dell International LLC/EMC Corp., 7.13%, 6/15/24 (b) | | | | | | | 78 | | | | 85,742 | |
Radiate Holdco LLC/Radiate Finance, Inc., 6.63%, 2/15/25 (b) | | | | | | | 41 | | | | 41,000 | |
Western Digital Corp.: | | | | | | | | | | | | |
7.38%, 4/01/23 (b) | | | | | | | 56 | | | | 61,530 | |
10.50%, 4/01/24 | | | | | | | 25 | | | | 29,492 | |
| | | | | | | | | | | | |
| | | | | | | | | | | | 217,764 | |
Textiles, Apparel & Luxury Goods — 0.0% | | | | | | | | | | | | |
Springs Industries, Inc., 6.25%, 6/01/21 | | | | | | | 4 | | | | 4,135 | |
Thrifts & Mortgage Finance — 0.3% | | | | | | | | | | | | |
Ladder Capital Finance Holdings LLLP/Ladder | | | | | | | | | | | | |
Capital Finance Corp., 5.25%, 3/15/22 (b) | | | | | | | 32 | | | | 32,880 | |
MGIC Investment Corp., 5.75%, 8/15/23 | | | | | | | 19 | | | | 20,473 | |
Rialto Holdings LLC/Rialto Corp., 7.00%, 12/01/18 (b) | | | | | | | 30 | | | | 30,450 | |
| | | | | | | | | | | | |
| | | | | | | | | | | | 83,803 | |
Trading Companies & Distributors — 1.6% | | | | | | | | | | | | |
Aircastle Ltd.: | | | | | | | | | | | | |
6.25%, 12/01/19 | | | | | | | 5 | | | | 5,444 | |
7.63%, 4/15/20 | | | | | | | 4 | | | | 4,520 | |
5.13%, 3/15/21 | | | | | | | 11 | | | | 11,774 | |
5.50%, 2/15/22 | | | | | | | 28 | | | | 30,520 | |
American Builders & Contractors Supply Co., Inc., 5.75%, 12/15/23 (b) | | | | | | | 9 | | | | 9,517 | |
BlueLine Rental Finance Corp./BlueLine Rental LLC, 9.25%, 3/15/24 (b) | | | | | | | 116 | | | | 120,640 | |
See Notes to Financial Statements.
| | | | | | |
| 94 | | BLACKROCK SERIES FUND, INC. | | JUNE 30, 2017 | | |
| | | | |
| Schedule of Investments (continued) | | | BlackRock High Yield Portfolio | |
| | | | |
| | | | | | | | | | | | |
| Corporate Bonds | | | | | Par (000) | | | Value | |
Trading Companies & Distributors (continued) | | | | | | | | | | | | |
HD Supply, Inc.: | | | | | | | | | | | | |
5.25%, 12/15/21 (b) | | | USD | | | | 172 | | | $ | 180,493 | |
5.75%, 4/15/24 (b) | | | | | | | 88 | | | | 93,500 | |
Herc Rentals, Inc.: | | | | | | | | | | | | |
7.50%, 6/01/22 (b) | | | | | | | 10 | | | | 10,550 | |
7.75%, 6/01/24 (b) | | | | | | | 24 | | | | 25,320 | |
United Rentals North America, Inc.: | | | | | | | | | | | | |
6.13%, 6/15/23 | | | | | | | 3 | | | | 3,124 | |
5.75%, 11/15/24 | | | | | | | 12 | | | | 12,570 | |
5.88%, 9/15/26 | | | | | | | 29 | | | | 30,885 | |
| | | | | | | | | | | | |
| | | | | | | | | | | | 538,857 | |
Wireless Telecommunication Services — 2.9% | | | | | | | | | | | | |
Sprint Capital Corp.: | | | | | | | | | | | | |
6.90%, 5/01/19 | | | | | | | 25 | | | | 26,686 | |
6.88%, 11/15/28 | | | | | | | 117 | | | | 130,054 | |
8.75%, 3/15/32 | | | | | | | 34 | | | | 42,840 | |
Sprint Communications, Inc.: | | | | | | | | | | | | |
9.00%, 11/15/18 (b) | | | | | | | 88 | | | | 95,507 | |
7.00%, 3/01/20 (b) | | | | | | | 29 | | | | 31,837 | |
Sprint Corp.: | | | | | | | | | | | | |
7.25%, 9/15/21 | | | | | | | 48 | | | | 53,340 | |
7.88%, 9/15/23 | | | | | | | 92 | | | | 105,800 | |
7.13%, 6/15/24 | | | | | | | 265 | | | | 294,813 | |
T-Mobile USA, Inc.: | | | | | | | | | | | | |
6.13%, 1/15/22 | | | | | | | 10 | | | | 10,509 | |
4.00%, 4/15/22 | | | | | | | 24 | | | | 24,977 | |
6.00%, 3/01/23 | | | | | | | 33 | | | | 34,928 | |
6.84%, 4/28/23 | | | | | | | 10 | | | | 10,675 | |
6.50%, 1/15/24 | | | | | | | 55 | | | | 59,125 | |
5.13%, 4/15/25 | | | | | | | 24 | | | | 25,200 | |
5.38%, 4/15/27 | | | | | | | 14 | | | | 15,015 | |
Trilogy International Partners LLC/Trilogy International Finance, Inc., 8.88%, 5/01/22 (b) | | | | | | | 12 | | | | 12,495 | |
| | | | | | | | | | | | |
| | | | | | | | | | | | 973,801 | |
Total Corporate Bonds — 84.1% | | | | | | | | | | | 28,128,673 | |
| | | | | | | | | | | | |
| Floating Rate Loan Interests (f) | | | | | | | | | |
Aerospace & Defense — 0.1% | | | | | | | | | | | | |
Sequa Mezzanine Holdings LLC: | | | | | | | | | | | | |
Initial Loan (Second Lien), 10.17%, 4/28/22 (d) | | | | 8 | | | | 8,140 | |
Initial Term Loan (First Lien), 6.67%, 11/28/21 | | | | 20 | | | | 20,100 | |
| | | | | | | | | | | | |
| | | | | | | | | | | | 28,240 | |
Air Freight & Logistics — 0.2% | | | | | | | | | | | | |
Ceva Group PLC (FKA Louis No.1 PLC/TNT Logistics), Pre-Funded L/C Loan, 1.05% - 5.45%, 3/19/21 (d) | | | | | | | 16 | | | | 14,584 | |
Ceva Intercompany BV, Dutch BV Term Loan, 6.67%, 3/19/21 | | | | | | | 17 | | | | 15,319 | |
Ceva Logistics Canada, ULC (FKA TNT Canada ULC), Canadian Term Loan, 6.67%, 3/19/21 | | | | | | | 3 | | | | 2,404 | |
Ceva Logistics U.S. Holdings, Inc. (FKA Louis U.S. Holdco, Inc.), U.S. Term Loan, 6.67%, 3/19/21 | | | | | | | 23 | | | | 21,736 | |
| | | | | | | | | | | | |
| | | | | | | | | | | | 54,043 | |
| | | | | | | | | | | | |
| Floating Rate Loan Interests(f) | | | | | Par (000) | | | Value | |
Airlines — 0.0% | | | | | | | | | | | | |
Northwest Airlines, Inc.: | | | | | | | | | | | | |
Loan B757-200, 2.46%, 9/10/18 (d) | | | USD | | | | 5 | | | $ | 4,677 | |
Loan B757-200, 2.65%, 9/10/18 (d) | | | | | | | 5 | | | | 4,433 | |
Loan B757-300, 2.65%, 9/10/18 (d) | | | | | | | 5 | | | | 4,431 | |
| | | | | | | | | | | | |
| | | | | | | | | | | | 13,541 | |
Chemicals — 0.5% | | | | | | | | | | | | |
Ascend Performance Materials Operations LLC, Term B Loan, 6.80%, 8/12/22 (d) | | | | | | | 165 | | | | 165,566 | |
Commercial Services & Supplies — 0.1% | | | | | | | | | | | | |
GW Honos Security Corp. (Garda World Security Corp.), Term B Loan, 5.23%, 5/24/24 | | | | | | | 21 | | | | 21,536 | |
Tempo Acquisition LLC, Initial Term Loan, 4.06%, 5/01/24 | | | | | | | 27 | | | | 27,046 | |
| | | | | | | | | | | | |
| | | | | | | | | | | | 48,582 | |
Construction & Engineering — 0.4% | | | | | | | | | | | | |
Brand Energy & Infrastructure Services, Inc. (FKA FR Brand Acquisition Corp.), Term Loan, 5.46% - 5.50%, 6/21/24 | | | | | | | 125 | | | | 124,726 | |
Diversified Consumer Services — 0.1% | | | | | | | | | | | | |
Ascend Learning (Alpine Finance), Term B Loan, 4.25%, 7/15/24 (d) | | | | | | | 7 | | | | 7,000 | |
Laureate Education, Inc., Series 2024 Term Loan, 5.73%, 4/26/24 | | | | | | | 15 | | | | 15,023 | |
| | | | | | | | | | | | |
| | | | | | | | | | | | 22,023 | |
Diversified Financial Services — 0.4% | | | | | | | | | | | | |
Veritas U.S. Inc., Initial Dollar Term B-1 Loan, 5.63%, 1/27/23 | | | | | | | 20 | | | | 20,021 | |
Veritas U.S., Inc., New Dollar Term B Loan, 4.50%, 1/27/23 | | | | | | | 110 | | | | 110,114 | |
| | | | | | | | | | | | |
| | | | | | | | | | | | 130,135 | |
Diversified Telecommunication Services — 2.0% | | | | | | | | | | | | |
CenturyLink, Inc., Initial Term B Loan, 1.38% - 2.75%, 1/31/25 | | | | | | | 185 | | | | 182,324 | |
Digicel International Finance Ltd., Initial Term B Loan (First Lien), 4.94%, 5/27/24 | | | | | | | 49 | | | | 49,291 | |
Intelsat Jackson Holdings S.A., Tranche B-2 Term Loan, 4.00%, 6/30/19 | | | | | | | 172 | | | | 170,376 | |
Ligado Networks LLC (FKA New LightSquared LLC), Junior Loan, 13.72%, 12/07/20 | | | | | | | 60 | | | | 42,103 | |
New LightSquared LLC, Loan, 9.97%, 6/15/20 | | | | | | | 246 | | | | 238,575 | |
| | | | | | | | | | | | |
| | | | | | | | | | | | 682,669 | |
Electrical Equipment — 0.1% | | | | | | | | | | | | |
Vertiv Group Corp. (FKA Cortes NP Acquisition Corp.), Term B Loan, 4.00%- 5.23%, 11/30/23 | | | | | | | 34 | | | | 33,848 | |
Energy Equipment & Services — 0.1% | | | | | | | | | | | | |
Weatherford International Ltd., Loan, 3.53%, 7/13/20 | | | | | | | 47 | | | | 45,243 | |
Food & Staples Retailing — 0.1% | | | | | | | | | | | | |
BJ’s Wholesale Club, Inc., Tranche B Term Loan (First Lien), 4.97%, 2/03/24 | | | | | | | 17 | | | | 16,453 | |
Food Products — 0.0% | | | | | | | | | | | | |
Chobani LLC (Chobani Idaho LLC), Closing Date Term Loan (First Lien), 5.48%, 10/10/23 | | | | | | | 8 | | | | 8,025 | |
See Notes to Financial Statements.
| | | | | | |
| | | BLACKROCK SERIES FUND, INC. | | JUNE 30, 2017 | | 95 |
| | | | |
| Schedule of Investments (continued) | | | BlackRock High Yield Portfolio | |
| | | | |
| | | | | | | | | | | | |
| Floating Rate Loan Interests(f) | | | | | Par (000) | | | Value | |
Health Care Equipment & Supplies — 0.3% | | | | | | | | | | | | |
DJO Finance LLC, Initial Term Loan, 4.48%, 6/08/20 | | | USD | | | | 39 | | | $ | 38,797 | |
Immucor, Inc. (FKA IVD Acquisition Corp.): | | | | | | | | | | | | |
Term B-2 Loan, 5.00%, 8/17/18 | | | | | | | 68 | | | | 67,910 | |
Term Loan, 5.00%, 6/25/21 | | | | | | | 3 | | | | 3,512 | |
| | | | | | | | | | | | |
| | | | | | | | | | | | 110,219 | |
Health Care Providers & Services — 0.1% | | | | | | | | | | | | |
Iasis Healthcare LLC, Term B-3 Loan, 4.00%, 2/17/21 | | | | | | | 8 | | | | 8,010 | |
Surgery Partners LLC, Term Loan B, 3.25%, 6/20/24 | | | | | | | 15 | | | | 15,047 | |
Team Health Holdings, Inc., Initial Term Loan, 2.75% - 3.98%, 2/06/24 | | | | | | | 5 | | | | 4,942 | |
| | | | | | | | | | | | |
| | | | | | | | | | | | 27,999 | |
Hotels, Restaurants & Leisure — 1.1% | | | | | | | | | | | | |
Caesars Entertainment Operating Co., Inc. (FKA Harrah’s Operating Co., Inc.), Term B-7 Loan, 1.50% - 9.25%, 1/28/18 | | | | | | | 60 | | | | 74,846 | |
Caesars Entertainment Resort Properties, LLC, Term B Loan, 4.54%, 10/11/20 | | | | | | | 277 | | | | 278,661 | |
Four Seasons Holdings, Inc., Term Loan (First Lien) 2013, 3.73%, 11/30/23 | | | | | | | 5 | | | | 5,004 | |
| | | | | | | | | | | | |
| | | | | | | | | | | | 358,511 | |
Insurance — 0.1% | | | | | | | | | | | | |
Alliant Holdings Intermediate, LLC, Initial Term Loan, 4.42%, 8/12/22 | | | | | | | 17 | | | | 16,758 | |
USI, Inc. (FKA Compass Investors, Inc.), Initial Term Loan, 4.18%, 5/16/24 | | | | | | | 10 | | | | 9,925 | |
| | | | | | | | | | | | |
| | | | | | | | | | | | 26,683 | |
Life Sciences Tools & Services — 0.0% | | | | | | | | | | | | |
InVentiv Group Holdings, Inc., Initial Term Loan, 4.95%, 11/09/23 | | | | | | | 15 | | | | 15,143 | |
Machinery — 0.4% | | | | | | | | | | | | |
Accudyne Industries Borrower S.C.A./Accudyne Industries LLC (FKA Silver II U.S. Holdings LLC), Refinancing Term Loan, 4.23%, 12/13/19 | | | | | | | 106 | | | | 104,725 | |
Gates Global LLC, Initial B-1 Dollar Term Loan, 4.55%, 4/01/24 | | | | | | | 24 | | | | 23,484 | |
| | | | | | | | | | | | |
| | | | | | | | | | | | 128,209 | |
Media — 0.2% | | | | | | | | | | | | |
CSC Holdings LLC (FKA CSC Holdings, Inc. (Cablevision)), March 2017 Refinancing Term Loan, 3.46%, 7/17/25 | | | | | | | 6 | | | | 6,309 | |
iHeartCommunications, Inc. (FKA Clear Channel Communications, Inc.), Tranche D Term Loan, 7.98%, 1/30/19 | | | | | | | 75 | | | | 60,850 | |
| | | | | | | | | | | | |
| | | | | | | | | | | | 67,159 | |
Oil, Gas & Consumable Fuels — 1.0% | | | | | | | | | | | | |
California Resources Corp.: | | | | | | | | | | | | |
Loan, 10.38% - 11.53%, 12/31/21 | | | | | | | 9 | | | | 9,717 | |
Term Loan, 4.23%, 9/24/19 | | | | | | | 49 | | | | 47,230 | |
Chesapeake Energy Corp., Class A Loan, 8.69%, 8/23/21 | | | | | | | 229 | | | | 241,589 | |
CITGO Holding, Inc., Term Loan, 9.80%, 5/12/18 | | | | | | | 23 | | | | 23,459 | |
| | | | | | | | | | | | |
| | | | | | | | | | | | 321,995 | |
Pharmaceuticals — 0.0% | | | | | | | | | | | | |
Alpha 3 BV (AKA Atotech), Initial Term B-1 Loan, 4.30%, 1/31/24 | | | | | | | 15 | | | | 15,019 | |
| | | | | | | | | | | | |
| Floating Rate Loan Interests(f) | | | | | Par (000) | | | Value | |
Professional Services — 0.0% | | | | | | | | | | | | |
Greenrock Finance, Inc., Term Loan B (USD), 3.50%, 6/05/24 | | | USD | | | | 6 | | | $ | 6,054 | |
Software — 0.6% | | | | | | | | | | | | |
BMC Software Finance, Inc., Initial B-1 U.S. Term Loan, 4.00% - 5.23%, 9/10/22 | | | | | | | 43 | | | | 43,496 | |
Cypress Intermediate Holdings III, Inc. (FKA Jaguar Holding, Inc.): | | | | | | | | | | | | |
Initial Term Loan (First Lien), 4.23%, 4/29/24 | | | | | | | 15 | | | | 14,706 | |
Initial Term Loan (Second Lien), 7.98%, 4/28/25 | | | | | | | 4 | | | | 4,095 | |
Information Resources, Inc. (FKA Symphonyiri Group, Inc.), Initial Term Loan (First Lien), 5.47%, 1/18/24 | | | | | | | 9 | | | | 9,000 | |
Kronos, Inc., Initial Term Loan (Second Lien), 9.42%, 11/01/24 | | | | | | | 63 | | | | 64,817 | |
Misys Ltd.: | | | | | | | | | | | | |
Dollar Term Loan (First Lien), 4.74%, 6/13/24 | | | | | | | 40 | | | | 39,985 | |
Dollar Term Loan (Second Lien), 8.46%, 6/13/25 | | | | | | | 9 | | | | 9,154 | |
Project Alpha Intermediate Holding, Inc., Term Loan, 4.67%, 4/26/24 | | | | | | | 20 | | | | 19,850 | |
| | | | | | | | | | | | |
| | | | | | | | | | | | 205,103 | |
Specialty Retail — 0.1% | | | | | | | | | | | | |
Neiman Marcus Group Inc.,, Other Term Loan, 4.34%, 10/25/20 | | | | | | | 29 | | | | 21,600 | |
Total Floating Rate Loan Interests — 8.0% | | | | | | | | | | | 2,676,788 | |
| | | | | | | | | | | | |
| Foreign Agency Obligations | | | | | | | | | |
Chemicals — 0.3% | | | | | | | | | | | | |
NOVA Chemicals Corp.: | | | | | | | | | | | | |
4.88%, 6/01/24 (b) | | | | | | | 31 | | | | 30,884 | |
5.25%, 6/01/27 (b) | | | | | | | 49 | | | | 48,755 | |
Total Foreign Agency Obligations — 0.3% | | | | | | | | | | | 79,639 | |
| | | | | | | | | | | | |
| Other Interests (i) | | | | | Beneficial Interest (000) | | | | |
Auto Components — 0.0% | | | | | | | | | | | | |
Lear Corp., Escrow (a)(c)(d) | | | | | | | 150 | | | | — | |
Lear Corp., Escrow (a)(c)(d) | | | | | | | 100 | | | | — | |
| | | | | | | | | | | | |
| | | | | | | | | | | | — | |
Capital Markets — 0.0% | | | | | | | | | | | | |
Lehman Brothers Holdings Capital Trust VII Escrow Bonds (a)(c) | | | | | | | 110 | | | | 6,875 | |
Lehman Brothers Holdings Capital Trust VII Escrow Bonds (a)(c) | | | | | | | 30 | | | | 1,875 | |
| | | | | | | | | | | | |
| | | | | | | | | | | | 8,750 | |
Total Other Interests — 0.0% | | | | | | | | | | | 8,750 | |
| | | | | | | | | | | | |
| | | | | | | | | | |
See Notes to Financial Statements.
| | | | | | |
| 96 | | BLACKROCK SERIES FUND, INC. | | JUNE 30, 2017 | | |
| | | | |
| Schedule of Investments (continued) | | | BlackRock High Yield Portfolio | |
| | | | | | | | | | | | |
| Preferred Securities | | | | | | | | | |
| Capital Trusts | | | | | Par
(000) | | | Value | |
Banks — 1.9% | | | | | | | | | | | | |
Bank of America Corp.: | | | | | | | | | | | | |
Series AA, 6.10% (f)(j) | | | USD | | | | 15 | | | $ | 16,295 | |
Series X, 6.25% (f)(j) | | | | | | | 66 | | | | 71,775 | |
Series Z, 6.50% (f)(j) | | | | | | | 33 | | | | 36,694 | |
CIT Group, Inc., Series A, 5.80% (f)(j) | | | | | | | 56 | | | | 58,380 | |
Citigroup, Inc.: | | | | | | | | | | | | |
5.95% (f)(j) | | | | | | | 36 | | | | 38,295 | |
Series N, 5.80% (f)(j) | | | | | | | 40 | | | | 41,700 | |
Series R, 6.13% (f)(j) | | | | | | | 23 | | | | 24,725 | |
JPMorgan Chase & Co.: | | | | | | | | | | | | |
Series Q, 5.15% (f)(j) | | | | | | | 20 | | | | 20,590 | |
Series U, 6.13% (f)(j) | | | | | | | 7 | | | | 7,569 | |
Series V, 5.00% (f)(j) | | | | | | | 65 | | | | 66,463 | |
Series X, 6.10% (f)(j) | | | | | | | 78 | | | | 84,630 | |
U.S. Bancorp, Series J, 5.30% (f)(j) | | | | | | | 55 | | | | 58,575 | |
Wells Fargo & Co.: | | | | | | | | | | | | |
Series S, 5.90% (f)(j) | | | | | | | 50 | | | | 53,550 | |
Series U, 5.88% (f)(j) | | | | | | | 54 | | | | 59,506 | |
| | | | | | | | | | | | |
| | | | | | | | | | | | 638,747 | |
Capital Markets — 0.2% | | | | | | | | | | | | |
Goldman Sachs Group, Inc., Series L, 5.70% (f)(j) | | | | 35 | | | | 36,426 | |
Morgan Stanley, Series H, 5.45% (f)(j) | | | | | | | 27 | | | | 27,959 | |
| | | | | | | | | | | | |
| | | | | | | | | | | | 64,385 | |
Total Capital Trusts — 2.1% | | | | | | | | | | | 703,132 | |
| | | | | | | | | | | | |
| Preferred Stocks | | | | | Shares | | | | |
Capital Markets — 0.2% | | | | | | | | | | | | |
Morgan Stanley, Series K, 5.85% (f) | | | | | | | 2,577 | | | | 70,404 | |
| | | | | | | | |
| Trust Preferreds | |
Shares | | | Value | |
Consumer Finance — 0.7% | | | | | | | | |
GMAC Capital Trust I, Series 2, 6.97%, 2/15/40 (f) | | | 8,676 | | | $ | 227,311 | |
Total Preferred Securities — 3.0% | | | | | | | 1,000,847 | |
Total Long-Term Investments (Cost — $31,637,493) — 96.6% | | | | | | | 32,300,250 | |
| | | | | | | | |
| Short-Term Securities | | | | | | |
BlackRock Liquidity Funds, T-Fund, Institutional Class, 0.84% (k)(l) | | | 981,988 | | | | 981,988 | |
Total Short-Term Securities (Cost — $981,988) — 2.9% | | | | | | | 981,988 | |
| | | | | | | | |
| Options Purchased | | | | | | |
(Cost — $3,026) — 0.0% | | | | | | | 2,815 | |
Total Investments Before Options Written (Cost — $32,622,507) — 99.5% | | | | | 33,285,053 | |
| | | | | | | | |
| Options Written | | | | | | |
(Premiums Received — $ 649) — (0.0)% | | | | | | | (245 | ) |
Total Investments Net of Options Written — 99.5% | | | | 33,284,808 | |
Other Assets Less Liabilities — 0.5% | | | | | | | 152,956 | |
| | | | | | | | |
Net Assets — 100.0% | | | | | | $ | 33,437,764 | |
| | | | | | | | |
|
| Notes to Schedule of Investments |
| (a) | Non-income producing security. |
| (b) | Security exempt from registration pursuant to Rule 144A under the Securities Act of 1933, as amended. These securities may be resold in transactions exempt from registration to qualified institutional investors. |
| (c) | Issuer filed for bankruptcy and/or is in default. |
| (d) | Security is valued using significant unobservable inputs and is classified as Level 3 in the fair value hierarchy. |
| (e) | Payment-in-kind security which may pay interest/dividends in additional par/shares and/or in cash. Rates shown are the current rate and possible payment rates. |
| (f) | Variable rate security. Rate as of period end. |
| (g) | Step-up bond that pays an initial coupon rate for the first period and then a higher coupon rate for the following periods. Rate as of period end. |
| (i) | Other interests represent beneficial interests in liquidation trusts and other reorganization or private entities. |
| (j) | Perpetual security with no stated maturity date. |
| (k) | During the six months ended June 30, 2017, investments in issuers considered to be affiliates of the Fund for purposes of Section 2(a)(3) of the Investment Company Act of 1940, as amended, were as follows: |
| | | | | | | | | | | | | | | | | | | | | | | | | | | | | | | | |
| Affiliate | | Shares Held
at December 31,
2016 | | | Shares
Purchased | | | Shares
Sold | | | Shares Held
at June 30,
2017 | | | Value Held
at June 30,
2017 | | | Income | | | Net
Realized
Gain | | | Change in
Unrealized
Appreciation
(Depreciation) | |
BlackRock Liquidity Funds, T-Fund, Institutional Class | | | 637,350 | | | | 344,638 | 1 | | | — | | | | 981,988 | | | $ | 981,988 | | | $ | 1,269 | | | | — | | | | — | |
iShares iBoxx $ High Yield Corporate Bond ETF | | | 2,461 | | | | — | | | | (2,461 | ) | | | — | | | | — | | | | — | | | $ | 2,494 | | | $ | (1,138 | ) |
Total | | | | | | | | | | | | | | | | | | $ | 981,988 | | | $ | 1,269 | | | $ | 2,494 | | | $ | (1,138 | ) |
| | | | | | | | | | | | | | | | | | | | |
| | 1 | | Represents net shares purchased. |
| (l) | Current yield as of period end. |
See Notes to Financial Statements.
| | | | | | |
| | | BLACKROCK SERIES FUND, INC. | | JUNE 30, 2017 | | 97 |
| | | | |
| Schedule of Investments (continued) | | | BlackRock High Yield Portfolio | |
| • | | For Fund compliance purposes, the Fund’s industry classifications refer to one or more of the industry sub-classifications used by one or more widely recognized market indexes or ratings group indexes, and/or as defined by the investment adviser. These definitions may not apply for purposes of this report, which may combine such industry sub-classifications for reporting ease. |
|
| Derivative Financial Instruments Outstanding as of Period End |
Futures Contract
| | | | | | | | | | | | | | | | | | |
Contracts
Short | | Issue | | Expiration | | | Notional
Value | | | Unrealized
Appreciation | |
| (1) | | U.S. Treasury Notes (10 Year) | | | September 2017 | | | | USD | | | | 125,531 | | | | $523 | |
Forward Foreign Currency Exchange Contracts
| | | | | | | | | | | | | | | | | | | | |
Currency
Purchased | | | | | Currency
Sold | | | | | Counterparty | | Settlement
Date | | | Unrealized
Appreciation
(Depreciation) | |
EUR | | | 495,000 | | | USD | | | 552,511 | | | HSBC Bank PLC | | | 7/06/17 | | | | $13,045 | |
| | | | | | | | | | | | | | | | | | | | |
| | | | | | | | | | | | | | | | | | | 13,045 | |
| | | | | | | | | | | | | | | | | | | | |
USD | | | 324,009 | | | CAD | | | 436,000 | | | HSBC Bank PLC | | | 7/06/17 | | | | (12,245 | ) |
USD | | | 335,897 | | | CAD | | | 436,000 | | | Westpac Banking Corp. | | | 8/03/17 | | | | (541 | ) |
| | | | | | | | | | | | | | | | | | | | |
| | | | | | | | | | | | | | | | | | | | (12,786 | ) |
Net Unrealized Appreciation | | | | | | | $ 259 | |
| | | | | | | | | | | | | | | | | | | | |
OTC Barrier Options Purchased
| | | | | | | | | | | | | | | | | | | | | | | | | | | | | | | | | | |
| Description | | | | | Type of Options | | Counterparty | | Expiration
Date | | Strike
Price | | | Barrier
Price | | | Contracts | | | Value | |
S&P 500 Index | | | | | | Down-and-Out | | Deutsche Bank AG | | 07/21/17 | | | USD | | | | 2,430.00 | | | | USD | | | | 2,200.00 | | | | 69 | | | | $1,649 | |
| | | | | | | | | | | | | | | | | | | | | | | | |
Exchange-Traded Options Purchased | | | | | | | | | | | | | | | | | | | | | | | | |
| Description | | Put/
Call | | | Expiration
Date | | | Strike
Price | | | Contracts | | | Value | |
SPDR S&P 500 ETF Trust | | | Put | | | | 7/21/17 | | | | USD | | | | 241.00 | | | | 7 | | | | $1,166 | |
| | | | | | | | | | | | | | | | | | | | | | | | |
Exchange-Traded Options Written | | | | | | | | | | | | | | | | | | | | | | | | |
| Description | | Put/
Call | | | Expiration
Date | | | Strike
Price | | | Contracts | | | Value | |
SPDR S&P 500 ETF Trust | | | Put | | | | 7/21/17 | | | | USD | | | | 231.00 | | | | 7 | | | | $(245) | |
| | | | | | | | | | | | | | | | | | | | | | | | |
Centrally Cleared Credit Default Swaps — Sell Protection | | | | | | | | | |
| Issuer/Index | | Receive
Fixed
Rate | | | Expiration
Date | | | Credit
Rating1 | | | Notional
Amount
(000)2 | | | Unrealized
Appreciation
(Depreciation) | |
Chesapeake Energy Corp. | | | 5.00% | | | | 12/20/21 | | | | CCC | | | | USD | | | | 20 | | | $ | (671 | ) |
CDX.NA.HY.28.V1 | | | 5.00% | | | | 6/20/22 | | | | B+ | | | | USD | | | | 228 | | | | 552 | |
Total | | | | | | | | | | | | | | | | | | | | | | $ | (119 | ) |
| | | | | | | | | | | | | | | | | | | | | | | | |
| | 1 | | Using S&P’s rating of the underlying securities of the index. |
| | 2 | | The maximum potential amount the Fund may pay should a negative credit event take place as defined under the terms of the agreement. |
See Notes to Financial Statements.
| | | | | | |
| 98 | | BLACKROCK SERIES FUND, INC. | | JUNE 30, 2017 | | |
| | | | |
| Schedule of Investments (continued) | | | BlackRock High Yield Portfolio | |
OTC Credit Default Swaps — Sell Protection
| | | | | | | | | | | | | | | | | | | | | | | | | | | | | | | | | | | | |
| Issuer | | Receive
Fixed
Rate | | | Counterparty | | | Expiration
Date | | | Credit
Rating1
| | | Notional
Amount
(000)2 | | | Market
Value | | | Premiums
Received | | | Unrealized
Appreciation
(Depreciation) | |
Avis Budget Group, Inc. | | | 5.00% | | | | Barclays Bank PLC | | | | 6/20/22 | | | | BB- | | | | USD | | | | 9 | | | $ | 52 | | | $ | 195 | | | $ | (143 | ) |
Hertz Global Holdings, Inc. | | | 5.00% | | | | Barclays Bank PLC | | | | 6/20/22 | | | | B | | | | USD | | | | 15 | | | | (2,651 | ) | | | (1,507 | ) | | | (1,144 | ) |
Hertz Global Holdings, Inc. | | | 5.00% | | | | Goldman Sachs International | | | | 6/20/22 | | | | B | | | | USD | | | | 13 | | | | (804 | ) | | | (838 | ) | | | 34 | |
Total | | | | | | | | | | | | | | | | | | | | | | | | | | $ | (3,403 | ) | | $ | (2,150 | ) | | $ | (1,253 | ) |
| | | | | | | | | | | | | | | | | | | | | | | | | | | | |
| | 1 | | Using S&P’s rating of the issuer. |
| | 2 | | The maximum potential amount the Fund may pay should a negative credit event take place as defined under the terms of the agreement. |
|
| Transactions in Options Written for the Six Months Ended June 30, 2017 |
| | | | | | | | |
| | | Puts | |
| | | Contracts | | | Premiums
Received | |
Outstanding options, beginning of period | | | 68 | | | $ | 7,599 | |
Options written | | | 94 | | | | 7,497 | |
Options expired | | | (11) | | | | (987 | ) |
Options closed | | | (144) | | | | (13,460 | ) |
| | | | |
Outstanding options, end of period | | | 7 | | | $ | 649 | |
| | | | |
|
| Derivative Financial Instruments Categorized by Risk Exposure |
As of period end, the fair values of derivative financial instruments located in the Statements of Assets and Liabilities were as follows:
| | | | | | | | | | | | | | | | | | | | | | | | | | |
| Assets - Derivative Financial Instruments | | Commodity
Contracts | | Credit
Contracts | | | Equity
Contracts | | | Foreign
Currency
Exchange
Contracts | | | Interest
Rate
Contracts | | | Other
Contracts | | Total | |
Futures contracts | | Net unrealized appreciation1 | | — | | | — | | | | — | | | | — | | | $ | 523 | | | — | | $ | 523 | |
Forward foreign currency exchange contracts | | Unrealized appreciation on forward foreign currency exchange contracts | | — | | | — | | | | — | | | $ | 13,045 | | | | — | | | — | | | 13,045 | |
Options purchased | | Investments at value — unaffiliated2 | | — | | | — | | | $ | 2,815 | | | | — | | | | — | | | — | | | 2,815 | |
Swaps - centrally cleared | | Net unrealized appreciation1 | | — | | $ | 552 | | | | — | | | | — | | | | — | | | — | | | 552 | |
Swaps - OTC | | Unrealized appreciation on OTC swaps; Swap premiums paid | | — | | | 229 | | | | — | | | | — | | | | — | | | — | | | 229 | |
| | | |
Total | | | | — | | $ | 781 | | | $ | 2,815 | | | $ | 13,045 | | | $ | 523 | | | — | | $ | 17,164 | |
| | | |
| | | | | | | | | | | | | | | | | | | | | | | | | | |
| Liabilities - Derivative Financial Instruments | | | | | | | | | | | | | | | | | | | |
Forward foreign currency exchange contracts | | Unrealized depreciation on forward foreign currency exchange contracts | | — | | | — | | | | — | | | $ | 12,786 | | | | — | | | — | | $ | 12,786 | |
Options written | | Options written, at value | | — | | | — | | | $ | 245 | | | | — | | | | — | | | — | | | 245 | |
Swaps - centrally cleared | | Net unrealized depreciation1 | | — | | $ | 671 | | | | — | | | | — | | | | — | | | — | | | 671 | |
Swaps - OTC | | Unrealized depreciation on OTC swaps; Swap premiums received | | — | | | 3,632 | | | | — | | | | — | | | | — | | | — | | | 3,632 | |
| | | |
Total | | | | — | | $ | 4,303 | | | $ | 245 | | | $ | 12,786 | | | | — | | | — | | $ | 17,334 | |
| | | |
| | 1 | | Includes cumulative appreciation (depreciation) on futures contracts and centrally cleared swaps, if any, as reported in the Schedule of Investments. Only current day’s variation margin is reported within the Statements of Assets and Liabilities. |
| | 2 | | Includes options purchased at value as reported in the Schedule of Investments. |
See Notes to Financial Statements.
| | | | | | |
| | | BLACKROCK SERIES FUND, INC. | | JUNE 30, 2017 | | 99 |
| | | | |
| Schedule of Investments (continued) | | | BlackRock High Yield Portfolio | |
For the six months ended June 30, 2017, the effect of derivative financial instruments in the Statements of Operations were as follows:
| | | | | | | | | | | | | | | | | | | | | | | | |
| Net Realized Gain (Loss) from: | | Commodity Contracts | | Credit Contracts | | | Equity Contracts | | | Foreign Currency Exchange Contracts | | | Interest Rate Contracts | | | Other Contracts | | Total | |
Futures contracts | | — | | | — | | | $ | (25,709 | ) | | | — | | | $ | (944 | ) | | — | | $ | (26,653 | ) |
Foreign currency transactions | | — | | | — | | | | — | | | $ | 21,719 | | | | — | | | — | | | 21,719 | |
Options purchased1 | | — | | | — | | | | (28,799 | ) | | | — | | | | (4,614 | ) | | — | | | (33,413 | ) |
Options written | | — | | | — | | | | 13,120 | | | | — | | | | — | | | — | | | 13,120 | |
Swaps | | — | | $ | 39,679 | | | | — | | | | — | | | | — | | | — | | | 39,679 | |
| | | |
Total | | — | | $ | 39,679 | | | $ | (41,388 | ) | | $ | 21,719 | | | $ | (5,558 | ) | | — | | $ | 14,452 | |
| | | |
| | | | | | | | | | | | | | | | | | | | | | | | |
| Net Change in Unrealized Appreciation (Depreciation) on: | | | | | | | | | | | | | | | | | | | |
Futures contracts | | — | | | — | | | $ | (1,595 | ) | | | — | | | $ | 523 | | | — | | $ | (1,072 | ) |
Foreign currency translations | | — | | | — | | | | — | | | $ | 6,145 | | | | — | | | — | | | 6,145 | |
Options purchased1 | | — | | | — | | | | 3,737 | | | | — | | | | 1,386 | | | — | | | 5,123 | |
Options written | | — | | | — | | | | (6,617 | ) | | | — | | | | — | | | — | | | (6,617 | ) |
Swaps | | — | | $ | (19,537 | ) | | | — | | | | — | | | | — | | | — | | | (19,537 | ) |
| | | |
Total | | — | | $ | (19,537 | ) | | $ | (4,475 | ) | | $ | 6,145 | | | $ | 1,909 | | | — | | $ | (15,958 | ) |
| | | |
| | 1 | | Options purchased are included in the net realized gain (loss) from investments. |
| | |
| Average Quarterly Balances of Outstanding Derivative Financial Instruments | | |
| | | | |
Futures contracts: | | | | |
Average notional value of contracts - short | | $ | 426,886 | |
Forward foreign currency exchange contracts: | | | | |
Average amounts purchased - in USD. | | $ | 693,502 | |
Average amounts sold - USD | | $ | 538,185 | |
Options: | | | | |
Average value of option contracts purchased | | $ | 2,022 | |
Average value of option contracts written | | $ | 301 | |
Average notional value of swaption contracts purchased | | $ | 260,000 | |
Credit default swaps: | | | | |
Average notional value - sell protection | | $ | 241,500 | |
For more information about the Fund’s investment risks regarding derivative financial instruments, refer to the Notes to Financial Statements.
| | | | |
| Derivative Financial Instruments - Offsetting as of Period End | | | | |
The Fund’s derivative assets and liabilities (by type) were as follows:
| | | | | | | | |
| | | Assets | | | Liabilities | |
Derivative Financial Instruments: | | | | | | | | |
Futures contracts | | | $ 281 | | | | — | |
Forward foreign currency exchange contracts | | | 13,045 | | | | $ 12,786 | |
Options | | | 2,815 | 1 | | | 245 | |
Swaps - Centrally cleared | | | 535 | | | | — | |
Swaps - OTC2 | | | 229 | | | | 3,632 | |
| | | | |
Total derivative assets and liabilities in the Statements of Assets and Liabilities | | | $ 16,905 | | | | $ 16,663 | |
Derivatives not subject to a Master Netting Agreement or similar agreement (“MNA”) | | | (1,982 | ) | | | (245 | ) |
| | | | |
Total derivative assets and liabilities subject to an MNA | | | $ 14,923 | | | | $ 16,418 | |
| | | | |
| | 1 | | Includes options purchased at value which is included in investments at value — unaffiliated in the Consolidated Statements of Assets and Liabilities and reported in the Consolidated Schedule of Investments. |
| | 2 | | Includes unrealized appreciation (depreciation) on OTC swaps in the Statements of Assets and Liabilities. |
See Notes to Financial Statements.
| | | | | | |
| 100 | | BLACKROCK SERIES FUND, INC. | | JUNE 30, 2017 | | |
| | | | |
| Schedule of Investments (continued) | | | BlackRock High Yield Portfolio | |
The following tables present the Fund’s derivative assets and liabilities by counterparty net of amounts available for offset under an MNA and net of the related collateral received and pledged by the Fund.
| | | | | | | | | | | | | | | | |
| Counterparty | | Derivative Assets
Subject to an MNA by
Counterparty | | | Derivatives Available
for Offset1 | | | Non-cash
Collateral
Received | | Cash
Collateral
Received | | Net Amount of
Derivative Assets2 | |
Barclays Bank PLC | | | $ 195 | | | | $ (195) | | | — | | — | | | — | |
Deutsche Bank AG | | | 1,649 | | | | — | | | — | | — | | $ | 1,649 | |
Goldman Sachs International | | | 34 | | | | (34) | | | — | | — | | | — | |
HSBC Bank PLC | | | 13,045 | | | | (12,245) | | | — | | — | | | 800 | |
| | | | |
Total | | | $14,923 | | | | $(12,474) | | | — | | — | | $ | 2,449 | |
| | | | |
| | | | | |
| | | | | | | | | | | | | | | | |
| Counterparty | | Derivative Liabilities
Subject to an MNA by
Counterparty | | | Derivatives Available
for Offset1 | | | Non-cash Collateral Pledged | | Cash Collateral Pledged | | Net Amount of
Derivative Liabilities3 | |
Barclays Bank PLC | | | $ 2,794 | | | | $(195) | | | — | | — | | $ | 2,599 | |
Goldman Sachs International | | | 838 | | | | (34) | | | — | | — | | | 804 | |
HSBC Bank PLC | | | 12,245 | | | | (12,245) | | | — | | — | | | — | |
Westpac Banking Corp | | | 541 | | | | — | | | — | | — | | | 541 | |
| | | | |
Total | | | $16,418 | | | | $(12,474) | | | — | | — | | $ | 3,944 | |
| | | | |
| | 1 | | The amount of derivatives available for offset is limited to the amount of assets and/or liabilities that are subject to an MNA. |
| | 2 | | Net amount represents the net amount receivable due to the counterparty in the event of default. |
| | 3 | | Net amount represents the net amount payable due to the counterparty in the event of default. |
|
| Fair Value Hierarchy as of Period End |
Various inputs are used in determining the fair value of investments and derivative financial instruments. For information about the Fund’s policy regarding valuation of investments and derivative financial instruments, refer to the Notes to Financial Statements.
The following tables summarize the Fund’s investments and derivative financial instruments in the disclosure hierarchy:
| | | | | | | | | | | | | | | | |
| | | Level 1 | | | Level 2 | | | Level 3 | | | Total | |
Assets: | | | | | | | | | | | | | | | | |
Investments: | | | | | | | | | | | | | | | | |
Long-Term Investments1 : | | | | | | | | | | | | | | | | |
Common Stocks | | $ | 405,553 | | | | — | | | | — | | | $ | 405,553 | |
Corporate Bonds | | | — | | | $ | 27,980,173 | | | $ | 148,500 | | | | 28,128,673 | |
Floating Rate Loan Interests | | | — | | | | 2,467,957 | | | | 208,831 | | | | 2,676,788 | |
Foreign Agency Obligations | | | — | | | | 79,639 | | | | — | | | | 79,639 | |
Other Interests | | | — | | | | 8,750 | | | | — | | | | 8,750 | |
Preferred Securities | | | 297,715 | | | | 703,132 | | | | — | | | | 1,000,847 | |
Short-Term Securities | | | 981,988 | | | | — | | | | — | | | | 981,988 | |
Options Purchased: | | | | | | | | | | | | | | | | |
Equity contracts | | | 1,166 | | | | 1,649 | | | | — | | | | 2,815 | |
| | | | |
Total | | $ | 1,686,422 | | | $ | 31,241,300 | | | $ | 357,331 | | | $ | 33,285,053 | |
| | | | |
| | | | |
1 See above Schedule of Investments for values in each industry. | | | | | | | | | | | | | | | | |
Derivative Financial Instruments2 | | | | | | | | | | | | | | | | |
Assets: | | | | | | | | | | | | | | | | |
Credit contracts | | | — | | | $ | 586 | | | | — | | | $ | 586 | |
Foreign Currency Exchange Contracts | | | — | | | | 13,045 | | | | — | | | | 13,045 | |
Interest rate contracts | | $ | 523 | | | | — | | | | — | | | | 523 | |
Liabilities: | | | | | | | | | | | | | | | | |
Credit contracts | | | — | | | | (1,958 | ) | | | — | | | | (1,958 | ) |
Equity contracts | | | (245 | ) | | | — | | | | — | | | | (245 | ) |
Foreign Currency Exchange Contracts | | | — | | | | (12,786 | ) | | | — | | | | (12,786 | ) |
| | | | |
Total | | $ | 278 | | | $ | (1,113 | ) | | | — | | | $ | (835 | ) |
| | | | |
| | 2 | | Derivative financial instruments are swaps, futures contracts, forward foreign currency exchange contracts and options written. Swaps, futures contracts and forward foreign currency exchange contracts are valued at the unrealized appreciation (depreciation) on the instrument and options written are shown at value. |
During the six months ended June 30, 2017, there were no transfers between Level 1 and Level 2.
See Notes to Financial Statements.
| | | | | | |
| | | BLACKROCK SERIES FUND, INC. | | JUNE 30, 2017 | | 101 |
| | | | |
| Schedule of Investments (concluded) | | | BlackRock High Yield Portfolio | |
A reconciliation of Level 3 investments is presented when the Fund had a significant amount of Level 3 investments at the beginning and/or end of the year in relation to net
assets. The following table is a reconciliation of Level 3 investments for which significant unobservable inputs were used in determining fair value:
| | | | | | | | | | | | | | | | | | | | |
| | | Common
Stocks | | | Corporate
Bonds | | | Floating Rate
Loan Interests | | | Other
Interests | | | Total | |
Assets: | | | | | | | | | | | | | | | | | | | | |
Opening Balance, as of December 31, 2016 | | $ | 195 | | | $ | 190,308 | | | $ | 125,524 | | | $ | 100,393 | | | $ | 416,420 | |
Transfers into Level 3 | | | — | | | | — | | | | 179,169 | | | | — | | | | 179,169 | |
Transfers out of Level 3 | | | — | | | | — | | | | — | | | | — | | | | — | |
Accrued discounts/premiums | | | — | | | | (2 | ) | | | 128 | | | | — | | | | 126 | |
Net realized gain (loss) | | | 258 | | | | 50 | | | | 3,352 | | | | 69,424 | | | | 73,084 | |
Net change in unrealized appreciation (depreciation)1,2 | | | — | | | | 16 | | | | (1,913 | ) | | | (72,681 | ) | | | (74,578 | ) |
Purchases | | | — | | | | — | | | | 14,885 | | | | — | | | | 14,885 | |
Sales | | | (453 | ) | | | (41,872 | ) | | | (112,314 | ) | | | (97,136 | ) | | | (251,775 | ) |
| | | | |
Closing Balance, as of June 30, 2017 | | | — | | | $ | 148,500 | | | $ | 208,831 | | | | — | | | $ | 357,331 | |
| | | | |
Net change in unrealized appreciation (depreciation) on investments still held at June 30, 20172 | | | — | | | | — | | | $ | 1,883 | | | | — | | | $ | 1,883 | |
| | | | |
| | 1 | | Included in the related change in unrealized appreciation (depreciation) in the Statements of Operations. |
| | 2 | | Any difference between net change in unrealized appreciation (depreciation) and net change in unrealized appreciation (depreciation) on investments still held at June 30, 2017 is generally due to investments no longer held or categorized as Level 3 at period end. |
The Fund’s investments that are categorized as Level 3 were valued utilizing third party pricing information without adjustment. Such valuations are based on unobservable inputs. A significant change in third party information could result in a significantly lower or higher value of such Level 3 investments.
See Notes to Financial Statements.
| | | | | | |
| 102 | | BLACKROCK SERIES FUND, INC. | | JUNE 30, 2017 | | |
| | | | |
| Schedule of Investments June 30, 2017 (Unaudited) | | | BlackRock Total Return Portfolio | |
| | | (Percentages shown are based on Net Assets) | |
| | | | | | | | | | | | |
| Asset-Backed Securities | | | | | Par (000) | | | Value | |
ACE Securities Corp. Home Equity Loan Trust: | | | | | | | | | | | | |
Series 2003-OP1, Class A2, 1.94%, 12/25/33 (a) | | | USD | | | | 23 | | | $ | 19,564 | |
Series 2007-HE4, Class A2A, 1.35%, 5/25/37 (a) | | | | | | | 20 | | | | 6,437 | |
ACE Securities Corp. Manufactured Housing Trust, Series 2003-MH1, Class B2, 0.00%, 8/15/30 (b) | | | | | | | 21 | | | | 16,448 | |
Ajax Mortgage Loan Trust, Series 2016-C, Class A, 4.00%, 10/25/57 (c)(d) | | | | | | | 92 | | | | 91,349 | |
B2R Mortgage Trust: | | | | | | | | | | | | |
Series 2015-1, Class A1, 2.52%, 5/15/48 (c) | | | | | | | 84 | | | | 83,352 | |
Series 2015-2, Class A, 3.34%, 11/15/48 (c) | | | | | | | 95 | | | | 96,153 | |
BankAmerica Manufactured Housing Contract Trust, Series 1998-2, Class B1, 7.93%, 12/10/25 (a) | | | | | | | 20 | | | | 15,726 | |
BCMSC Trust: | | | | | | | | | | | | |
Series 2000-A, Class A2, 7.58%, 6/15/30 (a) | | | | | | | 19 | | | | 8,256 | |
Series 2000-A, Class A3, 7.83%, 6/15/30 (a) | | | | | | | 18 | | | | 7,908 | |
Series 2000-A, Class A4, 8.29%, 6/15/30 (a) | | | | | | | 31 | | | | 14,538 | |
Bear Stearns Asset-Backed Securities I Trust: | | | | | | | | | | | | |
Series 2006-HE9, Class 2A,
1.36%, 11/25/36-3/25/37 (a) | | | | | | | 67 | | | | 62,027 | |
Series 2007-HE3, Class 1A4, 1.57%, 4/25/37 (a) | | | | | | | 90 | | | | 58,376 | |
Bear Stearns Asset-Backed Securities Trust, Series 2005-4, Class M2, 2.42%, 1/25/36 (a) | | | | | | | 24 | | | | 23,232 | |
Carrington Mortgage Loan Trust: | | | | | | | | | | | | |
Series 2006-FRE2, Class A2, 1.34%, 10/25/36 (a) | | | | | | | 84 | | | | 54,240 | |
Series 2006-NC4, Class A3, 1.38%, 10/25/36 (a) | | | | | | | 100 | | | | 85,301 | |
CHLUPA Trust, Series 2013-VM, Class A,
3.33%, 8/15/20 (b)(c) | | | | | | | 3 | | | | 3,075 | |
CIFC Funding Ltd.: | | | | | | | | | | | | |
Series 2014-2A, Class A1LR, 2.39%, 5/24/26 (a)(b)(c) | | | | | | | 250 | | | | 250,010 | |
Series 2014-5A, Class A1R, 2.56%, 1/17/27 (a)(c) | | | | | | | 250 | | | | 250,824 | |
Citigroup Mortgage Loan Trust: | | | | | | | | | | | | |
Series 2006-NC1, Class A2D, 1.47%, 8/25/36 (a) | | | | | | | 30 | | | | 24,016 | |
Series 2007-AHL2, Class A3B, 1.22%, 5/25/37 (a) | | | | | | | 42 | | | | 31,120 | |
Series 2007-AHL2, Class A3C, 1.29%, 5/25/37 (a) | | | | | | | 19 | | | | 14,386 | |
Conseco Financial Corp.: | | | | | | | | | | | | |
Series 1998-8, Class A1, 6.28%, 9/01/30 | | | | | | | 11 | | | | 11,210 | |
Series 1998-8, Class M1, 6.98%, 9/01/30 (a) | | | | | | | 24 | | | | 19,882 | |
Countrywide Asset-Backed Certificates: | | | | | | | | | | | | |
Series 2003-BC3, Class A2, 1.84%, 9/25/33 (a) | | | | | | | 27 | | | | 25,720 | |
Series 2004-5, Class A, 2.12%, 10/25/34 (a) | | | | | | | 32 | | | | 30,652 | |
Series 2006-8, Class 2A3, 1.38%, 1/25/46 (a) | | | | | | | 21 | | | | 19,593 | |
Series 2006-S10, Class A3, 1.54%, 10/25/36 (a) | | | | | | | 28 | | | | 25,573 | |
Series 2006-S3, Class A4, 6.40%, 1/25/29 (d) | | | | | | | 22 | | | | 21,691 | |
Series 2006-SPS1, Class A, 1.44%, 12/25/25 (a) | | | | | | | 2 | | | | 1,981 | |
| | | | | | | | | | | | |
| Asset-Backed Securities | | Par (000) | | | Value | |
CWHEQ Home Equity Loan Trust: | | | | | | | | | | | | |
Series 2006-S5, Class A4, 5.84%, 6/25/35 | | | USD | | | | 14 | | | $ | 14,163 | |
Series 2006-S5, Class A5, 6.16%, 6/25/35 | | | | | | | 18 | | | | 17,700 | |
Series 2007-S1, Class A3, 5.81%, 11/25/36 (a) | | | | | | | 16 | | | | 16,115 | |
CWHEQ Revolving Home Equity Loan Resuritization Trust, Series 2006-RES, Class 4Q1B, 1.29%, 12/15/33 (a)(b)(c) | | | | | | | 30 | | | | 25,810 | |
CWHEQ Revolving Home Equity Loan Trust, Series 2005-B, Class 2A, 1.34%, 5/15/35 (a) | | | | | | | 10 | | | | 8,613 | |
DCP Rights LLC, Series 2014-1A, Class A,
5.46%, 10/25/44 (c) | | | | | | | 108 | | | | 109,484 | |
First Franklin Mortgage Loan Trust: | | | | | | | | | | | | |
Series 2006-FF17, Class A5, 1.37%, 12/25/36 (a) | | | | | | | 51 | | | | 42,483 | |
Series 2006-FF5, Class 2A3, 1.38%, 4/25/36 (a) | | | | | | | 9 | | | | 8,440 | |
Ford Credit Floorplan Master Owner Trust, Series 2012-5, Class C, 2.14%, 9/15/19 | | | | | | | 100 | | | | 100,073 | |
GE-WMC Mortgage Securities Trust, Series 2006-1, Class A2B, 1.17%, 8/25/36 (a) | | | | | | | 113 | | | | 71,760 | |
GSAMP Trust: | | | | | | | | | | | | |
Series 2006-FM2, Class A2B, 1.34%, 9/25/36 (a) | | | | | | | 23 | | | | 10,409 | |
Series 2007-H1, Class A1B, 1.42%, 1/25/47 (a) | | | | | | | 16 | | | | 10,710 | |
Home Equity Mortgage Trust, Series 2006-2, Class 1A1, 5.87%, 7/25/36 (d) | | | | | | | 14 | | | | 5,848 | |
Home Loan Mortgage Loan Trust, Series 2005-1, Class A3, 1.88%, 4/15/36 (a) | | | | | | | 19 | | | | 17,085 | |
JPMorgan Mortgage Acquisition Trust, Series 2006-WF1, Class A3A, 5.83%, 7/25/36 (d) | | | | | | | 59 | | | | 33,109 | |
Lehman ABS Manufactured Housing Contract Trust, Series 2001-B, Class M1, 6.63%, 4/15/40 (a) | | | | | | | 40 | | | | 42,799 | |
Litigation Fee Residual Funding LLC, Series 2015-1, Class A, 4.00%, 10/01/27 (b)(c) | | | | | | | 85 | | | | 83,509 | |
Long Beach Mortgage Loan Trust: | | | | | | | | | | | | |
Series 2006-1, Class 1A, 1.44%, 2/25/36-11/25/36 (a) | | | | | | | 59 | | | | 45,851 | |
Series 2006-2, Class 2A3, 1.41%, 3/25/46 (a) | | | | | | | 23 | | | | 11,375 | |
Series 2006-2, Class 2A4, 1.51%, 3/25/46 (a) | | | | | | | 31 | | | | 15,760 | |
Series 2006-4, Class 2A4, 1.48%, 5/25/36 (a) | | | | | | | 21 | | | | 10,093 | |
Series 2006-5, Class 2A3, 1.37%, 6/25/36 (a) | | | | | | | 16 | | | | 8,544 | |
Series 2006-9, Class 2A3, 1.38%, 10/25/36 (a) | | | | | | | 28 | | | | 12,136 | |
Madison Park Funding XIV Ltd., Series 2014-14A, Class A2R, 2.28%, 7/20/26 (a)(c) | | | | | | | 250 | | | | 250,193 | |
Morgan Stanley ABS Capital I, Inc., Trust, Series 2005-HE1, Class A2MZ, 1.82%, 12/25/34 (a) | | | | | | | 35 | | | | 32,946 | |
Mountain Hawk I CLO Ltd., Series 2013-1A, Class B1, 3.34%, 1/20/24 (a)(c) | | | | | | | 250 | | | | 250,244 | |
Navient Private Education Loan Trust, Series 2014-CTA, Class B, 2.91%, 10/17/44 (a)(c) | | | | | | | 100 | | | | 95,881 | |
OCP CLO Ltd.: | | | | | | | | | | | | |
Series 2015-8A, Class A1, 2.69%, 4/17/27 (a)(c) | | | | | | | 100 | | | | 100,224 | |
See Notes to Financial Statements.
| | | | | | |
| | | BLACKROCK SERIES FUND, INC. | | JUNE 30, 2017 | | 103 |
| | | | |
| Schedule of Investments (continued) | | | BlackRock Total Return Portfolio | |
| | | | |
| | | | | | | | | | | | |
| Asset-Backed Securities | | Par (000) | | | Value | |
Series 2016-12A, Class A1, 2.73%, 10/18/28 (a)(c) | | | USD | | | | 180 | | | $ | 181,059 | |
OFSI Fund VI Ltd., Series 2014-6A, Class A2,
3.06%, 3/20/25 (a)(c) | | | | | | | 150 | | | | 150,136 | |
OHA Loan Funding Ltd., Series 2013-2A, Class A, 2.46%, 8/23/24 (a)(c) | | | | | | | 200 | | | | 200,038 | |
OneMain Financial Issuance Trust, Series 2014-1A, Class A, 2.43%, 6/18/24 (c) | | | | | | | 14 | | | | 13,986 | |
Option One Mortgage Acceptance Corp. Asset-Backed Certificates, Series 2003-4, Class A2, 1.86%, 7/25/33 (a) | | | | | | | 45 | | | | 43,349 | |
OZLM Funding II Ltd., Series 2012-2A, Class A1R, 2.61%, 10/30/27 (a)(c) | | | | | | | 250 | | | | 250,707 | |
OZLM Funding IV Ltd., Series 2013-4A, Class A1, 2.30%, 7/22/25 (a)(c) | | | | | | | 250 | | | | 250,127 | |
OZLM Funding V Ltd., Series 2013-5A, Class BR, 3.51%, 1/17/26 (a)(b)(c) | | | | | | | 250 | | | | 250,037 | |
Pretium Mortgage Credit Partners I LLC, Series 2017-NPL3, Class A1, 3.25%, 6/29/32 (c)(d) | | | | | | | 100 | | | | 100,000 | |
Progress Residential Trust, Series 2016-SFR1, Class E, 5.06%, 9/17/33 (a)(c) | | | | | | | 100 | | | | 104,362 | |
RASC Trust, Series 2003-KS5, Class AIIB, 1.80%, 7/25/33 (a) | | | | | | | 16 | | | | 15,311 | |
RCO Mortgage LLC, Series 2015-NQM1, Class A, 4.52%, 11/25/45 (a)(c) | | | | | | | 10 | | | | 9,746 | |
Rockford Tower CLO Ltd., Series 2017-1A, Class B, 3.17%, 4/15/29 (a)(b)(c) | | | | | | | 250 | | | | 248,725 | |
Scholar Funding Trust, Series 2013-A, Class A,
1.69%, 1/30/45 (a)(c) | | | | | | | 132 | | | | 130,126 | |
Silvermore CLO Ltd., Series 2014-1A, Class A1, 2.63%, 5/15/26 (a)(c) | | | | | | | 248 | | | | 247,816 | |
SLM Private Credit Student Loan Trust, Series 2004-B, Class A3, 1.58%, 3/15/24 (a) | | | | | | | 23 | | | | 22,728 | |
SLM Private Education Loan Trust, Series 2013-C, Class A2B, 2.56%, 10/15/31 (a)(c) | | | | | | | 85 | | | | 85,774 | |
Soundview Home Loan Trust, Series 2004-WMC1, Class M2, 2.01%, 1/25/35 (a) | | | | | | | 6 | | | | 5,526 | |
SpringCastle America Funding LLC, Series 2016-AA, Class A, 3.05%, 4/25/29 (c) | | | | | | | 80 | | | | 80,125 | |
Structured Asset Securities Corp. Mortgage Pass-Through Certificates, Series 2004-23XS, Class 2A1,
1.52%, 1/25/35 (a) | | | | | | | 36 | | | | 34,181 | |
SWAY Residential Trust, Series 2014-1, Class A, 2.51%, 1/17/32 (a)(c) | | | | | | | 2 | | | | 2,049 | |
TICP CLO III Ltd., Series 2014-3A, Class AR,
2.34%, 1/20/27 (a)(b)(c) | | | | | | | 250 | | | | 250,133 | |
Tricon American Homes Trust, Series 2015-SFR1, Class A, 2.42%, 5/17/32 (a)(c) | | | | | | | 89 | | | | 89,476 | |
U.S. Residential Opportunity Fund III Trust: | | | | | | | | | | | | |
Series 2016-1III, Class A, 3.47%, 7/27/36-8/27/36 (c)(d) | | | | | | | 189 | | | | 189,005 | |
Series 2016-3III, Class A, 3.60%, 10/27/36 (c)(d) | | | | | | | 93 | | | | 92,550 | |
U.S. Residential Opportunity Fund IV Trust, Series 2016-1IV, Class A, 3.47%, 7/27/36- 8/27/36 (c)(d) | | | | | | | 167 | | | | 166,630 | |
Venture XIX CLO Ltd., Series 2014-19A, Class AR, 2.53%, 1/15/27 (a)(b)(c) | | | | | | | 250 | | | | 250,469 | |
| | | | | | | | | | | | |
| Asset-Backed Securities | | Par (000) | | | Value | |
VOLT LIX LLC, Series 2017-NPL6, Class A1, 3.25%, 5/25/47 (c)(d) | | | USD | | | | 97 | | | $ | 97,341 | |
VOLT LXI LLC, Series 2017-NPL8, Class A1, 3.13%, 6/25/47 (b)(c)(d) | | | | | | | 100 | | | | 100,000 | |
Wachovia Asset Securitization Issuance II LLC Trust, Series 2007-HE2A, Class A, 1.35%, 7/25/37 (a)(c) | | | | | | | 29 | | | | 27,240 | |
Washington Mutual Asset-Backed Certificates Trust, Series 2006-HE5, Class 1A, 1.37%, 10/25/36 (a) | | | | | | | 16 | | | | 12,818 | |
Total Asset-Backed Securities — 11.9% | | | | | | | | | | | 6,525,567 | |
| | | | | | | | | | | | |
| Corporate Bonds | | | | | | | | | |
Aerospace & Defense — 0.4% | | | | | | | | | | | | |
BAE Systems Holdings, Inc.: | | | | | | | | | | | | |
2.85%, 12/15/20 (c) | | | | | | | 12 | | | | 12,164 | |
4.75%, 10/07/44 (c) | | | | | | | 3 | | | | 3,250 | |
Huntington Ingalls Industries, Inc., 5.00%, 12/15/21 (c) | | | | | | | 5 | | | | 5,175 | |
Lockheed Martin Corp.: | | | | | | | | | | | | |
3.55%, 1/15/26 | | | | | | | 14 | | | | 14,507 | |
3.60%, 3/01/35 | | | | | | | 19 | | | | 18,747 | |
4.50%, 5/15/36 | | | | | | | 5 | | | | 5,453 | |
4.07%, 12/15/42 | | | | | | | 16 | | | | 16,354 | |
4.70%, 5/15/46 | | | | | | | 6 | | | | 6,742 | |
Northrop Grumman Corp., 3.85%, 4/15/45 | | | | | | | 12 | | | | 11,900 | |
United Technologies Corp.: | | | | | | | | | | | | |
1.78%, 5/04/18 (d) | | | | | | | 58 | | | | 58,074 | |
4.15%, 5/15/45 | | | | | | | 19 | | | | 19,672 | |
4.05%, 5/04/47 | | | | | | | 50 | | | | 51,215 | |
| | | | | | | | | | | | |
| | | | | | | | | | | | 223,253 | |
Air Freight & Logistics — 0.2% | | | | | | | | | | | | |
FedEx Corp.: | | | | | | | | | | | | |
4.90%, 1/15/34 | | | | | | | 22 | | | | 24,488 | |
3.90%, 2/01/35 | | | | | | | 15 | | | | 14,889 | |
4.10%, 2/01/45 | | | | | | | 20 | | | | 19,621 | |
4.75%, 11/15/45 | | | | | | | 21 | | | | 22,677 | |
4.55%, 4/01/46 | | | | | | | 13 | | | | 13,656 | |
4.40%, 1/15/47 | | | | | | | 24 | | | | 24,685 | |
| | | | | | | | | | | | |
| | | | | | | | | | | | 120,016 | |
Airlines — 0.5% | | | | | | | | | | | | |
American Airlines Group, Inc., 4.63%, 3/01/20 (c) | | | | | | | 34 | | | | 35,165 | |
American Airlines Pass-Through Trust, Series 2015-1, Class A, 3.38%, 5/01/27 | | | | | | | 52 | | | | 52,690 | |
Delta Air Lines, Inc., 2.88%, 3/13/20 | | | | | | | 148 | | | | 149,935 | |
Turkish Airlines Pass-Through Trust, Series 2015-1, Class A, 4.20%, 3/15/27 (c) | | | | | | | 19 | | | | 18,325 | |
United Airlines Pass-Through Trust, Series 2014-1, Class B, 4.75%, 10/11/23 | | | | | | | 6 | | | | 5,915 | |
| | | | | | | | | | | | |
| | | | | | | | | | | | 262,030 | |
Auto Components — 0.1% | | | | | | | | | | | | |
Delphi Automotive PLC: | | | | | | | | | | | | |
4.25%, 1/15/26 | | | | | | | 32 | | | | 33,895 | |
4.40%, 10/01/46 | | | | | | | 21 | | | | 20,940 | |
| | | | | | | | | | | | |
| | | | | | | | | | | | 54,835 | |
See Notes to Financial Statements.
| | | | | | |
| 104 | | BLACKROCK SERIES FUND, INC. | | JUNE 30, 2017 | | |
| | | | |
| Schedule of Investments (continued) | | | BlackRock Total Return Portfolio | |
| | | | |
| | | | | | | | | | | | |
| Corporate Bonds | | | | | Par (000) | | | Value | |
Banks — 5.9% | | | | | | | | | | | | |
Bank of America Corp.: | | | | | | | | | | | | |
2.25%, 4/21/20 | | | USD | | | | 107 | | | $ | 107,044 | |
3.30%, 1/11/23 | | | | | | | 76 | | | | 77,497 | |
3.88%, 8/01/25 | | | | | | | 38 | | | | 39,311 | |
3.50%, 4/19/26 | | | | | | | 53 | | | | 53,181 | |
3.25%, 10/21/27 | | | | | | | 25 | | | | 24,158 | |
4.88%, 4/01/44 | | | | | | | 5 | | | | 5,598 | |
4.44%, 1/20/48 (a) | | | | | | | 80 | | | | 84,614 | |
BB&T Corp.: | | | | | | | | | | | | |
2.45%, 1/15/20 | | | | | | | 40 | | | | 40,447 | |
2.75%, 4/01/22 | | | | | | | 240 | | | | 243,546 | |
Citigroup, Inc.: | | | | | | | | | | | | |
1.80%, 2/05/18 | | | | | | | 58 | | | | 58,044 | |
2.50%, 9/26/18 | | | | | | | 106 | | | | 106,718 | |
2.50%, 7/29/19 | | | | | | | 78 | | | | 78,701 | |
2.90%, 12/08/21 | | | | | | | 321 | | | | 324,253 | |
3.50%, 5/15/23 | | | | | | | 25 | | | | 25,364 | |
3.88%, 3/26/25 | | | | | | | 25 | | | | 25,155 | |
4.13%, 7/25/28 | | | | | | | 90 | | | | 91,361 | |
4.75%, 5/18/46 | | | | | | | 70 | | | | 73,479 | |
HSBC Holdings PLC, 2.65%, 1/05/22 | | | | | | | 200 | | | | 199,539 | |
JPMorgan Chase & Co.: | | | | | | | | | | | | |
2.20%, 10/22/19 | | | | | | | 35 | | | | 35,112 | |
2.75%, 6/23/20 | | | | | | | 7 | | | | 7,117 | |
2.97%, 1/15/23 | | | | | | | 168 | | | | 169,998 | |
3.88%, 9/10/24 | | | | | | | 29 | | | | 29,921 | |
3.90%, 7/15/25 | | | | | | | 64 | | | | 66,744 | |
4.25%, 10/01/27 | | | | | | | 30 | | | | 31,293 | |
3.78%, 2/01/28 (a) | | | | | | | 110 | | | | 112,488 | |
Mizuho Financial Group, Inc., 2.95%, 2/28/22 | | | | | | | 224 | | | | 225,929 | |
Royal Bank of Scotland Group PLC, 2.65%, 5/15/23 (a) | | | | | | | 230 | | | | 231,863 | |
Sumitomo Mitsui Trust Bank Ltd., 2.05%, 3/06/19 (c) | | | | | | | 271 | | | | 270,998 | |
U.S. Bancorp: | | | | | | | | | | | | |
2.95%, 7/15/22 | | | | | | | 50 | | | | 50,858 | |
3.15%, 4/27/27 | | | | | | | 20 | | | | 20,033 | |
Wells Fargo & Co.: | | | | | | | | | | | | |
2.60%, 7/22/20 | | | | | | | 34 | | | | 34,479 | |
2.55%, 12/07/20 | | | | | | | 27 | | | | 27,310 | |
2.10%, 7/26/21 | | | | | | | 120 | | | | 118,391 | |
3.58%, 5/22/28 (a) | | | | | | | 80 | | | | 80,850 | |
4.90%, 11/17/45 | | | | | | | 16 | | | | 17,446 | |
4.75%, 12/07/46 | | | | | | | 46 | | | | 49,113 | |
| | | | | | | | | | | | |
| | | | | | | | | | | | 3,237,953 | |
Beverages — 0.5% | | | | | | | | | | | | |
Anheuser-Busch InBev Finance, Inc.: | | | | | | | | | | | | |
2.65%, 2/01/21 | | | | | | | 48 | | | | 48,644 | |
3.30%, 2/01/23 | | | | | | | 50 | | | | 51,487 | |
4.70%, 2/01/36 | | | | | | | 20 | | | | 22,013 | |
4.90%, 2/01/46 | | | | | | | 142 | | | | 160,267 | |
Anheuser-Busch InBev Worldwide, Inc., 3.75%, 7/15/42 | | | | | | | 12 | | | | 11,614 | |
| | | | | | | | | | | | |
| | | | | | | | | | | | 294,025 | |
Biotechnology — 0.6% | | | | | | | | | | | | |
AbbVie, Inc.: | | | | | | | | | | | | |
2.50%, 5/14/20 | | | | | | | 56 | | | | 56,649 | |
2.90%, 11/06/22 | | | | | | | 20 | | | | 20,188 | |
4.50%, 5/14/35 | | | | | | | 39 | | | | 41,131 | |
Amgen, Inc.: | | | | | | | | | | | | |
2.13%, 5/01/20 | | | | | | | 40 | | | | 40,060 | |
4.40%, 5/01/45 | | | | | | | 19 | | | | 19,516 | |
| | | | | | | | | | | | |
| Corporate Bonds | | | | | Par (000) | | | Value | |
Gilead Sciences, Inc.: | | | | | | | | | | | | |
2.35%, 2/01/20 | | | USD | | | | 10 | | | $ | 10,095 | |
2.50%, 9/01/23 | | | | | | | 23 | | | | 22,659 | |
4.60%, 9/01/35 | | | | | | | 9 | | | | 9,650 | |
4.00%, 9/01/36 | | | | | | | 80 | | | | 79,551 | |
4.50%, 2/01/45 | | | | | | | 13 | | | | 13,476 | |
4.15%, 3/01/47 | | | | | | | 13 | | | | 13,061 | |
| | | | | | | | | | | | |
| | | | | | | | | | | | 326,036 | |
Building Products — 0.1% | | | | | | | | | | | | |
Johnson Controls International PLC, 5.13%, 9/14/45 | | | | | | | 30 | | | | 34,498 | |
Capital Markets — 3.1% | | | | | | | | | | | | |
Bank of New York Mellon Corp., 2.05%, 5/03/21 | | | | | | | 120 | | | | 118,902 | |
Credit Suisse AG, 3.00%, 10/29/21 | | | | | | | 250 | | | | 254,761 | |
Goldman Sachs Group, Inc.: | | | | | | | | | | | | |
2.63%, 1/31/19 | | | | | | | 63 | | | | 63,637 | |
2.00%, 4/25/19 | | | | | | | 16 | | | | 15,993 | |
2.60%, 4/23/20 | | | | | | | 46 | | | | 46,427 | |
2.75%, 9/15/20 | | | | | | | 20 | | | | 20,241 | |
2.63%, 4/25/21 | | | | | | | 34 | | | | 34,067 | |
2.35%, 11/15/21 | | | | | | | 94 | | | | 92,735 | |
3.50%, 1/23/25 | | | | | | | 25 | | | | 25,272 | |
3.75%, 5/22/25 | | | | | | | 79 | | | | 80,895 | |
Jefferies Group LLC, 6.50%, 1/20/43 | | | | | | | 10 | | | | 11,301 | |
Lehman Brothers Holdings, Inc., 0.00%, 7/19/17 (b)(e)(f) | | | | | | | 150 | | | | — | |
Moody’s Corp.: | | | | | | | | | | | | |
2.75%, 12/15/21 | | | | | | | 38 | | | | 38,319 | |
3.25%, 1/15/28 (c) | | | | | | | 50 | | | | 49,232 | |
Morgan Stanley: | | | | | | | | | | | | |
2.80%, 6/16/20 | | | | | | | 76 | | | | 77,105 | |
2.63%, 11/17/21 | | | | | | | 175 | | | | 174,742 | |
2.75%, 5/19/22 | | | | | | | 240 | | | | 239,948 | |
3.75%, 2/25/23 | | | | | | | 58 | | | | 60,309 | |
3.70%, 10/23/24 | | | | | | | 56 | | | | 57,470 | |
Northern Trust Corp., 3.38%, 5/08/32 (a) | | | | | | | 35 | | | | 34,985 | |
State Street Corp., 2.65%, 5/19/26 | | | | | | | 17 | | | | 16,477 | |
UBS Group Funding Switzerland AG, 2.65%, 2/01/22 (c) | | | | | | | 200 | | | | 199,575 | |
| | | | | | | | | | | | |
| | | | | | | | | | | | 1,712,393 | |
Chemicals — 0.2% | | | | | | | | | | | | |
Agrium, Inc., 4.13%, 3/15/35 (g) | | | | | | | 14 | | | | 13,932 | |
Dow Chemical Co.: | | | | | | | | | | | | |
4.38%, 11/15/42 | | | | | | | 9 | | | | 9,296 | |
4.63%, 10/01/44 | | | | | | | 11 | | | | 11,708 | |
E.I. du Pont de Nemours & Co., 2.20%, 5/01/20 | | | | | | | 20 | | | | 20,109 | |
Eastman Chemical Co., 4.80%, 9/01/42 | | | | | | | 15 | | | | 16,102 | |
Monsanto Co., 3.60%, 7/15/42 | | | | | | | 14 | | | | 12,177 | |
Sherwin-Williams Co., 4.50%, 6/01/47 | | | | | | | 15 | | | | 15,717 | |
| | | | | | | | | | | | |
| | | | | | | | | | | | 99,041 | |
Commercial Services & Supplies — 0.4% | | | | | | | | | | | | |
Aviation Capital Group Corp., 2.88%, 9/17/18 (c) | | | | | | | 55 | | | | 55,529 | |
Pitney Bowes, Inc., 3.88%, 5/15/22 | | | | | | | 140 | | | | 139,964 | |
Waste Management, Inc., 3.90%, 3/01/35 | | | | | | | 16 | | | | 16,517 | |
| | | | | | | | | | | | |
| | | | | | | | | | | | 212,010 | |
See Notes to Financial Statements.
| | | | | | |
| | | BLACKROCK SERIES FUND, INC. | | JUNE 30, 2017 | | 105 |
| | | | |
| Schedule of Investments (continued) | | | BlackRock Total Return Portfolio | |
| | | | |
| | | | | | | | | | | | |
| Corporate Bonds | | | | | Par (000) | | | Value | |
Communications Equipment — 0.1% | | | | | | | | | | | | |
Harris Corp., 2.70%, 4/27/20 | | | USD | | | | 14 | | | $ | 14,145 | |
Juniper Networks, Inc., 3.30%, 6/15/20 | | | | | | | 21 | | | | 21,505 | |
| | | | | | | | | | | | |
| | | | | | | | | | | | 35,650 | |
Consumer Finance — 1.3% | | | | | | | | | | | | |
American Express Credit Corp.: | | | | | | | | | | | | |
2.25%, 8/15/19 | | | | | | | 28 | | | | 28,241 | |
3.30%, 5/03/27 | | | | | | | 15 | | | | 14,988 | |
Capital One Financial Corp., 3.75%, 3/09/27 | | | | | | | 60 | | | | 59,782 | |
Discover Financial Services, 4.10%, 2/09/27 | | | | | | | 13 | | | | 13,022 | |
General Motors Financial Co., Inc.: | | | | | | | | | | | | |
2.63%, 7/10/17 | | | | | | | 100 | | | | 100,010 | |
4.75%, 8/15/17 | | | | | | | 90 | | | | 90,307 | |
3.10%, 1/15/19 | | | | | | | 13 | | | | 13,178 | |
3.70%, 11/24/20 | | | | | | | 23 | | | | 23,797 | |
3.20%, 7/06/21 | | | | | | | 76 | | | | 76,854 | |
3.15%, 6/30/22 | | | | | | | 205 | | | | 205,317 | |
4.00%, 1/15/25 | | | | | | | 29 | | | | 29,123 | |
Synchrony Financial: | | | | | | | | | | | | |
2.60%, 1/15/19 | | | | | | | 36 | | | | 36,192 | |
2.70%, 2/03/20 | | | | | | | 19 | | | | 19,096 | |
4.50%, 7/23/25 | | | | | | | 19 | | | | 19,539 | |
| | | | | | | | | | | | |
| | | | | | | | | | | | 729,446 | |
Containers & Packaging — 0.1% | | | | | | | | | | | | |
Reynolds Group Issuer, Inc., 5.75%, 10/15/20 | | | | | | | 35 | | | | 35,817 | |
Diversified Financial Services — 0.9% | | | | | | | | | | | | |
AerCap Ireland Capital DAC/AerCap Global Aviation Trust, 3.50%, 5/26/22 | | | | | | | 150 | | | | 153,936 | |
BHP Billiton Finance USA Ltd., 5.00%, 9/30/43 | | | | | | | 30 | | | | 34,716 | |
BP Capital Markets PLC, 3.22%, 4/14/24 | | | | | | | 70 | | | | 70,691 | |
Glencore Funding LLC, 4.00%, 3/27/27 (c) | | | | | | | 70 | | | | 68,873 | |
Hyundai Capital America, 2.55%, 4/03/20 (c) | | | | | | | 132 | | | | 131,670 | |
Shell International Finance BV: | | | | | | | | | | | | |
4.13%, 5/11/35 | | | | | | | 36 | | | | 37,482 | |
3.63%, 8/21/42 | | | | | | | 16 | | | | 14,968 | |
Woodside Finance Ltd., 3.65%, 3/05/25 (c) | | | | | | | 4 | | | | 3,985 | |
| | | | | | | | | | | | |
| | | | | | | | | | | | 516,321 | |
Diversified Telecommunication Services — 1.2% | | | | | | | | | | | | |
AT&T Inc.: | | | | | | | | | | | | |
3.80%, 3/01/24 | | | | | | | 40 | | | | 40,904 | |
5.25%, 3/01/37 | | | | | | | 29 | | | | 30,896 | |
6.38%, 3/01/41 | | | | | | | 13 | | | | 15,181 | |
4.30%, 12/15/42 | | | | | | | 8 | | | | 7,429 | |
4.75%, 5/15/46 | | | | | | | 36 | | | | 35,302 | |
Orange SA, 5.50%, 2/06/44 | | | | | | | 18 | | | | 21,489 | |
Verizon Communications, Inc.: | | | | | | | | | | | | |
1.72%, 5/22/20 (a) | | | | | | | 410 | | | | 410,307 | |
3.85%, 11/01/42 | | | | | | | 7 | | | | 6,103 | |
4.86%, 8/21/46 | | | | | | | 81 | | | | 81,014 | |
| | | | | | | | | | | | |
| | | | | | | | | | | | 648,625 | |
Electric Utilities — 0.6% | | | | | | | | | | | | |
Baltimore Gas & Electric Co., 3.50%, 8/15/46 | | | | | | | 13 | | | | 12,394 | |
Emera U.S. Finance LP: | | | | | | | | | | | | |
2.15%, 6/15/19 | | | | | | | 32 | | | | 31,970 | |
2.70%, 6/15/21 | | | | | | | 39 | | | | 39,060 | |
Exelon Corp.: | | | | | | | | | | | | |
2.85%, 6/15/20 | | | | | | | 51 | | | | 51,812 | |
2.45%, 4/15/21 | | | | | | | 9 | | | | 8,975 | |
4.95%, 6/15/35 | | | | | | | 7 | | | | 7,663 | |
Great Plains Energy, Inc., 3.90%, 4/01/27 | | | | | | | 62 | | | | 62,721 | |
Southern California Edison Co., 1.25%, 11/01/17 | | | | | | | 19 | | | | 18,989 | |
| | | | | | | | | | | | |
| Corporate Bonds | | | | | Par (000) | | | Value | |
Electric Utilities (continued) | | | | | | | | | | | | |
Southern Co. Gas Capital Corp., 4.40%, 5/30/47 | | | USD | | | | 35 | | | $ | 35,698 | |
Trans-Allegheny Interstate Line Co., 3.85%, 6/01/25 (c) | | | | | | | 57 | | | | 59,110 | |
| | | | | | | | | | | | |
| | | | | | | | | | | | 328,392 | |
Electronic Equipment, Instruments & Components — 0.0% | | | | | |
Amphenol Corp., 3.20%, 4/01/24 | | | | | | | 19 | | | | 19,194 | |
Energy Equipment & Services — 0.2% | | | | | | | | | | | | |
Halliburton Co., 3.80%, 11/15/25 | | | | | | | 40 | | | | 40,993 | |
Nabors Industries, Inc., 5.50%, 1/15/23 (c) | | | | | | | 17 | | | | 16,107 | |
Schlumberger Holdings Corp., 3.00%, 12/21/20 (c) | | | | | | | 48 | | | | 48,873 | |
| | | | | | | | | | | | |
| | | | | | | | | | | | 105,973 | |
Equity Real Estate Investment Trusts (REITs) — 0.2% | | | | | |
American Tower Corp.: | | | | | | | | | | | | |
3.30%, 2/15/21 | | | | | | | 23 | | | | 23,601 | |
3.45%, 9/15/21 | | | | | | | 22 | | | | 22,687 | |
3.50%, 1/31/23 | | | | | | | 8 | | | | 8,205 | |
5.00%, 2/15/24 | | | | | | | 8 | | | | 8,839 | |
4.40%, 2/15/26 | | | | | | | 5 | | | | 5,241 | |
Crown Castle International Corp.: | | | | | | | | | | | | |
3.40%, 2/15/21 | | | | | | | 11 | | | | 11,295 | |
2.25%, 9/01/21 | | | | | | | 39 | | | | 38,368 | |
| | | | | | | | | | | | |
| | | | | | | | | | | | 118,236 | |
Food & Staples Retailing — 0.1% | | | | | |
Walgreens Boots Alliance, Inc.: | | | | | | | | | | | | |
4.80%, 11/18/44 | | | | | | | 61 | | | | 64,913 | |
4.65%, 6/01/46 | | | | | | | 2 | | | | 2,093 | |
| | | | | | | | | | | | |
| | | | | | | | | | | | 67,006 | |
Food Products — 0.1% | | | | | |
Arcor SAIC, 6.00%, 7/06/23 (c) | | | | | | | 5 | | | | 5,313 | |
Post Holdings, Inc., 6.00%, 12/15/22 (c) | | | | | | | 33 | | | | 34,980 | |
| | | | | | | | | | | | |
| | | | | | | | | | | | 40,293 | |
Health Care Equipment & Supplies — 0.7% | | | | | |
Abbott Laboratories: | | | | | | | | | | | | |
2.80%, 9/15/20 | | | | | | | 26 | | | | 26,406 | |
3.88%, 9/15/25 | | | | | | | 9 | | | | 9,257 | |
Becton Dickinson and Co.: | | | | | | | | | | | | |
2.13%, 6/06/19 | | | | | | | 100 | | | | 100,152 | |
2.68%, 12/15/19 | | | | | | | 34 | | | | 34,416 | |
2.89%, 6/06/22 | | | | | | | 70 | | | | 70,219 | |
4.69%, 12/15/44 | | | | | | | 8 | | | | 8,239 | |
Boston Scientific Corp., 2.65%, 10/01/18 | | | | | | | 28 | | | | 28,257 | |
Medtronic Global Holdings SCA, 3.35%, 4/01/27 | | | | | | | 60 | | | | 61,168 | |
Medtronic, Inc., 4.38%, 3/15/35 | | | | | | | 4 | | | | 4,369 | |
Stryker Corp., 4.63%, 3/15/46 | | | | | | | 16 | | | | 17,480 | |
| | | | | | | | | | | | |
| | | | | | | | | | | | 359,963 | |
Health Care Providers & Services — 0.8% | | | | | |
Aetna, Inc.: | | | | | | | | | | | | |
4.50%, 5/15/42 | | | | | | | 18 | | | | 19,442 | |
4.13%, 11/15/42 | | | | | | | 10 | | | | 10,182 | |
4.75%, 3/15/44 | | | | | | | 10 | | | | 11,241 | |
Anthem, Inc.: | | | | | | | | | | | | |
1.88%, 1/15/18 | | | | | | | 70 | | | | 70,058 | |
2.30%, 7/15/18 | | | | | | | 86 | | | | 86,484 | |
Baylor Scott & White Holdings, 4.19%, 11/15/45 | | | | | | | 15 | | | | 15,336 | |
Catholic Health Initiatives, 4.35%, 11/01/42 | | | | | | | 10 | | | | 9,026 | |
Cigna Corp., 3.25%, 4/15/25 | | | | | | | 44 | | | | 44,172 | |
See Notes to Financial Statements.
| | | | | | |
| 106 | | BLACKROCK SERIES FUND, INC. | | JUNE 30, 2017 | | |
| | | | |
| Schedule of Investments (continued) | | | BlackRock Total Return Portfolio | |
| | | | |
| | | | | | | | | | | | |
| Corporate Bonds | | Par (000) | | | Value | |
Health Care Providers & Services (continued) | | | | | | | | |
HCA, Inc., 3.75%, 3/15/19 | | | USD | | | | 35 | | | $ | 35,700 | |
Kaiser Foundation Hospitals, 4.15%, 5/01/47 | | | | | | | 21 | | | | 21,759 | |
Laboratory Corp. of America Holdings, 2.63%, 2/01/20 | | | | | | | 20 | | | | 20,165 | |
New York & Presbyterian Hospital, 3.56%, 8/01/36 | | | | | | | 9 | | | | 8,735 | |
Ochsner Clinic Foundation, 5.90%, 5/15/45 | | | | | | | 10 | | | | 12,423 | |
RWJ Barnabas Health, Inc., 3.95%, 7/01/46 | | | | | | | 5 | | | | 4,920 | |
Southern Baptist Hospital of Florida, Inc., 4.86%, 7/15/45 | | | | | | | 10 | | | | 11,126 | |
SSM Health Care Corp., 3.82%, 6/01/27 | | | | | | | 21 | | | | 21,520 | |
UnitedHealth Group, Inc.: | | | | | | | | | | | | |
2.70%, 7/15/20 | | | | | | | 15 | | | | 15,316 | |
4.63%, 7/15/35 | | | | | | | 7 | | | | 7,867 | |
4.20%, 1/15/47 | | | | | | | 18 | | | | 18,988 | |
| | | | | | | | | | | | |
| | | | | | | | | | | | 444,460 | |
Hotels, Restaurants & Leisure — 0.2% | | | | | | | | | | | | |
Caesars Growth Properties Holdings | | | | | | | | | | | | |
LLC/Caesars Growth Properties Finance, Inc., 9.38%, 5/01/22 | | | | | | | 35 | | | | 37,975 | |
McDonald’s Corp.: | | | | | | | | | | | | |
4.70%, 12/09/35 | | | | | | | 8 | | | | 8,830 | |
4.88%, 12/09/45 | | | | | | | 9 | | | | 10,034 | |
4.45%, 3/01/47 | | | | | | | 27 | | | | 28,401 | |
| | | | | | | | | | | | |
| | | | | | | | | | | | 85,240 | |
Household Durables — 0.1% | | | | | | | | | | | | |
Newell Brands, Inc., 2.88%, 12/01/19 | | | | | | | 51 | | | | 51,875 | |
Independent Power and Renewable Electricity Producers — 0.0% | |
Genneia SA, 8.75%, 1/20/22 (c) | | | | | | | 4 | | | | 4,253 | |
Industrial Conglomerates — 0.1% | | | | | | | | | | | | |
Eaton Corp., 2.75%, 11/02/22 | | | | | | | 23 | | | | 23,125 | |
General Electric Co., 4.50%, 3/11/44 | | | | | | | 45 | | | | 49,993 | |
| | | | | | | | | | | | |
| | | | | | | | | | | | 73,118 | |
Insurance — 0.3% | | | | | | | | | | | | |
Allstate Corp., 4.20%, 12/15/46 | | | | | | | 24 | | | | 25,020 | |
American International Group, Inc.: | | | | | | | | | | | | |
3.75%, 7/10/25 | | | | | | | 25 | | | | 25,465 | |
3.88%, 1/15/35 | | | | | | | 22 | | | | 21,328 | |
4.50%, 7/16/44 | | | | | | | 19 | | | | 19,321 | |
Aon PLC, 4.75%, 5/15/45 | | | | | | | 22 | | | | 23,804 | |
Marsh & McLennan Cos., Inc.: | | | | | | | | | | | | |
3.75%, 3/14/26 | | | | | | | 6 | | | | 6,247 | |
4.35%, 1/30/47 | | | | | | | 10 | | | | 10,687 | |
Travelers Cos., Inc.: | | | | | | | | | | | | |
4.60%, 8/01/43 | | | | | | | 23 | | | | 25,653 | |
4.00%, 5/30/47 | | | | | | | 30 | | | | 30,689 | |
Willis North America, Inc., 3.60%, 5/15/24 | | | | | | | 4 | | | | 4,040 | |
| | | | | | | | | | | | |
| | | | | | | | | | | | 192,254 | |
IT Services — 0.2% | | | | | | | | | | | | |
DXC Technology Co., 2.88%, 3/27/20 (c) | | | | | | | 21 | | | | 21,264 | |
Fidelity National Information Services, Inc.: | | | | | | | | | | | | |
3.63%, 10/15/20 | | | | | | | 4 | | | | 4,190 | |
4.50%, 8/15/46 | | | | | | | 55 | | | | 56,420 | |
Total System Services, Inc., 4.80%, 4/01/26 | | | | | | | 35 | | | | 38,099 | |
Visa, Inc., 4.15%, 12/14/35 | | | | | | | 16 | | | | 17,335 | |
| | | | | | | | | | | | |
| | | | | | | | | | | | 137,308 | |
Machinery — 0.0% | | | | | | | | | | | | |
Ingersoll-Rand Luxembourg Finance SA, 4.65%, 11/01/44 | | | | | | | 5 | | | | 5,392 | |
| | | | | | | | | | | | |
| Corporate Bonds | | Par (000) | | | Value | |
Media — 1.7% | | | | | | | | |
21st Century Fox America, Inc.: | | | | | | | | | | | | |
4.75%, 9/15/44 | | | USD | | | | 3 | | | $ | 3,158 | |
4.95%, 10/15/45 | | | | | | | 4 | | | | 4,330 | |
CBS Corp., 2.30%, 8/15/19 | | | | | | | 25 | | | | 25,163 | |
Charter Communications Operating LLC/Charter | | | | | | | | | | | | |
Communications Operating Capital: | | | | | | | | | | | | |
4.46%, 7/23/22 | | | | | | | 52 | | | | 55,404 | |
4.91%, 7/23/25 | | | | | | | 14 | | | | 15,124 | |
3.75%, 2/15/28 (c) | | | | | | | 130 | | | | 128,082 | |
6.38%, 10/23/35 | | | | | | | 16 | | | | 18,966 | |
6.48%, 10/23/45 | | | | | | | 100 | | | | 120,021 | |
5.38%, 5/01/47 (c) | | | | | | | 50 | | | | 52,897 | |
Comcast Corp.: | | | | | | | | | | | | |
3.38%, 8/15/25 | | | | | | | 12 | | | | 12,311 | |
4.25%, 1/15/33 | | | | | | | 10 | | | | 10,658 | |
4.40%, 8/15/35 | | | | | | | 25 | | | | 26,873 | |
3.20%, 7/15/36 | | | | | | | 47 | | | | 43,988 | |
4.75%, 3/01/44 | | | | | | | 46 | | | | 51,188 | |
4.60%, 8/15/45 | | | | | | | 17 | | | | 18,538 | |
3.40%, 7/15/46 | | | | | | | 13 | | | | 11,838 | |
CSC Holdings LLC, 7.63%, 7/15/18 | | | | | | | 35 | | | | 36,925 | |
Discovery Communications LLC, 3.80%, 3/13/24 | | | | | | | 23 | | | | 23,257 | |
Interpublic Group of Cos., Inc., 4.00%, 3/15/22 | | | | | | | 22 | | | | 23,070 | |
NBCUniversal Media LLC, 4.45%, 1/15/43 | | | | | | | 25 | | | | 26,542 | |
Time Warner Cable LLC: | | | | | | | | | | | | |
5.00%, 2/01/20 | | | | | | | 30 | | | | 32,004 | |
4.13%, 2/15/21 | | | | | | | 31 | | | | 32,417 | |
4.00%, 9/01/21 | | | | | | | 8 | | | | 8,362 | |
5.50%, 9/01/41 | | | | | | | 12 | | | | 12,896 | |
4.50%, 9/15/42 | | | | | | | 3 | | | | 2,854 | |
Time Warner, Inc.: | | | | | | | | | | | | |
2.10%, 6/01/19 | | | | | | | 41 | | | | 41,017 | |
3.60%, 7/15/25 | | | | | | | 19 | | | | 18,957 | |
4.85%, 7/15/45 | | | | | | | 21 | | | | 21,623 | |
Viacom, Inc.: | | | | | | | | | | | | |
2.75%, 12/15/19 | | | | | | | 6 | | | | 6,068 | |
4.50%, 3/01/21 | | | | | | | 24 | | | | 25,490 | |
| | | | | | | | | | | | |
| | | | | | | | | | | | 910,021 | |
Metals & Mining — 0.3% | | | | | | | | | | | | |
Barrick Gold Corp., 5.25%, 4/01/42 | | | | | | | 40 | | | | 45,512 | |
Newmont Mining Corp.: | | | | | | | | | | | | |
3.50%, 3/15/22 | | | | | | | 40 | | | | 41,365 | |
4.88%, 3/15/42 | | | | | | | 30 | | | | 31,699 | |
Nucor Corp., 5.20%, 8/01/43 | | | | | | | 12 | | | | 14,081 | |
Rio Tinto Finance USA PLC, 4.13%, 8/21/42 | | | | | | | 20 | | | | 20,638 | |
Steel Dynamics, Inc., 5.13%, 10/01/21 | | | | | | | 14 | | | | 14,378 | |
| | | | | | | | | | | | |
| | | | | | | | | | | | 167,673 | |
Multi-Utilities — 0.3% | | | | | | | | | | | | |
Dominion Energy Gas Holdings LLC, 4.60%, 12/15/44 | | | | | | | 22 | | | | 22,988 | |
NiSource Finance Corp., 3.49%, 5/15/27 | | | | | | | 35 | | | | 35,241 | |
Pacific Gas & Electric Co.: | | | | | | | | | | | | |
4.75%, 2/15/44 | | | | | | | 19 | | | | 21,624 | |
4.30%, 3/15/45 | | | | | | | 14 | | | | 14,996 | |
Virginia Electric & Power Co.: | | | | | | | | | | | | |
3.50%, 3/15/27 | | | | | | | 49 | | | | 50,384 | |
4.45%, 2/15/44 | | | | | | | 7 | | | | 7,648 | |
4.20%, 5/15/45 | | | | | | | 20 | | | | 20,997 | |
| | | | | | | | | | | | |
| | | | | | | | | | | | 173,878 | |
See Notes to Financial Statements.
| | | | | | |
| | | BLACKROCK SERIES FUND, INC. | | JUNE 30, 2017 | | 107 |
| | | | |
| Schedule of Investments (continued) | | | BlackRock Total Return Portfolio | |
| | | | |
| | | | | | | | | | | | |
| Corporate Bonds | | Par (000) | | | Value | |
Oil, Gas & Consumable Fuels — 2.2% | | | | | | | | | | | | |
Anadarko Petroleum Corp.: | | | | | | | | | | | | |
7.95%, 6/15/39 | | | USD | | | | 18 | | | $ | 22,659 | |
4.50%, 7/15/44 | | | | | | | 8 | | | | 7,331 | |
Apache Corp., 4.25%, 1/15/44 | | | | | | | 16 | | | | 14,987 | |
Canadian Natural Resources Ltd.: | | | | | | | | | | | | |
2.95%, 1/15/23 | | | | | | | 50 | | | | 49,602 | |
3.85%, 6/01/27 | | | | | | | 70 | | | | 69,433 | |
Cenovus Energy, Inc., 4.25%, 4/15/27 (c) | | | | | | | 70 | | | | 66,684 | |
Devon Energy Corp.: | | | | | | | | | | | | |
3.25%, 5/15/22 | | | | | | | 26 | | | | 25,840 | |
5.85%, 12/15/25 | | | | | | | 34 | | | | 38,637 | |
5.60%, 7/15/41 | | | | | | | 38 | | | | 39,466 | |
Enbridge, Inc.: | | | | | | | | | | | | |
2.90%, 7/15/22 | | | | | | | 35 | | | | 34,930 | |
3.70%, 7/15/27 | | | | | | | 25 | | | | 24,981 | |
Endeavor Energy Resources LP/EER Finance, Inc., 7.00%, 8/15/21 (c) | | | | | | | 35 | | | | 36,225 | |
Energy Transfer LP, 6.13%, 12/15/45 | | | | | | | 35 | | | | 37,883 | |
Enterprise Products Operating LLC: | | | | | | | | | | | | |
5.10%, 2/15/45 | | | | | | | 8 | | | | 8,785 | |
4.90%, 5/15/46 | | | | | | | 32 | | | | 34,411 | |
EOG Resources, Inc.: | | | | | | | | | | | | |
4.15%, 1/15/26 | | | | | | | 14 | | | | 14,710 | |
3.90%, 4/01/35 | | | | | | | 10 | | | | 9,698 | |
Exxon Mobil Corp.: | | | | | | | | | | | | |
1.82%, 3/15/19 | | | | | | | 57 | | | | 57,225 | |
4.11%, 3/01/46 | | | | | | | 20 | | | | 21,098 | |
Halcon Resources Corp., 12.00%, 2/15/22 (c) | | | | | | | 10 | | | | 11,300 | |
Hess Corp., 4.30%, 4/01/27 | | | | | | | 73 | | | | 71,305 | |
Kinder Morgan Energy Partners LP, 3.50%, 3/01/21 | | | | | | | 50 | | | | 51,199 | |
Kinder Morgan, Inc.: | | | | | | | | | | | | |
3.05%, 12/01/19 | | | | | | | 21 | | | | 21,365 | |
5.05%, 2/15/46 | | | | | | | 20 | | | | 20,084 | |
MPLX LP, 5.20%, 3/01/47 | | | | | | | 12 | | | | 12,358 | |
NGPL PipeCo LLC, 7.12%, 12/15/17 (c) | | | | | | | 35 | | | | 35,656 | |
Noble Energy, Inc., 5.05%, 11/15/44 | | | | | | | 17 | | | | 17,459 | |
Petro-Canada, 6.80%, 5/15/38 (g) | | | | | | | 20 | | | | 26,065 | |
Pioneer Natural Resources Co., 4.45%, 1/15/26 | | | | | | | 10 | | | | 10,515 | |
Plains All American Pipeline LP/PAA Finance Corp., 4.65%, 10/15/25 | | | | | | | 20 | | | | 20,500 | |
Resolute Energy Corp., 8.50%, 5/01/20 | | | | | | | 35 | | | | 34,825 | |
Sabine Pass Liquefaction LLC, 4.20%, 3/15/28 (c) | | | | | | | 26 | | | | 26,268 | |
Spectra Energy Partners LP, 4.50%, 3/15/45 | | | | | | | 30 | | | | 29,567 | |
Sunoco Logistics Partners Operations LP: | | | | | | | | | | | | |
3.90%, 7/15/26 | | | | | | | 7 | | | | 6,868 | |
5.35%, 5/15/45 | | | | | | | 10 | | | | 9,802 | |
Tesoro Logistics LP/Tesoro Logistics Finance Corp., 5.50%, 10/15/19 | | | | | | | 35 | | | | 36,925 | |
TransCanada PipeLines Ltd.: | | | | | | | | | | | | |
1.88%, 1/12/18 | | | | | | | 18 | | | | 18,024 | |
2.50%, 8/01/22 | | | | | | | 26 | | | | 25,968 | |
Western Refining Logistics LP/WNRL Finance Corp., 7.50%, 2/15/23 | | | | | | | 35 | | | | 37,713 | |
Williams Partners LP, 4.00%, 9/15/25 | | | | | | | 50 | | | | 50,920 | |
| | | | | | | | | | | | |
| | | | | | | | | | | | 1,189,271 | |
Paper & Forest Products — 0.1% | | | | | | | | | | | | |
Georgia-Pacific LLC, 7.38%, 12/01/25 | | | | | | | 23 | | | | 29,264 | |
| | | | | | | | | | | | |
| Corporate Bonds | | Par (000) | | | Value | |
Pharmaceuticals — 0.8% | | | | | | | | | | | | |
Allergan Funding SCS: | | | | | | | | | | | | |
2.35%, 3/12/18 | | | USD | | | | 132 | | | $ | 132,551 | |
3.00%, 3/12/20 | | | | | | | 54 | | | | 55,146 | |
3.80%, 3/15/25 | | | | | | | 114 | | | | 117,916 | |
4.55%, 3/15/35 | | | | | | | 23 | | | | 24,549 | |
4.75%, 3/15/45 | | | | | | | 24 | | | | 25,907 | |
Mylan NV, 5.25%, 6/15/46 | | | | | | | 12 | | | | 13,127 | |
Pfizer, Inc., 4.00%, 12/15/36 | | | | | | | 34 | | | | 35,919 | |
Teva Pharmaceutical Finance Co. BV, 3.65%, 11/10/21 | | | | | | | 17 | | | | 17,555 | |
Teva Pharmaceutical Finance Netherlands III BV, 2.80%, 7/21/23 | | | | | | | 25 | | | | 24,316 | |
| | | | | | | | | | | | |
| | | | | | | | | | | | 446,986 | |
Road & Rail — 0.3% | | | | | | | | | | | | |
Burlington Northern Santa Fe LLC: | | | | | | | | | | | | |
4.15%, 4/01/45 | | | | | | | 4 | | | | 4,181 | |
4.70%, 9/01/45 | | | | | | | 10 | | | | 11,262 | |
4.13%, 6/15/47 | | | | | | | 20 | | | | 21,031 | |
CSX Corp., 4.25%, 11/01/66 | | | | | | | 13 | | | | 12,815 | |
Norfolk Southern Corp., 6.00%, 5/23/2111 | | | | | | | 11 | | | | 13,245 | |
Penske Truck Leasing Co. LP/PTL Finance Corp., 3.40%, 11/15/26 (c) | | | | | | | 50 | | | | 49,133 | |
Union Pacific Corp., 3.88%, 2/01/55 | | | | | | | 20 | | | | 19,305 | |
Union Pacific Railroad Co. Pass-Through Trust, Series 2014-1, 3.23%, 5/14/26 | | | | | | | 51 | | | | 51,796 | |
| | | | | | | | | | | | |
| | | | | | | | | | | | 182,768 | |
Semiconductors & Semiconductor Equipment — 1.5% | | | | | | | | | |
Analog Devices, Inc.: | | | | | | | | | | | | |
3.90%, 12/15/25 | | | | | | | 7 | | | | 7,276 | |
3.50%, 12/05/26 | | | | | | | 50 | | | | 50,389 | |
5.30%, 12/15/45 | | | | | | | 7 | | | | 8,018 | |
Applied Materials, Inc.: | | | | | | | | | | | | |
3.30%, 4/01/27 | | | | | | | 37 | | | | 37,601 | |
4.35%, 4/01/47 | | | | | | | 10 | | | | 10,614 | |
Broadcom Corp./Broadcom Cayman Finance Ltd.: | | | | | | | | | | | | |
2.38%, 1/15/20 (c) | | | | | | | 188 | | | | 188,273 | |
3.00%, 1/15/22 (c) | | | | | | | 246 | | | | 248,199 | |
3.63%, 1/15/24 (c) | | | | | | | 128 | | | | 130,944 | |
Lam Research Corp.: | | | | | | | | | | | | |
2.75%, 3/15/20 | | | | | | | 19 | | | | 19,242 | |
2.80%, 6/15/21 | | | | | | | 27 | | | | 27,389 | |
QUALCOMM, Inc.: | | | | | | | | | | | | |
2.60%, 1/30/23 | | | | | | | 30 | | | | 29,891 | |
4.80%, 5/20/45 | | | | | | | 13 | | | | 14,268 | |
Xilinx, Inc., 2.95%, 6/01/24 | | | | | | | 25 | | | | 25,067 | |
| | | | | | | | | | | | |
| | | | | | | | | | | | 797,171 | |
Software — 0.8% | | | | | | | | | | | | |
Autodesk, Inc., 3.50%, 6/15/27 | | | | | | | 65 | | | | 63,920 | |
Microsoft Corp.: | | | | | | | | | | | | |
3.50%, 2/12/35 | | | | | | | 27 | | | | 27,223 | |
3.45%, 8/08/36 | | | | | | | 40 | | | | 40,025 | |
3.70%, 8/08/46 | | | | | | | 102 | | | | 100,933 | |
4.25%, 2/06/47 | | | | | | | 100 | | | | 108,265 | |
See Notes to Financial Statements.
| | | | | | |
| 108 | | BLACKROCK SERIES FUND, INC. | | JUNE 30, 2017 | | |
| | | | |
| Schedule of Investments (continued) | | | BlackRock Total Return Portfolio | |
| | | | |
| | | | | | | | | | | | |
| Corporate Bonds | | | | | Par (000) | | | Value | |
Software (continued) | | | | | | | | | | | | |
Oracle Corp.: | | | | | | | | | | | | |
3.25%, 5/15/30 | | | USD | | | | 14 | | | $ | 14,068 | |
3.90%, 5/15/35 | | | | | | | 13 | | | | 13,396 | |
4.00%, 7/15/46 | | | | | | | 35 | | | | 35,346 | |
4.38%, 5/15/55 | | | | | | | 9 | | | | 9,451 | |
| | | | | | | | | | | | |
| | | | | | | | | | | | 412,627 | |
Technology Hardware, Storage & Peripherals — 1.0% | |
Apple Inc.: | | | | | | | | | | | | |
3.00%, 2/09/24 | | | | | | | 48 | | | | 48,728 | |
2.85%, 5/11/24 | | | | | | | 175 | | | | 175,848 | |
3.45%, 2/09/45 | | | | | | | 12 | | | | 11,276 | |
4.65%, 2/23/46 | | | | | | | 116 | | | | 130,027 | |
Dell International LLC/EMC Corp.: | | | | | | | | | | | | |
5.45%, 6/15/23 (c) | | | | | | | 52 | | | | 56,429 | |
8.35%, 7/15/46 (c) | | | | | | | 30 | | | | 38,717 | |
Hewlett Packard Enterprise Co.: | | | | | | | | | | | | |
2.85%, 10/05/18 | | | | | | | 65 | | | | 65,556 | |
3.60%, 10/15/20 | | | | | | | 28 | | | | 28,871 | |
HP, Inc., 3.75%, 12/01/20 | | | | | | | 6 | | | | 6,280 | |
| | | | | | | | | | | | |
| | | | | | | | | | | | 561,732 | |
Tobacco — 0.1% | | | | | | | | | | | | |
Reynolds American, Inc.: | | | | | | | | | | | | |
2.30%, 6/12/18 | | | | | | | 22 | | | | 22,096 | |
3.25%, 6/12/20 | | | | | | | 10 | | | | 10,295 | |
| | | | | | | | | | | | |
| | | | | | | | | | | | 32,391 | |
Trading Companies & Distributors — 0.4% | |
Air Lease Corp.: | | | | | | | | | | | | |
2.63%, 7/01/22 | | | | | | | 70 | | | | 69,380 | |
3.00%, 9/15/23 | | | | | | | 95 | | | | 94,453 | |
3.63%, 4/01/27 | | | | | | | 36 | | | | 36,003 | |
GATX Corp.: | | | | | | | | | | | | |
2.60%, 3/30/20 | | | | | | | 26 | | | | 26,269 | |
3.85%, 3/30/27 | | | | | | | 16 | | | | 16,103 | |
| | | | | | | | | | | | |
| | | | | | | | | | | | 242,208 | |
Wireless Telecommunication Services — 0.1% | |
Rogers Communications, Inc., 5.00%, 3/15/44 | | | | | | | 8 | | | | 9,049 | |
Vodafone Group PLC, 4.38%, 2/19/43 | | | | | | | 20 | | | | 19,750 | |
| | | | | | | | | | | | |
| | | | | | | | | | | | 28,799 | |
Total Corporate Bonds — 28.8% | | | | | | | | | | | 15,749,695 | |
| | | | | | | | | | | | |
| Floating Rate Loan Interests (a) | | | | | | | | | |
Capital Markets — 0.7% | | | | | | | | | | | | |
LSTAR Securities Financing Vehicle: | | | | | | | | | | | | |
3.50%, 5/10/25 (b) | | | | | | | 197 | | | | 195,573 | |
2.00%, 6/16/25 | | | | | | | 190 | | | | 188,138 | |
Total Floating Rate Loan Interests — 0.7% | | | | | | | | | | | 383,711 | |
| | | | | | | | | | | | |
| Foreign Agency Obligations | | | | | | | | | |
Argentina — 0.0% | | | | | | | | | | | | |
Petrobras Argentina SA, 7.38%, 7/21/23 (c) | | | | | | | 10 | | | | 10,547 | |
YPF SA: | | | | | | | | | | | | |
8.88%, 12/19/18 (c) | | | | | | | 13 | | | | 13,928 | |
8.50%, 3/23/21 (c) | | | | | | | 2 | | | | 2,225 | |
| | | | | | | | | | | | |
| | | | | | | | | | | | 26,700 | |
| | | | | | | | | | | | |
| Foreign Agency Obligations | | | | | Par (000) | | | Value | |
Brazil — 0.3% | | | | | | | | | | | | |
Petrobras Global Finance BV: | | | | | | | | | | | | |
5.75%, 1/20/20 | | | USD | | | | 4 | | | $ | 4,151 | |
4.88%, 3/17/20 | | | | | | | 4 | | | | 4,080 | |
5.38%, 1/27/21 | | | | | | | 49 | | | | 49,818 | |
8.38%, 5/23/21 | | | | | | | 66 | | | | 73,879 | |
6.13%, 1/17/22 | | | | | | | 4 | | | | 4,126 | |
8.75%, 5/23/26 | | | | | | | 2 | | | | 2,300 | |
7.38%, 1/17/27 | | | | | | | 5 | | | | 5,290 | |
| | | | | | | | | | | | |
| | | | | | | | | | | | 143,644 | |
Mexico — 0.1% | | | | | | | | | | | | |
Petroleos Mexicanos, 6.50%, 3/13/27 (c) | | | | | | | 47 | | | | 50,490 | |
Total Foreign Agency Obligations — 0.4% | | | | | | | | | | | 220,834 | |
| | | | | | | | | | | | |
| Foreign Government Obligations | | | | | | | | | |
Argentina — 0.2% | | | | | | | | | | | | |
Republic of Argentina: | | | | | | | | | | | | |
5.63%, 1/26/22 | | | | | | | 59 | | | | 60,416 | |
7.82%, 12/31/33 | | | EUR | | | | 19 | | | | 22,577 | |
7.13%, 6/28/2117 | | | USD | | | | 16 | | | | 14,520 | |
| | | | | | | | | | | | |
| | | | | | | | | | | | 97,513 | |
Colombia — 0.4% | | | | | | | | | | | | |
Republic of Colombia, 4.00%, 2/26/24 | | | | | | | 200 | | | | 207,600 | |
Hungary — 0.1% | | | | | | | | | | | | |
Republic of Hungary, 5.38%, 3/25/24 | | | | | | | 50 | | | | 56,286 | |
Indonesia — 0.2% | | | | | | | | | | | | |
Republic of Indonesia: | | | | | | | | | | | | |
8.38%, 3/15/24 | | | IDR | | | | 148,000 | | | | 12,056 | |
8.38%, 9/15/26 | | | | | | | 797,000 | | | | 65,961 | |
7.00%, 5/15/27 | | | | | | | 405,000 | | | | 30,768 | |
9.00%, 3/15/29 | | | | | | | 49,000 | | | | 4,187 | |
| | | | | | | | | | | | |
| | | | | | | | | | | | 112,972 | |
Lebanon — 0.0% | | | | | | | | | | | | |
Lebanese Republic, 6.85%, 3/23/27 | | | USD | | | | 28 | | | | 28,190 | |
Mexico — 1.9% | | | | | | | | | | | | |
United Mexican States: | | | | | | | | | | | | |
Series M, 4.75%, 6/14/18 | | | MXN | | | | 12 | | | | 64,798 | |
Series M, 5.00%, 12/11/19 | | | | | | | 114 | | | | 605,316 | |
4.15%, 3/28/27 | | | USD | | | | 343 | | | | 355,177 | |
| | | | | | | | | | | | |
| | | | | | | | | | | | 1,025,291 | |
Russia — 1.0% | | | | | | | | | | | | |
Russian Federation: | | | | | | | | | | | | |
7.50%, 8/18/21 | | | RUB | | | | 11,660 | | | | 195,239 | |
7.40%, 12/07/22 | | | | | | | 2,675 | | | | 44,586 | |
7.75%, 9/16/26 | | | | | | | 3,609 | | | | 61,257 | |
8.15%, 2/03/27 | | | | | | | 8,658 | | | | 152,739 | |
7.05%, 1/19/28 | | | | | | | 5,142 | | | | 83,048 | |
| | | | | | | | | | | | |
| | | | | | | | | | | | 536,869 | |
South Africa — 0.2% | | | | | | | | | | | | |
Republic of South Africa, 6.25%, 3/31/36 | | | ZAR | | | | 1,656 | | | | 89,358 | |
See Notes to Financial Statements.
| | | | | | |
| | | BLACKROCK SERIES FUND, INC. | | JUNE 30, 2017 | | 109 |
| | | | |
| Schedule of Investments (continued) | | | BlackRock Total Return Portfolio | |
| | | | | | | | | | | | |
| Foreign Government Obligations | | Par
(000) | | | Value | |
Turkey — 0.6% | | | | | | | | | | | | |
Republic of Turkey: | | | | | | | | | | | | |
10.50%, 1/15/20 | | | TRY | | | | 150 | | | $ | 42,573 | |
7.00%, 6/05/20 | | | USD | | | | 39 | | | | 42,644 | |
9.20%, 9/22/21 | | | TRY | | | | 210 | | | | 57,089 | |
11.00%, 3/02/22 | | | | | | | 430 | | | | 124,535 | |
8.80%, 9/27/23 | | | | | | | 110 | | | | 29,130 | |
7.38%, 2/05/25 | | | USD | | | | 33 | | | | 38,215 | |
| | | | | | | | | | | | |
| | | | | | | | | | | | 334,186 | |
Uruguay — 0.1% | | | | | | | | | | | | |
Republic of Uruguay, 4.38%, 10/27/27 | | | | | | | 50 | | | | 53,125 | |
Total Foreign Government Obligations — 4.7% | | | | | | | | | | | 2,541,390 | |
| | | | | | | | | | | | |
| Investment Companies — 1.0% | | Shares | | | | | | | |
iShares iBoxx $ High Yield Corporate Bond ETF (h) | | | | | | | 6,240 | | | | 551,554 | |
| | | | | | | | | | | | |
| Non-Agency Mortgage-Backed Securities | | Par
(000) | | | | |
Collateralized Mortgage Obligations — 2.7% | | | | | | | | | | | | |
American Home Mortgage Assets Trust: | | | | | | | | | | | | |
Series 2006-3, Class 2A11,
1.67%, 10/25/46 (a) | | | USD | | | | 42 | | | | 35,487 | |
Series 2006-5, Class A1,
1.65%, 11/25/46 (a) | | | | | | | 42 | | | | 22,452 | |
APS Resecuritization Trust: | | | | | | | | | | | | |
Series 2016-3, Class 3A,
3.84%, 9/27/46 (a)(b)(c) | | | | | | | 90 | | | | 90,998 | |
Series 2016-3, Class 4A,
3.59%, 4/27/47 (a)(b)(c) | | | | | | | 85 | | | | 85,564 | |
Banc of America Funding Trust, Series 2016-R2, Class 1A1, 4.70%, 5/01/33 (a)(b)(c) | | | | | | | 96 | | | | 97,778 | |
Bear Stearns ALT-A Trust II, Series 2007-1, Class 1A1, 3.31%, 9/25/47 (a) | | | | | | | 32 | | | | 22,980 | |
Bear Stearns Mortgage Funding Trust: | | | | | | | | | | | | |
Series 2007-AR2, Class A1,
1.19%, 3/25/37 (a) | | | | | | | 9 | | | | 7,568 | |
Series 2007-AR4, Class 1A1,
1.22%, 9/25/47 (a) | | | | | | | 31 | | | | 27,183 | |
Countrywide Alternative Loan Trust: | | | | | | | | | | | | |
Series 2005-72, Class A3,
1.52%, 1/25/36 (a) | | | | | | | 13 | | | | 11,061 | |
Series 2006-15CB, Class A1,
6.50%, 6/25/36 | | | | | | | 6 | | | | 4,449 | |
Series 2006-OA14, Class 1A1,
2.46%, 11/25/46 (a) | | | | | | | 63 | | | | 59,146 | |
Series 2006-OA6, Class 1A2,
1.43%, 7/25/46 (a) | | | | | | | 27 | | | | 25,791 | |
Series 2006-OA8, Class 1A1,
1.41%, 7/25/46 (a) | | | | | | | 10 | | | | 8,630 | |
Series 2007-OA3, Class 1A1,
1.36%, 4/25/47 (a) | | | | | | | 15 | | | | 12,903 | |
Countrywide Home Loan Mortgage Pass-Through Trust, Series 2006-OA4, Class A1, 1.69%, 4/25/46 (a) | | | | | | | 87 | | | | 45,058 | |
Credit Suisse Commercial Mortgage Trust, Series 2014-9R, Class 3A1, 1.83%, 11/27/37 (a)(c) | | | | | | | 35 | | | | 33,573 | |
Credit Suisse Mortgage Capital Certificates: | | | | | | | | | | | | |
Series 2013-5R, Class 1A6, 1.24%, 2/27/36 (a)(c) | | | | | | | 25 | | | | 22,432 | |
Series 2014-11R, Class 16A1, 3.17%, 9/27/47 (a)(c) | | | | | | | 40 | | | | 39,661 | |
| | | | | | | | | | | | |
| Non-Agency Mortgage-Backed Securities | | Par
(000) | | | Value | |
Deutsche Alt-A Securities Mortgage Loan Trust, Series 2007-RMP1, Class A2, 1.17%, 12/25/36 (a) | | | USD | | | | 81 | | | $ | 70,275 | |
GreenPoint Mortgage Funding Trust, Series 2006-AR2, Class 4A1, 2.73%, 3/25/36 (a) | | | | | | | 8 | | | | 6,837 | |
GSMPS Mortgage Loan Trust: | | | | | | | | | | | | |
Series 2005-RP1, Class 1AF,
1.57%, 1/25/35 (a)(c) | | | | | | | 12 | | | | 10,524 | |
Series 2005-RP2, Class 1AF,
1.57%, 3/25/35 (a)(c) | | | | | | | 14 | | | | 12,568 | |
Series 2006-RP1, Class 1AF1,
1.37%, 1/25/36 (a)(c) | | | | | | | 10 | | | | 8,837 | |
Impac Secured Assets CMN Owner Trust, Series 2004-3, Class 1A4, 1.82%, 11/25/34 (a) | | | | | | | 11 | | | | 11,391 | |
JPMorgan Mortgage Trust, Series 2017-2, Class A6, 3.00%, 5/25/47 (a)(b)(c) | | | | | | | 99 | | | | 100,345 | |
LSTAR Securities Investment Ltd.: | | | | | | | | | | | | |
Series 2016-3, Class A, 3.05%, 9/01/21 (a)(c) | | | | | | | 64 | | | | 63,529 | |
Series 2017-2, Class A1, 3.05%, 2/01/22 (a)(b)(c) | | | | | | | 93 | | | | 92,833 | |
Series 2017-3, Class A1, 3.05%, 4/01/19 (a)(b)(c) | | | | | | | 97 | | | | 96,333 | |
LSTAR Securities Investment Trust, Series 2016-5, Class A1, 3.05%, 11/01/21 (a)(b)(c) | | | | | | | 68 | | | | 68,698 | |
RALI Trust: | | | | | | | | | | | | |
Series 2006-QO6, Class A2, 1.45%, 6/25/46 (a) | | | | | | | 35 | | | | 15,538 | |
Series 2007-QH6, Class A1, 1.41%, 7/25/37 (a) | | | | | | | 15 | | | | 13,389 | |
Series 2007-QH9, Class A1, 2.09%, 11/25/37 (a) | | | | | | | 31 | | | | 25,457 | |
Structured Adjustable Rate Mortgage Loan Trust, Series 2007-3, Class 3A1, 3.50%, 4/25/47 (a) | | | | | | | 162 | | | | 126,650 | |
Structured Asset Mortgage Investments II Trust, Series 2006-AR4, Class 3A1, 1.21%, 6/25/36 (a) | | | | | | | 28 | | | | 25,422 | |
Structured Asset Securities Corp. Mortgage Loan Trust, Series 2006-RF4, Class 2A1, 6.00%, 10/25/36 (c) | | | | | | | 35 | | | | 30,852 | |
WaMu Mortgage Pass-Through Certificates Trust, Series 2006-AR15, Class 2A, 2.08%, 11/25/46 (a) | | | | | | | 9 | | | | 8,362 | |
Wells Fargo Mortgage-Backed Securities Trust, Series 2005-AR16, Class CRB1, 3.28%, 10/25/35 (a) | | | | | | | 34 | | | | 26,610 | |
| | | | | | | | | | | | |
| | | | | | | | | | | | 1,467,164 | |
Commercial Mortgage-Backed Securities — 3.9% | | | | | | | | | | | | |
Banc of America Commercial Mortgage Trust: Series 2007-1, Class AMFX, 5.48%, 1/15/49 (a) | | | | | | | 5 | | | | 5,469 | |
Series 2007-5, Class AM, 5.77%, 2/10/51 (a) | | | | | | | 40 | | | | 40,444 | |
Bayview Commercial Asset Trust: | | | | | | | | | | | | |
Series 2005-4A, Class A1, 1.52%, 1/25/36 (a)(c) | | | | | | | 19 | | | | 17,255 | |
Series 2006-3A, Class A2, 1.52%, 10/25/36 (a)(c) | | | | | | | 27 | | | | 24,729 | |
Series 2007-4A, Class A1, 1.67%, 9/25/37 (a)(c) | | | | | | | 46 | | | | 40,396 | |
See Notes to Financial Statements.
| | | | | | |
| 110 | | BLACKROCK SERIES FUND, INC. | | JUNE 30, 2017 | | |
| | | | |
| Schedule of Investments (continued) | | | BlackRock Total Return Portfolio | |
| | | | | | | | | | | | |
| Non-Agency Mortgage-Backed Securities | | Par
(000) | | | Value | |
Commercial Mortgage-Backed Securities (continued) | | | | | | | | | |
BHMS Mortgage Trust, Series 2014-ATLS, Class AFL, 2.49%, 7/05/33 (a)(c) | | | USD | | | | 102 | | | $ | 101,500 | |
BWAY Mortgage Trust: | | | | | | | | | | | | |
Series 2013-1515, Class A2, 3.45%, 3/10/33 (c) | | | | | | | 230 | | | | 235,961 | |
Series 2013-1515, Class C, 3.45%, 3/10/33 (c) | | | | | | | 100 | | | | 99,703 | |
BXP Trust, Series 2017-GM, Class D,
3.42%, 6/13/39 (a)(b)(c) | | | | | | | 50 | | | | 48,451 | |
Chicago Skyscraper Trust, Series 2017-SKY, Class E, 4.46%, 2/15/30 (a)(c) | | | | | | | 100 | | | | 101,252 | |
Citigroup Commercial Mortgage Trust: | | | | | | | | | | | | |
Series 2016-P3, Class C, 5.00%, 4/15/49 (a) | | | | | | | 10 | | | | 10,546 | |
Series 2017-P7, Class A4, 3.71%, 4/14/50 | | | | | | | 10 | | | | 10,439 | |
Citigroup/Deutsche Bank Commercial Mortgage Trust: | | | | | | | | | | | | |
Series 2007-CD5, Class AMA, 6.51%, 11/15/44 (a) | | | | | | | 46 | | | | 46,385 | |
Series 2017-CD3, Class A4, 3.63%, 2/10/50 | | | | | | | 10 | | | | 10,410 | |
Commercial Mortgage Pass-Through Certificates: | | | | | | | | | | | | |
Series 2007-C9, Class AJFL,
1.68%, 12/10/49 (a)(c) | | | | | | | 14 | | | | 14,384 | |
Series 2014-CR14, Class A4, 4.24%, 2/10/47 (a) | | | | | | | 10 | | | | 10,745 | |
Series 2014-CR16, Class A4, 4.05%, 4/10/47 | | | | | | | 29 | | | | 30,892 | |
Series 2014-CR17, Class A5, 3.98%, 5/10/47 | | | | | | | 47 | | | | 49,872 | |
Series 2014-CR18, Class A4, 3.55%, 5/15/24 | | | | | | | 10 | | | | 10,332 | |
Series 2014-CR19, Class A5, 3.80%, 8/10/24 | | | | | | | 10 | | | | 10,501 | |
Series 2015-CR23, Class CMD,
3.81%, 5/10/48 (a)(c) | | | | | | | 100 | | | | 97,857 | |
Series 2015-CR25, Class C, 4.70%, 8/10/48 (a) | | | | | | | 20 | | | | 20,151 | |
Countrywide Commercial Mortgage Trust, Series 2007-MF1, Class A, 6.48%, 11/12/43 (a)(c) | | | | | | | 3 | | | | 2,608 | |
Credit Suisse Commercial Mortgage Trust, Series 2015-DEAL, Class A, 2.48%, 4/15/29 (a)(c) | | | | | | | 94 | | | | 94,573 | |
Credit Suisse Mortgage Capital Certificates, Series 17-1, Class A, 4.50%, 3/25/21 (c) | | | | | | | 133 | | | | 132,694 | |
CSAIL Commercial Mortgage Trust, Series 2017-C8, Class A4, 3.39%, 6/15/50 (b) | | | | | | | 10 | | | | 10,204 | |
FREMF Mortgage Trust: | | | | | | | | | | | | |
Series 2017-K64, Class B, 4.12%, 3/25/27 (a)(c) | | | | | | | 10 | | | | 10,066 | |
Series 2017-K725, Class B, 3.88%, 2/25/24 (a)(c) | | | | | | | 20 | | | | 19,993 | |
GS Mortgage Securities Corp. II, Series 2013-KING, Class E, 3.55%, 12/10/27 (a)(c) | | | | | | | 180 | | | | 179,123 | |
GS Mortgage Securities Trust: | | | | | | | | | | | | |
Series 2014-GC24, Class A5, 3.93%, 9/10/47 | | | | | | | 10 | | | | 10,587 | |
Series 2015-GC32, Class C, 4.56%, 7/10/25 (a) | | | | | | | 10 | | | | 9,922 | |
| | | | | | | | | | | | |
| Non-Agency Mortgage-Backed Securities | | Par
(000) | | | Value | |
Commercial Mortgage-Backed Securities (continued) | | | | | | | | | |
JPMorgan Chase Commercial Mortgage Securities Trust: | | | | | | | | | | | | |
Series 2014-C21, Class A5,
3.77%, 6/15/24 | | | USD | | | | 10 | | | $ | 10,511 | |
Series 2015-JP1, Class C,
4.90%, 1/15/49 (a) | | | | | | | 20 | | | | 20,949 | |
Series 2015-JP1, Class D,
4.40%, 1/15/49 (a) | | | | | | | 10 | | | | 9,204 | |
Series 2015-SGP, Class A,
2.86%, 7/15/36 (a)(c) | | | | | | | 36 | | | | 36,213 | |
Series 2016-NINE, Class A,
2.85%, 10/06/38 (a)(c) | | | | | | | 100 | | | | 98,053 | |
Morgan Stanley Bank of America Merrill Lynch Trust: | | | | | | | | | | | | |
Series 2014-C16, Class A5,
3.89%, 6/15/47 | | | | | | | 20 | | | | 21,156 | |
Series 2015-C25, Class D,
3.07%, 10/15/48 | | | | | | | 10 | | | | 8,017 | |
Series 2015-C26, Class D,
3.06%, 10/15/48 (c) | | | | | | | 140 | | | | 109,791 | |
Morgan Stanley Re-REMIC Trust, Series 2012-XA, Class A, 2.00%, 7/27/49 (c) | | | | | | | 4 | | | | 3,791 | |
Resource Capital Corp. Ltd.: | | | | | | | | | | | | |
Series 2017-CRE5, Class A,
1.89%, 7/15/34 (a)(c) | | | | | | | 10 | | | | 10,000 | |
Series 2017-CRE5, Class B, 3.09%, 7/15/34 (a)(b)(c) | | | | | | | 10 | | | | 10,000 | |
STRIPs Ltd., Series 2012-1A, Class B, 0.50%, 12/25/44 (b)(c) | | | | | | | 59 | | | | 57,887 | |
Velocity Commercial Capital Loan Trust, Series 2016-2, Class AFL, 3.02%, 10/25/46 (a) | | | | | | | 89 | | | | 89,973 | |
VNDO Trust, Series 2016-350P, Class E, 4.03%, 1/10/35 (a)(c) | | | | | | | 100 | | | | 93,895 | |
Wells Fargo Commercial Mortgage Trust: | | | | | | | | | | | | |
Series 2015-C31, Class D,
3.85%, 11/15/48 | | | | | | | 10 | | | | 7,606 | |
Series 2017-C38, Class A5,
3.45%, 7/15/50 | | | | | | | 10 | | | | 10,231 | |
WF-RBS Commercial Mortgage Trust: | | | | | | | | | | | | |
Series 2014-C21, Class A5,
3.68%, 7/15/24 | | | | | | | 10 | | | | 10,426 | |
Series 2014-C22, Class C,
3.91%, 9/15/24 (a) | | | | | | | 20 | | | | 18,868 | |
| | | | | | | | | | | | |
| | | | | | | | | | | | 2,134,015 | |
Interest Only Commercial Mortgage-Backed Securities — 0.4% | | | | | |
BB-UBS Trust, Series 2012-SHOW, Class XA, 0.73%, 11/05/36 (a)(c) | | | | | | | 1,760 | | | | 70,582 | |
Commercial Mortgage Pass-Through Certificates: | | | | | | | | | | | | |
Series 2015-3BP, Class XA,
0.17%, 2/10/35 (a)(c) | | | | | | | 939 | | | | 6,432 | |
Series 2016-DC2, Class XA,
1.22%, 2/10/49 (a) | | | | | | | 158 | | | | 10,648 | |
JPMDB Commercial Mortgage Securities Trust, Series 2016-C4, Class XC,
0.75%, 12/15/49 (a)(b)(c) | | | | | | | 1,800 | | | | 91,260 | |
Morgan Stanley Bank of America Merrill Lynch Trust, Series 2014-C19, Class XF, 1.34%, 12/15/47 (a)(b)(c) | | | | | | | 100 | | | | 6,346 | |
Morgan Stanley Capital I Trust, Series 2017-H1, Class XD, 2.20%, 6/15/50 (a)(c) | | | | | | | 100 | | | | 16,088 | |
See Notes to Financial Statements.
| | | | | | |
| | | BLACKROCK SERIES FUND, INC. | | JUNE 30, 2017 | | 111 |
| | | | |
| Schedule of Investments (continued) | | | BlackRock Total Return Portfolio | |
| | | | |
| | | | | | | | | | | | |
| Non-Agency Mortgage-Backed Securities | | | Par (000) | | | Value | |
Interest Only Commercial Mortgage-Backed Securities (continued) | |
One Market Plaza Trust: | | | | | | | | | | | | |
Series 2017-1MKT, Class XCP, 0.22%, 2/10/32 (a)(c) | | | USD | | | | 1,000 | | | $ | 6,300 | |
| | | |
Series 2017-1MKT, Class XNCP, 0.00%, 2/10/32 (a)(c) | | | | | | | 200 | | | | — | |
| | | |
| | | | | | | | | | | | |
| | | | | | | | | | | | 207,656 | |
Total Non-Agency Mortgage-Backed Securities — 7.0% | | | | 3,808,835 | |
| | | | | | | | | | | | |
| Other Interests (i) | | | | | Beneficial
Interest
(000) | | | | |
Capital Markets — 0.0% | | | | | | | | | | | | |
Lehman Brothers Holdings Capital
Trust VII (b)(e)(f) | | | | | | | 55 | | | | — | |
Lehman Brothers Holdings, Inc. (b)(e)(f) | | | | | | | 325 | | | | — | |
Total Other Interests — 0.0% | | | | | | | | | | | — | |
| | | | | | | | | | | | |
| Preferred Securities | | | | | | | | | |
| Capital Trusts | | | | | Par (000) | | | | |
Capital Markets — 0.1% | | | | | | | | | | | | |
Bank of New York Mellon Corp.,
Series F, 4.63% (a)(j) | | | USD | | | | 54 | | | | 54,464 | |
State Street Corp., 2.25%, 6/15/37 (a) | | | | | | | 20 | | | | 18,413 | |
| | | | | | | | | | | | |
| | | | | | | | | | | | 72,877 | |
Multi-Utilities — 0.1% | | | | | | | | | | | | |
Dominion Energy, Inc., 2.58%, 7/01/20 | | | | | | | 40 | | | | 40,207 | |
Total Capital Trusts — 0.2% | | | | | | | | | | | 113,084 | |
| | | | | | | | | | | | |
| Trust Preferreds | | | | | Shares | | | | |
Banks — 0.3% | | | | | | | | | | | | |
Citigroup Capital XIII, 7.54%, 10/30/40 (a) | | | | | | | 6,917 | | | | 179,704 | |
Total Preferred Securities — 0.5% | | | | | | | | | | | 292,788 | |
| | | | | | | | | | | | |
| Taxable Municipal Bonds | | | | | Par (000) | | | | |
American Municipal Power, Inc. RB,
6.45%, 2/15/44 | | | USD | | | | 5 | | | | 6,536 | |
Arizona Health Facilities Authority RB, 1.58%, 1/01/37 (a) | | | | | | | 10 | | | | 8,793 | |
Bay Area Toll Authority RB: | | | | | | | | | | | | |
6.92%, 4/01/40 | | | | | | | 25 | | | | 35,103 | |
7.04%, 4/01/50 | | | | | | | 15 | | | | 22,952 | |
Board of Water Commissioners City & County of Denver RB, 5.00%, 9/15/47 | | | | | | | 20 | | | | 23,726 | |
Brooklyn Arena Local Development Corp. RB, 5.00%, 7/15/42 | | | | | | | 15 | | | | 16,799 | |
Buckeye Tobacco Settlement Financing Authority RB, 5.88%, 6/01/47 | | | | | | | 30 | | | | 29,216 | |
| | | | | | | | | | | | |
| Taxable Municipal Bonds | | | | | Par (000) | | | Value | |
California Health Facilities Financing Authority RB,
5.00%, 8/15/33 | | | USD | | | | 10 | | | $ | 11,760 | |
California Housing Finance Agency RB, 3.66%, 2/01/29 | | | | | | | 10 | | | | 10,041 | |
California State Public Works Board RB, 8.36%, 10/01/34 | | | | | | | 10 | | | | 14,991 | |
Central Texas Regional Mobility Authority RB, 5.00%, 1/01/45-1/01/46 | | | | | | | 20 | | | | 22,547 | |
Chesapeake Bay Bridge & Tunnel District RB, 5.00%, 7/01/51 | | | | | | | 10 | | | | 11,174 | |
Chesapeake Bay Bridge & Tunnel District RB AGM, 5.00%, 7/01/41 | | | | | | | 10 | | | | 11,500 | |
Chino Valley Unified School District GO, 5.25%, 8/01/47 | | | | | | | 10 | | | | 11,994 | |
City of Atlanta, GA Water & Wastewater Revenue RB, 5.00%, 11/01/37 | | | | | | | 10 | | | | 11,864 | |
City of Aurora, CO Water Revenue RB, 5.00%, 8/01/46 | | | | | | | 10 | | | | 11,658 | |
City of Houston, TX Combined Utility System Revenue RB, 5.00%, 11/15/35 | | | | | | | 10 | | | | 11,722 | |
City of Riverside, CA Electric Revenue RB, 7.61%, 10/01/40 | | | | | | | 10 | | | | 14,751 | |
Clark County School District GO, 5.00%, 6/15/23-6/15/27 | | | | | | | 20 | | | | 23,922 | |
Colorado Health Facilities Authority RB, 5.25%, 2/01/31 | | | | | | | 5 | | | | 5,279 | |
Commonwealth Financing Authority RB, 4.14%, 6/01/38 | | | | | | | 10 | | | | 10,353 | |
Commonwealth of Puerto Rico GO, 8.00%, 7/01/35 (e)(f) | | | | | | | 240 | | | | 145,500 | |
Connecticut State Health & Educational Facility Authority RB, 5.00%, 7/01/45 | | | | | | | 20 | | | | 22,221 | |
Contra Costa Community College District GO, 6.50%, 8/01/34 | | | | | | | 5 | | | | 6,454 | |
County of Clark Department of Aviation RB, 5.00%, 7/01/21 | | | | | | | 10 | | | | 11,309 | |
County of Clark, NV RB, 5.00%, 7/01/28 | | | | | | | 10 | | | | 12,507 | |
County of Guilford, NC GO, 5.00%, 5/01/25- 5/01/28 | | | | | | | 75 | | | | 94,117 | |
County of Miami-Dade, FL Aviation Revenue RB: | | | | | | | | | | | | |
2.50%, 10/01/24 | | | | | | | 15 | | | | 14,525 | |
5.00%, 10/01/38 | | | | | | | 15 | | | | 16,932 | |
County of Miami-Dade, FL GO, 5.00%, 7/01/35 | | | | | | | 5 | | | | 5,844 | |
County of Orange, FL Tourist Development Tax Revenue RB, 5.00%, 10/01/28 | | | | | | | 10 | | | | 12,569 | |
Dallas Area Rapid Transit RB, 5.00%, 12/01/41-12/01/46 | | | | | | | 20 | | | | 22,892 | |
District of Columbia GO, 5.00%, 6/01/34- 6/01/36 | | | | | | | 40 | | | | 47,556 | |
District of Columbia RB, 5.59%, 12/01/34 | | | | | | | 15 | | | | 18,548 | |
District of Columbia Water & Sewer Authority RB, 5.00%, 10/01/52 | | | | | | | 10 | | | | 11,529 | |
Dutchess County Local Development Corp. RB, 5.00%, 7/01/46 | | | | | | | 25 | | | | 27,957 | |
Eastern Municipal Water District Financing Authority RB, 5.00%, 7/01/47 | | | | | | | 10 | | | | 11,784 | |
Geisinger Authority RB, 5.00%, 2/15/45 | | | | | | | 10 | | | | 11,445 | |
Golden State Tobacco Securitization Corp. RB, 5.13%, 6/01/47 | | | | | | | 45 | | | | 44,827 | |
Grant County Public Utility District No. 2 RB, 4.58%, 1/01/40 | | | | | | | 5 | | | | 5,174 | |
See Notes to Financial Statements.
| | | | | | |
| 112 | | BLACKROCK SERIES FUND, INC. | | JUNE 30, 2017 | | |
| | | | |
| Schedule of Investments (continued) | | | BlackRock Total Return Portfolio | |
| | | | |
| | | | | | | | | | | | |
| Taxable Municipal Bonds | | | | | Par (000) | | | Value | |
Great Lakes Water Authority Water Supply System Revenue RB, 5.25%, 7/01/33 | | | USD | | | | 15 | | | $ | 18,119 | |
Health & Educational Facilities Authority of the State of Missouri RB: | | | | | | | | | | | | |
5.00%, 11/15/29 | | | | | | | 5 | | | | 5,858 | |
3.65%, 8/15/57 | | | | | | | 15 | | | | 14,819 | |
Horry County School District, SC GO, 5.00%, 3/01/25 | | | | | | | 5 | | | | 6,121 | |
Lone Star College System GO, 5.00%, 8/15/42 | | | | | | | 10 | | | | 11,688 | |
Los Angeles Community College District GO, 6.60%, 8/01/42 | | | | | | | 30 | | | | 43,233 | |
Los Angeles County Metropolitan Transportation Authority RB, 5.00%, 7/01/38 | | | | | | | 10 | | | | 11,898 | |
Los Angeles Department of Water & Power RB, 6.60%, 7/01/50 | | | | | | | 10 | | | | 14,736 | |
Los Angeles Department of Water RB, 5.00%, 7/01/44 | | | | | | | 30 | | | | 35,227 | |
Los Angeles Unified School District GO, 5.00%, 7/01/26 | | | | | | | 10 | | | | 12,531 | |
Massachusetts Clean Water Trust RB, 5.00%, 2/01/27-2/01/28 | | | | | | | 20 | | | | 24,638 | |
Massachusetts Development Finance Agency RB,
5.00%, 7/01/47 | | | | | | | 10 | | | | 11,247 | |
Metropolitan Government Nashville & Davidson County Health & Educational Facilities Board RB, 5.00%, 7/01/46 | | | | | | | 10 | | | | 11,232 | |
Metropolitan Transportation Authority RB: | | | | | | | | | | | | |
5.00%, 11/15/35-11/15/47 | | | | | | | 30 | | | | 35,212 | |
6.69%, 11/15/40 | | | | | | | 10 | | | | 13,668 | |
6.81%, 11/15/40 | | | | | | | 20 | | | | 27,933 | |
5.25%, 11/15/57 | | | | | | | 20 | | | | 23,523 | |
Metropolitan Washington Airports Authority Dulles Toll Road Revenue RB, 7.46%, 10/01/46 | | | | | | | 10 | | | | 14,580 | |
Metropolitan Washington Airports Authority Dulles Toll Road Revenue RB AGC, 0.00%, 10/01/39 (k) | | | | | | | 10 | | | | 4,138 | |
Miami-Dade County Educational Facilities Authority RB, 5.07%, 4/01/50 | | | | | | | 15 | | | | 16,586 | |
Michigan Finance Authority RB, 5.00%, 11/15/41 | | | | | | | 25 | | | | 28,017 | |
Mississippi Hospital Equipment & Facilities Authority RB, 5.00%, 9/01/46 | | | | | | | 10 | | | | 11,076 | |
Municipal Electric Authority of Georgia RB: | | | | | | | | | | | | |
5.00%, 1/01/20 | | | | | | | 10 | | | | 10,808 | |
6.64%, 4/01/57 | | | | | | | 15 | | | | 18,414 | |
New Caney Independent School District GO PSF,
5.00%, 2/15/47 | | | | | | | 10 | | | | 11,678 | |
New Jersey State Turnpike Authority RB,
7.41%, 1/01/40 | | | | | | | 23 | | | | 34,546 | |
New Jersey Transportation Trust Fund Authority RB,
5.00%, 6/15/29 | | | | | | | 10 | | | | 10,741 | |
New York City Transitional Finance Authority Building Aid Revenue RB, 5.00%, 7/15/40 | | | | | | | 10 | | | | 11,504 | |
New York City Transitional Finance Authority Future Tax Secured Revenue RB: | | | | | | | | | | | | |
2.28%, 5/01/26 | | | | | | | 10 | | | | 9,341 | |
3.05%, 5/01/27 | | | | | | | 25 | | | | 24,727 | |
5.00%, 2/01/35-2/01/43 | | | | | | | 40 | | | | 46,609 | |
New York City Water & Sewer System RB: | | | | | | | | | | | | |
5.75%, 6/15/41 | | | | | | | 10 | | | | 13,219 | |
5.38%, 6/15/43 | | | | | | | 95 | | | | 107,171 | |
5.50%, 6/15/43 | | | | | | | 115 | | | | 130,300 | |
5.88%, 6/15/44 | | | | | | | 20 | | | | 27,053 | |
5.00%, 6/15/47 | | | | | | | 70 | | | | 81,391 | |
New York Convention Center Development Corp. RB, 5.00%, 11/15/40-11/15/46 | | | | | | | 20 | | | | 23,105 | |
| | | | | | | | | | | | |
| Taxable Municipal Bonds | | | | | Par (000) | | | Value | |
New York State Dormitory Authority RB: | | | | | | | | | | | | |
5.00%, 3/15/29-3/15/32 | | | USD | | | | 20 | | | $ | 24,061 | |
5.39%, 3/15/40 | | | | | | | 15 | | | | 18,636 | |
New York State Environmental Facilities Corp. RB,
5.00%, 6/15/46 | | | | | | | 20 | | | | 23,591 | |
New York State Urban Development Corp. RB: | | | | | | | | | | | | |
2.86%, 3/15/24 | | | | | | | 30 | | | | 30,299 | |
5.00%, 3/15/25-3/15/27 | | | | | | | 30 | | | | 37,213 | |
New York Transportation Development Corp. RB: | | | | | | | | | | | | |
5.00%, 7/01/46 | | | | | | | 10 | | | | 10,847 | |
5.25%, 1/01/50 | | | | | | | 50 | | | | 54,717 | |
Northwest Independent School District GO PSF, 5.00%, 2/15/42 | | | | | | | 10 | | | | 11,576 | |
Ohio Water Development Authority Water Pollution Control Loan Fund RB, 5.00%, 12/01/31 | | | | | | | 10 | | | | 12,174 | |
Orange County Local Transportation Authority RB,
6.91%, 2/15/41 | | | | | | | 25 | | | | 34,577 | |
Oregon School Boards Association GO AMBAC, 4.76%, 6/30/28 | | | | | | | 25 | | | | 27,639 | |
Oregon State Lottery RB, 5.00%, 4/01/30- 4/01/37 | | | | | | | 40 | | | | 47,791 | |
Oxnard School District GO BAM, 5.00%, 8/01/45 | | | | | | | 10 | | | | 11,588 | |
Pennsylvania Economic Development Financing Authority RB, 5.00%, 12/31/38 | | | | | | | 10 | | | | 11,125 | |
Pennsylvania State University RB, 5.00%, 9/01/42 | | | | | | | 10 | | | | 11,751 | |
Port Authority of New York & New Jersey RB: | | | | | | | | | | | | |
4.96%, 8/01/46 | | | | | | | 30 | | | | 35,615 | |
4.46%, 10/01/62 | | | | | | | 20 | | | | 21,790 | |
4.81%, 10/15/65 | | | | | | | 10 | | | | 11,539 | |
Port of Seattle, WA GO, 5.00%, 1/01/33- 1/01/42 | | | | | | | 110 | | | | 130,315 | |
Regents of the University of California Medical Center Pooled Revenue RB, 6.58%, 5/15/49 | | | | | | | 25 | | | | 33,963 | |
Royal Oak Hospital Finance Authority RB, 5.00%, 9/01/39 | | | | | | | 10 | | | | 11,092 | |
Salt Lake City Corp. Airport Revenue RB, 5.00%, 7/01/47 | | | | | | | 50 | | | | 57,605 | |
Salt River Project Agricultural Improvement & Power District RB, 5.00%, 12/01/36 | | | | | | | 10 | | | | 11,653 | |
San Diego County Regional Transportation Commission RB, 5.00%, 4/01/48 | | | | | | | 20 | | | | 23,276 | |
San Diego Public Facilities Financing Authority Sewer Revenue RB, 5.00%, 5/15/39 | | | | | | | 25 | | | | 29,188 | |
San Francisco Bay Area Rapid Transit District GO, 5.00%, 8/01/36-8/01/47 | | | | | | | 20 | | | | 23,999 | |
San Francisco City & County Airport Comm-San Francisco International Airport RB, 5.00%, 5/01/41 | | | | | | | 10 | | | | 11,351 | |
South Carolina Public Service Authority RB: | | | | | | | | | | | | |
2.39%, 12/01/23 | | | | | | | 19 | | | | 17,934 | |
5.00%, 12/01/49-12/01/50 | | | | | | | 20 | | | | 21,695 | |
State of California GO: | | | | | | | | | | | | |
5.00%, 8/01/26-9/01/27 | | | | | | | 25 | | | | 31,022 | |
7.50%, 4/01/34 | | | | | | | 20 | | | | 29,044 | |
7.55%, 4/01/39 | | | | | | | 10 | | | | 15,260 | |
7.30%, 10/01/39 | | | | | | | 5 | | | | 7,312 | |
7.35%, 11/01/39 | | | | | | | 10 | | | | 14,676 | |
7.60%, 11/01/40 | | | | | | | 85 | | | | 132,362 | |
State of Georgia GO, 5.00%, 7/01/26- 2/01/33 | | | | | | | 65 | | | | 79,796 | |
State of Illinois GO, 5.10%, 6/01/33 | | | | | | | 80 | | | | 74,870 | |
State of Kansas Department of Transportation RB, 5.00%, 9/01/35 | | | | | | | 10 | | | | 11,780 | |
State of Maryland GO, 5.00%, 3/15/29 | | | | | | | 10 | | | | 12,439 | |
State of Ohio GO, 5.00%, 5/01/27-5/01/37 | | | | | | | 80 | | | | 94,277 | |
See Notes to Financial Statements.
| | | | | | |
| | | BLACKROCK SERIES FUND, INC. | | JUNE 30, 2017 | | 113 |
| | | | |
| Schedule of Investments (continued) | | | BlackRock Total Return Portfolio | |
| | | | |
| | | | | | | | | | | | |
| Taxable Municipal Bonds | | | | | Par (000) | | | Value | |
State of Oregon GO, 5.00%, 8/01/42 | | | USD | | | | 35 | | | $ | 41,454 | |
State of Texas GO, 5.00%, 8/01/42 | | | | | | | 10 | | | | 11,825 | |
State of Washington GO, 5.00%, 7/01/28-8/01/30 | | | | | | | 25 | | | | 30,128 | |
State of Wisconsin GO, 5.00%, 5/01/24-11/01/27 | | | | | | | 30 | | | | 36,932 | |
State of Wisconsin RB, 3.15%, 5/01/27 | | | | | | | 25 | | | | 25,113 | |
Texas A&M University RB: | | | | | | | | | | | | |
2.76%, 5/15/26 | | | | | | | 25 | | | | 24,855 | |
2.84%, 5/15/27 | | | | | | | 10 | | | | 9,962 | |
Texas Private Activity Bond Surface Transportation Corp. RB, 5.00%, 12/31/55 | | | | | | | 5 | | | | 5,435 | |
Texas Water Development Board RB, 5.00%, 10/15/40-10/15/45 | | | | | | | 20 | | | | 23,122 | |
Tobacco Settlement Financing Corp. RB, 5.00%, 6/01/41 | | | | | | | 10 | | | | 9,800 | |
University of California RB: | | | | | | | | | | | | |
3.06%, 7/01/25 | | | | | | | 10 | | | | 10,072 | |
4.86%, 5/15/12 | | | | | | | 15 | | | | 15,491 | |
University of Houston RB, 5.00%, 2/15/33-2/15/36 | | | | | | | 40 | | | | 46,601 | |
University of Massachusetts Building Authority RB,
5.00%, 11/01/31 | | | | | | | 10 | | | | 11,829 | |
University of New Mexico RB, 5.00%, 6/01/47 | | | | | | | 10 | | | | 11,575 | |
University of Virginia RB, 5.00%, 4/01/44-4/01/46 | | | | | | | 20 | | | | 23,751 | |
Weld County School District No. RE-4 GO, 5.25%, 12/01/41 | | | | | | | 10 | | | | 11,907 | |
West Virginia Hospital Finance Authority RB, 5.00%, 6/01/19-6/01/24 | | | | | | | 30 | | | | 33,913 | |
Total Taxable Municipal Bonds — 6.5% | | | | | | | | | | | 3,522,261 | |
| | | | | | | | | | | | |
| U.S. Government Sponsored Agency Securities | | | | | | | | | |
Collateralized Mortgage Obligations — 0.6% | | | | | | | | | | | | |
Fannie Mae: | | | | | | | | | | | | |
Series 2013-C01, Class M2, 6.27%, 10/25/23 (a) | | | | | | | 115 | | | | 135,144 | |
Series 2016-C06, Class 1M2, 5.27%, 4/25/29 (a) | | | | | | | 20 | | | | 22,058 | |
Series 2017-C01, Class 1B1, 6.77%, 7/25/29 (a) | | | | | | | 20 | | | | 22,743 | |
Series 2017-C01, Class 1M2, 4.57%, 7/25/29 (a) | | | | | | | 20 | | | | 21,121 | |
Series 2017-C02, Class 2M2, 4.67%, 9/25/29 (a) | | | | | | | 20 | | | | 21,221 | |
Series 2017-C03, Class 1B1, 5.87%, 10/25/29 (a) | | | | | | | 50 | | | | 53,495 | |
Series 2017-C03, Class 1M2,
4.02%, 10/25/29 (a) | | | | | | | 30 | | | | 30,808 | |
Series 2017-C04, Class 2M2,
3.89%, 11/25/29 (a) | | | | | | | 40 | | | | 40,562 | |
| | | | | | | | | | | | |
| | | | | | | | | | | | 347,152 | |
Commercial Mortgage-Backed Securities — 0.2% | | | | | | | | | | | | |
Fannie Mae, Series 2017-M7, Class A2, 2.96%, 2/25/27 (a)(b) | | | | | | | 16 | | | | 16,192 | |
Freddie Mac: | | | | | | | | | | | | |
Series K059, Class A2, 3.12%, 9/25/26 (a) | | | | | | | 30 | | | | 30,668 | |
Series K060, Class A2, 3.30%, 10/25/26 | | | | | | | 40 | | | | 41,431 | |
Series K061, Class A2, 3.35%, 11/25/26 | | | | | | | 20 | | | | 20,792 | |
Series K063, Class A2, 3.43%, 1/25/27 (a) | | | | | | | 10 | | | | 10,497 | |
| | | | | | | | | | | | |
| | | | | | | | | | | | 119,580 | |
| | | | | | | | | | | | |
| U.S. Government Sponsored Agency Securities | | | Par (000) | | | Value | |
Interest Only Commercial Mortgage-Backed Securities — 0.2% | |
Fannie Mae: | | | | | | | | | | | | |
Series 2013-M5, Class X2,
2.25%, 1/25/22 (a) | | | USD | | | | 250 | | | $ | 15,646 | |
Series 2014-M13, Class X2, 1.29%, 8/25/24 (a) | | | | | | | 1,817 | | | | 16,232 | |
Series 2016-M4, Class X2,
2.80%, 1/25/39 (a) | | | | | | | 95 | | | | 11,398 | |
Freddie Mac, Series K064, Class X1, 0.75%, 3/25/27 (a) | | | | | | | 300 | | | | 14,837 | |
Ginnie Mae: | | | | | | | | | | | | |
Series 2012-120, Class IO,
0.79%, 2/16/53 (a) | | | | | | | 390 | | | | 18,892 | |
Series 2016-110, Class IO,
1.05%, 5/16/58 (a) | | | | | | | 95 | | | | 7,374 | |
Series 2017-69, Class IO,
0.80%, 7/16/59 (a)(b) | | | | | | | 100 | | | | 7,382 | |
| | | | | | | | | | | | |
| | | | | | | | | | | | 91,761 | |
Mortgage-Backed Securities — 44.7% | | | | | | | | | | | | |
Fannie Mae Mortgage-Backed Securities: | | | | | | | | | | | | |
2.50%, 4/01/30-7/01/32 (l) | | | | | | | 610 | | | | 614,303 | |
3.00%, 4/01/29-7/01/47 (l) | | | | | | | 5,403 | | | | 5,435,993 | |
3.50%, 7/01/26-7/01/47 (l) | | | | | | | 3,011 | | | | 3,112,674 | |
4.00%, 2/01/25-7/01/47 (l) | | | | | | | 1,652 | | | | 1,751,828 | |
4.50%, 2/01/25-7/01/47 (l) | | | | | | | 510 | | | | 548,677 | |
5.00%, 2/01/35-7/01/47 (l) | | | | | | | 282 | | | | 308,876 | |
5.50%, 2/01/35-9/01/39 | | | | | | | 346 | | | | 386,461 | |
6.00%, 4/01/35-7/01/47 (l) | | | | | | | 406 | | | | 460,008 | |
6.50%, 5/01/40 | | | | | | | 105 | | | | 117,788 | |
Freddie Mac Mortgage-Backed Securities: | | | | | | | | | | | | |
2.50%, 3/01/30-7/01/32 (l) | | | | | | | 347 | | | | 349,609 | |
3.00%, 1/01/30-7/01/47 (l) | | | | | | | 2,830 | | | | 2,837,055 | |
3.50%, 7/01/32-7/01/47 (l) | | | | | | | 1,519 | | | | 1,564,091 | |
4.00%, 8/01/40-7/01/47 (l) | | | | | | | 1,079 | | | | 1,135,390 | |
4.50%, 2/01/39-7/01/47 (l) | | | | | | | 403 | | | | 431,801 | |
5.00%, 11/01/41 | | | | | | | 108 | | | | 118,149 | |
5.50%, 5/01/40-6/01/41 | | | | | | | 83 | | | | 92,444 | |
6.00%, 6/01/35 | | | | | | | 33 | | | | 37,147 | |
Ginnie Mae Mortgage-Backed Securities: | | | | | | | | | | | | |
3.00%, 7/15/47 (l) | | | | | | | 1,359 | | | | 1,372,735 | |
3.50%, 12/20/41-7/15/47 (l) | | | | | | | 1,648 | | | | 1,709,626 | |
4.00%, 7/20/39-7/15/47 (l) | | | | | | | 1,186 | | | | 1,250,592 | |
4.50%, 12/20/39-2/15/42 | | | | | | | 664 | | | | 716,419 | |
5.00%, 7/15/39-7/20/42 | | | | | | | 75 | | | | 82,839 | |
5.50%, 5/20/36 | | | | | | | 5 | | | | 5,171 | |
| | | | | | | | | | | | |
| | | | | | | | | | | | 24,439,676 | |
Total U.S. Government Sponsored Agency Securities — 45.7% | | | | 24,998,169 | |
| | | | | | | | | | | | |
| U.S. Treasury Obligations | | | | | | | | | |
U.S. Treasury Bonds: | | | | | | | | | | | | |
2.13%, 3/31/24 | | | | | | | 131 | | | | 131,097 | |
2.88%, 11/15/46 (m) | | | | | | | 463 | | | | 465,550 | |
3.00%, 2/15/47-5/15/47 (m)(n) | | | | | | | 1,619 | | | | 1,670,650 | |
U.S. Treasury Notes: | | | | | | | | | | | | |
1.25%, 3/31/19-5/31/19 (m) | | | | | | | 2,963 | | | | 2,956,099 | |
1.63%, 3/15/20 | | | | | | | 953 | | | | 956,015 | |
1.50%, 4/15/20-5/15/20 (m) | | | | | | | 1,503 | | | | 1,501,710 | |
1.88%, 3/31/22-4/30/22 (m) | | | | | | | 2,064 | | | | 2,064,403 | |
1.75%, 5/31/22 (m) | | | | | | | 163 | | | | 162,045 | |
2.00%, 4/30/24-11/15/26 | | | | | | | 630 | | | | 616,604 | |
2.25%, 2/15/27 | | | | | | | 470 | | | | 467,815 | |
2.38%, 5/15/27 (m) | | | | | | | 127 | | | | 127,602 | |
Total U.S. Treasury Obligations — 20.4% | | | | | | | | | | | 11,119,590 | |
See Notes to Financial Statements.
| | | | | | |
| 114 | | BLACKROCK SERIES FUND, INC. | | JUNE 30, 2017 | | |
| | | | |
| Schedule of Investments (continued) | | | BlackRock Total Return Portfolio | |
| | | | | | | | | | | | |
| | | | | | | | | Value | |
Total Long-Term Investments (Cost — $69,254,019) — 127.6% | | | | | | | | | | $ | 69,714,394 | |
| | | | | | | | | | | | |
| Short-Term Securities | | | | | Par (000) | | | | |
Borrowed Bond Agreements — 0.4% (o) | | | | | | | | | | | | |
Barclays Bank PLC, 0.14%, Open (p) (Purchased on 6/09/17 to be repurchased at GBP 107,001, collateralized by United Kingdom Gilt Inflation Linked Bonds, 0.13% due at 3/22/26, par and fair value of GBP 85,000 and $136,602, respectively) | | | USD | | | | 107 | | | | 139,353 | |
BNP Paribas Securities Corp., 1.20%, Open (p) (Purchased on 6/13/17 to be repurchased at $85,936, collateralized by U.S. Treasury Notes, 2.00% due at 5/31/24, par and fair value of USD 86,000 and $85,308, respectively) | | | | | | | 86 | | | | 85,892 | |
| | | | | | | | | | | | |
| | | | | | | | | | | | 225,245 | |
| | | | | | | | | | | | |
| Money Market Funds — 0.5% | | | | | Shares | | | | |
BlackRock Liquidity Funds, T-Fund, Institutional Class, 0.84% (h)(q) | | | | | | | 288,048 | | | | 288,048 | |
Total Short-Term Securities (Cost — $510,264) — 0.9% | | | | | | | | | | | 513,293 | |
| | | | | | | | | | | | |
| Options Purchased | | | | | | | | | |
(Cost — $23,775) — 0.0% | | | | | | | | | | | 10,963 | |
Total Investments Before Borrowed Bonds, Options Written and TBA Sale Commitments (Cost — $69,788,058) — 128.5% | | | | 70,238,650 | |
| | | | | | | | | | | | |
| Borrowed Bonds | | Par (000) | | | | |
Foreign Government Obligations — (0.2)% | | | | | | | | | | | | |
United Kingdom Gilt Inflation Linked Bonds, 0.13%, 3/22/26 | | | GBP | | | | 85 | | | | (136,602 | ) |
U.S. Treasury Obligations — (0.2)% | | | | | | | | | | | | |
U.S. Treasury Notes, 2.00%, 5/31/24 | | | USD | | | | 86 | | | | (85,308 | ) |
(Proceeds — $217,322) — (0.4)% | | | | | | | | | | | (221,910 | ) |
| | | | | | | | | | | | |
| | | | | | | | | | |
| | | | | | | | | | | | |
| Options Written | | | | | | | | Value | |
(Premiums Received — $ 9,574) — (0.0)% | | | | | | | | | | $ | (3,239 | ) |
| | | | | | | | | | | | |
| TBA Sale Commitments (l) | | | | | Par (000) | | | | |
Mortgage-Backed Securities — (18.0)% | | | | | | | | | | | | |
Fannie Mae Mortgage-Backed Securities: | | | | | | | | | | | | |
2.50%, 7/01/32 | | | USD | | | | 266 | | | | (267,016 | ) |
3.00%, 7/01/32-7/01/47 | | | | | | | 3,641 | | | | (3,646,599 | ) |
3.50%, 7/01/32-7/01/47 | | | | | | | 1,176 | | | | (1,213,575 | ) |
4.00%, 7/01/32-7/01/47 | | | | | | | 501 | | | | (523,782 | ) |
4.50%, 7/01/47 | | | | | | | 26 | | | | (27,873 | ) |
5.50%, 7/01/47 | | | | | | | 182 | | | | (201,622 | ) |
6.00%, 7/01/47 | | | | | | | 362 | | | | (407,309 | ) |
Freddie Mac Mortgage-Backed Securities: | | | | | | | | | | | | |
3.00%, 7/01/47 | | | | | | | 1,551 | | | | (1,546,479 | ) |
3.50%, 7/01/47 | | | | | | | 361 | | | | (370,861 | ) |
4.00%, 7/01/47 | | | | | | | 451 | | | | (474,313 | ) |
4.50%, 7/01/47 | | | | | | | 149 | | | | (159,618 | ) |
Ginnie Mae Mortgage-Backed Securities: | | | | | | | | | | | | |
3.00%, 7/15/47 | | | | | | | 40 | | | | (40,403 | ) |
3.50%, 7/15/47 | | | | | | | 57 | | | | (58,832 | ) |
4.00%, 7/15/47 | | | | | | | 476 | | | | (500,544 | ) |
4.50%, 7/15/47 | | | | | | | 359 | | | | (383,276 | ) |
Total TBA Sale Commitments (Proceeds — $9,861,656) — (18.0)% | | | | | | | | | | | (9,822,102 | ) |
Total Investments Net of Borrowed Bonds, Options Written and TBA Sale Commitments — 110.1% | | | | 60,191,399 | |
Liabilities in Excess of Other Assets — (10.1)% | | | | | | | | | | | (5,544,391 | ) |
| | | | | | | | | | | | |
Net Assets — 100.0% | | | | | | | | | | $ | 54,647,008 | |
| | | | | | | | | | | | |
|
| Notes to Schedule of Investments |
| (a) | Variable rate security. Rate as of period end. |
| (b) | Security is valued using significant unobservable inputs and is classified as Level 3 in the fair value hierarchy. |
| (c) | Security exempt from registration pursuant to Rule 144A under the Securities Act of 1933, as amended. These securities may be resold in transactions exempt from registration to qualified institutional investors. |
| (d) | Step-up bond that pays an initial coupon rate for the first period and then a higher coupon rate for the following periods. Rate as of period end. (e) Issuer filed for bankruptcy and/or is in default. |
| (f) | Non-income producing security. |
| (g) | Issuer is a U.S. branch of a foreign domiciled bank. |
See Notes to Financial Statements.
| | | | | | |
| | | BLACKROCK SERIES FUND, INC. | | JUNE 30, 2017 | | 115 |
| | | | |
| Schedule of Investments (continued) | | | BlackRock Total Return Portfolio | |
| (h) | During the six months ended June 30, 2017, investments in issuers considered to be an affiliate of the Fund for purposes of Section 2(a)(3) of the Investment Company Act of 1940, as amended, were as follows: |
| | | | | | | | | | | | | | | | | | | | | | | | | | | | | | | | |
| Affiliate | | Shares Held at
December 31,
2016 | | | Shares
Purchased | | | Shares
Sold | | | Shares Held at
June 30,
2017 | | | Value at
June 30,
2017 | | | Income | | | Net
Realized
Gain | | | Change in
Unrealized
Appreciation
(Depreciation) | |
BlackRock Liquidity Funds, T-Fund, Institutional Class | | | 419,007 | | | | — | | | | (130,959 | )1 | | | 288,048 | | | $ | 288,048 | | | $ | 1,615 | | | | — | | | | — | |
iShares iBoxx $ High Yield Corporate Bond ETF | | | — | | | | 25,190 | | | | (18,950 | ) | | | 6,240 | | | | 551,554 | | | | 11,883 | | | $ | 23,791 | | | $ | 4,823 | |
Total | | | | | | | | | | | | | | | | | | $ | 839,602 | | | $ | 13,498 | | | $ | 23,791 | | | $ | 4,823 | |
| | | | | | | | | | | | | | | | | | | | |
| | 1 | | Represents net shares sold. |
| (i) | Other interests represent beneficial interests in liquidation trusts and other reorganization or private entities. |
| (j) | Perpetual security with no stated maturity date. |
| (l) | Represents or includes a TBA transaction. As of period end, unsettled TBA transactions were as follows: |
| | | | | | | | |
| Counterparty | | Value | | | Unrealized
Appreciation
(Depreciation) | |
Barclays Capital, Inc. | | $ | (560,899 | ) | | $ | 1,862 | |
Citigroup Global Markets, Inc. | | $ | (400,979 | ) | | $ | 1,870 | |
Credit Suisse Securities (USA) LLC | | $ | (224,456 | ) | | $ | 3,779 | |
Daiwa Capital Markets America, Inc. | | $ | 101,008 | | | $ | (680 | ) |
Deutsche Bank Securities, Inc. | | $ | (138,929 | ) | | $ | 626 | |
Goldman Sachs & Co. | | $ | 276,680 | | | $ | (2,326 | ) |
J.P. Morgan Securities LLC | | $ | (251,439 | ) | | $ | 1,691 | |
Merrill Lynch, Pierce, Fenner & Smith, Inc. | | $ | (240,663 | ) | | $ | 1,858 | |
Mizuho Securities USA LLC | | $ | (119,515 | ) | | $ | 548 | |
Morgan Stanley & Co. LLC | | $ | (414,346 | ) | | $ | 259 | |
Nomura Securities International, Inc. | | $ | (52,348 | ) | | $ | 200 | |
RBC Capital Markets, LLC | | $ | 322,618 | | | $ | (2,405 | ) |
Wells Fargo Securities, LLC | | $ | (395,143 | ) | | $ | 1,713 | |
| (m) | All or a portion of the security has been pledged as collateral in connection with outstanding reverse repurchase agreements. |
| (n) | All or a portion of the security has been pledged in connection with outstanding futures contracts. |
| (o) | Certain agreements have no stated maturity and can be terminated by either party at any time. |
| (p) | The amount to be repurchased assumes the maturity will be the day after the period end. |
| (q) | Current yield as of period end. |
| (r) | Rates are discount rates or a range of discount rates at the time of purchase. |
| • | | For Fund compliance purposes, the Fund’s industry classifications refer to one or more of the industry sub-classifications used by one or more widely recognized market indexes or ratings group indexes, and/or as defined by the investment adviser. These definitions may not apply for purposes of this report, which may combine such industry sub-classifications for reporting ease. |
Reverse repurchase agreements
| | | | | | | | | | | | | | | | | | | | | | | | | | | | |
| Counterparty | | Interest
Rate | | | Trade
Date | | | Maturity
Date | | | Face
Value | | | Face
Value
Including
Accrued
Interest | | | Type of Non-Cash
Underlying
Collateral | | | Remaining
Contractual
Maturity of the
Agreements | |
BNP Paribas Securities Corp. | | | 1.03 | % | | | 6/30/17 | | | | 7/03/17 | | | $ | 128,385 | | | $ | 128,396 | | | | U.S. Treasury Obligations | | | | Overnight | |
Citigroup Global Markets, Inc. | | | 1.45 | % | | | 6/30/17 | | | | 7/03/17 | | | | 1,875,500 | | | | 1,875,727 | | | | U.S. Treasury Obligations | | | | Overnight | |
Credit Suisse Securities (USA) LLC | | | 1.48 | % | | | 6/30/17 | | | | 7/03/17 | | | | 545,681 | | | | 545,749 | | | | U.S. Treasury Obligations | | | | Overnight | |
Deutsche Bank Securities, Inc. | | | 1.45 | % | | | 6/30/17 | | | | 7/03/17 | | | | 469,366 | | | | 469,423 | | | | U.S. Treasury Obligations | | | | Overnight | |
Deutsche Bank Securities, Inc. | | | 1.45 | % | | | 6/30/17 | | | | 7/03/17 | | | | 1,224,080 | | | | 1,224,228 | | | | U.S. Treasury Obligations | | | | Overnight | |
J.P. Morgan Securities LLC | | | 0.50 | % | | | 6/30/17 | | | | 7/03/17 | | | | 617,228 | | | | 617,253 | | | | U.S. Treasury Obligations | | | | Overnight | |
J.P. Morgan Securities LLC | | | 1.38 | % | | | 6/30/17 | | | | 7/03/17 | | | | 1,038,165 | | | | 1,038,284 | | | | U.S. Treasury Obligations | | | | Overnight | |
Merrill Lynch, Pierce, Fenner & Smith, Inc. | | | 1.18 | % | | | 6/30/17 | | | | 7/03/17 | | | | 162,593 | | | | 162,608 | | | | U.S. Treasury Obligations | | | | Overnight | |
Merrill Lynch, Pierce, Fenner & Smith, Inc. | | | 1.30 | % | | | 6/30/17 | | | | 7/03/17 | | | | 366,625 | | | | 366,665 | | | | U.S. Treasury Obligations | | | | Overnight | |
Merrill Lynch, Pierce, Fenner & Smith, Inc. | | | 1.35 | % | | | 6/30/17 | | | | 7/03/17 | | | | 960,395 | | | | 960,503 | | | | U.S. Treasury Obligations | | | | Overnight | |
Total | | | | | | | | | | | | | | $ | 7,388,018 | | | $ | 7,388,836 | | | | | | | | | |
| | | | | | | | | | | | | | | | | | | | | | | | |
See Notes to Financial Statements.
| | | | | | |
| 116 | | BLACKROCK SERIES FUND, INC. | | JUNE 30, 2017 | | |
| | | | |
| Schedule of Investments (continued) | | | BlackRock Total Return Portfolio | |
|
| Derivative Financial Instruments Outstanding as of Period End |
Futures Contracts
| | | | | | | | | | | | | | | | |
Contracts
Long (Short) | | Issue | | Expiration | | Notional
Value | | | Unrealized
Appreciation
(Depreciation) | |
| (8) | | Euro-Bobl | | September 2017 | | | USD | | | | 1,203,372 | | | $ | 3,283 | |
| (4) | | Euro-Bund | | September 2017 | | | USD | | | | 739,521 | | | | 3,982 | |
| 1 | | Long Gilt British | | September 2017 | | | USD | | | | 163,549 | | | | (2,801 | ) |
| 6 | | U.S. Treasury Bonds (30 Year) | | September 2017 | | | USD | | | | 922,125 | | | | 1,638 | |
| (28) | | U.S. Treasury Notes (10 Year) | | September 2017 | | | USD | | | | 3,514,875 | | | | 10,764 | |
| 1 | | U.S. Treasury Notes (2 Year) | | September 2017 | | | USD | | | | 216,109 | | | | (267 | ) |
| 24 | | U.S. Treasury Notes (5 Year) | | September 2017 | | | USD | | | | 2,828,062 | | | | (6,473 | ) |
| (3) | | U.S. Ultra Treasury Bonds | | September 2017 | | | USD | | | | 497,625 | | | | (6,082 | ) |
| (4) | | Euro Dollar | | March 2019 | | | USD | | | | 981,450 | | | | (3,331 | ) |
| Total | | | | | | | | | | | | | | $ | 713 | |
| | | | | | | | | | | | | | | | |
| | | | | | | | | | | | | | | | | | | | | | |
| | | | | | | | | | | | | | | | | | |
| Forward Foreign Currency Exchange Contracts | |
Currency
Purchased | | | Currency
Sold | | | Counterparty | | Settlement
Date | | | Unrealized
Appreciation
(Depreciation) | |
| BRL | | | 55,776 | | | | USD | | | | 16,800 | | | BNP Paribas S.A. | | | 7/03/17 | | | $ | 24 | |
| USD | | | 14,000 | | | | BRL | | | | 46,172 | | | Barclays Bank PLC | | | 7/03/17 | | | | 73 | |
| USD | | | 14,000 | | | | BRL | | | | 46,256 | | | Citibank N.A. | | | 7/03/17 | | | | 47 | |
| USD | | | 14,000 | | | | RUB | | | | 818,160 | | | BNP Paribas S.A. | | | 7/03/17 | | | | 136 | |
| CNH | | | 1,827,156 | | | | USD | | | | 269,000 | | | HSBC Bank PLC | | | 7/05/17 | | | | 419 | |
| EUR | | | 105,249 | | | | USD | | | | 120,000 | | | Morgan Stanley & Co. International PLC | | | 7/05/17 | | | | 244 | |
| GBP | | | 92,507 | | | | USD | | | | 120,000 | | | Morgan Stanley & Co. International PLC | | | 7/05/17 | | | | 507 | |
| HUF | | | 7,157,168 | | | | USD | | | | 26,374 | | | Deutsche Bank AG | | | 7/05/17 | | | | 100 | |
| HUF | | | 195,671 | | | | USD | | | | 721 | | | JPMorgan Chase Bank N.A. | | | 7/05/17 | | | | 2 | |
| HUF | | | 716,238 | | | | USD | | | | 2,637 | | | Morgan Stanley & Co. International PLC | | | 7/05/17 | | | | 12 | |
| HUF | | | 24,514,915 | | | | USD | | | | 90,268 | | | Morgan Stanley & Co. International PLC | | | 7/05/17 | | | | 410 | |
| JPY | | | 13,544,806 | | | | USD | | | | 120,000 | | | BNP Paribas S.A. | | | 7/05/17 | | | | 453 | |
| SEK | | | 1,021,096 | | | | USD | | | | 120,000 | | | Deutsche Bank AG | | | 7/05/17 | | | | 1,240 | |
| TRY | | | 428,544 | | | | USD | | | | 120,000 | | | BNP Paribas S.A. | | | 7/05/17 | | | | 1,621 | |
| TRY | | | 70,637 | | | | USD | | | | 20,000 | | | HSBC Bank PLC | | | 7/05/17 | | | | 47 | |
| USD | | | 120,000 | | | | JPY | | | | 13,250,640 | | | Royal Bank of Scotland PLC | | | 7/05/17 | | | | 2,163 | |
| USD | | | 3,400 | | | | TRY | | | | 11,963 | | | Barclays Bank PLC | | | 7/05/17 | | | | 5 | |
| USD | | | 17,000 | | | | TRY | | | | 59,797 | | | Citibank N.A. | | | 7/05/17 | | | | 30 | |
| USD | | | 120,000 | | | | ZAR | | | | 1,562,215 | | | BNP Paribas S.A. | | | 7/05/17 | | | | 699 | |
| ZAR | | | 1,591,734 | | | | USD | | | | 120,000 | | | BNP Paribas S.A. | | | 7/05/17 | | | | 1,555 | |
| CLP | | | 13,422,500 | | | | USD | | | | 20,000 | | | Credit Suisse International | | | 7/06/17 | | | | 216 | |
| RUB | | | 1,337,056 | | | | USD | | | | 22,400 | | | JPMorgan Chase Bank N.A. | | | 7/06/17 | | | | 242 | |
| USD | | | 120,000 | | | | BRL | | | | 395,340 | | | BNP Paribas S.A. | | | 7/06/17 | | | | 832 | |
| USD | | | 20,000 | | | | COP | | | | 58,175,000 | | | Credit Suisse International | | | 7/06/17 | | | | 929 | |
| USD | | | 40,000 | | | | COP | | | | 121,600,000 | | | Barclays Bank PLC | | | 7/07/17 | | | | 143 | |
| USD | | | 80,000 | | | | COP | | | | 242,333,360 | | | BNP Paribas S.A. | | | 7/07/17 | | | | 569 | |
| CLP | | | 14,259,000 | | | | USD | | | | 21,000 | | | BNP Paribas S.A. | | | 7/10/17 | | | | 474 | |
| EUR | | | 20,000 | | | | USD | | | | 22,764 | | | Deutsche Bank AG | | | 7/10/17 | | | | 92 | |
| EUR | | | 20,000 | | | | USD | | | | 22,576 | | | Goldman Sachs International | | | 7/10/17 | | | | 280 | |
| RUB | | | 886,614 | | | | USD | | | | 15,000 | | | JPMorgan Chase Bank N.A. | | | 7/10/17 | | | | 1 | |
| RUB | | | 650,320 | | | | USD | | | | 11,000 | | | JPMorgan Chase Bank N.A. | | | 7/10/17 | | | | 3 | |
| TRY | | | 20,514 | | | | USD | | | | 5,787 | | | Deutsche Bank AG | | | 7/10/17 | | | | 27 | |
See Notes to Financial Statements.
| | | | | | |
| | | BLACKROCK SERIES FUND, INC. | | JUNE 30, 2017 | | 117 |
| | | | |
| Schedule of Investments (continued) | | | BlackRock Total Return Portfolio | |
| | | | | | | | | | | | | | | | | | | | | | |
Currency
Purchased | | | Currency
Sold | | | Counterparty | | Settlement
Date | | | Unrealized
Appreciation
(Depreciation) | |
| TRY | | | 20,613 | | | | USD | | | | 5,813 | | | Goldman Sachs International | | | 7/10/17 | | | $ | 28 | |
| USD | | | 26,125 | | | | RUB | | | | 1,533,253 | | | Credit Suisse International | | | 7/10/17 | | | | 183 | |
| USD | | | 25,875 | | | | RUB | | | | 1,518,148 | | | Deutsche Bank AG | | | 7/10/17 | | | | 189 | |
| JPY | | | 2,589,213 | | | | USD | | | | 23,000 | | | Goldman Sachs International | | | 7/11/17 | | | | 32 | |
| TRY | | | 103,732 | | | | USD | | | | 29,336 | | | Goldman Sachs International | | | 7/14/17 | | | | 26 | |
| MYR | | | 51,660 | | | | USD | | | | 12,000 | | | BNP Paribas S.A. | | | 7/17/17 | | | | 25 | |
| MYR | | | 21,720 | | | | USD | | | | 5,000 | | | JPMorgan Chase Bank N.A. | | | 7/17/17 | | | | 56 | |
| MYR | | | 44,080 | | | | USD | | | | 10,000 | | | JPMorgan Chase Bank N.A. | | | 7/17/17 | | | | 261 | |
| TRY | | | 145,366 | | | | USD | | | | 41,000 | | | BNP Paribas S.A. | | | 7/21/17 | | | | 63 | |
| TRY | | | 64,060 | | | | USD | | | | 18,000 | | | Citibank N.A. | | | 7/21/17 | | | | 96 | |
| USD | | | 5,123 | | | | MXN | | | | 92,620 | | | BNP Paribas S.A. | | | 7/21/17 | | | | 38 | |
| USD | | | 12,877 | | | | MXN | | | | 232,812 | | | JPMorgan Chase Bank N.A. | | | 7/21/17 | | | | 96 | |
| USD | | | 1,000 | | | | ZAR | | | | 13,010 | | | Citibank N.A. | | | 7/21/17 | | | | 9 | |
| USD | | | 18,000 | | | | ZAR | | | | 231,710 | | | Citibank N.A. | | | 7/21/17 | | | | 358 | |
| RUB | | | 1,345,568 | | | | USD | | | | 22,400 | | | BNP Paribas S.A. | | | 7/24/17 | | | | 297 | |
| RUB | | | 1,336,384 | | | | USD | | | | 22,400 | | | Deutsche Bank AG | | | 7/24/17 | | | | 142 | |
| TRY | | | 20,647 | | | | USD | | | | 5,800 | | | Deutsche Bank AG | | | 8/04/17 | | | | 8 | |
| USD | | | 18,000 | | | | COP | | | | 52,812,000 | | | BNP Paribas S.A. | | | 8/09/17 | | | | 773 | |
| IDR | | | 134,650,000 | | | | USD | | | | 10,000 | | | Bank of America N.A. | | | 8/15/17 | | | | 48 | |
| IDR | | | 144,491,244 | | | | USD | | | | 10,732 | | | Citibank N.A. | | | 8/15/17 | | | | 50 | |
| IDR | | | 206,451,709 | | | | USD | | | | 15,332 | | | Citibank N.A. | | | 8/15/17 | | | | 74 | |
| IDR | | | 107,344,308 | | | | USD | | | | 7,975 | | | JPMorgan Chase Bank N.A. | | | 8/15/17 | | | | 35 | |
| IDR | | | 161,077,280 | | | | USD | | | | 11,960 | | | JPMorgan Chase Bank N.A. | | | 8/15/17 | | | | 60 | |
| MYR | | | 116,762 | | | | USD | | | | 27,000 | | | Morgan Stanley & Co. International PLC | | | 8/17/17 | | | | 144 | |
| USD | | | 20,000 | | | | COP | | | | 59,760,000 | | | Barclays Bank PLC | | | 8/22/17 | | | | 536 | |
| USD | | | 18,000 | | | | COP | | | | 54,639,000 | | | Credit Suisse International | | | 8/22/17 | | | | 204 | |
| EUR | | | 8,300 | | | | USD | | | | 9,385 | | | JPMorgan Chase Bank N.A. | | | 9/07/17 | | | | 130 | |
| USD | | | 55,012 | | | | RUB | | | | 3,192,493 | | | BNP Paribas S.A. | | | 9/15/17 | | | | 1,761 | |
| USD | | | 55,011 | | | | RUB | | | | 3,187,450 | | | BNP Paribas S.A. | | | 9/15/17 | | | | 1,844 | |
| USD | | | 137,024 | | | | RUB | | | | 7,973,237 | | | Deutsche Bank AG | | | 9/15/17 | | | | 4,030 | |
| USD | | | 138,456 | | | | RUB | | | | 8,027,464 | | | Deutsche Bank AG | | | 9/15/17 | | | | 4,557 | |
| USD | | | 20,276 | | | | RUB | | | | 1,203,725 | | | HSBC Bank PLC | | | 9/15/17 | | | | 197 | |
| USD | | | 124,311 | | | | RUB | | | | 7,209,027 | | | JPMorgan Chase Bank N.A. | | | 9/15/17 | | | | 4,063 | |
| AUD | | | 308,000 | | | | USD | | | | 232,854 | | | Citibank N.A. | | | 9/20/17 | | | | 3,627 | |
| AUD | | | 26,000 | | | | USD | | | | 19,663 | | | Credit Suisse International | | | 9/20/17 | | | | 299 | |
| EUR | | | 190,000 | | | | USD | | | | 216,751 | | | Goldman Sachs International | | | 9/20/17 | | | | 1,215 | |
| EUR | | | 170,000 | | | | USD | | | | 192,454 | | | Goldman Sachs International | | | 9/20/17 | | | | 2,568 | |
| USD | | | 35,562 | | | | MXN | | | | 646,438 | | | Deutsche Bank AG | | | 9/20/17 | | | | 408 | |
| USD | | | 34,857 | | | | MXN | | | | 631,421 | | | Deutsche Bank AG | | | 9/20/17 | | | | 520 | |
| USD | | | 142,248 | | | | MXN | | | | 2,586,069 | | | Goldman Sachs International | | | 9/20/17 | | | | 1,615 | |
| USD | | | 34,857 | | | | MXN | | | | 631,962 | | | Royal Bank of Scotland PLC | | | 9/20/17 | | | | 490 | |
| USD | | | 46,476 | | | | MXN | | | | 843,673 | | | Royal Bank of Scotland PLC | | | 9/20/17 | | | | 596 | |
| USD | | | 43,700 | | | | TRY | | | | 157,269 | | | Citibank N.A. | | | 9/20/17 | | | | 45 | |
| USD | | | 30,397 | | | | ZAR | | | | 400,733 | | | Bank of America N.A. | | | 9/20/17 | | | | 192 | |
| USD | | | 30,743 | | | | ZAR | | | | 404,410 | | | Citibank N.A. | | | 9/20/17 | | | | 261 | |
| USD | | | 30,907 | | | | ZAR | | | | 406,636 | | | JPMorgan Chase Bank N.A. | | | 9/20/17 | | | | 258 | |
| USD | | | 82,318 | | | | TRY | | | | 298,443 | | | BNP Paribas S.A. | | | 10/23/17 | | | | 211 | |
| TRY | | | 709,557 | | | | USD | | | | 183,313 | | | BNP Paribas S.A. | | | 6/25/18 | | | | 4 | |
| | | | | | | | | | | | | | | | | | | | | | |
| | | | | | | | | | | | | | | | | | | | | 46,317 | |
| | | | | | | | | | | | | | | | | | | | | | |
See Notes to Financial Statements.
| | | | | | |
| 118 | | BLACKROCK SERIES FUND, INC. | | JUNE 30, 2017 | | |
| | | | |
| Schedule of Investments (continued) | | | BlackRock Total Return Portfolio | |
| | | | | | | | | | | | | | | | | | | | | | |
Currency
Purchased | | | Currency
Sold | | | Counterparty | | Settlement
Date | | | Unrealized
Appreciation
(Depreciation) | |
| BRL | | | 36,725 | | | | USD | | | | 11,200 | | | Deutsche Bank AG | | | 7/03/17 | | | $ | (122 | ) |
| MXN | | | 92,987 | | | | USD | | | | 5,143 | | | Barclays Bank PLC | | | 7/03/17 | | | | (22 | ) |
| MXN | | | 92,976 | | | | USD | | | | 5,143 | | | Deutsche Bank AG | | | 7/03/17 | | | | (23 | ) |
| MXN | | | 139,454 | | | | USD | | | | 7,714 | | | Morgan Stanley & Co. International PLC | | | 7/03/17 | | | | (34 | ) |
| RUB | | | 808,500 | | | | USD | | | | 14,000 | | | Deutsche Bank AG | | | 7/03/17 | | | | (300 | ) |
| RUB | | | 6,869,580 | | | | USD | | | | 120,000 | | | BNP Paribas S.A. | | | 7/05/17 | | | | (3,645 | ) |
| USD | | | 269,000 | | | | CNH | | | | 1,827,156 | | | Citibank N.A. | | | 7/05/17 | | | | (375 | ) |
| USD | | | 120,000 | | | | EUR | | | | 106,525 | | | Deutsche Bank AG | | | 7/05/17 | | | | (1,701 | ) |
| USD | | | 120,000 | | | | GBP | | | | 92,857 | | | Deutsche Bank AG | | | 7/05/17 | | | | (963 | ) |
| USD | | | 120,000 | | | | HUF | | | | 32,860,200 | | | BNP Paribas S.A. | | | 7/05/17 | | | | (1,546 | ) |
| USD | | | 70,000 | | | | RUB | | | | 4,149,740 | | | Deutsche Bank AG | | | 7/05/17 | | | | (287 | ) |
| USD | | | 50,000 | | | | RUB | | | | 2,961,165 | | | JPMorgan Chase Bank N.A. | | | 7/05/17 | | | | (156 | ) |
| USD | | | 120,000 | | | | SEK | | | | 1,039,008 | | | Royal Bank of Scotland PLC | | | 7/05/17 | | | | (3,366 | ) |
| USD | | | 120,000 | | | | TRY | | | | 423,789 | | | BNP Paribas S.A. | | | 7/05/17 | | | | (272 | ) |
| BRL | | | 391,980 | | | | USD | | | | 120,000 | | | Goldman Sachs International | | | 7/06/17 | | | | (1,844 | ) |
| COP | | | 29,240,000 | | | | USD | | | | 10,000 | | | Royal Bank of Scotland PLC | | | 7/06/17 | | | | (414 | ) |
| COP | | | 29,230,000 | | | | USD | | | | 10,000 | | | UBS AG | | | 7/06/17 | | | | (418 | ) |
| USD | | | 20,000 | | | | CLP | | | | 13,292,200 | | | Royal Bank of Scotland PLC | | | 7/06/17 | | | | (20 | ) |
| USD | | | 22,400 | | | | RUB | | | | 1,345,344 | | | Goldman Sachs International | | | 7/06/17 | | | | (382 | ) |
| COP | | | 146,800,000 | | | | USD | | | | 50,000 | | | JPMorgan Chase Bank N.A. | | | 7/07/17 | | | | (1,883 | ) |
| COP | | | 205,520,000 | | | | USD | | | | 70,000 | | | UBS AG | | | 7/07/17 | | | | (2,636 | ) |
| RUB | | | 765,746 | | | | USD | | | | 13,000 | | | Barclays Bank PLC | | | 7/10/17 | | | | (44 | ) |
| RUB | | | 766,090 | | | | USD | | | | 13,000 | | | Barclays Bank PLC | | | 7/10/17 | | | | (38 | ) |
| USD | | | 21,000 | | | | CLP | | | | 14,018,550 | | | Deutsche Bank AG | | | 7/10/17 | | | | (112 | ) |
| USD | | | 22,446 | | | | EUR | | | | 20,000 | | | Citibank N.A. | | | 7/10/17 | | | | (410 | ) |
| USD | | | 5,800 | | | | TRY | | | | 20,743 | | | Citibank N.A. | | | 7/10/17 | | | | (78 | ) |
| USD | | | 5,800 | | | | TRY | | | | 20,503 | | | Deutsche Bank AG | | | 7/10/17 | | | | (10 | ) |
| USD | | | 28,961 | | | | TRY | | | | 103,732 | | | Bank of America N.A. | | | 7/14/17 | | | | (402 | ) |
| USD | | | 22,584 | | | | EUR | | | | 20,000 | | | Goldman Sachs International | | | 7/17/17 | | | | (281 | ) |
| USD | | | 17,908 | | | | GBP | | | | 14,000 | | | JPMorgan Chase Bank N.A. | | | 7/17/17 | | | | (337 | ) |
| USD | | | 27,000 | | | | MYR | | | | 116,505 | | | Morgan Stanley & Co. International PLC | | | 7/17/17 | | | | (120 | ) |
| MXN | | | 325,113 | | | | USD | | | | 18,000 | | | Barclays Bank PLC | | | 7/21/17 | | | | (152 | ) |
| ZAR | | | 167,535 | | | | USD | | | | 12,877 | | | Barclays Bank PLC | | | 7/21/17 | | | | (122 | ) |
| ZAR | | | 13,013 | | | | USD | | | | 1,000 | | | Barclays Bank PLC | | | 7/21/17 | | | | (9 | ) |
| ZAR | | | 66,676 | | | | USD | | | | 5,123 | | | BNP Paribas S.A. | | | 7/21/17 | | | | (46 | ) |
| IDR | | | 253,460,000 | | | | USD | | | | 19,000 | | | BNP Paribas S.A. | | | 7/24/17 | | | | (37 | ) |
| IDR | | | 667,000,000 | | | | USD | | | | 50,000 | | | JPMorgan Chase Bank N.A. | | | 7/24/17 | | | | (97 | ) |
| MXN | | | 325,742 | | | | USD | | | | 18,000 | | | Morgan Stanley & Co. International PLC | | | 7/27/17 | | | | (136 | ) |
| CLP | | | 2,321,055 | | | | USD | | | | 3,500 | | | Bank of America N.A. | | | 7/28/17 | | | | (6 | ) |
| CLP | | | 6,630,350 | | | | USD | | | | 10,000 | | | BNP Paribas S.A. | | | 7/28/17 | | | | (20 | ) |
| CLP | | | 6,633,000 | | | | USD | | | | 10,000 | | | BNP Paribas S.A. | | | 7/28/17 | | | | (16 | ) |
| CLP | | | 994,800 | | | | USD | | | | 1,500 | | | Goldman Sachs International | | | 7/28/17 | | | | (3 | ) |
| RUB | | | 1,660,960 | | | | USD | | | | 28,000 | | | Deutsche Bank AG | | | 7/28/17 | | | | (8 | ) |
| TRY | | | 42,014 | | | | USD | | | | 11,901 | | | BNP Paribas S.A. | | | 7/28/17 | | | | (57 | ) |
| TRY | | | 22,245 | | | | USD | | | | 6,297 | | | BNP Paribas S.A. | | | 7/28/17 | | | | (27 | ) |
| TRY | | | 42,025 | | | | USD | | | | 11,901 | | | Goldman Sachs International | | | 7/28/17 | | | | (54 | ) |
| TRY | | | 106,308 | | | | USD | | | | 30,000 | | | HSBC Bank PLC | | | 7/28/17 | | | | (31 | ) |
| TRY | | | 49,607 | | | | USD | | | | 14,000 | | | HSBC Bank PLC | | | 7/28/17 | | | | (15 | ) |
| TRY | | | 42,006 | | | | USD | | | | 11,901 | | | JPMorgan Chase Bank N.A. | | | 7/28/17 | | | | (59 | ) |
See Notes to Financial Statements.
| | | | | | |
| | | BLACKROCK SERIES FUND, INC. | | JUNE 30, 2017 | | 119 |
| | | | |
| Schedule of Investments (continued) | | | BlackRock Total Return Portfolio | |
| | | | | | | | | | | | | | | | | | | | | | |
Currency
Purchased | | | Currency
Sold | | | Counterparty | | Settlement
Date | | | Unrealized
Appreciation
(Depreciation) | |
| BRL | | | 110,703 | | | | USD | | | | 33,313 | | | Barclays Bank PLC | | | 8/02/17 | | | $ | (147 | ) |
| BRL | | | 70,000 | | | | USD | | | | 21,109 | | | BNP Paribas S.A. | | | 8/02/17 | | | | (137 | ) |
| BRL | | | 8,663 | | | | USD | | | | 2,641 | | | Goldman Sachs International | | | 8/02/17 | | | | (45 | ) |
| USD | | | 16,800 | | | | BRL | | | | 56,144 | | | BNP Paribas S.A. | | | 8/02/17 | | | | (20 | ) |
| USD | | | 56,727 | | | | BRL | | | | 189,366 | | | BNP Paribas S.A. | | | 8/02/17 | | | | (6 | ) |
| COP | | | 54,792,000 | | | | USD | | | | 18,000 | | | Barclays Bank PLC | | | 8/09/17 | | | | (127 | ) |
| USD | | | 4,965 | | | | EUR | | | | 4,551 | | | Bank of America N.A. | | | 8/11/17 | | | | (245 | ) |
| USD | | | 17,362 | | | | EUR | | | | 15,453 | | | Citibank N.A. | | | 8/11/17 | | | | (328 | ) |
| USD | | | 29,105 | | | | TRY | | | | 103,732 | | | Goldman Sachs International | | | 8/11/17 | | | | (13 | ) |
| USD | | | 56,000 | | | | IDR | | | | 762,809,600 | | | BNP Paribas S.A. | | | 8/15/17 | | | | (924 | ) |
| USD | | | 4,414 | | | | IDR | | | | 59,280,000 | | | Barclays Bank PLC | | | 8/16/17 | | | | (9 | ) |
| USD | | | 4,261 | | | | IDR | | | | 57,220,000 | | | Barclays Bank PLC | | | 8/16/17 | | | | (9 | ) |
| USD | | | 1,458 | | | | IDR | | | | 19,585,000 | | | Barclays Bank PLC | | | 8/16/17 | | | | (3 | ) |
| USD | | | 4,853 | | | | IDR | | | | 65,075,000 | | | BNP Paribas S.A. | | | 8/16/17 | | | | (3 | ) |
| USD | | | 4,684 | | | | IDR | | | | 62,815,000 | | | BNP Paribas S.A. | | | 8/16/17 | | | | (3 | ) |
| USD | | | 1,604 | | | | IDR | | | | 21,505,000 | | | BNP Paribas S.A. | | | 8/16/17 | | | | (1 | ) |
| USD | | | 5,252 | | | | IDR | | | | 70,570,000 | | | Deutsche Bank AG | | | 8/16/17 | | | | (14 | ) |
| USD | | | 5,069 | | | | IDR | | | | 68,115,000 | | | Deutsche Bank AG | | | 8/16/17 | | | | (14 | ) |
| USD | | | 4,940 | | | | IDR | | | | 66,350,000 | | | Deutsche Bank AG | | | 8/16/17 | | | | (10 | ) |
| USD | | | 4,768 | | | | IDR | | | | 64,040,000 | | | Deutsche Bank AG | | | 8/16/17 | | | | (10 | ) |
| USD | | | 1,735 | | | | IDR | | | | 23,320,000 | | | Deutsche Bank AG | | | 8/16/17 | | | | (5 | ) |
| USD | | | 5,288 | | | | IDR | | | | 70,920,000 | | | Deutsche Bank AG | | | 8/16/17 | | | | (4 | ) |
| USD | | | 5,240 | | | | IDR | | | | 70,285,000 | | | Deutsche Bank AG | | | 8/16/17 | | | | (4 | ) |
| USD | | | 5,104 | | | | IDR | | | | 68,455,000 | | | Deutsche Bank AG | | | 8/16/17 | | | | (4 | ) |
| USD | | | 5,058 | | | | IDR | | | | 67,840,000 | | | Deutsche Bank AG | | | 8/16/17 | | | | (4 | ) |
| USD | | | 1,632 | | | | IDR | | | | 21,920,000 | | | Deutsche Bank AG | | | 8/16/17 | | | | (3 | ) |
| USD | | | 1,747 | | | | IDR | | | | 23,435,000 | | | Deutsche Bank AG | | | 8/16/17 | | | | (1 | ) |
| USD | | | 1,732 | | | | IDR | | | | 23,225,000 | | | Deutsche Bank AG | | | 8/16/17 | | | | (1 | ) |
| USD | | | 2,942 | | | | IDR | | | | 39,523,454 | | | Goldman Sachs International | | | 8/16/17 | | | | (7 | ) |
| USD | | | 2,839 | | | | IDR | | | | 38,147,044 | | | Goldman Sachs International | | | 8/16/17 | | | | (7 | ) |
| USD | | | 972 | | | | IDR | | | | 13,056,267 | | | Goldman Sachs International | | | 8/16/17 | | | | (2 | ) |
| USD | | | 4,904 | | | | IDR | | | | 65,865,000 | | | JPMorgan Chase Bank N.A. | | | 8/16/17 | | | | (10 | ) |
| USD | | | 4,734 | | | | IDR | | | | 63,575,000 | | | JPMorgan Chase Bank N.A. | | | 8/16/17 | | | | (10 | ) |
| USD | | | 1,621 | | | | IDR | | | | 21,765,000 | | | JPMorgan Chase Bank N.A. | | | 8/16/17 | | | | (3 | ) |
| USD | | | 5,273 | | | | IDR | | | | 70,745,000 | | | UBS AG | | | 8/16/17 | | | | (6 | ) |
| USD | | | 5,089 | | | | IDR | | | | 68,280,000 | | | UBS AG | | | 8/16/17 | | | | (6 | ) |
| USD | | | 5,381 | | | | IDR | | | | 72,160,000 | | | UBS AG | | | 8/16/17 | | | | (4 | ) |
| USD | | | 5,193 | | | | IDR | | | | 69,645,000 | | | UBS AG | | | 8/16/17 | | | | (3 | ) |
| USD | | | 1,742 | | | | IDR | | | | 23,375,000 | | | UBS AG | | | 8/16/17 | | | | (2 | ) |
| USD | | | 1,778 | | | | IDR | | | | 23,840,000 | | | UBS AG | | | 8/16/17 | | | | (1 | ) |
| USD | | | 141,036 | | | | TRY | | | | 504,647 | | | BNP Paribas S.A. | | | 8/21/17 | | | | (185 | ) |
| COP | | | 61,043,400 | | | | USD | | | | 20,000 | | | UBS AG | | | 8/22/17 | | | | (118 | ) |
| USD | | | 65,120 | | | | MXN | | | | 1,234,378 | | | JPMorgan Chase Bank N.A. | | | 8/23/17 | | | | (2,296 | ) |
| USD | | | 9,385 | | | | EUR | | | | 8,300 | | | BNP Paribas S.A. | | | 9/07/17 | | | | (130 | ) |
| USD | | | 15,203 | | | | RUB | | | | 928,201 | | | Credit Suisse International | | | 9/15/17 | | | | (280 | ) |
| USD | | | 5,006 | | | | RUB | | | | 301,705 | | | Credit Suisse International | | | 9/15/17 | | | | (26 | ) |
| USD | | | 126,217 | | | | AUD | | | | 167,000 | | | Goldman Sachs International | | | 9/20/17 | | | | (2,004 | ) |
| USD | | | 126,416 | | | | AUD | | | | 167,000 | | | Goldman Sachs International | | | 9/20/17 | | | | (1,806 | ) |
| USD | | | 405,112 | | | | EUR | | | | 360,000 | | | Barclays Bank PLC | | | 9/20/17 | | | | (7,878 | ) |
See Notes to Financial Statements.
| | | | | | |
| 120 | | BLACKROCK SERIES FUND, INC. | | JUNE 30, 2017 | | |
| | | | |
| Schedule of Investments (continued) | | | BlackRock Total Return Portfolio | |
| | | | | | | | | | | | | | | | | | | | | | |
Currency
Purchased | | | Currency
Sold | | | Counterparty | | Settlement
Date | | | Unrealized
Appreciation
(Depreciation) | |
| USD | | | 40,937 | | | | TRY | | | | 147,617 | | | Bank of America N.A. | | | 9/20/17 | | | $ | (39 | ) |
| USD | | | 194,960 | | | | TRY | | | | 709,557 | | | BNP Paribas S.A. | | | 10/23/17 | | | | (252 | ) |
| TRY | | | 298,443 | | | | USD | | | | 77,423 | | | BNP Paribas S.A. | | | 6/25/18 | | | | (319 | ) |
| | | | | | | | | | | | | | | | | | | | | (40,624 | ) |
| | | | | | | | | | | | | | | | | | | | | | |
Net Unrealized Appreciation | | | | | | | | | | | | | $ | 5,693 | |
| | | | | | | | | | | | | | | | | | | | | | |
Exchange-Traded Options Purchased
| | | | | | | | | | | | | | | | | | | | | | |
| Description | | Put/
Call | | | Expiration
Date | | Strike
Price | | | Contracts | | | Value | |
Euro Dollar 90-Day | | | Put | | | 10/13/17 | | | USD | | | | 98.00 | | | | 52 | | | $ | 5,525 | |
OTC Barrier Options Purchased
| | | | | | | | | | | | | | | | | | | | | | | | | | | | | | | | | | | | | | | | |
| Description | | Put/
Call | | | Type
of Option | | | Counterparty | | Expiration
Date | | Strike
Price | | | Barrier
Price | | | Notional
Amount
(000) | | | Value | |
USD Currency | | | Put | | | | Down-and-Out | | | BNP Paribas S.A. | | 7/03/17 | | | TRY | | | | 3.50 | | | | USD | | | | 3.35 | | | | USD | | | | 34 | | | $ | 27 | |
OTC Options Purchased
| | | | | | | | | | | | | | | | | | | | | | | | | | | | | | | | |
| Description | | Put/
Call | | | Counterparty | | | Expiration
Date | | | Strike Price | | | Notional
Amount (000) | | | Value | |
USD Currency1 | | | Call | | | | Barclays Bank PLC | | | | 7/03/17 | | | | MXN | | | | 19.00 | | | | USD | | | | 17 | | | | — | |
USD Currency1 | | | Call | | | | Morgan Stanley & Co. International PLC | | | | 7/03/17 | | | | MXN | | | | 20.00 | | | | USD | | | | 43 | | | | — | |
USD Currency1 | | | Call | | | | Morgan Stanley & Co. International PLC | | | | 7/03/17 | | | | MXN | | | | 21.50 | | | | USD | | | | 15 | | | | — | |
USD Currency | | | Call | | | | Barclays Bank PLC | | | | 7/07/17 | | | | JPY | | | | 111.00 | | | | USD | | | | 23 | | | $ | 307 | |
USD Currency | | | Call | | | | Deutsche Bank AG | | | | 8/07/17 | | | | RUB | | | | 58.00 | | | | USD | | | | 18 | | | | 594 | |
USD Currency | | | Call | | | | HSBC Bank PLC | | | | 9/01/17 | | | | TWD | | | | 30.50 | | | | USD | | | | 40 | | | | 322 | |
USD Currency | | | Put | | | | Citibank N.A. | | | | 7/03/17 | | | | CNH | | | | 6.79 | | | | USD | | | | 1,088 | | | | 2,993 | |
EUR Currency | | | Put | | | | JPMorgan Chase Bank N.A. | | | | 7/06/17 | | | | MXN | | | | 20.80 | | | | EUR | | | | 24 | | | | 283 | |
USD Currency | | | Put | | | | Citibank N.A. | | | | 7/06/17 | | | | BRL | | | | 3.18 | | | | USD | | | | 28 | | | | — | |
AUD Currency | | | Put | | | | Barclays Bank PLC | | | | 7/27/17 | | | | USD | | | | 0.75 | | | | AUD | | | | 33 | | | | 36 | |
AUD Currency | | | Put | | | | JPMorgan Chase Bank N.A. | | | | 7/27/17 | | | | USD | | | | 0.72 | | | | AUD | | | | 33 | | | | 1 | |
EUR Currency | | | Put | | | | BNP Paribas S.A. | | | | 8/25/17 | | | | USD | | | | 1.12 | | | | EUR | | | | 25 | | | | 91 | |
USD Currency | | | Put | | | | Citibank N.A. | | | | 8/25/17 | | | | TRY | | | | 3.52 | | | | USD | | | | 56 | | | | 531 | |
EUR Currency | | | Put | | | | JPMorgan Chase Bank N.A. | | | | 8/29/17 | | | | MXN | | | | 20.50 | | | | EUR | | | | 21 | | | | 253 | |
Total | | | | | | | | | | | | | | | | | | | | | | | | | | | | | | $ | 5,411 | |
| | | | | | | | | | | | | | | | | | | | | | | | | | | | | | | | |
| | 1 | | Security is valued using significant unobservable inputs and is classified as Level 3 in the fair value hierarchy. |
Exchange-Traded Options Written
| | | | | | | | | | | | | | | | | | | | | | | | |
| Description | | Put/
Call | | | Expiration
Date | | | Strike
Price | | | Contracts | | | Value | |
Euro Dollar 90-Day | | | Put | | | | 10/13/17 | | | | USD | | | | 97.50 | | | | 26 | | | $ | (325 | ) |
Euro Dollar 90-Day | | | Put | | | | 10/13/17 | | | | USD | | | | 97.63 | | | | 52 | | | | (975 | ) |
Total | | | | | | | | | | | | | | | | | | | | | | $ | (1,300 | ) |
| | | | | | | | | | | | | | | | | | | | | | | | |
See Notes to Financial Statements.
| | | | | | |
| | | BLACKROCK SERIES FUND, INC. | | JUNE 30, 2017 | | 121 |
| | | | |
| Schedule of Investments (continued) | | | BlackRock Total Return Portfolio | |
OTC Options Written
| | | | | | | | | | | | | | | | | | | | | | | | | | | | | | | | |
| Description | | Put/
Call | | | Counterparty | | | Expiration
Date | | | Strike
Price | | | Notional Amount
(000) | | | Value | |
USD Currency1 | | | Call | | | | Goldman Sachs International | | | | 7/03/17 | | | | MXN | | | | 22.60 | | | | USD | | | | 30 | | | | — | |
USD Currency1 | | | Call | | | | Morgan Stanley & Co. International PLC | | | | 7/03/17 | | | | MXN | | | | 19.00 | | | | USD | | | | 17 | | | | — | |
USD Currency | | | Call | | | | Citibank N.A. | | | | 7/06/17 | | | | BRL | | | | 3.31 | | | | USD | | | | 28 | | | $ | (157 | ) |
USD Currency | | | Call | | | | Deutsche Bank AG | | | | 7/17/17 | | | | ZAR | | | | 14.00 | | | | USD | | | | 14 | | | | (14 | ) |
USD Currency | | | Call | | | | Citibank N.A. | | | | 7/27/17 | | | | TRY | | | | 3.65 | | | | USD | | | | 56 | | | | (207 | ) |
TRY Currency | | | Call | | | | BNP Paribas S.A. | | | | 7/28/17 | | | | ZAR | | | | 3.68 | | | | TRY | | | | 66 | | | | (328 | ) |
USD Currency | | | Call | | | | Barclays Bank PLC | | | | 8/10/17 | | | | BRL | | | | 3.40 | | | | USD | | | | 16 | | | | (169 | ) |
EUR Currency | | | Call | | | | JPMorgan Chase Bank N.A. | | | | 8/29/17 | | | | MXN | | | | 21.50 | | | | EUR | | | | 21 | | | | (216 | ) |
USD Currency | | | Put | | | | Citibank N.A. | | | | 7/03/17 | | | | CNH | | | | 6.75 | | | | USD | | | | 1,088 | | | | (412 | ) |
USD Currency | | | Put | | | | Deutsche Bank AG | | | | 7/17/17 | | | | ZAR | | | | 13.00 | | | | USD | | | | 14 | | | | (115 | ) |
AUD Currency | | | Put | | | | Barclays Bank PLC | | | | 7/27/17 | | | | USD | | | | 0.72 | | | | AUD | | | | 33 | | | | (1 | ) |
USD Currency | | | Put | | | | Barclays Bank PLC | | | | 8/10/17 | | | | BRL | | | | 3.30 | | | | USD | | | | 16 | | | | (195 | ) |
USD Currency | | | Put | | | | HSBC Bank PLC | | | | 9/01/17 | | | | TWD | | | | 30.00 | | | | USD | | | | 40 | | | | (125 | ) |
Total | | | | | | | | | | | | | | | | | | | | | | | | | | | | | | $ | (1,939 | ) |
| | | | | | | | | | | | | | | | | | | | | | | | | | | | | | | | |
| | 1 | | Security is valued using significant unobservable inputs and is classified as Level 3 in the fair value hierarchy. |
Centrally Cleared Credit Default Swaps — Sell Protection
| | | | | | | | | | | | | | | | | | | | | | |
| Index | | Receive
Fixed
Rate | | | Expiration
Date | | Credit
Rating1 | | | Notional
Amount
(000)2 | | | Unrealized
Depreciation | |
CDX.NA.IG.28.V1 | | | 1.00 | % | | 6/20/22 | | | BBB+ | | | | USD | | | | 188 | | | $ | (43 | ) |
| | 1 | | Using S&P’s rating of the issuer or the underlying securities of the index, as applicable. |
| | 2 | | The maximum potential amount the Fund may pay should a negative credit event take place as defined under the terms of the agreement. |
Centrally Cleared Interest Rate Swaps
| | | | | | | | | | | | | | | | | | | | | | |
Fixed
Rate | | Floating Rate | | | | | Expiration
Date | | | Notional
Amount
(000) | | | Unrealized
Appreciation
(Depreciation) | |
| 7.36%1 | | 28-day MXIBTIIE | | | | | | | 1/28/19 | | | | MXN | | | | 4,421 | | | $ | (1,500 | ) |
| 7.32%2 | | 28-day MXIBTIIE | | | | | | | 2/20/20 | | | | MXN | | | | 3,960 | | | | 3,052 | |
| 7.16%2 | | 28-day MXIBTIIE | | | | | | | 4/29/20 | | | | MXN | | | | 3,760 | | | | 2,240 | |
| 7.45%2 | | 28-day MXIBTIIE | | | | | | | 3/07/22 | | | | MXN | | | | 1,343 | | | | 2,074 | |
| 7.48%2 | | 28-day MXIBTIIE | | | | | | | 3/07/22 | | | | MXN | | | | 671 | | | | 1,063 | |
| 7.47%2 | | 28-day MXIBTIIE | | | | | | | 3/07/22 | | | | MXN | | | | 671 | | | | 1,048 | |
| 7.16%2 | | 28-day MXIBTIIE | | | | | | | 6/01/22 | | | | MXN | | | | 1,590 | | | | 1,338 | |
| 6.32%2 | | 28-day MXIBTIIE | | | | | | | 7/17/25 | | | | MXN | | | | 633 | | | | (1,617 | ) |
| 2.13%2 | | 3-month LIBOR | | | | | | | 8/25/25 | | | | USD | | | | 20 | | | | 59 | |
| 2.27%1 | | 3-month LIBOR | | | | | | | 9/11/25 | | | | USD | | | | 31 | | | | (418 | ) |
| 3.46%2 | | UK RPI All Items Monthly | | | | | | | 10/15/26 | | | | GBP | | | | 137 | | | | 907 | |
| 3.43%2 | | UK RPI All Items Monthly | | | | | | | 10/15/26 | | | | GBP | | | | 131 | | | | 241 | |
| 3.45%2 | | UK RPI All Items Monthly | | | | | | | 10/15/26 | | | | GBP | | | | 133 | | | | 615 | |
| 7.41%2 | | 28-day MXIBTIIE | | | | | | | 5/25/27 | | | | MXN | | | | 912 | | | | 849 | |
| 7.38%2 | | 28-day MXIBTIIE | | | | | | | 5/25/27 | | | | MXN | | | | 148 | | | | 116 | |
| 7.82%2 | | 28-day MXIBTIIE | | | | | | | 3/04/37 | | | | MXN | | | | 322 | | | | 458 | |
| 7.92%2 | | 28-day MXIBTIIE | | | | | | | 5/01/37 | | | | MXN | | | | 419 | | | | 834 | |
| 7.95%2 | | 28-day MXIBTIIE | | | | | | | 5/01/37 | | | | MXN | | | | 386 | | | | 834 | |
| Total | | | | | | | | | | | | | | | | | | | | $ | 12,193 | |
| | | | | | | | | | | | | | | | | | | | | | |
| | 1 | | The Fund pays the fixed rate and receives the floating rate. |
| | 2 | | The Fund pays the floating rate and receives the fixed rate. |
See Notes to Financial Statements.
| | | | | | |
| 122 | | BLACKROCK SERIES FUND, INC. | | JUNE 30, 2017 | | |
| | | | |
| Schedule of Investments (continued) | | | BlackRock Total Return Portfolio | |
OTC Credit Default Swaps — Buy Protection
| | | | | | | | | | | | | | | | | | | | | | | | | | | | | | | | |
| Issuer | | Pay
Fixed
Rate | | | Counterparty | | | Expiration
Date | | | Notional
Amount
(000) | | | Value | | | Premiums
Paid
(Received) | | | Unrealized
Appreciation
(Depreciation) | |
United Mexican States | | | 1.00 | % | | | JPMorgan Chase Bank N.A. | | | | 6/20/20 | | | | USD | | | | 66 | | | $ | (738 | ) | | $ | 344 | | | $ | (1,082 | ) |
United Mexican States | | | 1.00 | % | | | Bank of America N.A. | | | | 9/20/20 | | | | USD | | | | 66 | | | | (654 | ) | | | 533 | | | | (1,187 | ) |
Loews Corp. | | | 1.00 | % | | | Barclays Bank PLC | | | | 12/20/20 | | | | USD | | | | 35 | | | | (1,046 | ) | | | (856 | ) | | | (190 | ) |
Valero Energy Corp. | | | 1.00 | % | | | Morgan Stanley & Co. International PLC | | | | 12/20/20 | | | | USD | | | | 35 | | | | (659 | ) | | | 599 | | | | (1,258 | ) |
Russian Federation | | | 1.00 | % | | | Bank of America N.A. | | | | 12/20/21 | | | | USD | | | | 5 | | | | 111 | | | | 264 | | | | (153 | ) |
Republic of Argentina | | | 5.00 | % | | | Barclays Bank PLC | | | | 6/20/22 | | | | USD | | | | 37 | | | | (2,871 | ) | | | (1,688 | ) | | | (1,183 | ) |
Republic of Argentina | | | 5.00 | % | | | Barclays Bank PLC | | | | 6/20/22 | | | | USD | | | | 10 | | | | (778 | ) | | | (740 | ) | | | (38 | ) |
Republic of Argentina | | | 5.00 | % | | | Barclays Bank PLC | | | | 6/20/22 | | | | USD | | | | 6 | | | | (467 | ) | | | (490 | ) | | | 23 | |
Republic of Argentina | | | 5.00 | % | | | Barclays Bank PLC | | | | 6/20/22 | | | | USD | | | | 6 | | | | (467 | ) | | | (490 | ) | | | 23 | |
Republic of Argentina | | | 5.00 | % | | | Barclays Bank PLC | | | | 6/20/22 | | | | USD | | | | 6 | | | | (467 | ) | | | (482 | ) | | | 15 | |
Republic of South Africa | | | 1.00 | % | | | Bank of America N.A. | | | | 6/20/22 | | | | USD | | | | 30 | | | | 1,289 | | | | 1,464 | | | | (175 | ) |
Republic of South Africa | | | 1.00 | % | | | Barclays Bank PLC | | | | 6/20/22 | | | | USD | | | | 21 | | | | 902 | | | | 1,013 | | | | (111 | ) |
Republic of South Africa | | | 1.00 | % | | | Citibank N.A. | | | | 6/20/22 | | | | USD | | | | 70 | | | | 3,007 | | | | 3,415 | | | | (408 | ) |
Republic of South Africa | | | 1.00 | % | | | Goldman Sachs International | | | | 6/20/22 | | | | USD | | | | 15 | | | | 644 | | | | 730 | | | | (86 | ) |
Republic of South Africa | | | 1.00 | % | | | HSBC Bank PLC | | | | 6/20/22 | | | | USD | | | | 30 | | | | 1,289 | | | | 1,435 | | | | (146 | ) |
Republic of the Philippines | | | 1.00 | % | | | JPMorgan Chase Bank N.A. | | | | 6/20/22 | | | | USD | | | | 104 | | | | (1,181 | ) | | | (257 | ) | | | (924 | ) |
CMBX.NA.9.AAA | | | 0.50 | % | | | Credit Suisse International | | | | 9/17/58 | | | | USD | | | | 20 | | | | 272 | | | | 246 | | | | 26 | |
CMBX.NA.9.AAA | | | 0.50 | % | | | Deutsche Bank AG | | | | 9/17/58 | | | | USD | | | | 20 | | | | 273 | | | | 250 | | | | 23 | |
CMBX.NA.9.AAA | | | 0.50 | % | | | Morgan Stanley & Co. International PLC | | | | 9/17/58 | | | | USD | | | | 90 | | | | 1,225 | | | | 1,333 | | | | (108 | ) |
CMBX.NA.9.AAA | | | 0.50 | % | | | Morgan Stanley & Co. International PLC | | | | 9/17/58 | | | | USD | | | | 10 | | | | 136 | | | | 123 | | | | 13 | |
CMBX.NA.9.AAA | | | 0.50 | % | | | Morgan Stanley & Co. International PLC | | | | 9/17/58 | | | | USD | | | | 10 | | | | 136 | | | | 123 | | | | 13 | |
CMBX.NA.6.AAA | | | 0.50 | % | | | Deutsche Bank AG | | | | 5/11/63 | | | | USD | | | | 40 | | | | (68 | ) | | | (30 | ) | | | (38 | ) |
CMBX.NA.6.AAA | | | 0.50 | % | | | Deutsche Bank AG | | | | 5/11/63 | | | | USD | | | | 40 | | | | (68 | ) | | | 13 | | | | (81 | ) |
CMBX.NA.6.AAA | | | 0.50 | % | | | Deutsche Bank AG | | | | 5/11/63 | | | | USD | | | | 30 | | | | (51 | ) | | | 6 | | | | (57 | ) |
CMBX.NA.6.BBB- | | | 3.00 | % | | | Deutsche Bank AG | | | | 5/11/63 | | | | USD | | | | 20 | | | | 2,327 | | | | 1,837 | | | | 490 | |
CMBX.NA.6.BBB- | | | 3.00 | % | | | J.P. Morgan Securities LLC | | | | 5/11/63 | | | | USD | | | | 10 | | | | 1,163 | | | | 652 | | | | 511 | |
CMBX.NA.6.BBB- | | | 3.00 | % | | | J.P. Morgan Securities LLC | | | | 5/11/63 | | | | USD | | | | 10 | | | | 1,163 | | | | 652 | | | | 511 | |
CMBX.NA.6.BBB- | | | 3.00 | % | | | J.P. Morgan Securities LLC | | | | 5/11/63 | | | | USD | | | | 10 | | | | 1,163 | | | | 1,005 | | | | 158 | |
Total | | | | | | | | | | | | | | | | | | | | | | $ | 5,585 | | | $ | 11,004 | | | $ | (5,419 | ) |
| | | | | | | | | | | | | | | | | | | | | | | | |
OTC Credit Default Swaps — Sell Protection
| | | | | | | | | | | | | | | | | | | | | | | | | | | | | | | | |
| Issuer/Index | | Receive
Fixed
Rate | | | Counterparty | | Expiration
Date | | Credit
Rating1 | | | Notional
Amount
(000)2 | | | Value | | | Premiums
Received | | | Unrealized
Appreciation
(Depreciation) | |
Transocean Ltd. | | | 1.00 | % | | Goldman Sachs International | | 6/20/19 | | | BB- | | | | USD | | | | 50 | | | $ | (928 | ) | | $ | (616 | ) | | $ | (312 | ) |
Transocean Ltd. | | | 1.00 | % | | Goldman Sachs International | | 6/20/19 | | | B+ | | | | USD | | | | 10 | | | | (186 | ) | | | (123 | ) | | | (63 | ) |
United Mexican States | | | 1.00 | % | | Bank of America N.A. | | 6/20/20 | | | BBB+ | | | | USD | | | | 66 | | | | 737 | | | | (399 | ) | | | 1,136 | |
United Mexican States | | | 1.00 | % | | JPMorgan Chase Bank N.A. | | 9/20/20 | | | BBB+ | | | | USD | | | | 66 | | | | 654 | | | | (464 | ) | | | 1,118 | |
CMBX.NA.3.AM | | | 0.50 | % | | Credit Suisse International | | 12/13/49 | | | BBB+ | | | | USD | | | | 21 | | | | (103 | ) | | | (1,891 | ) | | | 1,788 | |
CMBX.NA.4.AM | | | 0.50 | % | | Deutsche Bank AG | | 2/17/51 | | | BBB- | | | | USD | | | | 22 | | | | (127 | ) | | | (2,893 | ) | | | 2,766 | |
CMBX.NA.8.A | | | 2.00 | % | | Goldman Sachs International | | 10/17/57 | | | Not Rated | | | | USD | | | | 10 | | | | (503 | ) | | | (570 | ) | | | 67 | |
CMBX.NA.9.A | | | 2.00 | % | | Credit Suisse International | | 9/17/58 | | | Not Rated | | | | USD | | | | 10 | | | | (371 | ) | | | (520 | ) | | | 149 | |
CMBX.NA.9.A | | | 2.00 | % | | Deutsche Bank AG | | 9/17/58 | | | Not Rated | | | | USD | | | | 10 | | | | (370 | ) | | | (517 | ) | | | 147 | |
CMBX.NA.9.A | | | 2.00 | % | | Deutsche Bank AG | | 9/17/58 | | | Not Rated | | | | USD | | | | 10 | | | | (370 | ) | | | (499 | ) | | | 129 | |
CMBX.NA.9.A | | | 2.00 | % | | J.P. Morgan Securities LLC | | 9/17/58 | | | Not Rated | | | | USD | | �� | | 30 | | | | (1,111 | ) | | | (1,558 | ) | | | 447 | |
See Notes to Financial Statements.
| | | | | | |
| | | BLACKROCK SERIES FUND, INC. | | JUNE 30, 2017 | | 123 |
| | | | |
| Schedule of Investments (continued) | | | BlackRock Total Return Portfolio | |
| | | | | | | | | | | | | | | | | | | | | | | | | | | | | | | | | | | | | | | | |
| Issuer/Index | | | | | | | Receive
Fixed
Rate | | | Counterparty | | Expiration
Date | | | Credit
Rating1 | | | Notional
Amount
(000)2 | | | Value | | | Premiums
Received | | | Unrealized
Appreciation
(Depreciation) | |
CMBX.NA.9.A | | | | | | | | | 2.00% | | | Morgan Stanley & Co. International PLC | | | 9/17/58 | | | | Not Rated | | | | USD | | | | 10 | | | $ | (370 | ) | | $ | (544 | ) | | $ | 174 | |
CMBX.NA.9.A | | | | | | | | | 2.00% | | | Morgan Stanley & Co. International PLC | | | 9/17/58 | | | | Not Rated | | | | USD | | | | 10 | | | | (370 | ) | | | (513 | ) | | | 143 | |
CMBX.NA.9.A | | | | | | | | | 2.00% | | | Morgan Stanley & Co. International PLC | | | 9/17/58 | | | | Not Rated | | | | USD | | | | 10 | | | | (370 | ) | | | (491 | ) | | | 121 | |
CMBX.NA.9.A | | | | | | | | | 2.00% | | | Morgan Stanley & Co. International PLC | | | 9/17/58 | | | | Not Rated | | | | USD | | | | 10 | | | | (370 | ) | | | (230 | ) | | | (140 | ) |
CMBX.NA.9.BBB- | | | | | | | | | 3.00% | | | Credit Suisse International | | | 9/17/58 | | | | Not Rated | | | | USD | | | | 10 | | | | (1,177 | ) | | | (1,057 | ) | | | (120 | ) |
CMBX.NA.9.BBB- | | | | | | | | | 3.00% | | | Morgan Stanley & Co. International PLC | | | 9/17/58 | | | | Not Rated | | | | USD | | | | 20 | | | | (2,355 | ) | | | (2,566 | ) | | | 211 | |
CMBX.NA.9.BBB- | | | | | | | | | 3.00% | | | Morgan Stanley & Co. International PLC | | | 9/17/58 | | | | Not Rated | | | | USD | | | | 10 | | | | (1,177 | ) | | | (1,105 | ) | | | (72 | ) |
CMBX.NA.9.BBB- | | | | | | | | | 3.00% | | | Morgan Stanley & Co. International PLC | | | 9/17/58 | | | | Not Rated | | | | USD | | | | 10 | | | | (1,177 | ) | | | (1,078 | ) | | | (99 | ) |
CMBX.NA.10.A | | | | | | | | | 2.00% | | | Deutsche Bank AG | | | 11/17/59 | | | | A- | | | | USD | | | | 20 | | | | (610 | ) | | | (912 | ) | | | 302 | |
CMBX.NA.10.A | | | | | | | | | 2.00% | | | Deutsche Bank AG | | | 11/17/59 | | | | A- | | | | USD | | | | 10 | | | | (305 | ) | | | (464 | ) | | | 159 | |
CMBX.NA.10.BBB- | | | | | | | | | 3.00% | | | J.P. Morgan Securities LLC | | | 11/17/59 | | | | BBB- | | | | USD | | | | 10 | | | | (1,076 | ) | | | (895 | ) | | | (181 | ) |
Total | | | | | | | | | | | | | | | | | | | | | | | | | | | | | | $ | (12,035 | ) | | $ | (19,905 | ) | | $ | 7,870 | |
| | | | | | | | | | | | | | | | | | | | | | | | | | | | | | | | |
| | 1 | | Using S&P’s rating of the issuer or the underlying securities of the index, as applicable. |
| | 2 | | The maximum potential amount the Fund may pay should a negative credit event take place as defined under the terms of the agreement. |
OTC Interest Rate Swaps
| | | | | | | | | | | | | | | | | | | | | | | | |
Fixed
Rate | | Floating
Rate | | Counterparty | | Expiration
Date | | Notional
Amount
(000) | | | Value | | | Premiums
Paid
(Received) | | | Unrealized
Appreciation
(Depreciation) | |
| 12.85%1 | | 1-day BZDIOVER | | JPMorgan Chase Bank N.A. | | 7/03/17 | | BRL | | | 33 | | | $ | (26 | ) | | | — | | | $ | (26 | ) |
| 13.11%1 | | 1-day BZDIOVER | | Citibank N.A. | | 7/03/17 | | BRL | | | 310 | | | | (361 | ) | | | — | | | | (361 | ) |
| 13.13%1 | | 1-day BZDIOVER | | Bank of America N.A. | | 7/03/17 | | BRL | | | 258 | | | | (313 | ) | | | — | | | | (313 | ) |
| 9.50%1 | | 1-day BZDIOVER | | Bank of America N.A. | | 10/02/17 | | BRL | | | 653 | | | | (18 | ) | | | — | | | | (18 | ) |
| 1.69%1 | | 3-month KRW Certificate of Deposit | | Deutsche Bank AG | | 11/10/17 | | KRW | | | 100,213 | | | | (115 | ) | | | — | | | | (115 | ) |
| 1.92%2 | | 3-month KRW Certificate of Deposit | | Deutsche Bank AG | | 11/10/17 | | KRW | | | 100,213 | | | | 218 | | | $ | 50 | | | | 168 | |
| 8.98%1 | | 1-day BZDIOVER | | Citibank N.A. | | 1/02/18 | | BRL | | | 166 | | | | 78 | | | | — | | | | 78 | |
| 9.98%1 | | 1-day BZDIOVER | | JPMorgan Chase Bank N.A. | | 1/02/18 | | BRL | | | 530 | | | | (363 | ) | | | — | | | | (363 | ) |
| 9.99%1 | | 1-day BZDIOVER | | Citibank N.A. | | 1/02/18 | | BRL | | | 530 | | | | (554 | ) | | | — | | | | (554 | ) |
| 4.55%1 | | 28-day MXIBTIIE | | Barclays Bank PLC | | 3/21/18 | | MXN | | | 408 | | | | 462 | | | | 6 | | | | 456 | |
| 4.85%1 | | 28-day MXIBTIIE | | Bank of America N.A. | | 11/01/18 | | MXN | | | 358 | | | | 578 | | | | 1 | | | | 577 | |
| 7.06%2 | | 28-day MXIBTIIE | | JPMorgan Chase Bank N.A. | | 11/21/18 | | MXN | | | 1,688 | | | | 81 | | | | — | | | | 81 | |
| 7.07%2 | | 28-day MXIBTIIE | | Citibank N.A. | | 11/21/18 | | MXN | | | 1,406 | | | | 102 | | | | — | | | | 102 | |
| 6.98%2 | | 28-day MXIBTIIE | | Citibank N.A. | | 11/28/18 | | MXN | | | 2,400 | | | | (68 | ) | | | (4 | ) | | | (64 | ) |
| 6.98%2 | | 28-day MXIBTIIE | | JPMorgan Chase Bank N.A. | | 11/28/18 | | MXN | | | 1,361 | | | | (38 | ) | | | (2 | ) | | | (36 | ) |
| 9.25%2 | | 1-day BZDIOVER | | Citibank N.A. | | 1/02/19 | | BRL | | | 453 | | | | 427 | | | | — | | | | 427 | |
| 9.28%2 | | 1-day BZDIOVER | | JPMorgan Chase Bank N.A. | | 1/02/19 | | BRL | | | 430 | | | | 446 | | | | — | | | | 446 | |
See Notes to Financial Statements.
| | | | | | |
| 124 | | BLACKROCK SERIES FUND, INC. | | JUNE 30, 2017 | | |
| | | | |
| Schedule of Investments (continued) | | | BlackRock Total Return Portfolio | |
| | | | | | | | | | | | | | | | | | | | | | | | | | |
Fixed
Rate | | Floating
Rate | | Counterparty | | Expiration
Date | | | Notional
Amount
(000) | | | Value | | | Premiums
Paid
(Received) | | | Unrealized
Appreciation
(Depreciation) | |
| 9.73%2 | | 1-day BZDIOVER | | JPMorgan Chase Bank N.A. | | | 1/02/20 | | | BRL | | | 317 | | | $ | 324 | | | | — | | | $ | 324 | |
| 3.27%1 | | 3-month LIBOR | | Deutsche Bank AG | | | 5/16/21 | | | USD | | | 210 | | | | (11,887 | ) | | | — | | | | (11,887 | ) |
| 3.78%2 | | 7-day China Fixing Repo Rates | | Bank of America N.A. | | | 6/02/22 | | | CNY | | | 143 | | | | 30 | | | $ | (1 | ) | | | 31 | |
| 5.73%1 | | 28-day MXIBTIIE | | Bank of America N.A. | | | 1/03/25 | | | MXN | | | 336 | | | | 1,420 | | | | 5 | | | | 1,415 | |
| 6.43%2 | | 28-day MXIBTIIE | | Bank of America N.A. | | | 6/06/25 | | | MXN | | | 262 | | | | (558 | ) | | | (4 | ) | | | (554 | ) |
| 6.33%2 | | 28-day MXIBTIIE | | Citibank N.A. | | | 6/09/25 | | | MXN | | | 131 | | | | (324 | ) | | | (1 | ) | | | (323 | ) |
| 6.33%2 | | 28-day MXIBTIIE | | Citibank N.A. | | | 7/17/25 | | | MXN | | | 316 | | | | (797 | ) | | | (2 | ) | | | (795 | ) |
| 6.31%1 | | 28-day MXIBTIIE | | Deutsche Bank AG | | | 8/11/25 | | | MXN | | | 1,180 | | | | 3,093 | | | | 6 | | | | 3,087 | |
| 6.27%2 | | 28-day MXIBTIIE | | Bank of America N.A. | | | 12/05/25 | | | MXN | | | 36 | | | | (105 | ) | | | (1 | ) | | | (104 | ) |
| Total | | | | | | | | | | | | | | | | $ | (8,268 | ) | | $ | 53 | | | $ | (8,321 | ) |
| | | | | | | | | | | | | | | | | | |
| | 1 | | The Fund pays the fixed rate and receives the floating rate. |
| | 2 | | The Fund pays the floating rate and receives the fixed rate. |
|
Transactions in Options Written for the Six Months Ended June 30, 2017 |
| | | | | | | | | | | | | | | | | | | | | | | | | | | | |
| | | Calls | |
| | | | | Notional (000) | | | | |
| | Contracts | | | AUD | | | EUR | | | MXN | | | TRY | | | USD | | | Premiums
Received | |
Outstanding options, beginning of period | | | — | | | | — | | | | 938 | | | | — | | | | — | | | | 75 | | | $ | 7,399 | |
Options written | | | 33 | | | | 70 | | | | 1,733 | | | | 2,083 | | | | 66 | | | | 713 | | | | 33,445 | |
Options expired | | | (33 | ) | | | (70 | ) | | | (1,918 | ) | | | — | | | | — | | | | (409 | ) | | | (21,332 | ) |
Options closed | | | — | | | | — | | | | (732 | ) | | | (2,083 | ) | | | — | | | | (218 | ) | | | (16,451 | ) |
| | | | |
Outstanding options, end of period | | | — | | | | — | | | | 21 | | | | — | | | | 66 | | | | 161 | | | $ | 3,061 | |
| | | | |
| | | | | | | | | | | | | | | | | | | | | | | | |
| | | Puts | |
| | | | | Notional (000) | | | | |
| | Contracts | | | AUD | | | EUR | | | MXN | | | USD | | | Premiums
Received | |
Outstanding options, beginning of period | | | — | | | | — | | | | — | | | | — | | | | 160 | | | $ | 944 | |
Options written | | | 78 | | | | 68 | | | | 2,549 | | | | 748 | | | | 2,491 | | | | 36,538 | |
Options expired | | | — | | | | (35 | ) | | | (463 | ) | | | (390 | ) | | | (1,220 | ) | | | (4,734 | ) |
Options closed | | | — | | | | — | | | | (2,086 | ) | | | (358 | ) | | | (273 | ) | | | (26,235 | ) |
| | | | |
Outstanding options, end of period | | | 78 | | | | 33 | | | | — | | | | — | | | | 1,158 | | | $ | 6,513 | |
| | | | |
|
Derivative Financial Instruments Categorized by Risk Exposure |
As of period end, the fair values of derivative financial instruments located in the Statements of Assets and Liabilities were as follows:
| | | | | | | | | | | | | | | | | | | | | | | | | | |
| Assets - Derivative Financial Instruments | | Commodity
Contracts | | Credit Contracts | | | Equity
Contracts | | Foreign
Currency
Exchange
Contracts | | | Interest
Rate
Contracts | | | Other Contracts | | | Total | |
Futures contracts | | Net unrealized appreciation1 | | — | | | — | | | — | | | — | | | $ | 19,667 | | | | — | | | $ | 19,667 | |
Forward foreign currency exchange contracts | | Unrealized appreciation on forward foreign currency exchange contracts | | — | | | — | | | — | | $ | 46,317 | | | | — | | | | — | | | | 46,317 | |
Options purchased | | Investments at value — unaffiliated2 | | — | | | — | | | — | | | 5,438 | | | | 5,525 | | | | — | | | | 10,963 | |
Swaps - centrally cleared | | Net unrealized appreciation1 | | — | | | — | | | — | | | — | | | | 13,965 | | | $ | 1,763 | | | | 15,728 | |
Swaps - OTC | | Unrealized appreciation on OTC swaps; Swap premiums paid | | — | | $ | 26,700 | | | — | | | — | | | | 7,260 | | | | — | | | | 33,960 | |
| | | |
Total | | | | — | | $ | 26,700 | | | — | | $ | 51,755 | | | $ | 46,417 | | | $ | 1,763 | | | $ | 126,635 | |
| | | |
| | 1 | | Includes cumulative appreciation on futures contracts and centrally cleared swaps, if any, as reported in the Schedule of Investments. Only current day’s variation margin is reported within the Statements of Assets and Liabilities. |
| | 2 | | Includes options purchased at value as reported in the Schedule of Investments. |
See Notes to Financial Statements.
| | | | | | |
| | | BLACKROCK SERIES FUND, INC. | | JUNE 30, 2017 | | 125 |
| | | | |
| Schedule of Investments (continued) | | | BlackRock Total Return Portfolio | |
| | | | | | | | | | | | | | | | | | | | | | | | |
| Liabilities - Derivative Financial Instruments | | Commodity
Contracts | | Credit
Contracts | | | Equity
Contracts | | Foreign
Currency
Exchange
Contracts | | | Interest
Rate
Contracts | | | Other
Contracts | | Total | |
Futures contracts | | Net unrealized depreciation1 | | — | | | — | | | — | | | — | | | $ | 18,954 | | | — | | $ | 18,954 | |
Forward foreign currency exchange contracts | | Unrealized depreciation on forward foreign currency exchange contracts | | — | | | — | | | — | | $ | 40,624 | | | | — | | | — | | | 40,624 | |
Options written | | Options written, at value | | — | | | — | | | — | | | 1,939 | | | | 1,300 | | | — | | | 3,239 | |
Swaps - centrally cleared | | Net unrealized depreciation1 | | — | | $ | 43 | | | — | | | — | | | | 3,535 | | | — | | | 3,578 | |
Swaps - OTC | | Unrealized depreciation on OTC swaps; Swap premiums received | | — | | | 33,150 | | | — | | | — | | | | 15,528 | | | — | | | 48,678 | |
| | | |
Total | | | | — | | $ | 33,193 | | | — | | $ | 42,563 | | | $ | 39,317 | | | — | | $ | 115,073 | |
| | | |
| | 1 | | Includes cumulative depreciation on futures contracts and centrally cleared swaps, if any, as reported in the Schedule of Investments. Only current day’s variation margin is reported within the Statements of Assets and Liabilities. |
For the six months ended June 30, 2017, the effect of derivative financial instruments in the Statements of Operations were as follows:
| | | | | | | | | | | | | | | | | | | | | | | | |
| Net Realized Gain (Loss) from: | | Commodity
Contracts | | Credit
Contracts | | | Equity
Contracts | | Foreign
Currency
Exchange
Contracts | | | Interest
Rate
Contracts | | | Other Contracts | | | Total | |
Futures contracts | | — | | | — | | | — | | | — | | | $ | 160,509 | | | | — | | | $ | 160,509 | |
Foreign currency transactions | | — | | | — | | | — | | $ | (14,184 | ) | | | — | | | | — | | | | (14,184 | ) |
Options purchased2 | | — | | | — | | | — | | | (38,029 | ) | | | (27,087 | ) | | | — | | | | (65,116 | ) |
Options written | | — | | | — | | | — | | | 17,049 | | | | 8,351 | | | | — | | | | 25,400 | |
Swaps | | — | | $ | (28,771 | ) | | — | | | (15,327 | ) | | | 5,411 | | | | — | | | | (38,687 | ) |
| | | |
Total | | — | | $ | (28,771 | ) | | — | | $ | (50,491 | ) | | $ | 147,184 | | | | — | | | $ | 67,922 | |
| | | |
| | | | | | | |
| | | | | | | | | | | | | | | | | | | | | | | | |
| Net Change in Unrealized Appreciation (Depreciation) on: | |
Futures contracts | | — | | | — | | | — | | | — | | | $ | 8,525 | | | | — | | | $ | 8,525 | |
Foreign currency translations | | — | | | — | | | — | | $ | (17,809 | ) | | | — | | | | — | | | | (17,809 | ) |
Options purchased2 | | — | | | — | | | — | | | (8,148 | ) | | | (8,854 | ) | | | — | | | | (17,002 | ) |
Options written | | — | | | — | | | — | | | (1,480 | ) | | | 2,157 | | | | — | | | | 677 | |
Swaps | | — | | $ | (22,297 | ) | | — | | | — | | | | 42,173 | | | $ | 4,927 | | | | 24,803 | |
| | | |
Total | | — | | $ | (22,297 | ) | | — | | $ | (27,437 | ) | | $ | 44,001 | | | $ | 4,927 | | | $ | (806 | ) |
| | | |
| | 2 | | Options purchased are included in the net realized gain (loss) from investments and the net change in unrealized appreciation (depreciation) on investments. |
|
Average Quarterly Balances of Outstanding Derivative Financial Instruments |
| | | | |
Futures contracts: | | | | |
Average notional value of contracts - long | | $ | 5,953,286 | |
Average notional value of contracts - short | | $ | 4,577,975 | |
Forward foreign currency exchange contracts: | | | | |
Average amounts purchased - in USD | | $ | 3,573,495 | |
Average amounts sold - USD | | $ | 2,603,037 | |
Options: | | | | |
Average value of option contracts purchased | | $ | 18,261 | |
Average value of option contracts written | | $ | 3,190 | |
Credit default swaps: | | | | |
Average notional value - buy protection | | $ | 1,819,384 | |
Average notional value - sell protection | | $ | 485,500 | |
Interest rate swaps: | | | | |
Average notional value - pays fixed rate | | $ | 1,901,404 | |
Average notional value - receives fixed rate | | $ | 2,397,167 | |
Total return swaps: | | | | |
Average notional value | | $ | 914,784 | |
For more information about the Fund’s investment risks regarding derivative financial instruments, refer to the Notes to Financial Statements.
See Notes to Financial Statements.
| | | | | | |
| 126 | | BLACKROCK SERIES FUND, INC. | | JUNE 30, 2017 | | |
| | | | |
| Schedule of Investments (continued) | | | BlackRock Total Return Portfolio | |
|
Derivative Financial Instruments - Offsetting as of Period End |
The Fund’s derivative assets and liabilities (by type) were as follows:
| | | | | | | | |
| | | Assets | | | Liabilities | |
Derivative Financial Instruments: | | | | | | | | |
Futures contracts | | $ | 9,605 | | | $ | 7,074 | |
Forward foreign currency exchange contracts | | | 46,317 | | | | 40,624 | |
Options | | | 10,963 | 1 | | | 3,239 | |
Swaps - Centrally cleared | | | — | | | | 4,727 | |
Swaps - OTC2 | | | 33,960 | | | | 48,678 | |
| | | | |
Total derivative assets and liabilities in the Statements of Assets and Liabilities | | $ | 100,845 | | | $ | 104,342 | |
Derivatives not subject to a Master Netting Agreement or similar agreement (“MNA”) | | | (15,130 | ) | | | (13,101 | ) |
| | | | |
Total derivative assets and liabilities subject to an MNA | | $ | 85,715 | | | $ | 91,241 | |
| | | | |
| | 1 | | Includes options purchased at value which is included in Investments at value - unaffiliated in the Statements of Assets and Liabilities and reported in the Schedule of Investments. |
| | 2 | | Includes unrealized appreciation (depreciation) on OTC swaps and swap premiums paid/received in the Statements of Assets and Liabilities. |
The following tables present the Fund’s derivative assets and liabilities by counterparty net of amounts available for offset under an MNA and net of the related collateral received and pledged by the Fund.
| | | | | | | | | | | | | | | | |
| Counterparty | | Derivative Assets
Subject to an MNA by
Counterparty | | | Derivatives Available
for Offset1 | | | Non-cash
Collateral
Received | | Cash
Collateral
Received | | Net Amount of
Derivative Assets2 | |
Bank of America N.A. | | $ | 5,666 | | | $ | (3,601 | ) | | — | | — | | $ | 2,065 | |
Barclays Bank PLC | | | 2,636 | | | | (2,636 | ) | | — | | — | | | — | |
BNP Paribas S.A. | | | 11,497 | | | | (7,974 | ) | | — | | — | | | 3,523 | |
Citibank N.A. | | | 12,143 | | | | (4,479 | ) | | — | | — | | | 7,664 | |
Credit Suisse International | | | 4,040 | | | | (3,894 | ) | | — | | — | | | 146 | |
Deutsche Bank AG | | | 21,340 | | | | (21,222 | ) | | — | | — | | | 118 | |
Goldman Sachs International | | | 6,561 | | | | (6,561 | ) | | — | | — | | | — | |
HSBC Bank PLC | | | 2,420 | | | | (317 | ) | | — | | — | | | 2,103 | |
J.P. Morgan Securities LLC | | | 3,936 | | | | (2,634 | ) | | — | | — | | | 1,302 | |
JPMorgan Chase Bank N.A. | | | 8,057 | | | | (8,057 | ) | | — | | — | | | — | |
Morgan Stanley & Co. International PLC | | | 4,170 | | | | (4,170 | ) | | — | | — | | | — | |
Royal Bank of Scotland PLC | | | 3,249 | | | | (3,249 | ) | | — | | — | | | — | |
| | | | |
Total | | $ | 85,715 | | | $ | (68,794 | ) | | — | | — | | $ | 16,921 | |
| | | | |
| | | | | | | | | | | | | | | | |
| Counterparty | | Derivative Liabilities
Subject to an MNA by
Counterparty | | | Derivatives Available
for Offset1 | | | Non-cash
Collateral
Pledged | | Cash
Collateral
Pledged | | Net Amount of
Derivative Liabilities3 | |
Bank of America N.A. | | $ | 3,601 | | | $ | (3,601 | ) | | — | | — | | | — | |
Barclays Bank PLC | | | 15,193 | | | | (2,636 | ) | | — | | — | | $ | 12,557 | |
BNP Paribas S.A. | | | 7,974 | | | | (7,974 | ) | | — | | — | | | — | |
Citibank N.A. | | | 4,479 | | | | (4,479 | ) | | — | | — | | | — | |
Credit Suisse International | | | 3,894 | | | | (3,894 | ) | | — | | — | | | — | |
Deutsche Bank AG | | | 21,222 | | | | (21,222 | ) | | — | | — | | | — | |
Goldman Sachs International | | | 8,218 | | | | (6,561 | ) | | — | | — | | | 1,657 | |
HSBC Bank PLC | | | 317 | | | | (317 | ) | | — | | — | | | — | |
J.P. Morgan Securities LLC | | | 2,634 | | | | (2,634 | ) | | — | | — | | | — | |
JPMorgan Chase Bank N.A. | | | 8,221 | | | | (8,057 | ) | | — | | — | | | 164 | |
Morgan Stanley & Co. International PLC | | | 8,494 | | | | (4,170 | ) | | — | | — | | | 4,324 | |
Royal Bank of Scotland PLC | | | 3,800 | | | | (3,249 | ) | | — | | — | | | 551 | |
UBS AG | | | 3,194 | | | | — | | | — | | — | | | 3,194 | |
| | | | |
Total | | $ | 91,241 | | | $ | (68,794 | ) | | — | | — | | $ | 22,447 | |
| | | | |
| | 1 | | The amount of derivatives available for offset is limited to the amount of assets and/or liabilities that are subject to an MNA. |
| | 2 | | Net amount represents the net amount receivable from the counterparty in the event of default. |
| | 3 | | Net amount represents the net amount payable due to the counterparty in the event of default. |
See Notes to Financial Statements.
| | | | | | |
| | | BLACKROCK SERIES FUND, INC. | | JUNE 30, 2017 | | 127 |
| | | | |
| Schedule of Investments (continued) | | | BlackRock Total Return Portfolio | |
|
Fair Value Hierarchy as of Period End |
Various inputs are used in determining the fair value of investments and derivative financial instruments. For information about the Fund’s policy regarding valuation of investments and derivative financial instruments, refer to the Notes to Financial Statements.
The following tables summarize the Fund’s investments and derivative financial instruments categorized in the disclosure hierarchy:
| | | | | | | | | | | | | | | | | | | | |
| | | Level 1 | | Level 2 | | Level 3 | | Total |
Assets: | | | | | | | | | | | | | | | | | | | | |
Investments: | | | | | | | | | | | | | | | | | | | | |
Long-Term Investments1: | | | | | | | | | | | | | | | | | | | | |
Asset-Backed Securities | | | | — | | | | $ | 5,047,351 | | | | $ | 1,478,216 | | | | $ | 6,525,567 | |
Corporate Bonds | | | | — | | | | | 15,749,695 | | | | | — | | | | | 15,749,695 | |
Floating Rate Loan Interests | | | | — | | | | | 188,138 | | | | | 195,573 | | | | | 383,711 | |
Foreign Agency Obligations | | | | — | | | | | 220,834 | | | | | — | | | | | 220,834 | |
Foreign Government Obligations | | | | — | | | | | 2,541,390 | | | | | — | | | | | 2,541,390 | |
Investment Companies | | | $ | 551,554 | | | | | — | | | | | — | | | | | 551,554 | |
Non-Agency Mortgage-Backed Securities | | | | — | | | | | 2,952,138 | | | | | 856,697 | | | | | 3,808,835 | |
Other Interests | | | | — | | | | | — | | | | | — | | | | | — | |
Preferred Securities | | | | 179,704 | | | | | 113,084 | | | | | — | | | | | 292,788 | |
Taxable Municipal Bonds | | | | — | | | | | 3,522,261 | | | | | — | | | | | 3,522,261 | |
U.S. Government Sponsored Agency Securities | | | | — | | | | | 24,974,595 | | | | | 23,574 | | | | | 24,998,169 | |
U.S. Treasury Obligations | | | | — | | | | | 11,119,590 | | | | | — | | | | | 11,119,590 | |
Short-Term Securities: | | | | | | | | | | | | | | | | | | | | |
Borrowed Bond Agreements | | | | — | | | | | 225,245 | | | | | — | | | | | 225,245 | |
Money Market Funds | | | | 288,048 | | | | | — | | | | | — | | | | | 288,048 | |
Options Purchased: | | | | | | | | | | | | | | | | | | | | |
Foreign currency exchange contracts | | | | — | | | | | 5,438 | | | | | — | | | | | 5,438 | |
Interest rate contracts | | | | 5,525 | | | | | — | | | | | — | | | | | 5,525 | |
Liabilities: | | | | | | | | | | | | | | | | | | | | |
Investments: | | | | | | | | | | | | | | | | | | | | |
Borrowed Bonds | | | | — | | | | | (221,910 | ) | | | | — | | | | | (221,910 | ) |
TBA Sale Commitments | | | | — | | | | | (9,822,102 | ) | | | | — | | | | | (9,822,102 | ) |
| | | | | |
Total | | | $ | 1,024,831 | | | | $ | 56,615,747 | | | | $ | 2,554,060 | | | | $ | 60,194,638 | |
| | | | | |
1 See above Schedule of Investments for values in each industry. | |
| | | | | | | | | | | | | | | | | | | | |
Derivative Financial Instruments2 | | | | | | | | | | | | | | | | | | | | |
Assets: | | | | | | | | | | | | | | | | | | | | |
Credit contracts | | | | — | | | | $ | 10,663 | | | | | — | | | | $ | 10,663 | |
Foreign Currency Exchange Contracts | | | | — | | | | | 46,317 | | | | | — | | | | | 46,317 | |
Interest rate contracts | | | $ | 19,667 | | | | | 21,157 | | | | | — | | | | | 40,824 | |
Other contracts | | | | — | | | | | 1,763 | | | | | — | | | | | 1,763 | |
Liabilities: | | | | | | | | | | | | | | | | | | | | |
Credit contracts | | | | — | | | | | (8,255 | ) | | | | — | | | | | (8,255 | ) |
Foreign Currency Exchange Contracts | | | | — | | | | | (42,563 | ) | | | | — | | | | | (42,563 | ) |
Interest rate contracts | | | | (20,254 | ) | | | | (19,048 | ) | | | | — | | | | | (39,302 | ) |
| | | | | |
Total | | | $ | (587 | ) | | | $ | 10,034 | | | | | — | | | | $ | 9,447 | |
| | | | | |
| | 2 | | Derivative financial instruments are swaps, future contracts, forward foreign currency exchange contracts and options written. Swaps, futures contracts and forward foreign currency exchange contracts are valued at the unrealized appreciation (depreciation) on the instrument and options written are shown at value. |
See Notes to Financial Statements.
| | | | | | |
| 128 | | BLACKROCK SERIES FUND, INC. | | JUNE 30, 2017 | | |
| | | | |
| Schedule of Investments (concluded) | | | BlackRock Total Return Portfolio | |
The Fund may hold assets and/or liabilities in which the fair value approximates the carrying amount or face value, including accrued interest, for financial statement purposes. As of period end, reverse repurchase agreements of $7,388,836 are categorized as Level 2 within the disclosure hierarchy.
During the six months ended June 30, 2017, there were no transfers between Level 1 and Level 2.
A reconciliation of Level 3 investments is presented when the Fund had a significant amount of Level 3 investments at the beginning and/or end of the period in relation to net assets. The following table is a reconciliation of Level 3 investments for which significant unobservable inputs were used in determining fair value:
| | | | | | | | | | | | | | | | | | | | | | | | |
| | | Asset-
Backed
Securities | | | Floating
Rate Loan
Interests | | | Non-Agency
Mortgage-Backed
Securities | | | Options
Purchased | | | U.S.
Government
Sponsored
Agency
Securities | | | Total | |
Assets: | | | | | | | | | | | | | | | | | | | | | | | | |
Opening Balance, as of December 31, 2016 | | $ | 1,579,936 | | | | — | | | $ | 566,628 | | | | — | | | | — | | | $ | 2,146,564 | |
Transfers into Level 3 | | | — | | | | — | | | | 196,549 | | | | — | | | | — | | | | 196,549 | |
Transfers out of Level 31 | | | (1,179,245 | ) | | | — | | | | (20,000 | ) | | | — | | | | — | | | | (1,199,245 | ) |
Accrued discounts/premiums | | | 150 | | | $ | 32 | | | | 1,444 | | | | — | | | | — | | | | 1,626 | |
Net realized gain (loss) | | | 454 | | | | — | | | | 5,844 | | | | — | | | $ | 25 | | | | 6,323 | |
Net change in unrealized appreciation (depreciation)2,3 | | | (730 | ) | | | (208 | ) | | | (7,921 | ) | | $ | (756 | ) | | | (223 | ) | | | (9,838 | ) |
Purchases | | | 1,098,750 | | | | 195,749 | | | | 367,982 | | | | 756 | | | | 33,896 | | | | 1,697,133 | |
Sales | | | (21,099 | ) | | | — | | | | (253,829 | ) | | | — | | | | (10,124 | ) | | | (285,052 | ) |
| | | | |
Closing Balance, as of June 30, 2017 | | $ | 1,478,216 | | | $ | 195,573 | | | $ | 856,697 | | | | — | | | $ | 23,574 | | | $ | 2,554,060 | |
| | | | |
Net change in unrealized appreciation (depreciation) on investments still held at June 30, 20173 | | $ | (730 | ) | | $ | (208 | ) | | $ | (7,180 | ) | | $ | (756 | ) | | $ | (222 | ) | | $ | (9,096 | ) |
| | | | |
| | 1 | | As of December 31, 2016, the Fund used significant unobservable inputs in determining the value of certain investments. As of June 30, 2017, the Fund used observable inputs in determining the value of the same investments. As a result, investments at beginning of period value were transferred from Level 3 to Level 2 in the disclosure hierarchy. |
| | 2 | | Included in the related net change in unrealized appreciation (depreciation) in the Statements of Operations. |
| | 3 | | Any difference between net change in unrealized appreciation (depreciation) and net change in unrealized appreciation (depreciation) on investments still held at June 30, 2017 is generally due to investments no longer held or categorized as level 3 at period end. |
The Fund’s investments that are categorized as Level 3 were valued utilizing third party pricing information without adjustment. Such valuations are based on unobservable inputs. A significant change in third party information could result in a significantly lower or higher value of such Level 3 investments.
See Notes to Financial Statements.
| | | | | | |
| | | BLACKROCK SERIES FUND, INC. | | JUNE 30, 2017 | | 129 |
| | | | |
| Schedule of Investments June 30, 2017 (Unaudited) | | | BlackRock U.S. Government Bond Portfolio | |
| | | (Percentages shown are based on Net Assets) | |
| | | | | | | | | | | | |
| Asset-Backed Securities | | | | | Par
(000) | | | Value | |
Arbor Realty Commercial Real Estate Notes Ltd., Series 2016-FL1A, Class A,
2.86%, 9/15/26 (a)(b)(c) | | | USD | | | | 170 | | | $ | 170,000 | |
Bsprt Issuer Ltd., Series 2017-FL1, Class A, 2.43%, 6/15/27 (a)(b)(c) | | | | | | | 170 | | | | 170,213 | |
Dryden XXVIII Senior Loan Fund, Series 2013-28A, Class A1L, 2.28%, 8/15/25 (a)(b) | | | | | | | 500 | | | | 500,445 | |
Invitation Homes Trust, Series 2014-SFR3, Class A, 2.41%, 12/17/31 (a)(b) | | | | | | | 19 | | | | 18,717 | |
OCP CLO Ltd., Series 2012-2A, Class A1R, 2.57%, 11/22/25 (a)(b) | | | | | | | 600 | | | | 602,303 | |
Tricon American Homes Trust, Series 2015-SFR1, Class A, 2.42%, 5/17/32 (a)(b) | | | | | | | 178 | | | | 178,951 | |
Washington Mill CLO Ltd., Series 2014-1A, Class A1R, 2.38%, 4/20/26 (a)(b) | | | | | | | 400 | | | | 399,801 | |
Total Asset-Backed Securities — 3.5% | | | | | | | | | | | 2,040,430 | |
| | | | | | | | | | | | |
| Corporate Bonds | | | | | | | | | |
Electric Utilities — 0.1% | | | | | | | | | | | | |
Southern Co. Gas Capital Corp., 4.40%, 5/30/47 | | | | | | | 40 | | | | 40,797 | |
| | | | | | | | | | | | |
| Foreign Government Obligations | | | | | | | | | |
Mexico — 1.1% | | | | | | | | | | | | |
United Mexican States, Series M, 5.00%, 12/11/19 | | | MXN | | | | 117 | | | | 618,590 | |
| | | | | | | | | | | | |
| Non-Agency Mortgage-Backed Securities | | | | | | | | | |
Commercial Mortgage-Backed Securities — 2.1% | | | | | | | | | | | | |
BHMS Mortgage Trust, Series 2014-ATLS, Class AFL, 2.49%, 7/05/33 (a)(b) | | | USD | | | | 600 | | | | 600,000 | |
Credit Suisse Mortgage Capital Certificates, | | | | | | | | | | | | |
Series 2016-MFF, Class A, 2.76%, 11/15/33 (a)(b) | | | | | | | 100 | | | | 100,312 | |
GAHR Commercial Mortgage Trust, | | | | | | | | | | | | |
Series 2015-NRF, Class AFL1, 2.29%, 12/15/34 (a)(b) | | | | | | | 146 | | | | 146,654 | |
LMREC, Inc., Series 2016-CRE2, Class A, 2.71%, 11/24/31 (a)(b) | | | | | | | 100 | | | | 100,750 | |
RAIT Trust, Series 2017-FL7, Class A, 2.10%, 6/15/37 (a)(b) | | | | | | | 250 | | | | 250,000 | |
| | | | | | | | | | | | |
| | | | | | | | | | | | 1,197,716 | |
Interest Only Commercial Mortgage-Backed Securities — 0.8% | |
CFCRE Commercial Mortgage Trust, Series 2016-C4, Class XA, 1.92%, 5/10/58 (b) | | | | | | | 630 | | | | 71,523 | |
Commercial Mortgage Pass-Through Certificates, Series 2015-CR24, Class XA, 1.01%,8/10/48 (b) | | | | | | | 1,176 | | | | 62,591 | |
Core Industrial Trust: | | | | | | | | | | | | |
Series 2015-CALW, Class XA, 0.94%, 2/10/34 (a)(b) | | | | | | | 3,120 | | | | 103,631 | |
Series 2015-TEXW, Class XA, 0.90%, 2/10/34 (a)(b) | | | | | | | 2,600 | | | | 82,506 | |
Series 2015-WEST, Class XA, 1.08%, 2/10/37 (a)(b) | | | | | | | 1,300 | | | | 78,088 | |
| | | | | | | | | | | | |
| Non-Agency Mortgage-Backed Securities | | | | | Par
(000) | | | Value | |
Interest Only Commercial Mortgage-Backed Securities (continued) | |
FREMF Mortgage Trust, Series 2015-K718, Class X2A, 0.10%, 2/25/22 (a)(b) | | | USD | | | | 18,595 | | | | 69,150 | |
| | | | | | | | | | | | |
| | | | | | | | | | | | 467,489 | |
Total Non-Agency Mortgage-Backed Securities — 2.9% | | | | | | | | 1,665,205 | |
| | | | | | | | | | | | |
| U.S. Government Sponsored Agency Securities | | | | | | | | | |
Agency Obligations — 1.3% | | | | | | | | | | | | |
Fannie Mae, Series 2011-8, Class ZA, 4.00%, 2/25/41 | | | | | | | 258 | | | | 271,505 | |
Federal Home Loan Bank, 4.00%, 4/10/28 | | | | | | | 400 | | | | 442,434 | |
| | | | | | | | | | | | |
| | | | | | | | | | | | 713,939 | |
Collateralized Mortgage Obligations — 0.3% | | | | | | | | | | | | |
Ginnie Mae, Series 2014-107, Class WX,
6.80%, 7/20/39 (b) | | | | | | | 166 | | | | 191,133 | |
Interest Only Commercial Mortgage-Backed Securities — 1.7% | | | | | |
Fannie Mae, Series 2016-M4, Class X2,
2.80%, 1/25/39 (b) | | | | | | | 541 | | | | 64,968 | |
Freddie Mac: | | | | | | | | | | | | |
Series K064, Class X1,
0.75%, 3/25/27 (b) | | | | | | | 1,200 | | | | 59,347 | |
Series K718, Class X1,
0.77%, 1/25/22 (b) | | | | | | | 330 | | | | 8,307 | |
Ginnie Mae: | | | | | | | | | | | | |
Series 2002-83, Class IO,
0.00%, 10/16/42-11/16/43 (b)(c)(d) | | | | | | | 2,518 | | | | 97 | |
Series 2016-137, Class IO,
0.95%, 10/16/56 (b) | | | | 593 | | | | 45,399 | |
Series 2016-140, Class IO,
0.94%, 5/16/58 (b) | | | | 594 | | | | 44,548 | |
Series 2016-143, Class IO,
0.97%, 10/16/56 | | | | 560 | | | | 44,353 | |
Series 2016-176, Class IO,
1.01%, 8/16/58 (b) | | | | 1,193 | | | | 103,890 | |
Series 2017-24, Class IO,
0.87%, 12/16/56 (b) | | | | 298 | | | | 21,749 | |
Series 2017-30, Class IO,
0.76%, 8/16/58 (b) | | | | 637 | | | | 44,474 | |
Series 2017-35, Class IO,
0.71%, 3/30/47 (b) | | | | 1,056 | | | | 74,381 | |
Series 2017-44, Class IO,
0.70%, 4/17/51 (b) | | | | 637 | | | | 42,174 | |
Series 2017-53, Class IO,
0.69%, 12/15/56 (b) | | | | 3,989 | | | | 267,154 | |
Series 2017-54, Class IO,
0.68%, 12/31/49 (b) | | | | 414 | | | | 29,158 | |
Series 2017-61, Class IO,
0.77%, 10/16/56 (b) | | | | 429 | | | | 36,812 | |
Series 2017-64, Class IO,
0.72%, 10/16/56 (b) | | | | 304 | | | | 22,235 | |
Series 2017-72, Class IO,
0.68%, 4/16/57 (b) | | | | 1,124 | | | | 79,488 | |
| | | | | | | | | | | | |
| | | | | | | | | | | | 988,534 | |
See Notes to Financial Statements.
| | | | | | |
| 130 | | BLACKROCK SERIES FUND, INC. | | JUNE 30, 2017 | | |
| | | | |
| Schedule of Investments (continued) | | | BlackRock U.S. Government Bond Portfolio | |
| | | | |
| | | | | | | | | | | | |
| U.S. Government Sponsored Agency Securities | | | | | Par
(000) | | | Value | |
Mortgage-Backed Securities — 74.3% | | | | | | | | | | | | |
Fannie Mae Mortgage-Backed Securities: | | | | | | | | | | | | |
2.50%, 4/01/30-7/01/32 (e) | | | USD | | | | 2,347 | | | $ | 2,360,535 | |
3.00%, 4/01/29-7/01/47 (e) | | | | | | | 9,188 | | | | 9,252,239 | |
3.50%, 7/01/26-7/01/47 (e) | | | | | | | 5,190 | | | | 5,360,074 | |
4.00%, 2/01/25-7/01/47 (e) | | | | | | | 2,360 | | | | 2,502,774 | |
4.50%, 6/01/26-7/01/47 (e) | | | | | | | 752 | | | | 809,660 | |
5.00%, 2/01/35-12/01/43 | | | | | | | 346 | | | | 379,097 | |
5.50%, 11/01/21-9/01/39 | | | | | | | 460 | | | | 508,960 | |
6.00%, 4/01/35-7/01/47 (e) | | | | | | | 376 | | | | 427,469 | |
6.50%, 5/01/40 | | | | | | | 69 | | | | 76,710 | |
Freddie Mac Mortgage-Backed Securities: | | | | | | | | | | | | |
2.50%, 3/01/30-7/01/32 (e) | | | | | | | 546 | | | | 549,918 | |
3.00%, 1/01/30-7/01/47 (e) | | | | | | | 6,763 | | | | 6,767,606 | |
3.50%, 7/01/32-7/01/47 (e) | | | | | | | 2,394 | | | | 2,465,011 | |
4.00%, 8/01/40-7/01/47 (e) | | | | | | | 1,657 | | | | 1,744,416 | |
4.50%, 2/01/39-7/01/47 (e) | | | | | | | 517 | | | | 554,483 | |
5.00%, 11/01/41 | | | | | | | 162 | | | | 177,223 | |
5.50%, 6/01/41 | | | | | | | 152 | | | | 168,982 | |
8.00%, 3/01/30-6/01/31 | | | | | | | 16 | | | | 16,639 | |
Ginnie Mae Mortgage-Backed Securities: | | | | | | | | | | | | |
3.00%, 7/15/47 (e) | | | | | | | 2,082 | | | | 2,103,036 | |
3.50%, 12/20/41-7/15/47 (e) | | | | | | | 2,598 | | | | 2,694,349 | |
4.00%, 10/20/40-7/15/47 (e) | | | | | | | 1,858 | | | | 1,958,262 | |
4.50%, 12/20/39-7/15/47 (e) | | | | | | | 1,600 | | | | 1,721,818 | |
5.00%, 7/15/39-7/20/44 | | | | | | | 119 | | | | 130,869 | |
| | | | | | | | | | | | |
| | | | | | | | | | | | 42,730,130 | |
Total U.S. Government Sponsored Agency Securities — 77.6% | | | | 44,623,736 | |
| | | | | | | | | | | | |
| U.S. Treasury Obligations | | | | | | | | | |
U.S. Treasury Bonds: | | | | | | | | | | | | |
2.13%, 3/31/24 | | | | | | | 1,621 | | | | 1,622,203 | |
2.88%, 11/15/46 | | | | | | | 1,427 | | | | 1,434,860 | |
3.00%, 2/15/47 (f) | | | | | | | 1,382 | | | | 1,425,619 | |
3.00%, 5/15/47 (f) | | | | | | | 892 | | | | 920,572 | |
U.S. Treasury Notes: | | | | | | | | | | | | |
1.25%, 3/31/19-5/31/19 (f) | | | | | | | 5,856 | | | | 5,842,332 | |
1.63%, 3/15/20 | | | | | | | 2,935 | | | | 2,944,286 | |
1.50%, 4/15/20-5/15/20 | | | | | | | 4,921 | | | | 4,916,947 | |
1.88%, 3/31/22-4/30/22 | | | | | | | 4,742 | | | | 4,742,925 | |
1.75%, 5/31/22 (f) | | | | | | | 1,593 | | | | 1,583,667 | |
2.00%, 4/30/24-11/15/26 (f) | | | | | | | 3,519 | | | | 3,478,362 | |
2.25%, 2/15/27 | | | | | | | 767 | | | | 763,435 | |
2.38%, 5/15/27 (f) | | | | | | | 253 | | | | 254,601 | |
Total U.S. Treasury Obligations — 52.1% | | | | | | | | | | | 29,929,809 | |
Total Long-Term Investments
(Cost — $78,798,432) — 137.3% | | | | | | | | | | | 78,918,567 | |
| | | | | | | | | | | | |
| | | | | | | | | | |
| | | | | | | | | | | | |
| Options Purchased | | | | | | | |
Value | |
(Cost — $23,679) — 0.0% | | | $ | 15,348 | |
Total Investments Before TBA Sale Commitments and Options Written (Cost — $78,822,111) — 137.3% | | | | 78,933,915 | |
| | | | | | | | | | | | |
| TBA Sale Commitments (e) | | | | | Par
(000) | | | | |
Mortgage-Backed Securities — (32.5)% | | | | | | | | | | | | |
Fannie Mae Mortgage-Backed Securities: | | | | | | | | | | | | |
2.50%, 7/01/32 | | | USD | | | | 597 | | | | (599,098 | ) |
3.00%, 7/01/32-7/01/47 | | | | | | | 6,948 | | | | (6,995,310 | ) |
3.50%, 7/01/32-7/01/47 | | | | | | | 2,513 | | | | (2,587,783 | ) |
4.00%, 7/01/32-7/01/47 | | | | | | | 498 | | | | (522,822 | ) |
4.50%, 7/01/47 | | | | | | | 87 | | | | (93,325 | ) |
5.00%, 7/01/47 | | | | | | | 56 | | | | (61,171 | ) |
5.50%, 7/01/47 | | | | | | | 74 | | | | (81,978 | ) |
6.00%, 7/01/47 | | | | | | | 138 | | | | (155,272 | ) |
Freddie Mac Mortgage-Backed Securities: | | | | | | | | | | | | |
3.00%, 7/01/47 | | | | | | | 4,787 | | | | (4,774,516 | ) |
3.50%, 7/01/47 | | | | | | | 550 | | | | (565,024 | ) |
4.00%, 7/01/47 | | | | | | | 672 | | | | (706,737 | ) |
4.50%, 7/01/47 | | | | | | | 148 | | | | (158,547 | ) |
Ginnie Mae Mortgage-Backed Securities: | | | | | | | | | | | | |
3.00%, 7/15/47 | | | | | | | 27 | | | | (27,272 | ) |
3.50%, 7/15/47 | | | | | | | 111 | | | | (115,078 | ) |
4.00%, 7/15/47 | | | | | | | 728 | | | | (765,538 | ) |
4.50%, 7/15/47 | | | | | | | 459 | | | | (487,831 | ) |
Total TBA Sale Commitments (Proceeds — $18,773,256) — (32.5)% | | | | | | | | | | | (18,697,302 | ) |
| | | | | | | | | | | | |
| Options Written | | | | | | | | | |
(Premiums Received — $3,675) — (0.0)% | | | | | | | | | | | (1,381 | ) |
Total Investments Net of TBA Sale Commitments and Options Written — 104.8% | | | | 60,235,232 | |
Liabilities in Excess of Other Assets — (4.8)% | | | | (2,756,182 | ) |
| | | | | | | | | | | | |
Net Assets — 100.0% | | | | | | | | | | $ | 57,479,050 | |
| | | | | | | | | | | | |
|
| Notes to Schedule of Investments |
| (a) | Security exempt from registration pursuant to Rule 144A under the Securities Act of 1933, as amended. These securities may be resold in transactions exempt from registration to qualified institutional investors. |
| (b) | Variable rate security. Rate as of period end. |
| (c) | Security is valued using significant unobservable inputs and is classified as Level 3 in the fair value hierarchy. |
See Notes to Financial Statements.
| | | | | | |
| | | BLACKROCK SERIES FUND, INC. | | JUNE 30, 2017 | | 131 |
| | | | |
| Schedule of Investments (continued) | | | BlackRock U.S. Government Bond Portfolio | |
| | (e) | | Represents or includes a TBA transaction. As of period end, unsettled TBA transactions were as follows: |
| | | | | | | | |
| Counterparty | | Value | | | Unrealized
Appreciation
(Depreciation) | |
Barclays Capital, Inc. | | $ | (1,223,839 | ) | | $ | 4,835 | |
Citigroup Global Markets, Inc. | | $ | (1,403,299 | ) | | $ | 6,923 | |
Credit Suisse Securities (USA) LLC | | $ | (747,185 | ) | | $ | 8,365 | |
Daiwa Capital Markets America, Inc. | | $ | 202,016 | | | $ | (1,359 | ) |
Deutsche Bank Securities, Inc. | | $ | (205,247 | ) | | $ | 935 | |
Goldman Sachs & Co. | | $ | (149,633 | ) | | $ | (2,578 | ) |
J.P. Morgan Securities LLC | | $ | 394,408 | | | $ | (1,689 | ) |
Merrill Lynch, Pierce, Fenner & Smith, Inc. | | $ | (212,620 | ) | | $ | 3,401 | |
Mizuho Securities USA LLC | | $ | (173,110 | ) | | $ | 792 | |
Morgan Stanley & Co. LLC | | $ | (594,149 | ) | | $ | 1,170 | |
Nomura Securities International, Inc. | | $ | (31,157 | ) | | $ | 87 | |
RBC Capital Markets, LLC | | $ | 714,572 | | | $ | (4,996 | ) |
Wells Fargo Securities, LLC | | $ | (399,065 | ) | | $ | 2,814 | |
| | (f) | | All or a portion of the security has been pledged as collateral in connection with outstanding reverse repurchase agreements. |
| | • | | During the six months ended June 30, 2017, investments in issuers considered to be affiliates of the Fund for purposes of Section 2(a)(3) of the Investment Company Act of 1940, as amended, were as follows: |
| | | | | | | | | | | | | | | | | | | | |
| Affiliate | | Shares Held at
December 31, 2016 | | | Net
Activity | | | Shares Held at
June 30, 2017 | | | Value at
June 30,
2017 | | | Income | |
BlackRock Liquidity Funds, T-Fund, Institutional Class | | | — | | | | — | | | | — | | | | — | | | $ | 2,650 | |
| | • | | For Fund compliance purposes, the Fund’s industry classifications refer to any one or more of the industry sub-classifications used by one or more widely recognized market indexes or ratings group indexes, and/or as defined by the investment adviser. These definitions may not apply for purposes of this report, which may combine such industry sub-classifications for reporting ease. |
Reverse repurchase agreements
| | | | | | | | | | | | | | | | | | | | | | | | | | | | |
| Counterparty | | Interest
Rate | | | Trade
Date | | | Maturity
Date1 | | | Face
Value | | | Face
Value
Including
Accrued
Interest | | | Type of Non-Cash
Underlying Collateral | | | Remaining
Contractual
Maturity of the
Agreements | |
BNP Paribas Securities Corp. | | | 1.03 | % | | | 6/30/17 | | | | 7/03/17 | | | $ | 256,163 | | | $ | 256,185 | | | | U.S. Treasury Obligations | | | | Overnight | |
Deutsche Bank Securities, Inc. | | | 1.45 | % | | | 6/30/17 | | | | 7/03/17 | | | | 927,680 | | | | 927,792 | | | | U.S. Treasury Obligations | | | | Overnight | |
J.P. Morgan Securities LLC | | | 0.50 | % | | | 6/30/17 | | | | 7/03/17 | | | | 1,464,168 | | | | 1,464,229 | | | | U.S. Treasury Obligations | | | | Overnight | |
Merrill Lynch, Pierce, Fenner & Smith, Inc. | | | 1.18 | % | | | 6/30/17 | | | | 7/03/17 | | | | 1,589,018 | | | | 1,589,174 | | | | U.S. Treasury Obligations | | | | Overnight | |
Merrill Lynch, Pierce, Fenner & Smith, Inc. | | | 1.30 | % | | | 6/30/17 | | | | 7/03/17 | | | | 1,447,645 | | | | 1,447,802 | | | | U.S. Treasury Obligations | | | | Overnight | |
Merrill Lynch, Pierce, Fenner & Smith, Inc. | | | 1.35 | % | | | 6/30/17 | | | | 7/03/17 | | | | 1,089,898 | | | | 1,090,021 | | | | U.S. Treasury Obligations | | | | Overnight | |
Total | | | | | | | | | | | | | | $ | 6,774,572 | | | $ | 6,775,203 | | | | | | | | | |
| | | | | | | | | | | | | | | | | | | | | | | | |
|
| Derivative Financial Instruments Outstanding as of Period End |
Futures Contracts
| | | | | | | | | | | | | | | | | | |
| Contracts Long (Short) | | Issue | | Expiration | | | Notional Value | | | Unrealized
Appreciation
(Depreciation) | |
(8) | | Euro-Bobl | | | September 2017 | | | | USD | | | | 1,203,372 | | | $ | 3,283 | |
8 | | U.S. Treasury Bonds (30 Year) | | | September 2017 | | | | USD | | | | 1,229,500 | | | | 11,276 | |
3 | | U.S. Treasury Notes (2 Year) | | | September 2017 | | | | USD | | | | 648,328 | | | | (300 | ) |
11 | | U.S. Treasury Notes (5 Year) | | | September 2017 | | | | USD | | | | 1,296,195 | | | | (3,692 | ) |
(37) | | U.S. Treasury Notes (10 Year) | | | September 2017 | | | | USD | | | | 4,644,656 | | | | 23,446 | |
(14) | | Euro Dollar | | | June 2018 | | | | USD | | | | 3,442,775 | | | | 1,995 | |
(13) | | Euro Dollar | | | March 2019 | | | | USD | | | | 3,189,713 | | | | (2,941 | ) |
Total | | | | | | | | | | | | | | | | $ | 33,067 | |
| | | | | | | | | | | | | | | | | | |
See Notes to Financial Statements.
| | | | | | |
| 132 | | BLACKROCK SERIES FUND, INC. | | JUNE 30, 2017 | | |
| | | | |
| Schedule of Investments (continued) | | | BlackRock U.S. Government Bond Portfolio | |
Forward Foreign Currency Exchange Contracts
| | | | | | | | | | | | | | | | | | | | | | |
Currency
Purchased | | | Currency
Sold | | | Counterparty | | Settlement
Date | | | Unrealized
Appreciation
(Depreciation) | |
| USD | | | 7,500 | | | | RUB | | | | 438,300 | | | BNP Paribas S.A. | | | 7/03/17 | | | $ | 73 | |
| EUR | | | 105,249 | | | | USD | | | | 120,000 | | | Morgan Stanley & Co. International PLC | | | 7/05/17 | | | | 244 | |
| GBP | | | 92,507 | | | | USD | | | | 120,000 | | | Morgan Stanley & Co. International PLC | | | 7/05/17 | | | | 507 | |
| HUF | | | 7,157,168 | | | | USD | | | | 26,374 | | | Deutsche Bank AG | | | 7/05/17 | | | | 100 | |
| HUF | | | 195,673 | | | | USD | | | | 721 | | | JPMorgan Chase Bank N.A. | | | 7/05/17 | | | | 2 | |
| HUF | | | 716,235 | | | | USD | | | | 2,637 | | | Morgan Stanley & Co. International PLC | | | 7/05/17 | | | | 12 | |
| HUF | | | 24,514,915 | | | | USD | | | | 90,268 | | | Morgan Stanley & Co. International PLC | | | 7/05/17 | | | | 410 | |
| JPY | | | 13,544,806 | | | | USD | | | | 120,000 | | | BNP Paribas S.A. | | | 7/05/17 | | | | 453 | |
| SEK | | | 1,021,096 | | | | USD | | | | 120,000 | | | Deutsche Bank AG | | | 7/05/17 | | | | 1,240 | |
| TRY | | | 428,544 | | | | USD | | | | 120,000 | | | BNP Paribas S.A. | | | 7/05/17 | | | | 1,621 | |
| USD | | | 120,000 | | | | JPY | | | | 13,250,640 | | | Royal Bank of Scotland PLC | | | 7/05/17 | | | | 2,163 | |
| USD | | | 120,000 | | | | ZAR | | | | 1,562,215 | | | BNP Paribas S.A. | | | 7/05/17 | | | | 699 | |
| ZAR | | | 1,591,734 | | | | USD | | | | 120,000 | | | BNP Paribas S.A. | | | 7/05/17 | | | | 1,555 | |
| CLP | | | 7,382,375 | | | | USD | | | | 11,000 | | | Credit Suisse International | | | 7/06/17 | | | | 119 | |
| RUB | | | 716,280 | | | | USD | | | | 12,000 | | | JPMorgan Chase Bank N.A. | | | 7/06/17 | | | | 130 | |
| USD | | | 120,000 | | | | BRL | | | | 395,340 | | | BNP Paribas S.A. | | | 7/06/17 | | | | 832 | |
| USD | | | 11,000 | | | | COP | | | | 31,996,250 | | | Credit Suisse International | | | 7/06/17 | | | | 511 | |
| USD | | | 40,000 | | | | COP | | | | 121,600,000 | | | Barclays Bank PLC | | | 7/07/17 | | | | 143 | |
| USD | | | 80,000 | | | | COP | | | | 242,333,360 | | | BNP Paribas S.A. | | | 7/07/17 | | | | 569 | |
| RUB | | | 502,520 | | | | USD | | | | 8,500 | | | JPMorgan Chase Bank N.A. | | | 7/10/17 | | | | 2 | |
| USD | | | 13,565 | | | | RUB | | | | 796,112 | | | Credit Suisse International | | | 7/10/17 | | | | 95 | |
| USD | | | 13,435 | | | | RUB | | | | 788,269 | | | Deutsche Bank AG | | | 7/10/17 | | | | 98 | |
| JPY | | | 1,350,894 | | | | USD | | | | 12,000 | | | Goldman Sachs International | | | 7/11/17 | | | | 17 | |
| MYR | | | 17,220 | | | | USD | | | | 4,000 | | | BNP Paribas S.A. | | | 7/17/17 | | | | 8 | |
| MYR | | | 21,720 | | | | USD | | | | 5,000 | | | JPMorgan Chase Bank N.A. | | | 7/17/17 | | | | 56 | |
| MYR | | | 22,040 | | | | USD | | | | 5,000 | | | JPMorgan Chase Bank N.A. | | | 7/17/17 | | | | 131 | |
| TRY | | | 78,001 | | | | USD | | | | 22,000 | | | BNP Paribas S.A. | | | 7/21/17 | | | | 34 | |
| TRY | | | 32,030 | | | | USD | | | | 9,000 | | | Citibank N.A. | | | 7/21/17 | | | | 48 | |
| USD | | | 2,561 | | | | MXN | | | | 46,310 | | | BNP Paribas S.A. | | | 7/21/17 | | | | 19 | |
| USD | | | 6,439 | | | | MXN | | | | 116,405 | | | JPMorgan Chase Bank N.A. | | | 7/21/17 | | | | 48 | |
| USD | | | 9,000 | | | | ZAR | | | | 115,855 | | | Citibank N.A. | | | 7/21/17 | | | | 179 | |
| RUB | | | 720,840 | | | | USD | | | | 12,000 | | | BNP Paribas S.A. | | | 7/24/17 | | | | 159 | |
| RUB | | | 715,920 | | | | USD | | | | 12,000 | | | Deutsche Bank AG | | | 7/24/17 | | | | 76 | |
| USD | | | 9,000 | | | | COP | | | | 26,406,000 | | | BNP Paribas S.A. | | | 8/09/17 | | | | 386 | |
| IDR | | | 67,325,000 | | | | USD | | | | 5,000 | | | Bank of America N.A. | | | 8/15/17 | | | | 24 | |
| IDR | | | 75,386,742 | | | | USD | | | | 5,600 | | | Citibank N.A. | | | 8/15/17 | | | | 26 | |
| IDR | | | 107,713,941 | | | | USD | | | | 8,000 | | | Citibank N.A. | | | 8/15/17 | | | | 39 | |
| IDR | | | 56,005,714 | | | | USD | | | | 4,161 | | | JPMorgan Chase Bank N.A. | | | 8/15/17 | | | | 18 | |
| IDR | | | 84,040,320 | | | | USD | | | | 6,240 | | | JPMorgan Chase Bank N.A. | | | 8/15/17 | | | | 31 | |
| MYR | | | 60,543 | | | | USD | | | | 14,000 | | | Morgan Stanley & Co. International PLC | | | 8/17/17 | | | | 75 | |
| USD | | | 10,000 | | | | COP | | | | 29,880,000 | | | Barclays Bank PLC | | | 8/22/17 | | | | 268 | |
| USD | | | 9,000 | | | | COP | | | | 27,319,500 | | | Credit Suisse International | | | 8/22/17 | | | | 102 | |
| EUR | | | 8,800 | | | | USD | | | | 9,950 | | | JPMorgan Chase Bank N.A. | | | 9/07/17 | | | | 138 | |
| AUD | | | 324,000 | | | | USD | | | | 244,950 | | | Citibank N.A. | | | 9/20/17 | | | | 3,815 | |
| AUD | | | 28,000 | | | | USD | | | | 21,176 | | | Credit Suisse International | | | 9/20/17 | | | | 322 | |
| EUR | | | 185,000 | | | | USD | | | | 211,047 | | | Goldman Sachs International | | | 9/20/17 | | | | 1,183 | |
| EUR | | | 180,000 | | | | USD | | | | 203,775 | | | Goldman Sachs International | | | 9/20/17 | | | | 2,720 | |
| USD | | | 37,497 | | | | MXN | | | | 681,618 | | | Deutsche Bank AG | | | 9/20/17 | | | | 430 | |
See Notes to Financial Statements.
| | | | | | |
| | | BLACKROCK SERIES FUND, INC. | | JUNE 30, 2017 | | 133 |
| | | | |
| Schedule of Investments (continued) | | | BlackRock U.S. Government Bond Portfolio | |
| | | | | | | | | | | | | | | | | | | | | | |
Currency
Purchased | | | Currency
Sold | | | Counterparty | | Settlement
Date | | | Unrealized
Appreciation
(Depreciation) | |
| USD | | | 36,754 | | | | MXN | | | | 665,784 | | | Deutsche Bank AG | | | 9/20/17 | | | $ | 548 | |
| USD | | | 149,989 | | | | MXN | | | | 2,726,808 | | | Goldman Sachs International | | | 9/20/17 | | | | 1,703 | |
| USD | | | 36,754 | | | | MXN | | | | 666,354 | | | Royal Bank of Scotland PLC | | | 9/20/17 | | | | 517 | |
| USD | | | 49,005 | | | | MXN | | | | 889,588 | | | Royal Bank of Scotland PLC | | | 9/20/17 | | | | 629 | |
| USD | | | 43,445 | | | | TRY | | | | 157,512 | | | BNP Paribas S.A. | | | 10/23/17 | | | | 111 | |
| TRY | | | 374,488 | | | | USD | | | | 96,748 | | | BNP Paribas S.A. | | | 6/25/18 | | | | 2 | |
| | | | | | | | | | | | | | | | | | | | | | |
| | | | | | | | | | | | | | | | | | | | | 25,440 | |
| | | | | | | | | | | | | | | | | | | | | | |
| MXN | | | 46,493 | | | | USD | | | | 2,571 | | | Barclays Bank PLC | | | 7/03/17 | | | | (11 | ) |
| MXN | | | 46,488 | | | | USD | | | | 2,571 | | | Deutsche Bank AG | | | 7/03/17 | | | | (11 | ) |
| MXN | | | 69,728 | | | | USD | | | | 3,857 | | | Morgan Stanley & Co. International PLC | | | 7/03/17 | | | | (17 | ) |
| RUB | | | 433,125 | | | | USD | | | | 7,500 | | | Deutsche Bank AG | | | 7/03/17 | | | | (161 | ) |
| RUB | | | 6,869,580 | | | | USD | | | | 120,000 | | | BNP Paribas S.A. | | | 7/05/17 | | | | (3,645 | ) |
| USD | | | 120,000 | | | | EUR | | | | 106,525 | | | Deutsche Bank AG | | | 7/05/17 | | | | (1,702 | ) |
| USD | | | 120,000 | | | | GBP | | | | 92,857 | | | Deutsche Bank AG | | | 7/05/17 | | | | (963 | ) |
| USD | | | 120,000 | | | | HUF | | | | 32,860,200 | | | BNP Paribas S.A. | | | 7/05/17 | | | | (1,546 | ) |
| USD | | | 70,000 | | | | RUB | | | | 4,149,740 | | | Deutsche Bank AG | | | 7/05/17 | | | | (287 | ) |
| USD | | | 50,000 | | | | RUB | | | | 2,961,165 | | | JPMorgan Chase Bank N.A. | | | 7/05/17 | | | | (156 | ) |
| USD | | | 120,000 | | | | SEK | | | | 1,039,008 | | | Royal Bank of Scotland PLC | | | 7/05/17 | | | | (3,366 | ) |
| USD | | | 120,000 | | | | TRY | | | | 423,789 | | | BNP Paribas S.A. | | | 7/05/17 | | | | (272 | ) |
| BRL | | | 391,980 | | | | USD | | | | 120,000 | | | Goldman Sachs International | | | 7/06/17 | | | | (1,844 | ) |
| COP | | | 14,620,000 | | | | USD | | | | 5,000 | | | Royal Bank of Scotland PLC | | | 7/06/17 | | | | (207 | ) |
| COP | | | 17,538,000 | | | | USD | | | | 6,000 | | | UBS AG | | | 7/06/17 | | | | (251 | ) |
| USD | | | 11,000 | | | | CLP | | | | 7,310,710 | | | Royal Bank of Scotland PLC | | | 7/06/17 | | | | (11 | ) |
| USD | | | 12,000 | | | | RUB | | | | 720,720 | | | Goldman Sachs International | | | 7/06/17 | | | | (205 | ) |
| COP | | | 146,800,000 | | | | USD | | | | 50,000 | | | JPMorgan Chase Bank N.A. | | | 7/07/17 | | | | (1,883 | ) |
| COP | | | 205,520,000 | | | | USD | | | | 70,000 | | | UBS AG | | | 7/07/17 | | | | (2,636 | ) |
| RUB | | | 397,599 | | | | USD | | | | 6,750 | | | Barclays Bank PLC | | | 7/10/17 | | | | (23 | ) |
| RUB | | | 397,778 | | | | USD | | | | 6,750 | | | Barclays Bank PLC | | | 7/10/17 | | | | (20 | ) |
| USD | | | 14,000 | | | | MYR | | | | 60,410 | | | Morgan Stanley & Co. International PLC | | | 7/17/17 | | | | (62 | ) |
| MXN | | | 162,556 | | | | USD | | | | 9,000 | | | Barclays Bank PLC | | | 7/21/17 | | | | (76 | ) |
| ZAR | | | 83,767 | | | | USD | | | | 6,439 | | | Barclays Bank PLC | | | 7/21/17 | | | | (61 | ) |
| ZAR | | | 33,339 | | | | USD | | | | 2,561 | | | BNP Paribas S.A. | | | 7/21/17 | | | | (23 | ) |
| IDR | | | 146,740,000 | | | | USD | | | | 11,000 | | | BNP Paribas S.A. | | | 7/24/17 | | | | (21 | ) |
| IDR | | | 333,500,000 | | | | USD | | | | 25,000 | | | JPMorgan Chase Bank N.A. | | | 7/24/17 | | | | (49 | ) |
| MXN | | | 162,871 | | | | USD | | | | 9,000 | | | Morgan Stanley & Co. International PLC | | | 7/27/17 | | | | (68 | ) |
| CLP | | | 1,237,905 | | | | USD | | | | 1,867 | | | Bank of America N.A. | | | 7/28/17 | | | | (3 | ) |
| CLP | | | 3,536,178 | | | | USD | | | | 5,333 | | | BNP Paribas S.A. | | | 7/28/17 | | | | (11 | ) |
| CLP | | | 3,316,500 | | | | USD | | | | 5,000 | | | BNP Paribas S.A. | | | 7/28/17 | | | | (8 | ) |
| CLP | | | 530,560 | | | | USD | | | | 800 | | | Goldman Sachs International | | | 7/28/17 | | | | (1 | ) |
| RUB | | | 889,800 | | | | USD | | | | 15,000 | | | Deutsche Bank AG | | | 7/28/17 | | | | (4 | ) |
| TRY | | | 22,007 | | | | USD | | | | 6,234 | | | BNP Paribas S.A. | | | 7/28/17 | | | | (30 | ) |
| TRY | | | 11,652 | | | | USD | | | | 3,299 | | | BNP Paribas S.A. | | | 7/28/17 | | | | (14 | ) |
| TRY | | | 22,013 | | | | USD | | | | 6,234 | | | Goldman Sachs International | | | 7/28/17 | | | | (28 | ) |
| TRY | | | 56,697 | | | | USD | | | | 16,000 | | | HSBC Bank PLC | | | 7/28/17 | | | | (17 | ) |
| TRY | | | 22,003 | | | | USD | | | | 6,234 | | | JPMorgan Chase Bank N.A. | | | 7/28/17 | | | | (31 | ) |
| COP | | | 27,396,000 | | | | USD | | | | 9,000 | | | Barclays Bank PLC | | | 8/09/17 | | | | (63 | ) |
| USD | | | 29,000 | | | | IDR | | | | 395,026,400 | | | BNP Paribas S.A. | | | 8/15/17 | | | | (478 | ) |
| COP | | | 30,521,700 | | | | USD | | | | 10,000 | | | UBS AG | | | 8/22/17 | | | | (59 | ) |
| USD | | | 9,950 | | | | EUR | | | | 8,800 | | | BNP Paribas S.A. | | | 9/07/17 | | | | (138 | ) |
See Notes to Financial Statements.
| | | | | | |
| 134 | | BLACKROCK SERIES FUND, INC. | | JUNE 30, 2017 | | |
| | | | |
| Schedule of Investments (continued) | | | BlackRock U.S. Government Bond Portfolio | |
| | | | | | | | | | | | | | | | | | | | | | | | | | |
Currency
Purchased | | | Currency
Sold | | | Counterparty | | Settlement
Date | | | | | | Unrealized
Appreciation
(Depreciation) | |
| USD | | | 133,019 | | | | AUD | | | | 176,000 | | | Goldman Sachs International | | | 9/20/17 | | | | | | | $ | (2,112 | ) |
| USD | | | 133,228 | | | | AUD | | | | 176,000 | | | Goldman Sachs International | | | 9/20/17 | | | | | | | | (1,903 | ) |
| USD | | | 410,738 | | | | EUR | | | | 365,000 | | | Barclays Bank PLC | | | 9/20/17 | | | | | | | | (7,987 | ) |
| USD | | | 102,896 | | | | TRY | | | | 374,488 | | | BNP Paribas S.A. | | | 10/23/17 | | | | | | | | (133 | ) |
| TRY | | | 157,512 | | | | USD | | | | 40,862 | | | BNP Paribas S.A. | | | 6/25/18 | | | | | | | | (168 | ) |
| | | | | | | | | | | | | | | | | | | | | | | | | (32,765 | ) |
| | | | | | | | | | | | | | | | | | | | | | | | | | |
Net Unrealized Depreciation | | | | | | | | | | $ | (7,325 | ) |
| | | | | | | | | | | | | | | | | | | | | | | | | | |
Exchange-Traded Options Purchased
| | | | | | | | | | | | | | | | | | | | | | | | |
| Description | | Put/
Call | | | Expiration
Date | | | Strike
Price | | | Contracts | | | Value | |
Euro Dollar 90-Day | | | Put | | | | 10/13/17 | | | | USD | | | | 98.00 | | | | 55 | | | $ | 5,844 | |
Euro Dollar 90-Day | | | Put | | | | 10/13/17 | | | | USD | | | | 98.13 | | | | 24 | | | | 4,800 | |
Euro Dollar 90-Day | | | Put | | | | 10/13/17 | | | | USD | | | | 97.75 | | | | 24 | | | | 4,200 | |
Total | | | | | | | | | | | | | | | | | | | | | | $ | 14,844 | |
| | | | | | | | | | | | | | | | | | | | | | | | |
OTC Options Purchased
| | | | | | | | | | | | | | | | | | | | | | | | | | | | | | |
| Description | | Put/
Call | | | Counterparty | | Expiration
Date | | | Strike
Price | | | Notional
Amount
(000) | | | Value | |
USD Currency | | | Call | | | Barclays Bank PLC | | | 7/07/17 | | | | JPY | | | | 111.00 | | | | USD | | | | 12 | | | $ | 160 | |
USD Currency | | | Call | | | Deutsche Bank AG | | | 8/07/17 | | | | RUB | | | | 58.00 | | | | USD | | | | 9 | | | | 297 | |
EUR Currency | | | Put | | | BNP Paribas S.A. | | | 8/25/17 | | | | USD | | | | 1.12 | | | | EUR | | | | 13 | | | | 47 | |
Total | | | | | | | | | | | | | | | | | | | | | | | | | | | | $ | 504 | |
| | | | | | | | | | | | | | | | | | | | | | | | | | | | | | |
Exchange-Traded Options Written
| | | | | | | | | | | | | | | | | | | | | | | | |
| Description | | Put/
Call | | | Expiration
Date | | | Strike
Price | | | Contracts | | | Value | |
Euro Dollar 90-Day | | | Put | | | | 10/13/17 | | | | USD | | | | 97.50 | | | | 28 | | | $ | (350 | ) |
Euro Dollar 90-Day | | | Put | | | | 10/13/17 | | | | USD | | | | 97.63 | | | | 55 | | | | (1,031 | ) |
Total | | | | | | | | | | | | | | | | | | | | | | $ | (1,381 | ) |
| | | | | | | | | | | | | | | | | | | | | | | | |
Centrally Cleared Credit Default Swaps - Buy Protection
| | | | | | | | | | | | | | | | |
| Index | | Pay
Fixed
Rate | | Expiration
Date | | | Notional
Amount
(000) | | | Unrealized
Depreciation |
CDX.NA.IG.28.V1 | | 1.00% | | | 6/20/22 | | | | USD | | | | 328 | | | $(1,216) |
Centrally Cleared Interest Rate Swaps
| | | | | | | | | | | | | | | | | | |
Fixed Rate | | Floating
Rate | | Effective
Date | | Expiration
Date | | Notional
Amount
(000) | | | Unrealized
Appreciation
(Depreciation) | |
| 7.36%1 | | 28-day MXIBTIIE | | N/A | | 1/28/19 | | | MXN | | | | 2,579 | | | $ | (828 | ) |
| 7.32%2 | | 28-day MXIBTIIE | | N/A | | 2/20/20 | | | MXN | | | | 2,083 | | | | 1,589 | |
| 7.16%2 | | 28-day MXIBTIIE | | N/A | | 4/29/20 | | | MXN | | | | 1,970 | | | | 1,168 | |
| 1.37%1 | | 3-month LIBOR | | N/A | | 11/30/20 | | | USD | | | | 930 | | | | 12,567 | |
| 7.45%2 | | 28-day MXIBTIIE | | N/A | | 3/07/22 | | | MXN | | | | 711 | | | | 1,092 | |
| 7.48%2 | | 28-day MXIBTIIE | | N/A | | 3/07/22 | | | MXN | | | | 355 | | | | 238 | |
| 7.47%2 | | 28-day MXIBTIIE | | N/A | | 3/07/22 | | | MXN | | | | 355 | | | | 237 | |
| 7.16%2 | | 28-day MXIBTIIE | | N/A | | 6/01/22 | | | MXN | | | | 846 | | | | 703 | |
| 2.13%2 | | 3-month LIBOR | | N/A | | 8/25/25 | | | USD | | | | 10 | | | | 28 | |
| 3.45%2 | | UK RPI All Items Monthly | | N/A | | 10/15/26 | | | GBP | | | | 142 | | | | 657 | |
See Notes to Financial Statements.
| | | | | | |
| | | BLACKROCK SERIES FUND, INC. | | JUNE 30, 2017 | | 135 |
| | | | |
| Schedule of Investments (continued) | | | BlackRock U.S. Government Bond Portfolio | |
| | | | | | | | | | | | | | | | | | | | | | |
Fixed
Rate | | | Floating
Rate | | Effective
Date | | Expiration
Date | | | | | | Notional
Amount
(000) | | | Unrealized
Appreciation
(Depreciation) | |
| | 3.46%2 | | | UK RPI All Items Monthly | | N/A | | | 10/15/26 | | | | GBP | | | | 146 | | | $ | 966 | |
| | 3.43%2 | | | UK RPI All Items Monthly | | N/A | | | 10/15/26 | | | | GBP | | | | 140 | | | | 258 | |
| | 7.41%2 | | | 28-day MXIBTIIE | | N/A | | | 5/25/27 | | | | MXN | | | | 485 | | | | 452 | |
| | 7.38%2 | | | 28-day MXIBTIIE | | N/A | | | 5/25/27 | | | | MXN | | | | 79 | | | | 62 | |
| | 7.82%2 | | | 28-day MXIBTIIE | | N/A | | | 3/04/37 | | | | MXN | | | | 171 | | | | 154 | |
| | 7.92%2 | | | 28-day MXIBTIIE | | N/A | | | 5/01/37 | | | | MXN | | | | 223 | | | | 421 | |
| | 7.95%2 | | | 28-day MXIBTIIE | | N/A | | | 5/01/37 | | | | MXN | | | | 205 | | | | 444 | |
| | Total | | | | | | | | | | | | | | | | | | | $ | 20,208 | |
| | | | | | | | | | | | | | | | | | | | | | |
| | 1 | | The Fund pays the fixed rate and receives the floating rate. |
| | 2 | | The Fund pays the floating rate and receives the fixed rate. |
|
| |
OTC Credit Default Swaps - Buy Protection |
| | | | | | | | | | | | | | | | | | | | | | | | | | | | |
| Index | | Pay
Fixed
Rate | | | Counterparty | | Expiration
Date | | Notional
Amount
(000) | | | Market
Value | | | Premiums
Paid | | | Unrealized
Depreciation | |
Republic of the Philippines | | | 1.00 | % | | JPMorgan Chase Bank N.A. | | 6/20/22 | | | USD | | | | 231 | | | | $(2,617) | | | | $(570 | ) | | | $(2,047) | |
| | | | | | | | | | | | | | | | | | | | | | | | | | | | | | |
OTC Interest Rate Swaps | |
Fixed
Rate | | Floating
Rate | | | Counterparty | | Expiration
Date | | | Notional
Amount
(000) | | | Value | | | Premiums
Paid
(Received) | | | Unrealized
Appreciation
(Depreciation) | |
13.13%1 | | | 1-day BZDIOVER | | | Bank of America N.A. | | | 7/03/17 | | | | BRL | | | | 140 | | | | (170 | ) | | | — | | | | $ (170 | ) |
13.11%1 | | | 1-day BZDIOVER | | | Citibank N.A. | | | 7/03/17 | | | | BRL | | | | 168 | | | | (197 | ) | | | — | | | | (197 | ) |
12.85%1 | | | 1-day BZDIOVER | | | JPMorgan Chase Bank N.A. | | | 7/03/17 | | | | BRL | | | | 11 | | | | (8 | ) | | | — | | | | (8 | ) |
9.50%1 | | | 1-day BZDIOVER | | | Bank of America N.A. | | | 10/02/17 | | | | BRL | | | | 342 | | | | (10 | ) | | | — | | | | (10 | ) |
9.99%1 | | | 1-day BZDIOVER | | | Citibank N.A. | | | 1/02/18 | | | | BRL | | | | 280 | | | | (293 | ) | | | — | | | | (293 | ) |
8.98%1 | | | 1-day BZDIOVER | | | Citibank N.A. | | | 1/02/18 | | | | BRL | | | | 86 | | | | 41 | | | | — | | | | 41 | |
9.98%1 | | | 1-day BZDIOVER | | | JPMorgan Chase Bank N.A. | | | 1/02/18 | | | | BRL | | | | 280 | | | | (192 | ) | | | — | | | | (192 | ) |
7.07%2 | | | 28-day MXIBTIIE | | | Citibank N.A. | | | 11/21/18 | | | | MXN | | | | 820 | | | | 15 | | | | — | | | | 15 | |
7.06%2 | | | 28-day MXIBTIIE | | | JPMorgan Chase Bank N.A. | | | 11/21/18 | | | | MXN | | | | 984 | | | | 189 | | | | — | | | | 189 | |
6.98%2 | | | 28-day MXIBTIIE | | | Citibank N.A. | | | 11/28/18 | | | | MXN | | | | 1,400 | | | | (56 | ) | | | $ (3 | ) | | | (53 | ) |
6.98%2 | | | 28-day MXIBTIIE | | | JPMorgan Chase Bank N.A. | | | 11/28/18 | | | | MXN | | | | 794 | | | | (32 | ) | | | (2 | ) | | | (30 | ) |
9.25%2 | | | 1-day BZDIOVER | | | Citibank N.A. | | | 1/02/19 | | | | BRL | | | | 238 | | | | 224 | | | | — | | | | 224 | |
9.28%2 | | | 1-day BZDIOVER | | | JPMorgan Chase Bank N.A. | | | 1/02/19 | | | | BRL | | | | 226 | | | | 235 | | | | — | | | | 235 | |
9.73%2 | | | 1-day BZDIOVER | | | JPMorgan Chase Bank N.A. | | | 1/02/20 | | | | BRL | | | | 170 | | | | 174 | | | | — | | | | 174 | |
3.78%2 | | | 7-day China Fixing Repo Rates | | | Bank of America N.A. | | | 6/02/22 | | | | CNY | | | | 74 | | | | 15 | | | | (1 | ) | | | 16 | |
6.32%2 | | | 28-day MXIBTIIE | | | Goldman Sachs International | | | 8/06/25 | | | | MXN | | | | 511 | | | | (1,315 | ) | | | (3 | ) | | | (1,312 | ) |
6.31%1 | | | 28-day MXIBTIIE | | | Deutsche Bank AG | | | 8/11/25 | | | | MXN | | | | 640 | | | | 1,679 | | | | 3 | | | | 1,676 | |
Total | | | | | | | | | | | | | | | | | | | | $ | 299 | | | | $ (6 | ) | | | $ 305 | |
| | | | | | | | | | | | | | | | | | | | | | |
| | 1 | | The Fund pays the fixed rate and receives the floating rate. |
| | 2 | | The Fund pays the floating rate and receives the fixed rate. |
|
| Transactions in Options Written for the Six Months Ended June 30, 2017 |
| | | | | | | | | | | | | | | | | | | | | | | | | | | | | | |
| | | Calls | | Puts | |
| | | | | | Notional (000) | | | | | | | | Notional (000) | | | | |
| | | Contracts | | | EUR | | | USD | | | Premiums
Received | | Contracts | | | EUR | | | USD | | | Premiums
Received | |
| | | | | | | |
Outstanding options, beginning of period | | | — | | | | — | | | | 6,080 | | | $ 35,685 | | | — | | | | — | | | | 6,080 | | | $ | 30,326 | |
Options written | | | 37 | | | | 730 | | | | 11,930 | | | 81,158 | | | 83 | | | | 730 | | | | 12,994 | | | | 82,949 | |
Options expired | | | (37 | ) | | | — | | | | — | | | (9,365) | | | — | | | | — | | | | (1,064 | ) | | | (2,956 | ) |
Options closed | | | — | | | | (730 | ) | | | (18,010 | ) | | (107,478) | | | — | | | | (730 | ) | | | (18,010 | ) | | | (106,644 | ) |
| | | | | | | |
Outstanding options, end of period | | | — | | | | — | | | | — | | | — | | | 83 | | | | — | | | | — | | | $ | 3,675 | |
| | | | | | | |
See Notes to Financial Statements.
| | | | | | |
| 136 | | BLACKROCK SERIES FUND, INC. | | JUNE 30, 2017 | | |
| | | | |
| Schedule of Investments (continued) | | | BlackRock U.S. Government Bond Portfolio | |
|
| Derivative Financial Instruments Categorized by Risk Exposure |
As of period end, the fair values of derivative financial instruments located in the Statements of Assets and Liabilities were as follows:
| | | | | | | | | | | | | | | | | | | | | | | | | | |
| Assets - Derivative Financial Instruments | | Commodity
Contracts | | Credit
Contracts | | | Equity
Contracts | | Foreign
Currency
Exchange
Contracts | | | Interest
Rate
Contracts | | | Other
Contracts | | | Total | |
Futures contracts | | Net unrealized appreciation1 | | — | | | — | | | — | | | — | | | $ | 40,000 | | | | — | | | $ | 40,000 | |
Forward foreign currency exchange contracts | | Unrealized appreciation on forward foreign currency exchange contracts | | — | | | — | | | — | | $ | 25,440 | | | | — | | | | — | | | | 25,440 | |
Options purchased | | Investments at value — unaffiliated2 | | — | | | — | | | — | | | 504 | | | | 14,844 | | | | — | | | | 15,348 | |
Swaps - centrally cleared | | Net unrealized appreciation1 | | — | | | — | | | — | | | — | | | | 19,155 | | | $ | 1,881 | | | | 21,036 | |
Swaps - OTC | | Unrealized appreciation on OTC swaps; Swap premiums paid | | — | | | — | | | — | | | — | | | | 2,573 | | | | — | | | | 2,573 | |
| | | |
Total | | | | — | | | — | | | — | | $ | 25,944 | | | $ | 76,572 | | | $ | 1,881 | | | $ | 104,397 | |
| | | |
| | | | | | | | |
| | | | | | | | | | | | | | | | | | | | | | | | | | | |
| Liabilities - Derivative Financial Instruments | |
Futures contracts | | Net unrealized depreciation1 | | — | | | — | | | — | | | — | | | $ | 6,933 | | | | — | | | $ | 6,933 | |
Forward foreign currency exchange contracts | | Unrealized depreciation on forward foreign currency exchange contracts | | — | | | — | | | — | | $ | 32,765 | | | | — | | | | — | | | | 32,765 | |
Options written | | Options written, at value | | — | | | — | | | — | | | — | | | | 1,381 | | | | — | | | | 1,381 | |
Swaps - centrally cleared | | Net unrealized depreciation1 | | — | | $ | 1,216 | | | — | | | — | | | | 828 | | | | — | | | | 2,044 | |
Swaps - OTC | | Unrealized depreciation on OTC swaps; Swap premiums received | | — | | | 2,617 | | | — | | | — | | | | 2,274 | | | | — | | | | 4,891 | |
| | | |
Total | | | | — | | $ | 3,833 | | | — | | $ | 32,765 | | | $ | 11,416 | | | | — | | | $ | 48,014 | |
| | | |
| 1 | Includes cumulative appreciation (depreciation) on futures contracts and centrally cleared swaps, if any, as reported in the Schedule of Investments. Only current day’s variation margin is reported within the Statements of Assets and Liabilities. |
| 2 | Includes options purchased at value as reported in the Schedule of Investments. |
For the six months ended June 30, 2017, the effect of derivative financial instruments in the Statements of Operations were as follows:
| | | | | | | | | | | | | | | | | | | | | | | | | | | | |
| Net Realized Gain (Loss) from: | | Commodity
Contracts | | | Credit
Contracts | | | Equity
Contracts | | | Foreign
Currency
Exchange
Contracts | | | Interest
Rate
Contracts | | | Other
Contracts | | | Total | |
Futures contracts | | | — | | | | — | | | | — | | | | — | | | $ | (144,666 | ) | | | — | | | $ | (144,666 | ) |
Foreign currency transactions | | | — | | | | — | | | | — | | | $ | 21,046 | | | | — | | | | — | | | | 21,046 | |
Options purchased1 | | | — | | | | — | | | | — | | | | (22,885 | ) | | | (40,728 | ) | | | — | | | | (63,613 | ) |
Options written | | | — | | | | — | | | | — | | | | (2,059 | ) | | | 46,021 | | | | — | | | | 43,962 | |
Swaps | | | — | | | $ | (7,252 | ) | | | — | | | | (9,054 | ) | | | (42,323 | ) | | | — | | | | (58,629 | ) |
| | | | |
Total | | | — | | | $ | (7,252 | ) | | | — | | | $ | (12,952 | ) | | $ | (181,696 | ) | | | — | | | $ | (201,900 | ) |
| | | | |
| | | | | | | | | | | | | | | | | | | | | | | | | | | | |
| Net Change in Unrealized Appreciation (Depreciation) on: | | | | | | | | | | | | | | | | | | | | | |
Futures contracts | | | — | | | | — | | | | — | | | | — | | | $ | 98,952 | | | | — | | | $ | 98,952 | |
Foreign currency translations | | | — | | | | — | | | | — | | | $ | (11,512 | ) | | | — | | | | — | | | | (11,512 | ) |
Options purchased1 | | | — | | | | — | | | | — | | | | (7,627 | ) | | | (8,515 | ) | | | — | | | | (16,142 | ) |
Options written | | | — | | | | — | | | | — | | | | — | | | | (4,399 | ) | | | — | | | | (4,399 | ) |
Swaps | | | — | | | $ | (1,252 | ) | | | — | | | | — | | | | 55,326 | | | $ | 5,246 | | | | 59,320 | |
| | | | |
Total | | | — | | | $ | (1,252 | ) | | | — | | | $ | (19,139 | ) | | $ | 141,364 | | | $ | 5,246 | | | $ | 126,219 | |
| | | | |
| 1 | Options purchased are included in the net realized gain (loss) from investments and the net change in unrealized appreciation (depreciation) on investments. |
See Notes to Financial Statements.
| | | | | | |
| | | BLACKROCK SERIES FUND, INC. | | JUNE 30, 2017 | | 137 |
| | | | |
| Schedule of Investments (continued) | | | BlackRock U.S. Government Bond Portfolio | |
|
| Average Quarterly Balances of Outstanding Derivative Financial Instruments |
| | | | |
Futures contracts: | | | | |
Average notional value of contracts - long | | $ | 3,207,621 | |
Average notional value of contracts - short | | $ | 15,752,304 | |
Forward foreign currency exchange contracts: | | | | |
Average amounts purchased - in USD | | $ | 1,817,185 | |
Average amounts sold - USD | | $ | 1,651,828 | |
Options: | | | | |
Average value of option contracts purchased | | $ | 17,291 | |
Average value of option contracts written | | $ | 691 | |
Average notional value of swaption contracts purchased | | $ | 350,000 | |
Average notional value of swaption contracts written | | $ | 12,080,000 | |
Credit default swaps: | | | | |
Average notional value - buy protection | | $ | 559,000 | |
Interest rate swaps: | | | | |
Average notional value - pays fixed rate | | $ | 4,624,264 | |
Average notional value - receives fixed rate | | $ | 4,395,813 | |
Total return swaps: | | | | |
Average notional value | | $ | 968,124 | |
For more information about the Fund’s investment risks regarding derivative financial instruments, refer to the Notes to Financial Statements.
|
| Derivative Financial Instruments - Offsetting as of Period End |
The Fund’s derivative assets and liabilities (by type) were as follows:
| | | | | | | | |
| | | Assets | | | Liabilities | |
Derivative Financial Instruments: | | | | | | | | |
Futures contracts | | $ | 11,340 | | | $ | 6,429 | |
Forward foreign currency exchange contracts | | | 25,440 | | | | 32,765 | |
Options | | | 15,348 | 1 | | | 1,381 | |
Swaps - Centrally cleared | | | — | | | | 3,917 | |
Swaps - OTC2 | | | 2,573 | | | | 4,891 | |
| | | | |
Total derivative assets and liabilities in the Statements of Assets and Liabilities | | $ | 54,701 | | | $ | 49,383 | |
Derivatives not subject to a Master Netting Agreement or similar agreement (“MNA”) | | | (26,184 | ) | | | (11,727 | ) |
| | | | |
Total derivative assets and liabilities subject to an MNA | | $ | 28,517 | | | $ | 37,656 | |
| | | | |
| | 1 | | Includes options purchased at value which is included in Investments at value - unaffiliated in the Statements of Assets and Liabilities and reported in the Schedule of Investments. |
| | 2 | | Includes unrealized appreciation (depreciation) on OTC swaps and swap premiums paid/received in the Statements of Assets and Liabilities. |
The following tables present the Fund’s derivative assets and liabilities by counterparty net of amounts available for offset under an MNA and net of the related collateral received and pledged by the Fund.
| | | | | | | | | | | | | | | | | | | | |
| Counterparty | | Derivative Assets
Subject to an MNA by
Counterparty | | | Derivatives Available
for Offset1 | | | Non-cash
Collateral
Received | | | Cash
Collateral
Received | | | Net Amount of
Derivative Assets2 | |
Bank of America N.A. | | $ | 40 | | | $ | (40 | ) | | | — | | | | — | | | | — | |
Barclays Bank PLC | | | 571 | | | | (571 | ) | | | — | | | | — | | | | — | |
BNP Paribas S.A | | | 6,568 | | | | (6,487 | ) | | | — | | | | — | | | $ | 81 | |
Citibank N.A. | | | 4,387 | | | | (546 | ) | | | — | | | | — | | | | 3,841 | |
Credit Suisse International | | | 1,149 | | | | — | | | | — | | | | — | | | | 1,149 | |
Deutsche Bank AG | | | 4,468 | | | | (3,128 | ) | | | — | | | | — | | | | 1,340 | |
Goldman Sachs International | | | 5,623 | | | | (5,623 | ) | | | — | | | | — | | | | — | |
JPMorgan Chase Bank N.A. | | | 1,154 | | | | (1,154 | ) | | | — | | | | — | | | | — | |
Morgan Stanley & Co. International PLC | | | 1,248 | | | | (147 | ) | | | — | | | | — | | | | 1,101 | |
Royal Bank of Scotland PLC | | | 3,309 | | | | (3,309 | ) | | | — | | | | — | | | | — | |
| | | | |
Total | | $ | 28,517 | | | $ | (21,005 | ) | | | — | | | | — | | | $ | 7,512 | |
| | | | |
| | 1 | | The amount of derivatives available for offset is limited to the amount of assets and/or liabilities that are subject to an MNA. |
| | 2 | | Net amount represents the net amount receivable from the counterparty in the event of default. |
See Notes to Financial Statements.
| | | | | | |
| 138 | | BLACKROCK SERIES FUND, INC. | | JUNE 30, 2017 | | |
| | | | |
| Schedule of Investments (concluded) | | | BlackRock U.S. Government Bond Portfolio | |
| | | | | | | | | | | | | | | | | | | | |
| Counterparty | | Derivative Liabilities
Subject to an MNA by
Counterparty | | | Derivatives Available
for Offset1 | | | Non-cash
Collateral
Pledged | | | Cash
Collateral
Pledged | | | Net Amount of
Derivative Liabilities2
| |
Bank of America N.A | | $ | 184 | | | $ | (40 | ) | | | — | | | | — | | | $ | 144 | |
Barclays Bank PLC | | | 8,241 | | | | (571 | ) | | | — | | | | — | | | | 7,670 | |
BNP Paribas S.A | | | 6,487 | | | | (6,487 | ) | | | — | | | | — | | | | — | |
Citibank N.A | | | 546 | | | | (546 | ) | | | — | | | | — | | | | — | |
Deutsche Bank AG | | | 3,128 | | | | (3,128 | ) | | | — | | | | — | | | | — | |
Goldman Sachs International | | | 7,408 | | | | (5,623 | ) | | | — | | | | — | | | | 1,785 | |
HSBC Bank PLC | | | 17 | | | | — | | | | — | | | | — | | | | 17 | |
JPMorgan Chase Bank N.A | | | 4,968 | | | | (1,154 | ) | | | — | | | | — | | | | 3,814 | |
Morgan Stanley & Co. International PLC | | | 147 | | | | (147 | ) | | | — | | | | — | | | | — | |
Royal Bank of Scotland PLC | | | 3,584 | | | | (3,309 | ) | | | — | | | | — | | | | 275 | |
UBS AG | | | 2,946 | | | | — | | | | — | | | | — | | | | 2,946 | |
Total | | $ | 37,656 | | | $ | (21,005 | ) | | | — | | | | — | | | $ | 16,651 | |
| | | | |
| | 1 | | The amount of derivatives available for offset is limited to the amount of assets and/or liabilities that are subject to an MNA. |
| | 2 | | Net amount represents the net amount payable due to the counterparty in the event of default. |
|
| Fair Value Hierarchy as of Period End |
Various inputs are used in determining the fair value of investments and derivative financial instruments. For information about the Fund’s policy regarding valuation of investments and derivative financial instruments, refer to the Notes to Financial Statements.
The following tables summarize the Fund’s investments and derivative financial instruments categorized in the disclosure hierarchy:
| | | | | | | | | | | | | | | | | | | | |
| | | Level 1 | | Level 2 | | Level 3 | | Total |
Assets: | | | | | | | | | | | | | | | | | | | | |
Investments: | | | | | | | | | | | | | | | | | | | | |
Long-Term Investments: | | | | | | | | | | | | | | | | | | | | |
Asset-Backed Securities | | | | — | | | | $ | 1,700,217 | | | | $ | 340,213 | | | | $ | 2,040,430 | |
Corporate Bonds | | | | — | | | | | 40,797 | | | | | — | | | | | 40,797 | |
Foreign Government Obligations | | | | — | | | | | 618,590 | | | | | — | | | | | 618,590 | |
Non-Agency Mortgage-Backed Securities | | | | — | | | | | 1,665,205 | | | | | — | | | | | 1,665,205 | |
U.S. Government Sponsored Agency Securities | | | | — | | | | | 44,623,736 | | | | | — | | | | | 44,623,736 | |
U.S. Treasury Obligations | | | | — | | | | | 29,929,809 | | | | | — | | | | | 29,929,809 | |
Options Purchased: | | | | | | | | | | | | | | | | | | | | |
Foreign currency exchange contracts | | | | — | | | | | 504 | | | | | — | | | | | 504 | |
Interest rate contracts | | | $ | 14,844 | | | | | — | | | | | — | | | | | 14,844 | |
Liabilities: | | | | | | | | | | | | | | | | | | | | |
Investments: | | | | | | | | | | | | | | | | | | | | |
TBA Sale Commitments | | | | — | | | | | (18,697,302 | ) | | | | — | | | | | (18,697,302 | ) |
| | | | | |
Total | | | $ | 14,844 | | | | $ | 59,881,556 | | | | $ | 340,213 | | | | $ | 60,236,613 | |
| | | | | |
| | | | | | | | | | | | | | | | | | | | |
Derivative Financial Instruments1 | | | | | | | | | | | | | | | | | | | | |
Assets: | | | | | | | | | | | | | | | | | | | | |
Foreign currency exchange contracts | | | | — | | | | $ | 25,440 | | | | | — | | | | $ | 25,440 | |
Interest rate contracts | | | $ | 40,000 | | | | | 21,725 | | | | | — | | | | | 61,725 | |
Other contracts | | | | — | | | | | 1,881 | | | | | — | | | | | 1,881 | |
Liabilities: | | | | | | | | | | | | | | | | | | | | |
Credit contracts | | | | — | | | | | (3,263 | ) | | | | — | | | | | (3,263 | ) |
Foreign currency exchange contracts | | | | — | | | | | (32,765 | ) | | | | — | | | | | (32,765 | ) |
Interest rate contracts | | | | (8,314 | ) | | | | (3,093 | ) | | | | — | | | | | (11,407 | ) |
| | | | | |
Total | | | $ | 31,686 | | | | $ | 9,925 | | | | | — | | | | $ | 41,611 | |
| | | | | |
1 Derivative financial instruments are swaps, futures contracts, forward foreign currency contracts and options written. Swaps, futures contracts and forward foreign currency contracts are valued at the unrealized appreciation (depreciation) on the instrument and options written are shown at value. | |
|
| The Fund may hold liabilities in which the fair value approximates the carrying amount or face value, including accrued interest, for financial statement purposes. As of period end, reverse repurchase agreements of $6,775,203 are categorized as Level 2 within the disclosure hierarchy. | |
|
| During the six months ended June 30, 2017, there were no transfers between levels. | |
See Notes to Financial Statements.
| | | | | | |
| | | BLACKROCK SERIES FUND, INC. | | JUNE 30, 2017 | | 139 |
| | | | |
| Statements of Assets and Liabilities | | | | |
| | | | | | | | | | | | | | | | |
| June 30, 2017 (Unaudited) | | BlackRock
Advantage
Large Cap Core
Portfolio | | | BlackRock
Balanced Capital
Portfolio | | | BlackRock
Capital
Appreciation
Portfolio | | | BlackRock
Global
Allocation
Portfolio1 | |
| | | | | | | | | | | | | | | | |
| Assets | | | | | | | | | | | | | | | | |
Investments at value — unaffiliated2,3 | | $ | 174,045,951 | | | $ | 494,955,601 | | | $ | 156,811,053 | | | $ | 203,099,657 | |
Investments at value — affiliated4 | | | 14,882,647 | | | | 56,705,338 | | | | 8,757,205 | | | | 12,702,662 | |
Cash | | | 34,612 | | | | 1,437,576 | | | | — | | | | 3,619 | |
Cash held for investments sold short | | | — | | | | — | | | | — | | | | 1,488,522 | |
Cash pledged: | | | | | | | | | | | | | | | | |
Futures contracts | | | 103,000 | | | | 1,824,000 | | | | — | | | | 177,000 | |
Centrally cleared swaps | | | — | | | | 152,182 | | | | — | | | | 103,750 | |
Foreign currency at value5 | | | — | | | | 1,863,174 | | | | — | | | | 131,993 | |
Receivables: | | | | | | | | | | | | | | | | |
Investments sold | | | 944,971 | | | | 2,425,164 | | | | 719,816 | | | | 1,772,384 | |
Securities lending income — affiliated | | | 1,605 | | | | 2,787 | | | | 20,116 | | | | 6,550 | |
TBA sale commitments | | | — | | | | 30,623,466 | | | | — | | | | — | |
Capital shares sold | | | 2,650 | | | | — | | | | — | | | | 3,739 | |
Dividends — unaffiliated | | | 107,448 | | | | 187,079 | | | | 16,345 | | | | 180,835 | |
Dividends — affiliated | | | 6,451 | | | | 24,376 | | | | 954 | | | | 3,484 | |
Interest — unaffiliated | | | — | | | | 928,526 | | | | — | | | | 520,348 | |
From the Manager | | | 35,783 | | | | 84,424 | | | | 24,462 | | | | 49,109 | |
Swap premiums paid | | | — | | | | 36,780 | | | | — | | | | — | |
Unrealized appreciation on: | | | | | | | | | | | | | | | | |
Forward foreign currency exchange contracts | | | — | | | | 289,296 | | | | — | | | | 36,916 | |
OTC swaps | | | — | | | | 60,891 | | | | — | | | | 392,023 | |
Variation margin receivable on financial futures contracts | | | 681 | | | | 24,378 | | | | — | | | | 5,530 | |
Variation margin receivable on centrally cleared swaps | | | — | | | | — | | | | — | | | | 1,107 | |
Prepaid expenses | | | 423 | | | | 1,259 | | | | 650 | | | | 8,239 | |
Other assets | | | — | | | | 18,474 | | | | — | | | | — | |
| | | | |
Total assets | | | 190,166,222 | | | | 591,644,771 | | | | 166,350,601 | | | | 220,687,467 | |
| | | | |
| | | | | | | | | | | | | | | | |
| Liabilities | | | | | | | | | | | | | | | | |
Investments sold short at value6 | | | — | | | | — | | | | — | | | | 1,697,917 | |
Cash received as collateral for OTC derivatives | | | — | | | | — | | | | — | | | | 700,000 | |
Borrowed bonds at value7 | | | — | | | | 1,098,961 | | | | — | | | | — | |
Collateral on securities loaned at value | | | 8,091,363 | | | | 10,284,931 | | | | 8,688,157 | | | | 4,797,793 | |
Options written at value8 | | | — | | | | 9,025 | | | | — | | | | 323,698 | |
TBA sale commitments at value9 | | | — | | | | 30,496,501 | | | | — | | | | — | |
Reverse repurchase agreements | | | — | | | | 10,017,553 | | | | — | | | | — | |
Payables: | | | | | | | | | | | | | | | | |
Investments purchased | | | 5,865,924 | | | | 38,334,525 | | | | 784,464 | | | | 1,050,553 | |
Capital shares redeemed | | | 112,192 | | | | 247,759 | | | | 2,698 | | | | 102,719 | |
Deferred foreign capital gain tax | | | — | | | | — | | | | — | | | | 24,439 | |
Foreign taxes | | | — | | | | 233 | | | | — | | | | — | |
Interest expense | | | — | | | | 885 | | | | — | | | | — | |
Investment advisory fees | | | 52,990 | | | | 148,244 | | | | 47,444 | | | | 63,625 | |
Officer’s and Directors’ fees | | | 1,156 | | | | 2,386 | | | | 1,130 | | | | 1,402 | |
Other affiliates | | | 1,343 | | | | 5,386 | | | | 1,231 | | | | 1,787 | |
Swap premiums received | | | — | | | | 66,735 | | | | — | | | | — | |
Unrealized depreciation on: | | | | | | | | | | | | | | | | |
Forward foreign currency exchange contracts | | | — | | | | 119,059 | | | | — | | | | 105,822 | |
OTC swaps | | | — | | | | 65,369 | | | | — | | | | 1,439 | |
Variation margin payable on financial futures contracts | | | — | | | | 199,585 | | | | — | | | | 2,248 | |
Variation margin payable on centrally cleared swaps | | | — | | | | 12,453 | | | | — | | | | — | |
Other accrued expenses payable | | | 121,669 | | | | 358,527 | | | | 111,662 | | | | 409,043 | |
| | | | |
Total liabilities | | | 14,246,637 | | | | 91,468,117 | | | | 9,636,786 | | | | 9,282,485 | |
| | | | |
Net Assets | | $ | 175,919,585 | | | $ | 500,176,654 | | | $ | 156,713,815 | | | $ | 211,404,982 | |
| | | | |
| | | | | | | | | | | | | | | | |
See Notes to Financial Statements.
| | | | | | |
140 | | BLACKROCK SERIES FUND, INC. | | JUNE 30, 2017 | | |
| | | | |
| Statements of Assets and Liabilities (continued) | | | | |
| | | | | | | | | | | | | | | | |
| June 30, 2017 (Unaudited) | | BlackRock
Advantage
Large Cap Core
Portfolio | | | BlackRock
Balanced Capital
Portfolio | | | BlackRock
Capital
Appreciation
Portfolio | | | BlackRock
Global Allocation
Portfolio1 | |
| | | | | | | | | | | | | | | | |
| Net Assets Consist of | | | | | | | | | | | | | | | | |
Paid-in capital | | $ | 123,001,128 | | | $ | 408,240,898 | | | $ | 110,258,959 | | | $ | 199,081,403 | |
Undistributed net investment income | | | 1,207,084 | | | | 4,761,170 | | | | 179,444 | | | | 374,773 | |
Accumulated net realized gain | | | 39,310,574 | | | | 66,820,114 | | | | 10,880,140 | | | | 253,448 | |
Net unrealized appreciation (depreciation) | | | 12,400,799 | | | | 20,354,472 | | | | 35,395,272 | | | | 11,695,358 | |
| | | | |
Net Assets | | $ | 175,919,585 | | | $ | 500,176,654 | | | $ | 156,713,815 | | | $ | 211,404,982 | |
| | | | |
Shares outstanding, $0.10 par value10 | | | 5,914,423 | | | | 27,724,019 | | | | 3,964,400 | | | | 13,430,300 | |
| | | | |
Net asset value, offering and redemption price per share | | $ | 29.74 | | | $ | 18.04 | | | $ | 39.53 | | | $ | 15.74 | |
| | | | |
1 Consolidated Statement of Assets and Liabilities 2 Investments at cost — unaffiliated | | $ | 161,638,013 | | | $ | 474,330,867 | | | $ | 121,415,086 | | | $ | 191,538,925 | |
3 Securities loaned at value | | $ | 7,929,856 | | | $ | 10,090,791 | | | $ | 8,569,000 | | | $ | 4,663,334 | |
4 Investments at cost — affiliated | | $ | 14,883,280 | | | $ | 57,217,234 | | | $ | 8,757,900 | | | $ | 12,808,761 | |
5 Foreign currency at cost | | | — | | | $ | 1,847,828 | | | | — | | | $ | 131,323 | |
6 Proceeds from investments sold short | | | — | | | | — | | | | — | | | $ | 1,535,060 | |
7 Proceeds received from borrowed bonds | | | — | | | $ | 1,084,779 | | | | — | | | | — | |
8 Premiums received | | | — | | | $ | 27,297 | | | | — | | | $ | 402,403 | |
9 Proceeds from TBA sale commitments | | | — | | | $ | 30,623,466 | | | | — | | | | — | |
10 Authorized shares | | | 100 million | | | | 300 million | | | | 100 million | | | | 100 million | |
See Notes to Financial Statements.
| | | | | | |
| | | BLACKROCK SERIES FUND, INC. | | JUNE 30, 2017 | | 141 |
| | | | |
| Statements of Assets and Liabilities (continued) | | | | |
| | | | | | | | | | | | | | | | |
| June 30, 2017 (Unaudited) | | BlackRock
Government
Money Market
Portfolio | | | BlackRock
High Yield
Portfolio | | | BlackRock
Total Return
Portfolio | | | BlackRock
U.S. Government
Bond Portfolio | |
| | | | | | | | | | | | | | | | |
| Assets | | | | | | | | | | | | | | | | |
Investments at value — unaffiliated1 | | $ | 69,161,800 | | | $ | 32,303,065 | | | $ | 69,399,048 | | | $ | 78,933,915 | |
Investments at value — affiliated2 | | | — | | | | 981,988 | | | | 839,602 | | | | — | |
Cash | | | 261,953 | | | | — | | | | 432,356 | | | | 145,214 | |
Cash pledged: | | | | | | | | | | | | | | | | |
Futures contracts | | | — | | | | 2,000 | | | | — | | | | 33,540 | |
Centrally cleared swaps | | | — | | | | 31,190 | | | | 54,500 | | | | 49,000 | |
Foreign currency at value3 | | | — | | | | — | | | | 123,926 | | | | 130,846 | |
Repurchase agreements at value4 | | | 45,200,000 | | | | — | | | | — | | | | — | |
Receivables: | | | | | | | | | | | | | | | | |
Investments sold | | | — | | | | 454,340 | | | | 218,118 | | | | 286,673 | |
TBA sale commitments | | | — | | | | — | | | | 9,861,656 | | | | 18,773,256 | |
Capital shares sold | | | 139,649 | | | | — | | | | — | | | | 1,206 | |
Dividends — unaffiliated | | | — | | | | 1,108 | | | | — | | | | — | |
Dividends — affiliated | | | — | | | | 275 | | | | 352 | | | | 677 | |
Interest — unaffiliated | | | 45,975 | | | | 479,260 | | | | 340,805 | | | | 237,111 | |
From the Manager | | | 36,835 | | | | 7,892 | | | | 14,445 | | | | 13,835 | |
Swap premiums paid | | | — | | | | 195 | | | | 16,105 | | | | 3 | |
Unrealized appreciation on: | | | | | | | | | | | | | | | | |
Forward foreign currency exchange contracts | | | — | | | | 13,045 | | | | 46,317 | | | | 25,440 | |
OTC swaps | | | — | | | | 34 | | | | 17,855 | | | | 2,570 | |
Variation margin receivable on financial futures contracts | | | — | | | | 281 | | | | 9,605 | | | | 11,340 | |
Variation margin receivable on centrally cleared swaps | | | — | | | | 535 | | | | — | | | | — | |
Prepaid expenses | | | 299 | | | | 90 | | | | 157 | | | | 172 | |
Other assets | | | — | | | | — | | | | 1,211 | | | | 48,070 | |
| | | | |
Total assets | | | 114,846,511 | | | | 34,275,298 | | | | 81,376,058 | | | | 98,692,868 | |
| | | | |
| | | | | | | | | | | | | | | | |
| Liabilities | | | | | | | | | | | | | | | | |
Borrowed bonds at value5 | | | — | | | | — | | | | 221,910 | | | | — | |
Bank overdraft | | | — | | | | 8,512 | | | | — | | | | — | |
Options written at value6 | | | — | | | | 245 | | | | 3,239 | | | | 1,381 | |
TBA sale commitments at value7 | | | — | | | | — | | | | 9,822,102 | | | | 18,697,302 | |
Reverse repurchase agreements | | | — | | | | — | | | | 7,388,836 | | | | 6,775,203 | |
Payables: | | | | | | | | | | | | | | | | |
Investments purchased | | | 1,000,000 | | | | 600,203 | | | | 9,017,589 | | | | 15,320,888 | |
Capital shares redeemed | | | 540 | | | | 579 | | | | 2,962 | | | | 155,362 | |
Foreign taxes | | | — | | | | — | | | | 87 | | | | — | |
Income dividends | | | — | | | | 154,665 | | | | 131,344 | | | | 104,623 | |
Investment advisory fees | | | 34,275 | | | | 23 | | | | — | | | | 4,948 | |
Officer’s and Directors’ fees | | | 1,011 | | | | 699 | | | | 810 | | | | 830 | |
Other affiliates | | | 969 | | | | 284 | | | | 505 | | | | 545 | |
Swap premiums received | | | — | | | | 2,345 | | | | 24,953 | | | | 579 | |
Unrealized depreciation on: | | | | | | | | | | | | | | | | |
Forward foreign currency exchange contracts | | | — | | | | 12,786 | | | | 40,624 | | | | 32,765 | |
OTC swaps | | | — | | | | 1,287 | | | | 23,725 | | | | 4,312 | |
Variation margin payable on financial futures contracts | | | — | | | | — | | | | 7,074 | | | | 6,429 | |
Variation margin payable on centrally cleared swaps | | | — | | | | — | | | | 4,727 | | | | 3,917 | |
Other accrued expenses payable | | | 23,956 | | | | 55,906 | | | | 38,563 | | | | 104,734 | |
| | | | |
Total liabilities | | | 1,060,751 | | | | 837,534 | | | | 26,729,050 | | | | 41,213,818 | |
| | | | |
Net Assets | | $ | 113,785,760 | | | $ | 33,437,764 | | | $ | 54,647,008 | | | $ | 57,479,050 | |
| | | | |
See Notes to Financial Statements.
| | | | | | |
| 142 | | BLACKROCK SERIES FUND, INC. | | JUNE 30, 2017 | | |
| | | | |
| Statements of Assets and Liabilities (concluded) | | | | |
| | | | | | | | | | | | | | | | |
| June 30, 2017 (Unaudited) | | BlackRock
Government
Money Market
Portfolio | | | BlackRock
High Yield
Portfolio | | | BlackRock
Total Return
Portfolio | | | BlackRock
U.S. Government
Bond Portfolio | |
| | | | | | | | | | | | | | | | |
| Net Assets Consist of | | | | | | | | | | | | | | | | |
Paid-in capital | | $ | 113,785,261 | | | $ | 38,077,710 | | | $ | 57,671,327 | | | $ | 59,559,733 | |
Undistributed (distributions in excess of) net investment income | | | — | | | | (182,155 | ) | | | (77,974 | ) | | | 113,341 | |
Accumulated net realized gain (loss) | | | 499 | | | | (5,120,652 | ) | | | (3,452,952 | ) | | | (2,475,168 | ) |
Net unrealized appreciation (depreciation) | | | — | | | | 662,861 | | | | 506,607 | | | | 281,144 | |
| | | | |
Net Assets | | $ | 113,785,760 | | | $ | 33,437,764 | | | $ | 54,647,008 | | | $ | 57,479,050 | |
| | | | |
Shares outstanding, $0.10 par value8 | | | 113,785,266 | | | | 6,177,143 | | | | 4,665,998 | | | | 5,273,826 | |
| | | | |
Net asset value, offering and redemption price per share | | $ | 1.00 | | | $ | 5.41 | | | $ | 11.71 | | | $ | 10.90 | |
| | | | |
1 Investments at cost — unaffiliated | | $ | 69,161,800 | | | $ | 31,640,519 | | | $ | 68,953,279 | | | $ | 78,822,111 | |
2 Investments at cost — affiliated | | | — | | | $ | 981,988 | | | $ | 834,779 | | | | — | |
3 Foreign currency at cost | | | — | | | | — | | | $ | 123,002 | | | $ | 130,597 | |
4 Repurchase agreements at cost | | $ | 45,200,000 | | | | — | | | | — | | | | — | |
5 Proceeds received from borrowed bonds | | | — | | | | — | | | $ | 217,322 | | | | — | |
6 Premiums received | | | — | | | $ | 649 | | | $ | 9,574 | | | $ | 3,675 | |
7 Proceeds from TBA sale commitments | | | — | | | | — | | | $ | 9,861,656 | | | $ | 18,773,256 | |
8 Authorized shares | | | 2 billion | | | | 100 million | | | | 100 million | | | | 100 million | |
See Notes to Financial Statements.
| | | | | | |
| | | BLACKROCK SERIES FUND, INC. | | JUNE 30, 2017 | | 143 |
| | | | | | | | | | | | | | | | |
| Six Months Ended June 30, 2017 (Unaudited) | | BlackRock
Advantage
Large Cap Core
Portfolio | | | BlackRock
Balanced
Capital
Portfolio | | | BlackRock
Capital
Appreciation
Portfolio | | | BlackRock
Global
Allocation
Portfolio1 | |
| | | | | | | | | | | | | | | | |
| Investment Income | | | | | | | | | | | | | |
Dividends — unaffiliated | | $ | 1,612,431 | | | $ | 2,837,654 | | | $ | 528,549 | | | $ | 1,531,718 | |
Dividends — affiliated | | | 15,595 | | | | 301,615 | | | | 2,679 | | | | 13,977 | |
Interest | | | 230 | | | | 2,337,743 | | | | — | | | | 841,572 | |
Securities lending — affiliated — net | | | 9,097 | | | | 16,300 | | | | 32,727 | | | | 22,417 | |
Foreign taxes withheld | | | (14,184 | ) | | | (26,018 | ) | | | (4,121 | ) | | | (103,081 | ) |
| | | | |
Total investment income | | | 1,623,169 | | | | 5,467,294 | | | | 559,834 | | | | 2,306,603 | |
| | | | |
| | | | | | | | | | | | | | | | |
| Expenses | | | | | | | | | | | | | | | | |
Investment advisory | | | 318,609 | | | | 911,250 | | | | 274,322 | | | | 385,268 | |
Transfer agent | | | 118,396 | | | | 347,606 | | | | 102,282 | | | | 149,638 | |
Professional | | | 35,656 | | | | 28,812 | | | | 26,178 | | | | 50,556 | |
Accounting services | | | 20,631 | | | | 55,593 | | | | 18,152 | | | | 30,265 | |
Printing | | | 11,044 | | | | 19,316 | | | | 10,488 | | | | 12,583 | |
Officer and Directors | | | 10,101 | | | | 12,496 | | | | 9,927 | | | | 10,404 | |
Custodian | | | 6,965 | | | | 59,001 | | | | 12,463 | | | | 146,439 | |
Pricing | | | 1,952 | | | | 25,093 | | | | 1,214 | | | | 49,283 | |
Miscellaneous | | | 3,684 | | | | 11,048 | | | | 3,752 | | | | 12,868 | |
| | | | |
Total expenses excluding dividend expense and interest expense | | | 527,038 | | | | 1,470,215 | | | | 458,778 | | | | 847,304 | |
Dividend expense | | | — | | | | — | | | | — | | | | 28,536 | |
Interest expense | | | — | | | | 50,470 | | | | — | | | | — | |
| | | | |
Total expenses | | | 527,038 | | | | 1,520,685 | | | | 458,778 | | | | 875,840 | |
Less: | | | | | | | | | | | | | | | | |
Fees waived by the Manager | | | (3,628 | ) | | | (19,273 | ) | | | (318 | ) | | | (104,269 | ) |
Transfer agent fees reimbursed | | | (87,342 | ) | | | (246,851 | ) | | | (69,914 | ) | | | (146,822 | ) |
Other expenses reimbursed | | | (2,582 | ) | | | — | | | | — | | | | — | |
| | | | |
Total expenses after fees waived and/or reimbursed | | | 433,486 | | | | 1,254,561 | | | | 388,546 | | | | 624,749 | |
| | | | |
Net investment income | | | 1,189,683 | | | | 4,212,733 | | | | 171,288 | | | | 1,681,854 | |
| | | | |
| | | | | | | | | | | | | | | | |
| Realized and Unrealized Gain (Loss) | | | | | | | | | | | | | | | | |
Net realized gain (loss) from: | | | | | | | | | | | | | | | | |
Investments — unaffiliated | | | 34,904,479 | | | | 58,971,945 | 2 | | | 6,898,005 | | | | 6,751,988 | |
Investments — affiliated | | | (1,055 | ) | | | (183,372 | ) | | | 148 | | | | 8,176 | |
Futures contracts | | | 108,049 | | | | 1,412,779 | | | | — | | | | (572,628 | ) |
Forward foreign currency exchange contracts | | | — | | | | (114,084 | ) | | | — | | | | 592,462 | |
Foreign currency transactions | | | — | | | | 166,164 | | | | (59 | ) | | | (1,384,156 | ) |
Options written | | | — | | | | 70,810 | | | | — | | | | 250,121 | |
Short sales | | | — | | | | — | | | | — | | | | (11,424 | ) |
Swaps | | | — | | | | (19,362 | ) | | | — | | | | 51,625 | |
Borrowed bonds | | | — | | | | (31,402 | ) | | | — | | | | — | |
| | | | |
| | | 35,011,473 | | | | 60,273,478 | | | | 6,898,094 | | | | 5,686,164 | |
| | | | |
Net change in unrealized appreciation (depreciation) on: | | | | | | | | | | | | | | | | |
Investments — unaffiliated | | | (20,368,012 | ) | | | (31,648,451 | ) | | | 17,014,530 | | | | 9,461,680 | 2 |
Investments — affiliated | | | (263 | ) | | | 468,513 | | | | (636 | ) | | | 40,960 | |
Futures contracts | | | 10,773 | | | | 29,176 | | | | — | | | | 26,496 | |
Forward foreign currency exchange contracts | | | — | | | | 101,407 | | | | — | | | | (1,438,022 | ) |
Foreign currency translations | | | — | | | | 17,587 | | | | — | | | | 13,879 | |
Options written | | | — | | | | 2,825 | | | | — | | | | 234,039 | |
Short sales | | | — | | | | (4,832 | ) | | | — | | | | (102,639 | ) |
Swaps | | | — | | | | (16,440 | ) | | | — | | | | 197,694 | |
Borrowed bonds | | | — | | | | (23,227 | ) | | | — | | | | — | |
| | | | |
| | | (20,357,502 | ) | | | (31,073,442 | ) | | | 17,013,894 | | | | 8,434,087 | |
| | | | |
Total realized and unrealized gain | | | 14,653,971 | | | | 29,200,036 | | | | 23,911,988 | | | | 14,120,251 | |
| | | | |
Net Increase in Net Assets Resulting from Operations | | $ | 15,843,654 | | | $ | 33,412,769 | | | $ | 24,083,276 | | | $ | 15,802,105 | |
| | | | |
1 Consolidated Statement of Operations | | | | | | | | | | | | | | | | |
2 Net of foreign capital gain tax | | | — | | | $ | (338 | ) | | | — | | | $ | (21,467 | ) |
| | | | |
See Notes to Financial Statements.
| | | | | | |
| 144 | | BLACKROCK SERIES FUND, INC. | | JUNE 30, 2017 | | |
| | | | |
| Statements of Operations (concluded) | | | | |
| | | | | | | | | | | | | | | | |
| Six Months Ended June 30, 2017 (Unaudited) | | BlackRock
Government
Money Market
Portfolio | | | BlackRock
High Yield
Portfolio | | | BlackRock
Total Return
Portfolio | | | BlackRock
U.S. Government
Bond Portfolio | |
| | | | | | | | | | | | | | | | |
| Investment Income | | | | | | | | | | | | | |
Dividends — unaffiliated | | | — | | | $ | 13,820 | | | $ | 6,928 | | | | — | |
Dividends — affiliated | | | — | | | | 1,269 | | | | 13,498 | | | $ | 2,650 | |
Interest | | $ | 440,858 | | | | 1,018,798 | | | | 845,907 | | | | 720,377 | |
Foreign taxes withheld | | | — | | | | (9 | ) | | | (26 | ) | | | — | |
| | | | |
Total investment income | | | 440,858 | | | | 1,033,878 | | | | 866,307 | | | | 723,027 | |
| | | | |
| | | | | | | | | | | | | | | | |
| Expenses | | | | | | | | | | | | | | | | |
Investment advisory | | | 212,021 | | | | 61,602 | | | | 102,963 | | | | 108,467 | |
Transfer agent | | | 121,383 | | | | 25,733 | | | | 40,833 | | | | 43,960 | |
Professional | | | 24,364 | | | | 27,059 | | | | 34,886 | | | | 35,258 | |
Custodian | | | 12,150 | | | | 18,024 | | | | 43,399 | | | | 32,553 | |
Printing | | | 10,011 | | | | 7,962 | | | | 8,810 | | | | 8,558 | |
Officer and Directors | | | 9,726 | | | | 9,106 | | | | 9,286 | | | | 9,312 | |
Accounting services | | | 2,322 | | | | 6,372 | | | | 8,959 | | | | 9,356 | |
Registration | | | 28 | | | | — | | | | — | | | | — | |
Miscellaneous | | | 3,962 | | | | 11,662 | | | | 26,401 | | | | 13,723 | |
| | | | |
Total expenses excluding interest expense | | | 395,967 | | | | 167,520 | | | | 275,537 | | | | 261,187 | |
Interest expense | | | — | | | | — | | | | 19,060 | | | | 22,872 | |
| | | | |
Total expenses | | | 395,967 | | | | 167,520 | | | | 294,597 | | | | 284,059 | |
Less: | | | | | | | | | | | | | | | | |
Fees waived by the Manager | | | — | | | | (59,916 | ) | | | (95,041 | ) | | | (71,534 | ) |
Transfer agent fees reimbursed | | | (107,836 | ) | | | (23,253 | ) | | | (38,354 | ) | | | (41,480 | ) |
Other expenses reimbursed | | | — | | | | — | | | | (1,463 | ) | | | — | |
| | | | |
Total expenses after fees waived and/or reimbursed | | | 288,131 | | | | 84,351 | | | | 159,739 | | | | 171,045 | |
| | | | |
Net investment income | | | 152,727 | | | | 949,527 | | | | 706,568 | | | | 551,982 | |
| | | | |
| | | | | | | | | | | | | | | | |
| Realized and Unrealized Gain (Loss) | | | | | | | | | | | | | | | | |
Net realized gain (loss) from: | | | | | | | | | | | | | | | | |
Investments — unaffiliated | | | 499 | | | | 545,755 | | | | (175,628 | ) | | | (864,143 | ) |
Investments — affiliated | | | — | | | | 2,494 | | | | 23,791 | | | | — | |
Futures contracts | | | — | | | | (26,653 | ) | | | 160,509 | | | | (144,666 | ) |
Forward foreign currency exchange contracts | | | — | | | | 21,719 | | | | (14,184 | ) | | | 21,046 | |
Foreign currency transactions | | | — | | | | 879 | | | | 10,357 | | | | (1,340 | ) |
Options written | | | — | | | | 13,120 | | | | 25,400 | | | | 43,962 | |
Borrowed bonds | | | — | | | | — | | | | (21,214 | ) | | | (149 | ) |
Swaps | | | — | | | | 39,679 | | | | (38,687 | ) | | | (58,629 | ) |
| | | | |
| | | 499 | | | | 596,993 | | | | (29,656 | ) | | | (1,003,919 | ) |
| | | | |
Net change in unrealized appreciation (depreciation) on: | | | | | | | | | | | | | | | | |
Investments — unaffiliated | | | — | | | | 81,626 | | | | 834,339 | | | | 1,189,262 | |
Investments — affiliated | | | — | | | | (1,138 | ) | | | 4,823 | | | | — | |
Futures contracts | | | — | | | | (1,072 | ) | | | 8,525 | | | | 98,952 | |
Forward foreign currency exchange contracts | | | — | | | | 6,145 | | | | (17,809 | ) | | | (11,512 | ) |
Foreign currency translations | | | — | | | | 5,605 | | | | 1,233 | | | | 332 | |
Options written | | | — | | | | (6,617 | ) | | | 677 | | | | (4,399 | ) |
Swaps | | | — | | | | (19,537 | ) | | | 24,803 | | | | 59,320 | |
Borrowed bonds | | | — | | | | — | | | | (5,900 | ) | | | (51 | ) |
| | | | |
| | | — | | | | 65,012 | | | | 850,691 | | | | 1,331,904 | |
| | | | |
Total realized and unrealized gain | | | 499 | | | | 662,005 | | | | 821,035 | | | | 327,985 | |
| | | | |
Net Increase in Net Assets Resulting from Operations | | $ | 153,226 | | | $ | 1,611,532 | | | $ | 1,527,603 | | | $ | 879,967 | |
| | | | |
See Notes to Financial Statements.
| | | | | | |
| | | BLACKROCK SERIES FUND, INC. | | JUNE 30, 2017 | | 145 |
| | | | |
| Statements of Changes in Net Assets | | | | |
| | | | | | | | | | | | | | | | |
| | | BlackRock
Advantage
Large Cap Core
Portfolio | | | BlackRock
Balanced Capital
Portfolio | |
| Increase (Decrease) in Net Assets: | | Six Months
Ended June 30, 2017
(Unaudited) | | | Year Ended
December 31,
2016 | | | Six Months
Ended
June 30, 2017
(Unaudited) | | | Year Ended
December 31,
2016 | |
| | | | | | | | | | | | | | | | |
| Operations | | | | | | | | | | | | | | | | |
Net investment income | | $ | 1,189,683 | | | $ | 2,175,951 | | | $ | 4,212,733 | | | $ | 8,292,344 | |
Net realized gain | | | 35,011,473 | | | | 13,875,708 | | | | 60,273,478 | | | | 33,164,356 | |
Net change in unrealized appreciation (depreciation) | | | (20,357,502 | ) | | | 93,987 | | | | (31,073,442 | ) | | | (1,754,877 | ) |
| | | | | | | | |
Net increase in net assets resulting from operations | | | 15,843,654 | | | | 16,145,646 | | | | 33,412,769 | | | | 39,701,823 | |
| | | | | | | | |
| | | | | | | | | | | | | | | | |
| Distributions to Shareholders From1 | | | | | | | | | | | | | | | | |
Net investment income | | | — | | | | (2,163,153 | ) | | | — | | | | (8,250,008 | ) |
Net realized gain | | | — | | | | (10,752,453 | ) | | | — | | | | (27,748,529 | ) |
| | | | | | | | |
Decrease in net assets resulting from distributions to shareholders | | | — | | | | (12,915,606 | ) | | | — | | | | (35,998,537 | ) |
| | | | | | | | |
| | | | | | | | | | | | | | | | |
| Capital Share Transactions | | | | | | | | | | | | | | | | |
Net decrease in net assets derived from capital share transactions | | | (7,911,153 | ) | | | (4,416,028 | ) | | | (23,677,700 | ) | | | (12,700,405 | ) |
| | | | | | | | |
| | | | | | | | | | | | | | | | |
| Net Assets | | | | | | | | | | | | | | | | |
Total increase (decrease) in net assets | | | 7,932,501 | | | | (1,185,988 | ) | | | 9,735,069 | | | | (8,997,119 | ) |
Beginning of period | | | 167,987,084 | | | | 169,173,072 | | | | 490,441,585 | | | | 499,438,704 | |
| | | | | | | | |
End of period | | $ | 175,919,585 | | | $ | 167,987,084 | | | $ | 500,176,654 | | | $ | 490,441,585 | |
| | | | | | | | |
Undistributed net investment income, end of period | | $ | 1,207,084 | | | $ | 17,401 | | | $ | 4,761,170 | | | $ | 548,437 | |
| | | | | | | | |
| 1 | | Distributions for annual periods determined in accordance with U.S. federal income tax regulations. |
See Notes to Financial Statements.
| | | | | | |
| 146 | | BLACKROCK SERIES FUND, INC. | | JUNE 30, 2017 | | |
| | | | |
| Statements of Changes in Net Assets (continued) | | | | |
| | | | | | | | | | | | | | | | |
| | | BlackRock
Capital Appreciation
Portfolio | | | BlackRock
Global Allocation
Portfolio1 | |
| Increase (Decrease) in Net Assets: | | Six Months
Ended June 30, 2017
(Unaudited) | | | Year Ended
December 31,
2016 | | | Six Months
Ended June 30, 2017
(Unaudited) | | | Year Ended
December 31,
2016 | |
| | | | | | | | | | | | | | | | |
| Operations | | | | | | | | | | | | | | | | |
Net investment income | | $ | 171,288 | | | $ | 308,556 | | | $ | 1,681,854 | | | $ | 3,479,951 | |
Net realized gain (loss) | | | 6,898,094 | | | | 5,410,955 | | | | 5,686,164 | | | | (4,100,832 | ) |
Net change in unrealized appreciation (depreciation) | | | 17,013,894 | | | | (5,505,546 | ) | | | 8,434,087 | | | | 9,211,000 | |
| | | | | | | | |
Net increase in net assets resulting from operations | | | 24,083,276 | | | | 213,965 | | | | 15,802,105 | | | | 8,590,119 | |
| | | | | | | | |
| | | | | | | | | | | | | | | | |
| Distributions to Shareholders From2 | | | | | | | | | | | | | | | | |
Net investment income | | | — | | | | (329,224 | ) | | | — | | | | (3,425,008 | ) |
Net realized gain | | | — | | | | (3,243,851 | ) | | | — | | | | — | |
| | | | | | | | |
Decrease in net assets resulting from distributions to shareholders | | | — | | | | (3,573,075 | ) | | | — | | | | (3,425,008 | ) |
| | | | | | | | |
| | | | | | | | | | | | | | | | |
| Capital Share Transactions | | | | | | | | | | | | | | | | |
Net decrease in net assets derived from capital share transactions | | | (6,388,598 | ) | | | (14,343,991 | ) | | | (10,922,209 | ) | | | (28,288,889 | ) |
| | | | | | | | |
| | | | | | | | | | | | | | | | |
| Net Assets | | | | | | | | | | | | | | | | |
Total increase (decrease) in net assets | | | 17,694,678 | | | | (17,703,101 | ) | | | 4,879,896 | | | | (23,123,778 | ) |
Beginning of period | | | 139,019,137 | | | | 156,722,238 | | | | 206,525,086 | | | | 229,648,864 | |
| | | | | | | | |
End of period | | $ | 156,713,815 | | | $ | 139,019,137 | | | $ | 211,404,982 | | | $ | 206,525,086 | |
| | | | | | | | |
Undistributed (distributions in excess of) net investment income, end of period | | $ | 179,444 | | | $ | 8,156 | | | $ | 374,773 | | | $ | (1,307,081 | ) |
| | | | | | | | |
| | 1 | | Consolidated Statements of Changes in Net Assets. |
| | 2 | | Distributions for annual periods determined in accordance with U.S. federal income tax regulations. |
See Notes to Financial Statements.
| | | | | | |
| | | BLACKROCK SERIES FUND, INC. | | JUNE 30, 2017 | | 147 |
| | | | |
| Statements of Changes in Net Assets (continued) | | | | |
| | | | | | | | | | | | | | | | |
| | | BlackRock Government Money
Market
Portfolio | | | BlackRock
High Yield
Portfolio | |
| Increase (Decrease) in Net Assets: | | Six Months
Ended
June 30, 2017
(Unaudited) | | | Year Ended
December 31,
2016 | | | Six Months
Ended
June 30, 2017
(Unaudited) | | | Year Ended
December 31,
2016 | |
| | | | | | | | | | | | | | | | |
| Operations | | | | | | | | | | | | | | | | |
Net investment income | | $ | 152,727 | | | $ | 3,280 | | | $ | 949,527 | | | $ | 1,870,604 | |
Net realized gain (loss) | | | 499 | | | | 216 | | | | 596,993 | | | | (1,067,419 | ) |
Net change in unrealized appreciation (depreciation) | | | — | | | | — | | | | 65,012 | | | | 3,677,847 | |
| | | | | | | | |
Net increase in net assets resulting from operations | | | 153,226 | | | | 3,496 | | | | 1,611,532 | | | | 4,481,032 | |
| | | | | | | | |
| | | | | | | | | | | | | | | | |
| Distributions to Shareholders From1 | | | | | | | | | | | | | | | | |
Net investment income | | | (152,727 | ) | | | (3,280 | ) | | | (977,579 | ) | | | (1,884,996 | ) |
Net realized gain | | | — | | | | (706 | ) | | | — | | | | — | |
| | | | | | | | |
Decrease in net assets resulting from distributions to shareholders | | | (152,727 | ) | | | (3,986 | ) | | | (977,579 | ) | | | (1,884,996 | ) |
| | | | | | | | |
| | | | | | | | | | | | | | | | |
| Capital Share Transactions | | | | | | | | | | | | | | | | |
Net decrease in net assets derived from capital share transactions | | | (8,272,036 | ) | | | (3,582,913 | ) | | | (990,450 | ) | | | (589,632 | ) |
| | | | | | | | |
| | | | | | | | | | | | | | | | |
| Net Assets | | | | | | | | | | | | | | | | |
Total increase (decrease) in net assets | | | (8,271,537 | ) | | | (3,583,403 | ) | | | (356,497 | ) | | | 2,006,404 | |
Beginning of period | | | 122,057,297 | | | | 125,640,700 | | | | 33,794,261 | | | | 31,787,857 | |
| | | | | | | | |
End of period | | $ | 113,785,760 | | | $ | 122,057,297 | | | $ | 33,437,764 | | | $ | 33,794,261 | |
| | | | | | | | |
Distributions in excess of net investment income, end of period | | | — | | | | — | | | $ | (182,155 | ) | | $ | (154,103 | ) |
| | | | | | | | |
| 1 | | Distributions for annual periods determined in accordance with U.S. federal income tax regulations. |
See Notes to Financial Statements.
| | | | | | |
| 148 | | BLACKROCK SERIES FUND, INC. | | JUNE 30, 2017 | | |
| | | | |
| Statements of Changes in Net Assets (concluded) | | | | |
| | | | | | | | | | | | | | | | |
| | | BlackRock
Total Return
Portfolio | | | BlackRock U.S.
Government Bond
Portfolio | |
| Increase (Decrease) in Net Assets: | | Six Months
Ended
June 30, 2017
(Unaudited) | | | Year Ended
December 31,
2016 | | | Six Months
Ended
June 30, 2017
(Unaudited) | | | Year Ended
December 31,
2016 | |
| | | | | | | | | | | | | | | | |
| Operations | | | | | | | | | | | | | | | | |
Net investment income | | $ | 706,568 | | | $ | 1,380,272 | | | $ | 551,982 | | | $ | 980,610 | |
Net realized gain (loss) | | | (29,656 | ) | | | (27,831 | ) | | | (1,003,919 | ) | | | 830,361 | |
Net change in unrealized appreciation (depreciation) | | | 850,691 | | | | 478,593 | | | | 1,331,904 | | | | (730,707 | ) |
| | | | | | | | |
Net increase in net assets resulting from operations | | | 1,527,603 | | | | 1,831,034 | | | | 879,967 | | | | 1,080,264 | |
| | | | | | | | |
| | | | | | | | | | | | | | | | |
| Distributions to Shareholders From1 | | | | | | | | | | | | | | | | |
Net investment income | | | (737,550 | ) | | | (1,496,303 | ) | | | (644,842 | ) | | | (1,238,736 | ) |
| | | | | | | | |
| | | | | | | | | | | | | | | | |
| Capital Share Transactions | | | | | | | | | | | | | | | | |
Net decrease in net assets derived from capital share transactions | | | (3,540,698 | ) | | | (4,939,015 | ) | | | (3,261,795 | ) | | | (5,598,780 | ) |
| | | | | | | | |
| | | | | | | | | | | | | | | | |
| Net Assets | | | | | | | | | | | | | | | | |
Total decrease in net assets | | | (2,750,645 | ) | | | (4,604,284 | ) | | | (3,026,670 | ) | | | (5,757,252 | ) |
Beginning of period | | | 57,397,653 | | | | 62,001,937 | | | | 60,505,720 | | | | 66,262,972 | |
| | | | | | | | |
End of period | | $ | 54,647,008 | | | $ | 57,397,653 | | | $ | 57,479,050 | | | $ | 60,505,720 | |
| | | | | | | | |
Undistributed (distributions in excess of) net investment income, end of period | | $ | (77,974 | ) | | $ | (46,992 | ) | | $ | 113,341 | | | $ | 206,201 | |
| | | | | | | | |
| 1 | | Distributions for annual periods determined in accordance with U.S. federal income tax regulations. |
See Notes to Financial Statements.
| | | | | | |
| | | BLACKROCK SERIES FUND, INC. | | JUNE 30, 2017 | | 149 |
| | | | |
| Financial Highlights | | | BlackRock Advantage Large Cap Core Portfolio | |
| | | | | | | | | | | | | | | | | | | | | | | | |
| | | Six Months Ended June 30, 2017 | | | Year Ended December 31, | |
| | | (Unaudited) | | | 2016 | | | 2015 | | | 2014 | | | 2013 | | | 2012 | |
| | | | | | | | | | | | | | | | | | | | | | | | |
| Per Share Operating Performance | | | | | | | | | | | | | | | | | | | | | | | | |
Net asset value, beginning of period | | $ | 27.15 | | | $ | 26.53 | | | $ | 28.11 | | | $ | 27.50 | | | $ | 20.70 | | | $ | 18.65 | |
| | | | |
Net investment income1 | | | 0.20 | | | | 0.36 | | | | 0.32 | | | | 0.29 | | | | 0.27 | | | | 0.34 | |
Net realized and unrealized gain (loss) | | | 2.39 | | | | 2.47 | | | | (0.15 | ) | | | 3.23 | | | | 6.82 | | | | 2.07 | |
| | | | |
Net increase from investment operations | | | 2.59 | | | | 2.83 | | | | 0.17 | | | | 3.52 | | | | 7.09 | | | | 2.41 | |
| | | | |
Distributions from2: | | | | | | | | | | | | | | | | | | | | | | | | |
Net investment income | | | — | | | | (0.37 | ) | | | (0.33 | ) | | | (0.32 | ) | | | (0.29 | ) | | | (0.36 | ) |
Net realized gain | | | — | | | | (1.84 | ) | | | (1.42 | ) | | | (2.59 | ) | | | — | | | | — | |
| | | | |
Total distributions | | | — | | | | (2.21 | ) | | | (1.75 | ) | | | (2.91 | ) | | | (0.29 | ) | | | (0.36 | ) |
| | | | |
Net asset value, end of period | | $ | 29.74 | | | $ | 27.15 | | | $ | 26.53 | | | $ | 28.11 | | | $ | 27.50 | | | $ | 20.70 | |
| | | | |
| | | | | | | | | | | | | | | | | | | | | | | | |
| Total Return3 | | | | | | | | | | | | | | | | | | | | | | | | |
Based on net asset value | | | 9.54 | %4 | | | 10.69 | % | | | 0.60 | % | | | 12.79 | % | | | 34.29 | % | | | 12.95 | % |
| | | | |
| | | | | | | | | | | | | | | | | | | | | | | | |
| Ratios to Average Net Assets | | | | | | | | | | | | | | | | | | | | | | | | |
Total expenses | | | 0.61 | %5,6 | | | 0.60 | % | | | 0.60 | % | | | 0.59 | % | | | 0.60 | % | | | 0.56 | % |
| | | | |
Total expenses after fees waived and/or reimbursed | | | 0.50 | %5,6 | | | 0.50 | % | | | 0.50 | % | | | 0.49 | % | | | 0.49 | % | | | 0.48 | % |
| | | | |
Net investment income | | | 1.37 | %5,6 | | | 1.36 | % | | | 1.14 | % | | | 1.03 | % | | | 1.12 | % | | | 1.69 | % |
| | | | |
| | | | | | | | | | | | | | | | | | | | | | | | |
| Supplemental Data | | | | | | | | | | | | | | | | | | | | | | | | |
Net assets, end of period (000) | | $ | 175,920 | | | $ | 167,987 | | | $ | 169,173 | | | $ | 184,854 | | | $ | 179,261 | | | $ | 151,411 | |
| | | | |
Portfolio turnover rate | | | 90 | % | | | 48 | % | | | 31 | % | | | 47 | % | | | 39 | % | | | 115 | % |
| | | | |
| | 1 | | Based on average shares outstanding. |
| | 2 | | Distributions for annual periods determined in accordance with U.S. federal income tax regulations. |
| | 3 | | Where applicable, excludes insurance-related fees and expenses and assumes the reinvestment of distributions. |
| | 4 | | Aggregate total return. |
| | 5 | | Ratios do not include expenses incurred indirectly as a result of investments in underlying funds of approximately 0.01%. |
See Notes to Financial Statements.
| | | | | | |
| 150 | | BLACKROCK SERIES FUND, INC. | | JUNE 30, 2017 | | |
| | | | |
| Financial Highlights (continued) | | | BlackRock Balanced Capital Portfolio | |
| | | | | | | | | | | | | | | | | | | | | | | | |
| | | Six Months
Ended
June 30, 2017 | | | Year Ended December 31, | |
| | | (Unaudited) | | | 2016 | | | 2015 | | | 2014 | | | 2013 | | | 2012 | |
| | | | | | | | | | | | | | | | | | | | | | | | |
| Per Share Operating Performance | | | | | | | | | | | | | | | | | | | | | | | | |
Net asset value, beginning of period | | $ | 16.87 | | | $ | 16.74 | | | $ | 17.81 | | | $ | 18.26 | | | $ | 15.51 | | | $ | 14.33 | |
| | | | |
Net investment income1 | | | 0.15 | | | | 0.29 | | | | 0.28 | | | | 0.33 | | | | 0.31 | | | | 0.36 | |
Net realized and unrealized gain (loss) | | | 1.02 | | | | 1.16 | | | | (0.19 | ) | | | 1.67 | | | | 2.83 | | | | 1.19 | |
| | | | |
Net increase from investment operations | | | 1.17 | | | | 1.45 | | | | 0.09 | | | | 2.00 | | | | 3.14 | | | | 1.55 | |
| | | | |
Distributions from2: | | | | | | | | | | | | | | | | | | | | | | | | |
Net investment income | | | — | | | | (0.30 | ) | | | (0.30 | ) | | | (0.36 | ) | | | (0.35 | ) | | | (0.37 | ) |
Net realized gain | | | — | | | | (1.02 | ) | | | (0.86 | ) | | | (2.09 | ) | | | (0.04 | ) | | | — | |
| | | | |
Total distributions | | | — | | | | (1.32 | ) | | | (1.16 | ) | | | (2.45 | ) | | | (0.39 | ) | | | (0.37 | ) |
| | | | |
Net asset value, end of period | | $ | 18.04 | | | $ | 16.87 | | | $ | 16.74 | | | $ | 17.81 | | | $ | 18.26 | | | $ | 15.51 | |
| | | | |
| | | | | | | | | | | | | | | | | | | | | | | | |
| Total Return3 | | | | | | | | | | | | | | | | | | | | | | | | |
Based on net asset value | | | 6.94 | %4 | | | 8.65 | % | | | 0.52 | % | | | 11.07 | % | | | 20.29 | % | | | 10.79 | % |
| | | | |
| | | | | | | | | | | | | | | | | | | | | | | | |
| Ratios to Average Net Assets | | | | | | | | | | | | | | | | | | | | | | | | |
Total expenses | | | 0.61 | %5,6 | | | 0.62 | %5 | | | 0.61 | % | | | 0.57 | % | | | 0.61 | % | | | 0.55 | % |
| | | | |
Total expenses after fees waived and/or reimbursed | | | 0.51 | %5,6 | | | 0.52 | %5 | | | 0.50 | % | | | 0.48 | % | | | 0.51 | % | | | 0.48 | % |
| | | | |
Total expenses after fees waived and/or reimbursed and excluding interest expense | | | 0.49 | %5,6 | | | 0.49 | %5 | | | 0.49 | % | | | 0.47 | % | | | 0.49 | % | | | 0.47 | % |
| | | | |
Net investment income | | | 1.70 | %5,6 | | | 1.72 | %5 | | | 1.54 | % | | | 1.72 | % | | | 1.83 | % | | | 2.36 | % |
| | | | |
| | | | | | | | | | | | | | | | | | | | | | | | |
| Supplemental Data | | | | | | | | | | | | | | | | | | | | | | | | |
Net assets, end of period (000) | | $ | 500,177 | | | $ | 490,442 | | | $ | 499,439 | | | $ | 546,054 | | | $ | 537,641 | | | $ | 496,992 | |
| | | | |
Portfolio turnover rate7 | | | 177 | % | | | 264 | % | | | 340 | % | | | 345 | % | | | 349 | % | | | 499 | % |
| | | | |
| | 1 | | Based on average shares outstanding. |
| | 2 | | Distributions for annual periods determined in accordance with U.S. federal income tax regulations. |
| | 3 | | Where applicable, excludes insurance-related fees and expenses and assumes the reinvestment of distributions. |
| | 4 | | Aggregate total return. |
| | 5 | | Ratios do not include expenses incurred indirectly as a result of investments in underlying funds of approximately 0.01%. |
| | 7 | | Includes mortgage dollar roll transactions (“MDRs”). Additional information regarding portfolio turnover rate is as follows: |
| | | | | | | | | | | | | | | | | | | | | | | | |
| | | Six Months
Ended
June 30, 2017 | | | Year Ended December 31, | |
| | | (Unaudited) | | | 2016 | | | 2015 | | | 2014 | | | 2013 | | | 2012 | |
| | | | |
Portfolio turnover rate (excluding MDRs) | | | 134 | % | | | 188 | % | | | 240 | % | | | 259 | % | | | 252 | % | | | 398 | % |
| | | | |
See Notes to Financial Statements.
| | | | | | |
| | | BLACKROCK SERIES FUND, INC. | | JUNE 30, 2017 | | 151 |
| | | | |
| Financial Highlights (continued) | | | BlackRock Capital Appreciation Portfolio | |
| | | | | | | | | | | | | | | | | | | | | | | | |
| | | Six Months
Ended
June 30, 2017 | | | Year Ended December 31, | |
| | | (Unaudited) | | | 2016 | | | 2015 | | | 2014 | | | 2013 | | | 2012 | |
| | | | | | | | | | | | | | | | | | | | | | | | |
| Per Share Operating Performance | | | | | | | | | | | | | | | | | | | | | | | | |
Net asset value, beginning of period | | $ | 33.61 | | | $ | 34.32 | | | $ | 34.75 | | | $ | 38.16 | | | $ | 28.43 | | | $ | 25.13 | |
| | | | |
Net investment income1 | | | 0.04 | | | | 0.07 | 2 | | | 0.05 | | | | 0.07 | | | | 0.08 | | | | 0.31 | |
Net realized and unrealized gain | | | 5.88 | | | | 0.07 | | | | 2.45 | | | | 3.33 | | | | 9.74 | | | | 3.33 | |
| | | | |
Net increase from investment operations | | | 5.92 | | | | 0.14 | | | | 2.50 | | | | 3.40 | | | | 9.82 | | | | 3.64 | |
| | | | |
Distributions from3: | | | | | | | | | | | | | | | | | | | | | | | | |
Net investment income | | | — | | | | (0.08 | ) | | | (0.05 | ) | | | (0.07 | ) | | | (0.09 | ) | | | (0.34 | ) |
Net realized gain | | | — | | | | (0.77 | ) | | | (2.88 | ) | | | (6.74 | ) | | | — | | | | — | |
| | | | |
Total distributions | | | — | | | | (0.85 | ) | | | (2.93 | ) | | | (6.81 | ) | | | (0.09 | ) | | | (0.34 | ) |
| | | | |
Net asset value, end of period | | $ | 39.53 | | | $ | 33.61 | | | $ | 34.32 | | | $ | 34.75 | | | $ | 38.16 | | | $ | 28.43 | |
| | | | |
| | | | | | | | | | | | | | | | | | | | | | | | |
| Total Return4 | | | | | | | | | | | | | | | | | | | | | | | | |
Based on net asset value | | | 17.61 | %5 | | | 0.40 | % | | | 7.09 | % | | | 9.12 | % | | | 34.53 | % | | | 14.48 | % |
| | | | |
| | | | | | | | | | | | | | | | | | | | | | | | |
| Ratios to Average Net Assets | | | | | | | | | | | | | | | | | | | | | | | | |
Total expenses | | | 0.61 | %6 | | | 0.62 | % | | | 0.61 | % | | | 0.60 | % | | | 0.62 | % | | | 0.56 | % |
| | | | |
Total expenses after fees waived and/or reimbursed | | | 0.52 | %6 | | | 0.53 | % | | | 0.51 | % | | | 0.51 | % | | | 0.53 | % | | | 0.50 | % |
| | | | |
Net investment income | | | 0.23 | %6 | | | 0.21 | % | | | 0.14 | % | | | 0.19 | % | | | 0.26 | % | | | 1.11 | % |
| | | | |
| | | | | | | | | | | | | | | | | | | | | | | | |
| Supplemental Data | | | | | | | | | | | | | | | | | | | | | | | | |
Net assets, end of period (000) | | $ | 156,714 | | | $ | 139,019 | | | $ | 156,722 | | | $ | 157,387 | | | $ | 158,051 | | | $ | 130,685 | |
| | | | |
Portfolio turnover rate | | | 27 | % | | | 86 | % | | | 71 | % | | | 99 | % | | | 151 | % | | | 61 | % |
| | | | |
| | 1 | | Based on average shares outstanding. |
| | 2 | | Net investment income per share and the ratio of net investment income to average net assets includes $0.03 per share and 0.08%, respectively, resulting from a special dividend. |
| | 3 | | Distributions for annual periods determined in accordance with U.S. federal income tax regulations. |
| | 4 | | Where applicable, excludes insurance-related fees and expenses and assumes the reinvestment of distributions. |
| | 5 | | Aggregate total return. |
See Notes to Financial Statements.
| | | | | | |
| 152 | | BLACKROCK SERIES FUND, INC. | | JUNE 30, 2017 | | |
| | | | |
| Financial Highlights (continued) | | | BlackRock Global Allocation Portfolio | |
| | | | | | | | | | | | | | | | | | | | | | | | |
| | | Six Months
Ended
June 30, 2017 | | | Year Ended December 31,1 | |
| | | (Unaudited)1 | | | 2016 | | | 2015 | | | 2014 | | | 2013 | | | 2012 | |
| | | | | | | | | | | | | | | | | | | | | | | | |
| Per Share Operating Performance | | | | | | | | | | | | | | | | | | | | | | | | |
Net asset value, beginning of period | | $ | 14.60 | | | $ | 14.25 | | | $ | 15.55 | | | $ | 16.97 | | | $ | 15.03 | | | $ | 13.80 | |
| | | | |
Net investment income2 | | | 0.12 | | | | 0.23 | | | | 0.24 | | | | 0.31 | | | | 0.24 | | | | 0.25 | |
Net realized and unrealized gain (loss) | | | 1.02 | | | | 0.37 | | | | (0.35 | ) | | | 0.12 | | | | 2.00 | | | | 1.19 | |
| | | | |
Net increase (decrease) from investment operations | | | 1.14 | | | | 0.60 | | | | (0.11 | ) | | | 0.43 | | | | 2.24 | | | | 1.44 | |
| | | | |
Distributions from3: | | | | | | | | | | | | | | | | | | | | | | | | |
Net investment income | | | — | | | | (0.25 | ) | | | (0.30 | ) | | | (0.43 | ) | | | (0.30 | ) | | | (0.21 | ) |
Net realized gain | | | — | | | | — | | | | (0.89 | ) | | | (1.42 | ) | | | — | | | | — | |
Tax return of capital | | | — | | | | — | | | | — | 4 | | | — | | | | — | | | | — | |
| | | | |
Total distributions | | | — | | | | (0.25 | ) | | | (1.19 | ) | | | (1.85 | ) | | | (0.30 | ) | | | (0.21 | ) |
| | | | |
Net asset value, end of period | | $ | 15.74 | | | $ | 14.60 | | | $ | 14.25 | | | $ | 15.55 | | | $ | 16.97 | | | $ | 15.03 | |
| | | | |
| | | | | | | | | | | | | | | | | | | | | | | | |
| Total Return5 | | | | | | | | | | | | | | | | | | | | | | | | |
Based on net asset value | | | 7.81 | %6 | | | 4.17 | % | | | (0.74 | )% | | | 2.52 | % | | | 14.94 | % | | | 10.46 | % |
| | | | |
| | | | | | | | | | | | | | | | | | | | | | | | |
| Ratios to Average Net Assets | | | | | | | | | | | | | | | | | | | | | | | | |
Total expenses | | | 0.84 | %7,8 | | | 0.83 | % | | | 0.77 | % | | | 0.72 | % | | | 0.69 | % | | | 0.61 | % |
| | | | |
Total expenses after fees waived and/or reimbursed | | | 0.60 | %7,8 | | | 0.58 | % | | | 0.58 | % | | | 0.57 | % | | | 0.56 | % | | | 0.53 | % |
| | | | |
Total expenses after fees waived and/or reimbursed and excluding dividend expense, broker fees and expenses on short sales, interest expense and stock loan fees | | | 0.57 | %7,8 | | | 0.57 | % | | | 0.57 | % | | | 0.57 | % | | | 0.56 | % | | | 0.53 | % |
| | | | |
Net investment income | | | 1.61 | %7,8 | | | 1.62 | % | | | 1.52 | % | | | 1.81 | % | | | 1.49 | % | | | 1.73 | % |
| | | | |
| | | | | | | | | | | | | | | | | | | | | | | | |
| Supplemental Data | | | | | | | | | | | | | | | | | | | | | | | | |
Net assets, end of period (000) | | $ | 211,405 | | | $ | 206,525 | | | $ | 229,649 | | | $ | 257,696 | | | $ | 276,622 | | | $ | 268,888 | |
| | | | |
Portfolio turnover rate | | | 60 | % | | | 134 | % | | | 89 | %9 | | | 70 | % | | | 56 | % | | | 44 | % |
| | | | |
| | 1 | | Consolidated Financial Highlights. |
| | 2 | | Based on average shares outstanding. |
| | 3 | | Distributions for annual periods determined in accordance with U.S. federal income tax regulations. |
| | 4 | | Amount is greater than $(0.005) per share. |
| | 5 | | Where applicable, excludes insurance-related fees and expenses and assumes the reinvestment of distributions. |
| | 6 | | Aggregate total return. |
| | 7 | | Ratios do not include expenses incurred indirectly as a result of investments in underlying funds of approximately 0.02%. |
| | 9 | | Includes mortgage dollar roll transactions. Excluding these transactions the portfolio turnover would have been 87%. |
See Notes to Financial Statements.
| | | | | | |
| | | BLACKROCK SERIES FUND, INC. | | JUNE 30, 2017 | | 153 |
| | | | |
| Financial Highlights (continued) | | | BlackRock Government Money Market Portfolio | |
| | | | | | | | | | | | | | | | | | | | | | | | |
| | | Six Months Ended June 30, 2017 | | | Year Ended December 31, | |
| | | (Unaudited) | | | 2016 | | | 2015 | | | 2014 | | | 2013 | | | 2012 | |
| | | | | | | | | | | | | | | | | | | | | | | | |
| Per Share Operating Performance | | | | | | | | | | | | | | | | | | | | | | | | |
Net asset value, beginning of period | | $ | 1.00 | | | $ | 1.00 | | | $ | 1.00 | | | $ | 1.00 | | | $ | 1.00 | | | $ | 1.00 | |
| | | | |
Net investment income | | | 0.0013 | | | | 0.0000 | 1 | | | 0.0000 | 1 | | | 0.0000 | 1 | | | 0.0000 | 1 | | | 0.0000 | 1 |
Net realized gain | | | 0.0000 | 1 | | | 0.0000 | 1 | | | 0.0001 | | | | 0.0001 | | | | 0.0000 | 1 | | | 0.0000 | 1 |
| | | | |
Net increase from investment operations | | | 0.0013 | | | | 0.0000 | | | | 0.0001 | | | | 0.0001 | | | | 0.0000 | | | | 0.0000 | |
| | | | |
Distributions from2: | | | | | | | | | | | | | | | | | | | | | | | | |
Net investment income | | | (0.0013 | ) | | | (0.0000 | )3 | | | (0.0000 | )3 | | | (0.0000 | )3 | | | (0.0000 | )3 | | | (0.0000 | )3 |
Net realized gain | | | — | | | | (0.0000 | )3 | | | (0.0001 | ) | | | (0.0001 | ) | | | (0.0000 | )3 | | | (0.0000 | )3 |
| | | | |
Total distributions | | | (0.0013 | ) | | | (0.0000 | ) | | | (0.0001 | ) | | | (0.0001 | ) | | | (0.0000 | ) | | | (0.0000 | ) |
| | | | |
Net asset value, end of period | | $ | 1.00 | | | $ | 1.00 | | | $ | 1.00 | | | $ | 1.00 | | | $ | 1.00 | | | $ | 1.00 | |
| | | | |
| | | | | | | | | | | | | | | | | | | | | | | | |
| Total Return4 | | | | | | | | | | | | | | | | | | | | | | | | |
Based on net asset value | | | 0.13 | %5 | | | 0.00 | % | | | 0.01 | % | | | 0.01 | % | | | 0.00 | % | | | 0.00 | % |
| | | | |
| | | | | | | | | | | | | | | | | | | | | | | | |
| Ratios to Average Net Assets | | | | | | | | | | | | | | | | | | | | | | | | |
Total expenses | | | 0.69 | %6 | | | 0.54 | % | | | 0.54 | % | | | 0.49 | % | | | 0.55 | % | | | 0.50 | % |
| | | | |
Total expenses after fees waived and/or reimbursed | | | 0.50 | %6 | | | 0.42 | % | | | 0.22 | % | | | 0.23 | % | | | 0.25 | % | | | 0.29 | % |
| | | | |
Net investment income | | | 0.26 | %6 | | | 0.00 | % | | | 0.00 | % | | | 0.00 | % | | | 0.00 | % | | | 0.00 | % |
| | | | |
| | | | | | | | | | | | | | | | | | | | | | | | |
| Supplemental Data | | | | | | | | | | | | | | | | | | | | | | | | |
Net assets, end of period (000) | | $ | 113,786 | | | $ | 122,057 | | | $ | 125,641 | | | $ | 138,033 | | | $ | 148,485 | | | $ | 163,347 | |
| | | | |
| | 1 | | Amount is less than $0.00005 per share. |
| | 2 | | Distributions for annual periods determined in accordance with U.S. federal income tax regulations. |
| | 3 | | Amount is greater than $(0.00005) per share. |
| | 4 | | Where applicable, excludes insurance-related fees and expenses and assumes the reinvestment of distributions. |
| | 5 | | Aggregate total return. |
See Notes to Financial Statements.
| | | | | | |
| 1544 | | BLACKROCK SERIES FUND, INC. | | JUNE 30, 2017 | | |
| | | | |
| Financial Highlights (continued) | | | BlackRock High Yield Portfolio | |
| | | | | | | | | | | | | | | | | | | | | | | | |
| | | Six Months Ended June 30, 2017 | | | Year Ended December 31, | |
| | | (Unaudited) | | | 2016 | | | 2015 | | | 2014 | | | 2013 | | | 2012 | |
| | | | | | | | | | | | | | | | | | | | | | | | |
| Per Share Operating Performance | | | | | | | | | | | | | | | | | | | | | | | | |
Net asset value, beginning of period | | $ | 5.31 | | | $ | 4.91 | | | $ | 5.44 | | | $ | 5.69 | | | $ | 5.50 | | | $ | 5.06 | |
| | | | |
Net investment income1 | | | 0.15 | | | | 0.29 | | | | 0.28 | | | | 0.32 | | | | 0.34 | | | | 0.36 | |
Net realized and unrealized gain (loss) | | | 0.11 | | | | 0.40 | | | | (0.52 | ) | | | (0.21 | ) | | | 0.21 | | | | 0.43 | |
| | | | |
Net increase (decrease) from investment operations | | | 0.26 | | | | 0.69 | | | | (0.24 | ) | | | 0.11 | | | | 0.55 | | | | 0.79 | |
| | | | |
Distributions from net investment income2 | | | (0.16 | ) | | | (0.29 | ) | | | (0.29 | ) | | | (0.36 | ) | | | (0.36 | ) | | | (0.35 | ) |
| | | | |
Net asset value, end of period | | $ | 5.41 | | | $ | 5.31 | | | $ | 4.91 | | | $ | 5.44 | | | $ | 5.69 | | | $ | 5.50 | |
| | | | |
| | | | | | | | | | | | | | | | | | | | | | | | |
| Total Return3 | | | | | | | | | | | | | | | | | | | | | | | | |
Based on net asset value | | | 4.86 | %4 | | | 14.43 | % | | | (4.65 | )% | | | 1.88 | % | | | 10.28 | % | | | 16.17 | % |
| | | | |
| | | | | | | | | | | | | | | | | | | | | | | | |
| Ratios to Average Net Assets | | | | | | | | | | | | | | | | | | | | | | | | |
Total expenses | | | 1.00 | %5 | | | 0.99 | %6 | | | 0.91 | % | | | 0.84 | % | | | 0.89 | % | | | 0.82 | % |
| | | | |
Total expenses after fees waived and/or reimbursed | | | 0.50 | %5 | | | 0.50 | %6 | | | 0.50 | % | | | 0.51 | % | | | 0.52 | % | | | 0.50 | % |
| | | | |
Total expenses after fees waived and/or reimbursed and excluding interest expense | | | 0.50 | %5 | | | 0.50 | %6 | | | 0.50 | % | | | 0.50 | % | | | 0.50 | % | | | 0.50 | % |
| | | | |
Net investment income | | | 5.66 | %5 | | | 5.64 | %6 | | | 5.30 | % | | | 5.54 | % | | | 6.01 | % | | | 6.72 | % |
| | | | |
| | | | | | | | | | | | | | | | | | | | | | | | |
| Supplemental Data | | | | | | | | | | | | | | | | | | | | | | | | |
Net assets, end of period (000) | | $ | 33,438 | | | $ | 33,794 | | | $ | 31,788 | | | $ | 39,081 | | | $ | 48,523 | | | $ | 49,756 | |
| | | | |
Portfolio turnover rate | | | 42 | % | | | 101 | % | | | 84 | % | | | 78 | % | | | 102 | % | | | 102 | % |
| | | | |
| | 1 | | Based on average shares outstanding. |
| | 2 | | Distributions for annual periods determined in accordance with U.S. federal income tax regulations. |
| | 3 | | Where applicable, excludes insurance-related fees and expenses and assumes the reinvestment of distributions. |
| | 4 | | Aggregate total return. |
| | 6 | | Ratios do not include expenses incurred indirectly as a result of investments in underlying funds of approximately 0.01%. |
See Notes to Financial Statements.
| | | | | | |
| | | BLACKROCK SERIES FUND, INC. | | JUNE 30, 2017 | | 155 |
| | | | |
| Financial Highlights (continued) | | | BlackRock Total Return Portfolio | |
| | | | | | | | | | | | | | | | | | | | | | | | |
| | | Six Months Ended June 30, 2017 | | | Year Ended December 31, | |
| | | (Unaudited) | | | 2016 | | | 2015 | | | 2014 | | | 2013 | | | 2012 | |
| | | | | | | | | | | | | | | | | | | | | | | | |
| Per Share Operating Performance | | | | | | | | | | | | | | | | | | | | | | | | |
Net asset value, beginning of period | | $ | 11.55 | | | $ | 11.50 | | | $ | 11.76 | | | $ | 11.34 | | | $ | 11.83 | | | $ | 11.37 | |
| | | | |
Net investment income1 | | | 0.15 | | | | 0.27 | | | | 0.27 | | | | 0.33 | | | | 0.33 | | | | 0.38 | |
Net realized and unrealized gain (loss) | | | 0.16 | | | | 0.07 | | | | (0.23 | ) | | | 0.45 | | | | (0.45 | ) | | | 0.49 | |
| | | | |
Net increase (decrease) from investment operations | | | 0.31 | | | | 0.34 | | | | 0.04 | | | | 0.78 | | | | (0.12 | ) | | | 0.87 | |
| | | | |
Distributions from net investment income2 | | | (0.15 | ) | | | (0.29 | ) | | | (0.30 | ) | | | (0.36 | ) | | | (0.37 | ) | | | (0.41 | ) |
| | | | |
Net asset value, end of period | | $ | 11.71 | | | $ | 11.55 | | | $ | 11.50 | | | $ | 11.76 | | | $ | 11.34 | | | $ | 11.83 | |
| | | | |
| | | | | | | | | | | | | | | | | | | | | | | | |
| Total Return3 | | | | | | | | | | | | | | | | | | | | | | | | |
Based on net asset value | | | 2.71 | %4 | | | 2.95 | % | | | 0.29 | % | | | 6.90 | % | | | (1.05 | )% | | | 7.78 | % |
| | | | |
| | | | | | | | | | | | | | | | | | | | | | | | |
| Ratios to Average Net Assets | | | | | | | | | | | | | | | | | | | | | | | | |
Total expenses | | | 1.05 | %5,6 | | | 1.04 | %6 | | | 0.94 | % | | | 0.84 | % | | | 0.85 | % | | | 0.80 | % |
| | | | |
Total expenses after fees waived and/or reimbursed and paid indirectly | | | 0.57 | %5,6 | | | 0.62 | %6 | | | 0.54 | % | | | 0.57 | % | | | 0.53 | % | | | 0.52 | % |
| | | | |
Total expenses after fees waived and/or reimbursed and paid indirectly and excluding interest expense | | | 0.50 | %5,6 | | | 0.50 | %6 | | | 0.50 | % | | | 0.50 | % | | | 0.50 | % | | | 0.50 | % |
| | | | |
Net investment income | | | 2.52 | %5,6 | | | 2.28 | %6 | | | 2.33 | % | | | 2.86 | % | | | 2.85 | % | | | 3.25 | % |
| | | | |
| | | | | | | | | | | | | | | | | | | | | | | | |
| Supplemental Data | | | | | | | | | | | | | | | | | | | | | | | | |
Net assets, end of period (000) | | $ | 54,647 | | | $ | 57,398 | | | $ | 62,002 | | | $ | 68,069 | | | $ | 72,505 | | | $ | 83,353 | |
| | | | |
Portfolio turnover rate7 | | | 336 | % | | | 595 | % | | | 783 | % | | | 762 | % | | | 806 | % | | | 952 | % |
| | | | |
| | 1 | | Based on average shares outstanding. |
| | 2 | | Distributions for annual periods determined in accordance with U.S. federal income tax regulations. |
| | 3 | | Where applicable, excludes insurance-related fees and expenses and assumes the reinvestment of distributions. |
| | 4 | | Aggregate total return. |
| | 6 | | Ratios do not include expenses incurred indirectly as a result of investments in underlying funds of approximately 0.01%. |
| | 7 | | Includes mortgage dollar roll transactions (“MDRs”). Additional information regarding portfolio turnover rate is as follows: |
| | | | | | | | | | | | | | | | | | | | | | | | |
| | | Six Months Ended June 30, 2017 | | | Year Ended December 31, | |
| | | (Unaudited) | | | 2016 | | | 2015 | | | 2014 | | | 2013 | | | 2012 | |
| | | | |
Portfolio turnover rate (excluding MDRs) | | | 222 | % | | | 400 | % | | | 548 | % | | | 556 | % | | | 582 | % | | | 731 | % |
| | | | |
See Notes to Financial Statements.
| | | | | | |
| 156 | | BLACKROCK SERIES FUND, INC. | | JUNE 30, 2017 | | |
| | | | |
| Financial Highlights (concluded) | | | BlackRock U.S. Government Bond Portfolio | |
| | | | | | | | | | | | | | | | | | | | | | | | |
| | | Six Months
Ended
June 30, 2017 | | | Year Ended December 31, | |
| | | (Unaudited) | | | 2016 | | | 2015 | | | 2014 | | | 2013 | | | 2012 | |
| | | | | | | | | | | | | | | | | | | | | | | | |
| Per Share Operating Performance | | | | | | | | | | | | | | | | | | | | | | | | |
Net asset value, beginning of period | | $ | 10.86 | | | $ | 10.90 | | | $ | 11.07 | | | $ | 10.67 | | | $ | 11.27 | | | $ | 11.56 | |
| | | | |
Net investment income1 | | | 0.10 | | | | 0.17 | | | | 0.17 | | | | 0.20 | | | | 0.16 | | | | 0.22 | |
Net realized and unrealized gain (loss) | | | 0.06 | | | | 0.00 | 2 | | | (0.11 | ) | | | 0.43 | | | | (0.49 | ) | | | 0.07 | |
| | | | |
Net increase (decrease) from investment operations | | | 0.16 | | | | 0.17 | | | | 0.06 | | | | 0.63 | | | | (0.33 | ) | | | 0.29 | |
| | | | |
Distributions from3: | | | | | | | | | | | | | | | | | | | | | | | | |
Net investment income | | | (0.12 | ) | | | (0.21 | ) | | | (0.23 | ) | | | (0.23 | ) | | | (0.25 | ) | | | (0.25 | ) |
Net realized gain | | | — | | | | — | | | | — | | | | — | | | | — | | | | (0.33 | ) |
Tax return of capital | | | — | | | | — | | | | — | | | | — | | | | (0.02 | ) | | | — | |
| | | | |
Total distributions | | | (0.12 | ) | | | (0.21 | ) | | | (0.23 | ) | | | (0.23 | ) | | | (0.27 | ) | | | (0.58 | ) |
| | | | |
Net asset value, end of period | | $ | 10.90 | | | $ | 10.86 | | | $ | 10.90 | | | $ | 11.07 | | | $ | 10.67 | | | $ | 11.27 | |
| | | | |
| | | | | | | | | | | | | | | | | | | | | | | | |
| Total Return4 | | | | | | | | | | | | | | | | | | | | | | | | |
Based on net asset value | | | 1.46 | %5 | | | 1.54 | % | | | 0.54 | % | | | 5.95 | % | | | (2.99 | )% | | | 2.55 | % |
| | | | |
| | | | | | | | | | | | | | | | | | | | | | | | |
| Ratios to Average Net Assets | | | | | | | | | | | | | | | | | | | | | | | | |
Total expenses | | | 0.96 | %6 | | | 0.94 | % | | | 0.81 | %7 | | | 0.76 | % | | | 0.78 | %7 | | | 0.67 | % |
| | | | |
Total expenses after fees waived and/or reimbursed | | | 0.58 | %6 | | | 0.59 | % | | | 0.53 | %7 | | | 0.53 | % | | | 0.50 | %7 | | | 0.50 | % |
| | | | |
Total expenses after fees waived and/or reimbursed and excluding interest expense | | | 0.50 | %6 | | | 0.50 | % | | | 0.50 | %7 | | | 0.50 | % | | | 0.50 | %7 | | | 0.50 | % |
| | | | |
Net investment income | | | 1.87 | %6 | | | 1.50 | % | | | 1.58 | %7 | | | 1.79 | % | | | 1.44 | %7 | | | 1.86 | % |
| | | | |
| | | | | | | | | | | | | | | | | | | | | | | | |
| Supplemental Data | | | | | | | | | | | | | | | | | | | | | | | | |
Net assets, end of period (000) | | $ | 57,479 | | | $ | 60,506 | | | $ | 66,263 | | | $ | 74,925 | | | $ | 80,302 | | | $ | 99,492 | |
| | | | |
Portfolio turnover rate8 | | | 548 | % | | | 1,004 | % | | | 1,421 | % | | | 1,374 | % | | | 2,125 | % | | | 1,572 | % |
| | | | |
| | 1 | | Based on average shares outstanding. |
| | 2 | | Amount is less than $0.005 per share. |
| | 3 | | Distributions for annual periods determined in accordance with U.S. federal income tax regulations. |
| | 4 | | Where applicable, excludes insurance-related fees and expenses and assumes the reinvestment of distributions. |
| | 5 | | Aggregate total return. |
| | 7 | | Ratios do not include expenses incurred indirectly as a result of investments in underlying funds of approximately 0.01%. |
| | 8 | | Includes mortgage dollar roll transactions (“MDRs”). Additional information regarding portfolio turnover rate is as follows: |
| | | | | | | | | | | | | | | | | | | | | | | | |
| | | Six Months
Ended
June 30, 2017 (Unaudited) | | | Year Ended December 31, | |
| | | | | | 2016 | | | 2015 | | | 2014 | | | 2013 | | | 2012 | |
| | | | |
Portfolio turnover rate (excluding MDRs) | | | 356 | % | | | 631 | % | | | 891 | % | | | 723 | % | | | 1,614 | % | | | 1,194 | % |
| | | | |
See Notes to Financial Statements.
| | | | | | |
| | | BLACKROCK SERIES FUND, INC. | | JUNE 30, 2017 | | 157 |
| | | | |
| Notes to Financial Statements | | | | |
1. Organization:
BlackRock Series Fund, Inc. (the “Company”) is registered under the Investment Company Act of 1940, as amended (the “1940 Act”), as an open-end management investment company. The following are referred to herein collectively as the “Funds” or individually, as a “Fund”:
| | | | |
| Fund Name | | Herein Referred To As | | Diversification Classification |
BlackRock Advantage Large Cap Core Portfolio | | Advantage Large Cap Core | | Diversified |
BlackRock Balanced Capital Portfolio | | Balanced Capital | | Diversified |
BlackRock Capital Appreciation Portfolio | | Capital Appreciation | | Diversified |
BlackRock Global Allocation Portfolio | | Global Allocation | | Diversified |
BlackRock Government Money Market Portfolio | | Government Money Market | | Diversified |
BlackRock High Yield Portfolio | | High Yield | | Diversified |
BlackRock Total Return Portfolio | | Total Return | | Diversified |
BlackRock U.S. Government Bond Portfolio | | U.S. Government Bond | | Diversified |
Effective June 12, 2017, the BlackRock Large Cap Core Portfolio changed its name to BlackRock Advantage Large Cap Core Portfolio.
The Company is organized as a Maryland corporation that is comprised of eight separate portfolios. The Funds offer shares to insurance companies for their separate accounts to fund benefits under certain variable annuity and variable life insurance contracts.
The Funds, together with certain other registered investment companies advised by BlackRock Advisors, LLC (the “Manager”) or its affiliates, are included in a complex of open-end funds referred to as the Equity-Bond Complex.
The Government Money Market Fund operates as a “government money market fund” under Rule 2a-7 under the 1940 Act. The Fund is not subject to liquidity fees or temporary suspensions of redemptions due to declines in the Fund’s weekly liquid assets.
Basis of Consolidation: The accompanying consolidated financial statements of Global Allocation include the accounts of BlackRock Cayman Global Allocation Portfolio I, Ltd. (the “Subsidiary”), which is a wholly owned subsidiary of Global Allocation and primarily invests in commodity-related instruments and other derivatives. The Subsidiary enables Global Allocation to hold these commodity-related instruments and satisfy regulated investment company tax requirements. Global Allocation may invest up to 25% of its total assets in the Subsidiary. The net assets of the Subsidiary as of period end were $10,338,703, which is 4.9% of Global Allocation’s consolidated net assets. Intercompany accounts and transactions, if any, have been eliminated. The Subsidiary is subject to the same investment policies and restrictions that apply to Global Allocation, except that the Subsidiary may invest without limitation in commodity-related instruments.
2. Significant Accounting Policies:
The financial statements are prepared in conformity with accounting principles generally accepted in the United States of America (“U.S. GAAP”), which may require management to make estimates and assumptions that affect the reported amounts of assets and liabilities in the financial statements, disclosure of contingent assets and liabilities at the date of the financial statements and the reported amounts of increases and decreases in net assets from operations during the reporting period. Actual results could differ from those estimates. Each Fund is considered an investment company under U.S. GAAP and follows the accounting and reporting guidance applicable to investment companies. Below is a summary of significant accounting policies:
Investment Transactions and Income Recognition: For financial reporting purposes, investment transactions are recorded on the dates the transactions are entered into (the “trade dates”). Realized gains and losses on investment transactions are determined on the identified cost basis. Dividend income is recorded on the ex-dividend date. Dividends from foreign securities where the ex-dividend date may have passed are subsequently recorded when the Funds are informed of the ex-dividend date. Under the applicable foreign tax laws, a withholding tax at various rates may be imposed on capital gains, dividends and interest. Upon notification from issuers, some of the dividend income received from a real estate investment trust may be redesignated as a reduction of cost of the related investment and/or realized gain. Interest income, including amortization and accretion of premiums and discounts on debt securities, is recognized on an accrual basis.
Foreign Currency Translation: Each Fund’s books and records are maintained in U.S. dollars. Securities and other assets and liabilities denominated in foreign currencies are translated into U.S. dollars using exchange rates determined as of the close of trading on the New York Stock Exchange (“NYSE”). Purchases and sales of investments are recorded at the rates of exchange prevailing on the respective dates of such transactions. Generally, when the U.S. dollar rises in value against a foreign currency, the investments denominated in that currency will lose value; the opposite effect occurs if the U.S. dollar falls in relative value.
| | | | | | |
| 158 | | BLACKROCK SERIES FUND, INC. | | JUNE 30, 2017 | | |
| | | | |
| Notes to Financial Statements (continued) | | | | |
Each Fund does not isolate the portion of the results of operations arising as a result of changes in the exchange rates from the changes in the market prices of investments held or sold for financial reporting purposes. Accordingly, the effects of changes in exchange rates on investments are not segregated in the Statements of Operations from the effects of changes in market prices of those investments, but are included as a component of net realized and unrealized gain (loss) from investments. Each Fund reports realized currency gains (losses) on foreign currency related transactions as components of net realized gain (loss) for financial reporting purposes, whereas such components are generally treated as ordinary income for U.S. federal income tax purposes.
Segregation and Collateralization: In cases where a Fund enters into certain investments (e.g., dollar rolls, TBA sale commitments, futures contracts, forward foreign currency exchange contracts, options written, swaps and short sales) or certain borrowings (e.g., reverse repurchase transactions) that would be treated as “senior securities” for 1940 Act purposes, a Fund may segregate or designate on its books and records cash or liquid assets having a market value at least equal to the amount of its future obligations under such investments or borrowings. Doing so allows the investment or borrowing to be excluded from treatment as a “senior security.” Furthermore, if required by an exchange or counterparty agreement, the Funds may be required to deliver/deposit cash and/or securities to/with an exchange, or broker-dealer or custodian as collateral for certain investments or obligations.
Distributions: For Government Money Market, distributions from net investment income are declared daily and paid monthly. Distributions are declared from the total of net investment income. For Advantage Large Cap Core, Balanced Capital, Capital Appreciation and Global Allocation, distributions from net investment income are declared and paid at least annually. For High Yield, Total Return and U.S. Government, distributions from net investment income are declared daily and paid monthly. For each Fund, distributions of capital gains are recorded on the ex-dividend dates and made at least annually.
Portions of return of capital distributions under U.S. GAAP may be taxed at ordinary income rates.
The character of distributions is determined in accordance with U.S. federal income tax regulations, which may differ from U.S. GAAP. The portion of distributions that exceeds a Fund’s current and accumulated earnings and profits, which are measured on a tax basis, will constitute a non-taxable return of capital. Realized net capital gains can be offset by capital losses carried forward from prior years. However, certain Funds have capital loss carryforwards from pre-2012 tax years that offset realized net capital gains but do not offset current earnings and profits. Consequently, if distributions in any tax year are less than the Fund’s current earnings and profits but greater than net investment income and net realized capital gains (taxable income), distributions in excess of taxable income are not treated as non-taxable return of capital, but rather may be taxable to shareholders at ordinary income rates. Under certain circumstances, taxable excess distributions could be significant.
Net income and realized gains from investments held by the Subsidiary are treated as ordinary income for tax purposes. If a net loss is realized by the Subsidiary in any taxable year, the loss will generally not be available to offset Global Allocation’s ordinary income and/or capital gains for that year.
Recent Accounting Standards: In November 2016, the Financial Accounting Standards Board issued Accounting Standards Update “Restricted Cash” which will require entities to include the total of cash, cash equivalents, restricted cash, and restricted cash equivalents in the beginning and ending cash balances in the Statements of Cash Flows. The guidance will be applied retrospectively and is effective for fiscal years beginning after December 15, 2017, and interim periods within those years. Management is evaluating the impact, if any, of this guidance on the Funds’ presentation in the Statements of Cash Flows.
In March 2017, the Financial Accounting Standards Board issued Accounting Standards Update “Premium Amortization of Purchased Callable Debt Securities” which amends the amortization period for certain purchased callable debt securities. Under the new guidance, the premium amortization of purchased callable debt securities that have explicit, non-contingent call features and are callable at fixed prices will be amortized to the earliest call date. The guidance will be applied on a modified retrospective basis and is effective for fiscal years, and their interim periods, beginning after December 15, 2018. Management is currently evaluating the impact of this guidance to the Funds.
SEC Reporting Modernization: The U.S. Securities and Exchange Commission (“SEC”) adopted new rules and forms and amended other rules to enhance the reporting and disclosure of information by registered investment companies. As part of these changes, the SEC amended Regulation S-X to standardize and enhance disclosures in investment company financial statements. The compliance date for implementing the new or amended rules is August 1, 2017.
Indemnifications: In the normal course of business, a Fund enters into contracts that contain a variety of representations that provide general indemnification. A Fund’s maximum exposure under these arrangements is unknown because it involves future potential claims against the Fund, which cannot be predicted with any certainty.
Other: Expenses directly related to a Fund are charged to that Fund. Other operating expenses shared by several funds, including other funds managed by the Manager, are prorated among those funds on the basis of relative net assets or other appropriate methods.
| | | | | | |
| | | BLACKROCK SERIES FUND, INC. | | JUNE 30, 2017 | | 159 |
| | | | |
| Notes to Financial Statements (continued) | | | | |
The Funds have an arrangement with their custodian whereby credits are earned on uninvested cash balances, which could be used to reduce custody fees and/or overdraft charges. The Funds may incur charges on certain uninvested cash balances and overdrafts, subject to certain conditions.
3. Investment Valuation and Fair Value Measurements:
Investment Valuation Policies: The Funds’ investments are valued at fair value (also referred to as “market value” within the financial statements) as of the close of trading on the NYSE (generally 4:00 p.m., Eastern time). U.S. GAAP defines fair value as the price the Funds would receive to sell an asset or pay to transfer a liability in an orderly transaction between market participants at the measurement date. The Funds determine the fair values of their financial instruments using various independent dealers or pricing services under policies approved by the Board of Directors of each Fund (the “Board”). The BlackRock Global Valuation Methodologies Committee (the “Global Valuation Committee”) is the committee formed by management to develop global pricing policies and procedures and to oversee the pricing function for all financial instruments.
Government Money Market’s investments are valued under the amortized cost method which approximates current market value in accordance with Rule 2a-7 under the 1940 Act. Under this method, investments are valued at cost when purchased and, thereafter, a constant proportionate accretion of discounts and amortization of premiums are recorded until the maturity of the security. The Fund seeks to maintain its net asset value (“NAV”) per share at $1.00, although there is no assurance that it will be able to do so on a continuing basis.
Fair Value Inputs and Methodologies: The following methods and inputs are used to establish the fair value of each Fund’s assets and liabilities:
| • | | Equity investments traded on a recognized securities exchange are valued at the official closing price each day, if available. For equity investments traded on more than one exchange, the official closing price on the exchange where the stock is primarily traded is used. Equity investments traded on a recognized exchange for which there were no sales on that day may be valued at the last available bid (long positions) or ask (short positions) price. |
| • | | Fixed-income securities for which market quotations are readily available are generally valued using the last available bid prices or current market quotations provided by independent dealers or third party pricing services. Floating rate loan interests are valued at the mean of the bid prices from one or more independent brokers or dealers as obtained from a third party pricing service. Pricing services generally value fixed-income securities assuming orderly transactions of an institutional round lot size, but a fund may hold or transact in such securities in smaller, odd lot sizes. Odd lots often trade at lower prices than institutional round lots. The pricing services may use matrix pricing or valuation models that utilize certain inputs and assumptions to derive values, including transaction data (e.g., recent representative bids and offers), credit quality information, perceived market movements, news, and other relevant information. Certain fixed-income securities, including asset-backed and mortgage related securities may be valued based on valuation models that consider the estimated cash flows of each tranche of the entity, establish a benchmark yield and develop an estimated tranche specific spread to the benchmark yield based on the unique attributes of the tranche. The amortized cost method of valuation may be used with respect to debt obligations with sixty days or less remaining to maturity unless the Manager determines such method does not represent fair value. |
Generally, trading in foreign instruments is substantially completed each day at various times prior to the close of trading on the NYSE. Occasionally, events affecting the values of such instruments may occur between the foreign market close and the close of trading on the NYSE that may not be reflected in the computation of the Funds’ net assets. Each business day, the Funds use a pricing service to assist with the valuation of certain foreign exchange-traded equity securities and foreign exchange-traded over-the-counter (“OTC”) options (the “Systematic Fair Value Price”). Using current market factors, the Systematic Fair Value Price is designed to value such foreign securities and foreign options at fair value as of the close of trading on the NYSE, which follows the close of the local markets.
| • | | Municipal investments (including commitments to purchase such investments on a “when-issued” basis) are valued on the basis of prices provided by dealers or pricing services. In determining the value of a particular investment, pricing services may use certain information with respect to transactions in such investments, quotations from dealers, pricing matrixes, market transactions in comparable investments and information with respect to various relationships between investments. |
| • | | Investments in open-end U.S. mutual funds are valued at NAV each business day. |
| • | | The Funds value their investment in SL Liquidity Series, LLC, Money Market Series (the “Money Market Series”) at fair value, which is ordinarily based upon their pro rata ownership in the underlying fund’s net assets. The Money Market Series seeks current income consistent with maintaining liquidity and preserving capital. Although the Money Market Series is not registered under the 1940 Act, its investments may follow the parameters of investments by a money market fund that is subject to Rule 2a-7 under the 1940 Act. |
| • | | Futures contracts traded on exchanges are valued at their last sale price. |
| • | | Forward foreign currency exchange contracts are valued at the mean between the bid and ask prices and are determined as of the close of trading on the NYSE. Interpolated values are derived when the settlement date of the contract is an interim date for which quotations are not available. |
| • | | Exchange-traded options are valued at the mean between the last bid and ask prices at the close of the options market in which the options trade. An exchange-traded option for which there is no mean price is valued at the last bid (long positions) or ask (short positions) price. If no bid or ask |
| | | | | | |
| 160 | | BLACKROCK SERIES FUND, INC. | | JUNE 30, 2017 | | |
| | | | |
| Notes to Financial Statements (continued) | | | | |
| | price is available, the prior day’s price will be used, unless it is determined that the prior day’s price no longer reflects the fair value of the option. OTC options and options on swaps (“swaptions”) are valued by an independent pricing service using a mathematical model, which incorporates a number of market data factors, such as the trades and prices of the underlying instruments. |
| • | | Swap agreements are valued utilizing quotes received daily by the Funds’ pricing service or through brokers, which are derived using daily swap curves and models that incorporate a number of market data factors, such as discounted cash flows, trades and values of the underlying reference instruments. |
| • | | To-be-announced (“TBA”) commitments are valued on the basis of last available bid prices or current market quotations provided by pricing services. |
If events (e.g., a company announcement, market volatility or a natural disaster) occur that are expected to materially affect the value of such investments, or in the event that the application of these methods of valuation results in a price for an investment that is deemed not to be representative of the market value of such investment, or if a price is not available, the investment will be valued by the Global Valuation Committee, or its delegate, in accordance with a policy approved by the Board as reflecting fair value (“Fair Valued Investments”). The fair valuation approaches that may be used by the Global Valuation Committee include Market approach, Income approach and the Cost approach. Valuation techniques such as discounted cash flow, use of market comparables and matrix pricing are types of valuation approaches and typically used in determining fair value. When determining the price for Fair Valued Investments, the Global Valuation Committee, or its delegate, seeks to determine the price that each Fund might reasonably expect to receive or pay from the current sale or purchase of that asset or liability in an arm’s-length transaction. Fair value determinations shall be based upon all available factors that the Global Valuation Committee, or its delegate, deems relevant and consistent with the principles of fair value measurement.
The Global Valuation Committee, or its delegate, employs various methods for calibrating valuation approaches for investments where an active market does not exist, including regular due diligence of each Fund’s pricing vendors, regular reviews of key inputs and assumptions, transactional back-testing or disposition analysis to compare unrealized gains and losses to realized gains and losses, reviews of missing or stale prices and large movements in market values and reviews of any market related activity. The pricing of all Fair Valued Investments is subsequently reported to the Board or a committee thereof on a quarterly basis. As a result of the inherent uncertainty in valuation of these investments, the fair values may differ from the values that would have been used had an active market existed.
For investments in equity or debt issued by privately-held companies or funds (“Private Company” or collectively, the “Private Companies”) and other Fair Valued Investments, the fair valuation approaches that are used by third party pricing services utilize one or a combination of, but not limited to, the following inputs:
| | | | | | |
| Standard Inputs Generally Considered By Third Party Pricing Services |
Market approach | | | (i | ) | | recent market transactions, including subsequent rounds of financing, in the underlying investment or comparable issuers; |
| | | (ii | ) | | recapitalizations and other transactions across the capital structure; and |
| | | | (iii | ) | | market multiples of comparable issuers. |
| | |
Income approach | | | (i | ) | | future cash flows discounted to present and adjusted as appropriate for liquidity, credit, and/or market risks; |
| | | (ii | ) | | quoted prices for similar investments or assets in active markets; and |
| | | | (iii | ) | | other risk factors, such as interest rates, yield curves, volatilities, prepayment speeds, loss severities, credit risks, recovery rates, liquidation amounts and/or default rates. |
| | |
Cost approach | | | (i | ) | | audited or unaudited financial statements, investor communications and financial or operational metrics issued by the Private Company; |
| | | (ii | ) | | changes in the valuation of relevant indices or publicly traded companies comparable to the Private Company; |
| | | (iii | ) | | relevant news and other public sources; and |
| | | | (iv | ) | | known secondary market transactions in the Private Company’s interests and merger or acquisition activity in companies comparable to the Private Company. |
Investments in series of preferred stock issued by Private Companies are typically valued utilizing Market approach in determining the enterprise value of the company. Such investments often contain rights and preferences that differ from other series of preferred and common stock of the same issuer. Valuation techniques such as an option pricing model (“OPM”), a probability weighted expected return model (“PWERM”) or a hybrid of those techniques are used in allocating enterprise value of the company, as deemed appropriate under the circumstances. The use of OPM and PWERM techniques involve a determination of the exit scenarios of the investment in order to appropriately allocate the enterprise value of the company among the various parts of its capital structure.
| | | | | | |
| | | BLACKROCK SERIES FUND, INC. | | JUNE 30, 2017 | | 161 |
| | | | |
| Notes to Financial Statements (continued) | | | | |
The Private Companies are not subject to the public company disclosure, timing, and reporting standards as other investments held by a Fund. Typically, the most recently available information by a Private Company is as of a date that is earlier than the date a Fund is calculating its NAV. This factor may result in a difference between the value of the investment and the price a Fund could receive upon the sale of the investment.
Fair Value Hierarchy: Various inputs are used in determining the fair value of investments and derivative financial instruments. These inputs to valuation techniques are categorized into a fair value hierarchy consisting of three broad levels for financial statement purposes as follows:
| • | | Level 1 — Unadjusted price quotations in active markets/exchanges for identical assets or liabilities that each Fund has the ability to access |
| • | | Level 2 — Other observable inputs (including, but not limited to, quoted prices for similar assets or liabilities in markets that are active, quoted prices for identical or similar assets or liabilities in markets that are not active, inputs other than quoted prices that are observable for the assets or liabilities (such as interest rates, yield curves, volatilities, prepayment speeds, loss severities, credit risks and default rates) or other market-corroborated inputs) |
| • | | Level 3 — Unobservable inputs based on the best information available in the circumstances, to the extent observable inputs are not available (including each Fund’s own assumptions used in determining the fair value of investments and derivative financial instruments) |
The hierarchy gives the highest priority to unadjusted quoted prices in active markets for identical assets or liabilities (Level 1 measurements) and the lowest priority to unobservable inputs (Level 3 measurements). Accordingly, the degree of judgment exercised in determining fair value is greatest for instruments categorized in Level 3. The inputs used to measure fair value may fall into different levels of the fair value hierarchy. In such cases, for disclosure purposes, the fair value hierarchy classification is determined based on the lowest level input that is significant to the fair value measurement in its entirety. Investments classified within Level 3 have significant unobservable inputs used by the Global Valuation Committee in determining the price for Fair Valued Investments. Level 3 investments include equity or debt issued by Private Companies. There may not be a secondary market, and/or there are a limited number of investors. Level 3 investments may also be adjusted to reflect illiquidity and/or non-transferability, with the amount of such discount estimated by the Global Valuation Committee in the absence of market information.
Changes in valuation techniques may result in transfers into or out of an assigned level within the hierarchy. In accordance with each Fund’s policy, transfers between different levels of the fair value hierarchy are deemed to have occurred as of the beginning of the reporting period. The categorization of a value determined for investments and derivative financial instruments is based on the pricing transparency of the investments and derivative financial instruments and is not necessarily an indication of the risks associated with investing in those securities.
As of June 30, 2017, certain investments of the Funds were valued using NAV per share as no quoted market value is available and therefore have been excluded from the fair value hierarchy.
4. Securities and Other Investments:
Asset-Backed and Mortgage-Backed Securities: Asset-backed securities are generally issued as pass-through certificates or as debt instruments. Asset-backed securities issued as pass-through certificates represent undivided fractional ownership interests in an underlying pool of assets. Asset-backed securities issued as debt instruments, which are also known as collateralized obligations, are typically issued as the debt of a special purpose entity organized solely for the purpose of owning such assets and issuing such debt. Asset-backed securities are often backed by a pool of assets representing the obligations of a number of different parties. The yield characteristics of certain asset-backed securities may differ from traditional debt securities. One such major difference is that all or a principal part of the obligations may be prepaid at any time because the underlying assets (i.e., loans) may be prepaid at any time. As a result, a decrease in interest rates in the market may result in increases in the level of prepayments as borrowers, particularly mortgagors, refinance and repay their loans. An increased prepayment rate with respect to an asset-backed security will have the effect of shortening the maturity of the security. In addition, a fund may subsequently have to reinvest the proceeds at lower interest rates. If a fund has purchased such an asset-backed security at a premium, a faster than anticipated prepayment rate could result in a loss of principal to the extent of the premium paid.
For mortgage pass-through securities (the “Mortgage Assets”) there are a number of important differences among the agencies and instrumentalities of the U.S. Government that issue mortgage-related securities and among the securities that they issue. For example, mortgage-related securities guaranteed by Ginnie Mae are guaranteed as to the timely payment of principal and interest by Ginnie Mae and such guarantee is backed by the full faith and credit of the United States. However, mortgage-related securities issued by Freddie Mac and Fannie Mae, including Freddie Mac and Fannie Mae guaranteed mortgage pass-through certificates, which are solely the obligations of Freddie Mac and Fannie Mae, are not backed by or entitled to the full faith and credit of the United States, but are supported by the right of the issuer to borrow from the U.S. Treasury.
Non-agency mortgage-backed securities are securities issued by non-governmental issuers and have no direct or indirect government guarantees of payment and are subject to various risks. Non-agency mortgage loans are obligations of the borrowers thereunder only and are not typically insured or
| | | | | | |
| 162 | | BLACKROCK SERIES FUND, INC. | | JUNE 30, 2017 | | |
| | | | |
| Notes to Financial Statements (continued) | | | | |
guaranteed by any other person or entity. The ability of a borrower to repay a loan is dependent upon the income or assets of the borrower. A number of factors, including a general economic downturn, acts of God, terrorism, social unrest and civil disturbances, may impair a borrower’s ability to repay its loans.
Collateralized Debt Obligations: Collateralized debt obligations (“CDOs”), including collateralized bond obligations (“CBOs”) and collateralized loan obligations (“CLOs”), are types of asset-backed securities. A CDO is an entity that is backed by a diversified pool of debt securities (CBOs) or syndicated bank loans (CLOs). The cash flows of the CDO can be split into multiple segments, called “tranches,” which will vary in risk profile and yield. The riskiest segment is the subordinated or “equity” tranche. This tranche bears the greatest risk of defaults from the underlying assets in the CDO and serves to protect the other, more senior, tranches from default in all but the most severe circumstances. Since it is shielded from defaults by the more junior tranches, a “senior” tranche will typically have higher credit ratings and lower yields than their underlying securities, and often receive investment grade ratings from one or more of the nationally recognized rating agencies. Despite the protection from the more junior tranches, senior tranches can experience substantial losses due to actual defaults, increased sensitivity to future defaults and the disappearance of one or more protecting tranches as a result of changes in the credit profile of the underlying pool of assets.
Inflation-Indexed Bonds: Inflation-indexed bonds (other than municipal inflation-indexed and certain corporate inflation-indexed bonds) are fixed-income securities whose principal value is periodically adjusted according to the rate of inflation. If the index measuring inflation rises or falls, the principal value of inflation-indexed bonds (other than municipal inflation-indexed and certain corporate inflation-indexed bonds) will be adjusted upward or downward, and consequently the interest payable on these securities (calculated with respect to a larger or smaller principal amount) will be increased or reduced, respectively. Any upward or downward adjustment in the principal amount of an inflation-indexed bond will be included as interest income in the Statements of Operations, even though investors do not receive their principal until maturity. Repayment of the original bond principal upon maturity (as adjusted for inflation) is guaranteed in the case of U.S. Treasury inflation-indexed bonds. For bonds that do not provide a similar guarantee, the adjusted principal value of the bond repaid at maturity may be less than the original principal. With regard to municipal inflation-indexed bonds and certain corporate inflation-indexed bonds, the inflation adjustment is typically reflected in the semi-annual coupon payment. As a result, the principal value of municipal inflation-indexed bonds and such corporate inflation-indexed bonds does not adjust according to the rate of inflation.
Multiple Class Pass-Through Securities: Multiple class pass-through securities, including collateralized mortgage obligations (“CMOs”) and commercial mortgage-backed securities, may be issued by Ginnie Mae, U.S. Government agencies or instrumentalities or by trusts formed by private originators of, or investors in, mortgage loans. In general, CMOs are debt obligations of a legal entity that are collateralized by a pool of residential or commercial mortgage loans or Mortgage Assets. The payments on these are used to make payments on the CMOs or multiple pass-through securities. Multiple class pass-through securities represent direct ownership interests in the Mortgage Assets. Classes of CMOs include interest only (“IOs”), principal only (“POs”), planned amortization classes and targeted amortization classes. IOs and POs are stripped mortgage-backed securities representing interests in a pool of mortgages, the cash flow from which has been separated into interest and principal components. IOs receive the interest portion of the cash flow while POs receive the principal portion. IOs and POs can be extremely volatile in response to changes in interest rates. As interest rates rise and fall, the value of IOs tends to move in the same direction as interest rates. POs perform best when prepayments on the underlying mortgages rise since this increases the rate at which the principal is returned and the yield to maturity on the PO. When payments on mortgages underlying a PO are slower than anticipated, the life of the PO is lengthened and the yield to maturity is reduced. If the underlying Mortgage Assets experience greater than anticipated prepayments of principal, a Fund’s initial investment in the IOs may not fully recoup.
Stripped Mortgage-Backed Securities: Stripped mortgage-backed securities are typically issued by the U.S. Government, its agencies and instrumentalities. Stripped mortgage-backed securities are usually structured with two classes that receive different proportions of the interest (IOs) and principal (POs) distributions on a pool of Mortgage Assets. Stripped mortgage-backed securities may be privately issued.
Zero-Coupon Bonds: Zero-coupon bonds, are normally issued at a significant discount from face value and do not provide for periodic interest payments. These bonds may experience greater volatility in market value than other debt obligations of similar maturity which provide for regular interest payments.
Capital Securities and Trust Preferred Securities: Capital securities, including trust preferred securities, are typically issued by corporations, generally in the form of interest-bearing notes with preferred securities characteristics. In the case of trust preferred securities, an affiliated business trust of a corporation issues these securities, generally in the form of beneficial interests in subordinated debentures or similarly structured securities. The securities can be structured with either a fixed or adjustable coupon that can have either a perpetual or stated maturity date. For trust preferred securities, the issuing bank or corporation pays interest to the trust, which is then distributed to holders of these securities as a dividend. Dividends can be deferred without creating an event of default or acceleration, although maturity cannot take place unless all cumulative payment obligations have been met. The deferral of payments does not affect the purchase or sale of these securities in the open market. These securities generally are rated below that of the issuing company’s senior debt securities and are freely callable at the issuer’s option.
| | | | | | |
| | | BLACKROCK SERIES FUND, INC. | | JUNE 30, 2017 | | 163 |
| | | | |
| Notes to Financial Statements (continued) | | | | |
Preferred Stocks: Preferred stock has a preference over common stock in liquidation (and generally in receiving dividends as well), but is subordinated to the liabilities of the issuer in all respects. As a general rule, the market value of preferred stock with a fixed dividend rate and no conversion element varies inversely with interest rates and perceived credit risk, while the market price of convertible preferred stock generally also reflects some element of conversion value. Because preferred stock is junior to debt securities and other obligations of the issuer, deterioration in the credit quality of the issuer will cause greater changes in the value of a preferred stock than in a more senior debt security with similar stated yield characteristics. Unlike interest payments on debt securities, preferred stock dividends are payable only if declared by the issuer’s board of directors. Preferred stock also may be subject to optional or mandatory redemption provisions.
Warrants: Warrants entitle a Fund to purchase a specified number of shares of common stock and are non-income producing. The purchase price and number of shares are subject to adjustment under certain conditions until the expiration date of the warrants, if any. If the price of the underlying stock does not rise above the strike price before the warrant expires, the warrant generally expires without any value and a Fund will lose any amount it paid for the warrant. Thus, investments in warrants may involve more risk than investments in common stock. Warrants may trade in the same markets as their underlying stock; however, the price of the warrant does not necessarily move with the price of the underlying stock.
Floating Rate Loan Interests: Floating rate loan interests are typically issued to companies (the “borrower”) by banks, other financial institutions, or privately and publicly offered corporations (the “lender”). Floating rate loan interests are generally non-investment grade, often involve borrowers whose financial condition is troubled or uncertain and companies that are highly leveraged or in bankruptcy proceedings. In addition, transactions in floating rate loan interests may settle on a delayed basis, which may result in proceeds from the sale not being readily available for a Fund to make additional investments or meet its redemption obligations. Floating rate loan interests may include fully funded term loans or revolving lines of credit. Floating rate loan interests are typically senior in the corporate capital structure of the borrower. Floating rate loan interests generally pay interest at rates that are periodically determined by reference to a base lending rate plus a premium. Since the rates reset only periodically, changes in prevailing interest rates (and particularly sudden and significant changes) can be expected to cause some fluctuations in the NAV of a Fund to the extent that it invests in floating rate loan interest. The base lending rates are generally the lending rate offered by one or more European banks, such as the London Interbank Offered Rate (“LIBOR”), the prime rate offered by one or more U.S. banks or the certificate of deposit rate. Floating rate loan interests may involve foreign borrowers, and investments may be denominated in foreign currencies. These investments are treated as investments in debt securities for purposes of a Fund’s investment policies.
When a Fund purchases a floating rate loan interest, it may receive a facility fee and when it sells a floating rate loan interest, it may pay a facility fee. On an ongoing basis, a Fund may receive a commitment fee based on the undrawn portion of the underlying line of credit amount of a floating rate loan interest. Facility and commitment fees are typically amortized to income over the term of the loan or term of the commitment, respectively. Consent and amendment fees are recorded to income as earned. Prepayment penalty fees, which may be received by a Fund upon the prepayment of a floating rate loan interest by a borrower, are recorded as realized gains. A Fund may invest in multiple series or tranches of a loan. A different series or tranche may have varying terms and carry different associated risks.
Floating rate loan interests are usually freely callable at the borrower’s option. A Fund may invest in such loans in the form of participations in loans (“Participations”) or assignments (“Assignments”) of all or a portion of loans from third parties. Participations typically will result in a Fund having a contractual relationship only with the lender, not with the borrower. A Fund has the right to receive payments of principal, interest and any fees to which it is entitled only from the lender selling the Participation and only upon receipt by the lender of the payments from the borrower. In connection with purchasing Participations, a Fund generally will have no right to enforce compliance by the borrower with the terms of the loan agreement, nor any rights of offset against the borrower. A Fund may not benefit directly from any collateral supporting the loan in which it has purchased the Participation. As a result, a Fund assumes the credit risk of both the borrower and the lender that is selling the Participation. A Fund’s investment in loan participation interests involves the risk of insolvency of the financial intermediaries who are parties to the transactions. In the event of the insolvency of the lender selling the Participation, a Fund may be treated as a general creditor of the lender and may not benefit from any offset between the lender and the borrower. Assignments typically result in a Fund having a direct contractual relationship with the borrower, and a Fund may enforce compliance by the borrower with the terms of the loan agreement.
Forward Commitments and When-Issued Delayed Delivery Securities: Certain Funds may purchase securities on a when-issued basis and may purchase or sell securities on a forward commitment basis. Settlement of such transactions normally occurs within a month or more after the purchase or sale commitment is made. A Fund may purchase securities under such conditions with the intention of actually acquiring them, but may enter into a separate agreement to sell the securities before the settlement date. Since the value of securities purchased may fluctuate prior to settlement, a Fund may be required to pay more at settlement than the security is worth. In addition, a Fund is not entitled to any of the interest earned prior to settlement. When purchasing a security on a delayed delivery basis, a Fund assumes the rights and risks of ownership of the security, including the risk of price and yield fluctuations. In the event of default by the counterparty, a Fund’s maximum amount of loss is the unrealized appreciation of unsettled when-issued transactions.
| | | | | | |
| 164 | | BLACKROCK SERIES FUND, INC. | | JUNE 30, 2017 | | |
| | | | |
| Notes to Financial Statements (continued) | | | | |
TBA Commitments: TBA commitments are forward agreements for the purchase or sale of mortgage-backed securities for a fixed price, with payment and delivery on an agreed upon future settlement date. The specific securities to be delivered are not identified at the trade date. However, delivered securities must meet specified terms, including issuer, rate and mortgage terms. When entering into TBA commitments, a fund may take possession of or deliver the underlying mortgage-backed securities but can extend the settlement or roll the transaction. TBA commitments involve a risk of loss if the value of the security to be purchased or sold declines or increases, respectively, prior to settlement date.
In order to better define contractual rights and to secure rights that will help a Fund mitigate its counterparty risk, TBA commitments may be entered into by a Fund under Master Securities Forward Transaction Agreements (each, an “MSFTA”). An MSFTA typically contains, among other things, collateral posting terms and netting provisions in the event of default and/or termination event. The collateral requirements are typically calculated by netting the mark-to-market amount for each transaction under such agreement and comparing that amount to the value of the collateral currently pledged by a Fund and the counterparty. Cash collateral that has been pledged to cover the obligations of a Fund and cash collateral received from the counterparty, if any, is reported separately on the Statements of Assets and Liabilities as cash pledged as collateral for TBA commitments or cash received as collateral for TBA commitments, respectively. Non-cash collateral pledged by a Fund, if any, is noted in the Schedules of Investments. Typically, a Fund is permitted to sell, re-pledge or use the collateral it receives; however, the counterparty is not permitted to do so. To the extent amounts due to a Fund are not fully collateralized, contractually or otherwise, a Fund bears the risk of loss from counterparty non-performance.
Mortgage Dollar Roll Transactions: Certain Funds may sell TBA mortgage-backed securities and simultaneously contract to repurchase substantially similar (i.e., same type, coupon and maturity) securities on a specific future date at an agreed upon price. During the period between the sale and repurchase, a Fund is not entitled to receive interest and principal payments on the securities sold. Mortgage dollar roll transactions are treated as purchases and sales and realize gains and losses on these transactions. Mortgage dollar rolls involve the risk that the market value of the securities that a Fund is required to purchase may decline below the agreed upon repurchase price of those securities.
Repurchase Agreements: Repurchase agreements are commitments to purchase a security from a counterparty who agrees to repurchase the same security at a mutually agreed upon date and price. On a daily basis, the counterparty is required to maintain collateral subject to the agreement and in value no less than the agreed upon repurchase amount. Pursuant to the custodial undertaking associated with a tri-party repurchase arrangement, an unaffiliated third party custodian maintains accounts to hold collateral for a fund and its counterparties. Typically, a fund and counterparty are not permitted to sell, repledge or use the collateral absent a default by the counterparty or a fund, respectively.
In the event the counterparty defaults and the fair value of the collateral declines, a Fund could experience losses, delays and costs in liquidating the collateral.
Repurchase agreements are entered into by a Fund under Master Repurchase Agreements (each, an “MRA”). The MRA permits a Fund, under certain circumstances, including an event of default (such as bankruptcy or insolvency), to offset payables and/or receivables with collateral held by and/or posted to the counterparty. As a result, one single net payment is created. Bankruptcy or insolvency laws of a particular jurisdiction may impose restrictions on or prohibitions against such a right of offset in the event of the MRA counterparty’s bankruptcy or insolvency. Based on the terms of the MRA, a Fund receives securities as collateral with a market value in excess of the repurchase price at maturity. Upon a bankruptcy or insolvency of the MRA counterparty, a Fund would recognize a liability with respect to such excess collateral. The liability reflects a Fund’s obligation under bankruptcy law to return the excess to the counterparty.
Borrowed Bond Agreements: Repurchase agreements may be referred to as borrowed bond agreements when entered into in connection with short sales of bonds. In a borrowed bond agreement, a Fund borrows a bond from a counterparty in exchange for cash collateral. The agreement contains a commitment that the security and the cash will be returned to the counterparty and a Fund at a mutually agreed upon date. Certain agreements have no stated maturity and can be terminated by either party at any time. Earnings on cash collateral and compensation to the lender of the bond are based on agreed upon rates between a Fund and the counterparty. The value of the underlying cash collateral approximates the market value and accrued interest of the borrowed bond. To the extent that a borrowed bond transaction exceeds one business day, the value of the cash collateral in the possession of the counterparty is monitored on a daily basis to ensure the adequacy of the collateral. As the market value of the borrowed bond changes, the cash collateral is periodically increased or decreased with a frequency and in amounts prescribed in the borrowed bond agreement. A Fund may also experience delays in gaining access to the collateral.
Reverse Repurchase Agreements: Reverse repurchase agreements are agreements with qualified third party broker dealers in which a Fund sells securities to a bank or broker-dealer and agrees to repurchase the same securities at a mutually agreed upon date and price. A Fund receives cash from the sale to use for other investment purposes. During the term of the reverse repurchase agreement, a Fund continues to receive the principal and interest payments on the securities sold. Certain agreements have no stated maturity and can be terminated by either party at any time. Interest on the value of the reverse repurchase agreements issued and outstanding is based upon competitive market rates determined at the time of issuance. A Fund may utilize reverse repurchase agreements when it is anticipated that the interest income to be earned from the investment of the proceeds of the transaction is greater than the interest expense of the transaction. Reverse repurchase agreements involve leverage risk. If a Fund suffers a loss on its
| | | | | | |
| | | BLACKROCK SERIES FUND, INC. | | JUNE 30, 2017 | | 165 |
| | | | |
| Notes to Financial Statements (continued) | | | | |
investment of the transaction proceeds from a reverse repurchase agreement, a Fund would still be required to pay the full repurchase price. Further, a Fund remains subject to the risk that the market value of the securities repurchased declines below the repurchase price. In such cases, a Fund would be required to return a portion of the cash received from the transaction or provide additional securities to the counterparty.
Cash received in exchange for securities delivered plus accrued interest due to the counterparty is recorded as a liability in the Statements of Assets and Liabilities at face value including accrued interest. Due to the short-term nature of the reverse repurchase agreements, face value approximates fair value. Interest payments made by a Fund to the counterparties are recorded as a component of interest expense in the Statements of Operations. In periods of increased demand for the security, a Fund may receive a fee for the use of the security by the counterparty, which may result in interest income to a Fund.
For the six months ended June 30, 2017, the average amount of reverse repurchase agreements and the daily weighted average interest rate for the Funds were as follows:
| | | | | | | | | | | | |
| | | Balanced Capital | | | Total Return | | | U.S. Government
Bond | |
Average Borrowings | | $ | 3,654,011 | | | $ | 4,192,883 | | | $ | 7,117,121 | |
Daily Weighted Average Interest Rate | | | 0.90 | % | | | 0.65 | % | | | 0.57 | % |
Borrowed bond agreements and reverse repurchase transactions are entered into by a Fund under Master Repurchase Agreements (each, an “MRA”), which permit a Fund, under certain circumstances, including an event of default (such as bankruptcy or insolvency), to offset payables and/or receivables under the MRA with collateral held and/or posted to the counterparty and create one single net payment due to or from a Fund. With borrowed bond agreements and reverse repurchase transactions, typically a Fund and counterparty under an MRA are permitted to sell, re-pledge, or use the collateral associated with the transaction. Bankruptcy or insolvency laws of a particular jurisdiction may impose restrictions on or prohibitions against such a right of offset in the event of the MRA counterparty’s bankruptcy or insolvency. Pursuant to the terms of the MRA, a Fund receives or posts securities as collateral with a market value in excess of the repurchase price to be paid or received by a Fund upon the maturity of the transaction. Upon a bankruptcy or insolvency of the MRA counterparty, a Fund is considered an unsecured creditor with respect to excess collateral and, as such, the return of excess collateral may be delayed.
As of period end, the following table is a summary of the Funds’ open borrowed bond agreements and reverse repurchase agreements by counterparty which are subject to offset under an MRA on a net basis:
| | | | | | | | | | | | | | | | | | | | | | | | | | | | |
| Counterparty | | Borrowed
Bond
Agreements1 | | | Reverse
Repurchase
Agreements | | | Borrowed Bonds
at Value
Including
Accrued Interest2 | | | Net Amount
before
Collateral | | | Fair Value of
Non-cash
Collateral
Pledged
Including
Accrued Interest | | | Net
Collateral
Pledged | | | Net Exposure
Due (to)/from
Counterparty3 | |
Balanced Capital | | | | | | | | | | | | | | | | | | | | | | | | | | | | |
Barclays Bank PLC | | $ | 404,942 | | | | — | | | $ | (397,592 | ) | | $ | 7,350 | | | | — | | | | — | | | $ | 7,350 | |
Barclays Capital, Inc. | | | 703,000 | | | | — | | | | (702,415 | ) | | | 585 | | | | — | | | | — | | | | 585 | |
Credit Suisse Securities (USA) LLC | | | — | | | $ | (2,559,300 | ) | | | — | | | | (2,559,300 | ) | | $ | 2,555,652 | | | $ | 2,555,652 | | | | (3,648 | ) |
Deutsche Bank Securities, Inc. | | | — | | | | (2,841,394 | ) | | | — | | | | (2,841,394 | ) | | | 2,824,642 | | | | 2,824,642 | | | | (16,752 | ) |
J.P. Morgan Securities LLC | | | — | | | | (3,492,678 | ) | | | — | | | | (3,492,678 | ) | | | 3,491,764 | | | | 3,491,764 | | | | (914 | ) |
Merrill Lynch, Pierce, Fenner & Smith, Inc. | | | — | | | | (1,124,181 | ) | | | — | | | | (1,124,181 | ) | | | 1,113,645 | | | | 1,113,645 | | | | (10,536 | ) |
| | | | |
Total | | $ | 1,107,942 | | | $ | (10,017,553 | ) | | $ | (1,100,007 | ) | | $ | (10,009,618 | ) | | $ | 9,985,703 | | | $ | 9,985,703 | | | $ | (23,915 | ) |
| | | | |
| | | | | | | | | | | | | | | | | | | | | | | | | | | | |
Total Return | | | | | | | | | | | | | | | | | | | | | | | | | | | | |
Barclays Bank PLC | | $ | 139,353 | | | | — | | | $ | (136,834 | ) | | $ | 2,519 | | | | — | | | | — | | | $ | 2,519 | |
BNP Paribas Securities Corp. | | | 85,892 | | | $ | (128,396 | ) | | | (85,399 | ) | | | (127,903 | ) | | $ | 127,671 | | | $ | 127,671 | | | | (232 | ) |
Citigroup Global Markets, Inc. | | | — | | | | (1,875,727 | ) | | | — | | | | (1,875,727 | ) | | | 1,874,256 | | | | 1,874,256 | | | | (1,471 | ) |
Credit Suisse Securities (USA) LLC | | | — | | | | (545,749 | ) | | | — | | | | (545,749 | ) | | | 544,952 | | | | 544,952 | | | | (797 | ) |
Deutsche Bank Securities, Inc. | | | — | | | | (1,693,651 | ) | | | — | | | | (1,693,651 | ) | | | 1,682,876 | | | | 1,682,876 | | | | (10,775 | ) |
J.P. Morgan Securities LLC | | | — | | | | (1,655,537 | ) | | | — | | | | (1,655,537 | ) | | | 1,652,720 | | | | 1,652,720 | | | | (2,817 | ) |
Merrill Lynch, Pierce, Fenner & Smith, Inc. | | | — | | | | (1,489,776 | ) | | | — | | | | (1,489,776 | ) | | | 1,484,158 | | | | 1,484,158 | | | | (5,618 | ) |
| | | | |
Total | | $ | 225,245 | | | $ | (7,388,836 | ) | | $ | (222,233 | ) | | $ | (7,385,824 | ) | | $ | 7,366,633 | | | $ | 7,366,633 | | | $ | (19,191 | ) |
| | | | |
| | 1 | | Included in Investments at value — unaffiliated in the Statements of Assets and Liabilities. |
| | 2 | | Includes accrued interest on borrowed bonds in the amount of $4,931 and $323 for Balanced Capital and Total Return, respectively, which is included in interest expense payable in the Statements of Assets and Liabilities. |
| | 3 | | Net exposure represents the net receivable (payable) that would be due from/to the counterparty in the event of default. |
| | | | | | |
| 166 | | BLACKROCK SERIES FUND, INC. | | JUNE 30, 2017 | | |
| | | | |
| Notes to Financial Statements (continued) | | | | |
| | | | | | | | | | | | | | | | | | | | | | | | | | | | |
| Counterparty | | Borrowed
Bond
Agreements | | | Reverse
Repurchase
Agreements | | | Borrowed Bonds
at Value
Including
Accrued Interest | | | Net Amount
before
Collateral | | | Fair Value of
Non-cash
Collateral
Pledged
Including
Accrued Interest | | | Net
Collateral
Pledged | | | Net Exposure
Due (to)/from
Counterparty1 | |
U.S. Government Bond | | | | | | | | | | | | | | | | | | | | | | | | | | | | |
BNP Paribas Securities Corp. | | | — | | | $ | (256,185 | ) | | | — | | | $ | (256,185 | ) | | $ | 254,773 | | | $ | 254,773 | | | $ | (1,412 | ) |
Deutsche Bank Securities, Inc. | | | — | | | | (927,792 | ) | | | — | | | | (927,792 | ) | | | 922,377 | | | | 922,377 | | | | (5,415 | ) |
J.P. Morgan Securities LLC | | | — | | | | (1,464,229 | ) | | | — | | | | (1,464,229 | ) | | | 1,463,266 | | | | 1,463,266 | | | | (963 | ) |
Merrill Lynch, Pierce, Fenner & Smith, Inc. | | | — | | | | (4,126,997 | ) | | | — | | | | (4,126,997 | ) | | | 4,106,620 | | | | 4,106,620 | | | | (20,377 | ) |
| | | | |
Total | | | — | | | $ | (6,775,203 | ) | | | — | | | $ | (6,775,203 | ) | | $ | 6,747,036 | | | $ | 6,747,036 | | | $ | (28,167 | ) |
| | | | |
| | 1 | | Net exposure represents the net receivable (payable) that would be due from/to the counterparty in the event of default. |
In the event the counterparty of securities under an MRA files for bankruptcy or becomes insolvent, a Fund’s use of the proceeds from the agreement may be restricted while the counterparty, or its trustee or receiver, determines whether or not to enforce a Fund’s obligation to repurchase the securities.
Short Sale Transactions (Borrowed Bonds): In short sale transactions, a Fund sells a security it does not hold in anticipation of a decline in the market price of that security. When a Fund makes a short sale, it will borrow the security sold short (borrowed bond) and deliver the fixed-income security to the counterparty to which it sold the security short. An amount equal to the proceeds received by a Fund is reflected as an asset and an equivalent liability. The amount of the liability is subsequently marked-to-market to reflect the market value of the short sale. A Fund is required to repay the counterparty interest on the security sold short, which, if applicable, is shown as interest expense in the Statements of Operations. A Fund is exposed to market risk based on the amount, if any, that the market value of the security increases beyond the market value at which the position was sold. Thus, a short sale of a security involves the risk that instead of declining, the price of the security sold short will rise. The short sale of securities involves the possibility of an unlimited loss since there is an unlimited potential for the market price of the security sold short to increase. A gain is limited to the price at which a Fund sold the security short. A realized gain or loss is recognized upon the termination of a short sale if the market price is either less than or greater than the proceeds originally received. There is no assurance that a Fund will be able to close out a short position at a particular time or at an acceptable price.
Short Sale Transactions (Equities): In short sale transactions, a Fund sells a security it does not hold in anticipation of a decline in the market price of that security. When a Fund makes a short sale, it will borrow the security sold short from a broker/counterparty and deliver the security to the purchaser. To close out a short position, a Fund delivers the same security to the broker and records a liability to reflect the obligation to return the security to the broker. The amount of the liability is subsequently marked-to-market to reflect the market value of the short sale. A Fund maintains a segregated account of securities or deposits cash with the broker-dealer as collateral for the short sales. Cash deposited with the broker is recorded as an asset in the Statements of Assets and Liabilities. Securities segregated as collateral are denoted in the Schedules of Investments. A Fund may pay a financing fee for the difference between the market value of the short position and the cash collateral deposited with the broker which would be recorded as interest expense. A Fund is required to repay the counterparty any dividends received on the security sold short, which, if applicable, is shown as dividend expense in the Statements of Operations. A Fund may pay a fee on the assets borrowed from the counterparty, which, if applicable, is shown as broker fees and expenses on short sales in the Statements of Operations. A Fund is exposed to market risk based on the amount, if any, that the market value of the security increases beyond the market value at which the position was sold. Thus, a short sale of a security involves the risk that instead of declining, the price of the security sold short will rise. The short sale of securities involves the possibility of an unlimited loss since there is an unlimited potential for the market price of the security sold short to increase. A gain, limited to the price at which a Fund sold the security short. A realized gain or loss is recognized upon the termination of a short sale if the market price is either less than or greater than the proceeds originally received. There is no assurance that a Fund will be able to close out a short position at a particular time or at an acceptable price.
Securities Lending: Certain Funds may lend their securities to approved borrowers, such as brokers, dealers and other financial institutions. The borrower pledges and maintains with the Funds collateral consisting of cash, an irrevocable letter of credit issued by a bank, or securities issued or guaranteed by the U.S. Government. The initial collateral received by each Fund is required to have a value of at least 102% of the current value of the loaned securities for securities traded on U.S. exchanges and a value of at least 105% for all other securities. The collateral is maintained thereafter at a value equal to at least 100% of the current market value of the securities on loan. The market value of the loaned securities is determined at the close of each business day of the Fund and any additional required collateral is delivered to the Fund, or excess collateral returned by the Fund, on the next business day. During the term of the loan, the Funds are entitled to all distributions made on or in respect of the loaned securities but does not receive interest income on securities received as collateral. Loans of securities are terminable at any time and the borrower, after notice, is required to return borrowed securities within the standard time period for settlement of securities transactions.
The market value of any securities on loan, all of which were classified as common stocks/investment companies in the Funds’ Schedules of Investments, and the value of any related collateral are shown separately in the Statements of Assets and Liabilities as a component of investments at value — unaffiliated, and collateral on securities loaned at value, respectively. As of period end, any securities on loan were collateralized by cash
| | | | | | |
| | | BLACKROCK SERIES FUND, INC. | | JUNE 30, 2017 | | 167 |
| | | | |
| Notes to Financial Statements (continued) | | | | |
and/or U.S. Government obligations. Cash collateral invested by the securities lending agent, BlackRock Investment Management, LLC (“BIM”), if any, is disclosed in the Schedules of Investments.
Securities lending transactions are entered into by the Funds under Master Securities Lending Agreements (each, an “MSLA”), which provide the right, in the event of default (including bankruptcy or insolvency), for the non-defaulting party to liquidate the collateral and calculate a net exposure to the defaulting party or request additional collateral. In the event that a borrower defaults, the Funds, as lender, would offset the market value of the collateral received against the market value of the securities loaned. When the value of the collateral is greater than that of the market value of the securities loaned, the lender is left with a net amount payable to the defaulting party. However, bankruptcy or insolvency laws of a particular jurisdiction may impose restrictions on or prohibitions against such a right of offset in the event of an MSLA counterparty’s bankruptcy or insolvency. Under the MSLA, absent an event of default, the borrower can resell or re-pledge the loaned securities, and a Fund can reinvest cash collateral received in connection with loaned securities. Upon an event of default, the parties’ obligations to return the securities or collateral to the other party are extinguished, and the parties can resell or re-pledge the loaned securities or the collateral received in connection with the loaned securities in order to satisfy the defaulting party’s net payment obligation for all transactions under the MSLA. The defaulting party remains liable for any deficiency.
As of period end, the following tables are a summary of the Funds’ securities lending agreements by counterparty which are subject to offset under an MSLA:
| | | | | | | | | | | | |
| Advantage Large Cap Core | | | | | | | | | |
| Counterparty | | Securities
Loaned
at Value | | | Cash Collateral
Received1 | | | Net Amount2 | |
Citigroup Global Markets, Inc. | | $ | 3,820,441 | | | $ | (3,820,441 | ) | | | — | |
Goldman Sachs & Co. | | | 105,546 | | | | (105,546 | ) | | | — | |
Merrill Lynch, Pierce, Fenner & Smith, Inc. | | | 1,794,326 | | | | (1,794,326 | ) | | | — | |
Morgan Stanley | | | 2,209,543 | | | | (2,209,543 | ) | | | — | |
| | | | |
Total | | $ | 7,929,856 | | | $ | (7,929,856 | ) | | | — | |
| | | | |
| | | | | | | | | | | | |
| Balanced Capital | | | | | | | | | |
| Counterparty | | | | | | | | | |
Citigroup Global Markets, Inc. | | $ | 2,931,087 | | | $ | (2,931,087 | ) | | | — | |
Goldman Sachs & Co. | | | 180,042 | | | | (180,042 | ) | | | — | |
JP Morgan Securities LLC | | | 527,028 | | | | (527,028 | ) | | | — | |
Merrill Lynch, Pierce, Fenner & Smith, Inc. | | | 2,577,174 | | | | (2,577,174 | ) | | | — | |
Morgan Stanley | | | 3,634,955 | | | | (3,634,955 | ) | | | — | |
State Street Bank and Trust Co. | | | 240,505 | | | | (240,505 | ) | | | — | |
| | | | |
Total | | $ | 10,090,791 | | | $ | (10,090,791 | ) | | | — | |
| | | | |
| | | | | | | | | | | | |
| Capital Appreciation | | | | | | | | | |
| Counterparty | | | | | | | | | |
Barclays Capital, Inc. | | $ | 576,139 | | | $ | (576,139 | ) | | | — | |
Citigroup Global Markets, Inc. | | | 1,761,544 | | | | (1,761,544 | ) | | | — | |
Deutsche Bank Securities, Inc. | | | 173,373 | | | | (173,004 | ) | | $ | 369 | |
Goldman Sachs & Co. | | | 404,256 | | | | (404,256 | ) | | | — | |
JP Morgan Securities LLC | | | 4,251,329 | | | | (4,251,329 | ) | | | — | |
State Street Bank and Trust Co. | | | 1,402,359 | | | | (1,402,359 | ) | | | — | |
| | | | |
Total | | $ | 8,569,000 | | | $ | (8,568,631 | ) | | $ | 369 | |
| | | | |
| | 1 | | Collateral with a value of $8,091,363, $10,284,931, and $8,688,157 has been received by Advantage Large Cap Core, Balanced Capital and Capital Appreciation, respectively, in connection with securities lending agreements. Collateral received in excess of the value of securities loaned from the individual counterparty is not shown for financial reporting purposes. |
| | 2 | | The market value of the loaned securities is determined as of June 30, 2017. Additional collateral is delivered to the Fund on the next business day in accordance with the MSLA. The net amount would be subject to the borrower default indemnity in the event of default by the counterparty. |
| | | | | | |
| 168 | | BLACKROCK SERIES FUND, INC. | | JUNE 30, 2017 | | |
| | | | |
| Notes to Financial Statements (continued) | | | | |
| | | | | | | | | | | | |
| Global Allocation | | | | | | | | | |
| Counterparty | | Securities
Loaned
at Value | | | Cash
Collateral
Received1 | | | Net Amount | |
BNP Paribas S.A. | | $ | 227,941 | | | $ | (227,941 | ) | | | — | |
Citigroup Global Markets, Inc. | | | 498,220 | | | | (498,220 | ) | | | — | |
Credit Suisse Securities (USA) LLC | | | 26,154 | | | | (26,154 | ) | | | — | |
Deutsche Bank Securities, Inc. | | | 660,715 | | | | (660,715 | ) | | | — | |
Goldman Sachs & Co. | | | 491,589 | | | | (491,589 | ) | | | — | |
JP Morgan Securities LLC | | | 2,195,514 | | | | (2,195,514 | ) | | | — | |
Merrill Lynch, Pierce, Fenner & Smith, Inc. | | | 99 | | | | (99 | ) | | | — | |
Morgan Stanley | | | 260,378 | | | | (260,378 | ) | | | — | |
State Street Bank and Trust Co. | | | 302,724 | | | | (302,724 | ) | | | — | |
| | | | |
Total | | $ | 4,663,334 | | | $ | (4,663,334 | ) | | | — | |
| | | | |
| | 1 | | Collateral with a value of $4,797,793 has been received by Global Allocation in connection with securities lending agreements. Collateral received in excess of the value of securities loaned from the individual counterparty is not shown for financial reporting purposes. |
The risks of securities lending include the risk that the borrower may not provide additional collateral when required or may not return the securities when due. To mitigate these risks, the Funds benefit from a borrower default indemnity provided by BIM. BIM’s indemnity allows for full replacement of the securities loaned if the collateral received does not cover the value on the securities loaned in the event of borrower default. Each Fund could suffer a loss if the value of an investment purchased with cash collateral falls below the market value of loaned securities or if the value of an investment purchased with cash collateral falls below the value of the original cash collateral received.
5. Derivative Financial Instruments:
Certain Funds engage in various portfolio investment strategies using derivative contracts both to increase the returns of the Funds and/or to manage their exposure to certain risks such as credit risk, equity risk, interest rate risk, foreign currency exchange rate risk, commodity price risk or other risks (e.g., inflation risk). Derivative financial instruments categorized by risk exposure are included in the Schedules of Investments. These contracts may be transacted on an exchange or OTC.
Futures Contracts: Futures contracts are purchased or sold to gain exposure to, or manage exposure to, changes in interest rates (interest rate risk), changes in the value of equity securities (equity risk) or foreign currencies (foreign currency exchange rate risk).
Futures contracts are agreements between the Funds and a counterparty to buy or sell a specific quantity of an underlying instrument at a specified price and on a specified date. Depending on the terms of a contract, it is settled either through physical delivery of the underlying instrument on the settlement date or by payment of a cash amount on the settlement date. Upon entering into a futures contract, the Funds are required to deposit initial margin with the broker in the form of cash or securities in an amount that varies depending on a contract’s size and risk profile. The initial margin deposit must then be maintained at an established level over the life of the contract.
Securities deposited as initial margin are designated in the Schedules of Investments and cash deposited, if any, is shown as cash pledged for futures contracts in the Statements of Assets and Liabilities. Pursuant to the contract, the Funds agree to receive from or pay to the broker an amount of cash equal to the daily fluctuation in market value of the contract (“variation margin”). Variation margin is recorded as unrealized appreciation (depreciation) and, if any, shown as variation margin receivable (or payable) on futures contracts in the Statements of Assets and Liabilities. When the contract is closed, a realized gain or loss is recorded in the Statements of Operations equal to the difference between the value of the contract at the time it was opened and the value at the time it was closed. The use of futures contracts involves the risk of an imperfect correlation in the movements in the price of futures contracts and interest, foreign currency exchange rates or underlying assets.
Forward Foreign Currency Exchange Contracts: Forward foreign currency exchange contracts are entered into to gain or reduce exposure to foreign currencies (foreign currency exchange rate risk).
A forward foreign currency exchange contract is an agreement between two parties to buy and sell a currency at a set exchange rate on a specified date. These contracts help to manage the overall exposure to the currencies in which some of the investments held by the Funds are denominated and in some cases, may be used to obtain exposure to a particular market.
The contract is marked-to-market daily and the change in market value is recorded as unrealized appreciation (depreciation) in the Statements of Assets and Liabilities. When a contract is closed, a realized gain or loss is recorded in the Statements of Operations equal to the difference between the value at the time it was opened and the value at the time it was closed. Non-deliverable forward foreign currency exchange contracts are settled with the counterparty in cash without the delivery of foreign currency. The use of forward foreign currency exchange contracts involves the risk that the value of a forward foreign currency exchange contract changes unfavorably due to movements in the value of the referenced foreign currencies.
| | | | | | |
| | | BLACKROCK SERIES FUND, INC. | | JUNE 30, 2017 | | 169 |
| | | | |
| Notes to Financial Statements (continued) | | | | |
Options: Certain Funds purchase and write call and put options to increase or decrease their exposure to the risks of underlying instruments, including equity risk, interest rate risk and/or commodity price risk and/or, in the case of options written, to generate gains from options premiums.
A call option gives the purchaser (holder) of the option the right (but not the obligation) to buy, and obligates the seller (writer) to sell (when the option is exercised) the underlying instrument at the exercise or strike price at any time or at a specified time during the option period. A put option gives the holder the right to sell and obligates the writer to buy the underlying instrument at the exercise or strike price at any time or at a specified time during the option period.
Premiums paid on options purchased and premiums received on options written, as well as the daily fluctuation in market value, are included in investments at value — unaffiliated and options written at value, respectively, in the Statements of Assets and Liabilities. When an instrument is purchased or sold through the exercise of an option, the premium is offset against the cost or proceeds of the underlying instrument. When an option expires, a realized gain or loss is recorded in the Statements of Operations to the extent of the premiums received or paid. When an option is closed or sold, a gain or loss is recorded in the Statements of Operations to the extent the cost of the closing transaction exceeds the premiums received or paid. When the Funds write a call option, such option is typically “covered,” meaning that they hold the underlying instrument subject to being called by the option counterparty. When the Funds write a put option, such option is covered by cash in an amount sufficient to cover the obligation.
| • | | Swaptions — Certain Funds purchase and write options on swaps (“swaptions”) primarily to preserve a return or spread on a particular investment or portion of the Funds’ holdings, as a duration management technique or to protect against an increase in the price of securities they anticipate purchasing at a later date. The purchaser and writer of a swaption is buying or granting the right to enter into a previously agreed upon interest rate or credit default swap agreement (interest rate risk and/or credit risk) at any time before the expiration of the option. |
| • | | Foreign currency options — Certain Funds purchase and write foreign currency options, foreign currency futures and options on foreign currency futures to gain or reduce exposure to foreign currencies (foreign currency exchange rate risk). Foreign currency options give the purchaser the right to buy from or sell to the writer a foreign currency at any time before the expiration of the option. |
| • | | Barrier options — Certain Funds may purchase and write a variety of options with non-standard payout structures or other features (“barrier options”) that are generally traded OTC. |
| • | | The Funds may invest in various types of barrier options, including down-and-out options, down-and-in options, double no-touch options, one-touch options, up-and-out options and up-and-in options. Down-and-out options expire worthless to the purchaser if the price of the underlying instrument falls below a specific barrier price level prior to the expiration date. Down-and-in options expire worthless to the purchaser unless the price of the underlying instrument falls below a specific barrier price level prior to the expiration date. Double no-touch options provide the purchaser an agreed-upon payout if the price of the underlying instrument does not reach or surpass predetermined barrier price levels prior to the option’s expiration date. One-touch options provide the purchaser an agreed-upon payout if the price of the underlying instrument reaches or surpasses predetermined barrier price levels prior to the expiration date. Up-and-out options expire worthless to the purchaser if the price of the underlying instrument increases beyond a predetermined barrier price level prior to the expiration date. Up-and-in options can only be exercised when the price of the underlying instrument increases beyond a predetermined barrier price level. |
| • | | Structured options — Certain Funds invest in structured options to increase or decrease their exposure to an underlying index or group of securities (equity risk). |
These options may consist of single or multiple OTC options which are priced as a single instrument. They may only be exercised at the expiration date, but may be transferred/sold prior to the expiration date. The value of a structured option may either increase or decrease with the underlying index or group of securities, depending on the combination of options used. Structured options are issued in units whereby each unit represents a structure based on the specific index with an initial reference strike price. One type of structure involves the combination of selling a put while buying a call on a specific index. This option would rise in value as the underlying index increases and fall in value as the underlying index decreases. Alternatively, another structure involves the sale of a call and the purchase of a put. This option structure would rise in value as the underlying index decreases and fall in value as the underlying index increases. Upon the exercise of the structured option, the Funds will receive a payment from, or be required to remit a payment to, the counterparty depending on the value of the underlying index at exercise.
In purchasing and writing options, the Funds bear the risk of an unfavorable change in the value of the underlying instrument or the risk that they may not be able to enter into a closing transaction due to an illiquid market. Exercise of a written option could result in the Funds purchasing or selling a security when they otherwise would not, or at a price different from the current market value.
Swaps: Swap contracts are entered into to manage exposure to issuers, markets and securities. Such contracts are agreements between the Funds and a counterparty to make periodic net payments on a specified notional amount or a net payment upon termination. Swap agreements are privately negotiated in the OTC market and may be entered into as a bilateral contract (“OTC swaps”) or centrally cleared (“centrally cleared swaps”).
| | | | | | |
| 170 | | BLACKROCK SERIES FUND, INC. | | JUNE 30, 2017 | | |
| | | | |
| Notes to Financial Statements (continued) | | | | |
For OTC swaps, any upfront premiums paid and any upfront fees received are shown as swap premiums paid and swap premiums received, respectively, in the Statements of Assets and Liabilities and amortized over the term of the contract. The daily fluctuation in market value is recorded as unrealized appreciation (depreciation) on OTC Swaps in the Statements of Assets and Liabilities. Payments received or paid are recorded in the Statements of Operations as realized gains or losses, respectively. When an OTC swap is terminated, a realized gain or loss is recorded in the Statements of Operations equal to the difference between the proceeds from (or cost of) the closing transaction and the Funds’ basis in the contract, if any. Generally, the basis of the contract is the premium received or paid.
In a centrally cleared swap, immediately following execution of the swap contract, the swap contract is novated to a central counterparty (the “CCP”) and the Funds’ counterparty on the swap agreement becomes the CCP. The Funds are required to interface with the CCP through the broker. Upon entering into a centrally cleared swap, the Funds are required to deposit initial margin with the broker in the form of cash or securities in an amount that varies depending on the size and risk profile of the particular swap. Securities deposited as initial margin are designated in the Schedules of Investments and cash deposited is shown as cash pledged for centrally cleared swaps in the Statements of Assets and Liabilities. Pursuant to the contract, the Funds agree to receive from or pay to the broker variation margin. Variation margin is recorded as unrealized appreciation (depreciation) and shown as variation margin receivable (or payable) on centrally cleared swaps in the Statements of Assets and Liabilities. Payments received from (paid to) the counterparty, including at termination, are recorded as realized gains (losses) in the Statements of Operations.
| • | | Credit default swaps — Credit default swaps are entered into to manage their exposure to the market or certain sectors of the market, to reduce their risk exposure to defaults of corporate and/or sovereign issuers or to create exposure to corporate and/or sovereign issuers to which they are not otherwise exposed (credit risk). |
The Funds may either buy or sell (write) credit default swaps on single-name issuers (corporate or sovereign), a combination or basket of singlename issuers or traded indexes. Credit default swaps are agreements in which the protection buyer pays fixed periodic payments to the seller in consideration for a promise from the protection seller to make a specific payment should a negative credit event take place with respect to the referenced entity (e.g., bankruptcy, failure to pay, obligation acceleration, repudiation, moratorium or restructuring). As a buyer, if an underlying credit event occurs, the Funds will either (i) receive from the seller an amount equal to the notional amount of the swap and deliver the referenced security or underlying securities comprising the index, or (ii) receive a net settlement of cash equal to the notional amount of the swap less the recovery value of the security or underlying securities comprising the index. As a seller (writer), if an underlying credit event occurs, the Funds will either pay the buyer an amount equal to the notional amount of the swap and take delivery of the referenced security or underlying securities comprising the index or pay a net settlement of cash equal to the notional amount of the swap less the recovery value of the security or underlying securities comprising the index.
| • | | Total return swaps — Total return swaps are entered into to obtain exposure to a security or market without owning such security or investing directly in such market or to exchange the risk/return of one market (e.g., fixed-income) with another market (e.g., equity or commodity prices) (equity risk, commodity price risk and/or interest rate risk). |
Total return swaps are agreements in which there is an exchange of cash flows whereby one party commits to make payments based on the total return (distributions plus capital gains/losses) of an underlying instrument in exchange for fixed or floating rate interest payments. If the total return of the instrument or index underlying the transaction exceeds or falls short of the offsetting fixed or floating interest rate obligation, the Funds receive payment from or make a payment to the counterparty.
| • | | Interest rate swaps — Interest rate swaps are entered into to gain or reduce exposure to interest rates or to manage duration, the yield curve or interest rate (interest rate risk). |
Interest rate swaps are agreements in which one party pays a stream of interest payments, either fixed or floating, in exchange for another party’s stream of interest payments, either fixed or floating, on the same notional amount for a specified period of time. In more complex interest rate swaps, the notional principal amount may decline (or amortize) over time.
| • | | Currency swaps — Currency swaps are entered into to gain or reduce exposure to foreign currencies (foreign currency exchange rate risk). |
Currency swaps are interest rate swaps in which one party pays a stream of interest payments, either fixed or floating, in exchange for another party’s stream of interest payments, either fixed or floating, based on the notional amounts of two different currencies. The notional amounts are typically determined based on the spot exchange rates at the inception of the trade. Currency swaps may also involve an exchange of notional amounts at the start, during and/or at expiration of the contract, either at the current spot rate or another specified rate.
| | | | | | |
| | | BLACKROCK SERIES FUND, INC. | | JUNE 30, 2017 | | 171 |
| | | | |
| Notes to Financial Statements (continued) | | | | |
| • | | Forward swaps — Contracts entered into forward interest rate swaps and forward total return swaps. In a forward swap, each Fund and the counterparty agree to make periodic net payments beginning on a specified date or a net payment at termination. |
| • | | Interest rate floors — Interest rate floors are entered into to gain or reduce exposure to interest rates (interest rate risk and/or other risk). Floors are agreements whereby one party agrees to make payments to the other, in return for a premium, to the extent that interest rate indexes fall below a specified rate, or “floor.” The maximum potential amount of future payments that a Fund would be required to make under an interest rate cap would be the notional amount times the percentage increase in interest rates determined by the difference between the interest rate index current value and the value at the time the cap was entered into. |
Swap transactions involve, to varying degrees, elements of interest rate, credit and market risk in excess of the amounts recognized in the Statements of Assets and Liabilities. Such risks involve the possibility that there will be no liquid market for these agreements, that the counterparty to the agreements may default on its obligation to perform or disagree as to the meaning of the contractual terms in the agreements, and that there may be unfavorable changes in interest rates and/or market values associated with these transactions.
Master Netting Arrangements: In order to define their contractual rights and to secure rights that will help them mitigate their counterparty risk, the Funds may enter into an International Swaps and Derivatives Association, Inc. Master Agreement (“ISDA Master Agreement”) or similar agreement with their counterparties. An ISDA Master Agreement is a bilateral agreement between each Fund and a counterparty that governs certain OTC derivatives and typically contains, among other things, collateral posting terms and netting provisions in the event of a default and/or termination event. Under an ISDA Master Agreement, each Fund may, under certain circumstances, offset with the counterparty certain derivative financial instruments’ payables and/or receivables with collateral held and/or posted and create one single net payment. The provisions of the ISDA Master Agreement typically permit a single net payment in the event of default including the bankruptcy or insolvency of the counterparty. Bankruptcy or insolvency laws of a particular jurisdiction may restrict or prohibit the right of offset in bankruptcy, insolvency or other events. In addition, certain ISDA Master Agreements allow counterparties to terminate derivative contracts prior to maturity in the event the Funds’ net assets decline by a stated percentage or the Funds fail to meet the terms of their ISDA Master Agreements. The result would cause the Funds to accelerate payment of any net liability owed to the counterparty.
Collateral Requirements: For derivatives traded under an ISDA Master Agreement, the collateral requirements are typically calculated by netting the mark-to-market amount for each transaction under such agreement and comparing that amount to the value of any collateral currently pledged by the Fund and the counterparty.
Cash collateral that has been pledged to cover obligations of the Funds and cash collateral received from the counterparty, if any, is reported separately on the Statements of Assets and Liabilities as cash pledged as collateral and cash received as collateral, respectively. Non-cash collateral pledged by the Funds, if any, is noted in the Schedules of Investments. Generally, the amount of collateral due from or to a counterparty is subject to a certain minimum transfer amount threshold before a transfer is required, which is determined at the close of business of the Funds. Any additional required collateral is delivered to/pledged by the Funds on the next business day. Typically, the counterparty is not permitted to sell, re-pledge or use cash and non-cash collateral it receives. A Fund generally agrees not to use non-cash collateral that it receives but may, absent default or certain other circumstances defined in the underlying ISDA Master Agreement, be permitted to use cash collateral received. In such cases, interest may be paid pursuant to the collateral arrangement with the counterparty. To the extent amounts due to the Funds from their counterparties are not fully collateralized, they bear the risk of loss from counterparty non-performance. Likewise, to the extent the Funds have delivered collateral to a counterparty and stand ready to perform under the terms of their agreement with such counterparty, they bear the risk of loss from a counterparty in the amount of the value of the collateral in the event the counterparty fails to return such collateral. Based on the terms of agreements, collateral may not be required for all derivative contracts.
For financial reporting purposes, the Funds do not offset derivative assets and derivative liabilities that are subject to netting arrangements, if any, in the Statements of Assets and Liabilities.
6. Investment Advisory Agreements and Other Transactions with Affiliates:
The PNC Financial Services Group, Inc. is the largest stockholder and an affiliate of BlackRock, Inc. (“BlackRock”) for 1940 Act purposes.
Investment Advisory: The Company, on behalf of each Fund, entered into an Investment Advisory Agreement with the Manager, the Funds’ investment adviser, an indirect, wholly-owned subsidiary of BlackRock, to provide investment advisory and administrative services. The Manager is responsible for the management of each Fund’s portfolio and provides the personnel, facilities, equipment and certain other services necessary to the operations of each Fund.
| | | | | | |
| 172 | | BLACKROCK SERIES FUND, INC. | | JUNE 30, 2017 | | |
| | | | |
| Notes to Financial Statements (continued) | | | | |
For such services, each Fund pays the Manager a monthly fee based on the percentage of the eight combined Funds’ average daily net assets at the following annual rates:
| | | | |
Average Daily Net Assets of the
Eight Combined Funds | | Investment
Advisory Fee | |
First $250 Million | | | 0.50 | % |
$250 Million - $300 Million | | | 0.45 | % |
$300 Million - $400 Million | | | 0.40 | % |
$400 Million - $800 Million | | | 0.35 | % |
Greater than $800 Million | | | 0.30 | % |
The portion of the assets of a Fund to which the rate of each breakpoint level applies will be determined on a “uniform percentage” basis. The uniform percentage applicable to a breakpoint level is determined by dividing the amount of the aggregate average daily net assets of the eight combined Funds that falls within that breakpoint level by the aggregate average daily net assets of the eight combined Funds. The amount of the fee for a Fund at each breakpoint level is determined by multiplying the average net assets of that Fund by the uniform percentage applicable to that breakpoint level and multiplying the product by the applicable advisory fee rate.
The Manager provides investment management and other services to the Subsidiary of Global Allocation. The Manager does not receive separate compensation from the Subsidiary for providing investment management or administrative services. However, Global Allocation pays the Manager based on the Fund’s net assets, plus the proceeds of any debt securities or outstanding borrowings used for leverage, which includes the assets of the Subsidiary.
Distribution Fees: The Company, on behalf of the Funds, entered into a Distribution Agreement and a Distribution Plan with BlackRock Investments, LLC (“BRIL”), an affiliate of the Manager.
Transfer Agent: On behalf of the Funds, the Manager entered into agreements with insurance companies and other financial intermediaries (“Service Organizations”), some of which may be affiliates. Pursuant to these agreements, the Service Organizations provide the Funds with administrative, networking, recordkeeping, sub-transfer agency and shareholder services to sub-accounts they service. For these services, the Service Organizations receive an annual fee per shareholder account, which will vary depending on share class and/or net assets of Fund shareholders serviced by the Service Organizations. For the six months ended June 30, 2017, the Funds did not pay any amounts to affiliates in return for these services.
Expense Limitations, Waivers and Reimbursements: With respect to each Fund, the Manager voluntarily agreed to waive its investment advisory fees by the amount of investment advisory fees each Fund pays to the Manager indirectly through its investment in affiliated money market funds (the “affiliated money market fund waiver”). These amounts are included in fees waived by the Manager in the Statements of Operations. The amount of waivers and/or reimbursements of fees and expenses made pursuant to the expense limitation caps, as applicable, will be reduced by the amount of the affiliated money market fund waiver. However, the Manager does not waive its investment advisory fees by the amount of investment advisory fees paid in connection with the Government Money Market Fund’s investments in other affiliated investment companies, if any. For the six months ended June 30, 2017, the amounts waived were as follows:
| | | | | | | | | | | | |
Advantage Large
Cap Core | | Balanced
Capital | | Capital
Appreciation | | Global
Allocation | | High
Yield | | Total
Return | | U.S.
Government
Bond |
$1,847 | | $7,263 | | $318 | | $1,454 | | $350 | | $192 | | $377 |
BlackRock has voluntarily agreed to waive the management fee with respect to any portion of each Fund’s assets (other than the Government Money Market) estimated to be attributable to investments in other equity and fixed-income mutual funds and exchange-traded funds managed by BlackRock or its affiliates that have a contractual management fee. Effective May 1, 2017, the waiver became contractual through April 30, 2018. Effective June 12, 2017, for Advantage Large Cap Core, the contractual waiver was extended through April 30, 2019. The contractual agreement may be terminated upon 90 days’ notice by a majority of the non-interested directors of the Company or by a vote of a majority of the outstanding voting securities of the Fund. For the six months ended June 30, 2017, the amounts waived in investment advisory fees pursuant to these arrangements were as follows:
| | | | |
Balanced Capital | | Global Allocation | | High Yield |
$12,010 | | $3,271 | | $1 |
| | | | | | |
| | | BLACKROCK SERIES FUND, INC. | | JUNE 30, 2017 | | 173 |
| | | | |
| Notes to Financial Statements (continued) | | | | |
For the six months ended June 30, 2017, the Funds reimbursed the Manager for certain accounting services, which are included in accounting services in the Statements of Operations. The reimbursements were as follows:
| | | | | | | | | | | | | | |
Advantage Large Cap Core | | Balanced Capital | | Capital Appreciation | | Global Allocation | | Government Money Market | | High Yield | | Total Return | | U.S. Government Bond |
$889 | | $2,677 | | $815 | | $1,183 | | $643 | | $189 | | $336 | | $363 |
The Manager has contractually agreed to reimburse transfer agent fees in order to limit such expenses as a percentage of average daily net assets as follows:
| | | | | | | | | | | | | | |
Advantage Large Cap Core | | Balanced Capital | | Capital Appreciation | | Global Allocation | | Government Money Market | | High Yield | | Total Return | | U.S. Government Bond |
0.04% | | 0.04% | | 0.04% | | 0.04% | | 0.02% | | 0.05% | | 0.05% | | 0.05% |
The Manager has agreed not to reduce or discontinue this contractual expense limitation prior to April 30, 2018 for each fund except Advantage Large Cap Core. The contractual cap for Advantage Large Cap Core is in effect through April 30, 2019. The contractual agreement may be terminated, with respect to each Fund, upon 90 days’ notice by a majority of the non-interested directors of the Company or by a vote of a majority of the outstanding voting securities of the Fund.
For the six months ended June 30, 2017, the following amounts are included in transfer agent fees reimbursed in the Statements of Operations:
| | | | | | | | | | | | | | |
Advantage Large Cap Core | | Balanced Capital | | Capital Appreciation | | Global Allocation | | Government Money Market | | High Yield | | Total Return | | U.S. Government Bond |
$87,342 | | $246,851 | | $69,914 | | $146,822 | | $107,836 | | $23,253 | | $38,354 | | $41,480 |
With respect to each Fund, the Manager contractually agreed to waive and/or reimburse fees or expenses in order to limit expenses, excluding interest expense, dividend expense, tax expense, acquired fund fees and expenses, and certain other fund expenses, which constitute extraordinary expenses not incurred in the ordinary course of each Fund’s business (“expense limitation”). The expense limitations as a percentage of average daily net assets are as follows:
| | | | | | | | | | | | | | |
Advantage Large Cap Core | | Balanced Capital | | Capital Appreciation | | Global Allocation | | Government Money Market | | High Yield | | Total Return | | U.S. Government Bond |
0.50% | | 0.50% | | 0.57% | | 0.57% | | 0.50% | | 0.50% | | 0.50% | | 0.50% |
The Manager has agreed not to reduce or discontinue these contractual expense limitations through April 30, 2018 for each fund except Advantage Large Cap Core. The contractual cap for Advantage Large Cap Core is in effect through April 30, 2019. The contractual agreement may be terminated, with respect to each Fund, upon 90 days’ notice by a majority of the non-interested directors of the Company or by a vote of a majority of the outstanding voting securities of the Fund.
The following Funds had waivers that are included in fees waived by the Manager in the Statements of Operations. For the six months ended June 30, 2017, the amounts were as follows:
| | | | | | | | | | | | | | | | | | | | |
| | | Advantage Large Cap Core | | | Global Allocation | | | High Yield | | | Total Return | | | U.S. Government Bond | |
Fees Waived by Manager | | $ | 1,781 | | | $ | 99,544 | | | $ | 59,565 | | | $ | 94,849 | | | $ | 71,157 | |
In addition, the following funds had expense reimbursements that are included in other expenses reimbursed in the Statements of Operations. For the six months ended June 30, 2017, the amounts reimbursement were as follows:
| | | | | | | | |
| | | Advantage
Large Cap
Core | | | Total
Return | |
Other Expenses Reimbursed | | $ | 2,582 | | | $ | 1,463 | |
The Manager and BRIL voluntarily agreed to waive a portion of their respective management and service and distribution fees and/or reimburse operating expenses to enable Government Money Market to maintain minimum levels of daily net investment income. For the six months ended June 30, 2017, there were no fees waived and/or reimbursed by the Manager. However, the Manager does not waive its investment advisory fees by the amount
| | | | | | |
| 174 | | BLACKROCK SERIES FUND, INC. | | JUNE 30, 2017 | | |
| | | | |
| Notes to Financial Statements (continued) | | | | |
of investment advisory fees paid in connection with the Fund’s investments in other affiliated investment companies, if any. The Manager and BRIL may discontinue the waiver or reimbursement at any time.
Securities Lending: The SEC has issued an exemptive order which permits BIM, an affiliate of the Manager, to serve as securities lending agent for the Funds, subject to applicable conditions. As securities lending agent, BIM bears all operational costs directly related to securities lending. The Funds are responsible for expenses in connection with the investment of cash collateral received for securities on loan (the “collateral investment expenses”). The cash collateral is invested in a private investment company managed by the Manager or its affiliates. However, BIM has agreed to cap the collateral investment expenses of the private investment company to an annual rate of 0.04%. The investment adviser to the private investment company will not charge any advisory fees with respect to shares purchased by the Funds. The private investment company in which the cash collateral has been invested may, under certain circumstances, impose a liquidity fee of up to 2% on the value redeemed or temporarily restrict redemptions for up to 10 business days during a 90 day period, in the event that the private investment company’s weekly liquid assets fall below certain thresholds.
Securities lending income is equal to the total of income earned from the reinvestment of cash collateral, net of fees and other payments to and from borrowers of securities, and less the collateral investment expenses. Each Fund retains a portion of securities lending income and remits a remaining portion to BIM as compensation for its services as securities lending agent.
Pursuant to a securities lending agreement, Advantage Large Cap Core, Balanced Capital and Capital Appreciation retain 71.5% of securities lending income, and this amount retained can never be less than 65% of the total of securities lending income plus the collateral investment expenses. In addition, commencing the business day following the date that the aggregate securities lending income earned across the Equity-Bond Complex in a calendar year exceeds a specified threshold, Advantage Large Cap Core, Balanced Capital and Capital Appreciation, pursuant to the securities lending agreement, will retain for the remainder of that calendar year securities lending income as follows: 75% of securities lending income, and this amount retained can never be less than 65% of the total of securities lending income plus the collateral investment expenses.
Pursuant to a securities lending agreement, Global Allocation retains 80% of securities lending income, and this amount retained can never be less than 70% of the total of securities lending income plus the collateral investment expenses. In addition, commencing the business day following the date that the aggregate securities lending income earned across the Equity-Bond Complex in a calendar year exceeds a specified threshold, Global Allocation, pursuant to the securities lending agreement, will retain for the remainder of that calendar year securities lending income as follows: 85% of securities lending income, and this amount retained can never be less than 70% of the total of securities lending income plus the collateral investment expenses.
The share of securities lending income earned by each Fund is shown as securities lending income — affiliated — net in the Statements of Operations. For the six months ended June 30, 2017, each Fund paid BIM the following amounts for securities lending agent services:
| | | | | | |
Advantage Large Cap Core | | Balanced Capital | | Capital Appreciation | | Global Allocation |
$3,543 | | $6,394 | | $12,972 | | $5,604 |
Interfund Lending: In accordance with an exemptive order (the “Order”) from the SEC, each Fund may participate in a joint lending and borrowing facility for temporary purposes (the “Interfund Lending Program”), subject to compliance with the terms and conditions of the Order, and to the extent permitted by each Fund’s investment policies and restrictions. Each Fund is currently permitted to borrow and lend under the Interfund Lending Program.
A lending BlackRock fund may lend in aggregate up to 15% of its net assets, but may not lend more than 5% of its net assets to any one borrowing fund through the Interfund Lending Program. A borrowing BlackRock fund may not borrow through the Interfund Lending Program or from any other source more than 33 1/3% of its total assets (or any lower threshold provided for by the fund’s investment restrictions). If a borrowing BlackRock fund’s total outstanding borrowings exceed 10% of its total assets, each of its outstanding interfund loans will be subject to collateralization of at least 102% of the outstanding principal value of the loan. All interfund loans are for temporary or emergency purposes and the interest rate to be charged will be the average of the highest current overnight repurchase agreement rate available to a lending fund and the bank loan rate, as calculated according to a formula established by the Board.
During the six months ended June 30, 2017, the Funds did not participate in the Interfund Lending Program.
Officers and Directors: Certain officers and/or directors of the Company are officers and/or directors of BlackRock or its affiliates. The Funds reimburse the Manager for a portion of the compensation paid to the Company’s Chief Compliance Officer, which is included in Officer and Directors in the Statements of Operations.
| | | | | | |
| | | BLACKROCK SERIES FUND, INC. | | JUNE 30, 2017 | | 175 |
| | | | |
| Notes to Financial Statements (continued) | | | | |
Other Transactions: The Funds may purchase securities from, or sell securities to, an affiliated fund provided the affiliation is due solely to having a common investment adviser, common officers, or common directors. For the six months ended June 30, 2017, the purchase and sale transactions and any net realized gains (losses) with affiliated funds in compliance with Rule 17a-7 of the 1940 Act were as follows:
| | | | | | | | | | | | |
| | | Purchases | | | Sales | | | Net Realized
Gain | |
Advantage Large Cap Core | | $ | 6,321,602 | | | $ | 18,438,663 | | | $ | 5,642,506 | |
Balanced Capital | | $ | 10,276,895 | | | $ | 33,192,337 | | | $ | 9,730,183 | |
Capital Appreciation | | | — | | | $ | 255,455 | | | $ | 56,974 | |
Global Allocation | | $ | 155,808 | | | | — | | | | — | |
Total Return | | $ | 110,962 | | | $ | 13,906 | | | $ | 640 | |
7. Purchases and Sales:
For the six months ended June 30, 2017, purchases and sales of investments, including mortgage dollar rolls and excluding short-term securities, were as follows:
| | | | | | | | | | | | | | | | | | | | | | | | | | | | |
| Purchases | | | | | | | | | | | | | | | | | | | | | |
| | | Advantage
Large
Cap Core | | | Balanced
Capital | | | Capital
Appreciation | | | Global
Allocation | | | High
Yield | | | Total
Return | | | U.S.
Government
Bond | |
Non-U.S. Government Securities | | $ | 152,399,644 | | | $ | 766,383,799 | | | $ | 39,644,181 | | | $ | 42,025,164 | | | $ | 13,960,303 | | | $ | 162,753,789 | | | $ | 257,622,612 | |
U.S. Government Securities | | | — | | | | 70,286,073 | | | | — | | | | 68,391,788 | | | | — | | | | 32,495,293 | | | | 84,012,690 | |
| | | | |
Total Purchases | | $ | 152,399,644 | | | $ | 836,669,872 | | | $ | 39,644,181 | | | $ | 110,416,952 | | | $ | 13,960,303 | | | $ | 195,249,082 | | | $ | 341,635,302 | |
| | | | |
| | | | | | | |
| | | | | | | | | | | | | | | | | | | | | | | | | | | | | |
| Sales | | | | | | | | | | | | | | | | | | | | | |
| | | Advantage
Large
Cap Core | | | Balanced
Capital | | | Capital
Appreciation | | | Global
Allocation | | | High
Yield | | | Total
Return | | | U.S.
Government
Bond | |
Non-U.S. Government | | | | | | | | | | | | | | | | | | | | | | | | | | | | |
Securities (includes paydowns) | | $ | 155,293,986 | | | $ | 802,779,204 | | | $ | 45,366,674 | | | $ | 56,667,792 | | | $ | 15,192,254 | | | $ | 169,759,511 | | | $ | 276,483,233 | |
U.S. Government Securities | | | — | | | | 75,452,445 | | | | — | | | | 54,944,736 | | | | — | | | | 36,833,792 | | | | 84,139,878 | |
| | | | |
Total Sales | | $ | 155,293,986 | | | $ | 878,231,649 | | | $ | 45,366,674 | | | $ | 111,612,528 | | | $ | 15,192,254 | | | $ | 206,593,303 | | | $ | 360,623,111 | |
| | | | |
| | | | | | | |
| | | | | | | | | | | | | | | | | | | | | | | | | | | | | |
| Purchases and Sales - MDRs | | | | | | | | | | | | | | Balanced
Capital | | | Total Return | | | U.S.
Government
Bond | |
Purchases | | | | | | | | | | | | | | | | | | $ | 200,509,740 | | | $ | 66,418,543 | | | $ | 119,650,184 | |
Sales | | | | | | | | | | | | | | | | | | $ | 200,492,445 | | | $ | 66,411,197 | | | $ | 119,698,413 | |
8. Income Tax Information:
It is each Fund’s policy to comply with the requirements of the Internal Revenue Code of 1986, as amended, applicable to regulated investment companies, and to distribute substantially all of its taxable income to its shareholders. Therefore, no U.S. federal income tax provision is required.
Each Fund files U.S. federal and various state and local tax returns. No income tax returns are currently under examination. The statute of limitations on each Fund’s U.S. federal tax returns generally remains open for each of the four years ended December 31, 2016. The statutes of limitations on each Fund’s state and local tax returns may remain open for an additional year depending upon the jurisdiction.
Management has analyzed tax laws and regulations and their application to the Funds as of June 30, 2017, inclusive of the open tax return years, and does not believe that there are any uncertain tax positions that require recognition of a tax liability in the Funds’ financial statements.
| | | | | | |
| 176 | | BLACKROCK SERIES FUND, INC. | | JUNE 30, 2017 | | |
| | | | |
| Notes to Financial Statements (continued) | | | | |
As of December 31, 2016, the following Funds had capital loss carryforwards available to offset future realized capital gains through the indicated expiration dates as follows:
| | | | | | | | | | | | | | | | |
| Expires December 31, | | Global
Allocation | | | High
Yield | | | Total
Return | | | U.S.
Government
Bond | |
No expiration date1 | | $ | 4,147,012 | | | $ | 2,526,746 | | | | — | | | $ | 1,368,130 | |
2017 | | | — | | | | 3,081,614 | | | $ | 2,918,439 | | | | — | |
| | | | |
Total | | $ | 4,147,012 | | | $ | 5,608,360 | | | $ | 2,918,439 | | | $ | 1,899,590 | |
| | | | |
| | | | | | | | | | | | | | | | | |
| | 1 | | Must be utilized prior to losses subject to expiration. |
As of June 30, 2017, gross unrealized appreciation and depreciation based on cost for federal income tax purposes were as follows:
| | | | | | | | | | | | | | | | |
| | | Advantage
Large Cap
Core | | | Balanced
Capital | | | Capital
Appreciation | | | Global
Allocation | |
Tax cost | | $ | 177,007,648 | | | $ | 532,762,775 | | | $ | 130,208,531 | | | $ | 205,485,289 | |
| | | | |
Gross unrealized appreciation | | $ | 14,007,320 | | | $ | 23,941,387 | | | $ | 36,461,767 | | | $ | 17,828,607 | |
Gross unrealized depreciation | | | (2,086,370 | ) | | | (5,043,223 | ) | | | (1,102,040 | ) | | | (7,511,577 | ) |
| | | | |
Net unrealized appreciation | | $ | 11,920,950 | | | $ | 18,898,164 | | | $ | 35,359,727 | | | $ | 10,317,030 | |
| | | | |
| | | | | | | | | | | | |
| | | High
Yield | | | Total
Return | | | U.S.
Government
Bond | |
Tax cost | | $ | 32,732,810 | | | $ | 69,999,366 | | | $ | 78,998,965 | |
| | | | |
Gross unrealized appreciation | | $ | 1,036,679 | | | $ | 569,359 | | | $ | 222,125 | |
Gross unrealized depreciation | | | (484,436 | ) | | | (330,075 | ) | | | (287,175 | ) |
| | | | |
Net unrealized appreciation (depreciation) | | $ | 552,243 | | | $ | 239,284 | | | $ | (65,050 | ) |
| | | | |
9. Bank Borrowings:
The Company, on behalf of the Funds (except for Government Money Market), along with certain other funds managed by the Manager and its affiliates (“Participating Funds”), is a party to a 364-day, $2.1 billion credit agreement with a group of lenders. Under this agreement, the Funds may borrow to fund shareholder redemptions. Excluding commitments designated for certain individual funds, the Participating Funds, including the Funds, can borrow up to an aggregate commitment amount of $1.6 billion at any time outstanding, subject to asset coverage and other limitations as specified in the agreement. The credit agreement has the following terms: a fee of 0.12% per annum on unused commitment amounts and interest at a rate equal to the higher of (a) one-month LIBOR (but, in any event, not less than 0.00%) on the date the loan is made plus 0.80% per annum or (b) the Fed Funds rate (but, in any event, not less than 0.00%) in effect from time to time plus 0.80% per annum on amounts borrowed. The agreement expires in April 2018 unless extended or renewed. Participating Funds paid administration, legal and arrangement fees, which, if applicable, are included in miscellaneous expenses in the Statements of Operations. These fees were allocated among such funds based upon portions of the aggregate commitment available to them and relative net assets of Participating Funds. During the six months ended June 30, 2017, the Funds did not borrow under the credit agreement.
10. Principal Risks:
Many municipalities insure repayment of their bonds, which may reduce the potential for loss due to credit risk. The market value of these bonds may fluctuate for other reasons, including market perception of the value of such insurance, and there is no guarantee that the insurer will meet its obligation.
Inventories of municipal bonds held by brokers and dealers may decrease, which would lessen their ability to make a market in these securities. Such a reduction in market making capacity could potentially decrease a Fund’s ability to buy or sell bonds. As a result, a Fund may sell a security at a lower price, sell other securities to raise cash, or give up an investment opportunity, any of which could have a negative impact on performance. If a Fund needed to sell large blocks of bonds, those sales could further reduce the bonds’ prices and impact performance.
In the normal course of business, certain Funds invest in securities and enter into transactions where risks exist due to fluctuations in the market (market risk) or failure of the issuer to meet all its obligations, including the ability to pay principal and interest when due (issuer credit risk). The value of securities held by the Funds may decline in response to certain events, including those directly involving the issuers of securities owned by the Funds. Changes arising from the general economy, the overall market and local, regional or global political and/or social instability, as well as currency, interest rate and price fluctuations, may also affect the securities’ value.
| | | | | | |
| | | BLACKROCK SERIES FUND, INC. | | JUNE 30, 2017 | | 177 |
| | | | |
| Notes to Financial Statements (continued) | | | | |
Each Fund may be exposed to prepayment risk, which is the risk that borrowers may exercise their option to prepay principal earlier than scheduled during periods of declining interest rates, which would force each Fund to reinvest in lower yielding securities. Each Fund may also be exposed to reinvestment risk, which is the risk that income from each Fund’s portfolio will decline if each Fund invests the proceeds from matured, traded or called fixed-income securities at market interest rates that are below each Fund portfolio’s current earnings rate.
Certain obligations held by Government Money Market have a credit enhancement or liquidity feature that may, under certain circumstances, provide for repayment of principal and interest on the obligation when due. These enhancements, which may include letters of credit, stand-by bond purchase agreements and/or third party insurance, are issued by financial institutions. The value of the obligations may be affected by changes in creditworthiness of the entities that provide the credit enhancements or liquidity features. Government Money Market monitors its exposure by reviewing the creditworthiness of the issuers, as well as the financial institutions issuing the credit enhancements and by limiting the amount of holdings with credit enhancements from one financial institution.
On October 11, 2016, BlackRock implemented certain changes required by amendments to Rule 2a-7 under the 1940 Act, which governs the operations of U.S. money market funds. The Funds may be exposed to additional risks when reinvesting cash collateral in money market funds that do not seek to maintain a stable NAV per share of $1.00 and which may be subject to redemption gates or liquidity fees under certain circumstances.
Valuation Risk: The market values of equities, such as common stocks and preferred securities or equity related investments, such as futures and options, may decline due to general market conditions which are not specifically related to a particular company. They may also decline due to factors which affect a particular industry or industries. A Fund may invest in illiquid investments and may experience difficulty in selling those investments in a timely manner at the price that it believes the investments are worth. Prices may fluctuate widely over short or extended periods in response to company, market or economic news. Markets also tend to move in cycles, with periods of rising and falling prices. This volatility may cause each Fund’s NAV to experience significant increases or decreases over short periods of time. If there is a general decline in the securities and other markets, the NAV of a Fund may lose value, regardless of the individual results of the securities and other instruments in which a Fund invests.
The price a Fund could receive upon the sale of any particular portfolio investment may differ from a Fund’s valuation of the investment, particularly for securities that trade in thin or volatile markets or that are valued using a fair valuation technique or a price provided by an independent pricing service. Changes to significant unobservable inputs and assumptions (i.e., publicly traded company multiples, growth rate, time to exit) due to the lack of observable inputs may significantly impact the resulting fair value and therefore a Fund’s results of operations. As a result, the price received upon the sale of an investment may be less than the value ascribed by a Fund, and a Fund could realize a greater than expected loss or lesser than expected gain upon the sale of the investment. A Fund’s ability to value its investments may also be impacted by technological issues and/or errors by pricing services or other third party service providers.
Counterparty Credit Risk: Similar to issuer credit risk, the Funds may be exposed to counterparty credit risk, or the risk that an entity may fail to or be unable to perform on its commitments related to unsettled or open transactions. The Funds manage counterparty credit risk by entering into transactions only with counterparties that the Manager believes have the financial resources to honor their obligations and by monitoring the financial stability of those counterparties. Financial assets, which potentially expose the Funds to market, issuer and counterparty credit risks, consist principally of financial instruments and receivables due from counterparties. The extent of the Funds’ exposure to market, issuer and counterparty credit risks with respect to these financial assets is approximately their value recorded in the Statements of Assets and Liabilities, less any collateral held by the Funds.
A derivative contract may suffer a mark-to-market loss if the value of the contract decreases due to an unfavorable change in the market rates or values of the underlying instrument. Losses can also occur if the counterparty does not perform under the contract.
A Fund’s risk of loss from counterparty credit risk on OTC derivatives is generally limited to the aggregate unrealized gain less the value of any collateral held by such Fund.
For OTC options purchased, each Fund bears the risk of loss in the amount of the premiums paid plus the positive change in market values net of any collateral held by the Funds should the counterparty fail to perform under the contracts. Options written by the Funds do not typically give rise to counterparty credit risk, as options written generally obligate the Funds, and not the counterparty, to perform. The Funds may be exposed to counterparty credit risk with respect to options written to the extent the Funds deposit collateral with their counterparty to a written option.
With exchange-traded options purchased and futures and centrally cleared swaps, there is less counterparty credit risk to the Funds since the exchange or clearinghouse, as counterparty to such instruments, guarantees against a possible default. The clearinghouse stands between the buyer and the seller of the contract; therefore, credit risk is limited to failure of the clearinghouse. While offset rights may exist under applicable law, a Fund does not have a contractual right of offset against a clearing broker or clearinghouse in the event of a default (including the bankruptcy or insolvency). Additionally, credit risk exists in exchange-traded futures and centrally cleared swaps with respect to initial and variation margin that is held in a clearing broker’s customer accounts. While clearing brokers are required to segregate customer margin from their own assets, in the event that a clearing
| | | | | | |
| 178 | | BLACKROCK SERIES FUND, INC. | | JUNE 30, 2017 | | |
| | | | |
| Notes to Financial Statements (continued) | | | | |
broker becomes insolvent or goes into bankruptcy and at that time there is a shortfall in the aggregate amount of margin held by the clearing broker for all its clients, typically the shortfall would be allocated on a pro rata basis across all the clearing broker’s customers, potentially resulting in losses to the Funds.
Concentration Risk: As of period end, Advantage Large Cap Core and Capital Appreciation invested a significant portion of their assets in securities in the Information Technology sector. Changes in economic conditions affecting such sector would have a greater impact on a Fund and could affect the value, income and/or liquidity of positions in such securities.
Certain Funds may invest in securities that are rated below investment grade quality (sometimes called “junk bonds”), which are predominantly speculative, have greater credit risk and generally are less liquid and have more volatile prices than higher quality securities.
Certain Funds invest a significant portion of their assets in fixed-income securities and/or use derivatives tied to the fixed-income markets. Changes in market interest rates or economic conditions may affect the value and/or liquidity of such investments. Interest rate risk is the risk that prices of bonds and other fixed-income securities will increase as interest rates fall and decrease as interest rates rise. The Funds may be subject to a greater risk of rising interest rates due to the current period of historically low rates.
Global Allocation invests a significant portion of its assets in securities of issuers located in Europe or with significant exposure to European issuers or countries. The European financial markets have recently experienced volatility and adverse trends due to concerns about economic downturns in, or rising government debt levels of, several European countries. These events may spread to other countries in Europe and may affect the value and liquidity of certain of the Fund’s investments.
The United Kingdom voted on June 23, 2016 to withdraw from the European Union, which may introduce significant new uncertainties and instability in the financial markets across Europe.
Certain Funds invest a significant portion of their assets in securities backed by commercial or residential mortgage loans or in issuers that hold mortgage and other asset-backed securities. Investment percentages in these securities are presented in the Schedules of Investments. Changes in economic conditions, including delinquencies and/or defaults on assets underlying these securities, can affect the value, income and/or liquidity of such positions.
11. Capital Share Transactions:
Transactions in capital shares were as follows:
| | | | | | | | | | | | | | | | | | | | |
| | | Six Months Ended
June 30, 2017 | | | | | | Year Ended
December 31, 2016 | |
| Advantage Large Cap Core | | Shares | | | Amount | | | | | | Shares | | | Amount | |
Shares sold | | | 41,493 | | | $ | 1,195,598 | | | | | | | | 62,426 | | | $ | 1,687,050 | |
Shares issued in reinvestment of distributions. | | | — | | | | — | | | | | | | | 470,523 | | | | 12,915,606 | |
Shares redeemed | | | (314,953 | ) | | | (9,106,751 | ) | | | | | | | (721,835 | ) | | | (19,018,684 | ) |
| | | | | | | | | | | | |
Net decrease | | | (273,460 | ) | | $ | (7,911,153 | ) | | | | | | | (188,886 | ) | | $ | (4,416,028 | ) |
| | | | | | | | | | | | |
| | | | | | | | | | | | | | | | | | | | |
Balanced Capital | | | | | | | | | | | | | | | | | | | | |
Shares sold | | | 40,478 | | | $ | 709,491 | | | | | | | | 176,003 | | | $ | 2,945,318 | |
Shares issued in reinvestment of distributions. | | | — | | | | — | | | | | | | | 2,118,248 | | | | 35,998,538 | |
Shares redeemed | | | (1,383,156 | ) | | | (24,387,191 | ) | | | | | | | (3,056,344 | ) | | | (51,644,261 | ) |
| | | | | | | | | | | | |
Net decrease | | | (1,342,678 | ) | | $ | (23,677,700 | ) | | | | | | | (762,093 | ) | | $ | (12,700,405 | ) |
| | | | | | | | | | | | |
| | | | | | | | | | | | | | | | | | | | |
Capital Appreciation | | | | | | | | | | | | | | | | | | | | |
Shares sold | | | 50,527 | | | $ | 1,879,350 | | | | | | | | 72,552 | | | $ | 2,401,843 | |
Shares issued in reinvestment of distributions. | | | — | | | | — | | | | | | | | 105,814 | | | | 3,573,075 | |
Shares redeemed | | | (222,279 | ) | | | (8,267,948 | ) | | | | | | | (608,686 | ) | | | (20,318,909 | ) |
| | | | | | | | | | | | |
Net decrease | | | (171,752 | ) | | $ | (6,388,598 | ) | | | | | | | (430,320 | ) | | $ | (14,343,991 | ) |
| | | | | | | | | | | | |
| | | | | | |
| | | BLACKROCK SERIES FUND, INC. | | JUNE 30, 2017 | | 179 |
| | | | |
| Notes to Financial Statements (concluded) | | | | |
| | | | | | | | | | | | | | | | | | | | |
| | | Six Months Ended
June 30, 2017 | | | | | | Year Ended
December 31, 2016 | |
| Global Allocation | | Shares | | | Amount | | | | | | Shares | | | Amount | |
Shares sold | | | 101,510 | | | $ | 1,553,772 | | | | | | | | 148,875 | | | $ | 2,143,612 | |
Shares issued in reinvestment of distributions. | | | — | | | | — | | | | | | | | 233,630 | | | | 3,425,008 | |
Shares redeemed | | | (815,780 | ) | | | (12,475,981 | ) | | | | | | | (2,354,671 | ) | | | (33,857,509 | ) |
| | | | | | | | | | | | |
Net decrease | | | (714,270 | ) | | $ | (10,922,209 | ) | | | | | | | (1,972,166 | ) | | $ | (28,288,889 | ) |
| | | | | | | | | | | | |
| | | | | | | | | | | | | | | | | | | | |
Government Money Market | | | | | | | | | | | | | | | | | | | | |
Shares sold | | | 25,308,648 | | | $ | 25,308,648 | | | | | | | | 77,420,244 | | | $ | 77,420,244 | |
Shares issued in reinvestment of distributions. | | | 155,695 | | | | 155,695 | | | | | | | | 4,438 | | | | 4,438 | |
Shares redeemed | | | (33,736,379 | ) | | | (33,736,379 | ) | | | | | | | (81,007,595 | ) | | | (81,007,595 | ) |
| | | | | | | | | | | | |
Net decrease | | | (8,272,036 | ) | | $ | (8,272,036 | ) | | | | | | | (3,582,913 | ) | | $ | (3,582,913 | ) |
| | | | | | | | | | | | |
| | | | | | | | | | | | | | | | | | | | |
High Yield | | | | | | | | | | | | | | | | | | | | |
Shares sold | | | 237,348 | | | $ | 1,274,579 | | | | | | | | 1,010,801 | | | $ | 5,165,372 | |
Shares issued in reinvestment of distributions. | | | 182,121 | | | | 980,751 | | | | | | | | 369,169 | | | | 1,880,450 | |
Shares redeemed | | | (605,049 | ) | | | (3,245,780 | ) | | | | | | | (1,489,676 | ) | | | (7,635,454 | ) |
| | | | | | | | | | | | |
Net decrease | | | (185,580 | ) | | $ | (990,450 | ) | | | | | | | (109,706 | ) | | $ | (589,632 | ) |
| | | | | | | | | | | | |
| | | | | | | | | | | | | | | | | | | | |
Total Return | | | | | | | | | | | | | | | | | | | | |
Shares sold | | | 54,358 | | | $ | 631,073 | | | | | | | | 299,460 | | | $ | 3,523,264 | |
Shares issued in reinvestment of distributions. | | | 63,481 | | | | 736,994 | | | | | | | | 127,400 | | | | 1,497,549 | |
Shares redeemed | | | (421,352 | ) | | | (4,908,765 | ) | | | | | | | (849,198 | ) | | | (9,959,828 | ) |
| | | | | | | | | | | | |
Net decrease | | | (303,513 | ) | | $ | (3,540,698 | ) | | | | | | | (422,338 | ) | | $ | (4,939,015 | ) |
| | | | | | | | | | | | |
| | | | | | | | | | | | | | | | | | | | |
U.S. Government Bond | | | | | | | | | | | | | | | | | | | | |
Shares sold | | | 102,006 | | | $ | 1,109,610 | | | | | | | | 285,061 | | | $ | 3,170,627 | |
Shares issued in reinvestment of distributions. | | | 59,054 | | | | 641,909 | | | | | | | | 113,486 | | | | 1,259,212 | |
Shares redeemed | | | (460,409 | ) | | | (5,013,314 | ) | | | | | | | (906,785 | ) | | | (10,028,619 | ) |
| | | | | | | | | | | | |
Net decrease | | | (299,349 | ) | | $ | (3,261,795 | ) | | | | | | | (508,238 | ) | | $ | (5,598,780 | ) |
| | | | | | | | | | | | |
12. Subsequent Events:
Management’s evaluation of the impact of all subsequent events on the Funds’ financial statements was completed through the date the financial statements were issued and the following items were noted:
Certain Funds paid a net investment income dividend in the following amounts per share on July 21, 2017 to shareholders of record on July 19, 2017:
| | | | | | | | | | | | |
| | | Advantage
Large Cap Core | | | Balanced
Capital | | | Global
Allocation | |
Investment income distribution | | $ | 0.001350 | | | $ | 0.020501 | | | $ | 0.057123 | |
Certain Funds paid a short-term capital gain and a long-term capital gain distribution in the following amounts per share on July 21, 2017 to shareholders of record on July 19, 2017:
| | | | | | | | | | | | |
| | | Advantage
Large Cap Core | | | Balanced
Capital | | | Capital
Appreciation | |
Short-term capital gain distribution | | | — | | | $ | 0.057927 | | | | — | |
Long-term capital gain distribution | | $ | 0.811351 | | | $ | 0.216830 | | | $ | 1.021578 | |
| | | | | | |
| 180 | | BLACKROCK SERIES FUND, INC. | | JUNE 30, 2017 | | |
| | | | |
| Disclosure of Investment Advisory Agreement | | | | |
The Board of Directors (the “Board,” the members of which are referred to as “Board Members”) of BlackRock Series Fund, Inc. (the “Corporation”) met in person on April 6, 2017 (the “April Meeting”) and May 9-10, 2017 (the “May Meeting”) to consider the approval of the investment advisory agreement (the “Advisory Agreement” or the “Agreement”) between the Corporation, on behalf of BlackRock Balanced Capital Portfolio (the “Balanced Capital Portfolio”), BlackRock Capital Appreciation Portfolio (the “Capital Appreciation Portfolio”), BlackRock Global Allocation Portfolio (the “Global Allocation Portfolio”), BlackRock Government Money Market Portfolio (the “Government Money Market Portfolio”), BlackRock High Yield Portfolio (the “High Yield Portfolio”), BlackRock Advantage Large Cap Core Portfolio (the “Advantage Large Cap Core Portfolio”), BlackRock Total Return Portfolio (the “Total Return Portfolio”) and BlackRock U.S. Government Bond Portfolio (the “U.S. Government Bond Portfolio”) (each, a “Fund,” and collectively, the “Funds”), each a series of the Corporation, and BlackRock Advisors, LLC (the “Manager” or “BlackRock”), each Fund’s investment advisor.
Activities and Composition of the Board
On the date of the May Meeting, the Board consisted of thirteen individuals, eleven of whom were not “interested persons” of the Corporation as defined in the Investment Company Act of 1940, as amended (the “1940 Act”) (the “Independent Board Members”). The Board Members are responsible for the oversight of the operations of the Funds and perform the various duties imposed on the directors of investment companies by the 1940 Act. The Independent Board Members have retained independent legal counsel to assist them in connection with their duties. The Chair of the Board is an Independent Board Member. The Board has established five standing committees: an Audit Committee, a Governance and Nominating Committee, a Compliance Committee, a Performance Oversight Committee and an Executive Committee, each of which is chaired by an Independent Board Member and composed of Independent Board Members (except for the Performance Oversight Committee and the Executive Committee, each of which also has one interested Board Member).
The Agreement
Pursuant to the 1940 Act, the Board is required to consider the continuation of the Agreement on an annual basis. The Board has four quarterly meetings per year, each extending over two days, a fifth one-day meeting to consider specific information surrounding the consideration of renewing the Agreement and additional in-person and telephonic meetings as needed. In connection with this year-long deliberative process, the Board assessed, among other things, the nature, extent and quality of the services provided to each Fund by BlackRock, BlackRock’s personnel and affiliates, including (as applicable): investment management; administrative and shareholder services; the oversight of fund service providers; marketing; risk oversight; compliance; and ability to meet applicable legal and regulatory requirements.
The Board, acting directly and through its committees, considers at each of its meetings, and from time to time as appropriate, factors that are relevant to its annual consideration of the renewal of the Agreement, including the services and support provided by BlackRock to each Fund and its shareholders. BlackRock also furnished additional information to the Board in response to specific questions from the Board. This additional information is discussed further below in the section titled “Board Considerations in Approving the Agreement.” Among the matters the Board considered were: (a) investment performance for one-year, three-year, five-year, ten-year, and/or since inception periods, as applicable, against peer funds, applicable benchmark, and performance metrics, as applicable, as well as senior management’s and portfolio managers’ analysis of the reasons for any over-performance or underperformance relative to its peers, benchmarks, and other performance metrics, as applicable; (b) fees, including advisory, administration, if applicable, and other amounts paid to BlackRock and its affiliates by each Fund for services; (c) Fund operating expenses and how BlackRock allocates expenses to each Fund; (d) the resources devoted to, risk oversight of, and compliance reports relating to, implementation of each Fund’s investment objective(s), policies and restrictions, and meeting regulatory requirements; (e) each Fund’s adherence to its compliance policies and procedures; (f) the nature, cost and character of non-investment management services provided by BlackRock and its affiliates; (g) BlackRock’s and other service providers’ internal controls and risk and compliance oversight mechanisms; (h) BlackRock’s implementation of the proxy voting policies approved by the Board; (i) the use of brokerage commissions and execution quality of portfolio transactions; (j) BlackRock’s implementation of each Fund’s valuation and liquidity procedures; (k) an analysis of management fees for products with similar investment mandates across the open-end fund, exchange-traded fund (“ETF”), closed-end fund, sub-advised mutual fund, separately managed account, collective investment trust, and institutional separate account product channels, as applicable, and the similarities and differences between these products and the services provided as compared to each Fund; (l) BlackRock’s compensation methodology for its investment professionals and the incentives and accountability it creates, along with investment professionals’ investments in the fund(s) they manage; and (m) periodic updates on BlackRock’s business.
Board Considerations in Approving the Agreement
The Approval Process: Prior to the April Meeting, the Board requested and received materials specifically relating to the Agreement. The Board is continuously engaged in a process with its independent legal counsel and BlackRock to review the nature and scope of the information provided to better assist its deliberations. The materials provided in connection with the April Meeting included (a) information independently compiled and prepared by Broadridge Financial Solutions, Inc. (“Broadridge”) on Fund fees and expenses as compared with a peer group of funds as determined by Broadridge (“Expense Peers”) and the investment performance of each Fund as compared with a peer group of funds as determined by Broadridge1 and, with respect to Capital Appreciation Portfolio and Advantage Large Cap Core Portfolio, the applicable Morningstar Classification; (b) information on the
| | 1 | | Funds are ranked by Broadridge in quartiles, ranging from first to fourth, where first is the most desirable quartile position and fourth is the least desirable. |
| | | | | | |
| | | BLACKROCK SERIES FUND, INC. | | JUNE 30, 2017 | | 181 |
| | | | |
| Disclosure of Investment Advisory Agreement (continued) | | | | |
profits realized by BlackRock and its affiliates pursuant to the Agreement and a discussion of fall-out benefits to BlackRock and its affiliates; (c) a general analysis provided by BlackRock concerning investment management fees charged to other clients, such as institutional clients, sub-advised mutual funds, ETFs, closed-end funds, and separately managed accounts, under similar investment mandates, as well as the performance of such other clients, as applicable; (d) review of non-management fees; (e) the existence, impact and sharing of potential economies of scale; (f) a summary of aggregate amounts paid by each Fund to BlackRock; and (g) sales and redemption data regarding each Fund’s shares.
At the April Meeting, the Board reviewed materials relating to its consideration of the Agreement. As a result of the discussions that occurred during the April Meeting, and as a culmination of the Board’s year-long deliberative process, the Board presented BlackRock with questions and requests for additional information. BlackRock responded to these requests with additional written information in advance of the May Meeting.
At the May Meeting, the Board, including the Independent Board Members, approved the continuation of the Advisory Agreement between the Manager and the Corporation, on behalf of each Fund, for a one-year term ending June 30, 2018. In approving the continuation of the Agreement, the Board considered: (a) the nature, extent and quality of the services provided by BlackRock; (b) the investment performance of each Fund; (c) the advisory fee and the cost of the services and profits to be realized by BlackRock and its affiliates from their relationship with each Fund; (d) each Fund’s costs to investors compared to the costs of Expense Peers and performance compared to the relevant performance metrics as previously discussed; (e) the sharing of potential economies of scale; (f) fall-out benefits to BlackRock and its affiliates as a result of its relationship with each Fund; and (g) other factors deemed relevant by the Board Members.
The Board also considered other matters it deemed important to the approval process, such as other payments made to BlackRock or its affiliates, securities lending and cash management, services related to the valuation and pricing of Fund portfolio holdings, and materials submitted for the Board’s review. The Board noted the willingness of BlackRock personnel to engage in open, candid discussions with the Board. The Board did not identify any particular information as determinative, and each Board Member may have attributed different weights to the various items considered.
A. Nature, Extent and Quality of the Services to be Provided by BlackRock:
The Board, including the Independent Board Members, reviewed the nature, extent and quality of services provided by BlackRock, including the investment advisory services and the resulting performance of each Fund. Throughout the year, the Board compared Fund performance to the performance of a comparable group of mutual funds, a relevant benchmark, and performance metrics, as applicable. The Board met with BlackRock’s senior management personnel responsible for investment activities, including the senior investment officers. The Board also reviewed the materials provided by each Fund’s portfolio management team discussing each Fund’s performance and each Fund’s investment objective(s), strategies and outlook.
The Board considered, among other factors, with respect to BlackRock: the number, education and experience of investment personnel generally and each Fund’s portfolio management team; BlackRock’s research capabilities; investments by portfolio managers in the funds they manage; portfolio trading capabilities; use of technology; commitment to compliance; credit analysis capabilities; risk analysis and oversight capabilities; and the approach to training and retaining portfolio managers and other research, advisory and management personnel. The Board engaged in a review of BlackRock’s compensation structure with respect to each Fund’s portfolio management team and BlackRock’s ability to attract and retain high-quality talent and create performance incentives.
In addition to investment advisory services, the Board considered the quality of the administrative and other non-investment advisory services provided to each Fund. BlackRock and its affiliates provide each Fund with certain administrative, shareholder and other services (in addition to any such services provided to each Fund by third parties) and officers and other personnel as are necessary for the operations of each Fund. In particular, BlackRock and its affiliates provide each Fund with administrative services including, among others: (i) preparing disclosure documents, such as the prospectus, the summary prospectus (as applicable), the statement of additional information and periodic shareholder reports; (ii) oversight of daily accounting and pricing; (iii) preparing periodic filings with regulators; (iv) overseeing and coordinating the activities of other service providers; (v) organizing Board meetings and preparing the materials for such Board meetings; (vi) providing legal and compliance support; (vii) furnishing analytical and other support to assist the Board in its consideration of strategic issues such as the merger, consolidation or repurposing of certain open-end funds; and (viii) performing other administrative functions necessary for the operation of each Fund, such as tax reporting, fulfilling regulatory filing requirements and call center services. The Board reviewed the structure and duties of BlackRock’s fund administration, shareholder services, and legal & compliance departments and considered BlackRock’s policies and procedures for assuring compliance with applicable laws and regulations.
B. The Investment Performance of each Fund and BlackRock:
The Board, including the Independent Board Members, also reviewed and considered the performance history of each Fund. In preparation for the April Meeting, the Board was provided with reports independently prepared by Broadridge, which included a comprehensive analysis of each Fund’s performance. The Board also reviewed a narrative and statistical analysis of the Broadridge data that was prepared by BlackRock. In connection with its review, the Board received and reviewed information regarding the investment performance of each Fund as compared to other funds in its applicable Broadridge category as well as, with respect to Capital Appreciation Portfolio and Advantage Large Cap Core Portfolio, the applicable Morningstar Classification. The Board was provided with a description of the methodology used by Broadridge to select peer funds and periodically meets with Broadridge representatives to review its methodology. The Board was provided with information on the composition of the Broadridge performance universes and expense universes. The Board and its Performance Oversight Committee regularly review, and meet with Fund management to discuss, the performance of each Fund throughout the year.
| | | | | | |
| 182 | | BLACKROCK SERIES FUND, INC. | | JUNE 30, 2017 | | |
| | | | |
| Disclosure of Investment Advisory Agreement (continued) | | | | |
In evaluating performance, the Board recognized that the performance data reflects a snapshot of a period as of a particular date and that selecting a different performance period could produce significantly different results. Further, the Board recognized that it is possible that long-term performance can be adversely affected by even one period of significant underperformance so that a single investment decision or theme has the ability to affect long-term performance disproportionately.
The Board noted that for the one-, three- and five-year periods reported, the Balanced Capital Portfolio ranked in the second, first, and first quartiles, respectively, against its Broadridge Performance Universe.
The Board noted that for the one-, three- and five-year periods reported, the Capital Appreciation Portfolio ranked in the fourth, third and third quartiles, respectively, against its Morningstar Performance Universe. BlackRock believes that the Morningstar Performance Universe is an appropriate performance metric for the Capital Appreciation Portfolio. The Board and BlackRock reviewed the Capital Appreciation Portfolio’s underperformance during these periods.
The Board and BlackRock discussed BlackRock’s strategy for improving the Capital Appreciation Portfolio’s investment performance. Discussions covered topics such as: investment risks undertaken by the Fund; performance attribution; the Fund’s investment personnel; and the resources appropriate to support the Fund’s investment processes.
The Board noted that for the one-, three- and five-year periods reported, the Global Allocation Portfolio ranked in the third, second and second quartiles, respectively, against its Broadridge Performance Universe. The Board and BlackRock reviewed the Global Allocation Portfolio’s underperformance during the one-year period.
The Board noted that for each of the one-, three- and five-year periods reported, the Government Money Market Portfolio ranked in the third quartile against its Broadridge Performance Universe. Additionally the Board noted that the Government Money Market Portfolio performed within the one basis point threshold of its Broadridge Performance Universe peer median for each of the one-, three-, and five-year periods. The Board reviewed the Government Money Market Portfolio’s performance within the context of the low yield environment that has existed over the past few years.
The quartile standing of the Government Money Market Portfolio in its Broadridge Performance Universe takes into account the Fund’s current yield only. BlackRock has reviewed with the Board that a money market fund can only be understood holistically, accounting for current yield and risk. While the Board reviews the Government Money Market Portfolio’s current yield performance, it also examines the liquidity, duration, and credit quality of the Fund’s portfolio. In the Board’s view, BlackRock’s money market funds have performed well over the one-, three- and five-year periods given BlackRock’s emphasis on preserving capital and seeking as high a level of current income as is consistent with liquidity while simultaneously managing risk.
The Board noted that for the one-, three- and five-year periods reported, the High Yield Portfolio ranked in the second, second, and first quartiles, respectively, against its Broadridge Performance Universe.
The Board noted that for the one-, three- and five-year periods reported, the Advantage Large Cap Core Portfolio ranked in the third, second, and third quartiles, respectively, against its Morningstar Performance Universe. BlackRock believes that the Morningstar Performance Universe is an appropriate performance metric for the Advantage Large Cap Core Portfolio. The Board and BlackRock reviewed the Advantage Large Cap Core Portfolio’s underperformance during the one- and five-year periods. The Board also noted that effective June 12, 2017, the Advantage Large Cap Core Portfolio had undergone changes in its investment objective, investment strategy and portfolio management team, and in connection with such changes, the Fund changed its name from BlackRock Large Cap Core Portfolio to BlackRock Advantage Large Cap Core Portfolio.
The Board noted that for each of the one-, three- and five-year periods reported, the Total Return Portfolio ranked in the second quartile against its Broadridge Performance Universe.
The Board noted that for the one-, three- and five-year periods reported, the U.S. Government Bond Portfolio ranked in the first, first and second quartiles, respectively, against its Broadridge Performance Universe.
C. Consideration of the Advisory/Management Fees and the Cost of the Services and Profits to be Realized by BlackRock and its Affiliates from their Relationship with each Fund:
The Board, including the Independent Board Members, reviewed each Fund’s contractual management fee rate compared with the other funds in its Broadridge category. The contractual management fee rate represents a combination of the advisory fee and any administrative fees, before taking into account any reimbursements or fee waivers. The Board also compared each Fund’s total expense ratio, as well as its actual management fee rate, to those of other funds in its Broadridge category. The total expense ratio represents a fund’s total net operating expenses, including any 12b-1 or non 12b-1 service fees. The total expense ratio gives effect to any expense reimbursements or fee waivers that benefit a fund, and the actual management fee rate gives effect to any management fee reimbursements or waivers that benefit a fund. The Board considered the services provided and the fees charged by BlackRock and its affiliates to other types of clients with similar investment mandates, as applicable, including institutional accounts and sub-advised mutual funds (including mutual funds sponsored by third parties).
The Board received and reviewed statements relating to BlackRock’s financial condition. The Board reviewed BlackRock’s profitability methodology and was also provided with a profitability analysis that detailed the revenues earned and the expenses incurred by BlackRock for services provided to each Fund. The Board reviewed BlackRock’s profitability with respect to each Fund and other funds the Board currently oversees for the year ended December 31, 2016 compared to available aggregate profitability data provided for the prior two years. The Board reviewed BlackRock’s profitability with respect to certain other U.S. fund complexes managed by the Manager and/or its affiliates. The Board reviewed BlackRock’s assumptions and
| | | | | | |
| | | BLACKROCK SERIES FUND, INC. | | JUNE 30, 2017 | | 183 |
| | | | |
| Disclosure of Investment Advisory Agreement (continued) | | | | |
methodology of allocating expenses in the profitability analysis, noting the inherent limitations in allocating costs among various advisory products. The Board recognized that profitability may be affected by numerous factors including, among other things, fee waivers and expense reimbursements by the Manager, the types of funds managed, precision of expense allocations and business mix. As a result, calculating and comparing profitability at individual fund levels is difficult.
The Board noted that, in general, individual fund or product line profitability of other advisors is not publicly available. The Board reviewed BlackRock’s overall operating margin, in general, compared to that of certain other publicly-traded asset management firms. The Board considered the differences between BlackRock and these other firms, including the contribution of technology at BlackRock, BlackRock’s expense management, and the relative product mix.
In addition, the Board considered the cost of the services provided to each Fund by BlackRock, and BlackRock’s and its affiliates’ profits relating to the management and distribution of each Fund and the other funds advised by BlackRock and its affiliates. As part of its analysis, the Board reviewed BlackRock’s methodology in allocating its costs of managing each Fund, to each Fund. The Board may receive and review information from independent third parties as part of its annual evaluation. The Board considered whether BlackRock has the financial resources necessary to attract and retain high quality investment management personnel to perform its obligations under the Agreement and to continue to provide the high quality of services that is expected by the Board. The Board further considered factors including but not limited to BlackRock’s commitment of time, assumption of risk, and liability profile in servicing each Fund in contrast to what is required of BlackRock with respect to other products with similar investment mandates across the open-end fund, ETF, closed-end fund, sub-advised mutual fund, separately managed account, collective investment trust, and institutional separate account product channels, as applicable.
The Board noted that the Balanced Capital Portfolio’s contractual management fee rate ranked in the first quartile, and that the actual management fee rate and total expense ratio each ranked in the first quartile, relative to the Fund’s Expense Peers. The Board also noted that the Balanced Capital Portfolio has an advisory fee arrangement that includes breakpoints that adjust the fee rate downward as the aggregate assets of the Fund, combined with the assets of the other Series Funds, increase above certain contractually specified levels. The Board further noted that BlackRock has contractually agreed to a cap on the Balanced Capital Portfolio’s total expenses as a percentage of the Fund’s average daily net assets. Additionally, the Board noted that BlackRock has contractually agreed to a cap on certain operational and recordkeeping fees for the Balanced Capital Portfolio.
The Board noted that the Capital Appreciation Portfolio’s contractual management fee rate ranked in the first quartile, and that the actual management fee rate and total expense ratio each ranked in the first quartile, relative to the Fund’s Expense Peers. The Board also noted that the Capital Appreciation Portfolio has an advisory fee arrangement that includes breakpoints that adjust the fee rate downward as the aggregate assets of the Fund, combined with the assets of the other Series Funds, increase above certain contractually specified levels. The Board further noted that BlackRock has contractually agreed to a cap on the Capital Appreciation Portfolio’s total expenses as a percentage of the Fund’s average daily net assets. Additionally, the Board noted that BlackRock has contractually agreed to a cap on certain operational and recordkeeping fees for the Capital Appreciation Portfolio.
The Board noted that the Global Allocation Portfolio’s contractual management fee rate ranked in the first quartile, and that the actual management fee rate and total expense ratio each ranked in the first quartile, relative to the Fund’s Expense Peers. The Board also noted that the Global Allocation Portfolio has an advisory fee arrangement that includes breakpoints that adjust the fee rate downward as the aggregate assets of the Fund, combined with the assets of the other Series Funds, increase above certain contractually specified levels. The Board further noted that BlackRock has contractually agreed to a cap on the Global Allocation Portfolio’s total expenses as a percentage of the Fund’s average daily net assets. Additionally, the Board noted that BlackRock has contractually agreed to a cap on certain operational and recordkeeping fees for the Global Allocation Portfolio.
The Board noted that the Government Money Market Portfolio’s contractual management fee rate ranked in the second quartile, and that the actual management fee rate and total expense ratio each ranked in the fourth quartile, relative to the Fund’s Expense Peers. The Board reviewed the Government Money Market Portfolio’s expenses within the context of the low yield environment and consequent expense waivers and reimbursements. The Board also noted that the Government Money Market Portfolio has an advisory fee arrangement that includes breakpoints that adjust the fee rate downward as the aggregate assets of the Fund, combined with the assets of the other Series Funds, increase above certain contractually specified levels. The Board further noted that BlackRock has contractually agreed to a cap on the Government Money Market Portfolio’s total expenses as a percentage of the Fund’s average daily net assets. Additionally, the Board noted that BlackRock has contractually agreed to a cap on certain operational and recordkeeping fees for the Government Money Market Portfolio. The Board also noted that, to enable the Government Money Market Portfolio to maintain minimum levels of daily net investment income, BlackRock has voluntarily agreed to waive a portion of its fees and/or reimburse the Fund’s operating expenses as necessary. This waiver and/or reimbursement may be discontinued at any time without notice.
The Board noted that the High Yield Portfolio’s contractual management fee rate ranked in the first quartile, and that the actual management fee rate and total expense ratio each ranked in the first quartile, relative to the Fund’s Expense Peers. The Board also noted that the High Yield Portfolio has an advisory fee arrangement that includes breakpoints that adjust the fee rate downward as the aggregate assets of the Fund, combined with the assets of the other Series Funds, increase above certain contractually specified levels. The Board further noted that BlackRock has contractually agreed to a cap on the High Yield Portfolio’s total expenses as a percentage of the Fund’s average daily net assets. Additionally, the Board noted that BlackRock has contractually agreed to a cap on certain operational and recordkeeping fees for the High Yield Portfolio.
| | | | | | |
| 184 | | BLACKROCK SERIES FUND, INC. | | JUNE 30, 2017 | | |
| | | | |
| Disclosure of Investment Advisory Agreement (concluded) | | | | |
The Board noted that the Advantage Large Cap Core Portfolio’s contractual management fee rate ranked in the first quartile, and that the actual management fee rate and total expense ratio each ranked in the first quartile, relative to the Fund’s Expense Peers. The Board also noted that the Advantage Large Cap Core Portfolio has an advisory fee arrangement that includes breakpoints that adjust the fee rate downward as the aggregate assets of the Fund, combined with the assets of the other Series Funds, increase above certain contractually specified levels. The Board further noted that BlackRock has contractually agreed to a cap on the Advantage Large Cap Core Portfolio’s total expenses as a percentage of the Fund’s average daily net assets. Additionally, the Board noted that BlackRock has contractually agreed to a cap on certain operational and recordkeeping fees for the Advantage Large Cap Core Portfolio.
The Board noted that the Total Return Portfolio’s contractual management fee rate ranked in the first quartile, and that the actual management fee rate and total expense ratio each ranked in the first quartile, relative to the Fund’s Expense Peers. The Board also noted that the Total Return Portfolio has an advisory fee arrangement that includes breakpoints that adjust the fee rate downward as the aggregate assets of the Fund, combined with the assets of the other Series Funds, increase above certain contractually specified levels. The Board further noted that BlackRock has contractually agreed to a cap on the Total Return Portfolio’s total expenses as a percentage of the Fund’s average daily net assets. Additionally, the Board noted that BlackRock has contractually agreed to a cap on certain operational and recordkeeping fees for the Total Return Portfolio.
The Board noted that the U.S. Government Bond Portfolio’s contractual management fee rate ranked in the first quartile, and that the actual management fee rate and total expense ratio each ranked in the first quartile, relative to the Fund’s Expense Peers. The Board also noted that the U.S. Government Bond Portfolio has an advisory fee arrangement that includes breakpoints that adjust the fee rate downward as the aggregate assets of the Fund, combined with the assets of the other Series Funds, increase above certain contractually specified levels. The Board further noted that BlackRock has contractually agreed to a cap on the U.S. Government Bond Portfolio’s total expenses as a percentage of the Fund’s average daily net assets. Additionally, the Board noted that BlackRock has contractually agreed to a cap on certain operational and recordkeeping fees for the U.S. Government Bond Portfolio.
D. Economies of Scale:
The Board, including the Independent Board Members, considered the extent to which economies of scale might be realized as the assets of the Funds increase, as well as the existence of expense caps, as applicable. The Board also considered the extent to which each Fund benefits from such economies in a variety of ways, and whether there should be changes in the advisory fee rate or breakpoint structure in order to enable each Fund to more fully participate in these economies of scale. The Board considered each Fund’s asset levels and whether the current fee schedule was appropriate. In its consideration, the Board Members took into account the existence of any expense caps and further considered the continuation and/or implementation, as applicable, of such caps.
E. Other Factors Deemed Relevant by the Board Members:
The Board, including the Independent Board Members, also took into account other ancillary or “fall-out” benefits that BlackRock or its affiliates may derive from their respective relationships with each Fund, both tangible and intangible, such as BlackRock’s ability to leverage its investment professionals who manage other portfolios and risk management personnel, an increase in BlackRock’s profile in the investment advisory community, and the engagement of BlackRock’s affiliates as service providers to each Fund, including for administrative, distribution, securities lending and cash management services. The Board also considered BlackRock’s overall operations and its efforts to expand the scale of, and improve the quality of, its operations. The Board also noted that BlackRock may use and benefit from third party research obtained by soft dollars generated by certain registered fund transactions to assist in managing all or a number of its other client accounts.
In connection with its consideration of the Agreement, the Board also received information regarding BlackRock’s brokerage and soft dollar practices. The Board received reports from BlackRock which included information on brokerage commissions and trade execution practices throughout the year.
The Board noted the competitive nature of the open-end fund marketplace, and that shareholders are able to redeem their Fund shares if they believe that each Fund’s fees and expenses are too high or if they are dissatisfied with the performance of each Fund.
Conclusion
The Board, including the Independent Board Members, approved the continuation of the Advisory Agreement between the Manager and the Corporation, on behalf of each Fund, for a one-year term ending June 30, 2018. Based upon its evaluation of all of the aforementioned factors in their totality, as well as other information, the Board, including the Independent Board Members, was satisfied that the terms of the Agreement were fair and reasonable and in the best interest of each Fund and its shareholders. In arriving at its decision to approve the Agreement, the Board did not identify any single factor or group of factors as all-important or controlling, but considered all factors together, and different Board Members may have attributed different weights to the various factors considered. The Independent Board Members were also assisted by the advice of independent legal counsel in making this determination. The contractual fee arrangements for each Fund reflect the results of several years of review by the Board Members and predecessor Board Members, and discussions between such Board Members (and predecessor Board Members) and BlackRock. As a result, the Board Members’ conclusions may be based in part on their consideration of these arrangements in prior years.
| | | | | | |
| | | BLACKROCK SERIES FUND, INC. | | JUNE 30, 2017 | | 185 |
Robert M. Hernandez, Chair of the Board and Director
James H. Bodurtha, Director
Bruce R. Bond, Director
Donald W. Burton, Director
Honorable Stuart E. Eizenstat, Director
Robert Fairbairn, Director
Henry Gabbay, Director
Lena G. Goldberg, Director
Henry R. Keizer, Director
John F. O’Brien, Director
Donald C. Opatrny, Director
Roberta Cooper Ramo, Director
John M. Perlowski, Director, President and Chief Executive Officer
Jennifer McGovern, Vice President
Neal J. Andrews, Chief Financial Officer
Jay M. Fife, Treasurer
Charles Park, Chief Compliance Officer
Fernanda Piedra, Anti-Money Laundering Compliance Officer
Benjamin Archibald, Secretary
| | | | | | |
| | | | |
Investment Adviser BlackRock Advisors, LLC Wilmington, DE 19809 | | Accounting Agent and Transfer Agent BNY Mellon Investment Servicing (US) Inc. Wilmington, DE 19809 | | Independent Registered Public Accounting Firm Deloitte & Touche LLP Philadelphia, PA 19103 | | Address of the Funds 100 Bellevue Parkway Wilmington, DE 19809 |
| | | | | | |
Custodian The Bank of New York Mellon1 New York, NY 10286 Brown Brothers Harriman & Co.2 Boston, MA 02109 | | Legal Counsel Willkie Farr & Gallagher LLP New York, NY 10019 | | Distributor BlackRock Investments, LLC New York, NY 10022 | | |
| | 1 | | For all Funds except BlackRock Global Allocation Portfolio. |
| | 2 | | For BlackRock Global Allocation Portfolio. |
| | | | | | |
| 186 | | BLACKROCK SERIES FUND, INC. | | JUNE 30, 2017 | | |
Availability of Quarterly Schedule of Investments
The Funds file their complete schedule of portfolio holdings with the SEC for the first and third quarters of each fiscal year on Form N-Q. The Funds’ Forms N-Q are available on the SEC’s website at http://www.sec.gov and may also be reviewed and copied at the SEC’s Public Reference Room in Washington, DC. Information on the operation of the Public Reference Room or how to access documents on the SEC’s website without charge may be obtained by calling (800) SEC-0330. The Funds’ Forms N-Q may also be obtained upon request and without charge by calling (800) 441-7762.
Availability of Proxy Voting Policies and Procedures
A description of the policies and procedures that the Funds use to determine how to vote proxies relating to portfolio securities is available
upon request and without charge (1) by calling (800) 441-7762; (2) at http://www.blackrock.com/prospectus/insurance; and (3) on the SEC’s website at http://www.sec.gov.
Availability of Proxy Voting Record
Information about how the Funds voted proxies relating to securities held in the Funds’ portfolios during the most recent 12-month period ended June 30 is available upon request and without charge (1) at http://www.blackrock.com/prospectus/insurance or by calling (800) 441-7762 and (2) on the SEC’s website at http://www.sec.gov.
|
| BlackRock Privacy Principles |
BlackRock is committed to maintaining the privacy of its current and former fund investors and individual clients (collectively, “Clients”) and to safe-guarding their non-public personal information. The following information is provided to help you understand what personal information BlackRock collects, how we protect that information and why in certain cases we share such information with select parties.
If you are located in a jurisdiction where specific laws, rules or regulations require BlackRock to provide you with additional or different privacy-related rights beyond what is set forth below, then BlackRock will comply with those specific laws, rules or regulations.
BlackRock obtains or verifies personal non-public information from and about you from different sources, including the following: (i) information we receive from you or, if applicable, your financial intermediary, on applications, forms or other documents; (ii) information about your transactions with us, our affiliates, or others; (iii) information we receive from a consumer reporting agency; and (iv) from visits to our websites.
BlackRock does not sell or disclose to non-affiliated third parties any non-public personal information about its Clients, except as permitted by law or as is necessary to respond to regulatory requests or to service Client accounts. These non-affiliated third parties are required to protect the confidentiality and security of this information and to use it only for its intended purpose.
We may share information with our affiliates to service your account or to provide you with information about other BlackRock products or services that may be of interest to you. In addition, BlackRock restricts access to non-public personal information about its Clients to those BlackRock employees with a legitimate business need for the information. BlackRock maintains physical, electronic and procedural safeguards that are designed to protect the non-public personal information of its Clients, including procedures relating to the proper storage and disposal of such information.
| | | | | | |
| | | BLACKROCK SERIES FUND, INC. | | JUNE 30, 2017 | | 187 |
This report is authorized for distribution only to Policyowners of certain variable life insurance policies, which are funded by shares of BlackRock Series Fund, Inc. This report is not authorized for use as an offer of sale or a solicitation of an offer to buy shares of the Fund or the policies. Past performance results shown in this report should not be considered a representation of future performance. Investment returns and principal value of shares will fluctuate so that shares, when redeemed, may be worth more or less than their original cost. Performance information used throughout this report does not include insurance-related fees and expenses. An investment in BlackRock Government Money Market Portfolio is not insured or guaranteed by the Federal Deposit Insurance Corporation or any other Government agency. Although BlackRock Government Money Market Portfolio seeks to preserve the value of your investment at $1.00 per share, it is possible to lose money by investing in the Portfolio. Statements and other information herein are as dated and are subject to change. Please see the Fund’s prospectus for a description of risks associated with global investments.

| | |
| |
Series8-6/17-SAR | |  |
| Item 2 – | Code of Ethics – Not Applicable to this semi-annual report |
| Item 3 – | Audit Committee Financial Expert – Not Applicable to this semi-annual report |
| Item 4 – | Principal Accountant Fees and Services – Not Applicable to this semi-annual report |
| Item 5 – | Audit Committee of Listed Registrants – Not Applicable |
(a) The registrant’s Schedule of Investments is included as part of the Report to Stockholders filed under Item 1 of this Form.
(b) Not Applicable due to no such divestments during the semi-annual period covered since the previous Form N-CSR filing.
| Item 7 – | Disclosure of Proxy Voting Policies and Procedures for Closed-End Management Investment Companies – Not Applicable |
| Item 8 – | Portfolio Managers of Closed-End Management Investment Companies – Not Applicable |
| Item 9 – | Purchases of Equity Securities by Closed-End Management Investment Company and Affiliated Purchasers – Not Applicable |
| Item 10 – | Submission of Matters to a Vote of Security Holders –There have been no material changes to these procedures. |
| Item 11 – | Controls and Procedures |
(a) – The registrant’s principal executive and principal financial officers, or persons performing similar functions, have concluded that the registrant’s disclosure controls and procedures (as defined in Rule 30a-3(c) under the Investment Company Act of 1940, as amended (the “1940 Act”)) are effective as of a date within 90 days of the filing of this report based on the evaluation of these controls and procedures required by Rule 30a-3(b) under the 1940 Act and Rule 15d-15(b) under the Securities Exchange Act of 1934, as amended.
(b) – There were no changes in the registrant’s internal control over financial reporting (as defined in Rule 30a-3(d) under the 1940 Act) that occurred during the second fiscal quarter of the period covered by this report that have materially affected, or are reasonably likely to materially affect, the registrant’s internal control over financial reporting.
| Item 12 – | Exhibits attached hereto |
(a)(1) – Code of Ethics – Not Applicable to this semi-annual report
(a)(2) – Certifications – Attached hereto
(a)(3) – Not Applicable
(b) – Certifications – Attached hereto
2
Pursuant to the requirements of the Securities Exchange Act of 1934 and the Investment Company Act of 1940, the registrant has duly caused this report to be signed on its behalf by the undersigned, thereunto duly authorized.
BlackRock Series Fund, Inc.
| | |
| By: | | /s/ John M. Perlowski |
| | John M. Perlowski |
| | Chief Executive Officer (principal executive officer) of |
| | BlackRock Series Fund, Inc. |
| |
| Date: | | August 28, 2017 |
Pursuant to the requirements of the Securities Exchange Act of 1934 and the Investment Company Act of 1940, this report has been signed below by the following persons on behalf of the registrant and in the capacities and on the dates indicated.
| | |
| By: | | /s/ John M. Perlowski |
| | John M. Perlowski |
| | Chief Executive Officer (principal executive officer) of |
| | BlackRock Series Fund, Inc. |
| |
| Date: | | August 28, 2017 |
| |
| By: | | /s/ Neal J. Andrews |
| | Neal J. Andrews |
| | Chief Financial Officer (principal financial officer) of |
| | BlackRock Series Fund, Inc. |
| |
| Date: | | August 28, 2017 |
3