Table of Contents
UNITED STATES
SECURITIES AND EXCHANGE COMMISSION
Washington, D.C. 20549
FORM 10-K
| x | Annual Report Pursuant to Section 13 or 15 (d) of the Securities Exchange Act of 1934 |
For the fiscal year ended December 31, 2006
or
| ¨ | Transition Report Pursuant to Section 13 or 15(d) of the Securities Exchange Act of 1934 |
For the transition period from to .
Commission File No. 1-9767
IRIS INTERNATIONAL, INC.
(Exact name of registrant as specified in its charter)
| Delaware | 94-2579751 | |
| (State or other jurisdiction of incorporation or organization) | (I.R.S. Employer Identification No.) |
9172 Eton Avenue, Chatsworth, California 91311
(Address of principal executive offices) (Zip Code)
(818) 709-1244
(Registrant’s telephone number, including area code)
Securities registered pursuant to Section 12(b) of the Act:
Title of each class | Name of each exchange on which registered | |
| Common Stock, par value $0.01 per share | NASDAQ Global Market |
Securities registered pursuant to Section 12(g) of the Act:
None
Indicate by check mark whether the Registrant is a well-known seasoned issuer, as defined in Rule 405 of the Securities Act. Yes ¨ No x
Indicate by check mark whether the Registrant is not required to file reports pursuant to Section 13 or Section 15(d) of the Exchange Act. Yes ¨ No x
Indicate by check mark whether the Registrant (1) has filed all reports required to be filed by Section 13 or 15(d) of the Securities Exchange Act of 1934 during the preceding 12 months (or for such shorter period that the Registrant was required to file such reports), and (2) has been subject to such filing requirements for the past 90 days. Yes x No ¨
Indicate by check mark if disclosure of delinquent filers pursuant to Item 405 of Regulation S-K is not contained herein, and will not be contained, to the best of registrant’s knowledge, in definitive proxy or information statements incorporated by reference in Part III of this Form 10-K or any amendment to this Form 10-K. ¨
Indicate by check mark whether the Registrant is a large accelerated filer, an accelerated filer or non-accelerated filer (as defined in Rule 12b-2 of the Exchange Act.)
Large accelerated filer ¨ Accelerated filer x Non accelerated filer ¨.
Indicate by check mark whether the Registrant is a shell company (as defined in Rule 12b-2 of the Exchange Act. Yes ¨ No x
The aggregate market value of the shares of Common Stock held by non-affiliates of the Registrant was approximately $213.4 million based upon the closing price of $13.16 per share of Common Stock as reported on the NASDAQ Global Market on June 30, 2006. Solely for the purpose of determining “non-affiliates” in this context, shares of Common Stock held by each officer and director and by each person who owns 5% or more of the outstanding Common Stock have been excluded. This determination of affiliate status is not necessarily a determination for other purposes.
The Registrant had 18,088,040 shares of Common Stock outstanding on March 1, 2007.
DOCUMENTS INCORPORATED BY REFERENCE
Portions of the Registrant’s definitive Proxy Statement to be filed with the Securities and Exchange Commission pursuant to Regulation 14A in connection with the 2007 Annual Meeting of Shareholders are incorporated by reference into Part III of this Report.
Table of Contents
ANNUAL REPORT ON FORM 10-K
Fiscal Year Ended December 31, 2006
Item 1. | 1 | |||
Item 1A | 13 | |||
Item 1B | 19 | |||
Item 2. | 19 | |||
Item 3. | 19 | |||
Item 4. | 19 | |||
Item 5. | 20 | |||
Item 6. | 22 | |||
Item 7. | Management’s Discussion and Analysis of Financial Condition and Results of Operations | 23 | ||
Item 7A. | 32 | |||
Item 8. | 33 | |||
Item 9. | Changes in and Disagreements with Accountants on Accounting and Financial Disclosure | 33 | ||
Item 9A | 33 | |||
Item 9B | 35 | |||
Item 10. | 35 | |||
Item 11. | 35 | |||
Item 12. | Security Ownership of Certain Beneficial Owners and Management and Related Stockholder Matters | 35 | ||
Item 13. | Certain Relationships and Related Transactions, and Director Independence | 35 | ||
Item 14. | 35 | |||
Item 15. | 36 | |||
| 38 | ||||
Table of Contents
Forward-Looking Statements
This Annual Report on Form 10-K contains forward-looking statements, which reflect our current views about future events and financial results. We have made these statements in reliance on the safe harbor created by that Private Securities Litigation Reform Act of 1995. Forward-looking statements include our views on future financial results, financing sources, product development, capital requirements, market growth and the like, and are generally identified by phrases such as “anticipates,” “believes,” “estimates,” “expects,” “intends,” “plans” and similar words. Forward-looking statements are merely predictions and therefore inherently subject to uncertainties and other factors which could cause the actual results to differ materially from the forward-looking statement. These uncertainties and other factors include, among other things:
| • | unexpected technical and marketing difficulties inherent in major product development efforts such as the new applications for our urinalysis workstation, |
| • | the potential need for changes in our long-term strategy in response to future developments, |
| • | future advances in diagnostic testing methods and procedures, as well as potential changes in government regulations and healthcare policies, both of which could adversely affect the economics of the diagnostic testing procedures automated by our products, |
| • | increasing competition from imaging and non-imaging based in-vitro diagnostic products. |
Set forth below in Item 1A. Risk Factors are additional significant uncertainties and other factors affecting forward-looking statements. The readers should understand that the uncertainties and other factors identified in this Annual Report are not a comprehensive list of all the uncertainties and other factors that may affect forward-looking statements. We do not undertake any obligation to update or revise any forward-looking statements or the list of uncertainties and other factors that could affect those statements.
Company Overview
IRIS International, Inc., (NASDAQGM: IRIS) was incorporated in California in 1979 and reincorporated in Delaware in 1987. Our company consists of three operating units and two business segments determined in accordance with Statement of Financial Accounting Standards (“SFAS”) No. 131. We have been investing significant resources in research and development activities in order to create a broad product pipeline. We believe this investment will make our core urinalysis business more competitive globally and expand our product offerings into the high value diagnostics testing segment with new applications for oncology, infectious diseases and microbiology.
Our largest business unit, Iris Diagnostics Division, designs, manufactures and marketsin vitrodiagnostics (IVD) systems, consumables and supplies for urinalysis and body fluids testing. In April 2006, we acquired a molecular diagnostics company, Leucadia Technologies, Inc., now named Iris Molecular Diagnostics (IMD). A new molecular diagnostics product line will be based on the platform technologies acquired, which includes ultra-sensitive detection capabilities under the detection thresholds of current immunoassay and molecular diagnostic methods. In addition, our molecular diagnostics group has a novel and highly specific method for the isolation and concentration of rare cells and microorganisms in biological fluids. We plan to develop, manufacture and sell innovative test methods and new instrument systems enabled by these platform technologies through our Diagnostics Division.
1
Table of Contents
Our second business unit StatSpin, Inc., d.b.a. Iris Sample Processing, markets small centrifuges, DNA processing stations and other equipment and accessories for rapid specimen processing.
Advanced Digital Imaging Research LLC (ADIR), our third business unit, does not generate revenue but assists in the advancement of proprietary imaging technology while conducting government-sponsored research and contract development in imaging and pattern recognition.
The majority of our revenue is derived from our Diagnostics division, which manufactures and sells urinalysis systems and develops ultra-sensitive molecular diagnostics tests for use in hospitals and commercial laboratories worldwide. The iQ®200 Automated Urine Microscopy Analyzer which we developed was initially launched in 2003 and is fully automated to perform microscopy in a flowing stream utilizing our neural network-based Automated Particle Recognition (APR™) software to enable high-speed digital processing to classify and display images of microscopic particles. Our iQ200 microscopy analyzers have the ability to be seamlessly connected to automated chemistry analyzers to constitute a fully integrated urinalysis system performing both chemistry and microscopy simultaneously on a urine sample, as well as the analysis of certain body fluids. Our systems are designed to provide users faster and more complete results, plus labor savings over manual methods of performing microscopy, one of the most labor intensive procedures in a clinical laboratory.
As of December 31, 2006, we have sold over 1,200 iQ200 analyzers which creates a solid installed base of instruments to generate a recurring revenue stream from consumables and service. It continues to be an important factor in our growth strategy to increase the penetration of the iQ200 by promoting its clinical value and consequently growing the consumable annuity. To further advance our position as a global leader in diagnostics, we plan to develop and commercialize new products to expand our overall market opportunity, diversify and extend our product offering and enter into the high value molecular diagnostics testing segment. We were able to accelerate these initiatives with the acquisition of a chemistry line in 2005 and the acquisition of Leucadia.
Market Overview and Business Opportunity
Urinalysis is performed as part of most routine medical examinations and is necessary for the diagnosis and monitoring of certain conditions including kidney and bladder disease, and urinary tract infections. The global urinalysis market is divided into three primary segments: urine chemistry, urine microscopy, and urine culture.
Urine chemistry consists of a panel of tests that identify a variety of chemical constituents in urine such as glucose, ketones, bilirubin, protein, nitrite, etc. Urine microscopy is the microscopic analysis of solid particles and cells (formed elements) suspended in urine. The particles analyzed include red blood cells, white blood cells, hyaline casts, pathological casts, crystals, bacteria, sperm, yeast, etc. Urine culture studies the propagation of microorganisms such as bacteria and yeast in agar media. In the urine culture market, all testing is done manually using agar plates requiring from 16 to 72 hours to receive results.
Current manual testing of urine and body fluids requires the clinical laboratory to split samples, perform automated and manual procedures and consolidate the separate results into one report. Urine chemistry compromises the majority of the urinalysis market, is broadly used and fairly generic, however, manual urine sediment analysis is used less frequently despite the fact that it provides significant clinical information. The analysis of other body fluids is critical for the diagnosis of infection, inflammation, hemorrhage and a variety of disease states. The manual procedure for microscopy requires a highly qualified medical technologist to accurately categorize formed elements observed under the microscope. However, inherent variability in sample preparation, (i.e. initial sample volume, spin down time, speed, and slide preparation technique) all contribute to significant variability in the quantitative accuracy of the diagnostic result. Furthermore, these tests represent very tedious and costly procedures for the clinical laboratory. On a total available market of approximately 6,900 sites, we estimate that approximately 50% continue to perform manual urine microscopies, representing a significant market opportunity for us. We believe the full automation and integration of results in the iQ200 product platform has accelerated the adoption of automated urine microscopy as a routine test.
2
Table of Contents
The automated microscopy market is estimated at approximately $250 million annually with a compound annual growth rate (CAGR) exceeding 25% in comparison to the globalin vitro diagnostics market CAGR of 6%. The chemistry market is estimated to be approximately $400 million annually with a CAGR of approximately 4%. The urine culture market today currently is not automated. We estimate the total market opportunity of automating this segment to be approximately $300 million, making the addressable urinalysis market over $950 million annually.
The worldwide molecular diagnostics market was estimated at approximately $2.0 billion in 2005. Molecular diagnostics is expected to be the growth engine for the clinical diagnostics market with an estimated 15-20% growth rate driven by an increase in the number of oncology tests and growth in existing infectious diseases testing. Due to the high value of molecular testing, it is one of the most profitable IVD market segments. We anticipate benefiting from these industry trends with improved diagnostic tests utilizing its unique platform technology for detection of cancer relapse, HIV viral load monitoring and bacteria testing.
In February 2007, we filed a 510(k) application with the U.S. Food and Drug Administration (FDA) for our ultra-sensitive Prostate-Specific Antigen (PSA) test based on our Nucleic Acid Detection Immuno-Assay (NADIA) technology. PSA remains the most important tumor marker to date for the diagnosis and clinical management of prostate cancer in men. Statistics show that approximately 230,000 men in the United States will be diagnosed with prostate cancer in 2007, and according to the Centers for Disease Control and Prevention, approximately 75% of them will undergo the removal of the prostate. The worldwide market for traditional PSA testing is estimated at more than $400 million annually, with more than $180 million in the U.S. alone. Our ultra-sensitive PSA test is intended for use in monitoring these cancer patients following prostatectomy.
Diagnostics Division
Our Diagnostics Division is a global leader in automatedin vitro diagnostics technology with instruments and chemical consumables for microscopy and chemistry analysis of urine and other body fluids and develops ultra-sensitive molecular diagnostics tests for use in hospitals and commercial laboratories worldwide. Our systems provide customers more accurate and rapid results and significant labor cost-savings over traditional manual methods. We sell our products directly and through a distributor network in the US and through distributors internationally. Our end-use customers consist of physician office laboratories, hospitals and clinical reference laboratories throughout the world. We have a pipeline of molecular diagnostics products in the research and early development stage that target applications in oncology, infectious diseases and microbiology.
Diagnostics Products
iQ®200 Automated Urine Microscopy Analyzers.Our iQ200 Automated Urine Microscopy Analyzer was launched in August 2003 and we have sold over 1,200 iQ200 analyzers as of December 31, 2006. The iQ200 technology platform utilizes proprietary image flow cytometry and neural network-based Automated Particle Recognition (APR™) software to achieve significant reductions in cost and processing time as compared to manual microscopic analysis. Our APR technology enables high-speed digital processing to classify and display images of microscopic particles in an easy-to-view graphical user interface. We believe our iQ200 product line has numerous benefits over competing products, including increased accuracy, digital imaging of particles and fully automated walk-away analysis of urine and body fluids.
We expanded our iQ200 product line to better serve different market segments. Our new products launched in 2006 include the iQ200 SELECT™, which enables automation at sites with lower test volumes, the iQ200 ELITE™, a next generation model which replaced the original iQ200 for mid-sized hospital laboratories, and the enhanced iQ200 SPRINT™, which is the fastest automated microscopy analyzer available targeted to large volume hospital and commercial laboratories. We restructured our product line to offer three different price points and expand our available market without sacrificing the clinical utility of our iQ200 microscopy analyzer. We also offer the iQ Body Fluids Module as an addition to the iQ200 test menu that enables the rapid diagnosis of malignant cells, bacteria and other abnormalities in body fluids such as cerebro-spinal, pleural, pericardial, peritoneal fluids and a variety of other serous fluids.
3
Table of Contents
iQ200 System with Automated Chemistry Analyzers.Our iQ200 microscopy analyzers have the ability to be seamlessly connected to automated chemistry analyzers to constitute a fully integrated urinalysis system performing both urine chemistry and urine microscopy simultaneously, as well as the analysis of body fluids. This automated system provides laboratories with a complete walk away solution for chemistry and microscopy urinalysis with results collated and displayed together.
Domestically, we sell our iQ200 instruments as stand-alone analyzers or as systems with ARKRAY’s AUTION MAX™ AX-4280 Automated Urine Chemistry Analyzer (AX-4280). ARKRAY is a Japanese diagnostics company and we have the exclusive rights to sell its chemistry analyzers in the US. Internationally, we sell our iQ200 instruments as stand-alone analyzers, with the exception of the iQ200 Select that can be connected with our proprietary semi-automated chemistry analyzer, the iChem™100. We do not have international distribution rights for ARKRAY’s chemistry analyzers. However, the large installed base of AX-4280 analyzers internationally is a readily available target for integration with one of the iQ200 microscopy analyzers. All of our international distributors sell the bridge system required to integrate the two instruments. In 2006, we discontinued domestic sales of the ARKRAY AUTION JET™ Semi-automated Urine Chemistry Analyzer (AJ-4270).
The table below summarizes our three iQ200 microscopy analyzers including throughput, appropriate chemistry analyzer that comprises a system and target market.
Microscopy Analyzer | Throughput | Chemistry Analyzer for Integrated System | Target Market . | |||
| iQ200 Sprint | 101 tests per hour | Arkray AUTION MAX™ AX-4280 domestic only | High volume hospitals and commercial laboratories | |||
| iQ200 Elite | 70 tests per hour | Arkray AUTION MAX™ AX-4280 domestic only | Medium-sized hospitals | |||
| iQ200 Select | 40 tests per hour | iChem™100 globally | Smaller hospitals and commercial laboratories |
Iris Chemistry Program.We are focused on strengthening our position in the urinalysis segment by marketing a complete core urinalysis offering with the addition of a proprietary line of chemistry analyzers. With a full line of chemistry products, we will be able to expand into newer market segments that include lower volume customers such as physician office laboratories, smaller hospitals, alternate care and veterinarians. In addition, a chemistry line fills the market-gap in the international segment, as well as provides a competitive advantage of seamless integration with our iQ200 microscopy analyzer.
On June 2005, we completed the acquisition of assets (primarily technology and inventory) of the urine chemistry business of Quidel Corporation to accelerate our development of a proprietary chemistry product line. With this acquisition, we acquired significant core technology and know-how in urine chemistry strips, patents and trademarks, product designs, a strip manufacturing facility in Germany and a semi-automated urine chemistry analyzer. In the third quarter of 2006, we launched our new iChem™100 Urine Chemistry Analyzer, a semi-automated bench top instrument designed for small volume hospital laboratories, outpatient clinics and large physician’s offices and our vChem™ urine chemistry test strips, which combined represented our entry into the global urine chemistry market with proprietary products.
In addition to the semi-automated iChem100, we expect to continue to develop a full line of chemistry analyzers that utilize our proprietary iChem and vChem urine chemistry strips. These analyzers include a fully-automated instrument that will have the ability to be connected to our iQ200 microscopy analyzer and CLIA-waived handheld chemistry instruments.
4
Table of Contents
Legacy Products.Prior to the iQ200 platform, we sold legacy product Models 500 and 939UDxTM, which are larger and more expensive workstations that perform microscopy and chemistry testing. The Model 500 is an operator-attended workstation that performs IVD testing on urine and eight other body fluids, but requires a medical technologist to manually load the specimens and characterize the microscopic particles manually. The 939UDx is a semi-automated workstation that performs IVD testing on urine only, but uses our first generation neural-network algorithms to automatically characterize the microscopic particles. As of December 31, 2006, we had an installed base of approximately 175 legacy systems, which continues to decline as these systems are replaced with iQ200 analyzers. Although declining, our legacy instruments continue to produce a significant source of revenue from consumables, parts, accessories and domestic service agreements.
Consumables and Service.Consumables and service provide an accumulating and significant source of recurring revenue for each instrument placed. In 2006, revenue derived from consumables and service was 43% of total consolidated revenue and 52% of our diagnostics business unit’s revenue. We realize recurring sales of consumables for our iQ200 microscopy platform, legacy products and iChem100 analyzer manufactured by Iris, and urine chemistry products sourced from ARKRAY and ROCHE. In addition, we sell our vChem urine chemistry strips without a related analyzer that are utilized on a manual visual read basis. Consumables include urine and body fluids reagents, calibrators and controls for our microscopy systems and test strips, calibrators, controls, and other solutions for the urine chemistry analyzers we manufacture and distribute. In the US and France, our customers purchase consumables directly from us. In addition, our proprietary chemistry strips are sold through our domestic distributors. Internationally, customers purchase consumables through our distribution network.
Domestic sales of our automated instruments include installation, customer training and a one-year warranty. Following the initial warranty period, the majority of domestic customers purchase annual service contracts from us. Such services are provided by our qualified service technicians located throughout the United States. Internationally, with the exception of France, our products are serviced by independent distributors.
Molecular Diagnostics Products.
The scientific study of DNA expression as specific proteins in cells provides the ability to characterize cells in a number of diseases, such as cancer. The ability to have better knowledge of the molecular definition of a disease and probable pathway for that disease process would aid physicians in improving patient outcomes. Standardized, quantitative methods are essential for clinicians to attain answers that are more precise, reliable and consistent. Using higher quality test data, physicians could better evaluate the prognosis and the potential effectiveness of increasingly targeted and expensive therapies and advice patients on an appropriate, individualized course of treatment. In addition, improved diagnostics would also help reduce the time to market for pharmaceutical companies to introduce therapies.
In April 2006, with the acquisition of Leucadia, we entered the molecular field, which is the fastest growing segment of the IVD market. Leucadia’s name was changed to Iris Molecular Diagnostics (IMD). IMD is focused on IVD products based on molecular detection technologies. This platform technology called NADIA (Nucleic Acid Detection Immunoassay), has the ability to rapidly and effectively measure extremely low concentrations, which are under the detection thresholds of current immunoassay and molecular diagnostic methods. In addition, IMD has a novel and highly specific method for the isolation and concentration of rare cells and microorganisms in biological fluids. Our strategy is to develop high value products that will provide diagnostic information currently unavailable to healthcare professionals. Our development efforts with NADIA are expected to aid in the early detection of disease, early detection of relapse and superior patient management thus providing better therapeutic outcomes. We plan to sell test kits only and license our test methods to large clinical reference laboratories that already have the requisite polymerase chain reaction (PCR) instrumentation to perform these molecular tests. Our two molecular platform technologies are described below:
5
Table of Contents
• | NADIA™ (Nucleic Acid Detection Immunoassay Platform):There is a need for quantitative or semi-quantitative measurement of the targeted proteins within cells. It is known that the 35,000 genes in the human genome result in more than 200,000 proteins being synthesized. Currently, only about 2,000 proteins can be detected in human plasma even though experts believe that there are more than 200,000 proteins present. Our Molecular Diagnostics group has developed NADIA™, an ultra-sensitive detection technology that may enable the detection of most of these proteins. Current technology used in the clinical laboratory has the ability to detect approximately one million molecules in plasma. The NADIA technology platform, has demonstrated the ability to phenotype and to quantify individual protein molecules expressed on single cells and detect about 500 molecules of a soluble protein in plasma, which is much more sensitive than any commercial immunoassay in the market. NADIA combines immunoassay (IA) and PCR methodologies with the potential to detect proteins with femtogram/ml sensitivity (10-15 gram/ milliliter). This amplified DNA–IA approach is similar to that of an enzyme immunoassay, which makes use of antibody (Ab) binding reactions and intermediate washing steps. In the NADIA method, the enzyme label is replaced with a strand of DNA and is detected by PCR amplification. Potential applications for these assays include the detection of circulating cancer cells, bacteria and viruses, such as human immunodeficiency virus (HIV). This technology is based partly on issued patents licensed from the University of California and patent-pending technology internally developed. NADIA is completely scalable to reach the sensitivity required by the analyte under test. |
| • | Bubble Isolation Technology Platform:Our second molecular platform technology is a novel cell isolation technology that makes it possible to isolate rare cells in the presence of billions of non-target cells. This “bubble technology” uses antibody-coated albumin micro-bubbles to bind to target cells. The isolation and separation of the targeted cells facilitates the ability to identify, count and characterize these specific cells of interest. We believe our albumin bubbles have significant competitive advantages in terms of affinity. In addition, the albumin bubbles can easily collapse and disappear without the cumbersome step of separating glass bubbles or magnetic beads from targeted cells, as is necessary with current commercial isolation technologies. We are conducting research to prove the feasibility of our bubble technology to separate all major bacteria species from urine. |
Molecular Diagnostics Product Pipeline.Our highly specific technology platforms provide an opportunity to enter the high value molecular diagnostic product segment focusing on early detection of relapse of cancer and HIV. As well, they provide enabling technology that combined with our IVD core technology and expertise in flow imaging should result in new modalities to study cell morphology in a variety of bodily fluids and microbiology. Our research and development efforts in molecular diagnostics focus on the following areas:
| • | Prostate Cancer: PSA Test.In February 2007, we filed a 510(k) application with the FDA for our ultra-sensitive PSA test. PSA remains the most important tumor marker to date for the diagnosis and clinical management of prostate cancer in men. IMD’s ultra-sensitive PSA test is intended for use in monitoring these cancer patients following therapy. We have developed a NADIA assay for total prostate-specific antigen (PSA) that employs an oligonucleotide-labeled reporter antibody and a solid phase capturing antibody coated onto paramagnetic micro-particles. Another NADIA assay is also being developed in a solution-phase homogeneous format. The PSA test is expected to help us prove the efficacy and value of our platform technology. We plan to conduct a retrospective clinical study in 2007 to establish the clinical utility of our ultra-sensitive PSA test. |
6
Table of Contents
| • | Urine Bacteria Screening. We are currently conducting feasibility studies to isolate and concentrate bacteria in urine. To date, we have data on the bubble technology that prove the method’s ability to isolate and concentrate certain types of bacteria, but not all experiments have been concluded. We expect our instrumentation product development group to work with IMD to facilitate the development of an automated bacteria screening instrument to indicate if there is bacteria and/or yeast present in urine. Typically if a patient has symptoms of a urinary tract infection, physicians prescribe antibiotics prior to receiving the results from urine cultures, which can take up to 72 hours. We believe our technology has the ability to provide a faster alternative to urine cultures and give physicians the information needed for appropriate treatment. |
| • | Cancer: Circulating Epithelial Cells.Utilizing our bubble isolation technology and NADIA, we are developing a test method to identify, quantify and characterize circulating epithelial cells present in blood to aid in screening, staging, prescribing appropriate therapy and detecting relapse in cancer. |
| • | HIV: Viral Load Test.Viral load tests measure the amount of HIV RNA in blood. The presence of RNA indicates that the virus is actively replicating. Along with the CD4 cell count, viral load is one of the most valuable measures for predicting HIV disease progression and gauging how well anti-retroviral treatment is working. Effective anti-retroviral treatment can often reduce viral load to low or undetectable levels. We believe our ultra-sensitive technology can provide detection of viral load at current undetectable levels. This would be beneficial information for the physician to continue to see the downward or upward trend of viral loads at levels that current methods cannot detect. If an upward trend is detected, a patient may no longer be responsive to current therapy and physicians may use the information as an indication to change or add new drugs to the treatment |
| • | Breast Cancer: Blood-based Her-2/neu Test. HER-2/neu is used as a prognostic marker to help determine how aggressive a breast cancer tumor is likely to be. According to the National Comprehensive Cancer Network, approximately one-third of breast cancers have too many copies of the HER-2/neu gene. However, patients who are HER-2/neu positive respond well to HER-2/neu antibody therapy, Herceptin, and consequently this specialized therapy has increased the use of Her-2/neu testing. Currently, Her-2/neu tests are performed on a small amount of cancer tissue. We are developing a blood-based alternative with high sensitivity and specificity to current Her-2/neu tests on tissue. The ability to have a sensitive blood test will provide physicians with valuable information that was previously only possible with tissue from a biopsy. Our technology is expected to be able to isolate and to phenotype circulating breast cancer cells and to determine the Her-2/neu concentration per cell with a higher sensitivity than traditional detection methods. |
Iris Sample Processing Division
Iris Sample Processing Division is a global leader in accelerated sample preparation for blood, urine, and body fluids analysis. The division makes centrifuges, semi-automated DNA processing workstations and blood analysis products, including the world’s fastest blood separator, which separates blood in under 30 seconds. Our bench top centrifuges are dedicated to applications for specimen preparation for coagulation, cytology, hematology and urinalysis. In 2006, revenue growth in this division was driven by the continued growth of the ThermoBrite™ DNA workstation and the new Express 3 centrifuge. The ThermoBrite DNA processing workstations automate the DNA denaturation and hybridization steps in a number of fluorescent in situ hybridization procedures. Our worldwide markets include medical institutions, commercial laboratories, clinics, doctors’ offices, veterinary laboratories and research facilities and we have important OEM supply agreements with Abbott Laboratories, Dako A/S and IDEXX Laboratories.
7
Table of Contents
ADIR Division
Our imaging research and development subsidiary, Advanced Digital Imaging Research, LLC, assists in the advancement of our proprietary imaging technology while conducting government-sponsored research and development in medical imaging and software. In addition, it pursues contract research for corporate clients, although to date such research for corporate clients has not been significant. ADIR has been focusing its efforts on advancing our proprietary pattern recognition technology platform targeting applications in both the security and biometrics markets. In 2006, ADIR acquired 3D images of passengers from a regional airport in Waco, Texas with a prototype facial recognition system to conduct further research and development on its system’s algorithms.
Growth Strategy
Our goal is to advance our position as a leader in the global diagnostics market through the following key elements: 1) increased penetration of our iQ200 product offering, 2) internal product development efforts and 3) selective acquisitions of related medical device companies, technologies or product lines. To date, an important driver of our growth has been through increased market penetration of our iQ200 products. As of December 31, 2006, we have sold over 1,200 iQ200s which creates a solid installed base of instruments to generate a recurring revenue stream from consumables and service. To further enhance our position in the in vitro diagnostics market, we are developing additional products to expand our overall market opportunity, diversify our product offering and enter into the high value testing segments.
Accelerate new product development.We are investing significantly in our research and development efforts to accelerate our growth in four significant product opportunities: 1) a full urine chemistry product line to fill gaps in our product portfolio, 2) a third generation flow microscope to expand our “iQ type” instrumentation into other high value market segments which can benefit from our systems capability to provide morphological information, 3) a revolutionary method to eliminate most urine cultures and 4) unique, high value testing applications utilizing our molecular platform technologies. These technology plans are based on a staged product development program in line with our resources and market priorities. Recent examples of our success in our new product development efforts include the launch in 2006 of the iChem100 and related strips as our first proprietary chemistry products. In addition, we filed a 510(k) application with the FDA for our ultra-sensitive PSA test in February 2007.
Increase market penetration. With the expansion of the iQ200 product line and the release of the current and future urine chemistry products, we are able to address the needs of a much broader market. We are initiating sales in the physician’s office laboratory with our proprietary chemistry products, as well as offering a complete chemistry and microscopy system with the iChem 100 in the international market to further our market penetration. As we continue to market the clinical value of urinalysis, specifically in microscopy, we expect to increase market awareness and demand for our automated urinalysis products. In 2006, we were able to secure large multi-unit, multi-site contracts with large volume laboratories including LabCorp for an initial 26 iQ200 Sprint analyzers. In addition, we approximately doubled our direct sales force in the US to accelerate our domestic penetration through direct sales and corporate accounts efforts.
Expand into new geographic markets. We will continue to expand our international market penetration. During 2006, international sales comprised approximately 28% of our total revenue. Over the past year, we continued to expand our international distribution network to approximately 55 distributors covering approximately 60 countries and anticipate the number of international distributors growing in 2007 with the launch of our products in new countries, such as India. In addition, we are strengthening our support of our distribution network with the addition of sales managers for the Asia Pacific and Latin America regions. We believe the sales and service support systems are in place to sustain our rapidly expanding global distribution network.
8
Table of Contents
Increase sales of consumables and service. Currently, we have an installed base of analyzers worldwide that provides significant recurring revenue of consumables and service. As we continue to increase our installed base, we will benefit from a cumulative increase in revenue from global consumables, both for chemistry and microscopy, and revenue from domestic service contracts and international spare parts.
Continuously enhance and expand system features.Another key element of our growth strategy is to expand and improve the features of the iQ200 analyzer with a next generation instrument. We plan to expand the iQ200 clinical applications to (i) increase the clinical utility of the platform, providing new information that is not currently available in routine testing, (ii) diversify the technology applications beyond the field of urinalysis and (iii) improve efficiency for medical professionals. As a result, we anticipate this will expand the potential market for our systems.
Pursue selective acquisitions.We intend to pursue selective acquisitions to augment our organic growth. Our acquisition strategy is to target companies, product lines and/or technologies that complement our product offering in specimen processing and provide synergies with our existing infrastructure. We plan to maximize the utilization of our manufacturing capabilities, distribution channels and technical and managerial expertise in the field ofin vitrodiagnostics and sample processing. In 2006, we acquired Leucadia Technologies, a molecular diagnostics company and in 2005, we acquired the chemistry product line from Quidel Corporation as part of our acquisition strategy.
Summary of Revenues by Product Line
The following table presents a summary of revenues by product line for the past three fiscal:
| Year ended December 31, | ||||||||||||||||||
(000s omitted) | 2006 | 2005 | 2004 | |||||||||||||||
IVD instruments | $ | 29,065 | 41 | % | $ | 27,542 | 44 | % | $ | 14,845 | 34 | % | ||||||
IVD consumables and service | 30,295 | 43 | % | 25,708 | 41 | % | 20,126 | 46 | % | |||||||||
Sample Processing instruments and supplies | 11,134 | 16 | % | 9,530 | 15 | % | 8,343 | 19 | % | |||||||||
Other | — | — | — | — | 336 | 1 | % | |||||||||||
Total | $ | 70,494 | 100 | % | $ | 62,780 | 100 | % | $ | 43,650 | 100 | % | ||||||
See Note 14 to the Consolidated Financial Statements, “Segment and Geographic Information,” for financial information regarding our operating segments and geographic areas.
Backlog
We did not have a material amount of backlog as of December 31, 2006. Our products are usually shipped within thirty to sixty days of receipt of sales orders. We do not believe that backlog is necessarily indicative of sales for any succeeding period.
Research and Development
Over the past three years, our product technology investments (including amounts reimbursed by third parties under research and development contracts and amounts capitalized) totaled $27.2 million ($14.9 million in 2006, including $5.2 million purchased in-process research and development). We plan to continue our investment in research and development, net of amounts received for grants, to approximate 13% of revenues. Our current research and development efforts are focusing on the following areas:
| • | Microscopy.A next generation iQ microscopy instrument with increased performance and expanded tests and applications; |
| • | Chemistry.Proprietary urine chemistry product line, including an automated analyzer (to be sold as a stand alone instrument and as a system with the iQ200 microscopy analyzer in the international market), and a CLIA-waived hand-held analyzer; |
| • | Urine Bacteria Screening.A urine analyzer that will rapidly detect extremely low concentrations of bacteria, therefore eliminating 70% of the urine cultures in the microbiology laboratory; and |
| • | Molecular Diagnostics.Test kits in the areas of cancer and infectious diseases that provide ultra-sensitive and high value results. |
9
Table of Contents
Our Sample Processing division plans to continue its organic growth programs and actively pursue technology licensing agreements as well as product acquisitions to supplement its core technologies and accelerate growth. ADIR plans to continue advancing our proprietary pattern recognition technology platform targeting applications in both the healthcare and biometrics markets.
Marketing and Sales
Domestic.In the US, we sell and service our Diagnostics division products through our own sales and service forces. Our customers include hospital laboratories, clinical reference laboratories and alternate care sites. We have been successful in securing supply agreements with the top six group purchasing organizations (GPO) and several smaller ones. In addition in 2006, we were able to secure large multi-unit, multi-site contracts with large volume laboratories including LabCorp for an initial 26 iQ200 Sprint analyzers. Domestic sales activities consist of direct sales by field sales representatives, telemarketing to initiate and aid in pursuing sales opportunities, logistics support of the field sales representatives and support to customers in the operation of their systems.
With the introduction of our first proprietary chemistry products, the iChem 100 and vChem strips, we implemented a distribution network consisting of the major medical device distributors in the US to sell to physician office laboratories and other smaller volume laboratories. In addition, Med Tech Associates, a professional manufacturer’s representation organization of approximately 30 sales representatives with nationwide coverage, is providing field-level product sales support activities for our chemistry products. Med Tech’s representatives act as domestic sales agents of Iris Diagnostics, supporting sales activities for the new urine chemistry product lines in a coordinated effort with the recently established US distribution network.
In addition to our sales activities, we promote our products through advertising in trade journals, attendance at trade shows, direct mail and our website. We also maintain a rental program for our urinalysis systems. Under the terms of the rental agreements, payments generally are based on the number of tests performed with a guaranteed monthly minimum payment. We are responsible for supply and service of the rental instruments. Alternatively, some customers either lease systems from us or from medical equipment leasing companies that, in turn purchase the instruments and consumables from us.
International.We sell our microscopy and chemistry products through distributors in markets around the world with the exception of France where we sell direct. In January 2005, we launched a direct commercial operation, Iris France S.A., headquartered just outside of Paris to address the issue of limited availability of independent capital equipment distributors in this market. We are adding sales and service personnel in step with the growing unit sales volume of this operation. As of March 1, 2007, we have agreements with distributors covering 60 countries. The international market is contributing significantly to the success of our new products.
Our Sample Processing division products are sold through distributors and to other manufacturers as OEM components of their respective products.
Competition
In the urine chemistry segment, Bayer and Roche are our principal competitors selling urine analyzers and test strips used in determining the concentration of various chemical substances found in urine. In the automated urine microscopy segment, Sysmex Corporation markets its automated urine sediment analyzers globally and remains our principal competitor. We believe the Sysmex systems have several significant limitations including the inability to perform particle and cellular imaging, an incomplete testing menu, and are not designed to perform body fluid analysis. These limitations result in repeat testing, requiring the technologist to retrieve the original sample, prepare a slide and conduct a manual microscopic analysis. The principal competitive factors in the urinalysis market are cost-per-test, ease of use and quality of result. We believe our automated systems compete favorably with respect to these factors.
10
Table of Contents
In 2004, however, Bayer and Sysmex formed a distribution alliance in the US market, whereby Bayer markets the ADVIA® Urinalysis WorkCell, comprised of the Bayer Clinitek Atlas® chemistry instrument and Sysmex UF100™ Urine Cell Analyzer. These two instruments are linked with a sample transport and the software to combine results. Despite the fact that these instruments are connected, we believe they have not overcome the limitations described above.
The iQ200 and the iQ200 Sprint Systems are the first instruments to fully integrate urine chemistry and urine microscopy analysis. We believe these systems provide the broadest menu available and are the only systems to provide digital images of urine and body fluids particles, which provides significant competitive advantages over these other systems. We believe the clinical utility and ease of use of our iQ200 product family will result in a better economic return for clinical laboratories and hospitals.
In addition to industry competitors, we are experiencing increased domestic and international pricing pressures in the urinalysis market due to the ongoing consolidation of both hospitals and medical device suppliers. Competitors are attempting to offer one-stop shopping for a variety of laboratory instruments, supplies and service. In the US, competitors typically offer hospitals annual rebates based on the hospital’s total volume of business. We have been successful in preventing this type of “product bundling” by negotiating contracts with the six largest GPOs in the US allowing GPO members to purchase our products and receive comparable product discounts but not rebates.
Intellectual Property
We have a long history of innovation. Our diversified core technology spans through a number of scientific endeavors, which includein vitro diagnostics, NADIA, bubble separation technology, specimen processing and handling, pattern recognition and image analysis. Our commercial success depends on our ability to protect and maintain our proprietary rights. We protect our proprietary technology by filing various patent applications. We have 41 active and 9 pending US patents for our technologies and 22 active and 42 pending corresponding foreign patents. These patents cover developments in imaging analysis and processing software, blood processing, digital refractometers, fluidics, centrifuges, automated slide handling and disposable urinalysis products sold by us. In 2006, our ADIR subsidiary filed a utility patent application for its 3D facial recognition technology, which is included in the pending count above.
For our molecular platform technologies, we have a license for three patents from the University of California that cover the use of nucleic acid labeled antibodies in immunoassays. In addition, we filed a patent on the improved use of DNA labeled antibodies and two patents covering NADIA and our bubble isolation technology methods.
We have trade secrets, unpatented technology and proprietary knowledge about the sale, promotion, operation, development and manufacturing of our products. We have confidentiality agreements with our employees and consultants to protect these rights.
We claim copyright in our software and the ways in which it assembles and displays images, and have filed copyright registrations with the United States Copyright Office. We also own various federally registered trademarks, including “IRIS”, “iQ”, “ThermoBrite”, and “StatSpin.” We own other registered and unregistered trademarks, and have certain trademark rights in foreign jurisdictions. We intend to aggressively protect our patents, copyrights and trademarks.
Government Regulations
Most of our products are subject to stringent government regulation in the United States and other countries. These laws and regulations govern product testing, manufacture, labeling, storage, record keeping, distribution, sale, marketing, advertising and promotion. The regulatory process can be lengthy, expensive and uncertain, and securing clearances or approvals often requires the submission of extensive testing and other supporting information. If we do not comply with regulatory requirements, we may be subject to fines, recall or seizure of products, total or partial suspension of production, withdrawal of existing product approvals or clearances, refusal to approve or clear new applications or notices and criminal prosecution. Further, any change in existing federal, state or foreign laws or regulations, or in their interpretation or enforcement, or the enactment of any additional laws or regulations, could affect us both materially and adversely.
11
Table of Contents
In the United States, the Food and Drug Administration regulates medical devices under the Food, Drug, and Cosmetic Act (the “FDC Act”). Before a new medical device can be commercially introduced in the United States, the manufacturer usually must obtain FDA clearance by filing a pre-market notification under Section 510(k) of the FDC Act (a “510(k) Notification”) or obtain FDA approval by filing a pre-market approval application (a “PMA Application”). The PMA Application process is significantly more complex, expensive, time-consuming and uncertain than the 510(k) Notification process. To date, we have cleared all of our regulated products with the FDA through the 510(k) Notification process. We cannot guarantee that we will be able to use the 510(k) Notification process for future products. Furthermore, FDA clearance of a 510(k) Notification or approval of a PMA Application is subject to continual review, and the subsequent discovery of previously unknown facts may result in restrictions on a product’s marketing or withdrawal of the product from the market.
We have pending one 510(k) Notification for our NADIA PSA test. Future tests developed by IMD may require a PMA application. We will try to pursuede novo 510(k) clearance whenever possible. Thede novo process allows a company to submit a 510(k) for a new IVD that would otherwise have to get to market via the PMA process.De novo classification is intended to be used for lower risk IVDs for which no predicate device exists.
We are also required to register as a medical device manufacturer with the FDA and comply with FDA regulations concerning good manufacturing practices for medical devices (“GMP Standards”). In 1997, the FDA expanded the scope of the GMP Standards with new regulations requiring medical device manufacturers to maintain control procedures for the design process, component purchases and instrument servicing. The FDA periodically inspects our manufacturing facilities for compliance with GMP Standards. We believe that we are in substantial compliance with the expanded GMP Standards.
Labeling, advertising and promotional activities for medical devices are subject to scrutiny by the FDA and, in certain instances, by the Federal Trade Commission. The FDA also enforces statutory and policy prohibitions against promoting or marketing medical devices for unapproved uses.
Many states have also enacted statutory provisions regulating medical devices. The State of California’s requirements in this area, in particular, are extensive, and require registration with the state and compliance with regulations similar to the GMP Standards established by the FDA. While the impact of such laws and regulations has not been significant to date, it is possible that future developments in this area could affect us both materially and adversely.
In addition to domestic regulation of medical devices, many of our products are subject to regulations in foreign jurisdictions. The requirements for the sale of medical devices in foreign markets vary widely from country to country, ranging from simple product registrations to detailed submissions similar to those required by the FDA. Our business strategy includes expanding the geographic distribution of these and other products, and we cannot guarantee that we will be able to secure the necessary clearances and approvals in the relevant foreign jurisdictions. Furthermore, the regulations in certain foreign jurisdictions continue to develop and we cannot be sure that new laws or regulations will not have a material adverse effect on our existing business or future plans. Among other things, CE Mark certifications are required for the sale of many products in certain international markets such as the European Community. We secured CE Mark certification for our existing product lines.
We have obtained the ISO 9001, EN 46001 and ISO 13485 certifications for our manufacturing facilities and are subject to surveillance by European notified bodies. During 2005, we received Canadian Medical Devices Conformity Assessment System (CMDCAS) certification and applied for the latest ISO standard, ISO 13485:2003 certification.
Our products are also subject to regulation by the United States Department of Commerce export controls, primarily as they relate to the associated computers and peripherals. We have not experienced any material difficulties in obtaining necessary export licenses to date.
Employees
We had 274 full-time employees at March 1, 2007. We also use outside consultants and part-time and temporary employees in production, administration, marketing and engineering. No employees are covered by collective bargaining agreements, and we believe that our employee relations are satisfactory.
12
Table of Contents
Available Information
Our Internet website address is http://www.proiris.com. Our annual report on Form 10-K, quarterly reports on Form 10-Q, current reports on Form 8-K and amendments to those reports filed or furnished pursuant to Section 13(a) or 15(d) of the Securities Exchange Act of 1934 are available free of charge through our Internet website as soon as reasonably practicable after we electronically file such material with, or furnish such material to, the Securities and Exchange Commission. Our Internet website and the content contained therein or connected thereto are not intended to be incorporated into this Annual Report on Form 10-K.
Related to Our Business
Our success depends largely on the acceptance of our iQ200 and iChem product line.
Our current strategy assumes that our instruments platforms will be adopted by a large number of end-users. We have invested and continue to invest a substantial amount of our resources in promotion and marketing of the iQ200 and iChem product lines in order to increase their market penetration, expand sales into new geographic areas and enhance and expand the system features. Failure of our instrument operating platforms to achieve and maintain a significant market presence, or the failure to successfully implement our promotion and marketing strategy, will have a material adverse effect on our financial condition and results of operations.
Any failure to successfully introduce our future products and systems into the market could adversely affect our business.
The commercial success of our future products and systems depends upon their acceptance by the medical community. Our future product plans include capital-intensive laboratory instruments. We believe that these products can significantly reduce labor costs, improve precision and offer other distinctive benefits to the medical research community. However, there is often market resistance to products that require significant capital expenditures or which eliminate jobs through automation. We have no assurance that the market will accept our future products and systems, or that sale of our future products and systems will grow at the rates expected by our management.
Any failure to successfully develop new products could adversely affect our business.
Our commercial success depends on the timely development of new products that are needed for future growth. These new products depend on our success in demonstrating technical feasibility and achieving cost targets and functionality demanded by the market. Significant delays in product releases will result in budget over-runs and lower revenues.
Failure to achieve significant clinical acceptance of our molecular diagnostics product line would reduce growth and revenue.
Our growth plans assume that the clinical utility of our new products will be demonstrated and widely accepted by the medical community. Failure to achieve clinical acceptance will adversely impact our financial condition and results of operations.
Changes in reimbursement fees or lower than anticipated reimbursement for diagnostics tests could reduce demand and the price at which we can sell our products.
Our customers ability to purchase our instruments and consumables depends on reimbursement fees established by government and insurance agencies. A suspension of reimbursements or a significant reduction in reimbursement fees could reduce demand from our customers for our products or the price at which we can sell our products, both of which would have a material adverse effect in our business.
13
Table of Contents
If we fail to meet changing demands of technology, we may not continue to be able to compete successfully with our competitors.
The market for our products and systems is characterized by rapid technological advances, changes in customer requirements, and frequent new product introductions and enhancements. Our future success depends upon our ability to introduce new products that keep pace with technological developments, enhance current product lines and respond to evolving customer requirements. Our failure to meet these demands could result in a loss of our market share and competitiveness and could harm our revenues and results of operations.
Any failure or inability to protect our technology and confidential information could adversely affect our business.
Patents.Our commercial success depends in part on our ability to protect and maintain our neural network-based Automated Particle Recognition (APR™) and other proprietary technology. We have received patents with respect to portions of the technologies of APR. However, ownership of technology patents may not insulate us from potentially damaging competition. Patent litigation relating to clinical laboratory instrumentation patents (like the ones we own) often involves complex legal and factual questions. Therefore, we can make no assurance that claims under patents currently held by us, or our pending or future patent applications, will be sufficiently broad to adequately protect what we believe to be our proprietary rights. Additionally, one or more of our patents could be circumvented by a competitor. We believe that our proprietary rights do not infringe upon the proprietary rights of third parties. However, third parties may assert infringement claims against us in the future. If we are unsuccessful in our defense against any infringement claim our patents, or patents in which we have licensed rights, may be held invalid and unenforceable.
Trade Secrets.We have trade secrets, unpatented technology and proprietary knowledge related to the sale, promotion, operation, development and manufacturing of our products. We generally enter into confidentiality agreements with our employees, suppliers and consultants. However, we cannot guarantee that our trade secrets, unpatented technology or proprietary knowledge will not become known or be independently developed by competitors. If any of this proprietary information becomes known to third parties, we may have no practical recourse against these parties.
Copyrights and Trademarks.We claim copyrights in our software and the ways in which it assembles and displays images. We also claim trademark rights in the United States and other foreign countries. However, we can make no assurance that we will be able to obtain enforceable copyright and trademark protection, nor that this protection will provide us a significant commercial advantage.
Potential Litigation Expenses.Offensive or defensive litigation regarding patent and other intellectual property rights could be time-consuming and expensive. Additionally, litigation could demand significant attention from our technical and management personnel. Any change in our ability to protect and maintain our proprietary rights could materially and adversely affect our financial condition and results of operations.
Our products could infringe on the intellectual property rights of others.
Given the complete factual and legal issues associated with intellectual property rights, there can be no assurance that our current and future products do not or will not infringe the intellectual property rights of others. A determination that such infringement exists or even a claim that it exists could involve us in costly litigation and result in our inability to use such intellectual property without paying a license fee or at all, all of which could have an adverse effect on our business and financial condition.
14
Table of Contents
We operate in a consolidating industry that creates barriers to our market penetration.
The healthcare industry in recent years has been characterized by consolidation. Large hospital chains and groups of affiliated hospitals prefer to negotiate comprehensive supply contracts for all of their supply needs at once. Large suppliers can often equip an entire laboratory and offer hospital chains and groups one-stop shopping for laboratory instruments, supplies and service. Larger suppliers also typically offer annual rebates to their customers based on the customer’s total volume of business with the supplier. The convenience and rebates offered by these large suppliers are administrative and financial incentives that we do not offer our customers. Our plans for further market penetration in the urinalysis market will depend in part on our ability to overcome these and any new barriers resulting from continued consolidation in the healthcare industry. The failure to overcome such barriers could have a material adverse effect on our financial condition or results of operation.
Since we operate in the medical technology industry, our products are subject to government regulation that could impair our operations.
Most of our products are subject to stringent government regulation in the United States and other countries. These regulatory processes can be lengthy, expensive and uncertain. Additionally, securing necessary clearances or approvals may require the submission of extensive official data and other supporting information. Our failure to comply with applicable requirements could result in fines, recall or seizure of products, total or partial suspension of production, withdrawal of existing product approvals or clearances, refusal to approve or clear new applications or notices, or criminal prosecution. If any of these events were to occur, they could harm our business. Changes in existing federal, state or foreign laws or regulations, or in the interpretation or enforcement of these laws, could also materially and adversely affect our business.
Changes in government regulation of the healthcare industry could adversely affect our business.
Federal and state legislative proposals are periodically introduced or proposed that would affect major changes in the healthcare system, nationally, at the state level or both. Future legislation, regulation or payment policies of Medicare, Medicaid, private health insurance plans, health maintenance organizations and other third-party payors could adversely affect the demand for our current or future products and our ability to sell our products on a profitable basis. Moreover, healthcare legislation is an area of extensive and dynamic change, and we cannot predict future legislative changes in the healthcare field or their impact on our industry or our business. Any impairment in our ability to market our products could have a material adverse effect on our financial condition and results of operation.
We may not be able to realize the deferred tax asset relating to our tax net operating loss carry forward.
As of December 31, 2006, we have deferred tax assets of approximately $8.4 million resulting from the differences between the financial statement and the tax bases of assets and liabilities using enacted tax rates in effect for the year in which the differences are expected to reverse. Management believes it is more likely than not that the deferred tax assets will be realized through future taxable income or alternative tax strategies. However, the net deferred tax assets could be reduced in the near term if management’s estimates of taxable income during the carryforward period are not realized or are significantly reduced or alternative tax strategies are not available. Although we believe that the deferred tax asset is recoverable, there is no assurance that we will be able to generate taxable income in the years that the differences reverse. Also, if we undergo an ownership change as defined in Section 382 of the Internal Revenue Code, NOLs generated prior to the ownership change would be subject to an annual limitation. If this occurs, a valuation allowance may be necessary.
15
Table of Contents
We rely on independent and some single-source suppliers for key components of our instruments. Any delay or disruption in the supply of components may prevent us from selling our products and negatively impact our operations.
Certain of our components are obtained from outside vendors, and the loss or breakdown of our relationships with these outside vendors could subject us to substantial delays in the delivery of our products to our customers. Furthermore certain key components of our instruments are manufactured by only one supplier. For example, ARKRAY is the single source supplier for the AX4280 chemistry analyzer and related consumable products and spare parts. Roche Diagnostics is the sole source for our proprietary CHEMSTRIP/IRIStrip urine test strips and related urine test strip readers, both used in our legacy instruments, the Model 500 and 939UDx urinalysis workstations. Because these suppliers are the only vendors with which we have a relationship for a particular component, we may be unable to sell products if one of these suppliers becomes unwilling or unable to deliver components meeting our specifications. Our inability to sell products to meet delivery schedules could have a material adverse effect on our reputation in the industry, as well as our financial condition and results of operation.
One of our single-source suppliers has terminated its agreement with us.
Roche Diagnostics has exercised its right to terminate its agreements with us relating to the supply of test strips and related urine test strip readers. Roche will continue to supply test strips and replacement readers to our installed base of legacy workstations until 2009. The failure to successfully and timely complete the phase out of their strips and readers with the introduction of our new iQ200 analyzers would have a material adverse affect on our instrument sales and the revenue growth for system consumables and service.
We face intense competition and our failure to compete effectively, particularly against larger, more established companies will cause our business to suffer.
The healthcare industry is highly competitive. We compete in this industry based primarily on product performance, service and price. Many of our competitors have substantially greater financial, technical and human resources than we do, and may also have substantially greater experience in developing products, obtaining regulatory approvals and manufacturing and marketing and distribution. As a result, they may be better able to compete for market share, even in areas in which our products may be superior. Further, our competitive position could be harmed by the establishment of patent protection by our competitors or other companies. The existing competitors or other companies may succeed in developing technologies and products that are more effective or affordable than those being developed by us or that would render our technology and products less competitive or obsolete. If we are unable to effectively compete in our market, our financial condition and results of operation will materially suffer.
Our success depends on our ability to attract, retain and motivate management and other skilled employees.
Our success depends in significant part upon the continued services of key management and skilled personnel. Competition for qualified personnel is intense and there are a limited number of people with knowledge of, and experience in, our industry. We do not have employment agreements with most of our key employees nor maintain life insurance polices on them. The loss of key personnel, especially without advance notice, or our inability to hire or retain qualified personnel, could have a material adverse effect on our instrument sales and our ability to maintain our technological edge. We cannot guarantee that we will continue to retain our key management and skilled personnel, or that we will be able to attract, assimilate and retain other highly qualified personnel in the future.
16
Table of Contents
Defective products may subject us to liability.
Our products are used to gather information for medical decisions and diagnosis. Accordingly, a defect in the design or manufacture of our products, or a failure of our products to perform for the use that we specify, could have a material adverse effect on our reputation in the industry and subject us to claims of liability arising from inaccurate or allegedly inaccurate test results. Misuse of our products by a technician that results in inaccurate or allegedly inaccurate test results could similarly subject us to claims of liability. We currently maintain product liability insurance coverage for up to $1.0 million per incident and up to an aggregate of $2.0 million per year. We also currently maintain a product liability umbrella policy for coverage of claims aggregating to $10.0 million. Although management believes this liability coverage is sufficient protection against future claims, there can be no assurance of the sufficiency of these policies. Any substantial underinsured loss would have a material adverse effect on our financial condition and results of operation. Furthermore, any impairment of our reputation could have a material adverse effect on our sales and prospects for future business. We have not received any indication that our insurance carrier will not renew our product liability insurance at or near current premiums; however, we cannot guarantee that this will continue to be the case. In addition, any failure to comply with Federal Drug Administration regulations governing manufacturing practices could hamper our ability to defend against product liability lawsuits.
Business interruptions could adversely affect our business.
Products for Iris Diagnostics and Sample Processing are manufactured in a single facility for each division, with the exception of our microscopy reagents which are manufactured in both facilities, and are vulnerable to interruption in the event of war, terrorism, fire, earthquake, power loss, floods, telecommunications failure and other events beyond our control. If our facilities were significantly damaged or destroyed by any cause, we would experience delays in locating a new facility and equipment and qualifying the new facility with the FDA. Our results would suffer. In addition, we may not carry adequate business interruption insurance to compensate us for losses that may occur and any losses or damages incurred by us could be substantial.
If we are unable to manage our growth, our results could suffer.
We have been experiencing significant growth in the scope of our operations. This growth has placed significant demands on our management, as well as operational resources. In order to achieve our business objectives, we anticipate that we will need to continue to grow. If this growth occurs, it will continue to place additional significant demands on our management and our operational resources, and will require that we continue to develop and improve our operational, financial and other internal controls both in the US and internationally. In particular, if our growth continues, it will increase the challenges in implementing appropriate control systems, expanding our sales and marketing infrastructure capabilities, providing adequate training and supervision to maintain high quality standards, and preserving our cultural values. The main challenge associated with our growth has been the management of our expenses. Our inability to scale our business appropriately or otherwise adapt to growth, could cause our business, financial condition and results of operations to suffer.
We depend on independent distributors to sell our products in international markets.
We sell our products in international markets through independent distributors. These distributors may not command the necessary resources to effectively market and sell our products. If a distributor fails to meet annual sales goals, it may be difficult and costly to locate an acceptable substitute distributor. If a change in our distributors becomes necessary, we may experience increased costs, as well as substantial disruption and a resulting loss of sales.
Our sales in international markets are subject to a variety of laws and political and economic risks that may adversely impact our sales and results of operations in certain regions.
Our ability to capitalize on growth in international markets is subject to risks including:
| • | changes in currency exchange rates which impact the price to international consumers; |
| • | the burdens of complying with a variety of foreign laws and regulations; |
17
Table of Contents
| • | unexpected changes in regulatory requirements; and |
| • | the difficulties associated with promoting products in unfamiliar cultures. |
We are also subject to general, political, economic and regulatory risks in connection with our international sales operations, including:
| • | political instability; |
| • | changes in diplomatic and trade relationships; |
| • | general economic fluctuations in specific countries or markets; and |
| • | changes in regulatory schemes. |
Any of the above mentioned factors could adversely affect our sales and results of operations in international markets.
We are subject to currency fluctuations.
We are exposed to certain foreign currency risks in the importation of goods from Japan. The line of automated urine chemistry analyzer, some assemblies for our iQ200 platform and related consumables strips and spare parts are sourced from ARKRAY, a supplier located in Kyoto, Japan. Our purchases from this supplier are denominated in Japanese Yen. These components represent a significant portion of our material costs. Fluctuations in the US Dollar/ Japanese Yen exchange rate could result in increased costs for our key components. Any increases would reduce our gross margins and would be likely to result in a material adverse effect on our profitability. Similarly, we are also exposed to currency fluctuations with respect to the exportation of our products. With the exception of France which is denominated in Euros, all of our sales are denominated in US Dollars. Accordingly, any fluctuation in the exchange rate between the US Dollar and the currency of the country with which we are exporting products could also affect our ability to sell internationally. Our strip manufacturing facility in Germany has the US Dollar as its functional currency.
Risks Related to Ownership of Our Common Stock
We have adopted a number of anti-takeover measures that may depress the price of our common stock.
Our shareholders rights plan, our ability to issue additional shares of preferred stock and some provisions of our articles of incorporation and bylaws could make it more difficult for a third party to make an unsolicited takeover attempt of us. Additionally, we are subject to the anti-takeover provisions of Section 203 of the Delaware General Corporation Law, which regulates corporate acquisitions. These anti-takeover measures may depress the price of our common stock by making it more difficult for third parties to acquire us by offering to purchase shares of our stock at a premium to its market price without approval of our board of directors. They could also have the effect of preventing changes in our management.
Our quarterly sales and operating results may fluctuate in future periods, and if we fail to meet expectations the price of our common stock may decline.
Our quarterly sales and operating results have fluctuated significantly in the past and are likely to do so in the future due to a number of factors, many of which are not within our control. If our quarterly sales or operating results fall below the expectations of investors or securities analysts, the price of our common stock could decline substantially. Factors that might cause quarterly fluctuations in our sales and operating results include the following:
| • | variation in demand for our products, including seasonality; |
| • | our ability to develop, introduce, market and gain market acceptance of new products and product enhancements in a timely manner; |
18
Table of Contents
| • | our ability to manage inventories, accounts receivable and cash flows; |
| • | our ability to control costs; |
| • | the size, timing, rescheduling or cancellation of orders from consumers and distributors; and |
| • | our ability to forecast future sales and operating results and subsequently attain them. |
The amount of expenses we incur depends, in part, on our expectations regarding future sales. In particular, we expect to continue incurring substantial expenses relating to the marketing and promotion of our products. Since many of our costs are fixed in the short term, if we have a shortfall in sales, we may be unable to reduce expenses quickly enough to avoid losses. If this occurs, we will not be profitable. Accordingly, you should not rely on quarter-to-quarter comparisons of our operating results as an indication of our future performance.
Item 1B. Unresolved Staff Comments
None
We lease all of our facilities. Our headquarters are located at 9172 Eton Avenue, Chatsworth, California 91311. The table below sets forth certain information regarding our leased properties as of March 1, 2007
Location | Approximate Floor Space (Sq. Ft.) | Monthly Rent | Use | ||||
Chatsworth, CA | 76,462 | $ | 53,529 | Corporate headquarters and manufacturing | |||
Westwood, MA | 22,900 | $ | 23,995 | Sample Processing division | |||
Carlsbad, CA | 6,835 | $ | 11,520 | Molecular Diagnostic research division | |||
Friendswood, TX | 3,000 | $ | 1,700 | Research and development subsidiary | |||
Marburg Germany | 8,539 | $ | 17,939 | Urine chemistry strip manufacturing facility | |||
Paris France | 300 | $ | 1,245 | Sales office | |||
We believe our facilities are adequate to meet our current and near-term needs.
We are not currently involved in any litigation that requires disclosure in this report.
Item 4.Submission of Matters to a Vote of Security Holders
We did not submit any matters to vote of security holders during the quarter ended December 31, 2006.
19
Table of Contents
Item 5.Market for Registrant’s Common Stock and Related Stockholder Matters and Issuer Purchases of Equity Securities
Our common stock is listed on the NASDAQ Global Market under the symbol “IRIS.”
The closing price of the Common Stock on March 1, 2007 was $11.01 per share. The table below sets forth high and low closing prices during the period January 1, 2005 through December 31, 2006:
| Price per share | ||||||
| Low | High | |||||
Fiscal 2006 | ||||||
First Quarter | $ | 14.94 | $ | 23.81 | ||
Second Quarter | 10.94 | 15.51 | ||||
Third Quarter | 7.74 | 14.00 | ||||
Fourth Quarter | 8.68 | 12.85 | ||||
Fiscal 2005 | ||||||
First Quarter | $ | 8.96 | $ | 11.51 | ||
Second Quarter | 11.22 | 19.11 | ||||
Third Quarter | 14.02 | 19.36 | ||||
Fourth Quarter | 19.00 | 27.96 | ||||
As of March 1, 2007 we had approximately 2,400 holders of record of our common stock.
We have never paid any cash dividends. We presently intend to retain any future earnings for use in our business. Furthermore, we may not pay any cash dividends on the common stock, or repurchase any shares of the common stock, without the written consent of our lender.
20
Table of Contents
FIVE-YEAR STOCK PRICE PERFORMANCE COMPARISON
The following graph and table compare the cumulative total return on the Company’s Common Stock with the cumulative total return (including reinvested dividends) of the Standard & Poor’s 500 Index (S&P 500), the NASDAQ Medical Devices, Instruments and Supplies, Manufacturers and Distributors Stocks Index and the Standard & Poor’s HealthCare Equipment Index for the five years ending December 31, 2006, assuming that the relative value of the Common Stock and each index was $100 on December 31, 2001. Amounts below have been rounded to the nearest dollar. The stock price performance on the following graph is not necessarily indicative of future stock price performance.
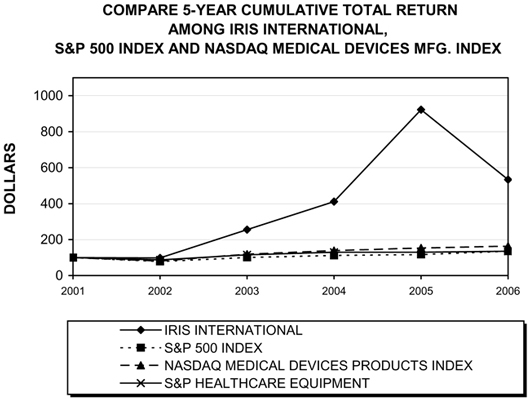
21
Table of Contents
Item 6.Selected Financial Data
The following selected financial data should be read in conjunction with our consolidated financial statements. The information set forth below is not necessarily indicative of results of future operations, and should be read in conjunction with Item 7, “Management’s Discussion and Analysis of Financial Condition and Results of Operations” and the consolidated financial statements and notes thereto included in Item 8, “Financial Statements and Supplementary Data” of this Form 10-K in order to understand fully factors that may affect the comparability of the financial data presented below.
| Year Ended December 31, | |||||||||||||||||||
| 2006 | 2005 | 2004 | 2003 | 2002 | |||||||||||||||
| (in thousands, except per share data) | |||||||||||||||||||
Statement of Operations Data: | |||||||||||||||||||
Revenues | $ | 70,494 | $ | 62,780 | $ | 43,650 | $ | 31,345 | $ | 28,188 | |||||||||
Operating income (loss) from continuing operations | 1,049 | 8,941 | 4,465 | (543 | ) | 1,902 | |||||||||||||
Interest and other income (expense), net | 1,089 | 605 | (666 | ) | (340 | ) | (441 | ) | |||||||||||
Net income (loss) | (175 | ) | 6,131 | 2,280 | (530 | ) | 877 | ||||||||||||
Basic net income (loss) per share | (0.01 | ) | 0.37 | 0.16 | (0.05 | ) | 0.08 | ||||||||||||
Diluted net income (loss) per share | (0.01 | ) | 0.35 | 0.14 | (0.05 | ) | 0.08 | ||||||||||||
Balance Sheet Data: | |||||||||||||||||||
Working capital | 37,283 | 33,879 | 24,959 | 6,614 | 6,445 | ||||||||||||||
Total assets | 74,317 | 63,929 | 48,136 | 32,480 | 27,223 | ||||||||||||||
Total debt | -0- | -0- | -0- | 5,032 | 4,245 | ||||||||||||||
Total liabilities | 11,751 | 10,160 | 8,963 | 13,013 | 9,874 | ||||||||||||||
Shareholders’ equity | 62,566 | 53,769 | 39,173 | 19,467 | 17,349 | ||||||||||||||
| 1. | 2006 results include the effect of the acquisition in April 2006 of Leucadia Technologies, Inc. We recorded a $5.2 million charge for purchased in-process research and development. In addition we incurred additional research and development expenses of $1.8 million since the date of the acquisition. |
| 2. | 2006 results also includes incremental stock based compensation expense of approximately $1.0 million as a result of implementing SFAS 123R as of January 1, 2006. |
| 3. | In June 2005, we acquired the operations of the urinalysis business of Quidel Corporation. The results for the remainder of 2005 and 2006 were negatively impacted by the cost of the acquired chemistry strip manufacturing facility in Germany operating below capacity which amounted to approximately $364,000 in 2005 and $1.0 million in 2006. |
| 4. | 2004 results included by the write down of a security held for sale in the amount of $531,000. |
| 5. | 2003 was impacted by the delay in the launch of the iQ200 analyzer plus an additional $1.2 million in severance costs. |
22
Table of Contents
Item 7.Management’s Discussion and Analysis of Financial Condition and Results of Operations
Overview
IRIS International, Inc. consists of three operating units in two business segments as determined in accordance with SFAS 131. Our largest unit, Iris Diagnostics Division, designs, manufactures and markets in vitro diagnostics (IVD) systems, consumables and supplies for urinalysis. Our Sample Processing division markets small centrifuges and other processing equipment and accessories for rapid specimen processing, and our Advanced Digital Imaging and Research LLC (ADIR) subsidiary assists in the advancement of proprietary imaging technology while conducting government-sponsored research and contract development in imaging and pattern recognition. With the acquisition IMD, we acquired significant core technology for an ultra-sensitive immunoassay process and novel in-vitro separation and concentration process as well as in-process research and development for bacteria and cancer detection applications.
We generate revenues primarily from: sales of IVD instruments, IVD consumables and service and sample processing instruments and supplies. Revenues from IVD instruments include sales of urine microscopy and chemistry analyzers manufactured by us and urine chemistry analyzers sourced from a Japanese manufacturer. We sell the urine microscopy analyzers and the iChem 100; our new semi-automated chemistry analyzer introduced in the third quarter of 2006 on a global basis and distribute the other chemistry analyzers domestically only. Consumables include products such as chemical reagents and urine test strips. Service revenues are derived primarily from annual service contracts purchased by our domestic customers after the initial year of sale, which is covered by product warranties spare parts from international customers. Once the analyzers are installed, we generate recurring revenue from sales of consumables. Consumable and service revenue will continue to expand as the installed base of related instruments increases. Revenue is also generated from sales of sample processing instruments and related supplies, which primarily consists of centrifuge systems, DNA processing workstations and blood analysis products.
Domestic sales of our automated urinalysis systems are direct to the customer through our sales force. With the introduction of our first proprietary chemistry products, the iChem 100 and vChem strips, we implemented a distribution network consisting of the major medical device distributors in the US to sell to physician office laboratories and other smaller volume laboratories. In addition, Med Tech Associates, a professional manufacturer’s representation organization with nationwide coverage, is providing field-level product sales support activities for our chemistry products. International sales, with the exception of France, are through independent distributors. Sales in France are direct to end use customers. International sales represented 28% of consolidated revenues in 2006 as compared to 30% in 2005. Since the launch of our iQ200 product line, we have increased our sales efforts in the international marketplace, with the ultimate goal of balancing our urinalysis business between domestic and international markets. Since international sales are made through independent distributors, gross profit margin is lower than domestic sales of the same products, but we do not incur sales and marketing costs for such sales. Our Sample Processing products are sold worldwide through distributors.
On April 3, 2006 we acquired the stock of IMD (formerly Leucadia Technologies, Inc.), a development stage molecular diagnostics company. With this acquisition we acquired significant core technology for an ultra-sensitive immunoassay process and novel in-vitro separation and concentration process as well as in-process research and development for bacteria and cancer detection applications.
Pursuant to the IMD acquisition agreement, we paid $3.3 million of cash, 272,375 shares of IRIS common stock, valued at $4.2 million, deferred stock units for 51,879 shares of IRIS common stock valued at $800,000 and $230,000 of transaction fees. The IRIS common stock and deferred stock units were valued based on the average closing market price of IRIS common stock a few days before and a few days following the acquisition. In addition, we will issue up to 108,950 shares of IRIS common stock and deferred stock units for 20,752 shares of IRIS common stock as earn-out consideration if certain regulatory and sales milestones are achieved.
23
Table of Contents
On June 2, 2005, we completed the acquisition of the assets (primarily technology and inventory) of the urinalysis business of Quidel Corporation. Our total acquisition cost amounted to $777,000. With this acquisition, we acquired significant core technology and know-how in urine chemistry strips, patents and trademarks, product designs, a strip manufacturing facility in Germany and a semi-automated urine chemistry analyzer that will enable us to offer a more complete product line internationally.
We make significant investments in research and development for new products and enhancements to existing products. We internally fund research and development programs, and through ADIR, we also receive government grants to fund various research activities.
The following table summarizes product technology expenditures for the periods indicated:
| 2006 | 2005 | 2004 | ||||||||||
| (in thousands) | ||||||||||||
Total product technology expenditures during year | $ | 14,937 | $ | 6,857 | $ | 5,448 | ||||||
Less: amounts capitalized during year to software development costs as reported in the consolidated statements of cash flow | (376 | ) | (171 | ) | (64 | ) | ||||||
Less: amounts reimbursed through grants for government sponsored research and development | (1,475 | ) | (1,649 | ) | (1,464 | ) | ||||||
Research and development expense as reported in the consolidated statements of operations | $ | 13,086 | $ | 5,037 | $ | 3,920 | ||||||
Year in Review
The year ended December 31, 2006 turned into another transition year for our company with significant investments in infrastructure and new technology necessary to support and expand our business at a fast and sustained pace for future periods and to strengthen our global competitive position. This year’s results were affected by certain large and special charges related to the accounting of acquisitions, transition of senior executives, bad debt and inventory write-downs. In addition, the Company expended over $7.6 million for an acquisition and capital expenditures during the year, with operating cash flows showing a substantial increase to $9.7 million up from $4.5 million in the prior year.
In 2005, with the acquisition of a product line and a dry chemistry strip manufacturing facility in Germany, we decided to make a significant investment in the urine chemistry segment in order to develop a proprietary line of urine chemistry products. In 2006, significant resources were allocated to improve the acquired semi-automated product line and to initiate the development of an expanded proprietary urine product lines covering both the automated and CLIA-waived urine chemistry segments. In addition, we acquired a molecular diagnostics company, Leucadia Technologies to enable new products in the field of urine bacteria, rare cell detection, cancer diagnostics and infectious diseases. As a result of the acquisition, R & D expenses increased in 2006 by approximately $8.0 million, including a non tax-deductible, non-cash charge of $5.2 million related to the allocation of a portion of the purchase price to in-process research and development. During the year we also implemented SFAS 123R that resulted in additional stock based compensation expense of approximately $1.1 million.
Our results for 2006 amounted to a net loss of $175,000 or $0.01 per share on revenues of $70.5 million with gross profits increasing 11% over the prior year to $34.7 million.
Critical Accounting Policies
The preparation of financial statements and related disclosures in conformity with U.S. generally accepted accounting principles and our discussion and analysis of our financial condition and results of operations require us to make judgments, assumptions, and estimates that affect the amounts reported in our consolidated financial statements and accompanying notes. Note 2 of the Notes to Consolidated Financial Statements of this Form 10–K describes the significant accounting policies and methods used in the preparation of our consolidated financial statements. We base our estimates on historical experience and on various other assumptions we believe to be reasonable under the circumstances, the results of which form the basis for making judgments about the carrying values of assets and liabilities. We regularly discuss with our audit committee the basis of our estimates. Actual results may differ from these estimates and such differences may be material.
24
Table of Contents
We believe the following critical accounting policies, among others, affect our more significant judgments and estimates used in the preparation of our consolidated financial statements:
Revenue recognition –Revenues are primarily derived from the sale of IVD instruments, sales of consumable supplies and services for IVD systems as well as sales of sample processing instruments and related supplies. Revenue is recognized once all of the following conditions have been met: a) an authorized purchase order has been received in writing with a fixed and determinable sales price, b) customer credit worthiness has been established, and c) delivery of the product based on shipping terms. The majority of domestic IVD instrument sales generally include installation and training to be performed.
Revenue is recorded in accordance with the provisions of Emerging Issues Task Force (EITF) Statement 00-21 “Revenue Arrangements with Multiple Deliverables” and Staff Accounting Bulletin (SAB) 104 “Revenue Recognition in Financial Statements which generally requires revenue earned on product sales involving multiple-elements to be allocated to each element based on the relative fair values of those elements if sold separately. Multiple elements of certain domestic product sales include IVD instruments, training, consumables and service.
Accordingly, we allocate revenue to each element in a multiple element arrangement based on the element’s respective fair value, with the fair value determined by the price charged when that element is sold separately and specifically defined in a quotation or contract.
A portion of our revenues are derived from sale-type leases as we provide lease financing to certain customers that purchase our diagnostic instruments. Leases under these arrangements are classified as sales-type leases. These leases typically have terms of five years. Revenue from sales-type leases is recognized when collectibility of the minimum lease payments is reasonably predictable and no important uncertainties surround the amount of unreimbursable costs yet to be incurred by us as lessor under the lease. The minimum lease payments that accrue to our benefit as lessor are recorded as the gross investment in the lease. The difference between the gross investment in the lease and the sum of the present value of the minimum lease payments and unguaranteed residual value, accruing to our benefit as lessor, are recorded as unearned income.
We have certain government contracts with cancellation clauses or renewal provisions that are generally required by law, such as 1) those dependant on fiscal funding outside of a governmental unit’s control, 2) those that can be cancelled if deemed in the tax payers’ best interest or 3) those that must be renewed each fiscal year, given limitations that may exist on multi-year contracts that are imposed by statute. Under these circumstances and in accordance with the relevant accounting literature, as well as considering our historical experience, a thorough evaluation of these contracts is performed to assess whether cancellation is remote or whether exercise of the renewal option is reasonably assured.
We recognize revenues from service contracts ratably over the term of the service period, which typically ranges from twelve to sixty months. Payments for service contracts are generally received in advance. Deferred revenue represents the revenues to be recognized over the remaining term of the service contracts.
Inventory valuation –We value inventories at the lower of cost or market value on a first-in, first-out basis. Provision for potentially obsolete or slow-moving inventory is made based on management’s analysis of inventory levels and future sales forecasts. We recognize that although we have introduced our new iQ200 product line of analyzers, an installed based of our legacy products still exist. We maintain a base supply of service parts for these products, a portion of which is classified as a long-term asset on our balance sheet. Management will periodically review the carrying value of such parts to ensure that they continue to equal or not exceed net realizable value.
Goodwill and Core Technology – Our intangible assets consist of goodwill, which is not being amortized and core technology, which is being amortized over its useful life of 20 years. All intangible assets are subject to impairment tests on an annual or periodic basis. Goodwill is evaluated in accordance with Statement of Financial Accounting Standards (“SFAS”) No. 142 based on various analyses, including cash flow and profitability projections. The analysis necessarily involves significant management judgment to evaluate the capacity of an acquired business to perform within projections. Core technology is evaluated for impairment using the methodology set forth in SFAS No. 144,Accounting for the Impairment or Disposal of Long-Lived Assets (SFAS No. 144). Recoverability of these assets is assessed only when events have occurred that may give rise to a potential impairment. When a potential impairment has been identified, forecasted undiscounted net cash flows of the operations to which the asset relates are compared to the current carrying value of the long-lived assets present in that operation. If such cash flows are less than such carrying amounts, long-lived assets, including such intangibles, are written down to their respective fair values.
At December 31, 2006, we evaluated goodwill and determined that fair value had not decreased below carrying value and no adjustment to impair goodwill was necessary in accordance with Statement of Financial Accounting Standards (“SFAS”) No. 142, “Goodwill and Other Intangible Assets.” Substantially all of the goodwill resides in the IMD reporting unit.
25
Table of Contents
Capitalized software –We capitalize software development costs in connection with our development of our urine analyzers in accordance with Statement of Financial Accounting Standards (“SFAS”) No. 86, “Accounting for the Cost of Capitalized Software to Be Sold, Leased or Otherwise Marketed.” We capitalize software development costs once technological feasibility is established and such costs are determined to be recoverable against future revenues.
Capitalized software development costs are expensed to cost of sales over periods up to five years. When, in management’s estimate, future revenues will not be sufficient to recover previously capitalized software development costs, we will expense such items as additional software development amortization in the period the impairment is identified. Such adjustments are normally attributable to changes in market conditions or product quality considerations.
Income taxes – We account for income taxes in accordance with SFAS No. 109 “Accounting for Income Taxes,” which requires recognition of deferred tax liabilities and assets for the expected future tax consequences of events that have been included in the financial statements or tax returns. Under this method, deferred tax liabilities and assets are determined based on the differences between the financial statement and the tax bases of assets and liabilities using enacted tax rates in effect for the year in which the differences are expected to reverse. Valuation allowances are established when necessary to reduce deferred tax assets to the amount expected to be realized. Income tax expense represents the tax payable for the period and the change during the period in deferred tax assets and liabilities.
Stock based compensation – Effective January 1, 2006 we implemented the provisions of SFAS No. 123R, “Share-Based Payment,” that establishes standards for accounting for transactions in which a company exchanges its equity instruments for goods and services or incurs a liability in exchange for goods and services that is based on the fair value of the entity’s equity instruments or that may be settled by the issuance of those equity instruments. The primary focus of this pronouncement is on issuing share-based payments for services provided by employees. This pronouncement also requires recognition of compensation expense for new equity instruments awarded or for modifications, cancellations or repurchases of existing awards starting January 1, 2006. Compensation expense for new equity awards, in most cases, will be based on the fair value of the stock on the date of grant and will be recognized over the vesting service period. An award of a liability instrument, as defined by this pronouncement, will initially be recorded at fair value and will be adjusted each reporting period to the new fair value through the date of settlement. Under the terms of this pronouncement, we began to expense equity awards using a modified version of prospective application.
Under that transition method, compensation cost is recognized on or after the required effective date for the portion of outstanding awards, for which the requisite service has not yet been rendered, based on the fair value of those awards on their respective grant dates.
Prior to implementation of SFAS 123R, we accounted for stock based compensation using the intrinsic method provided by Accounting Principles Board Opinion No. 25. On October 27, 2005, our Board of Directors passed a resolution whereby all outstanding employee stock options to be vested 100% and we recorded a charge of $112,000 representing an estimate for employee turnover during the remaining vesting period. The purpose of this action was to mitigate the effect on future earnings of implementing SFAS 123R.
Future periods will be impacted by the provisions of SFAS 123R, the extent to which stock options granted during 2006 and additional options, if any, to be granted in future periods.
26
Table of Contents
Results of Operations
The following table summarizes results of operations data for the periods indicated. The percentages in the table are based on total revenues with the exception of percentages for cost of goods sold which are computed on related revenue.
| Year ended December 31, | ||||||||||||||||||||
| (in thousands) | 2006 | 2005 | 2004 | |||||||||||||||||
Revenues | ||||||||||||||||||||
IVD instruments | $ | 29,065 | 41 | % | $ | 27,542 | 44 | % | $ | 14,845 | 34 | % | ||||||||
IVD consumables and service | 30,295 | 43 | % | 25,708 | 41 | % | 20,126 | 46 | % | |||||||||||
Sample Processing instruments and supplies | 11,134 | 16 | % | 9,530 | 15 | % | 8,343 | 19 | % | |||||||||||
Royalty and license revenues | — | — | — | — | 336 | 1 | % | |||||||||||||
Total revenues | 70,494 | 100 | % | 62,780 | 100 | % | 43,650 | 100 | % | |||||||||||
Gross Profit * | ||||||||||||||||||||
IVD instruments | 13,461 | 46 | % | 12,086 | 44 | % | 4,753 | 32 | % | |||||||||||
IVD consumable and supplies | 15,931 | 53 | % | 14,524 | 56 | % | 12,144 | 60 | % | |||||||||||
Sample Processing instruments and supplies | 5,319 | 48 | % | 4,535 | 48 | % | 4,158 | 50 | % | |||||||||||
Royalty and license revenues | — | — | 336 | |||||||||||||||||
Gross profit | 34,711 | 49 | % | 31,145 | 50 | % | 21,391 | 49 | % | |||||||||||
Operating expenses | ||||||||||||||||||||
Marketing and selling | 10,593 | 15 | % | 10,026 | 16 | % | 7,165 | 16 | % | |||||||||||
General and administrative | 9,983 | 14 | % | 7,141 | 11 | % | 5,841 | 13 | % | |||||||||||
Research and development, net | 13,086 | 18 | % | 5,037 | 8 | % | 3,920 | 9 | % | |||||||||||
Total operating expenses | 33,662 | 48 | % | 22,204 | 35 | % | 16,926 | 39 | % | |||||||||||
Operating income | 1,049 | 1 | % | 8,941 | 14 | % | 4,465 | 10 | % | |||||||||||
Other income (expense) | 1,089 | 605 | (666 | ) | ||||||||||||||||
Income before for income taxes | 2,138 | 3 | % | 9,546 | 15 | % | 3,799 | 9 | % | |||||||||||
Income taxes** | 2,313 | 108 | % | 3,415 | 36 | % | 1,519 | 40 | % | |||||||||||
Net income (loss) | $ | (175 | ) | 1 | % | $ | 6,131 | 10 | % | $ | 2,280 | 5 | % | |||||||
| * | Gross profit margin percentages are based on the related sales of each category. |
| ** | Income tax percentage is computed based on the relationship of income taxes to pre-tax income. During 2006 we acquired in-process research and development amounting to $5.2 million which is not deductible for tax purposes. |
Comparison of Year Ended December 31, 2006 to 2005
Revenues for the year ended December 31, 2006 increased by 12% over the prior year. Revenues in the IVD urinalysis segment increased to $59.4 million in 2006, from $53.3 million in the prior year. Sales of IVD instruments increased to $29.1 million from $27.5 million. The increase in instrument sales is primarily due to increased sales to domestic customers as compared to international customers. We sell our instruments and consumables direct to customers domestically. In the international market, the average sale prices of the iQ200 analyzer and related consumables are lower due to the fact that such sales, with the exception of France, are made through independent distributors in approximately 60 countries. International revenues accounted for approximately 28% of consolidated revenue during 2006 compared to 30% during 2005. We also continue to service and support the installed base of legacy systems discontinued in 2004. Sales of IVD consumables and service increased during the year to $30.3 million from $25.7 million, an increase of $4.6 million or 18% over 2005, primarily due to the larger installed base of instruments. Revenues from the sample processing instruments and supplies increased to $11.1 million up from $9.5 million, a 17% increase over 2005. This increase is primarily due to increased sales of new products (the Express3 centrifuge and the DNA ThermoBrite).
Our unit volume of instruments sold during 2006 was approximately the same as 2005 with the number of units sold domestically increasing by 26% whereas the number of units sold internationally decreased 13%. Included in the domestic increase were several multi-site multi-unit orders awarded by major laboratories and hospital chains in the second half of 2006. Domestically, we sell the iQ200 microscopy analyzers separately or combined with a chemistry analyzer, which we acquire from a Japanese
27
Table of Contents
company. The majority of domestic sales are sold as combined systems. Internationally, we sell our iQ200 microscopy analyzer separately or with our semi-automated chemistry analyzer, as we do not have the distribution rights for the fully automated chemistry analyzer. We plan on offering a fully automated chemistry analyzer that we are developing internally, internationally by the end of 2007.
Overall gross profit margins decreased slightly from 50% in 2005 to 49% in 2006. The gross profit margin of our IVD instruments increased to 46% in 2006 up from 44% in 2005 primarily due to increased sales of the iQ Sprint and the mix of instruments sold domestically versus internationally. The gross margin of our IVD consumables and services decreased to 53% during 2006 compared to 56% in 2005. The decrease resulted from the cost of our chemistry strip manufacturing operation acquired in June 2005 which is currently operating below capacity as well as increased costs associated with additional personnel for domestic service in order to improve customer service response times and a significant increase in the percentage of iQ200 analyzers under warranty. Our German strip manufacturing facility is expected to continue to operate below capacity until we launch our new automated urine chemistry analyzer later this year. Gross profit margin for our sample processing laboratory instrument and supply segment amounted to 48% in both 2006 and 2005.
Marketing and selling expenses totaled $10.6 million, as compared to $10.0 million in 2005, but as a percentage of revenues, marketing and selling expenses decreased to 15% in 2006 versus 16% in 2005. The increase includes additional personnel costs of $468,000; stock based compensation expense of $125,000; higher fees paid to GPOs (group purchasing organizations) of $114,000; plus travel and related costs of $138,000 due to increased sales to domestic customers. The increases were partially offset by decrease in professional fees of $101,000 and other selling costs totaling approximately $180,000.
General and administrative expenses increased to $10.0 million compared to $7.1 million in the prior year. The increase includes: severance and other costs relating to the CFO transitions during 2006 amounting to approximately $743,000; higher employee salaries and related benefits of $714,000; increased stock based compensation costs of $483,000 primarily associated with the adoption of SFAS 123R; higher professional fees relating to auditing services and compliance with Sarbanes Oxley Act – Section 404 amounting to $244,000 and an increase in bad debt reserves of $420,000.
Research and development expense amounted to $13.1 million during 2006 as compared to $5.0 million in the prior year. As a result of our acquisition of IMD on April 3, 2006, we acquired significant in-process research and development expense for bacteria and cancer detection applications which we valued at $5.2 million and is included in our research and development expense. The increase in research and development expense also includes approximately $1.8 million relating to molecular diagnostics programs initiated with our acquisition of Leucadia Technologies and approximately $800,000 of incremental development expenses primarily related to the design of our new automated urine chemistry analyzer for the international market. Research and development expenses were net of reimbursed costs received from governmental research and development grants for our ADIR subsidiary, which amounted to $1.5 million and $1.6 million during 2006 and 2005.
Interest income during 2006 amounted to $1.1 million, a $461,000 increase over 2005 and relates to our continued investment of excess cash during the year as well as interest earned on lease financing from the sale of instruments to customers. Our sales-type lease financings increased to $8.9 million at December 31, 2006 compared to $7.3 million the prior year.
Income tax expense during the year amounted to 108% of pre-tax income as compared to 36% during the prior year. The increase in the income tax provision results from the exclusion of $5.2 million for purchased in-process research and development not deductible for tax purposes. The tax provision continues to be primarily a non-cash expense, since we have significant deferred tax assets relating to tax loss carryforwards. Our tax loss carryforward amounts to approximately $9.4 million as of December 31, 2006. In addition, we also have research and development and other tax credit carryovers totaling $3.9 million, net of valuation allowances.
28
Table of Contents
Comparison of Year Ended December 31, 2005 to 2004
Revenues for the year ended December 31, 2005 increased by 44% over the prior year. Revenues in the IVD segment increased 51% to $53.3 million in 2005, up from $35.3 million in the prior year. Sales of IVD instruments increased to $27.5 million from $14.8 million, an increase of $12.7 million, or 86% over our 2004 sales. The increase was primarily due to the demand for the iQ200 product line. In 2004, we discontinued sales of our legacy instrument systems. We will continue to service and support the installed base of legacy systems until such time as all customers convert to our iQ200 systems. Sales of IVD consumables and service increased during 2005 to $25.7 million from $20.1 million, an increase of $5.6 million or 28% over 2004, primarily due to the larger installed base of instruments. Revenues from the sample processing instruments and supplies increased to $9.5 million from $8.3 million, or 14% over 2004. This increase is primarily due to increased sales of centrifuges, parts and service within this segment.
Our unit volume of instruments sold increased substantially during 2005 with average revenue per system sold domestically up approximately 6%, whereas, international revenue per instrument was up approximately 5% as compared to the previous year. Unit sales of the iQ200 microscopy analyzer since its launch in 2003 increased to 777 units as of December 31, 2005. 437 iQ200 analyzers were sold during 2005 as compared to 234 during 2004. Domestically, we sell the iQ200 microscopy analyzer separately or combined with a chemistry analyzer, which we acquire from a Japanese company. A majority of domestic sales are sold as systems and include an iQ200 microscopy analyzer and a chemistry analyzer. We sell our instruments and consumables direct to customers domestically. In the international market, the average sale prices of the iQ200 analyzer and related consumables are lower due to the fact that such sales, with the exception of France, are made through independent distributors in 60 countries. International revenues accounted for 30% of consolidated revenue during 2005 compared to 18% during 2004.
Overall gross profit margin increased from 49% in 2004 to 50% in 2005. The gross profit margin of our IVD instruments increased to 44% in 2005 up from 32% in 2004 primarily due to cost reduction programs and increased efficiencies related to volume of the iQ200 microscopy analyzers. The gross margin of our IVD consumables and services decreased to 56% during 2005 compared to 60% in 2004. The decrease resulted primarily from the acquisition of the chemistry strip manufacturing operation acquired in June 2005 which operated below capacity. Gross profit margin for our sample processing laboratory instrument and supply segment amounted to 48% in 2005, compared to 50% for 2004. This decrease was due to a combination of lower margins on increased sales to OEM accounts at lower gross profit margins, new product introduction expenses and costs related to the move to a new facility for this division.
Marketing and selling expenses totaled $10.0 million during 2005, as compared to $7.2 million in 2004. As a percentage of sales, such expenses were 16% of revenues during both 2005 and 2004. The dollar increase relates to additional payroll-related expenditures of $1.5 million; expanded participation in industry shows of $184,000; increased commissions on higher revenue of $213,000; fees paid to GPOs (group purchasing organizations) of $198,000; expanded marketing research and professional support of $266,000; and travel and related costs of $400,000.
General and administrative expenses increased during 2005 to $7.1 million from $5.8 million in the prior year. The $1.3 million increase is comprised of the following: payroll-related expenses due to additional employees of $553,000; outside consultants increased costs of $394,000; increased amortization of deferred compensation related to our employee stock ownership program of $134,000; additional Sarbanes Oxley compliance costs of $129,000 and higher recruiting fees of $111,000.
Research and development expenses increased to $5.0 million for 2005, as compared to $3.9 million in 2004. Research and Development expenses were net of capitalized software development costs during the year of $171,000 and reimbursed costs under research and development grants and contracts of $1.6 million related to our ADIR division. R&D expenses increased due to product development activity for new product platforms currently in development. Prior year expenditures related primarily to the development of the iQ200Sprint instrument, released in the first quarter of 2005, plus ongoing development activities relating to enhancements to existing product lines and research into new products. We expect to continue to invest in research and development during 2006 at an increased rate compared to 2005.
29
Table of Contents
Interest income during 2005 amounted to $607,000, an increase from $111,000 in 2004 and relates to our investment of cash during the year and interest earned on lease financing from the sale of instruments to customers. Interest expense decreased $15,000 in 2005 as a result of repayment of outstanding debt the second quarter of 2004. Other expense in 2004 included the permanent write-down of a security held for sale in the amount of $531,000. During 2005, this security was sold.
Income tax expense during the year amounted to 36% of pre-tax income as compared to 40%. The improvement resulted primarily from tax credits realized from research and development activities. The tax provision is a non-cash item, since we have significant deferred tax assets, primarily relating to tax loss carryforwards.
Contractual Obligations and Contingent Liabilities and Commitments
The following table aggregates our expected minimum contractual obligations and commitments subsequent to December 31, 2006:
Contractual Obligations (In thousands)* | Total | Less than 1 year | 1-3 years | 3-5 years | More than 5 years | ||||||||||
Operating lease commitments | $ | 5,621 | $ | 1,308 | $ | 2,508 | $ | 866 | $ | 939 | |||||
| * | Not included in the table above are normal recurring accounts payable or accrued expenses which are presented on the accompanying consolidated financial statements. On December 13, 2006, the Board of Directors adopted a resolution authorizing the Company to provide lease automobiles to field service and sales personnel commencing in 2007. The estimated cost for the leased vehicles over a 48 month period is expected to be approximately $555,000 plus operating costs. |
Off-Balance Sheet Arrangements
At December 31, 2006 and 2005, we did not have any relationships with unconsolidated entities or financial partnerships, such as entities often referred to as structured finance or special purpose entities, which would have been established for the purpose of facilitating off-balance sheet arrangements or other contractually narrow or limited purposes. As such, we are not exposed to any financing, liquidity, market or credit risk that could arise if we had engaged in such relationships.
Liquidity and Capital Resources
Our primary source of liquidity is cash from operations, which depends heavily on sales of our IVD instruments, consumables and service, as well as sales of sample processing instruments and supplies. At December 31, 2006, our cash and cash equivalents amounted to $23.2 million.
Operating Cash Flows.Cash flow provided by operations for the year ended December 31, 2006 increased significantly to $9.7 million compared to $4.5 million in the prior year. Our 2006 results of operations include $10 million in non-cash items as follows: $5.2 million in-process research and development expenditures; $1.9 million in deferred taxes; $2.1 million from depreciation and amortization and $1.6 million stock based compensation expense. In addition cash flow was strengthened by $2.4 million of increased accounts payable, accrued expenses and lower inventory levels. The improvement was partially offset by the investment of an additional $1.6 million in financing sales-type leases for customers.
The relationship of receivables to revenues has decreased over the prior year. The number of days sales in accounts receivable decreased to 68 at the end of 2006 compared to 69 days at the end of 2005. The number of days sales in inventory decreased to 75 days at the end of 2006 compared to 95 days at the end of 2005. The lower number of days sales in inventory is due to; higher sales volume and improved inventory planning procedures and reduced amount of lead-time required for safety stock on hand. In addition the level of inventory on hand for the Legacy product line continued to decrease during 2006.
Our cash flow continues to be favorably affected by the fact that we have net operating loss carry forwards of $9.4 million for federal and $1.0 million for state. We also have tax credit carry forwards of $2.2 million for federal and $1.7 million for state, net of valuation allowances. We continue to realize tax deductions from both the exercise of stock options and the purchase by employees of our common stock at a discount to market. During the year ended December 31, 2006, we realized tax deductions of approximately $0.9 million relating to these items.
30
Table of Contents
Investing Activities.Cash provided in investing activities totaled $7.9 million in 2006 primarily as a result of converting $15.8 million of short term cash investments to cash in 2006. In addition we expended $3.6 million to acquire Leucadia Technologies and property and equipment purchases of $4.0 million. Property and equipment expenditures in 2006 include $1.9 million for facility expansion and upgrading our California and Massachusetts locations, and $300,000 for production equipment. During 2005 $1.4 million was expended on property and equipment and approximately $0.7 million was used for an acquisition.
Financing Activities.For the year ended December 31, 2006, financing activities provided $2.4 million primarily from the issuances of common stock for stock options as well as purchases of shares by employees through the Company’s Employee Stock Purchase Plan compared to $4.0 million received during 2005. We also realized tax deductions benefits from the exercise of stock options. During the year ended December 31, 2006, we realized such tax benefits of approximately $0.9 million during 2006.
We currently have a credit facility with a commercial bank consisting of a $6.5 million revolving line of credit for working capital and a $10.0 million line of credit for acquisitions and product opportunities. Borrowings under the revolving line of credit are limited to a percentage of eligible receivables and inventory. The entire credit facility has variable interest rates, which will change from time to time based on changes to either the LIBOR rate or the lender’s prime rate. As of December 31, 2006, there were no borrowings under the new credit facility. We are subject to certain financial covenants under the credit facility with the bank and as of December 31, 2006, we were in compliance with such covenants.
We believe that our current cash on hand, together with cash generated from operations and cash available under the credit facility with the bank will be sufficient to fund normal operations. However additional funding may be required to fund expansion of our business. There is no assurance that such funding will be available, on terms acceptable to us.
New Accounting Pronouncements
In March 2006, the FASB issued EITF 06-3, “How Taxes Collected from Customers and Remitted to Governmental Authorities Should Be Presented in the Income Statement (That is, Gross versus Net Presentation)” that clarifies how a company discloses its recording of taxes collected that are imposed on revenue producing activities. EITF 06-3 is effective for the first interim reporting period beginning after December 31, 2006. The Company currently reports revenue on a net basis. The Company does not expect application of EITF No. 06-03 to have any effect on the Company’s consolidated results of operations, financial position or cash flows.
In June 2006, the FASB issued FASB Interpretation No. 48, Accounting for Uncertainty in Income Taxes, (FIN 48) an interpretation of FASB Statement No. 109, Accounting for Income Taxes. FIN 48 requires that a position taken or expected to be taken in a tax return be recognized in the financial statements when it is more likely than not (i.e. a likelihood of more than fifty percent) that the position would be sustained upon examination by tax authorities. A recognized tax position is then measured at the largest amount of benefit that is greater than fifty percent likely of being realized upon ultimate settlement. Upon adoption, the cumulative effect of applying the recognition and measurement provisions of FIN 48, if any, shall be reflected as an adjustment to the opening balance of retained earnings. We are currently evaluating the impact of the adoption of FIN 48 on our financial statements.
31
Table of Contents
In September 2006, the SEC issued SAB 108, “Topic 1N – Considering the Effects of Prior Year Misstatements when Quantifying Misstatements in Current Year Financial Statements,” which provides guidance on quantifying prior year errors for the purpose of evaluating materiality on current year financial statements. SAB 108 is effective for fiscal years ending after November 15, 2006. We do not expect the adoption of this statement to have a material impact on our financial statements.
In September 2006, the FASB issued SFAS 157, which addresses how companies should measure fair value when they are required to use a fair value measure for recognition or disclosure purposed under generally accepted accounting principles. As a result of SFAS 157, there is a common definition of fair value to be used throughout GAAP; SFAS 157 is effective for fiscal years beginning after November 15, 2007. We are currently evaluating the impact of adopting SFAS 157 on our financial position and results of operations.
In February 2007, the FASB issued SFAS No. 159, “The Fair Value Option for Financial Assets and Financial Liabilities” (SFAS 159), which provides entities with the option to measure certain financial instruments and other items at fair value, whereas those items are not currently required to be measured at fair value. SFAS 159 will be effective for us on January 1, 2008. We are currently evaluating the impact of adopting SFAS 159 on our financial position and results of operations.
Inflation
We do not foresee any material impact on our operations from inflation.
Healthcare Reform Policies
In recent years, an increasing number of legislative proposals have been introduced or proposed in Congress and in some state legislatures that would effect major changes in the healthcare system, nationally, at the state level or both. Future legislation, regulation or payment policies of Medicare, Medicaid, private health insurance plans, health maintenance organizations and other third-party payors could adversely affect the demand for our current or future products and our ability to sell our products on a profitable basis. Moreover, healthcare legislation is an area of extensive and dynamic change, and we cannot predict future legislative changes in the healthcare field or their impact on our business.
Item 7A.Quantitative and Qualitative Disclosures About Market Risk
Market Risk
Our business is exposed to various market risks, including changes in interest rates and foreign currency exchange rates. Market risk is the potential loss arising from adverse changes in market rates and prices, such as interest rates and foreign currency exchange rates. We do not invest in derivatives or other financial instruments for trading or speculative purposes. We had no debt at December 31, 2006.
Foreign Currencies
We are subject to certain foreign currency risks in the importation of goods from Japan. Our purchases from this supplier are denominated in Japanese Yen. These components represent a significant portion of our material costs. Fluctuations in the US Dollar/ Japanese Yen exchange rate could result in increased costs for our key components. Similarly, we are also exposed to currency fluctuations with respect to the exportation of our products. With the exception of France which is denominated in Euros, all of our sales are denominated in US Dollars. Our strip manufacturing facility in Germany has the US Dollar as its functional currency.
32
Table of Contents
Item 8.Financial Statements and Supplementary Data
Our Index to Financial Statements, Consolidated Financial Statements, the reports thereon, and the notes thereto commence on Page 39 of this Annual Report on Form 10-K, immediately following the signature page to this report.
Item 9.Changes in and Disagreements with Accountants on Accounting and Financial Disclosure
None.
Item 9A. Controls and Procedures
We maintain disclosure controls and procedures, which are designed to ensure that information required to be disclosed in the reports we file or submit under the Securities Exchange Act of 1934, as amended, is recorded, processed, summarized and reported within the time periods specified in the Securities and Exchange Commission’s rules and forms, and that such information is accumulated and communicated to our management, including our chief executive officer, or CEO, and chief financial officer, or CFO, as appropriate to allow timely decisions regarding required disclosure.
Under the supervision and with the participation of our management, including our CEO and CFO, an evaluation was performed on the effectiveness of the design and operation of our disclosure controls and procedures as of the end of the period covered by this annual report. Based on that evaluation, our management, including the CEO and CFO, concluded that our disclosure controls and procedures were effective as of December 31, 2006.
An evaluation was also performed under the supervision and with the participation of our management, including our CEO and CFO, of any change in our internal controls over financial reporting that occurred during our last fiscal quarter and that has materially affected, or is reasonably likely to materially affect, our internal controls over financial reporting. That evaluation did not identify any change in our internal controls over financial reporting that occurred during our latest fiscal quarter and that has materially affected, or is reasonably likely to materially affect, our internal controls over financial reporting.
Management’s Report on Internal Control Over Financial Reporting
Our management is responsible for establishing and maintaining adequate internal control over financial reporting, as this term is defined in Exchange Act Rules 13a-15(f). All internal control systems, no matter how well designed, have inherent limitations. Therefore, even those systems determined to be effective can provide only reasonable assurance with respect to financial statement preparation and presentation.
Under the supervision and with the participation of our management, including our CEO and CFO conducted an evaluation of the effectiveness of our internal control over financial reporting based on the framework inInternal Control—Integrated Framework issued by the Committee of Sponsoring Organizations of the Treadway Commission. Based on our evaluation under the framework inInternal Control—Integrated Framework, our management concluded that our internal control over financial reporting was effective as of December 31, 2006.
The scope of management’s assessment of the effectiveness of internal control over financial reporting includes all of our businesses except for Leucadia Technologies, Inc., a material business, of which we acquired in April 2006. The SEC’s guidance on this issue allows us to take additional time after the acquisition to understand and assess internal control processes relating to Leucadia.
Because of its inherent limitations, a system of internal control over financial reporting can provide only reasonable assurance and may not prevent or detect misstatements. In addition, projections of any evaluation of effectiveness to future periods are subject to the risks that controls may become inadequate because of changes in conditions and that the degree of compliance with the policies or procedures may deteriorate.
Our management’s assessment of the effectiveness of our internal control over financial reporting as of December 31, 2006 has been audited by BDO Seidman LLP, an independent registered public accounting firm, as stated in their report which is included below.
33
Table of Contents
Report of Independent Registered Public Accounting Firm on Internal Control over Financial Reporting
To the Board of Directors and Shareholders
of IRIS International, Inc.
Chatsworth, California
We have audited management’s assessment, included in the accompanying Item 9A, Management’s Report on Internal Control Over Financial Reporting, that IRIS International, Inc. (IRIS) maintained effective internal control over financial reporting as of December 31, 2006, based on criteria established inInternal Control—Integrated Framework issued by the Committee of Sponsoring Organizations of the Treadway Commission (the COSO criteria). IRIS’ management is responsible for maintaining effective internal control over financial reporting and for its assessment of the effectiveness of internal control over financial reporting. Our responsibility is to express an opinion on management’s assessment and an opinion on the effectiveness of IRIS’ internal control over financial reporting based on our audit.
We conducted our audit in accordance with the standards of the Public Company Accounting Oversight Board (United States). Those standards require that we plan and perform the audit to obtain reasonable assurance about whether effective internal control over financial reporting was maintained in all material respects. Our audit included obtaining an understanding of internal control over financial reporting, evaluating management’s assessment, testing and evaluating the design and operating effectiveness of internal control, and performing such other procedures as we considered necessary in the circumstances. We believe that our audit provides a reasonable basis for our opinion.
A company’s internal control over financial reporting is a process designed to provide reasonable assurance regarding the reliability of financial reporting and the preparation of financial statements for external purposes in accordance with generally accepted accounting principles. A company’s internal control over financial reporting includes those policies and procedures that (1) pertain to the maintenance of records that, in reasonable detail, accurately and fairly reflect the transactions and dispositions of the assets of the company; (2) provide reasonable assurance that transactions are recorded as necessary to permit preparation of financial statements in accordance with generally accepted accounting principles, and that receipts and expenditures of the company are being made only in accordance with authorizations of management and directors of the company; and (3) provide reasonable assurance regarding prevention or timely detection of unauthorized acquisition, use, or disposition of the company’s assets that could have a material effect on the financial statements.
Because of its inherent limitations, internal control over financial reporting may not prevent or detect misstatements. Also, projections of any evaluation of effectiveness to future periods are subject to the risk that controls may become inadequate because of changes in conditions, or that the degree of compliance with the policies or procedures may deteriorate.
As indicated in the accompanying Item 9A, Management’s Report on Internal Control over Financial Reporting, management’s assessment of and conclusion on the effectiveness of internal control over financial reporting did not include the internal controls of Leucadia Technologies, Inc. (“Leucadia”), which was acquired on April 3, 2006, and which is included in the consolidated balance sheet of IRIS as of December 31, 2006, and the related consolidated statements of operations, comprehensive loss, shareholders’ equity, and cash flows for the year then ended. Leucadia constituted 6% and 5% of total assets and net assets, respectively, as of December 31, 2006. In addition, Leucadia constituted $1,816,000 of total research and development costs included within the consolidated statement of operations for the year then ended, not including in-process research and development. Refer to Note 3 to the consolidated financial statements for further discussion of the Leucadia acquisition and its impact on the Company’s consolidated financial statements. Management did not assess the effectiveness of internal control over financial reporting of Leucadia because of the timing of the acquisition which was completed on April 3, 2006. Our audit of internal control over financial reporting of IRIS also did not include an evaluation of the internal control over financial reporting of Leucadia.
In our opinion, management’s assessment that IRIS maintained effective internal control over financial reporting as of December 31, 2006, is fairly stated, in all material respects, based on the COSO criteria. Also, in our opinion, IRIS maintained, in all material respects, effective internal control over financial reporting as of December 31, 2006, based on the COSO criteria.
We also have audited, in accordance with the standards of the Public Company Accounting Oversight Board (United States), the consolidated balance sheets of IRIS International, Inc., as of December 31, 2006 and 2005 and the related consolidated statements of operations, shareholders’ equity and cash flows for each of the three years in the period ended December 31, 2006 of IRIS and our report dated March 22, 2007 expressed an unqualified opinion thereon.
/s/ BDO SEIDMAN LLP
Los Angeles, California
March 22, 2007
34
Table of Contents
None
Item 10.Directors and Executive Officers of the Registrant
Information regarding directors and executive officers will appear in the definitive proxy statement for the 2007 annual meeting of IRIS shareholders, and is incorporated herein by reference.
Item 11.Executive Compensation
Information regarding executive compensation will appear in the definitive proxy statement for the 2007 annual meeting of IRIS shareholders, and is incorporated herein by reference.
Item 12.Security Ownership of Certain Beneficial Owners and Management and Related Stockholder Matters
Information regarding security ownership of certain beneficial owners and management and related stockholder matters will appear in the definitive proxy statement for the 2007 annual meeting of IRIS shareholders, and is incorporated herein by reference.
Item 13.Certain Relationships and Related Transactions
Information regarding certain relationships and related transactions will appear in the definitive proxy statement for the 2007 annual meeting of IRIS shareholders, and is incorporated herein by reference.
Item 14.Principal Accounting Fees and Services
Information regarding principal accounting fees and services will appear in the definitive proxy statement for the 2007 annual meeting of IRIS shareholders, and is incorporated herein by reference.
35
Table of Contents
Item 15.Exhibits, Financial Statement Schedules
Financial Statements and Financial Statement Schedules:
Reference is made to the Index to Financial Statements, Consolidated Financial Statements, the reports thereon, and the notes thereto commencing on page 39 of this Annual Report on Form 10-K.
Exhibits
| Exhibit Number | Description | Reference Document | ||
| 2.1 | Asset Purchase Agreement by and between by and between IRIS International, Inc., Blitz 05-047 GmbH, Quidel Corporation and Quidel Deutschland GmbH, dated April 26, 2005.** | (2) | ||
| 2.2 | Merger Agreement, dated April 3, 2006, by and among Iris International, Inc., IRIS Molecular Diagnostics, Inc., Leucadia Technologies, Inc., and Dr. Thomas H. Adams. | (13) | ||
| 3.1(a) | Certificate of Incorporation, as amended. | (1) | ||
| 3.1(b) | Certificate of Designations, Preferences and Rights of Series C Preferred. | (3) | ||
| 3.1(c) | Certificate of Ownership and Merger. | (10) | ||
| 3.2 | Amended and Restated Bylaws. | (10) | ||
| 4.1 | Specimen of Common Stock Certificate. | (4) | ||
| 4.2(a) | Rights Agreement, dated as of January 21, 2000, between the Company and Continental Stock Transfer & Trust Company, as Rights Agent, with related exhibits. | (3) | ||
| 4.2(b) | Rights Agreement Amendment, dated as of September 20, 2006, between the Company and Continental Stock Transfer & Trust Company, as Rights Agent, including an amended Rights Certificate. | (15) | ||
| 4.3 | Warrant Certificate dated April 19, 2004, issued to Oppenheimer & Co. Inc. to purchase 122,475 shares of Common Stock | (11) | ||
| 4.4 | Registration Rights Agreement, dated April 3, 2006, by and between Iris International, Inc. and Dr. Thomas H. Adams. | (13) | ||
| 10.1(a) | Lease for Property Located at 9172 Eton Avenue, Chatsworth, California (Headquarters), dated November 28, 2001. | (5) | ||
| 10.1(b) | Amendment No. 1, dated October 17, 2005, to the Lease for Property Located at 9172 Eton Avenue, Chatsworth, California (Headquarters), dated November 28, 2001. | (12) | ||
| 10.2 | Lease for Property Located at 9158-9162 Eton Avenue, Chatsworth, California, dated October 17, 2005. | (12) | ||
| 10.3(a) | 1994 Stock Option Plan and forms of Stock Option Agreements. † | (6) | ||
| 10.3(b) | Certificate of Officer With Respect to Amendment of 1994 Stock Option Plan. † | (7) | ||
| 10.4 | Employee Stock Purchase Plan. † | (8) | ||
| 10.5 | 1997 Stock Option Plan and form of Stock Option Agreement. † | (7) | ||
| 10.6 | Amended and Restated 1998 Stock Option Plan. † | * | ||
| 10.7 | Leucadia Technologies, Inc. Form of Deferred Stock Unit Agreement and Notices of Deferred Stock Grants. † | (16) | ||
| 10.8(a) | Change in Terms Agreement dated May 25, 2004 by and between the Company and California Bank & Trust. | (11) | ||
| 10.8(b) | Business Loan Agreement dated May 25, 2004 by and between the Company and California Bank & Trust. | (11) | ||
| 10.8(c) | Promissory Note dated May 25, 2004 by and between the Company and California Bank & Trust. | (11) | ||
| 10.8(d) | Commercial Security Agreements dated May 25, 2004 by and between the Company and California Bank & Trust. | (11) | ||
| 10.8(e) | Landlord’s Consent dated February 7, 2002 by and between the Company, the Company’s Landlord and California Bank & Trust. | (9) | ||
36
Table of Contents
| 10.8(f) | Commercial Guaranty Agreement dated May 25, 2004 by and between the Company, StatSpin, Inc (the Company’s affiliate) and California Bank & Trust. | (11) | ||
| 10.8(g) | Commercial Guaranty Agreement dated May 25, 2004 by and between the Company, Advanced Digital Imaging Research, LLP (the Company’s affiliate) and California Bank & Trust. | (11) | ||
| 10.9(a) | Key Employee Agreement, dated February 13, 2004, between the Company and Cesar M Garcia. † | (10) | ||
| 10.9(b) | First Amendment to Key Employee Agreement, dated December 21, 2006, between the Company and Cesar M Garcia. † | * | ||
| 10.10 | Key Employee Agreement, dated April 3, 2006, between the Company and Dr. Thomas H. Adams. † | (13) | ||
| 10.11(a) | Key Employee Agreement, dated January 5, 2004, between the Company and Martin G. Paravato. † | (10) | ||
| 10.11(b) | Separation Agreement, dated May 11, 2006, between the Company and Martin G. Paravato. † | (14) | ||
| 10.12 | Key Employee Agreement, dated May 1, 2006, between the Company and Donald Mueller. † | (14) | ||
| 21 | List of Subsidiaries. | * | ||
| 23 | Consent of BDO Seidman, LLP. | * | ||
| 31.1 | Statement Pursuant to Section 302 of the Sarbanes-Oxley Act of 2002 By Chief Executive Officer. | * | ||
| 31.2 | Statement Pursuant to Section 302 of the Sarbanes-Oxley Act of 2002 By Chief Financial Officer. | * | ||
| 32.1 | Statement Pursuant to Section 906 of the Sarbanes-Oxley Act of 2002 By Chief Executive Officer. | * | ||
| 32.2 | Statement Pursuant to Section 906 of the Sarbanes-Oxley Act of 2002 By Chief Financial Officer. | * | ||
| * | Filed herewith |
| † | Each a management contract or compensatory plan or arrangement required to be filed as an exhibit to this annual report on Form 10-K. |
| ** | Pursuant to Item 601(b)(2) of Regulation S-K, the schedules to the Asset Purchase Agreement have been omitted. The Registrant undertakes to supplementally furnish a copy of the omitted schedules to the Securities and Exchange Commission upon request. |
Exhibits followed by a number in parenthesis are incorporated by reference to the similarly numbered Company document cited below:
| (1) | Current Report on Form 8-K dated August 13, 1987 and Quarterly Report on Form 10-Q for the quarter ended September 30, 1993. |
| (2) | Current Report on Form 8-K dated June 3, 2005. |
| (3) | Current Report on Form 8-K dated January 26, 2000. |
| (4) | Quarterly Report on Form 10-Q for the quarter ended September 30, 1994. |
| (5) | Annual Report on Form 10-K for the year ended December 31, 2001. |
| (6) | Registration Statement on Form S-8, as filed with the Securities and Exchange Commission on August 8, 1994 (File No. 33-82560). |
| (7) | Registration Statement on Form S-8, as filed with the Securities and Exchange Commission on July 16, 1997 (File No. 333-31393). |
| (8) | Annual Report on Form 10-K for the year ended December 31, 1999. |
| (9) | Annual Report on Form 10-K for the year ended December 31, 2001. |
| (10) | Annual Report on Form 10-K for the year ended December 31, 2003. |
| (11) | Annual Report on Form 10-K for the year ended December 31, 2004. |
| (12) | Current Report on Form 8-K dated November 14, 2005. |
| (13) | Current Report on Form 8-K dated April 3, 2006. |
| (14) | Current Report on Form 8-K dated May 9, 2006. |
| (15) | Current Report on Form 8-K dated September 20, 2006. |
| (16) | Registration Statement on Form S-8, as filed with the Securities and Exchange Commission on October 2, 2006 (File No. 333-137738). |
37
Table of Contents
Pursuant to the requirements of Section 13 of the Securities Exchange Act of 1934, the Registrant has duly caused this report on Form 10-K to be signed on its behalf by the undersigned, thereunto duly authorized, in Chatsworth, California, on March 22, 2007.
| IRIS INTERNATIONAL, INC. |
/s/ Cesar M. García |
| Cesar M. García, |
| President and Chief Executive Officer |
Pursuant to the requirements of the Securities Exchange Act of 1934, this report has been signed below by the following persons on behalf of the Registrant and in the capacities and on the dates indicated.
Signature | Title | Date | ||
/s/ Cesar M. García Cesar M. García | President and Chief Executive Officer (Principal Executive Officer) and Corporate Secretary | March 22, 2007 | ||
/s/ Veronica Tarrant Veronica Tarrant | Interim Chief Financial Officer (Principal Financial Officer and Principal Accounting Officer) | March 22, 2007 | ||
/s/ Richard H. Williams Richard H. Williams | Chairman of the Board | March 22, 2007 | ||
/s/ Thomas Adams Thomas Adams | Director | March 22, 2007 | ||
/s/ Steven M. Besbeck Steven M. Besbeck | Director | March 22, 2007 | ||
/s/ Michael D. Matte Michael D. Matte | Director | March 22, 2007 | ||
/s/ Richard G. Nadeau Richard G. Nadeau | Director | March 22, 2007 | ||
/s/ Stephen E. Wasserman Stephen E. Wasserman | Director | March 22, 2007 | ||
38
Table of Contents
39
Table of Contents
REPORT OF INDEPENDENT REGISTERED PUBLIC ACCOUNTING FIRM
To the Board of Directors and Shareholders
of IRIS International, Inc.
Chatsworth, California
We have audited the accompanying consolidated balance sheets of IRIS International, Inc. as of December 31, 2006 and 2005, the related consolidated statements of operations, shareholders’ equity, cash flows and comprehensive income (loss) for each of the three years in the period ended December 31, 2006. These financial statements are the responsibility of the Company’s management. Our responsibility is to express an opinion on these financial statements based on our audits.
We conducted our audits in accordance with the auditing standards of the Public Company Accounting Oversight Board (United States). Those standards require that we plan and perform the audit to obtain reasonable assurance about whether the financial statements are free of material misstatement. An audit includes examining, on a test basis, evidence supporting the amounts and disclosures in the financial statements, assessing the accounting principles used and significant estimates made by management, as well as evaluating the overall presentation of the financial statements. We believe that our audits provide a reasonable basis for our opinion.
In our opinion, the consolidated financial statements referred to above present fairly, in all material respects, the financial position of IRIS International, Inc. at December 31, 2006 and 2005, and the results of its operations, cash flows and comprehensive income (loss) for each of the three years in the period ended December 31, 2006 in conformity with accounting principles generally accepted in the United States of America.
As discussed in Note 2 to the consolidated financial statements effective January 1, 2006, the Company adopted Statement of Financial Accounting Standards No. 123(R), “Share-Based Payment”.
We have also audited, in accordance with the standards of the Public Company Accounting Oversight Board (United States), the effectiveness of IRIS International, Inc.’s internal control over financial reporting as of December 31, 2006, based on criteria established inInternal Control – Integrated Framework issued by the Committee of Sponsoring Organizations of the Treadway Commission (COSO) and our report dated March 22, 2007, expressed an unqualified opinion thereon.
/s/ BDO Seidman, LLP
Los Angeles, California
March 22, 2007
40
Table of Contents
CONSOLIDATED BALANCE SHEETS
(In thousands)
| At December 31, | ||||||||
| 2006 | 2005 | |||||||
| Assets | ||||||||
Current assets: | ||||||||
Cash and cash equivalents | $ | 23,159 | $ | 3,169 | ||||
Marketable securities available for sale | 132 | 15,976 | ||||||
Accounts receivable, net of allowance for doubtful accounts and sales returns of $601 and $288 | 13,166 | 11,874 | ||||||
Inventories, net (note 4) | 6,918 | 7,590 | ||||||
Prepaid expenses and other current assets | 626 | 1,132 | ||||||
Investment in sales-type leases (note 6) | 2,145 | 1,455 | ||||||
Deferred tax asset (note 9) | 2,865 | 2,792 | ||||||
Total current assets | 49,011 | 43,988 | ||||||
Property and equipment, at cost, net (note 5) | 6,662 | 4,076 | ||||||
Goodwill | 2,450 | 189 | ||||||
Core Technology, net (note 3) | 1,723 | — | ||||||
Software development costs, net of accumulated amortization of $1,729 and $1,169 | 1,387 | 1,570 | ||||||
Deferred tax asset (note 9) | 5,516 | 7,237 | ||||||
Inventories – long term portion (note 4) | 440 | 632 | ||||||
Investment in sales-type leases (note 6) | 6,728 | 5,841 | ||||||
Other assets | 400 | 396 | ||||||
Total assets | $ | 74,317 | $ | 63,929 | ||||
Liabilities and Shareholders’ Equity | ||||||||
Current liabilities: | ||||||||
Accounts payable | $ | 3,797 | $ | 4,464 | ||||
Accrued expenses (note 7) | 6,414 | 4,188 | ||||||
Deferred service contract revenue | 1,517 | 1,457 | ||||||
Total current liabilities | 11,728 | 10,109 | ||||||
Deferred service contract revenue, long term | 23 | 51 | ||||||
Total liabilities | 11,751 | 10,160 | ||||||
Commitments and contingencies (note 11) | ||||||||
Shareholders’ equity: (note 10) | ||||||||
Common stock, $.01 par value Authorized: 50 million shares; issued and outstanding: 18,046 shares and 17,222 shares | 180 | 172 | ||||||
Preferred Stock, $.01 par value; Authorized 1 million shares: Callable Series C shares issued and outstanding: none | — | — | ||||||
Additional paid-in capital | 79,226 | 70,856 | ||||||
Unearned compensation | — | (546 | ) | |||||
Translation adjustment | 48 | — | ||||||
Accumulated deficit | (16,888 | ) | (16,713 | ) | ||||
Total shareholders’ equity | 62,566 | 53,769 | ||||||
Total liabilities and shareholders’ equity | $ | 74,317 | $ | 63,929 | ||||
The accompanying notes are an integral part of these consolidated financial statements.
41
Table of Contents
CONSOLIDATED STATEMENTS OF OPERATIONS
(In thousands, except per share amounts)
| For the Year ended December 31, | ||||||||||||
| 2006 | 2005 | 2004 | ||||||||||
Sales of IVD instruments | $ | 29,065 | $ | 27,542 | $ | 14,845 | ||||||
Sales of IVD consumables and service | 30,295 | 25,708 | 20,126 | |||||||||
Sales of sample processing instruments and supplies | 11,134 | 9,530 | 8,343 | |||||||||
Royalty and license revenues | — | — | 336 | |||||||||
Total revenues | 70,494 | 62,780 | 43,650 | |||||||||
Cost of goods - IVD instruments | 15,604 | 15,456 | 10,092 | |||||||||
Cost of goods - IVD consumable and supplies | 14,364 | 11,185 | 7,982 | |||||||||
Cost of goods - sample processing instruments and supplies | 5,815 | 4,994 | 4,185 | |||||||||
Total cost of goods sold | 35,783 | 31,635 | 22,259 | |||||||||
Gross profit | 34,711 | 31,145 | 21,391 | |||||||||
Marketing and selling | 10,593 | 10,026 | 7,165 | |||||||||
General and administrative | 9,983 | 7,141 | 5,841 | |||||||||
Research and development, net | 13,086 | 5,037 | 3,920 | |||||||||
Total operating expenses | 33,662 | 22,204 | 16,926 | |||||||||
Operating income | 1,049 | 8,941 | 4,465 | |||||||||
Other income (expense): | ||||||||||||
Interest income | 1,068 | 607 | 111 | |||||||||
Interest expense | (18 | ) | (15 | ) | (243 | ) | ||||||
Other income (expense) | 39 | 13 | (534 | ) | ||||||||
Income before provision for income taxes | 2,138 | 9,546 | 3,799 | |||||||||
Provision for income taxes (Note 9) | 2,313 | 3,415 | 1,519 | |||||||||
Net income (loss) | $ | (175 | ) | $ | 6,131 | $ | 2,280 | |||||
Basic net income per share | $ | (0.01 | ) | $ | 0.37 | $ | 0.16 | |||||
Diluted net income per share | $ | (0.01 | ) | $ | 0.35 | $ | 0.14 | |||||
Weighted average number of common shares outstanding – basic | 17,855 | 16,758 | 14,459 | |||||||||
Weighted average number of common shares outstanding – diluted | 17,855 | 17,654 | 15,818 | |||||||||
The accompanying notes are an integral part of these consolidated financial statements.
42
Table of Contents
CONSOLIDATED STATEMENTS OF SHAREHOLDERS’ EQUITY
(in thousands)
| Common Stock | Additional Capital | Unearned Compensation | Accumulated Income | Accumulated Deficit | Total | |||||||||||||||||||
| Shares | Amount | |||||||||||||||||||||||
Balance, January 1, 2004 | 11,901 | $ | 119 | $ | 44,717 | $ | (45 | ) | $ | (200 | ) | $ | (25,124) | $ | 19,467 | |||||||||
Common stock issued on exercise of stock options & warrants | 1,864 | 18 | 3,285 | — | — | — | 3,303 | |||||||||||||||||
Tax benefit from stock option exercises | — | — | 2,015 | — | — | — | 2,015 | |||||||||||||||||
Common stock issued under employee stock purchase plan for cash | 67 | 1 | 470 | (224 | ) | — | — | 247 | ||||||||||||||||
Private placement of stock, net of offering costs | 2,130 | 21 | 11,485 | — | — | — | 11,506 | |||||||||||||||||
Amortization of unearned compensation | — | — | — | 144 | — | — | 144 | |||||||||||||||||
Realized loss on investments | — | — | — | — | 538 | — | 538 | |||||||||||||||||
Unrealized loss on investments | — | — | — | — | (327 | ) | — | (327 | ) | |||||||||||||||
Net income for year | — | — | — | — | — | 2,280 | 2,280 | |||||||||||||||||
Balance, December 31, 2004 | 15,962 | $ | 159 | $ | 61,972 | $ | (125 | ) | $ | 11 | $ | (22,844 | ) | $ | 39,173 | |||||||||
Common stock issued on exercise of options & warrants | 1,140 | 12 | 3,029 | — | — | — | 3,041 | |||||||||||||||||
Tax benefit from stock option exercises | — | — | 4,080 | — | — | — | 4,080 | |||||||||||||||||
Common stock issued under employee stock purchase plan for cash | 120 | 1 | 1,775 | (850 | ) | — | — | 926 | ||||||||||||||||
Amortization of unearned compensation | — | — | — | 429 | — | — | 429 | |||||||||||||||||
Realized loss on investments | — | — | — | — | (11 | ) | — | (11 | ) | |||||||||||||||
Net income for year | — | — | — | — | — | 6,131 | 6,131 | |||||||||||||||||
Balance, December 31, 2005 | 17,222 | $ | 172 | $ | 70,856 | $ | (546 | ) | $ | — | $ | (16,713 | ) | $ | 53,769 | |||||||||
The accompanying notes are an integral part of these consolidated financial statements
43
Table of Contents
IRIS INTERNATIONAL, INC.
CONSOLIDATED STATEMENTS OF SHAREHOLDERS’ EQUITY (continued)
(In thousands)
Additional Paid-In Capital | Unearned Compensation | Other | Accumulated Deficit | Total | ||||||||||||||||||||
Common Stock | ||||||||||||||||||||||||
Shares | Amount | |||||||||||||||||||||||
Balance, December 31, 2005 | 17,222 | $ | 172 | $ | 70,856 | $ | (546 | ) | $ | — | $ | (16,713) | $ | 53,769 | ||||||||||
Reclassification - | 130 | 1 | (547 | ) | 546 | — | — | — | ||||||||||||||||
Balance January 1, 2006 | 17,352 | 173 | 70,309 | — | — | (16,713 | ) | 53,769 | ||||||||||||||||
Common stock issued on exercise of options | 301 | 3 | 1,380 | — | — | — | 1,383 | |||||||||||||||||
Restricted stock grants to employees | 105 | 1 | (1 | ) | — | — | — | — | ||||||||||||||||
Tax benefit from stock option exercises | — | — | 866 | — | — | — | 866 | |||||||||||||||||
Common stock issued under employee stock purchase plan | 16 | — | 135 | — | — | — | 135 | |||||||||||||||||
Stock issued in acquisition of business (note 3) | 272 | 3 | 4,997 | — | — | — | 5,000 | |||||||||||||||||
Translation adjustment | — | — | — | — | 48 | — | 48 | |||||||||||||||||
Stock based compensation expense | — | — | 1,540 | — | — | 1,540 | ||||||||||||||||||
Net loss for year | — | — | — | — | — | (175 | ) | (175 | ) | |||||||||||||||
Balance, December 31, 2006 | 18,046 | $ | 180 | $ | 79,226 | $ | — | $ | 48 | $ | (16,888 | ) | $ | 62,566 | ||||||||||
The accompanying notes are an integral part of these consolidated financial statements
44
Table of Contents
CONSOLIDATED STATEMENTS OF CASH FLOWS
(In thousands)
| For the Year ended December 31, | ||||||||||||
| 2006 | 2005 | 2004 | ||||||||||
Cash flows from operating activities: | ||||||||||||
Net income (loss) | $ | (175 | ) | $ | 6,131 | $ | 2,280 | |||||
Adjustments to reconcile net income (loss) to net cash provided by operations: | ||||||||||||
Non-cash in-process research and development charge | 5,180 | — | — | |||||||||
Deferred taxes | 1,853 | 3,356 | 1,353 | |||||||||
Tax benefit from stock option exercises | (866 | ) | — | — | ||||||||
Depreciation and amortization | 2,142 | 1,818 | 1,731 | |||||||||
Common stock and stock based compensation | 1,540 | 429 | 144 | |||||||||
Loss (gain) on sale/write down of investment | — | (11 | ) | 538 | ||||||||
Changes in assets and liabilities: | ||||||||||||
Accounts receivable | (1,292 | ) | (3,526 | ) | (1,654 | ) | ||||||
Deferred service contract revenue | 32 | 201 | (82 | ) | ||||||||
Inventories, net | 827 | 645 | (1,798 | ) | ||||||||
Prepaid expenses and other | 519 | (937 | ) | (2,119 | ) | |||||||
Sales-type leases | (1,577 | ) | (4,655 | ) | — | |||||||
Accounts payable | (667 | ) | 206 | 622 | ||||||||
Accrued expenses | 2,226 | 827 | 497 | |||||||||
Net cash provided by (used in) operating activities | 9,742 | 4,484 | 1,512 | |||||||||
Cash flows from investing activities: | ||||||||||||
Acquisition of businesses, net of cash acquired | (3,560 | ) | (743 | ) | ||||||||
Acquisition of property and equipment | (4,044 | ) | (1,392 | ) | (1,203 | ) | ||||||
Software development costs | (376 | ) | (171 | ) | (64 | ) | ||||||
Purchase of short-term investments and marketable securities | — | (15,976 | ) | — | ||||||||
Sale of short-term investments and marketable securities | 15,844 | 198 | 197 | |||||||||
Net cash provided by (used in) investing activities | 7,864 | (18,084 | ) | (1,070 | ) | |||||||
Cash flows from financing activities: | ||||||||||||
Issuance of common stock and warrants for cash | 1,518 | 3,967 | 15,056 | |||||||||
Tax benefit from stock option exercises | 866 | — | — | |||||||||
Borrowings under line of credit | 3,000 | — | 2,900 | |||||||||
Repayments of line of credit | (3,000 | ) | — | (5,800 | ) | |||||||
Repayments of term loan | — | — | (1,079 | ) | ||||||||
Repayments of notes payable | — | — | (1,069 | ) | ||||||||
Payments of capital lease obligations | — | (37 | ) | (55 | ) | |||||||
Net cash provided by financing activities | 2,384 | 3,930 | 9,953 | |||||||||
Net increase (decrease) in cash and cash equivalents | 19,990 | (9,670 | ) | 10,395 | ||||||||
Cash and cash equivalents at beginning of year | 3,169 | 12,839 | 2,444 | |||||||||
Cash and cash equivalents at end of year | $ | 23,159 | $ | 3,169 | $ | 12,839 | ||||||
Supplemental schedule of non-cash financing activities: | ||||||||||||
Issuance of common stock and common stock warrants | $ | 1,553 | $ | 850 | $ | 224 | ||||||
Issuance of common stock and deferred stock units to acquire subsidiary | $ | 5,000 | — | — | ||||||||
Supplemental disclosure of cash flow information: | ||||||||||||
Cash paid for income taxes | 47 | 72 | 74 | |||||||||
Cash paid for interest | 18 | 15 | 97 | |||||||||
The accompanying notes are an integral part of these consolidated financial statements.
45
Table of Contents
CONSOLIDATED STATEMENTS OF COMPREHENSIVE INCOME (LOSS)
(In thousand)
| For the Year ended December 31, | ||||||||||||
| 2006 | 2005 | 2004 | ||||||||||
Net income (loss) | $ | (176 | ) | $ | 6,131 | $ | 2,280 | |||||
Foreign currency translation | 48 | — | — | |||||||||
Realized (gain) loss on investment | — | (11 | ) | $ | 538 | |||||||
Unrealized loss on investment, net of taxes | — | — | (327 | ) | ||||||||
Comprehensive income (loss) | $ | (128 | ) | $ | 6,120 | $ | 2,491 | |||||
The accompanying notes are an integral part of these consolidated financial statements.
46
Table of Contents
NOTES TO CONSOLIDATED FINANCIAL STATEMENTS
1. Company History
IRIS International, Inc. was incorporated in California in 1979 and reincorporated during 1987 in Delaware under the name of International Remote Imaging Systems, Inc. We changed our name to IRIS International, Inc. in December 2003. We design, develop, manufacture and market in vitro diagnostic (“IVD”) equipment, including IVD imaging systems based on patented and proprietary neural network-based Automated Particle Recognition (APR™) software to enable high-speed digital processing to classify and display images of microscopic particles technology, as well as special purpose centrifuges and other small instruments for automating microscopic procedures performed in clinical laboratories.
2. Summary of Significant Accounting Policies
Use of Estimates
The preparation of financial statements in conformity with accounting principles generally accepted in the United States of America requires management to make estimates and assumptions that affect the reported amounts of assets and liabilities and disclosure of contingent assets and liabilities at the date of the financial statements and the reported amounts of revenues and expenses during the reporting periods. The significant estimates in the preparation of the consolidated financial statements relate to the assessment of the carrying value of accounts receivables, inventories, purchased intangibles, estimated provisions for warranty costs and deferred tax assets. Actual results could differ materially from those estimates.
Principles of Consolidation
Our financial statements include the accounts of IRIS International, Inc. and its wholly-owned subsidiaries. All inter-company accounts and transactions have been eliminated in the consolidated financial statements.
Cash Equivalents and Short-Term Investments
We invest available cash in short-term commercial paper, certificates of deposit and high-grade variable rate securities. Liquid investments with an original maturity of three months or less when purchased are considered to be cash equivalents.
Investments, including auction rate securities and certificates of deposit, with maturity dates greater than three months when purchased, which have readily determined fair values, are classified as available-for-sale investments and reflected in current assets as marketable securities available for sale. Auction rate securities are recorded at par value, which equals fair market value, as the rates on such securities reset generally every 7, 28, or 35 days.
Accounts Receivable
We sell predominantly to entities in the healthcare industry. We grant uncollateralized credit to customers, primarily hospitals, clinical and research laboratories, and distributors. We perform ongoing credit evaluations of customers before granting uncollateralized credit. No single customer accounts for 10% or more of our consolidated revenues or 10% or more of our accounts receivable at the balance sheet date.
Accounts receivable are customer obligations due under normal trade terms. We sell our products to distributors and customers in the health care industry. We perform credit evaluations of our customers’ financial condition and although we generally do not require collateral, letters of credit may be required from our customers in certain circumstances.
47
Table of Contents
Management reviews accounts receivable on a monthly basis to determine if any receivables will potentially be uncollectible. We include accounts receivable balances that are determined to be uncollectible, along with a reserve for potential accounts that could be uncollectible in our allowance for doubtful accounts. After all attempts to collect a receivable have failed, the receivable is written off against the allowance. Based on the information available to us, we believe our allowance for doubtful accounts as of December 31, 2006 is adequate.
Inventories
Inventories are carried at the lower of cost or market on a first in, first out basis. Provision for potentially obsolete or slow-moving inventory is made based on management’s analysis of inventory levels and future sales forecasts. We currently have approximately $440,000 of non-current inventory relating to spare parts for our legacy instruments which we no longer produce but continue to support and provide maintenance repairs for our customers. Other inventory that is considered excess inventory is fully reserved.
Property and Equipment and Depreciation
Property and equipment are recorded at cost, less accumulated depreciation and amortization. Depreciation is generally computed using the straight-line method over three to five years, the estimated useful lives of the assets. Leasehold improvements are amortized over the lesser of their useful life or the remaining term of the lease.
Goodwill and Core Technology
Our intangible assets consist of goodwill, which is not being amortized and core technology, which is being amortized over its useful life of 20 years. All intangible assets are subject to impairment tests on an annual or periodic basis. Goodwill is evaluated in accordance with Statement of Financial Accounting Standards (“SFAS”) No. 142 based on various analyses, including cash flow and profitability projections. The analysis necessarily involves significant management judgment to evaluate the capacity of an acquired business to perform within projections. Core technology is evaluated for impairment using the methodology set forth in SFAS No. 144,Accounting for the Impairment or Disposal of Long-Lived Assets (SFAS No. 144). Recoverability of these assets is assessed only when events have occurred that may give rise to a potential impairment. When a potential impairment has been identified, forecasted undiscounted net cash flows of the operations to which the asset relates are compared to the current carrying value of the long-lived assets present in that operation. If such cash flows are less than such carrying amounts, long-lived assets, including such intangibles, are written down to their respective fair values.
At December 31, 2006, we evaluated goodwill and determined that fair value had not decreased below carrying value and no adjustment to impair goodwill was necessary in accordance with Statement of Financial Accounting Standards (“SFAS”) No. 142, “Goodwill and Other Intangible Assets.” Substantially all of the goodwill resides in the IMD division.
Software Development Costs
We capitalize certain software development costs for new products and product enhancements once all planning, designing, coding and testing activities necessary to establish that the product can be produced to meet our design specifications are completed, and conclude capitalization when the product is ready for general release. Research and development costs relating to software development are expensed as incurred. Amortization of capitalized software development costs is provided on a product-by-product basis at the greater of the amount computed using (a) the ratio of current revenues for a product to the total of current and anticipated future revenues or (b) the straight-line method over the remaining estimated economic life of the product up to five years. We capitalized the following software development costs; $376,000 in 2006; $171,000 in 2005 and $64,000 in 2004. Amortization expense of software development costs was $559,000 in 2006 and $531,000 in 2005 and 2004.
Long-Lived Assets
We will identify and record impairment losses for long-lived assets whenever events or changes in circumstances result in the carrying amount of the assets exceed the sum of the expected future undiscounted cash flows associated with such assets. The measurement of the impairment losses recognized is based on the difference between the fair values and the carrying amounts of the assets. There were no impairments at December 31, 2006, 2005 and 2004.
48
Table of Contents
Revenue recognition
For products, revenue is recognized when risk of loss transfers, when persuasive evidence of an arrangement exists, the price to the buyer is fixed and determinable and collectibility is reasonably assured. When a customer enters into an operating-type lease agreement, hardware revenue is recognized on a straight-line basis over the life of the lease, while the cost of the leased equipment is carried in customer leased equipment within property, plant and equipment and amortized over its estimated useful life. Under a sales-type lease agreement, hardware revenue is generally recognized at the time of shipment based on the present value of the minimum lease payments with interest income recognized over the life of the lease using the interest method. Instrument costs under a sales-type lease agreement are recognized at the time of shipment. Service revenues on maintenance contracts are recognized ratably over the life of the service agreement or as service is performed, if not under contract. For those instrument sales that include multiple deliverables, such as instruments, training, consumables and service, we allocate revenue based on the relative fair values of the individual component sold separately, as determined in accordance with Emerging Issues Task Force (“EITF”) Issue No. 00-21.
Our accounting for leases involves specific determinations under SFAS No. 13 “Accounting for Leases” (“SFAS 13”), which often involve complex provisions and significant judgments. The four criteria of SFAS 13 that we use in the determination of a sales-type lease or operating-type lease are 1) a review of the lease term to determine if it is equal to or greater than 75 percent of the economic life of the equipment; 2) a review of the minimum lease payments to determine if they are equal to or greater than 90 percent of the fair market value of the equipment; 3) a determination of whether or not the lease transfers ownership to the lessee at the end of the lease term; and 4) determination of whether or not the lease contains a bargain purchase option.
Additionally, before classifying a lease as a sales-type lease, we assess whether collectibility of the lease payments is reasonably assured and whether there are any significant uncertainties related to costs that we have yet to incur with respect to the lease. Generally, our leases that qualify as sales-type lease are non-cancelable leases with a term of 75 percent or more of the economic life of the equipment. Certain of our lease contracts are customized for larger customers and often result in complex terms and conditions that typically require significant judgment in applying the lease accounting criteria.
The economic life of our leased instrument and its fair value require significant accounting estimates and judgment. These estimates are based on our historical experience. The most objective measure of the economic life of our leased instrument is the original term of a lease, which is typically five years, since a majority of the instruments are returned by the lessee at or near the end of the lease term and there is not a significant after-market for our used instruments without substantial remanufacturing. We believe that this is representative of the period during which the instrument is expected to be economically usable, with normal service, for the purpose for which it is intended. We regularly evaluate the economic life of existing and new products for purposes of this determination.
The fair value of our leased instruments is determined by a range of cash selling prices which we deem to be verifiable objective evidence. We regularly evaluate available objective evidence of instrument fair values using historical data.
We have certain government contracts with cancellation clauses or renewal provisions that are generally required by law, such as 1) those dependant on fiscal funding outside of a governmental unit’s control, 2) those that can be cancelled if deemed in the tax payers’ best interest or 3) those that must be renewed each fiscal year, given limitations that may exist on multi-year contracts that are imposed by statute. Under these circumstances and in accordance with the relevant accounting literature, as well as considering our historical experience, a thorough evaluation of these contracts is performed to assess whether cancellation is remote or whether exercise of the renewal option is reasonably assured.
We recognize revenues from service contracts ratably over the term of the service period, which typically ranges from twelve to ninety months. Payments for service contracts are generally received in advance. Deferred revenue represents the revenues to be recognized over the remaining term of the service contracts.
49
Table of Contents
Warranties
We recognize warranty expense, based on management’s estimate of expected cost, as an accrued liability at the time of sale. Warranty expense was $1,118,000, $929,000 and $550,000 during the years ended December 31, 2006, 2005 and 2004.
Research and Development Expenditures
Except for certain software development costs capitalized as described above (see Software Development Costs), research and development expenditures are charged to operations as incurred. Net research and development expense includes total research and development costs incurred, including costs incurred under research and development grants and contracts, less costs reimbursed under research and development contracts.
From time to time we receive grants from agencies of the US Government. We do not recognize any revenue from such grants since they are cost reimbursement grants whereby the Company submits requests for reimbursement for certain costs incurred. There are no ongoing obligations or requirements with respect to the grants received, we retain ownership of any intellectual property that results from the research and development and the US Government receives a right to use the results of the research for government projects. We received costs reimbursements (government grants) of $1.5 million, $1.6 million and $1.5 million during the years ended December 31, 2006, 2005 and 2004.
Income Taxes
We account for income taxes in accordance with SFAS No. 109 “Accounting for Income Taxes,” which requires recognition of deferred tax liabilities and assets for the expected future tax consequences of events that have been included in the financial statements or tax returns. Under this method, deferred tax liabilities and assets are determined based on the differences between the financial statement and the tax bases of assets and liabilities using enacted tax rates in effect for the year in which the differences are expected to reverse. Valuation allowances are established when necessary to reduce deferred tax assets to the amount expected to be realized. Income tax expense represents the tax payable for the period and the change during the period in deferred tax assets and liabilities.
Marketing Costs
All costs related to marketing our products are expensed at the time the marketing takes place.
Fair Value of Financial Instruments
The carrying amounts of financial instruments including cash and cash equivalents, restricted cash, accounts receivable and payable, accrued and other current liabilities and current maturities of long-term debt approximate fair value due to their short maturity. The carrying amount of our long-term liabilities also approximates fair value based on interest rates currently available to us for debt of similar terms and remaining maturities.
Earnings Per Share
Basic earnings per share are computed by dividing net income by the weighted average number of common shares outstanding. Diluted earnings per share is computed by dividing net income by the weighted average number of common shares and common stock equivalents outstanding, calculated on the treasury stock method for options and warrants or the converted method for convertible preferred stock. Common stock equivalents are excluded from the computation when their effect is antidilutive.
Stock Based Compensation
Effective January 1, 2006, we adopted Statement of Financial Accounting Standards (“SFAS”) No. 123R,“Share-Based Payment,” which requires compensation costs related to share-based transactions, including employee stock options, to be recognized in the financial statements based on fair value. SFAS No. 123R revises SFAS No. 123, as amended,“Accounting for Stock-Based Compensation,” and supersedes Accounting Principles Board (“APB”) Opinion No. 25,“Accounting for Stock Issued to Employees.” We adopted SFAS No. 123R using the modified prospective application transition method. Under this method, compensation cost is recognized for the unvested portion of share-based payments granted prior to January 1, 2006 and all share-based payments granted subsequent to December 31, 2005 over the related vesting period. However, as of December 31, 2005, existing employee stock options were fully vested; accordingly there was no SFAS No. 123R based compensation expense for such options that would be recognized in years subsequent to 2005.
50
Table of Contents
Prior to the first quarter of 2006, we applied the intrinsic value based method prescribed in APB Opinion No. 25 and FIN 44, “Accounting for Certain Transactions involving Stock Compensation” in accounting for employee stock based compensation. Prior period results have not been restated.
Due to the adoption of SFAS No. 123R, our results for the year ended December 31, 2006 include incremental share-based compensation expense totaling $922,000. In addition our results include share based compensation expense of $548,000 relating to stock issuances under our Employee Stock Purchase Plan. Accordingly our total stock based compensation totaled $1,540,000 for the year ended December 31, 2006 compared to $850,000 for the year ended December 31, 2005. The income tax benefit recognized in the income statement for shares based compensation arrangements amounted to $584,000 for the year ended December 31, 2006.
Segment Reporting
We determine and disclose industry segments in accordance with SFAS No. 131; “Disclosures about Segments of an Enterprise and Related Information,” which uses a “management” approach for determining business segments. The management approach designates the internal organization that is used by management for making operating decisions and assessing performance as the source of our reportable segments. SFAS No. 131 also requires disclosures about products and services, geographic areas, and major customers. See Note 14 — “Segment and Geographic Information”.
Reclassifications
Certain reclassifications have been made to the 2005 financial statements to conform to the 2006 presentation with no change in the previously reported net income or shareholders’ equity.
Certain Risks and Uncertainties
We derive most of our revenues from the sale of the urinalysis analyzers, and related supplies and services. Relatively modest declines in unit sales or gross margins could have a material adverse effect on our revenues and profits.
Certain of our components are obtained from outside vendors, and the loss or breakdown of our relationships with these outside vendors could subject us to substantial delays in the delivery of our products to our customers. Furthermore certain key components of our instruments are manufactured by only one supplier. For example, ARKRAY is the single source supplier for our line of urine chemistry analyzers and related consumable products and spare parts. Roche Diagnostics is the sole source for our proprietary CHEMSTRIP/IRIStrip urine test strips and related urine test strip readers, both used in our legacy instruments, the Model 500 and 939UDx urinalysis workstations. Because these suppliers are the only vendors with which we have a relationship for a particular component, we may be unable to sell products if one of these suppliers becomes unwilling or unable to deliver components meeting our specifications. Our inability to sell products to meet delivery schedules could have a material adverse effect on our reputation in the industry, as well as our financial condition and results of operation.
Roche Diagnostics has exercised its right to terminate its agreements with us relating to the supply of test strips and related urine test strip readers. Roche will continue to supply test strips and replacement readers to our installed base of legacy workstations until 2009. The failure to successfully and timely complete the phase out of their strips and readers with the introduction of our iQ200 analyzers would have a material adverse affect on our instrument sales and the revenue growth for system consumables and service.
New Accounting Pronouncement
In March 2006, the FASB issued EITF 06-3, “How Taxes Collected from Customers and Remitted to Governmental Authorities Should Be Presented in the Income Statement (That is, Gross versus Net Presentation)” that clarifies how a company discloses its recording of taxes collected that are imposed on revenue producing activities. EITF 06-3 is effective for the first interim reporting period beginning after December 31, 2006. The Company currently reports revenue on a net basis. The Company does not expect application of EITF No. 06-03 to have any effect on the Company’s consolidated results of operations, financial position or cash flows.
51
Table of Contents
In June 2006, the FASB issued FASB Interpretation No. 48, Accounting for Uncertainty in Income Taxes, (FIN 48) an interpretation of FASB Statement No. 109, Accounting for Income Taxes. FIN 48 requires that a position taken or expected to be taken in a tax return be recognized in the financial statements when it is more likely than not (i.e. a likelihood of more than fifty percent) that the position would be sustained upon examination by tax authorities. A recognized tax position is then measured at the largest amount of benefit that is greater than fifty percent likely of being realized upon ultimate settlement. Upon adoption, the cumulative effect of applying the recognition and measurement provisions of FIN 48, if any, shall be reflected as an adjustment to the opening balance of retained earnings. We are currently evaluating the impact of the adoption of FIN 48 on our financial statements.
In September 2006, the SEC issued SAB 108, “Topic 1N – Considering the Effects of Prior Year Misstatements when Quantifying Misstatements in Current Year Financial Statements,” which provides guidance on quantifying prior year errors for the purpose of evaluating materiality on current year financial statements. SAB 108 is effective for fiscal years ending after November 15, 2006. We do not expect the adoption of this statement to have a material impact on our financial statements.
In September 2006, the FASB issued SFAS 157, which addresses how companies should measure fair value when they are required to use a fair value measure for recognition or disclosure purposed under generally accepted accounting principles. As a result of SFAS 157, there is a common definition of fair value to be used throughout GAAP; SFAS 157 is effective for fiscal years beginning after November 15, 2007. We are currently evaluating the impact of adopting SFAS 157 on our financial position and results of operations.
In February 2007, the FASB issued SFAS No. 159, “The Fair Value Option for Financial Assets and Financial Liabilities” (SFAS 159), which provides entities with the option to measure certain financial instruments and other items at fair value, whereas those items are not currently required to be measured at fair value. SFAS 159 will be effective for us on January 1, 2008. We are currently evaluating the impact of adopting SFAS 159 on our financial position and results of operations.
3. Acquisitions
On April 3, 2006 we acquired the stock of Leucadia Technologies, Inc., a development stage molecular diagnostics company. With this acquisition we acquired significant core technology for an ultra-sensitive immunoassay process and novel in-vitro separation and concentration process as well as in-process research and development for bacteria and cancer detection applications.
Pursuant to the acquisition agreement we paid $3.3 million of cash, 272,375 shares of IRIS common stock, valued at $4.2 million, deferred stock units for 51,879 shares of IRIS common stock valued at $0.8 million and $230,000 of transaction fees. The IRIS common stock and deferred stock units were valued based on the average closing market price of IRIS common stock a few days before and a few days following the acquisition. In addition, we will issue up to 108,950 shares of IRIS common stock and deferred stock units for 20,752 shares of IRIS common stock as earn-out consideration if certain regulatory and sales milestones are achieved. The goodwill related to the Leucadia acquisition is non-deductible on a tax basis. The acquisition was accounted for as a purchase with the allocation, based on fair value, as follows:
52
Table of Contents
| (In thousands) | |||
Cash and cash equivalents | $ | 2 | |
Fixed assets | 21 | ||
Core Technology | 1,790 | ||
Goodwill | 2,231 | ||
Total assets acquired | $ | 4,044 | |
Total liabilities – deferred tax liability | $ | 662 | |
In-process research and development expense | $ | 5,180 | |
On June 2, 2005, we completed the acquisition of the assets (primarily technology and inventory) of the urinalysis business of Quidel Corporation. With this acquisition, we acquired significant core technology and know-how in urine chemistry strips, patents and trademarks, product designs, a strip manufacturing facility in Germany and a semi-automated urine chemistry analyzer that will enable us to offer a more complete product line internationally.
Pursuant to the acquisition agreement, we paid $500,000 in cash and assumed approximately $34,000 in accrued liabilities. We also incurred approximately $243,000 in professional and other fees, the total acquisition cost amounting to $777,000. The acquisition was accounted for as a purchase with the purchase price allocated, subject to adjustment, to the fair value of the assets acquired. The allocation of the acquisition price resulted in an excess of the fair value of the assets acquired over the purchase price and resulted in negative goodwill. The negative goodwill reduced the non-current assets to zero with the acquisition cost of $777,000 allocated to the fair value of the inventory acquired.
The following unaudited condensed consolidated pro forma statement of operations data shows the results of our operations for the year ended December 31, 2006 and 2005 as if the recently completed acquisitions had occurred at the beginning of each period presented:
| (In thousands, except per share data) | 2006 | 2005 | |||||
Revenues | $ | 70,494 | $ | 63,210 | |||
Income from operations | 829 | 2,684 | |||||
Net income (loss) | (307 | ) | 353 | ||||
Net income (loss) per share – diluted | (0.02 | ) | 0.02 | ||||
These unaudited condensed consolidated pro forma results have been prepared for comparative purposes only and are not necessarily indicative of the actual results of operations had the acquisitions taken place as of the beginning of the respective periods or the results of our future operations. Furthermore, the pro forma results do not give effect to all cost savings or incremental costs that may occur as a result of the integration and consolidation of the acquisitions.
4. Inventories
Inventories consist of the following:
| At December 31, | ||||||||
| (In thousands) | 2006 | 2005 | ||||||
Finished goods | $ | 2,127 | $ | 2,800 | ||||
Work-in-process | 241 | 337 | ||||||
Raw materials, parts and sub-assemblies | 4,990 | 5,085 | ||||||
| 7,358 | 8,222 | |||||||
Less: non-current portion, net of reserves | (440 | ) | (632 | ) | ||||
Inventories – current portion | $ | 6,918 | $ | 7,590 | ||||
53
Table of Contents
5.Properties and Equipment
Property and equipment consist of the following:
| At December 31, | ||||||||
| (In thousands) | 2006 | 2005 | ||||||
Machinery and equipment | $ | 7,831 | $ | 6,675 | ||||
Leasehold improvements | 4,228 | 2,012 | ||||||
Furniture and fixtures | 711 | 461 | ||||||
Tooling, dies and molds | 1,575 | 1,485 | ||||||
Rental units | 282 | 242 | ||||||
| 14,627 | 10,875 | |||||||
Less: accumulated depreciation and amortization | (7,965 | ) | (6,799 | ) | ||||
| $ | 6,662 | $ | 4,076 | |||||
Depreciation and amortization expense was $1.6 million, $1.2 million, and $936,000 in 2006, 2005 and 2004.
6. Sales-type Leases
The components of net investment in sales-type leases consist of the following:
| At December 31, | ||||||||
| (In thousands) | 2006 | 2005 | ||||||
Total minimum lease payments | $ | 10,155 | $ | 8,264 | ||||
Less: unearned income | (1,282 | ) | (968 | ) | ||||
Net investment in sales-type leases | 8,873 | 7,296 | ||||||
Less: current portion | (2,145 | ) | (1,455 | ) | ||||
| $ | 6,728 | $ | 5,841 | |||||
Future minimum lease payments due from customers under sales-type leases for each of the five succeeding years: $2.6 million in 2007, $2.6 million in 2008, $2.5 million in 2009, $1.7 million in 2010 and $0.7 million in 2011 and $57,000 thereafter.
7. Accrued Expenses
Accrued expenses consist of the following:
| At December 31, | ||||||
| (In thousands) | 2006 | 2005 | ||||
Accrued bonuses | $ | 891 | $ | 634 | ||
Accrued commissions | 420 | 584 | ||||
Accrued payroll | 685 | 496 | ||||
Accrued vacation | 815 | 554 | ||||
Accrued professional fees | 381 | 158 | ||||
Accrued warranty | 1,039 | 760 | ||||
Accrued laboratory information system implementations | 734 | 356 | ||||
Accrued – other | 1,449 | 646 | ||||
| $ | 6,414 | $ | 4,188 | |||
Changes in the accrued warranty liability were as follows:
| At December 31, | ||||||||
| (In thousands) | 2006 | 2005 | ||||||
Balance – beginning of year | $ | 760 | $ | 356 | ||||
Additions for provisions during year | 1,118 | 929 | ||||||
Reductions during year | (839 | ) | (525 | ) | ||||
Balance – end of year | $ | 1,039 | $ | 760 | ||||
54
Table of Contents
8. Bank Loan Agreement
In May 2004, we signed a credit facility with a commercial bank. The credit facility consists of a $6.5 million revolving line of credit for working capital and a $10.0 million line of credit for acquisitions and product opportunities. Borrowings under the revolving line of credit are limited to a percentage of eligible receivables and inventory. The entire credit facility has variable interest rates, which will change from time to time based on changes to either the LIBOR rate or the lender’s prime rate.
As of December 31, 2006 and 2005, there were no borrowings under the credit facility. We are subject to certain financial covenants under the credit facility with the bank and as of December 31, 2006, we were in compliance with such covenants.
9. Income Taxes
The provision for income taxes from operations consists of the following:
| For the Year Ended December 31, | ||||||||||
| (In thousands) | 2006 | 2005 | 2004 | |||||||
Current: | ||||||||||
Federal | $ | 186 | $ | — | $ | — | ||||
State | 274 | 49 | 24 | |||||||
| 460 | 49 | 24 | ||||||||
Deferred: | ||||||||||
Federal | 3,090 | 2,722 | 914 | |||||||
Foreign | (79 | ) | — | — | ||||||
State | (1,158 | ) | 644 | 581 | ||||||
| 1,853 | 3,366 | 1,495 | ||||||||
| $ | 2,313 | $ | 3,415 | $ | 1,519 | |||||
Income taxes have been based on the following components of pre-tax income (loss):
| For the Year Ended December 31, | |||||||||||
| (In thousands) | 2006 | 2005 | 2004 | ||||||||
Domestic | $ | 3,452 | $ | 10,166 | $ | 3,799 | |||||
Foreign | (1,314 | ) | (620 | ) | — | ||||||
| $ | 2,138 | $ | 9,546 | $ | 3,799 | ||||||
The provision for income taxes differs from the amount obtained by applying the federal statutory income tax rate to income before provision for income taxes as follows:
| For the Year Ended December 31, | ||||||||||||
| (In thousands) | 2006 | 2005 | 2004 | |||||||||
Tax provision computed at Federal statutory rate | $ | 727 | $ | 3,246 | $ | 1,291 | ||||||
State taxes, net of federal benefit | 213 | 400 | 190 | |||||||||
R&D tax credits | (583 | ) | (455 | ) | (341 | ) | ||||||
In-process purchased R&D | 1,959 | — | — | |||||||||
Expiration of Federal or State NOLs | — | 49 | 62 | |||||||||
Nondeductible expenses | 594 | 504 | 166 | |||||||||
Change in valuation allowance | (271 | ) | — | 341 | ||||||||
Foreign branch losses | (512 | ) | (240 | ) | — | |||||||
Other | 186 | (89 | ) | (190 | ) | |||||||
| $ | 2,313 | $ | 3,415 | $ | 1,519 | |||||||
55
Table of Contents
At December 31, 2006, we had federal net operating loss carry forward of approximately $9.4 million, and state net operating loss carry forward of $1.0 million, which expire in fiscal years ending in 2007 through 2025. We also have tax credit carry forwards of $2.2 million for federal and $1.7 million for state, net of valuation allowances.
The primary components of temporary differences, which give rise to our net deferred tax asset at December 31, 2006 and 2005, are as follows:
| At December 31, | ||||||||
| (In thousands) | 2006 | 2005 | ||||||
Depreciation and amortization | $ | (222 | ) | $ | 550 | |||
Allowance for doubtful accounts | 272 | 116 | ||||||
Accrued liabilities | 2,259 | 1,345 | ||||||
Deferred revenue-service contracts | (140 | ) | (100 | ) | ||||
Net operating loss carry forward | 3,232 | 7,348 | ||||||
Tax credits | 4,384 | 2,530 | ||||||
Valuation allowance | (1,510 | ) | (1,781 | ) | ||||
Other | 106 | 21 | ||||||
| $ | 8,381 | $ | 10,029 | |||||
Realization of deferred tax assets associated with net operating losses (“NOL”) and tax credit carry forward is dependent upon our ability to generate sufficient taxable income prior to their expiration. Management believes it is more likely than not that the deferred tax assets will be realized through future taxable income or alternative tax strategies. However, the net deferred tax assets could be reduced in the near term if management’s estimates of taxable income during the carryforward period are not realized or are significantly reduced or alternative tax strategies are not available. However, we have established a valuation allowance for the R&D tax credits based on our estimate of future utilization. We will continue to review estimates of taxable income and will make adjustments to the valuation allowance, when necessary.
Also, should we undergo an ownership change as defined in Section 382 of the Internal Revenue Code, our NOLs generated prior to the ownership change would be subject to an annual limitation. If this occurs, a valuation allowance may be necessary.
10. Capital Stock
Private Placements
In April 2004, we sold 2,130,000 shares of our common stock in a private placement at a price of $5.85 per share (a 10% discount to market). In addition, the investors received five-year warrants to purchase 319,500 additional shares of common stock at an exercise price of $7.80 per share. In addition, the investment bank received five-year warrants to purchase 122,475 shares of common stock at an exercise price of $7.80 per share. The agreement required us to file a registration statement within 30 days of closing and to have the registration statement declared effective within 90 days of closing. In May 2004, we filed a registration statement, which was declared effective on May 21, 2004. We realized net proceeds (after deducting offering expense of $1.0 million) of approximately $11.5 million. We used approximately $5.5 million of the net proceeds to retire all our outstanding indebtedness.
Stock Issuances
During 1990, the IRIS Board of Directors adopted an Employee Stock Purchase Plan designed to allow our employees to buy its shares at 50% of the current market price, provided that the employee agrees to hold the shares purchased for a minimum of one year. The employee’s 50% portion of stock purchases under the plan may not exceed 15% of the employee’s total compensation during any year. The remaining 50% portion is recorded as deferred compensation and amortized over the vesting period. The shares purchased pursuant to this plan may not be transferred, except following the death of the employee or a change in control, for a period of one year following the date of purchase. During the period of the limitation on transfer, we have the option to repurchase the shares at the employee’s purchase price if the employee terminates employment with the
56
Table of Contents
Company either voluntarily or as a result of termination for cause. During 2006, 2005 and 2004, we issued 16,000, 120,000 and 67,000 shares of common stock in this Plan and recorded deferred compensation in the amounts of $19,000, $850,000 and $224,000. On December 22, 2005 the Plan was amended by our Board of Directors, whereby effective January 1, 2006, our employees can purchase shares at 85% of the then current market price; all other aspects of the Plan remain the same.
Stock Option Plans and Employee Benefit Plans
As of December 31, 2006, we had three stock option plans under which we may grant non-qualified stock options, incentive stock options and stock appreciation rights. No stock appreciation rights have been granted under these plans.
In October 2005, the Board of Directors approved a resolution whereby all employee options then outstanding were fully vested. In accordance with FIN 44 “Accounting for Certain Transactions Involving Stock Options”, we recorded a charge to earnings in the amount of $112,000 representing an estimate for employee turnover during the remaining vesting period. The purpose of this action was to mitigate the effect on future earnings of implementing SFAS 123R.
The following schedule sets forth options authorized, exercised, outstanding and available for grant under our three stock option plans as of December 31, 2006:
(In thousands)
| Number of Option Shares | |||||||
Plan | Authorized | Exercised | Outstanding | Available for Grant | ||||
1994 Plan | 700 | 665 | 35 | — | ||||
1997 Plan | 600 | 547 | 53 | — | ||||
1998 Plan | 4,100 | 1,798 | 1,812 | 490 | ||||
| 5,400 | 3,010 | 1,900 | 490 | |||||
In addition to the above, as of December 31, 2006 there were stock options outstanding to purchase 73,000 shares of common stock that were issued in 2003 under special inducement grants.
The following table sets forth certain information relative to stock options during the three years ended December 31, 2006.
(In thousands, except for per share)
| Shares | Weighted Average Exercise Price | Average Intrinsic Value | ||||||
Outstanding at January 1, 2004 | 2,909 | $ | 2.46 | ||||||
Granted | 528 | $ | 7.73 | ||||||
Exercised | (1,033 | ) | $ | 1.77 | |||||
Canceled or expired | (115 | ) | $ | 3.05 | |||||
Outstanding at December 31, 2004 | 2,289 | $ | 3.97 | ||||||
Granted | 288 | $ | 11.63 | ||||||
Exercised | (811 | ) | $ | 3.03 | |||||
Canceled or expired | (49 | ) | $ | 5.18 | |||||
Outstanding at December 31, 2005 | 1,717 | $ | 6.89 | ||||||
Granted | 569 | $ | 16.55 | ||||||
Exercised | (301 | ) | $ | 4.59 | |||||
Canceled or expired | (12 | ) | $ | 18.26 | |||||
Outstanding at December 31, 2006, average remaining life - 3.4 years | 1,973 | $ | 9.98 | $ | 9,599 | ||||
Exercisable at December 31, 2006, average remaining life – 3.28 years | 1,480 | $ | 7.64 | $ | 9,443 | ||||
57
Table of Contents
The weighted average grant-date fair value of options granted during the years ended December 31, 2006, 2005 and 2004 was $5.76, $6.86 and $3.06. The intrinsic value of options exercised during the years ended December 31, 2006, 2005 and 2004 was $3,555,000 $10,928,000 and $5,716,000.
The Compensation Committee of the Board of Directors determines the exercise price of options. Payment of the exercise price may be made either in cash or with shares of common stock that have been held at least six months. The options generally vest over either three or four years and expire either five or ten years from the date of grant. The fair value of each option grant is estimated on the date of the grant using the Black-Scholes option pricing model with the following weighted average assumptions:
| For the Year Ended December 31, | |||||||||
| (In thousands) | 2006 | 2005 | 2004 | ||||||
Risk free interest rate | 4.6 | % | 4.3 | % | 3.6 | % | |||
Expected lives (years) | 3.0 | 3.0 | 5.0 | ||||||
Expected volatility | 47 | % | 40 | % | 39 | % | |||
Expected dividend yield | — | — | — | ||||||
The expected volatilities are based on the historical volatility of our stock. The observation is made on a weekly basis. The expected terms of the stock options are based on the average vesting period on a basis consistent with the historical experience for similar option grants. The risk-free rate is consistent with the expected terms of the stock options and based on the U.S. Treasury yield curve in effect at the time of grant.
A summary of non-vested stock options during the twelve months ended December 31, 2006 is presented below:
| (In thousands) | Shares | Weighted Average Grant Date Fair Value | ||||
Non-vested options at January 1, 2006 | — | — | ||||
Granted | 569 | $ | 16.55 | |||
Vested | (70 | ) | $ | 13.63 | ||
Forfeited or expired | (1 | ) | $ | 22.95 | ||
Non-vested options at December 31, 2006 | 498 | $ | 15.70 | |||
As of December 31, 2006, there was approximately $1,581,000 of accumulated unrecognized stock compensation based on fair value on the grant date related to non-vested options granted under the stock option plans. That cost is expected to be recognized during the weighted average service period of 4.0 years. The share-based compensation will be amortized based on the straight line method over the vesting period and the expense includes an estimate of the awards that will be forfeited. The total fair value of shares vested during the year ended December 31, 2006 was $279,000
All employees are also eligible to participate in a 401(k) Plan at the beginning of the first quarter following their employment start date. Our contributions are discretionary. Effective January 1, 2006 we commenced matching $0.50 per $1 contributed by the employees up to 6% of the employee’ contributions, prior to 2006 our practice was to match $0.25 per $1 contributed by the employees up to 4% of the employees’ contributions. Employees vest in amounts contributed by us immediately. We contributed $223,000, $89,000 and $83,000 to the 401(k) Plan for the year ended December 31, 2006, 2005, and 2004.
58
Table of Contents
Warrants
At December 31, 2006, there were warrants outstanding to purchase 74,300 shares of common stock at $7.80 per share. These warrants are exercisable and will expire April 23, 2009. During the year ended December 31, 2006, no warrants were issued, exercised, cancelled or expired. During the year ended December 31, 2005, no warrants were issued, cancelled or expired and warrants to purchase 328,784 shares were exercised and we received proceeds amounting to $1,010,000.
11. Commitments and Contingencies
Leases
We lease real property and equipment under agreements, which expire at various times over the next five years. Certain leases contain renewal options and generally require us to pay utilities, insurance, taxes and other operating expenses.
Future minimum rental payments required under operating leases that have an initial term in excess of one year as of December 31, 2006, are as follows:
(In thousands)
| Operating Leases | ||
Year Ended December 31, | |||
2007 | $ | 1,308 | |
2008 | 1,289 | ||
2009 | 1,219 | ||
2010 | 638 | ||
2011 | 228 | ||
Thereafter | 939 | ||
| $ | 5,621 | ||
Rent expense under all operating leases during 2006, 2005 and 2004 was $1,359,000, $822,000 and $636,000.
On December 13, 2006, the Board of Directors adopted a resolution authorizing the Company to provide lease automobiles to field service and sales personnel commencing in 2007. The estimated cost for the leased vehicles over a 48 month period is expected to be approximately $555,000 plus operating costs.
Litigation
From time to time, we are party to certain litigation arising in the normal course of business. Management believes that the resolution of such matters will not have a material adverse effect on our financial position, results of operations or cash flows.
Guarantees
We enter into indemnification provisions under (i) agreements with other companies in its ordinary course of business, typically with business partners, contractors, and customers, landlords and (ii) agreements with investors. Under these provisions, we generally indemnify and hold harmless the indemnified party for losses suffered or incurred by the indemnified party as a result of our activities or, in some cases, as a result of the indemnified party’s activities under the agreement. These indemnification provisions often include indemnifications relating to representations made by us with regard to intellectual property rights. These indemnification provisions generally survive termination of the underlying agreement. In addition, in some cases, we have agreed to reimburse employees for certain expenses and to provide salary continuation during short-term disability. The maximum potential amount of future payments we could be required to make under these indemnification provisions is unlimited. We have not incurred material costs to defend lawsuits or settle claims related to these indemnification agreements. As a result, we believe the estimated fair value of these agreements is minimal. Accordingly, we have no liabilities recorded for these agreements as of December 31, 2006.
Severance Liability
The Company has three severance agreements with key executives in which the Company would be liable for payment in the event of their termination.
59
Table of Contents
12. Earnings per Share
The computation of per share amounts for 2006, 2005 and 2004 is based on the average number of common shares outstanding for each period. Options and warrants to purchase 2,047,000, 199,000 and 805,000 shares of common stock were not considered in the computation of diluted EPS for 2006, 2005 and 2004, because their inclusion would have been antidilutive.
The following is a reconciliation of weighted average shares used in computing basic and diluted earnings per share:
(In thousands)
| 2006 | 2005 | 2004 | |||
Weighted average number of shares – basic | 17,855 | 16,758 | 14,459 | |||
Effect of dilutive securities: | ||||||
Options | — | 857 | 926 | |||
Warrants | — | 39 | 433 | |||
Weighed average number of shares – diluted | 17,855 | 17,654 | 15,818 | |||
13. License
Sysmex Corporation developed several urine sediment analyzers under licenses (which expired in July 2004), from us using our technology. IRIS received royalties under these licenses of $336,000 during 2004.
14. Segments and Geographic Information
Our operations are organized on the basis of products and related services and under SFAS No. 131, we operate in two segments: (1) IVD and (2) sample processing.
The IVD segment designs, develops, manufactures, markets and distributes IVD systems based on patented and proprietary technology for automating microscopic procedures for urinalysis. The segment also provides ongoing sales of supplies and services necessary for the operation of installed urinalysis workstations. In the United States, these products are sold through a direct sales force. Internationally, these products are sold through distributors. The segment also includes the operations of the IMD research division and the ADIR research subsidiary.
The sample processing segment designs, develops, manufactures and markets a variety of benchtop centrifuges, small instruments and supplies. These products are used primarily for manual specimen preparation and dedicated applications in coagulation, cytology, hematology and urinalysis. These products are sold worldwide through distributors.
The accounting policies of the segments are the same as those described in the “Summary of Significant Accounting Policies”. We evaluate the performance of our segments and allocate resources to them based on earnings before income taxes, excluding corporate charges (“Segment Profit”).
60
Table of Contents
The tables below present information about reported segments for the three years ended December 31, 2006:
(In thousands)
| IVD | Sample Processing | Unallocated Corporate Expenses | Total | |||||||||
| For the Year Ended December 31, 2006 | |||||||||||||
Revenues | $ | 59,360 | $ | 11,134 | $ | $ | 70,494 | ||||||
Interest income | 1,062 | 6 | 1,068 | ||||||||||
Interest expense | 18 | — | 18 | ||||||||||
Depreciation and amortization | 1,908 | 221 | 13 | 2,142 | |||||||||
Segment pre-tax profit | 4,686 | 2,460 | (5,008 | ) | 2,138 | ||||||||
Segment assets | 49,845 | 16,018 | 8,454 | 74,317 | |||||||||
Investment in long-lived assets | 19,328 | 462 | — | 19,790 | |||||||||
| For the Year Ended December 31, 2005 | |||||||||||||
Revenues | 53,250 | 9,530 | — | 62,780 | |||||||||
Interest income | 600 | 7 | — | 607 | |||||||||
Interest expense | 10 | — | 5 | 15 | |||||||||
Depreciation and amortization | 1,640 | 164 | 14 | 1,818 | |||||||||
Other non-cash items | 11 | — | — | 11 | |||||||||
Segment pre-tax profit | 11,543 | 1,831 | (3,828 | ) | 9,546 | ||||||||
Segment assets | 50,075 | 3,815 | 10,039 | 63,929 | |||||||||
Investment in long-lived assets | 12,196 | 508 | — | 12,704 | |||||||||
| For the Year Ended December 31, 2004 | |||||||||||||
Revenues | 35,307 | 8,343 | — | 43,650 | |||||||||
Interest income | 106 | 5 | — | 111 | |||||||||
Interest expense | 6 | — | 237 | 243 | |||||||||
Depreciation and amortization | 1,626 | 90 | 15 | 1,731 | |||||||||
Other non-cash items | 538 | — | — | 538 | |||||||||
Segment pre-tax profit | 5,658 | 1,945 | (3,804 | ) | 3,799 | ||||||||
Segment assets | 35,769 | 3,052 | 9,315 | 48,136 | |||||||||
Investment in long-lived assets | 8,518 | 204 | — | 8,722 | |||||||||
We ship products from two locations in the United States. Substantially all long-lived assets are located in the United States. Sales to international customers amounted to approximately $20.1 million in 2006, $19.0 million in 2005 and $8.0 million in 2004.
Segment assets attributed to corporate unallocated expenses are deferred taxes. Long-lived assets include property and equipment, intangible assets, long-term portion of inventory and other long-term assets. Deferred income tax is excluded from long-lived assets.
61
Table of Contents
15. Selected Quarterly Data (Unaudited)
The following table summarizes certain financial information by quarter:
| 2006 Quarter Ended | |||||||||||||
| (In thousands, except per share) | March 31 | June 30 | September 30 | December 31 | |||||||||
Net revenues | $ | 16,115 | $ | 16,598 | $ | 18,008 | $ | 19,773 | |||||
Gross profit | 8,290 | 8,410 | 8,140 | 9,871 | |||||||||
Net income | 1,658 | (4,477 | ) | 774 | 1,870 | ||||||||
Net income per share – basic: | 0.10 | (0.25 | ) | 0.04 | 0.10 | ||||||||
Net income per share – diluted: | 0.09 | (0.25 | ) | 0.04 | 0.10 | ||||||||
| 2005 Quarter Ended | ||||||||||||
| (In thousands, except per share) | March 31 | June 30 | September 30 | December 31 | ||||||||
Net revenues | $ | 13,964 | $ | 15,577 | $ | 16,002 | $ | 17,237 | ||||
Gross profit | 6,894 | 7,596 | 8,108 | 8,547 | ||||||||
Net income | 1,271 | 1,577 | 1,542 | 1,741 | ||||||||
Net income per share – basic: | 0.08 | 0.09 | 0.09 | 0.10 | ||||||||
Net income per share – diluted: | 0.07 | 0.09 | 0.09 | 0.10 | ||||||||
| (1) | During the second quarter of 2006, we acquired Leucadia Technologies Inc., as described in Note 3, which included $5.2 million of purchased in-process R&D which that was charged to R&D expense for the quarter. The second quarter also included approximately $500,000 relating to expenses associated with the transition to a new Chief Financial Officer. |
| (2) | During the third quarter of 2006, we incurred lower gross margins due to additional provisions for sales returns, inventory write-downs and the effects of lower margins on chemistry strips manufactured in Germany. The third quarter of 2006 was also impacted by the increased R&D expenses associated with the acquisition of Leucadia which amounted to approximately $600,000. |
| (3) | In the fourth quarter of 2006, we incurred an additional charge of $275,000 relating to Chief Financial Officer transition costs. |
16. Valuation and Qualifying Accounts
(In thousands)
| Beginning Balance | Charged To Cost and | Additions Charged To Other Accounts | Deductions | Ending Balance | ||||||||||
Year Ended December 31, 2006 | |||||||||||||||
Allowance for doubtful accounts | $ | 231 | $ | 507 | — | $ | (255 | )(1) | $ | 483 | |||||
Allowance for sales returns | 57 | 148 | — | — | 205 | ||||||||||
Reserve for inventory obsolescence | 889 | — | (8 | )(1) | 881 | ||||||||||
Valuation of deferred tax assets | 1,781 | — | — | (271 | )(2) | 1,510 | |||||||||
Year Ended December 31, 2005 | |||||||||||||||
Allowance for doubtful accounts | $ | 208 | $ | 103 | — | $ | (80 | )(1) | $ | 231 | |||||
Allowance for sales returns | 128 | — | — | (71 | )(1) | 57 | |||||||||
Reserve for inventory obsolescence | 1,193 | 838 | — | (1,142 | )(1) | 889 | |||||||||
Valuation of deferred tax assets | 1,781 | — | — | 1,781 | |||||||||||
Year Ended December 31, 2004 | |||||||||||||||
Allowance for doubtful accounts | $ | 262 | $ | 24 | — | $ | (78 | )(1) | $ | 208 | |||||
Allowance for sales returns | 50 | 237 | — | (159 | )(1) | 128 | |||||||||
Reserve for inventory obsolescence | 959 | 304 | — | (70 | )(1) | 1,193 | |||||||||
Valuation of deferred tax assets | 1,387 | 394 | — | 1,781 | |||||||||||
| (1) | Relates to the write-off of accounts receivable, return of merchandise, disposal of obsolete inventory or specific portion of the accounts receivable reserve or reserve for sales returns no longer needed. |
| (2) | Valuation adjustment relating to realization of deferred tax assets. |
62