UNITED STATES SECURITIES AND EXCHANGE COMMISSION
Washington, D.C. 20549
Form 10-K
| | þ | ANNUAL REPORT PURSUANT TO SECTION 13 OR 15 (d) OF THE SECURITIES EXCHANGE ACT OF 1934 |
For the fiscal year ended December 31, 2011
or
| | ¨ | TRANSITION REPORT PURSUANT TO SECTION 13 OR 15(d) OF THE SECURITIES EXCHANGE ACT OF 1934 |
For the transition period from to .
Commission File No. 1-11181
IRIS INTERNATIONAL, INC.
(Exact name of Registrant as Specified In Its Charter)
| | |
| Delaware | | 94-2579751 |
(State or other jurisdiction of Incorporation or Organization) | | (I.R.S. Employer Identification No.) |
9158 Eton Avenue, Chatsworth, California 91311
(Address of principal executive offices) (Zip Code)
(818) 709-1244
(Registrant’s telephone number, including area code)
Securities registered pursuant to Section 12(b) of the Act:
| | |
Title of each class | | Name of each exchange on which registered |
| Common Stock, par value $0.01 per share | | NASDAQ Global Market |
Securities registered pursuant to Section 12(g) of the Act: None
Indicate by check mark if the registrant is a well-known seasoned issuer, as defined in Rule 405 of the Securities Act. Yes ¨ No þ
Indicate by check mark if the registrant is not required to file reports pursuant to Section 13 or Section 15(d) of the Exchange Act. Yes ¨ No þ
Indicate by check mark whether the registrant (1) has filed all reports required to be filed by Section 13 or 15(d) of the Securities Exchange Act of 1934 during the preceding 12 months (or for such shorter period that the registrant was required to file such reports), and (2) has been subject to such filing requirements for the past 90 days. Yes þ No ¨
Indicate by check mark whether the registrant has submitted electronically and posted on its corporate Web site, if any, every Interactive Data File required to be submitted and posted pursuant to Rule 405 of Regulation S-T during the preceding 12 months (or for such shorter period that the registrant was required to submit and post such files). Yes þ No ¨
Indicate by check mark if disclosure of delinquent filers pursuant to Item 405 of Regulation S-K is not contained herein, and will not be contained, to the best of registrant’s knowledge, in definitive proxy or information statements incorporated by reference in Part III of this Form 10-K or any amendment to this Form 10-K. ¨
Indicate by check mark whether the registrant is a large accelerated filer, an accelerated filer a non-accelerated filer or a smaller reporting company. See definitions of “larger accelerated filer,” “accelerated filer” and “smaller reporting company” in Rule 12b-2 of the Exchange Act. (Check one):
| | | | | | |
| Large accelerated filer ¨ | | Accelerated filer þ | | Non-accelerated filer ¨ | | Smaller reporting company ¨ |
| | | | (Do not check if smaller reporting company) | | |
Indicate by check mark whether the registrant is a shell company (as defined in Rule 12b-2 of the Exchange Act. Yes ¨ No þ
The aggregate market value of the shares of common stock held by non-affiliates of the Registrant on June 30, 2011 was approximately $179 million based upon the closing price of $9.99 per share of its common stock as reported on the NASDAQ Global Market on such date.
The registrant had 17,888,511 shares of common stock outstanding on June 30, 2011.
DOCUMENTS INCORPORATED BY REFERENCE
Portions of the registrant’s definitive Proxy Statement for the 2012 Annual Meeting of Stockholders to be filed with the Securities and Exchange Commission, or SEC, pursuant to Regulation 14A not later than 120 days after the end of the fiscal year covered on this Form 10-K are incorporated by reference into Part III, Items 10-14 of this Form 10-K.
IRIS INTERNATIONAL, INC.
ANNUAL REPORT ON FORM 10-K
Fiscal Year Ended December 31, 2011
i
PART I
Forward-Looking Statements
This report includes “forward-looking statements” within the meaning of Section 27A of the Securities Act of 1933, as amended, and Section 21E of the Securities and Exchange Act of 1934, as amended. All statements other than statements of historical facts are “forward-looking statements” for purposes of these provisions, including any projections of earnings, revenues or other financial items, any statement of the plans and objectives of management for future operations, any statements concerning proposed new products or strategic arrangements, any statements regarding future economic conditions or performance, and any statement of assumptions underlying any of the foregoing. In some cases, forward-looking statements can be identified by the use of terminology such as “may,” “will,” “expects,” “plans,” “anticipates,” “estimates,” “potential,” “intends”, or “continue” or the negative thereof or other comparable terminology. Although we believe that the expectations reflected in the forward-looking statements contained herein are reasonable, there can be no assurance that such expectations or any of the forward-looking statements will prove to be correct, and actual results could differ materially from those projected or assumed in the forward-looking statements. Our future financial condition and results of operations, as well as any forward-looking statements, are subject to inherent risks and uncertainties, including but not limited to the Risk Factors set forth under Item 1A, and for the reasons described elsewhere in this report. All forward-looking statements and reasons why results may differ included in this report are made as of the date hereof, and we assume no obligation to update these forward-looking statements or reasons why actual results might differ.
Company Overview
We are a leading manufacturer of automatedin vitro diagnostic systems (IVD), sample processing products and high-value personalized diagnostics tests for use in hospitals and laboratories worldwide. Our IVD products analyze the chemistry and morphology of cells and sediments in a variety of body fluids. Our IVD products leverage our strengths in flow imaging technology, particle recognition and automation to bring efficiency to the hospital and commercial laboratories. The initial applications for our technology have been in the urinalysis market and we are the leading worldwide provider of automated urine microscopy and chemistry systems, with approximately 3,600 systems sold in over 50 countries. We are expanding our core imaging and morphology expertise into related markets, including applications in hematology and body fluids. In addition, our personalized medicine group operates a high complexity CLIA-certified laboratory for the further development and commercialization of our NADiA ultra-sensitive nucleic acid detection immunoassay platform, with applications in oncology and infectious disease.
Historically, we have predominantly focused on developing, manufacturing and commercializingin vitro diagnostics instruments and consumables for urinalysis, including our flagship iQ® analyzers, a family of fully-automated, image-based bench-top analyzers for urine microscopy. Urine microscopy is the visualization and identification of cells and other sediments in urine. The iQ analyzer uses a proprietary flow microscope and image-analysis software that captures the morphology of cells and sediment in urine and serous fluids, and assists in their identification and classification. Our systems are designed to provide users with faster, more complete and more consistent results, while substantially reducing hands-on time spent by laboratory technicians and turnaround time, as compared to traditional manual methods.
The iQ analyzer can be seamlessly integrated with an automated urine chemistry analyzer to simultaneously perform urine microscopy and chemistry testing in a fully automated manner. Our proprietary iChem®VELOCITY® automated urine chemistry analyzer and a fully integrated urine microscopy and urine chemistry work-cell, called the iRICELL received FDA 510(k) clearance in March 2011 and immediately thereafter, we commenced selling these new products in the United States. Historically, in the U.S. we sold our family of iQ analyzers integrated with an automated chemistry analyzer that was sourced from a Japanese manufacturer.
We intend to solidify our leadership position in the urinalysis market, as well as enter into several adjacent markets with our product pipeline under development. To maintain our market position in urinalysis, we continue to implement improvements to our existing product lines, including enhancing our data analysis and productivity
1
tools for our iRICELL systems, such as Edit Free Release Technology to improve turnaround time and iWare to enhance the interface to laboratory information systems, or LIS. These enhancements also allow more effective management of resources and costs in the screening of diseases such as urinary tract infection. In addition, late in 2011 we launched the iRICELL1500 in the United States, the first fully automated urine testing solution to address the specific needs of lower volume laboratories performing fewer than 70 urine tests per day.
We are also developing our 3GEMS™ (Third Generation Morphology System) platform, which will serve as the basis for our next generation products in urinalysis and an emerging pipeline of hematology products. These 3GEMS hematology products, currently in development, use image-based technology to automate the identification and characterization of blood cells. We believe an automated hematology analyzer using our proprietary imaging technology and software recognition capabilities will provide significant improvements in the identification of abnormal blood cells, including an automated, image-based expanded white blood cell differential analysis and other abnormal cell morphology. Like our urine microscopy products, these new hematology products by virtue of IRIS’s inherent capabilities to capture and analyze images are expected to significantly reduce the need for manual slide preparation and reviews under a microscope, increasing the efficiency and efficacy of what is currently a subjective and highly labor-intensive process.
Our Sample Processing group markets and develops centrifuges, DNA processing workstations and sample processing consumables. Our StatSpin® brand bench-top centrifuges are used for specimen preparation in coagulation, cytology, chemistry and urinalysis. Our worldwide markets include medical institutions, commercial laboratories, clinics, doctors’ offices, veterinary laboratories and research facilities. As a product line extension to our manual ThermoBrite DNA processing station, in December 2011 we announced the introduction of our new ThermoBrite® Elite Automated Laboratory Assistant, which we plan to launch in the first quarter of 2012. This new product platform provides automation for FISH (fluorescencein-situ hybridization) testing. Our Sample Processing products are sold worldwide primarily through distributors and incorporated into our OEM partners’ products.
We believe a significant driver in the future growth of diagnostics will be in personalized medicine, meaning the ability to analyze the molecular make-up of an individual patient’s cancer and assess disease progression in order to more precisely prescribe appropriate treatment. Our proprietary molecular diagnostics platform called NADiA has the ability to measure proteins below the detection thresholds of current immunoassay and molecular diagnostic methods. We believe our proprietary diagnostic products will address the need for increased sensitivity in the monitoring of disease enabling personalized treatment of cancers.
In September 2011, the FDA cleared our first NADiA assay: NADiA ProsVue™, an ultra-sensitive, blood-based test designed to be a prognostic indicator of post-prostatectomy patients at reduced risk of prostate cancer recurrence. NADiA ProsVue uses a threshold based on the slope of three successive test measurements of residual amounts of total prostate specific antigen, or tPSA, which are typically under the limit of detection of ELISA-based ultra-sensitive tPSA assays. In October 2011, we received Conformité Européenne (CE) Mark. The ProsVue commercialization strategy consists of an initial targeted direct sales approach focused on key opinion leaders and high volume urologists through our CLIA laboratory, followed by potential collaborations with major laboratories and diagnostic partners.
In September 2011, we also completed a restructuring of our Personalized Medicine division, which included downsizing and consolidating our CLIA certified laboratory operations into Iris Molecular Diagnostics. As part of this restructuring, we discontinued non-proprietary testing, but retained all licenses and high-complexity CLIA laboratory capabilities, as well as limited personnel to perform NADiA and other proprietary tests.
Market Overview and Opportunity
The global market for IVD was estimated at approximately $44 billion in 2010 and is expected to grow in the mid-single digits annually. IVD manufacturers provide products and services to the clinical laboratory industry, which is confronted with significant challenges in the current market. Healthcare professionals are demanding improved turnaround time for diagnostic tests, greater sensitivity and lower costs. To improve accuracy, productivity and efficiency, many laboratories are turning to automated methods to perform these tests.
2
Moreover, automated testing solutions better position laboratories to cope with the declining number of certified medical technologists available to perform tests.
Currently, we participate primarily in the urinalysis segment of the IVD market which we estimate is approximately $650 million. With the development of our hematology product, we will be able to enter a significantly larger market estimated at approximately $2.0 billion. In addition, with our expansion into molecular diagnostics, we have the opportunity to participate in the personalized medicine market. PricewaterhouseCoopers estimates the molecular diagnostics market in 2009 was $3 billion with a 15% growth rate. We believe we are well positioned to experience growth in this segment, which will include sales of our proprietary molecular tests utilizing our NADiA assays and licensing of our proprietary test platforms and technology.
Urinalysis
Urinalysis is performed as part of most routine medical examinations and is necessary for the diagnosis and monitoring of conditions such as urinary tract infection, and kidney and bladder disease. Traditionally, urinalysis comprises urine chemistry and urine microscopy tests, while urine cultures are considered part of microbiology. We believe that the advancement of automated technologies will blur this distinction, with urine cultures being performed increasingly in the same laboratories as urine chemistry and urine microscopy tests and eventually becoming part of the urinalysis market.
Urine Chemistry and Microscopy Market Overview
Urine chemistry consists of a panel of tests that identifies various chemical analytes in urine, while urine microscopy analyzes the microscopic solid particles and cells suspended in urine. Urine chemistry comprises the majority of the urinalysis market and is broadly used, with limited differentiation between products. Traditional urine microscopy is used less routinely because as a manual process it is time consuming and requires a trained medical technician to characterize sediments and cells based on their morphology. In order to reduce costs, many laboratories perform manual urine microscopy only in response to results from an initial urine chemistry test despite evidence that urine microscopy can provide a more reliable clinical diagnosis. The commercial success of our iQ analyzer is attributable to its capability to image and accurately identify particles and cells suspended in urine in a time-efficient manner eliminating manual microscopic examination.
Of the $650 million urinalysis segment, urine chemistry represented approximately $490 million and automated urine microscopy represented approximately $160 million, but growing at a much faster rate than the other urinalysis sub-segments. We estimate there are approximately 17,000 sites performing greater than 40 microscopy tests per day on a global basis including approximately 6,000 in China. These higher volume sites represent a significant opportunity for us, because they would benefit from the automation and consolidation of their urine chemistry and microscopy procedures. We believe the full automation and integration of results brought by the iQ product platform has accelerated the adoption of automated urine microscopy as a routine test. We believe approximately 50% of these targeted global sites continue to perform manual microscopy procedures. The penetration of automated urine microscopy analyzers varies significantly from country to country.
Limitations in Urine Chemistry and Microscopy
Current manual testing of urine and body fluids requires the clinical laboratory to split samples, perform automated and manual procedures and consolidate the separate results into one report. Moreover, the manual procedure for microscopy requires a qualified medical technician to accurately categorize particles and cells observed under the microscope. Therefore, these tests represent both time and cost intensive procedures for the clinical laboratory. Further, the inherent variability in sample preparation limits the quantitative and qualitative accuracy of the diagnostic result. The manual nature of urine microscopy procedures coupled with the lack of qualified personnel represent a significant market opportunity. However, the challenge remains to compete for capital for urinalysis automation versus other disciplines of the laboratory.
Laboratories typically perform microscopy and chemistry tests separately and generally perform microscopy only in the case of an abnormal chemistry result because urine microscopy is a very tedious process. If both tests are performed, the separate results must then be manually consolidated into one report or file. Without the
3
automatic integration of both the microscopy and chemistry results, valuable clinical information may be overlooked. By reducing the amount of manual labor spent conducting these tests and by automatically integrating the chemistry and microscopy results, we believe we can improve the consistency, reliability and value of the combined results and improve specimen turnaround time.
Hematology
Hematology Market Overview
The enumeration of the various cellular components of blood is an essential part of routine medical examinations. A complete blood count, or CBC, is the most common type of blood test performed and measures the number of specific types of blood cells, including red blood cells (RBC), white blood cells (WBC), platelets, and other blood components, such as hemoglobin. In most instances, a white cell differential count, which measures the percentage of five types of white blood cells, is added to the CBC test. Variations from concentration, size, or maturity of the blood cells can be used to indicate an infection or illness. CBC tests and differential WBC counts are performed primarily in hospitals and clinical reference laboratories.
According to Global Industry Analysts, Inc., the hematology market was approximately $2.0 billion in 2011 and growing approximately 2% to 3% per year driven primarily by system replacement sales and a small increase in test volume. Over the past 15 years, innovation within this market has been limited to automation of slide making and staining and algorithmic improvements to aid in the interpretation of results.
Limitations in Hematology
Traditional CBC test instruments use indirect means to measure the type and number of blood cells rather than direct observation of the blood cells. Despite the high number of these automated CBC analyzers in use, a significant percentage of the samples require a manual cell differential count of the blood specimen under a microscope. Frequently, a manual count is required due to the inability of automated CBC and differential analyzers to discriminate the complex morphology, especially the shape, of abnormal cells, such as immature white blood cells, or the presence of diseased cells, as in the case of sickle-cell anemia. The presence of immature white blood cells is often associated with conditions such as leukemia, infection, inflammation or tissue injury. However, a manual differential count of a blood specimen must be performed by a medical technologist trained in cytology or a pathologist under a microscope — a time consuming and subjective process, resulting in longer specimen turnaround times and higher cost.
According to a 2006 study conducted by the College of American Pathologists, of the 263 US laboratories surveyed, an average of 29% of automated CBCs required a manual review, scan or differential and this percentage dramatically increased depending on the pathology of the patient population. IRIS also confirmed this manual review rate, independently through a survey. Since the hematology market is dominated by a few large companies that typically compete on their ability to marginally reduce manual review rates, we believe there is significant opportunity to offer an automated image-based instrument that has the ability to identify immature white blood cells and other anomalies in a systematic fashion and to reduce significantly the number of manual reviews performed.
Sample Processing
Sample Processing Market Overview
Nearly every patient specimen presented to a clinical laboratory for testing requires some sort of sample processing before analysis. These samples include cytologic (blood, urine and other body fluids), histologic (tissue biopsies), and other materials which may need to be separated into its different constituents. In the United States, there are over 180,000 testing sites where sample processing occurs, including hospital laboratories, independent laboratories, doctor’s offices, health maintenance organizations and community clinics.
Although testing is performed on many different types of samples, most tests are performed on blood specimens that require separation in a centrifuge. The centrifuge market comprises five segments including non-refrigerated bench-top, refrigerated bench-top, floor, high-speed and ultra-centrifuges. According to Strategic Directions International, the worldwide market for sample processing centrifuges in 2010 was estimated
4
at $660 million, of which the market for non-refrigerated bench-top centrifuges, the market segment we serve, is estimated at approximately $100 million. To improve laboratory productivity and sample turnaround time, the trend has been towards smaller and faster bench-top models and away from large capacity floor models which have longer processing time per batch. This represents a significant opportunity for our Express line of bench-top centrifuges.
FISH (fluorescence in situ hybridization) is a cytogenetic technique that uses nucleic acid probes, which are segments of labeled DNA that are designed to hybridize or bind to the target DNA of a positive specimen. The probes are labeled with fluorescent or chromogenic molecules to enable the identification of genetic abnormalities, providing valuable information about cancer and other genetic diseases. With the increasing rate of adoption of FISH testing as standard protocol for cancer diagnostics development and application, laboratories performing as few as 10 tests per day are requiring a higher level of automation and standardization. Management estimates there are over 4,000 laboratories in the clinical and research market performing FISH testing and provides a large market opportunity for the recently introduced ThermoBrite Elite automated FISH processing system.
Limitations with Current Sample Processing Methods
The time it takes to process a sample is critical for clinical laboratories as the volume of samples to be tested increases. Each day, laboratory technicians are expected to handle thousands of samples with minimal error in a defined amount of time with limited laboratory space. In most laboratories, sample processing occurs in a central location where blood specimens are sorted and centrifuged in batches. The entire process can take up to an hour and requires dedicated resources to manage the sample flow. Once processed, the samples are often split and then sent to the various stations within the laboratory for analysis. The centralized processing of samples is thus quite inefficient as samples wait to enter the floor model centrifuge in large batches followed by long centrifugation times. In fact, many sample processing procedures create significant delays in specimen turnaround time.
In regards to FISH, the majority testing is performed manually and requires a significant amount of a skilled laboratory technician’s time and expertise. FISH procedures require numerous steps, including the successive immersion of slides in various reagents for specific time periods. These protocols are time sensitive and can take up to four to six hours of hands-on processing time. As such, a technician cannot devote attention to other laboratory tasks specifically during the pre-hybridization phase as they may risk ruining a precious patient sample. The increasing demand for these types of tests and the declining number of CLIA-certified technologists to perform them creates a significant market opportunity for the automation of FISH testing.
Personalized Medicine
Personalized medicine may be defined as giving the right treatment to the right patient at the right time. The implementation of personalized medicine has been made possible by state of the art molecular diagnostic testing. By examining the molecular make up of an individual patient’s cancer, therapy can be tailored for that specific patient, rather than blindly treating all patients with “one size fits all” drug cocktails. This leads to better management of the individual patient’s cancer, with fewer potentially ineffective drugs, reduced incidence of side effects, and overall cost savings for the healthcare industry.
Molecular Diagnostics Market Overview
Molecular diagnostic tests examine nucleic acids, including DNA and RNA, and protein biomarkers, to identify a disease, determine prognosis, monitor its progression and response to treatment, or predict individual predisposition to a disease or genetic disorder. These biomarkers can also provide information in drug discovery, preclinical drug development and patient monitoring during clinical trials. Currently, the clinical market for molecular diagnostics is primarily nucleic acid testing performed by real-time polymerase chain reaction, or PCR, instruments that amplify and detect nucleic acid targets for diseases or infections.
The analysis of DNA expression, presence of cell surface receptors, or the production of specific proteins in cells, provides the ability to characterize diseases, such as cancer and infectious diseases. As a result, the detection and identification of DNA and proteins can provide physicians with a means to tailor therapy, monitor disease progression and detect relapse.
5
Currently, the ability to detect specific proteins in cells is limited by sensitivity. We believe that development of an ultra-sensitive detection method for proteins with the capability to measure concentrations hundreds of times below the detection limits of currently available immunoassays, may provide a reliable method to detect disease at an earlier stage, which may result in improved patient care.
According to PricewaterhouseCoopers, the worldwide molecular diagnostics market in 2009 was approximately $3 billion and growing at 15% annually. We believe growth in the market is being driven primarily by an increase in the number of personalized diagnostic tests available to treat cancers and infectious diseases.
Limitations with Current Methods
Proteins are critical to understanding diseases and current testing methods lack the degree of sensitivity necessary to detect minute amounts of protein and the precision to monitor serial determinations for disease progression. Traditional methods to detect proteins, including enzyme-linked immunosorbent assay (ELISA) and chemiluminescence immunoassay (CIA), are unable to quantify protein biomarkers in extremely low concentrations. These methods become effective only after a disease has progressed to a more advanced stage and the concentration of the protein biomarker has increased to reach the lower limit of detection of those conventional methods. We believe there is a significant market opportunity for an ultra-sensitive detection technology that measures concentration as low as one femtogram per milliliter (10-15 gram/milliliter) compared to today’s technologies that are limited to measuring concentrations of greater than 50,000 femtograms per milliliter.
Our Products
Our commercialized products and product pipeline comprise three main categories: morphology, sample processing and personalized medicine. Our morphology category includes all urinalysis and hematology products consisting of our commercialized urine chemistry and microscopy products, as well as our development-stage products such as our 3GEMS urinalysis and hematology analyzers. Our sample processing category develops and markets small centrifuges and other processing equipment and accessories for rapid specimen processing. Our personalized medicine category consists of our 510(k) cleared ProsVue prostate cancer test and other development-stage products that utilize our NADiA technology for ultra-sensitive detection of proteins for monitoring cancer and infectious disease applications. The following table is a summary of our major commercialized and in-development products.
6
| | | | |
Major Products | | Status | | Description |
Morphology and Related Products | | |
iQ analyzers (Sprint, Elite, Select) | | Marketed | | Fully-automated urine microscopy and body fluids analyzer |
iQ Body Fluids Module | | Marketed | | |
Optional iWare Software | | Marketed | | |
iChemVELOCITY | | Launched 1Q11 in US and other markets requiring 510(k) clearance | | Fully-automated urine chemistry analyzer |
| | Launched internationally: 3Q2008 | | |
iRICELL (Pro and Plus versions of 3000, 2000 and 1500) | | Launched 1Q11 in US and other markets requiring 510(k) clearance | | Integrated iQ and iChemVELOCITY workcell |
| | Launched internationally: 3Q2008 | | |
3GEMS Urinalysis and Body Fluids | | In development | | Next generation urine microscopy and body fluids analyzer |
3GEMS Hematology | | In development | | Complete blood count, white blood cell count with expanded differentials and red blood cell and platelet morphology |
| |
Sample Processing | | |
Express centrifuge line | | Marketed | | Centrifuges for clinical diagnostic market |
ThermoBrite Elite | | Launching 1Q12 | | Benchtop platform for automating slide based procedures for FISH testing. A version with expanded functionality and capacity is in development. |
ThermoBrite | | Marketed | | DNA workstation for FISH procedures |
Cytofuge 2 | | Marketed | | Centrifuge used for thin layer cell preparation |
Cytofuge 12 | | Marketed | | 12 placement centrifuge used for thin layer cell preparation |
IDEXX Drive | | Marketed | | For internal use in IDEXX chemistry analyzers |
IDEXX whole blood separator | | Manufacturing rights licensed to IDEXX | | Consumable used in IDEXX chemistry analyzers |
OvaTube | | Marketed | | Ova and parasite testing for veterinarian market |
| |
Personalized Medicine | | |
NADiA ProsVue | | Launched 1Q12 | | Prognosticate stable prostate cancer patients after radical prostatectomy |
| | |
NADiA ProsVue - Expanded Applications | | In Development | | To enable a larger patient base to be monitored for a longer period post-prostatectomy |
NADiA CECs | | In feasibility | | Detect circulating epithelial cells to monitor cancer progression |
NADiA HIV | | Feasibility complete Pursuing licensing partners | | Monitoring HIV viral load during anti-retroviral therapy |
Morphology and Related Products
Cell morphology is the science of cell form and structure. Our morphology segment utilizes our proprietary imaging technology to identify cells and particles in a fully automated manner. In the urinalysis market, we offer urine microscopy analyzers and urine chemistry instruments on a standalone and integrated basis. As part of our 3GEMS Third Generation Morphology program, we are developing a next-generation urine microscopy analyzer and an image-based hematology analyzer.
7
Automated Urine Microscopy Analyzers
Our flagship product is the family of iQ urine microscopy analyzers. Our iQ technology platform utilizes proprietary image flow cytometry and software to achieve significant reductions in cost and processing time as compared to manual urine microscopy. Our technology enables high speed digital processing to classify and display images of microscopic particles in an easy-to-view graphical user interface. We believe our iQ product line has numerous benefits over competing products, including increased accuracy, digital imaging of particles and fully automated analysis of urine and body fluids and lower manual review rates of abnormal samples.
The iQ microscopy product line comprises the iQ SELECT, a fully-automated instrument capable of analyzing 40 samples an hour and enabling partial automation at laboratory sites with lower test volumes; the iQ ELITE, a fully-automated instrument capable of analyzing 70 samples an hour that is appropriate for mid-sized hospital laboratories; and the iQ SPRINT, a fully-automated instrument capable of analyzing 101 samples an hour that is appropriate for large volume hospital and commercial laboratories. By utilizing our urinalysis system, we believe the average laboratory, which we define as those laboratories that typically perform 60 microscopy tests per day, can re-assign one medical technician currently performing these tests to another function, with a payback period of approximately two years. We also offer the iQ Body Fluids Module as an addition to the iQ urinalysis test menu, which enables the rapid diagnosis for the presence of nucleated cells, red blood cells, bacteria and crystals in body fluid samples. In 2010, we attained 510(k) clearance for the synovial fluid application and added it to this optional software module.
In 2010, we also introduced the iRICELL® Plus and the iRICELL® Pro integrated urinalysis workstations which we believe delivers significant workflow enhancements and productivity to the laboratory. In addition, we launched iWARE™, an optional, expert software product that further enhances laboratory productivity by enabling real-time patient validation based on lab-defined verification rules for urine chemistry and microscopy results. The iWARE product includes an enhanced LIS communication protocol allowing for direct electronic communication between urinalysis and microbiology laboratories for more effective management of resources and costs in the screening for negative urine cultures.
Our iRICELL integrated urinalysis workstations are offered in various instrument configurations; the 3000 series integrating the high throughput iQ SPRINT with our iChemVELOCITY and a 2000 series connecting our mid-range iQ ELITE with our iChemVELOCITY. In 2011, we launched the iRICELL1500 in the United States, the first fully automated urine testing solution to address the specific needs of laboratories performing fewer than 70 urine tests per day. The iRICELL 1500 Workcell integrates the iCHEM VELOCITY automated chemistry analyzer with the iQ SELECT automated microscopy analyzer. This new product offering provides a fully automated system for managing the workload of urine microscopy and urine chemistry testing, delivering customer benefits of enhanced laboratory productivity and quality, while lowering laboratory operating costs.
Urine Chemistry Analyzers
We market our proprietary fully-automated urine chemistry analyzer, the iChemVELOCITY, which can be seamlessly connected to the iQ automated urine microscopy analyzers and provide laboratories with walk-away solutions for chemistry and microscopy urinalysis with results combined and displayed in a single report. The iChemVELOCITY is designed for medium to high volume laboratories that typically process more than 70 urine chemistry samples per day. We offer the iChemVELOCITY as a stand-alone analyzer or as part of our integrated urinalysis workcell solution, the iRICELL.
Internationally, we began selling the iChemVELOCITY in September 2008 following CE Mark certification. In March 2011, upon receipt of 510(k) clearance on our iChemVELOCITY and iRICELL products, we commenced selling them in the United States and other countries that required 510(k) clearance. Historically in the U.S., we sold a fully-automated urine chemistry analyzer manufactured by a Japanese IVD company.
Consumables and Service
We generate significant revenue from the sale of consumables and service contracts for our urine microscopy and urine chemistry analyzers. For the year ended December 31, 2011, revenue derived from consumables and service contracts accounted for 59% of our total consolidated revenues and 67% of our
8
IDD urinalysis segment’s revenue. Consumables include urine and body fluids reagents, calibrators and controls for our microscopy systems and test strips, calibrators, controls, and other solutions for the urine chemistry analyzers we manufacture and distribute. After the initial year of sale, which is covered by product warranty, we offer annual service contracts for our domestic and other direct customers in select international markets. To our distributors, we offer spare parts who in turn service the end-use customer.
3GEMS Platform
Our 3GEMS platform combines our core imaging technology with improved software and sample processing to enhance the identification of various cell types and particles found in urine, blood and other body fluids. We believe the increased sensitivity and specificity, reliability, ease of use and improved imaging of our 3GEMS platform will increase the clinical utility of our diagnostic tests and allow physicians and other caregivers to make more informed treatment decisions. The 3GEMS platform will be the basis for our next generation of image-based analyzers for the morphological examination of urine, body fluids and blood. The following describes our 3GEMS products under development:
| | Ÿ | | Next Generation Urine Microscopy Analyzers. Our next generation urine microscopy analyzer will include advances in electronics and optics and many proprietary elements designed to further automate and expand the menu of microscopic sediments under analysis. We anticipate these advances will improve the clinical utility and productivity of the instrument as a greater number of cell types will be able to be identified with greater precision. |
| | Ÿ | | Next Generation Body Fluids Module. We currently offer products that utilize our proprietary technology for morphology analysis of other body fluids, including cerebrospinal, synovial and serous fluids. We are developing a next generation body fluids module that we believe will possess improved diagnostic capabilities relative to our current product offering. |
| | Ÿ | | Hematology Analyzers. We are developing a portfolio of hematology analyzers to automate the identification and characterization of cells in blood. Our initial hematology analyzer will conduct a complete blood count, or CBC, the most common type of blood test, as well as automatically provide an expanded white cell differential analysis. This augmented differential analysis will identify the presence and quantity of immature white blood cells, whose presence is often associated with conditions such as leukemia, infection, inflammation or tissue injury. Importantly, the automation of the white cell differential will significantly reduce the need for a medical technologist trained in cytology or pathologist to manually identify and count cells under a microscope — a time consuming and subjective process. Finally, since our analyzer captures digital images of individual cells, the creation of slides to enable the review of a blood smear under a microscope and to retain physical evidence of a particular sample would be significantly reduced. Our virtual slides will be stored digitally and transmitted electronically between laboratories or healthcare providers. |
In March 2011, we entered into a Joint Development Agreement with Fujirebio Inc., one of the largestin vitro diagnostics companies in Japan, for the co-development of the 3GEMS Hematology Analyzer product line. Terms of the agreement call for Fujirebio to contribute $6 million based on the achievement of certain milestones toward the costs of the development of the 3GEMS Hematology development program in exchange for the distribution rights of the product in Japan.
Sample Processing
Our sample processing group markets and develops centrifuges, semi-automated DNA processing workstations and sample processing consumables. Our StatSpin brand bench-top centrifuges are used for specimen preparation in coagulation, cytology, chemistry and urinalysis. Our worldwide markets include medical institutions, commercial laboratories, clinics, doctors’ offices, veterinary laboratories and research facilities.
With our sample processing products, we believe we offer laboratories the ability to reduce turnaround times and increase their efficiency by processing samples as they arrive rather than in a batch mode. Our bench-top centrifuges offer a significant advantage with two to three minute cycles compared to conventional centrifuges taking up to 15-30 minutes, depending on batch size. Further, our bench-top models are small enough to sit alongside an analyzer eliminating the need for a separate central sample processing area.
9
Our Express 4 centrifuge employs a unique high speed horizontal rotor for separating samples and replaces larger and slower batch centrifuges by reducing sample preparation time and streamlining laboratory workflow. This product platform enables us to serve the high-volume chemistry market.
In November of 2010, we acquired the assets of a multi-purpose, bench-top instrument platform for automating highly repetitive, manual laboratory protocols for FISH testing and other slide-based cytogenetic applications. This new product called the ThermoBrite Elite automates all of the pre- and post-hybridization steps, as well as on-board denaturation and hybridization, which provides the end-user with higher confidence in a standardized and reproducible result. In addition, the ThermoBrite Elite has the ability to customize protocols for sample types and assays providing superior versatility and the potential to penetrate the research market. The ThermoBrite Elite is a natural brand extension to our successful semi-automated ThermoBrite DNA Hybridization System and is consistent with our expansion in personalized medicine with an emphasis on cancer diagnostics. ThermoBrite Elite was introduced in December 2011 and will be launched in the first quarter of 2012, and is expected to position us as a major competitor in the high growth cytogenetic instrumentation market.
Another product offering from our sample processing group is the StatSpin Ovatube, a centrifugal separation system for use in veterinary hospitals, clinics and reference laboratories to process fecal samples for the detection of gastrointestinal ova and parasites. Gastrointestinal parasites are not only primary disease agents in companion animals, some are also transmissible to people. Management estimates there are some 20 million ova and parasite tests performed on companion animals each year in the U.S. alone, with some 10 million of these tests being performed in 25,000 veterinary clinics. Of all the diagnostic techniques used to detect gastrointestinal parasites, none is more accurate and reliable than centrifugal fecal flotation, as recommended by the Companion Animal Parasite Council (CAPC). The StatSpin OvaTube complies with this recommendation.
Personalized Medicine
NADiA (Nucleic Acid Detection Immunoassay) Platform
Our Personalized Medicine category is leveraging our proprietary NADiA technology and Microbubble Isolation Technology platforms to develop ultra-sensitive and precise diagnostic tests. NADiA technology has the ability to measure proteins in extremely low concentrations below the detection thresholds of current immunoassay and molecular diagnostic methods. NADiA combines immunoassay and PCR methodologies, or Immuno-PCR, with the potential to detect proteins with femtogram/milliliter sensitivity (10-15 gram/milliliter). The Immuno-PCR approach is similar to that of an enzyme immunoassay, which makes use of antibody binding reactions and washing steps, but in the NADiA method, the enzyme label is replaced with a double-strand of DNA which is used to detect and quantify the target protein using PCR amplification. We believe diagnostic tests that utilize our NADiA technology will aid in the early detection of disease relapse and potentially provide better therapeutic outcomes for patients.
NADiA ProsVue
In 2011, we received 510(k) clearance and CE Mark for our NADiA ProsVue prognostic prostate cancer test for post-prostatectomy patients. NADiA ProsVue is anin vitro diagnostic assay for determining the rate of change or slope of residual concentrations of serum total prostate specific antigen (tPSA) over a period of time measured in picogram/milliliter per month. The slope provided by NADiA ProsVue is indicated for use as a prognostic marker in conjunction with clinical evaluation as an aid in identifying those patients at reduced risk for recurrence of prostate cancer for the eight year period following prostatectomy.
A retrospective clinical study of 304 patients evaluated the slope of three successive ProsVue tests over a period of at least ten months after a prostatectomy to identify prostate cancer patients with no evidence of disease or clinical progression. Recurrence of disease was determined by positive imaging, biopsy results or prostate cancer related death. The study resulted in a negative predictive value (NPV), or the proportion of patients correctly identified as stable, of 92.7% and a positive predictive value (PPV), or proportion of patients correctly identified as recurring, of 78.0%. Consequently, a ProsVue slope of equal to or less than 2.0 pg/mL per month in the first year following radical post-prostatectomy was highly associated with no evidence of disease over the long-term follow up.
NADiA ProsVue is expected to reduce unnecessary treatment of certain post-prostatectomy men thus reducing the morbidity and costs associated with adjuvant treatment, such as radiation therapy. This is significant
10
as approximately 80% of men that have a radical prostatectomy are cured of the disease, but about 30%-50% of men who receive adjuvant treatment based upon the pathological features of their disease may not benefit from such treatment as they are otherwise stable. This unnecessary treatment costs between $35,000 and $50,000 per patient and is typically associated with serious morbidity such as impotence and urinary incontinence. NADiA ProsVue is a beneficial tool available to help clinicians make confident and informed decisions about the patients they refer for follow-up therapy post radical prostatectomy. Further, ProsVue has the ability to provide “peace of mind” to patients who may be concerned about the recurrence of their disease.
The initial ProsVue commercialization strategy consists of a combination of targeted direct sales, followed by potential collaborations with major laboratories and diagnostic partners to help increase the market penetration of the test. Our CLIA laboratory has completed the verification of ProsVue in its new facility and has the ability and capacity to receive accessions and process samples. We have hired a small and focused commercial organization to initiate the direct launch of ProsVue. The commercial team, including sales, marketing, customer support, inbound logistics, and reimbursement, will execute a comprehensive marketing campaign in select geographical areas within the US initially, and in the future transition to serve as the “specialty organization” supporting a partner sales infrastructure of national scope.
Expanded Applications for ProsVue
We are developing several new tests with expanded applications for ProsVue to build a focus on men’s health. These complementary tests for prostate cancer will leverage our launch of ProsVue to urologists. We anticipate broadening the claims for ProsVue to enable a larger patient base to be monitored for a longer period post-prostatectomy. In addition, we plan to conduct further clinical studies to utilize ProsVue for patient monitoring during follow-up treatments. Due to ProsVue’s ability to detect low levels of tPSA, we believe the test could be beneficial in aiding clinicians in these expanded applications.
HIV Viral Load Test
We also developed an ultra-sensitive viral load test to monitor HIV patients that are taking highly active anti-retroviral therapy. Viral load testing is one of the most valuable measures for predicting HIV disease progression and gauging how well anti-retroviral treatment is working. Effective anti-retroviral treatment can often reduce RNA viral load to levels that are undetectable by current diagnostic tests. Unlike current tests measuring HIV RNA, our NADiA technology measures a specific HIV viral protein, p24, which is present in greater numbers relative to HIV RNA. Specifically, per unit of sample, there are 3,000 p24 molecules while only two copies of HIV RNA. We have developed an experimental blood-based HIV viral load p24 assay utilizing NADiA technology that achieved a sensitivity of one femtogram/mL, which is below the limit of detection of the most sensitive FDA cleared HIV RNA-based assay. As a result of our decision to focus on cancer diagnostics, we are currently pursuing a development and commercial partner for our NADiA HIV assay.
Microbubble Isolation Technology
In addition to our NADiA technology, we have a novel cell isolation technology that makes it possible to isolate rare cells in the presence of billions of non-target cells using antibody-coated albumin microbubbles to bind to target cells. We believe our albumin microbubbles have significant competitive advantages. In addition, the albumin microbubbles can easily collapse and disappear without the cumbersome step of separating magnetic beads from targeted cells, as is necessary with current commercial isolation technologies. This technology can be used to target antigens, bacteria, viruses, and cells while simultaneously concentrating and removing other contaminating materials from the sample.
Utilizing our microbubble isolation technology and NADiA, we are developing a test method to identify, quantify and characterize circulating epithelial cells present in blood to aid in monitoring cancer progression. The initial application will focus on prostate cancer, with breast and colon cancer to follow.
Arista Molecular CLIA Laboratory
In September 2011, we completed a restructuring of our Personalized Medicine division, which included downsizing and consolidating Arista Molecular’s CLIA laboratory operations into Iris Molecular Diagnostics. As
11
part of this restructuring, we discontinued non-proprietary testing services, but maintained Arista’s licenses and high-complexity CLIA laboratory capabilities, as well as limited personnel to perform NADiA and other proprietary tests. The restructuring provided significant cost reductions and enhanced profitability in our business. See Note 4 — “Restructuring and Impairment of Assets,” in the accompanying notes to financial statements for more information about the restructuring of our Personalized Medicine segment.
Our Strategy
Our goal is to maintain our leadership position in automatedin vitro diagnostics for urinalysis and sample processing while becoming a global leader in hematology and molecular diagnostics by offering products and solutions that increase laboratory productivity and efficiency and diagnostic tests that improve patient care. To achieve this goal, we intend to:
Increase the market adoption of the automated urinalysis platform in the in vitro diagnostics market. We strive to develop automated diagnostic instrumentation and solutions that enable increased laboratory productivity and efficiency. As we continue to market the clinical value of urinalysis, specifically in microscopy, we expect to increase market awareness and demand for our automated urinalysis products. In addition, we continue to pursue large multi-unit, multi-site contracts with large volume laboratories and to invest in emerging markets to increase our installed base of instruments.
Broaden our product offerings in the urinalysis IVD market. We intend to broaden our offerings in the urinalysis IVD market by developing and commercializing new products and solutions that improve laboratory efficiency and provide healthcare providers with more timely and more valuable information. The iChemVELOCITY, an automated urine chemistry analyzer, and iRICELL workstation represent key new product offerings that we launched domestically in 2011. The iChemVELOCITY, when linked with our iQ microscopy analyzer, allows us to offer an integrated system, called the iRICELL. We also recently introduced the iRICELL 1500 to provide an automated solution for lower volume laboratories and expand our addressable market opportunity. In addition, we are leveraging our 3GEMS imaging technology to develop next-generation urinalysis instruments to provide our customers with innovative products.
Use our imaging technology expertise to enter the automated hematology in vitro diagnostics market. We intend to leverage our imaging technology, which forms the basis of our market-leading urinalysis products, into other IVD markets where customers will value automation and increased efficiency. We are developing a hematology product portfolio that utilizes our next-generation 3GEMS imaging technology to reduce the need to prepare manual slides and perform subjective assessments of those slides under a microscope. We believe our product, by using a digitally-imaged virtual slide, will significantly decrease labor spent in laboratories by reducing the manual examination of abnormal blood samples while improving standardization.
Enter higher value segments of the market focused on personalized medicine. We believe that NADiA, our proprietary molecular diagnostic technology, has the potential to improve patient care management by allowing for earlier monitoring of disease and detection of relapse and to improve patient outcomes due to its ultra-sensitive detection of proteins. Our portfolio of emerging molecular diagnostic tests for cancer is designed to provide physicians and patients with more valuable information that may impact the treatment decision in managing the course of disease. As a result, we believe our NADiA platform is well-positioned for growth with the advent of personalized medicine utilizing genomic and molecular data to better determine targeted therapies for patients.
We launched ProsVue, a prognostic test for prostate cancer, in the first quarter of 2012, which is our first commercialized product utilizing our NADiA technology platform. Our product pipeline in personalized medicine includes expanded applications for ProsVue, as well as applications for circulating epithelial cells to monitor solid tumor cancers with an initial application for prostate cancer followed by breast and colon cancer. To accelerate the commercialization and market penetration of these tests, as well as others outside these applications, we plan to pursue licensing opportunities with commercial partners.
Pursue selective acquisitions. We will continue to pursue selective acquisitions to augment our organic growth. Our acquisition strategy is to target companies and product lines that complement our business and
12
provide additional earnings and infrastructure necessary for the commercialization of our pipeline. For example, our Sample Processing division acquired an automated bench-top instrument for FISH testing, the ThermoBrite Elite, which will be launched in the first quarter of 2012.
Competition
Competition in the IVD industry is intense. Many of our competitors are substantially larger than we are and have greater financial, research, manufacturing, marketing, sales and other resources than we do. As a result, our competitors may develop technologies or products that could render our products or products under development obsolete or noncompetitive.
Urinalysis
The principal competitive factors in the urinalysis market are cost-per-test, ease of use and quality of results. In the automated urine microscopy segment, Sysmex Corporation markets its automated non-imaging urine sediment analyzers globally and remains our principal competitor in the urine microscopy segment. Elektronika 77, a Hungarian company, offers a slide-based automated microscopy analyzer that can be run as stand-alone or in combination with a urine chemistry system. In the urine chemistry segment, Siemens Healthcare Diagnostics, ARKRAY and Roche Diagnostics are our principal competitors selling urine analyzers and test strips used in determining the concentration of various chemical substances found in urine. In addition, there have been several Chinese microscopy and chemistry instruments introduced in the international marketplace at discounted prices, albeit with reduced quality and functionality. We believe our systems provide the highest level of integration of urine chemistry and microscopy and the broadest menu available to provide digital images of urine and other body fluids particles with superior quality, which provides significant competitive advantages.
We are experiencing increased domestic and international pricing pressures in the urinalysis market due to the ongoing consolidation of both hospitals and medical device suppliers, increasing competition and decreasing reimbursement. Competitors are attempting to offer one-stop shopping for a variety of laboratory instruments, supplies and service with price discounts based on the hospital’s aggregate volume of business. We have been successful in countering this type of strategy by our large competitors by negotiating contracts with group purchasing organizations, or GPOs, in the United States allowing GPO members to purchase our products at competitive pricing.
Hematology
Hematology is a mature segment of thein vitro diagnostics market in which there are a number of large competitors who already have an established market presence and significantly greater resources than we have. The major competitors in the hematology market include Abbott Laboratories, Beckman Coulter, Inc., Siemens Healthcare Diagnostics, Sysmex Corporation and Horiba ABX. Our hematology analyzer currently under development represents a significant advancement in this market by combining an automated instrument with image-based expanded white cell differentials with complete blood counts. We believe this differentiates us from existing products, and should allow us to make a strong entry into the hematology testing market.
Sample Processing
The primary competitive factors in the centrifuge market include speed, ease of use, size and cost. The major competitors in the bench-top centrifuge market include the Drucker Company, LW Scientific and Hettich. With the industry trend moving away from bulky floor models to smaller, faster, more efficient bench-top models, we are facing competition from a number of U.S. and foreign competitors. We believe our products are differentiated due to innovative design, single push button operation, small footprint, quiet cycle and rapid separation time.
In the pre-analytical FISH market, the majority of patient samples are still processed manually by dipping slides in successive Coplin jars. We believe protocol complexity and time/temperature sensitivity have limited the competitive landscape of cost-effective FISH automation alternatives to date. The market leader is Abbott Molecular’s VP2000 followed distantly by SciGene’s Little Dipper and the Abbott Xmatrix. While the VP2000 automates a number of sample pre-treatment steps, the ThermoBrite Elite provides expanded features with automation of all the pre- and post-hybridization steps, as well as on-board denaturation and hybridization at an affordable price for both large and small laboratories.
13
Personalized Medicine
In the ultra-sensitive protein detection market, we may experience competition from companies that utilize enzyme-linked immunosorbent assay, or ELISA, chemiluminescence and fluorescence technologies, including Abbott Diagnostics, Beckman Coulter, Inc., Ortho-Clinical Diagnostics, Inc., Roche Diagnostics and Siemens Healthcare Diagnostics. Our technology detects proteins at lower concentrations, which we believe will enable earlier detection of relapse of disease. Many of these companies market instruments and reagents for measuring serum markers in concentrations greater than 50,000 femtograms per milliliter, while we believe our technology detects concentrations as low as one femtogram per milliliter.
We believe that our first 510(k) cleared ProsVue test for prostate cancer primarily competes on the basis of clinical validation of its prognostic capabilities, as well as having attained regulatory clearance. There are a number of companies that offer “ultra-sensitive” PSA tests, but these tests are not sufficiently accurate nor precise at the low level of detection required. Myriad Genetics will soon be offering Prolaris as a prognostic test for patients both pre- and post-radical prostatectomy. Based upon published studies, Myriad claims incremental value in evaluating low-risk patients, but according to the clinical study data, it does not provide actionable information for medium and high risk patients. Prolaris has no 510(k) clearance and its performance has not been validated against clinical recurrence events such as confirmation of cancer recurrence in bone scans, biopsy or death from prostate cancer. We believe that due to ProsVue’s ability to detect concentrations of tPSA at extremely low levels, the test can provide valuable information for the clinician when evaluating further treatment post-surgery.
Intellectual Property
We have a long history of innovation. Our diversified core technology spans a number of scientific endeavors, which include IVD, immuno-assay, rare cell separation technology, specimen processing and handling, pattern recognition and image analysis. Our commercial success depends on our ability to protect and maintain our proprietary technology by filing various patent applications domestically and in many foreign countries. We own various active patents and have pending patent applications for our technologies domestically and internationally.
These patents cover developments in imaging analysis and processing software, blood processing, digital refractometers, fluidics, centrifuges, immuno-PCR processes, rare cell separation, automated slide handling and disposable urinalysis products sold by us. In addition, we have various patents related to products of our sample processing business segment. These patents have various useful lives ranging from five to 15 years with expirations ranging from one to 15 years. Our core IVD patents in the United States will start to expire in 2017.
For our molecular platform technologies, we have a license for three patents from the University of California that cover the use of nucleic acid labeled antibodies in immunoassays. In addition, we filed a patent on the improved use of DNA labeled antibodies and obtained patents covering NADiA and our microbubble isolation technology methods. In October of 2010, Iris Molecular Diagnostic was granted a patent by the European Patent Office, which covers important aspects of the NADiA technology. This patent will be effective until November of 2024 and will be in force in numerous countries throughout Europe. In addition, Iris Molecular Diagnostics has also applied for numerous other patents throughout the world to obtain additional patent protection for our NADiA platform. In 2012, the European Patent Office also granted Iris Molecular Diagnostics a patent covering its microbubble for affinity isolation technology.
We have trade secrets, unpatented technology and proprietary knowledge about the sale, promotion, operation, development and manufacturing of our products. We have confidentiality agreements with our employees and consultants to protect these rights.
We claim copyright in our source code and have a patent on the ways in which our software displays images, and have filed copyright registrations with the United States Copyright Office. We also own various federally registered trademarks, including “IRIS”, “iChem”, “iQ”, “iRICELL”, “VELOCITY” “NADiA”, “3GEMS”, “ThermoBrite”, and “StatSpin.” We own other registered and unregistered trademarks, and have certain trademark rights in foreign jurisdictions. We intend to aggressively protect our patents, copyrights and trademarks.
14
Third-Party Payor Reimbursements
Successful sales of our products in the United States and other countries will depend on the availability of reimbursement from third-party payors such as private insurance plans, managed care organizations, and government funded healthcare programs, including Medicare and Medicaid. In the United States, the American Medical Association assigns to diagnostic tests specific Current Procedural Terminology, or CPT, codes, which are necessary for reimbursement of those tests. Once the CPT code is established, the Center for Medicare and Medicaid Services, or CMS, establishes reimbursement payment levels and coverage rules under Medicaid and Medicare, and private payors establish their own rates and coverage rules for such testing procedures. Our urinalysis tests are covered by established CPT codes and are therefore approved for reimbursement by Medicare and Medicaid as well as most third-party payors.
However, we have developed tests that do not relate to previously established CPT codes and we will need to obtain new CPT codes in order to obtain reimbursement. Reimbursement by a third-party payor depends on a number of factors, including the level of demand by health care providers and the payor’s determination that the use of the product represents a clinical advance or a reduction in the overall cost of treatment. In addition, in the United States, third-party payors and state governments routinely review reimbursement coverage for diagnostic tests considering budgetary constraints vis-à-vis demonstrated clinical efficacy. Outside of the United States, health care reimbursement systems vary from country to country, and to the extent we sell our products outside the United States, we may not be able to obtain adequate reimbursement coverage, if any, for our products.
Government Regulations
Our products are subject to stringent government regulation in the United States and other countries. These laws and regulations govern product testing, manufacturing, labeling, storage, record keeping, distribution, sale, marketing, advertising and promotion. The regulatory process can be lengthy, expensive and uncertain, and securing clearances or approvals often requires the submission of extensive testing and other supporting information. If we do not comply with regulatory requirements, we may be subject to fines, recall or seizure of products, total or partial suspension of production, withdrawal of existing product approvals or clearances, refusal to approve or clear new applications or notices and criminal prosecution. Further, any change in existing federal, state or foreign laws or regulations, or in their interpretation or enforcement, or the enactment of any additional laws or regulations, could affect us both materially and adversely.
In the United States, the FDA regulates medical devices under the Food, Drug, and Cosmetics Act. Before a new medical device can be commercially introduced in the United States, the manufacturer usually must obtain FDA clearance by filing a pre-market notification, or PMA, under Section 510(k) of the Food, Drug, and Cosmetics Act, or obtain FDA approval by filing a PMA application. The PMA application process is significantly more complex, expensive, time-consuming and uncertain than the 510(k) notification process. To date, we have cleared all of our regulated products with the FDA through the 510(k) notification process. We cannot guarantee that we will be able to use the 510(k) notification process for future products. Furthermore, FDA clearance of a 510(k) notification or approval of a PMA application is subject to continual review, and the subsequent discovery of previously unknown facts may result in restrictions on a product’s marketing or withdrawal of the product from the market.
We are also required to register as a medical device manufacturer with the FDA and comply with FDA regulations concerning good manufacturing practices for medical devices, or GMP Standards. In 1997, the FDA expanded the scope of the GMP Standards with new regulations requiring medical device manufacturers to maintain control procedures for the design process, component purchases and instrument servicing (Quality System Regulation or QSR). The FDA biannually inspects our manufacturing facilities for compliance with GMP Standards. We believe that we are in substantial compliance with the QSR.
Labeling, advertising and promotional activities for medical devices are subject to scrutiny by the FDA and, in certain instances, by the U.S. Federal Trade Commission. The FDA also enforces statutory and policy prohibitions against promoting or marketing medical devices for unapproved uses.
Clinical laboratory diagnostic tests that are developed and validated by a laboratory for use in testing that the laboratory performs itself are called laboratory developed tests and have traditionally been regulated by the
15
Centers for Medicare & Medicaid Services under the purview of CLIA as a laboratory service. We may develop lab developed tests in the future. The FDA maintains that it has authority to regulate the development and use of lab developed tests as diagnostic medical devices, but historically has elected not to exercise its enforcement authority with regard to most lab developed tests. The FDA indicated in June 2010 that it is considering exercising greater oversight of laboratory developed tests using a risk-based approach.
Many states have also enacted statutory provisions regulating medical devices. The State of California’s requirements in this area, in particular, are extensive, and require registration with the state and compliance with regulations identical to the GMP Standards established by the FDA. While the impact of such laws and regulations has not been significant to date, it is possible that future developments in this area could affect us both materially and adversely.
In addition to domestic regulation of medical devices, many of our products are subject to regulations in foreign jurisdictions. The requirements for the sale of medical devices in foreign markets vary widely from country to country, ranging from simple product registrations to detailed submissions similar to those required by the FDA. Our business strategy includes expanding the geographic distribution of these and other products, and we cannot guarantee that we will be able to secure the necessary clearances and approvals in the relevant foreign jurisdictions. Furthermore, the regulations in certain foreign jurisdictions continue to develop and we cannot be sure that new laws or regulations will not have a material adverse effect on our existing business or future plans. Among other things, CE Mark certifications are required for the sale of many products in certain international markets such as the European Community. We have secured CE Mark certification for our existing product lines.
We have obtained European Norm ISO 13485:2003 certification for our manufacturing facilities and are subject to surveillance by European notified bodies. In addition, our Chatsworth manufacturing facility is certified to ISO 13485:2003 with the Canadian Medical Devices Conformity Assessment System, or CMDCAS, which is the regulatory protocol used by Health Canada to certify manufacturers.
Our products are also subject to regulation by the U.S. Department of Commerce export controls, primarily as they relate to the associated computers and peripherals. We have not experienced any material difficulties in obtaining necessary export licenses to date.
Federal and State Clinical Laboratory Certification and Licensing
Our Arista laboratory, similar to almost all clinical laboratories operating in the United States, is required to maintain federal certification pursuant to the Clinical Laboratory Improvement Act, as amended, commonly known, together with its implementing regulations, as CLIA. The CLIA regulations have established three levels of regulatory control based on test complexity: “waived,” “moderate complexity” and “high complexity.” Arista has staffed and organized its Carlsbad, California clinical laboratory facility to meet the standards for a “high complexity” test laboratory, the most rigorous level of quality. CLIA imposes requirements relating to test processes, personnel qualifications, facilities and equipment, record keeping, quality assurance and participation in proficiency testing, which involve comparing the results of testing of specimens that have been specifically prepared for our laboratory to the known values of those specimens. Compliance with CLIA standards is verified by periodic on-site inspections. CLIA accreditation is maintained through regular inspections by the College of American Pathologists, and therefore, subject to its requirements and evaluation. The CLIA requirements also apply as a condition for participation by clinical laboratories in the Medicare and Medicaid programs.
CLIA does not preempt state laws that are more stringent than federal law. Therefore, additional requirements apply to our laboratory under California’s clinical laboratory licensure laws. The State of California Department of Health and Human Services — Laboratory Field Services enforces the state’s requirements to apply for and maintain licensure, CLIA certification, and proficiency testing. Our facilities have been inspected by these authorities and have been issued licenses to manufacture medical devices and provide laboratory diagnostic services in California. These licenses must be renewed every year. The State of California could prohibit our provision of laboratory services if we failed to maintain these licenses. Sanctions for failure to meet these certification, accreditation and licensure requirements may include suspension, limitation or revocation of certification, accreditation or licensure, civil penalties, criminal penalties, injunctive actions, and the imposition of plans of correction to remedy deficiencies. If a laboratory’s CLIA certificate or California license is revoked or suspended, the laboratory must then cease performing testing, until licensure is reinstated.
16
Antifraud Laws/Overpayments
Federal Medicare/Medicaid laws apply a wide array of fraud and abuse provisions to laboratories that participate in these programs. These laws include the federal False Claims Act, which prohibits, among other things: the submission of false claims or false information to government programs; deceptive or fraudulent conduct; and the provision and billing for excessive or unnecessary services. Federal law also prohibits fraud on private sector health insurers. Penalties for violating these laws may include exclusion from participation in the Medicare/Medicaid programs, asset forfeitures, civil penalties and criminal penalties. If an entity is determined to have violated the federal False Claims Act, it may be required to pay up to three times the actual damages sustained by the government, plus civil penalties ranging from $6,000 to $11,000 for each separate false claim. While there are many potential bases for liability under the federal False Claims Act, such liability primarily arises when an entity knowingly submits, or causes another to submit, a false claim for reimbursement to the federal government. Submitting a claim or failing to repay an overpayment with reckless disregard or deliberate ignorance of its validity could result in substantial civil liability. Exclusion from the Medicare and Medicaid programs is mandatory for certain offenses, and regulators also have the authority to impose permissive exclusions from Medicare and Medicaid programs in response to a wide range of less serious misconduct. In addition, the CMS may suspend Medicare payments to any provider it believes has engaged in fraudulent billing practices. Because the financial consequences to a laboratory of exclusion from participation in federal health care payment programs would typically be devastating, avoiding such exclusion has been a motivating factor in the settlement of many fraud investigations.
California law extends similar penalties beyond Medicare to punish laboratories engaged in conduct which defrauds the Medi-Cal program, private insurers or patients. California law also denies Medi-Cal enrollment to any provider that has entered into a settlement in lieu of conviction for fraud or abuse in any government program and further provides that a provider under investigation by certain governmental agencies for fraud or abuse will be subject to a temporary suspension from Medi-Cal pending investigation.
Independent of fraud allegations, Medicare and Medicaid programs and private payors may also retroactively determine that certain payments for services must be repaid due to failure of a laboratory to satisfy applicable payor requirements.
Federal and California “Self-Referral” Restrictions
A federal “self-referral” law, commonly referred to as the “Stark” law, prohibits Medicare payments for laboratory tests referred by physicians who, personally or through a family member, have ownership interests in or compensation arrangements with the testing laboratory, unless a statutory exception applies. Sanctions for violations of the self-referral prohibitions include denial of payment, refunds, civil money penalties of up to $15,000 for each service billed in violation of the prohibitions and exclusion from the Medicare program. In addition, claims submitted in violation of the Stark Law may also give rise to liability under the federal False Claims Act and its “whistleblower” provisions. Several states, including California, have enacted legislation that prohibits physician self-referral arrangements and/or requires physicians to disclose to their patients any financial interest they may have with a healthcare provider when referring patients to that provider. Some of these statutes, including California’s, cover all patients and are not limited to beneficiaries of Medicare, Medicaid or other federal healthcare programs. Possible sanctions for violating state physician self-referral laws vary, but may include loss of license and civil and criminal sanctions.
Anti-Kickback Laws
Existing federal laws governing Medicare and Medicaid, and other similar state laws, impose a variety of broadly described restrictions on financial relationships among healthcare providers, including clinical laboratories. The Medicare/Medicaid antikickback statute prohibits laboratories from paying for patient or specimen referrals for testing paid for by Medicare or Medicaid. Violation of the Medicare/Medicaid antikickback statute can result in criminal penalties pursuant to the U.S. sentencing guidelines, civil monetary penalties of $50,000 per violation plus treble damages, and exclusion from Medicare and Medicaid participation. The OIG has criticized a number of additional business practices in the clinical laboratory industry as potentially implicating the antikickback statute,
17
including providing phlebotomy staff to clients who perform clerical or other functions for the client which are not solely related to the collection or processing of laboratory specimens, providing computers or fax machines to clients which are not used exclusively in connection with performance of the laboratory’s work, the lease of space in a physician’s office for rent which exceeds the fair rental value of such space, certain acquisition agreements where the sellers may make referrals to the buyer after the sale and various other compensation relationships between laboratories and entities from which they receive referrals, or to which they make referrals, if such relationships are intended to induce referrals and no statutory Safe-Harbor applies. In addition, the OIG has indicated that discounts given by laboratories to clients concerning their private pay patients and/or HMO patients must not be intended to induce a client to refer Medicare or Medicaid patients to the laboratory.
Health Insurance Portability and Accountability Act and HITECH Act
The Health Insurance Portability and Accountability Act of 1996, or HIPAA, protects the security and privacy of individually identifiable health information. HIPAA standards govern the conduct of certain electronic transmission of health care information and to protect the security and privacy of individually identifiable health information maintained or transmitted by health care providers. These standards include:
| | Ÿ | | The Standards for Electronic Transactions establishes standards for common health care transactions such as claims information, plan eligibility, and payment information. It also establishes standards for the use of electronic signatures, unique identifiers for providers, employers, health plans, and individuals. |
| | Ÿ | | The Standards for Privacy of Individually Identifiable Information restricts the use and disclosure of certain individually identifiable health information. The HIPAA privacy and security regulations establish a uniform federal “floor” and do not supersede state laws that are more stringent or provide individuals with greater rights with respect to the privacy or security of, and access to, their records containing patient/private health information (PHI). As a result, we are required to comply with both HIPAA privacy regulations and varying state privacy and security laws, which include physical and electronic safeguard requirements. These laws contain significant fines and other penalties for wrongful use or disclosure of PHI. |
The federal Health Information Technology for Economic and Clinical Health Act, or HITECH, enacted in February 2009, strengthens and expands the HIPAA privacy and security rules and its restrictions on use and disclosure of PHI. HITECH includes, but is not limited to, prohibitions on exchanging patient identifiable health information for remuneration, restrictions on marketing to individuals and obligations to agree to provide individuals an accounting of virtually all disclosures of their health information. Violation of HITECH may result in penalties ranging from $100 — $50,000 per violation depending upon the violation category, subject to a $1.5 million cap for multiple violations of an identical requirement or prohibition in a calendar year.
Other Regulatory Requirements
Our laboratory is subject to federal, state and local regulations relating to the handling and disposal of regulated medical waste, hazardous waste and biohazardous waste, including chemical, biological agents and compounds, blood and bone marrow samples and other human tissue. Typically, we use outside vendors who are contractually obligated to comply with applicable laws and regulations to dispose of such waste. These vendors are licensed or otherwise qualified to handle and dispose of such waste. Historically, our costs associated with handling and disposal of such wastes have not been material.
The Occupational Safety and Health Administration, or OSHA, has established extensive requirements relating to workplace safety for healthcare employers, including requirements to develop and implement programs to protect workers from exposure to blood-borne pathogens by preventing or minimizing any exposure through needle stick or similar penetrating injuries.
18
Summary of Revenues by Product Line
| | | | | | | | | | | | | | | | | | | | | | | | |
| | | Year ended December 31, | |
| | | 2011 | | | | | | 2010 | | | | | | 2009 | | | | |
| | | ($ in thousands) | |
Revenues | | | | | | | | | | | | | | | | | | | | | | | | |
IDD instruments | | $ | 33,936 | | | | 29 | % | | $ | 32,083 | | | | 30 | % | | $ | 26,018 | | | | 28 | % |
IDD consumables and service | | | 69,656 | | | | 59 | % | | | 61,112 | | | | 57 | % | | | 52,213 | | | | 56 | % |
Sample Processing instruments and supplies | | | 14,540 | | | | 12 | % | | | 14,408 | | | | 13 | % | | | 14,335 | | | | 16 | % |
Personalized Medicine services | | | 192 | | | | 0 | % | | | 69 | | | | 0 | % | | | — | | | | 0 | % |
| | | | | | | | | | | | | | | | | | | | | | | | |
Total revenues | | $ | 118,324 | | | | 100 | % | | $ | 107,672 | | | | 100 | % | | $ | 92,566 | | | | 100 | % |
| | | | | | | | | | | | | | | | | | | | | | | | |
See Note 19 to the Consolidated Financial Statements, “Segment and Geographic Information,” for financial information regarding our operating segments and geographic areas.
Backlog
We did not have a material amount of backlog as of December 31, 2011. Our products usually ship within 30 to 60 days of receipt of sales orders. We do not believe that backlog is necessarily indicative of sales for any succeeding period.
Employees
At March 1, 2012, we had 387 full-time employees, including 334 in the United States and 53 internationally. We also use outside consultants and part-time and temporary employees in production, administration, marketing, research and development and engineering. None of our employees are covered by collective bargaining agreements. We consider our relations with our employees to be satisfactory.
Corporate Information
We incorporated in California in 1979 and reincorporated in Delaware in 1987. We currently have nine facilities, two in California, one in Massachusetts, one in Marburg, Germany, and sales offices in France, Germany, the United Kingdom and Hong Kong.
Available Information
We make available our annual reports on Form 10-K, quarterly reports on Form 10-Q, current reports on Form 8-K, along with any related amendments and supplements on our website as soon as reasonably practicable after we electronically file or furnish such materials with or to the Securities and Exchange Commission, or the SEC. These reports are available, free of charge, atwww.proiris.com. Our website and the information contained in it and connected to it do not constitute part of this annual report or any other report we file with, or furnish, to the SEC.
We have identified the following additional risks and uncertainties that may have a material adverse effect on our business, financial condition or results of operations. Investors should carefully consider the risks described below before making an investment decision. The risks described below are not the only ones we face. Additional risks not presently known to us or that we currently believe are immaterial may also significantly impair our business operations. Our business could be harmed by any of these risks. The trading price of our common stock could decline due to any of these risks, and investors may lose all or part of their investment.
Risks Related to Our Business
Adverse conditions in the global economy and disruption of financial markets could negatively impact our customers and therefore our results of operations.
An economic downturn in the businesses or geographic areas in which we sell our products could reduce demand for these products and result in a decrease in sales volume that could have a negative impact on our
19
results of operations. Volatility and disruption of financial markets could limit our customers’ ability to obtain adequate financing or credit to purchase and pay for our products in a timely manner, or to maintain operations, and result in a decrease in sales volume that could have a negative impact on our results of operations.
In the past few years, we have faced adverse macro economic forces, which have impacted our selling markets and the credit markets of our customers. At this point the impact from these forces are relatively mild; however, we may be further impacted if adverse economic conditions in Europe worsen. In the future, we may face the following challenges: deferrals of purchases due to decreases in capital budgets of our customers, delays in the purchasing cycle due to greater scrutiny of deals and increased internal competition for limited capital dollars, and a significant increase in requests for quotes for operating leases. The aforementioned factors may lead to a decrease in revenue, an increase of deferred revenue, or could lead to installment cash collection.
Our success depends largely on the continued acceptance of our iQ and iChem product lines.
Our current strategy assumes that our instrument platforms will be adopted by a large number of end-users. We have invested and continue to invest a substantial amount of our resources in promotion and marketing of the iQ and iChem product lines in order to increase their market penetration, expand sales into new geographic areas and enhance and expand the system features. Failure of our instrument operating platforms to achieve and maintain a significant market presence, or the failure to successfully implement our promotion and marketing strategy, will have a material adverse effect on our financial condition and results of operations.
To maintain our position as a leading worldwide provider of urinalysis systems, we must successfully develop and commercialize our next generation 3GEMS urinalysis platform.
We are investing substantial resources in developing our next generation 3GEMS urinalysis platform, which will serve as the basis for our next generation products in urinalysis. To remain a leading worldwide provider of automated urine microscopy and chemistry systems, our 3GEMS urinalysis products must meet or exceed our customers’ expectations for next generation urinalysis products. Our 3GEMS urinalysis platform must be adopted by a large number of end-users if we are to maintain and grow the significant market presence that we have achieved with our iQ platform.
If we fail to obtain, or experience significant delays in obtaining, regulatory clearances or approvals for our products or product enhancements, our ability to commercially distribute and market our products could suffer.
Our products are subject to rigorous regulation by the U.S. Food and Drug Administration, or FDA, and numerous other Federal, state and foreign governmental authorities. Our failure to comply with such regulations could lead to the imposition of injunctions, suspensions or loss of regulatory clearances or approvals, product recalls, termination of distribution, product seizures or civil penalties. In the most egregious cases, criminal sanctions or closure of our manufacturing facilities are possible. The process of obtaining regulatory authorizations to market a medical device, particularly from the FDA, can be costly and time consuming, and there can be no assurance that such authorizations will be granted on a timely basis, if at all. In particular, the FDA permits commercial distribution of a new class II or III medical device only after the device has received 510(k) clearance or is the subject of an approved pre-market approval, or PMA, application. The FDA will clear marketing of a medical device through the 510(k) process if it is demonstrated that the new product is substantially equivalent to other 510(k)-cleared products. The PMA approval process is more costly, lengthy and uncertain than the 510(k) clearance process. Introduction to the market of products we develop that require regulatory clearance or approval may be delayed. In addition, because we cannot assure you that any new products or any product enhancements we develop will be subject to the shorter 510(k) clearance process, the regulatory approval process for our products or product enhancements may take significantly longer than anticipated. There is no assurance that the FDA will not require that a new product or product enhancement go through the lengthy and expensive PMA approval process. To date, all of our class II or III products have been cleared through the 510(k) process. It is possible that some of our molecular diagnostics products under development may be reviewed by the FDA under a PMA filing.
20
Foreign governmental authorities that regulate the manufacture and sale of medical devices have become increasingly stringent, and to the extent we continue to market and sell our products in foreign countries, we will be subject to rigorous regulation in the future. In such circumstances, we would rely significantly on our distributors to comply with the varying regulations, and any failures on their part could result in restrictions on the sale of our products in foreign countries.
There is no assurance that U.S. or foreign regulatory bodies will ultimately allow market clearance or approval for these products. Regulatory delays or failures to obtain clearances and approvals could disrupt our business, harm our reputation and adversely affect our sales.
Modifications to our products may require new regulatory clearances or approvals or may require us to recall or cease marketing our products until clearances are obtained.
Modifications to our products may require new 510(k) clearances or PMA approvals or require us to recall or cease marketing the modified devices until these clearances or approvals are obtained. The FDA requires device manufacturers to initially make and document a determination of whether or not a modification requires a new approval, supplement or clearance. A manufacturer may determine that a modification could not significantly affect safety or efficacy and does not represent a major change in its intended use, so that no new 510(k) is necessary. However, the FDA can review a manufacturer’s decision and may disagree. The FDA may also on its own initiative determine that a new clearance or approval is required. We have made modifications to our products in the past and may make additional modifications in the future that we believe do not or will not require additional clearances or approvals. If the FDA disagrees and requires new clearances or approvals for the modifications, we may be required to recall and to stop marketing our products as modified, which could require us to redesign our products and harm our operating results. In these circumstances, we may be subject to significant enforcement actions.
If a manufacturer determines that a modification to an FDA-cleared device could significantly affect its safety or efficacy, or would constitute a major change in its intended use, then the manufacturer must file for a new 510(k) clearance or possibly a PMA approval. Where we determine that modifications to our products require a new 510(k) clearance or PMA approval, we may not be able to obtain those additional clearances or approvals for the modifications or additional indications in a timely manner, or at all. For those products sold in the European Union, we must notify our E.U. competent authority by means of revision of our technical file, if significant changes are made to the products or if there are substantial changes to our quality assurance systems affecting those products. Delays in obtaining required future clearances or approvals would adversely affect our ability to introduce new or enhanced products in a timely manner, which in turn would harm our future growth.
Any failure to introduce our future products and systems successfully into the market could adversely affect our business.
Our commercial success depends on the timely development of new products that are needed for future growth. These new products depend on our success in demonstrating technical feasibility and achieving cost targets and functionality demanded by the market. Even if our product development efforts are successful and even if the requisite regulatory approvals are obtained, our products may not gain market acceptance among physicians, healthcare payers and the medical community. A number of additional factors may limit the market acceptance of products including the following:
| | Ÿ | | rate of adoption by healthcare providers; |
| | Ÿ | | rate of our products’ acceptance by the target market; |
| | Ÿ | | timing of market entry relative to competitive products; |
| | Ÿ | | availability of alternative products; |
| | Ÿ | | price of our product relative to alternative products; |
| | Ÿ | | availability of third-party reimbursement; and |
| | Ÿ | | extent of marketing efforts by us and third-party distributors or agents retained by us. |
Failure to effectively develop new products or achieve clinical acceptance will adversely impact our financial condition and results of operations.
21
We face intense competition and our failure to compete effectively, particularly against larger, more established companies will cause our business to suffer.
The healthcare industry is highly competitive. We compete in this industry based primarily on product performance, service and price. Many of our competitors have substantially greater financial, technical and human resources than we do, and may also have substantially greater experience in developing products, obtaining regulatory approvals and manufacturing and marketing and distribution. As a result, they may be better able to compete for market share, even in areas in which our products may be superior. Further, our competitive position could be harmed by the establishment of patent protection by our competitors or other companies. The existing competitors or other companies may succeed in developing technologies and products that are more effective or affordable than those being developed by us or that would render our technology and products less competitive or obsolete. If we are unable to effectively compete in our market, our financial condition and results of operation will materially suffer.
If we choose to acquire new businesses, products or technologies, we may experience difficulty in the identification or integration of any such acquisition, and our business may suffer.
Our commercial success depends on our ability to continually enhance and broaden our product offerings in response to changing customer demands, competitive pressures and technologies. Accordingly, we may in the future pursue the acquisition of complementary businesses, products or technologies instead of developing them ourselves. We do not know if we will be able to identify or complete any acquisitions, or whether we will be able to successfully integrate any acquired business, product or technology or retain key employees. Integrating any business, product or technology we acquire could be expensive and time consuming, disrupt our ongoing business and distract our management. Moreover, we may fail to realize the anticipated benefits of any acquisition. If we are unable to integrate any acquired businesses, products or technologies effectively, our business will suffer. In addition, any amortization or charges resulting from acquisitions could adversely affect our operating results.
If we do not establish strategic partnerships to commercialize our products under development, we will have to undertake commercialization efforts on our own, which could be costly and may ultimately be unsuccessful.
We may selectively partner with other companies to obtain assistance for the commercialization of certain of our products. We may enter into strategic partnerships with third parties to develop and commercialize some of our products that are intended for larger markets or that otherwise require a large, specialized sales and marketing organization, and we may enter into strategic partnerships for products that are targeted beyond our selected target markets. We face competition in seeking appropriate strategic partners, and these strategic partnerships can be intricate and time consuming to negotiate and document. We may not be able to negotiate strategic partnerships on acceptable terms, or at all. We are unable to predict when, if ever, we will enter into any strategic partnerships because of the numerous risks and uncertainties associated with establishing strategic partnerships. If we are unable to negotiate strategic partnerships for our products under development, we may be forced to reduce the scope of our sales or marketing activities or undertake commercialization activities at our own expense. In addition, we will bear the entire risk related to the commercialization of these products. If we elect to increase our expenditures to fund commercialization activities on our own, we may need to obtain additional capital, which may not be available to us on acceptable terms, or at all.
Changes in reimbursement fees or lower than anticipated reimbursement for diagnostics tests could reduce demand and the price at which we can sell our products.
Successful sales of our products will depend on the availability of adequate coverage and reimbursement from third-party payors both domestically and internationally. Healthcare providers that purchase medical devices generally rely on third-party payors to reimburse all or part of the costs and fees associated with the procedures performed with these devices. Both public and private insurance coverage and reimbursement plans are central to new product acceptance. Customers are unlikely to use our products if they do not receive reimbursement adequate to cover the cost of our products.
22
To date, reimbursement has generally been available for the diagnostic tests that our products perform. However, all third-party coverage and reimbursement programs, whether government funded or insured commercially, whether inside the United States or outside, are developing increasingly sophisticated methods of controlling healthcare costs through limitations on covered items and services, prospective reimbursement and capitation programs, group purchasing, redesign of benefits, second opinions required prior to major surgery, careful review of bills, encouragement of healthier lifestyles and exploration of more cost-effective methods of delivering healthcare. These types of programs and legislative changes to coverage and reimbursement policies could potentially limit the amount which healthcare providers may be willing to pay for medical devices.
We believe that future coverage and reimbursement may be subject to increased restrictions both in the United States and in international markets. Third-party reimbursement and coverage for our products may not be available or adequate in either the United States or international markets. Future legislation, regulation, coverage or reimbursement policies of third-party payors may adversely affect the demand for our existing products or our products currently under development, and limit our ability to sell our products on a profitable basis.
If we fail to meet changing demands of technology, we may not continue to be able to compete successfully with our competitors.
The market for our products and systems is characterized by rapid technological advances, changes in customer requirements, and frequent new product introductions and enhancements. Our future success depends upon our ability to introduce new products that keep pace with technological developments, enhance current product lines and respond to evolving customer requirements. Our failure to meet these demands could result in a loss of our market share and competitiveness and could harm our revenues and results of operations.
Our ability to protect our intellectual property and proprietary technology through patents and other means is uncertain.
Our success depends significantly on our ability to protect our intellectual property and proprietary technologies. We rely on patent protection, as well as a combination of copyright, trade secret and trademark laws, and nondisclosure, confidentiality and other contractual restrictions to protect our proprietary technology. However, these legal means afford only limited protection and may not adequately protect our rights or permit us to gain or keep any competitive advantage.
Our pending U.S. and foreign patent applications may not issue as patents or may not issue in a form that will be advantageous to us. Any patents we have obtained or do obtain may be challenged by re-examination, opposition or other administrative proceeding, or may be challenged in litigation, and such challenges could result in a determination that the patent is invalid. In addition, competitors may be able to design alternative methods or devices that avoid infringement of our patents. To the extent our intellectual property protection offers inadequate protection, or is found to be invalid, we are exposed to a greater risk of direct competition. If our intellectual property does not provide adequate protection against our competitors’ products, our competitive position could be adversely affected, as could our business. Both the patent application process and the process of managing patent disputes can be time consuming and expensive. Furthermore, the laws of some foreign countries may not protect our intellectual property rights to the same extent as do the laws of the United States.
In addition to pursuing patents on our technology, we have taken steps to protect our intellectual property and proprietary technology by entering into confidentiality agreements and intellectual property assignment agreements with our employees, consultants, corporate partners and, when needed, our advisors. Such agreements may not be enforceable or may not provide meaningful protection for our trade secrets or other proprietary information in the event of unauthorized use or disclosure or other breaches of the agreements, and we may not be able to prevent such unauthorized disclosure. Monitoring unauthorized disclosure is difficult, and we do not know whether the steps we have taken to prevent such disclosure are, or will be, adequate.
In the event a competitor infringes upon our patents or other intellectual property rights, litigation to enforce our intellectual property rights or to defend our patents against challenge, even if successful, could be expensive and time consuming and could require significant time and attention from our management. We may not have sufficient resources to enforce our intellectual property rights or to defend our patents against challenges from
23
others. Additionally, our earliest patents began to expire in 2010, which may allow our competitors, many of which may have substantial resources and have made substantial investments in competing technologies, to develop technologies previously protected by these expiring patents.
The healthcare industry is characterized by patent litigation, and we could become subject to litigation that could be costly, result in the diversion of our management’s time and efforts, require us to pay damages or prevent us from selling our products.
The healthcare industry is characterized by extensive litigation and administrative proceedings over patent and other intellectual property rights. Whether or not a product infringes a patent involves complex legal and factual issues, the determination of which is often uncertain. Our competitors may assert that they own U.S. or foreign patents containing claims that cover our products, their components or the methods we employ in the manufacture or use of our products. In addition, we may become a party to an interference proceeding declared by the U.S. Patent and Trademark Office to determine the priority of invention. Because patent applications can take many years to issue and in many instances at least 18 months to publish, there may be applications now pending of which we are unaware, which may later result in issued patents that contain claims that cover our products. There could also be existing patents, of which we are unaware, that contain claims that cover one or more components of our products. As the number of participants in our industry increases, the possibility of patent infringement claims against us also increases.
Any interference proceeding, litigation or other assertion of claims against us may cause us to incur substantial costs, could place a significant strain on our financial resources, divert the attention of our management from our core business and harm our reputation. If the relevant patents were upheld as valid and enforceable and we were found to be infringing, we could be required to pay substantial damages and/or royalties and could be prevented from selling our products unless we could obtain a license or were able to redesign our products to avoid infringement. Any such license may not be available on reasonable terms, if at all. If we fail to obtain any required licenses or make any necessary changes to our products or technologies, we may be unable to make, use, sell or otherwise commercialize one or more of our products. In addition, if we are found to willfully infringe, we could be required to pay treble damages, among other penalties.
We operate in a consolidating industry that creates barriers to our market penetration.
The healthcare industry in recent years has been characterized by consolidation. Large hospital chains and groups of affiliated hospitals prefer to negotiate comprehensive supply contracts for all of their supply needs at once. Large suppliers can often equip an entire laboratory and offer hospital chains and groups one-stop shopping for laboratory instruments, supplies and service. Larger suppliers also typically offer pricing discounts to their customers based on the customer’s total volume of business with the supplier. The convenience and discounts offered by these large suppliers are administrative and financial incentives that we do not offer our customers. Our plans for further market penetration in the urinalysis market and penetration into the hematology and molecular diagnostics markets will depend in part on our ability to overcome these and any new barriers resulting from continued consolidation in the healthcare industry. The failure to overcome such barriers could have a material adverse effect on our financial condition or results of operation.
Changes in government regulation of the healthcare industry could adversely affect our business.
Federal and state legislative proposals are periodically introduced or proposed that would affect major changes in the healthcare system, nationally, at the state level or both. Future legislation, regulation or payment policies of Medicare, Medicaid, private health insurance plans, health maintenance organizations and other third-party payors could adversely affect the demand for our current or future products and our ability to sell our products on a profitable basis. Moreover, healthcare legislation is an area of extensive and dynamic change, and we cannot predict future legislative changes in the healthcare field or their impact on our industry or our business. Any impairment in our ability to market our products could have a material adverse effect on our financial condition and results of operation.
24
U.S. healthcare reform legislation may result in significant changes, and our business could be adversely impacted if we fail to adapt.
Government oversight of and attention to the healthcare industry in the United States is significant and increasing. In March 2010, U.S. federal legislation was enacted to reform healthcare. The legislation provides for reductions in the Medicare clinical laboratory fee schedule of 1.75% for five years beginning in 2011 and also includes a productivity adjustment that reduces the CPI market basket update beginning in 2011. The legislation imposes an excise tax on the seller for the sale of certain medical devices in the United States, including those purchased and used by laboratories, beginning in 2013. The legislation establishes the Independent Payment Advisory Board, which will be responsible, beginning in 2014, annually to submit proposals aimed at reducing Medicare cost growth while preserving quality. These proposals automatically will be implemented unless Congress enacts alternative proposals that achieve the same savings targets. Further, the legislation calls for a Center for Medicare and Medicaid Innovation that will examine alternative payment methodologies and conduct demonstration programs. The legislation provides for extensive health insurance reforms, including the elimination of pre-existing condition exclusions and other limitations on coverage, fixed percentages on medical loss ratios, expansion in Medicaid and other programs, employer mandates, individual mandates, creation of state and regional health insurance exchanges, and tax subsidies for individuals to help cover the cost of individual insurance coverage. The legislation also permits the establishment of accountable care organizations, a new healthcare delivery model. While the ultimate impact of the legislation on the healthcare industry is unknown, it is likely to be extensive and may result in significant change. Our failure to adapt to these changes could have a material adverse effect on our business.
We may not be able to fully realize deferred tax assets.
As of December 31, 2011, we have deferred tax assets of approximately $8.2 million resulting from the differences between the financial statement and the tax bases of assets and liabilities using enacted tax rates in effect for the year in which the differences are expected to reverse. Management believes it is more likely than not that the deferred tax assets will be realized through future taxable income or alternative tax strategies. However, the net deferred tax assets could be reduced in the near term if management’s estimates of taxable income during the carryforward period are not realized or are significantly reduced or alternative tax strategies are not available. Although we believe that the deferred tax asset is recoverable, there is no assurance that we will be able to generate taxable income in the years that the differences reverse.
We rely on independent and some single-source suppliers for key components of our instruments. Any delay or disruption in the supply of components may prevent us from selling our products and negatively impact our operations.
Certain of our components are obtained from outside vendors, and the loss or breakdown of our relationships with these outside vendors could subject us to substantial delays in the delivery of our products to our customers. Furthermore, certain key components of our instruments and consumables are manufactured by only one supplier. Because this supplier is the only vendor with which we have a relationship for a particular component, we may be unable to sell products this supplier becomes unwilling or unable to deliver components meeting our specifications. Our inability to sell products to meet delivery schedules could have a material adverse effect on our reputation in the industry, as well as our financial condition and results of operation.
If we are unable to secure a supply of consumable strips for our installed base of urine chemistry analyzers upon expiration of our single source supply agreement with a Japanese manufacturer at the end of 2013, our domestic consumable sales will be negatively impacted.
We currently purchase from a Japanese manufacturer all necessary consumable strips for our existing installed base of AX-4280 urine chemistry analyzers that we distributed for this Japanese manufacturer in the United States prior to the launch of our own proprietary iChem analyzers. Under our current agreement, the Japanese manufacturer will sell us consumable strips for the AX-4280 analyzer through 2013. Our ability to continue to sell consumable strips for use with the AX-4280 analyzer to our existing customers of this product, and to continue to service and support the product, will depend on our ability to secure a supply of consumable strips for the AX-4280. If we are unable to secure a supply of consumable strips, our domestic sales of consumable strips will be adversely affected.
25
We may not be able to maintain contracts with Group Purchasing Organizations, or GPOs.
A significant portion of our domestic sales are affected through agreements with participant members of GPOs. A failure to renew one or more GPO contracts may have a material effect on our domestic sales.
Our success depends on our ability to attract, retain and motivate management and other skilled employees.
Our success depends in significant part upon the continued services of key management and skilled personnel. Competition for qualified personnel is intense and there are a limited number of people with knowledge of, and experience in, our industry. We do not have employment agreements with most of our key employees nor maintain life insurance policies on them. The loss of key personnel, especially without advance notice, or our inability to hire or retain qualified personnel, could have a material adverse effect on our ability to maintain our technological edge and ultimately our financial condition and results of operations. We cannot guarantee that we will continue to retain our key management and skilled personnel, or that we will be able to attract, assimilate and retain other highly qualified personnel in the future.
The expense and potential unavailability of insurance coverage for us, our customers or our products may have an adverse effect on our financial position and results of operations.
Our products are used to gather information for medical decisions and diagnosis. Accordingly, a defect in the design or manufacture of our products, or a failure of our products to perform for the use that we specify, could have a material adverse effect on our reputation in the industry and subject us to claims of liability arising from inaccurate or allegedly inaccurate test results. Misuse of our products by a technician that results in inaccurate or allegedly inaccurate test results could similarly subject us to claims of liability. While we currently have insurance for our business, property, directors and officers, and products, insurance is increasingly costly and the scope of coverage is more narrow, and we may be required to assume more risk in the future. If we are subject to claims or suffer a loss or damage in excess of our insurance coverage, we will be required to cover the amounts in excess of our insurance limits. If we are subject to claims or suffer a loss or damage that is outside of our insurance coverage, we may incur significant costs associated with loss or damage that would have a material adverse effect on our financial position and results of operations. Furthermore, any claims made on our insurance policies may impact our ability to obtain or maintain insurance coverage at reasonable costs, or at all. We do not have the financial resources to self-insure, and it is unlikely that we will have these financial resources in the foreseeable future.
We have product liability insurance that covers our products and business operation, but we may need to increase and expand this coverage commensurate with our expanding business.
Any product liability claims brought against us, with or without merit, could result in:
| | Ÿ | | substantial costs of related litigation or regulatory action; |
| | Ÿ | | substantial monetary penalties or awards; |
| | Ÿ | | decreased demand for our products; |
| | Ÿ | | reduced revenue or market penetration; |
| | Ÿ | | injury to our reputation; |
| | Ÿ | | an inability to establish new strategic relationships; |
| | Ÿ | | increased product liability insurance rates; and |
| | Ÿ | | an inability to secure continuing coverage. |
Furthermore, any impairment of our reputation could have a material adverse effect on our sales and prospects for future business. We have not received any indication that our insurance carrier will not renew our product liability insurance at or near current premiums; however, we cannot guarantee that this will continue to be the case. In addition, any failure to comply with FDA regulations governing manufacturing practices could hamper our ability to defend against product liability lawsuits.
26
Our facilities are located near known earthquake fault zones, and the occurrence of an earthquake or other catastrophic disaster could damage our facilities and equipment, which could cause us to curtail or cease operations.
Instruments for our diagnostics division are manufactured in a single facility in the San Fernando Valley and Arista Molecular and Iris Molecular Diagnostics are located in Carlsbad, California, all of which are near known earthquake fault zones and, therefore, are vulnerable to damage from earthquakes. We are also vulnerable to damage from other types of disasters, such as power loss, fire, and similar events. If any disaster were to occur, our ability to operate our business could be seriously impaired. We currently may not have adequate insurance to cover our losses resulting from disasters or other similar significant business interruptions, and we do not plan to purchase additional insurance to cover such losses due to the cost of obtaining such coverage. Any significant losses that are not recoverable under our insurance policies could seriously impair our business, financial condition and prospects.
If we are unable to manage our growth, our results could suffer.
We have been experiencing significant growth in the scope of our operations. This growth has placed significant demands on our management, as well as operational resources. In order to achieve our business objectives, we anticipate that we will need to continue to grow. If this growth occurs, it will continue to place additional significant demands on our management and our operational resources, and will require that we continue to develop and improve our operational, financial and other internal controls both in the United States and internationally. In particular, if our growth continues, it will increase the challenges in implementing appropriate control systems, expanding our sales and marketing infrastructure capabilities, providing adequate training and supervision to maintain high quality standards, and preserving our cultural values. The main challenge associated with our growth has been the management of our expenses. Our inability to scale our business appropriately or otherwise adapt to growth, could cause our business, financial condition and results of operations to suffer.
To market and sell our products, we depend on third-party distributors, and they may not be successful.
We currently depend on third-party distributors to sell our IVD products in most markets outside of the United States as well as all Iris Sample Processing products. The quarterly and yearly demand from distributors depends on factors such as buying patterns, cash availability, currency exchange rates, etc. If these distributors are not successful in selling our products, we may be unable to increase or maintain our level of revenue. Our distributors may not commit the necessary resources to market and sell our products. If current or future distributors do not perform adequately or if we are unable to locate distributors in particular geographic areas, we may not realize revenue growth internationally. Over the long term, we intend to grow our business internationally, and to do so we will need to attract additional distributors to expand into new territories or to sell new products.
Our sales in international markets are subject to a variety of laws and political and economic risks that may adversely impact our sales and results of operations in certain regions.
Our ability to capitalize on growth in international markets is subject to risks including:
| | Ÿ | | changes in currency exchange rates that impact the price to international consumers; |
| | Ÿ | | the burdens of complying with a variety of foreign laws and regulations; |
| | Ÿ | | unexpected changes in local regulatory requirements; |
| | Ÿ | | the difficulties associated with promoting products in unfamiliar cultures; |
| | Ÿ | | subject to general, political and economic risks in connection with our international sales operations, including: |
| | Ÿ | | changes in diplomatic and trade relationships; and |
| | Ÿ | | general economic fluctuations in specific countries or markets. |
Any of the above mentioned factors could adversely affect our sales and results of operations in international markets.
27
We are subject to currency fluctuations.
We are exposed to certain foreign currency risks in international markets where we source, produce, market or sell product. Some consumable chemistry strips and spare parts for our installed base of chemistry analyzers are sourced from a supplier located in Japan. Our purchases from this supplier are denominated in Japanese Yen and any fluctuations in the U.S. Dollar/Japanese Yen exchange rate could result in increased costs for these key components. We no longer have exposure to the Japanese Yen for instruments since attaining FDA clearance in the United States for our chemistry analyzer, the iChemVELOCITY, and iRICELL workstation. For consumables, the exposure will gradually decrease as we begin replacing AX-4280 machines with our iChemVELOCITY domestically.
We are also exposed to currency fluctuations with respect to the exportation of our products. With the exception of France, Germany and the United Kingdom where our operations are denominated in Euros and British Pounds, most of our sales are denominated in U.S. Dollars. Accordingly, any fluctuation in the exchange rate between the U.S. Dollar and the currency of the country with which we are exporting products could also affect our ability to sell internationally. To the extent we conduct operations abroad in non-local currency, fluctuations in the exchange rate between functional currency of those operations and the local currency may lead to significant increased costs and could negatively impact our profitability.
Risks Related to Our Personalized Medicine Division
If third-party payors, including Medicare and insurance companies, do not provide reimbursement for our molecular diagnostic tests, the commercial success of our Personalized Medicine Division may be compromised.
Revenues from our ProsVue test and any molecular diagnostic tests we develop in the future, in the US and foreign markets will depend in part, upon the availability of reimbursement from third-party payors. These third-party payors include government healthcare programs such as Medicare, managed care providers, private health insurers and other organizations. Reimbursement procedures in both the domestic and foreign markets are highly complex and third-party health plans are fragmented, which makes systematic reimbursement arrangements difficult to establish. We expect to focus substantial resources and efforts on gaining adoption of and reimbursement coverage for ProsVue. If we are unable to achieve adequate reimbursement coverage from third-party payors for ProsVue or any molecular diagnostic test we develop in the future, our ability to achieve any kind of substantial revenues from our Personalized Medicine Division will be limited.
Increasingly, third-party payors are trying to control healthcare costs by demanding lower prices or rebates. They have recently reduced the number of new molecular diagnostic tests for which they will provide reimbursement, and even when third-party payors are willing to provide reimbursement, they are increasingly reducing the reimbursement amounts they will pay for new molecular diagnostic tests. Additionally, there is no guarantee that a test that has been approved for reimbursement in the past will remain approved for reimbursement or that similar or additional diagnostic tests will be approved in the future. Therefore, we may not be reimbursed, or such reimbursement may be inadequate, for ProsVue or future molecular diagnostic tests. Adequate third-party reimbursement might not be available to enable us to maintain price levels sufficient to realize an appropriate return on investment in product development.
Any changes to the current healthcare laws and regulations may necessitate a change to our business model.
The clinical laboratory industry is a highly regulated industry. Our clinical laboratory is subject to numerous federal and state laws and regulations, including with respect to anti-kickback, billing and claims, privacy, security and electronic transactions (including HIPAA), and the regulation of laboratories, including CLIA. While we believe that we are currently in compliance with all of these laws and regulations, they may be, or the way the courts interpret these laws and regulations, may be, changed or amended at anytime. Any such changes may necessitate a change to our business model or result in increased costs of compliance, which may adversely affect our business, prospects and the results of our operations.
28
We may incur substantial penalties including fines or possible debarment from Medicare or Medicaid if we violate certain government payor laws and regulations.
We are required to comply with a number of different government regulations relating to billing practices and relationships with physicians and hospitals. Violations of these regulations can lead to civil penalties, criminal liability and possible disbarment from participation in Medicare and Medicaid. If we were ever determined to be in violation of these regulations our relationship with many of our clients would be severely affected and we could face a material adverse effect to our financial condition or results of operations.
Our laboratory business may be harmed if we are unable to comply with certain healthcare related laws and regulations, including the Clinical Laboratory Improvement Act of 1967 and the Clinical Laboratory Improvement Amendments of 1988 (collectively, CLIA).
Arista is regulated and licensed by a number of federal and state statutes and regulations, including CLIA. If a clinical laboratory fails to comply with CLIA requirement or state healthcare and licensing laws and regulations, it can have its license suspended or revoked. At this time we believe that we comply with these laws and regulations. If these laws or regulations are amended, we may have to change the manner in which we conduct our laboratory business, which could lead to additional expenses in running our laboratory business. If we are unable to properly comply with these changes, we could have our licenses suspended or revoked, which would adversely affect our laboratory operations.
We face possible litigation, penalties and damage to our reputation with payors, physicians and patients if we are unable to properly protect customer-related information.
Arista receives a variety of personal information about our customers. We believe that we have a strong security system in place and that we comply with all federal and state laws and regulations relating to the protection of personal information (including HIPAA). However, if there was a breach of our security system or we inadvertently released protected patient information, we face possible monetary fines, litigation and damage to our reputation.
We face possible litigation, penalties and medical malpractice for errors in laboratory testing results.
Arista utilizes the best practices in quality assurance to avoid and prevent errors in test results. However, if the laboratory produces an inadvertent erroneous result, this can adversely affect a patient’s diagnosis and treatment and may result in medical malpractice litigation for which fines and damages can be substantial and could exceed the limits of our medical malpractice insurance coverage, causing substantial damage to our financial condition.
Federal, state and CLIA regulations define certain personnel standards that our laboratory must adhere to, including education, background and experience requirements. Our ability to attract, hire and maintain critical personnel may limit the testing our laboratory can perform.
The laboratory relies on its ability to attract, hire and keep certain critical personnel such as Medical Directors and licensed laboratory personnel who have appropriate advanced degrees and years of experience necessary to satisfy CLIA requirements and certain state requirements. If the laboratory cannot attract, hire and maintain these critical employees, then the laboratory’s ability to perform certain testing may be severely limited. This can damage the laboratory’s reputation with its customers and severely impact our financial performance.
Risks Related to Ownership of Our Common Stock
The potential issuance of preferred stock and certain provisions of our certificate of incorporation and bylaws may prevent a change in control and may adversely affect the market price of our common stock.
Our ability to issue additional shares of preferred stock and some provisions of our certificate of incorporation and bylaws could make it more difficult for a third party to make an unsolicited takeover attempt of us. Additionally, we are subject to the anti-takeover provisions of Section 203 of the Delaware General Corporation Law, which regulates corporate acquisitions. These anti-takeover provisions and the Board of Directors ability to issue additional shares of preferred stock may depress the price of our common stock by making it more difficult for third parties to acquire us by offering to purchase shares of our stock at a premium to its market price without approval of our board of directors. They could also have the effect of preventing changes in our management.
29
Our quarterly sales and operating results may fluctuate in future periods, and if we fail to meet expectations the price of our common stock may decline.
Our quarterly sales and operating results have fluctuated significantly in the past and are likely to do so in the future due to a number of factors, many of which are not within our control. If our quarterly sales or operating results fall below the expectations of investors or securities analysts, the price of our common stock could decline substantially. Factors that might cause quarterly fluctuations in our sales and operating results include the following:
| | Ÿ | | variation in demand for our products, including seasonality; |
| | Ÿ | | our ability to develop, introduce, market and gain market acceptance of new products and product enhancements in a timely manner; |
| | Ÿ | | our ability to manage inventories, accounts receivable and cash flows; |
| | Ÿ | | our ability to control costs; |
| | Ÿ | | the size, timing, rescheduling or cancellation of orders from consumers and distributors; and |
| | Ÿ | | our ability to forecast future sales and operating results and subsequently attain them. |
The amount of expenses we incur depends, in part, on our expectations regarding future sales. In particular, we expect to continue incurring substantial expenses relating to the marketing and promotion of our products. Since many of our costs are fixed in the short term, if we have a shortfall in sales, we may be unable to reduce expenses quickly enough to avoid losses. If this occurs, we will not be profitable. Accordingly, you should not rely on quarter-to-quarter comparisons of our operating results as an indication of our future performance.
| Item 1B. Unresolved | Staff Comments. |
None.
We lease all of our facilities totaling approximately 186,000 square feet of offices, laboratories and manufacturing space. Our headquarters are located at 9158 Eton Avenue, Chatsworth, California 91311.
The table below sets forth certain information regarding our leased properties as of March 1, 2012.
| | | | | | |
Location | | Approximate Floor
Space (Sq. Ft.) | | Monthly Rent | | Use |
Chatsworth, CA | | 98,446 | | $76,783 | | Corporate headquarters and manufacturing |
Westwood, MA | | 29,220 | | $36,080 | | Sample Processing division |
Carlsbad, CA | | 14,941 | | $18,183 | | Iris Molecular Diagnostics and Arista Molecular |
Carlsbad, CA | | 25,776 | | $26,250 | | Chemistry facility (occupancy in May 2012) |
Marburg, Germany | | 8,539 | | $16,304 | | Urine chemistry strip manufacturing facility |
Marburg, Germany | | 4,844 | | $2,055 | | Urine chemistry strip manufacturing warehouse |
Marburg, Germany | | 953 | | $3,034 | | Urine chemistry strip R&D facility |
Paris, France | | 4,241 | | $4,856 | | Sales office |
Causeway Bay, HK | | 132 | | $2,160 | | Sales office |
Cambridge, UK | | 323 | | $1,088 | | Sales office |
We believe our facilities are adequate to meet our current and near-term needs.
| Item 3. Legal | Proceedings. |
From time to time, we are party to certain litigation arising in the normal course of business. Management believes that the resolution of such matters will not have a material adverse effect on our financial position, results of operations or cash flows. We are not currently involved in any litigation that requires disclosure in this report.
| Item 4. Mine | Safety Disclosures. |
Not applicable.
30
PART II
| Item 5. | Market for Registrant’s Common Equity, Related Stockholder Matters and Issuer Purchases of Equity Securities. |
Our common stock is listed on the NASDAQ Global Market under the symbol “IRIS.” The closing price of our common stock on March 7, 2012 was $11.45 per share. The table below sets forth, for the periods indicated, the high and low closing prices of our common stock on the NASDAQ Global Market.
| | | | | | | | |
| | | Price per share | |
| | | Low | | | High | |
Fiscal 2011: | | | | | | | | |
First Fiscal Quarter | | $ | 8.64 | | | | 10.53 | |
Second Fiscal Quarter | | | 8.70 | | | | 10.04 | |
Third Fiscal Quarter | | | 7.85 | | | | 10.36 | |
Fourth Fiscal Quarter | | | 8.40 | | | | 9.77 | |
Fiscal 2010: | | | | | | | | |
First Fiscal Quarter | | $ | 10.21 | | | | 12.08 | |
Second Fiscal Quarter | | | 9.79 | | | | 11.86 | |
Third Fiscal Quarter | | | 7.34 | | | | 10.12 | |
Fourth Fiscal Quarter | | | 8.80 | | | | 10.44 | |
As of March 7, 2012 we had approximately 1,650 holders of record of our common stock. A substantially greater number of holders of IRIS common stock are “street name” or beneficial holders, whose shares are held of record by banks, brokers, and other financial institutions.
Dividend Policy
We have never paid any cash dividends on our common stock. We currently expect to retain any future earnings for use in the operation and expansion of our business and do not anticipate paying any cash dividends on our common stock in the foreseeable future. Furthermore, we may not pay any cash dividends on the common stock without the written consent of our lender.
31
FIVE-YEAR STOCK PRICE PERFORMANCE COMPARISON(1)
The following graph and table compare the cumulative total return on our common stock with the cumulative total return (including reinvested dividends) of the Standard & Poor’s 500 Index (S&P 500), the NASDAQ Medical Devices, Instruments and Supplies, Manufacturers and Distributors Stocks Index and the Standard & Poor’s HealthCare Equipment Index for the five years ending December 31, 2011, assuming that the relative value of the common stock and each index was $100 on December 31, 2006. Amounts below have been rounded to the nearest dollar. The stock price performance on the following graph is not necessarily indicative of future stock price performance.
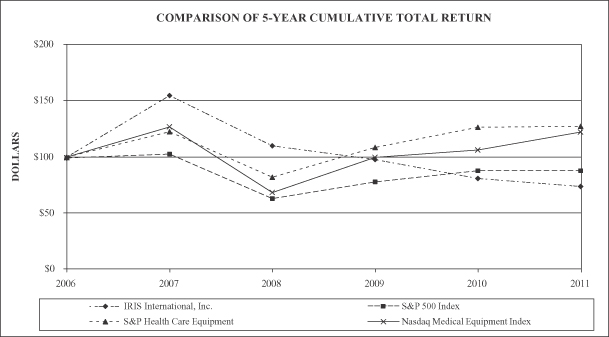
| (1) | This section is not “soliciting material,” is not deemed “filed” with the SEC and is not to be incorporated by reference into any filing of IRIS International, Inc. under the Securities Act of 1933, as amended, or the Securities Exchange Act of 1934, as amended, whether made before or after the date hereof and irrespective of any general incorporation language in any such filing. |
32
| Item 6. Selected | Financial Data. |
The table below sets forth selected consolidated financial data for the five years in the period ended December 31, 2011 that has been derived from our Consolidated Financial Statements. The information set forth below is not necessarily indicative of results of future operations, and should be read in conjunction with Item 7, “Management’s Discussion and Analysis of Financial Condition and Results of Operations” and the Consolidated Financial Statements and notes thereto included in Item 8, “Financial Statements and Supplementary Data” of this Annual Report on Form 10-K.
| | | | | | | | | | | | | | | | | | | | |
| | | Year Ended December 31, | |
| | | 2011 | | | 2010 | | | 2009 | | | 2008 | | | 2007 | |
| | | (in thousands, except per share data) | |
Statement of Operations Data: | | | | | | | | | | | | | | | | | | | | |
Revenues | | $ | 118,324 | | | $ | 107,672 | | | $ | 92,566 | | | $ | 95,502 | | | $ | 84,306 | |
Operating income (loss) | | | (4,405 | ) | | | 3,108 | | | | 7,811 | | | | 10,967 | | | | 8,953 | |
Other income | | | 1,337 | | | | 1,022 | | | | 894 | | | | 2,409 | | | | 1,440 | |
Net income (loss) | | | (1,194 | ) | | | 3,042 | | | | 6,251 | | | | 9,013 | | | | 7,549 | |
Basic net income (loss) per share | | | (0.07 | ) | | | 0.17 | | | | 0.35 | | | | 0.49 | | | | 0.42 | |
Diluted net income (loss) per share | | | (0.07 | ) | | | 0.17 | | | | 0.35 | | | | 0.48 | | | | 0.40 | |
Balance Sheet Data: | | | | | | | | | | | | | | | | | | | | |
Working capital | | | 48,961 | | | | 48,435 | | | | 58,988 | | | | 51,553 | | | | 49,685 | |
Total assets | | | 111,915 | | | | 106,609 | | | | 97,790 | | | | 90,638 | | | | 86,390 | |
Total debt | | | — | | | | — | | | | — | | | | — | | | | — | |
Total liabilities | | | 21,747 | | | | 17,958 | | | | 12,568 | | | | 14,728 | | | | 11,456 | |
Stockholders’ equity | | | 90,168 | | | | 88,651 | | | | 85,222 | | | | 75,910 | | | | 74,934 | |
Our financial results for the years set forth above were impacted by the following events:
1. In September 2011, we restructured our Personalized Medicine segment by downsizing and consolidating the molecular pathology laboratory operations of Arista into Iris Molecular Diagnostics. As a result, 2011 results include the operating losses from Arista Molecular of $12.5 million which includes $7.1 million related to restructuring and impairment charges.
2. 2010 results include the operating losses, including acquisition related costs, of approximately $3.7 million related to our acquisition in July 2010 of Arista Molecular Inc. In addition, we incurred $923,000 in CFO and related transition costs, $1.1 million unfavorable foreign currency fluctuation and losses and approximately $800,000 related to higher instrument cost of goods due to a price premium on our final purchase of automated chemistry analyzers from the Japanese manufacturer.
3. 2009 results include the following expenses totaling $1.1 million; an accrual of $475,000 for payroll taxes attributable to the exercise of stock options, $350,000 in start-up expenses for the initiation of direct sales operations in the UK and Germany and $250,000 for product retrofit costs related to the voluntary recall of approximately 1,565 StatSpin Express 4 Centrifuges.
4. 2008 results include the non-recurring other income related to the $1.2 million net payment to us as part of the manufacturing transition rights agreement signed with IDEXX Laboratories in December 2008.
5. 2007 results include the effects of closing our Advanced Digital Imaging Research subsidiary’s operations which resulted in a $163,000 write-off.
33
| Item 7. Management’s | Discussion and Analysis of Financial Condition and Results of Operations. |
Overview
IRIS International, Inc. consists of three operating units in three business segments as determined in accordance with Financial Accounting Standards Board (“FASB”) ASC Topic 280,Segment Reporting. Our in vitro diagnostics segment, also called Iris Diagnostics Division (IDD), designs, manufactures and markets systems, consumables and supplies for urinalysis and body fluids. Our Iris Sample Processing (ISP) segment markets small centrifuges and other processing equipment and accessories for rapid specimen processing, as well as, equipment for fluorescent in-situ hybridization (FISH). Our Personalized Medicine (PMD) segment combines the research and development operations of Iris Molecular Diagnostics and our CLIA laboratory, Arista Molecular, Inc. Under this segment we consolidate all operations for the development and commercialization of proprietary cancer diagnostic tests and related technology, including ProsVue, our recent FDA cleared prognostic prostate cancer test.
Iris Diagnostics Division
Our core IVD business is in the urinalysis market and we are the leading worldwide provider of automated urine microscopy systems, with more than 3,600 iQ microscopy analyzers shipped to date in over 50 countries. We generate revenues primarily from sales of instruments, consumables and service. Revenues from instruments include global sales of urine microscopy and chemistry analyzers. In September 2008, we released our proprietary iChemVELOCITY automated urine chemistry analyzer and a fully integrated urine microscopy and urine chemistry work-cell, called the iRICELL in some international markets. In March 2011, we received FDA clearance on our 510(k) application for these products and commenced selling them in the United States. Historically, we sold our family of iQ analyzers integrated with an automated chemistry analyzer that was sourced from a Japanese manufacturer.
Our consumables revenues result from sales of chemical reagents, urine test strips, calibrators and controls. Service revenues are derived primarily from annual service contracts purchased by our domestic customers after the initial year of sale, which is covered by product warranty, and spare parts purchased by international customers. Once the analyzers are installed, we generate recurring revenue from sales of consumables. Recurring consumable and service revenue should continue to expand as the installed base of related instruments increases.
In the United States, France, Germany and the United Kingdom sales of our urinalysis systems are direct to the end-user through our sales force. All other international sales are through independent distributors. International sales represented 33% and 34% of consolidated revenues for the years ended December 31, 2011 and 2010, respectively. Since the majority of international sales are made through independent distributors, gross profit margin is lower than domestic sales of the same products, but we incur minimal sales, service and marketing costs for such sales.
Iris Sample Processing
Our Iris Sample Processing group markets and develops centrifuges, semi-automated DNA processing workstations and sample processing consumables. Our StatSpin® brand bench-top centrifuges are used for specimen preparation in coagulation, cytology, chemistry and urinalysis. Our worldwide markets include medical institutions, commercial laboratories, clinics, doctors’ offices, veterinary laboratories and research facilities. Our Sample Processing products are sold worldwide primarily through distributors and incorporated into our OEM partners products.
In November 2010, we acquired the assets of a multi-purpose, bench-top instrument platform for automating highly repetitive, manual laboratory protocols for FISH testing and other slide-based cytogenetic applications. The automated product, now called ThermoBrite Elite, is a complementary product to our successful ThermoBrite® DNA Hybridization System and in line with our entry into personalized medicine with emphasis on cancer diagnostics. The product prototypes and proprietary technology assets were purchased for $3.2 million in cash from BioMicro Systems, Inc. Although BioMicro Systems built and tested working prototypes, several elements of this platform required further enhancement in order to improve reliability and serviceability. The product is expected to be launched in the first quarter of 2012.
34
Personalized Medicine
Our Personalized Medicine segment is leveraging our proprietary NADiA and Microbubble Isolation Technology platforms to develop ultra-sensitive and precise diagnostic tests to aid in the early detection of disease relapse, monitor treatment and potentially provide better therapeutic outcomes.
In September 2011, we received 510(k) clearance for our NADiA ProsVue prognostic prostate cancer test. This test is indicated for use as a prognostic marker in conjunction with clinical evaluation as an aid in identifying post radical prostatectomy patients at reduced risk for recurrence of prostate cancer and therefore is expected to reduce unnecessary treatment of certain post-prostatectomy men. In October 2011, we received Conformité Européenne (CE) Mark for NADiA ProsVue, which allows it to be marketed in the European Union and other countries that recognize the CE Mark.
In September 2011, we also completed a restructuring of our Personalized Medicine division, which included downsizing and consolidating Arista Molecular’s operations into Molecular Diagnostics. As part of this restructuring, we discontinued non-proprietary testing services such as flow cytometry, FISH, cytology services and the non-proprietary molecular pathology menu. Arista retained all licenses and high-complexity CLIA laboratory capabilities, as well as limited personnel to perform NADiA and other proprietary tests. The restructuring provides significant cost reductions and enhanced profitability in our business. For the year ended December 31, 2011, we recognized restructuring expenses and impairment of asset charges of $1.6 million and $5.8 million, respectively. The simplification of our business model should allow us to concentrate our resources on our new product pipeline and other strategic initiatives. See Note 4 — “Restructuring and Impairment of Assets,” in the accompanying notes to financial statements for more information about the restructuring of our Personalized Medicine segment.
Research and Development
We have invested significant capital to acquire technologies and to increase our investment in research and development both to sustain the technological leadership of our existing core product lines in urinalysis and sample processing and as part of our growth strategy to broaden our product pipeline into new high value segments such as hematology and personalized medicine. The decision to diversify into IVD market segments in which we do not presently participate has adversely affected our earnings growth over the last four years, as we have invested significantly in research and development without any corresponding revenues from new products still in development. Our investment in new product platforms, however, is of strategic importance and is necessary to position the company for significant revenue and earnings acceleration in future years. Research and development expense increased to $16.2 million, or 14% of revenue, in 2011 compared to $14.6 million, or 14% of revenue, in 2010. Of these expenditures, approximately $5.9 million and $7.0 million was invested in 2011 and 2010, respectively, in our NADiA and hematology platforms. Included in the 2011 hematology spending was the receipt of $1.5 million from our Japanese co-development partner for milestones achieved. For 2012, we anticipate that research and development expense will increase to approximately 15% to 16% of revenue because our Iris Diagnostics Division will be concurrently developing two next generation platforms, one for urinalysis and one for hematology, both based on our 3GEMS system architecture.
The following table summarizes product technology expenditures for the periods indicated:
| | | | | | | | | | | | |
| | | 2011 | | | 2010 | | | 2009 | |
| | | (in thousands) | |
Total product technology expenditures during year | | $ | 18,244 | | | $ | 15,357 | | | $ | 12,331 | |
Less: milestone payments received from Fujirebio related to Hematology program | | | (1,500 | ) | | | — | | | | — | |
Less: amounts capitalized during year to software development costs as reported in the consolidated statements of cash flow | | | (485 | ) | | | (754 | ) | | | (835 | ) |
Less: amounts reimbursed through grants for government sponsored research and development | | | (12 | ) | | | (41 | ) | | | (85 | ) |
| | | | | | | | | | | | |
Research and development expense as reported in the consolidated statements of operations | | $ | 16,247 | | | $ | 14,562 | | | $ | 11,411 | |
| | | | | | | | | | | | |
35
Critical Accounting Policies
The preparation of financial statements and related disclosures in conformity with U.S. generally accepted accounting principles and our discussion and analysis of our financial condition and results of operations require us to make judgments, assumptions, and estimates that affect the amounts reported in our consolidated financial statements and accompanying notes. Note 2 of the Notes to Consolidated Financial Statements of this Form 10-K describes the significant accounting policies and methods used in the preparation of our consolidated financial statements. We base our estimates on historical experience and on various other assumptions we believe to be reasonable under the circumstances, the results of which form the basis for making judgments about the carrying values of assets and liabilities. We regularly discuss with our audit committee the basis of our estimates. Actual results may differ from these estimates and such differences may be material.
We believe the following critical accounting policies, among others, affect our more significant judgments and estimates used in the preparation of our consolidated financial statements:
Revenue recognition: IDD and Sample Processing– Revenues are primarily derived from the sale of IVD instruments, sales of consumable supplies and services for IVD systems as well as sales of sample processing instruments and related supplies. Revenue is recognized once all of the following conditions have been met: (i) an authorized purchase order has been received in writing with a fixed and determinable sales price; (ii) customer credit worthiness has been established; and (iii) delivery of the product based on shipping terms.
Revenue is recorded in accordance with the provisions of FASB ASC Topic 605 “Revenue Recognition”, which generally require revenue earned on product sales involving multiple-elements to be allocated to each element based on the relative fair values of those elements if sold separately. Multiple elements of certain domestic product sales include IVD instruments, training, consumables and service.
Accordingly, we allocate revenue to each element in a multiple element arrangement based on the element’s respective fair value, with the fair value determined by the price charged when that element is sold separately and specifically defined in a quotation or contract.
A portion of our revenues are derived from sales-type leases as we provide lease financing to certain customers that purchase our diagnostic instruments. Leases under these arrangements are classified as investment in sales-type leases. These leases typically have terms of five years. Revenue from sales-type leases is recognized when collectability of the minimum lease payments is reasonably predictable and no important uncertainties surround the amount of unreimbursable costs yet to be incurred by us as lessor under the lease. The minimum lease payments that accrue to our benefit as lessor are recorded as the gross investment in the lease. The difference between the gross investment in the lease and the sum of the present value of the minimum lease payments and unguaranteed residual value, accruing to our benefit as lessor, are recorded as unearned income.
We have certain government contracts with cancellation clauses or renewal provisions that are generally required by law, such as (i) those dependent on fiscal funding outside of a governmental unit’s control; (ii) those that can be cancelled if deemed in the tax payers’ best interest; and (iii) those that must be renewed each fiscal year, given limitations that may exist on multi-year contracts that are imposed by statute. Under these circumstances and in accordance with the relevant accounting literature, as well as considering our historical experience, a thorough evaluation of these contracts is performed to assess whether cancellation is remote or whether exercise of the renewal option is reasonably assured.
We recognize revenues from service contracts ratably over the term of the service period, which typically ranges from twelve to sixty months. Payments for service contracts for purchased instruments are generally received in advance. Deferred revenue represents the revenues to be recognized over the remaining term of the service contracts.
Revenue recognition: Personalized Medicine — Revenues related to our Personalized Medicine segment are recorded in accordance with FASB ASC 605-10-S99-1, “Revenue Recognition”, when (i) the price is fixed or determinable, (ii) persuasive evidence of an arrangement exists, (iii) the service is performed and (iv) collectability of the resulting receivable is reasonably assured.
36
Our Personalized Medicine testing services are performed based on a written test requisition form and revenues are recognized once the diagnostic services have been performed, the results have been communicated to the ordering physician and when collectability is reasonably assured. We report revenues based on the amount expected to be collected from payors.
Inventory valuation — We value inventories at the lower of cost or market value on a first-in, first-out basis. Provision for potentially obsolete or slow-moving inventory is made based on management’s analysis of inventory levels and future sales forecasts.
Goodwill and IntangibleAssets – Our intangible assets consist of goodwill and intangible assets with indefinite lives such as a CLIA license, which are not being amortized and intangible assets with a finite life, which are being amortized over useful lives ranging from 3 to 20 years. All intangible assets are subject to impairment tests on an annual or periodic basis. Goodwill and intangible assets with indefinite lives are evaluated in accordance with FASB ASC Topic 350, The Intangibles — Goodwill and Other, based on various analyses, including a comparison of the carrying value of the reporting unit to its estimated fair value and discounted cash flow. The analysis necessarily involves significant management judgment to evaluate the capacity of an acquired business to perform within projections. Intangible assets with a finite life are evaluated for impairment using the methodology set forth in FASB ASC Topic 360, Property, Plant and Equipment. Recoverability of these assets is assessed only when events have occurred that may give rise to a potential impairment. When a potential impairment has been identified, forecasted undiscounted net cash flows of the operations to which the asset relates are compared to the current carrying value of the long-lived assets present in that operation. If such cash flows are less than such carrying amounts, long-lived assets, including such intangibles, are written down to their respective fair values. See Note 4 — “Restructuring and Impairment of Assets” for a discussion of impairment recorded in 2011.
Substantially all of the goodwill resides in the Personalized Medicine reporting unit.
Capitalized software — We capitalize certain software development costs in connection with our development of our analyzers in accordance with FASB ASC Topic 985, Software. We capitalize software development costs once technological feasibility is established and such costs are determined to be recoverable against future revenues.
Capitalized software development costs are expensed to cost of sales over periods of up to five years. When, in management’s estimate, future revenues will not be sufficient to recover previously capitalized software development costs, we will expense such items as additional software development amortization in the period the impairment is identified. Such adjustments are normally attributable to changes in market conditions or product quality considerations.
Income taxes — We account for income taxes in accordance with FASB ASC Topic 740,Income Taxes, which requires recognition of deferred tax liabilities and assets for the expected future tax consequences of events that have been included in the financial statements or tax returns. Under this method, deferred tax liabilities and assets are determined based on the differences between the financial statement and the tax bases of assets and liabilities using enacted tax rates in effect for the year in which the differences are expected to reverse. Valuation allowances are established when necessary to reduce deferred tax assets to the amount expected to be realized. Income tax expense represents the tax payable for the period and the change during the period in deferred tax assets and liabilities.
We account for uncertain tax positions in accordance with FASB ASC Topic 740-10 which prescribes a recognition threshold and measurement attribute for financial statement recognition and measurement of a tax position taken or expected to be taken in a tax return and also provides guidance on various related matters such as derecognition, interest, penalties and disclosures required. We recognize interest and penalties, if any, related to unrecognized tax benefits in income tax expense.
Stock based compensation — The Company accounts for stock based compensation under FASB ASC Topic 718,Compensation — Stock Compensation which requires compensation costs related to share-based transactions, including employee stock options, to be recognized in the financial statements based on fair value.
37
Warranties — We recognize warranty expense, based on historical data and management’s estimate of expected cost, as an accrued liability at the time of sale. The Company regularly reevaluates its estimates to assess the adequacy of the recorded warranty liabilities and adjust the amounts as necessary.
Results of Operations
The following table summarizes results of operations data for the periods indicated. The percentages in the table are based on total revenues with the exceptions of percentages for gross profit margins, which are computed on related revenue, and percentages for income taxes, which are computed based on the relationship of income taxes to pre-tax income (loss).
| | | | | | | | | | | | | | | | | | | | | | | | |
| | | Years ended December 31, | | | | |
| | | 2011 | | | | | | 2010 | | | | | | 2009 | | | | |
| | | (in thousands) | |
Revenues | | | | | | | | | | | | | | | | | | | | | | | | |
IDD instruments | | $ | 33,936 | | | | 29 | % | | $ | 32,083 | | | | 30 | % | | $ | 26,018 | | | | 28 | % |
IDD consumables and service | | | 69,656 | | | | 59 | % | | | 61,112 | | | | 57 | % | | | 52,213 | | | | 56 | % |
Sample Processing instruments and supplies | | | 14,540 | | | | 12 | % | | | 14,408 | | | | 13 | % | | | 14,335 | | | | 16 | % |
Personalized Medicine services | | | 192 | | | | 0 | % | | | 69 | | | | 0 | % | | | — | | | | 0 | % |
| | | | | | | | | | | | | | | | | | | | | | | | |
Total revenues | | | 118,324 | | | | 100 | % | | | 107,672 | | | | 100 | % | | | 92,566 | | | | 100 | % |
| | | | | | | | | | | | | | | | | | | | | | | | |
Gross profit(1) | | | | | | | | | | | | | | | | | | | | | | | | |
IDD instruments | | | 13,130 | | | | 39 | % | | | 10,846 | | | | 34 | % | | | 9,240 | | | | 36 | % |
IDD consumable and service | | | 40,486 | | | | 58 | % | | | 36,623 | | | | 60 | % | | | 32,055 | | | | 61 | % |
Sample Processing instruments and supplies | | | 8,049 | | | | 55 | % | | | 7,789 | | | | 54 | % | | | 7,370 | | | | 51 | % |
Personalized Medicine services | | | (1,444 | ) | | | — | | | | (372 | ) | | | — | | | | — | | | | 0 | % |
| | | | | | | | | | | | | | | | | | | | | | | | |
Gross profit | | | 60,221 | | | | 51 | % | | | 54,886 | | | | 51 | % | | | 48,665 | | | | 53 | % |
| | | | | | | | | | | | | | | | | | | | | | | | |
| | | | | | |
Operating expenses | | | | | | | | | | | | | | | | | | | | | | | | |
Marketing and selling | | | 23,109 | | | | 20 | % | | | 19,829 | | | | 18 | % | | | 16,122 | | | | 17 | % |
General and administrative | | | 19,105 | | | | 16 | % | | | 17,387 | | | | 16 | % | | | 13,321 | | | | 14 | % |
Research and development, net | | | 16,247 | | | | 14 | % | | | 14,562 | | | | 14 | % | | | 11,411 | | | | 12 | % |
Gain on revaluation of contingent consideration | | | (1,225 | ) | | | (1 | %) | | | — | | | | 0 | % | | | — | | | | 0 | % |
Impairment of assets | | | 5,829 | | | | 5 | % | | | — | | | | 0 | % | | | — | | | | 0 | % |
Restructuring expense | | | 1,561 | | | | 1 | % | | | — | | | | 0 | % | | | — | | | | 0 | % |
| | | | | | | | | | | | | | | | | | | | | | | | |
Total operating expenses | | | 64,626 | | | | 55 | % | | | 51,778 | | | | 48 | % | | | 40,854 | | | | 44 | % |
| | | | | | | | | | | | | | | | | | | | | | | | |
Operating income (loss) | | | (4,405 | ) | | | (4 | %) | | | 3,108 | | | | 3 | % | | | 7,811 | | | | 9 | % |
Other income | | | 1,337 | | | | | | | | 1,022 | | | | | | | | 894 | | | | | |
| | | | | | | | | | | | | | | | | | | | | | | | |
Income (loss) before provision for income taxes | | | (3,068 | ) | | | (3 | %) | | | 4,130 | | | | 4 | % | | | 8,705 | | | | 9 | % |
Provision for income taxes(2) | | | (1,874 | ) | | | (2 | %) | | | 1,088 | | | | 26 | % | | | 2,454 | | | | 28 | % |
| | | | | | | | | | | | | | | | | | | | | | | | |
Net income (loss) | | $ | (1,194 | ) | | | (1 | %) | | $ | 3,042 | | | | 3 | % | | $ | 6,251 | | | | 7 | % |
| | | | | | | | | | | | | | | | | | | | | | | | |
| (1) | Gross profit margin percentages are based on the related sales of each category. |
| (2) | Income tax percentage is computed based on the relationship of income taxes to pre-tax income (loss). |
Comparison of Year Ended December 31, 2011 to 2010
Consolidated revenues for the year ended December 31, 2011 increased 10% over the prior year to $118.3 million from $107.7 million in 2010. International revenues accounted for approximately 33% of consolidated revenue in 2011 compared to 34% in 2010. Revenues in the IDD urinalysis segment increased 11% to $103.6 million in 2011, from $93.2 million in the prior year. Sales of IDD instruments increased 6% to $33.9 million from $32.1 million in the prior year. The continued increase in IDD instrument sales is primarily driven by the introduction of iChemVELOCITY and iRICELL workstations.
38
IDD consumables and service increased during the year to $69.7 million from $61.1 million, an increase of 14% over 2010, primarily due to the larger installed base of iQ automated microscopy analyzers and the introduction of the Chem VELOCITY in most major markets. In particular, we experienced an increase in sales of Japanese sourced chemistry strips due to higher utilization in the US market. We expect sales of our iChemVELOCITY strips to accelerate with the introduction of the iChemVELOCITY in the domestic market and expected availability in additional international markets pending product registration in those countries.
Revenues derived from Sample Processing instruments and supplies modestly increased to $14.5 million, a 1% increase over 2010 revenues of $14.4 million. Revenues were favorably impacted by strong sales to US distribution partners and partially offset by weaker sales internationally, particularly in Eastern Europe. We expect to accelerate growth in this segment with the planned release of the ThermoBrite Elite in the first quarter of 2012.
Personalized Medicine revenues in 2011 totaled $192,000 as compared to $69,000 in 2010. All of this revenue came from non-proprietary testing services provided by Arista Molecular, which were discontinued in September 2011.
Consolidated gross profit margin remained at 51% in 2011 compared to 51% in 2010. Excluding losses from the Personalized Medicine CLIA laboratory, Arista Molecular, segment in both periods, consolidated gross margin was 52% in 2011 compared to 51% in 2010. Instrument margins increased in 2011 versus last year but this was offset by lower consumable and service margins, primarily due to higher costs for Japanese sourced chemistry strips due to the appreciation of the yen versus a year ago.
The gross profit margin of our IDD instruments was 39% in 2011 compared to 34% in 2010. The increase is primarily due to higher instrument volume and the initiation of sales of iChem VELOCITY in the U.S, whose cost is lower than the Japanese-sourced chemistry analyzer sold until December 2010.
The gross profit margin of our IDD consumables and service decreased to 58% in 2011 compared to 60% in 2010, primarily attributable to higher costs for Japanese sourced chemistry strips due to the appreciation of the Yen versus a year ago, as well as a modest increase in service personnel to support our increasing installed base.
Gross profit margin for our Sample Processing instruments and supplies segment increased to 55% in 2011 from 54% in 2010. The increase is primarily due to favorable product mix and cost reduction initiatives.
Marketing and selling expenses totaled $23.1 million, or 20% of revenues, in 2011 as compared to $19.8 million, or 18% of revenues in 2010. The increase primarily results from $1.5 million of expenses related to Arista’s operations, additional personnel and related costs of $802,000, travel and entertainment and shows expense of $497,000 as well as higher commissions and GPO fees of $479,000 from increased sales. Excluding Arista, marketing and selling expenses for our core business were approximately 17% of revenue in both periods.
General and administrative expenses increased to $19.1 million, or 16% of revenues, in 2011, from $17.4 million or 16% of revenues in 2010. This increase primarily relates to $1.7 million of corporate overhead, which included personnel and related costs, recruiting and relocation and board compensation.
Research and development expense increased to $16.2 million, or 14% of revenues, in 2011 from $14.6 million, or 14% of revenues in 2010. The increase was primarily attributable to $1.7 million in personnel and related costs, partially offset by other lower miscellaneous expenses, as we continue to invest heavily in research and development for the continued development of our diagnostics product pipeline, including our 3GEMS urinalysis and hematology programs. Net R&D expense for 2011 includes $1.5 million in payments from Fujirebio related to our joint development agreement on the 3GEMS Hematology Analyzer which partially offsets research and development expenditures for this product.
Gain on revaluation of contingent consideration of $1.2 million recorded in 2011 is the result of the reduction in the fair value of the contingent consideration obligation associated with the acquisition of Arista. As a result of significant revenue shortfalls at Arista relative to previous projections for the three months ended March 31, 2011, sales projections for Arista were significantly reduced for all future periods. As the revised revenue projections were significantly below the earn-out targets for all three years covered by the earn-out period, management concluded that the fair value contingent consideration obligation was zero, which resulted in
39
a decrease of $1.2 million in our contingent obligation by March 31, 2011. Consequently, the Company recognized a gain on revaluation of contingent consideration for 2011 (recorded in March 2011). As of December 31, 2011, the fair value of the contingent consideration remained at zero.
We incurred restructuring expenses of $1.6 million in 2011 related to downsizing and consolidating the molecular pathology laboratory operations of Arista Molecular, Inc., into the Iris Molecular Diagnostics facility. We also incurred approximately $5.8 million of asset write-downs and impairment charges as a result of this restructuring. The impaired assets included goodwill of $1.5 million, core technology and other intangibles of $2.9 million arising from the 2010 acquisition of AlliedPath, Inc. and write-downs of property and equipment of $1.5 million related to AlliedPath. See Note 4 — “Restructuring and Impairment of Assets,” in the accompanying notes to the consolidated financial statements for more information about the restructuring of our Personalized Medicine segment.
Interest income amounted to $1.1 million for both the years ended December 31, 2011 and 2010. While the interest earned on cash balances decreased in 2011 versus 2010 due primarily to our Arista operations, this was offset by higher lease interest income from customer leases as compared to 2010.
Income tax expense during the year amounted to 61% benefit of pre-tax loss as compared to 26% provision during the prior year. The higher income tax benefit rate resulted from an increase in research and development tax credits and other state tax credits as a percentage of the pre-tax loss. We have federal and state research and development and other tax credit carryovers totaling $4.6 million.
Comparison of Year Ended December 31, 2010 to 2009
Consolidated revenues for the year ended December 31, 2010 increased 16% over the prior year to $107.7 million from $92.6 million in 2009. International revenues accounted for approximately 34% of consolidated revenue in 2010 compared to 33% in 2009. Revenues in the IDD urinalysis segment increased 19% to $93.2 million in 2010, from $78.2 million in the prior year. IDD revenues in 2010 include approximately $2.4 million incremental revenue related to the acquisition of European distributor operations earlier in the year. Sales of IDD instruments increased 23% to $32.1 million in 2010 from $26.0 million in the prior year. The increase in IDD instrument sales in 2010 was primarily driven by strong domestic sales versus the 2009 period due to new marketing and sales initiatives and improvement in the U.S. medical capital equipment market environment.
IDD consumables and service increased during 2010 to $61.1 million from $52.2 million, an increase of 17% over 2009, primarily due to the larger installed base of instruments both domestically and internationally and increased sales of iChemVELOCITY test strips due to increased placements of our iChemVELOCITY analyzer in the international market.
Revenues derived from Sample Processing instruments and supplies modestly increased to $14.4 million, a 1% increase over 2009 revenues of $14.3 million. Revenues were favorably impacted by the following factors: a) continued strong sales of our ThermoBrite line of instruments, b) introduction of our new Cytofuge 12 instrument and c) OvaTube consumables. Revenues were unfavorably impacted by the completion of the transition of the separator consumable business to IDEXX. We will receive royalties on these units beginning in 2014.
Personalized Medicine revenues in 2010 totaled $69,000.
Consolidated gross profit margin decreased to 51% in 2010 compared to 53% in 2009, primarily the result of higher cost of goods due to a price premium on our final purchase of Japanese-sourced automated chemistry analyzers, the negative effect of foreign currency fluctuations, and increased service costs relating to our start up of direct commercial operations in Europe.
The gross profit margin of our IDD instruments was 34% in 2010 compared to 36% in 2009. Instrument gross margins were impacted by increased costs from foreign-sourced products due to the weakening of the U.S. dollar, in particular on our purchases of AUTION MAX AX-4280 chemistry analyzers which are denominated in Japanese Yen, partially offset by higher instrument volume and a greater mix of direct domestic sales versus international sales through distributors.
40
The gross profit margin of our IDD consumables and service decreased to 60% in 2010 compared to 61% in 2009, primarily the result of increased costs of foreign-sourced products due to the weaker U.S. dollar, increased service costs related to iChemVELOCITY and an increase in service costs related to our direct commercial operations in the United Kingdom and Germany, partially offset by the higher margins due to manufacturing efficiencies resulting from higher volume in consumables sold.
Gross profit margin for our Sample Processing instruments and supplies segment increased to 54% in 2010 from 51% in 2009 as a result of product mix, favorable purchase price discounts, and cost reduction initiatives such as lean manufacturing.
Marketing and selling expenses totaled $19.8 million, or 18% of revenues, in 2010 as compared to $16.1 million, or 17% of revenues in 2009. The increase primarily results from $1.3 million of expenses related to Arista’s operations, additional personnel and related costs of $2.0 million related primarily to our direct operations in the United Kingdom and Germany, travel and entertainment, excluding UK and Germany of $192,000 as well as higher commissions and GPO fees of $210,000.
General and administrative expenses increased to $17.4 million, or 16% of revenues, in 2010, from $13.3 million or 14% of revenues in 2009. This increase primarily relates to $1.9 million in acquisition and operating expenses relating to Arista, $923,000 of CFO severance and related transition expenses, $796,000 of additional personnel and related costs in information technology, quality assurance and regulatory affairs and $455,000 of recruiting and relocation expenses.
Research and development expense increased to $14.6 million, or 14% of revenues, in 2010 from $11.4 million, or 12% of revenues in 2009. The increase was primarily attributable to $1.2 million in research materials, consulting, clinical development expenses, $1.6 million in personnel and related costs and other expenses of approximately $400,000 as we continue to invest heavily in research and development for the continued development of our diagnostics product pipeline, including our NADiA platform and 3GEMS urinalysis and hematology programs.
Interest income during 2010 amounted to $1.1 million, a $266,000 increase over 2009 mainly due to a higher cash balance through part of 2010 as well as an increase in in-house sales-type leases.
Income tax expense during the year amounted to 26% of pre-tax income as compared to 28% during the prior year. The decrease in the income tax provision resulted from an increase in research and development tax credits due to an increase in qualifying research and development expenses. We had federal and state research and development and other tax credit carryovers totaling $3.6 million at December 31, 2010.
Contractual Obligations and Commercial Commitments
The following table aggregates our expected minimum contractual obligations and commitments subsequent to December 31, 2011:
| | | | | | | | | | | | | | | | | | | | |
Contractual Obligations | | Total | | | Less than
1 year | | | 1-3
years | | | 3-5
years | | | More than
5 years | |
| | | (in thousands)* | |
Operating lease commitments | | $ | 11,071 | | | $ | 2,497 | | | $ | 4,692 | | | $ | 2,275 | | | $ | 1,607 | |
| | | | | | | | | | | | | | | | | | | | |
| * | Not included in the table above are normal recurring accounts payable or accrued expenses which are presented on the accompanying consolidated financial statements. |
Off-Balance Sheet Arrangements
At December 31, 2011 and 2010, we did not have any relationships with unconsolidated entities or financial partnerships, such as entities often referred to as structured finance or special purpose entities, which would have been established for the purpose of facilitating off-balance sheet arrangements or other contractually narrow or limited purposes. As such, we are not exposed to any financing, liquidity, market or credit risk that could arise if we had engaged in such relationships.
41
Liquidity and Capital Resources
Our primary source of liquidity is cash from operations, which depends heavily on sales of our IDD instruments, consumables and service, as well as sales of sample processing instruments and supplies. At December 31, 2011, our cash and cash equivalents amounted to $23.5 million compared to $25.5 million at December 31, 2010. We also have up to $15.0 million of availability under our credit facility with JPMorgan Chase Bank, N.A.
In the past few years, we faced adverse macro-economic forces, which impacted our selling markets and the credit markets of our customers. At this point the impact from these forces are relatively mild, but in the future we may face the following challenges if adverse economic conditions in Europe worsen: deferrals of purchases due to decreases in capital budgets of our customers, delays in the purchasing cycle due to greater scrutiny of deals and increased internal competition for limited capital dollars. The aforementioned factors may lead to a decrease in revenue, an increase of deferred revenue, or could lead to installment cash collection.
Operating Cash Flows. Cash provided by operations for the year ended December 31, 2011 was $5.7 million as compared to $8.8 million in the prior year, primarily due to the decrease in net income resulting from losses at Arista adjusted for non-cash items and an increase in accounts receivable.
The number of days sales in accounts receivable increased to 83 days at the end of 2011 compared to 70 days for the prior year end. The number of days sales in accounts receivable varies and extends due to extended payment terms for our international customers and the granting of an increased volume of extended payment terms for certain customers.
Our cash flow has been favorably affected by tax credit carryforwards. As of December 31, 2011, we had federal and state tax credit carryforwards of approximately $910,000 and $3.7 million, respectively. We continue to realize tax deductions from the exercise of certain stock options. During the year ended December 31, 2011, we realized tax deductions of approximately $768,000 relating to this item. During the year ended December 31, 2011, we paid federal and state taxes of $798,000 and $443,000, respectively.
Investing Activities. Cash used in investing activities totaled $7.5 million as compared to $13.9 million in the prior year. In 2011, investing activities primarily consisted of the $1.6 million increase in investment in leasehold improvements for our new research and development facility located in Chatsworth, CA. In 2010, we used $4.6 million in cash for the acquisition of Arista, $3.3 million for the purchase of core technology and $0.7 million for the purchase of assets from a European distributor.
Financing Activities. Cash used in financing activities totaled $148,000 in the year ended December 31, 2011 compared to $3.2 million in the prior year. Financing activities in 2011 primarily were composed of settlement on restricted stock tax withholding. In the year ended December 31, 2010, we repurchased 330,454 shares of its common stock for $3.0 million.
On July 27, 2011, we entered into a new credit facility with JPMorgan Chase Bank, N.A., as administrative agent for certain lenders. The credit facility provides for borrowings of up to $15.0 million pursuant to revolving loans, acquired participations in letters of credit and swingline loans. We have not borrowed any amounts under the credit facility. All amounts under the revolving loans become due and payable on July 31, 2013. The credit facility has variable interest rates based on changes to either the applicable LIBOR rate or the lender’s prime rate. Interest is generally payable monthly in arrears. Our obligations under this credit facility are secured by a lien on substantially all of our assets and those of our domestic subsidiaries. The credit facility contains affirmative and negative covenants, including financial covenants and limitations on additional indebtedness, and customary default provisions that provide that all outstanding obligations under the facility may become immediately due and payable in the event of our default. We were in compliance with these covenants at December 31, 2011.
On July 22, 2011, we terminated our previous credit facility with another commercial bank. This facility consisted of a $6.5 million revolving line of credit for working capital and a $10.0 million line of credit for acquisitions and product opportunities. This credit facility had variable interest rates based on changes to either the LIBOR rate or the lender’s prime rate.
42
In August 2010, our board of directors authorized a share repurchase and retirement plan of up to $10 million of the Company’s common stock over a 12-month period. During the year ended December 31, 2010, we repurchased 330,454 shares of common stock at an average price per share of approximately $9.10, for an aggregate amount of approximately $3.0 million. In 2009, we repurchased 250,800 shares of our common stock for approximately $2.5 million, and in 2008, we repurchased 983,579 shares of our common stock for approximately $11.9 million. We did not repurchase shares of common stock in 2011.
We believe that our current cash on hand, together with cash generated from operations and cash available under the credit facility with the bank will be sufficient to fund normal operations for the foreseeable future. However, additional funding may be required to fund expansion of our business. There is no assurance that such funding will be available on terms acceptable to us.
Recent Accounting Pronouncements
In December 2011, the Financial Accounting Standards Board (“FASB”) issued Accounting Standards Update (“ASU”) ASU 2011-11,Disclosures About Offsetting Assets and Liabilities. The amendments in ASU 2011-11 require entities to disclose information about offsetting and related arrangements to enable users of financial statements to understand the effect of those arrangements on an entity’s financial position. The amendments require enhanced disclosures by requiring improved information about financial instruments and derivative instruments that are either (i) offset in accordance with current literature or (2) subject to an enforceable master netting arrangement or similar agreement, irrespective of whether they are offset in accordance with current literature. ASU 2011-11 is effective for fiscal years, and interim periods within those years, beginning on or after January 1, 2013. We are currently evaluating the impact of our pending adoption of ASU 2011-11 on our financial statements.
In September 2011, the FASB issued ASU No. 2011-08,Intangibles — Goodwill and Other (Topic 350)-Testing Goodwill for Impairment. ASU 2011-08 allows entities to use a qualitative approach to test goodwill for impairment. ASU 2011-08 permits an entity to first perform a qualitative assessment to determine whether it is more likely than not that the fair value of a reporting unit is less than its carrying value. If it is concluded that this is the case, it is necessary to perform the currently prescribed two-step goodwill impairment test. Otherwise, the two-step goodwill impairment test is not required. ASU 2011-08 is effective for us in fiscal 2013 and earlier adoption is permitted. We are currently evaluating the impact of our pending adoption of ASU 2011-08 on our financial statements.
In June 2011, the FASB issued ASU No. 2011-05,Comprehensive Income (ASC Topic 220): Presentation of Comprehensive Income.ASU 2011-05 amends current comprehensive income guidance. This accounting update eliminates the option to present the components of other comprehensive income as part of the statement of stockholders’ equity. Instead, entities must report comprehensive income in either a single continuous statement of comprehensive income which contains two sections, net income and other comprehensive income, or in two separate but consecutive statements. In December 2011, the FASB issued ASU 2011-12,Comprehensive Income (Topic 220): Deferral of the Effective Date for Amendments to the Presentation of Reclassifications of Items Out of Accumulated Other Comprehensive Income in ASU 2011-05, to defer the effective date of the specific requirement to present items that are reclassified out of accumulated other comprehensive income to net income alongside their respective components of net income and other comprehensive income. All other provisions of this update, which are to be applied retrospectively, are effective for fiscal years, and interim periods within those years, beginning after December 15, 2011. We do not expect the adoption of ASU 2011-05 to have a material impact on our financial statements as it only requires a change in the format of our current presentation.
In April 2011, the FASB issued ASU 2011-02,Receivables: A Creditor’s Determination of Whether a Restructuring is a Troubled Debt Restructuring.ASU 2011-02 provides guidance on whether a restructuring constitutes a troubled debt restructuring. For public entities, the ASU was effective for the first interim or annual period beginning on or after June 15, 2011, and should be applied retrospectively to the beginning of the annual period of adoption. For purposes of measuring impairment of those receivables, an entity should apply the amendments prospectively for the first interim or annual period beginning on or after June 15, 2011. For nonpublic entities, the ASU is effective for annual periods ending on or after December 15, 2012, including
43
interim periods within those annual periods. Early adoption is permitted. The adoption of ASU 2011-02 did not have a material impact on our financial statements.
In December 2010, the FASB issued ASU 2010-29,Business Combinations — Disclosure of Supplementary Pro Forma Information, which specifies that if a public entity presents comparative financial statements, the entity should disclose revenue and earnings of the combined entity as though the business combination(s) that occurred during the current year had occurred as of the beginning of the comparable prior annual reporting period only. ASU 2010-29 was effective on a prospective basis for business combinations for which the acquisition date was on or after the beginning of the first annual reporting period beginning on or after December 15, 2010 with early adoption permitted. The adoption of ASU 2010-29 did not have a material impact on our financial statements.
In December 2010, the FASB issued ASU No. 2010-28 — When to Perform Step 2 of the Goodwill Impairment Test for Reporting Units with Zero or Negative Carrying Amounts. This update provides amendments to ASC Topic 350 — Intangibles, Goodwill and Other that requires an entity to perform Step 2 impairment test even if a reporting unit has zero or negative carrying amount. Step 1 tests whether the carrying amount of a reporting unit exceeds its fair value. Previously reporting units with zero or negative carrying value passed Step 1 because the fair value was generally greater than zero. Step 2 requires impairment testing and impairment valuation be calculated in between annual tests if an event or circumstances indicate that it is more likely than not that goodwill has been impaired. ASU 2010-28 was effective beginning January 1, 2011. As a result of this standard, goodwill impairments may be reported sooner than under current practice. The adoption of ASU 2010-28 did not have a material impact on our financial statements.
In April 2010, the FASB issued ASU 2010-17, Milestone Method of Revenue Recognition, provides guidance on defining a milestone and determining when it may be appropriate to apply the milestone method of revenue recognition for research and development transactions. It was effective on a prospective basis for milestones achieved in fiscal years, and interim periods within those years, beginning on or after June 15, 2010. Early adoption is permitted. The adoption of the ASU 2010-17 did not have a material impact on our consolidated financial statements.
In October 2009, the FASB issued ASU 2009-14,Certain Revenue Arrangements That Include Software Elements, now codified under FASB ASC Topic 985,Software. ASU 2009-14, removes tangible products from the scope of software revenue guidance and provides guidance on determining whether software deliverables in an arrangement that includes a tangible product are covered by the scope of the software revenue guidance. ASU 2009-14 was to be applied on a prospective basis for revenue arrangements entered into or materially modified in fiscal years beginning on or after June 15, 2010, with early adoption permitted. The adoption of the ASU 2009-14 did not have a material impact on our consolidated financial statements.
In October 2009, the FASB issued ASU 2009-13, Multiple-Deliverable Revenue Arrangements, which amends ASC Topic 605,Revenue Recognition, to require companies to allocate revenue in multiple-element arrangements based on an element’s estimated selling price if vendor-specific or other third-party evidence of value is not available. ASU 2009-13 was effective for fiscal years beginning on or after June 15, 2010. Earlier application is permitted. The adoption of ASU 2009-13 did not have a material impact on our consolidated financial statements.
| Item 7A. Quantitative | and Qualitative Disclosures About Market Risk. |
Market Risk
Our business is exposed to various market risks, including changes in interest rates and foreign currency exchange rates. Market risk is the potential loss arising from adverse changes in market rates and prices, such as interest rates and foreign currency exchange rates. We do not invest in derivatives, foreign currency forward contracts or other financial instruments for trading or speculative purposes. We had no debt at December 31, 2011, thus were not subject to market risk for changes in interest rates on debt obligations. We are subject to market risk for changes in interest rates on our short-term investment portfolio. We invest our excess cash in certificates of deposit and the market value of these investments fluctuate based on changes in interest rates.
44
Foreign Currencies
We conduct business in certain foreign markets, primarily in the European Union and Asia. Our primary exposure to foreign currency risk relates to investments in foreign subsidiaries that transact business in a functional currency other than the U.S. Dollar, primarily the Euro and British Pound. We are subject to certain foreign currency risks in the importation of goods from Japan and as a result of commercial operations in Europe and Asia. Our consumables purchases from a major Japanese IVD supplier are denominated in Japanese Yen. The impact from fluctuation in the Yen should decrease over time, as we now sell our own chemistry analyzer into the domestic market and will decrease purchases from our Japanese supplier. All of our sales are denominated in U.S. Dollars with the exception of France, Germany, the United Kingdom and Ireland, where sales are denominated in Euros and British Pound. Fluctuations in the U.S. Dollar exchange rate for Japanese Yen, Euro and British Pound could result in increased costs for our key components and increased costs for commercial operations in Europe.
To mitigate the potential impact of adverse fluctuations in the U.S. Dollar exchange rate for these currencies, we have periodically purchased foreign currency forward contracts in the past for Euros and Japanese Yen. During the year ended December 31, 2011, we entered into such forward contracts to purchase 338,712,000 in Japanese Yen. As of December 31, 2011, we had outstanding foreign currency forward contracts to purchase 241,760,000 in Japanese Yen. We estimated the sensitivity of the fair value of all derivative foreign exchange contracts to a hypothetical 10% strengthening and 10% weakening of the spot exchange rates for the U.S. dollar against the Japanese Yen at December 31, 2011. The analysis showed that a 10% strengthening of the U.S. dollar would result in a loss from a fair value change of $333,000 and a 10% weakening of the U.S. dollar would result in a gain from a fair value change of $302,000 in these instruments. Losses and gains on the underlying transactions being hedged would largely offset any gains and losses on the fair value of the derivative contracts. These offsetting gains and losses are not reflected in the above analysis. Refer to the sectionForeign Currency Hedge under Note 2 — “Summary of Significant Accounting Policies” for additional details.
45
Item 8. Financial Statements and Supplementary Data.
Index to Financial Statements
46
Report of Independent Registered Public Accounting Firm
Board of Directors and Shareholders of IRIS International, Inc.
Chatsworth, California
We have audited the accompanying consolidated balance sheets of IRIS International, Inc. as of December 31, 2011 and 2010 and the related consolidated statements of operations, shareholders’ equity, cash flows and other comprehensive income (loss) for each of the three years in the period ended December 31, 2011. These financial statements are the responsibility of the Company’s management. Our responsibility is to express an opinion on these financial statements based on our audits.
We conducted our audits in accordance with the standards of the Public Company Accounting Oversight Board (United States). Those standards require that we plan and perform the audit to obtain reasonable assurance about whether the financial statements are free of material misstatement. An audit includes examining, on a test basis, evidence supporting the amounts and disclosures in the financial statements, assessing the accounting principles used and significant estimates made by management, as well as evaluating the overall financial statement presentation. We believe that our audits provide a reasonable basis for our opinion.
In our opinion, the consolidated financial statements referred to above present fairly, in all material respects, the financial position of IRIS International, Inc. at December 31, 2011 and 2010, and the results of its operations, cash flows and its other comprehensive income (loss) for each of the three years in the period ended December 31, 2011, in conformity with accounting principles generally accepted in the United States of America.
We also have audited, in accordance with the standards of the Public Company Accounting Oversight Board (United States), IRIS International Inc.’s internal control over financial reporting as of December 31, 2011, based on criteria established in Internal Control – Integrated Framework issued by the Committee of Sponsoring Organizations of the Treadway Commission (COSO) and our report dated March 12, 2012, expressed an unqualified opinion thereon.
/s/ BDO USA, LLP
Los Angeles, California
March 12, 2012
47
Report of Independent Registered Public Accounting Firm
To the Board of Directors and Shareholders of IRIS International, Inc.
Chatsworth, California
We have audited IRIS International, Inc.’s internal control over financial reporting as of December 31, 2011, based on criteria established in Internal Control – Integrated Framework issued by the Committee of Sponsoring Organizations of the Treadway Commission (the COSO criteria). IRIS International, Inc.’s management is responsible for maintaining effective internal control over financial reporting and for its assessment of the effectiveness of internal control over financial reporting, included in the accompanying “Item 9A, Management’s Report on Internal Control over Financial Reporting”. Our responsibility is to express an opinion on the company’s internal control over financial reporting based on our audit.
We conducted our audit in accordance with the standards of the Public Company Accounting Oversight Board (United States). Those standards require that we plan and perform the audit to obtain reasonable assurance about whether effective internal control over financial reporting was maintained in all material respects. Our audit included obtaining an understanding of internal control over financial reporting, assessing the risk that a material weakness exists, and testing and evaluating the design and operating effectiveness of internal control based on the assessed risk. Our audit also included performing such other procedures as we considered necessary in the circumstances. We believe that our audit provides a reasonable basis for our opinion.
A company’s internal control over financial reporting is a process designed to provide reasonable assurance regarding the reliability of financial reporting and the preparation of financial statements for external purposes in accordance with generally accepted accounting principles. A company’s internal control over financial reporting includes those policies and procedures that (1) pertain to the maintenance of records that, in reasonable detail, accurately and fairly reflect the transactions and dispositions of the assets of the company; (2) provide reasonable assurance that transactions are recorded as necessary to permit preparation of financial statements in accordance with generally accepted accounting principles, and that receipts and expenditures of the company are being made only in accordance with authorizations of management and directors of the company; and (3) provide reasonable assurance regarding prevention or timely detection of unauthorized acquisition, use, or disposition of the company’s assets that could have a material effect on the financial statements.
Because of its inherent limitations, internal control over financial reporting may not prevent or detect misstatements. Also, projections of any evaluation of effectiveness to future periods are subject to the risk that controls may become inadequate because of changes in conditions, or that the degree of compliance with the policies or procedures may deteriorate.
In our opinion, IRIS International, Inc. maintained, in all material respects, effective internal control over financial reporting as of December 31, 2011, based on the COSO criteria.
We also have audited, in accordance with the standards of the Public Company Accounting Oversight Board (United States), the consolidated balance sheets of IRIS International Inc. as of December 31, 2011 and 2010, and the related consolidated statements of operations, shareholders’ equity, cash flows and other comprehensive income for each of the three years in the period ended December 31, 2011 and our report dated March 12, 2012 expressed an unqualified opinion thereon.
/s/BDO USA, LLP
Los Angeles, California
March 12, 2012
48
IRIS INTERNATIONAL, INC.
CONSOLIDATED BALANCE SHEETS
| | | | | | | | |
| | | At December 31, | |
| | | 2011 | | | 2010 | |
| | | (in thousands, except
per share data) | |
Assets | |
Current assets: | | | | | | | | |
Cash and cash equivalents | | $ | 23,460 | | | $ | 25,531 | |
Accounts receivable, net of allowance for doubtful accounts and sales returns of $557 and $453 at December 31, 2011 and 2010, respectively | | | 26,886 | | | | 20,733 | |
Inventories | | | 10,572 | | | | 10,310 | |
Prepaid expenses and other current assets | | | 1,305 | | | | 1,661 | |
Investment in sales-type leases, current portion | | | 4,109 | | | | 3,578 | |
Deferred tax asset | | | 4,253 | | | | 3,135 | |
| | | | | | | | |
Total current assets | | | 70,585 | | | | 64,948 | |
Property and equipment, net of accumulated depreciation of $17,425 and $14,491 at December 31, 2011 and 2010, respectively | | | 13,374 | | | | 12,035 | |
Goodwill | | | 2,451 | | | | 3,957 | |
Intangible assets, net of accumulated amortization of $515 and $529 at December 31, 2011 and 2010, respectively | | | 6,075 | | | | 9,345 | |
Software development costs, net of accumulated amortization of $5,073 and $4,226 at December 31, 2011 and 2010, respectively | | | 2,258 | | | | 2,637 | |
Deferred tax asset | | | 3,994 | | | | 2,615 | |
Investment in sales-type leases, non-current portion | | | 11,799 | | | | 10,002 | |
Other assets | | | 1,379 | | | | 1,070 | |
| | | | | | | | |
Total assets | | $ | 111,915 | | | $ | 106,609 | |
| | | | | | | | |
Liabilities and Stockholders’ Equity | |
Current liabilities: | | | | | | | | |
Accounts payable | | $ | 5,398 | | | $ | 5,795 | |
Accrued expenses | | | 12,522 | | | | 7,513 | |
Deferred service contract revenue, current portion | | | 3,704 | | | | 3,205 | |
| | | | | | | | |
Total current liabilities | | | 21,624 | | | | 16,513 | |
Deferred service contract revenue, non-current portion | | | 73 | | | | 71 | |
Other long term liabilities . | | | 50 | | | | 1,374 | |
| | | | | | | | |
Total liabilities | | | 21,747 | | | | 17,958 | |
Commitments and contingencies | | | | | | | | |
Stockholders’ equity: | | | | | | | | |
Common stock, $0.01 par value | | | | | | | | |
Authorized: 50 million shares; Issued and outstanding: 17,939 shares and 17,791 shares at December 31, 2011 and 2010, respectively | | | 179 | | | | 178 | |
Preferred Stock, $0.01 par value Authorized 3.0 million shares: Issued and outstanding: none | | | — | | | | — | |
Additional paid-in capital | | | 93,018 | | | | 89,703 | |
Other comprehensive income | | | (465 | ) | | | 140 | |
Accumulated deficit | | | (2,564 | ) | | | (1,370 | ) |
| | | | | | | | |
Total stockholders’ equity | | | 90,168 | | | | 88,651 | |
| | | | | | | | |
Total liabilities and stockholders’ equity | | $ | 111,915 | | | $ | 106,609 | |
| | | | | | | | |
The accompanying notes are an integral part of these consolidated financial statements
49
IRIS INTERNATIONAL, INC.
CONSOLIDATED STATEMENTS OF OPERATIONS
| | | | | | | | | | | | |
| | | For the Years ended December 31, | |
| | | 2011 | | | 2010 | | | 2009 | |
| | | (in thousands, except per share data) | |
Revenues | | | | | | | | | | | | |
IDD instruments | | $ | 33,936 | | | $ | 32,083 | | | $ | 26,018 | |
IDD consumables and service | | | 69,656 | | | | 61,112 | | | | 52,213 | |
Sample processing instruments and supplies | | | 14,540 | | | | 14,408 | | | | 14,335 | |
Personalized medicine services | | | 192 | | | | 69 | | | | — | |
| | | | | | | | | | | | |
Total revenues | | | 118,324 | | | | 107,672 | | | | 92,566 | |
| | | | | | | | | | | | |
Cost of Revenue | | | | | | | | | | | | |
IDD instruments | | | 20,806 | | | | 21,237 | | | | 16,778 | |
IDD consumables and service | | | 29,170 | | | | 24,489 | | | | 20,158 | |
Sample processing instruments and supplies | | | 6,491 | | | | 6,619 | | | | 6,965 | |
Personalized medicine services | | | 1,636 | | | | 441 | | | | — | |
| | | | | | | | | | | | |
Total cost of revenue | | | 58,103 | | | | 52,786 | | | | 43,901 | |
| | | | | | | | | | | | |
Gross profit | | | 60,221 | | | | 54,886 | | | | 48,665 | |
| | | | | | | | | | | | |
Marketing and selling | | | 23,109 | | | | 19,829 | | | | 16,122 | |
General and administrative | | | 19,105 | | | | 17,387 | | | | 13,321 | |
Research and development, net | | | 16,247 | | | | 14,562 | | | | 11,411 | |
Gain on revaluation of contingent consideration | | | (1,225 | ) | | | — | | | | — | |
Impairment of assets | | | 5,829 | | | | — | | | | — | |
Restructuring expenses | | | 1,561 | | | | — | | | | — | |
| | | | | | | | | | | | |
Total operating expenses | | | 64,626 | | | | 51,778 | | | | 40,854 | |
| | | | | | | | | | | | |
Operating income (loss) | | | (4,405 | ) | | | 3,108 | | | | 7,811 | |
Other income (expense): | | | | | | | | | | | | |
Interest income | | | 1,133 | | | | 1,123 | | | | 857 | |
Interest expense | | | (20 | ) | | | (10 | ) | | | (21 | ) |
Foreign currency transaction gain (loss) and other | | | 224 | | | | (91 | ) | | | 58 | |
| | | | | | | | | | | | |
Income (loss) before provision for income taxes | | | (3,068 | ) | | | 4,130 | | | | 8,705 | |
Provision (benefit) for income taxes | | | (1,874 | ) | | | 1,088 | | | | 2,454 | |
| | | | | | | | | | | | |
Net income (loss) | | $ | (1,194 | ) | | $ | 3,042 | | | $ | 6,251 | |
| | | | | | | | | | | | |
Net income (loss) per share — basic | | $ | (0.07 | ) | | $ | 0.17 | | | $ | 0.35 | |
| | | | | | | | | | | | |
Net income (loss) per share — diluted | | $ | (0.07 | ) | | $ | 0.17 | | | $ | 0.35 | |
| | | | | | | | | | | | |
Weighted average common shares outstanding — basic | | | 17,821 | | | | 17,903 | | | | 17,727 | |
| | | | | | | | | | | | |
Weighted average common shares outstanding — diluted | | | 17,821 | | | | 18,019 | | | | 17,874 | |
| | | | | | | | | | | | |
The accompanying notes are an integral part of these consolidated financial statements.
50
IRIS INTERNATIONAL, INC.
CONSOLIDATED STATEMENTS OF COMPREHENSIVE INCOME (LOSS)
| | | | | | | | | | | | |
| | | For the Year ended
December 31, | |
| | | 2011 | | | 2010 | | | 2009 | |
| | | (In thousands) | |
Net income (loss) | | $ | (1,194 | ) | | $ | 3,042 | | | $ | 6,251 | |
Unrealized derivative loss on cash flow hedges | | | (37 | ) | | | — | | | | — | |
Foreign currency translation, net of tax | | | (568 | ) | | | (420 | ) | | | 145 | |
| | | | | | | | | | | | |
| | | |
Comprehensive income (loss) | | $ | (1,799 | ) | | $ | 2,622 | | | $ | 6,396 | |
| | | | | | | | | | | | |
The accompanying notes are an integral part of these consolidated financial statements.
51
IRIS INTERNATIONAL, INC.
CONSOLIDATED STATEMENTS OF STOCKHOLDERS’ EQUITY
| | | | | | | | | | | | | | | | | | | | | | | | |
| | | | | | | | | Additional Paid-In | | | Accumulated Other Comprehensive | | | | | | | |
| | | Common Stock | | | | | Accumulated Deficit | | | | |
| | | Shares* | | | Amount | | | Capital | | | Income (loss) | | | | Total | |
| | | (In thousands) | |
Balance, January 1, 2009 | | | 18,036 | | | | $180 | | | | $83,646 | | | | $415 | | | | $(8,331 | ) | | | $75,910 | |
Common stock issued on exercise of options | | | 221 | | | | 2 | | | | 1,448 | | | | — | | | | — | | | | 1,450 | |
Common stock issued on exercise of restricted stock units | | | 17 | | | | — | | | | — | | | | — | | | | — | | | | — | |
Restricted stock grants to employees | | | 113 | | | | 2 | | | | (2 | ) | | | — | | | | — | | | | — | |
Tax benefit from stock option exercises | | | — | | | | — | | | | 416 | | | | — | | | | — | | | | 416 | |
Translation adjustment, net of tax | | | — | | | | — | | | | — | | | | 145 | | | | — | | | | 145 | |
Stock based compensation expense | | | — | | | | — | | | | 3,729 | | | | — | | | | — | | | | 3,729 | |
Cancellation of restricted stock | | | (9 | ) | | | — | | | | — | | | | — | | | | — | | | | — | |
Purchase of common stock for retirement | | | (251 | ) | | | (3 | ) | | | (1,366 | ) | | | — | | | | (1,131 | ) | | | (2,500 | ) |
Settlement on restricted stock tax withholding | | | (16 | ) | | | — | | | | (179 | ) | | | — | | | | — | | | | (179 | ) |
Net income for year | | | — | | | | — | | | | — | | | | — | | | | 6,251 | | | | 6,251 | |
| | | | | | | | | | | | | | | | | | | | | | | | |
Balance, December 31, 2009 | | | 18,111 | | | | 181 | | | | 87,692 | | | | 560 | | | | (3,211 | ) | | | 85,222 | |
Common stock issued on exercise of options | | | 22 | | | | — | | | | 31 | | | | — | | | | — | | | | 31 | |
Common stock issued on exercise of restricted stock units | | | 10 | | | | — | | | | — | | | | — | | | | — | | | | — | |
Restricted stock grants to employees | | | 23 | | | | — | | | | — | | | | — | | | | — | | | | — | |
Tax shortfall from stock option exercises | | | — | | | | — | | | | (61 | ) | | | — | | | | — | | | | (61 | ) |
Translation adjustment, net of tax | | | — | | | | — | | | | — | | | | (420 | ) | | | — | | | | (420 | ) |
Stock based compensation expense | | | — | | | | — | | | | 4,157 | | | | — | | | | — | | | | 4,157 | |
Cancellation of restricted stock | | | (15 | ) | | | — | | | | — | | | | — | | | | — | | | | — | |
Purchase of common stock for retirement | | | (330 | ) | | | (3 | ) | | | (1,801 | ) | | | — | | | | (1,201 | ) | | | (3,005 | ) |
Settlement on restricted stock tax withholding | | | (30 | ) | | | — | | | | (315 | ) | | | — | | | | — | | | | (315 | ) |
Net income for year | | | — | | | | — | | | | — | | | | — | | | | 3,042 | | | | 3,042 | |
| | | | | | | | | | | | | | | | | | | | | | | | |
Balance, December 31, 2010 | | | 17,791 | | | | $178 | | | | $89,703 | | | | $140 | | | | $(1,370 | ) | | | $88,651 | |
| | | | | | | | | | | | | | | | | | | | | | | | |
Balance, December 31, 2010 | | | 17,791 | | | | $178 | | | | $89,703 | | | | $140 | | | | $(1,370 | ) | | | $88,651 | |
Common stock issued on exercise of options | | | 89 | | | | 1 | | | | 69 | | | | — | | | | — | | | | 70 | |
Common stock issued on exercise of restricted stock units | | | 53 | | | | — | | | | — | | | | — | | | | — | | | | — | |
Restricted stock grants to employees | | | 68 | | | | 1 | | | | (1 | ) | | | — | | | | — | | | | — | |
Tax shortfall from stock option exercises | | | — | | | | — | | | | (108 | ) | | | — | | | | — | | | | (108 | ) |
Unrealized derivative loss on cash flow hedges | | | — | | | | — | | | | — | | | | (37 | ) | | | — | | | | (37 | ) |
Translation adjustment, net of tax | | | — | | | | — | | | | — | | | | (568 | ) | | | — | | | | (568 | ) |
Stock based compensation expense | | | — | | | | — | | | | 3,885 | | | | — | | | | — | | | | 3,885 | |
Cancellation of restricted stock | | | (5 | ) | | | — | | | | — | | | | — | | | | — | | | | — | |
Purchase of common stock for retirement | | | — | | | | — | | | | — | | | | — | | | | — | | | | — | |
Settlement on stock tax withholding | | | (57 | ) | | | (1 | ) | | | (530 | ) | | | — | | | | — | | | | (531 | ) |
Net loss for year | | | — | | | | — | | | | — | | | | — | | | | (1,194 | ) | | | (1,194 | ) |
| | | | | | | | | | | | | | | | | | | | | | | | |
Balance, December 31, 2011 | | | 17,939 | | | | $179 | | | | $93,018 | | | | $(465 | ) | | | $(2,564 | ) | | | $90,168 | |
| | | | | | | | | | | | | | | | | | | | | | | | |
| * Shares | outstanding (does not include unvested restricted stock units or vested restricted stock units which have not been settled) |
The accompanying notes are an integral part of these consolidated financial statements
52
IRIS INTERNATIONAL, INC.
CONSOLIDATED STATEMENTS OF CASH FLOWS
| | | | | | | | | | | | |
| | | For the Year ended December 31, | |
| | | 2011 | | | 2010 | | | 2009 | |
| | | (in thousands) | |
Cash flows from operating activities: | | | | | | | | | | | | |
Net income (loss) | | $ | (1,194 | ) | | $ | 3,042 | | | $ | 6,251 | |
Adjustments to reconcile net income (loss) to net cash provided by operating activities: | | | | | | | | | | | | |
Loss on disposal of fixed assets | | | 82 | | | | 41 | | | | 74 | |
Gain/loss on foreign currency remeasurement of intercompany balances | | | (296 | ) | | | 155 | | | | — | |
Gain on revaluation of contingent consideration | | | (1,225 | ) | | | — | | | | — | |
Deferred taxes | | | (2,497 | ) | | | (156 | ) | | | (182 | ) |
Tax shortball from stock option exercises | | | (108 | ) | | | (61 | ) | | | — | |
Tax benefit from stock option exercises | | | (313 | ) | | | (99 | ) | | | (416 | ) |
Depreciation and amortization | | | 5,321 | | | | 4,164 | | | | 3,523 | |
Stock based compensation | | | 3,885 | | | | 4,157 | | | | 3,729 | |
Impairment of assets | | | 5,829 | | | | — | | | | — | |
Changes in operating assets and liabilities: | | | | | | | | | | | | |
Accounts receivable | | | (6,245 | ) | | | (3,062 | ) | | | 2,546 | |
Inventories | | | (281 | ) | | | 512 | | | | (909 | ) |
Prepaid expenses and other assets | | | 42 | | | | (779 | ) | | | 1,280 | |
Investment in sales-type leases | | | (2,295 | ) | | | (2,790 | ) | | | (1,677 | ) |
Accounts payable | | | 1,032 | | | | 1,100 | | | | (1,820 | ) |
Accrued expenses | | | 3,656 | | | | 1,593 | | | | (713 | ) |
Deferred service contract revenue | | | 424 | | | | 938 | | | | 373 | |
Other liabilities | | | (99 | ) | | | — | | | | — | |
| | | | | | | | | | | | |
Net cash provided by operating activities | | | 5,718 | | | | 8,755 | | | | 12,059 | |
| | | | | | | | | | | | |
Cash flows from investing activities: | | | | | | | | | | | | |
Acquisition of business | | | — | | | | (4,630 | ) | | | — | |
Purchase of assets from European distributor | | | — | | | | (660 | ) | | | — | |
Refund on acquisition of business | | | 46 | | | | — | | | | — | |
Acquisition of property and equipment | | | (7,022 | ) | | | (4,564 | ) | | | (2,905 | ) |
Purchase of core technology | | | — | | | | (3,284 | ) | | | — | |
Software development costs capitalized | | | (485 | ) | | | (754 | ) | | | (835 | ) |
Sale of short-term investments in marketable securities | | | — | | | | — | | | | 2,157 | |
| | | | | | | | | | | | |
Net cash used in investing activities | | | (7,461 | ) | | | (13,892 | ) | | | (1,583 | ) |
| | | | | | | | | | | | |
Cash flows from financing activities: | | | | | | | | | | | | |
Issuance of common stock and warrants for cash | | | 70 | | | | 31 | | | | 1,450 | |
Settlement on stock tax withholding | | | (531 | ) | | | (315 | ) | | | (179 | ) |
Repurchase of common stock | | | — | | | | (3,005 | ) | | | (2,500 | ) |
Tax benefit from stock option exercises | | | 313 | | | | 99 | | | | 416 | |
| | | | | | | | | | | | |
Net cash used in financing activities | | | (148 | ) | | | (3,190 | ) | | | (813 | ) |
| | | | | | | | | | | | |
Effect of exchange rate changes on cash and cash equivalents adjustments | | | (180 | ) | | | (395 | ) | | | 145 | |
| | | | | | | | | | | | |
Net increase (decrease) in cash and cash equivalents | | | (2,071 | ) | | | (8,722 | ) | | | 9,808 | |
Cash and cash equivalents at beginning of year | | | 25,531 | | | | 34,253 | | | | 24,445 | |
| | | | | | | | | | | | |
Cash and cash equivalents at end of year | | $ | 23,460 | | | $ | 25,531 | | | $ | 34,253 | |
| | | | | | | | | | | | |
Supplemental disclosure of cash flow information: | | | | | | | | | | | | |
Cash paid for income taxes | | $ | 1,241 | | | $ | 2,523 | | | $ | 2,729 | |
Cash paid for interest | | $ | 11 | | | $ | 9 | | | $ | 21 | |
53
IRIS INTERNATIONAL, INC.
CONSOLIDATED STATEMENTS OF CASH FLOWS — (Continued)
CONSOLIDATED STATEMENTS OF CASH FLOWS |
| |
| |
| |
| Supplemental schedule of non-cash investing and financing activities: |
|
During the year ended December 31, 2011, the Company disposed of property and equipment with a cost and accumulated depreciation of $2.9M and $1.2M, respectively. |
In December 2011, stock options for 86,105 shares of common stock were exercised pursuant to a net cashless exercise and, therefore, no cash was received, resulting in the issuance of 39,647 shares of common stock. |
During the year ended December 31, 2010, the Company disposed of property and equipment with a cost and accumulated depreciation of $666 and $625, respectively. |
Fair value of contingent consideration in connection with business acquisition completed in the year ended December 31, 2010 was $1.2 million |
During the year ended December 31, 2009, the Company disposed of property and equipment with a cost and accumulated depreciation of $122 and $48, respectively. |
The accompanying notes are an integral part of these consolidated financial statements.
54
IRIS INTERNATIONAL, INC.
NOTES TO CONSOLIDATED FINANCIAL STATEMENTS
1. Description of Business
IRIS International, Inc. (the “Company”) was incorporated in California in 1979 and reincorporated in 1987 in Delaware. IRIS International, Inc. consists of three operating units. Our in-vitro diagnostics segment also called Iris Diagnostics Division (“IDD”), designs, manufactures and markets systems, consumables and supplies for urinalysis and body fluids. Our Iris Sample Processing (ISP) segment markets small centrifuges and other processing equipment and accessories for rapid specimen processing, as well as, DNA processing stations for cytogenetic testing procedures such as fluorescent in-situ hybridization (FISH). Our Personalized Medicine (PMD) segment combines our subsidiaries Iris Molecular Diagnostics, dedicated to research and development of personalized medicine products and Arista Molecular, Inc. our CLIA certified high-complexity laboratory. Under this latest segment we consolidate all operations for the development and commercialization of proprietary cancer diagnostic testing services and related products.
2. Summary of Significant Accounting Policies
Use of Estimates
The preparation of financial statements in conformity with accounting principles generally accepted in the United States of America requires management to make estimates and assumptions that affect the reported amounts of assets and liabilities and disclosure of contingent assets and liabilities at the date of the financial statements and the reported amounts of revenues and expenses during the reporting periods. The significant estimates in the preparation of the consolidated financial statements relate to the assessment of the carrying allowance for doubtful accounts, inventory reserves, the useful lives, fair value and recoverability of carrying value of long-lived and intangible assets, including goodwill, unearned income on sales-type leases, estimated provisions for warranty costs, laboratory information system implementations, currency hedges for foreign purchases and deferred tax assets. Actual results and outcomes may differ from management’s estimates and assumptions.
Principles of Consolidation
The Company’s consolidated financial statements include the accounts of IRIS International, Inc. and its wholly-owned subsidiaries. Inter-company accounts and transactions have been eliminated in the consolidated financial statements.
Cash and Cash Equivalents
The Company considers highly liquid investments with maturities of three months or less from the date of purchase to be cash equivalents. These investments are carried at cost, which approximates fair value. At times, cash balances exceed amounts insured by the Federal Deposit Insurance Corporation.
Investments in Marketable Securities
In 2008, the Company adopted Financial Accounting Standards Board (“FASB”) Accounting Standards Codification (“ASC”) Topic 820, “Fair Value Measurement and Disclosures” (“ASC 820”), for assets and liabilities measured at fair value on a recurring basis. ASC 820 defines fair values as the price that would be received to sell an asset or paid to transfer a liability in an orderly transaction between market participants at the measurement date. ASC 820 establishes a fair value hierarchy, which prioritizes the inputs used in measuring fair value into three broad levels as follows:
| | • | | Level 1 inputs are quoted prices (unadjusted) in active markets for identical assets or liabilities that the reporting entity has the ability to access at the measurement date. |
55
IRIS INTERNATIONAL, INC.
NOTES TO CONSOLIDATED FINANCIAL STATEMENTS — Continued
| | • | | Level 2 inputs include quoted prices for similar assets or liabilities in active markets, quoted prices for identical or similar assets or liabilities in markets that are not active, inputs other than quoted prices that are observable for the asset or liability and inputs that are derived principally from or corroborated by observable market data by correlation or other means. |
| | • | | Level 3 inputs are unobservable inputs for the asset or liability |
At December 31, 2011 and 2010, the Company did not hold any investments in marketable securities.
Accounts Receivable
The Company sells predominantly to entities in the health care industry. The Company grants uncollateralized credit to customers, primarily hospitals, clinical and research laboratories, and distributors. The Company performs ongoing credit evaluations of customers’ financial condition before granting uncollateralized credit. Although the Company generally does not require collateral, letters of credit may be required from its customers in certain circumstances. No single customer accounts for 10% or more of the Company’s consolidated revenues. The Company has one international distributor which accounts for 10.7% of the Company’s accounts receivable at the balance sheet date.
Accounts receivable are carried at original invoice amount less allowances made for sales markdowns, returns and doubtful accounts. Accounts receivables are customer obligations due under normal trade terms. Despite the Company’s stated trade terms, several customers are subject to reimbursement delays attributed to government and third party payer compliance and regulation issues. Management determines the allowance for doubtful accounts by identifying troubled accounts and by using historical experience applied to an aging of accounts. Receivables are written off when deemed uncollectible.
Inventories
Inventories are carried at the lower of cost or market on a first in, first out basis. Provision for potentially obsolete or slow-moving inventory is made based on management’s analysis of inventory levels and future sales forecasts. Other inventory that is considered excess inventory is fully reserved.
Property and Equipment
Property and equipment are recorded at cost, less accumulated depreciation and amortization. Depreciation is generally computed using the straight-line method over three to seven years, the estimated useful lives of the assets. Leasehold improvements are amortized over the lesser of their useful life or the remaining term of the lease.
Goodwill and Intangible Assets
Goodwill represents the excess of the aggregate purchase price over the fair value of the tangible and identifiable intangible assets acquired by the Company. Goodwill and intangible assets with indefinite lives, which consists of a CLIA license, are not amortized. Goodwill and intangible assets with indefinite lives are subject to impairment tests on an annual basis or more frequently if facts and circumstances warrant such a review. Goodwill and intangible assets with indefinite lives are evaluated in accordance with FASB ASC Topic 350,Intangibles- Goodwill and Other (“ASC 350”), based on various analyses, including a comparison of the carrying value of the reporting unit to its estimated fair value and discounted cash flows. The analysis necessarily involves significant management judgment to evaluate the capacity of an acquired business to perform within projections. If the carrying amount of a reporting unit exceeds its fair value, the goodwill impairment test is performed to measure the amount of the impairment loss, if any. During the years ended December 31, 2010 and 2009, the Company did not record any impairment charges related to goodwill or intangible assets with indefinite lives. During the year ended December 31, 2011, the Company recorded goodwill impairment of $1.5 million (see Note 4 — “Restructuring and Impairment of Assets”).
56
IRIS INTERNATIONAL, INC.
NOTES TO CONSOLIDATED FINANCIAL STATEMENTS — Continued
Intangible assets are initially measured at their fair value, determined either by the fair value of the consideration exchanged for the intangible asset, or the estimated discounted cash flows expected to be generated from the intangible asset. Intangible assets with a finite life, such as core technology, customer relationships and non-compete agreements are amortized on a straight-line basis over their estimated useful life, ranging from 3 to 20 years. Intangible assets with a finite life are evaluated for impairment using the methodology set forth in FASB ASC Topic 360,Property, Plant and Equipment. Recoverability of these assets is assessed only when events have occurred that may give rise to a potential impairment. When a potential impairment has been identified, forecasted undiscounted net cash flows of the operations to which the asset relates are compared to the current carrying value of the long-lived assets present in that operation. If such cash flows are less than such carrying amounts, long-lived assets, including such intangibles, are written down to their respective fair values. During the years ended December 31, 2010 and 2009, no intangible asset impairment was recorded. During the year ended December 31, 2011, the Company recorded $2.9 million of intangible asset impairment (see Note 4—”Restructuring and Impairment of Assets”).
In determining the useful lives of intangible assets, the Company considers the expected use of the assets and the effects of obsolescence, demand, competition, anticipated technological advances, market influences and other economic factors. For technology based intangible assets, the Company considers the expected life cycles of products which incorporate the corresponding technology.
Goodwill decreased $1.5 million primarily due to goodwill impairment during the year ended December 31, 2011 (see Note 4 — “Restructuring and Impairment of Assets”). The goodwill balance primarily relates to the Personalized Medicine segment.
Goodwill and intangible assets as of December 31, 2011 consisted of the following:
| | | | | | | | | | | | | | | | |
| | | Weighted-
Average
Amortization
Period (in
Years) | | | Gross
Carrying
Amount | | | Accumulated
Amortization | | | Intangible
Assets, net | |
| | | (Dollars in Thousands) | |
Intangible assets subject to amortization: | | | | | | | | | | | | | | | | |
Core technology | | | 20 | | | $ | 4,986 | | | $ | (515 | ) | | $ | 4,471 | |
Intangible assets not subject to amortization: | | | | | | | | | | | | | | | | |
CLIA License | | | | | | | | | | | | | | | 1,604 | |
Goodwill | | | | | | | | | | | | | | | 2,451 | |
| | | | | | | | | | | | | | | | |
Total intangible assets, net | | | | | | | | | | | | | | $ | 8,526 | |
| | | | | | | | | | | | | | | | |
Core technology as of December 31, 2011, consists of technology acquired in the acquisition of Leucadia Technologies, Inc. in 2006, and technology acquired from BioMicro Systems, Inc. in November 2010 (see Note 3).
57
IRIS INTERNATIONAL, INC.
NOTES TO CONSOLIDATED FINANCIAL STATEMENTS — Continued
Goodwill and intangible assets as of December 31, 2010 consisted of the following:
| | | | | | | | | | | | | | | | |
| | | Weighted-
Average
Amortization
Period (in
Years) | | | Gross
Carrying
Amount | | | Accumulated
Amortization | | | Intangible
Assets, net | |
| | | (Dollars in Thousands) | |
Intangible assets subject to amortization: | | | | | | | | | | | | | | | | |
Core technology | | | 17 | | | $ | 8,164 | | | $ | (513 | ) | | $ | 7,651 | |
Customer relationships | | | 5 | | | | 6 | | | | (1 | ) | | | 5 | |
Non-compete agreements | | | 3 | | | | 100 | | | | (15 | ) | | | 85 | |
| | | | | | | | | | | | | | | | |
Subtotal | | | | | | $ | 8,270 | | | $ | (529 | ) | | | 7,741 | |
| | | | | | | | | | | | | | | | |
Intangible assets not subject to amortization: | | | | | | | | | | | | | | | | |
CLIA License | | | | | | | | | | | | | | | 1,604 | |
Goodwill | | | | | | | | | | | | | | | 3,957 | |
| | | | | | | | | | | | | | | | |
Total intangible assets, net | | | | | | | | | | | | | | $ | 13,302 | |
| | | | | | | | | | | | | | | | |
Total expense related to the amortization of intangible assets was $276,000, $193,000 and $89,000 for the years ended December 31, 2011, 2010 and 2009, respectively.
Total future amortization expense related to intangible assets subject to amortization at December 31, 2011 is set forth in the table below (in thousands):
| | | | |
2012 | | $ | 223 | |
2013 | | | 249 | |
2014 | | | 249 | |
2015 | | | 249 | |
2016 | | | 249 | |
Thereafter | | | 3,252 | |
| | | | |
| | $ | 4,471 | |
| | | | |
The change in goodwill during the year ended December 31, 2011 is comprised of the following (in thousands):
| | | | |
Balance at December 31, 2010 | | $ | 3,957 | |
Impairment | | | (1,460 | ) |
Refund from acquisition of business | | | (46 | ) |
| | | | |
Balance at December 31, 2011 | | $ | 2,451 | |
| | | | |
Goodwill and intangibles assets as of December 31, 2011 consist of $5.1 million related to the Personalized Medicine segment, $3.4 million relates to the Sample Processing segment. Goodwill and intangibles assets as of December 31, 2010 consist of $9.8 million related to the Personalized Medicine segment and $3.5 million related to the Sample Processing segment. During the year ended December 31, 2011, the Company recognized an impairment of goodwill of $1.5 million (see Note 4 — “Restructuring and Impairment of Assets”).
Software Development Costs
The Company capitalizes certain software development costs for new products and product enhancements once all planning, designing, coding and testing activities necessary to establish that the product can be produced to meet our design specifications are completed, and concludes capitalization when the product is ready for
58
IRIS INTERNATIONAL, INC.
NOTES TO CONSOLIDATED FINANCIAL STATEMENTS — Continued
general release. Research and development costs relating to software development are expensed as incurred. Amortization of capitalized software development costs is provided on a product-by-product basis at the greater of the amount computed using (i) the ratio of current revenues for a product to the total of current and anticipated future revenues or (ii) the straight-line method over the remaining estimated economic life of the product up to five years.
Total software development costs capitalized totaled $485,000, $754,000, and $835,000 for the years ended December 31, 2011, 2010 and 2009, respectively. Amortization expense of software development costs totaled $848,000, $659,000, and $592,000 for the years ended December 31, 2011, 2010 and 2009, respectively.
Impairment of Long-Lived Assets
The Company will identify and record impairment losses for long-lived assets whenever events or changes in circumstances indicate that the carrying amount of an asset may not be recoverable. Recoverability of assets to be held and used is measured by a comparison of the carrying amount of an asset to future undiscounted net cash flows expected to be generated by the asset. If such assets are considered to be impaired, the impairment to be recognized is measured by the amount by which the carrying amount of the assets exceeds the fair value of the assets. Assets to be disposed of are reported at the lower of the carrying amount or fair value less costs to sell. There were no impairments of long-lived assets at December 31, 2010 and 2009. For the year ended December 31, 2011, the Company recorded impairment of long-lived assets in connection with the restructuring of Arista. See Note 4—”Restructuring and Impairment of Assets”.
Revenue recognition
For products, revenue is recognized when risk of loss transfers, when persuasive evidence of an arrangement exists, the price to the buyer is fixed and determinable and collectability is reasonably assured. When a customer enters into an operating-type lease agreement, hardware revenue is recognized on a straight-line basis over the life of the lease, while the cost of the leased equipment is carried in customer leased equipment within property, plant and equipment and amortized over its estimated useful life. Under a sales-type lease agreement, hardware revenue is generally recognized at the time of shipment based on the present value of the minimum lease payments with interest income recognized over the life of the lease using the interest method. Instrument costs under a sales-type lease agreement are recognized at the time of shipment. Service revenues on maintenance contracts are recognized ratably over the life of the service agreement or as services are performed, if not under a contract. For those instrument sales that include multiple deliverables, such as instruments, training, consumables and service, the Company allocated revenue based on the relative fair values of the individual component sold separately, as determined in accordance with FASB ASC Topic 605,Revenue Recognition.
The Company’s accounting for leases involves specific determinations under FASB ASC Topic 840Leases (“ASC 840”), which often involve complex provisions and significant judgments. The four criteria of ASC 840 that the Company uses in the determination of a sales-type lease or operating-type lease are: (i) a review of the lease term to determine if it is equal to or greater than 75 percent of the economic life of the equipment; (ii) a review of the minimum lease payments to determine if they are equal to or greater than 90 percent of the fair market value of the equipment; (iii) a determination of whether or not the lease transfers ownership to the lessee at the end of the lease term; and (iv) determination of whether or not the lease contains a bargain purchase option.
Additionally, before classifying a lease as a sales-type lease, the Company assesses whether collectability of the lease payments is reasonably assured and whether there are any significant uncertainties related to costs that the Company has yet to incur with respect to the lease. Generally, the Company’s leases that qualify as sales-type lease are non-cancelable leases with a term of 75 percent or more of the economic life of the equipment. Certain of the Company’s lease contracts are customized for larger customers and often result in complex terms and conditions that typically require judgment in applying the lease accounting criteria.
59
IRIS INTERNATIONAL, INC.
NOTES TO CONSOLIDATED FINANCIAL STATEMENTS — Continued
The economic life of the Company’s leased instruments and their fair value require significant accounting estimates and judgment. These estimates are based on the Company’s historical experience. The most objective measure of the economic life of the Company’s leased instrument is the original term of a lease, which is typically five years, since a majority of the instruments are returned by the lessee at or near the end of the lease term and there is not a significant after-market for our used instruments without substantial remanufacturing. The Company believes that this is representative of the period during which the instrument is expected to be economically usable, with normal service, for the purpose for which it is intended. The Company regularly evaluates the economic life of existing and new products for purposes of this determination.
The fair value of the Company’s leased instruments is determined by a range of cash selling prices which the Company deem to be verifiable objective evidence. The Company regularly evaluates available objective evidence of instrument fair values using historical data.
The Company has certain government contracts with cancellation clauses or renewal provisions that are generally required by law, such as: (i) those dependent on fiscal funding outside of a governmental unit’s control; (ii) those that can be cancelled if deemed in the tax payers’ best interest; or (iii) those that must be renewed each fiscal year, given limitations that may exist on multi-year contracts that are imposed by statute. Under these circumstances and in accordance with the relevant accounting literature, as well as considering the Company’s historical experience, a thorough evaluation of these contracts is performed to assess whether cancellation is remote or whether exercise of the renewal option is reasonably assured.
The Company recognizes revenues from service contracts ratably over the term of the service period, which typically ranges from twelve to sixty months. Payments for service contracts are generally received in advance. Deferred revenue represents the revenues to be recognized over the remaining term of the service contracts.
Shipping and Handling Costs
The Company records shipping and handling costs billed to customers as a component of revenue. Costs to distribute products to customers, including inbound and outbound freight, and other shipping and handling activities are included in cost of goods sold in accordance with FASB ASC Topic 605-45-45-20.
Total shipping and handling costs included as a component of revenue for the years ended December 31, 2011, 2010 and 2009 amounted to approximately $837,000, $697,000, and $707,000, respectively. Total shipping and handling costs included as a component of cost of sales amounted to $2,806,000, $2,490,000, and $1,871,000 for the years ended December 31, 2011, 2010 and 2009, respectively.
Warranties
The Company recognizes warranty expense, based on historical data and management’s estimate of expected cost, as an accrued liability at the time of sale. The Company regularly reevaluates its estimates to assess the adequacy of the recorded warranty liabilities and adjust the amounts as necessary. Warranty expense was approximately $899,000, $797,000, and $1,137,000 during the years ended December 31, 2011, 2010 and 2009, respectively.
Advertising & Literature Expenditures
Advertising and literature costs are charged to expense as incurred. Advertising and literature expense for the years ended December 31, 2011, 2010 and 2009 amounted to $389,000, $360,000, and $244,000, respectively.
Research and Development Expenditures
Research and development expenditures are charged to operations as incurred. Net research and development expense includes total research and development costs incurred, including costs incurred under research and development grants and contracts, less costs reimbursed under research and development contracts.
60
IRIS INTERNATIONAL, INC.
NOTES TO CONSOLIDATED FINANCIAL STATEMENTS — Continued
From time to time the Company receives grants from agencies of the U.S. Government. The Company does not recognize any revenue from such grants since they are cost reimbursement grants whereby the Company submits requests for reimbursement for certain costs incurred. There are no ongoing obligations or requirements with respect to the grants received, the Company retains ownership of any intellectual property that results from the research and development, and the U.S. Government agency receives a right to use the results of the research for government projects. The Company received cost reimbursements of $12,000, $41,000, and $85,000 during the years ended December 31, 2011, 2010 and 2009, respectively.
Income Taxes
The Company accounts for income taxes in accordance with FASB ASC Topic 740-10, Income Taxes, (“ASC 740”) which requires recognition of deferred tax liabilities and assets for the expected future tax consequences of events that have been included in the financial statements or tax returns. Under this method, deferred tax liabilities and assets are determined based on the differences between the financial statement and the tax bases of assets and liabilities using enacted tax rates in effect for the year in which the differences are expected to reverse. Valuation allowances are established when necessary to reduce deferred tax assets to the amount expected to be realized. Income tax expense represents the tax payable for the period and the change during the period in deferred tax assets and liabilities.
The Company accounts for uncertain tax positions in accordance with ASC 740, which prescribes a recognition threshold and measurement attribute for financial statement recognition and measurement of a tax position taken or expected to be taken in a tax return and also provides guidance on various related matters such as derecognition, interest, penalties and disclosures required. The Company recognizes interest and penalties, if any, related to unrecognized tax benefits in income tax expense.
Foreign Currency Exchange Translation
The Company’s functional currency is the U.S. dollar. The functional currencies of the Company’s foreign subsidiaries are primarily accounted for in their respective local currencies. The statements of operations of foreign operations are translated into U.S. dollars at rates of exchange in effect each month. The balance sheets of these subsidiaries are translated at period-end exchange rates, and the differences from historical exchanges rates are reflected in stockholders’ equity as other comprehensive income (loss). Foreign currency transaction gains and losses from certain intercompany transactions are recorded in foreign currency transaction gain (loss) and other. Transactions denominated in currencies other than the functional currency are recorded based on rates in effect at the time such transactions arise. Subsequent changes in exchange rates result in transaction gains and losses and are reflected in the accompanying consolidated statements of operations as unrealized (based on the applicable period-end exchange rate) or realized upon settlement of the transactions. All other foreign currency gains and losses are also recorded on foreign currency transaction gain (loss) and other. The Company recognized net foreign currency transaction gain of $264,000 for the year ended December 31, 2011. The Company recognized net foreign currency transaction losses of $91,000 for the year ended December 31, 2010. Such gains and losses were primarily attributable to volatility in the Euro and British Pound.
Foreign currency exchange gains (losses) related to intercompany balances were recorded in the Company’s statements of operations through December 31, 2011 as they represented short-term intercompany trade payables and receivables. On March 31, 2011, a substantial portion of the Company’s intercompany balances from its European subsidiaries were converted to promissory notes that are of a long-term investment nature (settlement of these notes is not planned or anticipated in the foreseeable future). As a result, foreign exchange gains and losses attributable to these promissory notes are recorded in stockholders’ equity as other comprehensive income (loss) beginning April 1, 2011.
Fair Value of Financial Instruments
The carrying amounts of financial instruments including cash and cash equivalents, short term investments in marketable securities, accounts receivable, investment in sales-type leases, accounts payable, accrued expenses
61
IRIS INTERNATIONAL, INC.
NOTES TO CONSOLIDATED FINANCIAL STATEMENTS — Continued
and deferred service contract revenues approximate fair value due to their short maturity. The carrying amount of our long-term liabilities also approximates fair value based on interest rates currently available to us for debt of similar terms and remaining maturities.
Earnings Per Share
The Company computes and presents earnings per share in accordance with FASB ASC Topic 260,Earnings Per Share. Basic earnings per share are computed by dividing net income or loss by the weighted average number of common shares outstanding, including vested restricted shares and restricted stock units, during each period. Diluted earnings per share is computed by dividing net income by the weighted average number of common shares and common stock equivalents outstanding, calculated on the treasury stock method for options and warrants using the average market prices during the period. The weighted average number of outstanding antidilutive common stock options and warrants excluded from the computation of diluted net income per common share for the years ended December 31, 2011, 2010 and 2009 were 2,653,000, 1,777,000, and 1,479,000 respectively.
A reconciliation of the shares used in the calculation of basic and diluted earnings per common share is as follows:
| | | | | | | | | | | | |
| | | For the Years Ended
December 31, | |
| | | 2011 | | | 2010 | | | 2009 | |
| | | (In thousands) | |
Weighted average common shares outstanding — basic | | | 17,821 | | | | 17,903 | | | | 17,727 | |
Effect of dilutive securities | | | | | | | | | | | | |
Stock options | | | — | | | | 94 | | | | 111 | |
Restricted common shares and restricted stock units | | | — | | | | 22 | | | | 36 | |
Warrants | | | — | | | | — | | | | — | |
| | | | | | | | | | | | |
Weighted average common shares outstanding — diluted | | | 17,821 | | | | 18,019 | | | | 17,874 | |
| | | | | | | | | | | | |
Stock Based Compensation
The Company accounts for stock based compensation under FASB ASC Topic 718,Compensation — Stock Compensation (“ASC 718”) which requires compensation costs related to share-based transactions, including employee stock options, to be recognized in the financial statements based on fair value.
The Company’s results for the years ended December 31, 2011, 2010 and 2009 include share-based compensation expense totaling $3,885,000, $4,157,000, and $3,729,000 respectively. In addition, the Company’s results include stock based compensation expense of $0 relating to stock issuances under our Employee Stock Purchase Plan for the three years ended December 31, 2011, 2010 and 2009, respectively. The total income tax benefit recognized in the income statement for stock based compensation arrangements amounted to $1,227,000, $1,369,000, and $1,188,000 for the years ended December 31, 2011, 2010, and 2009, respectively.
Foreign Currency Hedge
The Company conducts business in certain foreign markets, primarily in the European Union and Asia. To mitigate the potential impact of adverse fluctuations in the U.S. Dollar exchange rate for these currencies, the Company may periodically purchases foreign currency forward contracts. The Company does not speculate in these hedging instruments in order to profit from foreign currency exchanges; nor does it enter into trades for which there are no underlying exposures.
62
IRIS INTERNATIONAL, INC.
NOTES TO CONSOLIDATED FINANCIAL STATEMENTS — Continued
Under FASB ASC Topic 815,Accounting for Derivatives Instruments and Hedging Activities,the Company documents all relationships between hedging instruments and hedged items, as well as its risk management objective for undertaking these hedging transactions. This process includes relating the forward contracts that are designated as fair value or cash flow hedges to specific assets and liabilities on the balance sheet or to specific firm commitments or forecasted transactions. The Company also formally assesses, both at the inception of the hedge and on an ongoing basis, whether each derivative is highly effective in offsetting changes in fair values or cash flows of the hedged of the hedged items.
As of December 31, 2011, the Company had entered into foreign currency forward contracts for inventory purchases denominated in Japanese yen, with settlement dates which are typically over a period of no longer than 1 year. These foreign currency contracts consist of forward contracts and are designated as cash flow hedges. As of December 31, 2011, the notional amounts of all derivative foreign exchange contracts were $3.1 million and had an estimated fair value of ($37,000), The fair value of the foreign currency forward contracts is recorded in accrued liabilities in the consolidated balance sheet as of December 31, 2011.
For the year ended December 31, 2011 we recorded an immaterial amount of ineffectiveness to other income from cash flow hedges. Derivative gains and losses on effective hedges included in accumulated other comprehensive loss are reclassified to cost of sales upon the recognition of the hedged transaction. We reclassified a $7,000 gain (before tax) to cost of sales during the year ended December 31, 2011. We also estimate that substantially all of the $37,000 of unrealized loss (before tax) from our foreign currency contracts included in accumulated other comprehensive loss at December 31, 2011 will be reclassified to cost of sales within the next twelve months. The actual amounts that will be reclassified to earnings over the next twelve months will vary from this amount as a result of changes in market rates.
Segment Reporting
The Company determines and discloses industry segments in accordance with FASB ASC Topic 280: Segment Reporting (“ASC 280”) which uses a “management” approach for determining business segments. The management approach designates the internal organization that is used by management for making operating decisions and assessing performance as the source of the Company’s reportable segments. ASC 280 also requires disclosures about products and services, geographic areas, and major customers. See Note 19 — “Segments and Geographic Information”.
Reclassifications
In 2009, the Company reclassified employee bonus expenses between cost of goods and operating expense categories in the consolidated statement of income to conform to the presentation used in the current year.
These reclassifications had no impact on the Company’s previously reported consolidated operating income, net income or basic or diluted earnings per share.
Certain Risks and Uncertainties
Financial instruments, which potentially expose the Company to concentration of credit risk, consist primarily of cash and cash equivalents, accounts receivable and investment in sales-type leases. Concentration of credit risk with respect to accounts receivable and investment in sales-type leases is mitigated by the Company’s performance of on-going credit evaluations of its customers and the Company maintains an allowance for doubtful accounts. Investments in sales-type leases are secured by the underlying instruments.
At December 31, 2011, the amount of the Company’s cash deposited in demand deposit accounts which are fully guaranteed by the Federal Deposit Insurance Corporation was $6.8 million. The rest of the cash balances on deposit with banks are guaranteed by the Federal Deposit Insurance Corporation up to $250,000. The Company may be exposed to risk for the amount of funds held in one bank in excess of the insurance limit. In assessing the risk, the Company’s policy is to maintain cash balances with high quality financial institutions.
63
IRIS INTERNATIONAL, INC.
NOTES TO CONSOLIDATED FINANCIAL STATEMENTS — Continued
The Company derives most of its revenues from the sale of the urinalysis analyzers, and related supplies and services. Declines in unit sales or gross margins could have a material adverse effect on the Company’s revenues and profits, respectively.
Certain of the Company’s components are obtained from outside vendors, and the loss or breakdown of the Company’s relationships with these outside vendors could subject us to substantial delays in the delivery of its products to its customers. Furthermore, certain key components of the Company’s instruments and certain consumables are manufactured by only one supplier. The Company’s inability to sell products to meet delivery schedules could have a material adverse effect on its reputation in the industry, as well as its financial condition and results of operation.
Recent Accounting Pronouncements
In December 2011, the FASB issued Accounting Standards Update (“ASU”) ASU 2011-11,Disclosures About Offsetting Assets and Liabilities. The amendments in ASU 2011-11 require entities to disclose information about offsetting and related arrangements to enable users of financial statements to understand the effect of those arrangements on an entity’s financial position. The amendments require enhanced disclosures by requiring improved information about financial instruments and derivative instruments that are either (i) offset in accordance with current literature or (2) subject to an enforceable master netting arrangement or similar agreement, irrespective of whether they are offset in accordance with current literature. ASU 2011-11 is effective for fiscal years, and interim periods within those years, beginning on or after January 1, 2013. The Company is currently evaluating the impact of its pending adoption of ASU 2011-11 on our financial statements.
In September 2011, the FASB issued ASU 2011-08,Intangibles- Goodwill and Other (Topic 350)-Testing Goodwill for Impairment. ASU 2011-08 allows entities to use a qualitative approach to test goodwill for impairment. ASU 2011-08 permits an entity to first perform a qualitative assessment to determine whether it is more likely than not that the fair value of a reporting unit is less than its carrying value. If it is concluded that this is the case, it is necessary to perform the currently prescribed two-step goodwill impairment test. Otherwise, the two-step goodwill impairment test is not required. ASU 2011-08 is effective for us in fiscal 2013 and earlier adoption is permitted. The Company is currently evaluating the impact of its pending adoption of ASU 2011-08 on our financial statements.
In June 2011, the FASB issued ASU No. 2011-05,Comprehensive Income (ASC Topic 220): Presentation of Comprehensive Income.ASU 2011-05 amends current comprehensive income guidance. This accounting update eliminates the option to present the components of other comprehensive income as part of the statement of stockholders’ equity. Instead, entities must report comprehensive income in either a single continuous statement of comprehensive income which contains two sections, net income and other comprehensive income, or in two separate but consecutive statements. In December 2011, the FASB issued ASU 2011-12,Comprehensive Income (Topic 220): Deferral of the Effective Date for Amendments to the Presentation of Reclassifications of Items Out of Accumulated Other Comprehensive Income in ASU 2011-05, to defer the effective date of the specific requirement to present items that are reclassified out of accumulated other comprehensive income to net income alongside their respective components of net income and other comprehensive income. All other provisions of this update, which are to be applied retrospectively, are effective for fiscal years, and interim periods within those years, beginning after December 15, 2011. The Company does not expect the adoption of ASU 2011-05 to have a material impact on our financial statements as it only requires a change in the format of our current presentation.
In April 2011, the FASB issued ASU 2011-02,Receivables: A Creditor’s Determination of Whether a Restructuring is a Troubled Debt Restructuring.ASU 2011-02 provides guidance on whether a restructuring constitutes a troubled debt restructuring. For public entities, the ASU was effective for the first interim or annual period beginning on or after June 15, 2011, and should be applied retrospectively to the beginning of the annual period of adoption. For purposes of measuring impairment of those receivables, an entity should apply the
64
IRIS INTERNATIONAL, INC.
NOTES TO CONSOLIDATED FINANCIAL STATEMENTS — Continued
amendments prospectively for the first interim or annual period beginning on or after June 15, 2011. For nonpublic entities, the ASU is effective for annual periods ending on or after December 15, 2012, including interim periods within those annual periods. Early adoption is permitted. The adoption of ASU 2011-02 did not have a material impact on the Company’s financial statements.
In December 2010, the FASB issued ASU 2010-29,Business Combinations- Disclosure of Supplementary Pro Forma Information, which specifies that if a public entity presents comparative financial statements, the entity should disclose revenue and earnings of the combined entity as though the business combination(s) that occurred during the current year had occurred as of the beginning of the comparable prior annual reporting period only. ASU 2010-29 was effective on a prospective basis for business combinations for which the acquisition date is on or after the beginning of the first annual reporting period beginning on or after December 15, 2010 with early adoption permitted. The adoption of ASU 2010-29 did not have a material impact on the Company’s financial statements.
In December 2010, the FASB issued ASU No. 2010-28 — When to Perform Step 2 of the Goodwill Impairment Test for Reporting Units with Zero or Negative Carrying Amounts. This update provides amendments to ASC Topic 350 — Intangibles, Goodwill and Other that requires an entity to perform Step 2 impairment test even if a reporting unit has zero or negative carrying amount. Step 1 tests whether the carrying amount of a reporting unit exceeds its fair value. Previously reporting units with zero or negative carrying value passed Step 1 because the fair value was generally greater than zero. Step 2 requires impairment testing and impairment valuation be calculated in between annual tests if an event or circumstances indicate that it is more likely than not that goodwill has been impaired. ASU 2010-28 was effective beginning January 1, 2011. As a result of this standard, goodwill impairments may be reported sooner than under current practice. The adoption of ASU 2010-28 did not have a material impact on the Company’s financial statements.
In April 2010, the FASB issued ASU 2010-17, Milestone Method of Revenue Recognition, provides guidance on defining a milestone and determining when it may be appropriate to apply the milestone method of revenue recognition for research and development transactions. It was effective on a prospective basis for milestones achieved in fiscal years, and interim periods within those years, beginning on or after June 15, 2010. Early adoption is permitted. The adoption of the ASU 2010-17 did not have a material impact on the Company’s consolidated financial statements.
In October 2009, the FASB issued ASU 2009-14,Certain Revenue Arrangements That Include Software Elements, now codified under FASB ASC Topic 985,Software. ASU 2009-14, removes tangible products from the scope of software revenue guidance and provides guidance on determining whether software deliverables in an arrangement that includes a tangible product are covered by the scope of the software revenue guidance. ASU 2009-14 was to be applied on a prospective basis for revenue arrangements entered into or materially modified in fiscal years beginning on or after June 15, 2010, with early adoption permitted. The adoption of the ASU 2009-14 did not have a material impact on the Company’s consolidated financial statements.
In October 2009, the FASB issued ASU 2009-13, Multiple-Deliverable Revenue Arrangements, which amends ASC Topic 605,Revenue Recognition, to require companies to allocate revenue in multiple-element arrangements based on an element’s estimated selling price if vendor-specific or other third-party evidence of value is not available. ASU 2009-13 was effective for fiscal years beginning on or after June 15, 2010. Earlier application is permitted. The adoption of ASU 2009-13 did not have a material impact on the Company’s consolidated financial statements.
3. Acquisitions
On January 1, 2010, the Company purchased certain assets relating to its current distribution of IRIS products in the United Kingdom, Ireland and Germany from one of the Company’s European distributors for a cash payment of $660,000. The assets purchased consist primarily of customer leases for installed IRIS
65
IRIS INTERNATIONAL, INC.
NOTES TO CONSOLIDATED FINANCIAL STATEMENTS — Continued
instruments and service contracts valued at inventory book value. This purchase increased the Company’s direct sales presence within its international sales channels, and will serve as a template for further potential transactions in territories that represent new business opportunities for the Company.
On July 28, 2010, the Company acquired AlliedPath, Inc., a high complexity CLIA-certified molecular pathology laboratory. Pursuant to the terms of the merger agreement dated July 26, 2010, the Company acquired all the issued and outstanding stock of AlliedPath for an amount in cash equal to $4.6 million less certain indebtedness existing at the closing, with an additional earn-out of up to $1.3 million subject to the achievement of specific sales and earnings targets through December 2013. Subsequently, the fair value of the earnout obligation was deemed to be zero. We did not assume any outstanding options or warrants of AlliedPath in connection with the acquisition. AlliedPath is now called Arista Molecular, Inc. (“Arista”) and is reported under the Personalized Medicine reporting segment of the consolidated financial statements
The aggregate consideration paid for the acquisition of Arista is as follows:
| | | | |
| | | (In thousands) | |
Cash | | $ | 4,584 | |
Fair value of contingent consideration | | | 1,210 | |
| | | | |
Total purchase price | | $ | 5,794 | |
| | | | |
The aggregate consideration shown above reflects a $46,000 return of purchase price recorded during the year ended December 31, 2011.
The following table summarizes the estimated fair values of assets acquired and liabilities assumed as of July 28, 2010.
| | | | |
| | | (In thousands) | |
Current assets | | $ | 74 | |
Property and equipment | | | 523 | |
Core technology | | | 3,090 | |
CLIA License | | | 1,604 | |
Customer relationships | | | 6 | |
Non-compete agreements | | | 100 | |
Goodwill | | | 1,461 | |
Other assets | | | 31 | |
Current liabilities | | | (316 | ) |
Lease obligations | | | (178 | ) |
Other liabilities | | | (61 | ) |
Deferred tax liability, net | | | (540 | ) |
| | | | |
Total purchase price | | $ | 5,794 | |
| | | | |
In determining the purchase price allocation, the Company considered, among other factors, historical demand for products, estimates of future demand for those services, customer relationships, the revenue generating potential of core technology, the assets’ useful lives, and agreements not to compete. The market, income and cost approaches were used to determine fair values of these intangibles. The rate used to discount the net cash flows to their present value was a 16.5% weighted average cost of capital for the business as a whole, and from 16.5% to 17.5% for the individual intangible assets depending on the risk associated with the asset’s potential to generate revenues and its projected remaining useful economic life. The weighted average cost of capital was determined after consideration of market rates of return on debt and equity capital of comparable
66
IRIS INTERNATIONAL, INC.
NOTES TO CONSOLIDATED FINANCIAL STATEMENTS — Continued
companies, the weighted average return on invested capital and the risk associated with achieving forecasted sales related to technology and assets acquired. The fair value of the contingent consideration was determined considering the probability of payout and using a 3% discount rate. Property and equipment net book value was evaluated at approximately fair value on the acquisition date due to the nature and relative age of the assets acquired.
Subsequent changes in the fair value of the contingent consideration are recognized as a gain or loss on revaluation of contingent consideration within operating expenses in the Company’s consolidated statement of operations. The Company considers the changes in the fair value of contingent consideration obligation at each reporting date based on changes in discount rates, timing and amount of revenue estimates and changes in probability assumptions with respect to the probability of achieving the obligations. Accretion expense related to the increase in net present value of the contingent liability is included in interest expense for the period. As a result of significant revenue shortfalls at Arista relative to previous projections for the three months ended March 31, 2011, sales projections for Arista were significantly reduced for all future periods and well below the earn-out targets for all three years covered by the earn-out period. Management thus determined that the fair value contingent consideration obligation was zero, which resulted in a decrease in the obligation of $1.2 million from December 31, 2010 to March 31, 2011. Consequently the Company recognized a gain on revaluation of contingent consideration for the year ended December 31, 2011 (recorded in March 2011). As of December 31, 2011, the fair value of the contingent consideration remained zero.
Property and equipment net book value was evaluated at approximately fair value on the acquisition date due to the nature and relative age of the assets acquired.
Acquired property and equipment are depreciated on a straight-line basis with estimated remaining useful lives ranging from 1 year to 5 years. Intangible assets except the CLIA license are being amortized on a straight-line basis with estimated remaining useful lives ranging from 3 years to 15 years reflecting the expected future value. The CLIA license is considered to have an indefinite useful life. The purchase was structured as a stock purchase therefore the value assigned to the core technology, CLIA license, customers relationships, non-compete agreements and goodwill is not deductible for tax purposes. See Note 4 — “Restructuring and Impairment of Assets” below.
The following table summarizes unaudited pro forma financial information assuming the acquisition of Arista had occurred on January 1, 2009 (the corresponding period of the fiscal year immediately preceding the acquisition). This unaudited pro forma financial information does not necessarily represent what would have occurred if the transaction had taken place on January 1, 2009 and should not be taken as representative of the Company’s future consolidated results of operations or financial position.
| | | | | | | | |
| | | For the Year
Ended December 31,
2010 | | | For the Year
Ended December 31,
2009 | |
| | | (In thousands) | |
Revenue | | $ | 107,702 | | | $ | 92,570 | |
Net income | | $ | 1,348 | | | $ | 3,803 | |
Net income per basic share | | $ | 0.08 | | | $ | 0.21 | |
Net income per diluted share | | $ | 0.07 | | | $ | 0.21 | |
On November 22, 2010, the Company acquired the assets of a multi-purpose, bench-top instrument platform for automating highly repetitive, manual laboratory protocols for FISH (fluorescence in-situ hybridization) testing and other slide-based cytogenetic applications. The product acquisition is a natural extension to the successful ThermoBrite® DNA Hybridization System and in line with the Company’s entry into personalized medicine with emphasis on cancer diagnostics. The product prototypes and proprietary technology assets were purchased for $3.2 million in cash from BioMicro Systems, Inc. The new product platform, now named ThermoBrite® Elite, has been integrated into the Iris Sample Processing Division and it is expected to position
67
IRIS INTERNATIONAL, INC.
NOTES TO CONSOLIDATED FINANCIAL STATEMENTS — Continued
IRIS as a major competitor in the high growth cytogenetic instrumentation market. This acquisition was recorded as an acquisition of assets determined not to be a business, since no workforce nor strategic management, operational or resource management processes were included in the purchase.
The purchase price of $3.2 million plus related asset acquisition costs of $94,000 was allocated as follows: $3.2 million to core technology, recorded in intangible assets, and $99,000 to property and equipment on the Company’s consolidated balance sheet as of December 31, 2011. Although BioMicro Systems built and tested working prototypes, several elements of this platform required further enhancement in order to improve reliability and serviceability. The useful life of the core technology is estimated at 20 years. Amortization is expected to begin with the initiation of product sale in 2012.
4. Restructuring and Impairment of Assets
In September 2011, the Company restructured its Personalized Medicine segment by downsizing and consolidating the molecular pathology laboratory operations of Arista Molecular, Inc., into Iris Molecular Diagnostics. The restructuring included personnel reduction as well as discontinuation of all non-proprietary testing services at the laboratory, the closure of Arista’s San Diego, CA laboratory facility and the relocation of the proprietary testing services to a downsized laboratory operation in Iris Molecular Diagnostics’ facility in Carlsbad, CA. Arista retained all licenses and high-complexity CLIA laboratory capabilities, as well as limited personnel to perform tests based on the Company’s NADiA platform and other proprietary technology, starting with NADiA ProsVue which attained FDA clearance on September 22, 2011.
The Company also restructured the research and development department within IDD to realign the department’s technical core competencies with the product pipeline in development. The total personnel reduction at Arista and IDD resulted in a reduction of approximately 10% of the total workforce of the Company.
The Company incurred restructuring costs of $1.6 million in 2011, substantially all of which cash expenditures consisting of severance and other employment termination costs of $0.7 million and contract termination and other associated costs of $0.9 million. The restructuring was completed on September 30, 2011. The restructuring expenses are presented as a separate line item under operating expenses in the Company’s consolidated statement of operations for the year ended December 31, 2011. Restructuring expenses of $1.6 million consist of $1.3 million related to the Personalized Medicine segment and $0.3 million related to the IDD segment.
As of December 31, 2011, the following table represents the details of the restructuring expenses:
| | | | | | | | | | | | |
| | | Severance
and other
termination
costs | | | Contract
termination
and other
costs | | | Total | |
| | | (In thousands) | |
Charges and adjustments to expense | | $ | 693 | | | $ | 868 | | | $ | 1,561 | |
Cash payments | | | (643 | ) | | | (597 | ) | | | (1,240 | ) |
Non-cash adjustments | | | — | | | | — | | | | — | |
| | | | | | | | | | | | |
Accrual at December 31, 2011 | | $ | 50 | | | $ | 271 | | | $ | 321 | |
| | | | | | | | | | | | |
The remaining balance at December 31, 2011 is included in accrued liabilities. The Company expects to pay accrued severance and other termination costs through 2012 and contract termination (consisting primarily of equipment leases) and other costs under contract through 2013.
In accordance with accounting guidance for costs associated with asset exit or disposal activities, restructuring costs are recorded as incurred. Restructuring charges for employee workforce reductions were recorded upon employee notification.
68
IRIS INTERNATIONAL, INC.
NOTES TO CONSOLIDATED FINANCIAL STATEMENTS — Continued
Furthermore, in connection with the restructuring of Arista, we incurred approximately $5.8 million of asset write-downs and impairment charges. The non-proprietary testing services which were discontinued represent the Arista business which was acquired in 2010 (see Note 3, Acquisition). Therefore, since the acquired non-proprietary laboratory business ceased operating, the entire balance of $1.5 million of goodwill and the remaining unamortized balance of $2.9 million of core technology, customer relationships and non-compete agreements arising from the acquisition of Arista were written down to zero as of December 31, 2011. Write-downs of property and equipment associated with the downsizing of Arista’s laboratory facility totaled $1.5 million. The asset write-downs and impairment charges are recorded as impairment of assets in the Company’s consolidated statements of operations for the year ended December 31, 2011. The entire amount of asset write-downs and impairment charges is reported in the Personalized Medicine segment.
The CLIA license arising from the acquisition of AlliedPath will be utilized to perform tests based on the Company’s proprietary platforms. The carrying value of the CLIA license is $1.6 million as of December 31, 2011. Based on projections for NADiA as of December 31, 2011, the estimated fair value (determined based on discounted cash flows) exceeds the carrying amount of the CLIA license. Thus, the CLIA license is not impaired.
5. Inventories
Inventories consist of the following:
| | | | | | | | |
| | | At December 31, | |
| | | 2011 | | | 2010 | |
| | | (In thousands) | |
Finished goods | | $ | 2,326 | | | $ | 3,423 | |
Work-in-process | | | 35 | | | | 181 | |
Raw materials, parts and sub-assemblies | | | 8,211 | | | | 6,706 | |
| | | | | | | | |
Inventories | | $ | 10,572 | | | $ | 10,310 | |
| | | | | | | | |
6. Property and Equipment
Property and equipment consist of the following:
| | | | | | | | |
| | | At December 31, | |
| | | 2011 | | | 2010 | |
| | | (In thousands) | |
Machinery and equipment | | $ | 10,288 | | | $ | 13,894 | |
Leasehold improvements | | | 9,449 | | | | 8,021 | |
Computer hardware | | | 4,321 | | | | — | |
Computer software and licenses | | | 1,185 | | | | — | |
Tooling, dies and molds | | | 2,270 | | | | 1,224 | |
Furniture and fixtures | | | 1,464 | | | | 2,088 | |
Rental units | | | 1,822 | | | | 1,299 | |
| | | | | | | | |
| | | 30,799 | | | | 26,526 | |
Less: accumulated depreciation | | | (17,425 | ) | | | (14,491 | ) |
| | | | | | | | |
| | $ | 13,374 | | | $ | 12,035 | |
| | | | | | | | |
Depreciation expense for Property and Equipment, for the years ended December 31, 2011, 2010 and 2009 was $4.2 million, $3.3 million, and $2.8 million, respectively.
69
IRIS INTERNATIONAL, INC.
NOTES TO CONSOLIDATED FINANCIAL STATEMENTS — Continued
7. Sales-type Leases
The components of net investment in sales-type leases consist of the following:
| | | | | | | | |
| | | At December 31, | |
| | | 2011 | | | 2010 | |
| | | (In thousands) | |
Total minimum lease payments | | $ | 18,530 | | | $ | 16,044 | |
Less: unearned income | | | (2,622 | ) | | | (2,464 | ) |
| | | | | | | | |
Net investment in sales-type leases | | | 15,908 | | | | 13,580 | |
Less: current portion | | | (4,109 | ) | | | (3,578 | ) |
| | | | | | | | |
Net investment in sales-type leases, non-current portion | | $ | 11,799 | | | $ | 10,002 | |
| | | | | | | | |
Future minimum lease payments due from customers under sales-type leases for each of the five succeeding years and thereafter:
| | | | |
| | | (In thousands) | |
Year Ending December 31, | | | | |
2012 | | $ | 4,109 | |
2013 | | | 3,856 | |
2014 | | | 3,557 | |
2015 | | | 2,815 | |
2016 | | | 1,370 | |
Thereafter | | | 201 | |
| | | | |
| | $ | 15,908 | |
| | | | |
Our leases are primarily to customers in the health care industry or to governments. We assess credit risk for all of our customers including those who lease equipment. Credit risk is assessed using an internally developed model which incorporates credit scores from third party providers and our own custom risk ratings and is updated on a quarterly basis. The external credit scores are developed based on the customer’s historical payment patterns and an overall assessment of the likelihood of delinquent payments. Our internal ratings are weighted based on company size, years in business, and other credit related factors (i.e. profitability, cash flow, liquidity, tangible net worth, etc.). Any one of the following factors may result in a customer being classified as high risk: i) the customer has a history of late payments; ii) the customer has open lawsuits, liens or judgments; and iii) the customer has been in business less than three years. Our lease receivables are collateralized by the equipment’s fair value, which mitigates our credit risk. The following table presents the risk profile by creditworthiness category of our sales-type lease receivables at December 31, 2011:
| | | | |
| | | (unaudited) | |
| | | (In thousands) | |
Low risk | | $ | 14,596 | |
Moderate risk | | | 742 | |
High Risk | | | 570 | |
| | | | |
| | $ | 15,908 | |
| | | | |
The balance of the allowance for uncollectible accounts for our sales-type leases was zero as of December 31, 2011. We determine the adequacy of our allowance for uncollectible accounts for sales-type leases based on an analysis of historical write-offs. There have been no write-offs of sales-type lease receivables for the years ended December 31, 2011, 2010 or 2009. As of December 31, 2011, the amount of sales-type leases which
70
IRIS INTERNATIONAL, INC.
NOTES TO CONSOLIDATED FINANCIAL STATEMENTS — Continued
were past due was not significant and there were no impaired sales-type leases. Accordingly, there was no material risk of default with respect to sales-type leases as of December 31, 2011.
8. Bank Credit Facility
On July 27, 2011, the Company entered into a new credit facility with JPMorgan Chase Bank, N.A., as administrative agent for certain lenders. The credit facility provides for borrowings of up to $15 million pursuant to revolving loans, acquired participations in letters of credit and swingline loans. The Company has not borrowed any amounts under the credit facility. All amounts under the revolving loans become due and payable on July 31, 2013. The credit facility has variable interest rates based on changes to either the applicable LIBOR rate or the lender’s prime rate. Interest is generally payable monthly in arrears. The Company’s obligations under this credit facility are secured by a lien on substantially all of the Company’s assets and those of its domestic subsidiaries. The credit facility contains affirmative and negative covenants, including financial covenants and limitations on additional indebtedness, and customary default provisions that provide that all outstanding obligations under the facility may become immediately due and payable in the event of the Company’s default.
On July 22, 2011, the Company terminated its previous credit facility with another commercial bank. This facility consisted of a $6.5 million revolving line of credit for working capital and a $10.0 million line of credit for acquisitions and product opportunities. This credit facility had variable interest rates based on changes to either the LIBOR rate or the lender’s prime rate. Borrowings under the credit facility were secured by all of the Company’s assets and were scheduled to mature in June 2012 and June 2015, respectively.
As of December 31, 2011 and 2010, there were no borrowings under either the new or previous credit facility. The Company, however, is subject to certain financial and non-financial covenants under the new credit facility and as of December 31, 2011, the Company was in compliance with these covenants.
9. Accrued Expenses
Accrued expenses consist of the following:
| | | | | | | | |
| | | At December 31, | |
| | | 2011 | | | 2010 | |
| | | (In thousands) | |
Accrued bonuses | | $ | 3,490 | | | $ | 1,762 | |
Accrued commissions | | | 984 | | | | 824 | |
Accrued payroll | | | 1,125 | | | | 1,059 | |
Accrued vacation | | | 1,854 | | | | 1,624 | |
Accrued professional fees | | | 895 | | | | 499 | |
Accrued warranty | | | 778 | | | | 705 | |
Accrued laboratory information system implementations | | | 570 | | | | 487 | |
Accrued restructuring expense | | | 320 | | | | — | |
Accrued employee relocation expense | | | 546 | | | | 375 | |
Accrued taxes and other | | | 1,960 | | | | 178 | |
| | | | | | | | |
| | $ | 12,522 | | | $ | 7,513 | |
| | | | | | | | |
71
IRIS INTERNATIONAL, INC.
NOTES TO CONSOLIDATED FINANCIAL STATEMENTS — Continued
Changes in accrued warranty were as follows:
| | | | | | | | |
| | | At December 31, | |
| | | 2011 | | | 2010 | |
| | | (In thousands) | |
Balance — beginning of year | | $ | 705 | | | $ | 946 | |
Additions for provisions during year | | | 899 | | | | 797 | |
Reductions during year | | | (826 | ) | | | (1,038 | ) |
| | | | | | | | |
Balance — end of year | | $ | 778 | | | $ | 705 | |
| | | | | | | | |
10. Income Taxes
The provision for income taxes from operations consists of the following:
| | | | | | | | | | | | |
| | | For the Years Ended
December 31, | |
| | | 2011 | | | 2010 | | | 2009 | |
| | | (In thousands) | |
Current: | | | | | | | | | | | | |
Federal | | $ | 159 | | | $ | 514 | | | $ | 1,879 | |
Foreign | | | 75 | | | | 63 | | | | — | |
State | | | 389 | | | | 665 | | | | 757 | |
| | | | | | | | | | | | |
| | | 623 | | | | 1,242 | | | | 2,636 | |
| | | | | | | | | | | | |
Deferred: | | | | | | | | | | | | |
Federal | | | (1,467 | ) | | | 243 | | | | 364 | |
Foreign | | | 242 | | | | 170 | | | | (32 | ) |
State | | | (1,272 | ) | | | (567 | ) | | | (514 | ) |
| | | | | | | | | | | | |
| | | (2,497 | ) | | | (154 | ) | | | (182 | ) |
| | | | | | | | | | | | |
| | $ | (1,874 | ) | | $ | 1,088 | | | $ | 2,454 | |
| | | | | | | | | | | | |
Income taxes have been based on the following components of pre-tax income (loss):
| | | | | | | | | | | | |
| | | For the Years Ended December 31, | |
| | | 2011 | | | 2010 | | | 2009 | |
| | | (In thousands) | |
Domestic | | $ | (4,002 | ) | | $ | 3,541 | | | $ | 8,821 | |
Foreign | | | 934 | | | | 589 | | | | (116 | ) |
| | | | | | | | | | | | |
| | $ | (3,068 | ) | | $ | 4,130 | | | $ | 8,705 | |
| | | | | | | | | | | | |
72
IRIS INTERNATIONAL, INC.
NOTES TO CONSOLIDATED FINANCIAL STATEMENTS — Continued
The provision for income taxes differs from the amount obtained by applying the federal statutory income tax rate to income (loss) before provision for income taxes as follows:
| | | | | | | | | | | | |
| | | For the Years Ended
December 31, | |
| | | 2011 | | | 2010 | | | 2009 | |
| | | (In thousands) | |
Tax provision (benefit) computed at federal statutory rate | | $ | (1,043 | ) | | $ | 1,404 | | | $ | 2,960 | |
State taxes, net of federal benefit | | | (129 | ) | | | 252 | | | | 544 | |
Tax credits | | | (953 | ) | | | (790 | ) | | | (258 | ) |
Incentive stock options | | | 282 | | | | 293 | | | | 303 | |
Nondeductible expenses | | | 94 | | | | 72 | | | | (83 | ) |
Change in valuation allowance | | | (188 | ) | | | (45 | ) | | | (269 | ) |
Rate differential on foreign income | | | (3 | ) | | | (9 | ) | | | (32 | ) |
Prior year return to provision adjustment | | | 241 | | | | (61 | ) | | | (772 | ) |
California hiring tax credit | | | (50 | ) | | | — | | | | — | |
California sales & use tax credit | | | (129 | ) | | | — | | | | — | |
Other | | | 4 | | | | (28 | ) | | | 61 | |
| | | | | | | | | | | | |
| | $ | (1,874 | ) | | $ | 1,088 | | | $ | 2,454 | |
| | | | | | | | | | | | |
The primary components of temporary differences, which give rise to the Company’s net deferred tax asset at December 31, 2011 and 2010, are as follows:
| | | | | | | | |
| | | At December 31, | |
| | | 2011 | | | 2010 | |
| | | (In thousands) | |
Depreciation and amortization | | $ | (965 | ) | | $ | (2,738 | ) |
Allowance for doubtful accounts | | | 258 | | | | 187 | |
Prepaid Expenses | | | (450 | ) | | | — | |
Accrued liabilities | | | 1,719 | | | | 1,382 | |
Inventory | | | 127 | | | | 145 | |
Stock compensation | | | 2,456 | | | | 2,132 | |
Gain/Loss on foreign currency | | | 15 | | | | — | |
Net operating loss carryforwards | | | 2,498 | | | | 2,740 | |
Tax credits | | | 4,644 | | | | 3,603 | |
Valuation allowance | | | (410 | ) | | | (598 | ) |
State deferred taxes | | | (1,645 | ) | | | (1,103 | ) |
| | | | | | | | |
| | $ | 8,247 | | | $ | 5,750 | |
| | | | | | | | |
As of December 31, 2011, withholding and U.S. taxes have not been provided on approximately $200,000 of cumulative undistributed earnings of the Company’s non-U.S. subsidiaries because the Company intends to indefinitely reinvest these earnings in its non-U.S. subsidiaries.
At December 31, 2011, the Company has Federal, state and foreign net operating loss carryforwards of approximately $5.2 million, $4.0 million, and $1.2 million, respectively expiring beginning in 2011 through 2030. The federal and state net operating loss carryforwards are subject to limitations on their utilization. The Company also has federal and state tax credit carryforwards of $910,000 and $3.7 million, respectively, net of valuation allowances.
73
IRIS INTERNATIONAL, INC.
NOTES TO CONSOLIDATED FINANCIAL STATEMENTS — Continued
Realization of deferred tax assets associated with foreign net operating losses (“NOL”) and tax credit carryforwards is dependent upon the Company’s ability to generate sufficient taxable income prior to their expiration. Management believes it is more likely than not that the deferred tax assets will be realized through future taxable income or alternative tax strategies. However, the net deferred tax assets could be reduced in the near term if management’s estimates of taxable income during the carryforward period are not realized or are significantly reduced or alternative tax strategies are not available. During 2011, the Company reduced the valuation allowance related to Arista’s NOLs by $188,000.
The Company adopted the provisions of FASB ASC Topic 740-10,Income Taxes, which requires that the Company recognize the impact of a tax position in its financial statements if that position is more likely than not of being sustained upon audit, based on the technical merits of the position.
The Company files income tax returns in the U.S. federal jurisdiction and various state and foreign jurisdictions. In general, the U.S. federal statute for the assessment of taxes for the Company is no longer open for tax years prior to 2007 and for state income tax purposes for tax years prior to 2006. The Company is currently under examination in the U.S. by the Internal Revenue Service which is examining the 2010 federal income tax return and in Germany which is examining the Company’s 2006 through 2009 income tax returns. The Company does not believe any additional taxes will be due in connection with the examinations.
The following changes occurred in the amount of unrecognized tax benefits (including related interest and penalties) during the years ended December 31, 2011, 2010 and 2009 as follows:
| | | | | | | | | | | | |
| | | For the Years Ended
December 31, | |
| | | 2011 | | | 2010 | | | 2009 | |
| | | (In thousands) | |
Balance at January 31 | | $ | 1,908 | | | $ | 1,282 | | | $ | 998 | |
Additions for current year tax positions | | | 494 | | | | 626 | | | | 284 | |
| | | | | | | | | | | | |
Balance at December 31 | | $ | 2,402 | | | $ | 1,908 | | | $ | 1,282 | |
| | | | | | | | | | | | |
The Company does not expect any reduction to the unrecognized tax benefits in the next twelve months.
Currently, there are no amounts of interest or penalties recorded in the financial statements as the unrecognized tax benefits relate to deferred tax assets. The Company will recognize potential interest and penalties related to income tax positions as a component of the provision for income taxes on the consolidated statements of operations in any future periods in which the Company must record a liability.
11. Stock-Based Compensation
The Company accounts for stock-based compensation pursuant to FASB Topic 505,Share-Based Payment, which requires compensation costs related to share-based transactions, including employee stock options, to be recognized in the financial statements based on fair value. Share-based compensation expense for the years ended December 31, 2011, 2010 and 2009 is as follows:
| | | | | | | | | | | | |
| | | For the Years Ended
December 31, | |
| | | 2011 | | | 2010 | | | 2009 | |
| | | (In thousands) | |
Cost of revenue | | $ | 308 | | | $ | 357 | | | $ | 417 | |
Marketing and selling | | | 564 | | | | 688 | | | | 631 | |
General and administrative | | | 2,179 | | | | 2,233 | | | | 2,026 | |
Research and development | | | 834 | | | | 879 | | | | 655 | |
| | | | | | | | | | | | |
Stock-based compensation | | $ | 3,885 | | | $ | 4,157 | | | $ | 3,729 | |
| | | | | | | | | | | | |
74
IRIS INTERNATIONAL, INC.
NOTES TO CONSOLIDATED FINANCIAL STATEMENTS — Continued
Stock Options
The Company has a stock option plan (the 2007 Stock Incentive Plan) under which the Company may grant future non-qualified stock options, incentive stock options and stock appreciation rights. No stock appreciation rights have been granted under any of the Company’s stock option plans. On July 13, 2007, the Company’s stockholders approved the adoption of the IRIS International, Inc. 2007 Stock Incentive Plan, which authorizes the issuance of up to 1,750,000 shares of common stock pursuant to equity awards granted under the plan. On May 22, 2009, the Company’s stockholders approved an increase of 1,550,000 shares to the 2007 Stock Incentive Plan for a total of 3,300,000 authorized shares.
In addition to the 2007 Stock Incentive Plan, on June 6, 2011, the Company’s board of directors adopted the IRIS International, Inc. 2011 Inducement Incentive Plan (the “2011 Inducement Plan”). The plan provides for the grant of equity-based awards in the form of stock options, restricted common stock, restricted stock units, stock appreciation rights and other stock-based awards solely to “New Employees” as an inducement material to the New Employee’s entering into employment with the Company or any of its subsidiaries within the meaning of Listing Rule 5635(c)(4) (or any successor thereto) of The NASDAQ Stock Market. For purposes of the 2011 Inducement Plan, a “New Employee” means any prospective employee of IRIS International or any of its subsidiaries who either (i) was not previously an employee or director of IRIS International or any of our subsidiaries or (ii) was previously an employee or director of IRIS International or any of its subsidiaries but for which there has occurred a bona fide period of non-employment.
The maximum number of shares available for grant under the 2011 Inducement Plan is 250,000 shares of common stock, which number of shares is subject to adjustment for certain corporate changes, as provided in the plan. The plan expires on September 30, 2013. The plan is administered by the Compensation Committee of the Company’s Board. As of December 31, 2011, 17,417 shares have been granted under the 2011 Inducement Plan.
The Company previously had other expired stock option plans which have remaining outstanding shares.
The following schedule sets forth options authorized, exercised, outstanding and available for grant under the Company’s existing stock option plans as of December 31, 2011:
| | | | | | | | | | | | | | | | |
| | | Number of Option Shares | |
Plan | | Authorized | | | Exercised | | | Outstanding | | | Available
for Grant | |
| | | (In thousands) | |
1994 Plan | | | 700 | | | | 680 | | | | 20 | | | | — | |
1998 Plan | | | 4,100 | | | | 2,828 | | | | 468 | | | | — | |
2007 Plan | | | 3,300 | | | | 2 | | | | 1,944 | | | | 483 | |
2011 Plan | | | 250 | | | | — | | | | 12 | | | | 233 | |
| | | | | | | | | | | | | | | | |
| | | 8,350 | | | | 3,510 | | | | 2,444 | | | | 716 | |
| | | | | | | | | | | | | | | | |
75
IRIS INTERNATIONAL, INC.
NOTES TO CONSOLIDATED FINANCIAL STATEMENTS — Continued
The following table sets forth certain information relative to stock options during the three years ended December 31, 2011.
| | | | | | | | | | | | |
| | | Shares | | | Weighted Average
Exercise Price | | | Average
Intrinsic Value | |
| | | (In thousands, except for per share) | |
Outstanding at January 1, 2009 | | | 1,974 | | | $ | 13.24 | | | | | |
Granted | | | 571 | | | $ | 9.02 | | | | | |
Exercised | | | (197 | ) | | $ | 7.34 | | | | | |
Canceled or expired | | | (143 | ) | | $ | 13.10 | | | | | |
| | | | | | | | | | | | |
Outstanding at December 31, 2009 | | | 2,205 | | | $ | 12.97 | | | | | |
Granted | | | 827 | | | $ | 10.74 | | | | | |
Exercised | | | (22 | ) | | $ | 1.44 | | | | | |
Canceled or expired | | | (241 | ) | | $ | 14.52 | | | | | |
| | | | | | | | | | | | |
Outstanding at December 31, 2010 | | | 2,769 | | | $ | 12.26 | | | | | |
Granted | | | 284 | | | $ | 9.80 | | | | | |
Exercised | | | (113 | ) | | $ | 2.61 | | | | | |
Canceled or expired | | | (496 | ) | | $ | 15.39 | | | | | |
| | | | | | | | | | | | |
Outstanding at December 31, 2011 average remaining
life — 3.9 years | | | 2,444 | | | $ | 11.78 | | | $ | 283 | |
Exercisable at December 31, 2011, average remaining
life — 3.3 years | | | 1,684 | | | $ | 12.42 | | | $ | 262 | |
The weighted average grant-date fair value of options granted during the years ended December 31, 2011, 2010 and 2009 was $4.06, $5.14, and $4.91, respectively. The intrinsic value of options exercised during the years ended December 31, 2011, 2010 and 2009 was $769,000, $201,000, and $729,000, respectively. Of the total outstanding stock options shown above, 930,000, 1,068,000, and 790,000 were incentive stock options as of December 31, 2011, 2010 and 2009, respectively.
The aggregate intrinsic value in the table above represents the total pretax intrinsic value (the difference between the Company’s closing stock price on December 31, 2011 and the exercise price, multiplied by the number of in-the-money options) that would have been received by the option holders, had all option holders exercised their options on December 31, 2011. As of December 31, 2011, total unrecognized stock-based compensation expense related to nonvested stock options was $3,014,000, which is expected to be recognized over the remaining weighted average period of approximately 2.5 years.
The Compensation Committee of the board of directors determines the stock based compensation grants. The exercise price of options is the closing price on the date the options are granted. Payment of the exercise price may be made either in cash or with shares of common stock that have been held at least six months. The options generally vest over four years and expire between five or ten years from the date of grant. The fair value of each option grant is estimated on the date of the grant using the Black-Scholes option-pricing model with the following weighted average assumptions:
| | | | | | | | | | | | |
| | | For the Years Ended
December 31, | |
| | | 2011 | | | 2010 | | | 2009 | |
| | | (In thousands) | |
Risk free interest rate | | | 1.72 | % | | | 1.75 | % | | | 2.0 | % |
Expected lives (years) | | | 4.08 | | | | 4.35 | | | | 4.0 | |
Expected volatility | | | 50.95 | % | | | 56.57 | % | | | 60.5 | % |
Expected dividend yield | | | — | | | | — | | | | — | |
76
IRIS INTERNATIONAL, INC.
NOTES TO CONSOLIDATED FINANCIAL STATEMENTS — Continued
The expected volatilities are based on the historical volatility of the Company’s stock. The observation is made on a weekly basis. The expected terms of the stock options are based on the average vesting period on a basis consistent with the historical experience for similar option grants. The risk-free interest rate is consistent with the expected terms of the stock options and based on the U.S. Treasury yield curve in effect at the time of grant. The Company estimates forfeiture rates based on historical data.
On December 12, 2011, the Company’s Chief Executive Officer exercised a stock option to purchase an aggregate of 86,105 shares of common stock with an exercise price of $2.60 per share, on a net issue basis, in a transaction approved by the compensation committee of the board of directors. The Company issued 39,647 shares of common stock to the Chief Executive Officer, and retained 46,458 shares of common stock with an aggregate market value of $442,745 based on the last closing price of the Company’s common stock immediately prior to exercise of $9.53 per share. The Company applied $223,873 in payment of the aggregate exercise price of the stock options and $218,872 was applied in payment of payroll taxes arising from the option exercise.
A summary of the Company’s non-vested stock options during the year ended December 31, 2011 is presented below:
| | | | | | | | |
| | | Shares | | | Weighted
Average
Grant Date
Fair Value | |
| | | (In thousands) | |
Non-vested options at January 1, 2011 | | | 1,127 | | | $ | 4.80 | |
Granted | | | 285 | | | $ | 4.06 | |
Vested | | | (498 | ) | | $ | 4.96 | |
Forfeited | | | (154 | ) | | $ | 4.15 | |
| | | | | | | | |
Non-vested options at December 31, 2011 | | | 760 | | | $ | 4.55 | |
| | | | | | | | |
As of December 31, 2011, there was approximately $3,014,000 of accumulated unrecognized stock compensation based on fair value on the grant date related to non-vested options granted under the stock option plans. That cost is expected to be recognized during the weighted average service period of 2.5 years. The share-based compensation will be amortized based on the straight line method over the vesting period and the expense includes an estimate of the awards that will be forfeited. The total fair value of shares vested during the year ended December 31, 2011 was $2,462,000.
Restricted Shares
The Company began awarding restricted shares of its common stock in 2006. In March 2009, the Company began to grant restricted stock units to its non-employee directors and to certain employees. Such awards generally require that certain performance conditions and service conditions be met before the awards vest. Restricted shares currently vest 25% after one year and 6 1/4% quarterly thereafter. Restricted stock units currently vest 25% after thirteen months and 6 1/4% quarterly thereafter. However, awards to non-employee directors are immediately vested on the grant date. Unvested restricted shares are forfeited if the recipient’s employment terminates for any reason other than death, disability, or special circumstances as determined by the
77
IRIS INTERNATIONAL, INC.
NOTES TO CONSOLIDATED FINANCIAL STATEMENTS — Continued
Compensation Committee of the Company’s board of directors. Restricted share and restricted stock unit activity during the year ended December 31, 2011 is as follows:
| | | | | | | | |
| | | Shares
and
Units | | | Weighted
Average Grant
Date Fair Value
Per Share | |
| | | (In thousands, except for per share) | |
Unvested at January 1, 2011 | | | 286 | | | $ | 10.89 | |
Granted | | | 209 | | | $ | 9.51 | |
Vested during period | | | (178 | ) | | $ | 10.42 | |
Cancelled during period | | | (52 | ) | | $ | 9.79 | |
| | | | | | | | |
Unvested at December 31, 2011 | | | 265 | | | $ | 10.33 | |
| | | | | | | | |
Fair value of the Company’s restricted shares and restricted stock units is based on the Company’s closing stock price on the date of grant. As of December 31, 2011, total unrecognized stock-based compensation expense related to nonvested restricted share grants was $2,495,000 which is expected to be recognized over the remaining weighted average period of approximately 2.6 years.
From time to time, the company retains shares of common stock from employees upon vesting of restricted shares and restricted stock units to cover income tax withholding. The impact of such withholding totaled $531,000, $315,000, and $179,000 for the years ended December 31, 2011, 2010 and 2009, respectively, and was recorded as settlement on restricted stock tax withholding in the accompanying consolidated statements of stockholders’ equity.
12. Capital Stock
At December 31, 2011, there were no warrants outstanding. During the year ended December 31, 2009, 24,016 warrants were exercised prior to their expiration.
13. Common Stock Repurchase Plan
In August 2010, the Company’s board of directors authorized a share repurchase and retirement plan of up to $10 million of the Company’s common stock over a 12-month period. During the year ended December 31, 2010, the Company repurchased 330,454 shares of common stock at an average price per share of approximately $9.10, for an aggregate amount of approximately $3.0 million.
In 2008, the Company’s board of directors authorized two stock repurchase plans. On March 3, 2008, the Company’s board of directors authorized the first share repurchase and retirement plan of up to $15 million of the Company’s common stock over a 12-month period. Under this first plan the Company repurchased 492,068 shares of common stock for approximately $5.7 million. On July 25, 2008, the Company’s board of directors terminated the first share repurchase and retirement plan.
On November 21, 2008, the Company’s board of directors authorized a second share repurchase and retirement plan of up to $10 million of the Company’s common stock over a 12-month period. During the year ended December 31, 2008, the Company repurchased 491,511 shares of common stock for approximately $6.2 million against this second authorization. During the year ended December 31, 2009, the Company repurchased an additional 250,800 shares of common stock for approximately $2.5 million. As of December 31, 2009, under this second repurchase plan, the Company had repurchased a cumulative total of 742,311 shares of common stock for approximately $8.7 million.
Cumulatively between the three plans mentioned above, the Company purchased a total of 1,564,833 shares of common stock for approximately $17.4 million in 2010, 2009 and 2008. No shares were repurchased during the year ended December 31, 2011.
78
IRIS INTERNATIONAL, INC.
NOTES TO CONSOLIDATED FINANCIAL STATEMENTS — Continued
14. Employee Benefits
All employees are also eligible to participate in a 401(k) Plan at the beginning of the first quarter following their employment start date. The Company’s contributions are discretionary. Effective January 1, 2006 the Company commenced matching $0.50 per $1.00 contributed by the employees up to 4% of the employee’s annual salary; prior to 2006, the Company’s practice was to match $0.25 per $1.00 contributed by the employees up to 4% of the employee’s annual salary. Employees vest in amounts contributed by the Company immediately. The Company contributed $479,000, $408,000, and $362,000 to the 401(k) Plan for the years ended December 31, 2011, 2010, and 2009, respectively.
15. Joint Development Agreement
On March 25, 2011, the Company entered into a Joint Development Agreement with Fujirebio Inc., one of the largest in-vitro diagnostics companies in Japan, for the co-development of the 3GEMS Hematology Analyzer product line.
Terms of the agreement call for Fujirebio to contribute $6.0 million toward the costs of the joint development program, with an initial payment of $500,000 upon signing of the agreement in March 2011 and the balance to be paid in installments during the course of the development period based upon the achievement of certain milestones. The Company received an additional $1 million from Fujirebio in 2011 for the achievement of two milestones. For the year ended December 31, 2011, the Company recorded $1.5 million as a reduction to research and development expenses in the Company’s consolidated statement of operations. These funds will be utilized to accelerate the 3GEMS Hematology Analyzer development program, which leverages IRIS’s proprietary image-based technology to automate the identification and characterization of blood cells, including an image-based expanded white blood cell differential, and is expected to significantly reduce the need for manual slide preparation and reviews.
In the first quarter of 2012, the Company achieved another milestone under its Joint Development Agreement with Fujirebio for which it received an additional $500,000.
16. Shelf Registration
In November 2010, the Company filed a Form S-3 shelf registration statement (“$125 million shelf”) to provide for financial flexibility. The $125 million shelf allows the Company to issue common stock, preferred stock and debt securities of the Company. Under the $125 million shelf, all of the securities available for issuance may be offered from time to time with terms to be determined at the time of issuance. In December 2010 the Form S-3 registration statement was declared effective. As of December 31, 2011, no securities had been issued under the $125 million shelf which will expire in December 2013.
17. Commitments and Contingencies
Leases
The Company leases real property, automobiles and equipment under operating lease agreements, which expire at various times through 2019. Certain leases contain renewal options and generally require us to pay utilities, insurance, taxes and other operating expenses.
79
IRIS INTERNATIONAL, INC.
NOTES TO CONSOLIDATED FINANCIAL STATEMENTS — Continued
Future minimum rental payments required under operating lease agreements that have an initial term in excess of one year as of December 31, 2011, are as follows:
| | | | |
| | | Operating
Leases | |
| | | (In thousands) | |
Year Ended December 31, | | | | |
2012 | | $ | 2,497 | |
2013 | | | 2,576 | |
2014 | | | 2,116 | |
2015 | | | 1,679 | |
2016 | | | 596 | |
Thereafter | | | 1,607 | |
| | | | |
| | $ | 11,071 | |
| | | | |
Consolidated rental expense under all operating leases during the years ended December 31, 2011, 2010 and 2009 was approximately $ 2,554,000, $2,424,000, and $1,997,000 respectively.
Litigation
From time to time, the Company is party to certain litigation arising in the normal course of business. Management believes that the resolution of such matters will not have a material adverse effect on the Company’s financial position, results of operations or cash flows.
Guarantees
The Company enters into indemnification provisions under (i) agreements with other companies in its ordinary course of business, typically with business partners, contractors, and customers, landlords and (ii) agreements with investors. Under these provisions, the Company generally indemnifies and holds harmless the indemnified party for losses suffered or incurred by the indemnified party as a result of its activities or, in some cases, as a result of the indemnified party’s activities under the agreement. These indemnification provisions often include indemnifications relating to representations made by the Company with regard to intellectual property rights. These indemnification provisions generally survive termination of the underlying agreement. In addition, in some cases, the Company has agreed to reimburse employees for certain expenses and to provide salary continuation during short-term disability. The maximum potential amount of future payments the Company could be required to make under these indemnification provisions is unlimited. The Company reviews its exposure under these agreements no less than annually, or more frequently when events indicate. The Company has not incurred material costs to defend lawsuits or settle claims related to these indemnification agreements. As a result, the Company believes the estimated fair value of its obligations under these agreements is minimal. Accordingly, the Company has not recorded any liabilities for these agreements as of December 31, 2011 and 2010.
18. Supplier Concentration
One supplier comprised greater than 10% of the Company’s consolidated purchases. Consolidated purchases from this supplier amounted to 13%, 17%, and 12% for the years end December 31, 2011, 2010, and 2009, respectively.
19. Segments and Geographic Information
The Company’s operations are organized on the basis of products and related services, and under FASB ASC Topic 280, Segment Reporting, the Company operates in three segments: (1) Iris Diagnostics Division (“IDD”), (2) Sample Processing and (3) Personalized Medicine.
80
IRIS INTERNATIONAL, INC.
NOTES TO CONSOLIDATED FINANCIAL STATEMENTS — Continued
The IDD segment designs, develops, manufactures, markets and distributes in-vitro diagnostic systems based on patented and proprietary technology for automating microscopic and clinical chemistry procedures for urinalysis. The segment also provides ongoing sales of consumables and services necessary for the operation of installed urinalysis workstations. In the United States, these products are mostly sold through a direct sales and service force. Internationally, these products are sold and serviced through distributors, with the exception of France, Germany, and United Kingdom.
The Sample Processing segment designs, develops, manufactures and markets a variety of benchtop centrifuges, small instruments and supplies. These products are used primarily for manual specimen preparation and dedicated applications in coagulation, cytology, hematology, urinalysis, DNA processing and FISH. These products are sold worldwide through distributors.
The Personalized Medicine segment operates a CLIA-certified laboratory focused on proprietary cancer diagnostic services. This segment also includes the research and development operations of Iris Molecular Diagnostics, or IMD.
The accounting policies of the segments are the same as those described in the “Summary of Significant Accounting Policies”. The Company evaluates the performance of its segments and allocates resources to them based on earnings before income taxes, excluding corporate charges.
81
IRIS INTERNATIONAL, INC.
NOTES TO CONSOLIDATED FINANCIAL STATEMENTS — Continued
The tables below present information about reported segments for the three years ended December 31, 2011:
| | | | | | | | | | | | | | | | | | | | |
| | | IDD | | | Sample
Processing | | | Personalized
Medicine(1) | | | Unallocated
Corporate
Expenses | | | Total | |
| | | (In thousands) | |
For the Year Ended December 31, 2011 | | | | | | | | | | | | | | | | | | | | |
Revenues | | $ | 103,592 | | | $ | 14,540 | | | $ | 192 | | | $ | — | | | $ | 118,324 | |
Gross profit (loss) | | | 53,616 | | | | 8,049 | | | | (1,444 | ) | | | — | | | | 60,221 | |
Marketing and selling | | | 18,891 | | | | 1,426 | | | | 2,792 | | | | — | | | | 23,109 | |
General and administrative | | | 6,384 | | | | 1,509 | | | | 2,058 | | | | 9,154 | | | | 19,105 | |
Research and development, net | | | 10,241 | | | | 914 | | | | 5,092 | | | | — | | | | 16,247 | |
Gain on revaluation of contingent consideration | | | — | | | | — | | | | (1,225 | ) | | | — | | | | (1,225 | ) |
Impairment of Assets | | | — | | | | — | | | | 5,829 | | | | — | | | | 5,829 | |
Restructuring expense | | | 333 | | | | — | | | | 1,228 | | | | — | | | | 1,561 | |
| | | | | | | | | | | | | | | | | | | | |
Total operating expenses | | | 35,849 | | | | 3,849 | | | | 15,774 | | | | 9,154 | | | | 64,626 | |
Operating income (loss) | | | 17,767 | | | | 4,200 | | | | (17,218 | ) | | | (9,154 | ) | | | (4,405 | ) |
Interest income | | | 94 | | | | 1 | | | | — | | | | 1,038 | | | | 1,133 | |
Interest expense | | | — | | | | — | | | | — | | | | (20 | ) | | | (20 | ) |
Depreciation and amortization | | | 4,378 | | | | 145 | | | | 784 | | | | 14 | | | | 5,321 | |
Segment pre-tax income (loss) | | | 18,772 | | | | 4,093 | | | | (17,219 | ) | | | (8,714 | ) | | | (3,068 | ) |
| | | | | | | | | | | | | | | | | | | | |
Segment assets | | | 85,277 | | | | 11,723 | | | | 6,668 | | | | 8,247 | | | | 111,915 | |
| | | | | | | | | | | | | | | | | | | | |
Investment in long-lived assets | | | 26,299 | | | | 4,829 | | | | 6,208 | | | | — | | | | 37,336 | |
| | | | | | | | | | | | | | | | | | | | |
| | | | | |
For the Year Ended December 31, 2010 | | | | | | | | | | | | | | | | | | | | |
Revenues | | $ | 93,195 | | | $ | 14,408 | | | $ | 69 | | | $ | — | | | $ | 107,672 | |
Gross profit | | | 47,469 | | | | 7,789 | | | | (372 | ) | | | — | | | | 54,886 | |
Marketing and selling | | | 17,375 | | | | 1,189 | | | | 1,265 | | | | — | | | | 19,829 | |
General and administrative | | | 6,386 | | | | 1,360 | | | | 1,872 | | | | 7,769 | | | | 17,387 | |
Research and development, net | | | 8,840 | | | | 619 | | | | 5,103 | | | | — | | | | 14,562 | |
Gain on revaluation of contingent consideration | | | — | | | | — | | | | — | | | | — | | | | — | |
Impairment of Assets | | | — | | | | — | | | | — | | | | — | | | | — | |
Restructuring expense | | | — | | | | — | | | | — | | | | — | | | | — | |
| | | | | | | | | | | | | | | | | | | | |
Total operating expenses | | | 32,601 | | | | 3,168 | | | | 8,240 | | | | 7,769 | | | | 51,778 | |
Operating income (loss) | | | 14,868 | | | | 4,621 | | | | (8,612 | ) | | | (7,769 | ) | | | 3,108 | |
Interest income | | | 141 | | | | 26 | | | | — | | | | 956 | | | | 1,123 | |
Interest expense | | | — | | | | — | | | | — | | | | (10 | ) | | | (10 | ) |
Depreciation and amortization | | | 3,612 | | | | 181 | | | | 357 | | | | 14 | | | | 4,164 | |
Segment pre-tax income (loss) | | | 15,744 | | | | 4,545 | | | | (8,620 | ) | | | (7,539 | ) | | | 4,130 | |
| | | | | | | | | | | | | | | | | | | | |
Segment assets | | | 76,981 | | | | 12,683 | | | | 11,195 | | | | 5,750 | | | | 106,609 | |
| | | | | | | | | | | | | | | | | | | | |
Investment in long-lived assets | | | 24,281 | | | | 3,720 | | | | 11,045 | | | | — | | | | 39,046 | |
| | | | | | | | | | | | | | | | | | | | |
82
IRIS INTERNATIONAL, INC.
NOTES TO CONSOLIDATED FINANCIAL STATEMENTS — Continued
| | | | | | | | | | | | | | | | | | | | |
| | | IDD | | | Sample
Processing | | | Personalized
Medicine(1) | | | Unallocated
Corporate
Expenses | | | Total | |
| | | (In thousands) | |
For the Year Ended December 31, 2009 | | | | | | | | | | | | | | | | | | | | |
Revenues | | $ | 78,231 | | | $ | 14,335 | | | $ | — | | | $ | — | | | $ | 92,566 | |
Gross profit | | | 41,295 | | | | 7,370 | | | | — | | | | — | | | | 48,665 | |
Marketing and selling | | | 14,999 | | | | 1,123 | | | | — | | | | — | | | | 16,122 | |
General and administrative | | | 5,077 | | | | 1,345 | | | | — | | | | 6,899 | | | | 13,321 | |
Research and development, net | | | 6,275 | | | | 824 | | | | 4,312 | | | | — | | | | 11,411 | |
| | | | | | | | | | | | | | | | | | | | |
Total operating expenses | | | 26,351 | | | | 3,292 | | | | 4,312 | | | | 6,899 | | | | 40,854 | |
Operating income (loss) | | | 14,944 | | | | 4,078 | | | | (4,312 | ) | | | (6,899 | ) | | | 7,811 | |
Interest income | | | 663 | | | | 25 | | | | — | | | | 169 | | | | 857 | |
Interest expense | | | — | | | | — | | | | — | | | | (21 | ) | | | (21 | ) |
Depreciation and amortization | | | 3,051 | | | | 230 | | | | 226 | | | | 16 | | | | 3,523 | |
Segment pre-tax income (loss) | | | 16,787 | | | | 4,014 | | | | (4,262 | ) | | | (7,834 | ) | | | 8,705 | |
| | | | | | | | | | | | | | | | | | | | |
Segment assets | | | 78,453 | | | | 8,784 | | | | 4,417 | | | | 6,136 | | | | 97,790 | |
| | | | | | | | | | | | | | | | | | | | |
Investment in long-lived assets | | | 19,681 | | | | 399 | | | | 4,298 | | | | — | | | | 24,378 | |
| | | | | | | | | | | | | | | | | | | | |
| (1) | Personalized Medicine includes the operations of Arista, which was acquired on July 28, 2010 (see Note 3). |
The Company ships products from two locations in the United States and one location in Germany. Substantially all long-lived assets are located in the United States. Sales to international customers amounted to approximately $38.8 million in 2011, $36.0 million in 2010 and $30.2 million in 2009. For the year ended December 31, 2011, two customers represented 12% of international sales. For the year ended December 31, 2010, one customer represented 13% of international sales. For the year ended December 31, 2009, three customers represented 19%, 12% and 12% of international sales, respectively.
Segment assets attributed to corporate unallocated expenses are deferred taxes. Long-lived assets include property and equipment, intangible assets, long-term portion of inventory and other long-term assets. Deferred income taxes are excluded from long-lived assets.
83
IRIS INTERNATIONAL, INC.
NOTES TO CONSOLIDATED FINANCIAL STATEMENTS — Continued
20. Valuation and Qualifying Accounts
| | | | | | | | | | | | | | | | | | | | |
| | | Beginning
Balance | | | Charged to
Costs and
Expenses | | | Additions
Charged to
Other
Accounts | | | Deductions | | | Ending
Balance | |
| | | (In thousands) | |
Year Ended December 31, 2011 | | | | | | | | | | | | | | | | | | | | |
Allowance for doubtful accounts | | $ | 405 | | | $ | — | | | $ | 135 | | | $ | (31 | )(1) | | $ | 509 | |
Allowance for sales returns | | | 48 | | | | — | | | | — | | | | — | (1) | | | 48 | |
Reserve for inventory obsolescence | | | 145 | | | | 138 | | | | — | | | | (42 | )(1) | | | 241 | |
Valuation of deferred tax assets | | | 598 | | | | — | | | | (188 | ) | | | — | | | | 410 | |
Year Ended December 31, 2010 | | | | | | | | | | | | | | | | | | | | |
Allowance for doubtful accounts | | $ | 369 | | | $ | — | | | $ | 43 | | | $ | (7 | )(1) | | $ | 405 | |
Allowance for sales returns | | | 48 | | | | — | | | | — | | | | — | (1) | | | 48 | |
Reserve for inventory obsolescence | | | 983 | | | | 131 | | | | — | | | | (969 | )(1) | | | 145 | |
Valuation of deferred tax assets | | | 335 | | | | — | | | | 308 | | | | (45 | )(2) | | | 598 | |
Year Ended December 31, 2009 | | | | | | | | | | | | | | | | | | | | |
Allowance for doubtful accounts | | $ | 410 | | | $ | — | | | $ | (20 | ) | | $ | (21 | )(1) | | $ | 369 | |
Allowance for sales returns | | | 35 | | | | — | | | | 13 | | | | — | | | | 48 | |
Reserve for inventory obsolescence | | | 846 | | | | 255 | | | | — | | | | (118 | )(1) | | | 983 | |
Valuation of deferred tax assets | | | 596 | | | | — | | | | — | | | | (261 | )(2) | | | 335 | |
| (1) | Relates to the write-off of accounts receivable, return of merchandise, disposal of obsolete inventory or specific portion of the accounts receivable reserve or reserve for sales returns no longer needed. |
| (2) | Valuation adjustment relating to realization of deferred tax assets. |
21. Selected Quarterly Data (Unaudited)
The following table summarizes certain financial information by quarter:
| | | | | | | | | | | | | | | | |
| | | 2011 Quarter Ended | |
| | | March 31 | | | June 30 | | | September 30 | | | December 31 | |
| | | (In thousands, except per share) | |
Net revenues | | $ | 26,939 | | | $ | 30,165 | | | $ | 28,096 | | | $ | 33,124 | |
Gross profit | | | 13,107 | | | | 15,653 | | | | 14,148 | | | | 17,313 | |
Net income (loss) | | | 523 | | | | (344 | ) | | | (4,270 | ) | | | 2,897 | |
Net income per share — basic | | | 0.03 | | | | (0.02 | ) | | | (0.24 | ) | | | 0.16 | |
Net income per share — diluted | | | 0.03 | | | | (0.02 | ) | | | (0.24 | ) | | | 0.16 | |
| | | | | | | | | | | | | | | | |
| | | 2010 Quarter Ended | |
| | | March 31 | | | June 30 | | | September 30 | | | December 31 | |
| | | (In thousands, except per share) | |
Net revenues | | $ | 25,980 | | | $ | 26,688 | | | $ | 25,726 | | | $ | 29,278 | |
Gross profit | | | 13,254 | | | | 14,495 | | | | 13,159 | | | | 13,978 | |
Net income | | | 1,042 | | | | 624 | | | | 924 | | | | 452 | |
Net income per share — basic | | | 0.06 | | | | 0.03 | | | | 0.05 | | | | 0.03 | |
Net income per share — diluted | | | 0.06 | | | | 0.03 | | | | 0.05 | | | | 0.03 | |
84
IRIS INTERNATIONAL, INC.
NOTES TO CONSOLIDATED FINANCIAL STATEMENTS — Continued
| 1. | 2011 results include the operating losses from Arista Molecular of $12.5 million. Included in this amount is $7.1 million related to restructuring and impairment charges. In September 2011, we restructured our Personalized Medicine segment by downsizing and consolidating the molecular pathology laboratory operations of Arista into Iris Molecular Diagnostics. |
| 2. | 2010 results include the operating losses, including acquisition related costs, of approximately $3.7 million related to our acquisition in July 2010 of Arista Molecular, Inc. In addition, in 2010 we incurred $923,000 in CFO and related transition costs, $1.1 million for foreign currency translation loss and $800,000 related to higher instrument cost of goods due to a price premium on the last purchase of automated chemistry analyzers from Arkray. |
22. Shareholders’ Rights Plan
On September 24, 2010, the Company’s board of directors adopted a shareholders’ rights plan under which each holder of a share of common stock also has one right to purchase one one-thousandth of a newly created Series A preferred share at $100 per one one-thousandth of a share. The rights originally were scheduled to expire on September 24, 2020. However, the expiration date was accelerated to November 30, 2011 such that the rights under the plan are no longer outstanding and the shareholders’ rights plan is no longer in effect as of December 31, 2011.
85
Item 9. Changes in and Disagreements with Accountants on Accounting and Financial Disclosure.
None.
Item 9A. Controls and Procedures.
Disclosure Controls and Procedures.
Based on their evaluation as of December 31, 2011, our Chief Executive Officer and Chief Financial Officer, with the participation of management, have concluded that our disclosure controls and procedures (as defined in Rules 13a — 15(e) and 15d — 15(e) of the Securities Exchange Act of 1934) were effective.
Management’s Annual Report on Internal Control over Financial Reporting.
Our management is responsible for establishing and maintaining adequate internal control over financial reporting, as defined in Rules 13a-15(f) and 15d-15(f) under the Securities and Exchange Act of 1934. Internal control over financial reporting is a process designed to provide reasonable assurance regarding the reliability of financial reporting and the preparation of financial statements for external purposes in accordance with generally accepted accounting principles in the United States.
Under the supervision and with the participation of our management, including our Chief Executive Officer and Chief Financial Officer, we conducted an evaluation of the effectiveness of our internal control over financial reporting as of December 31, 2011 using the criteria set forth by the Committee of Sponsoring Organizations of the Treadway Commission (COSO) inInternal Control — Integrated Framework. Based on this evaluation, our management concluded that as of December 31, 2010, our internal control over financial reporting was effective.
Attestation Report of the Registered Public Accounting Firm.
BDO USA LLP, our independent registered public accounting firm that has audited our financial statements included herein, has issued an attestation report on our internal control over financial reporting, which report is included under Item 8 of this Annual Report on Form 10-K.
Changes in Internal Control over Financial Reporting.
There were no changes in our internal control over financial reporting during the quarter ended December 31, 2011 that have materially affected, or are reasonably likely to materially affect, our internal control over financial reporting.
Limitations on the Effectiveness of Controls.
Our disclosure controls and procedures provide our Chief Executive Officer and Chief Financial Officer reasonable assurances that our disclosure controls and procedures will achieve their objectives. However, company management, including our Chief Executive Officer and Chief Financial Officer, does not expect that our disclosure controls and procedures or our internal control over financial reporting can or will prevent all human error. A control system, no matter how well designed and implemented, can provide only reasonable, not absolute, assurance that the objectives of the control system are met. Furthermore, the design of a control system must reflect the fact that there are internal resource constraints, and the benefit of controls must be weighed relative to their corresponding costs. Because of the limitations in all control systems, no evaluation of controls can provide complete assurance that all control issues and instances of error, if any, within our company are detected. These inherent limitations include the realities that judgments in decision-making can be faulty, and that breakdowns can occur due to human error or mistake. Additionally, controls, no matter how well designed, could be circumvented by the individual acts of specific persons within the organization. The design of any system of controls is also based in part upon certain assumptions about the likelihood of future events, and there can be no assurance that any design will succeed in achieving its stated objectives under all potential future conditions.
Item 9B. Other Information.
None.
86
PART III
Certain information required by Part III is omitted from this Annual Report on Form 10-K because the registrant will file with the U.S. Securities and Exchange Commission a definitive proxy statement pursuant to Regulation 14A in connection with the solicitation of proxies for our Annual Meeting of Stockholders expected to be held in April 2012 (the “Proxy Statement”) not later than 120 days after the end of the fiscal year covered by this Annual Report on Form 10-K, and certain information included therein is incorporated herein by reference.
Item 10. Directors, Executive Officers and Corporate Governance.
The information required by this item with respect to directors and executive officers may be found in the section “Director Nominees and Executive Officers” appearing in the Proxy Statement. Such information is incorporated herein by reference.
The information required by this Item with respect to our audit committee and audit committee financial expert may be found in the section entitled “Director Nominees and Executive Officers — The Board and Board Committees — Audit Committee” appearing in the Proxy Statement. Such information is incorporated herein by reference.
The information required by this Item with respect to compliance with Section 16(a) of the Securities Exchange Act of 1934 and our code of ethics may be found in the sections entitled “Director Nominees and Executive Officers — Section 16(a) Beneficial Ownership Reporting Compliance” and “Director Nominees and Executive Officers — Code of Business Conduct and Ethics,” respectively, appearing in the Proxy Statement. Such information is incorporated herein by reference.
Item 11. Executive Compensation.
The information required by this Item with respect to director and executive officer compensation is incorporated herein by reference to the information from the Proxy Statement under the section entitled “Executive Compensation.”
The information required by this Item with respect to Compensation Committee interlocks and insider participation is incorporated herein by reference to the information from the Proxy Statement under the section entitled “Director Nominees and Executive Officers — Compensation Committee Interlocks and Insider Participation.”
The information required by this Item with respect to our Compensation Committee’s review and discussion of the Compensation Discussion and Analysis included in the Proxy Statement is incorporate herein by reference to the information from the Proxy Statement under the section entitled “Compensation Discussion and Analysis — Compensation Committee Report.”
Item 12. Security Ownership of Certain Beneficial Owners and Management and Related Stockholder Matters.
The information required by this Item with respect to security ownership of certain beneficial owners and management is incorporated herein by reference to the information from the Proxy Statement under the section entitled “Security Ownership of Certain Beneficial Owners and Management.”
The information required by this Item with respect to securities authorized for issuance under our equity compensation plans is incorporated herein by reference to the information from the Proxy Statement under the section entitled “Approval of 2012 Omnibus Incentive Plan — Equity Compensation Plan Information.”
Item 13. Certain Relationships and Related Transactions, and Director Independence.
The information required by this Item with respect to related party transactions is incorporated herein by reference to the information from the Proxy Statement under the section entitled “Executive Compensation — Certain Relationships and Related Transactions.”
The information required by this Item with respect to director independence is incorporated herein by reference to the information from the Proxy Statement under the section entitled “Director Nominees and Executive Officers — The Board and Board Committees.”
Item 14. Principal Accounting Fees and Services.
The information required by this Item is incorporated herein by reference to the information from the Proxy Statement under the section entitled “Ratification of Selection of Independent Registered Public Accounting Firm.”
87
PART IV
Item 15. Exhibits, Financial Statement Schedules.
(a) Documents filed as part of this report
1. Financial Statements
See Index to Financial Statements in Item 8 of this Annual Report on Form 10-K, which is incorporated herein by reference.
2. Financial Statement Schedules
All financial statement schedules are omitted because the information is inapplicable or presented in the Notes to Financial Statements.
The following exhibits are included herein or incorporated herein by reference:
| | | | | | | | | | | | | | | | | | | | |
Exhibit Number | | | | Incorporated by Reference | | Filed
Herewith | |
| | Description | | Form | | | File Number | | | Exhibit | | | Filing Date | |
| 2.1 | | Merger Agreement, dated July 26, 2010, by and among Iris International, Inc., AlliedPath Inc., and API Acquisition Corp. | | | 8-K | | | | 001-11181 | | | | 2.1 | | | July 30, 2010 | | | — | |
| 3.1(a) | | Certificate of Incorporation, filed June 9, 1987 | | | 8-K | | | | 001-11181 | | | | 3.1 | (a) | | September 29, 2010 | | | — | |
| 3.1(b) | | Certificate of Amendment of Certificate of Incorporation, filed July 9, 1993 | | | 8-K | | | | 001-11181 | | | | 3.1 | (b) | | September 29, 2010 | | | — | |
| 3.1(c) | | Certificate of Amendment of Certificate of Incorporation, filed June 6, 2001 | | | 8-K | | | | 001-11181 | | | | 3.1 | (c) | | September 29, 2010 | | | — | |
| 3.1(d) | | Certificate of Ownership and Merger, filed November 26, 2003 | | | 8-K | | | | 001-11181 | | | | 3.1 | (d) | | September 29, 2010 | | | — | |
| 3.1(e) | | Certificate of Correction of Certificate of Ownership and Merger, filed December 11, 2003 | | | 8-K | | | | 001-11181 | | | | 3.1 | (e) | | September 29, 2010 | | | — | |
| 3.2 | | Amended and Restated Bylaws | | | 8-K | | | | 001-11181 | | | | 3.1 | | | December 1, 2011 | | | — | |
| 4.1(a) | | Rights Agreement, dated as of September 24, 2010, between the Registrant and Continental Stock Transfer & Trust Company, as Rights Agent, including the Certificate of Designation of Rights, Preferences and Privileges of Series A Preferred Stock, the Form of Rights Certificate, and the Summary of Rights to Purchase Preferred Stock, attached thereto as Exhibits A, B and C, respectively. | | | 8-K | | | | 001-11181 | | | | 4.1 | | | September 29, 2010 | | | — | |
| 4.1(b) | | Amendment and Termination of Rights Agreement, dated as of November 30, 2011, between the Registrant and Continental Stock Transfer & Trust Company, as Rights Agent. | | | 8-K | | | | 001-11181 | | | | 4.1 | | | December 1, 2011 | | | — | |
88
| | | | | | | | | | | | | | | | | | |
Exhibit Number | | | | Incorporated by Reference | | Filed
Herewith | |
| | Description | | Form | | | File Number | | | Exhibit | | Filing Date | |
| 10.1(a)† | | Key Employee Agreement, dated February 13, 2004, between the Registrant and Cesar M Garcia. | | | 10-K | | | | 001-11181 | | | 10.8(i) | | March 26, 2004 | | | — | |
| 10.1(b)† | | First Amendment to Key Employee Agreement, dated December 21, 2006, between the Registrant and Cesar M Garcia. | | | 10-K | | | | 001-11181 | | | 10.9(b) | | March 23, 2007 | | | — | |
| 10.1(c)† | | Second Amendment to Key Employee Agreement, dated November 14, 2007, between the Registrant and Cesar M. Garcia. | | | 8-K | | | | 001-11181 | | | 10.1 | | November 14, 2007 | | | | |
| 10.1(d)† | | Third Amendment to Key Employee Agreement for Cesar M. Garcia effective May 14, 2010 between IRIS International, Inc. and Cesar M. Garcia. | | | 8-K | | | | 001-11181 | | | 10.1 | | September 7, 2010 | | | — | |
| 10.1(e)† | | Fourth Amendment to Key Employee Agreement for Cesar M. Garcia effective March 30, 2011 between IRIS International, Inc. and Cesar M. Garcia. | | | 8-K | | | | 001-11181 | | | 10.1 | | April 5, 2011 | | | — | |
| 10.2(a)† | | Key Employee Agreement, dated March 1, 2007, between the Registrant and Thomas E. Warekois. | | | 10-K | | | | 001-1181 | | | 10.12 | | March 14, 2008 | | | — | |
| 10.2(b)† | | Amendment to Key Employee Agreement for Thomas Warekois, effective May 14, 2010 between IRIS International, Inc. and Thomas Warekois. | | | 8-K | | | | 001-11181 | | | 10.3 | | September 7, 2010 | | | — | |
| 10.2(c)† | | Second Amendment to Key Employee Agreement for Thomas Warekois, effective March 30, 2011 between IRIS International, Inc. and Thomas Warekois. | | | 8-K | | | | 001-11181 | | | 10.4 | | April 5, 2011 | | | — | |
| 10.3(a)† | | Key Employee Agreement, dated November 7, 2007, between the Registrant and Robert Mello. | | | 8-K | | | | 001-11181 | | | 10.2 | | November 14, 2007 | | | | |
| 10.3(b)† | | Amendment to Key Employee Agreement for Robert Mello, effective May 14, 2010 between IRIS International, Inc. and Robert Mello. | | | 8-K | | | | 001-11181 | | | 10.2 | | September 7, 2010 | | | — | |
| 10.3(c)† | | Second Amendment to Key Employee Agreement for Robert Mello, effective March 30, 2011 between IRIS International, Inc. and Robert Mello. | | | 8-K | | | | 001-11181 | | | 10.5 | | April 5, 2011 | | | — | |
| 10.4(a)† | | Key Employee Agreement for Thomas H. Adams, PhD, dated September 2, 2010 between IRIS International, Inc. and Thomas H. Adams, Ph.D. | | | 8-K | | | | 001-11181 | | | 10.5 | | September 7, 2010 | | | — | |
89
| | | | | | | | | | | | | | | | | | | | |
Exhibit Number | | | | Incorporated by Reference | | Filed
Herewith | |
| | Description | | Form | | | File Number | | | Exhibit | | | Filing Date | |
| 10.4(b)† | | First Amendment to Key Employee Agreement for Thomas H. Adams, PhD, effective March 30, 2011 between IRIS International, Inc. and Thomas H. Adams, PhD. | | | 8-K | | | | 001-11181 | | | | 10.6 | | | April 5, 2011 | | | — | |
| 10.5(a)† | | Key Employee Agreement for Amin Khalifa dated October 11, 2010 between IRIS International, Inc. and Amin Khalifa. | | | 8-K | | | | 001-11181 | | | | 10.1 | | | October 13, 2010 | | | — | |
| 10.5(b)† | | First Amendment to Key Employee Agreement for Amin Khalifa, effective March 30, 2011 between IRIS International, Inc. and Amin Khalifa. | | | 8-K | | | | 001-11181 | | | | 10.2 | | | April 5, 2011 | | | — | |
| 10.6† | | Key Employee Agreement for Richard A. O’Leary, dated February 14, 2011, between IRIS International, Inc. and Richard A. O’Leary | | | 8-K | | | | 001-11181 | | | | 10.1 | | | February 17, 2011 | | | — | |
| 10.7(a)† | | Key Employee Agreement, dated November 7, 2007, between the Registrant and John Yi. | | | 8-K | | | | 001-11181 | | | | 10.3 | | | November 14, 2007 | | | | |
| 10.7(b)† | | Amendment to Key Employee Agreement for John Yi, effective May 14, 2010 between IRIS International, Inc. and John Yi. | | | 8-K | | | | 001-11181 | | | | 10.4 | | | September 7, 2010 | | | — | |
| 10.7(c)† | | Second Amendment to Key Employee Agreement for John Yi, effective March 30, 2011 between IRIS International, Inc. and John Yi. | | | 8-K | | | | 001-11181 | | | | 10.3 | | | April 5, 2011 | | | — | |
| 10.8(a)† | | Key Employee Agreement for Philip Ginsburg, dated July 28, 2010, by and between Iris International, Inc. and Philip Ginsburg. | | | 8-K | | | | 001-11181 | | | | 10.1 | | | July 30, 2010 | | | — | |
| 10.8(b)† | | Amendment to Key Employee Agreement for Philip Ginsburg, effective March 30, 2011 between IRIS International, Inc. and Philip Ginsburg. | | | 8-K | | | | 001-11181 | | | | 10.8 | | | April 5, 2011 | | | — | |
| 10.9† | | 1994 Stock Option Plan and forms of Stock Option Agreements. | | | S-8 | | | | 33-82560 | | | | n/a | | | | | | — | |
| 10.10† | | 1997 Stock Option Plan and form of Stock Option Agreement. | | | S-8 | | | | 333-31393 | | |
| 4.2(a),
4.2(b) |
| | July 16, 1997 | | | — | |
| 10.11† | | Amended and Restated 1998 Stock Option Plan. | | | 10-K | | | | 001-11181 | | | | 10.6 | | | March 23, 2007 | | | — | |
| 10.12(a)† | | 2007 Stock Incentive Plan. | | | S-8 | | | | 333-145635 | | | | 4.3 | | | August 22, 2007 | | | — | |
| 10.12(b)† | | Amendment No. 1 to 2007 Stock Incentive Plan | | | 8-K | | | | 001-11181 | | | | 10.1 | | | May 29, 2009 | | | — | |
| 10.13† | | Form of Restricted Stock Unit Agreement. | | | 10-K | | | | 001-11181 | | | | 10.18 | | | March 16, 2010 | | | — | |
90
| | | | | | | | | | | | | | | | | | |
Exhibit Number | | | | Incorporated by Reference | | Filed
Herewith | |
| | Description | | Form | | | File Number | | | Exhibit | | Filing Date | |
| 10.14† | | Form of Non-Qualified Stock Option Agreement. | | | 10-K | | | | 001-11181 | | | 10.19 | | March 16, 2010 | | | — | |
| 10.15† | | Form of Incentive Stock Option Agreement. | | | 10-K | | | | 001-11181 | | | 10.20 | | March 16, 2010 | | | — | |
| 10.16† | | Form of Restricted Stock Unit Deferral Election. | | | 10-K | | | | 001-11181 | | | 10.21 | | March 16, 2010 | | | — | |
| 10.17† | | IRIS International, Inc. 2011 Inducement Incentive Plan. | | | 8-K | | | | 001-11181 | | | 10.1 | | June 10, 2011 | | | — | |
| 10.18(a) | | Lease for Property Located at 9172 Eton Avenue, Chatsworth, California, dated November 29, 2001. | | | 10-K | | | | 001-11181 | | | 10.1(a) | | April 1, 2002 | | | — | |
| 10.18(b) | | Amendment No. 1, dated October 17, 2005, to the Lease for Property Located at 9172 Eton Avenue, Chatsworth, California, dated November 28, 2001. | | | 8-K | | | | 001-11181 | | | 10.2 | | November 18, 2005 | | | — | |
| 10.19 | | Lease for Property Located at 9158-9162 Eton Avenue, Chatsworth, California, dated October 17, 2005. | | | 8-K | | | | 001-11181 | | | 10.1 | | November 18, 2005 | | | — | |
| 10.20 | | Lease for Property Located at 9232 Eton Avenue, Chatsworth, California, dated February 8, 2010. | | | 10-K | | | | 001-11181 | | | 10.17 | | March 16, 2010 | | | — | |
| 10.21 | | Lease for Property Located at 1891 Rutherford Road, Suite 200, Carlsbad, California, dated as of December 5, 2011. | | | 8-K | | | | 001-11181 | | | 10.1 | | December 20, 2011 | | | — | |
| 10.22 | | Credit Agreement dated July 27, 2011 among IRIS International, Inc., the Lenders party thereto, and JPMorgan Chase Bank, N.A., as Administrative Agent. | | | 8-K | | | | 001-11181 | | | 10.1 | | July 28, 2011 | | | — | |
| 10.23 | | Continuing Security Agreement dated July 27, 2011 between Arista Molecular, Inc. and JPMorgan Chase Bank, N.A. as administrative agent. | | | 8-K | | | | 001-11181 | | | 10.2 | | July 28, 2011 | | | — | |
| 10.24 | | Continuing Security Agreement dated July 27, 2011 between StatSpin, Inc. and JPMorgan Chase Bank, N.A. as administrative agent. | | | 8-K | | | | 001-11181 | | | 10.3 | | July 28, 2011 | | | — | |
| 10.25 | | Continuing Security Agreement dated July 27, 2011 between IRIS International, Inc. and JPMorgan Chase Bank, N.A. as administrative agent. | | | 8-K | | | | 001-11181 | | | 10.4 | | July 28, 2011 | | | — | |
| 10.26 | | Continuing Security Agreement dated July 27, 2011 between IRIS Molecular Diagnostics, Inc. and JPMorgan Chase Bank, N.A. as administrative agent. | | | 8-K | | | | 001-11181 | | | 10.5 | | July 28, 2011 | | | — | |
91
| | | | | | | | | | | | | | | | |
Exhibit Number | | | | Incorporated by Reference | | Filed
Herewith | |
| | Description | | Form | | File Number | | | Exhibit | | Filing Date | |
| 10.27 | | Continuing Security Agreement dated July 27, 2011 between IRIS Global Network, Inc. and JPMorgan Chase Bank, N.A. as administrative agent. | | 8-K | | | 001-11181 | | | 10.6 | | July 28, 2011 | | | — | |
| 21 | | List of Subsidiaries. | | | | | | | | | | | | | * | |
| 23.1 | | Consent of BDO USA, LLP. | | | | | | | | | | | | | * | |
| 24.1 | | Power of Attorney (included on signature page) | | | | | | | | | | | | | * | |
| 31.1 | | Certification of Principal Executive officer pursuant to Securities Exchange Act Rules 13a-14 and 15d-14 as adopted pursuant to Section 302 of the Sarbanes-Oxley Act of 2002. | | | | | | | | | | | | | * | |
| 31.2 | | Certification of Principal Financial officer pursuant to Securities Exchange Act Rules 13a-14 and 15d-14 as adopted pursuant to Section 302 of the Sarbanes-Oxley Act of 2002. | | | | | | | | | | | | | * | |
| 32.1 | | Certification of Principal Executive officer pursuant to Securities Exchange Act Rules 13a-14(b) of the Exchange Act and 18 U.S.C. Section 1350 as adopted pursuant to Section 906 of the Sarbanes-Oxley Act of 2002. | | | | | | | | | | | | | * | |
| 32.2 | | Certification of Principal Financial officer pursuant to Securities Exchange Act Rules 13a-14(b) of the Exchange Act and 18 U.S.C. Section 1350 as adopted pursuant to Section 906 of the Sarbanes-Oxley Act of 2002. | | | | | | | | | | | | | * | |
| 101.INS** | | XBRL Instance Document | | | | | | | | | | | | | ** | |
| 101.SCH** | | XBRL Taxonomy Extension Schema Document | | | | | | | | | | | | | ** | |
| 101.CAL** | | XBRL Taxonomy Extension Calculation Linkbase Document | | | | | | | | | | | | | ** | |
| 101.DEF** | | XBRL Taxonomy Extension Definition Linkbase | | | | | | | | | | | | | | |
| 101.LAB** | | XBRL Taxonomy Extension Label Linkbase Document | | | | | | | | | | | | | ** | |
| 101.PRE** | | XBRL Taxonomy Extension Presentation Linkbase Document | | | | | | | | | | | | | ** | |
| † | Each a management contract or compensatory plan or arrangement required to be filed as an exhibit to this annual report on Form 10-K. |
| ** | XBRL information is furnished and not filed or a part of a registration statement or prospectus for purposes of sections 11 or 12 of the Securities Act of 1933, as amended, is deemed not filed for purposes of section 18 of the Securities Exchange Act of 1934, as amended, and otherwise is not subject to liability under these sections. |
92
SIGNATURES
Pursuant to Section 13 or 15(d) of the Securities Exchange Act of 1934, the Registrant has duly caused this report on Form 10-K to be signed on its behalf by the undersigned, thereunto duly authorized, in Chatsworth, California, on March 12, 2012.
| | |
IRIS INTERNATIONAL, INC. |
| |
| By: | | /s/ CESAR M. GARCIA |
| | Cesar M. García, |
| | President and Chief Executive Officer |
POWER OF ATTORNEY
KNOW ALL PERSONS BY THESE PRESENTS, that each person whose signature appears below constitutes and appoints Cesar M. Garcia and Amin I. Khalifa, and each of them, as his true and lawful attorneys-in-fact and agents, with full power of substitution for him, and in his name in any and all capacities, to sign any and all amendments to this Annual Report on Form 10-K, and to file the same, with exhibits thereto and other documents in connection therewith, with the Securities and Exchange Commission, granting unto said attorneys-in-fact and agents, and each of them, full power and authority to do and perform each and every act and thing requisite and necessary to be done therewith, as fully to all intents and purposes as he might or could do in person, hereby ratifying and confirming all that said attorneys-in-fact and agents, and any of them or his or her substitute or substitutes, may lawfully do or cause to be done by virtue hereof.
Pursuant to the requirements of the Securities Act of 1934, this report has been signed by the following persons on behalf of the Registrant in the capacities indicated and on the date indicated:
| | | | |
Signature | | Title | | Date |
| | |
/s/ CESAR M. GARCIA | | President, Chief Executive Officer and | | March 12, 2012 |
Cesar M. Garcia | | Chairman of the Board (Principal Executive Officer) | | |
| | |
/s/ AMIN I. KHALIFA | | Corporate Vice President of Finance and | | March 12, 2012 |
Amin I. Khalifa | | Chief Financial Officer | | |
| | (Principal Financial and Accounting Officer) | | |
| | |
/s/ STEVEN M. BESBECK | | Director | | March 12, 2012 |
Steven M. Besbeck | | | | |
| | |
/s/ DAVID T. DELLA PENTA | | Director | | March 12, 2012 |
David T. Della Penta | | | | |
| | |
/s/ BETH Y. KARLAN | | Director | | March 12, 2012 |
Beth Y. Karlan | | | | |
93
| | | | |
Signature | | Title | | Date |
| | |
/s/ MICHAEL D. MATTE | | Director | | March 12, 2012 |
Michael D. Matte | | | | |
| | |
/s/ RICHARD G. NADEAU | | Director | | March 12, 2012 |
Richard G. Nadeau | | | | |
| | |
/s/ RICK TIMMINS | | Director | | March 12, 2012 |
Rick Timmins | | | | |
| | |
/s/ EDWARD F. VOBORIL | | Director | | March 12, 2012 |
Edward F. Voboril | | | | |
| | |
/s/ STEPHEN E. WASSERMAN | | Director | | March 12, 2012 |
Stephen E. Wasserman | | | | |
94