|
Exhibit 99.1 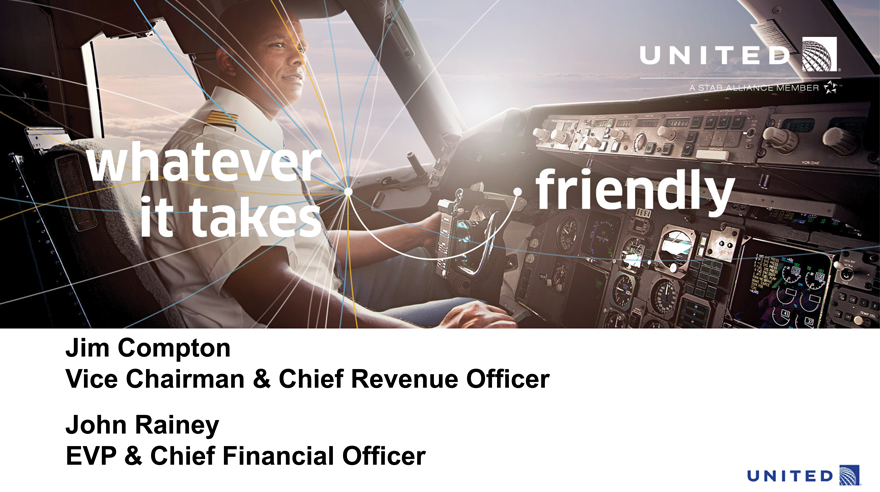
|
Exhibit 99.1
Whatever it takes friendly UNITED A STAR ALLIANCE MEMBER
Jim Compton
Vice Chairman & Chief Revenue Officer John Rainey EVP & Chief Financial Officer
Safe Harbor Statement
Certain statements included in this release are forward - looking and thus reflect our current expectations and beliefs with respect to certain current and future events and financial performance. Such forward - looking statements are and will be subject to many risks and uncertainties relating to our operations and business environment that may cause actual results to differ materially from any future results expressed or implied in such forward - looking statements. Words such as “expects,” “will,” “plans,” “anticipates,” “indicates,” “believes,” “forecast,” “guidance,” “outlook” and similar expressions are intended to identify forward - looking statements. Additionally, forward - looking statements include statements that do not relate solely to historical facts, such as statements which identify uncertainties or trends, discuss the possible future effects of current known trends or uncertainties or which indicate that the future effects of known trends or uncertainties cannot be predicted, guaranteed or assured. All forward - looking statements in this report are based upon information available to us on the date of this report. We undertake no obligation to publicly update or revise any forward - looking statement, whether as a result of new information, future events, changed circumstances or otherwise, except as required by applicable law. Our actual results could differ materially from these forward - looking statements due to numerous factors including, without limitation, the following: our ability to comply with the terms of our various financing arrangements; the costs and availability of financing; our ability to maintain adequate liquidity; our ability to execute our operational plans; our ability to control our costs, including realizing benefits from our resource optimization efforts, cost reduction initiatives and fleet replacement programs; our ability to utilize our net operating losses; our ability to attract and retain customers; demand for transportation in the markets in which we operate; an outbreak of a disease that affects travel demand or travel behavior; demand for travel and the impact that global economic conditions have on customer travel patterns; excessive taxation and the inability to offset future taxable income; general economic conditions (including interest rates, foreign currency exchange rates, investment or credit market conditions, crude oil prices, costs of aircraft fuel and energy refining capacity in relevant markets); our ability to cost-effectively hedge against increases in the price of aircraft fuel; any potential realized or unrealized gains or losses related to fuel or currency hedging programs; the effects of any hostilities, act of war or terrorist attack; the ability of other air carriers with whom we have alliances or partnerships to provide the services contemplated by the respective arrangements with such carriers; the costs and availability of aviation and other insurance; the costs associated with security measures and practices; industry consolidation or changes in airline alliances; competitive pressures on pricing and on demand; our capacity decisions and the capacity decisions of our competitors; U.S. or foreign governmental legislation, regulation and other actions (including open skies agreements and environmental regulations); labor costs; our ability to maintain satisfactory labor relations and the results of the collective bargaining agreement process with our union groups; any disruptions to operations due to any potential actions by our by our labor groups; weather conditions; the possibility that expected merger synergies will not be realized or will not be realized within the expected time period; and other risks and uncertainties set forth under Item 1A, Risk Factors, of UAL’s Annual Report on Form 10-K, as well as other risks and uncertainties set forth from time to time in the reports we file with the SEC.
2
Committed to running a great airline and improving returns
Deliver Improve efficiency Strengthen Expand revenue reliability and quality balance sheet
3
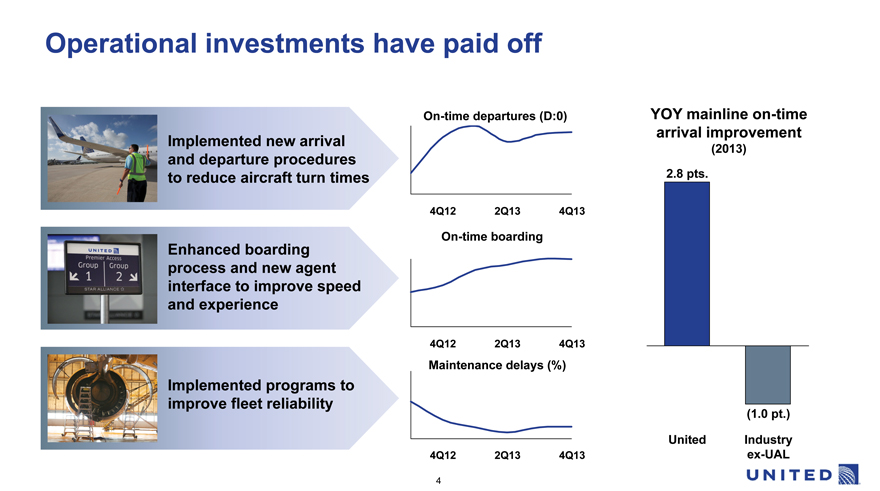
Operational investments have paid off
Implemented new arrival and departure procedures to reduce aircraft turn times
Enhanced boarding process and new agent interface to improve speed and experience
Implemented programs to improve fleet reliability
On-time departures (D:0) YOY mainline on-time arrival improvement
(2013)
2.8 pts.
4Q12 2Q13 4Q13
On-time boarding
4Q12 2Q13 4Q13
Maintenance delays (%)
(1.0 pt.)
United Industry
4Q12 2Q13 4Q13 ex-UAL
4
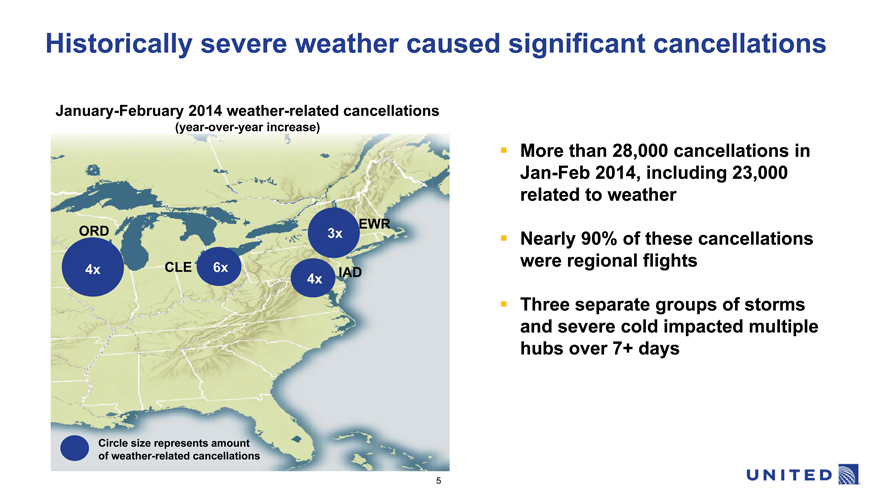
Historically severe weather caused significant cancellations
January -February 2014 weather-related cancellations
(year-over-year increase)
EWR ORD 3x
4x CLE 6x IAD
4x
Circle size represents amount of weather-related cancellations
More than 28,000 cancellations in Jan-Feb 2014, including 23,000 related to weather
Nearly 90% of these cancellations were regional flights
Three separate groups of storms and severe cold impacted multiple hubs over 7+ days
5
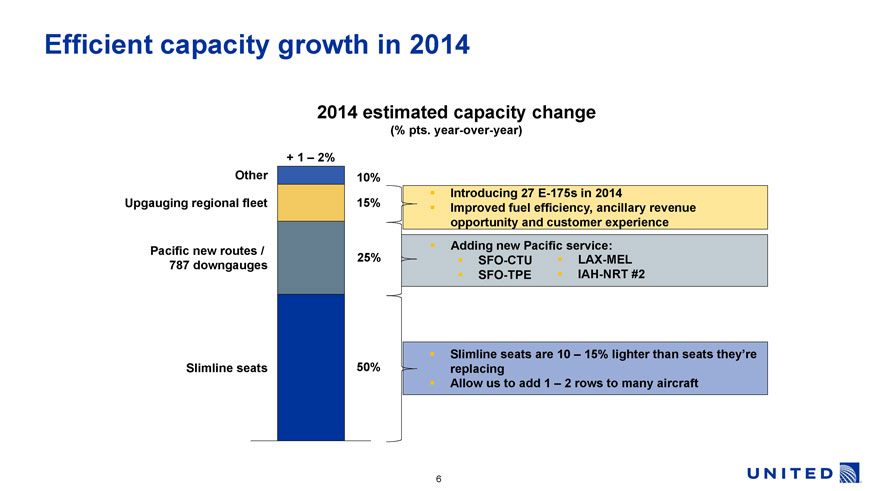
Efficient capacity growth in 2014
2014 estimated capacity change
(% pts. year-over-year)
+ 1 – 2%
Other
Upgauging regional fleet
Pacific new routes / 787 downgauges
Slimline seats
10%
15%
25%
50%
Introducing 27 E-175s in 2014
Improved fuel efficiency, ancillary revenue opportunity and customer experience
Adding new Pacific service:
SFO-CTU
SFO-TPE
LAX-MEL
IAH-NRT #2
Slimline seats are 10 – 15% lighter than seats they’re replacing
Allow us to add 1 – 2 rows to many aircraft
UNITED
6
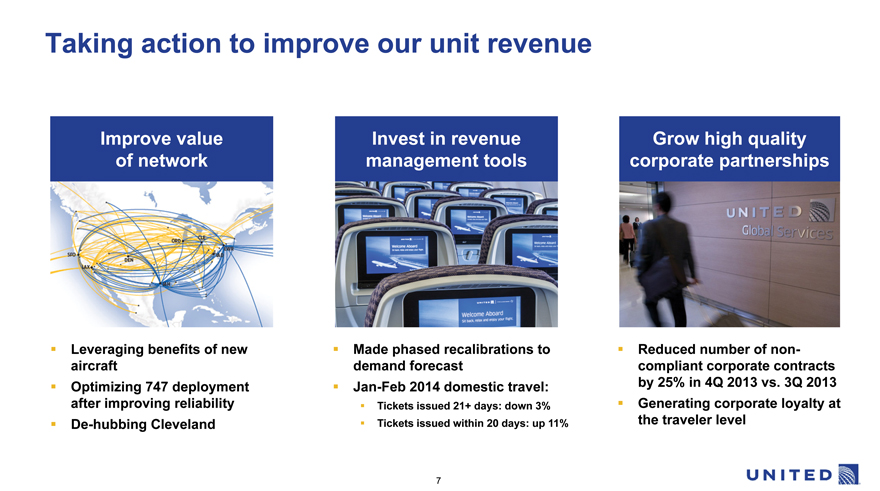
Taking action to improve our unit revenue
Improve value Invest in revenue Grow high quality of network management tools corporate partnerships
Leveraging benefits of new Made phased recalibrations to Reduced number of non- aircraft demand forecast compliant corporate contracts
Optimizing 747 deployment Jan-Feb 2014 domestic travel: by 25% in 4Q 2013 vs. 3Q 2013 after improving reliability Tickets issued 21+ days: down 3% Generating corporate loyalty at
De-hubbing Cleveland Tickets issued within 20 days: up 11% the traveler level
7
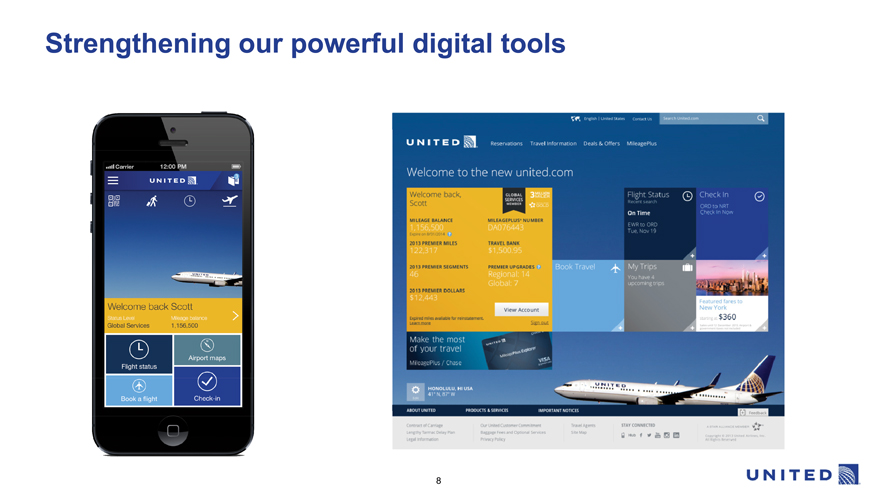
Strengthening our powerful digital tools
8
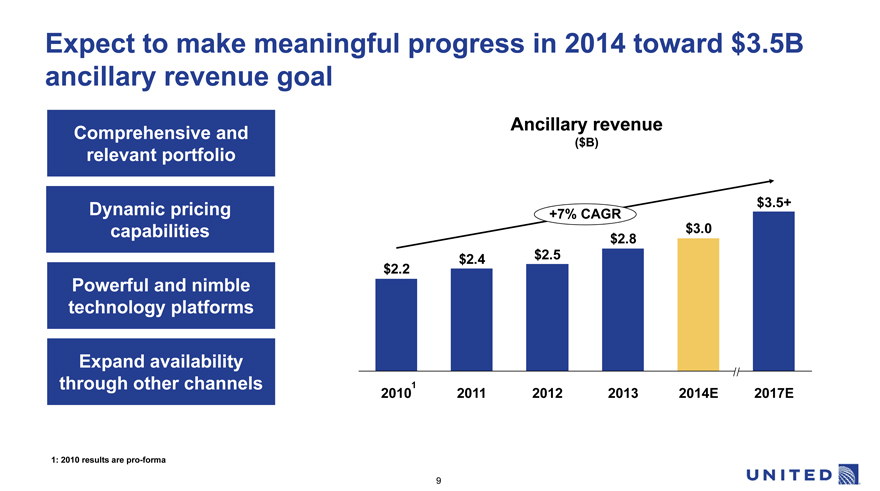
Expect to make meaningful progress in 2014 toward $3.5B ancillary revenue goal
Ancillary revenue Comprehensive and
($B)
relevant portfolio
Dynamic pricing $3.5+
+7%CAGR
capabilities $3.0
$2.8 $2.4 $2.5 $2.2
Powerful and nimble technology platforms
Expand availability through other channels 1
2010 2011 2012 2013 2014E 2017E
1: 2010 results are pro-forma
9
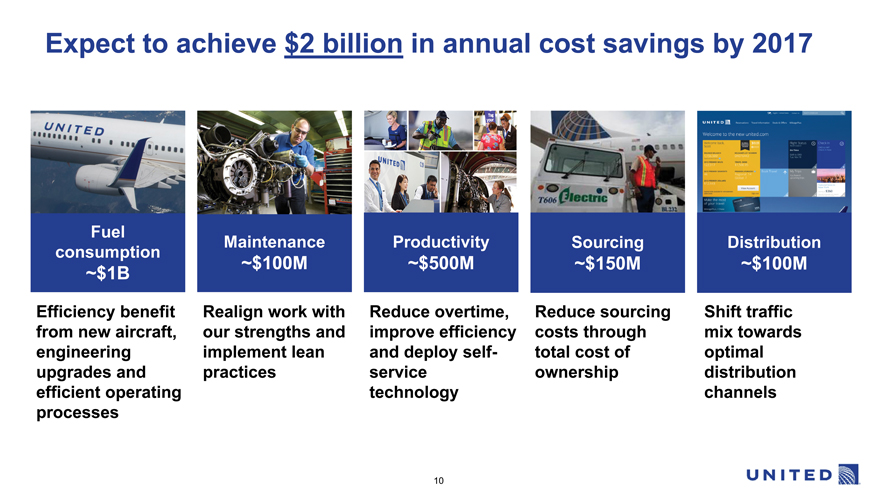
Expect to achieve $2 billion in annual cost savings by 2017
Fuel
Maintenance Productivity Sourcing Distribution consumption
~$100M ~$500M ~$150M ~$100M ~$1B
Efficiency benefit Realign work with Reduce overtime, Reduce sourcing Shift traffic from new aircraft, our strengths and improve efficiency costs through mix towards engineering implement lean and deploy self- total cost of optimal upgrades and practices service ownership distribution efficient operating technology channels processes
10
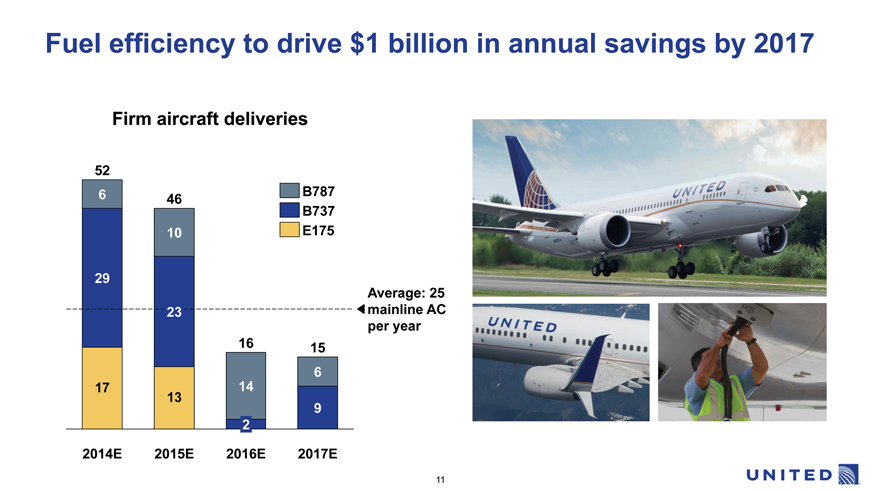
Fuel efficiency to drive $1 billion in annual savings by 2017
Firm aircraft deliveries
52
6 B787 46 B737
10 E175
29
Average: 25 23 mainline AC per year
16 15 6
17 14 13
9 2
2014E 2015E 2016E 2017E
11
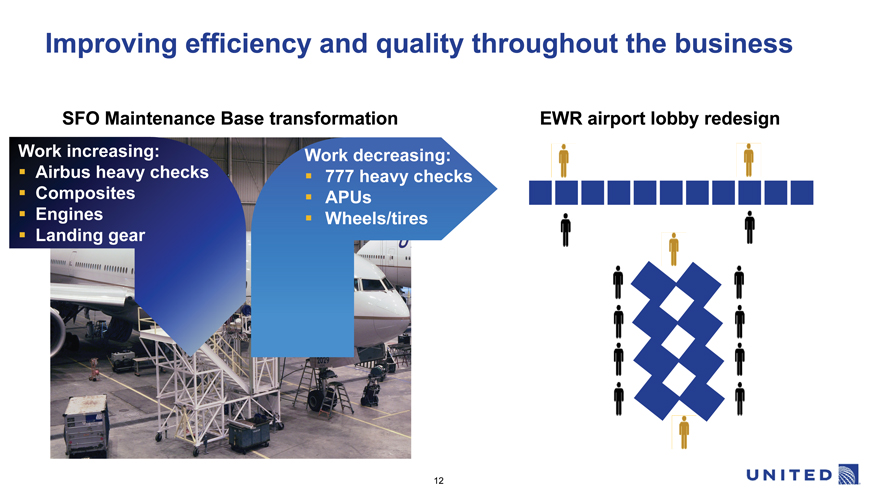
Improving efficiency and quality throughout the business
SFO Maintenance Base transformation EWR airport lobby redesign
Work increasing: Work decreasing:
Airbus heavy checks 777 heavy checks
Composites APUs
Engines Wheels/tires
Landing gear
12
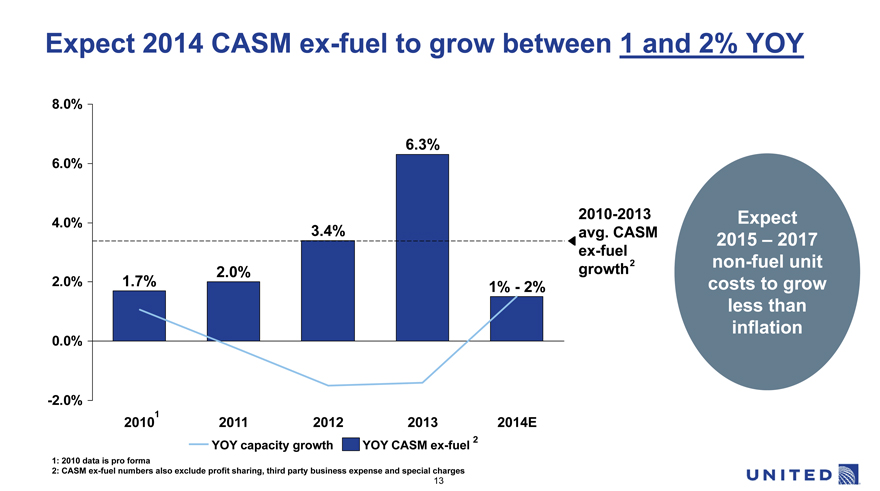
Expect 2014 CASM ex-fuel to grow between 1 and 2% YOY
8.0%
6.3%
6.0%
2010-2013 Expect
4.0%
3.4% avg. CASM
2015 – 2017
ex-fuel
growth 2 non-fuelunit
2.0%
2.0% 1.7% 1% -2% costs to grow less than 00% inflation
-2.0%
1
2010 2011 2012 2013 2014E
YOY capacity growth YOY CASM ex-fuel 2
1: 2010 data is pro forma
2: CASM ex-fuel numbers also exclude profit sharing, third party business expense and special charges
13
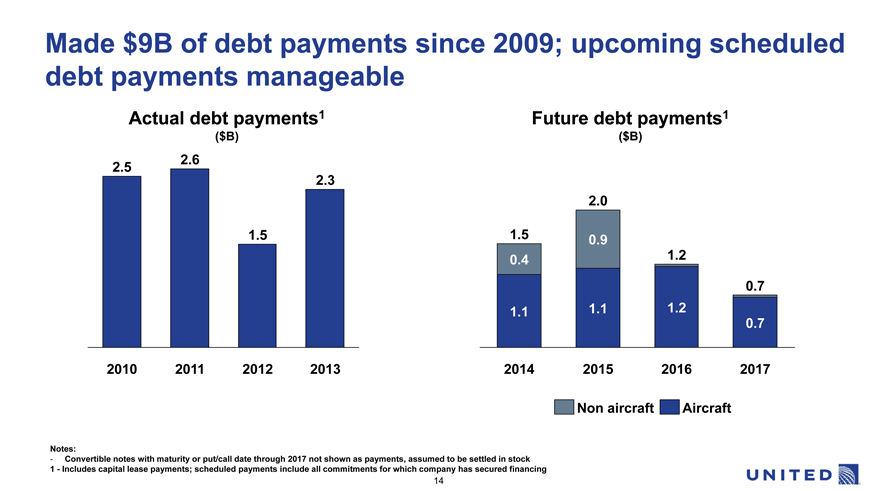
Made $9B of debt payments since 2009; upcoming scheduled debt payments manageable
Actual debt payments 1 Future debt payments 1
($B) ($B)
2.6 2.5
2.3
2.0
1.5 1.5 0.9
0.4 1.2
0.7 1.1 1.1 1.2 0.7
2010 2011 2012 2013 2014 2015 2016 2017
Non aircraft Aircraft
Notes:
- Convertible notes with maturity or put/call date through 2017 not shown as payments, assumed to be settled in stock 1-Includes capital lease payments; scheduled payments include all commitments for which company has secured financing
14
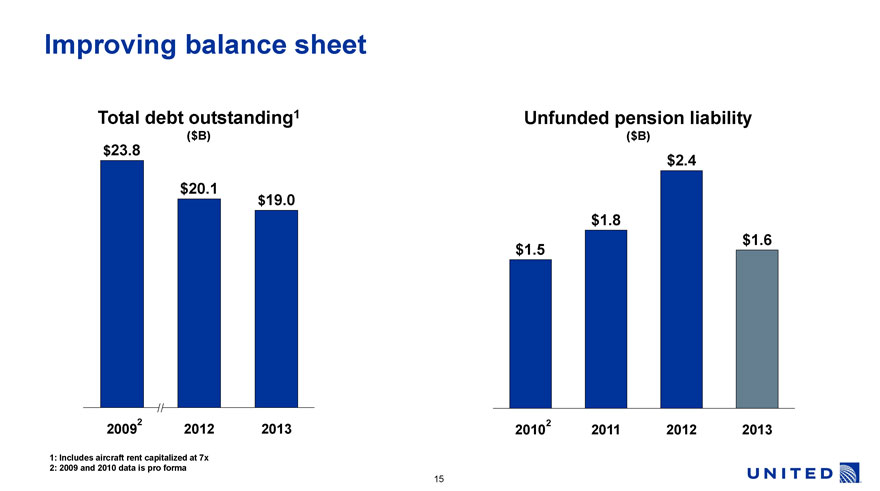
Improving balance sheet
Total debt outstanding1
($B)
$23.8
$20.1
$19.0
2009 2
2012
2013
Unfunded pension liability
($B)
$1.5
$1.8
$2.4
$1.6
2010 2
2011
2012
2013
1: Includes aircraft rent capitalized at 7x
2: 2009 and 2010 data is pro forma
UNITED
15
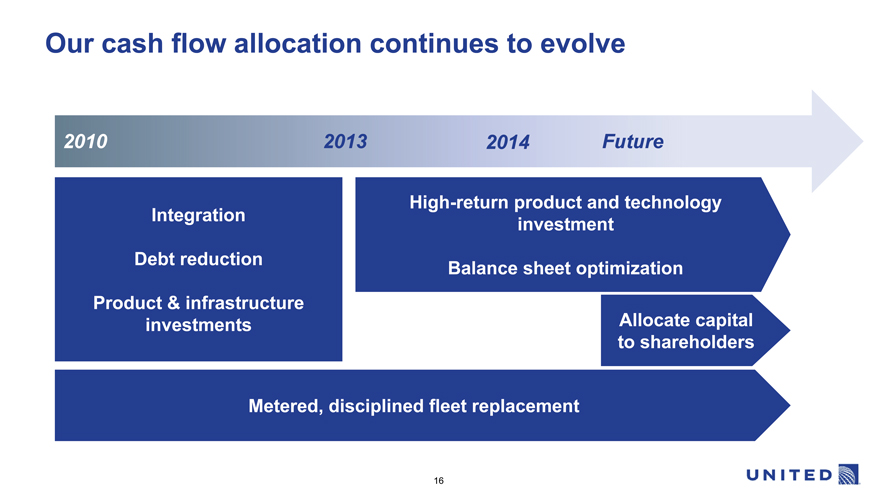
Our cash flow allocation continues to evolve
High-return product and technology Integration investment Debt reduction Balance sheet optimization Product & infrastructure investments Allocate capital to shareholders
Metered, disciplined fleet replacement
16
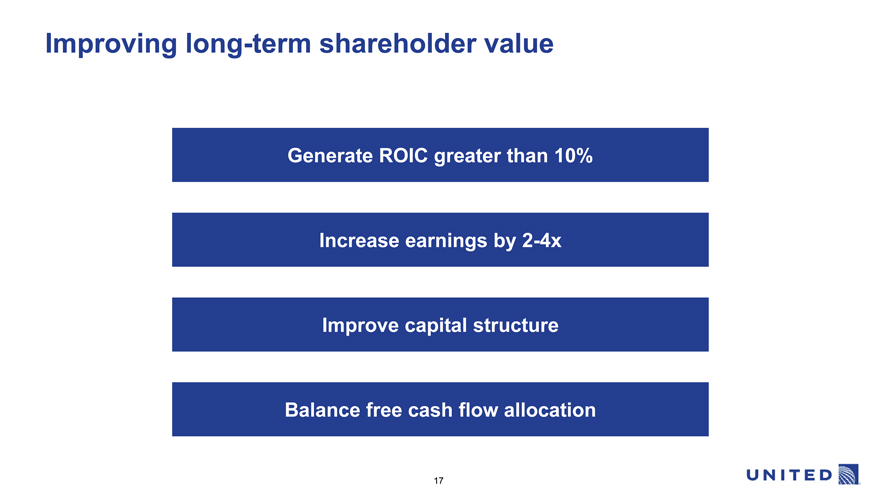
Improving long-term shareholder value
Generate ROIC greater than 10%
Increase earnings by 2-4x
Improve capital structure
Balance free cash flow allocation
17