 Jim Compton Vice Chairman & Chief Revenue Officer John Gebo Senior Vice President Financial Planning & Analysis Exhibit 99.1 |
Safe Harbor Statement 2 Certain statements included in this investor update are forward-looking and thus reflect our current expectations and beliefs with respect to certain current and future events and financial performance. Such forward-looking statements are and will be subject to many risks and uncertainties relating to our operations and business environment that may cause actual results to differ materially from any future results expressed or implied in such forward-looking statements. Words such as “expects,” “will,” “plans,” “anticipates,” “indicates,” “believes,” “forecast,” “guidance,” “outlook” and similar expressions are intended to identify forward-looking statements. Additionally, forward- looking statements include statements that do not relate solely to historical facts, such as statements which identify uncertainties or trends, discuss the possible future effects of current known trends or uncertainties or which indicate that the future effects of known trends or uncertainties cannot be predicted, guaranteed or assured. All forward-looking statements in this report are based upon information available to us on the date of this report. We undertake no obligation to publicly update or revise any forward-looking statement, whether as a result of new information, future events, changed circumstances or otherwise, except as required by applicable law. Our actual results could differ materially from these forward-looking statements due to numerous factors including, without limitation, the following: our ability to comply with the terms of our various financing arrangements; the costs and availability of financing; our ability to maintain adequate liquidity; our ability to execute our operational plans and revenue-generating initiatives, including optimizing our revenue; our ability to control our costs, including realizing benefits from our resource optimization efforts, cost reduction initiatives and fleet replacement programs; our ability to utilize our net operating losses; our ability to attract and retain customers; demand for transportation in the markets in which we operate; an outbreak of a disease that affects travel demand or travel behavior; demand for travel and the impact that global economic conditions have on customer travel patterns; excessive taxation and the inability to offset future taxable income; general economic conditions (including interest rates, foreign currency exchange rates, investment or credit market conditions, crude oil prices, costs of aircraft fuel and energy refining capacity in relevant markets); economic and political instability and other risks of doing business globally; our ability to cost-effectively hedge against increases in the price of aircraft fuel; any potential realized or unrealized gains or losses related to fuel or currency hedging programs; the effects of any hostilities, act of war or terrorist attack; the ability of other air carriers with whom we have alliances or partnerships to provide the services contemplated by the respective arrangements with such carriers; disruptions to our regional network; the costs and availability of aviation and other insurance; industry consolidation or changes in airline alliances; competitive pressures on pricing and on demand; our capacity decisions and the capacity decisions of our competitors; U.S. or foreign governmental legislation, regulation and other actions (including open skies agreements and environmental regulations); labor costs; our ability to maintain satisfactory labor relations and the results of the collective bargaining agreement process with our union groups; any disruptions to operations due to any potential actions by our labor groups; weather conditions; the possibility that expected merger synergies will not be realized or will not be realized within the expected time period; and other risks and uncertainties set forth under Part I, Item 1A, Risk Factors, of UAL’s Annual Report on Form 10-K, as well as other risks and uncertainties set forth from time to time in the reports we file with the SEC. |
 Committed to running a great airline and improving returns 3 Deliver reliability Expand revenue Improve efficiency and quality Strengthen balance sheet |
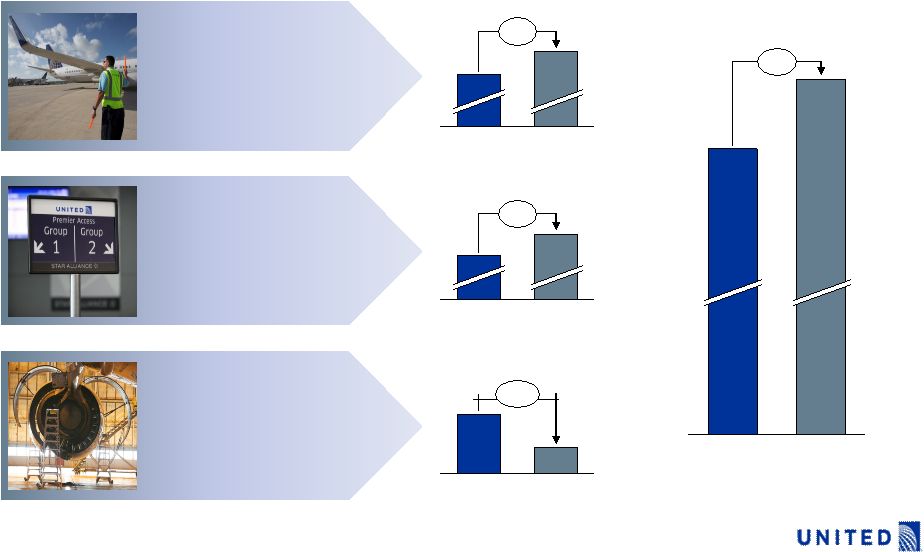 Operational investments have paid off 4 +6% Apr. 2014 Apr. 2013 Mainline on-time arrival On-time boarding Maintenance cancellations (%) On-time departures (D:0) +5% Apr. 2014 Apr. 2013 +3% Apr. 2014 Apr. 2013 -56% Apr. 2014 Apr. 2013 Implemented new arrival and departure procedures to reduce aircraft turn times Enhanced boarding process and new agent interface to improve speed and experience Implemented programs to improve fleet reliability |
 Capacity discipline is central to our strategy 5 United’s capacity vs. U.S. GDP growth (year-over-year) Installing slimline economy seats 10 – 15% lighter than seats they’re replacing Expect to install on ~350 aircraft by YE 2014 Up-gauging regional fleet Adding 27 76-seat E175s in 2014, replacing 50 seaters Adding new Pacific service and down-gauging certain existing routes to B787 2.4% 1.9% 2.8% (1.4%) (1.5%) 2014E 0.5%- 1.5% 2013 2012 Efficient capacity growth in 2014 Sources: SEC filings and IHS Global Insight; 2014E capacity from Apr. 24 Investor Update United consolidated capacity GDP |
 Taking near-term actions to improve our revenue 6 Improve value of network Optimize revenue management practices Restructuring Pacific network Optimizing 747 deployment after improving reliability Re-banking schedules at DEN and IAH De-hubbing CLE Made phased recalibrations to demand forecast Restructuring domestic and short-haul Latin premium cabin fares to improve revenue 2Q End of Year 2Q End of Year - Not yet implemented - Full benefit achieved |
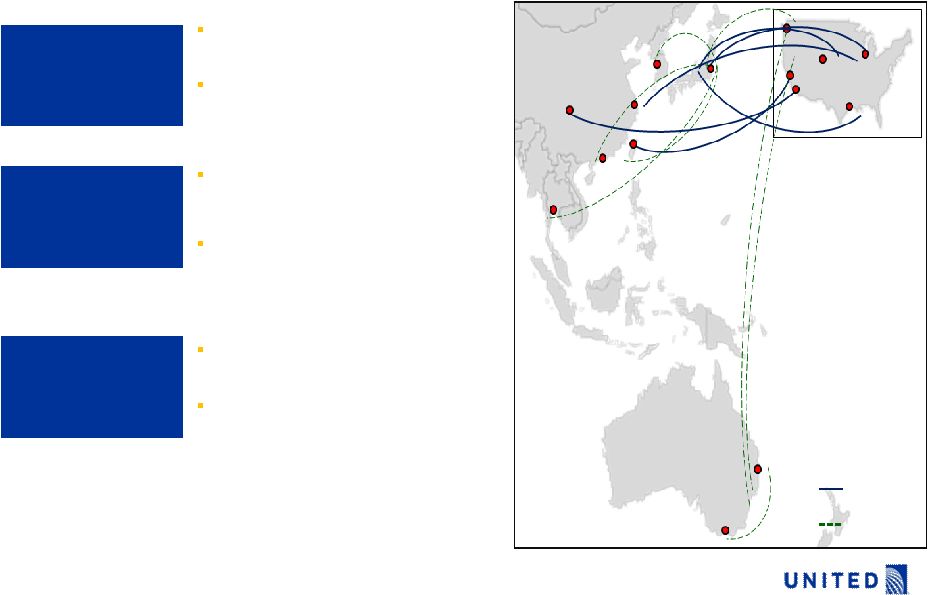 Enhancing our Pacific network 7 Launching non-stop service to Taipei and Chengdu, China Moving Seattle to Tokyo service to second daily Houston-Tokyo Reducing UA intra-Asia service and increasing connectivity with ANA Expect traffic connecting on ANA to increase 30% in 2 nd quarter Deploying B747 from Chicago to Tokyo and Shanghai Downgauging Sydney to B777 Optimizing B747 deployment Restructuring Pacific network Improving joint venture coordination Chicago Seoul Sydney Taipei Houston San Francisco Melbourne Chengdu Shanghai Tokyo Added or up-gauged Eliminated or down-gauged Bangkok Hong Kong Seattle Los Angeles Denver |
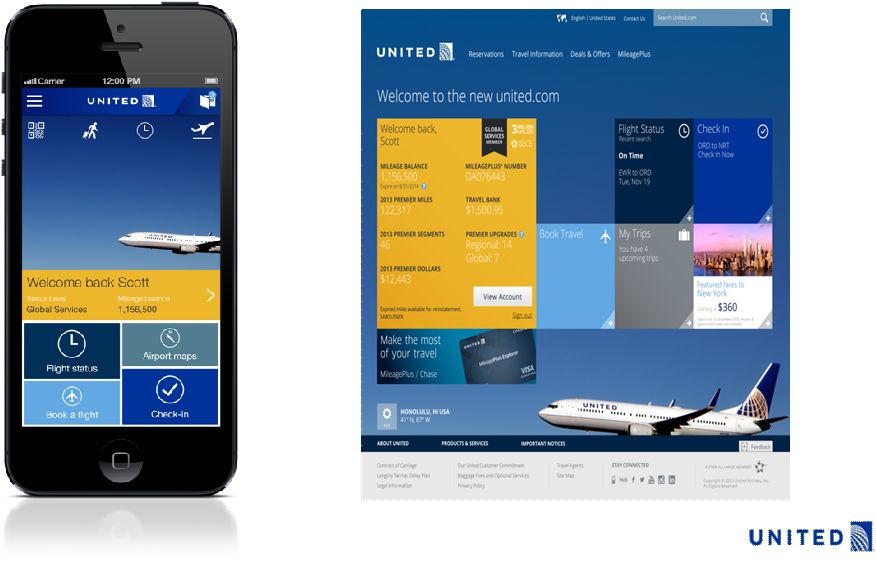 Strengthening our powerful digital tools 8 |
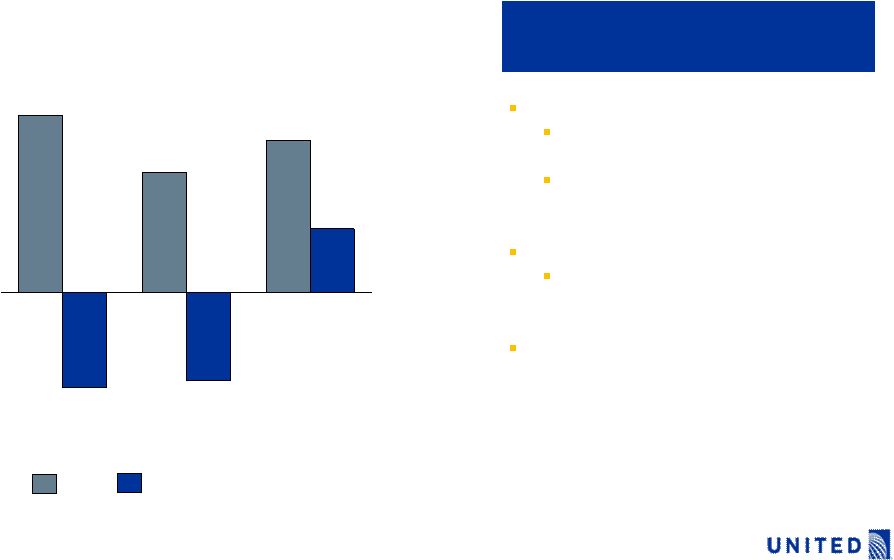
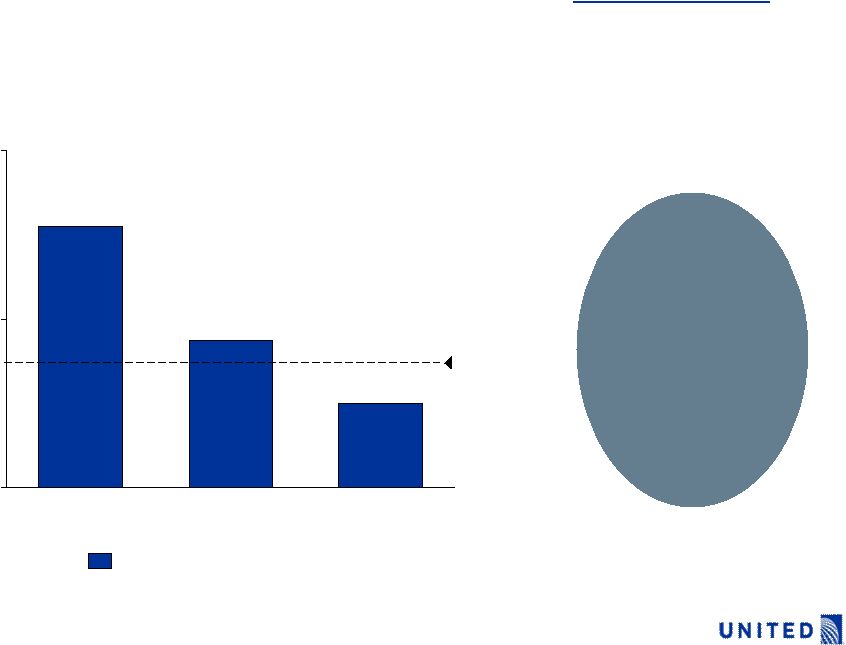
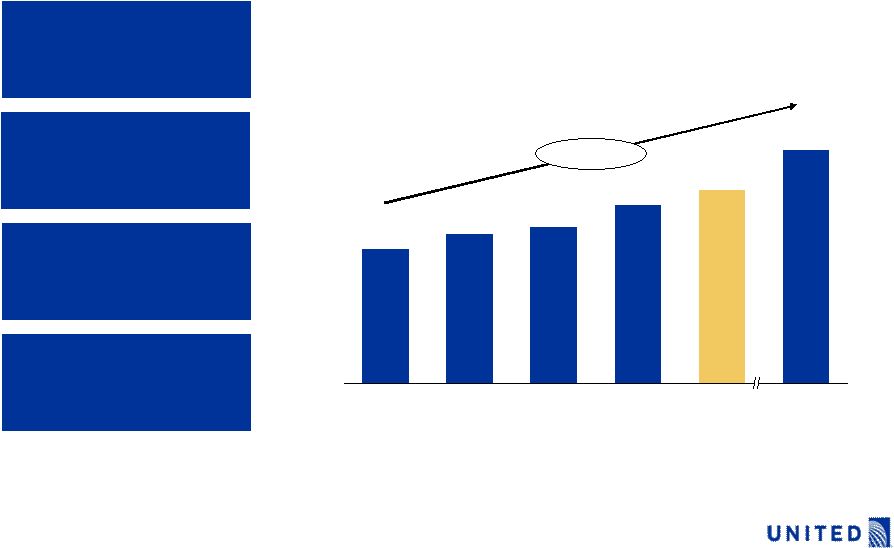 $3.0 $2.8 $2.5 $2.4 $2.2 2014E $3.5+ 2017E +7% CAGR 2013 2012 2011 2010 Expect to make meaningful progress in 2014 toward $3.5 billion ancillary revenue goal 9 Comprehensive and relevant portfolio Powerful and nimble technology platforms Dynamic pricing capabilities Expand availability through other channels Ancillary revenue ($B) 1 1: 2010 results are pro-forma |
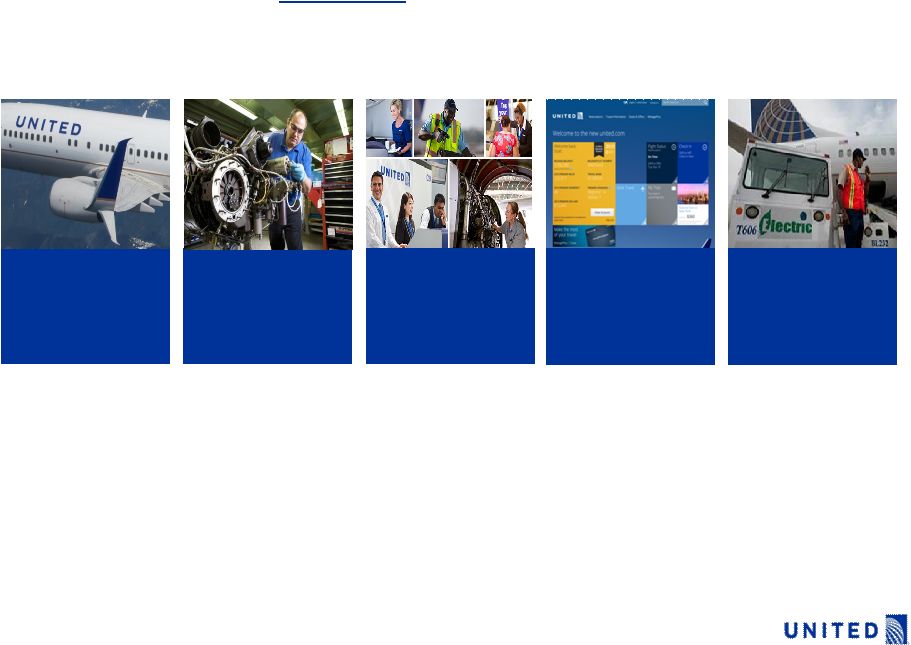 Expect to achieve $2 billion in annual cost savings by 2017 10 Maintenance ~$100M Fuel consumption ~$1B Productivity ~$500M Distribution ~$100M Sourcing ~$150M Efficiency benefit from new aircraft, engineering upgrades and efficient operating processes Realign work with our strengths and implement lean practices Reduce overtime, improve efficiency and deploy self- service technology Shift traffic mix towards optimal distribution channels Reduce sourcing costs through total cost of ownership |
 Expect to achieve $250 - $300 million in non-fuel cost savings in 2014 across every aspect of our business 11 Productivity Sourcing Bring engine contracts in line with market rates Implement best sourcing initiatives Restructure airport rental agreements Redesign airports to improve passenger flows and better match staffing with demand Improve technology and tools employees and customers use Optimize staffing to reduce overtime Two areas with meaningful impact in 2014 |
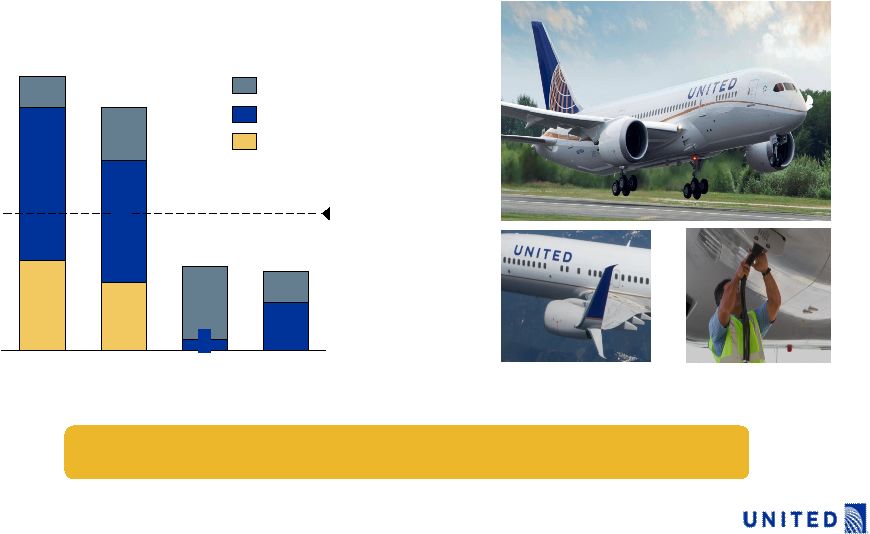 Fuel efficiency to drive $1 billion in annual savings by 2017 12 Firm aircraft deliveries 13 17 Average: 25 mainline AC per year 2017E 15 9 6 2016E 16 2 14 2015E 46 23 10 2014E 52 29 6 B737 B787 E175 Expect to achieve nearly $200M in fuel efficiency savings in 2014 |
 Expect 2014 CASM ex-fuel to grow between 1 and 2% YOY 13 3.1% 0.0% 2.0% 4.0% FY 2014E 1% – 2% 2H 2014E ~1.0% 2Q 2014E 1.25% - 2.25% 1Q 2014 YOY CASM ex-fuel 1 1: CASM ex-fuel numbers also exclude profit sharing, third party business expense and special charges Expect 2015 – 2017 non-fuel unit costs to grow less than inflation |
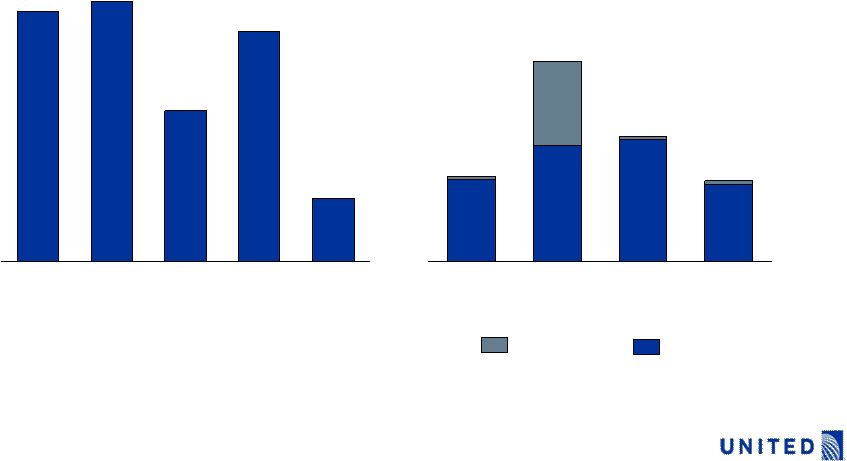 1.2 0.8 2Q - 4Q 2014 0.8 0.8 1.2 2015 2.0 2017 0.8 0.8 2016 1.2 Notes: - Convertible notes with maturity or put/call date through 2017 not shown as payments, assumed to be settled in stock 1 - Includes capital lease payments; scheduled payments include all commitments for which company has secured financing 2 – 2010 data is pro forma Aircraft Non aircraft Actual debt payments¹ ($B) Future debt payments¹ ($B) 0.6 1Q 2014 2012 1.5 2011 2.6 2010 2 2.5 2013 2.3 Made $10 billion of debt payments since 2009; upcoming scheduled debt payments manageable 14 |
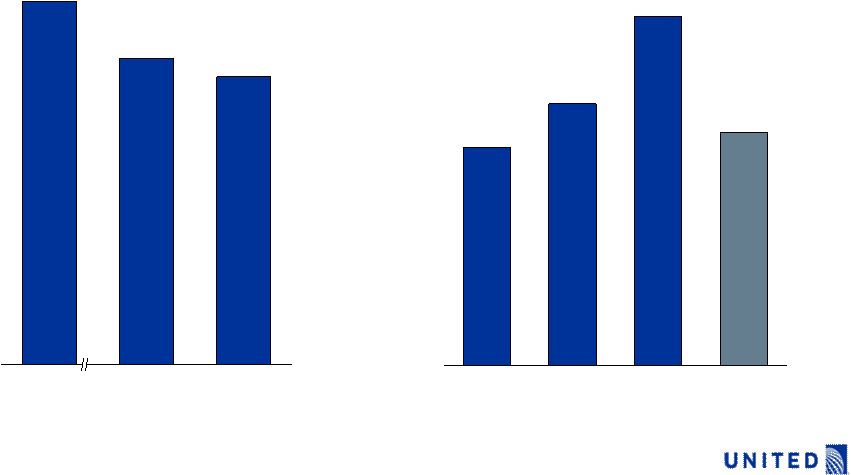 Improving balance sheet 15 Total debt outstanding¹ ($B) 1: Includes annualized aircraft rent capitalized at 7x 2: 2009 and 2010 data is pro forma 1Q 2014 $1.6 2012 $2.4 2011 $1.8 2010 2 $1.5 Unfunded pension liability ($B) 1Q 2014 $18.9 2012 $20.1 2009 2 $23.8 |
 Improving long-term shareholder value 16 Balance free cash flow allocation Increase earnings by 2-4x Improve capital structure Generate ROIC greater than 10% |
 17 |