|
Exhibit 99.1 
|
1Q 2017 Earnings Call April 18, 2017
UNITED A STAR ALLIANCE MEMBER
|
|
Safe Harbor Statement Certain statements included in this presentation are forward-looking and thus reflect our current expectations and beliefs with respect to certain current and future events and anticipated financial and operating performance. Such forward-looking statements are and will be subject to many risks and uncertainties relating to our operations and business environment that may cause actual results to differ materially from any future results expressed or implied in such forward-looking statements. Words such as “expects,” “will,” “plans,” “anticipates,” “indicates,” “believes,” “forecast,” “guidance,” “outlook,” “goals” and similar expressions are intended to identify forward-looking statements. Additionally, forward-looking statements include statements that do not relate solely to historical facts, such as statements which identify uncertainties or trends, discuss the possible future effects of current known trends or uncertainties or which indicate that the future effects of known trends or uncertainties cannot be predicted, guaranteed or assured. All forward-looking statements in this presentation are based upon information available to us on the date of this presentation. We undertake no obligation to publicly update or revise any forward-looking statement, whether as a result of new information, future events, changed circumstances or otherwise, except as required by applicable law. Our actual results could differ materially from these forward-looking statements due to numerous factors including, without limitation, the following: our ability to comply with the terms of our various financing arrangements; the costs and availability of financing; our ability to maintain adequate liquidity; our ability to execute our operational plans and revenue-generating initiatives, including optimizing our revenue; our ability to control our costs, including realizing benefits from our resource optimization efforts, cost reduction initiatives and fleet replacement programs; costs associated with any modification or termination of our aircraft orders; our ability to utilize our net operating losses; our ability to attract and retain customers; potential reputational or other impact from adverse events in our operations; demand for transportation in the markets in which we operate; an outbreak of a disease that affects travel demand or travel behavior; demand for travel and the impact that global economic and political conditions have on customer travel patterns; excessive taxation and the inability to offset future taxable income; general economic conditions (including interest rates, foreign currency exchange rates, investment or credit market conditions, crude oil prices, costs of aircraft fuel and energy refining capacity in relevant markets); our ability to cost-effectively hedge against increases in the price of aircraft fuel if we decide to do so; any potential realized or unrealized gains or losses related to fuel or currency hedging programs; economic and political instability and other risks of doing business globally; the effects of any hostilities, act of war or terrorist attack; the ability of other air carriers with whom we have alliances or partnerships to provide the services contemplated by the respective arrangements with such carriers; the effects of any technology failures or cybersecurity breaches; disruptions to our regional network; the costs and availability of aviation and other insurance; industry consolidation or changes in airline alliances; the success of our investments in airlines in other parts of the world; competitive pressures on pricing and on demand; our capacity decisions and the capacity decisions of our competitors; U.S. or foreign governmental legislation, regulation and other actions (including Open Skies agreements and environmental regulations); the impact of regulatory, investigative and legal proceedings and legal compliance risks; the impact of any management changes; labor costs; our ability to maintain satisfactory labor relations and the results of any collective bargaining agreement process with our union groups; any disruptions to operations due to any potential actions by our labor groups; weather conditions; and other risks and uncertainties set forth under Part I, Item 1A., “Risk Factors,” of our Annual Report on Form10-K for the fiscal year ended December 31, 2016, as well as other risks and uncertainties set forth from time to time in the reports we file with the U.S. Securities and Exchange Commission.2
|

|
Oscar Munoz Opening Remarks Chief Executive Officer UNITED
Scott Kirby President Operations and Commercial Update
UNITED
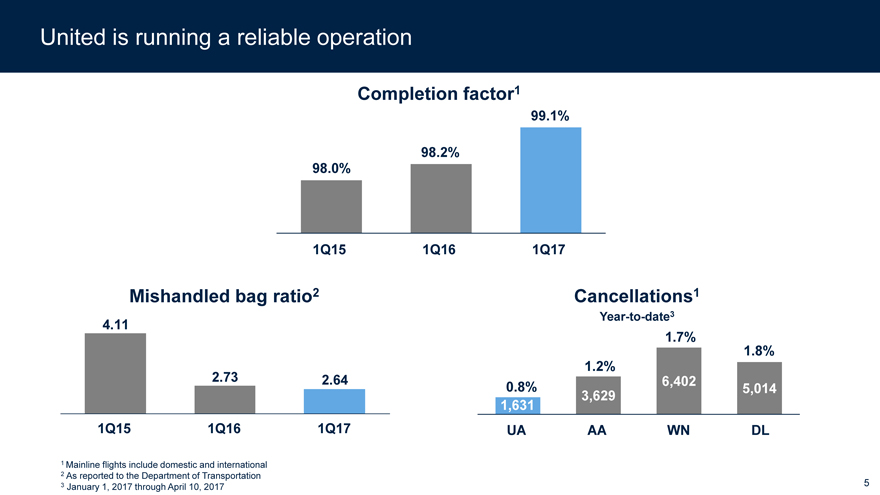
United is running a reliable operation Completion factor1 99.1% 98.2% 98.0% 1Q15 1Q16 1Q17
Cancellations1 Mishandled bag ratio2Year-to-date3 4.11 1.7% 1.8% 1.2% 6,402 2.73 2.64 0.8% 5,014 3,629 1,631 UA AA WN DL 1Q15 1Q16 1Q17 1 Mainline flights include domestic and international 2 January 1, 2017 through April 10, 2017 3 As reported to the Department of Transportation5
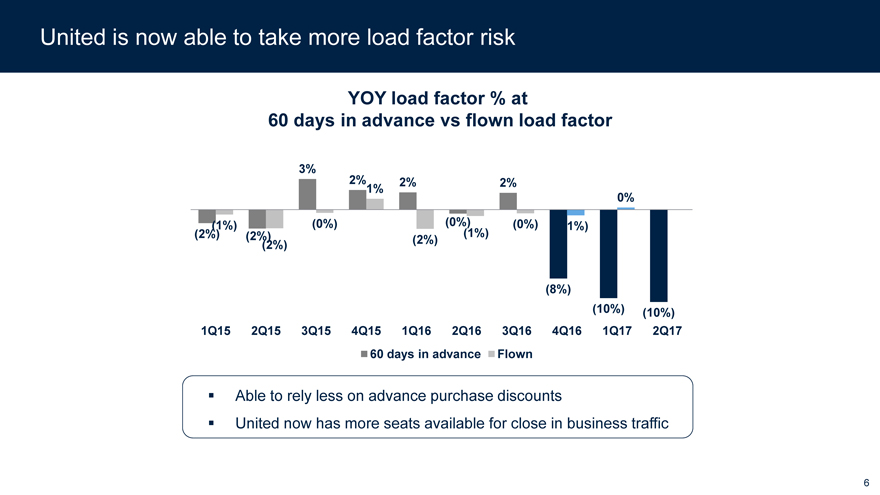
United is now able to take more load factor risk YOY load factor % at 60 days in advance vs flown load factor Able to rely less on advance purchase discounts United now has more seats available for close in business traffic 6
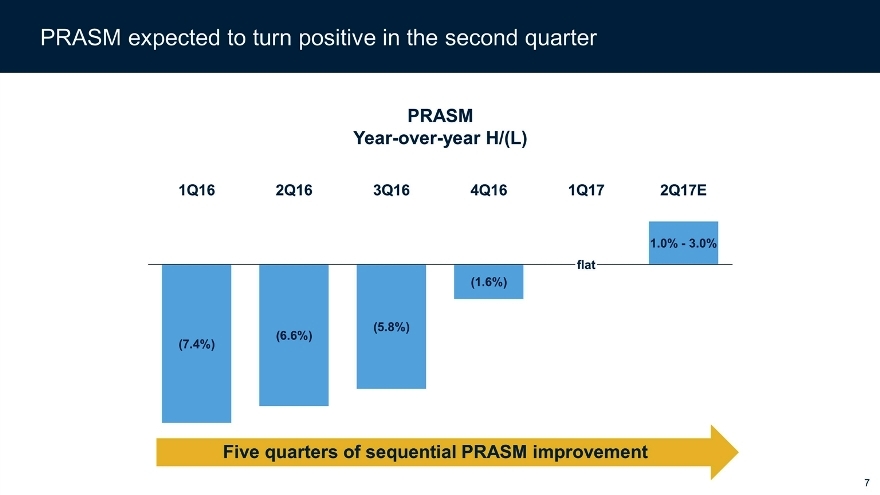
PRASM expected to turn positive in the second quarter flat (1.6%) (5.8%) (6.6%) (7.4%) 1.0% - 3.0% PRASM Year-over-year H/(L) 4Q16 2Q17E 3Q16 2Q16 1Q16 1Q17 Five quarters of sequential PRASM improvement7
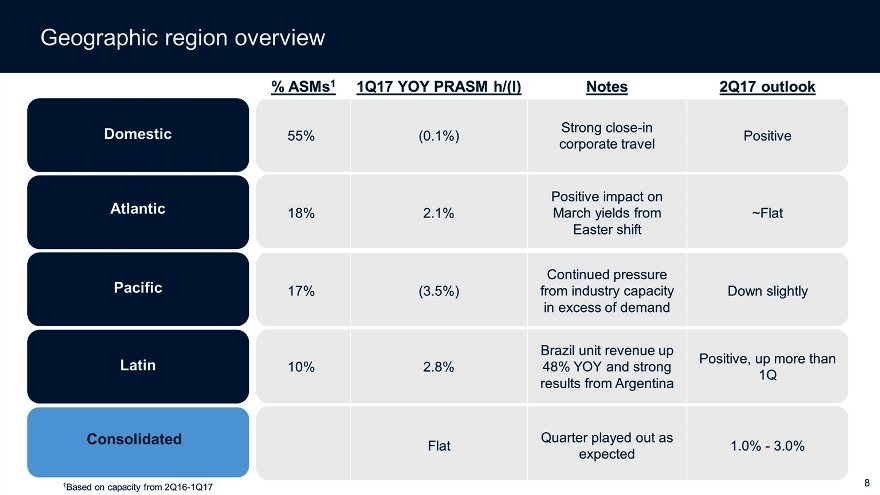
Geographic region overview Domestic Consolidated Latin Pacific Atlantic 1Based on capacity from 2Q16-1Q17 % ASMs1 1Q17 YOY PRASM h/(l) Notes 2Q17 outlook 55% (0.1%) Strongclose-in corporate travel Positive 18% 2.1% Positive impact on March yields from Easter shift ~Flat 17% (3.5%) Continued pressure from industry capacity in excess of demand Down slightly 10% 2.8% Brazil unit revenue up 48% YOY and strong results from Argentina Positive, up more than 1Q Flat Quarter played out as expected 1.0% - 3.0%8
Andrew Levy Financial Update Executive Vice President and Chief Financial Officer
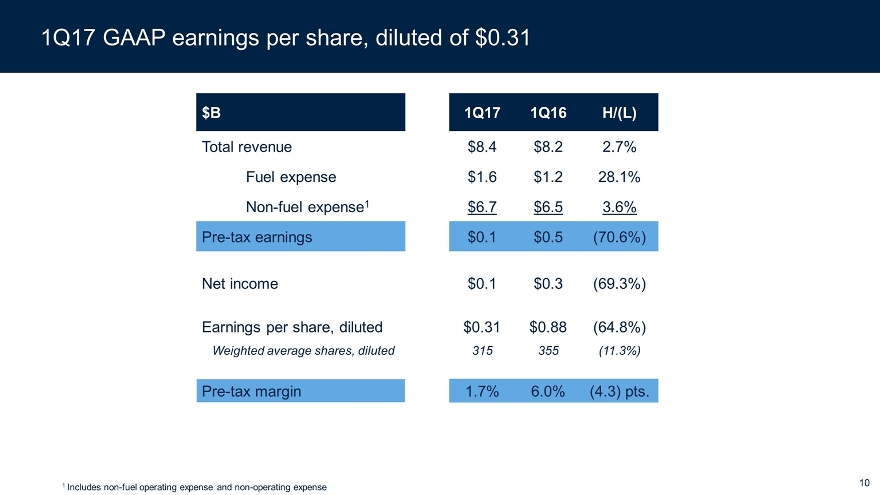
1Q17 GAAP earnings per share, diluted of $0.31 $B 1Q17 1Q16 H/(L) Total revenue $8.4 $8.2 2.7% Fuel expense $1.6 $1.2 28.1%Non-fuel expense1 $6.7 $6.5 3.6%Pre-tax earnings $0.1 $0.5 (70.6%) Net income $0.1 $0.3 (69.3%) Earnings per share, diluted $0.31 $0.88 (64.8%) Weighted average shares, diluted 315 355 (11.3%)Pre-tax margin 1.7% 6.0% (4.3) pts. 1 Includesnon-fuel operating expense andnon-operating expense10
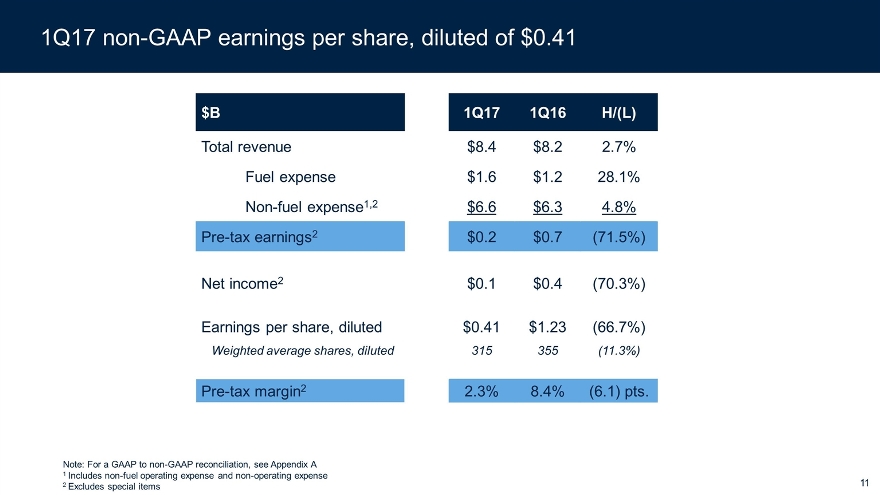
1Q17non-GAAP earnings per share, diluted of $0.41 $B 1Q17 1Q16 H/(L) Total revenue $8.4 $8.2 2.7% Fuel expense $1.6 $1.2 28.1%Non-fuel expense1,2 $6.6 $6.3 4.8%Pre-tax earnings2 $0.2 $0.7 (71.5%) Net income2 $0.1 $0.4 (70.3%) Earnings per share, diluted $0.41 $1.23 (66.7%) Weighted average shares, diluted 315 355 (11.3%)Pre-tax margin2 2.3% 8.4% (6.1) pts. Note: For a GAAP tonon-GAAP reconciliation, see Appendix A 1 Includesnon-fuel operating expense andnon-operating expense 2 Excludes special items11
|
|
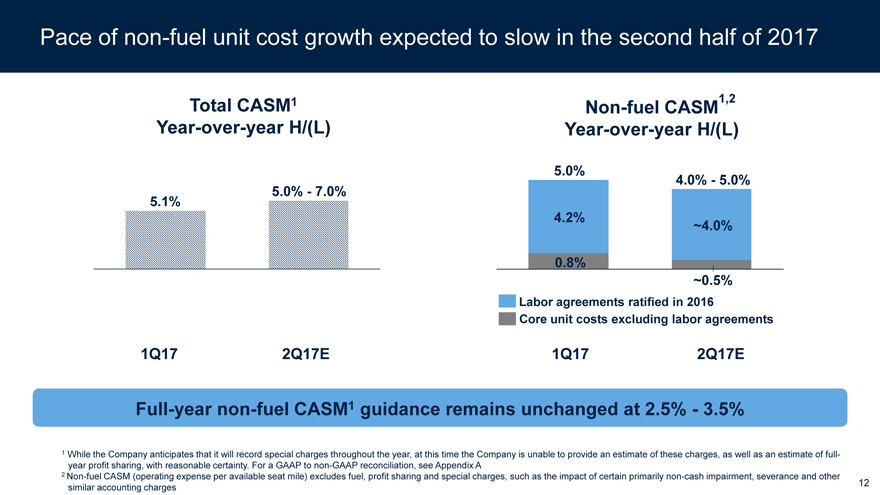
Pace ofnon-fuel unit cost growth expected to slow in the second half of 2017 Total CASM1Non-fuel CASM1,2 Year-over-year H/(L) Year-over-year H/(L) 5.0% 4.0% - 5.0% 5.0% - 7.0% 5.1% 4.2% ~4.0% 0.8% ~0.5% Labor agreements ratified in 2016 Core unit costs excluding labor agreements 1Q17 2Q17E 1Q17 2Q17E Full-yearnon-fuel CASM1 guidance remains unchanged at 2.5% - 3.5% 1 While the Company anticipates that it will record special charges throughout the year, at this time the Company is unable to provide an estimate of these charges, as well as an estimate of full-year profit sharing, with reasonable certainty. For a GAAP tonon-GAAP reconciliation, see Appendix A 2Non-fuel CASM (operating expense per available seat mile) excludes fuel, profit sharing and special charges, such as the impact of certain primarilynon-cash impairment, severance and other 12 similar accounting charges
|
|
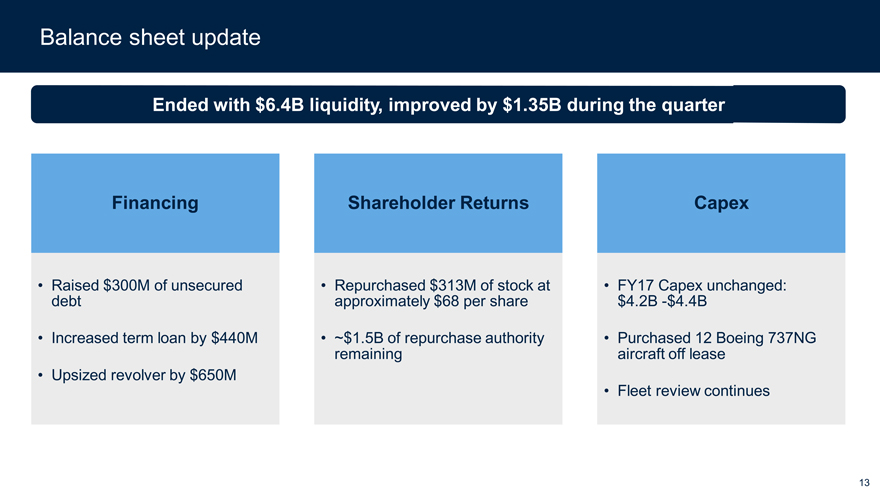
Balance sheet update Ended with $6.4B liquidity, improved by $1.35B during the quarter Financing Shareholder Returns Repurchased $313M of stock at approximately $68 per share Capex Purchased 12 Boeing 737NG aircraft off lease FY17 Capex unchanged: $4.2B-$4.4B Increased term loan by $440M Upsized revolver by $650M ~$1.5B of repurchase authority remaining Fleet review continues Raised $300M of unsecured debt13
|
|
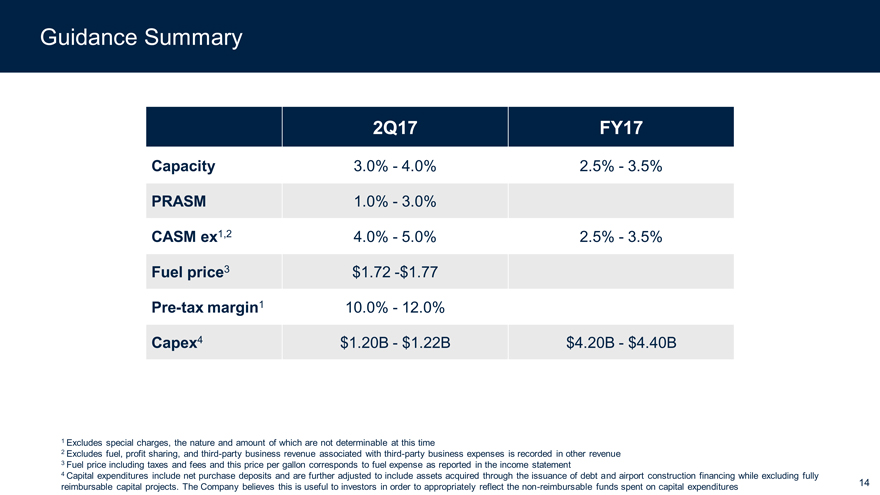
Guidance Summary 2Q17 FY17 Capacity 3.0% - 4.0% 2.5% - 3.5% PRASM 1.0% - 3.0% CASM ex1,2 4.0% - 5.0% 2.5% - 3.5% Fuel price3 $1.72 -$1.77Pre-tax margin1 10.0% - 12.0% Capex4 $1.20B - $1.22B $4.20B - $4.40B 1 Excludes special charges, the nature and amount of which are not determinable at this time 2 Excludes fuel, profit sharing, and third-party business revenue associated with third-party business expenses is recorded in other revenue 3 Fuel price including taxes and fees and this price per gallon corresponds to fuel expense as reported in the income statement 4 Capital expenditures include net purchase deposits and are further adjusted to include assets acquired through the issuance of debt and airport construction financing while excluding fully reimbursable capital projects. The Company believes this is useful to investors in order to appropriately reflect thenon-reimbursable funds spent on capital expenditures14
Question & Answer Session
UNITED
|
|
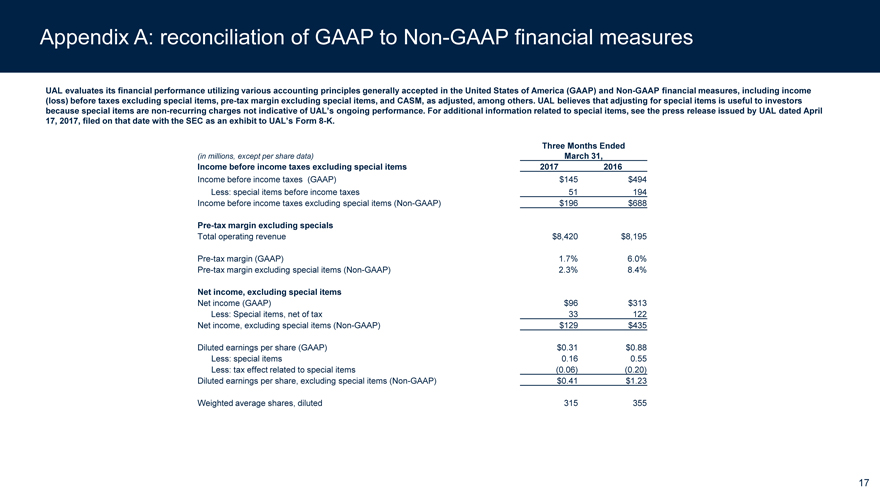
Appendix A: reconciliation of GAAP toNon-GAAP financial measures UAL evaluates its financial performance utilizing various accounting principles generally accepted in the United States of America (GAAP) andNon-GAAP financial measures, including income (loss) before taxes excluding special items,pre-tax margin excluding special items, and CASM, as adjusted, among others. UAL believes that adjusting for special items is useful to investors because special items arenon-recurring charges not indicative of UAL’s ongoing performance. For additional information related to special items, see the press release issued by UAL dated April 17, 2017, filed on that date with the SEC as an exhibit to UAL’s Form8-K. (in millions, except per share data) Three Months Ended March 31, Income before income taxes excluding special items 2017 2016 Income before income taxes (GAAP) $145 $494 Less: special items before income taxes 51 194 Income before income taxes excluding special items(Non-GAAP) $196 $688Pre-tax margin excluding specials Total operating revenue $8,420 $8,195Pre-tax margin (GAAP) 1.7% 6.0%Pre-tax margin excluding special items(Non-GAAP) 2.3% 8.4% Net income, excluding special items Net income (GAAP) $96 $313 Less: Special items, net of tax 33 122 Net income, excluding special items(Non-GAAP) $129 $435 Diluted earnings per share (GAAP) $0.31 $0.88 Less: special items 0.16 0.55 Less: tax effect related to special items (0.06) (0.20) Diluted earnings per share, excluding special items(Non-GAAP) $0.41 $1.23 Weighted average shares, diluted 315 355 17
|
|
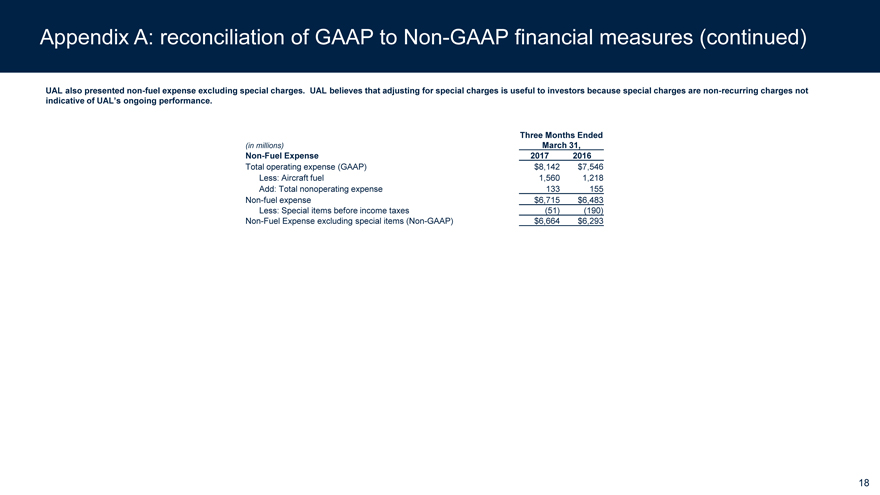
Appendix A: reconciliation of GAAP toNon-GAAP financial measures (continued) UAL also presentednon-fuel expense excluding special charges. UAL believes that adjusting for special charges is useful to investors because special charges arenon-recurring charges not indicative of UAL’s ongoing performance. (in millions) Three Months Ended March 31,Non-Fuel Expense 2017 2016 Total operating expense (GAAP) $8,142 $7,546 Less: Aircraft fuel 1,560 1,218 Add: Total nonoperating expense 133 155Non-fuel expense $6,715 $6,483 Less: Special items before income taxes (51) (190)Non-Fuel Expense excluding special items(Non-GAAP) $6,664 $6,293 18
|
|
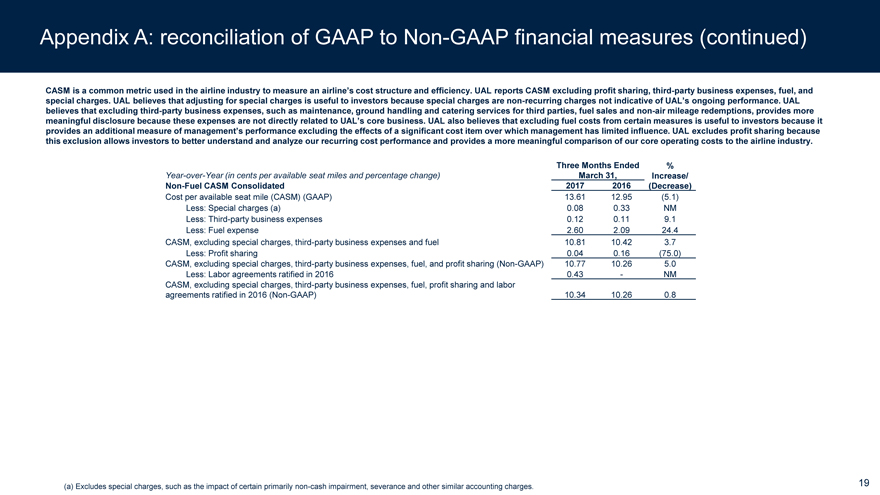
Appendix A: reconciliation of GAAP toNon-GAAP financial measures (continued) CASM is a common metric used in the airline industry to measure an airline’s cost structure and efficiency. UAL reports CASM excluding profit sharing, third-party business expenses, fuel, and special charges. UAL believes that adjusting for special charges is useful to investors because special charges arenon-recurring charges not indicative of UAL’s ongoing performance. UAL believes that excluding third-party business expenses, such as maintenance, ground handling and catering services for third parties, fuel sales andnon-air mileage redemptions, provides more meaningful disclosure because these expenses are not directly related to UAL’s core business. UAL also believes that excluding fuel costs from certain measures is useful to investors because it provides an additional measure of management’s performance excluding the effects of a significant cost item over which management has limited influence. UAL excludes profit sharing because this exclusion allows investors to better understand and analyze our recurring cost performance and provides a more meaningful comparison of our core operating costs to the airline industry. Year-over-Year (in cents per available seat miles and percentage change) Three Months Ended March 31, % Increase/ (Decrease)Non-Fuel CASM Consolidated 2017 2016 Cost per available seat mile (CASM) (GAAP) 13.61 12.95 (5.1) Less: Special charges (a) 0.08 0.33 NM Less: Third-party business expenses 0.12 0.11 9.1 Less: Fuel expense 2.60 2.09 24.4 CASM, excluding special charges, third-party business expenses and fuel 10.81 10.42 3.7 Less: Profit sharing 0.04 0.16 (75.0) CASM, excluding special charges, third-party business expenses, fuel, and profit sharing(Non-GAAP) 10.77 10.26 5.0 Less: Labor agreements ratified in 2016 0.43 - NM CASM, excluding special charges, third-party business expenses, fuel, profit sharing and labor agreements ratified in 2016(Non-GAAP) 10.34 10.26 0.8 (a) Excludes special charges, such as the impact of certain primarilynon-cash impairment, severance and other similar accounting charges. 19
|
|
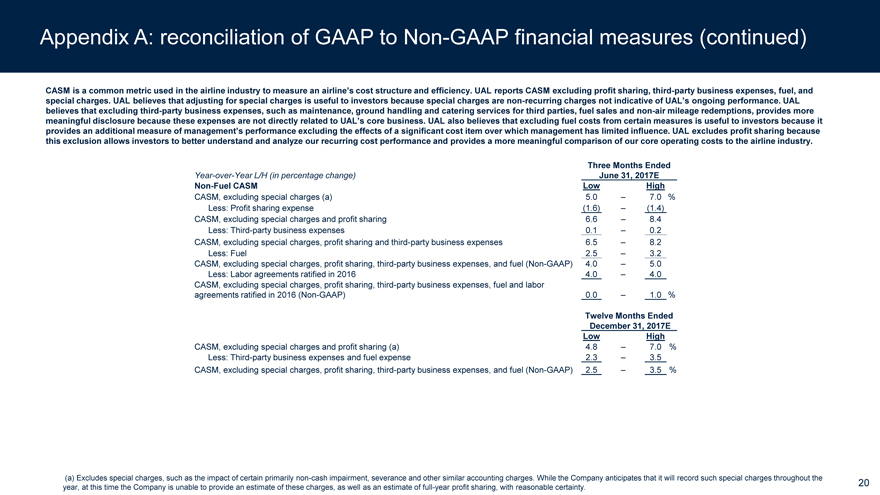
Appendix A: reconciliation of GAAP toNon-GAAP financial measures (continued) CASM is a common metric used in the airline industry to measure an airline’s cost structure and efficiency. UAL reports CASM excluding profit sharing, third-party business expenses, fuel, and special charges. UAL believes that adjusting for special charges is useful to investors because special charges arenon-recurring charges not indicative of UAL’s ongoing performance. UAL believes that excluding third-party business expenses, such as maintenance, ground handling and catering services for third parties, fuel sales andnon-air mileage redemptions, provides more meaningful disclosure because these expenses are not directly related to UAL’s core business. UAL also believes that excluding fuel costs from certain measures is useful to investors because it provides an additional measure of management’s performance excluding the effects of a significant cost item over which management has limited influence. UAL excludes profit sharing because this exclusion allows investors to better understand and analyze our recurring cost performance and provides a more meaningful comparison of our core operating costs to the airline industry. Year-over-Year L/H (in percentage change) Three Months Ended June 31, 2017ENon-Fuel CASM Low High CASM, excluding special charges (a) 5.0 – 7.0 % Less: Profit sharing expense (1.6) – (1.4) CASM, excluding special charges and profit sharing 6.6 – 8.4 Less: Third-party business expenses 0.1 – 0.2 CASM, excluding special charges, profit sharing and third-party business expenses 6.5 – 8.2 Less: Fuel 2.5 – 3.2 CASM, excluding special charges, profit sharing, third-party business expenses, and fuel(Non-GAAP) 4.0 – 5.0 Less: Labor agreements ratified in 2016 4.0 – 4.0 CASM, excluding special charges, profit sharing, third-party business expenses, fuel and labor agreements ratified in 2016(Non-GAAP) 0.0 – 1.0 % Twelve Months Ended December 31, 2017E Low High CASM, excluding special charges and profit sharing (a) 4.8 – 7.0 % Less: Third-party business expenses and fuel expense 2.3 – 3.5 CASM, excluding special charges, profit sharing, third-party business expenses, and fuel(Non-GAAP) 2.5 – 3.5 % (a) Excludes special charges, such as the impact of certain primarilynon-cash impairment, severance and other similar accounting charges. While the Company anticipates that it will record such special charges throughout the year, at this time the Company is unable to provide an estimate of these charges, as well as an estimate of full-year profit sharing, with reasonable certainty. 19