 Q1 2015 Financial Results Conference Call May 7, 2015 A global industrial technology company focused on environmental, energy, fluid handling industries Exhibit 99.2 |
 Non-GAAP Financial Information CECO is providing the non-GAAP historical financial measures in this presentation, as the Company believes that these figures are helpful in allowing individuals to better assess the ongoing nature of CECO’s core operations. A "non-GAAP financial measure" is a numerical measure of a company's historical financial performance that excludes amounts that are included in the most directly comparable measure calculated and presented in the GAAP statement of operations. Non-GAAP gross margin, non-GAAP operating income, non-GAAP net income, non-GAAP adjusted EBITDA, non-GAAP gross profit margin, non- GAAP operating margin, non-GAAP earnings per basic and diluted share, as we present them in the financial data included in this presentation, have been adjusted to exclude the effects of expenses related to property, plant, and equipment valuation adjustments, acquisition and integration expense activities including retention, legal, accounting, banking, amortization and earnout expenses, the impact of foreign currency remeasurement and the associated tax benefit of these charges. Management believes that these items are not necessarily indicative of the Company’s ongoing operations and their exclusion provides individuals with additional information to compare the Company's results over multiple periods. Additionally, management utilizes this information to evaluate its ongoing financial performance. Our financial statements may continue to be affected by items similar to those excluded in the non-GAAP adjustments described above, and exclusion of these items from our non-GAAP financial measures should not be construed as an inference that all such costs are unusual or infrequent. Non-GAAP gross margin, non-GAAP operating income, non-GAAP net income, non-GAAP adjusted EBITDA, non-GAAP gross profit margin, non- GAAP operating margin, and non-GAAP earnings per basic and diluted shares are not calculated in accordance with GAAP, and should be considered supplemental to, and not as a substitute for, or superior to, financial measures calculated in accordance with GAAP. Non-GAAP financial measures have limitations in that they do not reflect all of the costs associated with the operations of our business as determined in accordance with GAAP. As a result, you should not consider these measures in isolation or as a substitute for analysis of CECO’s results as reported under GAAP. In accordance with the requirements of Regulation G issued by the Securities and Exchange Commission, non-GAAP gross margin, non-GAAP operating income, non-GAAP net income, non-GAAP adjusted EBITDA, non-GAAP gross profit margin, non-GAAP operating margin, and non-GAAP earnings per basic and diluted share stated in the tables above are reconciled to the most directly comparable GAAP financial measures. Free cash flow has limitations due to the fact that it does not represent the residual cash flow available for discretionary expenditures, since it does not take into account debt service requirements or other non-discretionary expenditures that are not deducted from the measure. Adjusted EBITDA and Free Cash Flow are not calculated in accordance with GAAP, and should be considered supplemental to, and not as a substitute for, or superior to, financial measures calculated in accordance with GAAP Additionally, CECO cautions investors that the non-GAAP financial measures used by the Company may not be comparable to similarly titled measures of other companies. Safe Harbor Statement 2 |
 Forward-looking Statements Any statements contained in this presentation other than statements of historical fact, including statements about management’s beliefs and expectations, are forward-looking statements and should be evaluated as such. These statements are made on the basis of management’s views and assumptions regarding future events and business performance. Words such as “estimate,” “believe,” “anticipate,” “expect,” “intend,” “plan,” “target,” “project,” “should,” “may,” “will” and similar expressions are intended to identify forward- looking statements. Forward-looking statements (including oral representations) involve risks and uncertainties that may cause actual results to differ materially from any future results, performance or achievements expressed or implied by such statements. These risks and uncertainties include, but are not limited to: our ability to successfully complete the acquisition of PMFG; our ability to successfully integrate acquired businesses and realize the synergies from acquisitions, including PMFG, as well as a number of factors related to our business including economic and financial market conditions generally and economic conditions in CECO’s service areas; dependence on fixed price contracts and the risks associated therewith, including actual costs exceeding estimates and method of accounting for contract revenue; fluctuations in operating results from period to period due to seasonality of the business; the effect of growth on CECO’s infrastructure, resources, and existing sales; the ability to expand operations in both new and existing markets; the potential for contract delay or cancellation; changes in or developments with respect to any litigation or investigation; the potential for fluctuations in prices for manufactured components and raw materials; the substantial amount of debt incurred in connection with our recent acquisitions and our ability to repay or refinance it or incur additional debt in the future; the impact of federal, state or local government regulations; economic and political conditions generally; and the effect of competition in the product recovery, air pollution control and fluid handling and filtration industries. These and other risks and uncertainties are discussed in more detail in CECO’s filings with the Securities and Exchange Commission, including our reports on Form 10-K and Form 10-Q. Many of these risks are beyond management’s ability to control or predict. Should one or more of these risks or uncertainties materialize, or should the assumptions prove incorrect, actual results may vary in material aspects from those currently anticipated. Investors are cautioned not to place undue reliance on such forward-looking statements as they speak only to our views as of the date the statement is made. All forward-looking statements attributable to CECO or persons acting on behalf of CECO are expressly qualified in their entirety by the cautionary statements and risk factors contained in this presentation and CECO’s respective filings with the Securities and Exchange Commission. Furthermore, forward-looking statements speak only as of the date they are made. Except as required under the federal securities laws or the rules and regulations of the Securities and Exchange Commission, CECO undertakes no obligation to update or review any forward-looking statements, whether as a result of new information, future events or otherwise. Safe Harbor Statement 3 |
 Important Information for Investors and Stockholders This communication does not constitute an offer to sell or the solicitation of an offer to buy securities or a solicitation of any vote or approval. This communication is not a substitute for the prospectus/proxy statement that CECO and PMFG will file with the SEC. Investors in CECO or PMFG are urged to read the prospectus/proxy statement, which will contain important information, including detailed risk factors, when it becomes available. The prospectus/proxy statement and other documents that will be filed by CECO and PMFG with the SEC will be available free of charge at the SEC’s website, www.sec.gov, or by directing a request when such a filing is made to (1) CECO Environmental Corp., by mail at 4625 Red Bank Road Suite 200, Cincinnati, Ohio 45227, Attention: Investor Relations, by telephone at 800-333-5475 or by going to CECO’s Investor page on its corporate website at www.cecoenviro.com; or (2) PMFG, Inc. by mail at 14651 North Dallas Parkway Suite 500, Dallas, Texas 75254, Attention: Investor Relations, by telephone at 877- 879-7634, or by going to PMFG, Inc.’s Investors page on its corporate website at www.pmfginc.com. A final prospectus/proxy statement will be mailed to CECO’s stockholders and shareholders of PMFG. Safe Harbor Statement 4 Proxy Solicitation CECO and PMFG, and certain of their respective directors, executive officers and other members of management and employees may be deemed participants in the solicitation of proxies in connection with the proposed transactions. Information about the directors and executive officers of CECO is set forth in the proxy statement for CECO’s 2015 annual meeting of stockholders and CECO’s 10-K for the year ended December 31, 2014. Information about the directors and executive officers of PMFG is set forth in the proxy statement for PMFG’s 2014 annual meeting of shareholders and PMFG’s Form 10-K for the year ended June 28, 2014. Investors may obtain additional information regarding the interests of such participants in the proposed transactions by reading the prospectus/proxy statement for such proposed transactions when it becomes available. |
 Jeff Lang President and Chief Executive Officer 5 |
 6 • Revenue – Revenue of $81 million, up 41.6% year-over-year – Revenue on an organic basis is up 8.6% vs. 1Q14 using constant FX • Bookings / Backlog – 1Q15 bookings of $93.9 million up 48% year-over-year – Organic bookings up 9.3% in Q1, $69.5 million vs. $63.6 million in prior year – Record backlog of $153.0 million vs. $140.1 million at year end, up 9.2% • EPS – GAAP EPS for 1Q15 of $0.01 compared to $0.12 in 1Q14 – Non-GAAP EPS for 1Q15 of $0.21 vs. $0.19 in 1Q14 1Q15 Quarterly Financial Highlights |
 1Q15 Quarterly Financial Highlights 7 • Non-GAAP Gross Margin – Gross margin of 26% compared to 35% in prior year, primarily attributable to: • Expected shift in mix and 2014 acquisitions which have reshaped our gross profit • The large strategic energy job • Underperformance of Emtrol and Effox in Q1 • Non-GAAP Operating Margin – The gross margin decrease adversely impacted operating margins, – However, SG&A declined as a percentage of sales to 17% from a little over 20% last year, offsetting a portion of the gross profit decline – As such, operating margins decreased 520 bps to 9.3% over last year’s 14.5% • Adjusted EBITDA – Adjusted EBITDA of $8.6 million, down from $9.4 million in prior year |
 Business Conditions & Strategic Review 8 • Overall end markets are unchanged; we are executing better on our Sales Excellence and initiatives. • Environmental segment continues to gain momentum • Energy segment – global natural gas power generation business is up. Solid fuel is picking up globally but soft domestically; we are bolstering with after-market strategies • Fluid Handling and Filtration is on track for a solid 2015 • Integration of Zhongli and Emtrol are ahead of plan • Aftermarket sales continues to gain momentum • Acquisition of PMFG a significant strategic event |
 9 Strong strategic fit 1. Key step towards becoming market leader, including natural gas value chain 3. Enhances global footprint, particularly in China and the Middle East 5. 4. Provides access to attractive end markets to drive long-term growth 6. Brings a leading portfolio of highly engineered product offerings 8. Poised to benefit from a balanced portfolio and diverse end markets 7. Grows aftermarket & recurring revenue opportunity 2. Poised to achieve significant sales and cost synergies Announcement of Proposed Acquisition of PMFG, Inc. - Key Transaction Benefits & Strategic Rationale |
 10 (1) Pro forma for the full year impact of the Emtrol, Zhongli, HEE, and SAT acquisitions. (2) Includes $15M of synergies that are expected to be fully-realized in 2017. (3) See Appendix for reconciliation for Adjusted EBITDA and Adjusted EBITDA with synergies to net income Illustrative 2014 Revenues & EBITDA Bridge ($ in millions) Gross Margin (%) Gross Profit Revenues Adj. EBITDA (w/ Syn.) (3) SG&A SG&A (%) Adj. EBITDA (3) 30.0% 28.9% 29.6% $98.4 $45.7 $144.1 $327.9 $158.1 $486.0 $60.0 (2) $109.5 $58.0 $51.5 17.7% 32.6% 22.5% $47.1 ($2.1) $45.0 Pro Forma (12/31/2014) (12/31/2014) Standalone (1) |
 Ed Prajzner Chief Financial Officer 11 |
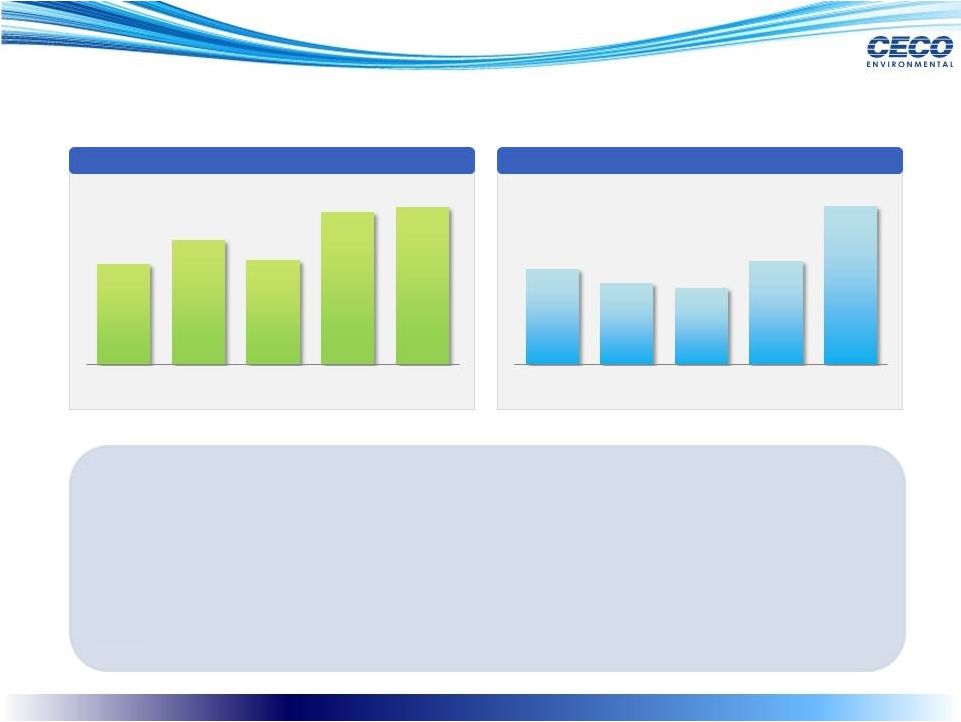
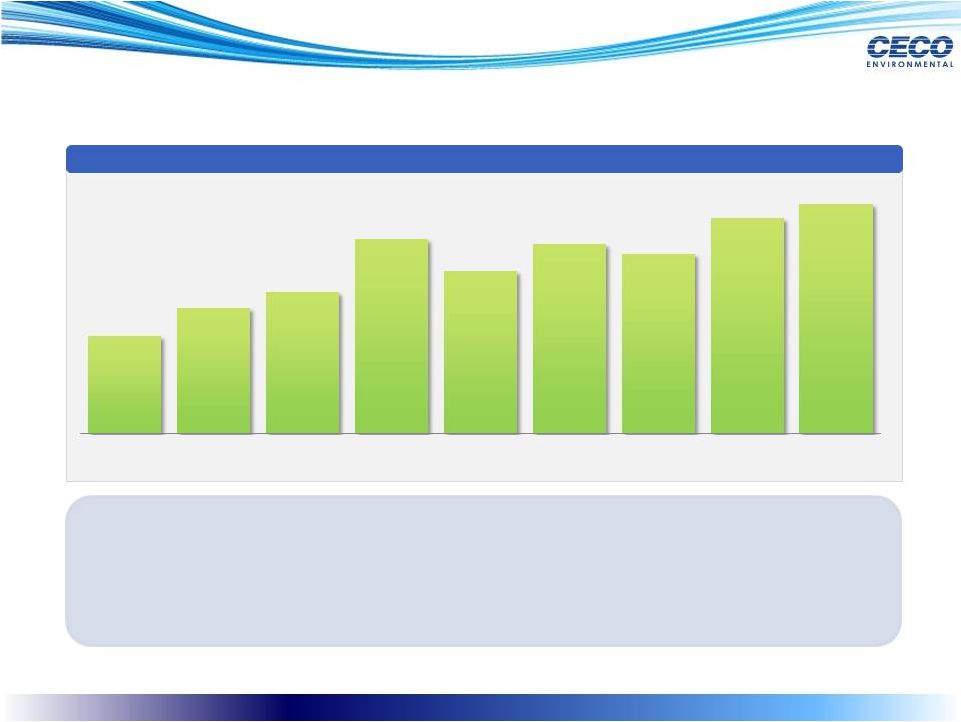 12 • Record revenue of $81.0 million, up 42% y/y and 6% sequentially • 2014 acquisitions added approximately $20.5 y/y • On a constant currency basis, organic revenue grew 8.6% ($ in millions) 1Q15 Quarterly Financial Highlights Revenue $34.4 $44.4 $49.8 $68.7 $57.2 $66.6 $63.3 $76.1 $81.0 1Q13 2Q13 3Q13 4Q13 1Q14 2Q14 3Q14 4Q14 1Q15 |
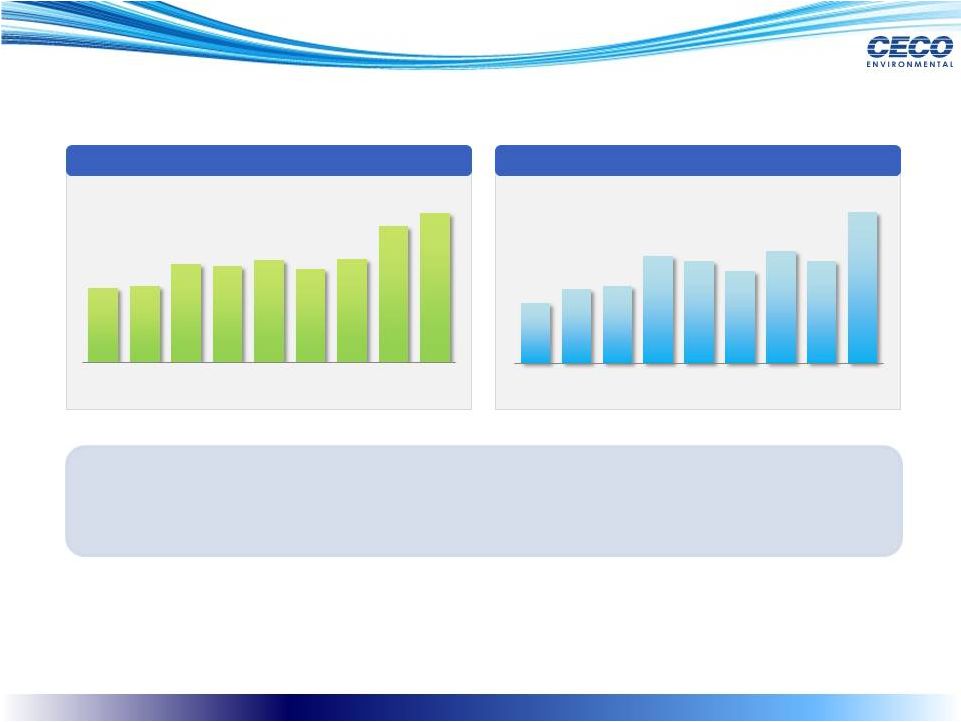 Backlog ($ in millions) 13 1Q15 Quarterly Financial Highlights Bookings • Solid 1Q15 backlog of $153.0 million, up 9.2% from year end • Strong 1Q15 bookings of $93.9 million, up 9.3% organically $75.8 $77.9 $100.4 $98.5 $104.9 $96.0 $106.2 $140.1 $153.0 1Q13 2Q13 3Q13 4Q13 1Q14 2Q14 3Q14 4Q14 1Q15 $37.6 $46.5 $48.0 $66.8 $63.6 $57.7 $69.9 $63.7 $93.9 1Q13 2Q13 3Q13 4Q13 1Q14 2Q14 3Q14 4Q14 1Q15 |
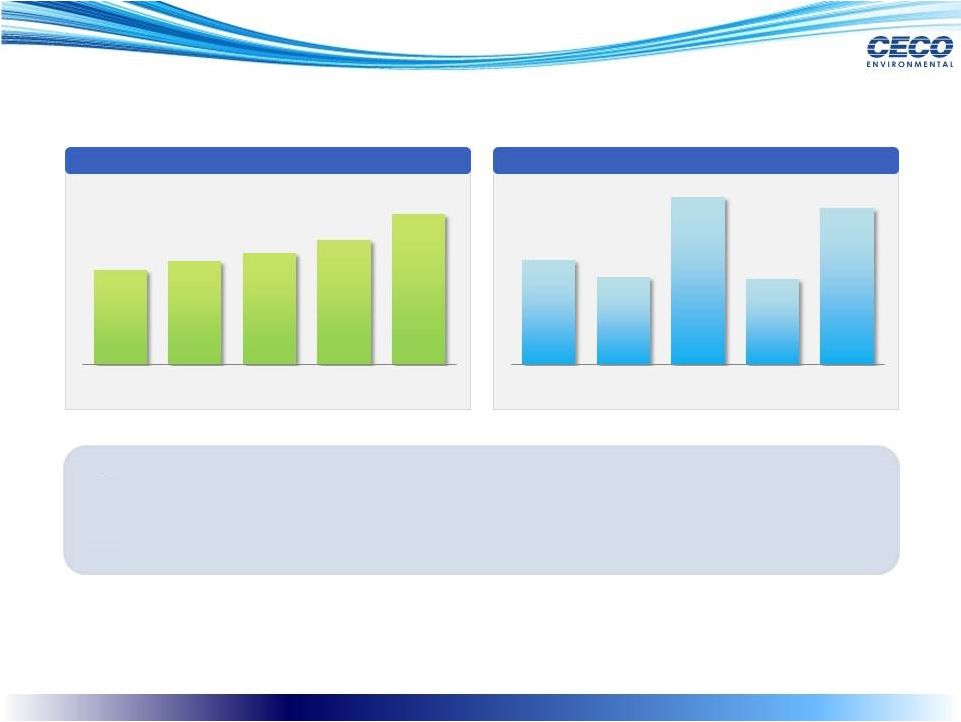
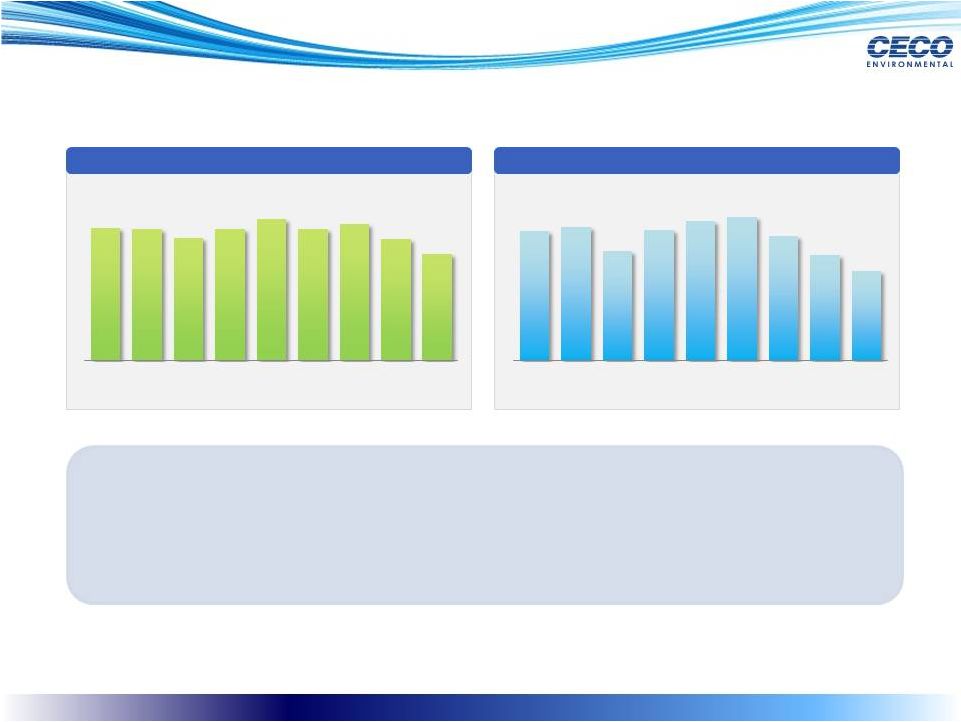 14 1Q15 Financial Highlights Non-GAAP Gross Margin • Non-GAAP gross margin of 26.2% due to expected mix changes and acquisitions • Operating margin of 9.3%, down 520 bps y/y and down 160 bps q/q • Good SG&A control Non-GAAP Operating Margin 32.6% 32.2% 30.1% 32.4% 34.8% 32.3% 33.6% 29.8% 26.2% 1Q13 2Q13 3Q13 4Q13 1Q14 2Q14 3Q14 4Q14 1Q15 13.4% 13.9% 11.4% 13.6% 14.5% 14.9% 12.9% 10.9% 9.3% 1Q13 2Q13 3Q13 4Q13 1Q14 2Q14 3Q14 4Q14 1Q15 |
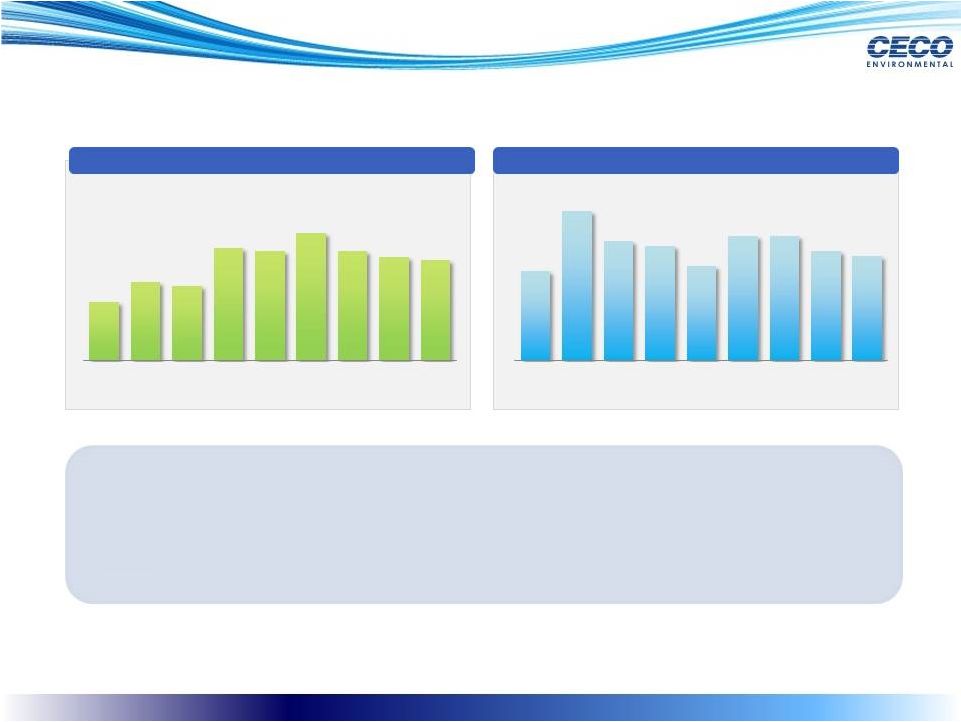 15 Adjusted EBITDA • Adjusted EBITDA of $8.6 million vs. $9.4 million in the prior year • Non-GAAP EPS of $0.21, up from $0.19 in 1Q14 • We have consistently excluded FX re-measurement in 2014 and 2013 Non-GAAP EPS ($ in millions) 1Q15 Quarterly Financial Highlights $5.0 $6.7 $6.4 $9.7 $9.4 $11.0 $9.4 $8.9 $8.6 1Q13 2Q13 3Q13 4Q13 1Q14 2Q14 3Q14 4Q14 1Q15 $0.18 $0.30 $0.24 $0.23 $0.19 $0.25 $0.25 $0.22 $0.21 1Q13 2Q13 3Q13 4Q13 1Q14 2Q14 3Q14 4Q14 1Q15 See supplemental slide for adjusted EBITDA reconciliation and important disclosures regarding CECO’s use of adjusted EBITDA. Note: |
 16 Environmental Segment Revenue • Revenue of $41.7 million was up 56% y/y • Bookings of $51.2 million in 1Q15, up 66% y/y with >15% due to organic • The OneCECO systems approach is gaining traction with creating customer value • Aftermarket continues to gain momentum to bolster our P&L • Overall a solid quarter in our Environmental segment Bookings ($ in millions) First Quarter Results $26.7 $32.9 $27.7 $40.3 $41.7 1Q14 2Q14 3Q14 4Q14 1Q15 $30.9 $26.4 $24.6 $33.3 $51.2 1Q14 2Q14 3Q14 4Q14 1Q15 |
 17 Revenue • Revenue of $24.3 million was up 59% y/y • Bookings of $26.5 million in 1Q15, up 81.5% sequentially • Aftermarket and retrofit opportunities continue to grow Bookings Energy Segment ($ in millions) First Quarter Results $15.3 $16.8 $18.0 $20.2 $24.3 1Q14 2Q14 3Q14 4Q14 1Q15 $17.8 $14.8 $28.4 $14.6 $26.5 1Q14 2Q14 3Q14 4Q14 1Q15 |
 18 Revenue Revenue of $15.2 million, down 4.4% sequentially Bookings of $16.2 million, up 2.5% sequentially Margin expansion and operational excellence continuing on plan Added strategic Sales leadership resources during Q1 Bookings Fluid Handling & Filtration Segment ($ in millions) First Quarter Results $15.5 $16.7 $17.6 $15.9 $15.2 1Q14 2Q14 3Q14 4Q14 1Q15 $15.1 $16.6 $16.7 $15.8 $16.2 1Q14 2Q14 3Q14 4Q14 1Q15 |
 19 12/31/2011 12/31/2012 12/31/2013 12/31/2014 3/31/2015 Cash & Equivalents $ 12.7 $ 23.0 $ 22.7 $ 19.4 $ 19.0 Total Assets $ 79.3 $ 94.1 $348.5 $414.4 $417.4 Total Bank Debt $ 0.0 $ 0.0 $ 89.1 $112.4 $112.9 Convertible Debt $ 9.6 $ 0.0 $ 0.0 $ 0.0 $ 0.0 Shareholders’ Equity $ 43.0 $ 62.0 $170.4 $181.2 $179.3 Current Asset Current Liabilities Net Working Capital $ 53.5 $(23.6) $ 29.9 $ 64.3 $(27.5) $ 36.8 $124.8 $(59.3) $ 65.5 $143.0 $(75.4) $ 67.6 Balance Sheet . Selected Balance Sheet Information Note: Balance Sheet figures presented as reported in Company filings $151.0 $(83.9) $ 67.1 Net Debt to Pro Forma EBITDA = 2.03 Leverage Ratio Balance Sheet Detail ($ Millions) |
 Supplemental 20 |
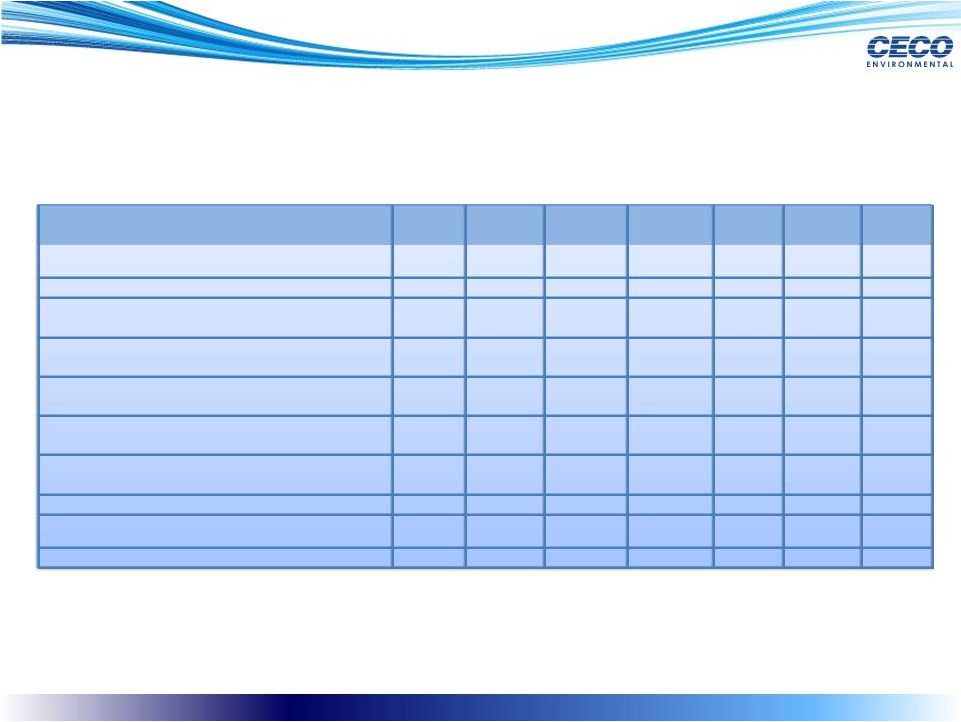
 21 Non-GAAP Gross Margin ($ in millions) Annual 2013 Q1 2014 Q2 2014 Q3 2014 Q4 2014 Annual 2014 Q1 2015 $ 61.6 $ 19.7 $ 21.4 $ 21.1 $ 22.6 $ 84.8 $ 21.0 31.2% 34.4% 32.1% 33.3% 29.7% 32.2% 25.9% 1.1 - - - - $ - - 0.2 0.2 0.1 0.2 0.1 $ 0.6 0.2 $ 62.9 $ 19.9 $ 21.5 $ 21.3 $ 22.7 $ 85.4 $ 21.2 31.9% 34.8% 32.3% 33.6% 29.8% 32.4% 26.2% with GAAP with GAAP Gross profit as reported in accordance Gross profit margin in accordance Inventory valuation adjustment Plant, property and equipment Non-GAAP gross margin Non- GAAP Gross profit margin valuation adjustment |
 22 Non-GAAP Operating Margin ($ in millions) Operating income as reported in accordance with GAAP $ 7.0 $ 5.5 $ 7.2 $ 5.2 $ 3.8 $ 21.7 $ 3.0 Operating margin in accordance with GAAP 3.5% 9.6% 10.8% 8.2% 5.0% 8.2% 3.7% Inventory valuation adjustment 1.1 - - - - - - Plant, property and equipment valuation adjustment 0.2 0.2 0.1 0.2 0.1 0.6 0.2 Acquisition and integration expenses 7.2 0.1 0.2 0.1 0.9 1.3 0.3 Amortization and earn-out expenses 6.8 2.5 2.4 2.4 2.8 10.1 4.0 Legal reserves 3.5 - - 0.3 - 0.3 - Non-GAAP operating income $ 25.8 $ 8.3 $ 9.9 $ 8.2 $ 7.6 $ 34.0 $ 7.5 Non-GAAP Operating margin 13.1% 14.5% 14.9% 12.9% 10.0% 12.9% 9.3% Annual 2013 Q1 2014 Q2 2014 Q3 2014 Q4 2014 Annual 2014 Q1 2015 |
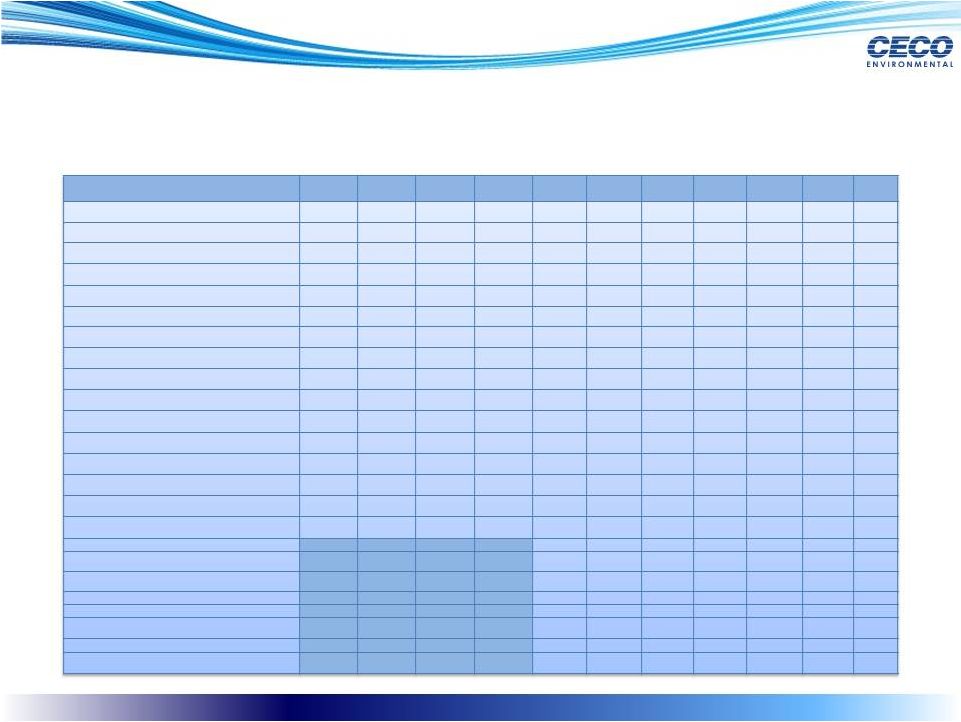 23 Non-GAAP NI & EBITDA ($ in millions) Annual 2009 Annual 2010 Annual 2011 Annual 2012 Annual 2013 Q1 2014 Q2 2014 Q3 2014 Q4 2014 Annual 2014 Q1 2015 Net income as reported in accordance with GAAP $ (15.0) $ 2.1 $ 8.3 $ 10.9 $ 6.6 $ 3.0 $ 4.5 $ 3.7 $ 1.9 $ 13.1 $ 0.2 Inventory valuation adjustment - - - - 1.1 - - - - - - Plant, property and equipment valuation adjustment - - - - 0.2 0.2 0.1 0.2 0.1 0.6 0.2 Acquisition and integration expenses - - - - 7.2 0.1 0.2 0.1 0.9 1.3 0.3 Amortization and earn-out expenses - - - - 6.8 2.5 2.4 2.4 2.8 10.1 4.0 Legal reserves - - - - 3.5 - - 0.3 - 0.3 - Foreign currency remeasurement - - - - (1.1) - - 1.7 1.2 2.9 2.7 Tax benefit of expenses - - - - (4.6) (0.8) (0.7) (1.2) (1.0) (3.7) (1.7) Non-GAAP net income $ (15.0) $ 2.1 $ 8.3 $ 10.9 $ 19.7 $ 5.0 $ 6.5 $ 7.2 $ 5.9 $ 24.6 $ 5.7 Depreciation 2.5 1.8 1.4 1.2 1.6 0.8 0.7 0.8 0.8 3.1 0.7 Non-cash stock compensation 1.0 0.9 0.7 0.7 1.1 0.3 0.4 0.5 0.5 1.7 0.4 Goodwill impairment 17.1 - - - - - - - - - - Other (income)/expense 0.8 0.1 (0.5) 0.1 0.1 0.1 0.1 (0.2) (0.6) (0.6) (1.0) Interest expense 1.3 1.2 1.1 1.2 1.5 0.7 0.8 0.7 0.9 3.1 1.0 Income tax expense (3.1) 1.4 3.4 4.5 4.5 2.5 2.5 0.4 1.4 6.8 1.8 Non-GAAP EBITDA $ 4.6 $ 7.5 $ 14.4 $ 18.6 $ 28.5 $ 9.4 $ 11.0 $ 9.4 $ 8.9 $ 38.7 $ 8.6 Basic Shares Outstanding 20,116,991 25,606,352 25,643,508 25,691,884 26,057,831 25,750,972 26,271,316 Diluted Shares Outstanding 20,719,951 26,115,512 26,107,648 26,129,427 26,467,984 26,196,901 26,598,799 Earnings (loss) per share: Basic $ 0.33 $ 0.12 $ 0.18 $ 0.14 $ 0.07 $ 0.51 $ 0.01 Diluted $ 0.32 $ 0.12 $ 0.17 $ 0.14 $ 0.50 $ 0.01 $ 0.07 |
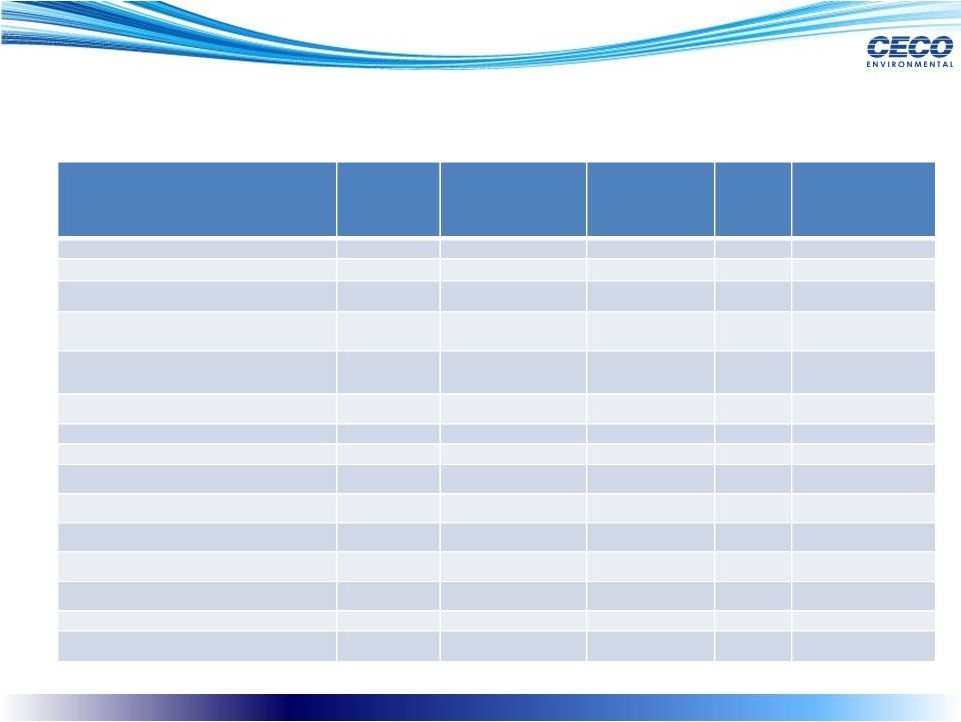 24 ($ in Millions) CECO Reported Pro-forma (Recent Acquisitions) CECO Standalone PMFG Pro-forma CECO Combined GAAP Revenues $263.2 $64.7 $327.9 $158.1 $ 486.0 GAAP Gross profit $84.8 $13.6 $98.4 $45.7 $144.1 SG&A as reported in accordance with GAAP $51.4 $6.6 $58.0 $51.5 $109.5 GAAP Net income $13.1 $8.1 $21.2 ($33.1) ($11.9) Amortization and earn-out expenses $10.1 - $10.1 $0.9 $11.0 Other (1) $5.1 $0.3 $5.4 $26.5 $31.9 Tax benefit of expenses ($3.7) - ($3.7) ($2.2) ($5.9) Non-GAAP net income $24.6 $8.4 $33.0 ($7.8) $25.2 Depreciation $3.1 - $3.1 $1.8 $4.9 Non-cash stock compensation $1.7 - $1.7 $1.1 $2.8 Other (income)/expense ($0.6) - ($0.6) ($0.1) ($0.7) Interest expense $3.1 - $3.1 $1.8 $4.9 Income tax expense $6.8 - $6.8 1.1 $7.9 Non GAAP Adjusted EBITDA $38.7 $8.4 $47.1 ($2.1) $45.0 Non-GAAP Adjusted EBITDA (with Synergies) $60.0 GAAP to Non-GAAP Adjusted EBITDA Reconciliation (Twelve Months ended 12/31/2014) (1) Includes plant, property and equipment (PPE) valuation adjustments, acquisition and integration expenses, legal reserves and foreign currency remeasurement |