SECURITIES AND EXCHANGE COMMISSION
INVESTMENT COMPANIES
(Address of principal executive offices) (Zip code)
OppenheimerFunds, Inc.
Two World Financial Center, New York, New York 10281-1008
(Name and address of agent for service)
Top Ten Common Stock Industries | ||||
| Communications Equipment | 9.3 | % | ||
| Chemicals | 7.1 | |||
| Oil, Gas & Consumable Fuels | 5.4 | |||
| Aerospace & Defense | 5.3 | |||
| Software | 5.2 | |||
| IT Services | 5.0 | |||
| Internet Software & Services | 4.6 | |||
| Computers & Peripherals | 4.5 | |||
| Energy Equipment & Services | 4.4 | |||
| Health Care Equipment & Supplies | 3.9 |
Top Ten Common Stock Holdings | ||||
| Monsanto Co. | 3.6 | % | ||
| Apple, Inc. | 3.5 | |||
| Google, Inc., Cl. A | 3.4 | |||
| Research in Motion Ltd. | 2.7 | |||
| QUALCOMM, Inc. | 2.6 | |||
| Cisco Systems, Inc. | 2.5 | |||
| Occidental Petroleum Corp. | 2.2 | |||
| Schlumberger Ltd. | 2.2 | |||
| Nestle SA | 2.0 | |||
| Praxair, Inc. | 1.9 |
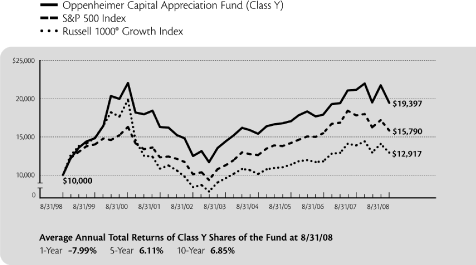
Comparison of Change in Value of $10,000 Hypothetical Investments in:
Comparison of Change in Value of $10,000 Hypothetical Investments in:
Comparison of Change in Value of $10,000 Hypothetical Investments in:
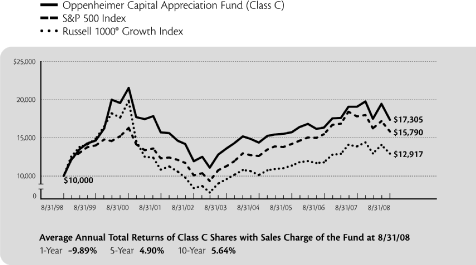
Comparison of Change in Value of $10,000 Hypothetical Investments in:
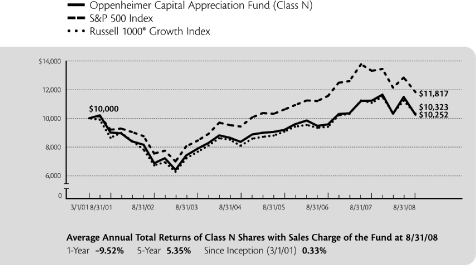
Comparison of Change in Value of $10,000 Hypothetical Investments in:
| Beginning | Ending | Expenses | ||||||||||
| Account | Account | Paid During | ||||||||||
| Value | Value | 6 Months Ended | ||||||||||
| Actual | March 1, 2008 | August 31, 2008 | August 31, 2008 | |||||||||
| Class A | $ | 1,000.00 | $ | 995.20 | $ | 5.43 | ||||||
| Class B | 1,000.00 | 991.50 | 9.25 | |||||||||
| Class C | 1,000.00 | 991.70 | 9.10 | |||||||||
| Class N | 1,000.00 | 993.70 | 6.99 | |||||||||
| Class Y | 1,000.00 | 997.00 | 3.47 | |||||||||
Hypothetical (5% return before expenses) | ||||||||||||
| Class A | 1,000.00 | 1,019.71 | 5.50 | |||||||||
| Class B | 1,000.00 | 1,015.89 | 9.37 | |||||||||
| Class C | 1,000.00 | 1,016.04 | 9.21 | |||||||||
| Class N | 1,000.00 | 1,018.15 | 7.08 | |||||||||
| Class Y | 1,000.00 | 1,021.67 | 3.51 | |||||||||
| Class | Expense Ratios | |||
| Class A | 1.08 | % | ||
| Class B | 1.84 | |||
| Class C | 1.81 | |||
| Class N | 1.39 | |||
| Class Y | 0.69 | |||
| Shares | Value | |||||||
Common Stocks—99.3% | ||||||||
Consumer Discretionary—8.4% | ||||||||
Hotels, Restaurants & Leisure—2.3% | ||||||||
| Burger King Holdings, Inc. | 1,987,390 | $ | 49,327,020 | |||||
Las Vegas Sands Corp.1 | 3,074,088 | 145,742,512 | ||||||
| 195,069,532 | ||||||||
Internet & Catalog Retail—0.1% | ||||||||
Amazon.com, Inc.1 | 73,470 | 5,937,111 | ||||||
Media—3.6% | ||||||||
Focus Media Holding Ltd., ADR1 | 3,684,400 | 120,553,568 | ||||||
Liberty Global, Inc., Series A1 | 2,604,928 | 91,641,367 | ||||||
| McGraw-Hill Cos., Inc. (The) | 1,650,880 | 70,723,699 | ||||||
Sirius XM Radio, Inc.1 | 18,138,485 | 24,124,185 | ||||||
| 307,042,819 | ||||||||
Specialty Retail—1.0% | ||||||||
| Abercrombie & Fitch Co., Cl. A | 1,652,302 | 86,663,240 | ||||||
Textiles, Apparel & Luxury Goods—1.4% | ||||||||
| Polo Ralph Lauren Corp., Cl. A | 1,553,725 | 117,896,653 | ||||||
Consumer Staples—5.3% | ||||||||
Beverages—0.6% | ||||||||
| PepsiCo, Inc. | 779,060 | 53,350,029 | ||||||
Food & Staples Retailing—1.3% | ||||||||
| Costco Wholesale Corp. | 1,611,580 | 108,072,555 | ||||||
Food Products—3.4% | ||||||||
Cadbury plc1 | 10,277,756 | 118,310,631 | ||||||
| Nestle SA | 3,956,049 | 174,602,898 | ||||||
| 292,913,529 | ||||||||
Energy—9.8% | ||||||||
Energy Equipment & Services—4.4% | ||||||||
| Schlumberger Ltd. | 1,948,096 | 183,549,605 | ||||||
| Smith International, Inc. | 911,356 | 63,521,513 | ||||||
| Transocean, Inc. | 448,900 | 57,100,080 | ||||||
Weatherford International Ltd.1 | 1,931,100 | 74,501,838 | ||||||
| 378,673,036 | ||||||||
Oil, Gas & Consumable Fuels—5.4% | ||||||||
| Devon Energy Corp. | 300,020 | 30,617,041 | ||||||
| Occidental Petroleum Corp. | 2,329,902 | 184,901,023 | ||||||
| Range Resources Corp. | 1,995,043 | 92,609,896 | ||||||
| XTO Energy, Inc. | 3,009,656 | 151,716,759 | ||||||
| 459,844,719 | ||||||||
Financials—8.4% | ||||||||
Capital Markets—3.9% | ||||||||
| Credit Suisse Group AG | 2,256,770 | 104,830,210 | ||||||
| Fortress Investment Group LLC, Cl. A | 2,919,341 | 29,339,377 | ||||||
| Goldman Sachs Group, Inc. (The) | 662,554 | 108,638,979 | ||||||
| Och-Ziff Capital Management Group, Cl. A | 2,262,040 | 40,377,414 | ||||||
| T. Rowe Price Group, Inc. | 837,240 | 49,698,566 | ||||||
| 332,884,546 | ||||||||
Consumer Finance—0.5% | ||||||||
| American Express Co. | 1,075,490 | 42,675,443 | ||||||
Diversified Financial Services—2.5% | ||||||||
| BM&F BOVESPA SA | 6,561,000 | 50,233,914 | ||||||
| CME Group, Inc. | 155,803 | 52,253,210 | ||||||
Intercontinental Exchange, Inc.1 | 660,440 | 58,138,533 | ||||||
MSCI, Inc., Cl. A1 | 1,647,540 | 49,179,069 | ||||||
| 209,804,726 | ||||||||
| Shares | Value | |||||||
Insurance—0.9% | ||||||||
| Prudential Financial, Inc. | 1,094,251 | $ | 80,657,241 | |||||
Real Estate Management & Development—0.6% | ||||||||
| Jones Lang LaSalle, Inc. | 1,066,400 | 53,106,720 | ||||||
Health Care—16.4% | ||||||||
Biotechnology—3.0% | ||||||||
Celgene Corp.1 | 1,686,930 | 116,904,249 | ||||||
Gilead Sciences, Inc.1 | 2,566,488 | 135,202,588 | ||||||
| 252,106,837 | ||||||||
Health Care Equipment & Supplies—3.9% | ||||||||
| Bard (C.R.), Inc. | 724,079 | 67,665,183 | ||||||
| Baxter International, Inc. | 1,910,430 | 129,450,737 | ||||||
| Dentsply International, Inc. | 1,169,930 | 45,849,557 | ||||||
| Medtronic, Inc. | 843,740 | 46,068,204 | ||||||
| Stryker Corp. | 697,220 | 46,846,212 | ||||||
| 335,879,893 | ||||||||
Health Care Providers & Services—3.3% | ||||||||
| Aetna, Inc. | 1,200,590 | 51,793,453 | ||||||
Express Scripts, Inc.1 | 2,099,750 | 154,142,648 | ||||||
Schein (Henry), Inc.1 | 1,355,367 | 79,261,862 | ||||||
| 285,197,963 | ||||||||
Life Sciences Tools & Services—2.8% | ||||||||
Covance, Inc.1 | 697,552 | 65,807,056 | ||||||
Illumina, Inc.1 | 356,730 | 30,725,155 | ||||||
Thermo Fisher Scientific, Inc.1 | 2,374,717 | 143,812,862 | ||||||
| 240,345,073 | ||||||||
Pharmaceuticals—3.4% | ||||||||
| Allergan, Inc. | 1,505,964 | 84,138,209 | ||||||
| Roche Holding AG | 770,300 | 130,114,698 | ||||||
| Shire Ltd. | 4,214,618 | 73,824,075 | ||||||
| 288,076,982 | ||||||||
Industrials—7.8% | ||||||||
Aerospace & Defense—5.3% | ||||||||
| General Dynamics Corp. | 1,287,298 | 118,817,605 | ||||||
| Lockheed Martin Corp. | 1,364,708 | 158,906,600 | ||||||
| Precision Castparts Corp. | 530,947 | 54,825,587 | ||||||
| United Technologies Corp. | 1,860,985 | 122,062,006 | ||||||
| 454,611,798 | ||||||||
Electrical Equipment—1.6% | ||||||||
| ABB Ltd. | 5,487,946 | 134,501,694 | ||||||
Industrial Conglomerates—0.9% | ||||||||
McDermott International, Inc.1 | 2,236,330 | 77,667,741 | ||||||
Information Technology—32.3% | ||||||||
Communications Equipment—9.3% | ||||||||
Cisco Systems, Inc.1 | 8,919,323 | 214,509,718 | ||||||
| Corning, Inc. | 2,755,770 | 56,603,516 | ||||||
F5 Networks, Inc.1 | 2,027,920 | 69,172,351 | ||||||
| QUALCOMM, Inc. | 4,214,560 | 221,896,584 | ||||||
Research in Motion Ltd.1 | 1,928,169 | 234,465,350 | ||||||
| 796,647,519 | ||||||||
Computers & Peripherals—4.5% | ||||||||
Apple, Inc.1 | 1,766,810 | 299,527,299 | ||||||
NetApp, Inc.1 | 3,158,370 | 80,475,268 | ||||||
| 380,002,567 | ||||||||
Internet Software & Services—4.6% | ||||||||
eBay, Inc.1 | 3,888,380 | 96,937,313 | ||||||
Google, Inc., Cl. A1 | 631,436 | 292,537,984 | ||||||
| 389,475,297 | ||||||||
IT Services—5.0% | ||||||||
Affiliated Computer Services, Inc., Cl. A1 | 1,653,265 | 88,019,829 | ||||||
Cognizant Technology Solutions Corp.1 | 3,773,163 | 110,629,139 | ||||||
| Shares | Value | |||||||
IT Services Continued | ||||||||
| MasterCard, Inc., Cl. A | 524,970 | $ | 127,331,474 | |||||
| Visa, Inc., Cl. A | 1,267,950 | 96,237,405 | ||||||
| 422,217,847 | ||||||||
Semiconductors & Semiconductor Equipment—3.7% | ||||||||
| ASML Holding NV | 2,914,790 | 68,934,784 | ||||||
Broadcom Corp., Cl. A1 | 3,717,275 | 89,437,637 | ||||||
MEMC Electronic Materials, Inc.1 | 575,960 | 28,273,876 | ||||||
| Microchip Technology, Inc. | 2,229,920 | 71,379,739 | ||||||
NVIDIA Corp.1 | 4,501,420 | 56,897,949 | ||||||
| 314,923,985 | ||||||||
Software—5.2% | ||||||||
Adobe Systems, Inc.1 | 3,335,910 | 142,877,025 | ||||||
Autodesk, Inc.1 | 3,216,003 | 114,264,587 | ||||||
| Microsoft Corp. | 2,334,326 | 63,703,757 | ||||||
Oracle Corp.1 | 3,132,810 | 68,702,523 | ||||||
Salesforce.com, Inc.1 | 1,007,414 | 56,435,332 | ||||||
| 445,983,224 | ||||||||
Materials—7.1% | ||||||||
Chemicals—7.1% | ||||||||
| Monsanto Co. | 2,674,083 | 305,513,983 | ||||||
| Mosaic Co. (The) | 417,200 | 44,531,928 | ||||||
| Potash Corp. of Saskatchewan, Inc. | 520,100 | 90,289,360 | ||||||
| Praxair, Inc. | 1,810,325 | 162,639,598 | ||||||
| 602,974,869 | ||||||||
Telecommunication Services—3.8% | ||||||||
Wireless Telecommunication Services—3.8% | ||||||||
| America Movil SAB de CV, ADR, Series L | 1,867,576 | 95,956,055 | ||||||
Crown Castle International Corp.1 | 2,952,289 | 110,415,609 | ||||||
NII Holdings, Inc.1 | 2,258,493 | 118,616,051 | ||||||
| 324,987,715 | ||||||||
| Total Common Stocks (Cost $7,024,408,710) | 8,470,192,903 | |||||||
Other Securities—0.0% | ||||||||
Seagate Technology International, Inc.1,2,3 (Cost $0) | 1,000,000 | 100,000 | ||||||
Investment Company—1.0% | ||||||||
Oppenheimer Institutional Money Market Fund, Cl. E, 2.76%4,5 (Cost $82,223,122) | 82,223,122 | 82,223,122 | ||||||
Total Investments, at Value (Cost $7,106,631,832) | 100.3 | % | 8,552,516,025 | |||||
Liabilities in Excess of Other Assets | (0.3 | ) | (25,817,566 | ) | ||||
Net Assets | 100.0 | % | $ | 8,526,698,459 | ||||
| 1. | Non-income producing security. | |
| 2. | Illiquid security. The aggregate value of illiquid securities as of August 31, 2008 was $100,000, which represents less than 0.005% of the Fund’s net assets. See Note 7 of accompanying Notes. | |
| 3. | Escrow shares received as the result of issuer reorganization. | |
| 4. | Is or was an affiliate, as defined in the Investment Company Act of 1940, at or during the period ended August 31, 2008, by virtue of the Fund owning at least 5% of the voting securities of the issuer or as a result of the Fund and the issuer having the same investment adviser. Transactions during the period in which the issuer was an affiliate are as follows: |
| Shares | Gross | Gross | Shares | |||||||||||||
| August 31, 2007 | Additions | Reductions | August 31, 2008 | |||||||||||||
| Oppenheimer Institutional Money Market Fund, Cl. E | 105,210,056 | 1,735,707,166 | 1,758,694,100 | 82,223,122 | ||||||||||||
| Dividend | ||||||||
| Value | Income | |||||||
| Oppenheimer Institutional Money Market Fund, Cl. E | $ | 82,223,122 | $ | 4,850,268 | ||||
Assets | ||||
| Investments, at value—see accompanying statement of investments: | ||||
| Unaffiliated companies (cost $7,024,408,710) | $ | 8,470,292,903 | ||
| Affiliated companies (cost $82,223,122) | 82,223,122 | |||
| 8,552,516,025 | ||||
| Cash | 2,956,065 | |||
| Receivables and other assets: | ||||
| Investments sold | 10,769,842 | |||
| Dividends | 6,777,785 | |||
| Shares of beneficial interest sold | 948,217 | |||
| Other | 669,095 | |||
| Total assets | 8,574,637,029 | |||
Liabilities | ||||
| Payables and other liabilities: | ||||
| Investments purchased | 33,287,619 | |||
| Shares of beneficial interest redeemed | 7,024,672 | |||
| Distribution and service plan fees | 3,017,145 | |||
| Trustees’ compensation | 1,951,792 | |||
| Transfer and shareholder servicing agent fees | 1,715,360 | |||
| Shareholder communications | 825,886 | |||
| Other | 116,096 | |||
| Total liabilities | 47,938,570 | |||
Net Assets | $ | 8,526,698,459 | ||
Composition of Net Assets | ||||
| Par value of shares of beneficial interest | $ | 189,772 | ||
| Additional paid-in capital | 7,430,526,971 | |||
| Accumulated net investment loss | (1,580,685 | ) | ||
| Accumulated net realized loss on investments and foreign currency transactions | (348,142,772 | ) | ||
| Net unrealized appreciation on investments and translation of assets and liabilities denominated in foreign currencies | 1,445,705,173 | |||
Net Assets | $ | 8,526,698,459 | ||
Net Asset Value Per Share | ||||
| Class A Shares: | ||||
| Net asset value and redemption price per share (based on net assets of $5,570,287,056 and 122,453,741 shares of beneficial interest outstanding) | $ | 45.49 | ||
| Maximum offering price per share (net asset value plus sales charge of 5.75% of offering price) | $ | 48.27 | ||
| Class B Shares: | ||||
| Net asset value, redemption price (excludes applicable contingent deferred sales charge) and offering price per share (based on net assets of $602,981,342 and 14,726,301 shares of beneficial interest outstanding) | $ | 40.95 | ||
| Class C Shares: | ||||
| Net asset value, redemption price (excludes applicable contingent deferred sales charge) and offering price per share (based on net assets of $679,777,735 and 16,736,355 shares of beneficial interest outstanding) | $ | 40.62 | ||
| Class N Shares: | ||||
| Net asset value, redemption price (excludes applicable contingent deferred sales charge) and offering price per share (based on net assets of $251,081,421 and 5,636,346 shares of beneficial interest outstanding) | $ | 44.55 | ||
| Class Y Shares: | ||||
| Net asset value, redemption price and offering price per share (based on net assets of $1,422,570,905 and 30,219,674 shares of beneficial interest outstanding) | $ | 47.07 |
Investment Income | ||||
| Dividends: | ||||
| Unaffiliated companies (net of foreign withholding taxes of $2,092,419) | $ | 76,517,289 | ||
| Affiliated companies | 4,850,268 | |||
| Interest | 182,337 | |||
| Other income | 173,837 | |||
| Total investment income | 81,723,731 | |||
Expenses | ||||
| Management fees | 51,502,330 | |||
| Distribution and service plan fees: | ||||
| Class A | 15,094,613 | |||
| Class B | 7,314,788 | |||
| Class C | 7,423,160 | |||
| Class N | 1,384,944 | |||
| Transfer and shareholder servicing agent fees: | ||||
| Class A | 14,161,379 | |||
| Class B | 1,479,242 | |||
| Class C | 1,590,526 | |||
| Class N | 929,124 | |||
| Class Y | 1,444,851 | |||
| Shareholder communications: | ||||
| Class A | 1,344,154 | |||
| Class B | 415,264 | |||
| Class C | 177,073 | |||
| Class N | 24,226 | |||
| Class Y | 10,592 | |||
| Trustees’ compensation | 357,522 | |||
| Custodian fees and expenses | 101,494 | |||
| Other | 800,346 | |||
| Total expenses | 105,555,628 | |||
| Less reduction to custodian expenses | (8,980 | ) | ||
| Less waivers and reimbursements of expenses | (160,457 | ) | ||
| Net expenses | 105,386,191 | |||
Net Investment Loss | (23,662,460 | ) | ||
Realized and Unrealized Gain (Loss) | ||||
| Net realized gain (loss) on: | ||||
| Investments: | ||||
| Unaffiliated companies (including premiums on options exercised) | (299,140,003 | ) | ||
| Closing and expiration of option contracts written | 2,430,262 | |||
| Foreign currency transactions | 43,591,655 | |||
| Net realized loss | (253,118,086 | ) | ||
| Net change in unrealized depreciation on: | ||||
| Investments | (604,930,303 | ) | ||
| Translation of assets and liabilities denominated in foreign currencies | (8,258,551 | ) | ||
| Net change in unrealized appreciation | (613,188,854 | ) | ||
Net Decrease in Net Assets Resulting from Operations | $ | (889,969,400 | ) | |
| Year Ended August 31, | 2008 | 2007 | ||||||
Operations | ||||||||
| Net investment loss | $ | (23,662,460 | ) | $ | (30,228,971 | ) | ||
| Net realized gain (loss) | (253,118,086 | ) | 631,672,721 | |||||
| Net change in unrealized appreciation | (613,188,854 | ) | 677,385,449 | |||||
| Net increase (decrease) in net assets resulting from operations | (889,969,400 | ) | 1,278,829,199 | |||||
Dividends and/or Distributions to Shareholders | ||||||||
| Distributions from net realized gain: | ||||||||
| Class A | (141,765,266 | ) | — | |||||
| Class B | (19,310,641 | ) | — | |||||
| Class C | (18,512,239 | ) | — | |||||
| Class N | (5,741,019 | ) | — | |||||
| Class Y | (23,667,836 | ) | — | |||||
| (208,997,001 | ) | — | ||||||
Beneficial Interest Transactions | ||||||||
| Net increase (decrease) in net assets resulting from beneficial interest transactions: | ||||||||
| Class A | 869,318,963 | (711,314,069 | ) | |||||
| Class B | (27,478,978 | ) | (254,371,683 | ) | ||||
| Class C | 86,959,766 | (63,359,072 | ) | |||||
| Class N | 44,751,870 | (50,155,981 | ) | |||||
| Class Y | 506,125,850 | 270,627,361 | ||||||
| 1,479,677,471 | (808,573,444 | ) | ||||||
Net Assets | ||||||||
| Total increase | 380,711,070 | 470,255,755 | ||||||
| Beginning of period | 8,145,987,389 | 7,675,731,634 | ||||||
| End of period (including accumulated net investment loss of $1,580,685 and $1,456,026, respectively) | $ | 8,526,698,459 | $ | 8,145,987,389 | ||||
| Class A Year Ended August 31, | 2008 | 2007 | 2006 | 2005 | 2004 | |||||||||||||||
Per Share Operating Data | ||||||||||||||||||||
| Net asset value, beginning of period | $ | 50.67 | $ | 43.08 | $ | 41.45 | $ | 37.57 | $ | 35.39 | ||||||||||
| Income (loss) from investment operations: | ||||||||||||||||||||
| Net investment income (loss) | (.09 | )1 | (.13 | )1 | (.12 | )1 | .26 | 1,2 | .01 | |||||||||||
| Net realized and unrealized gain (loss) | (4.00 | ) | 7.72 | 2.00 | 3.62 | 2.17 | ||||||||||||||
| Total from investment operations | (4.09 | ) | 7.59 | 1.88 | 3.88 | 2.18 | ||||||||||||||
| Dividends and/or distributions to shareholders: | ||||||||||||||||||||
| Dividends from net investment income | — | — | (.25 | ) | — | — | ||||||||||||||
| Distributions from net realized gain | (1.09 | ) | — | — | — | — | ||||||||||||||
| Total dividends and/or distributions to shareholders | (1.09 | ) | — | (.25 | ) | — | — | |||||||||||||
| Net asset value, end of period | $ | 45.49 | $ | 50.67 | $ | 43.08 | $ | 41.45 | $ | 37.57 | ||||||||||
Total Return, at Net Asset Value3 | (8.33 | )% | 17.62 | % | 4.53 | % | 10.33 | % | 6.16 | % | ||||||||||
Ratios/Supplemental Data | ||||||||||||||||||||
| Net assets, end of period (in thousands) | $ | 5,570,287 | $ | 5,437,581 | $ | 5,278,253 | $ | 5,633,688 | $ | 5,218,310 | ||||||||||
| Average net assets (in thousands) | $ | 6,174,248 | $ | 5,386,165 | $ | 5,569,912 | $ | 5,597,821 | $ | 4,971,315 | ||||||||||
Ratios to average net assets:4 | ||||||||||||||||||||
| Net investment income (loss) | (0.18 | )% | (0.27 | )% | (0.28 | )% | 0.64 | %2 | 0.09 | % | ||||||||||
| Total expenses | 1.07 | %5,6,7 | 1.05 | %5,6,7 | 1.07 | %6 | 1.06 | %6 | 1.09 | %6,8 | ||||||||||
| Portfolio turnover rate | 64 | % | 51 | % | 83 | % | 38 | % | 45 | % | ||||||||||
| 1. | Per share amounts calculated based on the average shares outstanding during the period. | |
| 2. | Net investment income per share and the net investment income ratio include $.17 and 0.43%, respectively, resulting from a special dividend from Microsoft Corp. in November 2004. | |
| 3. | Assumes an investment on the business day before the first day of the fiscal period, with all dividends and distributions reinvested in additional shares on the reinvestment date, and redemption at the net asset value calculated on the last business day of the fiscal period. Sales charges are not reflected in the total returns. Total returns are not annualized for periods less than one full year. Returns do not reflect the deduction of taxes that a shareholder would pay on fund distributions or the redemption of fund shares. | |
| 4. | Annualized for periods less than one full year. | |
| 5. | Total expenses including indirect expenses from affiliated fund were as follows: |
| Year Ended August 31, 2008 | 1.07 | % | ||
| Year Ended August 31, 2007 | 1.05 | % |
| 6. | Reduction to custodian expenses less than 0.005%. | |
| 7. | Waiver or reimbursement of indirect management fees less than 0.005%. | |
| 8. | Voluntary waiver of transfer agent fees less than 0.005%. |
| Class B Year Ended August 31, | 2008 | 2007 | 2006 | 2005 | 2004 | |||||||||||||||
Per Share Operating Data | ||||||||||||||||||||
| Net asset value, beginning of period | $ | 46.05 | $ | 39.47 | $ | 38.08 | $ | 34.82 | $ | 33.09 | ||||||||||
| Income (loss) from investment operations: | ||||||||||||||||||||
| Net investment loss | (.42 | )1 | (.46 | )1 | (.45 | )1 | (.08 | )1,2 | (.36 | ) | ||||||||||
| Net realized and unrealized gain (loss) | (3.59 | ) | 7.04 | 1.84 | 3.34 | 2.09 | ||||||||||||||
| Total from investment operations | (4.01 | ) | 6.58 | 1.39 | 3.26 | 1.73 | ||||||||||||||
| Dividends and/or distributions to shareholders: | ||||||||||||||||||||
| Dividends from net investment income | — | — | — | — | — | |||||||||||||||
| Distributions from net realized gain | (1.09 | ) | — | — | — | — | ||||||||||||||
| Total dividends and/or distributions to shareholders | (1.09 | ) | — | — | — | — | ||||||||||||||
| Net asset value, end of period | $ | 40.95 | $ | 46.05 | $ | 39.47 | $ | 38.08 | $ | 34.82 | ||||||||||
Total Return, at Net Asset Value3 | (9.01 | )% | 16.67 | % | 3.65 | % | 9.36 | % | 5.23 | % | ||||||||||
Ratios/Supplemental Data | ||||||||||||||||||||
| Net assets, end of period (in thousands) | $ | 602,981 | $ | 723,519 | $ | 851,836 | $ | 1,041,045 | $ | 1,104,348 | ||||||||||
| Average net assets (in thousands) | $ | 731,493 | $ | 806,550 | $ | 964,658 | $ | 1,099,380 | $ | 1,169,402 | ||||||||||
Ratios to average net assets:4 | ||||||||||||||||||||
| Net investment loss | (0.94 | )% | (1.06 | )% | (1.13 | )% | (0.21 | )%2 | (0.81 | )% | ||||||||||
| Total expenses | 1.83 | %5 | 1.86 | %5 | 1.93 | % | 1.93 | % | 1.99 | % | ||||||||||
| Expenses after payments, waivers and/or reimbursements and reduction to custodian expenses | 1.83 | % | 1.86 | % | 1.92 | % | 1.93 | % | 1.97 | % | ||||||||||
| Portfolio turnover rate | 64 | % | 51 | % | 83 | % | 38 | % | 45 | % | ||||||||||
| 1. | Per share amounts calculated based on the average shares outstanding during the period. | |
| 2. | Net investment income per share and the net investment income ratio include $.16 and 0.43%, respectively, resulting from a special dividend from Microsoft Corp. in November 2004. | |
| 3. | Assumes an investment on the business day before the first day of the fiscal period, with all dividends and distributions reinvested in additional shares on the reinvestment date, and redemption at the net asset value calculated on the last business day of the fiscal period. Sales charges are not reflected in the total returns. Total returns are not annualized for periods less than one full year. Returns do not reflect the deduction of taxes that a shareholder would pay on fund distributions or the redemption of fund shares. | |
| 4. | Annualized for periods less than one full year. | |
| 5. | Total expenses including indirect expenses from affiliated fund were as follows: |
| Year Ended August 31, 2008 | 1.83 | % | ||
| Year Ended August 31, 2007 | 1.86 | % |
| Class C Year Ended August 31, | 2008 | 2007 | 2006 | 2005 | 2004 | |||||||||||||||
Per Share Operating Data | ||||||||||||||||||||
| Net asset value, beginning of period | $ | 45.68 | $ | 39.14 | $ | 37.73 | $ | 34.47 | $ | 32.72 | ||||||||||
| Income (loss) from investment operations: | ||||||||||||||||||||
| Net investment loss | (.40 | )1 | (.44 | )1 | (.41 | )1 | (.05 | )1,2 | (.16 | ) | ||||||||||
| Net realized and unrealized gain (loss) | (3.57 | ) | 6.98 | 1.82 | 3.31 | 1.91 | ||||||||||||||
| Total from investment operations | (3.97 | ) | 6.54 | 1.41 | 3.26 | 1.75 | ||||||||||||||
| Dividends and/or distributions to shareholders: | ||||||||||||||||||||
| Dividends from net investment income | — | — | — | — | — | |||||||||||||||
| Distributions from net realized gain | (1.09 | ) | — | — | — | — | ||||||||||||||
| Total dividends and/or distributions to shareholders | (1.09 | ) | — | — | — | — | ||||||||||||||
| Net asset value, end of period | $ | 40.62 | $ | 45.68 | $ | 39.14 | $ | 37.73 | $ | 34.47 | ||||||||||
Total Return, at Net Asset Value3 | (9.00 | )% | 16.71 | % | 3.74 | % | 9.46 | % | 5.35 | % | ||||||||||
Ratios/Supplemental Data | ||||||||||||||||||||
| Net assets, end of period (in thousands) | $ | 679,778 | $ | 687,083 | $ | 646,333 | $ | 691,467 | $ | 638,676 | ||||||||||
| Average net assets (in thousands) | $ | 742,287 | $ | 678,427 | $ | 684,056 | $ | 681,646 | $ | 623,172 | ||||||||||
Ratios to average net assets:4 | ||||||||||||||||||||
| Net investment loss | (0.92 | )% | (1.02 | )% | (1.05 | )% | (0.14 | )%2 | (0.69 | )% | ||||||||||
| Total expenses | 1.81 | %5,6,7 | 1.81 | %5,6,7 | 1.84 | %6 | 1.84 | %6 | 1.87 | %6,8 | ||||||||||
| Portfolio turnover rate | 64 | % | 51 | % | 83 | % | 38 | % | 45 | % | ||||||||||
| 1. | Per share amounts calculated based on the average shares outstanding during the period. | |
| 2. | Net investment income per share and the net investment income ratio include $.16 and 0.43%, respectively, resulting from a special dividend from Microsoft Corp. in November 2004. | |
| 3. | Assumes an investment on the business day before the first day of the fiscal period, with all dividends and distributions reinvested in additional shares on the reinvestment date, and redemption at the net asset value calculated on the last business day of the fiscal period. Sales charges are not reflected in the total returns. Total returns are not annualized for periods less than one full year. Returns do not reflect the deduction of taxes that a shareholder would pay on fund distributions or the redemption of fund shares. | |
| 4. | Annualized for periods less than one full year. | |
| 5. | Total expenses including indirect expenses from affiliated fund were as follows: |
| Year Ended August 31, 2008 | 1.81 | % | ||
| Year Ended August 31, 2007 | 1.81 | % |
| 6. | Reduction to custodian expenses less than 0.005%. | |
| 7. | Waiver or reimbursement of indirect management fees less than 0.005%. | |
| 8. | Voluntary waiver of transfer agent fees less than 0.005%. |
| Class N Year Ended August 31, | 2008 | 2007 | 2006 | 2005 | 2004 | |||||||||||||||
Per Share Operating Data | ||||||||||||||||||||
| Net asset value, beginning of period | $ | 49.80 | $ | 42.49 | $ | 40.91 | $ | 37.21 | $ | 35.17 | ||||||||||
| Income (loss) from investment operations: | ||||||||||||||||||||
| Net investment income (loss) | (.25 | )1 | (.28 | )1 | (.27 | )1 | .11 | 1,2 | (.08 | ) | ||||||||||
| Net realized and unrealized gain (loss) | (3.91 | ) | 7.59 | 1.98 | 3.59 | 2.12 | ||||||||||||||
| Total from investment operations | (4.16 | ) | 7.31 | 1.71 | 3.70 | 2.04 | ||||||||||||||
| Dividends and/or distributions to shareholders: | ||||||||||||||||||||
| Dividends from net investment income | — | — | (.13 | ) | — | — | ||||||||||||||
| Distributions from net realized gain | (1.09 | ) | — | — | — | — | ||||||||||||||
| Total dividends and/or distributions to shareholders | (1.09 | ) | — | (.13 | ) | — | — | |||||||||||||
| Net asset value, end of period | $ | 44.55 | $ | 49.80 | $ | 42.49 | $ | 40.91 | $ | 37.21 | ||||||||||
Total Return, at Net Asset Value3 | (8.63 | )% | 17.20 | % | 4.16 | % | 9.94 | % | 5.80 | % | ||||||||||
Ratios/Supplemental Data | ||||||||||||||||||||
| Net assets, end of period (in thousands) | $ | 251,081 | $ | 241,593 | $ | 250,167 | $ | 245,932 | $ | 190,696 | ||||||||||
| Average net assets (in thousands) | $ | 277,096 | $ | 257,444 | $ | 253,590 | $ | 221,007 | $ | 154,605 | ||||||||||
Ratios to average net assets:4 | ||||||||||||||||||||
| Net investment income (loss) | (0.52 | )% | (0.60 | )% | (0.63 | )% | 0.27 | %2 | (0.25 | )% | ||||||||||
| Total expenses | 1.42 | %5 | 1.39 | %5 | 1.42 | % | 1.42 | % | 1.46 | % | ||||||||||
| Expenses after payments, waivers and/or reimbursements and reduction to custodian expenses | 1.40 | % | 1.39 | % | 1.42 | % | 1.42 | % | 1.44 | % | ||||||||||
| Portfolio turnover rate | 64 | % | 51 | % | 83 | % | 38 | % | 45 | % | ||||||||||
| 1. | Per share amounts calculated based on the average shares outstanding during the period. | |
| 2. | Net investment income per share and the net investment income ratio include $.17 and 0.43%, respectively, resulting from a special dividend from Microsoft Corp. in November 2004. | |
| 3. | Assumes an investment on the business day before the first day of the fiscal period, with all dividends and distributions reinvested in additional shares on the reinvestment date, and redemption at the net asset value calculated on the last business day of the fiscal period. Sales charges are not reflected in the total returns. Total returns are not annualized for periods less than one full year. Returns do not reflect the deduction of taxes that a shareholder would pay on fund distributions or the redemption of fund shares. | |
| 4. | Annualized for periods less than one full year. | |
| 5. | Total expenses including indirect expenses from affiliated fund were as follows: |
| Year Ended August 31, 2008 | 1.42 | % | ||
| Year Ended August 31, 2007 | 1.39 | % |
| Class Y Year Ended August 31, | 2008 | 2007 | 2006 | 2005 | 2004 | |||||||||||||||
Per Share Operating Data | ||||||||||||||||||||
| Net asset value, beginning of period | $ | 52.20 | $ | 44.21 | $ | 42.52 | $ | 38.40 | $ | 36.04 | ||||||||||
| Income (loss) from investment operations: | ||||||||||||||||||||
| Net investment income | .10 | 1 | .07 | 1 | .05 | 1 | .45 | 1,2 | .09 | |||||||||||
| Net realized and unrealized gain (loss) | (4.14 | ) | 7.92 | 2.05 | 3.67 | 2.27 | ||||||||||||||
| Total from investment operations | (4.04 | ) | 7.99 | 2.10 | 4.12 | 2.36 | ||||||||||||||
| Dividends and/or distributions to shareholders: | ||||||||||||||||||||
| Dividends from net investment income | — | — | (.41 | ) | — | — | ||||||||||||||
| Distributions from net realized gain | (1.09 | ) | — | — | — | — | ||||||||||||||
| Total dividends and/or distributions to shareholders | (1.09 | ) | — | (.41 | ) | — | — | |||||||||||||
| Net asset value, end of period | $ | 47.07 | $ | 52.20 | $ | 44.21 | $ | 42.52 | $ | 38.40 | ||||||||||
Total Return, at Net Asset Value3 | (7.99 | )% | 18.07 | % | 4.93 | % | 10.73 | % | 6.55 | % | ||||||||||
Ratios/Supplemental Data | ||||||||||||||||||||
| Net assets, end of period (in thousands) | $ | 1,422,571 | $ | 1,056,211 | $ | 649,143 | $ | 1,186,649 | $ | 1,391,718 | ||||||||||
| Average net assets (in thousands) | $ | 1,259,666 | $ | 865,096 | $ | 766,929 | $ | 1,210,587 | $ | 1,327,404 | ||||||||||
Ratios to average net assets:4 | ||||||||||||||||||||
| Net investment income | 0.20 | % | 0.13 | % | 0.11 | % | 1.10 | %2 | 0.47 | % | ||||||||||
| Total expenses | 0.69 | %5,6,7 | 0.66 | %5,6,7 | 0.70 | %6,8 | 0.69 | %6 | 0.71 | %6 | ||||||||||
| Portfolio turnover rate | 64 | % | 51 | % | 83 | % | 38 | % | 45 | % | ||||||||||
| 1. | Per share amounts calculated based on the average shares outstanding during the period. | |
| 2. | Net investment income per share and the net investment income ratio include $.18 and 0.43%, respectively, resulting from a special dividend from Microsoft Corp. in November 2004. | |
| 3. | Assumes an investment on the business day before the first day of the fiscal period, with all dividends and distributions reinvested in additional shares on the reinvestment date, and redemption at the net asset value calculated on the last business day of the fiscal period. Sales charges are not reflected in the total returns. Total returns are not annualized for periods less than one full year. Returns do not reflect the deduction of taxes that a shareholder would pay on fund distributions or the redemption of fund shares. | |
| 4. | Annualized for periods less than one full year. | |
| 5. | Total expenses including indirect expenses from affiliated fund were as follows: |
| Year Ended August 31, 2008 | 0.69 | % | ||
| Year Ended August 31, 2007 | 0.66 | % |
| 6. | Reduction to custodian expenses less than 0.005%. | |
| 7. | Waiver or reimbursement of indirect management fees less than 0.005%. | |
| 8. | Voluntary waiver of transfer agent fees less than 0.005%. |
F15 | OPPENHEIMER CAPITAL APPRECIATION FUND
F16 | OPPENHEIMER CAPITAL APPRECIATION FUND
| Net Unrealized | ||||||||||||
| Appreciation | ||||||||||||
| Based on Cost of | ||||||||||||
| Securities and | ||||||||||||
| Undistributed | Undistributed | Accumulated | Other Investments | |||||||||
| Net Investment | Long-Term | Loss | for Federal Income | |||||||||
| Income | Gain | Carryforward1,2,3,4 | Tax Purposes | |||||||||
| $— | $ | — | $ | 233,985,819 | $ | 1,331,885,466 | ||||||
| 1. | As of August 31, 2008, the Fund had $233,802,872 of post-October losses available to offset future realized capital gains, if any. Such losses, if unutilized, will expire in 2017. | |
| 2. | The Fund had $182,947 of post-October foreign currency losses which were deferred. | |
| 3. | During the fiscal year ended August 31, 2008, the Fund utilized $46,438,577 of capital loss carryforward to offset capital gains realized in that fiscal year. | |
| 4. | During the fiscal year ended August 31, 2007, the Fund utilized $424,180,295 of capital loss carryforward to offset capital gains realized in that fiscal year. |
F17 | OPPENHEIMER CAPITAL APPRECIATION FUND
| Reduction | Increase to | |||||||
| to Accumulated | Accumulated Net | |||||||
| Reduction | Net Investment | Realized Loss | ||||||
| to Paid-in Capital | Loss | on Investments | ||||||
| $8,884,975 | $ | 23,537,801 | $ | 14,652,826 | ||||
| Year Ended | Year Ended | |||||||
| August 31, 2008 | August 31, 2007 | |||||||
| Distributions paid from: | ||||||||
| Long-term capital gain | $ | 208,997,001 | $ | — | ||||
| Federal tax cost of securities | $ | 7,220,451,539 | ||
| Federal tax cost of other investments | 179,020 | |||
| Total federal tax cost | $ | 7,220,630,559 | ||
| Gross unrealized appreciation | $ | 1,770,969,882 | ||
| Gross unrealized depreciation | (439,084,416 | ) | ||
| Net unrealized appreciation | $ | 1,331,885,466 | ||
| Projected Benefit Obligations Increased | $ | 467,502 | ||
| Payments Made to Retired Trustees | 133,442 | |||
| Accumulated Liability as of August 31, 2008 | 1,268,622 |
F18 | OPPENHEIMER CAPITAL APPRECIATION FUND
F19 | OPPENHEIMER CAPITAL APPRECIATION FUND
| Year Ended August 31, 2008 | Year Ended August 31, 2007 | |||||||||||||||
| Shares | Amount | Shares | Amount | |||||||||||||
Class A | ||||||||||||||||
| Sold | 25,681,415 | $ | 1,275,894,300 | 21,222,885 | $ | 1,010,056,897 | ||||||||||
| Distributions reinvested | 2,473,136 | 128,083,701 | — | — | ||||||||||||
| Acquisition—Note 9 | 24,242,071 | 1,276,608,520 | — | — | ||||||||||||
| Redeemed | (37,263,587 | ) | (1,811,267,558 | ) | (36,425,258 | ) | (1,721,370,966 | ) | ||||||||
| Net increase (decrease) | 15,133,035 | $ | 869,318,963 | (15,202,373 | ) | $ | (711,314,069 | ) | ||||||||
Class B | ||||||||||||||||
| Sold | 2,277,460 | $ | 101,173,511 | 1,959,540 | $ | 84,668,049 | ||||||||||
| Distributions reinvested | 395,530 | 18,542,446 | — | — | ||||||||||||
| Acquisition—Note 9 | 4,230,388 | 202,686,406 | — | — | ||||||||||||
| Redeemed | (7,887,440 | ) | (349,881,341 | ) | (7,830,689 | ) | (339,039,732 | ) | ||||||||
| Net decrease | (984,062 | ) | $ | (27,478,978 | ) | (5,871,149 | ) | $ | (254,371,683 | ) | ||||||
Class C | ||||||||||||||||
| Sold | 2,821,827 | $ | 124,283,173 | 2,511,786 | $ | 108,170,132 | ||||||||||
| Distributions reinvested | 347,074 | 16,138,939 | — | — | ||||||||||||
| Acquisition—Note 9 | 2,494,432 | 118,555,942 | — | — | ||||||||||||
| Redeemed | (3,967,061 | ) | (172,018,288 | ) | (3,986,345 | ) | (171,529,204 | ) | ||||||||
| Net increase (decrease) | 1,696,272 | $ | 86,959,766 | (1,474,559 | ) | $ | (63,359,072 | ) | ||||||||
Class N | ||||||||||||||||
| Sold | 1,552,152 | $ | 74,488,179 | 1,577,607 | $ | 73,777,815 | ||||||||||
| Distributions reinvested | 102,322 | 5,201,995 | — | — | ||||||||||||
| Acquisition—Note 9 | 1,495,894 | 77,172,752 | — | — | ||||||||||||
| Redeemed | (2,365,110 | ) | (112,111,056 | ) | (2,614,445 | ) | (123,933,796 | ) | ||||||||
| Net increase (decrease) | 785,258 | $ | 44,751,870 | (1,036,838 | ) | $ | (50,155,981 | ) | ||||||||
F20 | OPPENHEIMER CAPITAL APPRECIATION FUND
| Year Ended August 31, 2008 | Year Ended August 31, 2007 | |||||||||||||||
| Shares | Amount | Shares | Amount | |||||||||||||
Class Y | ||||||||||||||||
| Sold | 14,104,959 | $ | 712,028,588 | 7,490,658 | $ | 366,439,984 | ||||||||||
| Distributions reinvested | 397,723 | 21,254,348 | — | — | ||||||||||||
| Acquisition—Note 9 | 1,008,258 | 54,681,820 | — | — | ||||||||||||
| Redeemed | (5,525,588 | ) | (281,838,906 | ) | (1,940,608 | ) | (95,812,623 | ) | ||||||||
| Net increase | 9,985,352 | $ | 506,125,850 | 5,550,050 | $ | 270,627,361 | ||||||||||
| Purchases | Sales | |||||||
| Investment securities | $ | 6,830,757,170 | $ | 5,741,944,177 | ||||
| Fee Schedule | ||||
| Up to $200 million | 0.75 | % | ||
| Next $200 million | 0.72 | |||
| Next $200 million | 0.69 | |||
| Next $200 million | 0.66 | |||
| Next $700 million | 0.60 | |||
| Next $1 billion | 0.58 | |||
| Next $2 billion | 0.56 | |||
| Next $2 billion | 0.54 | |||
| Next $2 billion | 0.52 | |||
| Next $2.5 billion | 0.50 | |||
| Over $11 billion | 0.48 | |||
F21 | OPPENHEIMER CAPITAL APPRECIATION FUND
| Class A | Class B | Class C | Class N | |||||||||||||||||
| Class A | Contingent | Contingent | Contingent | Contingent | ||||||||||||||||
| Front-End | Deferred | Deferred | Deferred | Deferred | ||||||||||||||||
| Sales Charges | Sales Charges | Sales Charges | Sales Charges | Sales Charges | ||||||||||||||||
| Retained by | Retained by | Retained by | Retained by | Retained by | ||||||||||||||||
| Year Ended | Distributor | Distributor | Distributor | Distributor | Distributor | |||||||||||||||
| August 31, 2008 | $ | 1,743,121 | $ | 23,748 | $ | 1,254,817 | $ | 48,689 | $ | 7,998 | ||||||||||
F22 | OPPENHEIMER CAPITAL APPRECIATION FUND
F23 | OPPENHEIMER CAPITAL APPRECIATION FUND
| Call Options | ||||||||
| Number of | Amount of | |||||||
| Contracts | Premiums | |||||||
| Options outstanding as of August 31, 2007 | — | $ | — | |||||
| Options written | 16,440 | 3,648,170 | ||||||
| Options closed or expired | (12,456 | ) | (2,990,332 | ) | ||||
| Options exercised | (3,984 | ) | (657,838 | ) | ||||
| Options outstanding as of August 31, 2008 | — | $ | — | |||||
F24 | OPPENHEIMER CAPITAL APPRECIATION FUND
F25 | OPPENHEIMER CAPITAL APPRECIATION FUND
F26 | OPPENHEIMER CAPITAL APPRECIATION FUND
F27 | OPPENHEIMER CAPITAL APPRECIATION FUND
F28 | OPPENHEIMER CAPITAL APPRECIATION FUND
25 | OPPENHEIMER CAPITAL APPRECIATION FUND
26 | OPPENHEIMER CAPITAL APPRECIATION FUND
27 | OPPENHEIMER CAPITAL APPRECIATION FUND
28 | OPPENHEIMER CAPITAL APPRECIATION FUND
1-800-SEC-0330.
29 | OPPENHEIMER CAPITAL APPRECIATION FUND
Name, Position(s) Held with the Fund, Length of Service, Age | Principal Occupation(s) During the Past 5 Years; Other Trusteeships/Directorships Held; Number of Portfolios in the Fund Complex Currently Overseen | |
INDEPENDENT TRUSTEES | The address of each Trustee in the chart below is 6803 S. Tucson Way, Centennial, Colorado 80112-3924. Each Trustee serves for an indefinite term, or until his or her resignation, retirement, death or removal. | |
Brian F. Wruble, Chairman of the Board of Trustees (since 2007), Trustee (since 2005) Age: 65 | General Partner of Odyssey Partners, L.P. (hedge fund) (September 1995- December 2007); Director of Special Value Opportunities Fund, LLC (registered investment company) (affiliate of the Manager’s parent company) (since September 2004); Chairman (since August 2007) and Trustee (since August 1991) of the Board of Trustees of The Jackson Laboratory (non-profit); Treasurer and Trustee of the Institute for Advanced Study (non-profit educational institute) (since May 1992); Member of Zurich Financial Investment Management Advisory Council (insurance) (2004-2007); Special Limited Partner of Odyssey Investment Partners, LLC (private equity investment) (January 1999-September 2004). Oversees 64 portfolios in the OppenheimerFunds complex. | |
David K. Downes, Trustee (since 2007) Age: 68 | Independent Chairman GSK Employee Benefit Trust (since April 2006); Director of Correctnet (since January 2006); Trustee of Employee Trusts (since January 2006); President, Chief Executive Officer and Board Member of CRAFund Advisors, Inc. (investment management company) (since January 2004); Director of Internet Capital Group (information technology company) (since October 2003); Independent Chairman of the Board of Trustees of Quaker Investment Trust (registered investment company) (2004-2007); President of The Community Reinvestment Act Qualified Investment Fund (investment management company) (2004-2007); Chief Operating Officer and Chief Financial Officer of Lincoln National Investment Companies, Inc. (subsidiary of Lincoln National Corporation, a publicly traded company) and Delaware Investments U.S., Inc. (investment management subsidiary of Lincoln National Corporation) (1993-2003); President, Chief Executive Officer and Trustee of Delaware Investment Family of Funds (1993-2003); President and Board Member of Lincoln National Convertible Securities Funds, Inc. and the Lincoln National Income Funds, TDC (1993-2003); Chairman and Chief Executive Officer of Retirement Financial Services, Inc. (registered transfer agent and investment adviser and subsidiary of Delaware Investments U.S., Inc.) (1993-2003); President and Chief Executive Officer of Delaware Service Company, Inc. (1995-2003); Chief Administrative Officer, Chief Financial Officer, Vice Chairman and Director of Equitable Capital Management Corporation (investment subsidiary of Equitable Life Assurance Society) (1985-1992); Corporate Controller of Merrill Lynch & Company (financial services holding company) (1977-1985); held the following positions at the Colonial Penn Group, Inc. (insurance company): Corporate Budget Director (1974-1977), Assistant Treasurer (1972-1974) and Director of Corporate Taxes (1969-1972); held the following positions at Price Waterhouse & Company (financial services firm): Tax Manager (1967-1969), Tax Senior (1965-1967) and Staff Accountant (1963-1965); United States Marine Corps (1957-1959). Oversees 64 portfolios in the OppenheimerFunds complex. | |
Matthew P. Fink, Trustee (since 2005) Age: 67 | Trustee of the Committee for Economic Development (policy research foundation) (since 2005); Director of ICI Education Foundation (education foundation) (October 1991-August 2006); President of the Investment Company Institute (trade association) (October 1991-June 2004); Director of ICI Mutual Insurance Company (insurance company) (October 1991-June 2004). Oversees 54 portfolios in the OppenheimerFunds complex. |
30 | OPPENHEIMER CAPITAL APPRECIATION FUND
Name, Position(s) Held with the Fund, Length of Service, Age | Principal Occupation(s) During the Past 5 Years; Other Trusteeships/Directorships Held; Number of Portfolios in the Fund Complex Currently Overseen | |
Robert G. Galli, Trustee (since 1993) Age: 75 | A director or trustee of other Oppenheimer funds. Oversees 64 portfolios in the OppenheimerFunds complex. | |
Phillip A. Griffiths, Trustee (since 1999) Age: 70 | Fellow of the Carnegie Corporation (since 2007); Distinguished Presidential Fellow for International Affairs (since 2002) and Member (since 1979) of the National Academy of Sciences; Council on Foreign Relations (since 2002); Director of GSI Lumonics Inc. (precision technology products company) (since 2001); Senior Advisor of The Andrew W. Mellon Foundation (since 2001); Chair of Science Initiative Group (since 1999); Member of the American Philosophical Society (since 1996); Trustee of Woodward Academy (since 1983); Foreign Associate of Third World Academy of Sciences; Director of the Institute for Advanced Study (1991-2004); Director of Bankers Trust New York Corporation (1994-1999); Provost at Duke University (1983-1991). Oversees 54 portfolios in the OppenheimerFunds complex. | |
Mary F. Miller, Trustee (since 2004) Age: 65 | Trustee of International House (not-for-profit) (since June 2007); Trustee of the American Symphony Orchestra (not-for-profit) (since October 1998); and Senior Vice President and General Auditor of American Express Company (financial services company) (July 1998-February 2003). Oversees 54 portfolios in the OppenheimerFunds complex. | |
Joel W. Motley, Trustee (since 2002) Age: 56 | Managing Director of Public Capital Advisors, LLC (privately held financial advisor) (since January 2006); Managing Director of Carmona Motley, Inc. (privately-held financial advisor) (since January 2002); Director of Columbia Equity Financial Corp. (privately-held financial advisor) (2002-2007); Managing Director of Carmona Motley Hoffman Inc. (privately-held financial advisor) (January 1998-December 2001); Member of the Finance and Budget Committee of the Council on Foreign Relations, Member of the Investment Committee of the Episcopal Church of America, Member of the Investment Committee and Board of Human Rights Watch and Member of the Investment Committee of Historic Hudson Valley. Oversees 54 portfolios in the OppenheimerFunds complex. | |
Russell S. Reynolds, Jr., Trustee (since 1989) Age: 76 | Chairman of RSR Partners (formerly “The Directorship Search Group, Inc.”) (corporate governance consulting and executive recruiting) (since 1993); Retired CEO of Russell Reynolds Associates (executive recruiting) (October 1969-March 1993); Life Trustee of International House (non-profit educational organization); Former Trustee of The Historical Society of the Town of Greenwich; Former Director of Greenwich Hospital Association. Oversees 54 portfolios in the OppenheimerFunds complex. | |
Joseph M. Wikler, Trustee (since 2005) Age: 67 | Director of C-TASC (bio-statistics services) (since 2007); Director of the following medical device companies: Medintec (since 1992) and Cathco (since 1996); Director of Lakes Environmental Association (environmental protection organization) (since 1996); Member of the Investment Committee of the Associated Jewish Charities of Baltimore (since 1994); Director of Fortis/Hartford mutual funds (1994-December 2001). Oversees 54 portfolios in the OppenheimerFunds complex. | |
Peter I. Wold, Trustee (since 2005) Age: 60 | President of Wold Oil Properties, Inc. (oil and gas exploration and production company) (since 1994); Vice President of American Talc Company, Inc. (talc mining and milling) (since 1999); Managing Member of Hole-in-the-Wall Ranch (cattle ranching) (since 1979); Vice President, Secretary and Treasurer of Wold Trona Company, Inc. (soda ash processing and production) (1996-2006); Director and Chairman of the Denver Branch of the Federal Reserve Bank of Kansas City (1993-1999); and Director of PacifiCorp. (electric utility) (1995-1999). Oversees 54 portfolios in the OppenheimerFunds complex. |
31 | OPPENHEIMER CAPITAL APPRECIATION FUND
Name, Position(s) Held with the Fund, Length of Service, Age | Principal Occupation(s) During the Past 5 Years; Other Trusteeships/Directorships Held; Number of Portfolios in the Fund Complex Currently Overseen | |
INTERESTED TRUSTEE AND OFFICER | The address of Mr. Murphy is Two World Financial Center, 225 Liberty Street, 11th Floor, New York, New York 10281-1008. Mr. Murphy serves as a Trustee for an indefinite term, or until his resignation, retirement, death or removal and as an Officer for an indefinite term, or until his resignation, retirement, death or removal. Mr. Murphy is an interested Trustee due to his positions with OppenheimerFunds, Inc. and its affiliates. | |
John V. Murphy, Trustee, President and Principal Executive Officer (since 2001) Age: 59 | Chairman, Chief Executive Officer and Director of the Manager (since June 2001); President of the Manager (September 2000-February 2007); President and director or trustee of other Oppenheimer funds; President and Director of Oppenheimer Acquisition Corp. (“OAC”) (the Manager’s parent holding company) and of Oppenheimer Partnership Holdings, Inc. (holding company subsidiary of the Manager) (since July 2001); Director of OppenheimerFunds Distributor, Inc. (subsidiary of the Manager) (November 2001-December 2006); Chairman and Director of Shareholder Services, Inc. and of Shareholder Financial Services, Inc. (transfer agent subsidiaries of the Manager) (since July 2001); President and Director of OppenheimerFunds Legacy Program (charitable trust program established by the Manager) (since July 2001); Director of the following investment advisory subsidiaries of the Manager: OFI Institutional Asset Management, Inc., Centennial Asset Management Corporation, Trinity Investment Management Corporation and Tremont Capital Management, Inc. (since November 2001), HarbourView Asset Management Corporation and OFI Private Investments, Inc. (since July 2001); President (since November 2001) and Director (since July 2001) of Oppenheimer Real Asset Management, Inc.; Executive Vice President of Massachusetts Mutual Life Insurance Company (OAC’s parent company) (since February 1997); Director of DLB Acquisition Corporation (holding company parent of Babson Capital Management LLC) (since June 1995); Chairman (since October 2007) and Member of the Investment Company Institute’s Board of Governors (since October 2003). Oversees 103 portfolios in the OppenheimerFunds complex. | |
OTHER OFFICERS OF THE FUND | The addresses of the Officers in the chart below are as follows: for Messrs. Baylin, Zack and Ms. Bloomberg, Two World Financial Center, 225 Liberty Street, New York, New York 10281-1008, for Messrs. Vandehey, Wixted, Petersen, Szilagyi and Ms. Ives, 6803 S. Tucson Way, Centennial, Colorado 80112-3924. Each Officer serves for an indefinite term or until his or her resignation, retirement, death or removal. | |
Marc L. Baylin, Vice President and Portfolio Manager (since 2005) Age: 40 | Vice President of the Manager and Member of the Manager’s Growth Equity Investment Team (since September 2005); a Chartered Financial Analyst. Managing Director and Lead Portfolio Manager at JP Morgan Fleming Investment Management (June 2002-August 2005); Vice President, Analyst (from June 1993) and Portfolio Manager (March 1999-June 2002) of T. Rowe Price. A portfolio manager and officer of 4 portfolios in the OppenheimerFunds complex. | |
Mark S. Vandehey, Vice President and Chief Compliance Officer (since 2004) Age: 58 | Senior Vice President and Chief Compliance Officer of the Manager (since March 2004); Chief Compliance Officer of OppenheimerFunds Distributor, Inc., Centennial Asset Management and Shareholder Services, Inc. (since March 2004); Vice President of OppenheimerFunds Distributor, Inc., Centennial Asset Management Corporation and Shareholder Services, Inc. (since June 1983); Former Vice President and Director of Internal Audit of the Manager (1997- February 2004). An officer of 103 portfolios in the OppenheimerFunds complex. |
32 | OPPENHEIMER CAPITAL APPRECIATION FUND
Name, Position(s) Held with the Fund, Length of Service, Age | Principal Occupation(s) During the Past 5 Years; Other Trusteeships/Directorships Held; Number of Portfolios in the Fund Complex Currently Overseen | |
Brian W. Wixted, Treasurer and Principal Financial & Accounting Officer (since 1999) Age: 49 | Senior Vice President and Treasurer of the Manager (since March 1999); Treasurer of the following: HarbourView Asset Management Corporation, Shareholder Financial Services, Inc., Shareholder Services, Inc., Oppenheimer Real Asset Management, Inc. and Oppenheimer Partnership Holdings, Inc. (since March 1999), OFI Private Investments, Inc. (since March 2000), OppenheimerFunds International Ltd. and OppenheimerFunds plc (since May 2000), OFI Institutional Asset Management, Inc. (since November 2000), and OppenheimerFunds Legacy Program (charitable trust program established by the Manager) (since June 2003); Treasurer and Chief Financial Officer of OFI Trust Company (trust company subsidiary of the Manager) (since May 2000); Assistant Treasurer of the following: OAC (since March 1999), Centennial Asset Management Corporation (March 1999-October 2003) and OppenheimerFunds Legacy Program (April 2000-June 2003). An officer of 103 portfolios in the OppenheimerFunds complex. | |
Brian S. Petersen, Assistant Treasurer (since 2004) Age: 38 | Vice President of the Manager (since February 2007); Assistant Vice President of the Manager (August 2002-February 2007); Manager/Financial Product Accounting of the Manager (November 1998-July 2002). An officer of 103 portfolios in the OppenheimerFunds complex. | |
Brian C. Szilagyi, Assistant Treasurer (since 2005) Age: 38 | Assistant Vice President of the Manager (since July 2004); Director of Financial Reporting and Compliance of First Data Corporation (April 2003-July 2004); Manager of Compliance of Berger Financial Group LLC (May 2001-March 2003). An officer of 103 portfolios in the OppenheimerFunds complex. | |
Robert G. Zack, Vice President and Secretary (since 2001) Age: 60 | Executive Vice President (since January 2004) and General Counsel (since March 2002) of the Manager; General Counsel and Director of the Distributor (since December 2001); General Counsel of Centennial Asset Management Corporation (since December 2001); Senior Vice President and General Counsel of HarbourView Asset Management Corporation (since December 2001); Secretary and General Counsel of OAC (since November 2001); Assistant Secretary (since September 1997) and Director (since November 2001) of OppenheimerFunds International Ltd. and OppenheimerFunds plc; Vice President and Director of Oppenheimer Partnership Holdings, Inc. (since December 2002); Director of Oppenheimer Real Asset Management, Inc. (since November 2001); Senior Vice President, General Counsel and Director of Shareholder Financial Services, Inc. and Shareholder Services, Inc. (since December 2001); Senior Vice President, General Counsel and Director of OFI Private Investments, Inc. and OFI Trust Company (since November 2001); Vice President of OppenheimerFunds Legacy Program (since June 2003); Senior Vice President and General Counsel of OFI Institutional Asset Management, Inc. (since November 2001); Director of OppenheimerFunds (Asia) Limited (since December 2003); Senior Vice President (May 1985-December 2003). An officer of 103 portfolios in the OppenheimerFunds complex. | |
Lisa I. Bloomberg, Assistant Secretary (since 2004) Age: 40 | Vice President (since May 2004) and Deputy General Counsel (since May 2008); of the Manager; Associate Counsel of the Manager (May 2004-May 2008); First Vice President (April 2001-April 2004), Associate General Counsel (December 2000-April 2004) of UBS Financial Services Inc. (formerly, PaineWebber Incorporated). An officer of 103 portfolios in the OppenheimerFunds complex. |
33 | OPPENHEIMER CAPITAL APPRECIATION FUND
Name, Position(s) Held with the Fund, Length of Service, Age | Principal Occupation(s) During the Past 5 Years; Other Trusteeships/Directorships Held; Number of Portfolios in the Fund Complex Currently Overseen | |
Kathleen T. Ives, Assistant Secretary (since 2001) Age: 43 | Vice President (since June 1998), Deputy General Counsel (since May 2008) and Assistant Secretary (since October 2003) of the Manager; Vice President (since 1999) and Assistant Secretary (since October 2003) of the Distributor; Assistant Secretary of Centennial Asset Management Corporation (since October 2003); Vice President and Assistant Secretary of Shareholder Services, Inc. (since 1999); Assistant Secretary of OppenheimerFunds Legacy Program and Shareholder Financial Services, Inc. (since December 2001); Senior Counsel of the Manager (October 2003-May 2008). An officer of 103 portfolios in the OppenheimerFunds complex. |
34 | OPPENHEIMER CAPITAL APPRECIATION FUND
| (a) | Audit Fees |
| (b) | Audit-Related Fees |
| (c) | Tax Fees |
| (d) | All Other Fees |
| (e) | (1) During its regularly scheduled periodic meetings, the registrant’s audit committee will pre-approve all audit, audit-related, tax and other services to be provided by the principal accountants of the registrant. |
| The audit committee has delegated pre-approval authority to its Chairman for any subsequent new engagements that arise between regularly scheduled meeting dates provided that any fees such pre-approved are presented to the audit committee at its next regularly scheduled meeting. | ||
| Under applicable laws, pre-approval of non-audit services maybe waived provided that: 1) the aggregate amount of all such services provided constitutes no more than five percent of the total amount of fees paid by the registrant to it principal accountant during the fiscal year in which services are provided 2) such services were not recognized by the registrant at the time of engagement as non-audit services and 3) such services are promptly brought to the attention of the audit committee of the registrant and approved prior to the completion of the audit. | ||
| (2) 100% |
| (f) | Not applicable as less than 50%. |
| (g) | The principal accountant for the audit of the registrant’s annual financial statements billed $250,000 in fiscal 2008 and $245,382 in fiscal 2007 to the registrant and the registrant’s investment adviser or any entity controlling, controlled by, or under common control with the adviser that provides ongoing services to the registrant related to non-audit fees. Those billings did not include any prohibited non-audit services as defined by the Securities Exchange Act of 1934. |
| (h) | The registrant’s audit committee of the board of trustees has considered whether the provision of non-audit services that were rendered to the registrant’s investment adviser, and any entity controlling, controlled by, or under common control with the investment adviser that provides ongoing services to the registrant that were not pre-approved pursuant to paragraph (c)(7)(ii) of Rule 2-01 of Regulation S-X is compatible with maintaining the principal accountant’s independence. No such services were rendered. |
| 1. | The Fund’s Governance Committee (the “Committee”) will evaluate potential Board candidates to assess their qualifications. The Committee shall have the authority, upon approval of the Board, to retain an executive search firm to assist in this effort. The Committee may consider recommendations by business and personal contacts of current Board members and by executive search firms which the Committee may engage from time to time and may also consider shareholder recommendations. The Committee may consider the advice and recommendation of the Funds’ investment manager and its affiliates in making the selection. |
| 2. | The Committee shall screen candidates for Board membership. The Committee has not established specific qualifications that it believes must be met by a trustee nominee. In evaluating trustee nominees, the Committee considers, among other things, an individual’s background, skills, and experience; whether the individual is an “interested person” as defined in the Investment Company Act of 1940; and whether the individual would be deemed an “audit committee financial expert” within the meaning of applicable SEC rules. The Committee also considers whether the individual’s background, skills, and experience will complement the background, skills, and experience of other nominees and will contribute to the Board. There are no differences in the manner in which the Committee evaluates nominees for trustees based on whether the nominee is recommended by a shareholder. |
| 3. | The Committee may consider nominations from shareholders for the Board at such times as the Committee meets to consider new nominees for the Board. The |
| Committee shall have the sole discretion to determine the candidates to present to the Board and, in such cases where required, to shareholders. Recommendations for trustee nominees should, at a minimum, be accompanied by the following: |
| • | the name, address, and business, educational, and/or other pertinent background of the person being recommended; | ||
| • | a statement concerning whether the person is an “interested person” as defined in the Investment Company Act of 1940; | ||
| • | any other information that the Funds would be required to include in a proxy statement concerning the person if he or she was nominated; and | ||
| • | the name and address of the person submitting the recommendation and, if that person is a shareholder, the period for which that person held Fund shares. |
| The recommendation also can include any additional information which the person submitting it believes would assist the Committee in evaluating the recommendation. | ||
| 4. | Shareholders should note that a person who owns securities issued by Massachusetts Mutual Life Insurance Company (the parent company of the Funds’ investment adviser) would be deemed an “interested person” under the Investment Company Act of 1940. In addition, certain other relationships with Massachusetts Mutual Life Insurance Company or its subsidiaries, with registered broker-dealers, or with the Funds’ outside legal counsel may cause a person to be deemed an “interested person.” | |
| 5. | Before the Committee decides to nominate an individual as a trustee, Committee members and other directors customarily interview the individual in person. In addition, the individual customarily is asked to complete a detailed questionnaire which is designed to elicit information which must be disclosed under SEC and stock exchange rules and to determine whether the individual is subject to any statutory disqualification from serving as a trustee of a registered investment company. |
| (a) | (1) Exhibit attached hereto. | |
| (2) Exhibits attached hereto. | ||
| (3) Not applicable. | ||
| (b) | Exhibit attached hereto. |
| By: | /s/ John V. Murphy | |||
| John V. Murphy | ||||
| Principal Executive Officer | ||||
| Date: | 10/13/2008 |
| By: | /s/ John V. Murphy | |||
| Principal Executive Officer | ||||
| Date: | 10/13/2008 | |||
| By: | /s/ Brian W. Wixted | |||
| Brian W. Wixted | ||||
| Principal Financial Officer | ||||
| Date: | 10/13/2008 |