Exhibit 99.3
Q1’16 Earnings
Supplemental Material
January 26, 2016
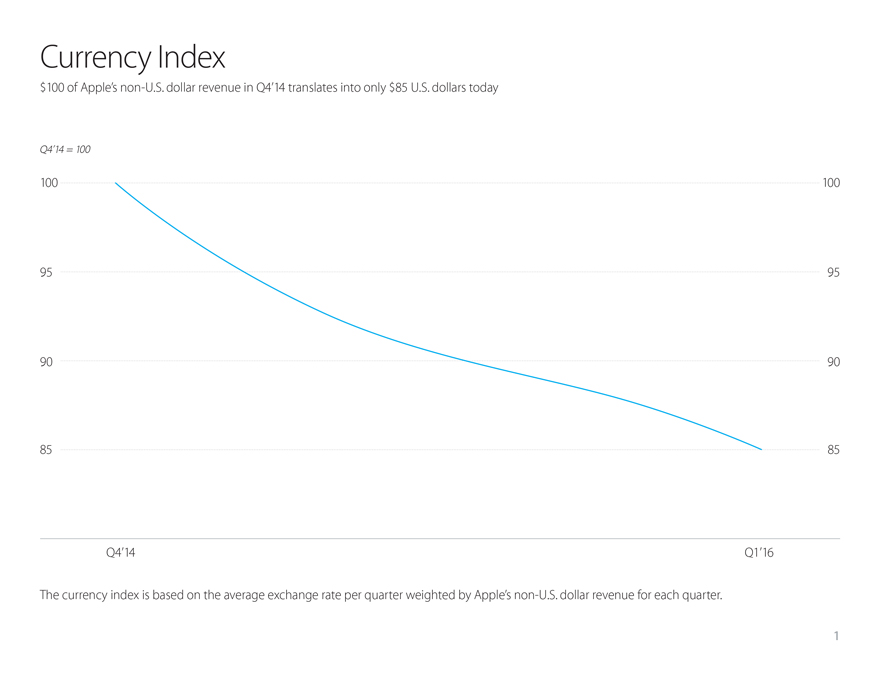
Currency Index
$100 of Apple’s non-U.S. dollar revenue in Q4’14 translates into only $85 U.S. dollars today
Q4’14 = 100
100 100
95 95
90 90
85 85
Q4’14 Q1’16
The currency index is based on the average exchange rate per quarter weighted by Apple’s non-U.S. dollar revenue for each quarter. 1
Q1’16 Constant Currency Revenue Growth
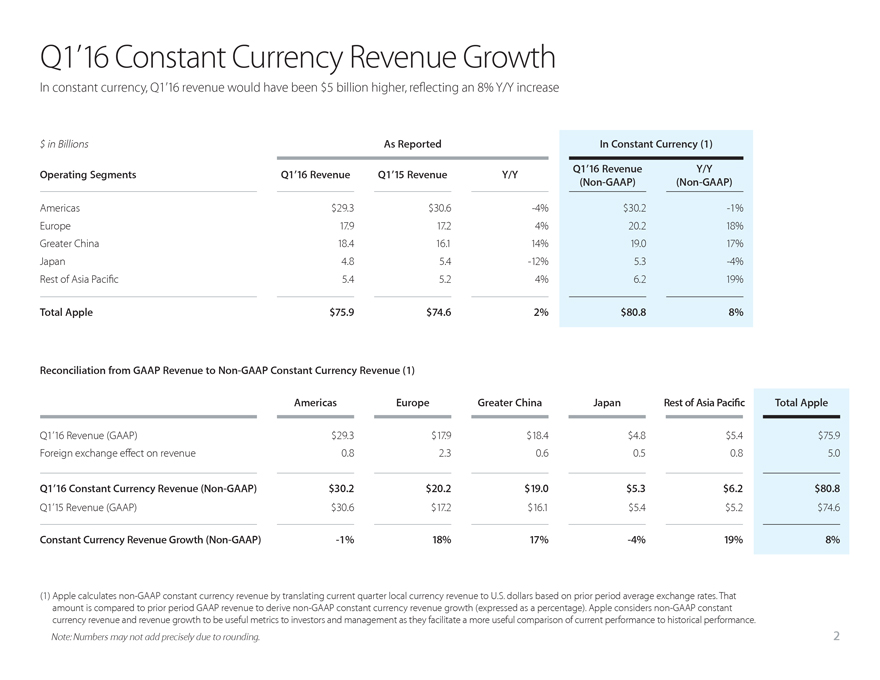
In constant currency, Q1’16 revenue would have been $5 billion higher, reflecting an 8% Y/Y increase
$ in Billions
As Reported In Constant Currency (1)
Operating Segments Q1’16 Revenue Q1’15 Revenue (Non-GAAP) Y/Y Q1’16 Revenue Y/Y (Non-GAAP)
Americas $29.3 $30.6 -4% $30.2 -1%
Europe 17.9 17.2 4% 20.2 18%
Greater China 18.4 16.1 14% 19.0 17%
Japan 4.8 5.4 -12% 5.3 -4%
Rest of Asia Pacific 5.4 5.2 4% 6.2 19%
Total Apple $75.9 $74.6 2% $80.8 8%
Reconciliation from GAAP Revenue to Non-GAAP Constant Currency Revenue (1)
Americas Europe Greater China Japan Rest of Asia Pacific Total Apple
Q1’16 Revenue (GAAP) $29.3 $17.9 $18.4 $4.8 $5.4 $75.9
Foreign exchange effect on revenue 0.8 2.3 0.6 0.5 0.8 5.0
Q1’16 Constant Currency Revenue (Non-GAAP) $30.2 $20.2 $19.0 $5.3 $6.2 $80.8
Q1’15 Revenue (GAAP) $30.6 $17.2 $16.1 $5.4 $5.2 $74.6
Constant Currency Revenue Growth (Non-GAAP) -1% 18% 17% -4% 19% 8%
(1) Apple calculates non-GAAP constant currency revenue by translating current quarter local currency revenue to U.S. dollars based on prior period average exchange rates. That amount is compared to prior period GAAP revenue to derive non-GAAP constant currency revenue growth (expressed as a percentage). Apple considers non-GAAP constant currency revenue and revenue growth to be useful metrics to investors and management as they facilitate a more useful comparison of current performance to historical performance.
Note: Numbers may not add precisely due to rounding. 2
Services Revenue
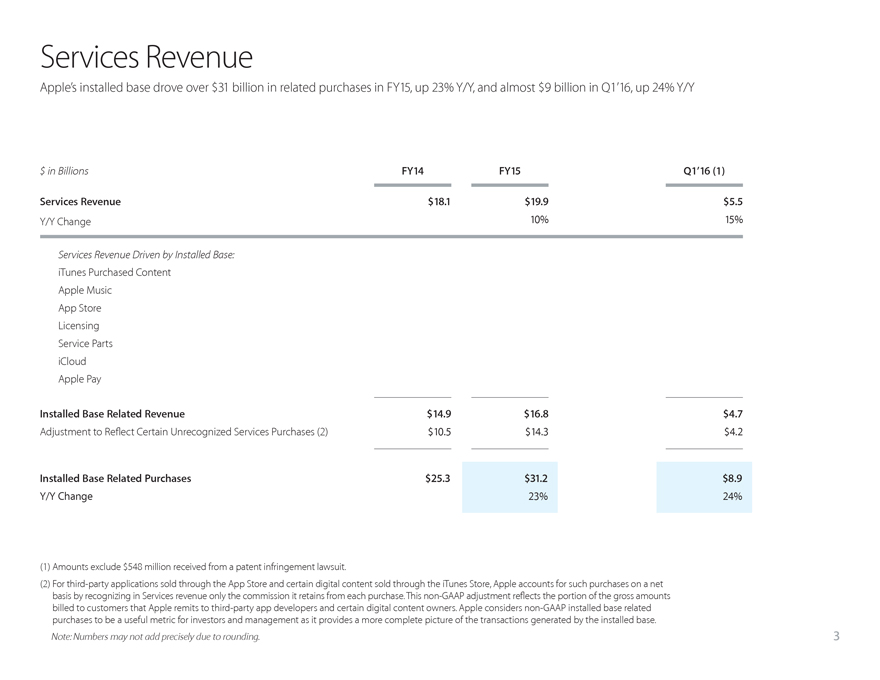
Apple’s installed base drove over $31 billion in related purchases in FY15, up 23% Y/Y, and almost $9 billion in Q1’16, up 24% Y/Y
$ in Billions FY14 FY15 Q1’16 (1)
Services Revenue $18.1 $19.9 $5.5
Y/Y Change 10% 15%
Services Revenue Driven by Installed Base:
iTunes Purchased Content
Apple Music
App Store
Licensing
Service PartsiCloud
Apple Pay
Installed Base Related Revenue $14.9 $16.8 $4.7
Adjustment to Reflect Certain Unrecognized Services Purchases (2) $10.5 $14.3 $4.2
Installed Base Related Purchases $25.3 $31.2 $8.9
Y/Y Change 23% 24%
(1) Amounts exclude $548 million received from a patent infringement lawsuit.
(2) For third-party applications sold through the App Store and certain digital content sold through the iTunes Store, Apple accounts for such purchases on a net basis by recognizing in Services revenue only the commission it retains from each purchase. This non-GAAP adjustment reflects the portion of the gross amounts billed to customers that Apple remits to third-party app developers and certain digital content owners. Apple considers non-GAAP installed base related purchases to be a useful metric for investors and management as it provides a more complete picture of the transactions generated by the installed base.
Note: Numbers may not add precisely due to rounding.
3
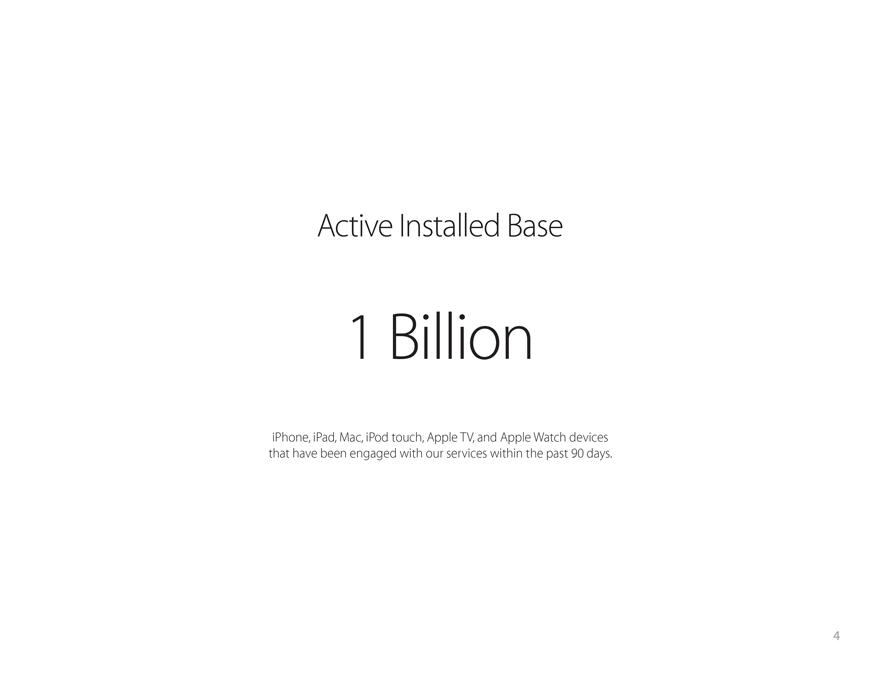
Active Installed Base
1 Billion
iPhone, iPad, Mac, iPod touch, Apple TV, and Apple Watch devices
that have been engaged with our services within the past 90 days.
4
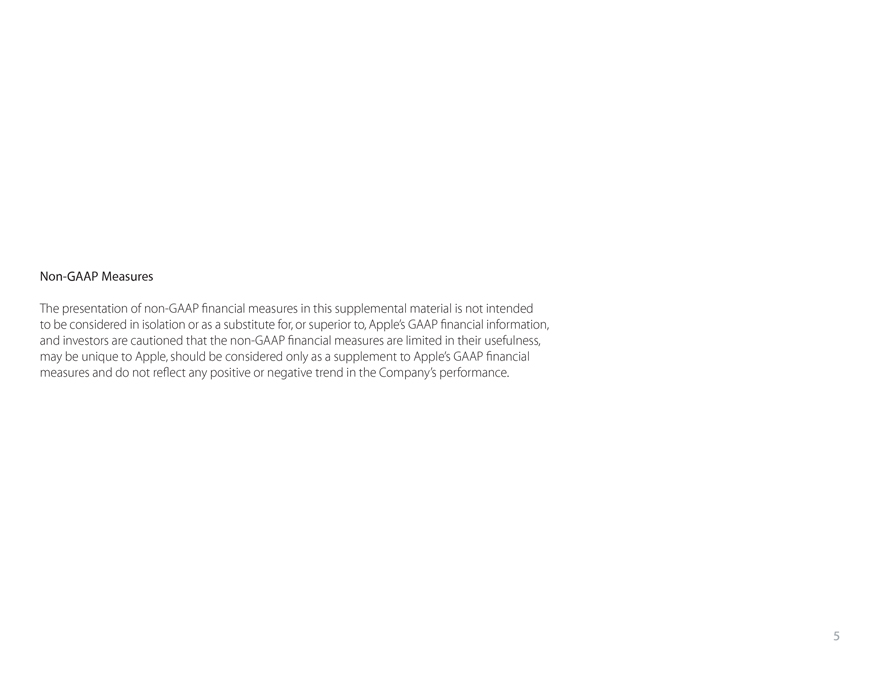
Non-GAAP Measures
The presentation of non-GAAP financial measures in this supplemental material is not intended to be considered in isolation or as a substitute for, or superior to, Apple’s GAAP financial information, and investors are cautioned that the non-GAAP financial measures are limited in their usefulness, may be unique to Apple, should be considered only as a supplement to Apple’s GAAP financial measures and do not reflect any positive or negative trend in the Company’s performance.
5


