UNITED STATES
SECURITIES AND EXCHANGE COMMISSION
Washington, D.C. 20549
FORM N-CSR
CERTIFIED SHAREHOLDER REPORT OF REGISTERED
MANAGEMENT INVESTMENT COMPANIES
Investment Company Act file number 811-03114
Fidelity Select Portfolios
(Exact name of registrant as specified in charter)
245 Summer St., Boston, MA 02210
(Address of principal executive offices) (Zip code)
Cynthia Lo Bessette, Secretary
245 Summer St.
Boston, Massachusetts 02210
(Name and address of agent for service)
Registrant's telephone number, including area code:
617-563-7000
| |
Date of fiscal year end: | February 28 |
|
|
Date of reporting period: | August 31, 2022 |
Item 1.
Reports to Stockholders
Fidelity® Select Portfolios®
Telecommunications Services Sector
Telecommunications Portfolio
Wireless Portfolio
Semi-Annual Report
August 31, 2022
Includes Fidelity and Fidelity Advisor share classes
Contents
To view a fund's proxy voting guidelines and proxy voting record for the 12-month period ended June 30, visit http://www.fidelity.com/proxyvotingresults or visit the Securities and Exchange Commission's (SEC) web site at http://www.sec.gov.
You may also call 1-800-544-8544 if you're an individual investing directly with Fidelity, call 1-800-835-5092 if you're a plan sponsor or participant with Fidelity as your recordkeeper or call 1-877-208-0098 on institutional accounts or if you're an advisor or invest through one to request a free copy of the proxy voting guidelines.
Standard & Poor's, S&P and S&P 500 are registered service marks of The McGraw-Hill Companies, Inc. and have been licensed for use by Fidelity Distributors Corporation.
Other third-party marks appearing herein are the property of their respective owners.
All other marks appearing herein are registered or unregistered trademarks or service marks of FMR LLC or an affiliated company. © 2022 FMR LLC. All rights reserved.
This report and the financial statements contained herein are submitted for the general information of the shareholders of the Fund. This report is not authorized for distribution to prospective investors in the Fund unless preceded or accompanied by an effective prospectus.
A fund files its complete schedule of portfolio holdings with the SEC for the first and third quarters of each fiscal year on Form N-PORT. Forms N-PORT are available on the SEC's web site at http://www.sec.gov. A fund's Forms N-PORT may be reviewed and copied at the SEC's Public Reference Room in Washington, DC. Information regarding the operation of the SEC's Public Reference Room may be obtained by calling 1-800-SEC-0330.
For a complete list of a fund's portfolio holdings, view the most recent holdings listing, semiannual report, or annual report on Fidelity's web site at http://www.fidelity.com, http://www.institutional.fidelity.com, or http://www.401k.com, as applicable.
NOT FDIC INSURED •MAY LOSE VALUE •NO BANK GUARANTEE
Neither the Fund nor Fidelity Distributors Corporation is a bank.
Top Holdings (% of Fund's net assets) |
| |
| Verizon Communications, Inc. | 23.1 | |
| AT&T, Inc. | 17.1 | |
| T-Mobile U.S., Inc. | 8.0 | |
| Iridium Communications, Inc. | 4.7 | |
| Cogent Communications Group, Inc. | 4.5 | |
| Liberty Global PLC Class C | 4.1 | |
| Telephone & Data Systems, Inc. | 4.0 | |
| Radius Global Infrastructure, Inc. | 3.5 | |
| Comcast Corp. Class A | 3.3 | |
| Gogo, Inc. | 3.1 | |
| | 75.4 | |
| |
| Industries (% of Fund's net assets) |
| |
| Diversified Telecommunication Services | 72.7 | |
| Wireless Telecommunication Services | 17.0 | |
| Media | 6.2 | |
| IT Services | 0.8 | |
| Construction & Engineering | 0.2 | |
| Software | 0.2 | |
| |
Telecommunications Portfolio
| Common Stocks - 97.1% |
| | | Shares | Value ($) |
| Construction & Engineering - 0.2% | | | |
| Construction & Engineering - 0.2% | | | |
| Dycom Industries, Inc. (a) | | 4,700 | 526,964 |
| Diversified Telecommunication Services - 72.7% | | | |
| Alternative Carriers - 23.5% | | | |
| Anterix, Inc. (a) | | 118,700 | 5,038,815 |
| Bandwidth, Inc. (a) | | 83,700 | 1,297,350 |
| Cogent Communications Group, Inc. | | 198,139 | 10,550,902 |
| EchoStar Holding Corp. Class A (a)(b) | | 306,300 | 5,638,983 |
| Globalstar, Inc. (a)(b) | | 720,600 | 1,441,200 |
| Iridium Communications, Inc. (a)(b) | | 249,911 | 11,093,549 |
| Liberty Global PLC Class C (a) | | 448,536 | 9,558,302 |
| Liberty Latin America Ltd. Class C (a) | | 1,053,033 | 7,339,640 |
| Lumen Technologies, Inc. (b) | | 350,400 | 3,489,984 |
| | | | 55,448,725 |
| Integrated Telecommunication Services - 49.2% | | | |
| AT&T, Inc. | | 2,296,020 | 40,272,191 |
| ATN International, Inc. | | 61,800 | 2,895,330 |
| Frontier Communications Parent, Inc. (a) | | 232,100 | 5,978,896 |
| IDT Corp. Class B (a) | | 157,000 | 4,014,490 |
| Radius Global Infrastructure, Inc. (a) | | 596,400 | 8,212,428 |
| Verizon Communications, Inc. | | 1,302,797 | 54,469,942 |
| | | | 115,843,277 |
TOTAL DIVERSIFIED TELECOMMUNICATION SERVICES | | | 171,292,002 |
| IT Services - 0.8% | | | |
| Internet Services & Infrastructure - 0.1% | | | |
| Twilio, Inc. Class A (a) | | 4,000 | 278,320 |
| IT Consulting & Other Services - 0.7% | | | |
| Amdocs Ltd. | | 17,800 | 1,521,366 |
TOTAL IT SERVICES | | | 1,799,686 |
| Media - 6.2% | | | |
| Cable & Satellite - 6.2% | | | |
| Charter Communications, Inc. Class A (a) | | 2,800 | 1,155,364 |
| Comcast Corp. Class A | | 214,500 | 7,762,755 |
| Liberty Broadband Corp. Class C (a) | | 56,924 | 5,789,171 |
| | | | 14,707,290 |
| Software - 0.2% | | | |
| Application Software - 0.2% | | | |
| RingCentral, Inc. (a) | | 8,500 | 365,840 |
| Wireless Telecommunication Services - 17.0% | | | |
| Wireless Telecommunication Services - 17.0% | | | |
| Gogo, Inc. (a) | | 494,300 | 7,345,298 |
| Millicom International Cellular SA (a) | | 75,310 | 1,067,143 |
| Shenandoah Telecommunications Co. (b) | | 49,323 | 1,099,410 |
| T-Mobile U.S., Inc. (a) | | 131,224 | 18,891,007 |
| Telephone & Data Systems, Inc. (b) | | 573,164 | 9,325,378 |
| U.S. Cellular Corp. (a) | | 78,900 | 2,255,751 |
| | | | 39,983,987 |
| TOTAL COMMON STOCKS (Cost $233,849,522) | | | 228,675,769 |
| | | | |
| Money Market Funds - 6.8% |
| | | Shares | Value ($) |
| Fidelity Cash Central Fund 2.33% (c) | | 6,169,908 | 6,171,142 |
| Fidelity Securities Lending Cash Central Fund 2.34% (c)(d) | | 9,901,588 | 9,902,578 |
| TOTAL MONEY MARKET FUNDS (Cost $16,073,720) | | | 16,073,720 |
| | | | |
| TOTAL INVESTMENT IN SECURITIES - 103.9% (Cost $249,923,242) | 244,749,489 |
NET OTHER ASSETS (LIABILITIES) - (3.9)% | (9,274,093) |
| NET ASSETS - 100.0% | 235,475,396 |
| | |
Legend
| (b) | Security or a portion of the security is on loan at period end. |
| (c) | Affiliated fund that is generally available only to investment companies and other accounts managed by Fidelity Investments. The rate quoted is the annualized seven-day yield of the fund at period end. A complete unaudited listing of the fund's holdings as of its most recent quarter end is available upon request. In addition, each Fidelity Central Fund's financial statements are available on the SEC's website or upon request. |
| (d) | Investment made with cash collateral received from securities on loan. |
Affiliated Central Funds
Fiscal year to date information regarding the Fund's investments in Fidelity Central Funds, including the ownership percentage, is presented below.
| Affiliate | Value, beginning of period ($) | Purchases ($) | Sales Proceeds ($) | Dividend Income ($) | Realized Gain (loss) ($) | Change in Unrealized appreciation (depreciation) ($) | Value, end of period ($) | %ownership, end of period |
| Fidelity Cash Central Fund 2.33% | 2,983,817 | 32,069,695 | 28,882,370 | 72,448 | - | - | 6,171,142 | 0.0% |
| Fidelity Securities Lending Cash Central Fund 2.34% | 27,079,836 | 64,742,564 | 81,919,822 | 14,332 | - | - | 9,902,578 | 0.0% |
| Total | 30,063,653 | 96,812,259 | 110,802,192 | 86,780 | - | - | 16,073,720 | |
| | | | | | | | | |
Amounts in the income column in the above table include any capital gain distributions from underlying funds, which are presented in the corresponding line item in the Statement of Operations, if applicable.
Amount for Fidelity Securities Lending Cash Central Fund represents the income earned on investing cash collateral, less rebates paid to borrowers and any lending agent fees associated with the loan, plus any premium payments received for lending certain types of securities.
Investment Valuation
The following is a summary of the inputs used, as of August 31, 2022, involving the Fund's assets and liabilities carried at fair value. The inputs or methodology used for valuing securities may not be an indication of the risk associated with investing in those securities. For more information on valuation inputs, and their aggregation into the levels used below, please refer to the Investment Valuation section in the accompanying Notes to Financial Statements.
| Valuation Inputs at Reporting Date: |
| Description | Total ($) | Level 1 ($) | Level 2 ($) | Level 3 ($) |
Investments in Securities: | | | | |
|
| Common Stocks | 228,675,769 | 228,675,769 | - | - |
|
| Money Market Funds | 16,073,720 | 16,073,720 | - | - |
| Total Investments in Securities: | 244,749,489 | 244,749,489 | - | - |
Telecommunications Portfolio
| Statement of Assets and Liabilities |
| | | | August 31, 2022 (Unaudited) |
| | | | | |
| Assets | | | | |
| Investment in securities, at value (including securities loaned of $9,534,897) - See accompanying schedule: | | $228,675,769 | | |
Unaffiliated issuers (cost $233,849,522) | | | |
Fidelity Central Funds (cost $16,073,720) | | 16,073,720 | | |
| | | | | |
| Total Investment in Securities (cost $249,923,242) | | | $ | 244,749,489 |
| Cash | | | | 51 |
| Receivable for investments sold | | | | 831,647 |
| Receivable for fund shares sold | | | | 101,227 |
| Dividends receivable | | | | 87,600 |
| Distributions receivable from Fidelity Central Funds | | | | 12,998 |
| Prepaid expenses | | | | 1,607 |
| Other receivables | | | | 7,033 |
Total assets | | | | 245,791,652 |
| Liabilities | | | | |
| Payable for fund shares redeemed | | $222,855 | | |
| Accrued management fee | | 109,258 | | |
| Distribution and service plan fees payable | | 11,124 | | |
| Other affiliated payables | | 49,228 | | |
| Other payables and accrued expenses | | 21,689 | | |
| Collateral on securities loaned | | 9,902,102 | | |
| Total Liabilities | | | | 10,316,256 |
| Net Assets | | | $ | 235,475,396 |
| Net Assets consist of: | | | | |
| Paid in capital | | | $ | 238,410,012 |
| Total accumulated earnings (loss) | | | | (2,934,616) |
| Net Assets | | | $ | 235,475,396 |
| | | | | |
| Net Asset Value and Maximum Offering Price | | | | |
| Class A : | | | | |
Net Asset Value and redemption price per share ($18,870,238 ÷ 398,438 shares) (a) | | | $ | 47.36 |
| Maximum offering price per share (100/94.25 of $47.36) | | | $ | 50.25 |
| Class M : | | | | |
Net Asset Value and redemption price per share ($6,999,480 ÷ 148,944 shares) (a) | | | $ | 46.99 |
| Maximum offering price per share (100/96.50 of $46.99) | | | $ | 48.69 |
| Class C : | | | | |
Net Asset Value and offering price per share ($4,382,427 ÷ 92,968 shares) (a) | | | $ | 47.14 |
| Telecommunications : | | | | |
Net Asset Value , offering price and redemption price per share ($174,338,153 ÷ 3,650,066 shares) | | | $ | 47.76 |
| Class I : | | | | |
Net Asset Value , offering price and redemption price per share ($25,887,413 ÷ 543,626 shares) | | | $ | 47.62 |
| Class Z : | | | | |
Net Asset Value , offering price and redemption price per share ($4,997,685 ÷ 105,156 shares) | | | $ | 47.53 |
(a)Redemption price per share is equal to net asset value less any applicable contingent deferred sales charge. |
| Statement of Operations |
| | | | Six months ended August 31, 2022 (Unaudited) |
| Investment Income | | | | |
| Dividends | | | $ | 4,003,914 |
| Income from Fidelity Central Funds (including $14,332 from security lending) | | | | 86,780 |
| Total Income | | | | 4,090,694 |
| Expenses | | | | |
| Management fee | $ | 684,996 | | |
| Transfer agent fees | | 253,690 | | |
| Distribution and service plan fees | | 70,722 | | |
| Accounting fees | | 48,363 | | |
| Custodian fees and expenses | | 1,432 | | |
| Independent trustees' fees and expenses | | 421 | | |
| Registration fees | | 43,578 | | |
| Audit | | 20,570 | | |
| Legal | | 735 | | |
| Miscellaneous | | 788 | | |
| Total expenses before reductions | | 1,125,295 | | |
| Expense reductions | | (4,286) | | |
| Total expenses after reductions | | | | 1,121,009 |
| Net Investment income (loss) | | | | 2,969,685 |
| Realized and Unrealized Gain (Loss) | | | | |
| Net realized gain (loss) on: | | | | |
| Investment Securities: | | | | |
| Unaffiliated issuers(net of foreign taxes of $40,436) | | 2,375,089 | | |
| Foreign currency transactions | | 3,842 | | |
| Total net realized gain (loss) | | | | 2,378,931 |
| Change in net unrealized appreciation (depreciation) on: | | | | |
| Investment Securities: | | | | |
| Unaffiliated issuers (net of decrease in deferred foreign taxes of $33,773) | | (30,411,798) | | |
| Assets and liabilities in foreign currencies | | (252) | | |
| Total change in net unrealized appreciation (depreciation) | | | | (30,412,050) |
| Net gain (loss) | | | | (28,033,119) |
| Net increase (decrease) in net assets resulting from operations | | | $ | (25,063,434) |
| Statement of Changes in Net Assets |
| |
| | Six months ended August 31, 2022 (Unaudited) | | Year ended February 28, 2022 |
| Increase (Decrease) in Net Assets | | | | |
| Operations | | | | |
| Net investment income (loss) | $ | 2,969,685 | $ | 7,853,249 |
| Net realized gain (loss) | | 2,378,931 | | 30,387,100 |
| Change in net unrealized appreciation (depreciation) | | (30,412,050) | | (51,298,844) |
| Net increase (decrease) in net assets resulting from operations | | (25,063,434) | | (13,058,495) |
| Distributions to shareholders | | (9,738,740) | | (39,228,015) |
| Share transactions - net increase (decrease) | | 18,082,046 | | (46,334,121) |
| Total increase (decrease) in net assets | | (16,720,128) | | (98,620,631) |
| | | | | |
| Net Assets | | | | |
| Beginning of period | | 252,195,524 | | 350,816,155 |
| End of period | $ | 235,475,396 | $ | 252,195,524 |
| | | | | |
| | | | | |
| Fidelity Advisor® Telecommunications Fund Class A |
| |
| | Six months ended (Unaudited) August 31, 2022 | | Years ended February 28, 2022 | | 2021 | | 2020 A | | 2019 | | 2018 |
Selected Per-Share Data | | | | | | | | | | | | |
| Net asset value, beginning of period | $ | 54.28 | $ | 66.52 | $ | 60.60 | $ | 55.68 | $ | 55.58 | $ | 69.61 |
| Income from Investment Operations | | | | | | | | | | | | |
Net investment income (loss) B,C | | .53 | | 1.51 D | | .66 | | .87 | | 1.10 E | | 1.05 |
| Net realized and unrealized gain (loss) | | (5.52) | | (5.14) | | 10.61 | | 5.86 | | .56 | | (3.38) |
| Total from investment operations | | (4.99) | | (3.63) | | 11.27 | | 6.73 | | 1.66 | | (2.33) |
| Distributions from net investment income | | (.44) | | (1.66) | | (.39) | | (.96) | | (.94) | | (1.31) |
| Distributions from net realized gain | | (1.49) | | (6.95) | | (4.96) | | (.85) | | (.62) | | (10.39) |
| Total distributions | | (1.93) | | (8.61) | | (5.35) | | (1.81) | | (1.56) | | (11.70) |
| Net asset value, end of period | $ | 47.36 | $ | 54.28 | $ | 66.52 | $ | 60.60 | $ | 55.68 | $ | 55.58 |
Total Return F,G,H | | (9.66)% | | (6.28)% | | 18.75% | | 12.12% | | 3.03% | | (4.06)% |
Ratios to Average Net Assets C,I,J | | | | | | | | | | | | |
| Expenses before reductions | | 1.12% K | | 1.09% | | 1.11% | | 1.18% | | 1.18% | | 1.14% |
| Expenses net of fee waivers, if any | | 1.12% K | | 1.09% | | 1.11% | | 1.17% | | 1.17% | | 1.14% |
| Expenses net of all reductions | | 1.12% K | | 1.09% | | 1.10% | | 1.17% | | 1.16% | | 1.12% |
| Net investment income (loss) | | 2.03% K | | 2.27% D | | 1.01% | | 1.47% | | 1.96% E | | 1.59% |
| Supplemental Data | | | | | | | | | | | | |
| Net assets, end of period (000 omitted) | $ | 18,870 | $ | 22,023 | $ | 29,800 | $ | 21,376 | $ | 20,589 | $ | 17,816 |
Portfolio turnover rate L | | 20% K | | 28% | | 58% | | 58% | | 64% M | | 66% |
A For the year ended February 29.
B Calculated based on average shares outstanding during the period.
C Net investment income (loss) is affected by the timing of the declaration of dividends by any underlying mutual funds or exchange-traded funds (ETFs). Net investment income (loss) of any such underlying funds is not included in the Fund's net investment income (loss) ratio.
D Net investment income per share reflects one or more large, non-recurring dividend(s) which amounted to $.35 per share. Excluding such non-recurring dividend(s), the ratio of net investment income (loss) to average net assets would have been 1.74%.
E Net investment income per share reflects one or more large, non-recurring dividend(s) which amounted to $.25 per share. Excluding such non-recurring dividend(s), the ratio of net investment income (loss) to average net assets would have been 1.52%.
F Total returns for periods of less than one year are not annualized.
G Total returns would have been lower if certain expenses had not been reduced during the applicable periods shown.
H Total returns do not include the effect of the sales charges.
I Fees and expenses of any underlying mutual funds or exchange-traded funds (ETFs) are not included in the Fund's expense ratio. The Fund indirectly bears its proportionate share of these expenses. For additional expense information related to investments in Fidelity Central Funds, please refer to the "Investments in Fidelity Central Funds" note found in the Notes to Financial Statements section of the most recent Annual or Semi-Annual report.
J Expense ratios reflect operating expenses of the class. Expenses before reductions do not reflect amounts reimbursed, waived, or reduced through arrangements with the investment adviser, brokerage services, or other offset arrangements, if applicable, and do not represent the amount paid by the class during periods when reimbursements, waivers or reductions occur.
K Annualized
L Amount does not include the portfolio activity of any underlying mutual funds or exchange-traded funds (ETFs).
M Portfolio turnover rate excludes securities received or delivered in-kind.
| Fidelity Advisor® Telecommunications Fund Class M |
| |
| | Six months ended (Unaudited) August 31, 2022 | | Years ended February 28, 2022 | | 2021 | | 2020 A | | 2019 | | 2018 |
Selected Per-Share Data | | | | | | | | | | | | |
| Net asset value, beginning of period | $ | 53.88 | $ | 66.09 | $ | 60.25 | $ | 55.40 | $ | 55.31 | $ | 69.33 |
| Income from Investment Operations | | | | | | | | | | | | |
Net investment income (loss) B,C | | .46 | | 1.29 D | | .46 | | .70 | | .92 E | | .81 |
| Net realized and unrealized gain (loss) | | (5.49) | | (5.08) | | 10.54 | | 5.83 | | .55 | | (3.36) |
| Total from investment operations | | (5.03) | | (3.79) | | 11.00 | | 6.53 | | 1.47 | | (2.55) |
| Distributions from net investment income | | (.37) | | (1.48) | | (.20) | | (.83) | | (.76) | | (1.07) |
| Distributions from net realized gain | | (1.49) | | (6.95) | | (4.96) | | (.85) | | (.62) | | (10.39) |
| Total distributions | | (1.86) | | (8.42) F | | (5.16) | | (1.68) | | (1.38) | | (11.47) F |
| Net asset value, end of period | $ | 46.99 | $ | 53.88 | $ | 66.09 | $ | 60.25 | $ | 55.40 | $ | 55.31 |
Total Return G,H,I | | (9.79)% | | (6.55)% | | 18.39% | | 11.81% | | 2.69% | | (4.40)% |
Ratios to Average Net Assets C,J,K | | | | | | | | | | | | |
| Expenses before reductions | | 1.39% L | | 1.39% | | 1.41% | | 1.46% | | 1.50% | | 1.49% |
| Expenses net of fee waivers, if any | | 1.38% L | | 1.38% | | 1.41% | | 1.46% | | 1.49% | | 1.49% |
| Expenses net of all reductions | | 1.38% L | | 1.38% | | 1.40% | | 1.45% | | 1.48% | | 1.48% |
| Net investment income (loss) | | 1.76% L | | 1.97% D | | .71% | | 1.19% | | 1.64% E | | 1.24% |
| Supplemental Data | | | | | | | | | | | | |
| Net assets, end of period (000 omitted) | $ | 6,999 | $ | 7,733 | $ | 9,038 | $ | 6,919 | $ | 6,018 | $ | 4,847 |
Portfolio turnover rate M | | 20% L | | 28% | | 58% | | 58% | | 64% N | | 66% |
A For the year ended February 29.
B Calculated based on average shares outstanding during the period.
��C Net investment income (loss) is affected by the timing of the declaration of dividends by any underlying mutual funds or exchange-traded funds (ETFs). Net investment income (loss) of any such underlying funds is not included in the Fund's net investment income (loss) ratio.
D Net investment income per share reflects one or more large, non-recurring dividend(s) which amounted to $.35 per share. Excluding such non-recurring dividend(s), the ratio of net investment income (loss) to average net assets would have been 1.44%.
E Net investment income per share reflects one or more large, non-recurring dividend(s) which amounted to $.25 per share. Excluding such non-recurring dividend(s), the ratio of net investment income (loss) to average net assets would have been 1.19%.
F Total distributions per share do not sum due to rounding.
G Total returns for periods of less than one year are not annualized.
H Total returns would have been lower if certain expenses had not been reduced during the applicable periods shown.
I Total returns do not include the effect of the sales charges.
J Fees and expenses of any underlying mutual funds or exchange-traded funds (ETFs) are not included in the Fund's expense ratio. The Fund indirectly bears its proportionate share of these expenses. For additional expense information related to investments in Fidelity Central Funds, please refer to the "Investments in Fidelity Central Funds" note found in the Notes to Financial Statements section of the most recent Annual or Semi-Annual report.
K Expense ratios reflect operating expenses of the class. Expenses before reductions do not reflect amounts reimbursed, waived, or reduced through arrangements with the investment adviser, brokerage services, or other offset arrangements, if applicable, and do not represent the amount paid by the class during periods when reimbursements, waivers or reductions occur.
L Annualized
M Amount does not include the portfolio activity of any underlying mutual funds or exchange-traded funds (ETFs).
N Portfolio turnover rate excludes securities received or delivered in-kind.
| Fidelity Advisor® Telecommunications Fund Class C |
| |
| | Six months ended (Unaudited) August 31, 2022 | | Years ended February 28, 2022 | | 2021 | | 2020 A | | 2019 | | 2018 |
Selected Per-Share Data | | | | | | | | | | | | |
| Net asset value, beginning of period | $ | 54.04 | $ | 66.17 | $ | 60.32 | $ | 55.45 | $ | 55.29 | $ | 69.24 |
| Income from Investment Operations | | | | | | | | | | | | |
Net investment income (loss) B,C | | .33 | | 1.01 D | | .17 | | .46 | | .70 E | | .57 |
| Net realized and unrealized gain (loss) | | (5.50) | | (5.09) | | 10.54 | | 5.82 | | .56 | | (3.36) |
| Total from investment operations | | (5.17) | | (4.08) | | 10.71 | | 6.28 | | 1.26 | | (2.79) |
| Distributions from net investment income | | (.24) | | (1.10) | | (.07) | | (.56) | | (.48) | | (.77) |
| Distributions from net realized gain | | (1.49) | | (6.95) | | (4.79) | | (.85) | | (.62) | | (10.39) |
| Total distributions | | (1.73) | | (8.05) | | (4.86) | | (1.41) | | (1.10) | | (11.16) |
| Net asset value, end of period | $ | 47.14 | $ | 54.04 | $ | 66.17 | $ | 60.32 | $ | 55.45 | $ | 55.29 |
Total Return F,G,H | | (9.99)% | | (6.97)% | | 17.88% | | 11.34% | | 2.30% | | (4.75)% |
Ratios to Average Net Assets C,I,J | | | | | | | | | | | | |
| Expenses before reductions | | 1.87% K | | 1.83% | | 1.86% | | 1.88% | | 1.88% | | 1.86% |
| Expenses net of fee waivers, if any | | 1.86% K | | 1.83% | | 1.86% | | 1.87% | | 1.88% | | 1.86% |
| Expenses net of all reductions | | 1.86% K | | 1.83% | | 1.84% | | 1.87% | | 1.86% | | 1.85% |
| Net investment income (loss) | | 1.28% K | | 1.52% D | | .26% | | .77% | | 1.26% E | | .87% |
| Supplemental Data | | | | | | | | | | | | |
| Net assets, end of period (000 omitted) | $ | 4,382 | $ | 5,254 | $ | 7,801 | $ | 6,491 | $ | 6,994 | $ | 8,396 |
Portfolio turnover rate L | | 20% K | | 28% | | 58% | | 58% | | 64% M | | 66% |
A For the year ended February 29.
B Calculated based on average shares outstanding during the period.
C Net investment income (loss) is affected by the timing of the declaration of dividends by any underlying mutual funds or exchange-traded funds (ETFs). Net investment income (loss) of any such underlying funds is not included in the Fund's net investment income (loss) ratio.
D Net investment income per share reflects one or more large, non-recurring dividend(s) which amounted to $.35 per share. Excluding such non-recurring dividend(s), the ratio of net investment income (loss) to average net assets would have been .99%.
E Net investment income per share reflects one or more large, non-recurring dividend(s) which amounted to $.25 per share. Excluding such non-recurring dividend(s), the ratio of net investment income (loss) to average net assets would have been .81%.
F Total returns for periods of less than one year are not annualized.
G Total returns would have been lower if certain expenses had not been reduced during the applicable periods shown.
H Total returns do not include the effect of the contingent deferred sales charge.
I Fees and expenses of any underlying mutual funds or exchange-traded funds (ETFs) are not included in the Fund's expense ratio. The Fund indirectly bears its proportionate share of these expenses. For additional expense information related to investments in Fidelity Central Funds, please refer to the "Investments in Fidelity Central Funds" note found in the Notes to Financial Statements section of the most recent Annual or Semi-Annual report.
J Expense ratios reflect operating expenses of the class. Expenses before reductions do not reflect amounts reimbursed, waived, or reduced through arrangements with the investment adviser, brokerage services, or other offset arrangements, if applicable, and do not represent the amount paid by the class during periods when reimbursements, waivers or reductions occur.
K Annualized
L Amount does not include the portfolio activity of any underlying mutual funds or exchange-traded funds (ETFs).
M Portfolio turnover rate excludes securities received or delivered in-kind.
| Telecommunications Portfolio |
| |
| | Six months ended (Unaudited) August 31, 2022 | | Years ended February 28, 2022 | | 2021 | | 2020 A | | 2019 | | 2018 |
Selected Per-Share Data | | | | | | | | | | | | |
| Net asset value, beginning of period | $ | 54.73 | $ | 67.04 | $ | 60.99 | $ | 56.04 | $ | 55.88 | $ | 69.97 |
| Income from Investment Operations | | | | | | | | | | | | |
Net investment income (loss) B,C | | .62 | | 1.71 D | | .86 | | 1.09 | | 1.30 E | | 1.28 |
| Net realized and unrealized gain (loss) | | (5.58) | | (5.18) | | 10.71 | | 5.90 | | .56 | | (3.42) |
| Total from investment operations | | (4.96) | | (3.47) | | 11.57 | | 6.99 | | 1.86 | | (2.14) |
| Distributions from net investment income | | (.52) | | (1.89) | | (.57) | | (1.19) | | (1.08) | | (1.56) |
| Distributions from net realized gain | | (1.49) | | (6.95) | | (4.96) | | (.85) | | (.62) | | (10.39) |
| Total distributions | | (2.01) | | (8.84) | | (5.52) F | | (2.04) | | (1.70) | | (11.95) |
| Net asset value, end of period | $ | 47.76 | $ | 54.73 | $ | 67.04 | $ | 60.99 | $ | 56.04 | $ | 55.88 |
Total Return G,H | | (9.53)% | | (5.99)% | | 19.15% | | 12.50% | | 3.38% | | (3.76)% |
Ratios to Average Net Assets C,I,J | | | | | | | | | | | | |
| Expenses before reductions | | .81% K | | .79% | | .81% | | .83% | | .84% | | .82% |
| Expenses net of fee waivers, if any | | .81% K | | .79% | | .81% | | .82% | | .83% | | .82% |
| Expenses net of all reductions | | .81% K | | .79% | | .79% | | .82% | | .82% | | .80% |
| Net investment income (loss) | | 2.34% K | | 2.57% D | | 1.31% | | 1.82% | | 2.30% E | | 1.92% |
| Supplemental Data | | | | | | | | | | | | |
| Net assets, end of period (000 omitted) | $ | 174,338 | $ | 199,560 | $ | 242,284 | $ | 219,854 | $ | 227,438 | $ | 320,908 |
Portfolio turnover rate L | | 20% K | | 28% | | 58% | | 58% | | 64% M | | 66% |
A For the year ended February 29.
B Calculated based on average shares outstanding during the period.
C Net investment income (loss) is affected by the timing of the declaration of dividends by any underlying mutual funds or exchange-traded funds (ETFs). Net investment income (loss) of any such underlying funds is not included in the Fund's net investment income (loss) ratio.
D Net investment income per share reflects one or more large, non-recurring dividend(s) which amounted to $.35 per share. Excluding such non-recurring dividend(s), the ratio of net investment income (loss) to average net assets would have been 2.04%.
E Net investment income per share reflects one or more large, non-recurring dividend(s) which amounted to $.25 per share. Excluding such non-recurring dividend(s), the ratio of net investment income (loss) to average net assets would have been 1.85%.
F Total distributions per share do not sum due to rounding.
G Total returns for periods of less than one year are not annualized.
H Total returns would have been lower if certain expenses had not been reduced during the applicable periods shown.
I Fees and expenses of any underlying mutual funds or exchange-traded funds (ETFs) are not included in the Fund's expense ratio. The Fund indirectly bears its proportionate share of these expenses. For additional expense information related to investments in Fidelity Central Funds, please refer to the "Investments in Fidelity Central Funds" note found in the Notes to Financial Statements section of the most recent Annual or Semi-Annual report.
J Expense ratios reflect operating expenses of the class. Expenses before reductions do not reflect amounts reimbursed, waived, or reduced through arrangements with the investment adviser, brokerage services, or other offset arrangements, if applicable, and do not represent the amount paid by the class during periods when reimbursements, waivers or reductions occur.
K Annualized
L Amount does not include the portfolio activity of any underlying mutual funds or exchange-traded funds (ETFs).
M Portfolio turnover rate excludes securities received or delivered in-kind.
| Fidelity Advisor® Telecommunications Fund Class I |
| |
| | Six months ended (Unaudited) August 31, 2022 | | Years ended February 28, 2022 | | 2021 | | 2020 A | | 2019 | | 2018 |
Selected Per-Share Data | | | | | | | | | | | | |
| Net asset value, beginning of period | $ | 54.58 | $ | 66.84 | $ | 60.86 | $ | 55.84 | $ | 55.74 | $ | 69.82 |
| Income from Investment Operations | | | | | | | | | | | | |
Net investment income (loss) B,C | | .62 | | 1.74 D | | .88 | | 1.04 | | 1.27 E | | 1.26 |
| Net realized and unrealized gain (loss) | | (5.55) | | (5.18) | | 10.66 | | 5.91 | | .57 | | (3.39) |
| Total from investment operations | | (4.93) | | (3.44) | | 11.54 | | 6.95 | | 1.84 | | (2.13) |
| Distributions from net investment income | | (.54) | | (1.87) | | (.60) | | (1.08) | | (1.12) | | (1.56) |
| Distributions from net realized gain | | (1.49) | | (6.95) | | (4.96) | | (.85) | | (.62) | | (10.39) |
| Total distributions | | (2.03) | | (8.82) | | (5.56) | | (1.93) | | (1.74) | | (11.95) |
| Net asset value, end of period | $ | 47.62 | $ | 54.58 | $ | 66.84 | $ | 60.86 | $ | 55.84 | $ | 55.74 |
Total Return F,G | | (9.51)% | | (5.97)% | | 19.13% | | 12.47% | | 3.35% | | (3.75)% |
Ratios to Average Net Assets C,H,I | | | | | | | | | | | | |
| Expenses before reductions | | .78% J | | .77% | | .79% | | .88% | | .91% | | .82% |
| Expenses net of fee waivers, if any | | .77% J | | .77% | | .79% | | .88% | | .90% | | .82% |
| Expenses net of all reductions | | .77% J | | .77% | | .78% | | .88% | | .88% | | .80% |
| Net investment income (loss) | | 2.38% J | | 2.59% D | | 1.33% | | 1.76% | | 2.23% E | | 1.91% |
| Supplemental Data | | | | | | | | | | | | |
| Net assets, end of period (000 omitted) | $ | 25,887 | $ | 12,038 | $ | 30,622 | $ | 12,428 | $ | 25,181 | $ | 8,332 |
Portfolio turnover rate K | | 20% J | | 28% | | 58% | | 58% | | 64% L | | 66% |
A For the year ended February 29.
B Calculated based on average shares outstanding during the period.
C Net investment income (loss) is affected by the timing of the declaration of dividends by any underlying mutual funds or exchange-traded funds (ETFs). Net investment income (loss) of any such underlying funds is not included in the Fund's net investment income (loss) ratio.
D Net investment income per share reflects one or more large, non-recurring dividend(s) which amounted to $.36 per share. Excluding such non-recurring dividend(s), the ratio of net investment income (loss) to average net assets would have been 2.06%.
E Net investment income per share reflects one or more large, non-recurring dividend(s) which amounted to $.25 per share. Excluding such non-recurring dividend(s), the ratio of net investment income (loss) to average net assets would have been 1.79%.
F Total returns for periods of less than one year are not annualized.
G Total returns would have been lower if certain expenses had not been reduced during the applicable periods shown.
H Fees and expenses of any underlying mutual funds or exchange-traded funds (ETFs) are not included in the Fund's expense ratio. The Fund indirectly bears its proportionate share of these expenses. For additional expense information related to investments in Fidelity Central Funds, please refer to the "Investments in Fidelity Central Funds" note found in the Notes to Financial Statements section of the most recent Annual or Semi-Annual report.
I Expense ratios reflect operating expenses of the class. Expenses before reductions do not reflect amounts reimbursed, waived, or reduced through arrangements with the investment adviser, brokerage services, or other offset arrangements, if applicable, and do not represent the amount paid by the class during periods when reimbursements, waivers or reductions occur.
J Annualized
K Amount does not include the portfolio activity of any underlying mutual funds or exchange-traded funds (ETFs).
L Portfolio turnover rate excludes securities received or delivered in-kind.
| Fidelity Advisor® Telecommunications Fund Class Z |
| |
| | Six months ended (Unaudited) August 31, 2022 | | Years ended February 28, 2022 | | 2021 | | 2020 A | | 2019 B |
Selected Per-Share Data | | | | | | | | | | |
| Net asset value, beginning of period | $ | 54.46 | $ | 66.75 | $ | 60.75 | $ | 55.84 | $ | 60.97 |
| Income from Investment Operations | | | | | | | | | | |
Net investment income (loss) C,D | | .65 | | 1.83 E | | .95 | | 1.20 | | .39 F |
| Net realized and unrealized gain (loss) | | (5.53) | | (5.20) | | 10.67 | | 5.86 | | (4.55) |
| Total from investment operations | | (4.88) | | (3.37) | | 11.62 | | 7.06 | | (4.16) |
| Distributions from net investment income | | (.56) | | (1.98) | | (.67) | | (1.30) | | (.97) |
| Distributions from net realized gain | | (1.49) | | (6.95) | | (4.96) | | (.85) | | - |
| Total distributions | | (2.05) | | (8.92) G | | (5.62) G | | (2.15) | | (.97) |
| Net asset value, end of period | $ | 47.53 | $ | 54.46 | $ | 66.75 | $ | 60.75 | $ | 55.84 |
Total Return H,I | | (9.44)% | | (5.87)% | | 19.31% | | 12.68% | | (6.80)% |
Ratios to Average Net Assets D,J,K | | | | | | | | | | |
| Expenses before reductions | | .66% L | | .65% | | .67% | | .68% | | .68% L |
| Expenses net of fee waivers, if any | | .65% L | | .65% | | .67% | | .67% | | .66% L |
| Expenses net of all reductions | | .65% L | | .65% | | .65% | | .67% | | .64% L |
| Net investment income (loss) | | 2.49% L | | 2.71% E | | 1.45% | | 1.97% | | 1.67% F,L |
| Supplemental Data | | | | | | | | | | |
| Net assets, end of period (000 omitted) | $ | 4,998 | $ | 5,587 | $ | 31,271 | $ | 25,223 | $ | 383 |
Portfolio turnover rate M | | 20% L | | 28% | | 58% | | 58% | | 64% N |
A For the year ended February 29.
B For the period October 2, 2018 (commencement of sale of shares) through February 28, 2019.
C Calculated based on average shares outstanding during the period.
D Net investment income (loss) is affected by the timing of the declaration of dividends by any underlying mutual funds or exchange-traded funds (ETFs). Net investment income (loss) of any such underlying funds is not included in the Fund's net investment income (loss) ratio.
E Net investment income per share reflects one or more large, non-recurring dividend(s) which amounted to $.36 per share. Excluding such non-recurring dividend(s), the ratio of net investment income (loss) to average net assets would have been 2.17%.
F Net investment income per share reflects one or more large, non-recurring dividend(s) which amounted to $.10 per share. Excluding such non-recurring dividend(s), the ratio of net investment income (loss) to average net assets would have been 1.23%.
G Total distributions per share do not sum due to rounding.
H Total returns for periods of less than one year are not annualized.
I Total returns would have been lower if certain expenses had not been reduced during the applicable periods shown.
J Fees and expenses of any underlying mutual funds or exchange-traded funds (ETFs) are not included in the Fund's expense ratio. The Fund indirectly bears its proportionate share of these expenses. For additional expense information related to investments in Fidelity Central Funds, please refer to the "Investments in Fidelity Central Funds" note found in the Notes to Financial Statements section of the most recent Annual or Semi-Annual report.
K Expense ratios reflect operating expenses of the class. Expenses before reductions do not reflect amounts reimbursed, waived, or reduced through arrangements with the investment adviser, brokerage services, or other offset arrangements, if applicable, and do not represent the amount paid by the class during periods when reimbursements, waivers or reductions occur.
L Annualized
M Amount does not include the portfolio activity of any underlying mutual funds or exchange-traded funds (ETFs).
N Portfolio turnover rate excludes securities received or delivered in-kind.
For the period ended August 31, 2022
1.Organization.
Telecommunications Portfolio (the Fund) is a non-diversified fund of Fidelity Select Portfolios (the Trust) and is authorized to issue an unlimited number of shares. The Trust is registered under the Investment Company Act of 1940, as amended (the 1940 Act), as an open-end management investment company organized as a Massachusetts business trust. The Fund invests primarily in securities of companies whose principal business activities fall within specific industries. The Fund offers Class A, Class M, Class C, Telecommunications, Class I and Class Z shares, each of which has equal rights as to assets and voting privileges. Each class has exclusive voting rights with respect to matters that affect that class. Class C shares will automatically convert to Class A shares after a holding period of eight years from the initial date of purchase, with certain exceptions.
2. Investments in Fidelity Central Funds.
Funds may invest in Fidelity Central Funds, which are open-end investment companies generally available only to other investment companies and accounts managed by the investment adviser and its affiliates. The Schedule of Investments lists any Fidelity Central Funds held as an investment as of period end, but does not include the underlying holdings of each Fidelity Central Fund. An investing fund indirectly bears its proportionate share of the expenses of the underlying Fidelity Central Funds.
Based on its investment objective, each Fidelity Central Fund may invest or participate in various investment vehicles or strategies that are similar to those of the investing fund. These strategies are consistent with the investment objectives of the investing fund and may involve certain economic risks which may cause a decline in value of each of the Fidelity Central Funds and thus a decline in the value of the investing fund.
| Fidelity Central Fund | Investment Manager | Investment Objective | Investment Practices | Expense Ratio A |
| Fidelity Money Market Central Funds | Fidelity Management & Research Company LLC (FMR) | Each fund seeks to obtain a high level of current income consistent with the preservation of capital and liquidity. | Short-term Investments | Less than .005% |
A Expenses expressed as a percentage of average net assets and are as of each underlying Central Fund's most recent annual or semi-annual shareholder report.
A complete unaudited list of holdings for each Fidelity Central Fund is available upon request or at the Securities and Exchange Commission website at www.sec.gov. In addition, the financial statements of the Fidelity Central Funds which contain the significant accounting policies (including investment valuation policies) of those funds, and are not covered by the Report of Independent Registered Public Accounting Firm, are available on the Securities and Exchange Commission website or upon request.
3. Significant Accounting Policies.
The Fund is an investment company and applies the accounting and reporting guidance of the Financial Accounting Standards Board (FASB) Accounting Standards Codification Topic 946 Financial Services - Investment Companies . The financial statements have been prepared in conformity with accounting principles generally accepted in the United States of America (GAAP), which require management to make certain estimates and assumptions at the date of the financial statements. Actual results could differ from those estimates. Subsequent events, if any, through the date that the financial statements were issued have been evaluated in the preparation of the financial statements. The Fund's Schedule of Investments lists any underlying mutual funds or exchange-traded funds (ETFs) but does not include the underlying holdings of these funds. The following summarizes the significant accounting policies of the Fund:
Investment Valuation. Investments are valued as of 4:00 p.m. Eastern time on the last calendar day of the period. The Board of Trustees (the Board) has delegated the day to day responsibility for the valuation of the Fund's investments to the Fair Value Committee (the Committee) established by the Fund's investment adviser. In accordance with valuation policies and procedures approved by the Board, the Fund attempts to obtain prices from one or more third party pricing vendors or brokers to value its investments. When current market prices, quotations or currency exchange rates are not readily available or reliable, investments will be fair valued in good faith by the Committee, in accordance with procedures adopted by the Board. Factors used in determining fair value vary by investment type and may include market or investment specific events. The frequency with which these procedures are used cannot be predicted and they may be utilized to a significant extent. The Committee oversees the Fund's valuation policies and procedures and reports to the Board on the Committee's activities and fair value determinations. The Board monitors the appropriateness of the procedures used in valuing the Fund's investments and ratifies the fair value determinations of the Committee.
The Fund categorizes the inputs to valuation techniques used to value its investments into a disclosure hierarchy consisting of three levels as shown below:
Level 1 - unadjusted quoted prices in active markets for identical investments
Level 2 - other significant observable inputs (including quoted prices for similar investments, interest rates, prepayment speeds, etc.)
Level 3 - unobservable inputs (including the Fund's own assumptions based on the best information available)
Valuation techniques used to value the Fund's investments by major category are as follows:
Equity securities, including restricted securities, for which market quotations are readily available, are valued at the last reported sale price or official closing price as reported by a third party pricing vendor on the primary market or exchange on which they are traded and are categorized as Level 1 in the hierarchy. In the event there were no sales during the day or closing prices are not available, securities are valued at the last quoted bid price or may be valued using the last available price and are generally categorized as Level 2 in the hierarchy. For foreign equity securities, when market or security specific events arise, comparisons to the valuation of American Depositary Receipts (ADRs), futures contracts, ETFs and certain indexes as well as quoted prices for similar securities may be used and would be categorized as Level 2 in the hierarchy. For equity securities, including restricted securities, where observable inputs are limited, assumptions about market activity and risk are used and these securities may be categorized as Level 3 in the hierarchy.
Investments in open-end mutual funds, including the Fidelity Central Funds, are valued at their closing net asset value (NAV) each business day and are categorized as Level 1 in the hierarchy.
Changes in valuation techniques may result in transfers in or out of an assigned level within the disclosure hierarchy. The aggregate value of investments by input level as of August 31, 2022 is included at the end of the Fund's Schedule of Investments.
Foreign Currency. Certain Funds may use foreign currency contracts to facilitate transactions in foreign-denominated securities. Gains and losses from these transactions may arise from changes in the value of the foreign currency or if the counterparties do not perform under the contracts' terms.
Foreign-denominated assets, including investment securities, and liabilities are translated into U.S. dollars at the exchange rates at period end. Purchases and sales of investment securities, income and dividends received, and expenses denominated in foreign currencies are translated into U.S. dollars at the exchange rate in effect on the transaction date.
The effects of exchange rate fluctuations on investments are included with the net realized and unrealized gain (loss) on investment securities. Other foreign currency transactions resulting in realized and unrealized gain (loss) are disclosed separately.
Investment Transactions and Income. For financial reporting purposes, the Fund's investment holdings and NAV include trades executed through the end of the last business day of the period. The NAV per share for processing shareholder transactions is calculated as of the close of business of the New York Stock Exchange (NYSE), normally 4:00 p.m. Eastern time and includes trades executed through the end of the prior business day. Gains and losses on securities sold are determined on the basis of identified cost and include proceeds received from litigation. Commissions paid to certain brokers with whom the investment adviser, or its affiliates, places trades on behalf of a fund include an amount in addition to trade execution, which may be rebated back to a fund. Any such rebates are included in net realized gain (loss) on investments in the Statement of Operations. Dividend income is recorded on the ex-dividend date, except for certain dividends from foreign securities where the ex-dividend date may have passed, which are recorded as soon as the Fund is informed of the ex-dividend date. Non-cash dividends included in dividend income, if any, are recorded at the fair market value of the securities received. Income and capital gain distributions from Fidelity Central Funds, if any, are recorded on the ex-dividend date. Certain distributions received by the Fund represent a return of capital or capital gain. The Fund determines the components of these distributions subsequent to the ex-dividend date, based upon receipt of tax filings or other correspondence relating to the underlying investment. These distributions are recorded as a reduction of cost of investments and/or as a realized gain. Investment income is recorded net of foreign taxes withheld where recovery of such taxes is uncertain.
Class Allocations and Expenses. Investment income, realized and unrealized capital gains and losses, common expenses of a fund, and certain fund-level expense reductions, if any, are allocated daily on a pro-rata basis to each class based on the relative net assets of each class to the total net assets of a fund. Each class differs with respect to transfer agent and distribution and service plan fees incurred, as applicable. Certain expense reductions may also differ by class, if applicable. For the reporting period, the allocated portion of income and expenses to each class as a percent of its average net assets may vary due to the timing of recording these transactions in relation to fluctuating net assets of the classes. Expenses directly attributable to a fund are charged to that fund. Expenses attributable to more than one fund are allocated among the respective funds on the basis of relative net assets or other appropriate methods. Expenses included in the accompanying financial statements reflect the expenses of that fund and do not include any expenses associated with any underlying mutual funds or exchange-traded funds. Although not included in a fund's expenses, a fund indirectly bears its proportionate share of these expenses through the net asset value of each underlying mutual fund or exchange-traded fund. Expense estimates are accrued in the period to which they relate and adjustments are made when actual amounts are known.
Income Tax Information and Distributions to Shareholders. Each year, the Fund intends to qualify as a regulated investment company under Subchapter M of the Internal Revenue Code, including distributing substantially all of its taxable income and realized gains. As a result, no provision for U.S. Federal income taxes is required. The Fund files a U.S. federal tax return, in addition to state and local tax returns as required. The Fund's federal income tax returns are subject to examination by the Internal Revenue Service (IRS) for a period of three fiscal years after they are filed. State and local tax returns may be subject to examination for an additional fiscal year depending on the jurisdiction. Foreign taxes are provided for based on the Fund's understanding of the tax rules and rates that exist in the foreign markets in which it invests. The Fund is subject to a tax imposed on capital gains by certain countries in which it invests.
Distributions are declared and recorded on the ex-dividend date. Income and capital gain distributions are declared separately for each class. Income and capital gain distributions are determined in accordance with income tax regulations, which may differ from GAAP.
Capital accounts within the financial statements are adjusted for permanent book-tax differences. These adjustments have no impact on net assets or the results of operations. Capital accounts are not adjusted for temporary book-tax differences which will reverse in a subsequent period.
Book-tax differences are primarily due to foreign currency transactions, certain foreign taxes and losses deferred due to wash sales and excise tax regulations.
As of period end, the cost and unrealized appreciation (depreciation) in securities, and derivatives if applicable, for federal income tax purposes were as follows:
| Gross unrealized appreciation | $ 36,376,685 |
| Gross unrealized depreciation | (42,268,229) |
| Net unrealized appreciation (depreciation) | $ (5,891,544) |
| Tax cost | $ 250,641,033 |
The Fund elected to defer to its next fiscal year approximately $606,780 of capital losses recognized during the period November 1, 2021 to February 28, 2022.
4. Purchases and Sales of Investments.
Purchases and sales of securities, other than short-term securities and in-kind transactions, as applicable, are noted in the table below.
| | Purchases ($) | Sales ($) |
| Telecommunications Portfolio | 33,857,565 | 24,086,159 |
5. Fees and Other Transactions with Affiliates.
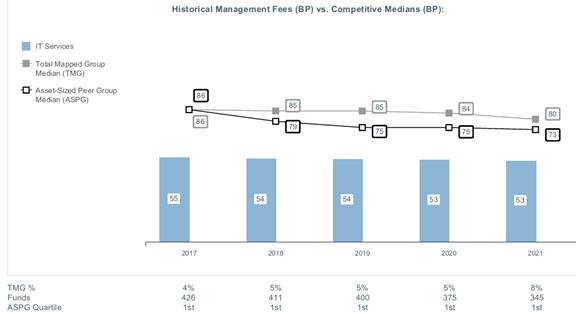
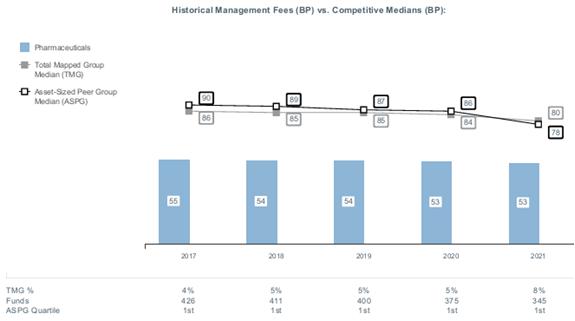
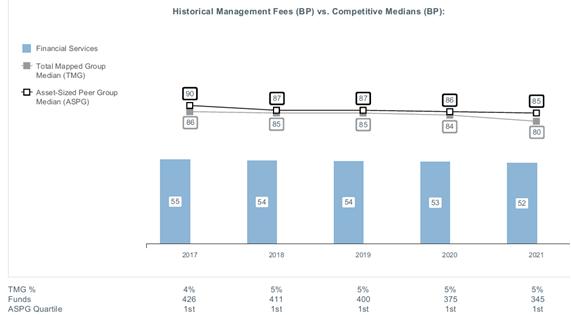
Management Fee. Fidelity Management & Research Company LLC (the investment adviser) and its affiliates provide the Fund with investment management related services for which the Fund pays a monthly management fee. The management fee is the sum of an individual fund fee rate that is based on an annual rate of .30% of the Fund's average net assets and an annualized group fee rate that averaged .23% during the period. The group fee rate is based upon the monthly average net assets of a group of registered investment companies with which the investment adviser has management contracts. The group fee rate decreases as assets under management increase and increases as assets under management decrease. For the reporting period, the total annualized management fee rate was .53% of the Fund's average net assets.
Distribution and Service Plan Fees. In accordance with Rule 12b-1 of the 1940 Act, the Fund has adopted separate Distribution and Service Plans for each class of shares. Certain classes pay Fidelity Distributors Company LLC (FDC), an affiliate of the investment adviser, separate Distribution and Service Fees, each of which is based on an annual percentage of each class' average net assets. In addition, FDC may pay financial intermediaries for selling shares of the Fund and providing shareholder support services. For the period, the Distribution and Service Fee rates, total fees and amounts retained by FDC were as follows:
| | Distribution Fee | Service Fee | Total Fees | Retained by FDC |
| Class A | - % | .25% | $ 26,505 | $ 508 |
| Class M | .25% | .25% | 19,106 | 134 |
| Class C | .75% | .25% | 25,111 | 2,305 |
| | | | $ 70,722 | $ 2,947 |
Sales Load. FDC may receive a front-end sales charge of up to 5.75% for selling Class A shares and 3.50% for selling Class M shares, some of which is paid to financial intermediaries for selling shares of the Fund. Depending on the holding period, FDC may receive contingent deferred sales charges levied on Class A, Class M and Class C redemptions. The deferred sales charges are 1.00% for Class C shares, 1.00% for certain purchases of Class A shares and .25% for certain purchases of Class M shares.
For the period, sales charge amounts retained by FDC were as follows:
| | Retained by FDC |
| Class A | $ 3,623 |
| Class M | 371 |
Class C A | 21 |
| | $ 4,015 |
A When Class C shares are initially sold, FDC pays commissions from its own resources to financial intermediaries through which the sales are made.
Transfer Agent Fees. Fidelity Investments Institutional Operations Company LLC (FIIOC), an affiliate of the investment adviser, is the transfer, dividend disbursing and shareholder servicing agent for each class of the Fund. FIIOC receives account fees and asset-based fees that vary according to the account size and type of account of the shareholders of the respective classes of the Fund, except for Class Z. FIIOC receives an asset-based fee of Class Z's average net assets. FIIOC pays for typesetting, printing and mailing of shareholder reports, except proxy statements.
For the period, transfer agent fees for each class were as follows:
| | Amount | % of Class-Level Average Net Assets A |
| Class A | $ 27,239 | .26 |
| Class M | 10,358 | .27 |
| Class C | 6,280 | .25 |
| Telecommunications | 187,618 | .19 |
| Class I | 21,067 | .16 |
| Class Z | 1,128 | .04 |
| | $ 253,690 | |
A Annualized
Accounting Fees. Fidelity Service Company, Inc. (FSC), an affiliate of the investment adviser, maintains the Fund's accounting records. The accounting fee is based on the level of average net assets for each month. For the period, the fees were equivalent to the following annualized rates:
| | % of Average Net Assets |
| Telecommunications Portfolio | .04 |
Brokerage Commissions. A portion of portfolio transactions were placed with brokerage firms which are affiliates of the investment adviser. Brokerage commissions are included in net realized gain (loss) and change in net unrealized appreciation (depreciation) in the Statement of Operations. The commissions paid to these affiliated firms were as follows:
| | Amount |
| Telecommunications Portfolio | $ 796 |
Interfund Trades. Funds may purchase from or sell securities to other Fidelity Funds under procedures adopted by the Board. The procedures have been designed to ensure these interfund trades are executed in accordance with Rule 17a-7 of the 1940 Act. Any interfund trades are included within the respective purchases and sales amounts shown in the Purchases and Sales of Investments note. Interfund trades during the period are noted in the table below.
| | Purchases ($) | Sales ($) | Realized Gain (Loss) ($) |
| Telecommunications Portfolio | 2,557,653 | - | - |
6. Committed Line of Credit.
Certain Funds participate with other funds managed by the investment adviser or an affiliate in a $4.25 billion credit facility (the "line of credit") to be utilized for temporary or emergency purposes to fund shareholder redemptions or for other short-term liquidity purposes. The participating funds have agreed to pay commitment fees on their pro-rata portion of the line of credit, which are reflected in Miscellaneous expenses on the Statement of Operations, and are listed below. During the period, there were no borrowings on this line of credit.
| | Amount |
| Telecommunications Portfolio | $ 231 |
7. Security Lending.
Funds lend portfolio securities from time to time in order to earn additional income. Lending agents are used, including National Financial Services (NFS), an affiliate of the investment adviser. Pursuant to a securities lending agreement, NFS will receive a fee, which is capped at 9.9% of a fund's daily lending revenue, for its services as lending agent. A fund may lend securities to certain qualified borrowers, including NFS. On the settlement date of the loan, a fund receives collateral (in the form of U.S. Treasury obligations, letters of credit and/or cash) against the loaned securities and maintains collateral in an amount not less than 100% of the market value of the loaned securities during the period of the loan. The market value of the loaned securities is determined at the close of business of a fund and any additional required collateral is delivered to a fund on the next business day. A fund or borrower may terminate the loan at any time, and if the borrower defaults on its obligation to return the securities loaned because of insolvency or other reasons, a fund may apply collateral received from the borrower against the obligation. A fund may experience delays and costs in recovering the securities loaned. Any cash collateral received is invested in the Fidelity Securities Lending Cash Central Fund. Any loaned securities are identified as such in the Schedule of Investments, and the value of loaned securities and cash collateral at period end, as applicable, are presented in the Statement of Assets and Liabilities. Security lending income represents the income earned on investing cash collateral, less rebates paid to borrowers and any lending agent fees associated with the loan, plus any premium payments received for lending certain types of securities. Security lending income is presented in the Statement of Operations as a component of income from Fidelity Central Funds. Affiliated security lending activity, if any, was as follows:
| | Total Security Lending Fees Paid to NFS | Security Lending Income From Securities Loaned to NFS | Value of Securities Loaned to NFS at Period End |
| Telecommunications Portfolio | $ 1,398 | $ - | $- |
8. Expense Reductions.
During the period the investment adviser or an affiliate reimbursed and/or waived a portion of fund-level operating expenses in the amount of $4,286.
9. Distributions to Shareholders.
Distributions to shareholders of each class were as follows:
| | Six months ended August 31, 2022 | Year ended February 28, 2022 |
| Telecommunications Portfolio | | |
| Distributions to shareholders | | |
| Class A | $ 775,861 | $3,450,435 |
| Class M | 267,698 | 1,137,728 |
| Class C | 168,615 | 810,598 |
| Telecommunications | 7,295,482 | 30,567,586 |
| Class I | 1,018,662 | 2,148,608 |
| Class Z | 212,422 | 1,113,060 |
Total | $ 9,738,740 | $ 39,228,015 |
10. Share Transactions.
Share transactions for each class were as follows and may contain in-kind transactions, automatic conversions between classes or exchanges between affiliated funds:
| | Shares | Shares | Dollars | Dollars |
| | Six months ended August 31, 2022 | Year ended February 28, 2022 | Six months ended August 31, 2022 | Year ended February 28, 2022 |
| Telecommunications Portfolio | | | | |
| Class A | | | | |
| Shares sold | 43,373 | 90,188 | $ 2,299,137 | $ 6,068,619 |
| Reinvestment of distributions | 13,653 | 54,998 | 745,823 | 3,273,159 |
| Shares redeemed | (64,278) | (187,477) | (3,354,785) | (12,278,980) |
| Net increase (decrease) | (7,252) | (42,291) | $ (309,825) | $ (2,937,202) |
| Class M | | | | |
| Shares sold | 11,818 | 30,229 | $ 611,697 | $ 1,999,078 |
| Reinvestment of distributions | 4,926 | 19,272 | 267,266 | 1,135,663 |
| Shares redeemed | (11,328) | (42,731) | (585,211) | (2,753,637) |
| Net increase (decrease) | 5,416 | 6,770 | $ 293,752 | $ 381,104 |
| Class C | | | | |
| Shares sold | 7,633 | 11,499 | $ 403,499 | $ 770,363 |
| Reinvestment of distributions | 3,031 | 13,391 | 165,405 | 796,726 |
| Shares redeemed | (14,920) | (45,557) | (786,740) | (2,968,982) |
| Net increase (decrease) | (4,256) | (20,667) | $ (217,836) | $ (1,401,893) |
| Telecommunications | | | | |
| Shares sold | 277,412 | 360,254 | $ 14,739,067 | $ 23,554,030 |
| Reinvestment of distributions | 123,954 | 475,371 | 6,818,149 | 28,443,914 |
| Shares redeemed | (397,755) | (803,327) | (20,833,209) | (52,542,566) |
| Net increase (decrease) | 3,611 | 32,298 | $ 724,007 | $ (544,622) |
| Class I | | | | |
| Shares sold | 393,325 | 96,788 | $ 21,267,972 | $ 6,174,851 |
| Reinvestment of distributions | 17,696 | 32,650 | 970,371 | 1,972,758 |
| Shares redeemed | (87,966) | (367,007) | (4,788,047) | (24,500,148) |
| Net increase (decrease) | 323,055 | (237,569) | $ 17,450,296 | $ (16,352,539) |
| Class Z | | | | |
| Shares sold | 9,941 | 57,644 | $ 516,659 | $ 3,735,025 |
| Reinvestment of distributions | 3,275 | 12,790 | 179,154 | 768,028 |
| Shares redeemed | (10,638) | (436,350) | (554,161) | (29,982,022) |
| Net increase (decrease) | 2,578 | (365,916) | $ 141,652 | $ (25,478,969) |
11. Other.
A fund's organizational documents provide former and current trustees and officers with a limited indemnification against liabilities arising in connection with the performance of their duties to the fund. In the normal course of business, a fund may also enter into contracts that provide general indemnifications. A fund's maximum exposure under these arrangements is unknown as this would be dependent on future claims that may be made against a fund. The risk of material loss from such claims is considered remote.
12. Risk and Uncertainties.
Many factors affect a fund's performance. Developments that disrupt global economies and financial markets, such as pandemics, epidemics, outbreaks of infectious diseases, war, terrorism, and environmental disasters, may significantly affect a fund's investment performance. The effects of these developments to a fund will be impacted by the types of securities in which a fund invests, the financial condition, industry, economic sector, and geographic location of an issuer, and a fund's level of investment in the securities of that issuer.
Top Holdings (% of Fund's net assets) |
| |
| Apple, Inc. | 13.2 | |
| American Tower Corp. | 11.1 | |
| T-Mobile U.S., Inc. | 10.9 | |
| AT&T, Inc. | 6.6 | |
| Qualcomm, Inc. | 4.8 | |
| Marvell Technology, Inc. | 4.5 | |
| Ericsson (B Shares) sponsored ADR | 3.0 | |
| SBA Communications Corp. Class A | 2.7 | |
| Verizon Communications, Inc. | 2.6 | |
| Amazon.com, Inc. | 2.5 | |
| | 61.9 | |
| |
| Industries (% of Fund's net assets) |
| |
| Diversified Telecommunication Services | 16.8 | |
| Wireless Telecommunication Services | 15.4 | |
| Equity Real Estate Investment Trusts (Reits) | 14.5 | |
| Technology Hardware, Storage & Peripherals | 14.5 | |
| Semiconductors & Semiconductor Equipment | 12.7 | |
| Communications Equipment | 10.0 | |
| Internet & Direct Marketing Retail | 4.9 | |
| Entertainment | 4.6 | |
| Interactive Media & Services | 2.7 | |
| Oil, Gas & Consumable Fuels | 2.3 | |
| Software | 0.7 | |
| Media | 0.4 | |
| IT Services | 0.2 | |
| |
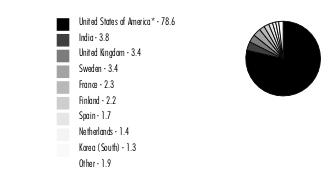
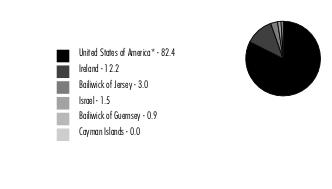
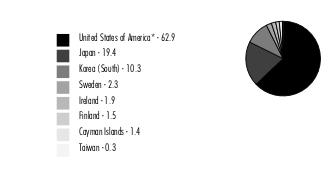
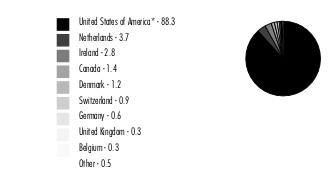
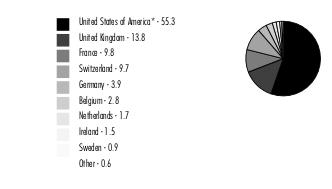
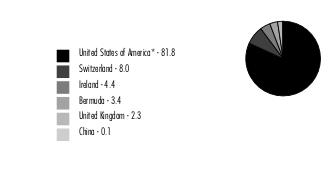
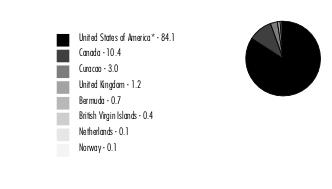
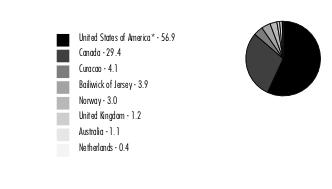
Geographic Diversification (% of Fund's net assets) |
|
* Includes Short-Term investments and Net Other Assets (Liabilities). Percentages are based on country or territory of incorporation and are adjusted for the effect of futures contracts, if applicable. |
| |
Wireless Portfolio
| Common Stocks - 99.7% |
| | | Shares | Value ($) |
| Communications Equipment - 10.0% | | | |
| Communications Equipment - 10.0% | | | |
| CommScope Holding Co., Inc. (a) | | 256,500 | 2,898,450 |
| Digi International, Inc. (a) | | 49,400 | 1,635,634 |
| Ericsson: | | | |
| (B Shares) | | 172,600 | 1,290,776 |
| (B Shares) sponsored ADR | | 1,390,900 | 10,334,387 |
| Motorola Solutions, Inc. | | 33,868 | 8,243,810 |
| Nokia Corp. sponsored ADR | | 1,537,300 | 7,763,365 |
| ViaSat, Inc. (a)(b) | | 63,701 | 2,419,364 |
| | | | 34,585,786 |
| Diversified Telecommunication Services - 16.8% | | | |
| Alternative Carriers - 3.6% | | | |
| Iridium Communications, Inc. (a)(b) | | 66,200 | 2,938,618 |
| Liberty Global PLC Class A (a) | | 387,500 | 7,827,500 |
| Liberty Latin America Ltd. Class C (a) | | 228,900 | 1,595,433 |
| | | | 12,361,551 |
| Integrated Telecommunication Services - 13.2% | | | |
| AT&T, Inc. | | 1,306,100 | 22,908,994 |
| Cellnex Telecom SA (c) | | 82,315 | 3,205,571 |
| Orange SA ADR (b) | | 768,600 | 7,755,174 |
| Telefonica SA sponsored ADR (b) | | 680,149 | 2,775,008 |
| Verizon Communications, Inc. | | 212,401 | 8,880,486 |
| | | | 45,525,233 |
TOTAL DIVERSIFIED TELECOMMUNICATION SERVICES | | | 57,886,784 |
| Entertainment - 4.6% | | | |
| Interactive Home Entertainment - 3.3% | | | |
| Activision Blizzard, Inc. | | 90,900 | 7,134,741 |
| Electronic Arts, Inc. | | 12,500 | 1,585,875 |
| Take-Two Interactive Software, Inc. (a) | | 21,501 | 2,635,163 |
| | | | 11,355,779 |
| Movies & Entertainment - 1.3% | | | |
| Spotify Technology SA (a) | | 10,200 | 1,103,130 |
| Warner Bros Discovery, Inc. (a) | | 251,637 | 3,331,674 |
| | | | 4,434,804 |
TOTAL ENTERTAINMENT | | | 15,790,583 |
| Equity Real Estate Investment Trusts (REITs) - 14.5% | | | |
| Specialized REITs - 14.5% | | | |
| American Tower Corp. | | 150,792 | 38,308,708 |
| Crown Castle International Corp. | | 13,301 | 2,272,210 |
| SBA Communications Corp. Class A | | 29,100 | 9,464,775 |
| | | | 50,045,693 |
| Interactive Media & Services - 2.7% | | | |
| Interactive Media & Services - 2.7% | | | |
| Meta Platforms, Inc. Class A (a) | | 45,300 | 7,380,729 |
| Snap, Inc. Class A (a) | | 191,700 | 2,085,696 |
| | | | 9,466,425 |
| Internet & Direct Marketing Retail - 4.9% | | | |
| Internet & Direct Marketing Retail - 4.9% | | | |
| Amazon.com, Inc. (a) | | 68,100 | 8,633,037 |
| Uber Technologies, Inc. (a) | | 290,100 | 8,343,276 |
| | | | 16,976,313 |
| IT Services - 0.2% | | | |
| Internet Services & Infrastructure - 0.2% | | | |
| Twilio, Inc. Class A (a) | | 11,100 | 772,338 |
| Media - 0.4% | | | |
| Cable & Satellite - 0.4% | | | |
| DISH Network Corp. Class A (a) | | 75,649 | 1,312,510 |
| Oil, Gas & Consumable Fuels - 2.3% | | | |
| Oil & Gas Refining & Marketing - 2.3% | | | |
| Reliance Industries Ltd. | | 236,500 | 7,744,019 |
| Semiconductors & Semiconductor Equipment - 12.7% | | | |
| Semiconductor Equipment - 0.7% | | | |
| Teradyne, Inc. | | 28,600 | 2,420,704 |
| Semiconductors - 12.0% | | | |
| Marvell Technology, Inc. | | 329,000 | 15,403,780 |
| NXP Semiconductors NV | | 28,300 | 4,657,614 |
| Qorvo, Inc. (a) | | 51,700 | 4,641,626 |
| Qualcomm, Inc. | | 126,150 | 16,685,861 |
| | | | 41,388,881 |
TOTAL SEMICONDUCTORS & SEMICONDUCTOR EQUIPMENT | | | 43,809,585 |
| Software - 0.7% | | | |
| Application Software - 0.7% | | | |
| LivePerson, Inc. (a) | | 84,000 | 974,400 |
| RingCentral, Inc. (a) | | 33,100 | 1,424,624 |
| Zoom Video Communications, Inc. Class A (a) | | 300 | 24,120 |
| | | | 2,423,144 |
| Technology Hardware, Storage & Peripherals - 14.5% | | | |
| Technology Hardware, Storage & Peripherals - 14.5% | | | |
| Apple, Inc. | | 288,620 | 45,376,836 |
| Samsung Electronics Co. Ltd. | | 103,800 | 4,580,254 |
| | | | 49,957,090 |
| Wireless Telecommunication Services - 15.4% | | | |
| Wireless Telecommunication Services - 15.4% | | | |
| Bharti Airtel Ltd. | | 546,500 | 4,948,054 |
| Bharti Airtel Ltd. | | 47,900 | 206,256 |
| Millicom International Cellular SA (a)(b) | | 187,680 | 2,659,426 |
| Rogers Communications, Inc. Class B (non-vtg.) (b) | | 88,800 | 3,823,535 |
| Shenandoah Telecommunications Co. | | 300 | 6,687 |
| Spok Holdings, Inc. | | 1 | 7 |
| T-Mobile U.S., Inc. (a) | | 261,516 | 37,647,843 |
| Vodafone Group PLC sponsored ADR | | 293,581 | 3,939,857 |
| | | | 53,231,665 |
| TOTAL COMMON STOCKS (Cost $272,386,602) | | | 344,001,935 |
| | | | |
| Money Market Funds - 4.9% |
| | | Shares | Value ($) |
| Fidelity Cash Central Fund 2.33% (d) | | 1,359,164 | 1,359,435 |
| Fidelity Securities Lending Cash Central Fund 2.34% (d)(e) | | 15,417,814 | 15,419,355 |
| TOTAL MONEY MARKET FUNDS (Cost $16,778,790) | | | 16,778,790 |
| | | | |
| TOTAL INVESTMENT IN SECURITIES - 104.6% (Cost $289,165,392) | 360,780,725 |
NET OTHER ASSETS (LIABILITIES) - (4.6)% | (15,907,094) |
| NET ASSETS - 100.0% | 344,873,631 |
| | |
Legend
| (b) | Security or a portion of the security is on loan at period end. |
| (c) | Security exempt from registration under Rule 144A of the Securities Act of 1933. These securities may be resold in transactions exempt from registration, normally to qualified institutional buyers. At the end of the period, the value of these securities amounted to $3,205,571 or 0.9% of net assets. |
| (d) | Affiliated fund that is generally available only to investment companies and other accounts managed by Fidelity Investments. The rate quoted is the annualized seven-day yield of the fund at period end. A complete unaudited listing of the fund's holdings as of its most recent quarter end is available upon request. In addition, each Fidelity Central Fund's financial statements are available on the SEC's website or upon request. |
| (e) | Investment made with cash collateral received from securities on loan. |
Affiliated Central Funds
Fiscal year to date information regarding the Fund's investments in Fidelity Central Funds, including the ownership percentage, is presented below.
| Affiliate | Value, beginning of period ($) | Purchases ($) | Sales Proceeds ($) | Dividend Income ($) | Realized Gain (loss) ($) | Change in Unrealized appreciation (depreciation) ($) | Value, end of period ($) | %ownership, end of period |
| Fidelity Cash Central Fund 2.33% | 678,387 | 35,822,364 | 35,141,316 | 8,531 | - | - | 1,359,435 | 0.0% |
| Fidelity Securities Lending Cash Central Fund 2.34% | 11,173,355 | 72,449,209 | 68,203,209 | 104,576 | - | - | 15,419,355 | 0.0% |
| Total | 11,851,742 | 108,271,573 | 103,344,525 | 113,107 | - | - | 16,778,790 | |
| | | | | | | | | |
Amounts in the income column in the above table include any capital gain distributions from underlying funds, which are presented in the corresponding line item in the Statement of Operations, if applicable.
Amount for Fidelity Securities Lending Cash Central Fund represents the income earned on investing cash collateral, less rebates paid to borrowers and any lending agent fees associated with the loan, plus any premium payments received for lending certain types of securities.
Investment Valuation
The following is a summary of the inputs used, as of August 31, 2022, involving the Fund's assets and liabilities carried at fair value. The inputs or methodology used for valuing securities may not be an indication of the risk associated with investing in those securities. For more information on valuation inputs, and their aggregation into the levels used below, please refer to the Investment Valuation section in the accompanying Notes to Financial Statements.
| Valuation Inputs at Reporting Date: |
| Description | Total ($) | Level 1 ($) | Level 2 ($) | Level 3 ($) |
Investments in Securities: | | | | |
|
| Common Stocks | 344,001,935 | 322,027,005 | 21,974,930 | - |
|
| Money Market Funds | 16,778,790 | 16,778,790 | - | - |
| Total Investments in Securities: | 360,780,725 | 338,805,795 | 21,974,930 | - |
Wireless Portfolio
| Statement of Assets and Liabilities |
| | | | August 31, 2022 (Unaudited) |
| | | | | |
| Assets | | | | |
| Investment in securities, at value (including securities loaned of $14,769,212) - See accompanying schedule: | | $344,001,935 | | |
Unaffiliated issuers (cost $272,386,602) | | | |
Fidelity Central Funds (cost $16,778,790) | | 16,778,790 | | |
| | | | | |
| Total Investment in Securities (cost $289,165,392) | | | $ | 360,780,725 |
| Foreign currency held at value (cost $90,111) | | | | 90,111 |
| Receivable for investments sold | | | | 356,262 |
| Receivable for fund shares sold | | | | 72,988 |
| Dividends receivable | | | | 276,097 |
| Distributions receivable from Fidelity Central Funds | | | | 14,036 |
| Prepaid expenses | | | | 1,510 |
| Other receivables | | | | 14,260 |
Total assets | | | | 361,605,989 |
| Liabilities | | | | |
| Payable for investments purchased | | 70,893 | | |
| Payable for fund shares redeemed | | 192,373 | | |
| Accrued management fee | | 159,759 | | |
| Other affiliated payables | | 68,551 | | |
| Other payables and accrued expenses | | 821,357 | | |
| Collateral on securities loaned | | 15,419,425 | | |
| Total Liabilities | | | | 16,732,358 |
| Net Assets | | | $ | 344,873,631 |
| Net Assets consist of: | | | | |
| Paid in capital | | | $ | 261,935,236 |
| Total accumulated earnings (loss) | | | | 82,938,395 |
| Net Assets | | | $ | 344,873,631 |
Net Asset Value , offering price and redemption price per share ($344,873,631 ÷ 31,141,751 shares) | | | $ | 11.07 |
| | | | | |
| Statement of Operations |
| | | | Six months ended August 31, 2022 (Unaudited) |
| Investment Income | | | | |
| Dividends | | | $ | 2,862,008 |
| Income from Fidelity Central Funds (including $104,576 from security lending) | | | | 113,107 |
| Total Income | | | | 2,975,115 |
| Expenses | | | | |
| Management fee | $ | 971,831 | | |
| Transfer agent fees | | 353,241 | | |
| Accounting fees | | 68,705 | | |
| Custodian fees and expenses | | (17,049) | | |
| Independent trustees' fees and expenses | | 604 | | |
| Registration fees | | 26,665 | | |
| Audit | | 17,528 | | |
| Legal | | 1,088 | | |
| Interest | | 164 | | |
| Miscellaneous | | 983 | | |
| Total expenses before reductions | | 1,423,760 | | |
| Expense reductions | | (6,169) | | |
| Total expenses after reductions | | | | 1,417,591 |
| Net Investment income (loss) | | | | 1,557,524 |
| Realized and Unrealized Gain (Loss) | | | | |
| Net realized gain (loss) on: | | | | |
| Investment Securities: | | | | |
| Unaffiliated issuers(net of foreign taxes of $45,879) | | 12,086,694 | | |
| Foreign currency transactions | | (1,473) | | |
| Total net realized gain (loss) | | | | 12,085,221 |
| Change in net unrealized appreciation (depreciation) on: | | | | |
| Investment Securities: | | | | |
| Unaffiliated issuers(net of increase in deferred foreign taxes of $56,025) | | (57,155,568) | | |
| Assets and liabilities in foreign currencies | | (4,724) | | |
| Total change in net unrealized appreciation (depreciation) | | | | (57,160,292) |
| Net gain (loss) | | | | (45,075,071) |
| Net increase (decrease) in net assets resulting from operations | | | $ | (43,517,547) |
| Statement of Changes in Net Assets |
| |
| | Six months ended August 31, 2022 (Unaudited) | | Year ended February 28, 2022 |
| Increase (Decrease) in Net Assets | | | | |
| Operations | | | | |
| Net investment income (loss) | $ | 1,557,524 | $ | 3,198,096 |
| Net realized gain (loss) | | 12,085,221 | | 34,525,197 |
| Change in net unrealized appreciation (depreciation) | | (57,160,292) | | (15,899,186) |
| Net increase (decrease) in net assets resulting from operations | | (43,517,547) | | 21,824,107 |
| Distributions to shareholders | | (14,643,251) | | (34,390,230) |
| Share transactions | | | | |
| Proceeds from sales of shares | | 23,104,852 | | 52,081,537 |
| Reinvestment of distributions | | 13,724,052 | | 32,470,195 |
| Cost of shares redeemed | | (37,360,651) | | (108,715,196) |
Net increase (decrease) in net assets resulting from share transactions | | (531,747) | | (24,163,464) |
| Total increase (decrease) in net assets | | (58,692,545) | | (36,729,587) |
| | | | | |
| Net Assets | | | | |
| Beginning of period | | 403,566,176 | | 440,295,763 |
| End of period | $ | 344,873,631 | $ | 403,566,176 |
| | | | | |
| Other Information | | | | |
| Shares | | | | |
| Sold | | 1,954,975 | | 3,719,197 |
| Issued in reinvestment of distributions | | 1,090,939 | | 2,345,099 |
| Redeemed | | (3,160,465) | | (7,824,819) |
| Net increase (decrease) | | (114,551) | | (1,760,523) |
| | | | | |
| | Six months ended (Unaudited) August 31, 2022 | | Years ended February 28, 2022 | | 2021 | | 2020 A | | 2019 | | 2018 |
Selected Per-Share Data | | | | | | | | | | | | |
| Net asset value, beginning of period | $ | 12.91 | $ | 13.34 | $ | 10.69 | $ | 8.93 | $ | 10.29 | $ | 9.11 |
| Income from Investment Operations | | | | | | | | | | | | |
Net investment income (loss) B,C | | .05 | | .10 | | .10 | | .14 | | .20 D | | .16 |
| Net realized and unrealized gain (loss) | | (1.42) | | .54 | | 3.50 | | 1.93 | | (.24) E | | 1.39 |
| Total from investment operations | | (1.37) | | .64 | | 3.60 | | 2.07 | | (.04) | | 1.55 |
| Distributions from net investment income | | - F | | (.09) | | (.10) | | (.12) | | (.19) | | (.14) |
| Distributions from net realized gain | | (.46) | | (.98) | | (.86) | | (.19) | | (1.13) | | (.24) |
| Total distributions | | (.47) G | | (1.07) | | (.95) G | | (.31) | | (1.32) | | (.37) G |
Redemption fees added to paid in capital B | | - | | - | | - | | - | | - | | - F |
| Net asset value, end of period | $ | 11.07 | $ | 12.91 | $ | 13.34 | $ | 10.69 | $ | 8.93 | $ | 10.29 |
Total Return H,I | | (11.08)% | | 4.40% | | 36.09% | | 23.01% | | .21% E | | 17.21% |
Ratios to Average Net Assets C,J,K | | | | | | | | | | | | |
| Expenses before reductions | | .77% L | | .77% | | .79% | | .81% | | .83% | | .83% |
| Expenses net of fee waivers, if any | | .77% L | | .77% | | .79% | | .81% | | .83% | | .83% |
| Expenses net of all reductions | | .77% L | | .77% | | .78% | | .81% | | .82% | | .82% |
| Net investment income (loss) | | .84% L | | .69% | | .80% | | 1.39% | | 2.07% D | | 1.61% |
| Supplemental Data | | | | | | | | | | | | |
| Net assets, end of period (000 omitted) | $ | 344,874 | $ | 403,566 | $ | 440,296 | $ | 355,309 | $ | 237,907 | $ | 275,742 |
Portfolio turnover rate M | | 16% L | | 30% | | 55% | | 78% | | 54% | | 85% |
A For the year ended February 29.
B Calculated based on average shares outstanding during the period.
C Net investment income (loss) is affected by the timing of the declaration of dividends by any underlying mutual funds or exchange-traded funds (ETFs). Net investment income (loss) of any such underlying funds is not included in the Fund's net investment income (loss) ratio.
D Net investment income per share reflects one or more large, non-recurring dividend(s) which amounted to $.03 per share. Excluding such non-recurring dividend(s), the ratio of net investment income (loss) to average net assets would have been 1.74%.
E Net realized and unrealized gain (loss) per share reflects proceeds received from litigation which amounted to $.01 per share. Excluding these litigation proceeds, the total return would have been .12%.
F Amount represents less than $.005 per share.
G Total distributions per share do not sum due to rounding.
H Total returns for periods of less than one year are not annualized.
I Total returns would have been lower if certain expenses had not been reduced during the applicable periods shown.
J Fees and expenses of any underlying mutual funds or exchange-traded funds (ETFs) are not included in the Fund's expense ratio. The Fund indirectly bears its proportionate share of these expenses. For additional expense information related to investments in Fidelity Central Funds, please refer to the "Investments in Fidelity Central Funds" note found in the Notes to Financial Statements section of the most recent Annual or Semi-Annual report.
K Expense ratios reflect operating expenses of the class. Expenses before reductions do not reflect amounts reimbursed, waived, or reduced through arrangements with the investment adviser, brokerage services, or other offset arrangements, if applicable, and do not represent the amount paid by the class during periods when reimbursements, waivers or reductions occur.
L Annualized
M Amount does not include the portfolio activity of any underlying mutual funds or exchange-traded funds (ETFs).
For the period ended August 31, 2022
1. Organization.
Wireless Portfolio (the Fund) is a non-diversified fund of Fidelity Select Portfolios (the Trust) and is authorized to issue an unlimited number of shares. Share transactions on the Statement of Changes in Net Assets may contain exchanges between affiliated funds. The Trust is registered under the Investment Company Act of 1940, as amended (the 1940 Act), as an open-end management investment company organized as a Massachusetts business trust. The Fund invests primarily in securities of companies whose principal business activities fall within specific industries.
2. Investments in Fidelity Central Funds.
Funds may invest in Fidelity Central Funds, which are open-end investment companies generally available only to other investment companies and accounts managed by the investment adviser and its affiliates. The Schedule of Investments lists any Fidelity Central Funds held as an investment as of period end, but does not include the underlying holdings of each Fidelity Central Fund. An investing fund indirectly bears its proportionate share of the expenses of the underlying Fidelity Central Funds.
Based on its investment objective, each Fidelity Central Fund may invest or participate in various investment vehicles or strategies that are similar to those of the investing fund. These strategies are consistent with the investment objectives of the investing fund and may involve certain economic risks which may cause a decline in value of each of the Fidelity Central Funds and thus a decline in the value of the investing fund.
| Fidelity Central Fund | Investment Manager | Investment Objective | Investment Practices | Expense Ratio A |
| Fidelity Money Market Central Funds | Fidelity Management & Research Company LLC (FMR) | Each fund seeks to obtain a high level of current income consistent with the preservation of capital and liquidity. | Short-term Investments | Less than .005% |
A Expenses expressed as a percentage of average net assets and are as of each underlying Central Fund's most recent annual or semi-annual shareholder report.
A complete unaudited list of holdings for each Fidelity Central Fund is available upon request or at the Securities and Exchange Commission website at www.sec.gov. In addition, the financial statements of the Fidelity Central Funds which contain the significant accounting policies (including investment valuation policies) of those funds, and are not covered by the Report of Independent Registered Public Accounting Firm, are available on the Securities and Exchange Commission website or upon request.
3. Significant Accounting Policies.
The Fund is an investment company and applies the accounting and reporting guidance of the Financial Accounting Standards Board (FASB) Accounting Standards Codification Topic 946 Financial Services - Investment Companies . The financial statements have been prepared in conformity with accounting principles generally accepted in the United States of America (GAAP), which require management to make certain estimates and assumptions at the date of the financial statements. Actual results could differ from those estimates. Subsequent events, if any, through the date that the financial statements were issued have been evaluated in the preparation of the financial statements. The Fund's Schedule of Investments lists any underlying mutual funds or exchange-traded funds (ETFs) but does not include the underlying holdings of these funds. The following summarizes the significant accounting policies of the Fund:
Investment Valuation. Investments are valued as of 4:00 p.m. Eastern time on the last calendar day of the period. The Board of Trustees (the Board) has delegated the day to day responsibility for the valuation of the Fund's investments to the Fair Value Committee (the Committee) established by the Fund's investment adviser. In accordance with valuation policies and procedures approved by the Board, the Fund attempts to obtain prices from one or more third party pricing vendors or brokers to value its investments. When current market prices, quotations or currency exchange rates are not readily available or reliable, investments will be fair valued in good faith by the Committee, in accordance with procedures adopted by the Board. Factors used in determining fair value vary by investment type and may include market or investment specific events. The frequency with which these procedures are used cannot be predicted and they may be utilized to a significant extent. The Committee oversees the Fund's valuation policies and procedures and reports to the Board on the Committee's activities and fair value determinations. The Board monitors the appropriateness of the procedures used in valuing the Fund's investments and ratifies the fair value determinations of the Committee.
The Fund categorizes the inputs to valuation techniques used to value its investments into a disclosure hierarchy consisting of three levels as shown below:
Level 1 - unadjusted quoted prices in active markets for identical investments
Level 2 - other significant observable inputs (including quoted prices for similar investments, interest rates, prepayment speeds, etc.)
Level 3 - unobservable inputs (including the Fund's own assumptions based on the best information available)
Valuation techniques used to value the Fund's investments by major category are as follows:
Equity securities, including restricted securities, for which market quotations are readily available, are valued at the last reported sale price or official closing price as reported by a third party pricing vendor on the primary market or exchange on which they are traded and are categorized as Level 1 in the hierarchy. In the event there were no sales during the day or closing prices are not available, securities are valued at the last quoted bid price or may be valued using the last available price and are generally categorized as Level 2 in the hierarchy. For foreign equity securities, when market or security specific events arise, comparisons to the valuation of American Depositary Receipts (ADRs), futures contracts, ETFs and certain indexes as well as quoted prices for similar securities may be used and would be categorized as Level 2 in the hierarchy. For equity securities, including restricted securities, where observable inputs are limited, assumptions about market activity and risk are used and these securities may be categorized as Level 3 in the hierarchy.
Investments in open-end mutual funds, including the Fidelity Central Funds, are valued at their closing net asset value (NAV) each business day and are categorized as Level 1 in the hierarchy.
Changes in valuation techniques may result in transfers in or out of an assigned level within the disclosure hierarchy. The aggregate value of investments by input level as of August 31, 2022 is included at the end of the Fund's Schedule of Investments.
Foreign Currency. Certain Funds may use foreign currency contracts to facilitate transactions in foreign-denominated securities. Gains and losses from these transactions may arise from changes in the value of the foreign currency or if the counterparties do not perform under the contracts' terms.
Foreign-denominated assets, including investment securities, and liabilities are translated into U.S. dollars at the exchange rates at period end. Purchases and sales of investment securities, income and dividends received, and expenses denominated in foreign currencies are translated into U.S. dollars at the exchange rate in effect on the transaction date.
The effects of exchange rate fluctuations on investments are included with the net realized and unrealized gain (loss) on investment securities. Other foreign currency transactions resulting in realized and unrealized gain (loss) are disclosed separately.
Investment Transactions and Income. For financial reporting purposes, the Fund's investment holdings and NAV include trades executed through the end of the last business day of the period. The NAV per share for processing shareholder transactions is calculated as of the close of business of the New York Stock Exchange (NYSE), normally 4:00 p.m. Eastern time and includes trades executed through the end of the prior business day. Gains and losses on securities sold are determined on the basis of identified cost and include proceeds received from litigation. Commissions paid to certain brokers with whom the investment adviser, or its affiliates, places trades on behalf of a fund include an amount in addition to trade execution, which may be rebated back to a fund. Any such rebates are included in net realized gain (loss) on investments in the Statement of Operations. Dividend income is recorded on the ex-dividend date, except for certain dividends from foreign securities where the ex-dividend date may have passed, which are recorded as soon as the Fund is informed of the ex-dividend date. Non-cash dividends included in dividend income, if any, are recorded at the fair market value of the securities received. Income and capital gain distributions from Fidelity Central Funds, if any, are recorded on the ex-dividend date. Certain distributions received by the Fund represent a return of capital or capital gain. The Fund determines the components of these distributions subsequent to the ex-dividend date, based upon receipt of tax filings or other correspondence relating to the underlying investment. These distributions are recorded as a reduction of cost of investments and/or as a realized gain. Investment income is recorded net of foreign taxes withheld where recovery of such taxes is uncertain. Funds may file withholding tax reclaims in certain jurisdictions to recover a portion of amounts previously withheld. Any withholding tax reclaims income is included in the Statement of Operations in dividends. Any receivables for withholding tax reclaims are included in the Statement of Assets and Liabilities in dividends receivable.
Expenses. Expenses directly attributable to a fund are charged to that fund. Expenses attributable to more than one fund are allocated among the respective funds on the basis of relative net assets or other appropriate methods. Expenses included in the accompanying financial statements reflect the expenses of that fund and do not include any expenses associated with any underlying mutual funds or exchange-traded funds. Although not included in a fund's expenses, a fund indirectly bears its proportionate share of these expenses through the net asset value of each underlying mutual fund or exchange-traded fund. Expense estimates are accrued in the period to which they relate and adjustments are made when actual amounts are known.
Income Tax Information and Distributions to Shareholders. Each year, the Fund intends to qualify as a regulated investment company under Subchapter M of the Internal Revenue Code, including distributing substantially all of its taxable income and realized gains. As a result, no provision for U.S. Federal income taxes is required. The Fund files a U.S. federal tax return, in addition to state and local tax returns as required. The Fund's federal income tax returns are subject to examination by the Internal Revenue Service (IRS) for a period of three fiscal years after they are filed. State and local tax returns may be subject to examination for an additional fiscal year depending on the jurisdiction. Foreign taxes are provided for based on the Fund's understanding of the tax rules and rates that exist in the foreign markets in which it invests. The Fund is subject to a tax imposed on capital gains by certain countries in which it invests. An estimated deferred tax liability for net unrealized appreciation on the applicable securities is included in Other payables and accrued expenses on the Statement of Assets & Liabilities.
Distributions are declared and recorded on the ex-dividend date. Income and capital gain distributions are determined in accordance with income tax regulations, which may differ from GAAP.
Capital accounts within the financial statements are adjusted for permanent book-tax differences. These adjustments have no impact on net assets or the results of operations. Capital accounts are not adjusted for temporary book-tax differences which will reverse in a subsequent period.
Book-tax differences are primarily due to foreign currency transactions, certain foreign taxes and losses deferred due to wash sales and excise tax regulations.
As of period end, the cost and unrealized appreciation (depreciation) in securities, and derivatives if applicable, for federal income tax purposes were as follows:
| Gross unrealized appreciation | $ 120,647,438 |
| Gross unrealized depreciation | (50,286,235) |
| Net unrealized appreciation (depreciation) | $ 70,361,203 |
| Tax cost | $ 290,419,522 |
Restricted Securities (including Private Placements). Funds may invest in securities that are subject to legal or contractual restrictions on resale. These securities generally may be resold in transactions exempt from registration or to the public if the securities are registered. Disposal of these securities may involve time-consuming negotiations and expense, and prompt sale at an acceptable price may be difficult. Information regarding restricted securities held at period end is included at the end of the Schedule of Investments, if applicable.
4. Purchases and Sales of Investments.
Purchases and sales of securities, other than short-term securities and in-kind transactions, as applicable, are noted in the table below.
| | Purchases ($) | Sales ($) |
| Wireless Portfolio | 29,455,573 | 41,939,760 |
5. Fees and Other Transactions with Affiliates.
Management Fee. Fidelity Management & Research Company LLC (the investment adviser) and its affiliates provide the Fund with investment management related services for which the Fund pays a monthly management fee. The management fee is the sum of an individual fund fee rate that is based on an annual rate of .30% of the Fund's average net assets and an annualized group fee rate that averaged .23% during the period. The group fee rate is based upon the monthly average net assets of a group of registered investment companies with which the investment adviser has management contracts. The group fee rate decreases as assets under management increase and increases as assets under management decrease. For the reporting period, the total annualized management fee rate was .53% of the Fund's average net assets.
Transfer Agent Fees. Fidelity Investments Institutional Operations Company LLC (FIIOC), an affiliate of the investment adviser, is the Fund's transfer, dividend disbursing and shareholder servicing agent. FIIOC receives account fees and asset-based fees that vary according to account size and type of account. FIIOC pays for typesetting, printing and mailing of shareholder reports, except proxy statements. For the period, the transfer agent fees were equivalent to an annualized rate of .19% of average net assets.
Accounting Fees. Fidelity Service Company, Inc. (FSC), an affiliate of the investment adviser, maintains the Fund's accounting records. The accounting fee is based on the level of average net assets for each month. For the period, the fees were equivalent to the following annualized rates:
| | % of Average Net Assets |
| Wireless Portfolio | .04 |
Brokerage Commissions. A portion of portfolio transactions were placed with brokerage firms which are affiliates of the investment adviser. Brokerage commissions are included in net realized gain (loss) and change in net unrealized appreciation (depreciation) in the Statement of Operations. The commissions paid to these affiliated firms were as follows:
| | Amount |
| Wireless Portfolio | $ 517 |
Interfund Lending Program. Pursuant to an Exemptive Order issued by the Securities and Exchange Commission (the SEC), the Fund, along with other registered investment companies having management contracts with Fidelity Management & Research Company LLC (FMR), or other affiliated entities of FMR, may participate in an interfund lending program. This program provides an alternative credit facility allowing the Fund to borrow from, or lend money to, other participating affiliated funds. At period end, there were no interfund loans outstanding. Activity in this program during the period for which loans were outstanding was as follows:
| | Borrower or Lender | Average Loan Balance | Weighted Average Interest Rate | Interest Expense |
| Wireless Portfolio | Borrower | $ 5,220,000 | .57% | $ 164 |
Interfund Trades. Funds may purchase from or sell securities to other Fidelity Funds under procedures adopted by the Board. The procedures have been designed to ensure these interfund trades are executed in accordance with Rule 17a-7 of the 1940 Act. Any interfund trades are included within the respective purchases and sales amounts shown in the Purchases and Sales of Investments note. Interfund trades during the period are noted in the table below.
| | Purchases ($) | Sales ($) | Realized Gain (Loss) ($) |
| Wireless Portfolio | 5,959,410 | 355,280 | (7,332) |
6. Committed Line of Credit.
Certain Funds participate with other funds managed by the investment adviser or an affiliate in a $4.25 billion credit facility (the "line of credit") to be utilized for temporary or emergency purposes to fund shareholder redemptions or for other short-term liquidity purposes. The participating funds have agreed to pay commitment fees on their pro-rata portion of the line of credit, which are reflected in Miscellaneous expenses on the Statement of Operations, and are listed below. During the period, there were no borrowings on this line of credit.
| | Amount |
| Wireless Portfolio | $ 346 |
7. Security Lending.
Funds lend portfolio securities from time to time in order to earn additional income. Lending agents are used, including National Financial Services (NFS), an affiliate of the investment adviser. Pursuant to a securities lending agreement, NFS will receive a fee, which is capped at 9.9% of a fund's daily lending revenue, for its services as lending agent. A fund may lend securities to certain qualified borrowers, including NFS. On the settlement date of the loan, a fund receives collateral (in the form of U.S. Treasury obligations, letters of credit and/or cash) against the loaned securities and maintains collateral in an amount not less than 100% of the market value of the loaned securities during the period of the loan. The market value of the loaned securities is determined at the close of business of a fund and any additional required collateral is delivered to a fund on the next business day. A fund or borrower may terminate the loan at any time, and if the borrower defaults on its obligation to return the securities loaned because of insolvency or other reasons, a fund may apply collateral received from the borrower against the obligation. A fund may experience delays and costs in recovering the securities loaned. Any cash collateral received is invested in the Fidelity Securities Lending Cash Central Fund. Any loaned securities are identified as such in the Schedule of Investments, and the value of loaned securities and cash collateral at period end, as applicable, are presented in the Statement of Assets and Liabilities. Security lending income represents the income earned on investing cash collateral, less rebates paid to borrowers and any lending agent fees associated with the loan, plus any premium payments received for lending certain types of securities. Security lending income is presented in the Statement of Operations as a component of income from Fidelity Central Funds. Affiliated security lending activity, if any, was as follows:
| | Total Security Lending Fees Paid to NFS | Security Lending Income From Securities Loaned to NFS | Value of Securities Loaned to NFS at Period End |
| Wireless Portfolio | $ 10,972 | $ - | $- |
8. Expense Reductions.
Through arrangements with the Fund's custodian, credits realized as a result of certain uninvested cash balances were used to reduce the Fund's expenses by $11.
In addition, during the period the investment adviser or an affiliate reimbursed and/or waived a portion of operating expenses in the amount of $6,158.
9. Other.
A fund's organizational documents provide former and current trustees and officers with a limited indemnification against liabilities arising in connection with the performance of their duties to the fund. In the normal course of business, a fund may also enter into contracts that provide general indemnifications. A fund's maximum exposure under these arrangements is unknown as this would be dependent on future claims that may be made against a fund. The risk of material loss from such claims is considered remote.
10. Risk and Uncertainties.
Many factors affect a fund's performance. Developments that disrupt global economies and financial markets, such as pandemics, epidemics, outbreaks of infectious diseases, war, terrorism, and environmental disasters, may significantly affect a fund's investment performance. The effects of these developments to a fund will be impacted by the types of securities in which a fund invests, the financial condition, industry, economic sector, and geographic location of an issuer, and a fund's level of investment in the securities of that issuer.
As a shareholder, you incur two types of costs: (1) transaction costs, which may include sales charges (loads) on purchase payments or redemption proceeds, as applicable and (2) ongoing costs, which generally include management fees, distribution and/or service (12b-1) fees and other Fund expenses. This Example is intended to help you understand your ongoing costs (in dollars) of investing in a fund and to compare these costs with the ongoing costs of investing in other mutual funds.
| The Example is based on an investment of $1,000 invested at the beginning of the period and held for the entire period (March 1, 2022 to August 31, 2022). |
Actual Expenses
The first line of the accompanying table provides information about actual account values and actual expenses. You may use the information in this line, together with the amount you invested, to estimate the expenses that you paid over the period. Simply divide your account value by $1,000.00 (for example, an $8,600 account value divided by $1,000.00 = 8.6), then multiply the result by the number in the first line for a class/Fund under the heading entitled "Expenses Paid During Period" to estimate the expenses you paid on your account during this period. If any fund is a shareholder of any underlying mutual funds or exchange-traded funds (ETFs) (the Underlying Funds), such fund indirectly bears its proportional share of the expenses of the Underlying Funds in addition to the direct expenses incurred presented in the table. These fees and expenses are not included in the annualized expense ratio used to calculate the expense estimate in the table below.
Hypothetical Example for Comparison Purposes
The second line of the accompanying table provides information about hypothetical account values and hypothetical expenses based on the actual expense ratio and an assumed rate of return of 5% per year before expenses, which is not the actual return. The hypothetical account values and expenses may not be used to estimate the actual ending account balance or expenses you paid for the period. You may use this information to compare the ongoing costs of investing in the Fund and other funds. To do so, compare this 5% hypothetical example with the 5% hypothetical examples that appear in the shareholder reports of the other funds. If any fund is a shareholder of any Underlying Funds, such fund indirectly bears its proportional share of the expenses of the Underlying Funds in addition to the direct expenses as presented in the table. These fees and expenses are not included in the annualized expense ratio used to calculate the expense estimate in the table below.
Please note that the expenses shown in the table are meant to highlight your ongoing costs only and do not reflect any transaction costs. Therefore, the second line of the table is useful in comparing ongoing costs only, and will not help you determine the relative total costs of owning different funds. In addition, if these transactional costs were included, your costs would have been higher.
| | | | | Annualized Expense Ratio- A | | Beginning Account Value March 1, 2022 | | Ending Account Value August 31, 2022 | | Expenses Paid During Period- C March 1, 2022 to August 31, 2022 |
| Telecommunications Portfolio | | | | | | | | | | |
| Class A | | | | 1.12% | | | | | | |
| Actual | | | | | | $ 1,000 | | $ 903.40 | | $ 5.37 |
Hypothetical- B | | | | | | $ 1,000 | | $ 1,019.56 | | $ 5.70 |
| Class M | | | | 1.38% | | | | | | |
| Actual | | | | | | $ 1,000 | | $ 902.10 | | $ 6.62 |
Hypothetical- B | | | | | | $ 1,000 | | $ 1,018.25 | | $ 7.02 |
| Class C | | | | 1.86% | | | | | | |
| Actual | | | | | | $ 1,000 | | $ 900.10 | | $ 8.91 |
Hypothetical- B | | | | | | $ 1,000 | | $ 1,015.83 | | $ 9.45 |
| Telecommunications Portfolio | | | | .81% | | | | | | |
| Actual | | | | | | $ 1,000 | | $ 904.70 | | $ 3.89 |
Hypothetical- B | | | | | | $ 1,000 | | $ 1,021.12 | | $ 4.13 |
| Class I | | | | .77% | | | | | | |
| Actual | | | | | | $ 1,000 | | $ 904.90 | | $ 3.70 |
Hypothetical- B | | | | | | $ 1,000 | | $ 1,021.32 | | $ 3.92 |
| Class Z | | | | .65% | | | | | | |
| Actual | | | | | | $ 1,000 | | $ 905.60 | | $ 3.12 |
Hypothetical- B | | | | | | $ 1,000 | | $ 1,021.93 | | $ 3.31 |
| | | | | | | | | | |
| Wireless Portfolio | | | | .77% | | | | | | |
| Actual | | | | | | $ 1,000 | | $ 889.20 | | $ 3.67 |
Hypothetical- B | | | | | | $ 1,000 | | $ 1,021.32 | | $ 3.92 |
| |
A Annualized expense ratio reflects expenses net of applicable fee waivers.
B 5% return per year before expenses
C Expenses are equal to the annualized expense ratio, multiplied by the average account value over the period, multiplied by 184/ 365 (to reflect the one-half year period). The fees and expenses of any Underlying Funds are not included in each annualized expense ratio.
Telecommunications Portfolio
Wireless Portfolio
Each year, the Board of Trustees, including the Independent Trustees (together, the Board), votes on the renewal of the management contract with Fidelity Management & Research Company LLC (FMR) and the sub-advisory agreements (together, the Advisory Contracts) for each fund. FMR and the sub-advisers are referred to herein as the Investment Advisers. The Board, assisted by the advice of fund counsel and Independent Trustees' counsel, requests and considers a broad range of information relevant to the renewal of the Advisory Contracts throughout the year.
The Board meets regularly and, at each of its meetings, covers an extensive agenda of topics and materials and considers factors that are relevant to its annual consideration of the renewal of each fund's Advisory Contracts, including the services and support provided to each fund and its shareholders. The Board has established various standing committees (Committees), each composed of and chaired by Independent Trustees with varying backgrounds, to which the Board has assigned specific subject matter responsibilities in order to enhance effective decision-making by the Board. The Board, acting directly and through its Committees, requests and receives information concerning the annual consideration of the renewal of each fund's Advisory Contracts. The Board also meets as needed to review matters specifically related to the Board's annual consideration of the renewal of the Advisory Contracts. Members of the Board may also meet with trustees of other Fidelity funds through joint ad hoc committees to discuss certain matters relevant to all of the Fidelity funds.
At its May 2022 meeting, the Board unanimously determined to renew each fund's Advisory Contracts. In reaching its determination, the Board considered all factors it believed relevant, including (i) the nature, extent, and quality of the services provided to each fund and its shareholders (including the investment performance of each fund); (ii) the competitiveness relative to peer funds of the management fee and total expense ratio of the fund or a representative class (retail class), as applicable; (iii) the total costs of the services provided by and the profits realized by Fidelity from its relationships with each fund; and (iv) the extent to which, if any, economies of scale exist and are realized as each fund grows, and whether any economies of scale are appropriately shared with fund shareholders.
In considering whether to renew the Advisory Contracts for each fund, the Board reached a determination, with the assistance of fund counsel and Independent Trustees' counsel and through the exercise of its business judgment, that the renewal of the Advisory Contracts was in the best interests of each fund and its shareholders and that the compensation payable under the Advisory Contracts was fair and reasonable. The Board's decision to renew the Advisory Contracts was not based on any single factor, but rather was based on a comprehensive consideration of all the information provided to the Board at its meetings throughout the year. The Board, in reaching its determination to renew the Advisory Contracts, was aware that shareholders of each fund have a broad range of investment choices available to them, including a wide choice among funds offered by Fidelity's competitors, and that each fund's shareholders, who have the opportunity to review and weigh the disclosure provided by the fund in its prospectus and other public disclosures, have chosen to invest in that fund, which is part of the Fidelity family of funds.
Nature, Extent, and Quality of Services Provided. The Board considered Fidelity's staffing as it relates to the funds, including the backgrounds of investment personnel of Fidelity, and also considered the funds' investment objectives, strategies, and related investment philosophies. The Independent Trustees also had discussions with senior management of Fidelity's investment operations and investment groups. The Board considered the structure of the investment personnel compensation program and whether this structure provides appropriate incentives to act in the best interests of each fund. Additionally, the Board considered the portfolio managers' investments, if any, in the funds that they manage. The Board also considered the steps Fidelity had taken to ensure the continued provision of high quality services to the Fidelity funds during the COVID-19 pandemic, including the expansion of staff in client facing positions to maintain service levels in periods of high volumes and volatility.
Resources Dedicated to Investment Management and Support Services . The Board and the Fund Oversight and Research Committees reviewed the general qualifications and capabilities of Fidelity's investment staff, including its size, education, experience, and resources, as well as Fidelity's approach to recruiting, training, managing, and compensating investment personnel. The Board noted the resources devoted to expansion of Fidelity's global investment organization, and that Fidelity's analysts have extensive resources, tools, and capabilities that allow them to conduct sophisticated quantitative and fundamental analysis, as well as credit analysis of issuers, counterparties, and guarantors. Further, the Board considered that Fidelity's investment professionals have sufficient access to global information and data so as to provide competitive investment results over time, and that those professionals also have access to sophisticated tools that permit them to assess portfolio construction and risk and performance attribution characteristics continuously, as well as to transmit new information and research conclusions rapidly around the world. Additionally, in its deliberations, the Board considered Fidelity's trading, risk management, compliance, and technology and operations capabilities and resources, which are integral parts of the investment management process.
Shareholder and Administrative Services. The Board considered (i) the nature, extent, quality, and cost of advisory, administrative, and shareholder services performed by the Investment Advisers and their affiliates under the Advisory Contracts and under separate agreements covering transfer agency, pricing and bookkeeping, and securities lending services for each fund; (ii) the nature and extent of the supervision of third party service providers, principally custodians, subcustodians, and pricing vendors; and (iii) the resources devoted to, and the record of compliance with, each fund's compliance policies and procedures. The Board also reviewed the allocation of fund brokerage, including allocations to brokers affiliated with the Investment Advisers, the use of brokerage commissions to pay fund expenses, and the use of "soft" commission dollars to pay for research services.
The Board noted that the growth of fund assets over time across the complex allows Fidelity to reinvest in the development of services designed to enhance the value and convenience of the Fidelity funds as investment vehicles. These services include 24-hour access to account information and market information over the Internet and through telephone representatives, investor education materials, and asset allocation tools. The Board also considered that it reviews customer service metrics such as telephone response times, continuity of services on the website and metrics addressing services at Fidelity Investor Centers.
Investment in a Large Fund Family . The Board considered the benefits to shareholders of investing in a Fidelity fund, including the benefits of investing in a fund that is part of a large family of funds offering a variety of investment disciplines and providing a large variety of mutual fund investor services. The Board noted that Fidelity had taken, or had made recommendations that resulted in the Fidelity funds taking, a number of actions over the previous year that benefited particular funds, including: (i) continuing to dedicate additional resources to Fidelity's investment research process, which includes meetings with management of issuers of securities in which the funds invest; (ii) continuing efforts to enhance Fidelity's global research capabilities; (iii) launching new funds and ETFs with innovative structures, strategies and pricing and making other enhancements to meet client needs; (iv) launching new share classes of existing funds; (v) eliminating purchase minimums and broadening eligibility requirements for certain funds and share classes; (vi) reducing management fees and total expenses for certain target date funds and classes and index funds; (vii) lowering expenses for certain existing funds and classes by implementing or lowering expense caps; (viii) rationalizing product lines and gaining increased efficiencies from fund mergers and liquidations; (ix) continuing to develop, acquire and implement systems and technology to improve services to the funds and shareholders, strengthen information security, and increase efficiency; and (x) continuing to implement enhancements to further strengthen Fidelity's product line to increase investors' probability of success in achieving their investment goals, including retirement income goals.
Investment Performance . The Board considered whether each fund has operated in accordance with its investment objective, as well as its record of compliance with its investment restrictions and its performance history. The Board noted that Telecommunications Portfolio had a portfolio manager change in April 2021. The Board will continue to monitor closely the fund's performance, taking into account the portfolio manager change.
The Board took into account discussions that occur at Board meetings throughout the year with representatives of the Investment Advisers about fund investment performance. In this regard the Board noted that as part of regularly scheduled fund reviews and other reports to the Board on fund performance, the Board considers annualized return information for each fund for different time periods, measured against an appropriate securities market index (benchmark index). The Board also reviews and considers information about performance attribution. In its evaluation of fund investment performance, the Board gave particular attention to information indicating changes in performance of certain Fidelity funds for specific time periods and discussed with the Investment Advisers the reasons for any overperformance or underperformance.
In addition to reviewing absolute and relative fund performance, the Independent Trustees periodically consider the appropriateness of fund performance metrics in evaluating the results achieved. In general, the Independent Trustees believe that fund performance should be evaluated based on net performance (after fees and expenses) of the fund or the representative class, as applicable, compared to appropriate benchmark indices, over appropriate time periods that may include full market cycles, taking into account relevant factors including the following: general market conditions; issuer-specific information; and fund cash flows and other factors.
The Independent Trustees recognize that shareholders evaluate performance on a net basis over their own holding periods, for which one-, three-, and five-year periods are often used as a proxy. For this reason, the performance information reviewed by the Board also included net cumulative total return information for each fund and an appropriate benchmark index for the most recent one-, three-, and five-year periods ended September 30, 2021, as shown below.
Telecommunications Portfolio
Wireless Portfolio
Based on its review, the Board concluded that the nature, extent, and quality of services provided to each fund under the Advisory Contracts should continue to benefit the shareholders of each fund.
Competitiveness of Management Fee and Total Expense Ratio. The Board considered each fund's management fee and total expense ratio compared to "mapped groups" of competitive funds and classes created for the purpose of facilitating the Trustees' competitive analysis of management fees and total expenses. Fidelity creates "mapped groups" by combining similar Lipper investment objective categories that have comparable investment mandates. For this purpose, all sector focused equity funds are grouped in the same mapped group. Combining Lipper investment objective categories aids the Board's management fee and total expense ratio comparisons by broadening the competitive group used for comparison.
Management Fee . The Board considered two proprietary management fee comparisons for the 12-month periods ended September 30 (June 30 for periods ended 2019 and 2018 and December 31 for periods prior to 2018) shown in basis points (BP) in the charts below. The group of Lipper funds used by the Board for management fee comparisons is referred to below as the "Total Mapped Group." The Total Mapped Group comparison focuses on a fund's standing in terms of gross management fees before expense reimbursements or caps relative to the total universe of funds with comparable investment mandates (i.e., sector equities), regardless of whether their management fee structures also are comparable. Funds with comparable management fee structures have similar management fee contractual arrangements (e.g., flat rate charged for advisory services, all-inclusive fee rate, etc.). "TMG %" represents the percentage of funds in the Total Mapped Group that had management fees that were lower than a fund's. For example, a hypothetical TMG % of 20% would mean that 80% of the funds in the Total Mapped Group had higher, and 20% had lower, management fees than a fund. The funds' actual TMG %s and the number of funds in the Total Mapped Group are in the charts below. The "Asset-Sized Peer Group" (ASPG) comparison focuses on a fund's standing relative to a subset of non-Fidelity funds within the Total Mapped Group that are similar in size and management fee structure. For example, if a fund is in the first quartile of the ASPG, the fund's management fee ranks in the least expensive or lowest 25% of funds in the ASPG. The ASPG represents at least 15% of the funds in the Total Mapped Group with comparable asset size and management fee structures, subject to a minimum of 50 funds (or all funds in the Total Mapped Group if fewer than 50). Additional information, such as the ASPG quartile in which a fund's management fee rate ranked, is also included in the charts and was considered by the Board.
Telecommunications Portfolio
Wireless Portfolio
The Board noted that each fund's management fee rate ranked below the median of its Total Mapped Group and below the median of its ASPG for the 12-month period ended September 30, 2021.
The Board also considered that, for funds subject to the group fee, FMR agreed to voluntarily waive fees over a specified period of time in amounts designed to account for assets converted from certain funds to certain collective investment trusts.
Based on its review, the Board concluded that each fund's management fee is fair and reasonable in light of the services that the fund receives and the other factors considered.
Total Expense Ratio . In its review of the total expense ratio of the representative class (retail class) of Telecommunications Portfolio, the Board considered the fund's management fee rate as well as other fund or class expenses, as applicable, such as transfer agent fees, pricing and bookkeeping fees, fund-paid 12b-1 fees, and custodial, legal, and audit fees. The Board also noted that Fidelity may agree to waive fees or reimburse expenses from time to time, and the extent to which, if any, it has done so for the fund. The fund's representative class is compared to those funds and classes in the Total Mapped Group (used by the Board for management fee comparisons) that have a similar sales load structure. The Board also considered a total expense ASPG comparison, which focuses on the total expenses of the representative class relative to a subset of non-Fidelity funds within the total expense similar sales load structure group. The total expense ASPG is limited to 15 larger and 15 smaller classes in fund average assets for a total of 30 classes, where possible. The total expense ASPG comparison excludes performance adjustments and fund-paid 12b-1 fees to eliminate variability in fee structures.
The Board noted that the total net expense ratio of the retail class of Telecommunications Portfolio ranked below the similar sales load structure group competitive median and below the ASPG competitive median for the 12-month period ended September 30, 2021.
In its review of Wireless Portfolio's total expense ratio, the Board considered the fund's management fee rate as well as other fund expenses, such as transfer agent fees, pricing and bookkeeping fees, and custodial, legal, and audit fees. The Board also noted that Fidelity may agree to waive fees or reimburse expenses from time to time, and the extent to which, if any, it has done so for the fund. The fund is compared to those funds and classes in the Total Mapped Group (used by the Board for management fee comparisons) that have a similar sales load structure. The Board also considered a total expense ASPG comparison for the fund, which focuses on the total expenses of the fund relative to a subset of non-Fidelity funds within the total expense similar sales load structure group. The total expense ASPG is limited to 15 larger and 15 smaller classes in fund average assets for a total of 30 classes, where possible. The total expense ASPG comparison excludes performance adjustments and fund-paid 12b-1 fees to eliminate variability in fee structures.
For Wireless Portfolio, the Board noted that the total net expense ratio ranked below the similar sales load structure group competitive median and below the ASPG competitive median for the 12-month period ended September 30, 2021.
Fees Charged to Other Fidelity Clients . The Board also considered Fidelity fee structures and other information with respect to clients of Fidelity, such as other funds advised or subadvised by Fidelity, pension plan clients, and other institutional clients with similar mandates. The Board noted that a joint ad hoc committee created by it and the boards of other Fidelity funds periodically reviews and compares Fidelity's institutional investment advisory business with its business of providing services to the Fidelity funds and also noted the most recent findings of the committee. The Board noted that the committee's review included a consideration of the differences in services provided, fees charged, and costs incurred, as well as competition in the markets serving the different categories of clients.
Based on its review of total expense ratios and fees charged to other Fidelity clients, the Board concluded that the total expense ratio of each class of each fund was reasonable in light of the services that the fund and its shareholders receive and the other factors considered.
Costs of the Services and Profitability. The Board considered the revenues earned and the expenses incurred by Fidelity in conducting the business of developing, marketing, distributing, managing, administering and servicing each fund and servicing each fund's shareholders. The Board also considered the level of Fidelity's profits in respect of all the Fidelity funds.
On an annual basis, Fidelity presents to the Board information about the profitability of its relationships with each fund. Fidelity calculates profitability information for each fund, as well as aggregate profitability information for groups of Fidelity funds and all Fidelity funds, using a series of detailed revenue and cost allocation methodologies which originate with the books and records of Fidelity on which Fidelity's audited financial statements are based. The Audit Committee of the Board reviews any significant changes from the prior year's methodologies and the full Board approves such changes.
A public accounting firm has been engaged annually by the Board as part of the Board's assessment of Fidelity's profitability analysis. The engagement includes the review and assessment of the methodologies used by Fidelity in determining the revenues and expenses attributable to Fidelity's mutual fund business, and completion of agreed-upon procedures in respect of the mathematical accuracy of certain fund profitability information and its conformity to established allocation methodologies. After considering the reports issued under the engagement and information provided by Fidelity, the Board concluded that while other allocation methods may also be reasonable, Fidelity's profitability methodologies are reasonable in all material respects.
The Board also reviewed Fidelity's non-fund businesses and potential indirect benefits such businesses may have received as a result of their association with Fidelity's mutual fund business (i.e., fall-out benefits) as well as cases where Fidelity's affiliates may benefit from the funds' business. The Board considered areas where potential indirect benefits to the Fidelity funds from their relationships with Fidelity may exist. The Board's consideration of these matters was informed by the findings of a joint ad hoc committee created by it and the boards of other Fidelity funds to evaluate potential fall-out benefits.
The Board considered the costs of the services provided by and the profits realized by Fidelity in connection with the operation of each fund and was satisfied that the profitability was not excessive.
Economies of Scale. The Board considered whether there have been economies of scale in respect of the management of the Fidelity funds, whether the Fidelity funds (including each fund) have appropriately benefited from any such economies of scale, and whether there is potential for realization of any further economies of scale. The Board considered the extent to which each fund will benefit from economies of scale as assets grow through increased services to the fund, through waivers or reimbursements, or through fee or expense ratio reductions. The Board also noted that a committee (the Economies of Scale Committee) created by it and the boards of other Fidelity funds periodically analyzes whether Fidelity attains economies of scale in respect of the management and servicing of the Fidelity funds, whether the Fidelity funds have appropriately benefited from such economies of scale, and whether there is potential for realization of any further economies of scale.
The Board recognized that each fund's management contract incorporates a "group fee" structure, which provides for lower group fee rates as total "group assets" increase, and for higher group fee rates as total "group assets" decrease ("group assets" as defined in the management contracts). FMR calculates the group fee rates based on a tiered asset "breakpoint" schedule that varies based on asset class. The Board considered that the group fee is designed to deliver the benefits of economies of scale to fund shareholders when total Fidelity fund assets increase, even if assets of any particular fund are unchanged or have declined, because some portion of Fidelity's costs are attributable to services provided to all Fidelity funds, and all funds benefit if those costs can be allocated among more assets. The Board further considered that Fidelity agreed to impose a temporary fee waiver in the form of additional breakpoints to the current breakpoint schedule. The Board concluded that, given the group fee structure, fund shareholders will benefit from lower management fees as "group assets" increase at the fund complex level, regardless of whether Fidelity achieves any such economies of scale.
The Board concluded, taking into account the analysis of the Economies of Scale Committee, that economies of scale, if any, are being appropriately shared between fund shareholders and Fidelity.
Additional Information Requested by the Board. In order to develop fully the factual basis for consideration of the Fidelity funds' advisory contracts, the Board requested and received additional information on certain topics, including: (i) fund flow and performance trends, in particular the underperformance of certain funds and strategies, and Fidelity's long-term strategies for certain funds, including any consideration of fund liquidations or mergers; (ii) the operation of performance fees, competitor use of performance fees, and consideration of the expansion of performance fees to additional funds; (iii) Fidelity's pricing philosophy compared to competitors; (iv) fund profitability methodology and data; (v) evaluation of competitive fund data and peer group classifications and fee and expense comparisons; (vi) the management fee and expense structures for different funds and classes and information about the differences between various fee and expense structures; (vii) group fee breakpoints and related voluntary fee waivers; and (viii) information regarding other accounts managed by Fidelity and the funds' sub-advisory arrangements.
Based on its evaluation of all of the conclusions noted above, and after considering all factors it believed relevant, the Board concluded that the advisory fee arrangements are fair and reasonable and that each fund's Advisory Contracts should be renewed.
1.846053.115
SELTS-SANN-1022
Fidelity® Select Portfolios®
Materials Sector
Chemicals Portfolio
Gold Portfolio
Materials Portfolio
Semi-Annual Report
August 31, 2022
Includes Fidelity and Fidelity Advisor share classes
Contents
To view a fund's proxy voting guidelines and proxy voting record for the 12-month period ended June 30, visit http://www.fidelity.com/proxyvotingresults or visit the Securities and Exchange Commission's (SEC) web site at http://www.sec.gov.
You may also call 1-800-544-8544 if you're an individual investing directly with Fidelity, call 1-800-835-5092 if you're a plan sponsor or participant with Fidelity as your recordkeeper or call 1-877-208-0098 on institutional accounts or if you're an advisor or invest through one to request a free copy of the proxy voting guidelines.
Standard & Poor's, S&P and S&P 500 are registered service marks of The McGraw-Hill Companies, Inc. and have been licensed for use by Fidelity Distributors Corporation.
Other third-party marks appearing herein are the property of their respective owners.
All other marks appearing herein are registered or unregistered trademarks or service marks of FMR LLC or an affiliated company. © 2022 FMR LLC. All rights reserved.
This report and the financial statements contained herein are submitted for the general information of the shareholders of the Fund. This report is not authorized for distribution to prospective investors in the Fund unless preceded or accompanied by an effective prospectus.
A fund files its complete schedule of portfolio holdings with the SEC for the first and third quarters of each fiscal year on Form N-PORT. Forms N-PORT are available on the SEC's web site at http://www.sec.gov. A fund's Forms N-PORT may be reviewed and copied at the SEC's Public Reference Room in Washington, DC. Information regarding the operation of the SEC's Public Reference Room may be obtained by calling 1-800-SEC-0330.
For a complete list of a fund's portfolio holdings, view the most recent holdings listing, semiannual report, or annual report on Fidelity's web site at http://www.fidelity.com, http://www.institutional.fidelity.com, or http://www.401k.com, as applicable.
NOT FDIC INSURED •MAY LOSE VALUE •NO BANK GUARANTEE
Neither the Fund nor Fidelity Distributors Corporation is a bank.
Top Holdings (% of Fund's net assets) |
| |
| Linde PLC | 23.7 | |
| Sherwin-Williams Co. | 10.4 | |
| Corteva, Inc. | 7.7 | |
| Ecolab, Inc. | 7.3 | |
| PPG Industries, Inc. | 5.0 | |
| Air Products & Chemicals, Inc. | 4.9 | |
| CF Industries Holdings, Inc. | 4.5 | |
| DuPont de Nemours, Inc. | 3.5 | |
| Albemarle Corp. | 3.3 | |
| Celanese Corp. Class A | 3.0 | |
| | 73.3 | |
| |
| Industries (% of Fund's net assets) |
| |
| Chemicals | 99.5 | |
| |
Geographic Diversification (% of Fund's net assets) |
|
* Includes Short-Term investments and Net Other Assets (Liabilities). Percentages are based on country or territory of incorporation and are adjusted for the effect of futures contracts, if applicable. |
| |
Chemicals Portfolio
Showing Percentage of Net Assets
| Common Stocks - 99.5% |
| | | Shares | Value ($) |
| Chemicals - 99.5% | | | |
| Commodity Chemicals - 7.7% | | | |
| Cabot Corp. | | 101,500 | 7,304,955 |
| Dow, Inc. | | 19,100 | 974,100 |
| Olin Corp. | | 229,500 | 12,544,470 |
| Orion Engineered Carbons SA | | 318,726 | 5,373,720 |
| Tronox Holdings PLC | | 759,669 | 11,113,957 |
| Westlake Corp. | | 149,856 | 14,780,297 |
| | | | 52,091,499 |
| Diversified Chemicals - 2.8% | | | |
| Huntsman Corp. | | 84,900 | 2,378,898 |
| The Chemours Co. LLC | | 494,959 | 16,694,967 |
| | | | 19,073,865 |
| Fertilizers & Agricultural Chemicals - 15.4% | | | |
| CF Industries Holdings, Inc. | | 294,017 | 30,418,999 |
| Corteva, Inc. | | 846,893 | 52,024,637 |
| FMC Corp. | | 54,800 | 5,922,784 |
| The Mosaic Co. | | 293,800 | 15,827,006 |
| | | | 104,193,426 |
| Industrial Gases - 28.6% | | | |
| Air Products & Chemicals, Inc. | | 131,211 | 33,124,217 |
| Linde PLC | | 568,016 | 160,669,005 |
| | | | 193,793,222 |
| Specialty Chemicals - 45.0% | | | |
| Albemarle Corp. | | 84,600 | 22,669,416 |
| Asian Paints Ltd. | | 223,200 | 9,391,928 |
| Avient Corp. | | 180,300 | 7,902,549 |
| Axalta Coating Systems Ltd. (a) | | 512,800 | 13,204,600 |
| Celanese Corp. Class A | | 181,600 | 20,132,176 |
| DuPont de Nemours, Inc. | | 425,694 | 23,685,614 |
| Eastman Chemical Co. | | 214,400 | 19,510,400 |
| Ecolab, Inc. | | 301,600 | 49,411,128 |
| Element Solutions, Inc. | | 837,743 | 15,640,662 |
| International Flavors & Fragrances, Inc. | | 173,716 | 19,192,144 |
| Livent Corp. (a) | | 200 | 6,436 |
| PPG Industries, Inc. | | 266,500 | 33,840,170 |
| Sherwin-Williams Co. | | 303,699 | 70,488,538 |
| | | | 305,075,761 |
| TOTAL COMMON STOCKS (Cost $464,264,256) | | | 674,227,773 |
| | | | |
| Money Market Funds - 0.4% |
| | | Shares | Value ($) |
Fidelity Cash Central Fund 2.33% (b) (Cost $2,447,125) | | 2,446,635 | 2,447,125 |
| | | | |
| TOTAL INVESTMENT IN SECURITIES - 99.9% (Cost $466,711,381) | 676,674,898 |
NET OTHER ASSETS (LIABILITIES) - 0.1% | 751,746 |
| NET ASSETS - 100.0% | 677,426,644 |
| | |
Legend
| (b) | Affiliated fund that is generally available only to investment companies and other accounts managed by Fidelity Investments. The rate quoted is the annualized seven-day yield of the fund at period end. A complete unaudited listing of the fund's holdings as of its most recent quarter end is available upon request. In addition, each Fidelity Central Fund's financial statements are available on the SEC's website or upon request. |
Affiliated Central Funds
Fiscal year to date information regarding the Fund's investments in Fidelity Central Funds, including the ownership percentage, is presented below.
| Affiliate | Value, beginning of period ($) | Purchases ($) | Sales Proceeds ($) | Dividend Income ($) | Realized Gain (loss) ($) | Change in Unrealized appreciation (depreciation) ($) | Value, end of period ($) | %ownership, end of period |
| Fidelity Cash Central Fund 2.33% | 1,042,443 | 66,665,277 | 65,260,595 | 36,630 | - | - | 2,447,125 | 0.0% |
| Fidelity Securities Lending Cash Central Fund 2.34% | 2,247,252 | 32,712,158 | 34,959,410 | 852 | - | - | - | 0.0% |
| Total | 3,289,695 | 99,377,435 | 100,220,005 | 37,482 | - | - | 2,447,125 | |
| | | | | | | | | |
Amounts in the income column in the above table include any capital gain distributions from underlying funds, which are presented in the corresponding line item in the Statement of Operations, if applicable.
Amount for Fidelity Securities Lending Cash Central Fund represents the income earned on investing cash collateral, less rebates paid to borrowers and any lending agent fees associated with the loan, plus any premium payments received for lending certain types of securities.
Investment Valuation
The following is a summary of the inputs used, as of August 31, 2022, involving the Fund's assets and liabilities carried at fair value. The inputs or methodology used for valuing securities may not be an indication of the risk associated with investing in those securities. For more information on valuation inputs, and their aggregation into the levels used below, please refer to the Investment Valuation section in the accompanying Notes to Financial Statements.
| Valuation Inputs at Reporting Date: |
| Description | Total ($) | Level 1 ($) | Level 2 ($) | Level 3 ($) |
Investments in Securities: | | | | |
|
| Common Stocks | 674,227,773 | 664,835,845 | 9,391,928 | - |
|
| Money Market Funds | 2,447,125 | 2,447,125 | - | - |
| Total Investments in Securities: | 676,674,898 | 667,282,970 | 9,391,928 | - |
Chemicals Portfolio
| Statement of Assets and Liabilities |
| | | | August 31, 2022 (Unaudited) |
| | | | | |
| Assets | | | | |
| Investment in securities, at value - See accompanying schedule: | | $674,227,773 | | |
Unaffiliated issuers (cost $464,264,256) | | | |
Fidelity Central Funds (cost $2,447,125) | | 2,447,125 | | |
| | | | | |
| Total Investment in Securities (cost $466,711,381) | | | $ | 676,674,898 |
| Receivable for fund shares sold | | | | 71,185 |
| Dividends receivable | | | | 1,402,982 |
| Distributions receivable from Fidelity Central Funds | | | | 3,694 |
| Prepaid expenses | | | | 6,872 |
| Other receivables | | | | 144,404 |
Total assets | | | | 678,304,035 |
| Liabilities | | | | |
| Payable for fund shares redeemed | | $259,718 | | |
| Accrued management fee | | 310,739 | | |
| Transfer agent fee payable | | 101,489 | | |
| Other affiliated payables | | 18,891 | | |
| Other payables and accrued expenses | | 186,554 | | |
| Total Liabilities | | | | 877,391 |
| Net Assets | | | $ | 677,426,644 |
| Net Assets consist of: | | | | |
| Paid in capital | | | $ | 419,372,929 |
| Total accumulated earnings (loss) | | | | 258,053,715 |
| Net Assets | | | $ | 677,426,644 |
Net Asset Value , offering price and redemption price per share ($677,426,644 ÷ 44,176,059 shares) | | | $ | 15.33 |
| | | | | |
| Statement of Operations |
| | | | Six months ended August 31, 2022 (Unaudited) |
| Investment Income | | | | |
| Dividends | | | $ | 6,393,399 |
| Income from Fidelity Central Funds (including $852 from security lending) | | | | 37,482 |
| Total Income | | | | 6,430,881 |
| Expenses | | | | |
| Management fee | $ | 1,924,300 | | |
| Transfer agent fees | | 634,178 | | |
| Accounting fees | | 122,887 | | |
| Custodian fees and expenses | | 2,937 | | |
| Independent trustees' fees and expenses | | 1,189 | | |
| Registration fees | | 21,575 | | |
| Audit | | 18,117 | | |
| Legal | | 207 | | |
| Miscellaneous | | 3,095 | | |
| Total expenses before reductions | | 2,728,485 | | |
| Expense reductions | | (12,087) | | |
| Total expenses after reductions | | | | 2,716,398 |
| Net Investment income (loss) | | | | 3,714,483 |
| Realized and Unrealized Gain (Loss) | | | | |
| Net realized gain (loss) on: | | | | |
| Investment Securities: | | | | |
| Unaffiliated issuers | | 45,362,489 | | |
| Foreign currency transactions | | 5,522 | | |
| Total net realized gain (loss) | | | | 45,368,011 |
| Change in net unrealized appreciation (depreciation) on: | | | | |
| Investment Securities: | | | | |
| Unaffiliated issuers(net of increase in deferred foreign taxes of $27,633) | | (94,600,434) | | |
| Assets and liabilities in foreign currencies | | (35,772) | | |
| Total change in net unrealized appreciation (depreciation) | | | | (94,636,206) |
| Net gain (loss) | | | | (49,268,195) |
| Net increase (decrease) in net assets resulting from operations | | | $ | (45,553,712) |
| Statement of Changes in Net Assets |
| |
| | Six months ended August 31, 2022 (Unaudited) | | Year ended February 28, 2022 |
| Increase (Decrease) in Net Assets | | | | |
| Operations | | | | |
| Net investment income (loss) | $ | 3,714,483 | $ | 6,746,277 |
| Net realized gain (loss) | | 45,368,011 | | 54,079,063 |
| Change in net unrealized appreciation (depreciation) | | (94,636,206) | | 56,407,256 |
| Net increase (decrease) in net assets resulting from operations | | (45,553,712) | | 117,232,596 |
| Distributions to shareholders | | (27,413,453) | | (9,969,040) |
| Share transactions | | | | |
| Proceeds from sales of shares | | 18,237,920 | | 88,405,055 |
| Reinvestment of distributions | | 25,823,592 | | 9,337,590 |
| Cost of shares redeemed | | (52,567,345) | | (146,786,766) |
Net increase (decrease) in net assets resulting from share transactions | | (8,505,833) | | (49,044,121) |
| Total increase (decrease) in net assets | | (81,472,998) | | 58,219,435 |
| | | | | |
| Net Assets | | | | |
| Beginning of period | | 758,899,642 | | 700,680,207 |
| End of period | $ | 677,426,644 | $ | 758,899,642 |
| | | | | |
| Other Information | | | | |
| Shares | | | | |
| Sold | | 1,102,250 | | 5,113,175 |
| Issued in reinvestment of distributions | | 1,512,806 | | 520,200 |
| Redeemed | | (3,225,513) | | (8,619,384) |
| Net increase (decrease) | | (610,457) | | (2,986,009) |
| | | | | |
| | Six months ended (Unaudited) August 31, 2022 | | Years ended February 28, 2022 | | 2021 | | 2020 A | | 2019 B | | 2018 B |
Selected Per-Share Data | | | | | | | | | | | | |
| Net asset value, beginning of period | $ | 16.94 | $ | 14.67 | $ | 10.47 | $ | 13.57 | $ | 17.34 | $ | 16.24 |
| Income from Investment Operations | | | | | | | | | | | | |
Net investment income (loss) C,D | | .08 | | .15 | | .15 | | .15 | | .23 | | .19 |
| Net realized and unrealized gain (loss) | | (1.07) | | 2.34 | | 4.21 | | (2.39) | | (2.17) | | 2.36 |
| Total from investment operations | | (.99) | | 2.49 | | 4.36 | | (2.24) | | (1.94) | | 2.55 |
| Distributions from net investment income | | (.01) | | (.14) | | (.16) | | (.20) | | (.21) | | (.16) |
| Distributions from net realized gain | | (.61) | | (.08) | | - | | (.66) | | (1.62) | | (1.29) |
| Total distributions | | (.62) | | (.22) | | (.16) | | (.86) | | (1.83) | | (1.45) |
| Net asset value, end of period | $ | 15.33 | $ | 16.94 | $ | 14.67 | $ | 10.47 | $ | 13.57 | $ | 17.34 |
Total Return E,F | | (6.21)% | | 16.90% | | 41.65% | | (17.63)% | | (11.10)% | | 16.31% |
Ratios to Average Net Assets D,G,H | | | | | | | | | | | | |
| Expenses before reductions | | .75% I | | .74% | | .79% | | .78% | | .77% | | .77% |
| Expenses net of fee waivers, if any | | .74% I | | .74% | | .79% | | .78% | | .77% | | .77% |
| Expenses net of all reductions | | .74% I | | .74% | | .78% | | .77% | | .76% | | .77% |
| Net investment income (loss) | | 1.02% I | | .85% | | 1.28% | | 1.21% | | 1.50% | | 1.12% |
| Supplemental Data | | | | | | | | | | | | |
| Net assets, end of period (000 omitted) | $ | 677,427 | $ | 758,900 | $ | 700,680 | $ | 656,441 | $ | 1,153,379 | $ | 1,790,221 |
Portfolio turnover rate J | | 54% I | | 15% | | 50% | | 77% | | 62% | | 62% |
A For the year ended February 29.
B Per share amounts have been adjusted to reflect the impact of the 10 for 1 share split that soccurred on August 10, 2018.
C Calculated based on average shares outstanding during the period.
D Net investment income (loss) is affected by the timing of the declaration of dividends by any underlying mutual funds or exchange-traded funds (ETFs). Net investment income (loss) of any such underlying funds is not included in the Fund's net investment income (loss) ratio.
E Total returns for periods of less than one year are not annualized.
F Total returns would have been lower if certain expenses had not been reduced during the applicable periods shown.
G Fees and expenses of any underlying mutual funds or exchange-traded funds (ETFs) are not included in the Fund's expense ratio. The Fund indirectly bears its proportionate share of these expenses. For additional expense information related to investments in Fidelity Central Funds, please refer to the "Investments in Fidelity Central Funds" note found in the Notes to Financial Statements section of the most recent Annual or Semi-Annual report.
H Expense ratios reflect operating expenses of the class. Expenses before reductions do not reflect amounts reimbursed, waived, or reduced through arrangements with the investment adviser, brokerage services, or other offset arrangements, if applicable, and do not represent the amount paid by the class during periods when reimbursements, waivers or reductions occur.
I Annualized
J Amount does not include the portfolio activity of any underlying mutual funds or exchange-traded funds (ETFs).
For the period ended August 31, 2022
1. Organization.
Chemicals Portfolio (the Fund) is a non-diversified fund of Fidelity Select Portfolios (the Trust) and is authorized to issue an unlimited number of shares. Share transactions on the Statement of Changes in Net Assets may contain exchanges between affiliated funds. The Trust is registered under the Investment Company Act of 1940, as amended (the 1940 Act), as an open-end management investment company organized as a Massachusetts business trust. The Fund invests primarily in securities of companies whose principal business activities fall within specific industries.
2. Investments in Fidelity Central Funds.
Funds may invest in Fidelity Central Funds, which are open-end investment companies generally available only to other investment companies and accounts managed by the investment adviser and its affiliates. The Schedule of Investments lists any Fidelity Central Funds held as an investment as of period end, but does not include the underlying holdings of each Fidelity Central Fund. An investing fund indirectly bears its proportionate share of the expenses of the underlying Fidelity Central Funds.
Based on its investment objective, each Fidelity Central Fund may invest or participate in various investment vehicles or strategies that are similar to those of the investing fund. These strategies are consistent with the investment objectives of the investing fund and may involve certain economic risks which may cause a decline in value of each of the Fidelity Central Funds and thus a decline in the value of the investing fund.
| Fidelity Central Fund | Investment Manager | Investment Objective | Investment Practices | Expense Ratio A |
| Fidelity Money Market Central Funds | Fidelity Management & Research Company LLC (FMR) | Each fund seeks to obtain a high level of current income consistent with the preservation of capital and liquidity. | Short-term Investments | Less than .005% |
A Expenses expressed as a percentage of average net assets and are as of each underlying Central Fund's most recent annual or semi-annual shareholder report.
A complete unaudited list of holdings for each Fidelity Central Fund is available upon request or at the Securities and Exchange Commission website at www.sec.gov. In addition, the financial statements of the Fidelity Central Funds which contain the significant accounting policies (including investment valuation policies) of those funds, and are not covered by the Report of Independent Registered Public Accounting Firm, are available on the Securities and Exchange Commission website or upon request.
3. Significant Accounting Policies.
The Fund is an investment company and applies the accounting and reporting guidance of the Financial Accounting Standards Board (FASB) Accounting Standards Codification Topic 946 Financial Services - Investment Companies . The financial statements have been prepared in conformity with accounting principles generally accepted in the United States of America (GAAP), which require management to make certain estimates and assumptions at the date of the financial statements. Actual results could differ from those estimates. Subsequent events, if any, through the date that the financial statements were issued have been evaluated in the preparation of the financial statements. The Fund's Schedule of Investments lists any underlying mutual funds or exchange-traded funds (ETFs) but does not include the underlying holdings of these funds. The following summarizes the significant accounting policies of the Fund:
Investment Valuation. Investments are valued as of 4:00 p.m. Eastern time on the last calendar day of the period. The Board of Trustees (the Board) has delegated the day to day responsibility for the valuation of the Fund's investments to the Fair Value Committee (the Committee) established by the Fund's investment adviser. In accordance with valuation policies and procedures approved by the Board, the Fund attempts to obtain prices from one or more third party pricing vendors or brokers to value its investments. When current market prices, quotations or currency exchange rates are not readily available or reliable, investments will be fair valued in good faith by the Committee, in accordance with procedures adopted by the Board. Factors used in determining fair value vary by investment type and may include market or investment specific events. The frequency with which these procedures are used cannot be predicted and they may be utilized to a significant extent. The Committee oversees the Fund's valuation policies and procedures and reports to the Board on the Committee's activities and fair value determinations. The Board monitors the appropriateness of the procedures used in valuing the Fund's investments and ratifies the fair value determinations of the Committee.
The Fund categorizes the inputs to valuation techniques used to value its investments into a disclosure hierarchy consisting of three levels as shown below:
Level 1 - unadjusted quoted prices in active markets for identical investments
Level 2 - other significant observable inputs (including quoted prices for similar investments, interest rates, prepayment speeds, etc.)
Level 3 - unobservable inputs (including the Fund's own assumptions based on the best information available)
Valuation techniques used to value the Fund's investments by major category are as follows:
Equity securities, including restricted securities, for which market quotations are readily available, are valued at the last reported sale price or official closing price as reported by a third party pricing vendor on the primary market or exchange on which they are traded and are categorized as Level 1 in the hierarchy. In the event there were no sales during the day or closing prices are not available, securities are valued at the last quoted bid price or may be valued using the last available price and are generally categorized as Level 2 in the hierarchy. For foreign equity securities, when market or security specific events arise, comparisons to the valuation of American Depositary Receipts (ADRs), futures contracts, ETFs and certain indexes as well as quoted prices for similar securities may be used and would be categorized as Level 2 in the hierarchy. For equity securities, including restricted securities, where observable inputs are limited, assumptions about market activity and risk are used and these securities may be categorized as Level 3 in the hierarchy.
Investments in open-end mutual funds, including the Fidelity Central Funds, are valued at their closing net asset value (NAV) each business day and are categorized as Level 1 in the hierarchy.
Changes in valuation techniques may result in transfers in or out of an assigned level within the disclosure hierarchy. The aggregate value of investments by input level as of August 31, 2022 is included at the end of the Fund's Schedule of Investments.
Foreign Currency. Certain Funds may use foreign currency contracts to facilitate transactions in foreign-denominated securities. Gains and losses from these transactions may arise from changes in the value of the foreign currency or if the counterparties do not perform under the contracts' terms.
Foreign-denominated assets, including investment securities, and liabilities are translated into U.S. dollars at the exchange rates at period end. Purchases and sales of investment securities, income and dividends received, and expenses denominated in foreign currencies are translated into U.S. dollars at the exchange rate in effect on the transaction date.
The effects of exchange rate fluctuations on investments are included with the net realized and unrealized gain (loss) on investment securities. Other foreign currency transactions resulting in realized and unrealized gain (loss) are disclosed separately.
Investment Transactions and Income. For financial reporting purposes, the Fund's investment holdings and NAV include trades executed through the end of the last business day of the period. The NAV per share for processing shareholder transactions is calculated as of the close of business of the New York Stock Exchange (NYSE), normally 4:00 p.m. Eastern time and includes trades executed through the end of the prior business day. Gains and losses on securities sold are determined on the basis of identified cost. Commissions paid to certain brokers with whom the investment adviser, or its affiliates, places trades on behalf of a fund include an amount in addition to trade execution, which may be rebated back to a fund. Any such rebates are included in net realized gain (loss) on investments in the Statement of Operations. Dividend income is recorded on the ex-dividend date, except for certain dividends from foreign securities where the ex-dividend date may have passed, which are recorded as soon as the Fund is informed of the ex-dividend date. Non-cash dividends included in dividend income, if any, are recorded at the fair market value of the securities received. Income and capital gain distributions from Fidelity Central Funds, if any, are recorded on the ex-dividend date. Certain distributions received by the Fund represent a return of capital or capital gain. The Fund determines the components of these distributions subsequent to the ex-dividend date, based upon receipt of tax filings or other correspondence relating to the underlying investment. These distributions are recorded as a reduction of cost of investments and/or as a realized gain. Investment income is recorded net of foreign taxes withheld where recovery of such taxes is uncertain. Funds may file withholding tax reclaims in certain jurisdictions to recover a portion of amounts previously withheld. Any withholding tax reclaims income is included in the Statement of Operations in dividends. Any receivables for withholding tax reclaims are included in the Statement of Assets and Liabilities in dividends receivable.
Expenses. Expenses directly attributable to a fund are charged to that fund. Expenses attributable to more than one fund are allocated among the respective funds on the basis of relative net assets or other appropriate methods. Expenses included in the accompanying financial statements reflect the expenses of that fund and do not include any expenses associated with any underlying mutual funds or exchange-traded funds. Although not included in a fund's expenses, a fund indirectly bears its proportionate share of these expenses through the net asset value of each underlying mutual fund or exchange-traded fund. Expense estimates are accrued in the period to which they relate and adjustments are made when actual amounts are known.
Deferred Trustee Compensation. Under a Deferred Compensation Plan (the Plan) for certain Funds, certain independent Trustees have elected to defer receipt of a portion of their annual compensation. Deferred amounts are invested in affiliated mutual funds, are marked-to-market and remain in a fund until distributed in accordance with the Plan. The investment of deferred amounts and the offsetting payable to the Trustees presented below are included in the accompanying Statement of Assets and Liabilities in other receivables and other payables and accrued expenses, as applicable.
| Chemicals Portfolio | $139,423 |
Income Tax Information and Distributions to Shareholders. Each year, the Fund intends to qualify as a regulated investment company under Subchapter M of the Internal Revenue Code, including distributing substantially all of its taxable income and realized gains. As a result, no provision for U.S. Federal income taxes is required. The Fund files a U.S. federal tax return, in addition to state and local tax returns as required. The Fund's federal income tax returns are subject to examination by the Internal Revenue Service (IRS) for a period of three fiscal years after they are filed. State and local tax returns may be subject to examination for an additional fiscal year depending on the jurisdiction. Foreign taxes are provided for based on the Fund's understanding of the tax rules and rates that exist in the foreign markets in which it invests. The Fund is subject to a tax imposed on capital gains by certain countries in which it invests. An estimated deferred tax liability for net unrealized appreciation on the applicable securities is included in Other payables and accrued expenses on the Statement of Assets & Liabilities.
Distributions are declared and recorded on the ex-dividend date. Income and capital gain distributions are determined in accordance with income tax regulations, which may differ from GAAP.
Capital accounts within the financial statements are adjusted for permanent book-tax differences. These adjustments have no impact on net assets or the results of operations. Capital accounts are not adjusted for temporary book-tax differences which will reverse in a subsequent period.
Book-tax differences are primarily due to foreign currency transactions, deferred Trustees compensation, capital loss carryforwards and losses deferred due to wash sales.
As of period end, the cost and unrealized appreciation (depreciation) in securities, and derivatives if applicable, for federal income tax purposes were as follows:
| Gross unrealized appreciation | $ 221,954,856 |
| Gross unrealized depreciation | (12,484,635) |
| Net unrealized appreciation (depreciation) | $ 209,470,221 |
| Tax cost | $ 467,204,677 |
4. Purchases and Sales of Investments.
Purchases and sales of securities, other than short-term securities and in-kind transactions, as applicable, are noted in the table below.
| | Purchases ($) | Sales ($) |
| Chemicals Portfolio | 195,176,580 | 228,697,983 |
5. Fees and Other Transactions with Affiliates.
Management Fee. Fidelity Management & Research Company LLC (the investment adviser) and its affiliates provide the Fund with investment management related services for which the Fund pays a monthly management fee. The management fee is the sum of an individual fund fee rate that is based on an annual rate of .30% of the Fund's average net assets and an annualized group fee rate that averaged .23% during the period. The group fee rate is based upon the monthly average net assets of a group of registered investment companies with which the investment adviser has management contracts. The group fee rate decreases as assets under management increase and increases as assets under management decrease. For the reporting period, the total annualized management fee rate was .53% of the Fund's average net assets.
Transfer Agent Fees. Fidelity Investments Institutional Operations Company LLC (FIIOC), an affiliate of the investment adviser, is the Fund's transfer, dividend disbursing and shareholder servicing agent. FIIOC receives account fees and asset-based fees that vary according to account size and type of account. FIIOC pays for typesetting, printing and mailing of shareholder reports, except proxy statements. For the period, the transfer agent fees were equivalent to an annualized rate of .17% of average net assets.
Accounting Fees. Fidelity Service Company, Inc. (FSC), an affiliate of the investment adviser, maintains the Fund's accounting records. The accounting fee is based on the level of average net assets for each month. For the period, the fees were equivalent to the following annualized rates:
| | % of Average Net Assets |
| Chemicals Portfolio | .03 |
Brokerage Commissions. A portion of portfolio transactions were placed with brokerage firms which are affiliates of the investment adviser. Brokerage commissions are included in net realized gain (loss) and change in net unrealized appreciation (depreciation) in the Statement of Operations. The commissions paid to these affiliated firms were as follows:
| | Amount |
| Chemicals Portfolio | $ 4,164 |
Interfund Trades. Funds may purchase from or sell securities to other Fidelity Funds under procedures adopted by the Board. The procedures have been designed to ensure these interfund trades are executed in accordance with Rule 17a-7 of the 1940 Act. Any interfund trades are included within the respective purchases and sales amounts shown in the Purchases and Sales of Investments note. Interfund trades during the period are noted in the table below.
| | Purchases ($) | Sales ($) | Realized Gain (Loss) ($) |
| Chemicals Portfolio | 4,187,107 | 15,901,677 | 4,783,871 |
6. Committed Line of Credit.
Certain Funds participate with other funds managed by the investment adviser or an affiliate in a $4.25 billion credit facility (the "line of credit") to be utilized for temporary or emergency purposes to fund shareholder redemptions or for other short-term liquidity purposes. The participating funds have agreed to pay commitment fees on their pro-rata portion of the line of credit, which are reflected in Miscellaneous expenses on the Statement of Operations, and are listed below. During the period, there were no borrowings on this line of credit.
| | Amount |
| Chemicals Portfolio | $ 670 |
7. Security Lending.
Funds lend portfolio securities from time to time in order to earn additional income. Lending agents are used, including National Financial Services (NFS), an affiliate of the investment adviser. Pursuant to a securities lending agreement, NFS will receive a fee, which is capped at 9.9% of a fund's daily lending revenue, for its services as lending agent. A fund may lend securities to certain qualified borrowers, including NFS. On the settlement date of the loan, a fund receives collateral (in the form of U.S. Treasury obligations, letters of credit and/or cash) against the loaned securities and maintains collateral in an amount not less than 100% of the market value of the loaned securities during the period of the loan. The market value of the loaned securities is determined at the close of business of a fund and any additional required collateral is delivered to a fund on the next business day. A fund or borrower may terminate the loan at any time, and if the borrower defaults on its obligation to return the securities loaned because of insolvency or other reasons, a fund may apply collateral received from the borrower against the obligation. A fund may experience delays and costs in recovering the securities loaned. Any cash collateral received is invested in the Fidelity Securities Lending Cash Central Fund. Any loaned securities are identified as such in the Schedule of Investments, and the value of loaned securities and cash collateral at period end, as applicable, are presented in the Statement of Assets and Liabilities. Security lending income represents the income earned on investing cash collateral, less rebates paid to borrowers and any lending agent fees associated with the loan, plus any premium payments received for lending certain types of securities. Security lending income is presented in the Statement of Operations as a component of income from Fidelity Central Funds. Affiliated security lending activity, if any, was as follows:
| | Total Security Lending Fees Paid to NFS | Security Lending Income From Securities Loaned to NFS | Value of Securities Loaned to NFS at Period End |
| Chemicals Portfolio | $ 82 | $ - | $- |
8. Expense Reductions.
During the period the investment adviser or an affiliate reimbursed and/or waived a portion of operating expenses in the amount of $12,087.
9. Other.
A fund's organizational documents provide former and current trustees and officers with a limited indemnification against liabilities arising in connection with the performance of their duties to the fund. In the normal course of business, a fund may also enter into contracts that provide general indemnifications. A fund's maximum exposure under these arrangements is unknown as this would be dependent on future claims that may be made against a fund. The risk of material loss from such claims is considered remote.
10. Risk and Uncertainties.
Many factors affect a fund's performance. Developments that disrupt global economies and financial markets, such as pandemics, epidemics, outbreaks of infectious diseases, war, terrorism, and environmental disasters, may significantly affect a fund's investment performance. The effects of these developments to a fund will be impacted by the types of securities in which a fund invests, the financial condition, industry, economic sector, and geographic location of an issuer, and a fund's level of investment in the securities of that issuer.
The information in the following tables is based on the consolidated investments of the Fund.
Top Holdings (% of Fund's net assets) |
| |
| Newmont Corp. | 11.3 | |
| Franco-Nevada Corp. | 10.1 | |
| Barrick Gold Corp. (Canada) | 8.7 | |
| Agnico Eagle Mines Ltd. (Canada) | 7.8 | |
| Wheaton Precious Metals Corp. | 6.4 | |
| Orla Mining Ltd. | 4.6 | |
| Zijin Mining Group Co. Ltd. (H Shares) | 3.8 | |
| OceanaGold Corp. | 3.1 | |
| Newcrest Mining Ltd. | 3.0 | |
| Osisko Gold Royalties Ltd. | 2.5 | |
| | 61.3 | |
| |
| Industries (% of Fund's net assets) |
| |
| Gold | 90.8 | |
| Silver | 4.1 | |
| Diversified Metals & Mining | 2.5 | |
| Commodities & Related Investments* | 0.8 | |
| Precious Metals & Minerals | 0.5 | |
| |
*Includes gold bullion and/or silver bullion.
Geographic Diversification (% of Fund's net assets) |
|
* Includes Short-Term investments and Net Other Assets (Liabilities). Percentages are based on country or territory of incorporation and are adjusted for the effect of futures contracts, if applicable. |
| |
Gold Portfolio
Showing Percentage of Net Assets
| Common Stocks - 97.9% |
| | | Shares | Value ($) |
| Australia - 5.8% | | | |
| Metals & Mining - 5.8% | | | |
| Gold - 5.8% | | | |
| Evolution Mining Ltd. | | 4,000,000 | 6,428,213 |
| Newcrest Mining Ltd. | | 3,000,000 | 36,065,000 |
| Northern Star Resources Ltd. | | 5,000,000 | 26,426,216 |
| | | | 68,919,429 |
| Canada - 67.9% | | | |
| Metals & Mining - 67.9% | | | |
| Diversified Metals & Mining - 1.7% | | | |
| BeMetals Corp. (a) | | 2,000,000 | 182,739 |
| Foran Mining Corp. (a)(b) | | 5,000,000 | 9,517,646 |
| Western Copper & Gold Corp. (TSX) (a)(b)(c) | | 8,000,000 | 10,172,460 |
| | | | 19,872,845 |
| Gold - 64.8% | | | |
| Agnico Eagle Mines Ltd. (Canada) (b) | | 2,250,000 | 92,785,625 |
| Alamos Gold, Inc. | | 4,000,000 | 28,842,274 |
| Artemis Gold, Inc. (a) | | 3,500,000 | 12,258,728 |
| Ascot Resources Ltd. (a)(c) | | 25,000,000 | 6,852,705 |
| B2Gold Corp. | | 7,000,000 | 21,479,423 |
| Barrick Gold Corp. (Canada) (b) | | 7,000,000 | 103,932,691 |
| Bonterra Resources, Inc. (a)(c) | | 7,500,000 | 3,483,458 |
| Franco-Nevada Corp. | | 1,000,000 | 120,226,901 |
| Fury Gold Mines Ltd. (c)(d) | | 10,000,000 | 3,995,127 |
| i-80 Gold Corp. (a)(b)(c) | | 10,000,000 | 17,893,174 |
| i-80 Gold Corp. (c)(e) | | 2,500,000 | 4,473,293 |
| i-80 Gold Corp. warrants 9/30/22 (a)(c) | | 625,000 | 5 |
| Lundin Gold, Inc. | | 2,000,000 | 13,355,160 |
| Maple Gold Mines Ltd. (a)(c) | | 20,000,000 | 2,741,082 |
| Marathon Gold Corp. (a)(b) | | 10,000,000 | 12,867,857 |
| Novagold Resources, Inc. (a) | | 3,000,000 | 13,248,563 |
| OceanaGold Corp. (a) | | 25,000,000 | 36,928,465 |
| Orla Mining Ltd. (a)(b)(c) | | 16,500,000 | 55,152,853 |
| Osisko Development Corp. (a) | | 666,666 | 3,223,306 |
| Osisko Development Corp. rights (a) | | 666,666 | 448,462 |
| Osisko Gold Royalties Ltd. (b) | | 3,000,000 | 29,032,626 |
| Osisko Mining, Inc. (a) | | 5,000,000 | 9,631,857 |
| Pure Gold Mining, Inc. warrants 3/28/23 (a) | | 1,500,000 | 11 |
| Rupert Resources Ltd. (a) | | 4,000,000 | 12,487,151 |
| Sabina Gold & Silver Corp. (a) | | 10,000,000 | 8,070,964 |
| Seabridge Gold, Inc. (a) | | 1,000,000 | 12,114,059 |
| Skeena Resources Ltd. (a)(b) | | 2,500,000 | 11,916,092 |
| Torex Gold Resources, Inc. (a) | | 1,000,000 | 7,423,764 |
| Triple Flag Precious Metals Corp. | | 1,000,000 | 12,120,000 |
| Victoria Gold Corp. (a)(b) | | 3,000,000 | 17,771,348 |
| Wesdome Gold Mines, Inc. (a) | | 3,500,000 | 20,466,745 |
| Wheaton Precious Metals Corp. (b) | | 2,500,000 | 76,312,483 |
| | | | 771,536,252 |
| Precious Metals & Minerals - 0.5% | | | |
| SilverCrest Metals, Inc. (a) | | 1,000,000 | 5,459,322 |
| | | | |
| Silver - 0.9% | | | |
| GoGold Resources, Inc. (a)(b) | | 5,000,000 | 6,814,634 |
| New Pacific Metals Corp. (a)(b) | | 1,500,000 | 3,894,621 |
| | | | 10,709,255 |
TOTAL METALS & MINING | | | 807,577,674 |
| | | | |
| China - 3.8% | | | |
| Metals & Mining - 3.8% | | | |
| Gold - 3.8% | | | |
| Zijin Mining Group Co. Ltd. (H Shares) | | 40,000,000 | 45,198,964 |
| | | | |
| South Africa - 2.8% | | | |
| Metals & Mining - 2.8% | | | |
| Gold - 2.8% | | | |
| AngloGold Ashanti Ltd. (b) | | 1,000,000 | 13,354,675 |
| Gold Fields Ltd. | | 2,500,000 | 20,190,888 |
| | | | 33,545,563 |
| United Kingdom - 0.4% | | | |
| Metals & Mining - 0.4% | | | |
| Gold - 0.4% | | | |
| Solgold PLC (a) | | 20,000,000 | 4,623,566 |
| | | | |
| United States of America - 17.2% | | | |
| Metals & Mining - 17.2% | | | |
| Diversified Metals & Mining - 0.8% | | | |
| Ivanhoe Electric, Inc. (a) | | 1,000,000 | 9,630,000 |
| | | | |
| Gold - 13.2% | | | |
| Dakota Gold Corp. (a)(b) | | 2,500,000 | 8,525,000 |
| Newmont Corp. | | 3,250,000 | 134,420,001 |
| Royal Gold, Inc. (b) | | 150,000 | 13,785,000 |
| | | | 156,730,001 |
| Silver - 3.2% | | | |
| Gatos Silver, Inc. (a)(b)(c) | | 6,000,000 | 18,240,000 |
| Hecla Mining Co. | | 5,000,000 | 19,700,000 |
| | | | 37,940,000 |
TOTAL METALS & MINING | | | 204,300,001 |
| | | | |
| TOTAL COMMON STOCKS (Cost $1,057,686,424) | | | 1,164,165,197 |
| | | | |
| Commodities - 0.8% |
| | | Troy Ounces | Value ($) |
Gold Bullion (Cost $4,575,085) | | 5,582 | 9,546,895 |
| | | | |
| Money Market Funds - 22.3% |
| | | Shares | Value ($) |
| Fidelity Cash Central Fund 2.33% (f) | | 8,475,988 | 8,477,683 |
| Fidelity Securities Lending Cash Central Fund 2.34% (f)(g) | | 257,332,840 | 257,358,573 |
| TOTAL MONEY MARKET FUNDS (Cost $265,836,256) | | | 265,836,256 |
| | | | |
| TOTAL INVESTMENT IN SECURITIES - 121.0% (Cost $1,328,097,765) | 1,439,548,348 |
NET OTHER ASSETS (LIABILITIES) - (21.0)% | (249,823,001) |
| NET ASSETS - 100.0% | 1,189,725,347 |
| | |
Legend
| (b) | Security or a portion of the security is on loan at period end. |
| (d) | Restricted securities (including private placements) - Investment in securities not registered under the Securities Act of 1933 (excluding 144A issues). At the end of the period, the value of restricted securities (excluding 144A issues) amounted to $3,995,127 or 0.3% of net assets. |
| (e) | Security exempt from registration under Rule 144A of the Securities Act of 1933. These securities may be resold in transactions exempt from registration, normally to qualified institutional buyers. At the end of the period, the value of these securities amounted to $4,473,293 or 0.4% of net assets. |
| (f) | Affiliated fund that is generally available only to investment companies and other accounts managed by Fidelity Investments. The rate quoted is the annualized seven-day yield of the fund at period end. A complete unaudited listing of the fund's holdings as of its most recent quarter end is available upon request. In addition, each Fidelity Central Fund's financial statements are available on the SEC's website or upon request. |
| (g) | Investment made with cash collateral received from securities on loan. |
| Additional information on each restricted holding is as follows: |
| Security | Acquisition Date | Acquisition Cost ($) |
| Fury Gold Mines Ltd. | 4/12/22 | 6,328,113 |
Affiliated Central Funds
Fiscal year to date information regarding the Fund's investments in Fidelity Central Funds, including the ownership percentage, is presented below.
| Affiliate | Value, beginning of period ($) | Purchases ($) | Sales Proceeds ($) | Dividend Income ($) | Realized Gain (loss) ($) | Change in Unrealized appreciation (depreciation) ($) | Value, end of period ($) | %ownership, end of period |
| Fidelity Cash Central Fund 2.33% | 58,603,905 | 282,408,478 | 332,534,700 | 79,051 | - | - | 8,477,683 | 0.0% |
| Fidelity Securities Lending Cash Central Fund 2.34% | 105,810,777 | 530,176,661 | 378,628,865 | 480,364 | - | - | 257,358,573 | 0.7% |
| Total | 164,414,682 | 812,585,139 | 711,163,565 | 559,415 | - | - | 265,836,256 | |
| | | | | | | | | |
Amounts in the income column in the above table include any capital gain distributions from underlying funds, which are presented in the corresponding line item in the Consolidated Statement of Operations, if applicable.
Amount for Fidelity Securities Lending Cash Central Fund represents the income earned on investing cash collateral, less rebates paid to borrowers and any lending agent fees associated with the loan, plus any premium payments received for lending certain types of securities.
Consolidated Subsidiary
| Fund | Value, beginning of period ($) | Purchases ($) | Sales Proceeds ($) | Dividend Income ($) | Realized Gain /loss ($) | Change in Unrealized appreciation (depreciation) ($) | Value, end of period ($) |
| Fidelity Select Cayman Gold Ltd. | 13,353,169 | - | 2,474,914 | - | 1,074,938 | (2,387,059) | 9,566,134 |
Other Affiliated Issuers
An affiliated company is a company in which the Fund has ownership of at least 5% of the voting securities. Fiscal year to date transactions with companies which are or were affiliates are as follows:
| Affiliate | Value, beginning of period ($) | Purchases ($) | Sales Proceeds ($) | Dividend Income ($) | Realized Gain (loss) ($) | Change in Unrealized appreciation (depreciation) ($) | Value, end of period ($) |
| Ascot Resources Ltd. | 17,199,211 | 3,907,938 | - | - | - | (14,254,444) | 6,852,705 |
| Bonterra Resources, Inc. | 6,011,834 | - | - | - | - | (3,950,846) | 3,483,458 |
| Bonterra Resources, Inc. | 1,352,663 | - | - | - | - | 69,807 | - |
| Fury Gold Mines Ltd. | - | 6,328,113 | - | - | - | (2,332,986) | 3,995,127 |
| Gatos Silver, Inc. | 16,850,000 | 3,173,371 | - | - | - | (1,783,371) | 18,240,000 |
| Gold Standard Ventures Corp. | 10,256,410 | 767,541 | 11,621,826 | - | (12,324,901) | 12,922,776 | - |
| i-80 Gold Corp. | 21,696,252 | - | - | - | - | (3,803,078) | 17,893,174 |
| i-80 Gold Corp. | - | - | - | - | - | (818,353) | 4,473,293 |
| i-80 Gold Corp. | 5,369,822 | - | - | - | - | (78,176) | - |
| i-80 Gold Corp. warrants 9/30/22 | 76,880 | - | - | - | - | (76,875) | 5 |
| Maple Gold Mines Ltd. | 5,285,996 | - | - | - | - | (2,544,914) | 2,741,082 |
| Orla Mining Ltd. | 51,692,308 | 12,624,098 | - | - | - | (9,163,553) | 55,152,853 |
| Pure Gold Mining, Inc. | 16,173,570 | - | 4,101,640 | - | (24,122,553) | 12,050,623 | - |
| Pure Gold Mining, Inc. warrants 3/28/23 | 58,434 | - | - | - | - | (58,423) | - |
| Western Copper & Gold Corp. (TSX) | 14,327,416 | - | - | - | - | (4,154,956) | 10,172,460 |
| Total | 166,350,796 | 26,801,061 | 15,723,466 | - | (36,447,454) | (17,976,769) | 123,004,157 |
Investment Valuation
The following is a summary of the inputs used, as of August 31, 2022, involving the Fund's assets and liabilities carried at fair value. The inputs or methodology used for valuing securities may not be an indication of the risk associated with investing in those securities. For more information on valuation inputs, and their aggregation into the levels used below, please refer to the Investment Valuation section in the accompanying Notes to Consolidated Financial Statements.
| Valuation Inputs at Reporting Date: |
| Description | Total ($) | Level 1 ($) | Level 2 ($) | Level 3 ($) |
Investments in Securities: | | | | |
|
| Common Stocks | 1,164,165,197 | 1,012,057,636 | 152,107,561 | - |
|
| Commodities | 9,546,895 | 9,546,895 | - | - |
|
| Money Market Funds | 265,836,256 | 265,836,256 | - | - |
| Total Investments in Securities: | 1,439,548,348 | 1,287,440,787 | 152,107,561 | - |
Gold Portfolio
| Consolidated Statement of Assets and Liabilities |
| | | | August 31, 2022 (Unaudited) |
| | | | | |
| Assets | | | | |
| Investment in securities, at value (including securities loaned of $240,112,282) - See accompanying schedule: | | $1,041,161,040 | | |
Unaffiliated issuers (cost $923,156,618) | | | |
Fidelity Central Funds (cost $265,836,256) | | 265,836,256 | | |
Commodities (cost $4,575,085) | | 9,546,895 | | |
Other affiliated issuers (cost $134,529,806) | | 123,004,157 | | |
| | | | | |
| Total Investment in Securities (cost $1,328,097,765) | | | $ | 1,439,548,348 |
| Cash | | | | 19,681 |
| Foreign currency held at value (cost $121,732) | | | | 120,382 |
| Receivable for investments sold | | | | 4,597,102 |
| Receivable for fund shares sold | | | | 1,390,439 |
| Dividends receivable | | | | 3,607,695 |
| Distributions receivable from Fidelity Central Funds | | | | 98,455 |
| Prepaid expenses | | | | 6,242 |
| Other receivables | | | | 170,225 |
Total assets | | | | 1,449,558,569 |
| Liabilities | | | | |
| Payable for fund shares redeemed | | 1,412,157 | | |
| Accrued management fee | | 570,958 | | |
| Distribution and service plan fees payable | | 48,154 | | |
| Other affiliated payables | | 259,845 | | |
| Other payables and accrued expenses | | 182,829 | | |
| Collateral on securities loaned | | 257,359,279 | | |
| Total Liabilities | | | | 259,833,222 |
| Net Assets | | | $ | 1,189,725,347 |
| Net Assets consist of: | | | | |
| Paid in capital | | | $ | 2,611,848,326 |
| Total accumulated earnings (loss) | | | | (1,422,122,979) |
| Net Assets | | | $ | 1,189,725,347 |
| | | | | |
| Net Asset Value and Maximum Offering Price | | | | |
| Class A : | | | | |
Net Asset Value and redemption price per share ($64,053,539 ÷ 3,534,465 shares) (a) | | | $ | 18.12 |
| Maximum offering price per share (100/94.25 of $18.12) | | | $ | 19.23 |
| Class M : | | | | |
Net Asset Value and redemption price per share ($20,252,635 ÷ 1,146,949 shares) (a) | | | $ | 17.66 |
| Maximum offering price per share (100/96.50 of $17.66) | | | $ | 18.30 |
| Class C : | | | | |
Net Asset Value and offering price per share ($27,010,920 ÷ 1,620,332 shares) (a) | | | $ | 16.67 |
| Gold : | | | | |
Net Asset Value , offering price and redemption price per share ($907,360,823 ÷ 48,399,958 shares) | | | $ | 18.75 |
| Class I : | | | | |
Net Asset Value , offering price and redemption price per share ($96,621,032 ÷ 5,153,306 shares) | | | $ | 18.75 |
| Class Z : | | | | |
Net Asset Value , offering price and redemption price per share ($74,426,398 ÷ 3,965,407 shares) | | | $ | 18.77 |
(a)Redemption price per share is equal to net asset value less any applicable contingent deferred sales charge. |
| Consolidated Statement of Operations |
| | | | Six months ended August 31, 2022 (Unaudited) |
| Investment Income | | | | |
| Dividends | | | $ | 16,768,689 |
| Income from Fidelity Central Funds (including $480,364 from security lending) | | | | 559,415 |
| Income before foreign taxes withheld | | | | 17,328,104 |
| Less foreign taxes withheld | | | | (1,628,038) |
| Total Income | | | | 15,700,066 |
| Expenses | | | | |
| Management fee | $ | 4,308,711 | | |
| Transfer agent fees | | 1,455,322 | | |
| Distribution and service plan fees | | 363,429 | | |
| Accounting fees | | 358,436 | | |
| Custodian fees and expenses | | 42,682 | | |
| Independent trustees' fees and expenses | | 2,698 | | |
| Registration fees | | 89,825 | | |
| Audit | | 31,192 | | |
| Legal | | 491 | | |
| Interest | | 749 | | |
| Miscellaneous | | 5,297 | | |
| Total expenses before reductions | | 6,658,832 | | |
| Expense reductions | | (28,161) | | |
| Total expenses after reductions | | | | 6,630,671 |
| Net Investment income (loss) | | | | 9,069,395 |
| Realized and Unrealized Gain (Loss) | | | | |
| Net realized gain (loss) on: | | | | |
| Investments: | | | | |
| Unaffiliated issuers | | (34,639,759) | | |
| Affiliated issuers | | (36,447,454) | | |
| Commodities | | 998,453 | | |
| Foreign currency transactions | | 55,356 | | |
| Total net realized gain (loss) | | | | (70,033,404) |
| Change in net unrealized appreciation (depreciation) on: | | | | |
| Investments: | | | | |
| Investments | | (468,304,324) | | |
| Affiliated issuers | | (17,976,780) | | |
| Assets and liabilities in foreign currencies | | (48,181) | | |
| Commodities | | (2,309,700) | | |
| Total change in net unrealized appreciation (depreciation) | | | | (488,638,985) |
| Net gain (loss) | | | | (558,672,389) |
| Net increase (decrease) in net assets resulting from operations | | | $ | (549,602,994) |
| Consolidated Statement of Changes in Net Assets |
| |
| | Six months ended August 31, 2022 (Unaudited) | | Year ended February 28, 2022 |
| Increase (Decrease) in Net Assets | | | | |
| Operations | | | | |
| Net investment income (loss) | $ | 9,069,395 | $ | 23,266,597 |
| Net realized gain (loss) | | (70,033,404) | | 68,341,551 |
| Change in net unrealized appreciation (depreciation) | | (488,638,985) | | 70,246,590 |
| Net increase (decrease) in net assets resulting from operations | | (549,602,994) | | 161,854,738 |
| Distributions to shareholders | | (5,320,281) | | (27,126,849) |
| Share transactions - net increase (decrease) | | (4,802,862) | | (106,344,853) |
| Total increase (decrease) in net assets | | (559,726,137) | | 28,383,036 |
| | | | | |
| Net Assets | | | | |
| Beginning of period | | 1,749,451,484 | | 1,721,068,448 |
| End of period | $ | 1,189,725,347 | $ | 1,749,451,484 |
| | | | | |
| | | | | |
| Fidelity Advisor® Gold Fund Class A |
| |
| | Six months ended (Unaudited) August 31, 2022 | | Years ended February 28, 2022 | | 2021 | | 2020 A | | 2019 | | 2018 |
Selected Per-Share Data | | | | | | | | | | | | |
| Net asset value, beginning of period | $ | 26.27 | $ | 24.15 | $ | 21.67 | $ | 18.52 | $ | 18.30 | $ | 20.54 |
| Income from Investment Operations | | | | | | | | | | | | |
Net investment income (loss) B,C | | .10 | | .27 D | | (.04) | | (.01) E | | (.03) | | (.12) |
| Net realized and unrealized gain (loss) | | (8.18) | | 2.20 | | 3.74 | | 3.20 | | .25 | | (2.09) |
| Total from investment operations | | (8.08) | | 2.47 | | 3.70 | | 3.19 | | .22 | | (2.21) |
| Distributions from net investment income | | (.07) | | (.35) | | (1.22) | | (.01) | | - | | - |
| Distributions from net realized gain | | - | | - | | - | | (.03) | | - | | (.03) |
| Total distributions | | (.07) | | (.35) | | (1.22) | | (.04) | | - | | (.03) |
| Net asset value, end of period | $ | 18.12 | $ | 26.27 | $ | 24.15 | $ | 21.67 | $ | 18.52 | $ | 18.30 |
Total Return F,G,H | | (30.86)% | | 10.37% | | 16.59% | | 17.23% | | 1.20% | | (10.77)% |
Ratios to Average Net Assets C,I,J | | | | | | | | | | | | |
| Expenses before reductions | | 1.08% K | | 1.07% | | 1.08% | | 1.13% | | 1.19% | | 1.18% |
| Expenses net of fee waivers, if any | | 1.08% K | | 1.07% | | 1.08% | | 1.13% | | 1.18% | | 1.16% |
| Expenses net of all reductions | | 1.08% K | | 1.07% | | 1.07% | | 1.12% | | 1.18% | | 1.16% |
| Net investment income (loss) | | .84% K | | 1.02% D | | (.12)% | | (.05)% E | | (.15)% | | (.58)% |
| Supplemental Data | | | | | | | | | | | | |
| Net assets, end of period (000 omitted) | $ | 64,054 | $ | 86,977 | $ | 82,989 | $ | 64,971 | $ | 50,479 | $ | 61,703 |
Portfolio turnover rate L | | 50% K | | 38% | | 46% | | 56% | | 37% | | 13% |
A For the year ended February 29.
B Calculated based on average shares outstanding during the period.
C Net investment income (loss) is affected by the timing of the declaration of dividends by any underlying mutual funds or exchange-traded funds (ETFs). Net investment income (loss) of any such underlying funds is not included in the Fund's net investment income (loss) ratio.
D Net investment income per share reflects one or more large, non-recurring dividend(s) which amounted to $.12 per share. Excluding such non-recurring dividend(s), the ratio of net investment income (loss) to average net assets would have been .57%.
E Net investment income per share reflects one or more large, non-recurring dividend(s) which amounted to $.05 per share. Excluding such non-recurring dividend(s), the ratio of net investment income (loss) to average net assets would have been (.26)%.
F Total returns for periods of less than one year are not annualized.
G Total returns would have been lower if certain expenses had not been reduced during the applicable periods shown.
H Total returns do not include the effect of the sales charges.
I Fees and expenses of any underlying mutual funds or exchange-traded funds (ETFs) are not included in the Fund's expense ratio. The Fund indirectly bears its proportionate share of these expenses. For additional expense information related to investments in Fidelity Central Funds, please refer to the "Investments in Fidelity Central Funds" note found in the Notes to Financial Statements section of the most recent Annual or Semi-Annual report.
J Expense ratios reflect operating expenses of the class. Expenses before reductions do not reflect amounts reimbursed, waived, or reduced through arrangements with the investment adviser, brokerage services, or other offset arrangements, if applicable, and do not represent the amount paid by the class during periods when reimbursements, waivers or reductions occur.
K Annualized
L Amount does not include the portfolio activity of any underlying mutual funds or exchange-traded funds (ETFs).
| Fidelity Advisor® Gold Fund Class M |
| |
| | Six months ended (Unaudited) August 31, 2022 | | Years ended February 28, 2022 | | 2021 | | 2020 A | | 2019 | | 2018 |
Selected Per-Share Data | | | | | | | | | | | | |
| Net asset value, beginning of period | $ | 25.63 | $ | 23.57 | $ | 21.16 | $ | 18.11 | $ | 17.94 | $ | 20.19 |
| Income from Investment Operations | | | | | | | | | | | | |
Net investment income (loss) B,C | | .07 | | .19 D | | (.12) | | (.07) E | | (.07) | | (.17) |
| Net realized and unrealized gain (loss) | | (7.98) | | 2.16 | | 3.67 | | 3.12 | | .24 | | (2.05) |
| Total from investment operations | | (7.91) | | 2.35 | | 3.55 | | 3.05 | | .17 | | (2.22) |
| Distributions from net investment income | | (.06) | | (.29) | | (1.14) | | - | | - | | - |
| Distributions from net realized gain | | - | | - | | - | | - | | - | | (.03) |
| Total distributions | | (.06) | | (.29) | | (1.14) | | - | | - | | (.03) |
| Net asset value, end of period | $ | 17.66 | $ | 25.63 | $ | 23.57 | $ | 21.16 | $ | 18.11 | $ | 17.94 |
Total Return F,G,H | | (30.96)% | | 10.08% | | 16.28% | | 16.84% | | .95% | | (11.04)% |
Ratios to Average Net Assets C,I,J | | | | | | | | | | | | |
| Expenses before reductions | | 1.36% K | | 1.36% | | 1.37% | | 1.42% | | 1.48% | | 1.48% |
| Expenses net of fee waivers, if any | | 1.36% K | | 1.35% | | 1.37% | | 1.42% | | 1.46% | | 1.47% |
| Expenses net of all reductions | | 1.36% K | | 1.35% | | 1.36% | | 1.41% | | 1.46% | | 1.47% |
| Net investment income (loss) | | .56% K | | .74% D | | (.42)% | | (.34)% E | | (.43)% | | (.88)% |
| Supplemental Data | | | | | | | | | | | | |
| Net assets, end of period (000 omitted) | $ | 20,253 | $ | 26,201 | $ | 24,535 | $ | 19,620 | $ | 17,401 | $ | 19,355 |
Portfolio turnover rate L | | 50% K | | 38% | | 46% | | 56% | | 37% | | 13% |
A For the year ended February 29.
B Calculated based on average shares outstanding during the period.
C Net investment income (loss) is affected by the timing of the declaration of dividends by any underlying mutual funds or exchange-traded funds (ETFs). Net investment income (loss) of any such underlying funds is not included in the Fund's net investment income (loss) ratio.
D Net investment income per share reflects one or more large, non-recurring dividend(s) which amounted to $.11 per share. Excluding such non-recurring dividend(s), the ratio of net investment income (loss) to average net assets would have been .29%.
E Net investment income per share reflects one or more large, non-recurring dividend(s) which amounted to $.04 per share. Excluding such non-recurring dividend(s), the ratio of net investment income (loss) to average net assets would have been (.56)%.
F Total returns for periods of less than one year are not annualized.
G Total returns would have been lower if certain expenses had not been reduced during the applicable periods shown.
H Total returns do not include the effect of the sales charges.
I Fees and expenses of any underlying mutual funds or exchange-traded funds (ETFs) are not included in the Fund's expense ratio. The Fund indirectly bears its proportionate share of these expenses. For additional expense information related to investments in Fidelity Central Funds, please refer to the "Investments in Fidelity Central Funds" note found in the Notes to Financial Statements section of the most recent Annual or Semi-Annual report.
J Expense ratios reflect operating expenses of the class. Expenses before reductions do not reflect amounts reimbursed, waived, or reduced through arrangements with the investment adviser, brokerage services, or other offset arrangements, if applicable, and do not represent the amount paid by the class during periods when reimbursements, waivers or reductions occur.
K Annualized
L Amount does not include the portfolio activity of any underlying mutual funds or exchange-traded funds (ETFs).
| Fidelity Advisor® Gold Fund Class C |
| |
| | Six months ended (Unaudited) August 31, 2022 | | Years ended February 28, 2022 | | 2021 | | 2020 A | | 2019 | | 2018 |
Selected Per-Share Data | | | | | | | | | | | | |
| Net asset value, beginning of period | $ | 24.24 | $ | 22.30 | $ | 20.07 | $ | 17.24 | $ | 17.15 | $ | 19.36 |
| Income from Investment Operations | | | | | | | | | | | | |
Net investment income (loss) B,C | | .02 | | .08 D | | (.22) | | (.14) E | | (.13) | | (.24) |
| Net realized and unrealized gain (loss) | | (7.54) | | 2.05 | | 3.49 | | 2.97 | | .22 | | (1.95) |
| Total from investment operations | | (7.52) | | 2.13 | | 3.27 | | 2.83 | | .09 | | (2.19) |
| Distributions from net investment income | | (.05) | | (.19) | | (1.04) | | - | | - | | - |
| Distributions from net realized gain | | - | | - | | - | | - | | - | | (.02) |
| Total distributions | | (.05) | | (.19) | | (1.04) | | - | | - | | (.02) |
| Net asset value, end of period | $ | 16.67 | $ | 24.24 | $ | 22.30 | $ | 20.07 | $ | 17.24 | $ | 17.15 |
Total Return F,G,H | | (31.12)% | | 9.62% | | 15.81% | | 16.42% | | .52% | | (11.35)% |
Ratios to Average Net Assets C,I,J | | | | | | | | | | | | |
| Expenses before reductions | | 1.79% K | | 1.77% | | 1.78% | | 1.80% | | 1.84% | | 1.85% |
| Expenses net of fee waivers, if any | | 1.78% K | | 1.77% | | 1.78% | | 1.80% | | 1.83% | | 1.83% |
| Expenses net of all reductions | | 1.78% K | | 1.77% | | 1.77% | | 1.79% | | 1.83% | | 1.83% |
| Net investment income (loss) | | .14% K | | .32% D | | (.83)% | | (.72)% E | | (.80)% | | (1.25)% |
| Supplemental Data | | | | | | | | | | | | |
| Net assets, end of period (000 omitted) | $ | 27,011 | $ | 43,031 | $ | 51,195 | $ | 52,375 | $ | 67,760 | $ | 92,724 |
Portfolio turnover rate L | | 50% K | | 38% | | 46% | | 56% | | 37% | | 13% |
A For the year ended February 29.
B Calculated based on average shares outstanding during the period.
C Net investment income (loss) is affected by the timing of the declaration of dividends by any underlying mutual funds or exchange-traded funds (ETFs). Net investment income (loss) of any such underlying funds is not included in the Fund's net investment income (loss) ratio.
D Net investment income per share reflects one or more large, non-recurring dividend(s) which amounted to $.11 per share. Excluding such non-recurring dividend(s), the ratio of net investment income (loss) to average net assets would have been (.12)%.
E Net investment income per share reflects one or more large, non-recurring dividend(s) which amounted to $.04 per share. Excluding such non-recurring dividend(s), the ratio of net investment income (loss) to average net assets would have been (.94)%.
F Total returns for periods of less than one year are not annualized.
G Total returns would have been lower if certain expenses had not been reduced during the applicable periods shown.
H Total returns do not include the effect of the contingent deferred sales charge.
I Fees and expenses of any underlying mutual funds or exchange-traded funds (ETFs) are not included in the Fund's expense ratio. The Fund indirectly bears its proportionate share of these expenses. For additional expense information related to investments in Fidelity Central Funds, please refer to the "Investments in Fidelity Central Funds" note found in the Notes to Financial Statements section of the most recent Annual or Semi-Annual report.
J Expense ratios reflect operating expenses of the class. Expenses before reductions do not reflect amounts reimbursed, waived, or reduced through arrangements with the investment adviser, brokerage services, or other offset arrangements, if applicable, and do not represent the amount paid by the class during periods when reimbursements, waivers or reductions occur.
K Annualized
L Amount does not include the portfolio activity of any underlying mutual funds or exchange-traded funds (ETFs).
| | Six months ended (Unaudited) August 31, 2022 | | Years ended February 28, 2022 | | 2021 | | 2020 A | | 2019 | | 2018 |
Selected Per-Share Data | | | | | | | | | | | | |
| Net asset value, beginning of period | $ | 27.14 | $ | 24.93 | $ | 22.33 | $ | 19.07 | $ | 18.78 | $ | 21.02 |
| Income from Investment Operations | | | | | | | | | | | | |
Net investment income (loss) B,C | | .14 | | .36 D | | .06 | | .06 E | | .03 | | (.05) |
| Net realized and unrealized gain (loss) | | (8.45) | | 2.27 | | 3.84 | | 3.30 | | .26 | | (2.14) |
| Total from investment operations | | (8.31) | | 2.63 | | 3.90 | | 3.36 | | .29 | | (2.19) |
| Distributions from net investment income | | (.08) | | (.42) | | (1.30) | | (.06) | | - | | - |
| Distributions from net realized gain | | - | | - | | - | | (.03) | | - | | (.05) |
| Total distributions | | (.08) | | (.42) | | (1.30) | | (.10) F | | - | | (.05) |
| Net asset value, end of period | $ | 18.75 | $ | 27.14 | $ | 24.93 | $ | 22.33 | $ | 19.07 | $ | 18.78 |
Total Return G,H | | (30.73)% | | 10.71% | | 16.96% | | 17.60% | | 1.54% | | (10.47)% |
Ratios to Average Net Assets C,I,J | | | | | | | | | | | | |
| Expenses before reductions | | .77% K | | .76% | | .76% | | .79% | | .86% | | .86% |
| Expenses net of fee waivers, if any | | .77% K | | .76% | | .76% | | .79% | | .85% | | .85% |
| Expenses net of all reductions | | .77% K | | .76% | | .75% | | .78% | | .85% | | .84% |
| Net investment income (loss) | | 1.15% K | | 1.33% D | | .19% | | .29% E | | .18% | | (.26)% |
| Supplemental Data | | | | | | | | | | | | |
| Net assets, end of period (000 omitted) | $ | 907,361 | $ | 1,330,602 | $ | 1,319,440 | $ | 1,292,204 | $ | 1,035,697 | $ | 1,011,412 |
Portfolio turnover rate L | | 50% K | | 38% | | 46% | | 56% | | 37% | | 13% |
A For the year ended February 29.
B Calculated based on average shares outstanding during the period.
C Net investment income (loss) is affected by the timing of the declaration of dividends by any underlying mutual funds or exchange-traded funds (ETFs). Net investment income (loss) of any such underlying funds is not included in the Fund's net investment income (loss) ratio.
D Net investment income per share reflects one or more large, non-recurring dividend(s) which amounted to $.12 per share. Excluding such non-recurring dividend(s), the ratio of net investment income (loss) to average net assets would have been .89%.
E Net investment income per share reflects one or more large, non-recurring dividend(s) which amounted to $.05 per share. Excluding such non-recurring dividend(s), the ratio of net investment income (loss) to average net assets would have been .07%.
F Total distributions per share do not sum due to rounding.
G Total returns for periods of less than one year are not annualized.
H Total returns would have been lower if certain expenses had not been reduced during the applicable periods shown.
I Fees and expenses of any underlying mutual funds or exchange-traded funds (ETFs) are not included in the Fund's expense ratio. The Fund indirectly bears its proportionate share of these expenses. For additional expense information related to investments in Fidelity Central Funds, please refer to the "Investments in Fidelity Central Funds" note found in the Notes to Financial Statements section of the most recent Annual or Semi-Annual report.
J Expense ratios reflect operating expenses of the class. Expenses before reductions do not reflect amounts reimbursed, waived, or reduced through arrangements with the investment adviser, brokerage services, or other offset arrangements, if applicable, and do not represent the amount paid by the class during periods when reimbursements, waivers or reductions occur.
K Annualized
L Amount does not include the portfolio activity of any underlying mutual funds or exchange-traded funds (ETFs).
| Fidelity Advisor® Gold Fund Class I |
| |
| | Six months ended (Unaudited) August 31, 2022 | | Years ended February 28, 2022 | | 2021 | | 2020 A | | 2019 | | 2018 |
Selected Per-Share Data | | | | | | | | | | | | |
| Net asset value, beginning of period | $ | 27.15 | $ | 24.93 | $ | 22.33 | $ | 19.07 | $ | 18.78 | $ | 21.02 |
| Income from Investment Operations | | | | | | | | | | | | |
Net investment income (loss) B,C | | .14 | | .36 D | | .05 | | .06 E | | .04 | | (.05) |
| Net realized and unrealized gain (loss) | | (8.46) | | 2.27 | | 3.85 | | 3.30 | | .25 | | (2.14) |
| Total from investment operations | | (8.32) | | 2.63 | | 3.90 | | 3.36 | | .29 | | (2.19) |
| Distributions from net investment income | | (.08) | | (.41) | | (1.30) | | (.07) | | - | | - |
| Distributions from net realized gain | | - | | - | | - | | (.03) | | - | | (.05) |
| Total distributions | | (.08) | | (.41) | | (1.30) | | (.10) | | - | | (.05) |
| Net asset value, end of period | $ | 18.75 | $ | 27.15 | $ | 24.93 | $ | 22.33 | $ | 19.07 | $ | 18.78 |
Total Return F,G | | (30.76)% | | 10.74% | | 16.96% | | 17.60% | | 1.54% | | (10.47)% |
Ratios to Average Net Assets C,H,I | | | | | | | | | | | | |
| Expenses before reductions | | .78% J | | .76% | | .77% | | .79% | | .84% | | .85% |
| Expenses net of fee waivers, if any | | .77% J | | .76% | | .77% | | .79% | | .82% | | .83% |
| Expenses net of all reductions | | .77% J | | .76% | | .76% | | .77% | | .82% | | .83% |
| Net investment income (loss) | | 1.15% J | | 1.33% D | | .18% | | .30% E | | .21% | | (.24)% |
| Supplemental Data | | | | | | | | | | | | |
| Net assets, end of period (000 omitted) | $ | 96,621 | $ | 152,799 | $ | 137,617 | $ | 115,699 | $ | 84,956 | $ | 61,677 |
Portfolio turnover rate K | | 50% J | | 38% | | 46% | | 56% | | 37% | | 13% |
A For the year ended February 29.
B Calculated based on average shares outstanding during the period.
C Net investment income (loss) is affected by the timing of the declaration of dividends by any underlying mutual funds or exchange-traded funds (ETFs). Net investment income (loss) of any such underlying funds is not included in the Fund's net investment income (loss) ratio.
D Net investment income per share reflects one or more large, non-recurring dividend(s) which amounted to $.12 per share. Excluding such non-recurring dividend(s), the ratio of net investment income (loss) to average net assets would have been .89%.
E Net investment income per share reflects one or more large, non-recurring dividend(s) which amounted to $.05 per share. Excluding such non-recurring dividend(s), the ratio of net investment income (loss) to average net assets would have been .08%.
F Total returns for periods of less than one year are not annualized.
G Total returns would have been lower if certain expenses had not been reduced during the applicable periods shown.
H Fees and expenses of any underlying mutual funds or exchange-traded funds (ETFs) are not included in the Fund's expense ratio. The Fund indirectly bears its proportionate share of these expenses. For additional expense information related to investments in Fidelity Central Funds, please refer to the "Investments in Fidelity Central Funds" note found in the Notes to Financial Statements section of the most recent Annual or Semi-Annual report.
I Expense ratios reflect operating expenses of the class. Expenses before reductions do not reflect amounts reimbursed, waived, or reduced through arrangements with the investment adviser, brokerage services, or other offset arrangements, if applicable, and do not represent the amount paid by the class during periods when reimbursements, waivers or reductions occur.
J Annualized
K Amount does not include the portfolio activity of any underlying mutual funds or exchange-traded funds (ETFs).
| Fidelity Advisor® Gold Fund Class Z |
| |
| | Six months ended (Unaudited) August 31, 2022 | | Years ended February 28, 2022 | | 2021 | | 2020 A | | 2019 B |
Selected Per-Share Data | | | | | | | | | | |
| Net asset value, beginning of period | $ | 27.16 | $ | 24.94 | $ | 22.34 | $ | 19.08 | $ | 16.62 |
| Income from Investment Operations | | | | | | | | | | |
Net investment income (loss) C,D | | .16 | | .40 E | | .09 | | .10 F | | .07 |
| Net realized and unrealized gain (loss) | | (8.46) | | 2.27 | | 3.85 | | 3.29 | | 2.39 |
| Total from investment operations | | (8.30) | | 2.67 | | 3.94 | | 3.39 | | 2.46 |
| Distributions from net investment income | | (.09) | | (.45) | | (1.34) | | (.10) | | - |
| Distributions from net realized gain | | - | | - | | - | | (.03) | | - |
| Total distributions | | (.09) | | (.45) | | (1.34) | | (.13) | | - |
| Net asset value, end of period | $ | 18.77 | $ | 27.16 | $ | 24.94 | $ | 22.34 | $ | 19.08 |
Total Return G,H | | (30.70)% | | 10.88% | | 17.12% | | 17.75% | | 14.80% |
Ratios to Average Net Assets D,I,J | | | | | | | | | | |
| Expenses before reductions | | .63% K | | .63% | | .64% | | .65% | | .68% K |
| Expenses net of fee waivers, if any | | .63% K | | .62% | | .64% | | .64% | | .68% K |
| Expenses net of all reductions | | .63% K | | .62% | | .62% | | .63% | | .67% K |
| Net investment income (loss) | | 1.29% K | | 1.47% E | | .32% | | .44% F | | .97% K |
| Supplemental Data | | | | | | | | | | |
| Net assets, end of period (000 omitted) | $ | 74,426 | $ | 109,842 | $ | 105,293 | $ | 95,076 | $ | 3,037 |
Portfolio turnover rate L | | 50% K | | 38% | | 46% | | 56% | | 37% K |
A For the year ended February 29.
B For the period October 2, 2018 (commencement of sale of shares) through February 28, 2019.
C Calculated based on average shares outstanding during the period.
D Net investment income (loss) is affected by the timing of the declaration of dividends by any underlying mutual funds or exchange-traded funds (ETFs). Net investment income (loss) of any such underlying funds is not included in the Fund's net investment income (loss) ratio.
E Net investment income per share reflects one or more large, non-recurring dividend(s) which amounted to $.12 per share. Excluding such non-recurring dividend(s), the ratio of net investment income (loss) to average net assets would have been 1.02%.
F Net investment income per share reflects one or more large, non-recurring dividend(s) which amounted to $.05 per share. Excluding such non-recurring dividend(s), the ratio of net investment income (loss) to average net assets would have been .22%.
G Total returns for periods of less than one year are not annualized.
H Total returns would have been lower if certain expenses had not been reduced during the applicable periods shown.
I Fees and expenses of any underlying mutual funds or exchange-traded funds (ETFs) are not included in the Fund's expense ratio. The Fund indirectly bears its proportionate share of these expenses. For additional expense information related to investments in Fidelity Central Funds, please refer to the "Investments in Fidelity Central Funds" note found in the Notes to Financial Statements section of the most recent Annual or Semi-Annual report.
J Expense ratios reflect operating expenses of the class. Expenses before reductions do not reflect amounts reimbursed, waived, or reduced through arrangements with the investment adviser, brokerage services, or other offset arrangements, if applicable, and do not represent the amount paid by the class during periods when reimbursements, waivers or reductions occur.
K Annualized
L Amount does not include the portfolio activity of any underlying mutual funds or exchange-traded funds (ETFs).
For the period ended August 31, 2022
1. Organization.
Gold Portfolio (the Fund) is a non-diversified fund of Fidelity Select Portfolios (the Trust) and is authorized to issue an unlimited number of shares. The Trust is registered under the Investment Company Act of 1940, as amended (the 1940 Act), as an open-end management investment company organized as a Massachusetts business trust. The Fund invests primarily in securities of companies whose principal business activities fall within specific industries. The Fund offers Class A, Class M, Class C, Gold, Class I and Class Z shares, each of which has equal rights as to assets and voting privileges. Each class has exclusive voting rights with respect to matters that affect that class. Class C shares will automatically convert to Class A shares after a holding period of eight years from the initial date of purchase, with certain exceptions.
2. Consolidated Subsidiary.
The Funds included in the table below hold certain commodity-related investments through a wholly owned subsidiary (the "Subsidiary"). As of period end, the investments in the Subsidiaries, were as follows:
| | Subsidiary Name | $ Amount | % of Fund's Net Assets |
| Gold Portfolio | Fidelity Select Gold Cayman Ltd. | 9,566,134 | .8 |
The financial statements have been consolidated to include the Subsidiary accounts where applicable. Accordingly, all inter-company transactions and balances have been eliminated.
3. Investments in Fidelity Central Funds.
Funds may invest in Fidelity Central Funds, which are open-end investment companies generally available only to other investment companies and accounts managed by the investment adviser and its affiliates. The Consolidated Schedule of Investments lists any Fidelity Central Funds held as an investment as of period end, but does not include the underlying holdings of each Fidelity Central Fund. An investing fund indirectly bears its proportionate share of the expenses of the underlying Fidelity Central Funds.
Based on its investment objective, each Fidelity Central Fund may invest or participate in various investment vehicles or strategies that are similar to those of the investing fund. These strategies are consistent with the investment objectives of the investing fund and may involve certain economic risks which may cause a decline in value of each of the Fidelity Central Funds and thus a decline in the value of the investing fund.
| Fidelity Central Fund | Investment Manager | Investment Objective | Investment Practices | Expense Ratio A |
| Fidelity Money Market Central Funds | Fidelity Management & Research Company LLC (FMR) | Each fund seeks to obtain a high level of current income consistent with the preservation of capital and liquidity. | Short-term Investments | Less than .005% |
A Expenses expressed as a percentage of average net assets and are as of each underlying Central Fund's most recent annual or semi-annual shareholder report.
A complete unaudited list of holdings for each Fidelity Central Fund is available upon request or at the Securities and Exchange Commission website at www.sec.gov. In addition, the financial statements of the Fidelity Central Funds which contain the significant accounting policies (including investment valuation policies) of those funds, and are not covered by the Report of Independent Registered Public Accounting Firm, are available on the Securities and Exchange Commission website or upon request.
4. Significant Accounting Policies.
The Fund is an investment company and applies the accounting and reporting guidance of the Financial Accounting Standards Board (FASB) Accounting Standards Codification Topic 946 Financial Services - Investment Companies . The consolidated financial statements have been prepared in conformity with accounting principles generally accepted in the United States of America (GAAP), which require management to make certain estimates and assumptions at the date of the financial statements. Actual results could differ from those estimates. Subsequent events, if any, through the date that the financial statements were issued have been evaluated in the preparation of the financial statements. The Fund's Consolidated Schedule of Investments lists any underlying mutual funds or exchange-traded funds (ETFs) but does not include the underlying holdings of these funds. The following summarizes the significant accounting policies of the Fund:
Investment Valuation. Investments are valued as of 4:00 p.m. Eastern time on the last calendar day of the period. The Board of Trustees (the Board) has delegated the day to day responsibility for the valuation of the Fund's investments to the Fair Value Committee (the Committee) established by the Fund's investment adviser. In accordance with valuation policies and procedures approved by the Board, the Fund attempts to obtain prices from one or more third party pricing vendors or brokers to value its investments. When current market prices, quotations or currency exchange rates are not readily available or reliable, investments will be fair valued in good faith by the Committee, in accordance with procedures adopted by the Board. Factors used in determining fair value vary by investment type and may include market or investment specific events. The frequency with which these procedures are used cannot be predicted and they may be utilized to a significant extent. The Committee oversees the Fund's valuation policies and procedures and reports to the Board on the Committee's activities and fair value determinations. The Board monitors the appropriateness of the procedures used in valuing the Fund's investments and ratifies the fair value determinations of the Committee.
The Fund categorizes the inputs to valuation techniques used to value its investments into a disclosure hierarchy consisting of three levels as shown below:
Level 1 - unadjusted quoted prices in active markets for identical investments
Level 2 - other significant observable inputs (including quoted prices for similar investments, interest rates, prepayment speeds, etc.)
Level 3 - unobservable inputs (including the Fund's own assumptions based on the best information available)
Valuation techniques used to value the Fund's investments by major category are as follows:
Equity securities, including restricted securities, for which market quotations are readily available, are valued at the last reported sale price or official closing price as reported by a third party pricing vendor on the primary market or exchange on which they are traded and are categorized as Level 1 in the hierarchy. In the event there were no sales during the day or closing prices are not available, securities are valued at the last quoted bid price or may be valued using the last available price and are generally categorized as Level 2 in the hierarchy. For foreign equity securities, when market or security specific events arise, comparisons to the valuation of American Depositary Receipts (ADRs), futures contracts, Exchange-Traded Funds (ETFs) and certain indexes as well as quoted prices for similar securities may be used and would be categorized as Level 2 in the hierarchy. For equity securities, including restricted securities, where observable inputs are limited, assumptions about market activity and risk are used and these securities may be categorized as Level 3 in the hierarchy.
Investments in commodities are valued at their last traded price at 4:00 p.m. Eastern time each business day and are categorized as Level 1 in the hierarchy. Investments in open-end mutual funds, including the Fidelity Central Funds, are valued at their closing net asset value (NAV) each business day and are categorized as Level 1 in the hierarchy.
Changes in valuation techniques may result in transfers in or out of an assigned level within the disclosure hierarchy. The aggregate value of investments by input level as of August 31, 2022 is included at the end of the Fund's Consolidated Schedule of Investments.
Foreign Currency. Certain Funds may use foreign currency contracts to facilitate transactions in foreign-denominated securities. Gains and losses from these transactions may arise from changes in the value of the foreign currency or if the counterparties do not perform under the contracts' terms.
Foreign-denominated assets, including investment securities, and liabilities are translated into U.S. dollars at the exchange rates at period end. Purchases and sales of investment securities, income and dividends received, and expenses denominated in foreign currencies are translated into U.S. dollars at the exchange rate in effect on the transaction date.
The effects of exchange rate fluctuations on investments are included with the net realized and unrealized gain (loss) on investment securities. Other foreign currency transactions resulting in realized and unrealized gain (loss) are disclosed separately.
Investment Transactions and Income. For financial reporting purposes, the Fund's investment holdings and NAV include trades executed through the end of the last business day of the period. The NAV per share for processing shareholder transactions is calculated as of the close of business of the New York Stock Exchange (NYSE), normally 4:00 p.m. Eastern time and includes trades executed through the end of the prior business day. Gains and losses on securities sold are determined on the basis of identified cost and include proceeds received from litigation. Commissions paid to certain brokers with whom the investment adviser, or its affiliates, places trades on behalf of a fund include an amount in addition to trade execution, which may be rebated back to a fund. Any such rebates are included in net realized gain (loss) on investments in the Consolidated Statement of Operations. Dividend income is recorded on the ex-dividend date, except for certain dividends from foreign securities where the ex-dividend date may have passed, which are recorded as soon as the Fund is informed of the ex-dividend date. Non-cash dividends included in dividend income, if any, are recorded at the fair market value of the securities received. Income and capital gain distributions from Fidelity Central Funds, if any, are recorded on the ex-dividend date. Interest income is accrued as earned and includes coupon interest and amortization of premium and accretion of discount on debt securities as applicable. Investment income is recorded net of foreign taxes withheld where recovery of such taxes is uncertain.
Class Allocations and Expenses. Investment income, realized and unrealized capital gains and losses, common expenses of a fund, and certain fund-level expense reductions, if any, are allocated daily on a pro-rata basis to each class based on the relative net assets of each class to the total net assets of a fund. Each class differs with respect to transfer agent and distribution and service plan fees incurred, as applicable. Certain expense reductions may also differ by class, if applicable. For the reporting period, the allocated portion of income and expenses to each class as a percent of its average net assets may vary due to the timing of recording these transactions in relation to fluctuating net assets of the classes. Expenses directly attributable to a fund are charged to that fund. Expenses attributable to more than one fund are allocated among the respective funds on the basis of relative net assets or other appropriate methods. Expenses included in the accompanying financial statements reflect the expenses of that fund and do not include any expenses associated with any underlying mutual funds or exchange-traded funds. Although not included in a fund's expenses, a fund indirectly bears its proportionate share of these expenses through the net asset value of each underlying mutual fund or exchange-traded fund. Expense estimates are accrued in the period to which they relate and adjustments are made when actual amounts are known.
Deferred Trustee Compensation. Under a Deferred Compensation Plan (the Plan) for certain Funds, certain independent Trustees have elected to defer receipt of a portion of their annual compensation. Deferred amounts are invested in affiliated mutual funds, are marked-to-market and remain in a fund until distributed in accordance with the Plan. The investment of deferred amounts and the offsetting payable to the Trustees presented below are included in the accompanying Consolidated Statement of Assets and Liabilities in other receivables and other payables and accrued expenses, as applicable.
Income Tax Information and Distributions to Shareholders. Each year, the Fund intends to qualify as a regulated investment company under Subchapter M of the Internal Revenue Code, including distributing substantially all of its taxable income and realized gains. As a result, no provision for U.S. Federal income taxes is required. The Fund files a U.S. federal tax return, in addition to state and local tax returns as required. The Fund's federal income tax returns are subject to examination by the Internal Revenue Service (IRS) for a period of three fiscal years after they are filed. State and local tax returns may be subject to examination for an additional fiscal year depending on the jurisdiction. Foreign taxes are provided for based on the Fund's understanding of the tax rules and rates that exist in the foreign markets in which it invests.
The Subsidiary is classified as a controlled foreign corporation under Subchapter N of the Internal Revenue Code. Therefore, the Fund is required to increase its taxable income by its share of the Subsidiary's income. Net investment losses of the Subsidiary cannot be deducted by the Fund in the current period nor carried forward to offset taxable income in future periods.
Distributions are declared and recorded on the ex-dividend date. Income and capital gain distributions are declared separately for each class. Income and capital gain distributions are determined in accordance with income tax regulations, which may differ from GAAP.
Capital accounts within the consolidated financial statements are adjusted for permanent book-tax differences. These adjustments have no impact on net assets or the results of operations. Capital accounts are not adjusted for temporary book-tax differences which will reverse in a subsequent period.
Book-tax differences are primarily due to foreign currency transactions, passive foreign investment companies (PFIC), controlled foreign corporations, deferred Trustees compensation, capital loss carryforwards and losses deferred due to wash sales and excise tax regulations.
As of period end, the cost and unrealized appreciation (depreciation) in securities, and derivatives if applicable, for federal income tax purposes were as follows:
| Gross unrealized appreciation | $ 297,711,750 |
| Gross unrealized depreciation | (257,678,332) |
| Net unrealized appreciation (depreciation) | $ 40,033,418 |
| Tax cost | $1,399,514,930 |
Capital loss carryforwards are only available to offset future capital gains of the Fund to the extent provided by regulations and may be limited. The capital loss carryforward information presented below, including any applicable limitation, is estimated as of prior fiscal period end and is subject to adjustment.
| Short-term | $(199,931,688) |
| Long-term | (1,152,157,943) |
| Total capital loss carryforward | $(1,352,089,631) |
Restricted Securities (including Private Placements). Funds may invest in securities that are subject to legal or contractual restrictions on resale. These securities generally may be resold in transactions exempt from registration or to the public if the securities are registered. Disposal of these securities may involve time-consuming negotiations and expense, and prompt sale at an acceptable price may be difficult. Information regarding restricted securities held at period end is included at the end of the Consolidated Schedule of Investments, if applicable.
5. Purchases and Sales of Investments.
Purchases and sales of securities, other than short-term securities and in-kind transactions, as applicable, are noted in the table below.
| | Purchases ($) | Sales ($) |
| Gold Portfolio | 392,048,020 | 397,453,491 |
6. Fees and Other Transactions with Affiliates.
Management Fee. Fidelity Management & Research Company LLC (the investment adviser) and its affiliates provide the Fund with investment management related services for which the Fund pays a monthly management fee. The management fee is the sum of an individual fund fee rate that is based on an annual rate of .30% of the Fund's average net assets and an annualized group fee rate that averaged .23% during the period. The group fee rate is based upon the monthly average net assets of a group of registered investment companies with which the investment adviser has management contracts. The group fee rate decreases as assets under management increase and increases as assets under management decrease. For the reporting period, the total annualized management fee rate was .53% of the Fund's average net assets.
The investment adviser, either through itself or through an affiliate provides investment management related services to the Subsidiary. The Subsidiary does not pay the investment adviser a fee for these services. Under the management contract with the subsidiary, the investment adviser pays all other expenses of the Subsidiary, except custodian fees.
Distribution and Service Plan Fees. In accordance with Rule 12b-1 of the 1940 Act, the Fund has adopted separate Distribution and Service Plans for each class of shares. Certain classes pay Fidelity Distributors Company LLC (FDC), an affiliate of the investment adviser, separate Distribution and Service Fees, each of which is based on an annual percentage of each class' average net assets. In addition, FDC may pay financial intermediaries for selling shares of the Fund and providing shareholder support services. For the period, the Distribution and Service Fee rates, total fees and amounts retained by FDC were as follows:
| | Distribution Fee | Service Fee | Total Fees | Retained by FDC |
| Class A | - % | .25% | $ 104,538 | $ 1,372 |
| Class M | .25% | .25% | 64,643 | - |
| Class C | .75% | .25% | 194,248 | 13,853 |
| | | | $ 363,429 | $ 15,225 |
Sales Load. FDC may receive a front-end sales charge of up to 5.75% for selling Class A shares and 3.50% for selling Class M shares, some of which is paid to financial intermediaries for selling shares of the Fund. Depending on the holding period, FDC may receive contingent deferred sales charges levied on Class A, Class M and Class C redemptions. The deferred sales charges are 1.00% for Class C shares, 1.00% for certain purchases of Class A shares and .25% for certain purchases of Class M shares.
For the period, sales charge amounts retained by FDC were as follows:
| | Retained by FDC |
| Class A | $ 28,914 |
| Class M | 1,810 |
Class C A | 110 |
| | $ 30,834 |
A When Class C shares are initially sold, FDC pays commissions from its own resources to financial intermediaries through which the sales are made.
Transfer Agent Fees. Fidelity Investments Institutional Operations Company LLC (FIIOC), an affiliate of the investment adviser, is the transfer, dividend disbursing and shareholder servicing agent for each class of the Fund. FIIOC receives account fees and asset-based fees that vary according to the account size and type of account of the shareholders of the respective classes of the Fund, except for Class Z. FIIOC receives an asset-based fee of Class Z's average net assets. FIIOC pays for typesetting, printing and mailing of shareholder reports, except proxy statements.
For the period, transfer agent fees for each class were as follows:
| | Amount | % of Class-Level Average Net Assets A |
| Class A | $ 100,590 | .24 |
| Class M | 34,571 | .27 |
| Class C | 37,660 | .19 |
| Gold | 1,131,979 | .18 |
| Class I | 129,153 | .18 |
| Class Z | 21,369 | .04 |
| | $ 1,455,322 | |
A Annualized
Accounting Fees. Fidelity Service Company, Inc. (FSC), an affiliate of the investment adviser, maintains the Fund's accounting records. The accounting fee is based on the level of average net assets for each month. For the period, the fees were equivalent to the following annualized rates:
| | % of Average Net Assets |
| Gold Portfolio | .04 |
Brokerage Commissions. A portion of portfolio transactions were placed with brokerage firms which are affiliates of the investment adviser. Brokerage commissions are included in net realized gain (loss) and change in net unrealized appreciation (depreciation) in the Consolidated Statement of Operations. The commissions paid to these affiliated firms were as follows:
| | Amount |
| Gold Portfolio | $ 1,467 |
Interfund Lending Program. Pursuant to an Exemptive Order issued by the Securities and Exchange Commission (the SEC), the Fund, along with other registered investment companies having management contracts with Fidelity Management & Research Company LLC (FMR), or other affiliated entities of FMR, may participate in an interfund lending program. This program provides an alternative credit facility allowing the Fund to borrow from, or lend money to, other participating affiliated funds. At period end, there were no interfund loans outstanding. Activity in this program during the period for which loans were outstanding was as follows:
| | Borrower or Lender | Average Loan Balance | Weighted Average Interest Rate | Interest Expense |
| Gold Portfolio | Borrower | $ 5,253,500 | 2.57% | $ 749 |
Interfund Trades. Funds may purchase from or sell securities to other Fidelity Funds under procedures adopted by the Board. The procedures have been designed to ensure these interfund trades are executed in accordance with Rule 17a-7 of the 1940 Act. Any interfund trades are included within the respective purchases and sales amounts shown in the Purchases and Sales of Investments note. Interfund trades during the period are noted in the table below.
| | Purchases ($) | Sales ($) | Realized Gain (Loss) ($) |
| Gold Portfolio | 4,222,305 | 27,485,584 | 2,148,279 |
7. Committed Line of Credit.
Certain Funds participate with other funds managed by the investment adviser or an affiliate in a $4.25 billion credit facility (the "line of credit") to be utilized for temporary or emergency purposes to fund shareholder redemptions or for other short-term liquidity purposes. The participating funds have agreed to pay commitment fees on their pro-rata portion of the line of credit, which are reflected in Miscellaneous expenses on the Consolidated Statement of Operations, and are listed below. During the period, there were no borrowings on this line of credit.
| | Amount |
| Gold Portfolio | $ 1,528 |
8. Security Lending.
Funds lend portfolio securities from time to time in order to earn additional income. Lending agents are used, including National Financial Services (NFS), an affiliate of the investment adviser. Pursuant to a securities lending agreement, NFS will receive a fee, which is capped at 9.9% of a fund's daily lending revenue, for its services as lending agent. A fund may lend securities to certain qualified borrowers, including NFS. On the settlement date of the loan, a fund receives collateral (in the form of U.S. Treasury obligations, letters of credit and/or cash) against the loaned securities and maintains collateral in an amount not less than 100% of the market value of the loaned securities during the period of the loan. The market value of the loaned securities is determined at the close of business of a fund and any additional required collateral is delivered to a fund on the next business day. A fund or borrower may terminate the loan at any time, and if the borrower defaults on its obligation to return the securities loaned because of insolvency or other reasons, a fund may apply collateral received from the borrower against the obligation. A fund may experience delays and costs in recovering the securities loaned. Any cash collateral received is invested in the Fidelity Securities Lending Cash Central Fund. Any loaned securities are identified as such in the Consolidated Schedule of Investments, and the value of loaned securities and cash collateral at period end, as applicable, are presented in the Consolidated Statement of Assets and Liabilities. Security lending income represents the income earned on investing cash collateral, less rebates paid to borrowers and any lending agent fees associated with the loan, plus any premium payments received for lending certain types of securities. Security lending income is presented in the Consolidated Statement of Operations as a component of income from Fidelity Central Funds. Affiliated security lending activity, if any, was as follows:
| | Total Security Lending Fees Paid to NFS | Security Lending Income From Securities Loaned to NFS | Value of Securities Loaned to NFS at Period End |
| Gold Portfolio | $ 50,668 | $ - | $- |
9. Expense Reductions.
During the period the investment adviser or an affiliate reimbursed and/or waived a portion of fund-level operating expenses in the amount of $28,161.
10. Distributions to Shareholders.
Distributions to shareholders of each class were as follows:
| | Six months ended August 31, 2022 | Year ended February 28, 2022 |
| Gold Portfolio | | |
| Distributions to shareholders | | |
| Class A | $ 236,581 | $1,159,197 |
| Class M | 64,063 | 296,704 |
| Class C | 82,259 | 340,514 |
| Gold | 4,119,368 | 21,360,877 |
| Class I | 460,437 | 2,173,450 |
| Class Z | 357,573 | 1,796,107 |
Total | $ 5,320,281 | $ 27,126,849 |
11. Share Transactions.
Share transactions for each class were as follows and may contain in-kind transactions, automatic conversions between classes or exchanges between affiliated funds:
| | Shares | Shares | Dollars | Dollars |
| | Six months ended August 31, 2022 | Year ended February 28, 2022 | Six months ended August 31, 2022 | Year ended February 28, 2022 |
| Gold Portfolio | | | | |
| Class A | | | | |
| Shares sold | 756,006 | 1,096,721 | $ 19,424,981 | $ 29,272,417 |
| Reinvestment of distributions | 7,775 | 47,654 | 230,842 | 1,130,833 |
| Shares redeemed | (539,903) | (1,270,387) | (13,408,439) | (33,037,200) |
| Net increase (decrease) | 223,878 | (126,012) | $ 6,247,384 | $ (2,633,950) |
| Class M | | | | |
| Shares sold | 279,813 | 261,284 | $ 6,680,993 | $ 6,743,876 |
| Reinvestment of distributions | 2,211 | 12,798 | 64,030 | 296,405 |
| Shares redeemed | (157,479) | (292,712) | (3,640,197) | (7,361,263) |
| Net increase (decrease) | 124,545 | (18,630) | $ 3,104,826 | $ (320,982) |
| Class C | | | | |
| Shares sold | 236,936 | 196,401 | $ 5,986,935 | $ 4,759,229 |
| Reinvestment of distributions | 2,997 | 15,464 | 82,054 | 339,121 |
| Shares redeemed | (395,166) | (732,472) | (8,737,298) | (17,728,207) |
| Net increase (decrease) | (155,233) | (520,607) | $ (2,668,309) | $ (12,629,857) |
| Gold | | | | |
| Shares sold | 9,461,485 | 15,683,398 | $ 256,055,527 | $ 428,540,719 |
| Reinvestment of distributions | 128,260 | 836,569 | 3,933,734 | 20,495,942 |
| Shares redeemed | (10,208,755) | (20,431,260) | (261,832,105) | (537,992,891) |
| Net increase (decrease) | (619,010) | (3,911,293) | $ (1,842,844) | $ (88,956,230) |
| Class I | | | | |
| Shares sold | 946,190 | 1,719,405 | $ 25,039,488 | $ 46,014,104 |
| Reinvestment of distributions | 14,570 | 85,689 | 447,009 | 2,100,234 |
| Shares redeemed | (1,435,868) | (1,696,668) | (34,896,642) | (45,357,188) |
| Net increase (decrease) | (475,108) | 108,426 | $ (9,410,145) | $ 2,757,150 |
| Class Z | | | | |
| Shares sold | 1,008,904 | 1,719,289 | $ 27,197,539 | $ 46,800,221 |
| Reinvestment of distributions | 11,475 | 72,350 | 352,174 | 1,773,309 |
| Shares redeemed | (1,099,047) | (1,969,124) | (27,783,487) | (53,134,514) |
| Net increase (decrease) | (78,668) | (177,485) | $ (233,774) | $ (4,560,984) |
12. Other.
A fund's organizational documents provide former and current trustees and officers with a limited indemnification against liabilities arising in connection with the performance of their duties to the fund. In the normal course of business, a fund may also enter into contracts that provide general indemnifications. A fund's maximum exposure under these arrangements is unknown as this would be dependent on future claims that may be made against a fund. The risk of material loss from such claims is considered remote.
13. Risk and Uncertainties.
Many factors affect a fund's performance. Developments that disrupt global economies and financial markets, such as pandemics, epidemics, outbreaks of infectious diseases, war, terrorism, and environmental disasters, may significantly affect a fund's investment performance. The effects of these developments to a fund will be impacted by the types of securities in which a fund invests, the financial condition, industry, economic sector, and geographic location of an issuer, and a fund's level of investment in the securities of that issuer.
Top Holdings (% of Fund's net assets) |
| |
| Linde PLC | 14.0 | |
| Air Products & Chemicals, Inc. | 5.5 | |
| CF Industries Holdings, Inc. | 5.5 | |
| Albemarle Corp. | 5.3 | |
| Sherwin-Williams Co. | 5.1 | |
| Corteva, Inc. | 4.6 | |
| Freeport-McMoRan, Inc. | 4.3 | |
| Ecolab, Inc. | 4.1 | |
| First Quantum Minerals Ltd. | 2.8 | |
| The Mosaic Co. | 2.8 | |
| | 54.0 | |
| |
| Industries (% of Fund's net assets) |
| |
| Chemicals | 70.1 | |
| Metals & Mining | 15.0 | |
| Containers & Packaging | 6.9 | |
| Construction Materials | 4.8 | |
| Paper & Forest Products | 1.3 | |
| |
Geographic Diversification (% of Fund's net assets) |
|
* Includes Short-Term investments and Net Other Assets (Liabilities). Percentages are based on country or territory of incorporation and are adjusted for the effect of futures contracts, if applicable. |
| |
Materials Portfolio
Showing Percentage of Net Assets
| Common Stocks - 98.1% |
| | | Shares | Value ($) |
| Chemicals - 70.1% | | | |
| Commodity Chemicals - 7.4% | | | |
| LyondellBasell Industries NV Class A | | 264,400 | 21,945,200 |
| Olin Corp. | | 447,800 | 24,476,748 |
| Tronox Holdings PLC | | 1,829,103 | 26,759,777 |
| | | | 73,181,725 |
| Diversified Chemicals - 0.7% | | | |
| Huntsman Corp. | | 229,200 | 6,422,184 |
| Fertilizers & Agricultural Chemicals - 16.3% | | | |
| CF Industries Holdings, Inc. | | 524,700 | 54,285,462 |
| Corteva, Inc. | | 753,311 | 46,275,895 |
| FMC Corp. | | 58,517 | 6,324,517 |
| Nutrien Ltd. | | 269,800 | 24,768,558 |
| The Mosaic Co. | | 515,100 | 27,748,437 |
| The Scotts Miracle-Gro Co. Class A (a) | | 41,800 | 2,798,510 |
| | | | 162,201,379 |
| Industrial Gases - 19.5% | | | |
| Air Products & Chemicals, Inc. | | 217,300 | 54,857,385 |
| Linde PLC | | 491,886 | 139,134,875 |
| | | | 193,992,260 |
| Specialty Chemicals - 26.2% | | | |
| Albemarle Corp. | | 196,300 | 52,600,548 |
| Ashland, Inc. | | 62,500 | 6,360,000 |
| DuPont de Nemours, Inc. | | 471,017 | 26,207,386 |
| Eastman Chemical Co. | | 70,400 | 6,406,400 |
| Ecolab, Inc. | | 250,410 | 41,024,670 |
| Element Solutions, Inc. | | 377,200 | 7,042,324 |
| International Flavors & Fragrances, Inc. | | 223,215 | 24,660,793 |
| Livent Corp. (a)(b) | | 319,297 | 10,274,977 |
| PPG Industries, Inc. | | 177,900 | 22,589,742 |
| RPM International, Inc. | | 111,200 | 10,359,392 |
| Sherwin-Williams Co. | | 217,300 | 50,435,330 |
| Wacker Chemie AG | | 10,970 | 1,566,002 |
| | | | 259,527,564 |
TOTAL CHEMICALS | | | 695,325,112 |
| Construction Materials - 4.8% | | | |
| Construction Materials - 4.8% | | | |
| Martin Marietta Materials, Inc. | | 59,800 | 20,793,058 |
| Summit Materials, Inc. (b) | | 196,400 | 5,581,688 |
| Vulcan Materials Co. | | 127,300 | 21,194,177 |
| | | | 47,568,923 |
| Containers & Packaging - 6.9% | | | |
| Metal & Glass Containers - 4.2% | | | |
| Aptargroup, Inc. | | 87,000 | 8,944,470 |
| Ball Corp. | | 192,000 | 10,715,520 |
| Crown Holdings, Inc. | | 191,559 | 17,353,330 |
| Greif, Inc. Class A | | 67,400 | 4,519,170 |
| | | | 41,532,490 |
| Paper Packaging - 2.7% | | | |
| Avery Dennison Corp. | | 96,900 | 17,792,778 |
| Sealed Air Corp. | | 169,200 | 9,104,652 |
| | | | 26,897,430 |
TOTAL CONTAINERS & PACKAGING | | | 68,429,920 |
| Metals & Mining - 15.0% | | | |
| Aluminum - 2.8% | | | |
| Alcoa Corp. | | 556,600 | 27,540,568 |
| Copper - 7.1% | | | |
| First Quantum Minerals Ltd. | | 1,581,600 | 27,986,739 |
| Freeport-McMoRan, Inc. | | 1,451,900 | 42,976,240 |
| | | | 70,962,979 |
| Gold - 1.1% | | | |
| Newmont Corp. | | 264,500 | 10,939,720 |
| Steel - 4.0% | | | |
| Commercial Metals Co. | | 309,100 | 12,521,641 |
| Reliance Steel & Aluminum Co. | | 102,200 | 19,211,556 |
| Steel Dynamics, Inc. | | 98,100 | 7,918,632 |
| | | | 39,651,829 |
TOTAL METALS & MINING | | | 149,095,096 |
| Paper & Forest Products - 1.3% | | | |
| Forest Products - 1.3% | | | |
| Louisiana-Pacific Corp. | | 157,900 | 8,562,917 |
| West Fraser Timber Co. Ltd. | | 53,900 | 4,822,210 |
| | | | 13,385,127 |
| TOTAL COMMON STOCKS (Cost $722,001,620) | | | 973,804,178 |
| | | | |
| Money Market Funds - 2.0% |
| | | Shares | Value ($) |
| Fidelity Cash Central Fund 2.33% (c) | | 6,817,278 | 6,818,642 |
| Fidelity Securities Lending Cash Central Fund 2.34% (c)(d) | | 13,123,318 | 13,124,630 |
| TOTAL MONEY MARKET FUNDS (Cost $19,943,272) | | | 19,943,272 |
| | | | |
| TOTAL INVESTMENT IN SECURITIES - 100.1% (Cost $741,944,892) | 993,747,450 |
NET OTHER ASSETS (LIABILITIES) - (0.1)% | (1,312,060) |
| NET ASSETS - 100.0% | 992,435,390 |
| | |
Legend
| (a) | Security or a portion of the security is on loan at period end. |
| (c) | Affiliated fund that is generally available only to investment companies and other accounts managed by Fidelity Investments. The rate quoted is the annualized seven-day yield of the fund at period end. A complete unaudited listing of the fund's holdings as of its most recent quarter end is available upon request. In addition, each Fidelity Central Fund's financial statements are available on the SEC's website or upon request. |
| (d) | Investment made with cash collateral received from securities on loan. |
Affiliated Central Funds
Fiscal year to date information regarding the Fund's investments in Fidelity Central Funds, including the ownership percentage, is presented below.
| Affiliate | Value, beginning of period ($) | Purchases ($) | Sales Proceeds ($) | Dividend Income ($) | Realized Gain (loss) ($) | Change in Unrealized appreciation (depreciation) ($) | Value, end of period ($) | %ownership, end of period |
| Fidelity Cash Central Fund 2.33% | 1,212,250 | 102,978,129 | 97,371,737 | 44,877 | - | - | 6,818,642 | 0.0% |
| Fidelity Securities Lending Cash Central Fund 2.34% | 20,127,155 | 96,714,684 | 103,717,209 | 6,386 | - | - | 13,124,630 | 0.0% |
| Total | 21,339,405 | 199,692,813 | 201,088,946 | 51,263 | - | - | 19,943,272 | |
| | | | | | | | | |
Amounts in the income column in the above table include any capital gain distributions from underlying funds, which are presented in the corresponding line item in the Statement of Operations, if applicable.
Amount for Fidelity Securities Lending Cash Central Fund represents the income earned on investing cash collateral, less rebates paid to borrowers and any lending agent fees associated with the loan, plus any premium payments received for lending certain types of securities.
Investment Valuation
The following is a summary of the inputs used, as of August 31, 2022, involving the Fund's assets and liabilities carried at fair value. The inputs or methodology used for valuing securities may not be an indication of the risk associated with investing in those securities. For more information on valuation inputs, and their aggregation into the levels used below, please refer to the Investment Valuation section in the accompanying Notes to Financial Statements.
| Valuation Inputs at Reporting Date: |
| Description | Total ($) | Level 1 ($) | Level 2 ($) | Level 3 ($) |
Investments in Securities: | | | | |
|
| Common Stocks | 973,804,178 | 973,804,178 | - | - |
|
| Money Market Funds | 19,943,272 | 19,943,272 | - | - |
| Total Investments in Securities: | 993,747,450 | 993,747,450 | - | - |
Materials Portfolio
| Statement of Assets and Liabilities |
| | | | August 31, 2022 (Unaudited) |
| | | | | |
| Assets | | | | |
| Investment in securities, at value (including securities loaned of $12,793,359) - See accompanying schedule: | | $973,804,178 | | |
Unaffiliated issuers (cost $722,001,620) | | | |
Fidelity Central Funds (cost $19,943,272) | | 19,943,272 | | |
| | | | | |
| Total Investment in Securities (cost $741,944,892) | | | $ | 993,747,450 |
| Foreign currency held at value (cost $1,615,688) | | | | 1,615,578 |
| Receivable for investments sold | | | | 43,519,287 |
| Receivable for fund shares sold | | | | 604,456 |
| Dividends receivable | | | | 1,952,122 |
| Distributions receivable from Fidelity Central Funds | | | | 14,876 |
| Prepaid expenses | | | | 7,647 |
| Other receivables | | | | 169,154 |
Total assets | | | | 1,041,630,570 |
| Liabilities | | | | |
| Payable for investments purchased | | 34,405,434 | | |
| Payable for fund shares redeemed | | 802,661 | | |
| Accrued management fee | | 455,511 | | |
| Distribution and service plan fees payable | | 56,344 | | |
| Other affiliated payables | | 175,242 | | |
| Other payables and accrued expenses | | 191,863 | | |
| Collateral on securities loaned | | 13,108,125 | | |
| Total Liabilities | | | | 49,195,180 |
| Net Assets | | | $ | 992,435,390 |
| Net Assets consist of: | | | | |
| Paid in capital | | | $ | 742,964,575 |
| Total accumulated earnings (loss) | | | | 249,470,815 |
| Net Assets | | | $ | 992,435,390 |
| | | | | |
| Net Asset Value and Maximum Offering Price | | | | |
| Class A : | | | | |
Net Asset Value and redemption price per share ($119,725,924 ÷ 1,289,195 shares) (a) | | | $ | 92.87 |
| Maximum offering price per share (100/94.25 of $92.87) | | | $ | 98.54 |
| Class M : | | | | |
Net Asset Value and redemption price per share ($34,470,070 ÷ 375,877 shares) (a) | | | $ | 91.71 |
| Maximum offering price per share (100/96.50 of $91.71) | | | $ | 95.04 |
| Class C : | | | | |
Net Asset Value and offering price per share ($17,852,870 ÷ 200,887 shares) (a) | | | $ | 88.87 |
| Materials : | | | | |
Net Asset Value , offering price and redemption price per share ($550,304,954 ÷ 5,882,659 shares) | | | $ | 93.55 |
| Class I : | | | | |
Net Asset Value , offering price and redemption price per share ($205,376,131 ÷ 2,200,233 shares) | | | $ | 93.34 |
| Class Z : | | | | |
Net Asset Value , offering price and redemption price per share ($64,705,441 ÷ 693,695 shares) | | | $ | 93.28 |
(a)Redemption price per share is equal to net asset value less any applicable contingent deferred sales charge. |
| Statement of Operations |
| | | | Six months ended August 31, 2022 (Unaudited) |
| Investment Income | | | | |
| Dividends | | | $ | 11,587,303 |
| Income from Fidelity Central Funds (including $6,386 from security lending) | | | | 51,263 |
| Total Income | | | | 11,638,566 |
| Expenses | | | | |
| Management fee | $ | 2,903,813 | | |
| Transfer agent fees | | 963,055 | | |
| Distribution and service plan fees | | 354,682 | | |
| Accounting fees | | 171,161 | | |
| Custodian fees and expenses | | 6,312 | | |
| Independent trustees' fees and expenses | | 1,794 | | |
| Registration fees | | 60,856 | | |
| Audit | | 21,630 | | |
| Legal | | 317 | | |
| Interest | | 201 | | |
| Miscellaneous | | 4,325 | | |
| Total expenses before reductions | | 4,488,146 | | |
| Expense reductions | | (18,264) | | |
| Total expenses after reductions | | | | 4,469,882 |
| Net Investment income (loss) | | | | 7,168,684 |
| Realized and Unrealized Gain (Loss) | | | | |
| Net realized gain (loss) on: | | | | |
| Investment Securities: | | | | |
| Unaffiliated issuers | | 33,137,927 | | |
| Foreign currency transactions | | (5,157) | | |
| Total net realized gain (loss) | | | | 33,132,770 |
| Change in net unrealized appreciation (depreciation) on: | | | | |
| Investment Securities: | | | | |
| Unaffiliated issuers | | (151,261,491) | | |
| Assets and liabilities in foreign currencies | | (27,714) | | |
| Total change in net unrealized appreciation (depreciation) | | | | (151,289,205) |
| Net gain (loss) | | | | (118,156,435) |
| Net increase (decrease) in net assets resulting from operations | | | $ | (110,987,751) |
| Statement of Changes in Net Assets |
| |
| | Six months ended August 31, 2022 (Unaudited) | | Year ended February 28, 2022 |
| Increase (Decrease) in Net Assets | | | | |
| Operations | | | | |
| Net investment income (loss) | $ | 7,168,684 | $ | 8,580,339 |
| Net realized gain (loss) | | 33,132,770 | | 32,188,411 |
| Change in net unrealized appreciation (depreciation) | | (151,289,205) | | 129,763,897 |
| Net increase (decrease) in net assets resulting from operations | | (110,987,751) | | 170,532,647 |
| Distributions to shareholders | | - | | (8,437,183) |
| Share transactions - net increase (decrease) | | (51,000,598) | | 72,770,453 |
| Total increase (decrease) in net assets | | (161,988,349) | | 234,865,917 |
| | | | | |
| Net Assets | | | | |
| Beginning of period | | 1,154,423,739 | | 919,557,822 |
| End of period | $ | 992,435,390 | $ | 1,154,423,739 |
| | | | | |
| | | | | |
| Fidelity Advisor® Materials Fund Class A |
| |
| | Six months ended (Unaudited) August 31, 2022 | | Years ended February 28, 2022 | | 2021 | | 2020 A | | 2019 | | 2018 |
Selected Per-Share Data | | | | | | | | | | | | |
| Net asset value, beginning of period | $ | 102.68 | $ | 87.03 | $ | 59.39 | $ | 69.57 | $ | 88.50 | $ | 81.27 |
| Income from Investment Operations | | | | | | | | | | | | |
Net investment income (loss) B,C | | .54 | | .46 | | .33 | | .58 | | .84 | | .55 |
| Net realized and unrealized gain (loss) | | (10.35) | | 15.77 | | 27.72 | | (10.10) | | (12.01) | | 11.18 |
| Total from investment operations | | (9.81) | | 16.23 | | 28.05 | | (9.52) | | (11.17) | | 11.73 |
| Distributions from net investment income | | - | | (.58) | | (.41) | | (.66) | | (.67) | | (.50) |
| Distributions from net realized gain | | - | | - | | - | | - | | (7.09) | | (4.00) |
| Total distributions | | - | | (.58) | | (.41) | | (.66) | | (7.76) | | (4.50) |
| Net asset value, end of period | $ | 92.87 | $ | 102.68 | $ | 87.03 | $ | 59.39 | $ | 69.57 | $ | 88.50 |
Total Return D,E,F | | (9.55)% | | 18.64% | | 47.27% | | (13.81)% | | (12.59)% | | 14.65% |
Ratios to Average Net Assets C,G,H | | | | | | | | | | | | |
| Expenses before reductions | | 1.03% I | | 1.03% | | 1.08% | | 1.08% | | 1.06% | | 1.07% |
| Expenses net of fee waivers, if any | | 1.02% I | | 1.03% | | 1.08% | | 1.08% | | 1.06% | | 1.07% |
| Expenses net of all reductions | | 1.02% I | | 1.03% | | 1.08% | | 1.07% | | 1.05% | | 1.06% |
| Net investment income (loss) | | 1.09% I | | .46% | | .48% | | .87% | | 1.08% | | .64% |
| Supplemental Data | | | | | | | | | | | | |
| Net assets, end of period (000 omitted) | $ | 119,726 | $ | 138,219 | $ | 101,238 | $ | 76,869 | $ | 126,182 | $ | 201,933 |
Portfolio turnover rate J | | 24% I | | 43% | | 36% | | 69% | | 77% K | | 67% |
A For the year ended February 29.
B Calculated based on average shares outstanding during the period.
C Net investment income (loss) is affected by the timing of the declaration of dividends by any underlying mutual funds or exchange-traded funds (ETFs). Net investment income (loss) of any such underlying funds is not included in the Fund's net investment income (loss) ratio.
D Total returns for periods of less than one year are not annualized.
E Total returns would have been lower if certain expenses had not been reduced during the applicable periods shown.
F Total returns do not include the effect of the sales charges.
G Fees and expenses of any underlying mutual funds or exchange-traded funds (ETFs) are not included in the Fund's expense ratio. The Fund indirectly bears its proportionate share of these expenses. For additional expense information related to investments in Fidelity Central Funds, please refer to the "Investments in Fidelity Central Funds" note found in the Notes to Financial Statements section of the most recent Annual or Semi-Annual report.
H Expense ratios reflect operating expenses of the class. Expenses before reductions do not reflect amounts reimbursed, waived, or reduced through arrangements with the investment adviser, brokerage services, or other offset arrangements, if applicable, and do not represent the amount paid by the class during periods when reimbursements, waivers or reductions occur.
I Annualized
J Amount does not include the portfolio activity of any underlying mutual funds or exchange-traded funds (ETFs).
K Portfolio turnover rate excludes securities received or delivered in-kind.
| Fidelity Advisor® Materials Fund Class M |
| |
| | Six months ended (Unaudited) August 31, 2022 | | Years ended February 28, 2022 | | 2021 | | 2020 A | | 2019 | | 2018 |
Selected Per-Share Data | | | | | | | | | | | | |
| Net asset value, beginning of period | $ | 101.52 | $ | 86.14 | $ | 58.84 | $ | 68.98 | $ | 87.79 | $ | 80.66 |
| Income from Investment Operations | | | | | | | | | | | | |
Net investment income (loss) B,C | | .41 | | .20 | | .14 | | .39 | | .61 | | .30 |
| Net realized and unrealized gain (loss) | | (10.22) | | 15.59 | | 27.42 | | (10.01) | | (11.88) | | 11.08 |
| Total from investment operations | | (9.81) | | 15.79 | | 27.56 | | (9.62) | | (11.27) | | 11.38 |
| Distributions from net investment income | | - | | (.41) | | (.26) | | (.52) | | (.45) | | (.25) |
| Distributions from net realized gain | | - | | - | | - | | - | | (7.09) | | (4.00) |
| Total distributions | | - | | (.41) | | (.26) | | (.52) | | (7.54) | | (4.25) |
| Net asset value, end of period | $ | 91.71 | $ | 101.52 | $ | 86.14 | $ | 58.84 | $ | 68.98 | $ | 87.79 |
Total Return D,E,F | | (9.66)% | | 18.32% | | 46.86% | | (14.05)% | | (12.84)% | | 14.30% |
Ratios to Average Net Assets C,G,H | | | | | | | | | | | | |
| Expenses before reductions | | 1.28% I | | 1.29% | | 1.36% | | 1.37% | | 1.35% | | 1.36% |
| Expenses net of fee waivers, if any | | 1.28% I | | 1.29% | | 1.36% | | 1.36% | | 1.35% | | 1.36% |
| Expenses net of all reductions | | 1.28% I | | 1.29% | | 1.36% | | 1.36% | | 1.34% | | 1.35% |
| Net investment income (loss) | | .83% I | | .20% | | .21% | | .58% | | .79% | | .35% |
| Supplemental Data | | | | | | | | | | | | |
| Net assets, end of period (000 omitted) | $ | 34,470 | $ | 37,100 | $ | 24,768 | $ | 19,423 | $ | 27,436 | $ | 40,107 |
Portfolio turnover rate J | | 24% I | | 43% | | 36% | | 69% | | 77% K | | 67% |
A For the year ended February 29.
B Calculated based on average shares outstanding during the period.
C Net investment income (loss) is affected by the timing of the declaration of dividends by any underlying mutual funds or exchange-traded funds (ETFs). Net investment income (loss) of any such underlying funds is not included in the Fund's net investment income (loss) ratio.
D Total returns for periods of less than one year are not annualized.
E Total returns would have been lower if certain expenses had not been reduced during the applicable periods shown.
F Total returns do not include the effect of the sales charges.
G Fees and expenses of any underlying mutual funds or exchange-traded funds (ETFs) are not included in the Fund's expense ratio. The Fund indirectly bears its proportionate share of these expenses. For additional expense information related to investments in Fidelity Central Funds, please refer to the "Investments in Fidelity Central Funds" note found in the Notes to Financial Statements section of the most recent Annual or Semi-Annual report.
H Expense ratios reflect operating expenses of the class. Expenses before reductions do not reflect amounts reimbursed, waived, or reduced through arrangements with the investment adviser, brokerage services, or other offset arrangements, if applicable, and do not represent the amount paid by the class during periods when reimbursements, waivers or reductions occur.
I Annualized
J Amount does not include the portfolio activity of any underlying mutual funds or exchange-traded funds (ETFs).
K Portfolio turnover rate excludes securities received or delivered in-kind.
| Fidelity Advisor® Materials Fund Class C |
| |
| | Six months ended (Unaudited) August 31, 2022 | | Years ended February 28, 2022 | | 2021 | | 2020 A | | 2019 | | 2018 |
Selected Per-Share Data | | | | | | | | | | | | |
| Net asset value, beginning of period | $ | 98.63 | $ | 83.76 | $ | 57.30 | $ | 67.13 | $ | 85.52 | $ | 78.72 |
| Income from Investment Operations | | | | | | | | | | | | |
Net investment income (loss) B,C | | .16 | | (.28) | | (.18) | | .08 | | .25 | | (.09) |
| Net realized and unrealized gain (loss) | | (9.92) | | 15.15 | | 26.64 | | (9.76) | | (11.50) | | 10.80 |
| Total from investment operations | | (9.76) | | 14.87 | | 26.46 | | (9.68) | | (11.25) | | 10.71 |
| Distributions from net investment income | | - | | - | | - | | (.15) | | (.04) | | (.02) |
| Distributions from net realized gain | | - | | - | | - | | - | | (7.09) | | (3.89) |
| Total distributions | | - | | - | | - | | (.15) | | (7.14) D | | (3.91) |
| Net asset value, end of period | $ | 88.87 | $ | 98.63 | $ | 83.76 | $ | 57.30 | $ | 67.13 | $ | 85.52 |
Total Return E,F,G | | (9.90)% | | 17.75% | | 46.18% | | (14.46)% | | (13.24)% | | 13.78% |
Ratios to Average Net Assets C,H,I | | | | | | | | | | | | |
| Expenses before reductions | | 1.78% J | | 1.78% | | 1.83% | | 1.82% | | 1.81% | | 1.82% |
| Expenses net of fee waivers, if any | | 1.78% J | | 1.78% | | 1.83% | | 1.82% | | 1.81% | | 1.82% |
| Expenses net of all reductions | | 1.78% J | | 1.78% | | 1.83% | | 1.81% | | 1.79% | | 1.82% |
| Net investment income (loss) | | .34% J | | (.29)% | | (.27)% | | .12% | | .33% | | (.11)% |
| Supplemental Data | | | | | | | | | | | | |
| Net assets, end of period (000 omitted) | $ | 17,853 | $ | 21,261 | $ | 23,296 | $ | 24,239 | $ | 51,659 | $ | 85,792 |
Portfolio turnover rate K | | 24% J | | 43% | | 36% | | 69% | | 77% L | | 67% |
A For the year ended February 29.
B Calculated based on average shares outstanding during the period.
C Net investment income (loss) is affected by the timing of the declaration of dividends by any underlying mutual funds or exchange-traded funds (ETFs). Net investment income (loss) of any such underlying funds is not included in the Fund's net investment income (loss) ratio.
D Total distributions per share do not sum due to rounding.
E Total returns for periods of less than one year are not annualized.
F Total returns would have been lower if certain expenses had not been reduced during the applicable periods shown.
G Total returns do not include the effect of the contingent deferred sales charge.
H Fees and expenses of any underlying mutual funds or exchange-traded funds (ETFs) are not included in the Fund's expense ratio. The Fund indirectly bears its proportionate share of these expenses. For additional expense information related to investments in Fidelity Central Funds, please refer to the "Investments in Fidelity Central Funds" note found in the Notes to Financial Statements section of the most recent Annual or Semi-Annual report.
I Expense ratios reflect operating expenses of the class. Expenses before reductions do not reflect amounts reimbursed, waived, or reduced through arrangements with the investment adviser, brokerage services, or other offset arrangements, if applicable, and do not represent the amount paid by the class during periods when reimbursements, waivers or reductions occur.
J Annualized
K Amount does not include the portfolio activity of any underlying mutual funds or exchange-traded funds (ETFs).
L Portfolio turnover rate excludes securities received or delivered in-kind.
| | Six months ended (Unaudited) August 31, 2022 | | Years ended February 28, 2022 | | 2021 | | 2020 A | | 2019 | | 2018 |
Selected Per-Share Data | | | | | | | | | | | | |
| Net asset value, beginning of period | $ | 103.29 | $ | 87.46 | $ | 59.63 | $ | 69.84 | $ | 88.90 | $ | 81.64 |
| Income from Investment Operations | | | | | | | | | | | | |
Net investment income (loss) B,C | | .68 | | .75 | | .53 | | .77 | | 1.06 | | .79 |
| Net realized and unrealized gain (loss) | | (10.42) | | 15.86 | | 27.87 | | (10.14) | | (12.09) | | 11.24 |
| Total from investment operations | | (9.74) | | 16.61 | | 28.40 | | (9.37) | | (11.03) | | 12.03 |
| Distributions from net investment income | | - | | (.78) | | (.57) | | (.84) | | (.93) | | (.77) |
| Distributions from net realized gain | | - | | - | | - | | - | | (7.09) | | (4.00) |
| Total distributions | | - | | (.78) | | (.57) | | (.84) | | (8.03) D | | (4.77) |
| Net asset value, end of period | $ | 93.55 | $ | 103.29 | $ | 87.46 | $ | 59.63 | $ | 69.84 | $ | 88.90 |
Total Return E,F | | (9.43)% | | 18.98% | | 47.68% | | (13.57)% | | (12.35)% | | 14.96% |
Ratios to Average Net Assets C,G,H | | | | | | | | | | | | |
| Expenses before reductions | | .75% I | | .75% | | .80% | | .80% | | .79% | | .79% |
| Expenses net of fee waivers, if any | | .75% I | | .74% | | .80% | | .80% | | .79% | | .79% |
| Expenses net of all reductions | | .75% I | | .74% | | .80% | | .79% | | .78% | | .79% |
| Net investment income (loss) | | 1.36% I | | .75% | | .76% | | 1.14% | | 1.35% | | .91% |
| Supplemental Data | | | | | | | | | | | | |
| Net assets, end of period (000 omitted) | $ | 550,305 | $ | 645,773 | $ | 533,073 | $ | 405,668 | $ | 626,759 | $ | 1,043,704 |
Portfolio turnover rate J | | 24% I | | 43% | | 36% | | 69% | | 77% K | | 67% |
A For the year ended February 29.
B Calculated based on average shares outstanding during the period.
C Net investment income (loss) is affected by the timing of the declaration of dividends by any underlying mutual funds or exchange-traded funds (ETFs). Net investment income (loss) of any such underlying funds is not included in the Fund's net investment income (loss) ratio.
D Total distributions per share do not sum due to rounding.
E Total returns for periods of less than one year are not annualized.
F Total returns would have been lower if certain expenses had not been reduced during the applicable periods shown.
G Fees and expenses of any underlying mutual funds or exchange-traded funds (ETFs) are not included in the Fund's expense ratio. The Fund indirectly bears its proportionate share of these expenses. For additional expense information related to investments in Fidelity Central Funds, please refer to the "Investments in Fidelity Central Funds" note found in the Notes to Financial Statements section of the most recent Annual or Semi-Annual report.
H Expense ratios reflect operating expenses of the class. Expenses before reductions do not reflect amounts reimbursed, waived, or reduced through arrangements with the investment adviser, brokerage services, or other offset arrangements, if applicable, and do not represent the amount paid by the class during periods when reimbursements, waivers or reductions occur.
I Annualized
J Amount does not include the portfolio activity of any underlying mutual funds or exchange-traded funds (ETFs).
K Portfolio turnover rate excludes securities received or delivered in-kind.
| Fidelity Advisor® Materials Fund Class I |
| |
| | Six months ended (Unaudited) August 31, 2022 | | Years ended February 28, 2022 | | 2021 | | 2020 A | | 2019 | | 2018 |
Selected Per-Share Data | | | | | | | | | | | | |
| Net asset value, beginning of period | $ | 103.07 | $ | 87.29 | $ | 59.52 | $ | 69.70 | $ | 88.73 | $ | 81.49 |
| Income from Investment Operations | | | | | | | | | | | | |
Net investment income (loss) B,C | | .68 | | .74 | | .55 | | .78 | | 1.07 | | .80 |
| Net realized and unrealized gain (loss) | | (10.41) | | 15.83 | | 27.80 | | (10.12) | | (12.08) | | 11.22 |
| Total from investment operations | | (9.73) | | 16.57 | | 28.35 | | (9.34) | | (11.01) | | 12.02 |
| Distributions from net investment income | | - | | (.79) | | (.58) | | (.84) | | (.93) | | (.78) |
| Distributions from net realized gain | | - | | - | | - | | - | | (7.09) | | (4.00) |
| Total distributions | | - | | (.79) | | (.58) | | (.84) | | (8.02) | | (4.78) |
| Net asset value, end of period | $ | 93.34 | $ | 103.07 | $ | 87.29 | $ | 59.52 | $ | 69.70 | $ | 88.73 |
Total Return D,E | | (9.44)% | | 18.97% | | 47.70% | | (13.55)% | | (12.34)% | | 14.97% |
Ratios to Average Net Assets C,F,G | | | | | | | | | | | | |
| Expenses before reductions | | .76% H | | .75% | | .78% | | .79% | | .78% | | .79% |
| Expenses net of fee waivers, if any | | .76% H | | .75% | | .78% | | .79% | | .78% | | .79% |
| Expenses net of all reductions | | .76% H | | .75% | | .78% | | .78% | | .77% | | .78% |
| Net investment income (loss) | | 1.36% H | | .74% | | .78% | | 1.16% | | 1.36% | | .92% |
| Supplemental Data | | | | | | | | | | | | |
| Net assets, end of period (000 omitted) | $ | 205,376 | $ | 238,282 | $ | 190,132 | $ | 137,887 | $ | 254,240 | $ | 511,062 |
Portfolio turnover rate I | | 24% H | | 43% | | 36% | | 69% | | 77% J | | 67% |
A For the year ended February 29.
B Calculated based on average shares outstanding during the period.
C Net investment income (loss) is affected by the timing of the declaration of dividends by any underlying mutual funds or exchange-traded funds (ETFs). Net investment income (loss) of any such underlying funds is not included in the Fund's net investment income (loss) ratio.
D Total returns for periods of less than one year are not annualized.
E Total returns would have been lower if certain expenses had not been reduced during the applicable periods shown.
F Fees and expenses of any underlying mutual funds or exchange-traded funds (ETFs) are not included in the Fund's expense ratio. The Fund indirectly bears its proportionate share of these expenses. For additional expense information related to investments in Fidelity Central Funds, please refer to the "Investments in Fidelity Central Funds" note found in the Notes to Financial Statements section of the most recent Annual or Semi-Annual report.
G Expense ratios reflect operating expenses of the class. Expenses before reductions do not reflect amounts reimbursed, waived, or reduced through arrangements with the investment adviser, brokerage services, or other offset arrangements, if applicable, and do not represent the amount paid by the class during periods when reimbursements, waivers or reductions occur.
H Annualized
I Amount does not include the portfolio activity of any underlying mutual funds or exchange-traded funds (ETFs).
J Portfolio turnover rate excludes securities received or delivered in-kind.
| Fidelity Advisor® Materials Fund Class Z |
| |
| | Six months ended (Unaudited) August 31, 2022 | | Years ended February 28, 2022 | | 2021 | | 2020 A | | 2019 B |
Selected Per-Share Data | | | | | | | | | | |
| Net asset value, beginning of period | $ | 102.92 | $ | 87.14 | $ | 59.40 | $ | 69.58 | $ | 79.81 |
| Income from Investment Operations | | | | | | | | | | |
Net investment income (loss) C,D | | .75 | | .88 | | .67 | | .88 | | .62 |
| Net realized and unrealized gain (loss) | | (10.39) | | 15.81 | | 27.75 | | (10.10) | | (6.96) |
| Total from investment operations | | (9.64) | | 16.69 | | 28.42 | | (9.22) | | (6.34) |
| Distributions from net investment income | | - | | (.91) | | (.68) | | (.96) | | (.96) |
| Distributions from net realized gain | | - | | - | | - | | - | | (2.93) |
| Total distributions | | - | | (.91) | | (.68) | | (.96) | | (3.89) |
| Net asset value, end of period | $ | 93.28 | $ | 102.92 | $ | 87.14 | $ | 59.40 | $ | 69.58 |
Total Return E,F | | (9.37)% | | 19.14% | | 47.92% | | (13.43)% | | (7.35)% |
Ratios to Average Net Assets D,G,H | | | | | | | | | | |
| Expenses before reductions | | .62% I | | .62% | | .64% | | .63% | | .63% I |
| Expenses net of fee waivers, if any | | .61% I | | .62% | | .64% | | .63% | | .62% I |
| Expenses net of all reductions | | .61% I | | .62% | | .63% | | .62% | | .61% I |
| Net investment income (loss) | | 1.50% I | | .88% | | .93% | | 1.31% | | 2.27% I |
| Supplemental Data | | | | | | | | | | |
| Net assets, end of period (000 omitted) | $ | 64,705 | $ | 73,790 | $ | 47,051 | $ | 13,267 | $ | 10,039 |
Portfolio turnover rate J | | 24% I | | 43% | | 36% | | 69% | | 77% K |
A For the year ended February 29.
B For the period October 2, 2018 (commencement of sale of shares) through February 28, 2019.
C Calculated based on average shares outstanding during the period.
D Net investment income (loss) is affected by the timing of the declaration of dividends by any underlying mutual funds or exchange-traded funds (ETFs). Net investment income (loss) of any such underlying funds is not included in the Fund's net investment income (loss) ratio.
E Total returns would have been lower if certain expenses had not been reduced during the applicable periods shown.
F Total returns for periods of less than one year are not annualized.
G Fees and expenses of any underlying mutual funds or exchange-traded funds (ETFs) are not included in the Fund's expense ratio. The Fund indirectly bears its proportionate share of these expenses. For additional expense information related to investments in Fidelity Central Funds, please refer to the "Investments in Fidelity Central Funds" note found in the Notes to Financial Statements section of the most recent Annual or Semi-Annual report.
H Expense ratios reflect operating expenses of the class. Expenses before reductions do not reflect amounts reimbursed, waived, or reduced through arrangements with the investment adviser, brokerage services, or other offset arrangements, if applicable, and do not represent the amount paid by the class during periods when reimbursements, waivers or reductions occur.
I Annualized
J Amount does not include the portfolio activity of any underlying mutual funds or exchange-traded funds (ETFs).
K Portfolio turnover rate excludes securities received or delivered in-kind.
For the period ended August 31, 2022
1. Organization.
Materials Portfolio (the Fund) is a non-diversified fund of Fidelity Select Portfolios (the Trust) and is authorized to issue an unlimited number of shares. The Trust is registered under the Investment Company Act of 1940, as amended (the 1940 Act), as an open-end management investment company organized as a Massachusetts business trust. The Fund invests primarily in securities of companies whose principal business activities fall within specific industries. The Fund offers Class A, Class M, Class C, Materials, Class I and Class Z shares, each of which has equal rights as to assets and voting privileges. Each class has exclusive voting rights with respect to matters that affect that class. Class C shares will automatically convert to Class A shares after a holding period of eight years from the initial date of purchase, with certain exceptions.
2. Investments in Fidelity Central Funds.
Funds may invest in Fidelity Central Funds, which are open-end investment companies generally available only to other investment companies and accounts managed by the investment adviser and its affiliates. The Schedule of Investments lists any Fidelity Central Funds held as an investment as of period end, but does not include the underlying holdings of each Fidelity Central Fund. An investing fund indirectly bears its proportionate share of the expenses of the underlying Fidelity Central Funds.
Based on its investment objective, each Fidelity Central Fund may invest or participate in various investment vehicles or strategies that are similar to those of the investing fund. These strategies are consistent with the investment objectives of the investing fund and may involve certain economic risks which may cause a decline in value of each of the Fidelity Central Funds and thus a decline in the value of the investing fund.
| Fidelity Central Fund | Investment Manager | Investment Objective | Investment Practices | Expense Ratio A |
| Fidelity Money Market Central Funds | Fidelity Management & Research Company LLC (FMR) | Each fund seeks to obtain a high level of current income consistent with the preservation of capital and liquidity. | Short-term Investments | Less than .005% |
A Expenses expressed as a percentage of average net assets and are as of each underlying Central Fund's most recent annual or semi-annual shareholder report.
A complete unaudited list of holdings for each Fidelity Central Fund is available upon request or at the Securities and Exchange Commission website at www.sec.gov. In addition, the financial statements of the Fidelity Central Funds which contain the significant accounting policies (including investment valuation policies) of those funds, and are not covered by the Report of Independent Registered Public Accounting Firm, are available on the Securities and Exchange Commission website or upon request.
3. Significant Accounting Policies.
The Fund is an investment company and applies the accounting and reporting guidance of the Financial Accounting Standards Board (FASB) Accounting Standards Codification Topic 946 Financial Services - Investment Companies . The financial statements have been prepared in conformity with accounting principles generally accepted in the United States of America (GAAP), which require management to make certain estimates and assumptions at the date of the financial statements. Actual results could differ from those estimates. Subsequent events, if any, through the date that the financial statements were issued have been evaluated in the preparation of the financial statements. The Fund's Schedule of Investments lists any underlying mutual funds or exchange-traded funds (ETFs) but does not include the underlying holdings of these funds. The following summarizes the significant accounting policies of the Fund:
Investment Valuation. Investments are valued as of 4:00 p.m. Eastern time on the last calendar day of the period. The Board of Trustees (the Board) has delegated the day to day responsibility for the valuation of the Fund's investments to the Fair Value Committee (the Committee) established by the Fund's investment adviser. In accordance with valuation policies and procedures approved by the Board, the Fund attempts to obtain prices from one or more third party pricing vendors or brokers to value its investments. When current market prices, quotations or currency exchange rates are not readily available or reliable, investments will be fair valued in good faith by the Committee, in accordance with procedures adopted by the Board. Factors used in determining fair value vary by investment type and may include market or investment specific events. The frequency with which these procedures are used cannot be predicted and they may be utilized to a significant extent. The Committee oversees the Fund's valuation policies and procedures and reports to the Board on the Committee's activities and fair value determinations. The Board monitors the appropriateness of the procedures used in valuing the Fund's investments and ratifies the fair value determinations of the Committee.
The Fund categorizes the inputs to valuation techniques used to value its investments into a disclosure hierarchy consisting of three levels as shown below:
Level 1 - unadjusted quoted prices in active markets for identical investments
Level 2 - other significant observable inputs (including quoted prices for similar investments, interest rates, prepayment speeds, etc.)
Level 3 - unobservable inputs (including the Fund's own assumptions based on the best information available)
Valuation techniques used to value the Fund's investments by major category are as follows:
Equity securities, including restricted securities, for which market quotations are readily available, are valued at the last reported sale price or official closing price as reported by a third party pricing vendor on the primary market or exchange on which they are traded and are categorized as Level 1 in the hierarchy. In the event there were no sales during the day or closing prices are not available, securities are valued at the last quoted bid price or may be valued using the last available price and are generally categorized as Level 2 in the hierarchy. For foreign equity securities, when market or security specific events arise, comparisons to the valuation of American Depositary Receipts (ADRs), futures contracts, ETFs and certain indexes as well as quoted prices for similar securities may be used and would be categorized as Level 2 in the hierarchy. For equity securities, including restricted securities, where observable inputs are limited, assumptions about market activity and risk are used and these securities may be categorized as Level 3 in the hierarchy.
Investments in open-end mutual funds, including the Fidelity Central Funds, are valued at their closing net asset value (NAV) each business day and are categorized as Level 1 in the hierarchy.
Changes in valuation techniques may result in transfers in or out of an assigned level within the disclosure hierarchy. The aggregate value of investments by input level as of August 31, 2022 is included at the end of the Fund's Schedule of Investments.
Foreign Currency. Certain Funds may use foreign currency contracts to facilitate transactions in foreign-denominated securities. Gains and losses from these transactions may arise from changes in the value of the foreign currency or if the counterparties do not perform under the contracts' terms.
Foreign-denominated assets, including investment securities, and liabilities are translated into U.S. dollars at the exchange rates at period end. Purchases and sales of investment securities, income and dividends received, and expenses denominated in foreign currencies are translated into U.S. dollars at the exchange rate in effect on the transaction date.
The effects of exchange rate fluctuations on investments are included with the net realized and unrealized gain (loss) on investment securities. Other foreign currency transactions resulting in realized and unrealized gain (loss) are disclosed separately.
Investment Transactions and Income. For financial reporting purposes, the Fund's investment holdings and NAV include trades executed through the end of the last business day of the period. The NAV per share for processing shareholder transactions is calculated as of the close of business of the New York Stock Exchange (NYSE), normally 4:00 p.m. Eastern time and includes trades executed through the end of the prior business day. Gains and losses on securities sold are determined on the basis of identified cost and include proceeds received from litigation. Commissions paid to certain brokers with whom the investment adviser, or its affiliates, places trades on behalf of a fund include an amount in addition to trade execution, which may be rebated back to a fund. Any such rebates are included in net realized gain (loss) on investments in the Statement of Operations. Dividend income is recorded on the ex-dividend date, except for certain dividends from foreign securities where the ex-dividend date may have passed, which are recorded as soon as the Fund is informed of the ex-dividend date. Non-cash dividends included in dividend income, if any, are recorded at the fair market value of the securities received. Income and capital gain distributions from Fidelity Central Funds, if any, are recorded on the ex-dividend date. Certain distributions received by the Fund represent a return of capital or capital gain. The Fund determines the components of these distributions subsequent to the ex-dividend date, based upon receipt of tax filings or other correspondence relating to the underlying investment. These distributions are recorded as a reduction of cost of investments and/or as a realized gain. Investment income is recorded net of foreign taxes withheld where recovery of such taxes is uncertain. Funds may file withholding tax reclaims in certain jurisdictions to recover a portion of amounts previously withheld. Any withholding tax reclaims income is included in the Statement of Operations in dividends. Any receivables for withholding tax reclaims are included in the Statement of Assets and Liabilities in dividends receivable.
Class Allocations and Expenses. Investment income, realized and unrealized capital gains and losses, common expenses of a fund, and certain fund-level expense reductions, if any, are allocated daily on a pro-rata basis to each class based on the relative net assets of each class to the total net assets of a fund. Each class differs with respect to transfer agent and distribution and service plan fees incurred, as applicable. Certain expense reductions may also differ by class, if applicable. For the reporting period, the allocated portion of income and expenses to each class as a percent of its average net assets may vary due to the timing of recording these transactions in relation to fluctuating net assets of the classes. Expenses directly attributable to a fund are charged to that fund. Expenses attributable to more than one fund are allocated among the respective funds on the basis of relative net assets or other appropriate methods. Expenses included in the accompanying financial statements reflect the expenses of that fund and do not include any expenses associated with any underlying mutual funds or exchange-traded funds. Although not included in a fund's expenses, a fund indirectly bears its proportionate share of these expenses through the net asset value of each underlying mutual fund or exchange-traded fund. Expense estimates are accrued in the period to which they relate and adjustments are made when actual amounts are known.
Deferred Trustee Compensation. Under a Deferred Compensation Plan (the Plan) for certain Funds, certain independent Trustees have elected to defer receipt of a portion of their annual compensation. Deferred amounts are invested in affiliated mutual funds, are marked-to-market and remain in a fund until distributed in accordance with the Plan. The investment of deferred amounts and the offsetting payable to the Trustees presented below are included in the accompanying Statement of Assets and Liabilities in other receivables and other payables and accrued expenses, as applicable.
| Materials Portfolio | $167,781 |
Income Tax Information and Distributions to Shareholders. Each year, the Fund intends to qualify as a regulated investment company under Subchapter M of the Internal Revenue Code, including distributing substantially all of its taxable income and realized gains. As a result, no provision for U.S. Federal income taxes is required. The Fund files a U.S. federal tax return, in addition to state and local tax returns as required. The Fund's federal income tax returns are subject to examination by the Internal Revenue Service (IRS) for a period of three fiscal years after they are filed. State and local tax returns may be subject to examination for an additional fiscal year depending on the jurisdiction. Foreign taxes are provided for based on the Fund's understanding of the tax rules and rates that exist in the foreign markets in which it invests.
Distributions are declared and recorded on the ex-dividend date. Income and capital gain distributions are declared separately for each class. Income and capital gain distributions are determined in accordance with income tax regulations, which may differ from GAAP.
Capital accounts within the financial statements are adjusted for permanent book-tax differences. These adjustments have no impact on net assets or the results of operations. Capital accounts are not adjusted for temporary book-tax differences which will reverse in a subsequent period.
Book-tax differences are primarily due to foreign currency transactions, deferred Trustees compensation, capital loss carryforwards and losses deferred due to wash sales and excise tax regulations.
As of period end, the cost and unrealized appreciation (depreciation) in securities, and derivatives if applicable, for federal income tax purposes were as follows:
| Gross unrealized appreciation | $ 288,350,104 |
| Gross unrealized depreciation | (37,794,040) |
| Net unrealized appreciation (depreciation) | $ 250,556,064 |
| Tax cost | $ 743,191,386 |
Capital loss carryforwards are only available to offset future capital gains of the Fund to the extent provided by regulations and may be limited. The capital loss carryforward information presented below, including any applicable limitation, is estimated as of prior fiscal period end and is subject to adjustment.
4. Purchases and Sales of Investments.
Purchases and sales of securities, other than short-term securities and in-kind transactions, as applicable, are noted in the table below.
| | Purchases ($) | Sales ($) |
| Materials Portfolio | 130,292,766 | 185,187,527 |
5. Fees and Other Transactions with Affiliates.
Management Fee. Fidelity Management & Research Company LLC (the investment adviser) and its affiliates provide the Fund with investment management related services for which the Fund pays a monthly management fee. The management fee is the sum of an individual fund fee rate that is based on an annual rate of .30% of the Fund's average net assets and an annualized group fee rate that averaged .23% during the period. The group fee rate is based upon the monthly average net assets of a group of registered investment companies with which the investment adviser has management contracts. The group fee rate decreases as assets under management increase and increases as assets under management decrease. For the reporting period, the total annualized management fee rate was .53% of the Fund's average net assets.
Distribution and Service Plan Fees. In accordance with Rule 12b-1 of the 1940 Act, the Fund has adopted separate Distribution and Service Plans for each class of shares. Certain classes pay Fidelity Distributors Company LLC (FDC), an affiliate of the investment adviser, separate Distribution and Service Fees, each of which is based on an annual percentage of each class' average net assets. In addition, FDC may pay financial intermediaries for selling shares of the Fund and providing shareholder support services. For the period, the Distribution and Service Fee rates, total fees and amounts retained by FDC were as follows:
| | Distribution Fee | Service Fee | Total Fees | Retained by FDC |
| Class A | - % | .25% | $ 162,655 | $ 1,751 |
| Class M | .25% | .25% | 91,976 | - |
| Class C | .75% | .25% | 100,051 | 17,006 |
| | | | $ 354,682 | $ 18,757 |
Sales Load. FDC may receive a front-end sales charge of up to 5.75% for selling Class A shares and 3.50% for selling Class M shares, some of which is paid to financial intermediaries for selling shares of the Fund. Depending on the holding period, FDC may receive contingent deferred sales charges levied on Class A, Class M and Class C redemptions. The deferred sales charges are 1.00% for Class C shares, 1.00% for certain purchases of Class A shares and .25% for certain purchases of Class M shares.
For the period, sales charge amounts retained by FDC were as follows:
| | Retained by FDC |
| Class A | $ 12,814 |
| Class M | 1,449 |
Class C A | 32 |
| | $ 14,295 |
A When Class C shares are initially sold, FDC pays commissions from its own resources to financial intermediaries through which the sales are made.
Transfer Agent Fees. Fidelity Investments Institutional Operations Company LLC (FIIOC), an affiliate of the investment adviser, is the transfer, dividend disbursing and shareholder servicing agent for each class of the Fund. FIIOC receives account fees and asset-based fees that vary according to the account size and type of account of the shareholders of the respective classes of the Fund, except for Class Z. FIIOC receives an asset-based fee of Class Z's average net assets. FIIOC pays for typesetting, printing and mailing of shareholder reports, except proxy statements.
For the period, transfer agent fees for each class were as follows:
| | Amount | % of Class-Level Average Net Assets A |
| Class A | $ 130,980 | .20 |
| Class M | 37,849 | .21 |
| Class C | 20,388 | .20 |
| Materials | 546,472 | .18 |
| Class I | 212,826 | .18 |
| Class Z | 14,540 | .04 |
| | $ 963,055 | |
A Annualized
Accounting Fees. Fidelity Service Company, Inc. (FSC), an affiliate of the investment adviser, maintains the Fund's accounting records. The accounting fee is based on the level of average net assets for each month. For the period, the fees were equivalent to the following annualized rates:
| | % of Average Net Assets |
| Materials Portfolio | .03 |
Brokerage Commissions. A portion of portfolio transactions were placed with brokerage firms which are affiliates of the investment adviser. Brokerage commissions are included in net realized gain (loss) and change in net unrealized appreciation (depreciation) in the Statement of Operations. The commissions paid to these affiliated firms were as follows:
| | Amount |
| Materials Portfolio | $ 1,809 |
Interfund Lending Program. Pursuant to an Exemptive Order issued by the Securities and Exchange Commission (the SEC), the Fund, along with other registered investment companies having management contracts with Fidelity Management & Research Company LLC (FMR), or other affiliated entities of FMR, may participate in an interfund lending program. This program provides an alternative credit facility allowing the Fund to borrow from, or lend money to, other participating affiliated funds. At period end, there were no interfund loans outstanding. Activity in this program during the period for which loans were outstanding was as follows:
| | Borrower or Lender | Average Loan Balance | Weighted Average Interest Rate | Interest Expense |
| Materials Portfolio | Borrower | $ 7,643,667 | .32% | $ 201 |
Interfund Trades. Funds may purchase from or sell securities to other Fidelity Funds under procedures adopted by the Board. The procedures have been designed to ensure these interfund trades are executed in accordance with Rule 17a-7 of the 1940 Act. Any interfund trades are included within the respective purchases and sales amounts shown in the Purchases and Sales of Investments note. Interfund trades during the period are noted in the table below.
| | Purchases ($) | Sales ($) | Realized Gain (Loss) ($) |
| Materials Portfolio | 8,065,967 | 8,409,196 | 1,027,120 |
6. Committed Line of Credit.
Certain Funds participate with other funds managed by the investment adviser or an affiliate in a $4.25 billion credit facility (the "line of credit") to be utilized for temporary or emergency purposes to fund shareholder redemptions or for other short-term liquidity purposes. The participating funds have agreed to pay commitment fees on their pro-rata portion of the line of credit, which are reflected in Miscellaneous expenses on the Statement of Operations, and are listed below. During the period, there were no borrowings on this line of credit.
| | Amount |
| Materials Portfolio | $ 1,012 |
7. Security Lending.
Funds lend portfolio securities from time to time in order to earn additional income. Lending agents are used, including National Financial Services (NFS), an affiliate of the investment adviser. Pursuant to a securities lending agreement, NFS will receive a fee, which is capped at 9.9% of a fund's daily lending revenue, for its services as lending agent. A fund may lend securities to certain qualified borrowers, including NFS. On the settlement date of the loan, a fund receives collateral (in the form of U.S. Treasury obligations, letters of credit and/or cash) against the loaned securities and maintains collateral in an amount not less than 100% of the market value of the loaned securities during the period of the loan. The market value of the loaned securities is determined at the close of business of a fund and any additional required collateral is delivered to a fund on the next business day. A fund or borrower may terminate the loan at any time, and if the borrower defaults on its obligation to return the securities loaned because of insolvency or other reasons, a fund may apply collateral received from the borrower against the obligation. A fund may experience delays and costs in recovering the securities loaned. Any cash collateral received is invested in the Fidelity Securities Lending Cash Central Fund. Any loaned securities are identified as such in the Schedule of Investments, and the value of loaned securities and cash collateral at period end, as applicable, are presented in the Statement of Assets and Liabilities. Security lending income represents the income earned on investing cash collateral, less rebates paid to borrowers and any lending agent fees associated with the loan, plus any premium payments received for lending certain types of securities. Security lending income is presented in the Statement of Operations as a component of income from Fidelity Central Funds. Affiliated security lending activity, if any, was as follows:
| | Total Security Lending Fees Paid to NFS | Security Lending Income From Securities Loaned to NFS | Value of Securities Loaned to NFS at Period End |
| Materials Portfolio | $ 618 | $ - | $- |
8. Expense Reductions.
During the period the investment adviser or an affiliate reimbursed and/or waived a portion of fund-level operating expenses in the amount of $18,264.
9. Distributions to Shareholders.
Distributions to shareholders of each class were as follows:
| | Six months ended August 31, 2022 | Year ended February 28, 2022 |
| Materials Portfolio | | |
| Distributions to shareholders | | |
| Class A | $ - | $762,533 |
| Class M | - | 147,448 |
| Materials | - | 5,007,156 |
| Class I | - | 1,869,092 |
| Class Z | - | 650,954 |
Total | $ - | $ 8,437,183 |
10. Share Transactions.
Share transactions for each class were as follows and may contain in-kind transactions, automatic conversions between classes or exchanges between affiliated funds:
| | Shares | Shares | Dollars | Dollars |
| | Six months ended August 31, 2022 | Year ended February 28, 2022 | Six months ended August 31, 2022 | Year ended February 28, 2022 |
| Materials Portfolio | | | | |
| Class A | | | | |
| Shares sold | 112,895 | 462,367 | $ 11,545,535 | $ 46,208,008 |
| Reinvestment of distributions | - | 7,168 | - | 745,309 |
| Shares redeemed | (169,791) | (286,710) | (16,967,179) | (28,650,346) |
| Net increase (decrease) | (56,896) | 182,825 | $ (5,421,644) | $ 18,302,971 |
| Class M | | | | |
| Shares sold | 53,288 | 179,127 | $ 5,378,800 | $ 17,772,580 |
| Reinvestment of distributions | - | 1,429 | - | 147,010 |
| Shares redeemed | (42,845) | (102,671) | (4,201,188) | (10,013,298) |
| Net increase (decrease) | 10,443 | 77,885 | $ 1,177,612 | $ 7,906,292 |
| Class C | | | | |
| Shares sold | 23,628 | 94,534 | $ 2,308,802 | $ 9,060,563 |
| Shares redeemed | (38,294) | (157,099) | (3,625,433) | (14,767,417) |
| Net increase (decrease) | (14,666) | (62,565) | $ (1,316,631) | $ (5,706,854) |
| Materials | | | | |
| Shares sold | 467,659 | 5,001,453 | $ 48,629,058 | $ 502,734,189 |
| Reinvestment of distributions | - | 44,769 | - | 4,680,116 |
| Shares redeemed | (837,269) | (4,889,252) | (82,050,301) | (485,592,599) |
| Net increase (decrease) | (369,610) | 156,970 | $ (33,421,243) | $ 21,821,706 |
| Class I | | | | |
| Shares sold | 442,736 | 1,335,457 | $ 44,935,722 | $ 132,303,721 |
| Reinvestment of distributions | - | 16,505 | - | 1,721,641 |
| Shares redeemed | (554,310) | (1,218,271) | (54,493,480) | (121,416,087) |
| Net increase (decrease) | (111,574) | 133,691 | $ (9,557,758) | $ 12,609,275 |
| Class Z | | | | |
| Shares sold | 119,816 | 511,529 | $ 11,817,405 | $ 50,914,703 |
| Reinvestment of distributions | - | 5,860 | - | 610,221 |
| Shares redeemed | (143,077) | (340,358) | (14,278,339) | (33,687,861) |
| Net increase (decrease) | (23,261) | 177,031 | $ (2,460,934) | $ 17,837,063 |
11. Other.
A fund's organizational documents provide former and current trustees and officers with a limited indemnification against liabilities arising in connection with the performance of their duties to the fund. In the normal course of business, a fund may also enter into contracts that provide general indemnifications. A fund's maximum exposure under these arrangements is unknown as this would be dependent on future claims that may be made against a fund. The risk of material loss from such claims is considered remote.
12. Risk and Uncertainties.
Many factors affect a fund's performance. Developments that disrupt global economies and financial markets, such as pandemics, epidemics, outbreaks of infectious diseases, war, terrorism, and environmental disasters, may significantly affect a fund's investment performance. The effects of these developments to a fund will be impacted by the types of securities in which a fund invests, the financial condition, industry, economic sector, and geographic location of an issuer, and a fund's level of investment in the securities of that issuer.
As a shareholder, you incur two types of costs: (1) transaction costs, which may include sales charges (loads) on purchase payments or redemption proceeds, as applicable and (2) ongoing costs, which generally include management fees, distribution and/or service (12b-1) fees and other Fund expenses. This Example is intended to help you understand your ongoing costs (in dollars) of investing in a fund and to compare these costs with the ongoing costs of investing in other mutual funds.
| The Example is based on an investment of $1,000 invested at the beginning of the period and held for the entire period (March 1, 2022 to August 31, 2022). |
Actual Expenses
The first line of the accompanying table provides information about actual account values and actual expenses. You may use the information in this line, together with the amount you invested, to estimate the expenses that you paid over the period. Simply divide your account value by $1,000.00 (for example, an $8,600 account value divided by $1,000.00 = 8.6), then multiply the result by the number in the first line for a class/Fund under the heading entitled "Expenses Paid During Period" to estimate the expenses you paid on your account during this period. If any fund is a shareholder of any underlying mutual funds or exchange-traded funds (ETFs) (the Underlying Funds), such fund indirectly bears its proportional share of the expenses of the Underlying Funds in addition to the direct expenses incurred presented in the table. These fees and expenses are not included in the annualized expense ratio used to calculate the expense estimate in the table below.
Hypothetical Example for Comparison Purposes
The second line of the accompanying table provides information about hypothetical account values and hypothetical expenses based on the actual expense ratio and an assumed rate of return of 5% per year before expenses, which is not the actual return. The hypothetical account values and expenses may not be used to estimate the actual ending account balance or expenses you paid for the period. You may use this information to compare the ongoing costs of investing in the Fund and other funds. To do so, compare this 5% hypothetical example with the 5% hypothetical examples that appear in the shareholder reports of the other funds. If any fund is a shareholder of any Underlying Funds, such fund indirectly bears its proportional share of the expenses of the Underlying Funds in addition to the direct expenses as presented in the table. These fees and expenses are not included in the annualized expense ratio used to calculate the expense estimate in the table below.
Please note that the expenses shown in the table are meant to highlight your ongoing costs only and do not reflect any transaction costs. Therefore, the second line of the table is useful in comparing ongoing costs only, and will not help you determine the relative total costs of owning different funds. In addition, if these transactional costs were included, your costs would have been higher.
| | | | | Annualized Expense Ratio- A | | Beginning Account Value March 1, 2022 | | Ending Account Value August 31, 2022 | | Expenses Paid During Period- C March 1, 2022 to August 31, 2022 |
| | | | | | | | | | |
| Chemicals Portfolio | | | | .74% | | | | | | |
| Actual | | | | | | $ 1,000 | | $ 937.90 | | $ 3.61 |
Hypothetical- B | | | | | | $ 1,000 | | $ 1,021.48 | | $ 3.77 |
| Gold Portfolio | | | | | | | | | | |
| Class A | | | | 1.08% | | | | | | |
| Actual | | | | | | $ 1,000 | | $ 691.40 | | $ 4.60 |
Hypothetical- B | | | | | | $ 1,000 | | $ 1,019.76 | | $ 5.50 |
| Class M | | | | 1.36% | | | | | | |
| Actual | | | | | | $ 1,000 | | $ 690.40 | | $ 5.79 |
Hypothetical- B | | | | | | $ 1,000 | | $ 1,018.35 | | $ 6.92 |
| Class C | | | | 1.78% | | | | | | |
| Actual | | | | | | $ 1,000 | | $ 688.80 | | $ 7.58 |
Hypothetical- B | | | | | | $ 1,000 | | $ 1,016.23 | | $ 9.05 |
| Gold Portfolio | | | | .77% | | | | | | |
| Actual | | | | | | $ 1,000 | | $ 692.70 | | $ 3.29 |
Hypothetical- B | | | | | | $ 1,000 | | $ 1,021.32 | | $ 3.92 |
| Class I | | | | .77% | | | | | | |
| Actual | | | | | | $ 1,000 | | $ 692.40 | | $ 3.28 |
Hypothetical- B | | | | | | $ 1,000 | | $ 1,021.32 | | $ 3.92 |
| Class Z | | | | .63% | | | | | | |
| Actual | | | | | | $ 1,000 | | $ 693.00 | | $ 2.69 |
Hypothetical- B | | | | | | $ 1,000 | | $ 1,022.03 | | $ 3.21 |
| Materials Portfolio | | | | | | | | | | |
| Class A | | | | 1.02% | | | | | | |
| Actual | | | | | | $ 1,000 | | $ 904.50 | | $ 4.90 |
Hypothetical- B | | | | | | $ 1,000 | | $ 1,020.06 | | $ 5.19 |
| Class M | | | | 1.28% | | | | | | |
| Actual | | | | | | $ 1,000 | | $ 903.40 | | $ 6.14 |
Hypothetical- B | | | | | | $ 1,000 | | $ 1,018.75 | | $ 6.51 |
| Class C | | | | 1.78% | | | | | | |
| Actual | | | | | | $ 1,000 | | $ 901.00 | | $ 8.53 |
Hypothetical- B | | | | | | $ 1,000 | | $ 1,016.23 | | $ 9.05 |
| Materials Portfolio | | | | .75% | | | | | | |
| Actual | | | | | | $ 1,000 | | $ 905.70 | | $ 3.60 |
Hypothetical- B | | | | | | $ 1,000 | | $ 1,021.42 | | $ 3.82 |
| Class I | | | | .76% | | | | | | |
| Actual | | | | | | $ 1,000 | | $ 905.60 | | $ 3.65 |
Hypothetical- B | | | | | | $ 1,000 | | $ 1,021.37 | | $ 3.87 |
| Class Z | | | | .61% | | | | | | |
| Actual | | | | | | $ 1,000 | | $ 906.30 | | $ 2.93 |
Hypothetical- B | | | | | | $ 1,000 | | $ 1,022.13 | | $ 3.11 |
| |
A Annualized expense ratio reflects expenses net of applicable fee waivers.
B 5% return per year before expenses
C Expenses are equal to the annualized expense ratio, multiplied by the average account value over the period, multiplied by 184/ 365 (to reflect the one-half year period). The fees and expenses of any Underlying Funds are not included in each annualized expense ratio.
Chemicals Portfolio
Gold Portfolio
Materials Portfolio
Each year, the Board of Trustees, including the Independent Trustees (together, the Board), votes on the renewal of the management contract with Fidelity Management & Research Company LLC (FMR) and the sub-advisory agreements (together, the Advisory Contracts) for each fund. FMR and the sub-advisers are referred to herein as the Investment Advisers. The Board, assisted by the advice of fund counsel and Independent Trustees' counsel, requests and considers a broad range of information relevant to the renewal of the Advisory Contracts throughout the year.
The Board meets regularly and, at each of its meetings, covers an extensive agenda of topics and materials and considers factors that are relevant to its annual consideration of the renewal of each fund's Advisory Contracts, including the services and support provided to each fund and its shareholders. The Board has established various standing committees (Committees), each composed of and chaired by Independent Trustees with varying backgrounds, to which the Board has assigned specific subject matter responsibilities in order to enhance effective decision-making by the Board. The Board, acting directly and through its Committees, requests and receives information concerning the annual consideration of the renewal of each fund's Advisory Contracts. The Board also meets as needed to review matters specifically related to the Board's annual consideration of the renewal of the Advisory Contracts. Members of the Board may also meet with trustees of other Fidelity funds through joint ad hoc committees to discuss certain matters relevant to all of the Fidelity funds.
At its May 2022 meeting, the Board unanimously determined to renew each fund's Advisory Contracts. In reaching its determination, the Board considered all factors it believed relevant, including (i) the nature, extent, and quality of the services provided to each fund and its shareholders (including the investment performance of each fund); (ii) the competitiveness relative to peer funds of the management fee and total expense ratio of the fund or a representative class (retail class), as applicable; (iii) the total costs of the services provided by and the profits realized by Fidelity from its relationships with each fund; and (iv) the extent to which, if any, economies of scale exist and are realized as each fund grows, and whether any economies of scale are appropriately shared with fund shareholders.
In considering whether to renew the Advisory Contracts for each fund, the Board reached a determination, with the assistance of fund counsel and Independent Trustees' counsel and through the exercise of its business judgment, that the renewal of the Advisory Contracts was in the best interests of each fund and its shareholders and that the compensation payable under the Advisory Contracts was fair and reasonable. The Board's decision to renew the Advisory Contracts was not based on any single factor, but rather was based on a comprehensive consideration of all the information provided to the Board at its meetings throughout the year. The Board, in reaching its determination to renew the Advisory Contracts, was aware that shareholders of each fund have a broad range of investment choices available to them, including a wide choice among funds offered by Fidelity's competitors, and that each fund's shareholders, who have the opportunity to review and weigh the disclosure provided by the fund in its prospectus and other public disclosures, have chosen to invest in that fund, which is part of the Fidelity family of funds.
Nature, Extent, and Quality of Services Provided. The Board considered Fidelity's staffing as it relates to the funds, including the backgrounds of investment personnel of Fidelity, and also considered the funds' investment objectives, strategies, and related investment philosophies. The Independent Trustees also had discussions with senior management of Fidelity's investment operations and investment groups. The Board considered the structure of the investment personnel compensation program and whether this structure provides appropriate incentives to act in the best interests of each fund. Additionally, the Board considered the portfolio managers' investments, if any, in the funds that they manage. The Board also considered the steps Fidelity had taken to ensure the continued provision of high quality services to the Fidelity funds during the COVID-19 pandemic, including the expansion of staff in client facing positions to maintain service levels in periods of high volumes and volatility.
Resources Dedicated to Investment Management and Support Services. The Board and the Fund Oversight and Research Committees reviewed the general qualifications and capabilities of Fidelity's investment staff, including its size, education, experience, and resources, as well as Fidelity's approach to recruiting, training, managing, and compensating investment personnel. The Board noted the resources devoted to expansion of Fidelity's global investment organization, and that Fidelity's analysts have extensive resources, tools, and capabilities that allow them to conduct sophisticated quantitative and fundamental analysis, as well as credit analysis of issuers, counterparties, and guarantors. Further, the Board considered that Fidelity's investment professionals have sufficient access to global information and data so as to provide competitive investment results over time, and that those professionals also have access to sophisticated tools that permit them to assess portfolio construction and risk and performance attribution characteristics continuously, as well as to transmit new information and research conclusions rapidly around the world. Additionally, in its deliberations, the Board considered Fidelity's trading, risk management, compliance, and technology and operations capabilities and resources, which are integral parts of the investment management process.
Shareholder and Administrative Services. The Board considered (i) the nature, extent, quality, and cost of advisory, administrative, and shareholder services performed by the Investment Advisers and their affiliates under the Advisory Contracts and under separate agreements covering transfer agency, pricing and bookkeeping, and securities lending services for each fund; (ii) the nature and extent of the supervision of third party service providers, principally custodians, subcustodians, and pricing vendors; and (iii) the resources devoted to, and the record of compliance with, each fund's compliance policies and procedures. The Board also reviewed the allocation of fund brokerage, including allocations to brokers affiliated with the Investment Advisers, the use of brokerage commissions to pay fund expenses, and the use of "soft" commission dollars to pay for research services.
The Board noted that the growth of fund assets over time across the complex allows Fidelity to reinvest in the development of services designed to enhance the value and convenience of the Fidelity funds as investment vehicles. These services include 24-hour access to account information and market information over the Internet and through telephone representatives, investor education materials, and asset allocation tools. The Board also considered that it reviews customer service metrics such as telephone response times, continuity of services on the website and metrics addressing services at Fidelity Investor Centers.
Investment in a Large Fund Family. The Board considered the benefits to shareholders of investing in a Fidelity fund, including the benefits of investing in a fund that is part of a large family of funds offering a variety of investment disciplines and providing a large variety of mutual fund investor services. The Board noted that Fidelity had taken, or had made recommendations that resulted in the Fidelity funds taking, a number of actions over the previous year that benefited particular funds, including: (i) continuing to dedicate additional resources to Fidelity's investment research process, which includes meetings with management of issuers of securities in which the funds invest; (ii) continuing efforts to enhance Fidelity's global research capabilities; (iii) launching new funds and ETFs with innovative structures, strategies and pricing and making other enhancements to meet client needs; (iv) launching new share classes of existing funds; (v) eliminating purchase minimums and broadening eligibility requirements for certain funds and share classes; (vi) reducing management fees and total expenses for certain target date funds and classes and index funds; (vii) lowering expenses for certain existing funds and classes by implementing or lowering expense caps; (viii) rationalizing product lines and gaining increased efficiencies from fund mergers and liquidations; (ix) continuing to develop, acquire and implement systems and technology to improve services to the funds and shareholders, strengthen information security, and increase efficiency; and (x) continuing to implement enhancements to further strengthen Fidelity's product line to increase investors' probability of success in achieving their investment goals, including retirement income goals.
Investment Performance. The Board considered whether each fund has operated in accordance with its investment objective, as well as its record of compliance with its investment restrictions and its performance history. The Board noted that Chemicals Portfolio had a portfolio manager change in August 2019 and July 2020, Gold Portfolio had a portfolio manager change in March 2019, and Materials Portfolio had a portfolio manager change in November 2019 and May 2020. The Board will continue to monitor closely each fund's performance, taking into account the portfolio manager changes.
The Board took into account discussions that occur at Board meetings throughout the year with representatives of the Investment Advisers about fund investment performance. In this regard the Board noted that as part of regularly scheduled fund reviews and other reports to the Board on fund performance, the Board considers annualized return information for each fund for different time periods, measured against an appropriate securities market index (benchmark index). The Board also reviews and considers information about performance attribution. In its evaluation of fund investment performance, the Board gave particular attention to information indicating changes in performance of certain Fidelity funds for specific time periods and discussed with the Investment Advisers the reasons for any overperformance or underperformance.
In addition to reviewing absolute and relative fund performance, the Independent Trustees periodically consider the appropriateness of fund performance metrics in evaluating the results achieved. In general, the Independent Trustees believe that fund performance should be evaluated based on net performance (after fees and expenses) of the fund or representative class, as applicable, compared to appropriate benchmark indices, over appropriate time periods that may include full market cycles, taking into account relevant factors including the following: general market conditions; issuer-specific information; and fund cash flows and other factors.
The Independent Trustees recognize that shareholders evaluate performance on a net basis over their own holding periods, for which one-, three-, and five-year periods are often used as a proxy. For this reason, the performance information reviewed by the Board also included net cumulative total return information for each fund and an appropriate benchmark index for the most recent one-, three-, and five-year periods ended September 30, 2021, as shown below.
Chemicals Portfolio
Gold Portfolio
The Board considered the fund's underperformance for different time periods ended December 31, 2021 (which periods are not reflected in the chart above). The Board noted that the fund's underperformance has continued since the Board approved the management contract in January 2020 and May 2021. The Board's discussions with FMR regarding underperformance cover topics including, but not limited to: the longer-term track record of a fund's portfolio manager(s); broader trends in the market that may adversely impact a fund's performance; and attribution reports on contributors to the fund's underperformance. The Board engages with FMR on steps that might be taken to address a fund's underperformance. For a fund with underperformance over longer periods of time, the Board typically monitors the fund's performance more closely.
Materials Portfolio
Based on its review, the Board concluded that the nature, extent, and quality of services provided to each fund under the Advisory Contracts should continue to benefit the shareholders of each fund.
Competitiveness of Management Fee and Total Expense Ratio. The Board considered each fund's management fee and total expense ratio compared to "mapped groups" of competitive funds and classes created for the purpose of facilitating the Trustees' competitive analysis of management fees and total expenses. Fidelity creates "mapped groups" by combining similar Lipper investment objective categories that have comparable investment mandates. For this purpose, all sector focused equity funds are grouped in the same mapped group. Combining Lipper investment objective categories aids the Board's management fee and total expense ratio comparisons by broadening the competitive group used for comparison.
Management Fee. The Board considered two proprietary management fee comparisons for the 12-month periods ended September 30 (June 30 for periods ended 2019 and 2018 and December 31 for periods prior to 2018) shown in basis points (BP) in the charts below. The group of Lipper funds used by the Board for management fee comparisons is referred to below as the "Total Mapped Group." The Total Mapped Group comparison focuses on a fund's standing in terms of gross management fees before expense reimbursements or caps relative to the total universe of funds with comparable investment mandates (i.e., sector equities), regardless of whether their management fee structures also are comparable. Funds with comparable management fee structures have similar management fee contractual arrangements (e.g., flat rate charged for advisory services, all-inclusive fee rate, etc.). "TMG %" represents the percentage of funds in the Total Mapped Group that had management fees that were lower than a fund's. For example, a hypothetical TMG % of 20% would mean that 80% of the funds in the Total Mapped Group had higher, and 20% had lower, management fees than a fund. The funds' actual TMG %s and the number of funds in the Total Mapped Group are in the charts below. The "Asset-Sized Peer Group" (ASPG) comparison focuses on a fund's standing relative to a subset of non-Fidelity funds within the Total Mapped Group that are similar in size and management fee structure. For example, if a fund is in the first quartile of the ASPG, the fund's management fee ranks in the least expensive or lowest 25% of funds in the ASPG. The ASPG represents at least 15% of the funds in the Total Mapped Group with comparable asset size and management fee structures, subject to a minimum of 50 funds (or all funds in the Total Mapped Group if fewer than 50). Additional information, such as the ASPG quartile in which a fund's management fee rate ranked, is also included in the charts and was considered by the Board.
Chemicals Portfolio
Gold Portfolio
Materials Portfolio
The Board noted that each fund's management fee rate ranked below the median of its Total Mapped Group and below the median of its ASPG for the 12-month period ended September 30, 2021.
The Board also considered that, for funds subject to the group fee, FMR agreed to voluntarily waive fees over a specified period of time in amounts designed to account for assets converted from certain funds to certain collective investment trusts.
Based on its review, the Board concluded that each fund's management fee is fair and reasonable in light of the services that the fund receives and the other factors considered.
Total Expense Ratio. In its review of Chemicals Portfolio's total expense ratio, the Board considered the fund's management fee rate as well as other fund expenses, such as transfer agent fees, pricing and bookkeeping fees, and custodial, legal, and audit fees. The Board also noted that Fidelity may agree to waive fees or reimburse expenses from time to time, and the extent to which, if any, it has done so for the fund. The fund is compared to those funds and classes in the Total Mapped Group (used by the Board for management fee comparisons) that have a similar sales load structure. The Board also considered a total expense ASPG comparison for the fund, which focuses on the total expenses of the fund relative to a subset of non-Fidelity funds within the total expense similar sales load structure group. The total expense ASPG is limited to 15 larger and 15 smaller classes in fund average assets for a total of 30 classes, where possible. The total expense ASPG comparison excludes performance adjustments and fund-paid 12b-1 fees to eliminate variability in fee structures.
The Board noted that the total net expense ratio of Chemicals Portfolio ranked below the similar sales load structure group competitive median and below the ASPG competitive median for the 12-month period ended September 30, 2021.
In its review of the total expense ratio of the representative class (retail class) of each of Gold Portfolio and Materials Portfolio, the Board considered the fund's management fee rate as well as other fund or class expenses, as applicable, such as transfer agent fees, pricing and bookkeeping fees, fund-paid 12b-1 fees, and custodial, legal, and audit fees. The Board also noted that Fidelity may agree to waive fees or reimburse expenses from time to time, and the extent to which, if any, it has done so for each fund. Each fund's representative class is compared to those funds and classes in the Total Mapped Group (used by the Board for management fee comparisons) that have a similar sales load structure. The Board also considered a total expense ASPG comparison for each fund, which focuses on the total expenses of the representative class relative to a subset of non-Fidelity funds within the total expense similar sales load structure group. The total expense ASPG is limited to 15 larger and 15 smaller classes in fund average assets for a total of 30 classes, where possible. The total expense ASPG comparison excludes performance adjustments and fund-paid 12b-1 fees to eliminate variability in fee structures.
The Board noted that the total net expense ratio of the retail class of each of Gold Portfolio and Materials Portfolio ranked below the similar sales load structure group competitive median and below the ASPG competitive median for the 12-month period ended September 30, 2021.
Fees Charged to Other Fidelity Clients. The Board also considered Fidelity fee structures and other information with respect to clients of Fidelity, such as other funds advised or subadvised by Fidelity, pension plan clients, and other institutional clients with similar mandates. The Board noted that a joint ad hoc committee created by it and the boards of other Fidelity funds periodically reviews and compares Fidelity's institutional investment advisory business with its business of providing services to the Fidelity funds and also noted the most recent findings of the committee. The Board noted that the committee's review included a consideration of the differences in services provided, fees charged, and costs incurred, as well as competition in the markets serving the different categories of clients.
Based on its review of total expense ratios and fees charged to other Fidelity clients, the Board concluded that the total expense ratio of each class of each fund was reasonable in light of the services that the fund and its shareholders receive and the other factors considered.
Costs of the Services and Profitability. The Board considered the revenues earned and the expenses incurred by Fidelity in conducting the business of developing, marketing, distributing, managing, administering and servicing each fund and servicing each fund's shareholders. The Board also considered the level of Fidelity's profits in respect of all the Fidelity funds.
On an annual basis, Fidelity presents to the Board information about the profitability of its relationships with each fund. Fidelity calculates profitability information for each fund, as well as aggregate profitability information for groups of Fidelity funds and all Fidelity funds, using a series of detailed revenue and cost allocation methodologies which originate with the books and records of Fidelity on which Fidelity's audited financial statements are based. The Audit Committee of the Board reviews any significant changes from the prior year's methodologies and the full Board approves such changes.
A public accounting firm has been engaged annually by the Board as part of the Board's assessment of Fidelity's profitability analysis. The engagement includes the review and assessment of the methodologies used by Fidelity in determining the revenues and expenses attributable to Fidelity's mutual fund business, and completion of agreed-upon procedures in respect of the mathematical accuracy of certain fund profitability information and its conformity to established allocation methodologies. After considering the reports issued under the engagement and information provided by Fidelity, the Board concluded that while other allocation methods may also be reasonable, Fidelity's profitability methodologies are reasonable in all material respects.
The Board also reviewed Fidelity's non-fund businesses and potential indirect benefits such businesses may have received as a result of their association with Fidelity's mutual fund business (i.e., fall-out benefits) as well as cases where Fidelity's affiliates may benefit from the funds' business. The Board considered areas where potential indirect benefits to the Fidelity funds from their relationships with Fidelity may exist. The Board's consideration of these matters was informed by the findings of a joint ad hoc committee created by it and the boards of other Fidelity funds to evaluate potential fall-out benefits.
The Board considered the costs of the services provided by and the profits realized by Fidelity in connection with the operation of each fund and was satisfied that the profitability was not excessive.
Economies of Scale. The Board considered whether there have been economies of scale in respect of the management of the Fidelity funds, whether the Fidelity funds (including each fund) have appropriately benefited from any such economies of scale, and whether there is potential for realization of any further economies of scale. The Board considered the extent to which each fund will benefit from economies of scale as assets grow through increased services to the fund, through waivers or reimbursements, or through fee or expense ratio reductions. The Board also noted that a committee (the Economies of Scale Committee) created by it and the boards of other Fidelity funds periodically analyzes whether Fidelity attains economies of scale in respect of the management and servicing of the Fidelity funds, whether the Fidelity funds have appropriately benefited from such economies of scale, and whether there is potential for realization of any further economies of scale.
The Board recognized that each fund's management contract incorporates a "group fee" structure, which provides for lower group fee rates as total "group assets" increase, and for higher group fee rates as total "group assets" decrease ("group assets" as defined in the management contracts). FMR calculates the group fee rates based on a tiered asset "breakpoint" schedule that varies based on asset class. The Board considered that the group fee is designed to deliver the benefits of economies of scale to fund shareholders when total Fidelity fund assets increase, even if assets of any particular fund are unchanged or have declined, because some portion of Fidelity's costs are attributable to services provided to all Fidelity funds, and all funds benefit if those costs can be allocated among more assets. The Board further considered that Fidelity agreed to impose a temporary fee waiver in the form of additional breakpoints to the current breakpoint schedule. The Board concluded that, given the group fee structure, fund shareholders will benefit from lower management fees as "group assets" increase at the fund complex level, regardless of whether Fidelity achieves any such economies of scale.
The Board concluded, taking into account the analysis of the Economies of Scale Committee, that economies of scale, if any, are being appropriately shared between fund shareholders and Fidelity.
Additional Information Requested by the Board. In order to develop fully the factual basis for consideration of the Fidelity funds' advisory contracts, the Board requested and received additional information on certain topics, including: (i) fund flow and performance trends, in particular the underperformance of certain funds and strategies, and Fidelity's long-term strategies for certain funds, including any consideration of fund liquidations or mergers; (ii) the operation of performance fees, competitor use of performance fees, and consideration of the expansion of performance fees to additional funds; (iii) Fidelity's pricing philosophy compared to competitors; (iv) fund profitability methodology and data; (v) evaluation of competitive fund data and peer group classifications and fee and expense comparisons; (vi) the management fee and expense structures for different funds and classes and information about the differences between various fee and expense structures; (vii) group fee breakpoints and related voluntary fee waivers; and (viii) information regarding other accounts managed by Fidelity and the funds' sub-advisory arrangements.
Based on its evaluation of all of the conclusions noted above, and after considering all factors it believed relevant, the Board concluded that the advisory fee arrangements are fair and reasonable and that each fund's Advisory Contracts should be renewed.
1.846035.115
SELMT-SANN-1022
Fidelity® Select Portfolios®
Information Technology Sector
IT Services Portfolio
Semiconductors Portfolio
Software and IT Services Portfolio
Tech Hardware Portfolio
Technology Portfolio
Semi-Annual Report
August 31, 2022
Contents
To view a fund's proxy voting guidelines and proxy voting record for the 12-month period ended June 30, visit http://www.fidelity.com/proxyvotingresults or visit the Securities and Exchange Commission's (SEC) web site at http://www.sec.gov.
You may also call 1-800-544-8544 to request a free copy of the proxy voting guidelines.
Standard & Poor's, S&P and S&P 500 are registered service marks of The McGraw-Hill Companies, Inc. and have been licensed for use by Fidelity Distributors Corporation.
Other third-party marks appearing herein are the property of their respective owners.
All other marks appearing herein are registered or unregistered trademarks or service marks of FMR LLC or an affiliated company. © 2022 FMR LLC. All rights reserved.
This report and the financial statements contained herein are submitted for the general information of the shareholders of the Fund. This report is not authorized for distribution to prospective investors in the Fund unless preceded or accompanied by an effective prospectus.
A fund files its complete schedule of portfolio holdings with the SEC for the first and third quarters of each fiscal year on Form N-PORT. Forms N-PORT are available on the SEC's web site at http://www.sec.gov. A fund's Forms N-PORT may be reviewed and copied at the SEC's Public Reference Room in Washington, DC. Information regarding the operation of the SEC's Public Reference Room may be obtained by calling 1-800-SEC-0330.
For a complete list of a fund's portfolio holdings, view the most recent holdings listing, semiannual report, or annual report on Fidelity's web site at http://www.fidelity.com, http://www.institutional.fidelity.com, or http://www.401k.com, as applicable.
NOT FDIC INSURED •MAY LOSE VALUE •NO BANK GUARANTEE
Neither the Fund nor Fidelity Distributors Corporation is a bank.
Top Holdings (% of Fund's net assets) |
| |
| Visa, Inc. Class A | 19.4 | |
| MasterCard, Inc. Class A | 16.5 | |
| Accenture PLC Class A | 12.2 | |
| EPAM Systems, Inc. | 5.0 | |
| Cognizant Technology Solutions Corp. Class A | 4.1 | |
| ExlService Holdings, Inc. | 4.0 | |
| Block, Inc. Class A | 3.7 | |
| H&R Block, Inc. | 3.4 | |
| Paychex, Inc. | 3.3 | |
| Intuit, Inc. | 3.3 | |
| | 74.9 | |
| |
| Industries (% of Fund's net assets) |
| |
| IT Services | 88.2 | |
| Software | 5.9 | |
| Diversified Consumer Services | 3.4 | |
| Internet & Direct Marketing Retail | 1.5 | |
| Consumer Finance | 0.4 | |
| |
Percentages shown as 0.0% may reflect amounts less than 0.05%.
Percentages shown as 0.0% may reflect amounts less than 0.05%.
Geographic Diversification (% of Fund's net assets) |
|
* Includes Short-Term investments and Net Other Assets (Liabilities). Percentages are based on country or territory of incorporation and are adjusted for the effect of futures contracts, if applicable. |
| |
Percentages shown as 0.0% reflect amounts less than 0.05%.
IT Services Portfolio
| Common Stocks - 99.4% |
| | | Shares | Value ($) |
| Consumer Finance - 0.4% | | | |
| Consumer Finance - 0.4% | | | |
| NerdWallet, Inc. (a) | | 988,700 | 10,272,593 |
| Diversified Consumer Services - 3.4% | | | |
| Specialized Consumer Services - 3.4% | | | |
| H&R Block, Inc. | | 1,716,500 | 77,242,500 |
| Internet & Direct Marketing Retail - 1.5% | | | |
| Internet & Direct Marketing Retail - 1.5% | | | |
| Global-e Online Ltd. (a)(b) | | 1,096,525 | 34,639,225 |
| IT Services - 88.2% | | | |
| Data Processing & Outsourced Services - 58.0% | | | |
| Automatic Data Processing, Inc. | | 147,575 | 36,068,806 |
| Block, Inc. Class A (a)(b) | | 1,222,000 | 84,208,020 |
| ExlService Holdings, Inc. (b) | | 540,500 | 90,647,255 |
| Fidelity National Information Services, Inc. | | 639,659 | 58,445,643 |
| Fiserv, Inc. (b) | | 590,117 | 59,713,939 |
| MasterCard, Inc. Class A | | 1,164,000 | 377,566,680 |
| Nuvei Corp. (a)(c) | | 201,300 | 6,157,767 |
| Paychex, Inc. | | 614,000 | 75,730,760 |
| PayPal Holdings, Inc. (b) | | 191,640 | 17,906,842 |
| TaskUs, Inc. (a)(b) | | 424,637 | 6,318,599 |
| The Western Union Co. | | 4,800 | 71,136 |
| Visa, Inc. Class A (a) | | 2,231,148 | 443,351,418 |
| WEX, Inc. (b) | | 700 | 107,975 |
| WNS Holdings Ltd. sponsored ADR (b) | | 816,492 | 68,789,451 |
| | | | 1,325,084,291 |
| Internet Services & Infrastructure - 4.7% | | | |
| Cloudflare, Inc. (b) | | 272,900 | 17,075,353 |
| GoDaddy, Inc. (b) | | 54,427 | 4,126,655 |
| MongoDB, Inc. Class A (a)(b) | | 167,800 | 54,175,908 |
| Okta, Inc. (b) | | 96,800 | 8,847,520 |
| Snowflake, Inc. (a)(b) | | 123,000 | 22,256,850 |
| | | | 106,482,286 |
| IT Consulting & Other Services - 25.5% | | | |
| Accenture PLC Class A | | 963,480 | 277,925,441 |
| Amdocs Ltd. | | 251,200 | 21,470,064 |
| CI&T, Inc. Class A (a) | | 101,656 | 930,152 |
| Cognizant Technology Solutions Corp. Class A | | 1,493,232 | 94,327,465 |
| DXC Technology Co. (b) | | 447,200 | 11,081,616 |
| EPAM Systems, Inc. (b) | | 267,200 | 113,960,800 |
| Gartner, Inc. (b) | | 224,100 | 63,940,212 |
| | | | 583,635,750 |
TOTAL IT SERVICES | | | 2,015,202,327 |
| Software - 5.9% | | | |
| Application Software - 5.9% | | | |
| Intuit, Inc. | | 174,556 | 75,369,790 |
| Paycom Software, Inc. (b) | | 168,000 | 59,001,600 |
| | | | 134,371,390 |
| TOTAL COMMON STOCKS (Cost $1,382,391,580) | | | 2,271,728,035 |
| | | | |
| Money Market Funds - 20.2% |
| | | Shares | Value ($) |
| Fidelity Cash Central Fund 2.33% (d) | | 13,521,023 | 13,523,727 |
| Fidelity Securities Lending Cash Central Fund 2.34% (d)(e) | | 448,448,365 | 448,493,210 |
| TOTAL MONEY MARKET FUNDS (Cost $462,016,937) | | | 462,016,937 |
| | | | |
| TOTAL INVESTMENT IN SECURITIES - 119.6% (Cost $1,844,408,517) | 2,733,744,972 |
NET OTHER ASSETS (LIABILITIES) - (19.6)% | (448,469,918) |
| NET ASSETS - 100.0% | 2,285,275,054 |
| | |
Legend
| (a) | Security or a portion of the security is on loan at period end. |
| (c) | Security exempt from registration under Rule 144A of the Securities Act of 1933. These securities may be resold in transactions exempt from registration, normally to qualified institutional buyers. At the end of the period, the value of these securities amounted to $6,157,767 or 0.3% of net assets. |
| (d) | Affiliated fund that is generally available only to investment companies and other accounts managed by Fidelity Investments. The rate quoted is the annualized seven-day yield of the fund at period end. A complete unaudited listing of the fund's holdings as of its most recent quarter end is available upon request. In addition, each Fidelity Central Fund's financial statements are available on the SEC's website or upon request. |
| (e) | Investment made with cash collateral received from securities on loan. |
Affiliated Central Funds
Fiscal year to date information regarding the Fund's investments in Fidelity Central Funds, including the ownership percentage, is presented below.
| Affiliate | Value, beginning of period ($) | Purchases ($) | Sales Proceeds ($) | Dividend Income ($) | Realized Gain (loss) ($) | Change in Unrealized appreciation (depreciation) ($) | Value, end of period ($) | %ownership, end of period |
| Fidelity Cash Central Fund 2.33% | 1,591,416 | 366,490,804 | 354,558,493 | 74,588 | - | - | 13,523,727 | 0.0% |
| Fidelity Securities Lending Cash Central Fund 2.34% | 84,129,800 | 1,020,962,541 | 656,599,131 | 200,562 | - | - | 448,493,210 | 1.3% |
| Total | 85,721,216 | 1,387,453,345 | 1,011,157,624 | 275,150 | - | - | 462,016,937 | |
| | | | | | | | | |
Amounts in the income column in the above table include any capital gain distributions from underlying funds, which are presented in the corresponding line item in the Statement of Operations, if applicable.
Amount for Fidelity Securities Lending Cash Central Fund represents the income earned on investing cash collateral, less rebates paid to borrowers and any lending agent fees associated with the loan, plus any premium payments received for lending certain types of securities.
Investment Valuation
The following is a summary of the inputs used, as of August 31, 2022, involving the Fund's assets and liabilities carried at fair value. The inputs or methodology used for valuing securities may not be an indication of the risk associated with investing in those securities. For more information on valuation inputs, and their aggregation into the levels used below, please refer to the Investment Valuation section in the accompanying Notes to Financial Statements.
| Valuation Inputs at Reporting Date: |
| Description | Total ($) | Level 1 ($) | Level 2 ($) | Level 3 ($) |
Investments in Securities: | | | | |
|
| Common Stocks | 2,271,728,035 | 2,271,728,035 | - | - |
|
| Money Market Funds | 462,016,937 | 462,016,937 | - | - |
| Total Investments in Securities: | 2,733,744,972 | 2,733,744,972 | - | - |
IT Services Portfolio
| Statement of Assets and Liabilities |
| | | | August 31, 2022 (Unaudited) |
| | | | | |
| Assets | | | | |
| Investment in securities, at value (including securities loaned of $432,869,824) - See accompanying schedule: | | $2,271,728,035 | | |
Unaffiliated issuers (cost $1,382,391,580) | | | |
Fidelity Central Funds (cost $462,016,937) | | 462,016,937 | | |
| | | | | |
| Total Investment in Securities (cost $1,844,408,517) | | | $ | 2,733,744,972 |
| Receivable for investments sold | | | | 2,314,116 |
| Receivable for fund shares sold | | | | 194,259 |
| Dividends receivable | | | | 922,368 |
| Distributions receivable from Fidelity Central Funds | | | | 57,265 |
| Prepaid expenses | | | | 10,950 |
| Other receivables | | | | 39,187 |
Total assets | | | | 2,737,283,117 |
| Liabilities | | | | |
| Payable for fund shares redeemed | | $2,061,559 | | |
| Accrued management fee | | 1,067,216 | | |
| Other affiliated payables | | 380,610 | | |
| Other payables and accrued expenses | | 21,558 | | |
| Collateral on securities loaned | | 448,477,120 | | |
| Total Liabilities | | | | 452,008,063 |
| Net Assets | | | $ | 2,285,275,054 |
| Net Assets consist of: | | | | |
| Paid in capital | | | $ | 1,394,578,057 |
| Total accumulated earnings (loss) | | | | 890,696,997 |
| Net Assets | | | $ | 2,285,275,054 |
Net Asset Value , offering price and redemption price per share ($2,285,275,054 ÷ 41,517,466 shares) | | | $ | 55.04 |
| | | | | |
| Statement of Operations |
| | | | Six months ended August 31, 2022 (Unaudited) |
| Investment Income | | | | |
| Dividends | | | $ | 8,698,191 |
| Income from Fidelity Central Funds (including $200,562 from security lending) | | | | 275,150 |
| Total Income | | | | 8,973,341 |
| Expenses | | | | |
| Management fee | $ | 6,442,805 | | |
| Transfer agent fees | | 2,044,894 | | |
| Accounting fees | | 344,774 | | |
| Custodian fees and expenses | | 7,312 | | |
| Independent trustees' fees and expenses | | 4,058 | | |
| Registration fees | | 13,008 | | |
| Audit | | 18,459 | | |
| Legal | | 1,390 | | |
| Interest | | 1,940 | | |
| Miscellaneous | | 10,174 | | |
| Total expenses before reductions | | 8,888,814 | | |
| Expense reductions | | (41,669) | | |
| Total expenses after reductions | | | | 8,847,145 |
| Net Investment income (loss) | | | | 126,196 |
| Realized and Unrealized Gain (Loss) | | | | |
| Net realized gain (loss) on: | | | | |
| Investment Securities: | | | | |
| Unaffiliated issuers | | 12,994,131 | | |
| Foreign currency transactions | | (6,366) | | |
| Total net realized gain (loss) | | | | 12,987,765 |
| Change in net unrealized appreciation (depreciation) on: | | | | |
| Investment Securities: | | | | |
| Unaffiliated issuers | | (354,683,730) | | |
| Assets and liabilities in foreign currencies | | (1,352) | | |
| Total change in net unrealized appreciation (depreciation) | | | | (354,685,082) |
| Net gain (loss) | | | | (341,697,317) |
| Net increase (decrease) in net assets resulting from operations | | | $ | (341,571,121) |
| Statement of Changes in Net Assets |
| |
| | Six months ended August 31, 2022 (Unaudited) | | Year ended February 28, 2022 |
| Increase (Decrease) in Net Assets | | | | |
| Operations | | | | |
| Net investment income (loss) | $ | 126,196 | $ | (11,605,499) |
| Net realized gain (loss) | | 12,987,765 | | 758,484,744 |
| Change in net unrealized appreciation (depreciation) | | (354,685,082) | | (1,177,179,444) |
| Net increase (decrease) in net assets resulting from operations | | (341,571,121) | | (430,300,199) |
| Distributions to shareholders | | (302,093,148) | | (528,547,016) |
| Share transactions | | | | |
| Proceeds from sales of shares | | 69,212,647 | | 283,388,277 |
| Reinvestment of distributions | | 284,162,618 | | 495,301,813 |
| Cost of shares redeemed | | (298,274,895) | | (1,081,314,912) |
Net increase (decrease) in net assets resulting from share transactions | | 55,100,370 | | (302,624,822) |
| Total increase (decrease) in net assets | | (588,563,899) | | (1,261,472,037) |
| | | | | |
| Net Assets | | | | |
| Beginning of period | | 2,873,838,953 | | 4,135,310,990 |
| End of period | $ | 2,285,275,054 | $ | 2,873,838,953 |
| | | | | |
| Other Information | | | | |
| Shares | | | | |
| Sold | | 1,156,483 | | 3,049,821 |
| Issued in reinvestment of distributions | | 4,603,315 | | 5,895,522 |
| Redeemed | | (5,141,449) | | (12,068,264) |
| Net increase (decrease) | | 618,349 | | (3,122,921) |
| | | | | |
| | Six months ended (Unaudited) August 31, 2022 | | Years ended February 28, 2022 | | 2021 | | 2020 A | | 2019 | | 2018 |
Selected Per-Share Data | | | | | | | | | | | | |
| Net asset value, beginning of period | $ | 70.27 | $ | 93.94 | $ | 73.62 | $ | 64.96 | $ | 58.69 | $ | 44.84 |
| Income from Investment Operations | | | | | | | | | | | | |
Net investment income (loss) B,C | | - | | (.27) | | (.09) | | .03 | | .04 | | .04 |
| Net realized and unrealized gain (loss) | | (7.68) | | (10.44) | | 25.34 | | 10.36 | | 8.92 | | 15.50 |
| Total from investment operations | | (7.68) | | (10.71) | | 25.25 | | 10.39 | | 8.96 | | 15.54 |
| Distributions from net investment income | | - | | - | | (.01) | | (.03) | | (.03) | | (.02) |
| Distributions from net realized gain | | (7.55) | | (12.96) | | (4.93) | | (1.70) | | (2.66) | | (1.67) |
| Total distributions | | (7.55) | | (12.96) | | (4.93) D | | (1.73) | | (2.69) | | (1.69) |
| Net asset value, end of period | $ | 55.04 | $ | 70.27 | $ | 93.94 | $ | 73.62 | $ | 64.96 | $ | 58.69 |
Total Return E,F | | (12.09)% | | (13.31)% | | 34.67% | | 15.99% | | 16.04% | | 35.17% |
Ratios to Average Net Assets C,G,H | | | | | | | | | | | | |
| Expenses before reductions | | .73% I | | .70% | | .72% | | .73% | | .74% | | .77% |
| Expenses net of fee waivers, if any | | .72% I | | .70% | | .72% | | .73% | | .74% | | .77% |
| Expenses net of all reductions | | .72% I | | .70% | | .72% | | .73% | | .74% | | .77% |
| Net investment income (loss) | | .01% I | | (.29)% | | (.11)% | | .04% | | .06% | | .08% |
| Supplemental Data | | | | | | | | | | | | |
| Net assets, end of period (000 omitted) | $ | 2,285,275 | $ | 2,873,839 | $ | 4,135,311 | $ | 4,099,114 | $ | 2,867,321 | $ | 2,284,152 |
Portfolio turnover rate J | | 48% I | | 41% | | 31% | | 24% | | 26% | | 26% |
A For the year ended February 29.
B Calculated based on average shares outstanding during the period.
C Net investment income (loss) is affected by the timing of the declaration of dividends by any underlying mutual funds or exchange-traded funds (ETFs). Net investment income (loss) of any such underlying funds is not included in the Fund's net investment income (loss) ratio.
D Total distributions per share do not sum due to rounding.
E Total returns for periods of less than one year are not annualized.
F Total returns would have been lower if certain expenses had not been reduced during the applicable periods shown.
G Fees and expenses of any underlying mutual funds or exchange-traded funds (ETFs) are not included in the Fund's expense ratio. The Fund indirectly bears its proportionate share of these expenses. For additional expense information related to investments in Fidelity Central Funds, please refer to the "Investments in Fidelity Central Funds" note found in the Notes to Financial Statements section of the most recent Annual or Semi-Annual report.
H Expense ratios reflect operating expenses of the class. Expenses before reductions do not reflect amounts reimbursed, waived, or reduced through arrangements with the investment adviser, brokerage services, or other offset arrangements, if applicable, and do not represent the amount paid by the class during periods when reimbursements, waivers or reductions occur.
I Annualized
J Amount does not include the portfolio activity of any underlying mutual funds or exchange-traded funds (ETFs).
Top Holdings (% of Fund's net assets) |
| |
| NVIDIA Corp. | 20.5 | |
| NXP Semiconductors NV | 10.1 | |
| Marvell Technology, Inc. | 9.1 | |
| onsemi | 8.4 | |
| GlobalFoundries, Inc. | 5.2 | |
| Microchip Technology, Inc. | 4.8 | |
| Advanced Micro Devices, Inc. | 4.7 | |
| Broadcom, Inc. | 4.2 | |
| Teradyne, Inc. | 3.5 | |
| Cadence Design Systems, Inc. | 2.9 | |
| | 73.4 | |
| |
| Industries (% of Fund's net assets) |
| |
| Semiconductors & Semiconductor Equipment | 94.0 | |
| Software | 2.9 | |
| Electronic Equipment & Components | 1.6 | |
| Electrical Equipment | 0.3 | |
| Metals & Mining | 0.1 | |
| Technology Hardware, Storage & Peripherals | 0.0 | |
| |
Percentages shown as 0.0% may reflect amounts less than 0.05%.
Percentages shown as 0.0% may reflect amounts less than 0.05%.
Percentages shown as 0.0% reflect amounts less than 0.05%.
Geographic Diversification (% of Fund's net assets) |
|
* Includes Short-Term investments and Net Other Assets (Liabilities). Percentages are based on country or territory of incorporation and are adjusted for the effect of futures contracts, if applicable. |
| |
Semiconductors Portfolio
| Common Stocks - 98.1% |
| | | Shares | Value ($) |
| Electrical Equipment - 0.3% | | | |
| Electrical Components & Equipment - 0.3% | | | |
| Array Technologies, Inc. (a) | | 983,600 | 20,557,240 |
| Electronic Equipment & Components - 1.6% | | | |
| Electronic Equipment & Instruments - 0.0% | | | |
| Aeva Technologies, Inc. (a)(b) | | 1,097,800 | 3,381,224 |
| Electronic Manufacturing Services - 1.6% | | | |
| Flex Ltd. (a) | | 1,244,200 | 22,159,202 |
| Jabil, Inc. | | 1,319,958 | 79,593,467 |
| | | | 101,752,669 |
TOTAL ELECTRONIC EQUIPMENT & COMPONENTS | | | 105,133,893 |
| Semiconductors & Semiconductor Equipment - 93.3% | | | |
| Semiconductor Equipment - 8.6% | | | |
| Enphase Energy, Inc. (a) | | 57,000 | 16,327,080 |
| KLA Corp. | | 170,013 | 58,506,574 |
| Lam Research Corp. | | 356,873 | 156,278,255 |
| Nova Ltd. (a)(b) | | 1,038,428 | 103,136,669 |
| Teradyne, Inc. (b) | | 2,677,822 | 226,650,854 |
| | | | 560,899,432 |
| Semiconductors - 84.7% | | | |
| Advanced Micro Devices, Inc. (a) | | 3,581,218 | 303,937,972 |
| Allegro MicroSystems LLC (a) | | 2,347,000 | 54,732,040 |
| Alpha & Omega Semiconductor Ltd. (a) | | 513,296 | 19,844,023 |
| Analog Devices, Inc. | | 1,186,538 | 179,796,103 |
| ASE Technology Holding Co. Ltd. ADR (b) | | 1,396,600 | 8,044,416 |
| Broadcom, Inc. | | 550,950 | 274,984,655 |
| Cirrus Logic, Inc. (a) | | 1,315,779 | 100,907,092 |
| Diodes, Inc. (a) | | 809,700 | 57,626,349 |
| GlobalFoundries, Inc. (b) | | 5,622,293 | 336,325,567 |
| Lattice Semiconductor Corp. (a) | | 244,000 | 13,151,600 |
| MACOM Technology Solutions Holdings, Inc. (a) | | 1,691,900 | 93,308,285 |
| Marvell Technology, Inc. | | 12,731,677 | 596,097,117 |
| MaxLinear, Inc. Class A (a) | | 1,524,331 | 54,769,213 |
| Microchip Technology, Inc. | | 4,840,198 | 315,822,920 |
| Monolithic Power Systems, Inc. | | 239,000 | 108,310,020 |
| NVIDIA Corp. | | 8,859,568 | 1,337,263,193 |
| NXP Semiconductors NV | | 4,010,288 | 660,013,199 |
| onsemi (a) | | 7,998,709 | 550,071,218 |
| Qualcomm, Inc. | | 911,288 | 120,536,064 |
| Skyworks Solutions, Inc. | | 459,500 | 45,283,725 |
| SMART Global Holdings, Inc. (a)(b) | | 760,000 | 13,946,000 |
| Synaptics, Inc. (a) | | 306,664 | 35,453,425 |
| Taiwan Semiconductor Manufacturing Co. Ltd. sponsored ADR | | 2,200,100 | 183,378,335 |
| Texas Instruments, Inc. | | 265,635 | 43,885,558 |
| Wolfspeed, Inc. (a)(b) | | 195,200 | 22,149,344 |
| | | | 5,529,637,433 |
TOTAL SEMICONDUCTORS & SEMICONDUCTOR EQUIPMENT | | | 6,090,536,865 |
| Software - 2.9% | | | |
| Application Software - 2.9% | | | |
| Cadence Design Systems, Inc. (a) | | 1,077,800 | 187,289,306 |
| Technology Hardware, Storage & Peripherals - 0.0% | | | |
| Technology Hardware, Storage & Peripherals - 0.0% | | | |
| IonQ, Inc. (a)(c) | | 155,600 | 924,264 |
| TOTAL COMMON STOCKS (Cost $4,778,032,402) | | | 6,404,441,568 |
| | | | |
| Convertible Preferred Stocks - 0.6% |
| | | Shares | Value ($) |
| Electronic Equipment & Components - 0.0% | | | |
| Electronic Components - 0.0% | | | |
| Menlo Micro, Inc. Series C (c)(d) | | 739,500 | 778,324 |
| Metals & Mining - 0.1% | | | |
| Precious Metals & Minerals - 0.1% | | | |
| Diamond Foundry, Inc. Series C (a)(c)(d) | | 189,999 | 6,028,668 |
| Semiconductors & Semiconductor Equipment - 0.5% | | | |
| Semiconductor Equipment - 0.2% | | | |
| Astera Labs, Inc.: | | | |
| Series A (c)(d) | | 269,049 | 2,736,094 |
| Series B (c)(d) | | 45,810 | 465,865 |
| Series C (c)(d) | | 185,800 | 1,889,493 |
| Series D (c)(d) | | 1,092,759 | 11,112,813 |
| | | | 16,204,265 |
| Semiconductors - 0.3% | | | |
| Alif Semiconductor Series C (c)(d) | | 444,283 | 9,018,296 |
| GaN Systems, Inc.: | | | |
| Series F1 (c)(d) | | 496,628 | 3,332,374 |
| Series F2 (c)(d) | | 262,241 | 1,759,637 |
| SiMa.ai: | | | |
| Series B (a)(c)(d) | | 309,900 | 2,197,470 |
| Series B1 (c)(d) | | 20,760 | 147,207 |
| | | | 16,454,984 |
TOTAL SEMICONDUCTORS & SEMICONDUCTOR EQUIPMENT | | | 32,659,249 |
| Software - 0.0% | | | |
| Systems Software - 0.0% | | | |
| Tenstorrent, Inc. Series C1 (a)(c)(d) | | 8,800 | 495,264 |
| TOTAL CONVERTIBLE PREFERRED STOCKS (Cost $38,192,468) | | | 39,961,505 |
| | | | |
| Preferred Securities - 0.2% |
| | | Principal Amount (e) | Value ($) |
| Semiconductors & Semiconductor Equipment - 0.2% | | | |
| Semiconductors - 0.2% | | | |
| GaN Systems, Inc. 0% (c)(d)(f) | | 11,640,267 | 11,640,267 |
| Software - 0.0% | | | |
| Systems Software - 0.0% | | | |
| Tenstorrent, Inc. 0% (c)(d)(f) | | 490,000 | 490,000 |
| TOTAL PREFERRED SECURITIES (Cost $12,130,267) | | | 12,130,267 |
| | | | |
| Money Market Funds - 6.1% |
| | | Shares | Value ($) |
| Fidelity Cash Central Fund 2.33% (g) | | 50,110,447 | 50,120,469 |
| Fidelity Securities Lending Cash Central Fund 2.34% (g)(h) | | 348,071,110 | 348,105,917 |
| TOTAL MONEY MARKET FUNDS (Cost $398,226,386) | | | 398,226,386 |
| | | | |
| TOTAL INVESTMENT IN SECURITIES - 105.0% (Cost $5,226,581,523) | 6,854,759,726 |
NET OTHER ASSETS (LIABILITIES) - (5.0)% | (325,333,842) |
| NET ASSETS - 100.0% | 6,529,425,884 |
| | |
Legend
| (b) | Security or a portion of the security is on loan at period end. |
| (c) | Restricted securities (including private placements) - Investment in securities not registered under the Securities Act of 1933 (excluding 144A issues). At the end of the period, the value of restricted securities (excluding 144A issues) amounted to $53,016,036 or 0.8% of net assets. |
| (e) | Amount is stated in United States dollars unless otherwise noted. |
| (f) | Security is perpetual in nature with no stated maturity date. |
| (g) | Affiliated fund that is generally available only to investment companies and other accounts managed by Fidelity Investments. The rate quoted is the annualized seven-day yield of the fund at period end. A complete unaudited listing of the fund's holdings as of its most recent quarter end is available upon request. In addition, each Fidelity Central Fund's financial statements are available on the SEC's website or upon request. |
| (h) | Investment made with cash collateral received from securities on loan. |
| Additional information on each restricted holding is as follows: |
| Security | Acquisition Date | Acquisition Cost ($) |
| Alif Semiconductor Series C | 3/08/22 | 9,018,296 |
| Astera Labs, Inc. Series A | 5/17/22 | 2,736,094 |
| Astera Labs, Inc. Series B | 5/17/22 | 465,865 |
| Astera Labs, Inc. Series C | 8/24/21 | 624,622 |
| Astera Labs, Inc. Series D | 5/17/22 - 5/27/22 | 11,112,812 |
| Diamond Foundry, Inc. Series C | 3/15/21 | 4,559,976 |
| GaN Systems, Inc. Series F1 | 11/30/21 | 4,211,405 |
| GaN Systems, Inc. Series F2 | 11/30/21 | 2,223,804 |
| GaN Systems, Inc. 0% | 11/30/21 | 11,640,267 |
| IonQ, Inc. | 3/07/21 | 1,556,000 |
| Menlo Micro, Inc. Series C | 2/09/22 | 980,207 |
| SiMa.ai Series B | 5/10/21 | 1,588,981 |
| SiMa.ai Series B1 | 4/25/22 | 147,207 |
| Tenstorrent, Inc. Series C1 | 4/23/21 | 523,198 |
| Tenstorrent, Inc. 0% | 4/23/21 | 490,000 |
Affiliated Central Funds
Fiscal year to date information regarding the Fund's investments in Fidelity Central Funds, including the ownership percentage, is presented below.
| Affiliate | Value, beginning of period ($) | Purchases ($) | Sales Proceeds ($) | Dividend Income ($) | Realized Gain (loss) ($) | Change in Unrealized appreciation (depreciation) ($) | Value, end of period ($) | %ownership, end of period |
| Fidelity Cash Central Fund 2.33% | 56,307,633 | 686,529,507 | 692,716,671 | 368,695 | - | - | 50,120,469 | 0.1% |
| Fidelity Securities Lending Cash Central Fund 2.34% | 109,291,689 | 1,130,930,725 | 892,116,497 | 1,304,592 | - | - | 348,105,917 | 1.0% |
| Total | 165,599,322 | 1,817,460,232 | 1,584,833,168 | 1,673,287 | - | - | 398,226,386 | |
| | | | | | | | | |
Amounts in the income column in the above table include any capital gain distributions from underlying funds, which are presented in the corresponding line item in the Statement of Operations, if applicable.
Amount for Fidelity Securities Lending Cash Central Fund represents the income earned on investing cash collateral, less rebates paid to borrowers and any lending agent fees associated with the loan, plus any premium payments received for lending certain types of securities.
Investment Valuation
The following is a summary of the inputs used, as of August 31, 2022, involving the Fund's assets and liabilities carried at fair value. The inputs or methodology used for valuing securities may not be an indication of the risk associated with investing in those securities. For more information on valuation inputs, and their aggregation into the levels used below, please refer to the Investment Valuation section in the accompanying Notes to Financial Statements.
| Valuation Inputs at Reporting Date: |
| Description | Total ($) | Level 1 ($) | Level 2 ($) | Level 3 ($) |
Investments in Securities: | | | | |
|
| Common Stocks | 6,404,441,568 | 6,404,441,568 | - | - |
|
| Convertible Preferred Stocks | 39,961,505 | - | - | 39,961,505 |
|
| Preferred Securities | 12,130,267 | - | - | 12,130,267 |
|
| Money Market Funds | 398,226,386 | 398,226,386 | - | - |
| Total Investments in Securities: | 6,854,759,726 | 6,802,667,954 | - | 52,091,772 |
Semiconductors Portfolio
| Statement of Assets and Liabilities |
| | | | August 31, 2022 (Unaudited) |
| | | | | |
| Assets | | | | |
| Investment in securities, at value (including securities loaned of $334,831,813) - See accompanying schedule: | | $6,456,533,340 | | |
Unaffiliated issuers (cost $4,828,355,137) | | | |
Fidelity Central Funds (cost $398,226,386) | | 398,226,386 | | |
| | | | | |
| Total Investment in Securities (cost $5,226,581,523) | | | $ | 6,854,759,726 |
| Receivable for investments sold | | | | 29,764,292 |
| Receivable for fund shares sold | | | | 1,952,878 |
| Dividends receivable | | | | 3,978,814 |
| Distributions receivable from Fidelity Central Funds | | | | 845,106 |
| Prepaid expenses | | | | 24,134 |
| Other receivables | | | | 194,636 |
Total assets | | | | 6,891,519,586 |
| Liabilities | | | | |
| Payable for fund shares redeemed | | 9,697,599 | | |
| Accrued management fee | | 3,162,561 | | |
| Other affiliated payables | | 895,514 | | |
| Other payables and accrued expenses | | 232,111 | | |
| Collateral on securities loaned | | 348,105,917 | | |
| Total Liabilities | | | | 362,093,702 |
| Net Assets | | | $ | 6,529,425,884 |
| Net Assets consist of: | | | | |
| Paid in capital | | | $ | 4,853,234,435 |
| Total accumulated earnings (loss) | | | | 1,676,191,449 |
| Net Assets | | | $ | 6,529,425,884 |
Net Asset Value , offering price and redemption price per share ($6,529,425,884 ÷ 416,013,220 shares) | | | $ | 15.70 |
| | | | | |
| Statement of Operations |
| | | | Six months ended August 31, 2022 (Unaudited) |
| Investment Income | | | | |
| Dividends | | | $ | 26,307,712 |
| Income from Fidelity Central Funds (including $1,304,592 from security lending) | | | | 1,673,287 |
| Total Income | | | | 27,980,999 |
| Expenses | | | | |
| Management fee | $ | 18,905,568 | | |
| Transfer agent fees | | 5,097,057 | | |
| Accounting fees | | 554,574 | | |
| Custodian fees and expenses | | 39,418 | | |
| Independent trustees' fees and expenses | | 11,784 | | |
| Registration fees | | 58,121 | | |
| Audit | | 18,459 | | |
| Legal | | 2,673 | | |
| Interest | | 1,055 | | |
| Miscellaneous | | 19,179 | | |
| Total expenses before reductions | | 24,707,888 | | |
| Expense reductions | | (122,726) | | |
| Total expenses after reductions | | | | 24,585,162 |
| Net Investment income (loss) | | | | 3,395,837 |
| Realized and Unrealized Gain (Loss) | | | | |
| Net realized gain (loss) on: | | | | |
| Investment Securities: | | | | |
| Unaffiliated issuers | | 66,711,714 | | |
| Foreign currency transactions | | (121,340) | | |
| Total net realized gain (loss) | | | | 66,590,374 |
| Change in net unrealized appreciation (depreciation) on: | | | | |
| Investment Securities: | | | | |
| Unaffiliated issuers | | (1,705,929,881) | | |
| Assets and liabilities in foreign currencies | | 2,729 | | |
| Total change in net unrealized appreciation (depreciation) | | | | (1,705,927,152) |
| Net gain (loss) | | | | (1,639,336,778) |
| Net increase (decrease) in net assets resulting from operations | | | $ | (1,635,940,941) |
| Statement of Changes in Net Assets |
| |
| | Six months ended August 31, 2022 (Unaudited) | | Year ended February 28, 2022 |
| Increase (Decrease) in Net Assets | | | | |
| Operations | | | | |
| Net investment income (loss) | $ | 3,395,837 | $ | 2,075,831 |
| Net realized gain (loss) | | 66,590,374 | | 704,123,799 |
| Change in net unrealized appreciation (depreciation) | | (1,705,927,152) | | 616,660,274 |
| Net increase (decrease) in net assets resulting from operations | | (1,635,940,941) | | 1,322,859,904 |
| Distributions to shareholders | | (287,580,089) | | (613,939,297) |
| Share transactions | | | | |
| Proceeds from sales of shares | | 719,339,001 | | 3,146,391,881 |
| Reinvestment of distributions | | 271,103,279 | | 580,580,568 |
| Cost of shares redeemed | | (964,418,385) | | (1,726,756,170) |
Net increase (decrease) in net assets resulting from share transactions | | 26,023,895 | | 2,000,216,279 |
| Total increase (decrease) in net assets | | (1,897,497,135) | | 2,709,136,886 |
| | | | | |
| Net Assets | | | | |
| Beginning of period | | 8,426,923,019 | | 5,717,786,133 |
| End of period | $ | 6,529,425,884 | $ | 8,426,923,019 |
| | | | | |
| Other Information | | | | |
| Shares | | | | |
| Sold | | 40,504,864 | | 150,199,767 |
| Issued in reinvestment of distributions | | 15,103,244 | | 28,114,026 |
| Redeemed | | (56,173,217) | | (86,759,172) |
| Net increase (decrease) | | (565,109) | | 91,554,621 |
| | | | | |
| | Six months ended (Unaudited) August 31, 2022 | | Years ended February 28, 2022 | | 2021 | | 2020 A | | 2019 B | | 2018 B |
Selected Per-Share Data | | | | | | | | | | | | |
| Net asset value, beginning of period | $ | 20.23 | $ | 17.59 | $ | 11.47 | $ | 9.41 | $ | 11.77 | $ | 10.12 |
| Income from Investment Operations | | | | | | | | | | | | |
Net investment income (loss) C,D | | .01 | | .01 | | .07 | | .09 | | .10 | | .05 |
| Net realized and unrealized gain (loss) | | (3.84) | | 4.30 | | 7.37 | | 2.39 | | (.35) | | 3.24 |
| Total from investment operations | | (3.83) | | 4.31 | | 7.44 | | 2.48 | | (.25) | | 3.29 |
| Distributions from net investment income | | - | | (.01) | | (.08) | | (.10) | | (.06) | | (.12) |
| Distributions from net realized gain | | (.70) | | (1.66) | | (1.24) | | (.33) | | (2.05) | | (1.52) |
| Total distributions | | (.70) | | (1.67) | | (1.32) | | (.42) E | | (2.11) | | (1.64) |
Redemption fees added to paid in capital C | | - | | - | | - | | - | | - | | - F |
| Net asset value, end of period | $ | 15.70 | $ | 20.23 | $ | 17.59 | $ | 11.47 | $ | 9.41 | $ | 11.77 |
Total Return G,H | | (19.38)% | | 24.57% | | 70.47% | | 26.01% | | .19% | | 34.20% |
Ratios to Average Net Assets D,I,J | | | | | | | | | | | | |
| Expenses before reductions | | .69% K | | .68% | | .70% | | .72% | | .73% | | .75% |
| Expenses net of fee waivers, if any | | .68% K | | .67% | | .70% | | .72% | | .73% | | .75% |
| Expenses net of all reductions | | .68% K | | .67% | | .69% | | .71% | | .72% | | .74% |
| Net investment income (loss) | | .09% K | | .03% | | .53% | | .85% | | .92% | | .47% |
| Supplemental Data | | | | | | | | | | | | |
| Net assets, end of period (000 omitted) | $ | 6,529,426 | $ | 8,426,923 | $ | 5,717,786 | $ | 3,778,557 | $ | 3,052,506 | $ | 3,652,565 |
Portfolio turnover rate L | | 31% K | | 33% | | 87% | | 114% | | 130% | | 110% |
A For the year ended February 29.
B Per share amounts have been adjusted to reflect the impact of the 10 for 1 share split that occurred on May 11, 2018.
C Calculated based on average shares outstanding during the period.
D Net investment income (loss) is affected by the timing of the declaration of dividends by any underlying mutual funds or exchange-traded funds (ETFs). Net investment income (loss) of any such underlying funds is not included in the Fund's net investment income (loss) ratio.
E Total distributions per share do not sum due to rounding.
F Amount represents less than $.005 per share.
G Total returns for periods of less than one year are not annualized.
H Total returns would have been lower if certain expenses had not been reduced during the applicable periods shown.
I Fees and expenses of any underlying mutual funds or exchange-traded funds (ETFs) are not included in the Fund's expense ratio. The Fund indirectly bears its proportionate share of these expenses. For additional expense information related to investments in Fidelity Central Funds, please refer to the "Investments in Fidelity Central Funds" note found in the Notes to Financial Statements section of the most recent Annual or Semi-Annual report.
J Expense ratios reflect operating expenses of the class. Expenses before reductions do not reflect amounts reimbursed, waived, or reduced through arrangements with the investment adviser, brokerage services, or other offset arrangements, if applicable, and do not represent the amount paid by the class during periods when reimbursements, waivers or reductions occur.
K Annualized
L Amount does not include the portfolio activity of any underlying mutual funds or exchange-traded funds (ETFs).
Top Holdings (% of Fund's net assets) |
| |
| Microsoft Corp. | 24.7 | |
| Visa, Inc. Class A | 7.2 | |
| MasterCard, Inc. Class A | 6.4 | |
| Adobe, Inc. | 5.8 | |
| Salesforce.com, Inc. | 4.9 | |
| Alphabet, Inc. Class A | 2.9 | |
| Palo Alto Networks, Inc. | 2.8 | |
| PayPal Holdings, Inc. | 2.8 | |
| Autodesk, Inc. | 2.5 | |
| Cognizant Technology Solutions Corp. Class A | 2.3 | |
| | 62.3 | |
| |
Percentages shown as 0.0% may reflect amounts less than 0.05%.
| Industries (% of Fund's net assets) |
| |
| Software | 57.0 | |
| IT Services | 34.1 | |
| Interactive Media & Services | 4.5 | |
| Entertainment | 1.7 | |
| Internet & Direct Marketing Retail | 0.6 | |
| Professional Services | 0.3 | |
| Media | 0.2 | |
| |
Percentages shown as 0.0% may reflect amounts less than 0.05%.
Percentages shown as 0.0% reflect amounts less than 0.05%.
Software and IT Services Portfolio
| Common Stocks - 98.4% |
| | | Shares | Value ($) |
| Entertainment - 1.7% | | | |
| Interactive Home Entertainment - 1.7% | | | |
| Activision Blizzard, Inc. | | 814,900 | 63,961,501 |
| Electronic Arts, Inc. | | 717,300 | 91,003,851 |
| | | | 154,965,352 |
| Interactive Media & Services - 4.5% | | | |
| Interactive Media & Services - 4.5% | | | |
| Alphabet, Inc. Class A (a) | | 2,496,000 | 270,117,120 |
| Meta Platforms, Inc. Class A (a) | | 420,300 | 68,479,479 |
| Twitter, Inc. (a) | | 2,062,242 | 79,911,878 |
| | | | 418,508,477 |
| Internet & Direct Marketing Retail - 0.6% | | | |
| Internet & Direct Marketing Retail - 0.6% | | | |
| Alibaba Group Holding Ltd. sponsored ADR (a) | | 352,800 | 33,660,648 |
| Uber Technologies, Inc. (a) | | 725,900 | 20,876,884 |
| | | | 54,537,532 |
| IT Services - 34.1% | | | |
| Data Processing & Outsourced Services - 20.4% | | | |
| AvidXchange Holdings, Inc. | | 36,300 | 282,777 |
| Block, Inc. Class A (a) | | 711,400 | 49,022,574 |
| ExlService Holdings, Inc. (a) | | 216,062 | 36,235,758 |
| Fidelity National Information Services, Inc. | | 611,200 | 55,845,344 |
| Fiserv, Inc. (a) | | 272,400 | 27,564,156 |
| FleetCor Technologies, Inc. (a) | | 153,200 | 32,559,596 |
| Global Payments, Inc. | | 1,168,870 | 145,208,720 |
| MasterCard, Inc. Class A | | 1,814,800 | 588,666,676 |
| PayPal Holdings, Inc. (a) | | 2,706,500 | 252,895,360 |
| StoneCo Ltd. Class A (a) | | 319,600 | 3,029,808 |
| Visa, Inc. Class A | | 3,341,920 | 664,072,923 |
| WEX, Inc. (a) | | 114,700 | 17,692,475 |
| | | | 1,873,076,167 |
| Internet Services & Infrastructure - 5.1% | | | |
| Akamai Technologies, Inc. (a) | | 1,122,900 | 101,375,412 |
| GoDaddy, Inc. (a) | | 1,471,200 | 111,546,384 |
| MongoDB, Inc. Class A (a) | | 346,200 | 111,774,132 |
| Snowflake, Inc. (a) | | 333,200 | 60,292,540 |
| Twilio, Inc. Class A (a) | | 748,400 | 52,073,672 |
| Wix.com Ltd. (a) | | 472,300 | 29,891,867 |
| | | | 466,954,007 |
| IT Consulting & Other Services - 8.6% | | | |
| Accenture PLC Class A | | 655,900 | 189,200,914 |
| Capgemini SA | | 691,100 | 120,152,124 |
| Cognizant Technology Solutions Corp. Class A | | 3,294,200 | 208,094,614 |
| DXC Technology Co. (a) | | 707,800 | 17,539,284 |
| Gartner, Inc. (a) | | 301,600 | 86,052,512 |
| IBM Corp. | | 1,241,200 | 159,432,140 |
| Kyndryl Holdings, Inc. (a) | | 281,400 | 2,932,188 |
| Thoughtworks Holding, Inc. | | 46,100 | 606,676 |
| | | | 784,010,452 |
TOTAL IT SERVICES | | | 3,124,040,626 |
| Media - 0.2% | | | |
| Publishing - 0.2% | | | |
| The New York Times Co. Class A | | 560,000 | 17,074,400 |
| Professional Services - 0.3% | | | |
| Research & Consulting Services - 0.3% | | | |
| CACI International, Inc. Class A (a) | | 88,700 | 24,913,169 |
| Software - 57.0% | | | |
| Application Software - 24.8% | | | |
| Adobe, Inc. (a) | | 1,415,000 | 528,417,600 |
| Alteryx, Inc. Class A (a) | | 329,700 | 20,546,904 |
| Aspen Technology, Inc. (a) | | 204,162 | 42,996,517 |
| Autodesk, Inc. (a) | | 1,125,000 | 226,957,500 |
| Avalara, Inc. (a) | | 285,100 | 26,112,309 |
| Blackbaud, Inc. (a) | | 646,300 | 33,801,490 |
| Braze, Inc. | | 15,500 | 638,290 |
| Ceridian HCM Holding, Inc. (a) | | 981,542 | 58,539,165 |
| Citrix Systems, Inc. | | 258,907 | 26,607,872 |
| Confluent, Inc. (a) | | 148,100 | 4,052,016 |
| Constellation Software, Inc. | | 25,200 | 37,934,217 |
| Coupa Software, Inc. (a) | | 424,300 | 24,779,120 |
| DocuSign, Inc. (a) | | 129,800 | 7,556,956 |
| Dropbox, Inc. Class A (a) | | 213,000 | 4,556,070 |
| Elastic NV (a) | | 735,700 | 61,732,587 |
| Everbridge, Inc. (a) | | 473,000 | 18,815,940 |
| Five9, Inc. (a) | | 323,000 | 31,689,530 |
| HashiCorp, Inc. | | 16,900 | 597,415 |
| HubSpot, Inc. (a) | | 215,000 | 72,463,600 |
| Intuit, Inc. | | 281,600 | 121,589,248 |
| Liveramp Holdings, Inc. (a) | | 265,300 | 5,266,205 |
| Micro Focus International PLC | | 1,263,938 | 7,609,954 |
| Momentive Global, Inc. (a) | | 850,700 | 6,031,463 |
| New Relic, Inc. (a) | | 473,100 | 28,721,901 |
| PTC, Inc. (a) | | 934,400 | 107,353,216 |
| Qualtrics International, Inc. (a) | | 877,200 | 10,745,700 |
| Salesforce.com, Inc. (a) | | 2,898,284 | 452,480,098 |
| Samsara, Inc. (b) | | 69,800 | 1,037,926 |
| SAP SE | | 73,900 | 6,294,018 |
| Smartsheet, Inc. (a) | | 313,700 | 10,436,799 |
| Workday, Inc. Class A (a) | | 872,300 | 143,545,688 |
| Workiva, Inc. (a) | | 226,100 | 15,349,929 |
| Zendesk, Inc. (a) | | 1,178,100 | 90,442,737 |
| Zoom Video Communications, Inc. Class A (a) | | 406,900 | 32,714,760 |
| | | | 2,268,414,740 |
| Systems Software - 32.2% | | | |
| GitLab, Inc. | | 11,200 | 670,544 |
| Mandiant, Inc. (a) | | 3,422,300 | 78,233,778 |
| Microsoft Corp. | | 8,667,500 | 2,266,291,225 |
| NortonLifeLock, Inc. | | 4,479,100 | 101,182,869 |
| Oracle Corp. | | 2,364,027 | 175,292,602 |
| Palo Alto Networks, Inc. (a) | | 465,500 | 259,195,055 |
| Tenable Holdings, Inc. (a) | | 1,617,600 | 64,073,136 |
| Zuora, Inc. (a) | | 1,207,700 | 9,275,136 |
| | | | 2,954,214,345 |
TOTAL SOFTWARE | | | 5,222,629,085 |
| TOTAL COMMON STOCKS (Cost $5,272,175,519) | | | 9,016,668,641 |
| | | | |
| Money Market Funds - 1.6% |
| | | Shares | Value ($) |
| Fidelity Cash Central Fund 2.33% (c) | | 140,151,290 | 140,179,320 |
| Fidelity Securities Lending Cash Central Fund 2.34% (c)(d) | | 1,016,898 | 1,017,000 |
| TOTAL MONEY MARKET FUNDS (Cost $141,196,320) | | | 141,196,320 |
| | | | |
| TOTAL INVESTMENT IN SECURITIES - 100.0% (Cost $5,413,371,839) | 9,157,864,961 |
NET OTHER ASSETS (LIABILITIES) - 0.0% | 2,133,698 |
| NET ASSETS - 100.0% | 9,159,998,659 |
| | |
Legend
| (b) | Security or a portion of the security is on loan at period end. |
| (c) | Affiliated fund that is generally available only to investment companies and other accounts managed by Fidelity Investments. The rate quoted is the annualized seven-day yield of the fund at period end. A complete unaudited listing of the fund's holdings as of its most recent quarter end is available upon request. In addition, each Fidelity Central Fund's financial statements are available on the SEC's website or upon request. |
| (d) | Investment made with cash collateral received from securities on loan. |
Affiliated Central Funds
Fiscal year to date information regarding the Fund's investments in Fidelity Central Funds, including the ownership percentage, is presented below.
| Affiliate | Value, beginning of period ($) | Purchases ($) | Sales Proceeds ($) | Dividend Income ($) | Realized Gain (loss) ($) | Change in Unrealized appreciation (depreciation) ($) | Value, end of period ($) | %ownership, end of period |
| Fidelity Cash Central Fund 2.33% | 46,704,772 | 410,494,606 | 317,020,058 | 423,218 | - | - | 140,179,320 | 0.3% |
| Fidelity Securities Lending Cash Central Fund 2.34% | 582,500 | 108,196,303 | 107,761,803 | 22,211 | - | - | 1,017,000 | 0.0% |
| Total | 47,287,272 | 518,690,909 | 424,781,861 | 445,429 | - | - | 141,196,320 | |
| | | | | | | | | |
Amounts in the income column in the above table include any capital gain distributions from underlying funds, which are presented in the corresponding line item in the Statement of Operations, if applicable.
Amount for Fidelity Securities Lending Cash Central Fund represents the income earned on investing cash collateral, less rebates paid to borrowers and any lending agent fees associated with the loan, plus any premium payments received for lending certain types of securities.
Investment Valuation
The following is a summary of the inputs used, as of August 31, 2022, involving the Fund's assets and liabilities carried at fair value. The inputs or methodology used for valuing securities may not be an indication of the risk associated with investing in those securities. For more information on valuation inputs, and their aggregation into the levels used below, please refer to the Investment Valuation section in the accompanying Notes to Financial Statements.
| Valuation Inputs at Reporting Date: |
| Description | Total ($) | Level 1 ($) | Level 2 ($) | Level 3 ($) |
Investments in Securities: | | | | |
|
| Common Stocks | 9,016,668,641 | 9,002,764,669 | 13,903,972 | - |
|
| Money Market Funds | 141,196,320 | 141,196,320 | - | - |
| Total Investments in Securities: | 9,157,864,961 | 9,143,960,989 | 13,903,972 | - |
Software and IT Services Portfolio
| Statement of Assets and Liabilities |
| | | | August 31, 2022 (Unaudited) |
| | | | | |
| Assets | | | | |
| Investment in securities, at value (including securities loaned of $1,008,186) - See accompanying schedule: | | $9,016,668,641 | | |
Unaffiliated issuers (cost $5,272,175,519) | | | |
Fidelity Central Funds (cost $141,196,320) | | 141,196,320 | | |
| | | | | |
| Total Investment in Securities (cost $5,413,371,839) | | | $ | 9,157,864,961 |
| Receivable for investments sold | | | | 6,898,154 |
| Receivable for fund shares sold | | | | 1,141,905 |
| Dividends receivable | | | | 9,537,089 |
| Distributions receivable from Fidelity Central Funds | | | | 152,164 |
| Prepaid expenses | | | | 34,555 |
| Other receivables | | | | 458,183 |
Total assets | | | | 9,176,087,011 |
| Liabilities | | | | |
| Payable for fund shares redeemed | | 9,130,560 | | |
| Accrued management fee | | 4,312,194 | | |
| Transfer agent fee payable | | 1,161,557 | | |
| Other affiliated payables | | 96,315 | | |
| Other payables and accrued expenses | | 370,726 | | |
| Collateral on securities loaned | | 1,017,000 | | |
| Total Liabilities | | | | 16,088,352 |
| Net Assets | | | $ | 9,159,998,659 |
| Net Assets consist of: | | | | |
| Paid in capital | | | $ | 5,131,000,702 |
| Total accumulated earnings (loss) | | | | 4,028,997,957 |
| Net Assets | | | $ | 9,159,998,659 |
Net Asset Value , offering price and redemption price per share ($9,159,998,659 ÷ 418,745,659 shares) | | | $ | 21.87 |
| | | | | |
| Statement of Operations |
| | | | Six months ended August 31, 2022 (Unaudited) |
| Investment Income | | | | |
| Dividends | | | $ | 30,217,968 |
| Income from Fidelity Central Funds (including $22,211 from security lending) | | | | 445,429 |
| Total Income | | | | 30,663,397 |
| Expenses | | | | |
| Management fee | $ | 26,209,518 | | |
| Transfer agent fees | | 7,243,959 | | |
| Accounting fees | | 611,439 | | |
| Custodian fees and expenses | | 38,546 | | |
| Independent trustees' fees and expenses | | 16,329 | | |
| Registration fees | | 29,081 | | |
| Audit | | 18,003 | | |
| Legal | | 4,203 | | |
| Interest | | 7,451 | | |
| Miscellaneous | | 32,152 | | |
| Total expenses before reductions | | 34,210,681 | | |
| Expense reductions | | (167,865) | | |
| Total expenses after reductions | | | | 34,042,816 |
| Net Investment income (loss) | | | | (3,379,419) |
| Realized and Unrealized Gain (Loss) | | | | |
| Net realized gain (loss) on: | | | | |
| Investment Securities: | | | | |
| Unaffiliated issuers | | 291,914,710 | | |
| Foreign currency transactions | | 716 | | |
| Total net realized gain (loss) | | | | 291,915,426 |
| Change in net unrealized appreciation (depreciation) on: | | | | |
| Investment Securities: | | | | |
| Unaffiliated issuers | | (1,825,642,094) | | |
| Assets and liabilities in foreign currencies | | (7,205) | | |
| Total change in net unrealized appreciation (depreciation) | | | | (1,825,649,299) |
| Net gain (loss) | | | | (1,533,733,873) |
| Net increase (decrease) in net assets resulting from operations | | | $ | (1,537,113,292) |
| Statement of Changes in Net Assets |
| |
| | Six months ended August 31, 2022 (Unaudited) | | Year ended February 28, 2022 |
| Increase (Decrease) in Net Assets | | | | |
| Operations | | | | |
| Net investment income (loss) | $ | (3,379,419) | $ | (21,892,746) |
| Net realized gain (loss) | | 291,915,426 | | 1,110,704,960 |
| Change in net unrealized appreciation (depreciation) | | (1,825,649,299) | | (688,232,505) |
| Net increase (decrease) in net assets resulting from operations | | (1,537,113,292) | | 400,579,709 |
| Distributions to shareholders | | (393,321,116) | | (831,854,738) |
| Share transactions | | | | |
| Proceeds from sales of shares | | 280,131,909 | | 1,277,423,928 |
| Reinvestment of distributions | | 369,715,240 | | 783,418,638 |
| Cost of shares redeemed | | (827,705,424) | | (2,255,819,953) |
Net increase (decrease) in net assets resulting from share transactions | | (177,858,275) | | (194,977,387) |
| Total increase (decrease) in net assets | | (2,108,292,683) | | (626,252,416) |
| | | | | |
| Net Assets | | | | |
| Beginning of period | | 11,268,291,342 | | 11,894,543,758 |
| End of period | $ | 9,159,998,659 | $ | 11,268,291,342 |
| | | | | |
| Other Information | | | | |
| Shares | | | | |
| Sold | | 11,837,462 | | 42,971,848 |
| Issued in reinvestment of distributions | | 14,607,456 | | 26,896,267 |
| Redeemed | | (35,735,055) | | (77,442,780) |
| Net increase (decrease) | | (9,290,137) | | (7,574,665) |
| | | | | |
| Software and IT Services Portfolio |
| |
| | Six months ended (Unaudited) August 31, 2022 | | Years ended February 28, 2022 | | 2021 | | 2020 A | | 2019 B | | 2018 B |
Selected Per-Share Data | | | | | | | | | | | | |
| Net asset value, beginning of period | $ | 26.33 | $ | 27.31 | $ | 19.90 | $ | 18.71 | $ | 17.89 | $ | 14.09 |
| Income from Investment Operations | | | | | | | | | | | | |
Net investment income (loss) C,D | | (.01) | | (.05) | | (.03) | | .19 E | | .02 | | (.02) |
| Net realized and unrealized gain (loss) | | (3.52) | | 1.03 | | 8.82 | | 3.52 | | 1.81 | | 5.01 |
| Total from investment operations | | (3.53) | | .98 | | 8.79 | | 3.71 | | 1.83 | | 4.99 |
| Distributions from net investment income | | - | | - | | (.15) | | (.05) | | (.01) | | - |
| Distributions from net realized gain | | (.93) | | (1.96) | | (1.23) | | (2.47) | | (1.00) | | (1.19) |
| Total distributions | | (.93) | | (1.96) | | (1.38) | | (2.52) | | (1.01) | | (1.19) |
| Net asset value, end of period | $ | 21.87 | $ | 26.33 | $ | 27.31 | $ | 19.90 | $ | 18.71 | $ | 17.89 |
Total Return F,G | | (13.89)% | | 2.98% | | 45.80% | | 21.33% | | 10.90% | | 36.76% |
Ratios to Average Net Assets D,H,I | | | | | | | | | | | | |
| Expenses before reductions | | .69% J | | .67% | | .70% | | .70% | | .72% | | .73% |
| Expenses net of fee waivers, if any | | .68% J | | .67% | | .70% | | .70% | | .72% | | .73% |
| Expenses net of all reductions | | .68% J | | .67% | | .69% | | .70% | | .71% | | .73% |
| Net investment income (loss) | | (.07)% J | | (.17)% | | (.11)% | | .98% E | | .10% | | (.09)% |
| Supplemental Data | | | | | | | | | | | | |
| Net assets, end of period (000 omitted) | $ | 9,159,999 | $ | 11,268,291 | $ | 11,894,544 | $ | 8,031,911 | $ | 6,540,896 | $ | 5,539,357 |
Portfolio turnover rate K | | 1% J | | 10% | | 22% | | 23% | | 48% | | 31% |
A For the year ended February 29.
B Per share amounts have been adjusted to reflect the impact of the 10 for 1 share split that occurred on May 11, 2018.
C Calculated based on average shares outstanding during the period.
D Net investment income (loss) is affected by the timing of the declaration of dividends by any underlying mutual funds or exchange-traded funds (ETFs). Net investment income (loss) of any such underlying funds is not included in the Fund's net investment income (loss) ratio.
E Net investment income per share reflects one or more large, non-recurring dividend(s) which amounted to $.15 per share. Excluding such non-recurring dividend(s), the ratio of net investment income (loss) to average net assets would have been .22%.
F Total returns for periods of less than one year are not annualized.
G Total returns would have been lower if certain expenses had not been reduced during the applicable periods shown.
H Fees and expenses of any underlying mutual funds or exchange-traded funds (ETFs) are not included in the Fund's expense ratio. The Fund indirectly bears its proportionate share of these expenses. For additional expense information related to investments in Fidelity Central Funds, please refer to the "Investments in Fidelity Central Funds" note found in the Notes to Financial Statements section of the most recent Annual or Semi-Annual report.
I Expense ratios reflect operating expenses of the class. Expenses before reductions do not reflect amounts reimbursed, waived, or reduced through arrangements with the investment adviser, brokerage services, or other offset arrangements, if applicable, and do not represent the amount paid by the class during periods when reimbursements, waivers or reductions occur.
J Annualized
K Amount does not include the portfolio activity of any underlying mutual funds or exchange-traded funds (ETFs).
Top Holdings (% of Fund's net assets) |
| |
| Cisco Systems, Inc. | 11.4 | |
| Apple, Inc. | 11.2 | |
| Sony Group Corp. | 10.5 | |
| Samsung Electronics Co. Ltd. | 10.3 | |
| Palo Alto Networks, Inc. | 6.1 | |
| Motorola Solutions, Inc. | 4.9 | |
| Fortinet, Inc. | 3.2 | |
| FUJIFILM Holdings Corp. | 3.1 | |
| Nintendo Co. Ltd. | 3.0 | |
| CDW Corp. | 2.7 | |
| | 66.4 | |
| |
Percentages shown as 0.0% may reflect amounts less than 0.05%.
| Industries (% of Fund's net assets) |
| |
| Technology Hardware, Storage & Peripherals | 36.5 | |
| Communications Equipment | 27.1 | |
| Household Durables | 12.9 | |
| Software | 10.5 | |
| Electronic Equipment & Components | 8.3 | |
| Entertainment | 3.0 | |
| IT Services | 0.5 | |
| |
Percentages shown as 0.0% may reflect amounts less than 0.05%.
Percentages shown as 0.0% reflect amounts less than 0.05%.
Geographic Diversification (% of Fund's net assets) |
|
* Includes Short-Term investments and Net Other Assets (Liabilities). Percentages are based on country or territory of incorporation and are adjusted for the effect of futures contracts, if applicable. |
| |
Tech Hardware Portfolio
| Common Stocks - 98.8% |
| | | Shares | Value ($) |
| Communications Equipment - 27.1% | | | |
| Communications Equipment - 27.1% | | | |
| Arista Networks, Inc. (a) | | 146,866 | 17,606,296 |
| Calix, Inc. (a) | | 136,137 | 8,011,662 |
| Ciena Corp. (a) | | 191,819 | 9,732,896 |
| Cisco Systems, Inc. | | 1,868,165 | 83,544,337 |
| CommScope Holding Co., Inc. (a) | | 396,562 | 4,481,151 |
| Ericsson (B Shares) | | 2,251,737 | 16,839,443 |
| Extreme Networks, Inc. (a) | | 616,678 | 8,836,996 |
| Juniper Networks, Inc. | | 100,404 | 2,853,482 |
| Motorola Solutions, Inc. | | 147,333 | 35,862,326 |
| Nokia Corp. | | 2,171,653 | 10,943,748 |
| | | | 198,712,337 |
| Electronic Equipment & Components - 8.3% | | | |
| Electronic Components - 0.8% | | | |
| Kyocera Corp. | | 101,994 | 5,669,212 |
| Electronic Equipment & Instruments - 3.8% | | | |
| Keysight Technologies, Inc. (a) | | 109,238 | 17,903,016 |
| Napco Security Technologies, Inc. | | 35,154 | 1,042,668 |
| Zebra Technologies Corp. Class A (a) | | 28,868 | 8,707,744 |
| | | | 27,653,428 |
| Technology Distributors - 3.7% | | | |
| CDW Corp. | | 117,257 | 20,015,770 |
| TD SYNNEX Corp. | | 75,418 | 7,261,245 |
| | | | 27,277,015 |
TOTAL ELECTRONIC EQUIPMENT & COMPONENTS | | | 60,599,655 |
| Entertainment - 3.0% | | | |
| Interactive Home Entertainment - 3.0% | | | |
| Nintendo Co. Ltd. | | 52,919 | 21,662,229 |
| Household Durables - 12.9% | | | |
| Consumer Electronics - 12.9% | | | |
| Garmin Ltd. | | 72,741 | 6,436,851 |
| Panasonic Holdings Corp. | | 610,838 | 4,956,574 |
| Sonos, Inc. (a)(b) | | 412,175 | 6,199,112 |
| Sony Group Corp. | | 965,949 | 76,796,140 |
| | | | 94,388,677 |
| IT Services - 0.5% | | | |
| Internet Services & Infrastructure - 0.5% | | | |
| Cloudflare, Inc. (a) | | 63,138 | 3,950,545 |
| Software - 10.5% | | | |
| Application Software - 0.6% | | | |
| NCR Corp. (a) | | 137,950 | 4,283,348 |
| Systems Software - 9.9% | | | |
| Fortinet, Inc. (a) | | 490,102 | 23,863,066 |
| KnowBe4, Inc. (a) | | 219,060 | 4,210,333 |
| Palo Alto Networks, Inc. (a)(b) | | 80,093 | 44,596,583 |
| | | | 72,669,982 |
TOTAL SOFTWARE | | | 76,953,330 |
| Technology Hardware, Storage & Peripherals - 36.5% | | | |
| Technology Hardware, Storage & Peripherals - 36.5% | | | |
| Advantech Co. Ltd. | | 191,434 | 2,043,798 |
| Apple, Inc. | | 523,074 | 82,237,694 |
| Canon, Inc. | | 380,586 | 9,114,772 |
| Dell Technologies, Inc. | | 472,405 | 18,088,387 |
| FUJIFILM Holdings Corp. | | 453,673 | 23,031,532 |
| Hewlett Packard Enterprise Co. | | 305,063 | 4,148,857 |
| HP, Inc. | | 439,310 | 12,612,590 |
| NetApp, Inc. | | 81,620 | 5,887,251 |
| Pure Storage, Inc. Class A (a) | | 357,093 | 10,344,984 |
| Samsung Electronics Co. Ltd. | | 1,710,114 | 75,460,084 |
| Seagate Technology Holdings PLC | | 212,678 | 14,240,919 |
| Xiaomi Corp. Class B (a)(c) | | 7,193,805 | 10,507,694 |
| | | | 267,718,562 |
| TOTAL COMMON STOCKS (Cost $607,629,562) | | | 723,985,335 |
| | | | |
| Money Market Funds - 6.1% |
| | | Shares | Value ($) |
| Fidelity Cash Central Fund 2.33% (d) | | 3,322,490 | 3,323,154 |
| Fidelity Securities Lending Cash Central Fund 2.34% (d)(e) | | 41,126,987 | 41,131,100 |
| TOTAL MONEY MARKET FUNDS (Cost $44,454,254) | | | 44,454,254 |
| | | | |
| TOTAL INVESTMENT IN SECURITIES - 104.9% (Cost $652,083,816) | 768,439,589 |
NET OTHER ASSETS (LIABILITIES) - (4.9)% | (35,956,106) |
| NET ASSETS - 100.0% | 732,483,483 |
| | |
Legend
| (b) | Security or a portion of the security is on loan at period end. |
| (c) | Security exempt from registration under Rule 144A of the Securities Act of 1933. These securities may be resold in transactions exempt from registration, normally to qualified institutional buyers. At the end of the period, the value of these securities amounted to $10,507,694 or 1.4% of net assets. |
| (d) | Affiliated fund that is generally available only to investment companies and other accounts managed by Fidelity Investments. The rate quoted is the annualized seven-day yield of the fund at period end. A complete unaudited listing of the fund's holdings as of its most recent quarter end is available upon request. In addition, each Fidelity Central Fund's financial statements are available on the SEC's website or upon request. |
| (e) | Investment made with cash collateral received from securities on loan. |
Affiliated Central Funds
Fiscal year to date information regarding the Fund's investments in Fidelity Central Funds, including the ownership percentage, is presented below.
| Affiliate | Value, beginning of period ($) | Purchases ($) | Sales Proceeds ($) | Dividend Income ($) | Realized Gain (loss) ($) | Change in Unrealized appreciation (depreciation) ($) | Value, end of period ($) | %ownership, end of period |
| Fidelity Cash Central Fund 2.33% | 2,163,365 | 57,577,550 | 56,417,761 | 7,431 | - | - | 3,323,154 | 0.0% |
| Fidelity Securities Lending Cash Central Fund 2.34% | 13,140,825 | 119,935,713 | 91,945,438 | 13,430 | - | - | 41,131,100 | 0.1% |
| Total | 15,304,190 | 177,513,263 | 148,363,199 | 20,861 | - | - | 44,454,254 | |
| | | | | | | | | |
Amounts in the income column in the above table include any capital gain distributions from underlying funds, which are presented in the corresponding line item in the Statement of Operations, if applicable.
Amount for Fidelity Securities Lending Cash Central Fund represents the income earned on investing cash collateral, less rebates paid to borrowers and any lending agent fees associated with the loan, plus any premium payments received for lending certain types of securities.
Investment Valuation
The following is a summary of the inputs used, as of August 31, 2022, involving the Fund's assets and liabilities carried at fair value. The inputs or methodology used for valuing securities may not be an indication of the risk associated with investing in those securities. For more information on valuation inputs, and their aggregation into the levels used below, please refer to the Investment Valuation section in the accompanying Notes to Financial Statements.
| Valuation Inputs at Reporting Date: |
| Description | Total ($) | Level 1 ($) | Level 2 ($) | Level 3 ($) |
Investments in Securities: | | | | |
|
| Common Stocks | 723,985,335 | 466,960,109 | 257,025,226 | - |
|
| Money Market Funds | 44,454,254 | 44,454,254 | - | - |
| Total Investments in Securities: | 768,439,589 | 511,414,363 | 257,025,226 | - |
Tech Hardware Portfolio
| Statement of Assets and Liabilities |
| | | | August 31, 2022 (Unaudited) |
| | | | | |
| Assets | | | | |
| Investment in securities, at value (including securities loaned of $40,091,216) - See accompanying schedule: | | $723,985,335 | | |
Unaffiliated issuers (cost $607,629,562) | | | |
Fidelity Central Funds (cost $44,454,254) | | 44,454,254 | | |
| | | | | |
| Total Investment in Securities (cost $652,083,816) | | | $ | 768,439,589 |
| Receivable for investments sold | | | | 17,934,200 |
| Receivable for fund shares sold | | | | 90,717 |
| Dividends receivable | | | | 336,942 |
| Distributions receivable from Fidelity Central Funds | | | | 5,156 |
| Prepaid expenses | | | | 3,137 |
| Other receivables | | | | 169,352 |
Total assets | | | | 786,979,093 |
| Liabilities | | | | |
| Payable to custodian bank | | 6 | | |
| Payable for investments purchased | | 11,166,183 | | |
| Payable for fund shares redeemed | | 1,657,871 | | |
| Accrued management fee | | 339,693 | | |
| Other affiliated payables | | 119,003 | | |
| Other payables and accrued expenses | | 81,754 | | |
| Collateral on securities loaned | | 41,131,100 | | |
| Total Liabilities | | | | 54,495,610 |
| Net Assets | | | $ | 732,483,483 |
| Net Assets consist of: | | | | |
| Paid in capital | | | $ | 620,116,737 |
| Total accumulated earnings (loss) | | | | 112,366,746 |
| Net Assets | | | $ | 732,483,483 |
Net Asset Value , offering price and redemption price per share ($732,483,483 ÷ 9,787,443 shares) | | | $ | 74.84 |
| | | | | |
| Statement of Operations |
| | | | Six months ended August 31, 2022 (Unaudited) |
| Investment Income | | | | |
| Dividends | | | $ | 5,694,957 |
| Income from Fidelity Central Funds (including $13,430 from security lending) | | | | 20,861 |
| Total Income | | | | 5,715,818 |
| Expenses | | | | |
| Management fee | $ | 2,100,185 | | |
| Transfer agent fees | | 613,852 | | |
| Accounting fees | | 131,597 | | |
| Custodian fees and expenses | | 16,409 | | |
| Independent trustees' fees and expenses | | 1,315 | | |
| Registration fees | | 20,085 | | |
| Audit | | 23,029 | | |
| Legal | | 494 | | |
| Interest | | 162 | | |
| Miscellaneous | | (9,243) | | |
| Total expenses before reductions | | 2,897,885 | | |
| Expense reductions | | (13,472) | | |
| Total expenses after reductions | | | | 2,884,413 |
| Net Investment income (loss) | | | | 2,831,405 |
| Realized and Unrealized Gain (Loss) | | | | |
| Net realized gain (loss) on: | | | | |
| Investment Securities: | | | | |
| Unaffiliated issuers | | (3,976,786) | | |
| Foreign currency transactions | | (97,180) | | |
| Total net realized gain (loss) | | | | (4,073,966) |
| Change in net unrealized appreciation (depreciation) on: | | | | |
| Investment Securities: | | | | |
| Unaffiliated issuers | | (142,431,520) | | |
| Assets and liabilities in foreign currencies | | (81,022) | | |
| Total change in net unrealized appreciation (depreciation) | | | | (142,512,542) |
| Net gain (loss) | | | | (146,586,508) |
| Net increase (decrease) in net assets resulting from operations | | | $ | (143,755,103) |
| Statement of Changes in Net Assets |
| |
| | Six months ended August 31, 2022 (Unaudited) | | Year ended February 28, 2022 |
| Increase (Decrease) in Net Assets | | | | |
| Operations | | | | |
| Net investment income (loss) | $ | 2,831,405 | $ | 3,223,590 |
| Net realized gain (loss) | | (4,073,966) | | 173,943,867 |
| Change in net unrealized appreciation (depreciation) | | (142,512,542) | | (149,735,648) |
| Net increase (decrease) in net assets resulting from operations | | (143,755,103) | | 27,431,809 |
| Distributions to shareholders | | (108,481,985) | | (131,911,413) |
| Share transactions | | | | |
| Proceeds from sales of shares | | 21,830,817 | | 125,851,574 |
| Net asset value of shares issued in exchange for the net assets of the Target Fund(s) (see Merger Information note) | | - | | 189,381,924 |
| Reinvestment of distributions | | 102,874,192 | | 125,862,871 |
| Cost of shares redeemed | | (53,633,366) | | (193,743,884) |
Net increase (decrease) in net assets resulting from share transactions | | 71,071,643 | | 247,352,485 |
| Total increase (decrease) in net assets | | (181,165,445) | | 142,872,881 |
| | | | | |
| Net Assets | | | | |
| Beginning of period | | 913,648,928 | | 770,776,047 |
| End of period | $ | 732,483,483 | $ | 913,648,928 |
| | | | | |
| Other Information | | | | |
| Shares | | | | |
| Sold | | 263,067 | | 1,206,665 |
| Issued in exchange for the shares of the Target Fund(s) (see Merger Information note) | | - | | 1,755,160 |
| Issued in reinvestment of distributions | | 1,180,291 | | 1,142,875 |
| Redeemed | | (659,125) | | (1,819,249) |
| Net increase (decrease) | | 784,233 | | 2,285,451 |
| | | | | |
| | Six months ended (Unaudited) August 31, 2022 | | Years ended February 28, 2022 | | 2021 | | 2020 A | | 2019 | | 2018 |
Selected Per-Share Data | | | | | | | | | | | | |
| Net asset value, beginning of period | $ | 101.48 | $ | 114.74 | $ | 78.64 | $ | 75.84 | $ | 92.81 | $ | 83.01 |
| Income from Investment Operations | | | | | | | | | | | | |
Net investment income (loss) B,C | | .29 | | .42 | | .93 D | | 1.51 E | | .81 | | .67 |
| Net realized and unrealized gain (loss) | | (14.80) | | 5.73 | | 44.83 | | 11.48 | | (1.67) | | 19.24 |
| Total from investment operations | | (14.51) | | 6.15 | | 45.76 | | 12.99 | | (.86) | | 19.91 |
| Distributions from net investment income | | - | | (.73) F | | (1.61) | | (.77) | | (.88) F | | (.73) F |
| Distributions from net realized gain | | (12.13) | | (18.68) F | | (8.05) | | (9.42) | | (15.23) F | | (9.38) F |
| Total distributions | | (12.13) | | (19.41) | | (9.66) | | (10.19) | | (16.11) | | (10.11) |
�� Redemption fees added to paid in capital B | | - | | - | | - | | - | | - | | - G |
| Net asset value, end of period | $ | 74.84 | $ | 101.48 | $ | 114.74 | $ | 78.64 | $ | 75.84 | $ | 92.81 |
Total Return H,I | | (15.99)% | | 4.72% | | 62.60% | | 17.80% | | .54% | | 24.82% |
Ratios to Average Net Assets C,J,K | | | | | | | | | | | | |
| Expenses before reductions | | .73% L | | .72% M | | .74% | | .76% | | .77% | | .79% |
| Expenses net of fee waivers, if any | | .72% L | | .72% M | | .74% | | .76% | | .77% | | .79% |
| Expenses net of all reductions | | .72% L | | .72% M | | .73% | | .75% | | .77% | | .78% |
| Net investment income (loss) | | .71% L | | .38% M | | 1.04% D | | 1.95% E | | .90% | | .75% |
| Supplemental Data | | | | | | | | | | | | |
| Net assets, end of period (000 omitted) | $ | 732,483 | $ | 913,649 | $ | 770,776 | $ | 533,793 | $ | 491,780 | $ | 538,332 |
Portfolio turnover rate N | | 22% L | | 99% O | | 78% | | 116% | | 81% | | 57% |
A For the year ended February 29.
B Calculated based on average shares outstanding during the period.
C Net investment income (loss) is affected by the timing of the declaration of dividends by any underlying mutual funds or exchange-traded funds (ETFs). Net investment income (loss) of any such underlying funds is not included in the Fund's net investment income (loss) ratio.
D Net investment income per share reflects one or more large, non-recurring dividend(s) which amounted to $.44 per share. Excluding such non-recurring dividend(s), the ratio of net investment income (loss) to average net assets would have been .55%.
E Net investment income per share reflects one or more large, non-recurring dividend(s) which amounted to $.78 per share. Excluding such non-recurring dividend(s), the ratio of net investment income (loss) to average net assets would have been .94%.
F The amount shown reflects reclassifications related to book to tax differences that were made in the year shown.
G Amount represents less than $.005 per share.
H Total returns for periods of less than one year are not annualized.
I Total returns would have been lower if certain expenses had not been reduced during the applicable periods shown.
J Fees and expenses of any underlying mutual funds or exchange-traded funds (ETFs) are not included in the Fund's expense ratio. The Fund indirectly bears its proportionate share of these expenses. For additional expense information related to investments in Fidelity Central Funds, please refer to the "Investments in Fidelity Central Funds" note found in the Notes to Financial Statements section of the most recent Annual or Semi-Annual report.
K Expense ratios reflect operating expenses of the class. Expenses before reductions do not reflect amounts reimbursed, waived, or reduced through arrangements with the investment adviser, brokerage services, or other offset arrangements, if applicable, and do not represent the amount paid by the class during periods when reimbursements, waivers or reductions occur.
L Annualized
M Proxy expenses are not annualized.
N Amount does not include the portfolio activity of any underlying mutual funds or exchange-traded funds (ETFs).
O The portfolio turnover rate does not include the assets acquired in the merger.
Top Holdings (% of Fund's net assets) |
| |
| Apple, Inc. | 24.9 | |
| Microsoft Corp. | 18.7 | |
| NVIDIA Corp. | 5.5 | |
| MasterCard, Inc. Class A | 4.9 | |
| Marvell Technology, Inc. | 4.4 | |
| NXP Semiconductors NV | 3.2 | |
| onsemi | 2.8 | |
| Salesforce.com, Inc. | 2.7 | |
| Cisco Systems, Inc. | 2.3 | |
| GlobalFoundries, Inc. | 2.0 | |
| | 71.4 | |
| |
Percentages shown as 0.0% may reflect amounts less than 0.05%.
| Industries (% of Fund's net assets) |
| |
| Software | 29.0 | |
| Technology Hardware, Storage & Peripherals | 24.9 | |
| Semiconductors & Semiconductor Equipment | 22.4 | |
| IT Services | 14.0 | |
| Communications Equipment | 2.4 | |
| Hotels, Restaurants & Leisure | 1.1 | |
| Internet & Direct Marketing Retail | 1.1 | |
| Electronic Equipment & Components | 0.9 | |
| Interactive Media & Services | 0.9 | |
| Entertainment | 0.6 | |
| Oil, Gas & Consumable Fuels | 0.5 | |
| Chemicals | 0.2 | |
| Aerospace & Defense | 0.1 | |
| Air Freight & Logistics | 0.1 | |
| Construction & Engineering | 0.1 | |
| Diversified Financial Services | 0.1 | |
| Food Products | 0.1 | |
| Capital Markets | 0.0 | |
| Electrical Equipment | 0.0 | |
| Life Sciences Tools & Services | 0.0 | |
| Pharmaceuticals | 0.0 | |
| Road & Rail | 0.0 | |
| Textiles, Apparel & Luxury Goods | 0.0 | |
| |
Percentages shown as 0.0% may reflect amounts less than 0.05%.
Percentages shown as 0.0% reflect amounts less than 0.05%.
Technology Portfolio
| Common Stocks - 97.2% |
| | | Shares | Value ($) |
| Air Freight & Logistics - 0.1% | | | |
| Air Freight & Logistics - 0.1% | | | |
| Delhivery Private Ltd. (a) | | 579,000 | 3,936,317 |
| Capital Markets - 0.0% | | | |
| Financial Exchanges & Data - 0.0% | | | |
| Coinbase Global, Inc. (b) | | 8,511 | 568,535 |
| Chemicals - 0.2% | | | |
| Commodity Chemicals - 0.2% | | | |
| LG Chemical Ltd. | | 40,787 | 19,016,832 |
| Communications Equipment - 2.3% | | | |
| Communications Equipment - 2.3% | | | |
| Cisco Systems, Inc. | | 4,389,273 | 196,288,289 |
| Diversified Financial Services - 0.1% | | | |
| Other Diversified Financial Services - 0.1% | | | |
| Ant International Co. Ltd. Class C (a)(b)(c) | | 6,426,931 | 11,504,206 |
| Electrical Equipment - 0.0% | | | |
| Electrical Components & Equipment - 0.0% | | | |
| ESS Tech, Inc. Class A (b) | | 787,286 | 3,495,550 |
| Electronic Equipment & Components - 0.9% | | | |
| Electronic Manufacturing Services - 0.9% | | | |
| Jabil, Inc. | | 1,236,625 | 74,568,488 |
| Entertainment - 0.6% | | | |
| Movies & Entertainment - 0.6% | | | |
| Netflix, Inc. (b) | | 226,730 | 50,687,759 |
| Food Products - 0.1% | | | |
| Agricultural Products - 0.1% | | | |
| Local Bounti Corp. (b) | | 1,546,921 | 5,754,546 |
| Hotels, Restaurants & Leisure - 1.1% | | | |
| Hotels, Resorts & Cruise Lines - 1.1% | | | |
| Airbnb, Inc. Class A (b) | | 837,009 | 94,682,458 |
| Interactive Media & Services - 0.8% | | | |
| Interactive Media & Services - 0.8% | | | |
| Snap, Inc. Class A (b) | | 4,135,013 | 44,988,941 |
| Tongdao Liepin Group (b) | | 21,313,741 | 26,594,174 |
| | | | 71,583,115 |
| Internet & Direct Marketing Retail - 1.1% | | | |
| Internet & Direct Marketing Retail - 1.1% | | | |
| Cazoo Group Ltd. (a)(b) | | 144,100 | 97,253 |
| Deliveroo PLC Class A (b)(d) | | 6,252,898 | 5,875,116 |
| Lyft, Inc. (b) | | 1,718,528 | 25,313,917 |
| Uber Technologies, Inc. (b) | | 2,254,238 | 64,831,885 |
| | | | 96,118,171 |
| IT Services - 13.7% | | | |
| Data Processing & Outsourced Services - 7.5% | | | |
| Genpact Ltd. | | 1,581,276 | 74,288,346 |
| MasterCard, Inc. Class A | | 1,306,480 | 423,782,918 |
| Visa, Inc. Class A (e) | | 794,787 | 157,932,125 |
| | | | 656,003,389 |
| Internet Services & Infrastructure - 5.6% | | | |
| Cloudflare, Inc. (b)(e) | | 1,239,884 | 77,579,542 |
| MongoDB, Inc. Class A (b) | | 211,700 | 68,349,462 |
| Okta, Inc. (b) | | 1,584,535 | 144,826,499 |
| Shopify, Inc. Class A (b)(e) | | 944,500 | 29,893,425 |
| Snowflake, Inc. (b) | | 524,790 | 94,960,751 |
| Twilio, Inc. Class A (b) | | 1,052,165 | 73,209,641 |
| | | | 488,819,320 |
| IT Consulting & Other Services - 0.6% | | | |
| Cognizant Technology Solutions Corp. Class A | | 510,000 | 32,216,700 |
| Thoughtworks Holding, Inc. (e) | | 1,329,904 | 17,501,537 |
| | | | 49,718,237 |
TOTAL IT SERVICES | | | 1,194,540,946 |
| Life Sciences Tools & Services - 0.0% | | | |
| Life Sciences Tools & Services - 0.0% | | | |
| Eden Biologics, Inc. (b)(c) | | 1,015,442 | 0 |
| Oil, Gas & Consumable Fuels - 0.5% | | | |
| Oil & Gas Refining & Marketing - 0.5% | | | |
| Reliance Industries Ltd. | | 1,102,807 | 36,110,604 |
| Reliance Industries Ltd. sponsored GDR (b)(d) | | 79,100 | 5,212,690 |
| | | | 41,323,294 |
| Pharmaceuticals - 0.0% | | | |
| Pharmaceuticals - 0.0% | | | |
| Chime Biologics Wuhan Co. Ltd. (b)(c) | | 1,015,442 | 528,873 |
| Semiconductors & Semiconductor Equipment - 22.1% | | | |
| Semiconductor Equipment - 1.8% | | | |
| ASML Holding NV (Netherlands) | | 104,750 | 51,130,074 |
| Teradyne, Inc. | | 1,244,228 | 105,311,458 |
| | | | 156,441,532 |
| Semiconductors - 20.3% | | | |
| Advanced Micro Devices, Inc. (b) | | 526,994 | 44,725,981 |
| GlobalFoundries, Inc. (e) | | 2,965,674 | 177,406,619 |
| Marvell Technology, Inc. | | 8,189,681 | 383,440,864 |
| Microchip Technology, Inc. | | 1,745,340 | 113,883,435 |
| NVIDIA Corp. | | 3,157,157 | 476,541,278 |
| NXP Semiconductors NV | | 1,681,018 | 276,661,942 |
| onsemi (b) | | 3,539,547 | 243,414,647 |
| Renesas Electronics Corp. (b) | | 1 | 9 |
| Taiwan Semiconductor Manufacturing Co. Ltd. | | 3,142,488 | 51,481,636 |
| | | | 1,767,556,411 |
TOTAL SEMICONDUCTORS & SEMICONDUCTOR EQUIPMENT | | | 1,923,997,943 |
| Software - 28.7% | | | |
| Application Software - 7.3% | | | |
| CCC Intelligent Solutions Holdings, Inc. (a)(b) | | 102,045 | 975,550 |
| Confluent, Inc. (b)(e) | | 26,842 | 734,397 |
| Cvent Holding Corp. (a)(b) | | 1,099,667 | 5,564,315 |
| Epic Games, Inc. (a)(b)(c) | | 17,917 | 16,662,810 |
| HubSpot, Inc. (b) | | 235,900 | 79,507,736 |
| Intuit, Inc. | | 378,813 | 163,563,877 |
| Nutanix, Inc. Class B (b)(d) | | 72,872 | 1,260,686 |
| Otonomo Technologies Ltd. (b) | | 1,048,000 | 450,535 |
| Procore Technologies, Inc. (b)(e) | | 10,475 | 571,935 |
| Qualtrics International, Inc. (b) | | 1,459,293 | 17,876,339 |
| Salesforce.com, Inc. (b) | | 1,502,552 | 234,578,418 |
| Splunk, Inc. (b) | | 904,300 | 81,414,129 |
| Stripe, Inc. Class B (a)(b)(c) | | 38,600 | 1,090,836 |
| Zoom Video Communications, Inc. Class A (b) | | 370,328 | 29,774,371 |
| | | | 634,025,934 |
| Systems Software - 21.4% | | | |
| Microsoft Corp. | | 6,221,586 | 1,626,758,091 |
| Palo Alto Networks, Inc. (b)(e) | | 114,300 | 63,643,383 |
| Rapid7, Inc. (b) | | 682,836 | 39,263,070 |
| ServiceNow, Inc. (b) | | 197,800 | 85,967,836 |
| Tenable Holdings, Inc. (b) | | 1,161,072 | 45,990,062 |
| UiPath, Inc. Class A (b) | | 88,382 | 1,453,884 |
| | | | 1,863,076,326 |
TOTAL SOFTWARE | | | 2,497,102,260 |
| Technology Hardware, Storage & Peripherals - 24.9% | | | |
| Technology Hardware, Storage & Peripherals - 24.9% | | | |
| Apple, Inc. | | 13,765,450 | 2,164,204,050 |
| IonQ, Inc. (a)(b) | | 8,400 | 49,896 |
| | | | 2,164,253,946 |
| Textiles, Apparel & Luxury Goods - 0.0% | | | |
| Textiles - 0.0% | | | |
| Algolia, Inc. (a)(c) | | 153,503 | 2,985,633 |
| TOTAL COMMON STOCKS (Cost $6,749,191,825) | | | 8,452,937,161 |
| | | | |
| Preferred Stocks - 1.3% |
| | | Shares | Value ($) |
| Convertible Preferred Stocks - 1.1% | | | |
| Aerospace & Defense - 0.1% | | | |
| Aerospace & Defense - 0.1% | | | |
| ABL Space Systems: | | | |
| Series B(a)(b)(c) | | 98,000 | 5,485,060 |
| Series B2(a)(c) | | 74,989 | 4,197,134 |
| | | | 9,682,194 |
| Communications Equipment - 0.1% | | | |
| Communications Equipment - 0.1% | | | |
| Astranis Space Technologies Corp. Series C (a)(b)(c) | | 605,440 | 9,335,885 |
| Xsight Labs Ltd. Series D (a)(b)(c) | | 281,500 | 2,105,620 |
| | | | 11,441,505 |
| Construction & Engineering - 0.1% | | | |
| Construction & Engineering - 0.1% | | | |
| Beta Technologies, Inc. Series A (a)(b)(c) | | 72,591 | 7,489,213 |
| | | | |
| Hotels, Restaurants & Leisure - 0.0% | | | |
| Casinos & Gaming - 0.0% | | | |
| Discord, Inc. Series I (a)(c) | | 1,300 | 522,184 |
| | | | |
| Interactive Media & Services - 0.1% | | | |
| Interactive Media & Services - 0.1% | | | |
| Reddit, Inc.: | | | |
| Series D(a)(b)(c) | | 250,861 | 9,868,872 |
| Series E(a)(b)(c) | | 14,400 | 566,496 |
| | | | 10,435,368 |
| IT Services - 0.1% | | | |
| Internet Services & Infrastructure - 0.1% | | | |
| ByteDance Ltd. Series E1 (a)(b)(c) | | 70,707 | 10,402,414 |
| | | | |
| Road & Rail - 0.0% | | | |
| Trucking - 0.0% | | | |
| Convoy, Inc. Series D (a)(b)(c) | | 203,844 | 2,348,283 |
| | | | |
| Semiconductors & Semiconductor Equipment - 0.3% | | | |
| Semiconductor Equipment - 0.3% | | | |
| Astera Labs, Inc.: | | | |
| Series A(a)(c) | | 351,532 | 3,574,905 |
| Series B(a)(c) | | 59,853 | 608,675 |
| Series C(a)(c) | | 344,200 | 3,500,342 |
| Series D(a)(c) | | 1,443,456 | 14,679,226 |
| | | | 22,363,148 |
| Semiconductors - 0.0% | | | |
| GaN Systems, Inc.: | | | |
| Series F1(a)(c) | | 133,634 | 896,684 |
| Series F2(a)(c) | | 70,564 | 473,484 |
| | | | 1,370,168 |
TOTAL SEMICONDUCTORS & SEMICONDUCTOR EQUIPMENT | | | 23,733,316 |
| | | | |
| Software - 0.3% | | | |
| Application Software - 0.3% | | | |
| Bolt Technology OU Series E (a)(c) | | 40,842 | 6,342,555 |
| Databricks, Inc.: | | | |
| Series G(a)(b)(c) | | 45,012 | 2,465,307 |
| Series H(a)(c) | | 174,018 | 9,530,966 |
| Skyryse, Inc. Series B (a)(c) | | 121,800 | 2,943,906 |
| Stripe, Inc. Series H (a)(b)(c) | | 17,100 | 483,246 |
| | | | 21,765,980 |
| Textiles, Apparel & Luxury Goods - 0.0% | | | |
| Textiles - 0.0% | | | |
| Algolia SAS Series D (a)(b)(c) | | 109,867 | 2,136,913 |
| | | | |
| TOTAL CONVERTIBLE PREFERRED STOCKS | | | 99,957,370 |
| Nonconvertible Preferred Stocks - 0.2% | | | |
| IT Services - 0.2% | | | |
| Data Processing & Outsourced Services - 0.1% | | | |
| Checkr, Inc. Series E (c) | | 711,000 | 13,231,710 |
| | | | |
| Internet Services & Infrastructure - 0.1% | | | |
| Gupshup, Inc. (a)(b)(c) | | 257,284 | 5,019,611 |
| | | | |
TOTAL IT SERVICES | | | 18,251,321 |
| | | | |
| TOTAL PREFERRED STOCKS (Cost $121,026,281) | | | 118,208,691 |
| | | | |
| Preferred Securities - 0.0% |
| | | Principal Amount (f) | Value ($) |
| Semiconductors & Semiconductor Equipment - 0.0% | | | |
| Semiconductors - 0.0% | | | |
GaN Systems, Inc. 0% (a)(c)(g) (Cost $3,132,190) | | 3,132,190 | 3,132,190 |
| | | | |
| Money Market Funds - 3.4% |
| | | Shares | Value ($) |
| Fidelity Cash Central Fund 2.33% (h) | | 109,126,763 | 109,148,589 |
| Fidelity Securities Lending Cash Central Fund 2.34% (h)(i) | | 183,364,330 | 183,382,666 |
| TOTAL MONEY MARKET FUNDS (Cost $292,531,255) | | | 292,531,255 |
| | | | |
| TOTAL INVESTMENT IN SECURITIES - 101.9% (Cost $7,165,881,551) | 8,866,809,297 |
NET OTHER ASSETS (LIABILITIES) - (1.9)% | (166,940,972) |
| NET ASSETS - 100.0% | 8,699,868,325 |
| | |
Legend
| (a) | Restricted securities (including private placements) - Investment in securities not registered under the Securities Act of 1933 (excluding 144A issues). At the end of the period, the value of restricted securities (excluding 144A issues) amounted to $150,975,987 or 1.7% of net assets. |
| (d) | Security exempt from registration under Rule 144A of the Securities Act of 1933. These securities may be resold in transactions exempt from registration, normally to qualified institutional buyers. At the end of the period, the value of these securities amounted to $12,348,492 or 0.1% of net assets. |
| (e) | Security or a portion of the security is on loan at period end. |
| (f) | Amount is stated in United States dollars unless otherwise noted. |
| (g) | Security is perpetual in nature with no stated maturity date. |
| (h) | Affiliated fund that is generally available only to investment companies and other accounts managed by Fidelity Investments. The rate quoted is the annualized seven-day yield of the fund at period end. A complete unaudited listing of the fund's holdings as of its most recent quarter end is available upon request. In addition, each Fidelity Central Fund's financial statements are available on the SEC's website or upon request. |
| (i) | Investment made with cash collateral received from securities on loan. |
| Additional information on each restricted holding is as follows: |
| Security | Acquisition Date | Acquisition Cost ($) |
| ABL Space Systems Series B | 3/24/21 | 4,413,489 |
| ABL Space Systems Series B2 | 10/22/21 | 5,098,960 |
| Algolia SAS Series D | 7/23/21 | 3,213,066 |
| Algolia, Inc. | 10/27/21 | 4,489,203 |
| Ant International Co. Ltd. Class C | 5/16/18 | 24,495,442 |
| Astera Labs, Inc. Series A | 5/17/22 | 3,574,905 |
| Astera Labs, Inc. Series B | 5/17/22 | 608,675 |
| Astera Labs, Inc. Series C | 8/24/21 | 1,157,132 |
| Astera Labs, Inc. Series D | 5/17/22 - 5/27/22 | 14,679,226 |
| Astranis Space Technologies Corp. Series C | 3/19/21 | 13,271,808 |
| Beta Technologies, Inc. Series A | 4/09/21 | 5,318,743 |
| Bolt Technology OU Series E | 1/03/22 | 10,610,609 |
| ByteDance Ltd. Series E1 | 11/18/20 | 7,747,662 |
| Cazoo Group Ltd. | 3/28/21 | 1,441,000 |
| CCC Intelligent Solutions Holdings, Inc. | 2/02/21 | 1,020,450 |
| Convoy, Inc. Series D | 10/30/19 | 2,760,048 |
| Cvent Holding Corp. | 7/23/21 | 10,996,670 |
| Databricks, Inc. Series G | 2/01/21 | 2,661,228 |
| Databricks, Inc. Series H | 8/31/21 | 12,787,562 |
| Delhivery Private Ltd. | 5/20/21 | 2,826,237 |
| Discord, Inc. Series I | 9/15/21 | 715,812 |
| Epic Games, Inc. | 3/29/21 | 15,856,545 |
| GaN Systems, Inc. Series F1 | 11/30/21 | 1,133,216 |
| GaN Systems, Inc. Series F2 | 11/30/21 | 598,383 |
| GaN Systems, Inc. 0% | 11/30/21 | 3,132,190 |
| Gupshup, Inc. | 6/08/21 | 5,882,850 |
| IonQ, Inc. | 3/07/21 | 84,000 |
| Reddit, Inc. Series D | 2/04/19 | 5,440,247 |
| Reddit, Inc. Series E | 5/18/21 | 611,628 |
| Skyryse, Inc. Series B | 10/21/21 | 3,006,020 |
| Stripe, Inc. Class B | 5/18/21 | 1,548,955 |
| Stripe, Inc. Series H | 3/15/21 | 686,138 |
| Xsight Labs Ltd. Series D | 2/16/21 | 2,250,874 |
Affiliated Central Funds
Fiscal year to date information regarding the Fund's investments in Fidelity Central Funds, including the ownership percentage, is presented below.
| Affiliate | Value, beginning of period ($) | Purchases ($) | Sales Proceeds ($) | Dividend Income ($) | Realized Gain (loss) ($) | Change in Unrealized appreciation (depreciation) ($) | Value, end of period ($) | %ownership, end of period |
| Fidelity Cash Central Fund 2.33% | 49,633,884 | 898,474,774 | 838,960,069 | 471,540 | - | - | 109,148,589 | 0.2% |
| Fidelity Securities Lending Cash Central Fund 2.34% | 122,541,953 | 694,915,154 | 634,074,441 | 363,776 | - | - | 183,382,666 | 0.5% |
| Total | 172,175,837 | 1,593,389,928 | 1,473,034,510 | 835,316 | - | - | 292,531,255 | |
| | | | | | | | | |
Amounts in the income column in the above table include any capital gain distributions from underlying funds, which are presented in the corresponding line item in the Statement of Operations, if applicable.
Amount for Fidelity Securities Lending Cash Central Fund represents the income earned on investing cash collateral, less rebates paid to borrowers and any lending agent fees associated with the loan, plus any premium payments received for lending certain types of securities.
Investment Valuation
The following is a summary of the inputs used, as of August 31, 2022, involving the Fund's assets and liabilities carried at fair value. The inputs or methodology used for valuing securities may not be an indication of the risk associated with investing in those securities. For more information on valuation inputs, and their aggregation into the levels used below, please refer to the Investment Valuation section in the accompanying Notes to Financial Statements.
| Valuation Inputs at Reporting Date: |
| Description | Total ($) | Level 1 ($) | Level 2 ($) | Level 3 ($) |
Investments in Securities: | | | | |
|
| Common Stocks | 8,452,937,161 | 8,231,895,157 | 188,269,646 | 32,772,358 |
|
| Preferred Stocks | 118,208,691 | - | - | 118,208,691 |
|
| Preferred Securities | 3,132,190 | - | - | 3,132,190 |
|
| Money Market Funds | 292,531,255 | 292,531,255 | - | - |
| Total Investments in Securities: | 8,866,809,297 | 8,524,426,412 | 188,269,646 | 154,113,239 |
| | | | | |
|
| Net Unrealized Depreciation on Unfunded Commitments | (1,070,220) | - | - | (1,070,220) |
| Total | (1,070,220) | - | - | (1,070,220) |
The following is a reconciliation of Investments in Securities for which Level 3 inputs were used in determining value:
| |
| Investments in Securities: | |
| Preferred Stocks | | | |
| Beginning Balance | $ | 124,004,300 | |
| Net Realized Gain (Loss) on Investment Securities | | - | |
| Net Unrealized Gain (Loss) on Investment Securities | | (24,658,415) | |
| Cost of Purchases | | 18,862,806 | |
| Proceeds of Sales | | - | |
| Amortization/Accretion | | - | |
| Transfers into Level 3 | | - | |
| Transfers out of Level 3 | | - | |
| Ending Balance | $ | 118,208,691 | |
| The change in unrealized gain (loss) for the period attributable to Level 3 securities held at August 31, 2022 | $ | (24,658,415) | |
| Other Investments in Securities | | | |
| Beginning Balance | $ | 39,422,488 | |
| Net Realized Gain (Loss) on Investment Securities | | - | |
| Net Unrealized Gain (Loss) on Investment Securities | | 984,384 | |
| Cost of Purchases | | - | |
| Proceeds of Sales | | - | |
| Amortization/Accretion | | - | |
| Transfers into Level 3 | | - | |
| Transfers out of Level 3 | | (4,502,324) | |
| Ending Balance | $ | 35,904,548 | |
| The change in unrealized gain (loss) for the period attributable to Level 3 securities held at August 31, 2022 | $ | 984,384 | |
| The information used in the above reconciliation represents fiscal year to date activity for any Investments in Securities identified as using Level 3 inputs at either the beginning or the end of the current fiscal period. Cost of purchases and proceeds of sales may include securities received and/or delivered through in-kind transactions. Transfers into Level 3 were attributable to a lack of observable market data resulting from decreases in market activity, decreases in liquidity, security restructurings or corporate actions. Transfers out of Level 3 were attributable to observable market data becoming available for those securities. Transfers in or out of Level 3 represent the beginning value of any Security or Instrument where a change in the pricing level occurred from the beginning to the end of the period. The cost of purchases and the proceeds of sales may include securities received or delivered through corporate actions or exchanges. Realized and unrealized gains (losses) disclosed in the reconciliation are included in Net Gain (Loss) on the Fund's Statement of Operations. | |
Technology Portfolio
| Statement of Assets and Liabilities |
| | | | August 31, 2022 (Unaudited) |
| | | | | |
| Assets | | | | |
| Investment in securities, at value (including securities loaned of $177,864,165) - See accompanying schedule: | | $8,574,278,042 | | |
Unaffiliated issuers (cost $6,873,350,296) | | | |
Fidelity Central Funds (cost $292,531,255) | | 292,531,255 | | |
| | | | | |
| Total Investment in Securities (cost $7,165,881,551) | | | $ | 8,866,809,297 |
| Foreign currency held at value (cost $85,587) | | | | 85,587 |
| Receivable for investments sold | | | | 21,897,204 |
| Receivable for fund shares sold | | | | 3,289,476 |
| Dividends receivable | | | | 5,010,704 |
| Distributions receivable from Fidelity Central Funds | | | | 440,591 |
| Prepaid expenses | | | | 38,572 |
| Other receivables | | | | 381,253 |
Total assets | | | | 8,897,952,684 |
| Liabilities | | | | |
| Unrealized depreciation on unfunded commitments | | 1,070,220 | | |
| Payable for fund shares redeemed | | 7,290,704 | | |
| Accrued management fee | | 4,126,358 | | |
| Other affiliated payables | | 1,211,074 | | |
| Other payables and accrued expenses | | 1,018,529 | | |
| Collateral on securities loaned | | 183,367,474 | | |
| Total Liabilities | | | | 198,084,359 |
| Net Assets | | | $ | 8,699,868,325 |
| Net Assets consist of: | | | | |
| Paid in capital | | | $ | 7,627,993,660 |
| Total accumulated earnings (loss) | | | | 1,071,874,665 |
| Net Assets | | | $ | 8,699,868,325 |
Net Asset Value , offering price and redemption price per share ($8,699,868,325 ÷ 438,583,950 shares) | | | $ | 19.84 |
| | | | | |
| Statement of Operations |
| | | | Six months ended August 31, 2022 (Unaudited) |
| Investment Income | | | | |
| Dividends | | | $ | 30,745,191 |
| Income from Fidelity Central Funds (including $363,776 from security lending) | | | | 835,316 |
| Total Income | | | | 31,580,507 |
| Expenses | | | | |
| Management fee | $ | 24,887,613 | | |
| Transfer agent fees | | 7,003,814 | | |
| Accounting fees | | 601,153 | | |
| Custodian fees and expenses | | 59,470 | | |
| Independent trustees' fees and expenses | | 15,553 | | |
| Registration fees | | 39,081 | | |
| Audit | | 22,283 | | |
| Legal | | 7,835 | | |
| Interest | | 7,757 | | |
| Miscellaneous | | 32,066 | | |
| Total expenses before reductions | | 32,676,625 | | |
| Expense reductions | | (160,055) | | |
| Total expenses after reductions | | | | 32,516,570 |
| Net Investment income (loss) | | | | (936,063) |
| Realized and Unrealized Gain (Loss) | | | | |
| Net realized gain (loss) on: | | | | |
| Investment Securities: | | | | |
| Unaffiliated issuers(net of foreign taxes of $605,902) | | (320,955,073) | | |
| Foreign currency transactions | | (83,383) | | |
| Total net realized gain (loss) | | | | (321,038,456) |
| Change in net unrealized appreciation (depreciation) on: | | | | |
| Investment Securities: | | | | |
| Unaffiliated issuers(net of increase in deferred foreign taxes of $201,218) | | (1,648,937,362) | | |
| Unfunded commitments | | (1,070,220) | | |
| Assets and liabilities in foreign currencies | | (20,582) | | |
| Total change in net unrealized appreciation (depreciation) | | | | (1,650,028,164) |
| Net gain (loss) | | | | (1,971,066,620) |
| Net increase (decrease) in net assets resulting from operations | | | $ | (1,972,002,683) |
| Statement of Changes in Net Assets |
| |
| | Six months ended August 31, 2022 (Unaudited) | | Year ended February 28, 2022 |
| Increase (Decrease) in Net Assets | | | | |
| Operations | | | | |
| Net investment income (loss) | $ | (936,063) | $ | (28,034,349) |
| Net realized gain (loss) | | (321,038,456) | | 942,930,071 |
| Change in net unrealized appreciation (depreciation) | | (1,650,028,164) | | (674,451,714) |
| Net increase (decrease) in net assets resulting from operations | | (1,972,002,683) | | 240,444,008 |
| Distributions to shareholders | | (310,416,447) | | (1,453,950,149) |
| Share transactions | | | | |
| Proceeds from sales of shares | | 675,920,618 | | 2,156,919,710 |
| Reinvestment of distributions | | 291,937,258 | | 1,378,760,437 |
| Cost of shares redeemed | | (1,039,358,815) | | (3,254,727,729) |
Net increase (decrease) in net assets resulting from share transactions | | (71,500,939) | | 280,952,418 |
| Total increase (decrease) in net assets | | (2,353,920,069) | | (932,553,723) |
| | | | | |
| Net Assets | | | | |
| Beginning of period | | 11,053,788,394 | | 11,986,342,117 |
| End of period | $ | 8,699,868,325 | $ | 11,053,788,394 |
| | | | | |
| Other Information | | | | |
| Shares | | | | |
| Sold | | 31,307,467 | | 76,869,741 |
| Issued in reinvestment of distributions | | 12,438,737 | | 49,764,669 |
| Redeemed | | (48,699,433) | | (118,513,597) |
| Net increase (decrease) | | (4,953,229) | | 8,120,813 |
| | | | | |
| | Six months ended (Unaudited) August 31, 2022 | | Years ended February 28, 2022 | | 2021 | | 2020 A | | 2019 B | | 2018 B |
Selected Per-Share Data | | | | | | | | | | | | |
| Net asset value, beginning of period | $ | 24.92 | $ | 27.53 | $ | 19.65 | $ | 15.45 | $ | 19.36 | $ | 14.70 |
| Income from Investment Operations | | | | | | | | | | | | |
Net investment income (loss) C,D | | - | | (.06) | | (.03) | | .05 | | .06 | | - |
| Net realized and unrealized gain (loss) | | (4.37) | | .83 | | 12.98 | | 4.52 | | (.78) | | 6.15 |
| Total from investment operations | | (4.37) | | .77 | | 12.95 | | 4.57 | | (.72) | | 6.15 |
| Distributions from net investment income | | - | | - | | (.03) | | (.05) | | (.02) | | - |
| Distributions from net realized gain | | (.71) | | (3.38) | | (5.04) | | (.32) | | (3.17) | | (1.49) |
| Total distributions | | (.71) | | (3.38) | | (5.07) | | (.37) | | (3.19) | | (1.49) |
| Net asset value, end of period | $ | 19.84 | $ | 24.92 | $ | 27.53 | $ | 19.65 | $ | 15.45 | $ | 19.36 |
Total Return E,F | | (17.99)% | | 1.91% | | 69.87% | | 29.57% | | (3.03)% | | 43.71% |
Ratios to Average Net Assets D,G,H | | | | | | | | | | | | |
| Expenses before reductions | | .69% I | | .67% | | .69% | | .71% | | .72% | | .75% |
| Expenses net of fee waivers, if any | | .69% I | | .67% | | .69% | | .71% | | .72% | | .75% |
| Expenses net of all reductions | | .69% I | | .67% | | .68% | | .71% | | .71% | | .74% |
| Net investment income (loss) | | (.02)% I | | (.23)% | | (.13)% | | .30% | | .34% | | .01% |
| Supplemental Data | | | | | | | | | | | | |
| Net assets, end of period (000 omitted) | $ | 8,699,868 | $ | 11,053,788 | $ | 11,986,342 | $ | 6,558,578 | $ | 5,124,121 | $ | 7,242,300 |
Portfolio turnover rate J | | 23% I | | 87% | | 107% | | 32% K | | 126% K | | 71% |
A For the year ended February 29.
B Per share amounts have been adjusted to reflect the impact of the 10 for 1 share split that soccurred on August 10, 2018.
C Calculated based on average shares outstanding during the period.
D Net investment income (loss) is affected by the timing of the declaration of dividends by any underlying mutual funds or exchange-traded funds (ETFs). Net investment income (loss) of any such underlying funds is not included in the Fund's net investment income (loss) ratio.
E Total returns for periods of less than one year are not annualized.
F Total returns would have been lower if certain expenses had not been reduced during the applicable periods shown.
G Fees and expenses of any underlying mutual funds or exchange-traded funds (ETFs) are not included in the Fund's expense ratio. The Fund indirectly bears its proportionate share of these expenses. For additional expense information related to investments in Fidelity Central Funds, please refer to the "Investments in Fidelity Central Funds" note found in the Notes to Financial Statements section of the most recent Annual or Semi-Annual report.
H Expense ratios reflect operating expenses of the class. Expenses before reductions do not reflect amounts reimbursed, waived, or reduced through arrangements with the investment adviser, brokerage services, or other offset arrangements, if applicable, and do not represent the amount paid by the class during periods when reimbursements, waivers or reductions occur.
I Annualized
J Amount does not include the portfolio activity of any underlying mutual funds or exchange-traded funds (ETFs).
K Portfolio turnover rate excludes securities received or delivered in-kind.
For the period ended August 31, 2022
1. Organization.
IT Services Portfolio, Semiconductors Portfolio, Software and IT Services Portfolio, Tech Hardware Portfolio and Technology Portfolio (the Funds) are non-diversified funds of Fidelity Select Portfolios (the Trust). The Trust is registered under the Investment Company Act of 1940, as amended (the 1940 Act), as an open-end management investment company organized as a Massachusetts business trust. The Funds invest primarily in securities of companies whose principal business activities fall within specific industries. Each Fund is authorized to issue an unlimited number of shares. Share transactions on the Statement of Changes in Net Assets may contain exchanges between affiliated funds. Certain Funds' investments in emerging markets can be subject to social, economic, regulatory, and political uncertainties and can be extremely volatile.
2. Investments in Fidelity Central Funds.
Funds may invest in Fidelity Central Funds, which are open-end investment companies generally available only to other investment companies and accounts managed by the investment adviser and its affiliates. The Schedule of Investments lists any Fidelity Central Funds held as an investment as of period end, but does not include the underlying holdings of each Fidelity Central Fund. An investing fund indirectly bears its proportionate share of the expenses of the underlying Fidelity Central Funds.
Based on its investment objective, each Fidelity Central Fund may invest or participate in various investment vehicles or strategies that are similar to those of the investing fund. These strategies are consistent with the investment objectives of the investing fund and may involve certain economic risks which may cause a decline in value of each of the Fidelity Central Funds and thus a decline in the value of the investing fund.
| Fidelity Central Fund | Investment Manager | Investment Objective | Investment Practices | Expense Ratio A |
| Fidelity Money Market Central Funds | Fidelity Management & Research Company LLC (FMR) | Each fund seeks to obtain a high level of current income consistent with the preservation of capital and liquidity. | Short-term Investments | Less than .005% |
A Expenses expressed as a percentage of average net assets and are as of each underlying Central Fund's most recent annual or semi-annual shareholder report.
A complete unaudited list of holdings for each Fidelity Central Fund is available upon request or at the Securities and Exchange Commission website at www.sec.gov. In addition, the financial statements of the Fidelity Central Funds which contain the significant accounting policies (including investment valuation policies) of those funds, and are not covered by the Report of Independent Registered Public Accounting Firm, are available on the Securities and Exchange Commission website or upon request.
3. Significant Accounting Policies.
Each Fund is an investment company and applies the accounting and reporting guidance of the Financial Accounting Standards Board (FASB) Accounting Standards Codification Topic 946 Financial Services - Investment Companies . The financial statements have been prepared in conformity with accounting principles generally accepted in the United States of America (GAAP), which require management to make certain estimates and assumptions at the date of the financial statements. Actual results could differ from those estimates. Subsequent events, if any, through the date that the financial statements were issued have been evaluated in the preparation of the financial statements. Each Fund's Schedule of Investments lists any underlying mutual funds or exchange-traded funds (ETFs) but does not include the underlying holdings of these funds. The following summarizes the significant accounting policies of each Fund:
Investment Valuation. Investments are valued as of 4:00 p.m. Eastern time on the last calendar day of the period. The Board of Trustees (the Board) has delegated the day to day responsibility for the valuation of each Fund's investments to the Fair Value Committee (the Committee) established by each Fund's investment adviser. In accordance with valuation policies and procedures approved by the Board, each Fund attempts to obtain prices from one or more third party pricing vendors or brokers to value its investments. When current market prices, quotations or currency exchange rates are not readily available or reliable, investments will be fair valued in good faith by the Committee, in accordance with procedures adopted by the Board. Factors used in determining fair value vary by investment type and may include market or investment specific events, changes in interest rates and credit quality. The frequency with which these procedures are used cannot be predicted and they may be utilized to a significant extent. The Committee oversees each Fund's valuation policies and procedures and reports to the Board on the Committee's activities and fair value determinations. The Board monitors the appropriateness of the procedures used in valuing each Fund's investments and ratifies the fair value determinations of the Committee.
Each Fund categorizes the inputs to valuation techniques used to value its investments into a disclosure hierarchy consisting of three levels as shown below:
Level 1 - unadjusted quoted prices in active markets for identical investments
Level 2 - other significant observable inputs (including quoted prices for similar investments, interest rates, prepayment speeds, etc.)
Level 3 - unobservable inputs (including the Fund's own assumptions based on the best information available)
Valuation techniques used to value each Fund's investments by major category are as follows:
Equity securities, including restricted securities, for which market quotations are readily available, are valued at the last reported sale price or official closing price as reported by a third party pricing vendor on the primary market or exchange on which they are traded and are categorized as Level 1 in the hierarchy. In the event there were no sales during the day or closing prices are not available, securities are valued at the last quoted bid price or may be valued using the last available price and are generally categorized as Level 2 in the hierarchy. For foreign equity securities, when market or security specific events arise, comparisons to the valuation of American Depositary Receipts (ADRs), futures contracts, ETFs and certain indexes as well as quoted prices for similar securities may be used and would be categorized as Level 2 in the hierarchy. For equity securities, including restricted securities, where observable inputs are limited, assumptions about market activity and risk are used and these securities may be categorized as Level 3 in the hierarchy. Securities, including private placements or other restricted securities, for which observable inputs are not available are valued using alternate valuation approaches, including the market approach, the income approach and cost approach, and are categorized as Level 3 in the hierarchy. The market approach considers factors including the price of recent investments in the same or a similar security or financial metrics of comparable securities. The income approach considers factors including expected future cash flows, security specific risks and corresponding discount rates. The cost approach considers factors including the value of the security's underlying assets and liabilities.
Debt securities, including restricted securities, are valued based on evaluated prices received from third party pricing vendors or from brokers who make markets in such securities. Preferred securities are valued by pricing vendors who utilize matrix pricing which considers yield or price of bonds of comparable quality, coupon, maturity and type or by broker-supplied prices. When independent prices are unavailable or unreliable, debt securities may be valued utilizing pricing methodologies which consider similar factors that would be used by third party pricing vendors. Debt securities are generally categorized as Level 2 in the hierarchy but may be Level 3 depending on the circumstances.
Investments in open-end mutual funds, including the Fidelity Central Funds, are valued at their closing net asset value (NAV) each business day and are categorized as Level 1 in the hierarchy.
The following provides information on Level 3 securities held by the Fund that were valued at period end based on unobservable inputs. These amounts exclude valuations provided by a broker.
| Asset Type | Fair Value | Valuation Technique(s) | Unobservable Input | Amount or Range/Weighted Average | Impact to Valuation from an Increase in Input A |
| Equities | $150,981,049 | Market approach | Discount rate | 6.5%-75.0%/20.4% | Decrease |
| | | | Transaction price | $8.00-$103.17/$30.86 | Increase |
| | | Recovery value | Recovery value | $0.00 | Increase |
| | | Book value | Book value multiple | 1.6 | Increase |
| | | Market comparable | Enterprise value/Revenue multiple (EV/R) | 1.5-27.0/8.6 | Increase |
| | | Black scholes | Volatility | 75.0% | Increase |
| | | | Probability rate | 50.0% | Increase |
| Preferred Securities | $3,132,190 | Market approach | Transaction price | $100.00 | Increase |
A Represents the directional change in the fair value of the Level 3 investments that could have resulted from an increase in the corresponding input as of period end. A decrease to the unobservable input would have had the opposite effect. Significant changes in these inputs may have resulted in a significantly higher or lower fair value measurement at period end.
Changes in valuation techniques may result in transfers in or out of an assigned level within the disclosure hierarchy. The aggregate value of investments by input level as of August 31, 2022, as well as a roll forward of Level 3 investments, is included at the end of each Fund's Schedule of Investments.
Foreign Currency. Certain Funds may use foreign currency contracts to facilitate transactions in foreign-denominated securities. Gains and losses from these transactions may arise from changes in the value of the foreign currency or if the counterparties do not perform under the contracts' terms.
Foreign-denominated assets, including investment securities, and liabilities are translated into U.S. dollars at the exchange rates at period end. Purchases and sales of investment securities, income and dividends received, and expenses denominated in foreign currencies are translated into U.S. dollars at the exchange rate in effect on the transaction date.
The effects of exchange rate fluctuations on investments are included with the net realized and unrealized gain (loss) on investment securities. Other foreign currency transactions resulting in realized and unrealized gain (loss) are disclosed separately.
Investment Transactions and Income. For financial reporting purposes, the Funds' investment holdings and NAV include trades executed through the end of the last business day of the period. The NAV per share for processing shareholder transactions is calculated as of the close of business of the New York Stock Exchange (NYSE), normally 4:00 p.m. Eastern time and includes trades executed through the end of the prior business day. Gains and losses on securities sold are determined on the basis of identified cost and for certain Funds include proceeds received from litigation. Commissions paid to certain brokers with whom the investment adviser, or its affiliates, places trades on behalf of a fund include an amount in addition to trade execution, which may be rebated back to a fund. Any such rebates are included in net realized gain (loss) on investments in the Statement of Operations. Dividend income is recorded on the ex-dividend date, except for certain dividends from foreign securities where the ex-dividend date may have passed, which are recorded as soon as the Funds are informed of the ex-dividend date. Non-cash dividends included in dividend income, if any, are recorded at the fair market value of the securities received. Income and capital gain distributions from Fidelity Central Funds, if any, are recorded on the ex-dividend date. Certain distributions received by the Funds represent a return of capital or capital gain. The Funds determine the components of these distributions subsequent to the ex-dividend date, based upon receipt of tax filings or other correspondence relating to the underlying investment. These distributions are recorded as a reduction of cost of investments and/or as a realized gain. Investment income is recorded net of foreign taxes withheld where recovery of such taxes is uncertain. Funds may file withholding tax reclaims in certain jurisdictions to recover a portion of amounts previously withheld. Any withholding tax reclaims income is included in the Statement of Operations in dividends. Any receivables for withholding tax reclaims are included in the Statement of Assets and Liabilities in dividends receivable.
Expenses. Expenses directly attributable to a fund are charged to that fund. Expenses attributable to more than one fund are allocated among the respective funds on the basis of relative net assets or other appropriate methods. Expenses included in the accompanying financial statements reflect the expenses of that fund and do not include any expenses associated with any underlying mutual funds or exchange-traded funds. Although not included in a fund's expenses, a fund indirectly bears its proportionate share of these expenses through the net asset value of each underlying mutual fund or exchange-traded fund. Expense estimates are accrued in the period to which they relate and adjustments are made when actual amounts are known.
Deferred Trustee Compensation. Under a Deferred Compensation Plan (the Plan) for certain Funds, certain independent Trustees have elected to defer receipt of a portion of their annual compensation. Deferred amounts are invested in affiliated mutual funds, are marked-to-market and remain in a fund until distributed in accordance with the Plan. The investment of deferred amounts and the offsetting payable to the Trustees presented below are included in the accompanying Statement of Assets and Liabilities in other receivables and other payables and accrued expenses, as applicable.
| Semiconductors Portfolio | $194,636 |
Software and IT Services Portfolio | 333,759 |
Tech Hardware Portfolio | 54,234 |
Technology Portfolio | 317,581 |
Income Tax Information and Distributions to Shareholders. Each year, each Fund intends to qualify as a regulated investment company under Subchapter M of the Internal Revenue Code, including distributing substantially all of its taxable income and realized gains. As a result, no provision for U.S. Federal income taxes is required. Each Fund files a U.S. federal tax return, in addition to state and local tax returns as required. Each Fund's federal income tax returns are subject to examination by the Internal Revenue Service (IRS) for a period of three fiscal years after they are filed. State and local tax returns may be subject to examination for an additional fiscal year depending on the jurisdiction. Foreign taxes are provided for based on each Fund's understanding of the tax rules and rates that exist in the foreign markets in which it invests. An estimated deferred tax liability for net unrealized appreciation on the applicable securities is included in Other payables and accrued expenses on each applicable Fund's Statement of Assets & Liabilities.
Distributions are declared and recorded on the ex-dividend date. Income and capital gain distributions are determined in accordance with income tax regulations, which may differ from GAAP.
Capital accounts within the financial statements are adjusted for permanent book-tax differences. These adjustments have no impact on net assets or the results of operations. Capital accounts are not adjusted for temporary book-tax differences which will reverse in a subsequent period.
Book-tax differences are primarily due to foreign currency transactions, certain foreign taxes, passive foreign investment companies (PFIC), deferred Trustee compensation, net operating losses and losses deferred due to wash sales and excise tax regulations.
As of period end, the cost and unrealized appreciation (depreciation) in securities, and derivatives if applicable, for federal income tax purposes were as follows for each Fund:
| | Tax cost | Gross unrealized appreciation | Gross unrealized depreciation | Net unrealized appreciation (depreciation) |
| IT Services Portfolio | $1,847,976,919 | $1,060,980,633 | $ (175,212,580) | $ 885,768,053 |
Semiconductors Portfolio | 5,251,330,875 | 2,164,998,278 | (561,569,427) | 1,603,428,851 |
Software and IT Services Portfolio | 5,415,610,334 | 4,559,791,009 | (817,536,382) | 3,742,254,627 |
Tech Hardware Portfolio | 654,347,156 | 198,710,779 | (84,618,346) | 114,092,433 |
Technology Portfolio | 7,178,028,419 | 2,926,858,207 | (1,238,077,329) | 1,688,780,878 |
Certain of the Funds elected to defer to the next fiscal year capital losses recognized during the period November 1, 2021 to February 28, 2022, and ordinary losses recognized during the period January 1, 2022 to February 28, 2022 Loss deferrals were as follows:
| Ordinary losses | Capital losses |
| IT Services Portfolio | $- | $ (5,864,158) |
Semiconductors Portfolio | (2,480,569) | (12,926,652) |
Technology Portfolio | - | (301,751,401) |
Restricted Securities (including Private Placements). Funds may invest in securities that are subject to legal or contractual restrictions on resale. These securities generally may be resold in transactions exempt from registration or to the public if the securities are registered. Disposal of these securities may involve time-consuming negotiations and expense, and prompt sale at an acceptable price may be difficult. Information regarding restricted securities held at period end is included at the end of the Schedule of Investments, if applicable.
Commitments. A commitment is an agreement to acquire an investment at a future date (subject to conditions) in connection with a potential public or non-public offering. Commitments outstanding at period end are presented in the table below. Unrealized appreciation (depreciation) on any commitments outstanding at period end is separately presented in the Statements of Assets and Liabilities as Unrealized appreciation (depreciation) on unfunded commitments, and any change in unrealized appreciation (depreciation) on unfunded commitments during the period is separately presented in the Statement of Operations, as applicable based on contractual conditions of each commitment.
| | Investment to be Acquired | Commitment Amount | Unrealized Appreciation (Depreciation) |
| Technology Portfolio | Stripe, Inc. | $1,070,220 | $(1,070,220) |
4. Purchases and Sales of Investments.
Purchases and sales of securities, other than short-term securities and in-kind transactions, as applicable, are noted in the table below.
| | Purchases ($) | Sales ($) |
| IT Services Portfolio | 599,230,603 | 865,020,097 |
Semiconductors Portfolio | 1,125,919,414 | 1,394,086,516 |
Software and IT Services Portfolio | 65,737,686 | 551,133,455 |
Tech Hardware Portfolio | 87,928,898 | 122,369,980 |
Technology Portfolio | 1,088,148,851 | 1,572,737,638 |
5. Fees and Other Transactions with Affiliates.
Management Fee. Fidelity Management & Research Company LLC (the investment adviser) and its affiliates provide the Funds with investment management related services for which the Funds pay a monthly management fee. The management fee is the sum of an individual fund fee rate and an annualized group fee rate. The individual fund fee rate is applied to each Fund's average net assets. The group fee rate is based upon the monthly average net assets of a group of registered investment companies with which the investment adviser has management contracts. The group fee rate decreases as assets under management increase and increases as assets under management decrease. For the reporting period, each Fund's annualized management fee rate expressed as a percentage of each Fund's average net assets was as follows:
| | Individual Rate | Group Rate | Total |
| IT Services Portfolio | .30% | .23% | .53% |
Semiconductors Portfolio | .30% | .23% | .53% |
Software and IT Services Portfolio | .30% | .23% | .53% |
Tech Hardware Portfolio | .30% | .23% | .53% |
Technology Portfolio | .30% | .23% | .53% |
Transfer Agent Fees. Fidelity Investments Institutional Operations Company LLC (FIIOC), an affiliate of the investment adviser, is the Funds' transfer, dividend disbursing and shareholder servicing agent. FIIOC receives account fees and asset-based fees that vary according to account size and type of account. FIIOC pays for typesetting, printing and mailing of shareholder reports, except proxy statements. For the period, transfer agent fees were equivalent to the following annualized rates expressed as a percentage of average net assets:
| IT Services Portfolio | .17% |
Semiconductors Portfolio | .14% |
Software and IT Services Portfolio | .15% |
Tech Hardware Portfolio | .15% |
Technology Portfolio | .15% |
Accounting Fees. Fidelity Service Company, Inc. (FSC), an affiliate of the investment adviser, maintains each Fund's accounting records. The accounting fee is based on the level of average net assets for each month. For the period, the fees were equivalent to the following annualized rates:
| | % of Average Net Assets |
| IT Services Portfolio | .03 |
Semiconductors Portfolio | .02 |
Software and IT Services Portfolio | .01 |
Tech Hardware Portfolio | .03 |
Technology Portfolio | .01 |
Brokerage Commissions. A portion of portfolio transactions were placed with brokerage firms which are affiliates of the investment adviser. Brokerage commissions are included in net realized gain (loss) and change in net unrealized appreciation (depreciation) in the Statement of Operations. The commissions paid to these affiliated firms were as follows:
| | Amount |
| IT Services Portfolio | $ 12,041 |
Semiconductors Portfolio | 15,187 |
Software and IT Services Portfolio | 1,625 |
Tech Hardware Portfolio | 2,089 |
Technology Portfolio | 21,568 |
Interfund Lending Program. Pursuant to an Exemptive Order issued by the Securities and Exchange Commission (the SEC), each Fund, along with other registered investment companies having management contracts with Fidelity Management & Research Company LLC (FMR), or other affiliated entities of FMR, may participate in an interfund lending program. This program provides an alternative credit facility allowing each Fund to borrow from, or lend money to, other participating affiliated funds. At period end, there were no interfund loans outstanding. Activity in this program during the period for which loans were outstanding was as follows:
| | Borrower or Lender | Average Loan Balance | Weighted Average Interest Rate | Interest Expense |
| IT Services Portfolio | Borrower | $ 6,840,143 | .73% | $ 1,940 |
Semiconductors Portfolio | Borrower | $ 8,964,125 | .53% | $ 1,055 |
Software and IT Services Portfolio | Borrower | $8,520,838 | .83% | $ 7,257 |
Tech Hardware Portfolio | Borrower | $ 3,430,333 | .57% | $ 162 |
Technology Portfolio | Borrower | $ 17,458,500 | .80% | $ 7,757 |
Interfund Trades. Funds may purchase from or sell securities to other Fidelity Funds under procedures adopted by the Board. The procedures have been designed to ensure these interfund trades are executed in accordance with Rule 17a-7 of the 1940 Act. Any interfund trades are included within the respective purchases and sales amounts shown in the Purchases and Sales of Investments note. Interfund trades during the period are noted in the table below.
| | Purchases ($) | Sales ($) | Realized Gain (Loss) ($) |
| IT Services Portfolio | 18,712,243 | 24,112,911 | (1,675,297) |
Semiconductors Portfolio | 53,271,583 | 54,615,703 | 584,325 |
Software and IT Services Portfolio | 2,637,490 | 10,773,991 | 375,667 |
Tech Hardware Portfolio | 5,838,573 | 793,358 | 18,704 |
Technology Portfolio | 67,526,529 | 37,023,421 | (6,879,432) |
6. Committed Line of Credit.
Certain Funds participate with other funds managed by the investment adviser or an affiliate in a $4.25 billion credit facility (the "line of credit") to be utilized for temporary or emergency purposes to fund shareholder redemptions or for other short-term liquidity purposes. The participating funds have agreed to pay commitment fees on their pro-rata portion of the line of credit, which are reflected in Miscellaneous expenses on the Statement of Operations, and are listed below. During the period, there were no borrowings on this line of credit.
| | Amount |
| IT Services Portfolio | $ 2,388 |
Semiconductors Portfolio | 6,863 |
Software and IT Services Portfolio | 9,399 |
Tech Hardware Portfolio | 758 |
Technology Portfolio | 9,076 |
7. Security Lending.
Funds lend portfolio securities from time to time in order to earn additional income. Lending agents are used, including National Financial Services (NFS), an affiliate of the investment adviser. Pursuant to a securities lending agreement, NFS will receive a fee, which is capped at 9.9% of a fund's daily lending revenue, for its services as lending agent. A fund may lend securities to certain qualified borrowers, including NFS. On the settlement date of the loan, a fund receives collateral (in the form of U.S. Treasury obligations, letters of credit and/or cash) against the loaned securities and maintains collateral in an amount not less than 100% of the market value of the loaned securities during the period of the loan. The market value of the loaned securities is determined at the close of business of a fund and any additional required collateral is delivered to a fund on the next business day. A fund or borrower may terminate the loan at any time, and if the borrower defaults on its obligation to return the securities loaned because of insolvency or other reasons, a fund may apply collateral received from the borrower against the obligation. A fund may experience delays and costs in recovering the securities loaned. Any cash collateral received is invested in the Fidelity Securities Lending Cash Central Fund. Any loaned securities are identified as such in the Schedule of Investments, and the value of loaned securities and cash collateral at period end, as applicable, are presented in the Statement of Assets and Liabilities. Security lending income represents the income earned on investing cash collateral, less rebates paid to borrowers and any lending agent fees associated with the loan, plus any premium payments received for lending certain types of securities. Security lending income is presented in the Statement of Operations as a component of income from Fidelity Central Funds. Affiliated security lending activity, if any, was as follows:
| | Total Security Lending Fees Paid to NFS | Security Lending Income From Securities Loaned to NFS | Value of Securities Loaned to NFS at Period End |
| IT Services Portfolio | $ 20,288 | $ 26,152 | $2,399,051 |
Semiconductors Portfolio | $ 139,077 | $ 29,720 | $ - |
Software and IT Services Portfolio | $ 2,316 | $ - | $ - |
Tech Hardware Portfolio | $ 1,381 | $ - | $ - |
Technology Portfolio | $ 38,119 | $ 75 | $ - |
8. Bank Borrowings.
Each Fund is permitted to have bank borrowings for temporary or emergency purposes to fund shareholder redemptions or for other short-term liquidity requirements. Each Fund has established borrowing arrangements with certain banks. The interest rate on the borrowings is the bank's base rate, as revised from time to time. Any open loans, including accrued interest, at period end are presented under the caption "Notes payable" in the Statement of Assets and Liabilities, if applicable. Activity in this program during the period for which loans were outstanding was as follows:
| | Average Loan Balance | Weighted Average Interest Rate | Interest Expense |
| Software and IT Services Portfolio | $ 2,098,500 | .83% | $ 194 |
9. Expense Reductions.
Through arrangements with each applicable Fund's custodian, credits realized as a result of certain uninvested cash balances were used to reduce each applicable Fund's expenses. All of the applicable expense reductions are noted in the table below.
| | Custodian credits |
| Software and IT Services Portfolio | 664 |
In addition, during the period the investment adviser or an affiliate reimbursed and/or waived a portion of operating expenses as follows:
| | Amount |
| IT Services Portfolio | $ 41,669 |
Semiconductors Portfolio | 122,726 |
Software and IT Services Portfolio | 167,201 |
Tech Hardware Portfolio | 13,472 |
Technology Portfolio | 160,055 |
10. Other.
A fund's organizational documents provide former and current trustees and officers with a limited indemnification against liabilities arising in connection with the performance of their duties to the fund. In the normal course of business, a fund may also enter into contracts that provide general indemnifications. A fund's maximum exposure under these arrangements is unknown as this would be dependent on future claims that may be made against a fund. The risk of material loss from such claims is considered remote.
11. Risk and Uncertainties.
Many factors affect a fund's performance. Developments that disrupt global economies and financial markets, such as pandemics, epidemics, outbreaks of infectious diseases, war, terrorism, and environmental disasters, may significantly affect a fund's investment performance. The effects of these developments to a fund will be impacted by the types of securities in which a fund invests, the financial condition, industry, economic sector, and geographic location of an issuer, and a fund's level of investment in the securities of that issuer.
12. Prior Fiscal Year Merger Information.
On November 12, 2021, Tech Hardware Portfolio acquired all of the assets and assumed all of the liabilities of Communications Equipment Portfolio ("Target Fund") pursuant to an Agreement and Plan of Reorganization approved by the Board of Trustees ("The Board"). The securities held by the Target Fund were the primary assets acquired by the Fund. The acquisition was accomplished by an exchange of shares of the Fund for shares then outstanding of the Target Fund at its respective net asset value on the acquisition date. The reorganization provides shareholders of the Target Fund access to a larger portfolio with a similar investment objective and lower projected expenses. For financial reporting purposes, the assets and liabilities of the Target Fund and shares issued by the Fund were recorded at fair value; however, the cost basis of the investments received from the Target Fund were carried forward and will be utilized for purposes of the Fund's ongoing reporting of realized and unrealized gains and losses to more closely align subsequent reporting of realized gains with amounts distributable to shareholders for tax purposes. The reorganization qualified as a tax-free reorganization for federal income tax purposes with no gain or loss recognized to the funds or their shareholders.
| Target Fund | Investments ($) | Unrealized appreciation (depreciation) ($) | Net Assets ($) | Shares Exchanged | Shares Exchanged Ratio |
| Communications Equipment Portfolio | 187,085,638 | 75,879,300 | 189,381,924 | 1,755,160 | .4176867470 |
| Surviving Fund | Net Assets ($) | Total net assets after the acquisition ($) |
| Tech Hardware Portfolio | 798,971,790 | 988,353,714 |
Pro forma results of operations of the combined entity for the entire period ended February 28, 2022, as though the acquisition had occurred as of the beginning of the year (rather than on the actual acquisition date), are as follows:
| | Amount |
| Net investment income (loss) | $ 3,770,342 |
Total net realized gain (loss) | 191,061,539 |
Total change in net unrealized appreciation (depreciation) | (130,804,365) |
Net increase (decrease) in net assets resulting from operations | $64,027,516 |
Because the combined investment portfolios have been managed as a single portfolio since the acquisition was completed, it is not practicable to separate the amounts of revenue and earnings of the acquired fund that have been included in the Tech Hardware Portfolio's Statement of Operations since November 12, 2021.
As a shareholder, you incur two types of costs: (1) transaction costs, which may include sales charges (loads) on purchase payments or redemption proceeds, as applicable and (2) ongoing costs, which generally include management fees, distribution and/or service (12b-1) fees and other Fund expenses. This Example is intended to help you understand your ongoing costs (in dollars) of investing in a fund and to compare these costs with the ongoing costs of investing in other mutual funds.
| The Example is based on an investment of $1,000 invested at the beginning of the period and held for the entire period (March 1, 2022 to August 31, 2022). |
Actual Expenses
The first line of the accompanying table provides information about actual account values and actual expenses. You may use the information in this line, together with the amount you invested, to estimate the expenses that you paid over the period. Simply divide your account value by $1,000.00 (for example, an $8,600 account value divided by $1,000.00 = 8.6), then multiply the result by the number in the first line for a class/Fund under the heading entitled "Expenses Paid During Period" to estimate the expenses you paid on your account during this period. If any fund is a shareholder of any underlying mutual funds or exchange-traded funds (ETFs) (the Underlying Funds), such fund indirectly bears its proportional share of the expenses of the Underlying Funds in addition to the direct expenses incurred presented in the table. These fees and expenses are not included in the annualized expense ratio used to calculate the expense estimate in the table below.
Hypothetical Example for Comparison Purposes
The second line of the accompanying table provides information about hypothetical account values and hypothetical expenses based on the actual expense ratio and an assumed rate of return of 5% per year before expenses, which is not the actual return. The hypothetical account values and expenses may not be used to estimate the actual ending account balance or expenses you paid for the period. You may use this information to compare the ongoing costs of investing in the Fund and other funds. To do so, compare this 5% hypothetical example with the 5% hypothetical examples that appear in the shareholder reports of the other funds. If any fund is a shareholder of any Underlying Funds, such fund indirectly bears its proportional share of the expenses of the Underlying Funds in addition to the direct expenses as presented in the table. These fees and expenses are not included in the annualized expense ratio used to calculate the expense estimate in the table below.
Please note that the expenses shown in the table are meant to highlight your ongoing costs only and do not reflect any transaction costs. Therefore, the second line of the table is useful in comparing ongoing costs only, and will not help you determine the relative total costs of owning different funds. In addition, if these transactional costs were included, your costs would have been higher.
| | | | | Annualized Expense Ratio- A | | Beginning Account Value March 1, 2022 | | Ending Account Value August 31, 2022 | | Expenses Paid During Period- C March 1, 2022 to August 31, 2022 |
| | | | | | | | | | |
| IT Services Portfolio | | | | .72% | | | | | | |
| Actual | | | | | | $ 1,000 | | $ 879.10 | | $ 3.41 |
Hypothetical- B | | | | | | $ 1,000 | | $ 1,021.58 | | $ 3.67 |
| | | | | | | | | | |
| Semiconductors Portfolio | | | | .68% | | | | | | |
| Actual | | | | | | $ 1,000 | | $ 806.20 | | $ 3.10 |
Hypothetical- B | | | | | | $ 1,000 | | $ 1,021.78 | | $ 3.47 |
| | | | | | | | | | |
| Software and IT Services Portfolio | | | | .68% | | | | | | |
| Actual | | | | | | $ 1,000 | | $ 861.10 | | $ 3.19 |
Hypothetical- B | | | | | | $ 1,000 | | $ 1,021.78 | | $ 3.47 |
| | | | | | | | | | |
| Tech Hardware Portfolio | | | | .72% | | | | | | |
| Actual | | | | | | $ 1,000 | | $ 840.10 | | $ 3.34 |
Hypothetical- B | | | | | | $ 1,000 | | $ 1,021.58 | | $ 3.67 |
| | | | | | | | | | |
| Technology Portfolio | | | | .69% | | | | | | |
| Actual | | | | | | $ 1,000 | | $ 820.10 | | $ 3.17 |
Hypothetical- B | | | | | | $ 1,000 | | $ 1,021.73 | | $ 3.52 |
| |
A Annualized expense ratio reflects expenses net of applicable fee waivers.
B 5% return per year before expenses
C Expenses are equal to the annualized expense ratio, multiplied by the average account value over the period, multiplied by 184/ 365 (to reflect the one-half year period). The fees and expenses of any Underlying Funds are not included in each annualized expense ratio.
IT Services Portfolio
Semiconductors Portfolio
Software and IT Services Portfolio
Tech Hardware Portfolio (formerly, Computers Portfolio)
Technology Portfolio
Each year, the Board of Trustees, including the Independent Trustees (together, the Board), votes on the renewal of the management contract with Fidelity Management & Research Company LLC (FMR) and the sub-advisory agreements (together, the Advisory Contracts) for each fund. FMR and the sub-advisers are referred to herein as the Investment Advisers. The Board, assisted by the advice of fund counsel and Independent Trustees' counsel, requests and considers a broad range of information relevant to the renewal of the Advisory Contracts throughout the year.
The Board meets regularly and, at each of its meetings, covers an extensive agenda of topics and materials and considers factors that are relevant to its annual consideration of the renewal of each fund's Advisory Contracts, including the services and support provided to each fund and its shareholders. The Board has established various standing committees (Committees), each composed of and chaired by Independent Trustees with varying backgrounds, to which the Board has assigned specific subject matter responsibilities in order to enhance effective decision-making by the Board. The Board, acting directly and through its Committees, requests and receives information concerning the annual consideration of the renewal of each fund's Advisory Contracts. The Board also meets as needed to review matters specifically related to the Board's annual consideration of the renewal of the Advisory Contracts. Members of the Board may also meet with trustees of other Fidelity funds through joint ad hoc committees to discuss certain matters relevant to all of the Fidelity funds.
At its May 2022 meeting, the Board unanimously determined to renew each fund's Advisory Contracts. In reaching its determination, the Board considered all factors it believed relevant, including (i) the nature, extent, and quality of the services provided to each fund and its shareholders (including the investment performance of each fund); (ii) the competitiveness relative to peer funds of each fund's management fee and total expense ratio; (iii) the total costs of the services provided by and the profits realized by Fidelity from its relationships with each fund; and (iv) the extent to which, if any, economies of scale exist and are realized as each fund grows, and whether any economies of scale are appropriately shared with fund shareholders.
In considering whether to renew the Advisory Contracts for each fund, the Board reached a determination, with the assistance of fund counsel and Independent Trustees' counsel and through the exercise of its business judgment, that the renewal of the Advisory Contracts was in the best interests of each fund and its shareholders and that the compensation payable under the Advisory Contracts was fair and reasonable. The Board's decision to renew the Advisory Contracts was not based on any single factor, but rather was based on a comprehensive consideration of all the information provided to the Board at its meetings throughout the year. The Board, in reaching its determination to renew the Advisory Contracts, was aware that shareholders of each fund have a broad range of investment choices available to them, including a wide choice among funds offered by Fidelity's competitors, and that each fund's shareholders, who have the opportunity to review and weigh the disclosure provided by the fund in its prospectus and other public disclosures, have chosen to invest in that fund, which is part of the Fidelity family of funds.
Nature, Extent, and Quality of Services Provided . The Board considered Fidelity's staffing as it relates to the funds, including the backgrounds of investment personnel of Fidelity, and also considered the funds' investment objectives, strategies, and related investment philosophies. The Independent Trustees also had discussions with senior management of Fidelity's investment operations and investment groups. The Board considered the structure of the investment personnel compensation program and whether this structure provides appropriate incentives to act in the best interests of each fund. Additionally, the Board considered the portfolio managers' investments, if any, in the funds that they manage. The Board also considered the steps Fidelity had taken to ensure the continued provision of high quality services to the Fidelity funds during the COVID-19 pandemic, including the expansion of staff in client facing positions to maintain service levels in periods of high volumes and volatility.
Resources Dedicated to Investment Management and Support Services . The Board and the Fund Oversight and Research Committees reviewed the general qualifications and capabilities of Fidelity's investment staff, including its size, education, experience, and resources, as well as Fidelity's approach to recruiting, training, managing, and compensating investment personnel. The Board noted the resources devoted to expansion of Fidelity's global investment organization, and that Fidelity's analysts have extensive resources, tools, and capabilities that allow them to conduct sophisticated quantitative and fundamental analysis, as well as credit analysis of issuers, counterparties, and guarantors. Further, the Board considered that Fidelity's investment professionals have sufficient access to global information and data so as to provide competitive investment results over time, and that those professionals also have access to sophisticated tools that permit them to assess portfolio construction and risk and performance attribution characteristics continuously, as well as to transmit new information and research conclusions rapidly around the world. Additionally, in its deliberations, the Board considered Fidelity's trading, risk management, compliance, and technology and operations capabilities and resources, which are integral parts of the investment management process.
Shareholder and Administrative Services . The Board considered (i) the nature, extent, quality, and cost of advisory, administrative, and shareholder services performed by the Investment Advisers and their affiliates under the Advisory Contracts and under separate agreements covering transfer agency, pricing and bookkeeping, and securities lending services for each fund; (ii) the nature and extent of the supervision of third party service providers, principally custodians, subcustodians, and pricing vendors; and (iii) the resources devoted to, and the record of compliance with, each fund's compliance policies and procedures. The Board also reviewed the allocation of fund brokerage, including allocations to brokers affiliated with the Investment Advisers, the use of brokerage commissions to pay fund expenses, and the use of "soft" commission dollars to pay for research services.
The Board noted that the growth of fund assets over time across the complex allows Fidelity to reinvest in the development of services designed to enhance the value and convenience of the Fidelity funds as investment vehicles. These services include 24-hour access to account information and market information over the Internet and through telephone representatives, investor education materials, and asset allocation tools. The Board also considered that it reviews customer service metrics such as telephone response times, continuity of services on the website and metrics addressing services at Fidelity Investor Centers.
Investment in a Large Fund Family . The Board considered the benefits to shareholders of investing in a Fidelity fund, including the benefits of investing in a fund that is part of a large family of funds offering a variety of investment disciplines and providing a large variety of mutual fund investor services. The Board noted that Fidelity had taken, or had made recommendations that resulted in the Fidelity funds taking, a number of actions over the previous year that benefited particular funds, including: (i) continuing to dedicate additional resources to Fidelity's investment research process, which includes meetings with management of issuers of securities in which the funds invest; (ii) continuing efforts to enhance Fidelity's global research capabilities; (iii) launching new funds and ETFs with innovative structures, strategies and pricing and making other enhancements to meet client needs; (iv) launching new share classes of existing funds; (v) eliminating purchase minimums and broadening eligibility requirements for certain funds and share classes; (vi) reducing management fees and total expenses for certain target date funds and classes and index funds; (vii) lowering expenses for certain existing funds and classes by implementing or lowering expense caps; (viii) rationalizing product lines and gaining increased efficiencies from fund mergers and liquidations; (ix) continuing to develop, acquire and implement systems and technology to improve services to the funds and shareholders, strengthen information security, and increase efficiency; and (x) continuing to implement enhancements to further strengthen Fidelity's product line to increase investors' probability of success in achieving their investment goals, including retirement income goals.
Investment Performance . The Board considered whether each fund has operated in accordance with its investment objective, as well as its record of compliance with its investment restrictions and its performance history. The Board noted that: (i) IT Services Portfolio had a portfolio manager change in April 2019, October 2019, and January 2021; (ii) Semiconductors Portfolio had a portfolio manager change in July 2020; (iii) Tech Hardware had a portfolio manager change in January 2022; and (iv) Technology Portfolio had a portfolio manager change in July 2020, January 2021, and January 2022. The Board will continue to monitor closely each fund's performance, taking into account the portfolio manager changes.
The Board took into account discussions that occur at Board meetings throughout the year with representatives of the Investment Advisers about fund investment performance. In this regard the Board noted that as part of regularly scheduled fund reviews and other reports to the Board on fund performance, the Board considers annualized return information for each fund for different time periods, measured against an appropriate securities market index (benchmark index). The Board also reviews and considers information about performance attribution. In its evaluation of fund investment performance, the Board gave particular attention to information indicating changes in performance of certain Fidelity funds for specific time periods and discussed with the Investment Advisers the reasons for any overperformance or underperformance.
In addition to reviewing absolute and relative fund performance, the Independent Trustees periodically consider the appropriateness of fund performance metrics in evaluating the results achieved. In general, the Independent Trustees believe that fund performance should be evaluated based on net performance (after fees and expenses) of the fund compared to appropriate benchmark indices, over appropriate time periods that may include full market cycles, taking into account relevant factors including the following: general market conditions; issuer-specific information; and fund cash flows and other factors.
The Independent Trustees recognize that shareholders evaluate performance on a net basis over their own holding periods, for which one-, three-, and five-year periods are often used as a proxy. For this reason, the performance information reviewed by the Board also included net cumulative total return information for each fund and an appropriate benchmark index for the most recent one-, three-, and five-year periods ended September 30, 2021, as shown below.
IT Services Portfolio
Semiconductors Portfolio
Software and IT Services Portfolio
Tech Hardware Portfolio
Technology Portfolio
Based on its review, the Board concluded that the nature, extent, and quality of services provided to each fund under the Advisory Contracts should continue to benefit the shareholders of each fund.
Competitiveness of Management Fee and Total Expense Ratio. The Board considered each fund's management fee and total expense ratio compared to "mapped groups" of competitive funds and classes created for the purpose of facilitating the Trustees' competitive analysis of management fees and total expenses. Fidelity creates "mapped groups" by combining similar Lipper investment objective categories that have comparable investment mandates. For this purpose, all sector focused equity funds are grouped in the same mapped group. Combining Lipper investment objective categories aids the Board's management fee and total expense ratio comparisons by broadening the competitive group used for comparison.
Management Fee . The Board considered two proprietary management fee comparisons for the 12-month periods ended September 30 (June 30 for periods ended 2019 and 2018 and December 31 for periods prior to 2018) shown in basis points (BP) in the charts below. The group of Lipper funds used by the Board for management fee comparisons is referred to below as the "Total Mapped Group." The Total Mapped Group comparison focuses on a fund's standing in terms of gross management fees before expense reimbursements or caps relative to the total universe of funds with comparable investment mandates (i.e., sector equities), regardless of whether their management fee structures also are comparable. Funds with comparable management fee structures have similar management fee contractual arrangements (e.g., flat rate charged for advisory services, all-inclusive fee rate, etc.). "TMG %" represents the percentage of funds in the Total Mapped Group that had management fees that were lower than a fund's. For example, a hypothetical TMG % of 20% would mean that 80% of the funds in the Total Mapped Group had higher, and 20% had lower, management fees than a fund. The funds' actual TMG %s and the number of funds in the Total Mapped Group are in the charts below. The "Asset-Sized Peer Group" (ASPG) comparison focuses on a fund's standing relative to a subset of non-Fidelity funds within the Total Mapped Group that are similar in size and management fee structure. For example, if a fund is in the first quartile of the ASPG, the fund's management fee ranks in the least expensive or lowest 25% of funds in the ASPG. The ASPG represents at least 15% of the funds in the Total Mapped Group with comparable asset size and management fee structures, subject to a minimum of 50 funds (or all funds in the Total Mapped Group if fewer than 50). Additional information, such as the ASPG quartile in which a fund's management fee rate ranked, is also included in the charts and was considered by the Board.
IT Services Portfolio
Semiconductors Portfolio
Software and IT Services Portfolio
Tech Hardware Portfolio
Technology Portfolio
The Board noted that each fund's management fee rate ranked below the median of its Total Mapped Group and below the median of its ASPG for the 12-month period ended September 30, 2021.
The Board also considered that, for funds subject to the group fee, FMR agreed to voluntarily waive fees over a specified period of time in amounts designed to account for assets converted from certain funds to certain collective investment trusts.
Based on its review, the Board concluded that each fund's management fee is fair and reasonable in light of the services that the fund receives and the other factors considered.
Total Expense Ratio . In its review of each fund's total expense ratio, the Board considered the fund's management fee rate as well as other fund expenses, such as transfer agent fees, pricing and bookkeeping fees, and custodial, legal, and audit fees. The Board also noted that Fidelity may agree to waive fees or reimburse expenses from time to time, and the extent to which, if any, it has done so for each fund. Each fund is compared to those funds and classes in the Total Mapped Group (used by the Board for management fee comparisons) that have a similar sales load structure. The Board also considered a total expense ASPG comparison for each fund, which focuses on the total expenses of each fund relative to a subset of non-Fidelity funds within the total expense similar sales load structure group. The total expense ASPG is limited to 15 larger and 15 smaller classes in fund average assets for a total of 30 classes, where possible. The total expense ASPG comparison excludes performance adjustments and fund-paid 12b-1 fees to eliminate variability in fee structures.
The Board noted that each fund's total net expense ratio ranked below the similar sales load structure group competitive median and below the ASPG competitive median for the 12-month period ended September 30, 2021.
Fees Charged to Other Fidelity Clients . The Board also considered Fidelity fee structures and other information with respect to clients of Fidelity, such as other funds advised or subadvised by Fidelity, pension plan clients, and other institutional clients with similar mandates. The Board noted that a joint ad hoc committee created by it and the boards of other Fidelity funds periodically reviews and compares Fidelity's institutional investment advisory business with its business of providing services to the Fidelity funds and also noted the most recent findings of the committee. The Board noted that the committee's review included a consideration of the differences in services provided, fees charged, and costs incurred, as well as competition in the markets serving the different categories of clients.
Based on its review of total expense ratios and fees charged to other Fidelity clients, the Board concluded that each fund's total expense ratio was reasonable in light of the services that the fund and its shareholders receive and the other factors considered.
Costs of the Services and Profitability. The Board considered the revenues earned and the expenses incurred by Fidelity in conducting the business of developing, marketing, distributing, managing, administering and servicing each fund and servicing each fund's shareholders. The Board also considered the level of Fidelity's profits in respect of all the Fidelity funds.
On an annual basis, Fidelity presents to the Board information about the profitability of its relationships with each fund. Fidelity calculates profitability information for each fund, as well as aggregate profitability information for groups of Fidelity funds and all Fidelity funds, using a series of detailed revenue and cost allocation methodologies which originate with the books and records of Fidelity on which Fidelity's audited financial statements are based. The Audit Committee of the Board reviews any significant changes from the prior year's methodologies and the full Board approves such changes.
A public accounting firm has been engaged annually by the Board as part of the Board's assessment of Fidelity's profitability analysis. The engagement includes the review and assessment of the methodologies used by Fidelity in determining the revenues and expenses attributable to Fidelity's mutual fund business, and completion of agreed-upon procedures in respect of the mathematical accuracy of certain fund profitability information and its conformity to established allocation methodologies. After considering the reports issued under the engagement and information provided by Fidelity, the Board concluded that while other allocation methods may also be reasonable, Fidelity's profitability methodologies are reasonable in all material respects.
The Board also reviewed Fidelity's non-fund businesses and potential indirect benefits such businesses may have received as a result of their association with Fidelity's mutual fund business (i.e., fall-out benefits) as well as cases where Fidelity's affiliates may benefit from the funds' business. The Board considered areas where potential indirect benefits to the Fidelity funds from their relationships with Fidelity may exist. The Board's consideration of these matters was informed by the findings of a joint ad hoc committee created by it and the boards of other Fidelity funds to evaluate potential fall-out benefits.
The Board considered the costs of the services provided by and the profits realized by Fidelity in connection with the operation of each fund and was satisfied that the profitability was not excessive.
Economies of Scale. The Board considered whether there have been economies of scale in respect of the management of the Fidelity funds, whether the Fidelity funds (including each fund) have appropriately benefited from any such economies of scale, and whether there is potential for realization of any further economies of scale. The Board considered the extent to which each fund will benefit from economies of scale as assets grow through increased services to the fund, through waivers or reimbursements, or through fee or expense ratio reductions. The Board also noted that a committee (the Economies of Scale Committee) created by it and the boards of other Fidelity funds periodically analyzes whether Fidelity attains economies of scale in respect of the management and servicing of the Fidelity funds, whether the Fidelity funds have appropriately benefited from such economies of scale, and whether there is potential for realization of any further economies of scale.
The Board recognized that each fund's management contract incorporates a "group fee" structure, which provides for lower group fee rates as total "group assets" increase, and for higher group fee rates as total "group assets" decrease ("group assets" as defined in the management contracts). FMR calculates the group fee rates based on a tiered asset "breakpoint" schedule that varies based on asset class. The Board considered that the group fee is designed to deliver the benefits of economies of scale to fund shareholders when total Fidelity fund assets increase, even if assets of any particular fund are unchanged or have declined, because some portion of Fidelity's costs are attributable to services provided to all Fidelity funds, and all funds benefit if those costs can be allocated among more assets. The Board further considered that Fidelity agreed to impose a temporary fee waiver in the form of additional breakpoints to the current breakpoint schedule. The Board concluded that, given the group fee structure, fund shareholders will benefit from lower management fees as "group assets" increase at the fund complex level, regardless of whether Fidelity achieves any such economies of scale.
The Board concluded, taking into account the analysis of the Economies of Scale Committee, that economies of scale, if any, are being appropriately shared between fund shareholders and Fidelity.
Additional Information Requested by the Board. In order to develop fully the factual basis for consideration of the Fidelity funds' advisory contracts, the Board requested and received additional information on certain topics, including: (i) fund flow and performance trends, in particular the underperformance of certain funds and strategies, and Fidelity's long-term strategies for certain funds, including any consideration of fund liquidations or mergers; (ii) the operation of performance fees, competitor use of performance fees, and consideration of the expansion of performance fees to additional funds; (iii) Fidelity's pricing philosophy compared to competitors; (iv) fund profitability methodology and data; (v) evaluation of competitive fund data and peer group classifications and fee and expense comparisons; (vi) the management fee and expense structures for different funds and classes and information about the differences between various fee and expense structures; (vii) group fee breakpoints and related voluntary fee waivers; and (viii) information regarding other accounts managed by Fidelity and the funds' sub-advisory arrangements.
Based on its evaluation of all of the conclusions noted above, and after considering all factors it believed relevant, the Board concluded that the advisory fee arrangements are fair and reasonable and that each fund's Advisory Contracts should be renewed.
1.813673.117
SELTEC-SANN-1022
Fidelity® Select Portfolios®
Industrials Sector
Defense and Aerospace Portfolio
Industrials Portfolio
Transportation Portfolio
Semi-Annual Report
August 31, 2022
Contents
To view a fund's proxy voting guidelines and proxy voting record for the 12-month period ended June 30, visit http://www.fidelity.com/proxyvotingresults or visit the Securities and Exchange Commission's (SEC) web site at http://www.sec.gov.
You may also call 1-800-544-8544 to request a free copy of the proxy voting guidelines.
Standard & Poor's, S&P and S&P 500 are registered service marks of The McGraw-Hill Companies, Inc. and have been licensed for use by Fidelity Distributors Corporation.
Other third-party marks appearing herein are the property of their respective owners.
All other marks appearing herein are registered or unregistered trademarks or service marks of FMR LLC or an affiliated company. © 2022 FMR LLC. All rights reserved.
This report and the financial statements contained herein are submitted for the general information of the shareholders of the Fund. This report is not authorized for distribution to prospective investors in the Fund unless preceded or accompanied by an effective prospectus.
A fund files its complete schedule of portfolio holdings with the SEC for the first and third quarters of each fiscal year on Form N-PORT. Forms N-PORT are available on the SEC's web site at http://www.sec.gov. A fund's Forms N-PORT may be reviewed and copied at the SEC's Public Reference Room in Washington, DC. Information regarding the operation of the SEC's Public Reference Room may be obtained by calling 1-800-SEC-0330.
For a complete list of a fund's portfolio holdings, view the most recent holdings listing, semiannual report, or annual report on Fidelity's web site at http://www.fidelity.com, http://www.institutional.fidelity.com, or http://www.401k.com, as applicable.
NOT FDIC INSURED •MAY LOSE VALUE •NO BANK GUARANTEE
Neither the Fund nor Fidelity Distributors Corporation is a bank.
Top Holdings (% of Fund's net assets) |
| |
| Lockheed Martin Corp. | 15.8 | |
| The Boeing Co. | 15.3 | |
| Raytheon Technologies Corp. | 13.3 | |
| TransDigm Group, Inc. | 5.1 | |
| Northrop Grumman Corp. | 4.9 | |
| Howmet Aerospace, Inc. | 4.8 | |
| HEICO Corp. Class A | 4.6 | |
| L3Harris Technologies, Inc. | 3.9 | |
| General Dynamics Corp. | 3.1 | |
| Huntington Ingalls Industries, Inc. | 2.8 | |
| | 73.6 | |
| |
| Industries (% of Fund's net assets) |
| |
| Aerospace & Defense | 91.8 | |
| Professional Services | 4.3 | |
| Electronic Equipment & Components | 2.3 | |
| |
Defense and Aerospace Portfolio
| Common Stocks - 98.4% |
| | | Shares | Value ($) |
| Aerospace & Defense - 91.8% | | | |
| Aerospace & Defense - 91.8% | | | |
| AerSale Corp. (a)(b) | | 418,900 | 8,076,392 |
| Airbus Group NV | | 265,300 | 25,997,582 |
| Axon Enterprise, Inc. (a) | | 64,600 | 7,537,528 |
| BWX Technologies, Inc. | | 547,700 | 28,551,601 |
| Curtiss-Wright Corp. | | 104,800 | 15,425,512 |
| Elbit Systems Ltd. (b) | | 85,700 | 18,037,279 |
| General Dynamics Corp. | | 183,700 | 42,054,441 |
| HEICO Corp. Class A | | 519,600 | 63,692,568 |
| Howmet Aerospace, Inc. | | 1,850,200 | 65,552,586 |
| Huntington Ingalls Industries, Inc. | | 164,000 | 37,762,640 |
| Kratos Defense & Security Solutions, Inc. (a) | | 953,100 | 11,951,874 |
| L3Harris Technologies, Inc. | | 235,500 | 53,738,745 |
| Lockheed Martin Corp. | | 517,200 | 217,280,892 |
| Maxar Technologies, Inc. (b) | | 690,300 | 16,449,849 |
| Mercury Systems, Inc. (a) | | 413,300 | 19,892,129 |
| Northrop Grumman Corp. | | 140,400 | 67,109,796 |
| Raytheon Technologies Corp. | | 2,033,000 | 182,461,750 |
| Spirit AeroSystems Holdings, Inc. Class A | | 680,000 | 20,468,000 |
| Textron, Inc. | | 566,000 | 35,307,080 |
| The Boeing Co. (a) | | 1,309,200 | 209,799,300 |
| TransDigm Group, Inc. | | 117,600 | 70,605,864 |
| Triumph Group, Inc. (a) | | 1,433,300 | 18,618,567 |
| Woodward, Inc. | | 257,000 | 23,918,990 |
| | | | 1,260,290,965 |
| Electronic Equipment & Components - 2.3% | | | |
| Electronic Equipment & Instruments - 2.3% | | | |
| Teledyne Technologies, Inc. (a) | | 86,700 | 31,936,812 |
| Professional Services - 4.3% | | | |
| Research & Consulting Services - 4.3% | | | |
| Booz Allen Hamilton Holding Corp. Class A | | 326,200 | 31,217,340 |
| CACI International, Inc. Class A (a) | | 100,500 | 28,227,435 |
| | | | 59,444,775 |
| TOTAL COMMON STOCKS (Cost $1,038,410,828) | | | 1,351,672,552 |
| | | | |
| Money Market Funds - 1.9% |
| | | Shares | Value ($) |
| Fidelity Cash Central Fund 2.33% (c) | | 17,819,413 | 17,822,977 |
| Fidelity Securities Lending Cash Central Fund 2.34% (c)(d) | | 8,604,398 | 8,605,258 |
| TOTAL MONEY MARKET FUNDS (Cost $26,428,235) | | | 26,428,235 |
| | | | |
| TOTAL INVESTMENT IN SECURITIES - 100.3% (Cost $1,064,839,063) | 1,378,100,787 |
NET OTHER ASSETS (LIABILITIES) - (0.3)% | (4,575,887) |
| NET ASSETS - 100.0% | 1,373,524,900 |
| | |
Legend
| (b) | Security or a portion of the security is on loan at period end. |
| (c) | Affiliated fund that is generally available only to investment companies and other accounts managed by Fidelity Investments. The rate quoted is the annualized seven-day yield of the fund at period end. A complete unaudited listing of the fund's holdings as of its most recent quarter end is available upon request. In addition, each Fidelity Central Fund's financial statements are available on the SEC's website or upon request. |
| (d) | Investment made with cash collateral received from securities on loan. |
Affiliated Central Funds
Fiscal year to date information regarding the Fund's investments in Fidelity Central Funds, including the ownership percentage, is presented below.
| Affiliate | Value, beginning of period ($) | Purchases ($) | Sales Proceeds ($) | Dividend Income ($) | Realized Gain (loss) ($) | Change in Unrealized appreciation (depreciation) ($) | Value, end of period ($) | %ownership, end of period |
| Fidelity Cash Central Fund 2.33% | 10,252,211 | 174,809,822 | 167,239,056 | 73,097 | - | - | 17,822,977 | 0.0% |
| Fidelity Securities Lending Cash Central Fund 2.34% | 19,275,358 | 98,948,236 | 109,618,336 | 9,175 | - | - | 8,605,258 | 0.0% |
| Total | 29,527,569 | 273,758,058 | 276,857,392 | 82,272 | - | - | 26,428,235 | |
| | | | | | | | | |
Amounts in the income column in the above table include any capital gain distributions from underlying funds, which are presented in the corresponding line item in the Statement of Operations, if applicable.
Amount for Fidelity Securities Lending Cash Central Fund represents the income earned on investing cash collateral, less rebates paid to borrowers and any lending agent fees associated with the loan, plus any premium payments received for lending certain types of securities.
Investment Valuation
The following is a summary of the inputs used, as of August 31, 2022, involving the Fund's assets and liabilities carried at fair value. The inputs or methodology used for valuing securities may not be an indication of the risk associated with investing in those securities. For more information on valuation inputs, and their aggregation into the levels used below, please refer to the Investment Valuation section in the accompanying Notes to Financial Statements.
| Valuation Inputs at Reporting Date: |
| Description | Total ($) | Level 1 ($) | Level 2 ($) | Level 3 ($) |
Investments in Securities: | | | | |
|
| Common Stocks | 1,351,672,552 | 1,325,674,970 | 25,997,582 | - |
|
| Money Market Funds | 26,428,235 | 26,428,235 | - | - |
| Total Investments in Securities: | 1,378,100,787 | 1,352,103,205 | 25,997,582 | - |
Defense and Aerospace Portfolio
| Statement of Assets and Liabilities |
| | | | August 31, 2022 (Unaudited) |
| | | | | |
| Assets | | | | |
| Investment in securities, at value (including securities loaned of $8,417,807) - See accompanying schedule: | | $1,351,672,552 | | |
Unaffiliated issuers (cost $1,038,410,828) | | | |
Fidelity Central Funds (cost $26,428,235) | | 26,428,235 | | |
| | | | | |
| Total Investment in Securities (cost $1,064,839,063) | | | $ | 1,378,100,787 |
| Receivable for investments sold | | | | 2,061,071 |
| Receivable for fund shares sold | | | | 266,724 |
| Dividends receivable | | | | 3,115,871 |
| Distributions receivable from Fidelity Central Funds | | | | 33,502 |
| Prepaid expenses | | | | 12,121 |
| Other receivables | | | | 111,788 |
Total assets | | | | 1,383,701,864 |
| Liabilities | | | | |
| Payable for fund shares redeemed | | $562,250 | | |
| Accrued management fee | | 630,019 | | |
| Other affiliated payables | | 247,418 | | |
| Other payables and accrued expenses | | 131,877 | | |
| Collateral on securities loaned | | 8,605,400 | | |
| Total Liabilities | | | | 10,176,964 |
| Net Assets | | | $ | 1,373,524,900 |
| Net Assets consist of: | | | | |
| Paid in capital | | | $ | 1,056,454,586 |
| Total accumulated earnings (loss) | | | | 317,070,314 |
| Net Assets | | | $ | 1,373,524,900 |
Net Asset Value , offering price and redemption price per share ($1,373,524,900 ÷ 97,766,475 shares) | | | $ | 14.05 |
| | | | | |
| Statement of Operations |
| | | | Six months ended August 31, 2022 (Unaudited) |
| Investment Income | | | �� | |
| Dividends | | | $ | 10,669,632 |
| Income from Fidelity Central Funds (including $9,175 from security lending) | | | | 82,272 |
| Total Income | | | | 10,751,904 |
| Expenses | | | | |
| Management fee | $ | 3,820,554 | | |
| Transfer agent fees | | 1,329,579 | | |
| Accounting fees | | 215,899 | | |
| Custodian fees and expenses | | 6,612 | | |
| Independent trustees' fees and expenses | | 2,320 | | |
| Registration fees | | 43,591 | | |
| Audit | | 17,704 | | |
| Legal | | 404 | | |
| Miscellaneous | | 5,852 | | |
| Total expenses before reductions | | 5,442,515 | | |
| Expense reductions | | (23,568) | | |
| Total expenses after reductions | | | | 5,418,947 |
| Net Investment income (loss) | | | | 5,332,957 |
| Realized and Unrealized Gain (Loss) | | | | |
| Net realized gain (loss) on: | | | | |
| Investment Securities: | | | | |
| Unaffiliated issuers | | 1,569,835 | | |
| Foreign currency transactions | | 19,410 | | |
| Total net realized gain (loss) | | | | 1,589,245 |
| Change in net unrealized appreciation (depreciation) on investment securities | | | | (179,052,674) |
| Net gain (loss) | | | | (177,463,429) |
| Net increase (decrease) in net assets resulting from operations | | | $ | (172,130,472) |
| Statement of Changes in Net Assets |
| |
| | Six months ended August 31, 2022 (Unaudited) | | Year ended February 28, 2022 |
| Increase (Decrease) in Net Assets | | | | |
| Operations | | | | |
| Net investment income (loss) | $ | 5,332,957 | $ | 932,889 |
| Net realized gain (loss) | | 1,589,245 | | 353,125,938 |
| Change in net unrealized appreciation (depreciation) | | (179,052,674) | | (141,504,262) |
| Net increase (decrease) in net assets resulting from operations | | (172,130,472) | | 212,554,565 |
| Distributions to shareholders | | (125,091,433) | | (114,456,735) |
| Share transactions | | | | |
| Proceeds from sales of shares | | 187,330,963 | | 116,915,674 |
| Reinvestment of distributions | | 118,053,929 | | 107,992,135 |
| Cost of shares redeemed | | (171,169,216) | | (424,668,107) |
Net increase (decrease) in net assets resulting from share transactions | | 134,215,676 | | (199,760,298) |
| Total increase (decrease) in net assets | | (163,006,229) | | (101,662,468) |
| | | | | |
| Net Assets | | | | |
| Beginning of period | | 1,536,531,129 | | 1,638,193,597 |
| End of period | $ | 1,373,524,900 | $ | 1,536,531,129 |
| | | | | |
| Other Information | | | | |
| Shares | | | | |
| Sold | | 11,783,205 | | 6,800,815 |
| Issued in reinvestment of distributions | | 7,675,809 | | 7,086,098 |
| Redeemed | | (11,667,690) | | (24,520,122) |
| Net increase (decrease) | | 7,791,324 | | (10,633,209) |
| | | | | |
| Defense and Aerospace Portfolio |
| |
| | Six months ended (Unaudited) August 31, 2022 | | Years ended February 28, 2022 | | 2021 | | 2020 A | | 2019 B | | 2018 B |
Selected Per-Share Data | | | | | | | | | | | | |
| Net asset value, beginning of period | $ | 17.08 | $ | 16.28 | $ | 16.61 | $ | 17.27 | $ | 18.45 | $ | 13.83 |
| Income from Investment Operations | | | | | | | | | | | | |
Net investment income (loss) C,D | | .05 | | .01 | | (.04) | | .27 E | | .11 | | .09 F |
| Net realized and unrealized gain (loss) | | (1.77) | | 2.12 | | .06 G | | (.45) | | .33 | | 5.14 |
| Total from investment operations | | (1.72) | | 2.13 | | .02 | | (.18) | | .44 | | 5.23 |
| Distributions from net investment income | | - | | - | | (.05) | | (.22) | | (.10) | | (.07) |
| Distributions from net realized gain | | (1.31) | | (1.33) | | (.30) | | (.26) | | (1.52) | | (.54) |
| Total distributions | | (1.31) | | (1.33) | | (.35) | | (.48) | | (1.62) | | (.61) |
| Net asset value, end of period | $ | 14.05 | $ | 17.08 | $ | 16.28 | $ | 16.61 | $ | 17.27 | $ | 18.45 |
Total Return H,I | | (10.71)% | | 14.06% | | .69% | | (1.32)% | | 3.57% | | 38.46% |
Ratios to Average Net Assets D,J,K | | | | | | | | | | | | |
| Expenses before reductions | | .75% L | | .74% | | .77% | | .75% | | .75% | | .76% |
| Expenses net of fee waivers, if any | | .75% L | | .74% | | .77% | | .74% | | .75% | | .76% |
| Expenses net of all reductions | | .75% L | | .74% | | .76% | | .74% | | .75% | | .76% |
| Net investment income (loss) | | .74% L | | .06% | | (.29)% | | 1.49% E | | .66% | | .58% F |
| Supplemental Data | | | | | | | | | | | | |
| Net assets, end of period (000 omitted) | $ | 1,373,525 | $ | 1,536,531 | $ | 1,638,194 | $ | 2,728,959 | $ | 2,795,259 | $ | 3,073,789 |
Portfolio turnover rate M | | 14% L | | 52% | | 30% | | 40% | | 44% | | 32% |
A For the year ended February 29.
B Per share amounts have been adjusted to reflect the impact of the 10 for 1 share split that soccurred on August 10, 2018.
C Calculated based on average shares outstanding during the period.
D Net investment income (loss) is affected by the timing of the declaration of dividends by any underlying mutual funds or exchange-traded funds (ETFs). Net investment income (loss) of any such underlying funds is not included in the Fund's net investment income (loss) ratio.
E Net investment income per share reflects one or more large, non-recurring dividend(s) which amounted to $.18 per share. Excluding such non-recurring dividend(s), the ratio of net investment income (loss) to average net assets would have been .48%.
F Net investment income per share reflects one or more large, non-recurring dividend(s) which amounted to $.07 per share. Excluding such non-recurring dividend(s), the ratio of net investment income (loss) to average net assets would have been .14%.
G The amount shown for a share outstanding does not correspond with the aggregate net gain (loss) on investments for the period due to the timing of sales and repurchases of shares in relation to fluctuating market values of the investments of the Fund.
H Total returns for periods of less than one year are not annualized.
I Total returns would have been lower if certain expenses had not been reduced during the applicable periods shown.
J Fees and expenses of any underlying mutual funds or exchange-traded funds (ETFs) are not included in the Fund's expense ratio. The Fund indirectly bears its proportionate share of these expenses. For additional expense information related to investments in Fidelity Central Funds, please refer to the "Investments in Fidelity Central Funds" note found in the Notes to Financial Statements section of the most recent Annual or Semi-Annual report.
K Expense ratios reflect operating expenses of the class. Expenses before reductions do not reflect amounts reimbursed, waived, or reduced through arrangements with the investment adviser, brokerage services, or other offset arrangements, if applicable, and do not represent the amount paid by the class during periods when reimbursements, waivers or reductions occur.
L Annualized
M Amount does not include the portfolio activity of any underlying mutual funds or exchange-traded funds (ETFs).
Top Holdings (% of Fund's net assets) |
| |
| Roper Technologies, Inc. | 12.0 | |
| Willscot Mobile Mini Holdings | 6.9 | |
| FTI Consulting, Inc. | 5.8 | |
| Fortive Corp. | 5.8 | |
| AMETEK, Inc. | 5.5 | |
| Teledyne Technologies, Inc. | 5.2 | |
| Crane Holdings Co. | 4.8 | |
| Howmet Aerospace, Inc. | 4.8 | |
| TransDigm Group, Inc. | 4.4 | |
| Raytheon Technologies Corp. | 4.4 | |
| | 59.6 | |
| |
| Industries (% of Fund's net assets) |
| |
| Aerospace & Defense | 28.7 | |
| Machinery | 19.0 | |
| Software | 12.0 | |
| Construction & Engineering | 10.5 | |
| Electrical Equipment | 6.0 | |
| Professional Services | 5.8 | |
| Road & Rail | 5.3 | |
| Electronic Equipment & Components | 5.2 | |
| Industrial Conglomerates | 4.3 | |
| Commercial Services & Supplies | 2.9 | |
| Building Products | 0.1 | |
| |
Industrials Portfolio
| Common Stocks - 99.8% |
| | | Shares | Value ($) |
| Aerospace & Defense - 28.7% | | | |
| Aerospace & Defense - 28.7% | | | |
| General Dynamics Corp. | | 10,900 | 2,495,337 |
| HEICO Corp. (a) | | 44,900 | 6,838,270 |
| HEICO Corp. Class A | | 69,300 | 8,494,794 |
| Hexcel Corp. | | 19,100 | 1,120,597 |
| Howmet Aerospace, Inc. | | 403,400 | 14,292,462 |
| Lockheed Martin Corp. | | 20,800 | 8,738,288 |
| Raytheon Technologies Corp. | | 148,500 | 13,327,875 |
| Spirit AeroSystems Holdings, Inc. Class A | | 93,100 | 2,802,310 |
| The Boeing Co. (b) | | 74,860 | 11,996,315 |
| TransDigm Group, Inc. | | 22,237 | 13,350,872 |
| Triumph Group, Inc. (b) | | 218,522 | 2,838,601 |
| | | | 86,295,721 |
| Building Products - 0.1% | | | |
| Building Products - 0.1% | | | |
| Builders FirstSource, Inc. (b) | | 7,470 | 437,817 |
| Commercial Services & Supplies - 2.9% | | | |
| Diversified Support Services - 0.1% | | | |
| Copart, Inc. (b) | | 3,600 | 430,740 |
| Environmental & Facility Services - 2.8% | | | |
| Tetra Tech, Inc. | | 500 | 67,905 |
| Waste Connections, Inc. (United States) | | 59,200 | 8,239,456 |
| | | | 8,307,361 |
TOTAL COMMERCIAL SERVICES & SUPPLIES | | | 8,738,101 |
| Construction & Engineering - 10.5% | | | |
| Construction & Engineering - 10.5% | | | |
| AECOM | | 7,700 | 563,255 |
| Quanta Services, Inc. | | 71,700 | 10,131,210 |
| Willscot Mobile Mini Holdings (b) | | 521,900 | 20,949,066 |
| | | | 31,643,531 |
| Electrical Equipment - 6.0% | | | |
| Electrical Components & Equipment - 6.0% | | | |
| Acuity Brands, Inc. | | 3,016 | 494,413 |
| AMETEK, Inc. | | 137,020 | 16,464,323 |
| nVent Electric PLC | | 34,652 | 1,142,130 |
| | | | 18,100,866 |
| Electronic Equipment & Components - 5.2% | | | |
| Electronic Equipment & Instruments - 5.2% | | | |
| Teledyne Technologies, Inc. (b) | | 42,300 | 15,581,628 |
| Industrial Conglomerates - 4.3% | | | |
| Industrial Conglomerates - 4.3% | | | |
| Honeywell International, Inc. | | 68,998 | 13,064,771 |
| Machinery - 19.0% | | | |
| Industrial Machinery - 19.0% | | | |
| Chart Industries, Inc. (a)(b) | | 58,200 | 11,282,652 |
| Crane Holdings Co. | | 151,700 | 14,314,412 |
| Flowserve Corp. | | 296,073 | 9,021,344 |
| Fortive Corp. | | 274,000 | 17,352,420 |
| Ingersoll Rand, Inc. | | 106,300 | 5,035,431 |
| | | | 57,006,259 |
| Professional Services - 5.8% | | | |
| Research & Consulting Services - 5.8% | | | |
| Clarivate Analytics PLC (b) | | 13,600 | 158,712 |
| FTI Consulting, Inc. (b) | | 108,300 | 17,392,980 |
| | | | 17,551,692 |
| Road & Rail - 5.3% | | | |
| Railroads - 4.6% | | | |
| CSX Corp. | | 217,700 | 6,890,205 |
| Norfolk Southern Corp. | | 11,709 | 2,846,809 |
| Union Pacific Corp. | | 17,421 | 3,911,189 |
| | | | 13,648,203 |
| Trucking - 0.7% | | | |
| J.B. Hunt Transport Services, Inc. | | 11,752 | 2,045,083 |
| Old Dominion Freight Lines, Inc. | | 323 | 87,665 |
| | | | 2,132,748 |
TOTAL ROAD & RAIL | | | 15,780,951 |
| Software - 12.0% | | | |
| Application Software - 12.0% | | | |
| Roper Technologies, Inc. | | 89,604 | 36,072,779 |
| TOTAL COMMON STOCKS (Cost $276,339,647) | | | 300,274,116 |
| | | | |
| Money Market Funds - 5.3% |
| | | Shares | Value ($) |
| Fidelity Cash Central Fund 2.33% (c) | | 495,176 | 495,275 |
| Fidelity Securities Lending Cash Central Fund 2.34% (c)(d) | | 15,377,662 | 15,379,200 |
| TOTAL MONEY MARKET FUNDS (Cost $15,874,475) | | | 15,874,475 |
| | | | |
| TOTAL INVESTMENT IN SECURITIES - 105.1% (Cost $292,214,122) | 316,148,591 |
NET OTHER ASSETS (LIABILITIES) - (5.1)% | (15,334,284) |
| NET ASSETS - 100.0% | 300,814,307 |
| | |
Legend
| (a) | Security or a portion of the security is on loan at period end. |
| (c) | Affiliated fund that is generally available only to investment companies and other accounts managed by Fidelity Investments. The rate quoted is the annualized seven-day yield of the fund at period end. A complete unaudited listing of the fund's holdings as of its most recent quarter end is available upon request. In addition, each Fidelity Central Fund's financial statements are available on the SEC's website or upon request. |
| (d) | Investment made with cash collateral received from securities on loan. |
Affiliated Central Funds
Fiscal year to date information regarding the Fund's investments in Fidelity Central Funds, including the ownership percentage, is presented below.
| Affiliate | Value, beginning of period ($) | Purchases ($) | Sales Proceeds ($) | Dividend Income ($) | Realized Gain (loss) ($) | Change in Unrealized appreciation (depreciation) ($) | Value, end of period ($) | %ownership, end of period |
| Fidelity Cash Central Fund 2.33% | 1,945,359 | 32,748,485 | 34,198,569 | 4,613 | - | - | 495,275 | 0.0% |
| Fidelity Securities Lending Cash Central Fund 2.34% | 1,593,775 | 106,588,121 | 92,802,696 | 4,641 | - | - | 15,379,200 | 0.0% |
| Total | 3,539,134 | 139,336,606 | 127,001,265 | 9,254 | - | - | 15,874,475 | |
| | | | | | | | | |
Amounts in the income column in the above table include any capital gain distributions from underlying funds, which are presented in the corresponding line item in the Statement of Operations, if applicable.
Amount for Fidelity Securities Lending Cash Central Fund represents the income earned on investing cash collateral, less rebates paid to borrowers and any lending agent fees associated with the loan, plus any premium payments received for lending certain types of securities.
Investment Valuation
The following is a summary of the inputs used, as of August 31, 2022, involving the Fund's assets and liabilities carried at fair value. The inputs or methodology used for valuing securities may not be an indication of the risk associated with investing in those securities. For more information on valuation inputs, and their aggregation into the levels used below, please refer to the Investment Valuation section in the accompanying Notes to Financial Statements.
| Valuation Inputs at Reporting Date: |
| Description | Total ($) | Level 1 ($) | Level 2 ($) | Level 3 ($) |
Investments in Securities: | | | | |
|
| Common Stocks | 300,274,116 | 300,274,116 | - | - |
|
| Money Market Funds | 15,874,475 | 15,874,475 | - | - |
| Total Investments in Securities: | 316,148,591 | 316,148,591 | - | - |
Industrials Portfolio
| Statement of Assets and Liabilities |
| | | | August 31, 2022 (Unaudited) |
| | | | | |
| Assets | | | | |
| Investment in securities, at value (including securities loaned of $15,135,608) - See accompanying schedule: | | $300,274,116 | | |
Unaffiliated issuers (cost $276,339,647) | | | |
Fidelity Central Funds (cost $15,874,475) | | 15,874,475 | | |
| | | | | |
| Total Investment in Securities (cost $292,214,122) | | | $ | 316,148,591 |
| Receivable for fund shares sold | | | | 23,507 |
| Dividends receivable | | | | 356,130 |
| Distributions receivable from Fidelity Central Funds | | | | 2,529 |
| Prepaid expenses | | | | 3,881 |
| Other receivables | | | | 108,128 |
Total assets | | | | 316,642,766 |
| Liabilities | | | | |
| Payable for fund shares redeemed | | 133,894 | | |
| Accrued management fee | | 139,153 | | |
| Other affiliated payables | | 53,005 | | |
| Other payables and accrued expenses | | 123,207 | | |
| Collateral on securities loaned | | 15,379,200 | | |
| Total Liabilities | | | | 15,828,459 |
| Net Assets | | | $ | 300,814,307 |
| Net Assets consist of: | | | | |
| Paid in capital | | | $ | 278,901,958 |
| Total accumulated earnings (loss) | | | | 21,912,349 |
| Net Assets | | | $ | 300,814,307 |
Net Asset Value , offering price and redemption price per share ($300,814,307 ÷ 10,826,887 shares) | | | $ | 27.78 |
| | | | | |
| Statement of Operations |
| | | | Six months ended August 31, 2022 (Unaudited) |
| Investment Income | | | | |
| Dividends | | | $ | 1,171,776 |
| Special dividends | | | | 411,385 |
| Income from Fidelity Central Funds (including $4,641 from security lending) | | | | 9,254 |
| Total Income | | | | 1,592,415 |
| Expenses | | | | |
| Management fee | $ | 841,241 | | |
| Transfer agent fees | | 273,204 | | |
| Accounting fees | | 59,507 | | |
| Custodian fees and expenses | | 3,588 | | |
| Independent trustees' fees and expenses | | 522 | | |
| Registration fees | | 16,106 | | |
| Audit | | 17,360 | | |
| Legal | | 1,825 | | |
| Miscellaneous | | 1,426 | | |
| Total expenses before reductions | | 1,214,779 | | |
| Expense reductions | | (5,335) | | |
| Total expenses after reductions | | | | 1,209,444 |
| Net Investment income (loss) | | | | 382,971 |
| Realized and Unrealized Gain (Loss) | | | | |
| Net realized gain (loss) on: | | | | |
| Investment Securities: | | | | |
| Unaffiliated issuers | | (952,238) | | |
| Foreign currency transactions | | 1,065 | | |
| Total net realized gain (loss) | | | | (951,173) |
| Change in net unrealized appreciation (depreciation) on: | | | | |
| Investment Securities: | | | | |
| Unaffiliated issuers | | (28,425,680) | | |
| Assets and liabilities in foreign currencies | | (10) | | |
| Total change in net unrealized appreciation (depreciation) | | | | (28,425,690) |
| Net gain (loss) | | | | (29,376,863) |
| Net increase (decrease) in net assets resulting from operations | | | $ | (28,993,892) |
| Statement of Changes in Net Assets |
| |
| | Six months ended August 31, 2022 (Unaudited) | | Year ended February 28, 2022 |
| Increase (Decrease) in Net Assets | | | | |
| Operations | | | | |
| Net investment income (loss) | $ | 382,971 | $ | (443,437) |
| Net realized gain (loss) | | (951,173) | | 100,676,384 |
| Change in net unrealized appreciation (depreciation) | | (28,425,690) | | (46,229,650) |
| Net increase (decrease) in net assets resulting from operations | | (28,993,892) | | 54,003,297 |
| Distributions to shareholders | | (12,727,975) | | (115,424,416) |
| Share transactions | | | | |
| Proceeds from sales of shares | | 11,880,614 | | 116,900,003 |
| Reinvestment of distributions | | 12,013,988 | | 108,515,761 |
| Cost of shares redeemed | | (41,123,413) | | (368,438,524) |
Net increase (decrease) in net assets resulting from share transactions | | (17,228,811) | | (143,022,760) |
| Total increase (decrease) in net assets | | (58,950,678) | | (204,443,879) |
| | | | | |
| Net Assets | | | | |
| Beginning of period | | 359,764,985 | | 564,208,864 |
| End of period | $ | 300,814,307 | $ | 359,764,985 |
| | | | | |
| Other Information | | | | |
| Shares | | | | |
| Sold | | 410,650 | | 3,139,766 |
| Issued in reinvestment of distributions | | 402,884 | | 3,143,897 |
| Redeemed | | (1,442,030) | | (10,008,148) |
| Net increase (decrease) | | (628,496) | | (3,724,485) |
| | | | | |
| | Six months ended (Unaudited) August 31, 2022 | | Years ended February 28, 2022 | | 2021 | | 2020 A | | 2019 | | 2018 |
Selected Per-Share Data | | | | | | | | | | | | |
| Net asset value, beginning of period | $ | 31.41 | $ | 37.17 | $ | 31.90 | $ | 33.84 | $ | 36.96 | $ | 33.72 |
| Income from Investment Operations | | | | | | | | | | | | |
Net investment income (loss) B,C | | .03 D | | (.04) | | (.02) | | .28 E | | .32 | | .21 |
| Net realized and unrealized gain (loss) | | (2.53) | | 3.70 | | 6.38 | | (.76) | | (.70) | | 4.95 |
| Total from investment operations | | (2.50) | | 3.66 | | 6.36 | | (.48) | | (.38) | | 5.16 |
| Distributions from net investment income | | - | | - | | (.07) F | | (.24) | | (.25) | | (.22) |
| Distributions from net realized gain | | (1.13) | | (9.42) | | (1.02) F | | (1.23) | | (2.49) | | (1.71) |
| Total distributions | | (1.13) | | (9.42) | | (1.09) | | (1.46) G | | (2.74) | | (1.92) G |
| Net asset value, end of period | $ | 27.78 | $ | 31.41 | $ | 37.17 | $ | 31.90 | $ | 33.84 | $ | 36.96 |
Total Return H,I | | (8.21)% | | 9.33% | | 21.41% | | (1.82)% | | (.45)% | | 15.73% |
Ratios to Average Net Assets C,J,K | | | | | | | | | | | | |
| Expenses before reductions | | .76% L | | .74% | | .76% | | .76% | | .76% | | .77% |
| Expenses net of fee waivers, if any | | .76% L | | .74% | | .76% | | .76% | | .76% | | .77% |
| Expenses net of all reductions | | .76% L | | .74% | | .74% | | .75% | | .75% | | .77% |
| Net investment income (loss) | | .11% D,L | | (.10)% | | (.05)% | | .81% E | | .92% | | .60% |
| Supplemental Data | | | | | | | | | | | | |
| Net assets, end of period (000 omitted) | $ | 300,814 | $ | 359,765 | $ | 564,209 | $ | 529,023 | $ | 632,470 | $ | 1,076,950 |
Portfolio turnover rate M | | 65% L | | 151% | | 272% | | 143% N | | 88% N | | 64% O |
A For the year ended February 29.
B Calculated based on average shares outstanding during the period.
C Net investment income (loss) is affected by the timing of the declaration of dividends by any underlying mutual funds or exchange-traded funds (ETFs). Net investment income (loss) of any such underlying funds is not included in the Fund's net investment income (loss) ratio.
D Net investment income per share reflects one or more large, non-recurring dividend(s) which amounted to $.04 per share. Such dividends are not annualized in the ratio of net investment income (loss) to average net assets. Excluding such non-recurring dividend(s) the ratio of net investment income (loss) to average net assets would have been (.02)%.
E Net investment income per share reflects one or more large, non-recurring dividend(s) which amounted to $.06 per share. Excluding such non-recurring dividend(s), the ratio of net investment income (loss) to average net assets would have been .64%.
F The amount shown reflects reclassifications related to book to tax differences that were made in the year shown.
G Total distributions per share do not sum due to rounding.
H Total returns for periods of less than one year are not annualized.
I Total returns would have been lower if certain expenses had not been reduced during the applicable periods shown.
J Fees and expenses of any underlying mutual funds or exchange-traded funds (ETFs) are not included in the Fund's expense ratio. The Fund indirectly bears its proportionate share of these expenses. For additional expense information related to investments in Fidelity Central Funds, please refer to the "Investments in Fidelity Central Funds" note found in the Notes to Financial Statements section of the most recent Annual or Semi-Annual report.
K Expense ratios reflect operating expenses of the class. Expenses before reductions do not reflect amounts reimbursed, waived, or reduced through arrangements with the investment adviser, brokerage services, or other offset arrangements, if applicable, and do not represent the amount paid by the class during periods when reimbursements, waivers or reductions occur.
L Annualized
M Amount does not include the portfolio activity of any underlying mutual funds or exchange-traded funds (ETFs).
N Portfolio turnover rate excludes securities received or delivered in-kind.
O The portfolio turnover rate does not include the assets acquired in the merger.
Top Holdings (% of Fund's net assets) |
| |
| United Parcel Service, Inc. Class B | 16.0 | |
| Union Pacific Corp. | 13.7 | |
| CSX Corp. | 8.0 | |
| Air Transport Services Group, Inc. | 6.8 | |
| Scorpio Tankers, Inc. | 5.3 | |
| Uber Technologies, Inc. | 4.4 | |
| FedEx Corp. | 4.1 | |
| Alaska Air Group, Inc. | 3.6 | |
| Kirby Corp. | 3.3 | |
| C.H. Robinson Worldwide, Inc. | 2.9 | |
| | 68.1 | |
| |
| Industries (% of Fund's net assets) |
| |
| Air Freight & Logistics | 34.6 | |
| Road & Rail | 33.3 | |
| Airlines | 11.3 | |
| Oil, Gas & Consumable Fuels | 8.2 | |
| Internet & Direct Marketing Retail | 5.0 | |
| Marine | 3.9 | |
| Electrical Equipment | 1.2 | |
| Energy Equipment & Services | 0.1 | |
| |
Geographic Diversification (% of Fund's net assets) |
|
* Includes Short-Term investments and Net Other Assets (Liabilities). Percentages are based on country or territory of incorporation and are adjusted for the effect of futures contracts, if applicable. |
| |
Transportation Portfolio
| Common Stocks - 97.6% |
| | | Shares | Value ($) |
| Air Freight & Logistics - 34.6% | | | |
| Air Freight & Logistics - 34.6% | | | |
| Air Transport Services Group, Inc. (a) | | 1,406,262 | 42,370,674 |
| Atlas Air Worldwide Holdings, Inc. (a) | | 66,700 | 6,664,664 |
| C.H. Robinson Worldwide, Inc. (b) | | 157,796 | 18,012,413 |
| Expeditors International of Washington, Inc. | | 135,438 | 13,935,216 |
| FedEx Corp. | | 119,241 | 25,137,195 |
| Forward Air Corp. | | 35,400 | 3,435,216 |
| GXO Logistics, Inc. (a) | | 21,522 | 955,146 |
| Hub Group, Inc. Class A (a) | | 54,949 | 4,385,480 |
| United Parcel Service, Inc. Class B | | 509,941 | 99,188,626 |
| | | | 214,084,630 |
| Airlines - 11.3% | | | |
| Airlines - 11.3% | | | |
| Alaska Air Group, Inc. (a) | | 516,200 | 22,485,672 |
| Allegiant Travel Co. (a) | | 17,000 | 1,640,500 |
| Canada Jetlines Ltd. (a) | | 1,250 | 266 |
| Copa Holdings SA Class A (a)(b) | | 169,200 | 12,047,040 |
| Delta Air Lines, Inc. (a) | | 449,261 | 13,958,539 |
| Frontier Group Holdings, Inc. (a)(b) | | 597,600 | 7,709,040 |
| Spirit Airlines, Inc. (a) | | 75,000 | 1,701,000 |
| Sun Country Airlines Holdings, Inc. (a)(b) | | 418,900 | 8,344,488 |
| United Airlines Holdings, Inc. (a) | | 54,379 | 1,903,809 |
| | | | 69,790,354 |
| Electrical Equipment - 1.2% | | | |
| Electrical Components & Equipment - 1.2% | | | |
| Sensata Technologies, Inc. PLC | | 180,600 | 7,274,568 |
| Energy Equipment & Services - 0.1% | | | |
| Oil & Gas Drilling - 0.1% | | | |
| Valaris Ltd. (a)(b) | | 15,000 | 764,700 |
| Internet & Direct Marketing Retail - 5.0% | | | |
| Internet & Direct Marketing Retail - 5.0% | | | |
| Lyft, Inc. (a) | | 268,700 | 3,957,951 |
| Uber Technologies, Inc. (a) | | 953,704 | 27,428,527 |
| | | | 31,386,478 |
| Marine - 3.9% | | | |
| Marine - 3.9% | | | |
| Eagle Bulk Shipping, Inc. (b) | | 20,230 | 878,791 |
| Kirby Corp. (a) | | 306,200 | 20,533,772 |
| Matson, Inc. | | 34,995 | 2,577,732 |
| | | | 23,990,295 |
| Oil, Gas & Consumable Fuels - 8.2% | | | |
| Coal & Consumable Fuels - 0.8% | | | |
| Peabody Energy Corp. (a)(b) | | 209,100 | 5,156,406 |
| Oil & Gas Exploration & Production - 0.3% | | | |
| Canadian Natural Resources Ltd. | | 33,000 | 1,808,730 |
| Oil & Gas Storage & Transport - 7.1% | | | |
| Ardmore Shipping Corp. (a) | | 125,000 | 1,205,000 |
| Cool Co. Ltd. (a) | | 168,700 | 1,833,354 |
| DHT Holdings, Inc. | | 380,000 | 2,967,800 |
| International Seaways, Inc. | | 160,800 | 4,748,424 |
| Scorpio Tankers, Inc. | | 792,300 | 32,959,680 |
| | | | 43,714,258 |
TOTAL OIL, GAS & CONSUMABLE FUELS | | | 50,679,394 |
| Road & Rail - 33.3% | | | |
| Railroads - 24.2% | | | |
| CSX Corp. | | 1,553,101 | 49,155,647 |
| Norfolk Southern Corp. | | 63,936 | 15,544,760 |
| Union Pacific Corp. | | 377,737 | 84,805,734 |
| | | | 149,506,141 |
| Trucking - 9.1% | | | |
| AMERCO | | 11,369 | 5,976,342 |
| ArcBest Corp. | | 29,200 | 2,351,476 |
| Hertz Global Holdings, Inc. | | 85,000 | 1,569,100 |
| J.B. Hunt Transport Services, Inc. | | 102,911 | 17,908,572 |
| Knight-Swift Transportation Holdings, Inc. Class A | | 116,200 | 5,869,262 |
| Ryder System, Inc. | | 68,207 | 5,213,743 |
| Saia, Inc. (a) | | 20,874 | 4,317,369 |
| TFI International, Inc. | | 37,300 | 3,722,167 |
| TFI International, Inc. (Canada) | | 27,700 | 2,763,567 |
| Werner Enterprises, Inc. | | 23,783 | 946,326 |
| XPO Logistics, Inc. (a)(b) | | 110,322 | 5,783,079 |
| | | | 56,421,003 |
TOTAL ROAD & RAIL | | | 205,927,144 |
| TOTAL COMMON STOCKS (Cost $444,851,026) | | | 603,897,563 |
| | | | |
| Money Market Funds - 8.6% |
| | | Shares | Value ($) |
| Fidelity Cash Central Fund 2.33% (c) | | 11,548,858 | 11,551,167 |
| Fidelity Securities Lending Cash Central Fund 2.34% (c)(d) | | 41,362,188 | 41,366,324 |
| TOTAL MONEY MARKET FUNDS (Cost $52,917,491) | | | 52,917,491 |
| | | | |
| TOTAL INVESTMENT IN SECURITIES - 106.2% (Cost $497,768,517) | 656,815,054 |
NET OTHER ASSETS (LIABILITIES) - (6.2)% | (38,418,711) |
| NET ASSETS - 100.0% | 618,396,343 |
| | |
Legend
| (b) | Security or a portion of the security is on loan at period end. |
| (c) | Affiliated fund that is generally available only to investment companies and other accounts managed by Fidelity Investments. The rate quoted is the annualized seven-day yield of the fund at period end. A complete unaudited listing of the fund's holdings as of its most recent quarter end is available upon request. In addition, each Fidelity Central Fund's financial statements are available on the SEC's website or upon request. |
| (d) | Investment made with cash collateral received from securities on loan. |
Affiliated Central Funds
Fiscal year to date information regarding the Fund's investments in Fidelity Central Funds, including the ownership percentage, is presented below.
| Affiliate | Value, beginning of period ($) | Purchases ($) | Sales Proceeds ($) | Dividend Income ($) | Realized Gain (loss) ($) | Change in Unrealized appreciation (depreciation) ($) | Value, end of period ($) | %ownership, end of period |
| Fidelity Cash Central Fund 2.33% | 10,409,172 | 75,517,640 | 74,375,645 | 66,115 | - | - | 11,551,167 | 0.0% |
| Fidelity Securities Lending Cash Central Fund 2.34% | 71,035,353 | 251,883,270 | 281,552,299 | 22,403 | - | - | 41,366,324 | 0.1% |
| Total | 81,444,525 | 327,400,910 | 355,927,944 | 88,518 | - | - | 52,917,491 | |
| | | | | | | | | |
Amounts in the income column in the above table include any capital gain distributions from underlying funds, which are presented in the corresponding line item in the Statement of Operations, if applicable.
Amount for Fidelity Securities Lending Cash Central Fund represents the income earned on investing cash collateral, less rebates paid to borrowers and any lending agent fees associated with the loan, plus any premium payments received for lending certain types of securities.
Investment Valuation
The following is a summary of the inputs used, as of August 31, 2022, involving the Fund's assets and liabilities carried at fair value. The inputs or methodology used for valuing securities may not be an indication of the risk associated with investing in those securities. For more information on valuation inputs, and their aggregation into the levels used below, please refer to the Investment Valuation section in the accompanying Notes to Financial Statements.
| Valuation Inputs at Reporting Date: |
| Description | Total ($) | Level 1 ($) | Level 2 ($) | Level 3 ($) |
Investments in Securities: | | | | |
|
| Common Stocks | 603,897,563 | 603,897,563 | - | - |
|
| Money Market Funds | 52,917,491 | 52,917,491 | - | - |
| Total Investments in Securities: | 656,815,054 | 656,815,054 | - | - |
Transportation Portfolio
| Statement of Assets and Liabilities |
| | | | August 31, 2022 (Unaudited) |
| | | | | |
| Assets | | | | |
| Investment in securities, at value (including securities loaned of $40,107,820) - See accompanying schedule: | | $603,897,563 | | |
Unaffiliated issuers (cost $444,851,026) | | | |
Fidelity Central Funds (cost $52,917,491) | | 52,917,491 | | |
| | | | | |
| Total Investment in Securities (cost $497,768,517) | | | $ | 656,815,054 |
| Foreign currency held at value (cost $17) | | | | 17 |
| Receivable for investments sold | | | | 4,466,804 |
| Receivable for fund shares sold | | | | 834,129 |
| Dividends receivable | | | | 1,589,656 |
| Distributions receivable from Fidelity Central Funds | | | | 26,105 |
| Prepaid expenses | | | | 2,820 |
| Other receivables | | | | 5,805 |
Total assets | | | | 663,740,390 |
| Liabilities | | | | |
| Payable to custodian bank | | 331 | | |
| Payable for investments purchased | | 2,008,054 | | |
| Payable for fund shares redeemed | | 1,554,013 | | |
| Accrued management fee | | 282,834 | | |
| Other affiliated payables | | 112,248 | | |
| Other payables and accrued expenses | | 20,243 | | |
| Collateral on securities loaned | | 41,366,324 | | |
| Total Liabilities | | | | 45,344,047 |
| Net Assets | | | $ | 618,396,343 |
| Net Assets consist of: | | | | |
| Paid in capital | | | $ | 430,886,024 |
| Total accumulated earnings (loss) | | | | 187,510,319 |
| Net Assets | | | $ | 618,396,343 |
Net Asset Value , offering price and redemption price per share ($618,396,343 ÷ 6,257,545 shares) | | | $ | 98.82 |
| | | | | |
| Statement of Operations |
| | | | Six months ended August 31, 2022 (Unaudited) |
| Investment Income | | | | |
| Dividends | | | $ | 7,319,359 |
| Income from Fidelity Central Funds (including $22,403 from security lending) | | | | 88,518 |
| Total Income | | | | 7,407,877 |
| Expenses | | | | |
| Management fee | $ | 1,669,404 | | |
| Transfer agent fees | | 586,372 | | |
| Accounting fees | | 110,343 | | |
| Custodian fees and expenses | | 4,171 | | |
| Independent trustees' fees and expenses | | 1,023 | | |
| Registration fees | | 27,590 | | |
| Audit | | 22,575 | | |
| Legal | | 953 | | |
| Miscellaneous | | (1,192) | | |
| Total expenses before reductions | | 2,421,239 | | |
| Expense reductions | | (10,495) | | |
| Total expenses after reductions | | | | 2,410,744 |
| Net Investment income (loss) | | | | 4,997,133 |
| Realized and Unrealized Gain (Loss) | | | | |
| Net realized gain (loss) on: | | | | |
| Investment Securities: | | | | |
| Unaffiliated issuers | | 25,986,852 | | |
| Foreign currency transactions | | (2,596) | | |
| Total net realized gain (loss) | | | | 25,984,256 |
| Change in net unrealized appreciation (depreciation) on: | | | | |
| Investment Securities: | | | | |
| Unaffiliated issuers | | (59,174,164) | | |
| Assets and liabilities in foreign currencies | | (255) | | |
| Total change in net unrealized appreciation (depreciation) | | | | (59,174,419) |
| Net gain (loss) | | | | (33,190,163) |
| Net increase (decrease) in net assets resulting from operations | | | $ | (28,193,030) |
| Statement of Changes in Net Assets |
| |
| | Six months ended August 31, 2022 (Unaudited) | | Year ended February 28, 2022 |
| Increase (Decrease) in Net Assets | | | | |
| Operations | | | | |
| Net investment income (loss) | $ | 4,997,133 | $ | 2,903,332 |
| Net realized gain (loss) | | 25,984,256 | | 53,873,633 |
| Change in net unrealized appreciation (depreciation) | | (59,174,419) | | 9,800,484 |
| Net increase (decrease) in net assets resulting from operations | | (28,193,030) | | 66,577,449 |
| Distributions to shareholders | | (18,141,440) | | (47,428,580) |
| Share transactions | | | | |
| Proceeds from sales of shares | | 49,872,348 | | 148,678,513 |
| Net asset value of shares issued in exchange for the net assets of the Target Fund(s) (see Merger Information note) | | - | | 322,796,887 |
| Reinvestment of distributions | | 17,275,549 | | 44,843,850 |
| Cost of shares redeemed | | (81,719,793) | | (191,945,005) |
Net increase (decrease) in net assets resulting from share transactions | | (14,571,896) | | 324,374,245 |
| Total increase (decrease) in net assets | | (60,906,366) | | 343,523,114 |
| | | | | |
| Net Assets | | | | |
| Beginning of period | | 679,302,709 | | 335,779,595 |
| End of period | $ | 618,396,343 | $ | 679,302,709 |
| | | | | |
| Other Information | | | | |
| Shares | | | | |
| Sold | | 488,115 | | 1,386,810 |
| Issued in exchange for the shares of the Target Fund(s) (see Merger Information note) | | - | | 3,028,967 |
| Issued in reinvestment of distributions | | 175,368 | | 421,380 |
| Redeemed | | (825,151) | | (1,810,854) |
| Net increase (decrease) | | (161,668) | | 3,026,303 |
| | | | | |
| | Six months ended (Unaudited) August 31, 2022 | | Years ended February 28, 2022 | | 2021 | | 2020 A | | 2019 | | 2018 |
Selected Per-Share Data | | | | | | | | | | | | |
| Net asset value, beginning of period | $ | 105.82 | $ | 98.97 | $ | 82.12 | $ | 95.41 | $ | 99.07 | $ | 92.98 |
| Income from Investment Operations | | | | | | | | | | | | |
Net investment income (loss) B,C | | .78 | | .64 | | 1.06 D | | .93 | | .85 | | .78 |
| Net realized and unrealized gain (loss) | | (4.95) | | 19.26 | | 23.43 | | (10.43) | | 5.05 | | 10.83 |
| Total from investment operations | | (4.17) | | 19.90 | | 24.49 | | (9.50) | | 5.90 | | 11.61 |
| Distributions from net investment income | | (.01) | | (1.03) | | (.76) | | (1.10) | | (.78) | | (.67) |
| Distributions from net realized gain | | (2.82) | | (12.03) | | (6.88) | | (2.70) | | (8.78) | | (4.85) |
| Total distributions | | (2.83) | | (13.05) E | | (7.64) | | (3.79) E | | (9.56) | | (5.52) |
Redemption fees added to paid in capital B | | - | | - | | - | | - | | - | | - F |
| Net asset value, end of period | $ | 98.82 | $ | 105.82 | $ | 98.97 | $ | 82.12 | $ | 95.41 | $ | 99.07 |
Total Return G,H | | (3.93)% | | 20.35% | | 34.62% | | (10.49)% | | 6.85% | | 12.48% |
Ratios to Average Net Assets C,I,J | | | | | | | | | | | | |
| Expenses before reductions | | .76% K | | .77% | | .80% | | .79% | | .79% | | .80% |
| Expenses net of fee waivers, if any | | .76% K | | .77% | | .80% | | .79% | | .79% | | .80% |
| Expenses net of all reductions | | .76% K | | .77% | | .80% | | .79% | | .78% | | .80% |
| Net investment income (loss) | | 1.57% K | | .60% | | 1.29% D | | 1.00% | | .87% | | .80% |
| Supplemental Data | | | | | | | | | | | | |
| Net assets, end of period (000 omitted) | $ | 618,396 | $ | 679,303 | $ | 335,780 | $ | 310,441 | $ | 451,192 | $ | 512,155 |
Portfolio turnover rate L | | 28% K | | 66% M | | 52% | | 78% | | 58% | | 47% |
A For the year ended February 29.
B Calculated based on average shares outstanding during the period.
C Net investment income (loss) is affected by the timing of the declaration of dividends by any underlying mutual funds or exchange-traded funds (ETFs). Net investment income (loss) of any such underlying funds is not included in the Fund's net investment income (loss) ratio.
D Net investment income per share reflects one or more large, non-recurring dividend(s) which amounted to $.34 per share. Excluding such non-recurring dividend(s), the ratio of net investment income (loss) to average net assets would have been .88%.
E Total distributions per share do not sum due to rounding.
F Amount represents less than $.005 per share.
G Total returns for periods of less than one year are not annualized.
H Total returns would have been lower if certain expenses had not been reduced during the applicable periods shown.
I Fees and expenses of any underlying mutual funds or exchange-traded funds (ETFs) are not included in the Fund's expense ratio. The Fund indirectly bears its proportionate share of these expenses. For additional expense information related to investments in Fidelity Central Funds, please refer to the "Investments in Fidelity Central Funds" note found in the Notes to Financial Statements section of the most recent Annual or Semi-Annual report.
J Expense ratios reflect operating expenses of the class. Expenses before reductions do not reflect amounts reimbursed, waived, or reduced through arrangements with the investment adviser, brokerage services, or other offset arrangements, if applicable, and do not represent the amount paid by the class during periods when reimbursements, waivers or reductions occur.
K Annualized
L Amount does not include the portfolio activity of any underlying mutual funds or exchange-traded funds (ETFs).
M The portfolio turnover rate does not include the assets acquired in the merger.
For the period ended August 31, 2022
1. Organization.
Defense and Aerospace Portfolio, Industrials Portfolio and Transportation Portfolio (the Funds) are non-diversified funds of Fidelity Select Portfolios (the Trust). The Trust is registered under the Investment Company Act of 1940, as amended (the 1940 Act), as an open-end management investment company organized as a Massachusetts business trust. The Funds invest primarily in securities of companies whose principal business activities fall within specific industries. Each Fund is authorized to issue an unlimited number of shares. Share transactions on the Statement of Changes in Net Assets may contain exchanges between affiliated funds.
2. Investments in Fidelity Central Funds.
Funds may invest in Fidelity Central Funds, which are open-end investment companies generally available only to other investment companies and accounts managed by the investment adviser and its affiliates. The Schedule of Investments lists any Fidelity Central Funds held as an investment as of period end, but does not include the underlying holdings of each Fidelity Central Fund. An investing fund indirectly bears its proportionate share of the expenses of the underlying Fidelity Central Funds.
Based on its investment objective, each Fidelity Central Fund may invest or participate in various investment vehicles or strategies that are similar to those of the investing fund. These strategies are consistent with the investment objectives of the investing fund and may involve certain economic risks which may cause a decline in value of each of the Fidelity Central Funds and thus a decline in the value of the investing fund.
| Fidelity Central Fund | Investment Manager | Investment Objective | Investment Practices | Expense Ratio A |
| Fidelity Money Market Central Funds | Fidelity Management & Research Company LLC (FMR) | Each fund seeks to obtain a high level of current income consistent with the preservation of capital and liquidity. | Short-term Investments | Less than .005% |
A Expenses expressed as a percentage of average net assets and are as of each underlying Central Fund's most recent annual or semi-annual shareholder report.
A complete unaudited list of holdings for each Fidelity Central Fund is available upon request or at the Securities and Exchange Commission website at www.sec.gov. In addition, the financial statements of the Fidelity Central Funds which contain the significant accounting policies (including investment valuation policies) of those funds, and are not covered by the Report of Independent Registered Public Accounting Firm, are available on the Securities and Exchange Commission website or upon request.
3. Significant Accounting Policies.
Each Fund is an investment company and applies the accounting and reporting guidance of the Financial Accounting Standards Board (FASB) Accounting Standards Codification Topic 946 Financial Services - Investment Companies . The financial statements have been prepared in conformity with accounting principles generally accepted in the United States of America (GAAP), which require management to make certain estimates and assumptions at the date of the financial statements. Actual results could differ from those estimates. Subsequent events, if any, through the date that the financial statements were issued have been evaluated in the preparation of the financial statements. Each Fund's Schedule of Investments lists any underlying mutual funds or exchange-traded funds (ETFs) but does not include the underlying holdings of these funds. The following summarizes the significant accounting policies of each Fund:
Investment Valuation. Investments are valued as of 4:00 p.m. Eastern time on the last calendar day of the period. The Board of Trustees (the Board) has delegated the day to day responsibility for the valuation of each Fund's investments to the Fair Value Committee (the Committee) established by each Fund's investment adviser. In accordance with valuation policies and procedures approved by the Board, each Fund attempts to obtain prices from one or more third party pricing vendors or brokers to value its investments. When current market prices, quotations or currency exchange rates are not readily available or reliable, investments will be fair valued in good faith by the Committee, in accordance with procedures adopted by the Board. Factors used in determining fair value vary by investment type and may include market or investment specific events. The frequency with which these procedures are used cannot be predicted and they may be utilized to a significant extent. The Committee oversees each Fund's valuation policies and procedures and reports to the Board on the Committee's activities and fair value determinations. The Board monitors the appropriateness of the procedures used in valuing each Fund's investments and ratifies the fair value determinations of the Committee.
Each Fund categorizes the inputs to valuation techniques used to value its investments into a disclosure hierarchy consisting of three levels as shown below:
Level 1 - unadjusted quoted prices in active markets for identical investments
Level 2 - other significant observable inputs (including quoted prices for similar investments, interest rates, prepayment speeds, etc.)
Level 3 - unobservable inputs (including the Fund's own assumptions based on the best information available)
Valuation techniques used to value each Fund's investments by major category are as follows:
Equity securities, including restricted securities, for which market quotations are readily available, are valued at the last reported sale price or official closing price as reported by a third party pricing vendor on the primary market or exchange on which they are traded and are categorized as Level 1 in the hierarchy. In the event there were no sales during the day or closing prices are not available, securities are valued at the last quoted bid price or may be valued using the last available price and are generally categorized as Level 2 in the hierarchy. For foreign equity securities, when market or security specific events arise, comparisons to the valuation of American Depositary Receipts (ADRs), futures contracts, ETFs and certain indexes as well as quoted prices for similar securities may be used and would be categorized as Level 2 in the hierarchy. For equity securities, including restricted securities, where observable inputs are limited, assumptions about market activity and risk are used and these securities may be categorized as Level 3 in the hierarchy.
Investments in open-end mutual funds, including the Fidelity Central Funds, are valued at their closing net asset value (NAV) each business day and are categorized as Level 1 in the hierarchy.
Changes in valuation techniques may result in transfers in or out of an assigned level within the disclosure hierarchy. The aggregate value of investments by input level as of August 31, 2022 is included at the end of each Fund's Schedule of Investments.
Foreign Currency. Certain Funds may use foreign currency contracts to facilitate transactions in foreign-denominated securities. Gains and losses from these transactions may arise from changes in the value of the foreign currency or if the counterparties do not perform under the contracts' terms.
Foreign-denominated assets, including investment securities, and liabilities are translated into U.S. dollars at the exchange rates at period end. Purchases and sales of investment securities, income and dividends received, and expenses denominated in foreign currencies are translated into U.S. dollars at the exchange rate in effect on the transaction date.
The effects of exchange rate fluctuations on investments are included with the net realized and unrealized gain (loss) on investment securities. Other foreign currency transactions resulting in realized and unrealized gain (loss) are disclosed separately.
Investment Transactions and Income. For financial reporting purposes, the Funds' investment holdings and NAV include trades executed through the end of the last business day of the period. The NAV per share for processing shareholder transactions is calculated as of the close of business of the New York Stock Exchange (NYSE), normally 4:00 p.m. Eastern time and includes trades executed through the end of the prior business day. Gains and losses on securities sold are determined on the basis of identified cost and for certain Funds include proceeds received from litigation. Commissions paid to certain brokers with whom the investment adviser, or its affiliates, places trades on behalf of a fund include an amount in addition to trade execution, which may be rebated back to a fund. Any such rebates are included in net realized gain (loss) on investments in the Statement of Operations. Dividend income is recorded on the ex-dividend date, except for certain dividends from foreign securities where the ex-dividend date may have passed, which are recorded as soon as the Funds are informed of the ex-dividend date. Non-cash dividends included in dividend income, if any, are recorded at the fair market value of the securities received. Income and capital gain distributions from Fidelity Central Funds, if any, are recorded on the ex-dividend date. Certain distributions received by the Funds represent a return of capital or capital gain. The Funds determine the components of these distributions subsequent to the ex-dividend date, based upon receipt of tax filings or other correspondence relating to the underlying investment. These distributions are recorded as a reduction of cost of investments and/or as a realized gain. Large, non-recurring dividends recognized by the Funds are presented separately on the Statement of Operations as "Special Dividends" and the impact of these dividends is presented in the Financial Highlights. Investment income is recorded net of foreign taxes withheld where recovery of such taxes is uncertain. Funds may file withholding tax reclaims in certain jurisdictions to recover a portion of amounts previously withheld. Any withholding tax reclaims income is included in the Statement of Operations in dividends. Any receivables for withholding tax reclaims are included in the Statement of Assets and Liabilities in dividends receivable.
Expenses. Expenses directly attributable to a fund are charged to that fund. Expenses attributable to more than one fund are allocated among the respective funds on the basis of relative net assets or other appropriate methods. Expenses included in the accompanying financial statements reflect the expenses of that fund and do not include any expenses associated with any underlying mutual funds or exchange-traded funds. Although not included in a fund's expenses, a fund indirectly bears its proportionate share of these expenses through the net asset value of each underlying mutual fund or exchange-traded fund. Expense estimates are accrued in the period to which they relate and adjustments are made when actual amounts are known.
Deferred Trustee Compensation. Under a Deferred Compensation Plan (the Plan) for certain Funds, certain independent Trustees have elected to defer receipt of a portion of their annual compensation. Deferred amounts are invested in affiliated mutual funds, are marked-to-market and remain in a fund until distributed in accordance with the Plan. The investment of deferred amounts and the offsetting payable to the Trustees presented below are included in the accompanying Statement of Assets and Liabilities in other receivables and other payables and accrued expenses, as applicable.
Defense and Aerospace Portfolio | $110,897 |
Industrials Portfolio | 103,928 |
Income Tax Information and Distributions to Shareholders. Each year, each Fund intends to qualify as a regulated investment company under Subchapter M of the Internal Revenue Code, including distributing substantially all of its taxable income and realized gains. As a result, no provision for U.S. Federal income taxes is required. Each Fund files a U.S. federal tax return, in addition to state and local tax returns as required. Each Fund's federal income tax returns are subject to examination by the Internal Revenue Service (IRS) for a period of three fiscal years after they are filed. State and local tax returns may be subject to examination for an additional fiscal year depending on the jurisdiction. Foreign taxes are provided for based on each Fund's understanding of the tax rules and rates that exist in the foreign markets in which it invests.
Distributions are declared and recorded on the ex-dividend date. Income and capital gain distributions are determined in accordance with income tax regulations, which may differ from GAAP.
Capital accounts within the financial statements are adjusted for permanent book-tax differences. These adjustments have no impact on net assets or the results of operations. Capital accounts are not adjusted for temporary book-tax differences which will reverse in a subsequent period.
Book-tax differences are primarily due to foreign currency transactions, passive foreign investment companies (PFIC), certain deemed dividend, partnerships, deferred Trustee compensation, net operating losses, capital loss carryforwards, losses deferred due to wash sales and excise tax regulations.
As of period end, the cost and unrealized appreciation (depreciation) in securities, and derivatives if applicable, for federal income tax purposes were as follows for each Fund:
| | Tax cost | Gross unrealized appreciation | Gross unrealized depreciation | Net unrealized appreciation (depreciation) |
| Defense and Aerospace Portfolio | $ 1,066,633,928 | $ 387,326,754 | $ (75,859,895) | $ 311,466,859 |
| Industrials Portfolio | 293,153,978 | 41,410,632 | (18,416,019) | 22,994,613 |
| Transportation Portfolio | 499,387,514 | 202,892,503 | (45,464,963) | 157,427,540 |
Certain of the Funds elected to defer to the next fiscal year capital losses recognized during the period November 1, 2021 to February 28, 2022. Loss deferrals were as follows:
| | Capital losses |
| Transportation Portfolio | $ (725,683) |
4. Purchases and Sales of Investments.
Purchases and sales of securities, other than short-term securities and in-kind transactions, as applicable, are noted in the table below.
| | Purchases ($) | Sales ($) |
| Defense and Aerospace Portfolio | 114,623,893 | 100,936,228 |
| Industrials Portfolio | 104,535,596 | 132,365,094 |
| Transportation Portfolio | 86,816,674 | 124,247,186 |
5. Fees and Other Transactions with Affiliates.
Management Fee. Fidelity Management & Research Company LLC (the investment adviser) and its affiliates provide the Funds with investment management related services for which the Funds pay a monthly management fee. The management fee is the sum of an individual fund fee rate and an annualized group fee rate. The individual fund fee rate is applied to each Fund's average net assets. The group fee rate is based upon the monthly average net assets of a group of registered investment companies with which the investment adviser has management contracts. The group fee rate decreases as assets under management increase and increases as assets under management decrease. For the reporting period, each Fund's annualized management fee rate expressed as a percentage of each Fund's average net assets was as follows:
| | Individual Rate | Group Rate | Total |
| Defense and Aerospace Portfolio | .30% | .23% | .53% |
| Industrials Portfolio | .30% | .23% | .53% |
| Transportation Portfolio | .30% | .23% | .53% |
Transfer Agent Fees. Fidelity Investments Institutional Operations Company LLC (FIIOC), an affiliate of the investment adviser, is the Funds' transfer, dividend disbursing and shareholder servicing agent. FIIOC receives account fees and asset-based fees that vary according to account size and type of account. FIIOC pays for typesetting, printing and mailing of shareholder reports, except proxy statements. For the period, transfer agent fees were equivalent to the following annualized rates expressed as a percentage of average net assets:
| Defense and Aerospace Portfolio | .18% |
| Industrials Portfolio | .17% |
| Transportation Portfolio | .18% |
Accounting Fees. Fidelity Service Company, Inc. (FSC), an affiliate of the investment adviser, maintains each Fund's accounting records. The accounting fee is based on the level of average net assets for each month. For the period, the fees were equivalent to the following annualized rates:
| | % of Average Net Assets |
| Defense and Aerospace Portfolio | .03 |
| Industrials Portfolio | .04 |
| Transportation Portfolio | .03 |
Brokerage Commissions. A portion of portfolio transactions were placed with brokerage firms which are affiliates of the investment adviser. Brokerage commissions are included in net realized gain (loss) and change in net unrealized appreciation (depreciation) in the Statement of Operations. The commissions paid to these affiliated firms were as follows:
| | Amount |
| Defense and Aerospace Portfolio | $ 1,850 |
| Industrials Portfolio | 1,416 |
| Transportation Portfolio | 2,675 |
Interfund Trades. Funds may purchase from or sell securities to other Fidelity Funds under procedures adopted by the Board. The procedures have been designed to ensure these interfund trades are executed in accordance with Rule 17a-7 of the 1940 Act. Any interfund trades are included within the respective purchases and sales amounts shown in the Purchases and Sales of Investments note. Interfund trades during the period are noted in the table below.
| | Purchases ($) | Sales ($) | Realized Gain (Loss) ($) |
| Defense and Aerospace Portfolio | 5,272,054 | 9,912,676 | 942,880 |
| Industrials Portfolio | 2,817,818 | 6,021,916 | 173,808 |
| Transportation Portfolio | 5,578,387 | 2,881,867 | 219,887 |
6. Committed Line of Credit.
Certain Funds participate with other funds managed by the investment adviser or an affiliate in a $4.25 billion credit facility (the "line of credit") to be utilized for temporary or emergency purposes to fund shareholder redemptions or for other short-term liquidity purposes. The participating funds have agreed to pay commitment fees on their pro-rata portion of the line of credit, which are reflected in Miscellaneous expenses on the Statement of Operations, and are listed below. During the period, there were no borrowings on this line of credit.
| | Amount |
| Defense and Aerospace Portfolio | $ 1,280 |
| Industrials Portfolio | 300 |
| Transportation Portfolio | 575 |
7. Security Lending.
Funds lend portfolio securities from time to time in order to earn additional income. Lending agents are used, including National Financial Services (NFS), an affiliate of the investment adviser. Pursuant to a securities lending agreement, NFS will receive a fee, which is capped at 9.9% of a fund's daily lending revenue, for its services as lending agent. A fund may lend securities to certain qualified borrowers, including NFS. On the settlement date of the loan, a fund receives collateral (in the form of U.S. Treasury obligations, letters of credit and/or cash) against the loaned securities and maintains collateral in an amount not less than 100% of the market value of the loaned securities during the period of the loan. The market value of the loaned securities is determined at the close of business of a fund and any additional required collateral is delivered to a fund on the next business day. A fund or borrower may terminate the loan at any time, and if the borrower defaults on its obligation to return the securities loaned because of insolvency or other reasons, a fund may apply collateral received from the borrower against the obligation. A fund may experience delays and costs in recovering the securities loaned. Any cash collateral received is invested in the Fidelity Securities Lending Cash Central Fund. Any loaned securities are identified as such in the Schedule of Investments, and the value of loaned securities and cash collateral at period end, as applicable, are presented in the Statement of Assets and Liabilities. Security lending income represents the income earned on investing cash collateral, less rebates paid to borrowers and any lending agent fees associated with the loan, plus any premium payments received for lending certain types of securities. Security lending income is presented in the Statement of Operations as a component of income from Fidelity Central Funds. Affiliated security lending activity, if any, was as follows:
| | Total Security Lending Fees Paid to NFS | Security Lending Income From Securities Loaned to NFS | Value of Securities Loaned to NFS at Period End |
| Defense and Aerospace Portfolio | $ 927 | $ - | $- |
| Industrials Portfolio | $ 464 | $ 1 | $- |
| Transportation Portfolio | $ 2,208 | $ 159 | $ 4,663,350 |
8. Expense Reductions.
During the period the investment adviser or an affiliate reimbursed and/or waived a portion of operating expenses as follows:
| | Amount |
| Defense and Aerospace Portfolio | $ 23,568 |
| Industrials Portfolio | 5,335 |
| Transportation Portfolio | 10,495 |
9. Other.
A fund's organizational documents provide former and current trustees and officers with a limited indemnification against liabilities arising in connection with the performance of their duties to the fund. In the normal course of business, a fund may also enter into contracts that provide general indemnifications. A fund's maximum exposure under these arrangements is unknown as this would be dependent on future claims that may be made against a fund. The risk of material loss from such claims is considered remote.
10. Risk and Uncertainties.
Many factors affect a fund's performance. Developments that disrupt global economies and financial markets, such as pandemics, epidemics, outbreaks of infectious diseases, war, terrorism, and environmental disasters, may significantly affect a fund's investment performance. The effects of these developments to a fund will be impacted by the types of securities in which a fund invests, the financial condition, industry, economic sector, and geographic location of an issuer, and a fund's level of investment in the securities of that issuer.
11. Prior Fiscal Year Merger Information.
On November 12, 2021, Transportation Portfolio acquired all of the assets and assumed all of the liabilities of Air Transportation Portfolio ("Target Fund") pursuant to an Agreement and Plan of Reorganization approved by the Board of Trustees ("The Board"). The securities held by the Target Fund were the primary assets acquired by the Fund. The acquisition was accomplished by an exchange of shares of the Fund for shares then outstanding of the Target Fund at its respective net asset value on the acquisition date. The reorganization provides shareholders of the Target Fund access to a larger portfolio with a similar investment objective and lower projected expenses. For financial reporting purposes, the assets and liabilities of the Target Fund and shares issued by the Fund were recorded at fair value; however, the cost basis of the investments received from the Target Fund were carried forward and will be utilized for purposes of the Fund's ongoing reporting of realized and unrealized gains and losses to more closely align subsequent reporting of realized gains with amounts distributable to shareholders for tax purposes. The reorganization qualified as a tax-free reorganization for federal income tax purposes with no gain or loss recognized to the funds or their shareholders.
| Target Fund | Investments $ | Unrealized appreciation (depreciation) $ | Net Assets $ | Shares Exchanged | Shares Exchanged Ratio |
| Air Transportation Portfolio | 320,705,550 | 47,927,461 | 322,796,887 | 3,028,967 | .5404138125 |
| Surviving Fund | Net Assets $ | Total net assets after the acquisition $ |
| Transportation Portfolio | 411,872,847 | 734,669,734 |
Pro forma results of operations of the combined entity for the entire period ended February 28, 2022, as though the acquisition had occurred as of the beginning of the year (rather than on the actual acquisition date), are as follows:
| Net investment income (loss) | $2,600,527 |
| Total net realized gain (loss) | 134,920,339 |
| Total change in net unrealized appreciation (depreciation) | (53,851,879) |
| Net increase (decrease) in net assets resulting from operations | $83,668,987 |
Because the combined investment portfolios have been managed as a single portfolio since the acquisition was completed, it is not practicable to separate the amounts of revenue and earnings of the acquired fund that have been included in the Transportation Portfolio's Statement of Operations since November 12, 2021.
As a shareholder, you incur two types of costs: (1) transaction costs, which may include sales charges (loads) on purchase payments or redemption proceeds, as applicable and (2) ongoing costs, which generally include management fees, distribution and/or service (12b-1) fees and other Fund expenses. This Example is intended to help you understand your ongoing costs (in dollars) of investing in a fund and to compare these costs with the ongoing costs of investing in other mutual funds.
| The Example is based on an investment of $1,000 invested at the beginning of the period and held for the entire period (March 1, 2022 to August 31, 2022). |
Actual Expenses
The first line of the accompanying table provides information about actual account values and actual expenses. You may use the information in this line, together with the amount you invested, to estimate the expenses that you paid over the period. Simply divide your account value by $1,000.00 (for example, an $8,600 account value divided by $1,000.00 = 8.6), then multiply the result by the number in the first line for a class/Fund under the heading entitled "Expenses Paid During Period" to estimate the expenses you paid on your account during this period. If any fund is a shareholder of any underlying mutual funds or exchange-traded funds (ETFs) (the Underlying Funds), such fund indirectly bears its proportional share of the expenses of the Underlying Funds in addition to the direct expenses incurred presented in the table. These fees and expenses are not included in the annualized expense ratio used to calculate the expense estimate in the table below.
Hypothetical Example for Comparison Purposes
The second line of the accompanying table provides information about hypothetical account values and hypothetical expenses based on the actual expense ratio and an assumed rate of return of 5% per year before expenses, which is not the actual return. The hypothetical account values and expenses may not be used to estimate the actual ending account balance or expenses you paid for the period. You may use this information to compare the ongoing costs of investing in the Fund and other funds. To do so, compare this 5% hypothetical example with the 5% hypothetical examples that appear in the shareholder reports of the other funds. If any fund is a shareholder of any Underlying Funds, such fund indirectly bears its proportional share of the expenses of the Underlying Funds in addition to the direct expenses as presented in the table. These fees and expenses are not included in the annualized expense ratio used to calculate the expense estimate in the table below.
Please note that the expenses shown in the table are meant to highlight your ongoing costs only and do not reflect any transaction costs. Therefore, the second line of the table is useful in comparing ongoing costs only, and will not help you determine the relative total costs of owning different funds. In addition, if these transactional costs were included, your costs would have been higher.
| | | | | Annualized Expense Ratio- A | | Beginning Account Value March 1, 2022 | | Ending Account Value August 31, 2022 | | Expenses Paid During Period- C March 1, 2022 to August 31, 2022 |
| | | | | | | | | | |
| Defense and Aerospace Portfolio | | | | .75% | | | | | | |
| Actual | | | | | | $ 1,000 | | $ 892.90 | | $ 3.58 |
Hypothetical- B | | | | | | $ 1,000 | | $ 1,021.42 | | $ 3.82 |
| | | | | | | | | | |
| Industrials Portfolio | | | | .76% | | | | | | |
| Actual | | | | | | $ 1,000 | | $ 917.90 | | $ 3.67 |
Hypothetical- B | | | | | | $ 1,000 | | $ 1,021.37 | | $ 3.87 |
| | | | | | | | | | |
| Transportation Portfolio | | | | .76% | | | | | | |
| Actual | | | | | | $ 1,000 | | $ 960.70 | | $ 3.76 |
Hypothetical- B | | | | | | $ 1,000 | | $ 1,021.37 | | $ 3.87 |
| |
A Annualized expense ratio reflects expenses net of applicable fee waivers.
B 5% return per year before expenses
C Expenses are equal to the annualized expense ratio, multiplied by the average account value over the period, multiplied by 184/ 365 (to reflect the one-half year period). The fees and expenses of any Underlying Funds are not included in each annualized expense ratio.
Defense and Aerospace Portfolio
Industrials Portfolio
Transportation Portfolio
Each year, the Board of Trustees, including the Independent Trustees (together, the Board), votes on the renewal of the management contract with Fidelity Management & Research Company LLC (FMR) and the sub-advisory agreements (together, the Advisory Contracts) for each fund. FMR and the sub-advisers are referred to herein as the Investment Advisers. The Board, assisted by the advice of fund counsel and Independent Trustees' counsel, requests and considers a broad range of information relevant to the renewal of the Advisory Contracts throughout the year.
The Board meets regularly and, at each of its meetings, covers an extensive agenda of topics and materials and considers factors that are relevant to its annual consideration of the renewal of each fund's Advisory Contracts, including the services and support provided to each fund and its shareholders. The Board has established various standing committees (Committees), each composed of and chaired by Independent Trustees with varying backgrounds, to which the Board has assigned specific subject matter responsibilities in order to enhance effective decision-making by the Board. The Board, acting directly and through its Committees, requests and receives information concerning the annual consideration of the renewal of each fund's Advisory Contracts. The Board also meets as needed to review matters specifically related to the Board's annual consideration of the renewal of the Advisory Contracts. Members of the Board may also meet with trustees of other Fidelity funds through joint ad hoc committees to discuss certain matters relevant to all of the Fidelity funds.
At its May 2022 meeting, the Board unanimously determined to renew each fund's Advisory Contracts. In reaching its determination, the Board considered all factors it believed relevant, including (i) the nature, extent, and quality of the services provided to each fund and its shareholders (including the investment performance of each fund); (ii) the competitiveness relative to peer funds of each fund's management fee and total expense ratio; (iii) the total costs of the services provided by and the profits realized by Fidelity from its relationships with each fund; and (iv) the extent to which, if any, economies of scale exist and are realized as each fund grows, and whether any economies of scale are appropriately shared with fund shareholders.
In considering whether to renew the Advisory Contracts for each fund, the Board reached a determination, with the assistance of fund counsel and Independent Trustees' counsel and through the exercise of its business judgment, that the renewal of the Advisory Contracts was in the best interests of each fund and its shareholders and that the compensation payable under the Advisory Contracts was fair and reasonable. The Board's decision to renew the Advisory Contracts was not based on any single factor, but rather was based on a comprehensive consideration of all the information provided to the Board at its meetings throughout the year. The Board, in reaching its determination to renew the Advisory Contracts, was aware that shareholders of each fund have a broad range of investment choices available to them, including a wide choice among funds offered by Fidelity's competitors, and that each fund's shareholders, who have the opportunity to review and weigh the disclosure provided by the fund in its prospectus and other public disclosures, have chosen to invest in that fund, which is part of the Fidelity family of funds.
Nature, Extent, and Quality of Services Provided. The Board considered Fidelity's staffing as it relates to the funds, including the backgrounds of investment personnel of Fidelity, and also considered the funds' investment objectives, strategies, and related investment philosophies. The Independent Trustees also had discussions with senior management of Fidelity's investment operations and investment groups. The Board considered the structure of the investment personnel compensation program and whether this structure provides appropriate incentives to act in the best interests of each fund. Additionally, the Board considered the portfolio managers' investments, if any, in the funds that they manage. The Board also considered the steps Fidelity had taken to ensure the continued provision of high quality services to the Fidelity funds during the COVID-19 pandemic, including the expansion of staff in client facing positions to maintain service levels in periods of high volumes and volatility.
Resources Dedicated to Investment Management and Support Services. The Board and the Fund Oversight and Research Committees reviewed the general qualifications and capabilities of Fidelity's investment staff, including its size, education, experience, and resources, as well as Fidelity's approach to recruiting, training, managing, and compensating investment personnel. The Board noted the resources devoted to expansion of Fidelity's global investment organization, and that Fidelity's analysts have extensive resources, tools, and capabilities that allow them to conduct sophisticated quantitative and fundamental analysis, as well as credit analysis of issuers, counterparties, and guarantors. Further, the Board considered that Fidelity's investment professionals have sufficient access to global information and data so as to provide competitive investment results over time, and that those professionals also have access to sophisticated tools that permit them to assess portfolio construction and risk and performance attribution characteristics continuously, as well as to transmit new information and research conclusions rapidly around the world. Additionally, in its deliberations, the Board considered Fidelity's trading, risk management, compliance, and technology and operations capabilities and resources, which are integral parts of the investment management process.
Shareholder and Administrative Services. The Board considered (i) the nature, extent, quality, and cost of advisory, administrative, and shareholder services performed by the Investment Advisers and their affiliates under the Advisory Contracts and under separate agreements covering transfer agency, pricing and bookkeeping, and securities lending services for each fund; (ii) the nature and extent of the supervision of third party service providers, principally custodians, subcustodians, and pricing vendors; and (iii) the resources devoted to, and the record of compliance with, each fund's compliance policies and procedures. The Board also reviewed the allocation of fund brokerage, including allocations to brokers affiliated with the Investment Advisers, the use of brokerage commissions to pay fund expenses, and the use of "soft" commission dollars to pay for research services.
The Board noted that the growth of fund assets over time across the complex allows Fidelity to reinvest in the development of services designed to enhance the value and convenience of the Fidelity funds as investment vehicles. These services include 24-hour access to account information and market information over the Internet and through telephone representatives, investor education materials, and asset allocation tools. The Board also considered that it reviews customer service metrics such as telephone response times, continuity of services on the website and metrics addressing services at Fidelity Investor Centers.
Investment in a Large Fund Family. The Board considered the benefits to shareholders of investing in a Fidelity fund, including the benefits of investing in a fund that is part of a large family of funds offering a variety of investment disciplines and providing a large variety of mutual fund investor services. The Board noted that Fidelity had taken, or had made recommendations that resulted in the Fidelity funds taking, a number of actions over the previous year that benefited particular funds, including: (i) continuing to dedicate additional resources to Fidelity's investment research process, which includes meetings with management of issuers of securities in which the funds invest; (ii) continuing efforts to enhance Fidelity's global research capabilities; (iii) launching new funds and ETFs with innovative structures, strategies and pricing and making other enhancements to meet client needs; (iv) launching new share classes of existing funds; (v) eliminating purchase minimums and broadening eligibility requirements for certain funds and share classes; (vi) reducing management fees and total expenses for certain target date funds and classes and index funds; (vii) lowering expenses for certain existing funds and classes by implementing or lowering expense caps; (viii) rationalizing product lines and gaining increased efficiencies from fund mergers and liquidations; (ix) continuing to develop, acquire and implement systems and technology to improve services to the funds and shareholders, strengthen information security, and increase efficiency; and (x) continuing to implement enhancements to further strengthen Fidelity's product line to increase investors' probability of success in achieving their investment goals, including retirement income goals.
Investment Performance. The Board considered whether each fund has operated in accordance with its investment objective, as well as its record of compliance with its investment restrictions and its performance history. The Board noted that Defense and Aerospace Portfolio had a portfolio manager change in December 2021. The Board will continue to monitor closely the fund's performance, taking into account the portfolio manager change.
The Board took into account discussions that occur at Board meetings throughout the year with representatives of the Investment Advisers about fund investment performance. In this regard the Board noted that as part of regularly scheduled fund reviews and other reports to the Board on fund performance, the Board considers annualized return information for each fund for different time periods, measured against an appropriate securities market index (benchmark index). The Board also reviews and considers information about performance attribution. In its evaluation of fund investment performance, the Board gave particular attention to information indicating changes in performance of certain Fidelity funds for specific time periods and discussed with the Investment Advisers the reasons for any overperformance or underperformance.
In addition to reviewing absolute and relative fund performance, the Independent Trustees periodically consider the appropriateness of fund performance metrics in evaluating the results achieved. In general, the Independent Trustees believe that fund performance should be evaluated based on net performance (after fees and expenses) of the fund compared to appropriate benchmark indices, over appropriate time periods that may include full market cycles, taking into account relevant factors including the following: general market conditions; issuer-specific information; and fund cash flows and other factors.
The Independent Trustees recognize that shareholders evaluate performance on a net basis over their own holding periods, for which one-, three-, and five-year periods are often used as a proxy. For this reason, the performance information reviewed by the Board also included net cumulative total return information for each fund and an appropriate benchmark index for the most recent one-, three-, and five-year periods ended September 30, 2021, as shown below.
Defense and Aerospace Portfolio
The Board considered the fund's underperformance for different time periods ended September 30, 2021 and for different time periods ended December 31, 2021 (which periods are not reflected in the charts above). The Board's discussions with FMR regarding underperformance cover topics including, but not limited to: the longer-term track record of a fund's portfolio manager(s); broader trends in the market that may adversely impact a fund's performance; and attribution reports on contributors to the fund's underperformance. The Board engages with FMR on steps that might be taken to address a fund's underperformance.
Industrials Portfolio
The Board considered the fund's underperformance for different time periods ended September 30, 2021 and for different time periods ended December 31, 2021 (which periods are not reflected in the charts above). The Board noted that the fund's underperformance has continued since the Board approved the management contract in January 2020 and May 2021. The Board's discussions with FMR regarding underperformance cover topics including, but not limited to: the longer-term track record of a fund's portfolio manager(s); broader trends in the market that may adversely impact a fund's performance; and attribution reports on contributors to the fund's underperformance. The Board engages with FMR on steps that might be taken to address a fund's underperformance. For a fund with underperformance over longer periods of time, the Board typically monitors the fund's performance more closely.
Transportation Portfolio
The Board considered the fund's underperformance for different time periods ended September 30, 2021 (which periods are reflected in the charts above). The Board's discussions with FMR regarding underperformance cover topics including, but not limited to: the longer-term track record of a fund's portfolio manager(s); broader trends in the market that may adversely impact a fund's performance; attribution reports on contributors to the fund's underperformance; and the applicable portfolio manager's explanation of his or her underperformance. The Board engages with FMR on steps that might be taken to address a fund's underperformance
Based on its review, the Board concluded that the nature, extent, and quality of services provided to each fund under the Advisory Contracts should continue to benefit the shareholders of each fund.
Competitiveness of Management Fee and Total Expense Ratio. The Board considered each fund's management fee and total expense ratio compared to "mapped groups" of competitive funds and classes created for the purpose of facilitating the Trustees' competitive analysis of management fees and total expenses. Fidelity creates "mapped groups" by combining similar Lipper investment objective categories that have comparable investment mandates. For this purpose, all sector focused equity funds are grouped in the same mapped group. Combining Lipper investment objective categories aids the Board's management fee and total expense ratio comparisons by broadening the competitive group used for comparison.
Management Fee. The Board considered two proprietary management fee comparisons for the 12-month periods ended September 30 (June 30 for periods ended 2019 and 2018 and December 31 for periods prior to 2018) shown in basis points (BP) in the charts below. The group of Lipper funds used by the Board for management fee comparisons is referred to below as the "Total Mapped Group." The Total Mapped Group comparison focuses on a fund's standing in terms of gross management fees before expense reimbursements or caps relative to the total universe of funds with comparable investment mandates (i.e., sector equities), regardless of whether their management fee structures also are comparable. Funds with comparable management fee structures have similar management fee contractual arrangements (e.g., flat rate charged for advisory services, all-inclusive fee rate, etc.). "TMG %" represents the percentage of funds in the Total Mapped Group that had management fees that were lower than a fund's. For example, a hypothetical TMG % of 20% would mean that 80% of the funds in the Total Mapped Group had higher, and 20% had lower, management fees than a fund. The funds' actual TMG %s and the number of funds in the Total Mapped Group are in the charts below. The "Asset-Sized Peer Group" (ASPG) comparison focuses on a fund's standing relative to a subset of non-Fidelity funds within the Total Mapped Group that are similar in size and management fee structure. For example, if a fund is in the first quartile of the ASPG, the fund's management fee ranks in the least expensive or lowest 25% of funds in the ASPG. The ASPG represents at least 15% of the funds in the Total Mapped Group with comparable asset size and management fee structures, subject to a minimum of 50 funds (or all funds in the Total Mapped Group if fewer than 50). Additional information, such as the ASPG quartile in which a fund's management fee rate ranked, is also included in the charts and was considered by the Board.
Defense and Aerospace Portfolio
Industrials Portfolio
Transportation Portfolio
The Board noted that each fund's management fee rate ranked below the median of its Total Mapped Group and below the median of its ASPG for the 12-month period ended September 30, 2021.
The Board also considered that, for funds subject to the group fee, FMR agreed to voluntarily waive fees over a specified period of time in amounts designed to account for assets converted from certain funds to certain collective investment trusts.
Based on its review, the Board concluded that each fund's management fee is fair and reasonable in light of the services that the fund receives and the other factors considered.
Total Expense Ratio. In its review of each fund's total expense ratio, the Board considered the fund's management fee rate as well as other fund expenses, such as transfer agent fees, pricing and bookkeeping fees, and custodial, legal, and audit fees. The Board also noted that Fidelity may agree to waive fees or reimburse expenses from time to time, and the extent to which, if any, it has done so for each fund. Each fund is compared to those funds and classes in the Total Mapped Group (used by the Board for management fee comparisons) that have a similar sales load structure. The Board also considered a total expense ASPG comparison for each fund, which focuses on the total expenses of each fund relative to a subset of non-Fidelity funds within the total expense similar sales load structure group. The total expense ASPG is limited to 15 larger and 15 smaller classes in fund average assets for a total of 30 classes, where possible. The total expense ASPG comparison excludes performance adjustments and fund-paid 12b-1 fees to eliminate variability in fee structures.
The Board noted that each fund's total net expense ratio ranked below the similar sales load structure group competitive median and below the ASPG competitive median for the 12-month period ended September 30, 2021.
Fees Charged to Other Fidelity Clients. The Board also considered Fidelity fee structures and other information with respect to clients of Fidelity, such as other funds advised or subadvised by Fidelity, pension plan clients, and other institutional clients with similar mandates. The Board noted that a joint ad hoc committee created by it and the boards of other Fidelity funds periodically reviews and compares Fidelity's institutional investment advisory business with its business of providing services to the Fidelity funds and also noted the most recent findings of the committee. The Board noted that the committee's review included a consideration of the differences in services provided, fees charged, and costs incurred, as well as competition in the markets serving the different categories of clients.
Based on its review of total expense ratios and fees charged to other Fidelity clients, the Board concluded that each fund's total expense ratio was reasonable in light of the services that the fund and its shareholders receive and the other factors considered.
Costs of the Services and Profitability. The Board considered the revenues earned and the expenses incurred by Fidelity in conducting the business of developing, marketing, distributing, managing, administering and servicing each fund and servicing each fund's shareholders. The Board also considered the level of Fidelity's profits in respect of all the Fidelity funds.
On an annual basis, Fidelity presents to the Board information about the profitability of its relationships with each fund. Fidelity calculates profitability information for each fund, as well as aggregate profitability information for groups of Fidelity funds and all Fidelity funds, using a series of detailed revenue and cost allocation methodologies which originate with the books and records of Fidelity on which Fidelity's audited financial statements are based. The Audit Committee of the Board reviews any significant changes from the prior year's methodologies and the full Board approves such changes.
A public accounting firm has been engaged annually by the Board as part of the Board's assessment of Fidelity's profitability analysis. The engagement includes the review and assessment of the methodologies used by Fidelity in determining the revenues and expenses attributable to Fidelity's mutual fund business, and completion of agreed-upon procedures in respect of the mathematical accuracy of certain fund profitability information and its conformity to established allocation methodologies. After considering the reports issued under the engagement and information provided by Fidelity, the Board concluded that while other allocation methods may also be reasonable, Fidelity's profitability methodologies are reasonable in all material respects.
The Board also reviewed Fidelity's non-fund businesses and potential indirect benefits such businesses may have received as a result of their association with Fidelity's mutual fund business (i.e., fall-out benefits) as well as cases where Fidelity's affiliates may benefit from the funds' business. The Board considered areas where potential indirect benefits to the Fidelity funds from their relationships with Fidelity may exist. The Board's consideration of these matters was informed by the findings of a joint ad hoc committee created by it and the boards of other Fidelity funds to evaluate potential fall-out benefits.
The Board considered the costs of the services provided by and the profits realized by Fidelity in connection with the operation of each fund and was satisfied that the profitability was not excessive.
Economies of Scale. The Board considered whether there have been economies of scale in respect of the management of the Fidelity funds, whether the Fidelity funds (including each fund) have appropriately benefited from any such economies of scale, and whether there is potential for realization of any further economies of scale. The Board considered the extent to which each fund will benefit from economies of scale as assets grow through increased services to the fund, through waivers or reimbursements, or through fee or expense ratio reductions. The Board also noted that a committee (the Economies of Scale Committee) created by it and the boards of other Fidelity funds periodically analyzes whether Fidelity attains economies of scale in respect of the management and servicing of the Fidelity funds, whether the Fidelity funds have appropriately benefited from such economies of scale, and whether there is potential for realization of any further economies of scale.
The Board recognized that each fund's management contract incorporates a "group fee" structure, which provides for lower group fee rates as total "group assets" increase, and for higher group fee rates as total "group assets" decrease ("group assets" as defined in the management contracts). FMR calculates the group fee rates based on a tiered asset "breakpoint" schedule that varies based on asset class. The Board considered that the group fee is designed to deliver the benefits of economies of scale to fund shareholders when total Fidelity fund assets increase, even if assets of any particular fund are unchanged or have declined, because some portion of Fidelity's costs are attributable to services provided to all Fidelity funds, and all funds benefit if those costs can be allocated among more assets. The Board further considered that Fidelity agreed to impose a temporary fee waiver in the form of additional breakpoints to the current breakpoint schedule. The Board concluded that, given the group fee structure, fund shareholders will benefit from lower management fees as "group assets" increase at the fund complex level, regardless of whether Fidelity achieves any such economies of scale.
The Board concluded, taking into account the analysis of the Economies of Scale Committee, that economies of scale, if any, are being appropriately shared between fund shareholders and Fidelity.
Additional Information Requested by the Board. In order to develop fully the factual basis for consideration of the Fidelity funds' advisory contracts, the Board requested and received additional information on certain topics, including: (i) fund flow and performance trends, in particular the underperformance of certain funds and strategies, and Fidelity's long-term strategies for certain funds, including any consideration of fund liquidations or mergers; (ii) the operation of performance fees, competitor use of performance fees, and consideration of the expansion of performance fees to additional funds; (iii) Fidelity's pricing philosophy compared to competitors; (iv) fund profitability methodology and data; (v) evaluation of competitive fund data and peer group classifications and fee and expense comparisons; (vi) the management fee and expense structures for different funds and classes and information about the differences between various fee and expense structures; (vii) group fee breakpoints and related voluntary fee waivers; and (viii) information regarding other accounts managed by Fidelity and the funds' sub-advisory arrangements.
Based on its evaluation of all of the conclusions noted above, and after considering all factors it believed relevant, the Board concluded that the advisory fee arrangements are fair and reasonable and that each fund's Advisory Contracts should be renewed.
1.813660.117
SELCI-SANN-1022
Fidelity® Select Portfolios®
Health Care Sector
Biotechnology Portfolio
Health Care Portfolio
Health Care Services Portfolio
Medical Technology and Devices Portfolio
Pharmaceuticals Portfolio
Semi-Annual Report
August 31, 2022
Contents
To view a fund's proxy voting guidelines and proxy voting record for the 12-month period ended June 30, visit http://www.fidelity.com/proxyvotingresults or visit the Securities and Exchange Commission's (SEC) web site at http://www.sec.gov.
You may also call 1-800-544-8544 to request a free copy of the proxy voting guidelines.
Standard & Poor's, S&P and S&P 500 are registered service marks of The McGraw-Hill Companies, Inc. and have been licensed for use by Fidelity Distributors Corporation.
Other third-party marks appearing herein are the property of their respective owners.
All other marks appearing herein are registered or unregistered trademarks or service marks of FMR LLC or an affiliated company. © 2022 FMR LLC. All rights reserved.
This report and the financial statements contained herein are submitted for the general information of the shareholders of the Fund. This report is not authorized for distribution to prospective investors in the Fund unless preceded or accompanied by an effective prospectus.
A fund files its complete schedule of portfolio holdings with the SEC for the first and third quarters of each fiscal year on Form N-PORT. Forms N-PORT are available on the SEC's web site at http://www.sec.gov. A fund's Forms N-PORT may be reviewed and copied at the SEC's Public Reference Room in Washington, DC. Information regarding the operation of the SEC's Public Reference Room may be obtained by calling 1-800-SEC-0330.
For a complete list of a fund's portfolio holdings, view the most recent holdings listing, semiannual report, or annual report on Fidelity's web site at http://www.fidelity.com, http://www.institutional.fidelity.com, or http://www.401k.com, as applicable.
NOT FDIC INSURED •MAY LOSE VALUE •NO BANK GUARANTEE
Neither the Fund nor Fidelity Distributors Corporation is a bank.
Top Holdings (% of Fund's net assets) |
| |
| AbbVie, Inc. | 9.5 | |
| Vertex Pharmaceuticals, Inc. | 5.7 | |
| Alnylam Pharmaceuticals, Inc. | 4.8 | |
| Argenx SE ADR | 3.3 | |
| Krystal Biotech, Inc. | 2.8 | |
| Biogen, Inc. | 2.6 | |
| Seagen, Inc. | 2.5 | |
| Cytokinetics, Inc. | 2.4 | |
| Blueprint Medicines Corp. | 2.3 | |
| PTC Therapeutics, Inc. | 2.2 | |
| | 38.1 | |
| |
| Industries (% of Fund's net assets) |
| |
| Biotechnology | 91.1 | |
| Pharmaceuticals | 7.3 | |
| Health Care Providers & Services | 0.4 | |
| Health Care Technology | 0.2 | |
| Life Sciences Tools & Services | 0.2 | |
| Health Care Equipment & Supplies | 0.1 | |
| Chemicals | 0.0 | |
| Food & Staples Retailing | 0.0 | |
| |
Percentages shown as 0.0% may reflect amounts less than 0.05%.
Percentages shown as 0.0% may reflect amounts less than 0.05%.
Geographic Diversification (% of Fund's net assets) |
|
* Includes Short-Term investments and Net Other Assets (Liabilities). Percentages are based on country or territory of incorporation and are adjusted for the effect of futures contracts, if applicable. |
| |
Biotechnology Portfolio
| Common Stocks - 97.8% |
| | | Shares | Value ($) |
| Biotechnology - 89.8% | | | |
| Biotechnology - 89.8% | | | |
| 2seventy bio, Inc. (a) | | 103,752 | 1,528,267 |
| 4D Molecular Therapeutics, Inc. (a)(b) | | 197,868 | 1,555,242 |
| AbbVie, Inc. | | 3,672,903 | 493,858,537 |
| Adagio Therapeutics, Inc. | | 326,216 | 1,487,545 |
| ADC Therapeutics SA (a)(b) | | 755,238 | 5,150,723 |
| Adicet Bio, Inc. (a) | | 807,861 | 11,439,312 |
| Adverum Biotechnologies, Inc. (a)(b)(c) | | 10,597,366 | 12,292,945 |
| Aerovate Therapeutics, Inc. (a)(b) | | 201,551 | 3,996,756 |
| Agios Pharmaceuticals, Inc. (a) | | 12,371 | 315,461 |
| Akouos, Inc. (a)(b) | | 1,103,186 | 3,695,673 |
| Aldeyra Therapeutics, Inc. (a)(b) | | 1,045,737 | 7,361,988 |
| Alector, Inc. (a) | | 914,318 | 9,463,191 |
| Alkermes PLC (a) | | 893,536 | 21,149,997 |
| Allena Pharmaceuticals, Inc. (a)(b) | | 106,183 | 11,160 |
| Allogene Therapeutics, Inc. (a)(b) | | 1,318,870 | 18,081,708 |
| Allovir, Inc. (a)(b) | | 1,067,983 | 8,020,552 |
| Alnylam Pharmaceuticals, Inc. (a) | | 1,215,739 | 251,256,779 |
| Altimmune, Inc. (a) | | 40,469 | 893,556 |
| ALX Oncology Holdings, Inc. (a) | | 478,804 | 6,224,452 |
| Ambrx Biopharma, Inc. ADR (a) | | 1,361,508 | 2,246,488 |
| Amgen, Inc. | | 5,590 | 1,343,277 |
| Amicus Therapeutics, Inc. (a) | | 2,265,461 | 25,441,127 |
| AnaptysBio, Inc. (a)(b) | | 82,196 | 1,908,591 |
| Apellis Pharmaceuticals, Inc. (a) | | 1,363,284 | 82,492,315 |
| Applied Therapeutics, Inc. (a)(c) | | 3,331,325 | 4,563,915 |
| Arcellx, Inc. | | 605,400 | 10,879,038 |
| Arcturus Therapeutics Holdings, Inc. (a)(b) | | 920,424 | 12,922,753 |
| Arcus Biosciences, Inc. (a)(b) | | 3,193,396 | 76,896,976 |
| Arcutis Biotherapeutics, Inc. (a) | | 948,574 | 25,564,069 |
| Argenx SE ADR (a) | | 456,947 | 172,666,563 |
| Arrowhead Pharmaceuticals, Inc. (a) | | 2,336,532 | 92,783,686 |
| Ascendis Pharma A/S sponsored ADR (a)(b) | | 659,409 | 59,063,264 |
| Atara Biotherapeutics, Inc. (a) | | 82,240 | 329,782 |
| aTyr Pharma, Inc. (a) | | 1,146,952 | 3,922,576 |
| Aura Biosciences, Inc. (b) | | 603,459 | 8,062,212 |
| Aurinia Pharmaceuticals, Inc. (a) | | 255,886 | 1,883,321 |
| Autolus Therapeutics PLC ADR (a)(b) | | 380,185 | 1,254,611 |
| Avidity Biosciences, Inc. (a)(b) | | 279,484 | 5,483,476 |
| Axcella Health, Inc. (a)(b) | | 1,051,598 | 2,586,931 |
| Beam Therapeutics, Inc. (a)(b) | | 220,992 | 12,066,163 |
| BELLUS Health, Inc. (a) | | 2,726,464 | 31,081,690 |
| Bicycle Therapeutics PLC ADR (a)(b) | | 449,847 | 11,898,453 |
| BioAtla, Inc. (a)(b) | | 258,572 | 2,252,162 |
| BioCryst Pharmaceuticals, Inc. (a)(b) | | 4,397,219 | 61,121,344 |
| Biogen, Inc. (a) | | 683,036 | 133,451,574 |
| BioInvent International AB (a) | | 929,048 | 4,043,886 |
| BioMarin Pharmaceutical, Inc. (a) | | 459,787 | 41,013,000 |
| Biomea Fusion, Inc. (a)(b) | | 650,324 | 7,478,726 |
| BioNTech SE ADR | | 195,228 | 28,237,778 |
| BioXcel Therapeutics, Inc. (a)(b) | | 351,727 | 4,811,625 |
| Blueprint Medicines Corp. (a) | | 1,670,708 | 122,329,240 |
| BridgeBio Pharma, Inc. (a)(b) | | 893,742 | 9,384,291 |
| Candel Therapeutics, Inc. (a)(b) | | 899,399 | 3,120,915 |
| Celldex Therapeutics, Inc. (a) | | 849,200 | 25,815,680 |
| Centessa Pharmaceuticals PLC ADR (a)(b) | | 132,047 | 574,404 |
| Century Therapeutics, Inc. (a)(b) | | 834,618 | 8,780,181 |
| Cerevel Therapeutics Holdings (a)(b) | | 1,100,980 | 32,038,518 |
| Chinook Therapeutics, Inc. (a) | | 352,081 | 7,323,285 |
| Chinook Therapeutics, Inc. rights (a)(d) | | 115,821 | 1 |
| Codiak Biosciences, Inc. (a)(b) | | 402,539 | 865,459 |
| Cogent Biosciences, Inc. (a) | | 1,253,967 | 20,677,916 |
| Compass Therapeutics, Inc. | | 2,750,000 | 7,562,500 |
| ContraFect Corp. (a)(b) | | 374,609 | 99,646 |
| Crinetics Pharmaceuticals, Inc. (a) | | 1,815,587 | 34,278,283 |
| CRISPR Therapeutics AG (a)(b) | | 305,022 | 19,853,882 |
| Cullinan Oncology, Inc. (a) | | 124,940 | 1,684,191 |
| Cyclerion Therapeutics, Inc. (a) | | 837,285 | 703,319 |
| Cyclerion Therapeutics, Inc. (a)(e) | | 94,809 | 79,640 |
| Cyteir Therapeutics, Inc. (a) | | 484,023 | 1,045,490 |
| Cytokinetics, Inc. (a)(b) | | 2,338,471 | 123,845,424 |
| Day One Biopharmaceuticals, Inc. (a)(b) | | 1,496,135 | 35,144,211 |
| Denali Therapeutics, Inc. (a) | | 605,951 | 16,766,664 |
| Design Therapeutics, Inc. (a)(b) | | 1,024,935 | 20,765,183 |
| Dyne Therapeutics, Inc. (a) | | 72,200 | 707,560 |
| Enanta Pharmaceuticals, Inc. (a) | | 349,846 | 21,298,624 |
| Entrada Therapeutics, Inc. (b) | | 885,461 | 11,183,372 |
| EQRx, Inc. (a) | | 507,567 | 2,482,003 |
| EQRx, Inc.: | | | |
| rights (a)(d) | | 116,649 | 390,774 |
| rights (a)(d) | | 49,993 | 132,981 |
| Erasca, Inc. (a) | | 810,023 | 7,306,407 |
| Evelo Biosciences, Inc. (a)(b) | | 1,098,999 | 2,406,808 |
| Exelixis, Inc. (a) | | 2,835,934 | 50,309,469 |
| Fate Therapeutics, Inc. (a)(b) | | 690,487 | 18,049,330 |
| Foghorn Therapeutics, Inc. (a)(b) | | 544,119 | 5,408,543 |
| Forma Therapeutics Holdings, Inc. (a) | | 20,460 | 274,164 |
| Fusion Pharmaceuticals, Inc. (a) | | 1,491,202 | 3,295,556 |
| G1 Therapeutics, Inc. (a)(b) | | 532,104 | 7,720,829 |
| Galapagos NV sponsored ADR (a) | | 53,743 | 2,690,375 |
| Generation Bio Co. (a) | | 137,100 | 701,952 |
| Geron Corp. (a)(b) | | 189,606 | 500,560 |
| Geron Corp. warrants 12/31/25 (a) | | 2,100,000 | 1,708,552 |
| Gilead Sciences, Inc. | | 1,204 | 76,418 |
| Gossamer Bio, Inc. (a) | | 97,759 | 1,363,738 |
| Graphite Bio, Inc. (a) | | 1,312,653 | 4,344,881 |
| Gritstone Bio, Inc. (a)(b) | | 469,480 | 1,544,589 |
| Halozyme Therapeutics, Inc. (a) | | 616,300 | 25,101,899 |
| Homology Medicines, Inc. (a) | | 600,351 | 1,404,821 |
| Hookipa Pharma, Inc. (a)(b) | | 1,610,100 | 2,399,049 |
| Horizon Therapeutics PLC (a) | | 1,387,953 | 82,180,697 |
| Icosavax, Inc. (a) | | 490,857 | 2,316,845 |
| Ideaya Biosciences, Inc. (a)(b) | | 467,904 | 4,599,496 |
| Idorsia Ltd. (a)(b) | | 1,371,271 | 21,519,486 |
| Imago BioSciences, Inc. (a) | | 284,600 | 4,135,238 |
| Immuneering Corp. (a)(b) | | 222,971 | 1,244,178 |
| Immunic, Inc. (a)(b) | | 509,372 | 2,266,705 |
| Immunocore Holdings PLC ADR (a) | | 324,318 | 17,127,234 |
| ImmunoGen, Inc. (a) | | 804,623 | 4,674,860 |
| Incyte Corp. (a) | | 327,400 | 23,058,782 |
| Inhibikase Therapeutics, Inc. (a) | | 433,300 | 415,795 |
| Inhibrx, Inc. (a)(b) | | 198,726 | 3,525,399 |
| Inozyme Pharma, Inc. (a) | | 609,380 | 1,828,140 |
| Insmed, Inc. (a) | | 266,820 | 6,569,108 |
| Instil Bio, Inc. (a) | | 1,445,074 | 7,514,385 |
| Intellia Therapeutics, Inc. (a) | | 885,001 | 53,153,160 |
| Ionis Pharmaceuticals, Inc. (a) | | 1,246,677 | 53,008,706 |
| Iovance Biotherapeutics, Inc. (a) | | 58,579 | 627,967 |
| iTeos Therapeutics, Inc. (a) | | 238,000 | 5,278,840 |
| Iveric Bio, Inc. (a) | | 451,988 | 4,447,562 |
| Janux Therapeutics, Inc. (a)(b) | | 742,948 | 8,038,697 |
| Jounce Therapeutics, Inc. (a) | | 769,979 | 2,818,123 |
| Karuna Therapeutics, Inc. (a) | | 404,412 | 103,149,325 |
| Keros Therapeutics, Inc. (a) | | 378,977 | 13,404,416 |
| Kezar Life Sciences, Inc. (a)(b) | | 27,452 | 282,207 |
| Kiniksa Pharmaceuticals Ltd. (a)(b) | | 192,666 | 2,258,046 |
| Kinnate Biopharma, Inc. (a)(b) | | 1,512,823 | 21,905,677 |
| Kronos Bio, Inc. (a)(b) | | 744,460 | 2,977,840 |
| Krystal Biotech, Inc. (a)(b)(c) | | 2,105,960 | 147,648,856 |
| Kymera Therapeutics, Inc. (a)(b) | | 318,054 | 8,991,387 |
| Legend Biotech Corp. ADR (a)(b) | | 1,207,675 | 56,144,811 |
| Lyell Immunopharma, Inc. (a)(b) | | 362,253 | 2,427,095 |
| Macrogenics, Inc. (a) | | 223,616 | 887,756 |
| Madrigal Pharmaceuticals, Inc. (a)(b) | | 153,140 | 11,044,457 |
| MannKind Corp. (a)(b) | | 6,582,901 | 24,027,589 |
| Merus BV (a)(b) | | 630,486 | 14,929,908 |
| Minerva Neurosciences, Inc. (a)(b) | | 28,272 | 318,908 |
| Mirati Therapeutics, Inc. (a) | | 659,256 | 53,419,514 |
| Moderna, Inc. (a) | | 292,793 | 38,727,730 |
| Monte Rosa Therapeutics, Inc. (a)(b) | | 1,257,805 | 9,961,816 |
| Morphic Holding, Inc. (a)(b) | | 805,337 | 22,162,874 |
| Morphosys AG sponsored ADR (a) | | 131,228 | 574,779 |
| Natera, Inc. (a) | | 387,433 | 19,084,950 |
| Neximmune, Inc. (a)(b) | | 525,000 | 603,750 |
| Nkarta, Inc. (a)(b) | | 769,266 | 11,069,738 |
| Nurix Therapeutics, Inc. (a)(b) | | 1,726,213 | 27,153,330 |
| Nuvalent, Inc. Class A (a)(b) | | 204,174 | 3,446,457 |
| Omega Therapeutics, Inc. (a) | | 915,541 | 4,092,468 |
| Oragenics, Inc. (a) | | 155,806 | 48,658 |
| ORIC Pharmaceuticals, Inc. (a) | | 318,846 | 1,103,207 |
| PMV Pharmaceuticals, Inc. (a)(b) | | 772,700 | 10,755,984 |
| Poseida Therapeutics, Inc. (a) | | 570,083 | 1,886,975 |
| Prelude Therapeutics, Inc. (a) | | 359,156 | 2,585,923 |
| Prometheus Biosciences, Inc. (a)(b) | | 391,755 | 20,492,704 |
| Protagonist Therapeutics, Inc. (a) | | 784,378 | 6,839,776 |
| Prothena Corp. PLC (a) | | 834,489 | 23,006,862 |
| PTC Therapeutics, Inc. (a) | | 2,267,944 | 113,261,123 |
| Rallybio Corp. (a)(b) | | 1,199,143 | 13,250,530 |
| RAPT Therapeutics, Inc. (a)(b) | | 1,024,677 | 27,369,123 |
| Recursion Pharmaceuticals, Inc. (a)(b) | | 89,200 | 937,492 |
| Regeneron Pharmaceuticals, Inc. (a) | | 102,025 | 59,282,647 |
| Relay Therapeutics, Inc. (a)(b) | | 928,789 | 21,334,283 |
| Repare Therapeutics, Inc. (a)(b) | | 174,960 | 2,085,523 |
| Replimune Group, Inc. (a)(b) | | 1,080,217 | 20,588,936 |
| Revolution Medicines, Inc. (a)(b) | | 579,072 | 12,062,070 |
| Rhythm Pharmaceuticals, Inc. (a)(b) | | 1,368,703 | 30,932,688 |
| Rocket Pharmaceuticals, Inc. (a)(b) | | 223,736 | 3,447,772 |
| Rubius Therapeutics, Inc. (a)(b) | | 595,229 | 416,660 |
| Sage Therapeutics, Inc. (a) | | 699,553 | 26,345,166 |
| Sana Biotechnology, Inc. (a)(b) | | 27,690 | 188,569 |
| Sarepta Therapeutics, Inc. (a) | | 590,804 | 64,622,142 |
| Scholar Rock Holding Corp. (a)(b) | | 1,693,925 | 14,127,335 |
| Scholar Rock Holding Corp. warrants 12/31/25 (a)(e) | | 17,850 | 63,999 |
| Seagen, Inc. (a) | | 830,539 | 128,143,862 |
| Selecta Biosciences, Inc. (a)(b) | | 1,032,715 | 1,941,504 |
| Sensorion SA (a)(b) | | 2,378,022 | 1,173,388 |
| Seres Therapeutics, Inc. (a)(b) | | 854,347 | 4,391,344 |
| Shattuck Labs, Inc. (a) | | 110,936 | 360,542 |
| Silverback Therapeutics, Inc. (a) | | 285,209 | 1,551,537 |
| Springworks Therapeutics, Inc. (a)(b) | | 443,611 | 12,319,077 |
| Stoke Therapeutics, Inc. (a) | | 526,536 | 7,929,632 |
| Surface Oncology, Inc. (a) | | 144,645 | 196,717 |
| Surrozen, Inc. (a)(b) | | 252,900 | 649,953 |
| Sutro Biopharma, Inc. (a) | | 663,300 | 3,754,278 |
| Syndax Pharmaceuticals, Inc. (a) | | 124,200 | 2,932,362 |
| Syros Pharmaceuticals, Inc. (a) | | 1,045,057 | 836,673 |
| Syros Pharmaceuticals, Inc. warrants 10/10/22 (a) | | 21,625 | 0 |
| Tango Therapeutics, Inc. (a) | | 927,488 | 3,802,701 |
| Taysha Gene Therapies, Inc. (a)(b) | | 882,847 | 2,789,797 |
| Tenaya Therapeutics, Inc. (a) | | 1,263,918 | 5,548,600 |
| TG Therapeutics, Inc. (a) | | 2,066,920 | 14,737,140 |
| Travere Therapeutics, Inc. (a) | | 393,328 | 10,525,457 |
| Twist Bioscience Corp. (a)(b) | | 825,632 | 33,124,356 |
| Tyra Biosciences, Inc. (b) | | 472,301 | 3,121,910 |
| Ultragenyx Pharmaceutical, Inc. (a) | | 978,351 | 46,657,559 |
| uniQure B.V. (a) | | 255,608 | 4,994,580 |
| United Therapeutics Corp. (a) | | 409,109 | 92,712,282 |
| Vaxcyte, Inc. (a) | | 580,989 | 15,198,672 |
| Vera Therapeutics, Inc. (a) | | 779,768 | 16,944,359 |
| Vertex Pharmaceuticals, Inc. (a) | | 1,063,775 | 299,729,244 |
| Verve Therapeutics, Inc. (a)(b) | | 549,067 | 21,062,210 |
| Vigil Neuroscience, Inc. | | 4,075 | 34,678 |
| Vor Biopharma, Inc. (a)(b) | | 696,659 | 3,573,861 |
| Werewolf Therapeutics, Inc. (a)(b) | | 336,930 | 1,704,866 |
| X4 Pharmaceuticals, Inc. warrants 4/12/24 (a) | | 450,000 | 7 |
| Xencor, Inc. (a) | | 250,843 | 6,619,747 |
| Xenon Pharmaceuticals, Inc. (a) | | 1,076,233 | 41,768,603 |
| Xilio Therapeutics, Inc. (b) | | 612,462 | 1,371,915 |
| Y-mAbs Therapeutics, Inc. (a)(b) | | 1,740,751 | 27,991,276 |
| Yumanity Therapeutics, Inc. (a) | | 260,182 | 444,911 |
| Zai Lab Ltd. ADR (a) | | 35,572 | 1,643,782 |
| Zealand Pharma A/S (a) | | 361,200 | 6,452,135 |
| Zentalis Pharmaceuticals, Inc. (a) | | 638,433 | 17,116,389 |
| | | | 4,687,009,933 |
| Chemicals - 0.0% | | | |
| Specialty Chemicals - 0.0% | | | |
| Ginkgo Bioworks Holdings, Inc. Class A (a)(b) | | 358,700 | 964,903 |
| Food & Staples Retailing - 0.0% | | | |
| Drug Retail - 0.0% | | | |
| MedAvail Holdings, Inc. (a) | | 2,777 | 3,221 |
| Health Care Equipment & Supplies - 0.1% | | | |
| Health Care Equipment - 0.1% | | | |
| Alpha Tau Medical Ltd. Class A (a)(b) | | 308,578 | 2,428,509 |
| Novocure Ltd. (a) | | 11,113 | 912,711 |
| | | | 3,341,220 |
| Health Care Supplies - 0.0% | | | |
| Pulmonx Corp. (a)(b) | | 8,300 | 152,471 |
TOTAL HEALTH CARE EQUIPMENT & SUPPLIES | | | 3,493,691 |
| Health Care Providers & Services - 0.3% | | | |
| Health Care Services - 0.3% | | | |
| 23andMe Holding Co. Class B (f) | | 3,206,519 | 10,805,969 |
| Guardant Health, Inc. (a) | | 82,500 | 4,129,950 |
| Precipio, Inc. (a)(b) | | 525 | 620 |
| | | | 14,936,539 |
| Health Care Technology - 0.2% | | | |
| Health Care Technology - 0.2% | | | |
| Schrodinger, Inc. (a) | | 387,827 | 10,641,973 |
| Life Sciences Tools & Services - 0.2% | | | |
| Life Sciences Tools & Services - 0.2% | | | |
| 10X Genomics, Inc. (a) | | 15,719 | 518,570 |
| Absci Corp. (a)(b) | | 997,900 | 3,362,923 |
| Evotec OAI AG (a) | | 153,400 | 3,382,256 |
| Olink Holding AB ADR (a) | | 57,100 | 864,494 |
| Pacific Biosciences of California, Inc. (a)(b) | | 23,312 | 136,608 |
| Quanterix Corp. (a) | | 256,200 | 2,395,470 |
| Seer, Inc. (a) | | 304,058 | 3,070,986 |
| | | | 13,731,307 |
| Pharmaceuticals - 7.2% | | | |
| Pharmaceuticals - 7.2% | | | |
| Aclaris Therapeutics, Inc. (a) | | 435,589 | 6,930,221 |
| Adimab LLC (a)(d)(e)(g) | | 1,954,526 | 84,762,124 |
| Afferent Pharmaceuticals, Inc. rights 12/31/24 (a)(d) | | 8,274,568 | 8,605,551 |
| Amylyx Pharmaceuticals, Inc. (b) | | 122,300 | 3,086,852 |
| Antengene Corp. (a)(f) | | 318,671 | 168,126 |
| Aradigm Corp. (a)(d) | | 11,945 | 549 |
| Aradigm Corp. (a)(d) | | 148,009 | 6,808 |
| Arvinas Holding Co. LLC (a) | | 742,119 | 31,421,318 |
| Atea Pharmaceuticals, Inc. (a) | | 66,800 | 501,000 |
| Axsome Therapeutics, Inc. (a)(b) | | 191,902 | 12,243,348 |
| Chiasma, Inc. warrants 12/16/24 (a)(d) | | 382,683 | 4 |
| CinCor Pharma, Inc. (b) | | 390,789 | 13,196,945 |
| Corcept Therapeutics, Inc. (a) | | 102,243 | 2,639,914 |
| DICE Therapeutics, Inc. | | 294,700 | 4,626,790 |
| Edgewise Therapeutics, Inc. (a) | | 724,054 | 7,298,464 |
| Fulcrum Therapeutics, Inc. (a) | | 1,784,376 | 13,204,382 |
| GH Research PLC (a)(b) | | 1,388,224 | 21,586,883 |
| Harmony Biosciences Holdings, Inc. (a)(b) | | 247,725 | 10,877,605 |
| Ikena Oncology, Inc. (a) | | 453,147 | 2,152,448 |
| Intra-Cellular Therapies, Inc. (a) | | 312,876 | 15,725,148 |
| Kaleido Biosciences, Inc. (a) | | 84,860 | 93 |
| Longboard Pharmaceuticals, Inc. (a) | | 371,100 | 1,243,185 |
| Marinus Pharmaceuticals, Inc. (a)(b) | | 249,965 | 1,739,756 |
| NGM Biopharmaceuticals, Inc. (a) | | 183,700 | 2,592,007 |
| Nuvation Bio, Inc. (a)(b) | | 1,483,691 | 4,154,335 |
| OptiNose, Inc. (a)(b) | | 702,319 | 2,563,464 |
| Pharvaris BV (a) | | 353,507 | 3,213,379 |
| Pliant Therapeutics, Inc. (a) | | 1,434,131 | 27,650,046 |
| Rain Therapeutics, Inc. (a)(b) | | 346,004 | 2,051,804 |
| Reata Pharmaceuticals, Inc. (a)(b) | | 699,412 | 16,722,941 |
| Roivant Sciences Ltd. (a)(e) | | 2,500,000 | 8,900,000 |
| Royalty Pharma PLC | | 361,320 | 15,106,789 |
| Terns Pharmaceuticals, Inc. (a)(b) | | 101,009 | 393,935 |
| Theseus Pharmaceuticals, Inc. | | 1,645,528 | 11,222,501 |
| Trevi Therapeutics, Inc. (a)(b) | | 41,053 | 130,549 |
| Tricida, Inc. (a)(b) | | 178,300 | 2,232,316 |
| UCB SA | | 138,977 | 9,790,512 |
| Ventyx Biosciences, Inc. (b) | | 524,405 | 10,697,862 |
| Verona Pharma PLC ADR (a)(b) | | 413,400 | 4,307,628 |
| Verrica Pharmaceuticals, Inc. (a)(b) | | 1,597,876 | 6,263,674 |
| WAVE Life Sciences (a) | | 2,043,033 | 6,067,808 |
| | | | 376,079,064 |
| TOTAL COMMON STOCKS (Cost $4,349,886,543) | | | 5,106,860,631 |
| | | | |
| Convertible Preferred Stocks - 1.5% |
| | | Shares | Value ($) |
| Biotechnology - 1.3% | | | |
| Biotechnology - 1.3% | | | |
| ElevateBio LLC Series C (a)(d)(e) | | 216,600 | 990,512 |
| Korro Bio, Inc.: | | | |
| Series B1 (d)(e) | | 957,854 | 1,829,501 |
| Series B2 (d)(e) | | 899,280 | 1,717,625 |
| National Resilience, Inc. Series B (a)(d)(e) | | 732,064 | 44,458,247 |
| SalioGen Therapeutics, Inc. Series B (d)(e) | | 94,461 | 7,043,957 |
| ValenzaBio, Inc. Series A (a)(d)(e) | | 1,685,311 | 9,993,894 |
| | | | 66,033,736 |
| Health Care Providers & Services - 0.1% | | | |
| Health Care Services - 0.1% | | | |
| Scorpion Therapeutics, Inc. Series B (a)(d)(e) | | 3,099,905 | 3,874,881 |
| Pharmaceuticals - 0.1% | | | |
| Pharmaceuticals - 0.1% | | | |
| Afferent Pharmaceuticals, Inc. Series C (a)(d)(e) | | 8,274,568 | 83 |
| Aristea Therapeutics, Inc. Series B (a)(d)(e) | | 836,400 | 7,351,956 |
| | | | 7,352,039 |
| TOTAL CONVERTIBLE PREFERRED STOCKS (Cost $53,020,299) | | | 77,260,656 |
| | | | |
| Money Market Funds - 11.1% |
| | | Shares | Value ($) |
| Fidelity Cash Central Fund 2.33% (h) | | 35,533,876 | 35,540,982 |
| Fidelity Securities Lending Cash Central Fund 2.34% (h)(i) | | 541,473,101 | 541,527,248 |
| TOTAL MONEY MARKET FUNDS (Cost $577,034,589) | | | 577,068,230 |
| | | | |
| TOTAL INVESTMENT IN SECURITIES - 110.4% (Cost $4,979,941,431) | 5,761,189,517 |
NET OTHER ASSETS (LIABILITIES) - (10.4)% | (541,343,598) |
| NET ASSETS - 100.0% | 5,219,845,919 |
| | |
Legend
| (b) | Security or a portion of the security is on loan at period end. |
| (e) | Restricted securities (including private placements) - Investment in securities not registered under the Securities Act of 1933 (excluding 144A issues). At the end of the period, the value of restricted securities (excluding 144A issues) amounted to $171,066,419 or 3.3% of net assets. |
| (f) | Security exempt from registration under Rule 144A of the Securities Act of 1933. These securities may be resold in transactions exempt from registration, normally to qualified institutional buyers. At the end of the period, the value of these securities amounted to $10,974,095 or 0.2% of net assets. |
| (g) | Investment is owned by a wholly-owned subsidiary (Subsidiary) that is treated as a corporation for U.S. tax purposes. |
| (h) | Affiliated fund that is generally available only to investment companies and other accounts managed by Fidelity Investments. The rate quoted is the annualized seven-day yield of the fund at period end. A complete unaudited listing of the fund's holdings as of its most recent quarter end is available upon request. In addition, each Fidelity Central Fund's financial statements are available on the SEC's website or upon request. |
| (i) | Investment made with cash collateral received from securities on loan. |
| Additional information on each restricted holding is as follows: |
| Security | Acquisition Date | Acquisition Cost ($) |
| Adimab LLC | 9/17/14 - 6/05/15 | 31,094,459 |
| Afferent Pharmaceuticals, Inc. Series C | 7/01/15 | 0 |
| Aristea Therapeutics, Inc. Series B | 10/06/20 | 4,611,659 |
| Cyclerion Therapeutics, Inc. | 4/02/19 | 1,404,026 |
| ElevateBio LLC Series C | 3/09/21 | 908,637 |
| Korro Bio, Inc. Series B1 | 12/17/21 | 2,499,999 |
| Korro Bio, Inc. Series B2 | 12/17/21 | 2,499,998 |
| National Resilience, Inc. Series B | 12/01/20 | 9,999,994 |
| Roivant Sciences Ltd. | 5/01/21 | 25,000,000 |
| SalioGen Therapeutics, Inc. Series B | 12/10/21 | 10,000,019 |
| Scholar Rock Holding Corp. warrants 12/31/25 | 6/17/22 | 0 |
| Scorpion Therapeutics, Inc. Series B | 1/08/21 | 7,500,000 |
| ValenzaBio, Inc. Series A | 3/25/21 | 14,999,993 |
Affiliated Central Funds
Fiscal year to date information regarding the Fund's investments in Fidelity Central Funds, including the ownership percentage, is presented below.
| Affiliate | Value, beginning of period ($) | Purchases ($) | Sales Proceeds ($) | Dividend Income ($) | Realized Gain (loss) ($) | Change in Unrealized appreciation (depreciation) ($) | Value, end of period ($) | %ownership, end of period |
| Fidelity Cash Central Fund 2.33% | 42,446,755 | 638,114,195 | 645,019,968 | 250,403 | 3,258 | (3,258) | 35,540,982 | 0.1% |
| Fidelity Securities Lending Cash Central Fund 2.34% | 492,109,261 | 1,302,003,479 | 1,252,585,492 | 4,586,360 | - | - | 541,527,248 | 1.6% |
| Total | 534,556,016 | 1,940,117,674 | 1,897,605,460 | 4,836,763 | 3,258 | (3,258) | 577,068,230 | |
| | | | | | | | | |
Amounts in the income column in the above table include any capital gain distributions from underlying funds, which are presented in the corresponding line item in the Statement of Operations, if applicable.
Amount for Fidelity Securities Lending Cash Central Fund represents the income earned on investing cash collateral, less rebates paid to borrowers and any lending agent fees associated with the loan, plus any premium payments received for lending certain types of securities.
Other Affiliated Issuers
An affiliated company is a company in which the Fund has ownership of at least 5% of the voting securities. Fiscal year to date transactions with companies which are or were affiliates are as follows:
| Affiliate | Value, beginning of period ($) | Purchases ($) | Sales Proceeds ($) | Dividend Income ($) | Realized Gain (loss) ($) | Change in Unrealized appreciation (depreciation) ($) | Value, end of period ($) |
| Adverum Biotechnologies, Inc. | - | 14,311,389 | - | - | - | (2,018,444) | 12,292,945 |
| Applied Therapeutics, Inc. | 1,070,923 | 2,575,660 | 482,432 | - | (12,512,034) | 13,911,798 | 4,563,915 |
| Candel Therapeutics, Inc. | 8,593,545 | - | 5,825,729 | - | (3,665,574) | 4,018,673 | - |
| Krystal Biotech, Inc. | 126,760,516 | 6,531,326 | - | - | - | 14,357,014 | 147,648,856 |
| Total | 136,424,984 | 23,418,375 | 6,308,161 | - | (16,177,608) | 30,269,041 | 164,505,716 |
Investment Valuation
The following is a summary of the inputs used, as of August 31, 2022, involving the Fund's assets and liabilities carried at fair value. The inputs or methodology used for valuing securities may not be an indication of the risk associated with investing in those securities. For more information on valuation inputs, and their aggregation into the levels used below, please refer to the Investment Valuation section in the accompanying Notes to Financial Statements.
| Valuation Inputs at Reporting Date: |
| Description | Total ($) | Level 1 ($) | Level 2 ($) | Level 3 ($) |
Investments in Securities: | | | | |
|
| Common Stocks | 5,106,860,631 | 5,011,021,155 | 1,940,684 | 93,898,792 |
|
| Convertible Preferred Stocks | 77,260,656 | - | - | 77,260,656 |
|
| Money Market Funds | 577,068,230 | 577,068,230 | - | - |
| Total Investments in Securities: | 5,761,189,517 | 5,588,089,385 | 1,940,684 | 171,159,448 |
The following is a reconciliation of Investments in Securities for which Level 3 inputs were used in determining value:
| |
| Investments in Securities: | |
| Common Stocks | | | |
| Beginning Balance | $ | 90,662,671 | |
| Net Realized Gain (Loss) on Investment Securities | | 109,876 | |
| Net Unrealized Gain (Loss) on Investment Securities | | 3,213,621 | |
| Cost of Purchases | | 22,500 | |
| Proceeds of Sales | | (109,876) | |
| Amortization/Accretion | | - | |
| Transfers into Level 3 | | - | |
| Transfers out of Level 3 | | - | |
| Ending Balance | $ | 93,898,792 | |
| The change in unrealized gain (loss) for the period attributable to Level 3 securities held at August 31, 2022 | $ | 3,213,621 | |
| Convertible Preferred Stocks | | | |
| Beginning Balance | $ | 80,070,979 | |
| Net Realized Gain (Loss) on Investment Securities | | - | |
| Net Unrealized Gain (Loss) on Investment Securities | | (2,810,323) | |
| Cost of Purchases | | - | |
| Proceeds of Sales | | - | |
| Amortization/Accretion | | - | |
| Transfers into Level 3 | | - | |
| Transfers out of Level 3 | | - | |
| Ending Balance | $ | 77,260,656 | |
| The change in unrealized gain (loss) for the period attributable to Level 3 securities held at August 31, 2022 | $ | (2,810,323) | |
| The information used in the above reconciliation represents fiscal year to date activity for any Investments in Securities identified as using Level 3 inputs at either the beginning or the end of the current fiscal period. Cost of purchases and proceeds of sales may include securities received and/or delivered through in-kind transactions. Transfers into Level 3 were attributable to a lack of observable market data resulting from decreases in market activity, decreases in liquidity, security restructurings or corporate actions. Transfers out of Level 3 were attributable to observable market data becoming available for those securities. Transfers in or out of Level 3 represent the beginning value of any Security or Instrument where a change in the pricing level occurred from the beginning to the end of the period. The cost of purchases and the proceeds of sales may include securities received or delivered through corporate actions or exchanges. Realized and unrealized gains (losses) disclosed in the reconciliation are included in Net Gain (Loss) on the Fund's Statement of Operations. | |
Biotechnology Portfolio
| Statement of Assets and Liabilities |
| | | | August 31, 2022 (Unaudited) |
| | | | | |
| Assets | | | | |
| Investment in securities, at value (including securities loaned of $534,128,736) - See accompanying schedule: | | $5,019,615,571 | | |
Unaffiliated issuers (cost $4,296,995,867) | | | |
Fidelity Central Funds (cost $577,034,589) | | 577,068,230 | | |
Other affiliated issuers (cost $105,910,975) | | 164,505,716 | | |
| | | | | |
| Total Investment in Securities (cost $4,979,941,431) | | | $ | 5,761,189,517 |
| Foreign currency held at value (cost $14) | | | | 14 |
| Receivable for investments sold | | | | 11,627,931 |
| Receivable for fund shares sold | | | | 429,389 |
| Dividends receivable | | | | 256,837 |
| Distributions receivable from Fidelity Central Funds | | | | 1,028,248 |
| Prepaid expenses | | | | 37,202 |
| Other receivables | | | | 1,100,330 |
Total assets | | | | 5,775,669,468 |
| Liabilities | | | | |
| Payable for investments purchased | | $7,280,198 | | |
| Payable for fund shares redeemed | | 2,844,639 | | |
| Accrued management fee | | 2,388,335 | | |
| Other affiliated payables | | 778,508 | | |
| Other payables and accrued expenses | | 1,165,689 | | |
| Collateral on securities loaned | | 541,366,180 | | |
| Total Liabilities | | | | 555,823,549 |
| Net Assets | | | $ | 5,219,845,919 |
| Net Assets consist of: | | | | |
| Paid in capital | | | $ | 4,775,141,366 |
| Total accumulated earnings (loss) | | | | 444,704,553 |
| Net Assets | | | $ | 5,219,845,919 |
Net Asset Value , offering price and redemption price per share ($5,219,845,919 ÷ 329,846,378 shares) | | | $ | 15.83 |
| | | | | |
| Statement of Operations |
| | | | Six months ended August 31, 2022 (Unaudited) |
| Investment Income | | | | |
| Dividends | | | $ | 14,421,322 |
| Income from Fidelity Central Funds (including $4,586,360 from security lending) | | | | 4,836,763 |
| Total Income | | | | 19,258,085 |
| Expenses | | | | |
| Management fee | $ | 13,282,380 | | |
| Transfer agent fees | | 4,098,926 | | |
| Accounting fees | | 510,782 | | |
| Custodian fees and expenses | | 117,677 | | |
| Independent trustees' fees and expenses | | 8,068 | | |
| Registration fees | | 53,174 | | |
| Audit | | 59,757 | | |
| Legal | | 2,393 | | |
| Miscellaneous | | 22,228 | | |
| Total expenses before reductions | | 18,155,385 | | |
| Expense reductions | | (82,625) | | |
| Total expenses after reductions | | | | 18,072,760 |
| Net Investment income (loss) | | | | 1,185,325 |
| Realized and Unrealized Gain (Loss) | | | | |
| Net realized gain (loss) on: | | | | |
| Investment Securities: | | | | |
| Unaffiliated issuers | | (179,022,791) | | |
| Fidelity Central Funds | | 3,258 | | |
| Other affiliated issuers | | (16,177,608) | | |
| Foreign currency transactions | | (18,820) | | |
| Total net realized gain (loss) | | | | (195,215,961) |
| Change in net unrealized appreciation (depreciation) on: | | | | |
| Investment Securities: | | | | |
| Unaffiliated issuers | | 174,854,862 | | |
| Fidelity Central Funds | | (3,258) | | |
| Other affiliated issuers | | 30,269,041 | | |
| Assets and liabilities in foreign currencies | | (17,190) | | |
| Total change in net unrealized appreciation (depreciation) | | | | 205,103,455 |
| Net gain (loss) | | | | 9,887,494 |
| Net increase (decrease) in net assets resulting from operations | | | $ | 11,072,819 |
| Statement of Changes in Net Assets |
| |
| | Six months ended August 31, 2022 (Unaudited) | | Year ended February 28, 2022 |
| Increase (Decrease) in Net Assets | | | | |
| Operations | | | | |
| Net investment income (loss) | $ | 1,185,325 | $ | (10,105,462) |
| Net realized gain (loss) | | (195,215,961) | | 288,016,862 |
| Change in net unrealized appreciation (depreciation) | | 205,103,455 | | (2,639,724,294) |
| Net increase (decrease) in net assets resulting from operations | | 11,072,819 | | (2,361,812,894) |
| Distributions to shareholders | | - | | (951,630,731) |
| Share transactions | | | | |
| Proceeds from sales of shares | | 402,117,956 | | 514,676,797 |
| Reinvestment of distributions | | - | | 898,472,847 |
| Cost of shares redeemed | | (474,036,823) | | (1,692,638,148) |
Net increase (decrease) in net assets resulting from share transactions | | (71,918,867) | | (279,488,504) |
| Total increase (decrease) in net assets | | (60,846,048) | | (3,592,932,129) |
| | | | | |
| Net Assets | | | | |
| Beginning of period | | 5,280,691,967 | | 8,873,624,096 |
| End of period | $ | 5,219,845,919 | $ | 5,280,691,967 |
| | | | | |
| Other Information | | | | |
| Shares | | | | |
| Sold | | 26,763,029 | | 24,447,337 |
| Issued in reinvestment of distributions | | - | | 43,520,026 |
| Redeemed | | (31,471,047) | | (81,104,304) |
| Net increase (decrease) | | (4,708,018) | | (13,136,941) |
| | | | | |
| | Six months ended (Unaudited) August 31, 2022 | | Years ended February 28, 2022 | | 2021 | | 2020 A | | 2019 B | | 2018 B |
Selected Per-Share Data | | | | | | | | | | | | |
| Net asset value, beginning of period | $ | 15.78 | $ | 25.52 | $ | 21.02 | $ | 21.14 | $ | 23.45 | $ | 20.32 |
| Income from Investment Operations | | | | | | | | | | | | |
Net investment income (loss) C,D | | - | | (.03) | | (.01) | | .05 | | (.04) | | (.05) |
| Net realized and unrealized gain (loss) | | .05 | | (6.91) | | 9.41 | | 1.79 | | (.29) E | | 3.49 |
| Total from investment operations | | .05 | | (6.94) | | 9.40 | | 1.84 | | (.33) | | 3.44 |
| Distributions from net investment income | | - | | (.03) | | (.07) | | (.03) | | - | | - |
| Distributions from net realized gain | | - | | (2.77) | | (4.84) | | (1.93) | | (1.98) | | (.31) |
| Total distributions | | - | | (2.80) | | (4.90) F | | (1.96) | | (1.98) | | (.31) |
| Net asset value, end of period | $ | 15.83 | $ | 15.78 | $ | 25.52 | $ | 21.02 | $ | 21.14 | $ | 23.45 |
Total Return G,H | | .32% | | (29.49)% | | 47.35% | | 8.57% | | (.46)% E | | 17.04% |
Ratios to Average Net Assets D,I,J | | | | | | | | | | | | |
| Expenses before reductions | | .72% K | | .69% | | .70% | | .72% | | .72% | | .74% |
| Expenses net of fee waivers, if any | | .72% K | | .69% | | .70% | | .72% | | .72% | | .74% |
| Expenses net of all reductions | | .72% K | | .69% | | .69% | | .72% | | .72% | | .73% |
| Net investment income (loss) | | .05% K | | (.14)% | | (.03)% | | .22% | | (.20)% | | (.25)% |
| Supplemental Data | | | | | | | | | | | | |
| Net assets, end of period (000 omitted) | $ | 5,219,846 | $ | 5,280,692 | $ | 8,873,624 | $ | 6,624,752 | $ | 7,583,722 | $ | 8,940,767 |
Portfolio turnover rate L | | 51% K | | 46% | | 78% | | 50% | | 37% | | 26% |
A For the year ended February 29.
B Per share amounts have been adjusted to reflect the impact of the 10 for 1 share split that soccurred on August 10, 2018.
C Calculated based on average shares outstanding during the period.
D Net investment income (loss) is affected by the timing of the declaration of dividends by any underlying mutual funds or exchange-traded funds (ETFs). Net investment income (loss) of any such underlying funds is not included in the Fund's net investment income (loss) ratio.
E Net realized and unrealized gain (loss) per share reflects proceeds received from litigation which amounted to $.01 per share. Excluding these litigation proceeds, the total return would have been (.53)%.
F Total distributions per share do not sum due to rounding.
G Total returns for periods of less than one year are not annualized.
H Total returns would have been lower if certain expenses had not been reduced during the applicable periods shown.
I Fees and expenses of any underlying mutual funds or exchange-traded funds (ETFs) are not included in the Fund's expense ratio. The Fund indirectly bears its proportionate share of these expenses. For additional expense information related to investments in Fidelity Central Funds, please refer to the "Investments in Fidelity Central Funds" note found in the Notes to Financial Statements section of the most recent Annual or Semi-Annual report.
J Expense ratios reflect operating expenses of the class. Expenses before reductions do not reflect amounts reimbursed, waived, or reduced through arrangements with the investment adviser, brokerage services, or other offset arrangements, if applicable, and do not represent the amount paid by the class during periods when reimbursements, waivers or reductions occur.
K Annualized
L Amount does not include the portfolio activity of any underlying mutual funds or exchange-traded funds (ETFs).
Top Holdings (% of Fund's net assets) |
| |
| UnitedHealth Group, Inc. | 11.5 | |
| Danaher Corp. | 5.8 | |
| Eli Lilly & Co. | 5.5 | |
| Boston Scientific Corp. | 5.1 | |
| Thermo Fisher Scientific, Inc. | 4.9 | |
| Humana, Inc. | 4.9 | |
| Cigna Corp. | 4.0 | |
| Insulet Corp. | 3.0 | |
| Penumbra, Inc. | 2.8 | |
| Royalty Pharma PLC | 2.5 | |
| | 50.0 | |
| |
Percentages shown as 0.0% may reflect amounts less than 0.05%.
| Industries (% of Fund's net assets) |
| |
| Health Care Providers & Services | 32.4 | |
| Biotechnology | 19.1 | |
| Health Care Equipment & Supplies | 17.2 | |
| Life Sciences Tools & Services | 15.8 | |
| Pharmaceuticals | 13.4 | |
| Health Care Technology | 1.1 | |
| Personal Products | 0.4 | |
| Specialty Retail | 0.2 | |
| Diversified Financial Services | 0.1 | |
| |
Percentages shown as 0.0% may reflect amounts less than 0.05%.
Health Care Portfolio
| Common Stocks - 98.4% |
| | | Shares | Value ($) |
| Biotechnology - 18.4% | | | |
| Biotechnology - 18.4% | | | |
| ADC Therapeutics SA (a)(b) | | 988,800 | 6,743,616 |
| Agios Pharmaceuticals, Inc. (a)(b) | | 360,000 | 9,180,000 |
| Alnylam Pharmaceuticals, Inc. (a) | | 500,000 | 103,335,000 |
| Ambrx Biopharma, Inc. ADR (a) | | 354,700 | 585,255 |
| Arcutis Biotherapeutics, Inc. (a) | | 830,121 | 22,371,761 |
| Argenx SE ADR (a) | | 485,000 | 183,266,950 |
| Ascendis Pharma A/S sponsored ADR (a) | | 954,412 | 85,486,683 |
| Avid Bioservices, Inc. (a) | | 1,000,000 | 17,220,000 |
| Beam Therapeutics, Inc. (a)(b) | | 400,000 | 21,840,000 |
| Blueprint Medicines Corp. (a) | | 830,974 | 60,843,916 |
| Celldex Therapeutics, Inc. (a) | | 647,699 | 19,690,050 |
| Century Therapeutics, Inc. (a) | | 815,000 | 8,573,800 |
| Cerevel Therapeutics Holdings (a) | | 1,342,000 | 39,052,200 |
| Cytokinetics, Inc. (a) | | 1,700,000 | 90,032,000 |
| Denali Therapeutics, Inc. (a) | | 500,000 | 13,835,000 |
| Erasca, Inc. (a) | | 2,571,600 | 23,195,832 |
| Exelixis, Inc. (a) | | 1,500,000 | 26,610,000 |
| Fate Therapeutics, Inc. (a)(b) | | 350,000 | 9,149,000 |
| Generation Bio Co. (a) | | 509,353 | 2,607,887 |
| Graphite Bio, Inc. (a) | | 800,000 | 2,648,000 |
| Imago BioSciences, Inc. (a) | | 200,000 | 2,906,000 |
| Innovent Biologics, Inc. (a)(c) | | 7,800,000 | 32,881,119 |
| Instil Bio, Inc. (a)(b) | | 1,500,000 | 7,800,000 |
| Janux Therapeutics, Inc. (a)(b) | | 500,000 | 5,410,000 |
| Keros Therapeutics, Inc. (a) | | 400,000 | 14,148,000 |
| Legend Biotech Corp. ADR (a) | | 1,400,000 | 65,086,000 |
| Mirati Therapeutics, Inc. (a) | | 200,000 | 16,206,000 |
| Morphic Holding, Inc. (a) | | 320,000 | 8,806,400 |
| Nuvalent, Inc. Class A (a)(b) | | 351,130 | 5,927,074 |
| Poseida Therapeutics, Inc. (a) | | 1,890,825 | 6,258,631 |
| PTC Therapeutics, Inc. (a) | | 1,150,000 | 57,431,000 |
| Regeneron Pharmaceuticals, Inc. (a) | | 310,000 | 180,128,600 |
| Relay Therapeutics, Inc. (a)(b) | | 1,200,000 | 27,564,000 |
| Sarepta Therapeutics, Inc. (a) | | 740,000 | 80,941,200 |
| Scholar Rock Holding Corp. (a)(b) | | 155,315 | 1,295,327 |
| Shattuck Labs, Inc. (a) | | 1,162,800 | 3,779,100 |
| Stoke Therapeutics, Inc. (a) | | 500,000 | 7,530,000 |
| uniQure B.V. (a) | | 670,000 | 13,091,800 |
| Vaxcyte, Inc. (a) | | 750,000 | 19,620,000 |
| Vertex Pharmaceuticals, Inc. (a) | | 340,000 | 95,798,400 |
| Verve Therapeutics, Inc. (a) | | 280,000 | 10,740,800 |
| Xencor, Inc. (a) | | 1,400,000 | 36,946,000 |
| Xenon Pharmaceuticals, Inc. (a) | | 483,795 | 18,776,084 |
| Zai Lab Ltd. (a)(d) | | 6,900,000 | 30,590,619 |
| Zentalis Pharmaceuticals, Inc. (a) | | 850,000 | 22,788,500 |
| | | | 1,518,717,604 |
| Health Care Equipment & Supplies - 17.2% | | | |
| Health Care Equipment - 17.2% | | | |
| Boston Scientific Corp. (a) | | 10,450,000 | 421,239,500 |
| Envista Holdings Corp. (a) | | 1,600,000 | 59,344,000 |
| Inspire Medical Systems, Inc. (a) | | 240,000 | 45,957,600 |
| Insulet Corp. (a) | | 980,000 | 250,360,600 |
| Masimo Corp. (a) | | 690,000 | 101,354,100 |
| Nevro Corp. (a) | | 700,000 | 31,724,000 |
| Novocure Ltd. (a) | | 431,840 | 35,467,019 |
| Outset Medical, Inc. (a)(b) | | 1,080,000 | 19,753,200 |
| Penumbra, Inc. (a) | | 1,416,900 | 232,612,473 |
| PROCEPT BioRobotics Corp. | | 600,000 | 24,288,000 |
| ResMed, Inc. | | 600,000 | 131,952,000 |
| Tandem Diabetes Care, Inc. (a) | | 1,450,000 | 66,323,000 |
| | | | 1,420,375,492 |
| Health Care Providers & Services - 32.4% | | | |
| Health Care Facilities - 3.4% | | | |
| Cano Health, Inc. (a) | | 8,600,000 | 53,062,000 |
| HCA Holdings, Inc. | | 800,000 | 158,296,000 |
| Surgery Partners, Inc. (a) | | 2,100,000 | 57,813,000 |
| The Oncology Institute, Inc. (a)(e) | | 2,232,581 | 14,176,889 |
| | | | 283,347,889 |
| Health Care Services - 8.0% | | | |
| agilon health, Inc. (a)(b) | | 5,750,000 | 119,485,000 |
| Cigna Corp. | | 1,160,000 | 328,802,000 |
| Guardant Health, Inc. (a) | | 618,385 | 30,956,353 |
| LifeStance Health Group, Inc. (a) | | 4,250,000 | 26,732,500 |
| Oak Street Health, Inc. (a)(b) | | 6,000,000 | 157,200,000 |
| | | | 663,175,853 |
| Managed Health Care - 21.0% | | | |
| Alignment Healthcare, Inc. (a) | | 3,600,000 | 54,756,000 |
| Centene Corp. (a) | | 2,280,000 | 204,607,200 |
| Humana, Inc. | | 835,000 | 402,286,300 |
| Molina Healthcare, Inc. (a) | | 340,000 | 114,705,800 |
| UnitedHealth Group, Inc. | | 1,840,000 | 955,567,202 |
| | | | 1,731,922,502 |
TOTAL HEALTH CARE PROVIDERS & SERVICES | | | 2,678,446,244 |
| Health Care Technology - 0.8% | | | |
| Health Care Technology - 0.8% | | | |
| Definitive Healthcare Corp. (b) | | 500,000 | 10,040,000 |
| Doximity, Inc. (a)(b) | | 1,080,000 | 35,845,200 |
| Medlive Technology Co. Ltd. (c) | | 3,000,000 | 4,768,942 |
| Phreesia, Inc. (a) | | 700,000 | 17,962,000 |
| | | | 68,616,142 |
| Life Sciences Tools & Services - 15.8% | | | |
| Life Sciences Tools & Services - 15.8% | | | |
| 10X Genomics, Inc. Class B (a)(c) | | 500,000 | 16,495,000 |
| Agilent Technologies, Inc. | | 280,000 | 35,910,000 |
| Avantor, Inc. (a) | | 400,000 | 9,964,000 |
| Bio-Rad Laboratories, Inc. Class A (a) | | 100,000 | 48,504,000 |
| Bruker Corp. | | 1,350,000 | 75,600,000 |
| Danaher Corp. | | 1,760,000 | 475,041,600 |
| Lonza Group AG | | 108,000 | 57,598,562 |
| Nanostring Technologies, Inc. (a) | | 417,366 | 5,659,483 |
| Olink Holding AB ADR (a)(b) | | 1,200,000 | 18,168,000 |
| Sartorius Stedim Biotech | | 90,000 | 33,075,919 |
| Seer, Inc. (a) | | 1,023,900 | 10,341,390 |
| Stevanato Group SpA | | 1,080,000 | 17,928,000 |
| Thermo Fisher Scientific, Inc. | | 740,000 | 403,536,800 |
| West Pharmaceutical Services, Inc. | | 325,000 | 96,424,250 |
| | | | 1,304,247,004 |
| Personal Products - 0.4% | | | |
| Personal Products - 0.4% | | | |
| The Beauty Health Co. (a)(b) | | 801,005 | 9,291,658 |
| The Beauty Health Co. (a)(e) | | 1,800,000 | 20,880,000 |
| | | | 30,171,658 |
| Pharmaceuticals - 13.2% | | | |
| Pharmaceuticals - 13.2% | | | |
| Arvinas Holding Co. LLC (a) | | 500,000 | 21,170,000 |
| AstraZeneca PLC (United Kingdom) | | 1,420,000 | 175,643,120 |
| Bristol-Myers Squibb Co. | | 1,200,000 | 80,892,000 |
| Eli Lilly & Co. | | 1,500,000 | 451,845,000 |
| Merck & Co., Inc. | | 450,000 | 38,412,000 |
| Pharvaris BV (a) | | 620,000 | 5,635,800 |
| Roche Holding AG (participation certificate) | | 280,000 | 90,227,661 |
| Royalty Pharma PLC | | 5,000,000 | 209,050,000 |
| Theseus Pharmaceuticals, Inc. | | 600,000 | 4,092,000 |
| UCB SA | | 280,000 | 19,725,159 |
| | | | 1,096,692,740 |
| Specialty Retail - 0.2% | | | |
| Specialty Stores - 0.2% | | | |
| Warby Parker, Inc. (a)(b) | | 1,280,000 | 16,089,600 |
| TOTAL COMMON STOCKS (Cost $5,688,579,933) | | | 8,133,356,484 |
| | | | |
| Preferred Stocks - 1.3% |
| | | Shares | Value ($) |
| Convertible Preferred Stocks - 1.2% | | | |
| Biotechnology - 0.7% | | | |
| Biotechnology - 0.7% | | | |
| Asimov, Inc. Series B (e)(f) | | 101,438 | 6,977,920 |
| Caris Life Sciences, Inc. Series D (a)(e)(f) | | 3,206,021 | 17,761,356 |
| Cleerly, Inc. Series C (e)(f) | | 1,285,367 | 15,142,394 |
| Element Biosciences, Inc. Series C (a)(e)(f) | | 572,265 | 7,817,140 |
| ElevateBio LLC Series C (a)(e)(f) | | 254,900 | 1,165,658 |
| Inscripta, Inc. Series E (a)(e)(f) | | 1,282,228 | 7,795,946 |
| | | | 56,660,414 |
| Health Care Providers & Services - 0.0% | | | |
| Health Care Services - 0.0% | | | |
| dMed Biopharmaceutical Co. Ltd. Series C (a)(e)(f) | | 380,451 | 3,412,645 |
| | | | |
| Health Care Technology - 0.3% | | | |
| Health Care Technology - 0.3% | | | |
| Aledade, Inc.: | | | |
| Series B1(a)(e)(f) | | 201,220 | 10,022,768 |
| Series E1(e)(f) | | 56,664 | 2,822,434 |
| Omada Health, Inc. Series E (e)(f) | | 2,153,073 | 5,942,481 |
| Wugen, Inc. Series B (a)(e)(f) | | 454,342 | 2,371,665 |
| | | | 21,159,348 |
| Pharmaceuticals - 0.2% | | | |
| Pharmaceuticals - 0.2% | | | |
| Aristea Therapeutics, Inc. Series B (a)(e)(f) | | 1,037,400 | 9,118,746 |
| Galvanize Therapeutics Series B (e)(f) | | 3,696,429 | 6,320,894 |
| | | | 15,439,640 |
| TOTAL CONVERTIBLE PREFERRED STOCKS | | | 96,672,047 |
| Nonconvertible Preferred Stocks - 0.1% | | | |
| Diversified Financial Services - 0.1% | | | |
| Other Diversified Financial Services - 0.1% | | | |
| Thriveworks TopCo LLC Series B (a)(e)(f)(g) | | 473,270 | 9,735,164 |
| | | | |
| TOTAL PREFERRED STOCKS (Cost $132,756,273) | | | 106,407,211 |
| | | | |
| Money Market Funds - 2.6% |
| | | Shares | Value ($) |
| Fidelity Cash Central Fund 2.33% (h) | | 24,228,781 | 24,233,627 |
| Fidelity Securities Lending Cash Central Fund 2.34% (h)(i) | | 193,698,233 | 193,717,603 |
| TOTAL MONEY MARKET FUNDS (Cost $217,949,480) | | | 217,951,230 |
| | | | |
| TOTAL INVESTMENT IN SECURITIES - 102.3% (Cost $6,039,285,686) | 8,457,714,925 |
NET OTHER ASSETS (LIABILITIES) - (2.3)% | (189,922,025) |
| NET ASSETS - 100.0% | 8,267,792,900 |
| | |
Legend
| (b) | Security or a portion of the security is on loan at period end. |
| (c) | Security exempt from registration under Rule 144A of the Securities Act of 1933. These securities may be resold in transactions exempt from registration, normally to qualified institutional buyers. At the end of the period, the value of these securities amounted to $54,145,061 or 0.7% of net assets. |
| (e) | Restricted securities (including private placements) - Investment in securities not registered under the Securities Act of 1933 (excluding 144A issues). At the end of the period, the value of restricted securities (excluding 144A issues) amounted to $141,464,100 or 1.7% of net assets. |
| (g) | Investment is owned by a wholly-owned subsidiary (Subsidiary) that is treated as a corporation for U.S. tax purposes. |
| (h) | Affiliated fund that is generally available only to investment companies and other accounts managed by Fidelity Investments. The rate quoted is the annualized seven-day yield of the fund at period end. A complete unaudited listing of the fund's holdings as of its most recent quarter end is available upon request. In addition, each Fidelity Central Fund's financial statements are available on the SEC's website or upon request. |
| (i) | Investment made with cash collateral received from securities on loan. |
| Additional information on each restricted holding is as follows: |
| Security | Acquisition Date | Acquisition Cost ($) |
| Aledade, Inc. Series B1 | 5/07/21 | 7,704,855 |
| Aledade, Inc. Series E1 | 5/20/22 | 2,822,683 |
| Aristea Therapeutics, Inc. Series B | 10/06/20 | 5,719,912 |
| Asimov, Inc. Series B | 10/29/21 | 9,401,345 |
| Caris Life Sciences, Inc. Series D | 5/11/21 | 25,968,770 |
| Cleerly, Inc. Series C | 7/08/22 | 15,142,394 |
| dMed Biopharmaceutical Co. Ltd. Series C | 12/01/20 | 5,403,602 |
| Element Biosciences, Inc. Series C | 6/21/21 | 11,763,880 |
| ElevateBio LLC Series C | 3/09/21 | 1,069,306 |
| Galvanize Therapeutics Series B | 3/29/22 | 6,399,572 |
| Inscripta, Inc. Series E | 3/30/21 | 11,322,073 |
| Omada Health, Inc. Series E | 12/22/21 | 12,908,103 |
| The Beauty Health Co. | 12/08/20 | 18,000,000 |
| The Oncology Institute, Inc. | 6/28/21 | 22,325,810 |
| Thriveworks TopCo LLC Series B | 7/23/21 - 2/25/22 | 13,584,368 |
| Wugen, Inc. Series B | 7/09/21 | 3,523,377 |
Affiliated Central Funds
Fiscal year to date information regarding the Fund's investments in Fidelity Central Funds, including the ownership percentage, is presented below.
| Affiliate | Value, beginning of period ($) | Purchases ($) | Sales Proceeds ($) | Dividend Income ($) | Realized Gain (loss) ($) | Change in Unrealized appreciation (depreciation) ($) | Value, end of period ($) | %ownership, end of period |
| Fidelity Cash Central Fund 2.33% | 36,264,694 | 509,009,622 | 521,040,689 | 248,078 | - | - | 24,233,627 | 0.0% |
| Fidelity Securities Lending Cash Central Fund 2.34% | 202,861,851 | 693,538,460 | 702,682,708 | 1,224,172 | - | - | 193,717,603 | 0.6% |
| Total | 239,126,545 | 1,202,548,082 | 1,223,723,397 | 1,472,250 | - | - | 217,951,230 | |
| | | | | | | | | |
Amounts in the income column in the above table include any capital gain distributions from underlying funds, which are presented in the corresponding line item in the Statement of Operations, if applicable.
Amount for Fidelity Securities Lending Cash Central Fund represents the income earned on investing cash collateral, less rebates paid to borrowers and any lending agent fees associated with the loan, plus any premium payments received for lending certain types of securities.
Other Affiliated Issuers
An affiliated company is a company in which the Fund has ownership of at least 5% of the voting securities. Fiscal year to date transactions with companies which are or were affiliates are as follows:
| Affiliate | Value, beginning of period ($) | Purchases ($) | Sales Proceeds ($) | Dividend Income ($) | Realized Gain (loss) ($) | Change in Unrealized appreciation (depreciation) ($) | Value, end of period ($) |
| Zai Lab Ltd. | 26,625,199 | 7,708,621 | - | - | - | (3,743,201) | 30,590,619 |
| Total | 26,625,199 | 7,708,621 | - | - | - | (3,743,201) | 30,590,619 |
Investment Valuation
The following is a summary of the inputs used, as of August 31, 2022, involving the Fund's assets and liabilities carried at fair value. The inputs or methodology used for valuing securities may not be an indication of the risk associated with investing in those securities. For more information on valuation inputs, and their aggregation into the levels used below, please refer to the Investment Valuation section in the accompanying Notes to Financial Statements.
| Valuation Inputs at Reporting Date: |
| Description | Total ($) | Level 1 ($) | Level 2 ($) | Level 3 ($) |
Investments in Securities: | | | | |
|
| Common Stocks | 8,133,356,484 | 7,741,646,461 | 391,710,023 | - |
|
| Preferred Stocks | 106,407,211 | - | - | 106,407,211 |
|
| Money Market Funds | 217,951,230 | 217,951,230 | - | - |
| Total Investments in Securities: | 8,457,714,925 | 7,959,597,691 | 391,710,023 | 106,407,211 |
The following is a reconciliation of Investments in Securities for which Level 3 inputs were used in determining value:
| |
| Investments in Securities: | |
| Beginning Balance | $ | 99,854,613 | |
| Net Realized Gain (Loss) on Investment Securities | | - | |
| Net Unrealized Gain (Loss) on Investment Securities | | (17,834,085) | |
| Cost of Purchases | | 24,386,683 | |
| Proceeds of Sales | | - | |
| Amortization/Accretion | | - | |
| Transfers into Level 3 | | - | |
| Transfers out of Level 3 | | - | |
| Ending Balance | $ | 106,407,211 | |
| The change in unrealized gain (loss) for the period attributable to Level 3 securities held at August 31, 2022 | $ | (17,834,085) | |
| The information used in the above reconciliation represents fiscal year to date activity for any Investments in Securities identified as using Level 3 inputs at either the beginning or the end of the current fiscal period. Cost of purchases and proceeds of sales may include securities received and/or delivered through in-kind transactions. Transfers into Level 3 were attributable to a lack of observable market data resulting from decreases in market activity, decreases in liquidity, security restructurings or corporate actions. Transfers out of Level 3 were attributable to observable market data becoming available for those securities. Transfers in or out of Level 3 represent the beginning value of any Security or Instrument where a change in the pricing level occurred from the beginning to the end of the period. The cost of purchases and the proceeds of sales may include securities received or delivered through corporate actions or exchanges. Realized and unrealized gains (losses) disclosed in the reconciliation are included in Net Gain (Loss) on the Fund's Statement of Operations. | |
Health Care Portfolio
| Statement of Assets and Liabilities |
| | | | August 31, 2022 (Unaudited) |
| | | | | |
| Assets | | | | |
| Investment in securities, at value (including securities loaned of $190,952,470) - See accompanying schedule: | | $8,209,173,076 | | |
Unaffiliated issuers (cost $5,765,781,878) | | | |
Fidelity Central Funds (cost $217,949,480) | | 217,951,230 | | |
Other affiliated issuers (cost $55,554,328) | | 30,590,619 | | |
| | | | | |
| Total Investment in Securities (cost $6,039,285,686) | | | $ | 8,457,714,925 |
| Receivable for investments sold | | | | 12,986,399 |
| Receivable for fund shares sold | | | | 916,679 |
| Dividends receivable | | | | 4,049,977 |
| Reclaims receivable | | | | 7,242,155 |
| Distributions receivable from Fidelity Central Funds | | | | 208,517 |
| Prepaid expenses | | | | 37,349 |
| Other receivables | | | | 740,457 |
Total assets | | | | 8,483,896,458 |
| Liabilities | | | | |
| Payable for investments purchased | | 12,486,528 | | |
| Payable for fund shares redeemed | | 4,260,337 | | |
| Accrued management fee | | 3,807,646 | | |
| Other affiliated payables | | 1,099,560 | | |
| Other payables and accrued expenses | | 753,710 | | |
| Collateral on securities loaned | | 193,695,777 | | |
| Total Liabilities | | | | 216,103,558 |
| Net Assets | | | $ | 8,267,792,900 |
| Net Assets consist of: | | | | |
| Paid in capital | | | $ | 6,041,264,216 |
| Total accumulated earnings (loss) | | | | 2,226,528,684 |
| Net Assets | | | $ | 8,267,792,900 |
Net Asset Value , offering price and redemption price per share ($8,267,792,900 ÷ 310,261,217 shares) | | | $ | 26.65 |
| | | | | |
| Statement of Operations |
| | | | Six months ended August 31, 2022 (Unaudited) |
| Investment Income | | | | |
| Dividends | | | $ | 24,907,800 |
| Income from Fidelity Central Funds (including $1,224,172 from security lending) | | | | 1,472,250 |
| Total Income | | | | 26,380,050 |
| Expenses | | | | |
| Management fee | $ | 22,307,407 | | |
| Transfer agent fees | | 6,083,752 | | |
| Accounting fees | | 581,053 | | |
| Custodian fees and expenses | | 49,236 | | |
| Independent trustees' fees and expenses | | 13,633 | | |
| Registration fees | | 48,072 | | |
| Audit | | 24,306 | | |
| Legal | | 4,322 | | |
| Interest | | 958 | | |
| Miscellaneous | | 28,271 | | |
| Total expenses before reductions | | 29,141,010 | | |
| Expense reductions | | (138,308) | | |
| Total expenses after reductions | | | | 29,002,702 |
| Net Investment income (loss) | | | | (2,622,652) |
| Realized and Unrealized Gain (Loss) | | | | |
| Net realized gain (loss) on: | | | | |
| Investment Securities: | | | | |
| Unaffiliated issuers | | (159,282,508) | | |
| Foreign currency transactions | | (102,074) | | |
| Total net realized gain (loss) | | | | (159,384,582) |
| Change in net unrealized appreciation (depreciation) on: | | | | |
| Investment Securities: | | | | |
| Unaffiliated issuers | | (196,383,440) | | |
| Affiliated issuers | | (3,743,201) | | |
| Assets and liabilities in foreign currencies | | (464,887) | | |
| Total change in net unrealized appreciation (depreciation) | | | | (200,591,528) |
| Net gain (loss) | | | | (359,976,110) |
| Net increase (decrease) in net assets resulting from operations | | | $ | (362,598,762) |
| Statement of Changes in Net Assets |
| |
| | Six months ended August 31, 2022 (Unaudited) | | Year ended February 28, 2022 |
| Increase (Decrease) in Net Assets | | | | |
| Operations | | | | |
| Net investment income (loss) | $ | (2,622,652) | $ | (10,700,587) |
| Net realized gain (loss) | | (159,384,582) | | 831,099,766 |
| Change in net unrealized appreciation (depreciation) | | (200,591,528) | | (1,151,771,898) |
| Net increase (decrease) in net assets resulting from operations | | (362,598,762) | | (331,372,719) |
| Distributions to shareholders | | (185,553,756) | | (929,859,235) |
| Share transactions | | | | |
| Proceeds from sales of shares | | 272,514,789 | | 1,043,831,682 |
| Reinvestment of distributions | | 171,968,812 | | 861,023,255 |
| Cost of shares redeemed | | (627,746,972) | | (1,997,490,811) |
Net increase (decrease) in net assets resulting from share transactions | | (183,263,371) | | (92,635,874) |
| Total increase (decrease) in net assets | | (731,415,889) | | (1,353,867,828) |
| | | | | |
| Net Assets | | | | |
| Beginning of period | | 8,999,208,789 | | 10,353,076,617 |
| End of period | $ | 8,267,792,900 | $ | 8,999,208,789 |
| | | | | |
| Other Information | | | | |
| Shares | | | | |
| Sold | | 10,073,809 | | 32,480,198 |
| Issued in reinvestment of distributions | | 5,803,857 | | 27,447,935 |
| Redeemed | | (23,611,876) | | (63,667,769) |
| Net increase (decrease) | | (7,734,210) | | (3,739,636) |
| | | | | |
| | Six months ended (Unaudited) August 31, 2022 | | Years ended February 28, 2022 | | 2021 | | 2020 A | | 2019 B | | 2018 B |
Selected Per-Share Data | | | | | | | | | | | | |
| Net asset value, beginning of period | $ | 28.30 | $ | 32.18 | $ | 26.53 | $ | 24.48 | $ | 23.56 | $ | 20.89 |
| Income from Investment Operations | | | | | | | | | | | | |
Net investment income (loss) C,D | | (.01) | | (.03) | | - E | | .04 | | .02 | | .05 |
| Net realized and unrealized gain (loss) | | (1.05) | | (.92) | | 9.23 | | 2.40 | | 2.90 | | 3.17 |
| Total from investment operations | | (1.06) | | (.95) | | 9.23 | | 2.44 | | 2.92 | | 3.22 |
| Distributions from net investment income | | - | | (.04) F | | (.18) | | (.03) | | (.03) | | (.04) |
| Distributions from net realized gain | | (.59) | | (2.89) F | | (3.40) | | (.36) | | (1.97) | | (.51) |
| Total distributions | | (.59) | | (2.93) | | (3.58) | | (.39) | | (2.00) | | (.55) |
| Net asset value, end of period | $ | 26.65 | $ | 28.30 | $ | 32.18 | $ | 26.53 | $ | 24.48 | $ | 23.56 |
Total Return G,H | | (3.96)% | | (3.67)% | | 36.00% | | 9.84% | | 13.30% | | 15.49% |
Ratios to Average Net Assets D,I,J | | | | | | | | | | | | |
| Expenses before reductions | | .69% K | | .68% | | .69% | | .70% | | .71% | | .73% |
| Expenses net of fee waivers, if any | | .68% K | | .67% | | .69% | | .70% | | .71% | | .73% |
| Expenses net of all reductions | | .68% K | | .67% | | .69% | | .70% | | .71% | | .72% |
| Net investment income (loss) | | (.06)% K | | (.10)% | | (.01)% | | .16% | | .10% | | .23% |
| Supplemental Data | | | | | | | | | | | | |
| Net assets, end of period (000 omitted) | $ | 8,267,793 | $ | 8,999,209 | $ | 10,353,077 | $ | 7,220,187 | $ | 7,450,707 | $ | 6,923,404 |
Portfolio turnover rate L | | 34% K | | 31% | | 52% | | 36% M | | 60% M | | 75% |
A For the year ended February 29.
B Per share amounts have been adjusted to reflect the impact of the 10 for 1 share split that soccurred on August 10, 2018.
C Calculated based on average shares outstanding during the period.
D Net investment income (loss) is affected by the timing of the declaration of dividends by any underlying mutual funds or exchange-traded funds (ETFs). Net investment income (loss) of any such underlying funds is not included in the Fund's net investment income (loss) ratio.
E Amount represents less than $.005 per share.
F The amount shown reflects reclassifications related to book to tax differences that were made in the year shown.
G Total returns for periods of less than one year are not annualized.
H Total returns would have been lower if certain expenses had not been reduced during the applicable periods shown.
I Fees and expenses of any underlying mutual funds or exchange-traded funds (ETFs) are not included in the Fund's expense ratio. The Fund indirectly bears its proportionate share of these expenses. For additional expense information related to investments in Fidelity Central Funds, please refer to the "Investments in Fidelity Central Funds" note found in the Notes to Financial Statements section of the most recent Annual or Semi-Annual report.
J Expense ratios reflect operating expenses of the class. Expenses before reductions do not reflect amounts reimbursed, waived, or reduced through arrangements with the investment adviser, brokerage services, or other offset arrangements, if applicable, and do not represent the amount paid by the class during periods when reimbursements, waivers or reductions occur.
K Annualized
L Amount does not include the portfolio activity of any underlying mutual funds or exchange-traded funds (ETFs).
M Portfolio turnover rate excludes securities received or delivered in-kind.
Top Holdings (% of Fund's net assets) |
| |
| UnitedHealth Group, Inc. | 23.8 | |
| Cigna Corp. | 7.9 | |
| Humana, Inc. | 7.8 | |
| Centene Corp. | 6.3 | |
| Elevance Health, Inc. | 4.9 | |
| Molina Healthcare, Inc. | 4.8 | |
| CVS Health Corp. | 4.7 | |
| HCA Holdings, Inc. | 4.3 | |
| AmerisourceBergen Corp. | 3.9 | |
| McKesson Corp. | 2.9 | |
| | 71.3 | |
| |
Percentages shown as 0.0% may reflect amounts less than 0.05%.
| Industries (% of Fund's net assets) |
| |
| Health Care Providers & Services | 93.6 | |
| Health Care Technology | 2.4 | |
| Diversified Financial Services | 0.1 | |
| |
Percentages shown as 0.0% may reflect amounts less than 0.05%.
Health Care Services Portfolio
| Common Stocks - 95.7% |
| | | Shares | Value ($) |
| Health Care Providers & Services - 93.6% | | | |
| Health Care Distributors & Services - 6.8% | | | |
| AmerisourceBergen Corp. | | 420,300 | 61,599,168 |
| McKesson Corp. | | 127,800 | 46,902,600 |
| | | | 108,501,768 |
| Health Care Facilities - 11.3% | | | |
| Brookdale Senior Living, Inc. (a) | | 2,899,600 | 12,758,240 |
| Cano Health, Inc. (a)(b) | | 3,086,329 | 19,042,650 |
| Encompass Health Corp. | | 262,100 | 12,730,197 |
| HCA Holdings, Inc. | | 344,400 | 68,146,428 |
| Surgery Partners, Inc. (a)(b) | | 967,800 | 26,643,534 |
| Tenet Healthcare Corp. (a) | | 469,700 | 26,538,050 |
| U.S. Physical Therapy, Inc. (b) | | 159,600 | 13,184,556 |
| | | | 179,043,655 |
| Health Care Services - 26.4% | | | |
| agilon health, Inc. (a)(b) | | 1,108,700 | 23,038,786 |
| Amedisys, Inc. (a) | | 24,300 | 2,878,335 |
| Andlauer Healthcare Group, Inc. | | 184,939 | 7,346,303 |
| CareMax, Inc. (a)(c) | | 379,900 | 2,598,516 |
| CareMax, Inc. Class A (a)(b) | | 1,356,800 | 9,280,512 |
| Chemed Corp. | | 59,800 | 28,476,162 |
| Cigna Corp. | | 445,372 | 126,240,693 |
| CVS Health Corp. | | 760,070 | 74,600,871 |
| DaVita HealthCare Partners, Inc. (a) | | 75,500 | 6,439,395 |
| Enhabit Home Health & Hospice (a)(b) | | 131,050 | 2,175,430 |
| Guardant Health, Inc. (a) | | 138,700 | 6,943,322 |
| Laboratory Corp. of America Holdings | | 34,700 | 7,816,869 |
| LHC Group, Inc. (a) | | 115,596 | 18,665,286 |
| LifeStance Health Group, Inc. (a)(b) | | 3,139,300 | 19,746,197 |
| Oak Street Health, Inc. (a)(b) | | 911,527 | 23,882,007 |
| Option Care Health, Inc. (a) | | 1,191,232 | 36,880,543 |
| P3 Health Partners, Inc. (a)(c) | | 250,000 | 1,168,500 |
| Privia Health Group, Inc. (a)(b) | | 536,700 | 21,355,293 |
| | | | 419,533,020 |
| Managed Health Care - 49.1% | | | |
| Alignment Healthcare, Inc. (a) | | 738,996 | 11,240,129 |
| Centene Corp. (a) | | 1,122,984 | 100,776,584 |
| Elevance Health, Inc. | | 158,902 | 77,084,949 |
| HealthEquity, Inc. (a) | | 191,400 | 12,647,712 |
| Humana, Inc. | | 256,800 | 123,721,104 |
| Molina Healthcare, Inc. (a) | | 227,300 | 76,684,201 |
| UnitedHealth Group, Inc. | | 729,650 | 378,929,136 |
| | | | 781,083,815 |
TOTAL HEALTH CARE PROVIDERS & SERVICES | | | 1,488,162,258 |
| Health Care Technology - 2.1% | | | |
| Health Care Technology - 2.1% | | | |
| Change Healthcare, Inc. (a) | | 717,100 | 17,619,147 |
| Evolent Health, Inc. (a) | | 277,200 | 10,187,100 |
| Phreesia, Inc. (a) | | 250,335 | 6,423,596 |
| | | | 34,229,843 |
| TOTAL COMMON STOCKS (Cost $833,072,972) | | | 1,522,392,101 |
| | | | |
| Preferred Stocks - 0.4% |
| | | Shares | Value ($) |
| Convertible Preferred Stocks - 0.3% | | | |
| Health Care Technology - 0.3% | | | |
| Health Care Technology - 0.3% | | | |
| Aledade, Inc.: | | | |
| Series B1(a)(c)(d) | | 52,232 | 2,601,676 |
| Series E1(c)(d) | | 40,149 | 1,999,822 |
| | | | 4,601,498 |
| Nonconvertible Preferred Stocks - 0.1% | | | |
| Diversified Financial Services - 0.1% | | | |
| Other Diversified Financial Services - 0.1% | | | |
| Thriveworks TopCo LLC Series B (a)(c)(d)(e) | | 69,639 | 1,432,474 |
| | | | |
| TOTAL PREFERRED STOCKS (Cost $6,020,894) | | | 6,033,972 |
| | | | |
| Money Market Funds - 6.8% |
| | | Shares | Value ($) |
| Fidelity Cash Central Fund 2.33% (f) | | 62,055,811 | 62,068,222 |
| Fidelity Securities Lending Cash Central Fund 2.34% (f)(g) | | 45,858,111 | 45,862,696 |
| TOTAL MONEY MARKET FUNDS (Cost $107,930,918) | | | 107,930,918 |
| | | | |
| TOTAL INVESTMENT IN SECURITIES - 102.9% (Cost $947,024,784) | 1,636,356,991 |
NET OTHER ASSETS (LIABILITIES) - (2.9)% | (45,817,321) |
| NET ASSETS - 100.0% | 1,590,539,670 |
| | |
Legend
| (b) | Security or a portion of the security is on loan at period end. |
| (c) | Restricted securities (including private placements) - Investment in securities not registered under the Securities Act of 1933 (excluding 144A issues). At the end of the period, the value of restricted securities (excluding 144A issues) amounted to $9,800,988 or 0.6% of net assets. |
| (e) | Investment is owned by a wholly-owned subsidiary (Subsidiary) that is treated as a corporation for U.S. tax purposes. |
| (f) | Affiliated fund that is generally available only to investment companies and other accounts managed by Fidelity Investments. The rate quoted is the annualized seven-day yield of the fund at period end. A complete unaudited listing of the fund's holdings as of its most recent quarter end is available upon request. In addition, each Fidelity Central Fund's financial statements are available on the SEC's website or upon request. |
| (g) | Investment made with cash collateral received from securities on loan. |
| Additional information on each restricted holding is as follows: |
| Security | Acquisition Date | Acquisition Cost ($) |
| Aledade, Inc. Series B1 | 5/07/21 | 2,000,000 |
| Aledade, Inc. Series E1 | 5/20/22 | 1,999,998 |
| CareMax, Inc. | 12/18/20 | 3,799,000 |
| P3 Health Partners, Inc. | 5/25/21 | 2,500,000 |
| Thriveworks TopCo LLC Series B | 7/23/21 - 2/25/22 | 1,998,863 |
Affiliated Central Funds
Fiscal year to date information regarding the Fund's investments in Fidelity Central Funds, including the ownership percentage, is presented below.
| Affiliate | Value, beginning of period ($) | Purchases ($) | Sales Proceeds ($) | Dividend Income ($) | Realized Gain (loss) ($) | Change in Unrealized appreciation (depreciation) ($) | Value, end of period ($) | %ownership, end of period |
| Fidelity Cash Central Fund 2.33% | 1,067,186 | 272,660,870 | 211,659,834 | 253,039 | - | - | 62,068,222 | 0.1% |
| Fidelity Securities Lending Cash Central Fund 2.34% | 47,754,630 | 222,064,700 | 223,956,634 | 182,666 | - | - | 45,862,696 | 0.1% |
| Total | 48,821,816 | 494,725,570 | 435,616,468 | 435,705 | - | - | 107,930,918 | |
| | | | | | | | | |
Amounts in the income column in the above table include any capital gain distributions from underlying funds, which are presented in the corresponding line item in the Statement of Operations, if applicable.
Amount for Fidelity Securities Lending Cash Central Fund represents the income earned on investing cash collateral, less rebates paid to borrowers and any lending agent fees associated with the loan, plus any premium payments received for lending certain types of securities.
Investment Valuation
The following is a summary of the inputs used, as of August 31, 2022, involving the Fund's assets and liabilities carried at fair value. The inputs or methodology used for valuing securities may not be an indication of the risk associated with investing in those securities. For more information on valuation inputs, and their aggregation into the levels used below, please refer to the Investment Valuation section in the accompanying Notes to Financial Statements.
| Valuation Inputs at Reporting Date: |
| Description | Total ($) | Level 1 ($) | Level 2 ($) | Level 3 ($) |
Investments in Securities: | | | | |
|
| Common Stocks | 1,522,392,101 | 1,521,223,601 | 1,168,500 | - |
|
| Preferred Stocks | 6,033,972 | - | - | 6,033,972 |
|
| Money Market Funds | 107,930,918 | 107,930,918 | - | - |
| Total Investments in Securities: | 1,636,356,991 | 1,629,154,519 | 1,168,500 | 6,033,972 |
Health Care Services Portfolio
| Statement of Assets and Liabilities |
| | | | August 31, 2022 (Unaudited) |
| | | | | |
| Assets | | | | |
| Investment in securities, at value (including securities loaned of $45,410,183) - See accompanying schedule: | | $1,528,426,073 | | |
Unaffiliated issuers (cost $839,093,866) | | | |
Fidelity Central Funds (cost $107,930,918) | | 107,930,918 | | |
| | | | | |
| Total Investment in Securities (cost $947,024,784) | | | $ | 1,636,356,991 |
| Receivable for investments sold | | | | 3,161,066 |
| Receivable for fund shares sold | | | | 3,439,091 |
| Dividends receivable | | | | 157,172 |
| Distributions receivable from Fidelity Central Funds | | | | 160,064 |
| Prepaid expenses | | | | 5,437 |
| Other receivables | | | | 84,700 |
Total assets | | | | 1,643,364,521 |
| Liabilities | | | | |
| Payable for investments purchased | | 3,573,260 | | |
| Payable for fund shares redeemed | | 2,377,953 | | |
| Accrued management fee | | 697,917 | | |
| Other affiliated payables | | 218,029 | | |
| Other payables and accrued expenses | | 98,424 | | |
| Collateral on securities loaned | | 45,859,268 | | |
| Total Liabilities | | | | 52,824,851 |
| Net Assets | | | $ | 1,590,539,670 |
| Net Assets consist of: | | | | |
| Paid in capital | | | $ | 921,975,325 |
| Total accumulated earnings (loss) | | | | 668,564,345 |
| Net Assets | | | $ | 1,590,539,670 |
Net Asset Value , offering price and redemption price per share ($1,590,539,670 ÷ 11,972,700 shares) | | | $ | 132.85 |
| | | | | |
| Statement of Operations |
| | | | Six months ended August 31, 2022 (Unaudited) |
| Investment Income | | | | |
| Dividends | | | $ | 5,544,409 |
| Income from Fidelity Central Funds (including $182,666 from security lending) | | | | 435,705 |
| Total Income | | | | 5,980,114 |
| Expenses | | | | |
| Management fee | $ | 3,607,217 | | |
| Transfer agent fees | | 1,016,673 | | |
| Accounting fees | | 204,394 | | |
| Custodian fees and expenses | | 5,507 | | |
| Independent trustees' fees and expenses | | 2,100 | | |
| Registration fees | | 54,069 | | |
| Audit | | 17,475 | | |
| Legal | | 1,123 | | |
| Miscellaneous | | 3,575 | | |
| Total expenses before reductions | | 4,912,133 | | |
| Expense reductions | | (20,790) | | |
| Total expenses after reductions | | | | 4,891,343 |
| Net Investment income (loss) | | | | 1,088,771 |
| Realized and Unrealized Gain (Loss) | | | | |
| Net realized gain (loss) on: | | | | |
| Investment Securities: | | | | |
| Unaffiliated issuers | | (9,409,690) | | |
| Foreign currency transactions | | (1,223) | | |
| Total net realized gain (loss) | | | | (9,410,913) |
| Change in net unrealized appreciation (depreciation) on: | | | | |
| Investment Securities: | | | | |
| Unaffiliated issuers | | 67,251,560 | | |
| Assets and liabilities in foreign currencies | | (86) | | |
| Total change in net unrealized appreciation (depreciation) | | | | 67,251,474 |
| Net gain (loss) | | | | 57,840,561 |
| Net increase (decrease) in net assets resulting from operations | | | $ | 58,929,332 |
| Statement of Changes in Net Assets |
| |
| | Six months ended August 31, 2022 (Unaudited) | | Year ended February 28, 2022 |
| Increase (Decrease) in Net Assets | | | | |
| Operations | | | | |
| Net investment income (loss) | $ | 1,088,771 | $ | 2,679,968 |
| Net realized gain (loss) | | (9,410,913) | | 122,701,804 |
| Change in net unrealized appreciation (depreciation) | | 67,251,474 | | 56,927,180 |
| Net increase (decrease) in net assets resulting from operations | | 58,929,332 | | 182,308,952 |
| Distributions to shareholders | | (58,203,664) | | (87,625,390) |
| Share transactions | | | | |
| Proceeds from sales of shares | | 438,771,390 | | 148,662,940 |
| Reinvestment of distributions | | 54,395,336 | | 81,964,453 |
| Cost of shares redeemed | | (117,384,816) | | (212,192,301) |
Net increase (decrease) in net assets resulting from share transactions | | 375,781,910 | | 18,435,092 |
| Total increase (decrease) in net assets | | 376,507,578 | | 113,118,654 |
| | | | | |
| Net Assets | | | | |
| Beginning of period | | 1,214,032,092 | | 1,100,913,438 |
| End of period | $ | 1,590,539,670 | $ | 1,214,032,092 |
| | | | | |
| Other Information | | | | |
| Shares | | | | |
| Sold | | 3,285,170 | | 1,120,061 |
| Issued in reinvestment of distributions | | 389,651 | | 621,521 |
| Redeemed | | (900,498) | | (1,608,688) |
| Net increase (decrease) | | 2,774,323 | | 132,894 |
| | | | | |
| Health Care Services Portfolio |
| |
| | Six months ended (Unaudited) August 31, 2022 | | Years ended February 28, 2022 | | 2021 | | 2020 A | | 2019 | | 2018 |
Selected Per-Share Data | | | | | | | | | | | | |
| Net asset value, beginning of period | $ | 131.98 | $ | 121.44 | $ | 94.72 | $ | 89.28 | $ | 92.21 | $ | 89.93 |
| Income from Investment Operations | | | | | | | | | | | | |
Net investment income (loss) B,C | | .10 | | .29 | | .06 | | .23 | | .13 | | .11 |
| Net realized and unrealized gain (loss) | | 6.87 | | 20.01 | | 27.59 | | 5.50 | | 8.27 | | 14.23 |
| Total from investment operations | | 6.97 | | 20.30 | | 27.65 | | 5.73 | | 8.40 | | 14.34 |
| Distributions from net investment income | | - | | (.22) D | | (.93) | | (.29) | | (.10) | | (.10) |
| Distributions from net realized gain | | (6.10) | | (9.55) D | | - | | - | | (11.23) | | (11.96) |
| Total distributions | | (6.10) | | (9.76) E | | (.93) | | (.29) | | (11.33) | | (12.06) |
Redemption fees added to paid in capital B | | - | | - | | - | | - | | - | | - F |
| Net asset value, end of period | $ | 132.85 | $ | 131.98 | $ | 121.44 | $ | 94.72 | $ | 89.28 | $ | 92.21 |
Total Return G,H | | 5.06% | | 16.85% | | 29.43% | | 6.39% | | 9.61% | | 17.03% |
Ratios to Average Net Assets C,I,J | | | | | | | | | | | | |
| Expenses before reductions | | .72% K | | .71% | | .73% | | .75% | | .76% | | .77% |
| Expenses net of fee waivers, if any | | .71% K | | .71% | | .73% | | .75% | | .76% | | .77% |
| Expenses net of all reductions | | .71% K | | .71% | | .73% | | .75% | | .76% | | .76% |
| Net investment income (loss) | | .16% K | | .22% | | .05% | | .25% | | .14% | | .12% |
| Supplemental Data | | | | | | | | | | | | |
| Net assets, end of period (000 omitted) | $ | 1,590,540 | $ | 1,214,032 | $ | 1,100,913 | $ | 1,003,206 | $ | 1,343,070 | $ | 829,692 |
Portfolio turnover rate L | | 17% K | | 35% | | 34% | | 37% | | 60% | | 65% |
A For the year ended February 29.
B Calculated based on average shares outstanding during the period.
C Net investment income (loss) is affected by the timing of the declaration of dividends by any underlying mutual funds or exchange-traded funds (ETFs). Net investment income (loss) of any such underlying funds is not included in the Fund's net investment income (loss) ratio.
D The amount shown reflects reclassifications related to book to tax differences that were made in the year shown.
E Total distributions per share do not sum due to rounding.
F Amount represents less than $.005 per share.
G Total returns for periods of less than one year are not annualized.
H Total returns would have been lower if certain expenses had not been reduced during the applicable periods shown.
I Fees and expenses of any underlying mutual funds or exchange-traded funds (ETFs) are not included in the Fund's expense ratio. The Fund indirectly bears its proportionate share of these expenses. For additional expense information related to investments in Fidelity Central Funds, please refer to the "Investments in Fidelity Central Funds" note found in the Notes to Financial Statements section of the most recent Annual or Semi-Annual report.
J Expense ratios reflect operating expenses of the class. Expenses before reductions do not reflect amounts reimbursed, waived, or reduced through arrangements with the investment adviser, brokerage services, or other offset arrangements, if applicable, and do not represent the amount paid by the class during periods when reimbursements, waivers or reductions occur.
K Annualized
L Amount does not include the portfolio activity of any underlying mutual funds or exchange-traded funds (ETFs).
Top Holdings (% of Fund's net assets) |
| |
| Thermo Fisher Scientific, Inc. | 15.4 | |
| Danaher Corp. | 14.5 | |
| Boston Scientific Corp. | 10.0 | |
| Abbott Laboratories | 5.1 | |
| ResMed, Inc. | 4.7 | |
| Insulet Corp. | 4.3 | |
| Penumbra, Inc. | 3.5 | |
| West Pharmaceutical Services, Inc. | 3.1 | |
| Masimo Corp. | 2.8 | |
| Sartorius Stedim Biotech | 2.1 | |
| | 65.5 | |
| |
Percentages shown as 0.0% may reflect amounts less than 0.05%.
| Industries (% of Fund's net assets) |
| |
| Life Sciences Tools & Services | 45.4 | |
| Health Care Equipment & Supplies | 45.1 | |
| Health Care Technology | 4.0 | |
| Biotechnology | 2.6 | |
| Health Care Providers & Services | 0.9 | |
| Personal Products | 0.6 | |
| Textiles, Apparel & Luxury Goods | 0.5 | |
| Specialty Retail | 0.3 | |
| Pharmaceuticals | 0.1 | |
| |
Percentages shown as 0.0% may reflect amounts less than 0.05%.
Medical Technology and Devices Portfolio
| Common Stocks - 96.3% |
| | | Shares | Value ($) |
| Biotechnology - 1.3% | | | |
| Biotechnology - 1.3% | | | |
| Abcam PLC (a) | | 2,650,000 | 39,102,846 |
| Avid Bioservices, Inc. (a) | | 1,280,000 | 22,041,600 |
| Natera, Inc. (a) | | 600,000 | 29,556,000 |
| Saluda Medical Pty Ltd. warrants (a)(b)(c) | | 470,371 | 1,349,965 |
| | | | 92,050,411 |
| Health Care Equipment & Supplies - 44.7% | | | |
| Health Care Equipment - 44.0% | | | |
| Abbott Laboratories | | 3,500,000 | 359,275,000 |
| Angiodynamics, Inc. (a) | | 1,600,000 | 35,424,000 |
| Boston Scientific Corp. (a) | | 17,600,000 | 709,456,000 |
| DexCom, Inc. (a) | | 700,000 | 57,547,000 |
| Envista Holdings Corp. (a) | | 2,800,000 | 103,852,000 |
| Hologic, Inc. (a) | | 1,280,000 | 86,476,800 |
| Inspire Medical Systems, Inc. (a) | | 400,000 | 76,596,000 |
| Insulet Corp. (a)(d) | | 1,200,000 | 306,564,000 |
| Intuitive Surgical, Inc. (a) | | 528,000 | 108,630,720 |
| Masimo Corp. (a) | | 1,350,000 | 198,301,500 |
| Nevro Corp. (a) | | 1,750,000 | 79,310,000 |
| Novocure Ltd. (a) | | 751,000 | 61,679,630 |
| Outset Medical, Inc. (a)(d) | | 1,001,809 | 18,323,087 |
| Penumbra, Inc. (a)(d) | | 1,500,000 | 246,255,000 |
| PROCEPT BioRobotics Corp. (d) | | 1,500,000 | 60,720,000 |
| ResMed, Inc. | | 1,500,000 | 329,880,000 |
| Shenzhen Mindray Bio-Medical Electronics Co. Ltd. (A Shares) | | 500,000 | 21,573,758 |
| Stryker Corp. | | 670,000 | 137,484,000 |
| Tandem Diabetes Care, Inc. (a)(d) | | 2,520,000 | 115,264,800 |
| | | | 3,112,613,295 |
| Health Care Supplies - 0.7% | | | |
| Nanosonics Ltd. (a)(e) | | 16,701,000 | 46,592,817 |
TOTAL HEALTH CARE EQUIPMENT & SUPPLIES | | | 3,159,206,112 |
| Health Care Providers & Services - 0.7% | | | |
| Health Care Services - 0.7% | | | |
| Guardant Health, Inc. (a) | | 515,642 | 25,813,039 |
| LifeStance Health Group, Inc. (a) | | 4,250,000 | 26,732,500 |
| | | | 52,545,539 |
| Health Care Technology - 3.3% | | | |
| Health Care Technology - 3.3% | | | |
| Change Healthcare, Inc. (a) | | 2,100,000 | 51,597,000 |
| Definitive Healthcare Corp. (d) | | 750,000 | 15,060,000 |
| DNA Script (b)(c) | | 1,220 | 893,868 |
| DNA Script (b)(c) | | 4,668 | 3,420,145 |
| Doximity, Inc. (a)(d) | | 1,400,000 | 46,466,000 |
| Medlive Technology Co. Ltd. (f) | | 4,295,500 | 6,828,330 |
| Phreesia, Inc. (a) | | 1,650,000 | 42,339,000 |
| Veeva Systems, Inc. Class A (a) | | 340,000 | 67,768,800 |
| | | | 234,373,143 |
| Life Sciences Tools & Services - 45.4% | | | |
| Life Sciences Tools & Services - 45.4% | | | |
| 10X Genomics, Inc. Class B (a)(f) | | 392,772 | 12,957,548 |
| Agilent Technologies, Inc. | | 750,000 | 96,187,500 |
| Avantor, Inc. (a) | | 3,300,000 | 82,203,000 |
| Bio-Rad Laboratories, Inc. Class A (a) | | 170,000 | 82,456,800 |
| Bio-Techne Corp. | | 165,000 | 54,748,650 |
| Bruker Corp. | | 2,200,000 | 123,200,000 |
| Charles River Laboratories International, Inc. (a) | | 200,000 | 41,050,000 |
| Danaher Corp. | | 3,800,000 | 1,025,658,000 |
| IQVIA Holdings, Inc. (a) | | 210,000 | 44,658,600 |
| Lonza Group AG | | 175,000 | 93,331,004 |
| Nanostring Technologies, Inc. (a) | | 2,180,000 | 29,560,800 |
| Olink Holding AB ADR (a)(d) | | 1,280,000 | 19,379,200 |
| Sartorius Stedim Biotech | | 400,000 | 147,004,086 |
| Seer, Inc. (a)(d) | | 2,021,692 | 20,419,089 |
| Stevanato Group SpA | | 1,400,000 | 23,240,000 |
| Thermo Fisher Scientific, Inc. | | 2,000,000 | 1,090,640,001 |
| West Pharmaceutical Services, Inc. | | 750,000 | 222,517,500 |
| | | | 3,209,211,778 |
| Personal Products - 0.6% | | | |
| Personal Products - 0.6% | | | |
| The Beauty Health Co. (a)(d) | | 600,939 | 6,970,892 |
| The Beauty Health Co. (a)(b) | | 3,000,000 | 34,800,000 |
| | | | 41,770,892 |
| Specialty Retail - 0.3% | | | |
| Specialty Stores - 0.3% | | | |
| Warby Parker, Inc. (a)(d) | | 1,750,000 | 21,997,500 |
| TOTAL COMMON STOCKS (Cost $4,610,116,687) | | | 6,811,155,375 |
| | | | |
| Convertible Preferred Stocks - 2.9% |
| | | Shares | Value ($) |
| Biotechnology - 1.3% | | | |
| Biotechnology - 1.3% | | | |
| Asimov, Inc. Series B (b)(c) | | 97,985 | 6,740,388 |
| Caris Life Sciences, Inc. Series D (a)(b)(c) | | 2,803,935 | 15,533,800 |
| Element Biosciences, Inc. Series B (a)(b)(c) | | 2,385,223 | 32,582,146 |
| ElevateBio LLC Series C (a)(b)(c) | | 214,700 | 981,823 |
| Inscripta, Inc. Series D (a)(b)(c) | | 3,938,731 | 23,947,484 |
| Saluda Medical Pty Ltd. Series D (b)(c) | | 1,567,904 | 15,754,832 |
| | | | 95,540,473 |
| Health Care Equipment & Supplies - 0.1% | | | |
| Health Care Supplies - 0.1% | | | |
| Kardium, Inc. Series D6 (a)(b)(c) | | 13,783,189 | 10,258,552 |
| Health Care Providers & Services - 0.2% | | | |
| Health Care Services - 0.2% | | | |
| Conformal Medical, Inc. Series C (a)(b)(c) | | 2,605,625 | 8,572,506 |
| dMed Biopharmaceutical Co. Ltd. Series C (a)(b)(c) | | 309,255 | 2,774,017 |
| | | | 11,346,523 |
| Health Care Technology - 0.7% | | | |
| Health Care Technology - 0.7% | | | |
| Aledade, Inc.: | | | |
| Series B1 (a)(b)(c) | | 175,232 | 8,728,306 |
| Series E1 (b)(c) | | 58,567 | 2,917,222 |
| DNA Script: | | | |
| Series B (b)(c) | | 59 | 43,228 |
| Series C (b)(c) | | 28,249 | 20,697,446 |
| Omada Health, Inc. Series E (b)(c) | | 2,182,939 | 6,024,912 |
| PrognomIQ, Inc.: | | | |
| Series A5 (a)(b)(c) | | 833,333 | 2,166,666 |
| Series B (a)(b)(c) | | 2,735,093 | 7,111,242 |
| Series C (b)(c) | | 752,098 | 1,955,455 |
| | | | 49,644,477 |
| Pharmaceuticals - 0.1% | | | |
| Pharmaceuticals - 0.1% | | | |
| Galvanize Therapeutics Series B (b)(c) | | 3,641,139 | 6,226,348 |
| Textiles, Apparel & Luxury Goods - 0.5% | | | |
| Textiles - 0.5% | | | |
| Freenome, Inc.: | | | |
| Series C (a)(b)(c) | | 2,268,156 | 20,776,309 |
| Series D (b)(c) | | 1,325,855 | 12,144,832 |
| | | | 32,921,141 |
| TOTAL CONVERTIBLE PREFERRED STOCKS (Cost $198,835,399) | | | 205,937,514 |
| | | | |
| Preferred Securities - 0.3% |
| | | Principal Amount (g) | Value ($) |
| Health Care Equipment & Supplies - 0.3% | | | |
| Health Care Supplies - 0.3% | | | |
Kardium, Inc. 0% (b)(c)(h) (Cost $19,551,861) | | 19,551,861 | 19,551,861 |
| | | | |
| Money Market Funds - 2.6% |
| | | Shares | Value ($) |
| Fidelity Cash Central Fund 2.33% (i) | | 40,985,545 | 40,993,742 |
| Fidelity Securities Lending Cash Central Fund 2.34% (i)(j) | | 139,862,258 | 139,876,245 |
| TOTAL MONEY MARKET FUNDS (Cost $180,869,986) | | | 180,869,987 |
| | | | |
| TOTAL INVESTMENT IN SECURITIES - 102.1% (Cost $5,009,373,933) | 7,217,514,737 |
NET OTHER ASSETS (LIABILITIES) - (2.1)% | (146,088,421) |
| NET ASSETS - 100.0% | 7,071,426,316 |
| | |
Legend
| (b) | Restricted securities (including private placements) - Investment in securities not registered under the Securities Act of 1933 (excluding 144A issues). At the end of the period, the value of restricted securities (excluding 144A issues) amounted to $265,953,353 or 3.8% of net assets. |
| (d) | Security or a portion of the security is on loan at period end. |
| (f) | Security exempt from registration under Rule 144A of the Securities Act of 1933. These securities may be resold in transactions exempt from registration, normally to qualified institutional buyers. At the end of the period, the value of these securities amounted to $19,785,878 or 0.3% of net assets. |
| (g) | Amount is stated in United States dollars unless otherwise noted. |
| (h) | Security is perpetual in nature with no stated maturity date. |
| (i) | Affiliated fund that is generally available only to investment companies and other accounts managed by Fidelity Investments. The rate quoted is the annualized seven-day yield of the fund at period end. A complete unaudited listing of the fund's holdings as of its most recent quarter end is available upon request. In addition, each Fidelity Central Fund's financial statements are available on the SEC's website or upon request. |
| (j) | Investment made with cash collateral received from securities on loan. |
| Additional information on each restricted holding is as follows: |
| Security | Acquisition Date | Acquisition Cost ($) |
| Aledade, Inc. Series B1 | 5/07/21 | 6,709,756 |
| Aledade, Inc. Series E1 | 5/20/22 | 2,917,480 |
| Asimov, Inc. Series B | 10/29/21 | 9,081,318 |
| Caris Life Sciences, Inc. Series D | 5/11/21 | 22,711,874 |
| Conformal Medical, Inc. Series C | 7/24/20 | 9,554,996 |
| dMed Biopharmaceutical Co. Ltd. Series C | 12/01/20 | 4,392,395 |
| DNA Script | 12/17/21 | 4,714,776 |
| DNA Script Series B | 12/17/21 | 47,244 |
| DNA Script Series C | 10/01/21 | 24,572,393 |
| Element Biosciences, Inc. Series B | 12/13/19 | 12,500,000 |
| ElevateBio LLC Series C | 3/09/21 | 900,667 |
| Freenome, Inc. Series C | 8/14/20 | 14,999,996 |
| Freenome, Inc. Series D | 11/22/21 | 9,999,996 |
| Galvanize Therapeutics Series B | 3/29/22 | 6,303,849 |
| Inscripta, Inc. Series D | 11/13/20 | 18,000,001 |
| Kardium, Inc. Series D6 | 12/30/20 | 14,001,515 |
| Kardium, Inc. 0% | 12/30/20 | 19,551,861 |
| Omada Health, Inc. Series E | 12/22/21 | 13,087,156 |
| PrognomIQ, Inc. Series A5 | 8/20/20 | 503,333 |
| PrognomIQ, Inc. Series B | 9/11/20 | 6,249,999 |
| PrognomIQ, Inc. Series C | 2/16/22 | 2,301,420 |
| Saluda Medical Pty Ltd. Series D | 1/20/22 | 20,000,011 |
| Saluda Medical Pty Ltd. warrants | 1/20/22 | 0 |
| The Beauty Health Co. | 12/08/20 | 30,000,000 |
Affiliated Central Funds
Fiscal year to date information regarding the Fund's investments in Fidelity Central Funds, including the ownership percentage, is presented below.
| Affiliate | Value, beginning of period ($) | Purchases ($) | Sales Proceeds ($) | Dividend Income ($) | Realized Gain (loss) ($) | Change in Unrealized appreciation (depreciation) ($) | Value, end of period ($) | %ownership, end of period |
| Fidelity Cash Central Fund 2.33% | 21,433,102 | 570,997,918 | 551,437,279 | 603,850 | - | 1 | 40,993,742 | 0.1% |
| Fidelity Securities Lending Cash Central Fund 2.34% | 73,452,626 | 541,550,704 | 475,127,085 | 960,644 | - | - | 139,876,245 | 0.4% |
| Total | 94,885,728 | 1,112,548,622 | 1,026,564,364 | 1,564,494 | - | 1 | 180,869,987 | |
| | | | | | | | | |
Amounts in the income column in the above table include any capital gain distributions from underlying funds, which are presented in the corresponding line item in the Statement of Operations, if applicable.
Amount for Fidelity Securities Lending Cash Central Fund represents the income earned on investing cash collateral, less rebates paid to borrowers and any lending agent fees associated with the loan, plus any premium payments received for lending certain types of securities.
Other Affiliated Issuers
An affiliated company is a company in which the Fund has ownership of at least 5% of the voting securities. Fiscal year to date transactions with companies which are or were affiliates are as follows:
| Affiliate | Value, beginning of period ($) | Purchases ($) | Sales Proceeds ($) | Dividend Income ($) | Realized Gain (loss) ($) | Change in Unrealized appreciation (depreciation) ($) | Value, end of period ($) |
| Nanosonics Ltd. | 63,907,137 | - | 12,591,867 | - | (302,332) | (4,420,121) | 46,592,817 |
| Total | 63,907,137 | - | 12,591,867 | - | (302,332) | (4,420,121) | 46,592,817 |
Investment Valuation
The following is a summary of the inputs used, as of August 31, 2022, involving the Fund's assets and liabilities carried at fair value. The inputs or methodology used for valuing securities may not be an indication of the risk associated with investing in those securities. For more information on valuation inputs, and their aggregation into the levels used below, please refer to the Investment Valuation section in the accompanying Notes to Financial Statements.
| Valuation Inputs at Reporting Date: |
| Description | Total ($) | Level 1 ($) | Level 2 ($) | Level 3 ($) |
Investments in Securities: | | | | |
|
| Common Stocks | 6,811,155,375 | 6,598,062,642 | 207,428,755 | 5,663,978 |
|
| Convertible Preferred Stocks | 205,937,514 | - | - | 205,937,514 |
|
| Preferred Securities | 19,551,861 | - | - | 19,551,861 |
|
| Money Market Funds | 180,869,987 | 180,869,987 | - | - |
| Total Investments in Securities: | 7,217,514,737 | 6,778,932,629 | 207,428,755 | 231,153,353 |
The following is a reconciliation of Investments in Securities for which Level 3 inputs were used in determining value:
| |
| Investments in Securities: | |
| Convertible Preferred Stocks | | | |
| Beginning Balance | $ | 240,783,918 | |
| Net Realized Gain (Loss) on Investment Securities | | - | |
| Net Unrealized Gain (Loss) on Investment Securities | | (44,067,733) | |
| Cost of Purchases | | 9,221,329 | |
| Proceeds of Sales | | - | |
| Amortization/Accretion | | - | |
| Transfers into Level 3 | | - | |
| Transfers out of Level 3 | | - | |
| Ending Balance | $ | 205,937,514 | |
| The change in unrealized gain (loss) for the period attributable to Level 3 securities held at August 31, 2022 | $ | (44,067,733) | |
| Other Investments in Securities | | | |
| Beginning Balance | $ | 25,605,694 | |
| Net Realized Gain (Loss) on Investment Securities | | - | |
| Net Unrealized Gain (Loss) on Investment Securities | | (389,855) | |
| Cost of Purchases | | - | |
| Proceeds of Sales | | - | |
| Amortization/Accretion | | - | |
| Transfers into Level 3 | | - | |
| Transfers out of Level 3 | | - | |
| Ending Balance | $ | 25,215,839 | |
| The change in unrealized gain (loss) for the period attributable to Level 3 securities held at August 31, 2022 | $ | (389,855) | |
| The information used in the above reconciliation represents fiscal year to date activity for any Investments in Securities identified as using Level 3 inputs at either the beginning or the end of the current fiscal period. Cost of purchases and proceeds of sales may include securities received and/or delivered through in-kind transactions. Transfers into Level 3 were attributable to a lack of observable market data resulting from decreases in market activity, decreases in liquidity, security restructurings or corporate actions. Transfers out of Level 3 were attributable to observable market data becoming available for those securities. Transfers in or out of Level 3 represent the beginning value of any Security or Instrument where a change in the pricing level occurred from the beginning to the end of the period. The cost of purchases and the proceeds of sales may include securities received or delivered through corporate actions or exchanges. Realized and unrealized gains (losses) disclosed in the reconciliation are included in Net Gain (Loss) on the Fund's Statement of Operations. | |
Medical Technology and Devices Portfolio
| Statement of Assets and Liabilities |
| | | | August 31, 2022 (Unaudited) |
| | | | | |
| Assets | | | | |
| Investment in securities, at value (including securities loaned of $138,672,972) - See accompanying schedule: | | $6,990,051,933 | | |
Unaffiliated issuers (cost $4,793,205,266) | | | |
Fidelity Central Funds (cost $180,869,986) | | 180,869,987 | | |
Other affiliated issuers (cost $35,298,681) | | 46,592,817 | | |
| | | | | |
| Total Investment in Securities (cost $5,009,373,933) | | | $ | 7,217,514,737 |
| Foreign currency held at value (cost $42,484) | | | | 42,484 |
| Receivable for investments sold | | | | 9,918,096 |
| Receivable for fund shares sold | | | | 679,669 |
| Dividends receivable | | | | 1,103,983 |
| Distributions receivable from Fidelity Central Funds | | | | 462,148 |
| Prepaid expenses | | | | 26,402 |
| Other receivables | | | | 264,473 |
Total assets | | | | 7,230,011,992 |
| Liabilities | | | | |
| Payable for investments purchased | | 9,631,425 | | |
| Payable for fund shares redeemed | | 4,457,866 | | |
| Accrued management fee | | 3,315,220 | | |
| Other affiliated payables | | 1,046,013 | | |
| Other payables and accrued expenses | | 267,472 | | |
| Collateral on securities loaned | | 139,867,680 | | |
| Total Liabilities | | | | 158,585,676 |
| Net Assets | | | $ | 7,071,426,316 |
| Net Assets consist of: | | | | |
| Paid in capital | | | $ | 5,125,594,707 |
| Total accumulated earnings (loss) | | | | 1,945,831,609 |
| Net Assets | | | $ | 7,071,426,316 |
Net Asset Value , offering price and redemption price per share ($7,071,426,316 ÷ 119,190,299 shares) | | | $ | 59.33 |
| | | | | |
| Statement of Operations |
| | | | Six months ended August 31, 2022 (Unaudited) |
| Investment Income | | | | |
| Dividends | | | $ | 10,383,852 |
| Income from Fidelity Central Funds (including $960,644 from security lending) | | | | 1,564,494 |
| Total Income | | | | 11,948,346 |
| Expenses | | | | |
| Management fee | $ | 20,369,355 | | |
| Transfer agent fees | | 5,964,273 | | |
| Accounting fees | | 565,973 | | |
| Custodian fees and expenses | | 38,903 | | |
| Independent trustees' fees and expenses | | 12,704 | | |
| Registration fees | | 16,422 | | |
| Audit | | 17,572 | | |
| Legal | | 2,816 | | |
| Interest | | 814 | | |
| Miscellaneous | | 24,232 | | |
| Total expenses before reductions | | 27,013,064 | | |
| Expense reductions | | (130,112) | | |
| Total expenses after reductions | | | | 26,882,952 |
| Net Investment income (loss) | | | | (14,934,606) |
| Realized and Unrealized Gain (Loss) | | | | |
| Net realized gain (loss) on: | | | | |
| Investment Securities: | | | | |
| Unaffiliated issuers | | (136,202,778) | | |
| Affiliated issuers | | (302,332) | | |
| Foreign currency transactions | | 15,515 | | |
| Total net realized gain (loss) | | | | (136,489,595) |
| Change in net unrealized appreciation (depreciation) on: | | | | |
| Investment Securities: | | | | |
| Unaffiliated issuers | | (1,155,858,467) | | |
| Fidelity Central Funds | | 1 | | |
| Other affiliated issuers | | (4,420,121) | | |
| Assets and liabilities in foreign currencies | | 34,352 | | |
| Total change in net unrealized appreciation (depreciation) | | | | (1,160,244,235) |
| Net gain (loss) | | | | (1,296,733,830) |
| Net increase (decrease) in net assets resulting from operations | | | $ | (1,311,668,436) |
| Statement of Changes in Net Assets |
| |
| | Six months ended August 31, 2022 (Unaudited) | | Year ended February 28, 2022 |
| Increase (Decrease) in Net Assets | | | | |
| Operations | | | | |
| Net investment income (loss) | $ | (14,934,606) | $ | (44,939,672) |
| Net realized gain (loss) | | (136,489,595) | | 498,712,415 |
| Change in net unrealized appreciation (depreciation) | | (1,160,244,235) | | (241,663,649) |
| Net increase (decrease) in net assets resulting from operations | | (1,311,668,436) | | 212,109,094 |
| Distributions to shareholders | | (137,785,975) | | (808,325,364) |
| Share transactions | | | | |
| Proceeds from sales of shares | | 271,156,218 | | 1,949,163,820 |
| Reinvestment of distributions | | 128,703,751 | | 757,192,690 |
| Cost of shares redeemed | | (784,813,559) | | (1,877,605,232) |
Net increase (decrease) in net assets resulting from share transactions | | (384,953,590) | | 828,751,278 |
| Total increase (decrease) in net assets | | (1,834,408,001) | | 232,535,008 |
| | | | | |
| Net Assets | | | | |
| Beginning of period | | 8,905,834,317 | | 8,673,299,309 |
| End of period | $ | 7,071,426,316 | $ | 8,905,834,317 |
| | | | | |
| Other Information | | | | |
| Shares | | | | |
| Sold | | 4,207,619 | | 24,345,738 |
| Issued in reinvestment of distributions | | 1,786,060 | | 9,855,790 |
| Redeemed | | (12,547,371) | | (24,120,700) |
| Net increase (decrease) | | (6,553,692) | | 10,080,828 |
| | | | | |
| Medical Technology and Devices Portfolio |
| |
| | Six months ended (Unaudited) August 31, 2022 | | Years ended February 28, 2022 | | 2021 | | 2020 A | | 2019 | | 2018 |
Selected Per-Share Data | | | | | | | | | | | | |
| Net asset value, beginning of period | $ | 70.83 | $ | 74.99 | $ | 55.88 | $ | 52.92 | $ | 46.09 | $ | 41.48 |
| Income from Investment Operations | | | | | | | | | | | | |
Net investment income (loss) B,C | | (.12) | | (.37) | | (.24) | | (.08) | | (.04) | | .05 |
| Net realized and unrealized gain (loss) | | (10.27) | | 2.97 | | 24.19 | | 4.10 | | 10.40 | | 7.31 |
| Total from investment operations | | (10.39) | | 2.60 | | 23.95 | | 4.02 | | 10.36 | | 7.36 |
| Distributions from net investment income | | - | | - | | - | | - | | - | | (.08) |
| Distributions from net realized gain | | (1.11) | | (6.76) | | (4.84) | | (1.06) | | (3.53) | | (2.67) |
| Total distributions | | (1.11) | | (6.76) | | (4.84) | | (1.06) | | (3.53) | | (2.75) |
| Net asset value, end of period | $ | 59.33 | $ | 70.83 | $ | 74.99 | $ | 55.88 | $ | 52.92 | $ | 46.09 |
Total Return D,E | | (14.95)% | | 2.95% | | 44.20% | | 7.46% | | 23.85% | | 18.01% |
Ratios to Average Net Assets C,F,G | | | | | | | | | | | | |
| Expenses before reductions | | .70% H | | .68% | | .70% | | .71% | | .73% | | .76% |
| Expenses net of fee waivers, if any | | .69% H | | .68% | | .70% | | .71% | | .73% | | .76% |
| Expenses net of all reductions | | .69% H | | .68% | | .70% | | .71% | | .73% | | .75% |
| Net investment income (loss) | | (.39)% H | | (.46)% | | (.36)% | | (.15)% | | (.07)% | | .11% |
| Supplemental Data | | | | | | | | | | | | |
| Net assets, end of period (000 omitted) | $ | 7,071,426 | $ | 8,905,834 | $ | 8,673,299 | $ | 6,058,766 | $ | 6,787,645 | $ | 4,063,926 |
Portfolio turnover rate I | | 27% H | | 32% | | 58% | | 35% | | 43% | | 77% |
A For the year ended February 29.
B Calculated based on average shares outstanding during the period.
C Net investment income (loss) is affected by the timing of the declaration of dividends by any underlying mutual funds or exchange-traded funds (ETFs). Net investment income (loss) of any such underlying funds is not included in the Fund's net investment income (loss) ratio.
D Total returns for periods of less than one year are not annualized.
E Total returns would have been lower if certain expenses had not been reduced during the applicable periods shown.
F Fees and expenses of any underlying mutual funds or exchange-traded funds (ETFs) are not included in the Fund's expense ratio. The Fund indirectly bears its proportionate share of these expenses. For additional expense information related to investments in Fidelity Central Funds, please refer to the "Investments in Fidelity Central Funds" note found in the Notes to Financial Statements section of the most recent Annual or Semi-Annual report.
G Expense ratios reflect operating expenses of the class. Expenses before reductions do not reflect amounts reimbursed, waived, or reduced through arrangements with the investment adviser, brokerage services, or other offset arrangements, if applicable, and do not represent the amount paid by the class during periods when reimbursements, waivers or reductions occur.
H Annualized
I Amount does not include the portfolio activity of any underlying mutual funds or exchange-traded funds (ETFs).
Top Holdings (% of Fund's net assets) |
| |
| Eli Lilly & Co. | 13.1 | |
| AstraZeneca PLC sponsored ADR | 11.7 | |
| Sanofi SA sponsored ADR | 8.9 | |
| Bristol-Myers Squibb Co. | 6.5 | |
| Roche Holding AG (participation certificate) | 5.2 | |
| Royalty Pharma PLC | 4.9 | |
| Novartis AG sponsored ADR | 4.1 | |
| Merck & Co., Inc. | 3.4 | |
| Merck KGaA | 3.0 | |
| Johnson & Johnson | 2.6 | |
| | 63.4 | |
| |
Percentages shown as 0.0% may reflect amounts less than 0.05%.
| Industries (% of Fund's net assets) |
| |
| Pharmaceuticals | 75.4 | |
| Biotechnology | 18.6 | |
| Health Care Providers & Services | 3.2 | |
| Life Sciences Tools & Services | 1.1 | |
| Health Care Equipment & Supplies | 0.8 | |
| Diversified Financial Services | 0.1 | |
| Food & Staples Retailing | 0.0 | |
| Software | 0.0 | |
| |
Percentages shown as 0.0% may reflect amounts less than 0.05%.
Geographic Diversification (% of Fund's net assets) |
|
* Includes Short-Term investments and Net Other Assets (Liabilities). Percentages are based on country or territory of incorporation and are adjusted for the effect of futures contracts, if applicable. |
| |
Pharmaceuticals Portfolio
| Common Stocks - 98.7% |
| | | Shares | Value ($) |
| Biotechnology - 18.2% | | | |
| Biotechnology - 18.2% | | | |
| 2seventy bio, Inc. (a) | | 209,200 | 3,081,516 |
| ADC Therapeutics SA (a)(b) | | 419,700 | 2,862,354 |
| Alnylam Pharmaceuticals, Inc. (a) | | 36,571 | 7,558,129 |
| Amicus Therapeutics, Inc. (a) | | 295,700 | 3,320,711 |
| Arcellx, Inc. | | 157,100 | 2,823,087 |
| Arcus Biosciences, Inc. (a) | | 126,600 | 3,048,528 |
| Argenx SE (a) | | 17,400 | 6,552,171 |
| Argenx SE ADR (a) | | 11,000 | 4,156,570 |
| Ascendis Pharma A/S sponsored ADR (a) | | 51,300 | 4,594,941 |
| Beam Therapeutics, Inc. (a)(b) | | 87,200 | 4,761,120 |
| Biogen, Inc. (a) | | 42,200 | 8,245,036 |
| BioInvent International AB (a) | | 1,648,418 | 7,175,103 |
| BioNTech SE ADR (b) | | 48,200 | 6,971,648 |
| Blueprint Medicines Corp. (a) | | 150,700 | 11,034,254 |
| Celldex Therapeutics, Inc. (a) | | 73,400 | 2,231,360 |
| Cullinan Oncology, Inc. (a) | | 88,100 | 1,187,588 |
| Cytokinetics, Inc. (a) | | 75,100 | 3,977,296 |
| Galapagos NV sponsored ADR (a) | | 36,900 | 1,847,214 |
| Generation Bio Co. (a) | | 250,176 | 1,280,901 |
| Horizon Therapeutics PLC (a) | | 74,500 | 4,411,145 |
| Intellia Therapeutics, Inc. (a) | | 15,400 | 924,924 |
| iTeos Therapeutics, Inc. (a) | | 183,800 | 4,076,684 |
| Kalvista Pharmaceuticals, Inc. (a) | | 374,800 | 6,172,956 |
| Leap Therapeutics, Inc. warrants 1/31/26 (a) | | 606,000 | 251,951 |
| Legend Biotech Corp. ADR (a) | | 259,400 | 12,059,506 |
| NextCure, Inc. (a)(b) | | 336,900 | 1,381,290 |
| Oxurion NV (a)(b)(c) | | 3,128,819 | 701,180 |
| PTC Therapeutics, Inc. (a) | | 157,700 | 7,875,538 |
| Sarepta Therapeutics, Inc. (a) | | 118,500 | 12,961,530 |
| Springworks Therapeutics, Inc. (a)(b) | | 44,300 | 1,230,211 |
| Synlogic, Inc. (a) | | 520,700 | 520,700 |
| uniQure B.V. (a) | | 170,500 | 3,331,570 |
| Xencor, Inc. (a) | | 123,168 | 3,250,404 |
| XOMA Corp. (a)(b) | | 53,300 | 1,059,604 |
| | | | 146,918,720 |
| Food & Staples Retailing - 0.0% | | | |
| Drug Retail - 0.0% | | | |
| MedAvail Holdings, Inc. (a) | | 3,333 | 3,866 |
| Health Care Equipment & Supplies - 0.8% | | | |
| Health Care Equipment - 0.8% | | | |
| Angiodynamics, Inc. (a) | | 282,000 | 6,243,480 |
| Health Care Providers & Services - 3.2% | | | |
| Health Care Services - 3.2% | | | |
| 23andMe Holding Co. Class B (d) | | 396,606 | 1,336,562 |
| Cigna Corp. | | 55,200 | 15,646,440 |
| Guardant Health, Inc. (a) | | 172,000 | 8,610,320 |
| | | | 25,593,322 |
| Life Sciences Tools & Services - 1.1% | | | |
| Life Sciences Tools & Services - 1.1% | | | |
| Maravai LifeSciences Holdings, Inc. (a) | | 193,500 | 4,038,345 |
| Sartorius Stedim Biotech | | 13,900 | 5,108,392 |
| | | | 9,146,737 |
| Pharmaceuticals - 75.4% | | | |
| Pharmaceuticals - 75.4% | | | |
| Arvinas Holding Co. LLC (a) | | 55,600 | 2,354,104 |
| AstraZeneca PLC sponsored ADR | | 1,517,900 | 94,686,602 |
| Axsome Therapeutics, Inc. (a)(b) | | 43,400 | 2,768,920 |
| Bristol-Myers Squibb Co. | | 779,080 | 52,517,783 |
| Edgewise Therapeutics, Inc. (a) | | 455,400 | 4,590,432 |
| Eli Lilly & Co. | | 350,761 | 105,659,735 |
| Euroapi SASU (a) | | 163,500 | 2,555,832 |
| GSK PLC sponsored ADR | | 515,160 | 16,732,397 |
| Harmony Biosciences Holdings, Inc. (a)(b) | | 73,077 | 3,208,811 |
| Intra-Cellular Therapies, Inc. (a) | | 91,200 | 4,583,712 |
| Jazz Pharmaceuticals PLC (a) | | 53,700 | 8,335,314 |
| Johnson & Johnson | | 131,950 | 21,288,813 |
| Merck & Co., Inc. | | 317,936 | 27,139,017 |
| Merck KGaA | | 140,800 | 24,186,619 |
| NGM Biopharmaceuticals, Inc. (a) | | 108,600 | 1,532,346 |
| Novartis AG sponsored ADR | | 411,596 | 33,141,710 |
| Pharvaris BV (a) | | 60,939 | 553,936 |
| Pliant Therapeutics, Inc. (a)(b) | | 488,000 | 9,408,640 |
| Roche Holding AG (participation certificate) | | 131,086 | 42,241,369 |
| Royalty Pharma PLC | | 944,700 | 39,497,907 |
| Sanofi SA sponsored ADR | | 1,759,322 | 72,184,982 |
| UCB SA | | 282,900 | 19,929,455 |
| Zoetis, Inc. Class A | | 121,800 | 19,065,354 |
| Zogenix, Inc. rights (a)(e) | | 800 | 544 |
| | | | 608,164,334 |
| TOTAL COMMON STOCKS (Cost $614,743,413) | | | 796,070,459 |
| | | | |
| Convertible Preferred Stocks - 0.5% |
| | | Shares | Value ($) |
| Biotechnology - 0.4% | | | |
| Biotechnology - 0.4% | | | |
| Castle Creek Biosciences, Inc.: | | | |
| Series D1 (e)(f) | | 6,308 | 1,285,192 |
| Series D2 (e)(f) | | 85 | 17,318 |
| ValenzaBio, Inc. Series A (a)(e)(f) | | 224,708 | 1,332,518 |
| | | | 2,635,028 |
| Diversified Financial Services - 0.1% | | | |
| Other Diversified Financial Services - 0.1% | | | |
| Paragon Biosciences Emalex Capital, Inc. Series C (a)(e)(f) | | 158,879 | 891,311 |
| Pharmaceuticals - 0.0% | | | |
| Pharmaceuticals - 0.0% | | | |
| Castle Creek Pharmaceutical Holdings, Inc. Series C (a)(e)(f) | | 200 | 44,304 |
| Software - 0.0% | | | |
| Systems Software - 0.0% | | | |
| Evozyne LLC Series A (a)(e)(f) | | 5,900 | 91,981 |
| TOTAL CONVERTIBLE PREFERRED STOCKS (Cost $5,286,055) | | | 3,662,624 |
| | | | |
| Convertible Bonds - 0.0% |
| | | Principal Amount (g) | Value ($) |
| Diversified Financial Services - 0.0% | | | |
| Other Diversified Financial Services - 0.0% | | | |
Paragon Biosciences Emalex Capital, Inc. 1.26% (e)(f)(h) (Cost $193,747) | | 193,747 | 193,747 |
| | | | |
| Money Market Funds - 3.4% |
| | | Shares | Value ($) |
| Fidelity Cash Central Fund 2.33% (i) | | 4,238,327 | 4,239,174 |
| Fidelity Securities Lending Cash Central Fund 2.34% (i)(j) | | 23,347,209 | 23,349,544 |
| TOTAL MONEY MARKET FUNDS (Cost $27,588,718) | | | 27,588,718 |
| | | | |
| TOTAL INVESTMENT IN SECURITIES - 102.6% (Cost $647,811,933) | 827,515,548 |
NET OTHER ASSETS (LIABILITIES) - (2.6)% | (21,067,983) |
| NET ASSETS - 100.0% | 806,447,565 |
| | |
Legend
| (b) | Security or a portion of the security is on loan at period end. |
| (d) | Security exempt from registration under Rule 144A of the Securities Act of 1933. These securities may be resold in transactions exempt from registration, normally to qualified institutional buyers. At the end of the period, the value of these securities amounted to $1,336,562 or 0.2% of net assets. |
| (f) | Restricted securities (including private placements) - Investment in securities not registered under the Securities Act of 1933 (excluding 144A issues). At the end of the period, the value of restricted securities (excluding 144A issues) amounted to $3,856,371 or 0.5% of net assets. |
| (g) | Amount is stated in United States dollars unless otherwise noted. |
| (h) | Security is perpetual in nature with no stated maturity date. |
| (i) | Affiliated fund that is generally available only to investment companies and other accounts managed by Fidelity Investments. The rate quoted is the annualized seven-day yield of the fund at period end. A complete unaudited listing of the fund's holdings as of its most recent quarter end is available upon request. In addition, each Fidelity Central Fund's financial statements are available on the SEC's website or upon request. |
| (j) | Investment made with cash collateral received from securities on loan. |
| Additional information on each restricted holding is as follows: |
| Security | Acquisition Date | Acquisition Cost ($) |
| Castle Creek Biosciences, Inc. Series D1 | 4/19/22 | 1,356,409 |
| Castle Creek Biosciences, Inc. Series D2 | 6/28/21 | 14,700 |
| Castle Creek Pharmaceutical Holdings, Inc. Series C | 12/09/19 | 82,370 |
| Evozyne LLC Series A | 4/09/21 | 132,573 |
| Paragon Biosciences Emalex Capital, Inc. Series C | 2/26/21 | 1,700,005 |
| Paragon Biosciences Emalex Capital, Inc. 1.26% | 5/18/22 | 193,747 |
| ValenzaBio, Inc. Series A | 3/25/21 | 1,999,998 |
Affiliated Central Funds
Fiscal year to date information regarding the Fund's investments in Fidelity Central Funds, including the ownership percentage, is presented below.
| Affiliate | Value, beginning of period ($) | Purchases ($) | Sales Proceeds ($) | Dividend Income ($) | Realized Gain (loss) ($) | Change in Unrealized appreciation (depreciation) ($) | Value, end of period ($) | %ownership, end of period |
| Fidelity Cash Central Fund 2.33% | 10,726,575 | 193,886,427 | 200,373,828 | 50,126 | - | - | 4,239,174 | 0.0% |
| Fidelity Securities Lending Cash Central Fund 2.34% | 7,039,136 | 249,322,951 | 233,012,543 | 23,027 | - | - | 23,349,544 | 0.1% |
| Total | 17,765,711 | 443,209,378 | 433,386,371 | 73,153 | - | - | 27,588,718 | |
| | | | | | | | | |
Amounts in the income column in the above table include any capital gain distributions from underlying funds, which are presented in the corresponding line item in the Statement of Operations, if applicable.
Amount for Fidelity Securities Lending Cash Central Fund represents the income earned on investing cash collateral, less rebates paid to borrowers and any lending agent fees associated with the loan, plus any premium payments received for lending certain types of securities.
Other Affiliated Issuers
An affiliated company is a company in which the Fund has ownership of at least 5% of the voting securities. Fiscal year to date transactions with companies which are or were affiliates are as follows:
| Affiliate | Value, beginning of period ($) | Purchases ($) | Sales Proceeds ($) | Dividend Income ($) | Realized Gain (loss) ($) | Change in Unrealized appreciation (depreciation) ($) | Value, end of period ($) |
| Oxurion NV | - | 4,984,659 | - | - | - | (4,283,479) | 701,180 |
| Total | - | 4,984,659 | - | - | - | (4,283,479) | 701,180 |
Investment Valuation
The following is a summary of the inputs used, as of August 31, 2022, involving the Fund's assets and liabilities carried at fair value. The inputs or methodology used for valuing securities may not be an indication of the risk associated with investing in those securities. For more information on valuation inputs, and their aggregation into the levels used below, please refer to the Investment Valuation section in the accompanying Notes to Financial Statements.
| Valuation Inputs at Reporting Date: |
| Description | Total ($) | Level 1 ($) | Level 2 ($) | Level 3 ($) |
Investments in Securities: | | | | |
|
| Common Stocks | 796,070,459 | 722,837,805 | 73,232,110 | 544 |
|
| Convertible Preferred Stocks | 3,662,624 | - | - | 3,662,624 |
|
| Convertible Bonds | 193,747 | - | - | 193,747 |
|
| Money Market Funds | 27,588,718 | 27,588,718 | - | - |
| Total Investments in Securities: | 827,515,548 | 750,426,523 | 73,232,110 | 3,856,915 |
Pharmaceuticals Portfolio
| Statement of Assets and Liabilities |
| | | | August 31, 2022 (Unaudited) |
| | | | | |
| Assets | | | | |
| Investment in securities, at value (including securities loaned of $23,170,174) - See accompanying schedule: | | $799,225,650 | | |
Unaffiliated issuers (cost $615,238,556) | | | |
Fidelity Central Funds (cost $27,588,718) | | 27,588,718 | | |
Other affiliated issuers (cost $4,984,659) | | 701,180 | | |
| | | | | |
| Total Investment in Securities (cost $647,811,933) | | | $ | 827,515,548 |
| Foreign currency held at value (cost $289) | | | | 291 |
| Receivable for fund shares sold | | | | 162,492 |
| Dividends receivable | | | | 1,633,404 |
| Reclaims receivable | | | | 2,092,992 |
| Interest receivable | | | | 705 |
| Distributions receivable from Fidelity Central Funds | | | | 15,585 |
| Prepaid expenses | | | | 4,036 |
| Other receivables | | | | 154,116 |
Total assets | | | | 831,579,169 |
| Liabilities | | | | |
| Payable for fund shares redeemed | | 1,092,702 | | |
| Accrued management fee | | 375,946 | | |
| Other affiliated payables | | 146,674 | | |
| Other payables and accrued expenses | | 167,446 | | |
| Collateral on securities loaned | | 23,348,836 | | |
| Total Liabilities | | | | 25,131,604 |
| Net Assets | | | $ | 806,447,565 |
| Net Assets consist of: | | | | |
| Paid in capital | | | $ | 595,295,688 |
| Total accumulated earnings (loss) | | | | 211,151,877 |
| Net Assets | | | $ | 806,447,565 |
Net Asset Value , offering price and redemption price per share ($806,447,565 ÷ 36,569,363 shares) | | | $ | 22.05 |
| | | | | |
| Statement of Operations |
| | | | Six months ended August 31, 2022 (Unaudited) |
| Investment Income | | | | |
| Dividends | | | $ | 10,870,012 |
| Foreign Tax Reclaims | | | | 1,218,788 |
| Interest | | | | 1,003 |
| Income from Fidelity Central Funds (including $23,027 from security lending) | | | | 73,153 |
| Income before foreign taxes withheld | | | | 12,162,956 |
| Less foreign taxes withheld | | | | (1,894,498) |
| Total Income | | | | 10,268,458 |
| Expenses | | | | |
| Management fee | $ | 2,287,380 | | |
| Transfer agent fees | | 750,756 | | |
| Accounting fees | | 140,662 | | |
| Custodian fees and expenses | | 13,734 | | |
| Independent trustees' fees and expenses | | 1,406 | | |
| Registration fees | | 37,978 | | |
| Audit | | 18,117 | | |
| Legal | | 2,262 | | |
| Interest | | 400 | | |
| Miscellaneous | | 2,578 | | |
| Total expenses before reductions | | 3,255,273 | | |
| Expense reductions | | (13,861) | | |
| Total expenses after reductions | | | | 3,241,412 |
| Net Investment income (loss) | | | | 7,027,046 |
| Realized and Unrealized Gain (Loss) | | | | |
| Net realized gain (loss) on: | | | | |
| Investment Securities: | | | | |
| Unaffiliated issuers | | 27,700,579 | | |
| Foreign currency transactions | | 5,990 | | |
| Total net realized gain (loss) | | | | 27,706,569 |
| Change in net unrealized appreciation (depreciation) on: | | | | |
| Investment Securities: | | | | |
| Unaffiliated issuers | | (35,754,428) | | |
| Affiliated issuers | | (4,283,479) | | |
| Assets and liabilities in foreign currencies | | (105,170) | | |
| Total change in net unrealized appreciation (depreciation) | | | | (40,143,077) |
| Net gain (loss) | | | | (12,436,508) |
| Net increase (decrease) in net assets resulting from operations | | | $ | (5,409,462) |
| Statement of Changes in Net Assets |
| |
| | Six months ended August 31, 2022 (Unaudited) | | Year ended February 28, 2022 |
| Increase (Decrease) in Net Assets | | | | |
| Operations | | | | |
| Net investment income (loss) | $ | 7,027,046 | $ | 9,312,735 |
| Net realized gain (loss) | | 27,706,569 | | 66,607,987 |
| Change in net unrealized appreciation (depreciation) | | (40,143,077) | | (29,793,616) |
| Net increase (decrease) in net assets resulting from operations | | (5,409,462) | | 46,127,106 |
| Distributions to shareholders | | (10,339,389) | | (87,692,898) |
| Share transactions | | | | |
| Proceeds from sales of shares | | 110,455,465 | | 223,427,519 |
| Reinvestment of distributions | | 9,823,096 | | 83,261,883 |
| Cost of shares redeemed | | (232,830,061) | | (163,755,378) |
Net increase (decrease) in net assets resulting from share transactions | | (112,551,500) | | 142,934,024 |
| Total increase (decrease) in net assets | | (128,300,351) | | 101,368,232 |
| | | | | |
| Net Assets | | | | |
| Beginning of period | | 934,747,916 | | 833,379,684 |
| End of period | $ | 806,447,565 | $ | 934,747,916 |
| | | | | |
| Other Information | | | | |
| Shares | | | | |
| Sold | | 4,740,589 | | 9,855,327 |
| Issued in reinvestment of distributions | | 395,933 | | 3,596,826 |
| Redeemed | | (10,053,473) | | (6,801,557) |
| Net increase (decrease) | | (4,916,951) | | 6,650,596 |
| | | | | |
| Pharmaceuticals Portfolio |
| |
| | Six months ended (Unaudited) August 31, 2022 | | Years ended February 28, 2022 | | 2021 | | 2020 A | | 2019 | | 2018 |
Selected Per-Share Data | | | | | | | | | | | | |
| Net asset value, beginning of period | $ | 22.53 | $ | 23.92 | $ | 21.71 | $ | 21.07 | $ | 18.82 | $ | 18.11 |
| Income from Investment Operations | | | | | | | | | | | | |
Net investment income (loss) B,C | | .19 | | .27 | | .27 | | .29 | | .29 | | .27 |
| Net realized and unrealized gain (loss) | | (.41) | | .97 | | 4.04 | | 2.29 | | 2.34 | | .74 |
| Total from investment operations | | (.22) | | 1.24 | | 4.31 | | 2.58 | | 2.63 | | 1.01 |
| Distributions from net investment income | | (.06) | | (.28) | | (.31) | | (.31) | | (.28) | | (.25) |
| Distributions from net realized gain | | (.20) | | (2.35) | | (1.79) | | (1.64) | | (.10) | | (.05) |
| Total distributions | | (.26) | | (2.63) | | (2.10) | | (1.94) D | | (.38) | | (.30) |
| Net asset value, end of period | $ | 22.05 | $ | 22.53 | $ | 23.92 | $ | 21.71 | $ | 21.07 | $ | 18.82 |
Total Return E,F | | (1.12)% | | 5.15% | | 20.46% | | 12.06% | | 14.15% | | 5.61% |
Ratios to Average Net Assets C,G,H | | | | | | | | | | | | |
| Expenses before reductions | | .75% I | | .75% | | .77% | | .78% | | .80% | | .81% |
| Expenses net of fee waivers, if any | | .75% I | | .75% | | .77% | | .78% | | .79% | | .81% |
| Expenses net of all reductions | | .75% I | | .75% | | .76% | | .77% | | .79% | | .80% |
| Net investment income (loss) | | 1.62% I | | 1.10% | | 1.13% | | 1.36% | | 1.48% | | 1.44% |
| Supplemental Data | | | | | | | | | | | | |
| Net assets, end of period (000 omitted) | $ | 806,448 | $ | 934,748 | $ | 833,380 | $ | 764,285 | $ | 747,604 | $ | 744,563 |
Portfolio turnover rate J | | 42% I | | 29% | | 32% | | 52% | | 55% | | 89% |
A For the year ended February 29.
B Calculated based on average shares outstanding during the period.
C Net investment income (loss) is affected by the timing of the declaration of dividends by any underlying mutual funds or exchange-traded funds (ETFs). Net investment income (loss) of any such underlying funds is not included in the Fund's net investment income (loss) ratio.
D Total distributions per share do not sum due to rounding.
E Total returns for periods of less than one year are not annualized.
F Total returns would have been lower if certain expenses had not been reduced during the applicable periods shown.
G Fees and expenses of any underlying mutual funds or exchange-traded funds (ETFs) are not included in the Fund's expense ratio. The Fund indirectly bears its proportionate share of these expenses. For additional expense information related to investments in Fidelity Central Funds, please refer to the "Investments in Fidelity Central Funds" note found in the Notes to Financial Statements section of the most recent Annual or Semi-Annual report.
H Expense ratios reflect operating expenses of the class. Expenses before reductions do not reflect amounts reimbursed, waived, or reduced through arrangements with the investment adviser, brokerage services, or other offset arrangements, if applicable, and do not represent the amount paid by the class during periods when reimbursements, waivers or reductions occur.
I Annualized
J Amount does not include the portfolio activity of any underlying mutual funds or exchange-traded funds (ETFs).
For the period ended August 31, 2022
1. Organization.
Biotechnology Portfolio, Health Care Portfolio, Health Care Services Portfolio, Medical Technology and Devices Portfolio, and Pharmaceuticals Portfolio (the Funds) are non-diversified funds of Fidelity Select Portfolios (the Trust). The Trust is registered under the Investment Company Act of 1940, as amended (the 1940 Act), as an open-end management investment company organized as a Massachusetts business trust. The Funds invest primarily in securities of companies whose principal business activities fall within specific industries. Each Fund is authorized to issue an unlimited number of shares. Share transactions on the Statement of Changes in Net Assets may contain exchanges between affiliated funds.
2. Investments in Fidelity Central Funds.
Funds may invest in Fidelity Central Funds, which are open-end investment companies generally available only to other investment companies and accounts managed by the investment adviser and its affiliates. The Schedule of Investments lists any Fidelity Central Funds held as an investment as of period end, but does not include the underlying holdings of each Fidelity Central Fund. An investing fund indirectly bears its proportionate share of the expenses of the underlying Fidelity Central Funds.
Based on its investment objective, each Fidelity Central Fund may invest or participate in various investment vehicles or strategies that are similar to those of the investing fund. These strategies are consistent with the investment objectives of the investing fund and may involve certain economic risks which may cause a decline in value of each of the Fidelity Central Funds and thus a decline in the value of the investing fund.
| Fidelity Central Fund | Investment Manager | Investment Objective | Investment Practices | Expense Ratio A |
| Fidelity Money Market Central Funds | Fidelity Management & Research Company LLC (FMR) | Each fund seeks to obtain a high level of current income consistent with the preservation of capital and liquidity. | Short-term Investments | Less than .005% |
A Expenses expressed as a percentage of average net assets and are as of each underlying Central Fund's most recent annual or semi-annual shareholder report.
A complete unaudited list of holdings for each Fidelity Central Fund is available upon request or at the Securities and Exchange Commission website at www.sec.gov. In addition, the financial statements of the Fidelity Central Funds which contain the significant accounting policies (including investment valuation policies) of those funds, and are not covered by the Report of Independent Registered Public Accounting Firm, are available on the Securities and Exchange Commission website or upon request.
3. Significant Accounting Policies.
Each Fund is an investment company and applies the accounting and reporting guidance of the Financial Accounting Standards Board (FASB) Accounting Standards Codification Topic 946 Financial Services - Investment Companies . The financial statements have been prepared in conformity with accounting principles generally accepted in the United States of America (GAAP), which require management to make certain estimates and assumptions at the date of the financial statements. Actual results could differ from those estimates. Subsequent events, if any, through the date that the financial statements were issued have been evaluated in the preparation of the financial statements. Each Fund's Schedule of Investments lists any underlying mutual funds or exchange-traded funds (ETFs) but does not include the underlying holdings of these funds. The following summarizes the significant accounting policies of each Fund:
Investment Valuation. Investments are valued as of 4:00 p.m. Eastern time on the last calendar day of the period. The Board of Trustees (the Board) has delegated the day to day responsibility for the valuation of each Fund's investments to the Fair Value Committee (the Committee) established by each Fund's investment adviser. In accordance with valuation policies and procedures approved by the Board, each Fund attempts to obtain prices from one or more third party pricing vendors or brokers to value its investments. When current market prices, quotations or currency exchange rates are not readily available or reliable, investments will be fair valued in good faith by the Committee, in accordance with procedures adopted by the Board. Factors used in determining fair value vary by investment type and may include market or investment specific events, changes in interest rates and credit quality. The frequency with which these procedures are used cannot be predicted and they may be utilized to a significant extent. The Committee oversees each Fund's valuation policies and procedures and reports to the Board on the Committee's activities and fair value determinations. The Board monitors the appropriateness of the procedures used in valuing each Fund's investments and ratifies the fair value determinations of the Committee.
Each Fund categorizes the inputs to valuation techniques used to value its investments into a disclosure hierarchy consisting of three levels as shown below:
Level 1 - unadjusted quoted prices in active markets for identical investments
Level 2 - other significant observable inputs (including quoted prices for similar investments, interest rates, prepayment speeds, etc.)
Level 3 - unobservable inputs (including the Fund's own assumptions based on the best information available)
Valuation techniques used to value each Fund's investments by major category are as follows:
Equity securities, including restricted securities, for which market quotations are readily available, are valued at the last reported sale price or official closing price as reported by a third party pricing vendor on the primary market or exchange on which they are traded and are categorized as Level 1 in the hierarchy. In the event there were no sales during the day or closing prices are not available, securities are valued at the last quoted bid price or may be valued using the last available price and are generally categorized as Level 2 in the hierarchy. For foreign equity securities, when market or security specific events arise, comparisons to the valuation of American Depositary Receipts (ADRs), futures contracts, ETFs and certain indexes as well as quoted prices for similar securities may be used and would be categorized as Level 2 in the hierarchy. For equity securities, including restricted securities, where observable inputs are limited, assumptions about market activity and risk are used and these securities may be categorized as Level 3 in the hierarchy. Securities, including private placements or other restricted securities, for which observable inputs are not available are valued using alternate valuation approaches, including the market approach, the income approach and cost approach, and are categorized as Level 3 in the hierarchy. The market approach considers factors including the price of recent investments in the same or a similar security or financial metrics of comparable securities. The income approach considers factors including expected future cash flows, security specific risks and corresponding discount rates. The cost approach considers factors including the value of the security's underlying assets and liabilities.
Debt securities, including restricted securities, are valued based on evaluated prices received from third party pricing vendors or from brokers who make markets in such securities. Corporate bonds and preferred securities are valued by pricing vendors who utilize matrix pricing which considers yield or price of bonds of comparable quality, coupon, maturity and type or by broker-supplied prices. When independent prices are unavailable or unreliable, debt securities may be valued utilizing pricing methodologies which consider similar factors that would be used by third party pricing vendors. Debt securities are generally categorized as Level 2 in the hierarchy but may be Level 3 depending on the circumstances.
Investments in open-end mutual funds, including the Fidelity Central Funds, are valued at their closing net asset value (NAV) each business day and are categorized as Level 1 in the hierarchy.
The following provides information on Level 3 securities held by the Fund that were valued at period end based on unobservable inputs. These amounts exclude valuations provided by a broker.
Biotechnology Portfolio:
| Asset Type | Fair Value | Valuation Technique(s) | Unobservable Input | Amount or Range/Weighted Average | Impact to Valuation from an Increase in Input A |
| Equities | $ 171,159,448 | Market approach | Discount rate | 29.0% - 48.3% / 34.0% | Decrease |
| | | | Transaction price | $2.42 - $105.86 / $50.90 | Increase |
| | | Recovery value | Recovery value | $0.00 - $3.35 / $3.13 | Increase |
| | | | Discount for lack of marketablitly | 5.0% | Decrease |
| | | Discounted cash flow | Discount rate | 8.0% - 13.0% / 12.3% | Decrease |
| | | | Probability rate | 0.6% - 90.0% / 26.4% | Increase |
| | | | Growth rate | 3.5% | Increase |
| | | | Discount for lack of marketablitly | 10.0% | Decrease |
A Represents the directional change in the fair value of the Level 3 investments that could have resulted from an increase in the corresponding input as of period end. A decrease to the unobservable input would have had the opposite effect. Significant changes in these inputs may have resulted in a significantly higher or lower fair value measurement at period end.
Health Care Portfolio:
| Asset Type | Fair Value | Valuation Technique(s) | Unobservable Input | Amount or Range/Weighted Average | Impact to Valuation from an Increase in Input A |
| Equities | $ 106,407,211 | Market approach | Discount rate | 31.1% - 49.5% / 33.5% | Decrease |
| | | | Transaction price | $4.57 - $20.56 / $11.47 | Increase |
| | | Market comparable | Enterprise value/Revenue multiple (EV/R) | 3.6 - 6.8 / 5.9 | Increase |
| | | Discounted cash flow | Discount rate | 10.0% | Decrease |
| | | | Probability rate | 0.6% - 37.3% / 16.3% | Increase |
| | | Black scholes | Term | 1.5 | Increase |
| | | | Volatility | 55.0% | Increase |
A Represents the directional change in the fair value of the Level 3 investments that could have resulted from an increase in the corresponding input as of period end. A decrease to the unobservable input would have had the opposite effect. Significant changes in these inputs may have resulted in a significantly higher or lower fair value measurement at period end.
Medical Technology and Devices Portfolio:
| Asset Type | Fair Value | Valuation Technique(s) | Unobservable Input | Amount or Range/Weighted Average | Impact to Valuation from an Increase in Input A |
| Equities | $ 211,601,492 | Market approach | Discount rate | 10.3% - 49.5% / 26.3% | Decrease |
| | | | Transaction price | $1.02 - $20.56 / $11.14 | Increase |
| | | Recovery value | Recovery value | $2.87 | Increase |
| | | | Transaction price | $12.76 | Increase |
| | | | Probability rate | 15.0% - 70.0% / 42.5% | Increase |
| | | Market comparable | Enterprise value/Revenue multiple (EV/R) | 3.6 - 6.8 / 5.7 | Increase |
| | | Discounted cash flow | Weighted average cost of capital (WACC) | 25.0% | Decrease |
| | | | Exit multiple | 2.0 | Increase |
| | | Black scholes | Term | 1.5 | Increase |
| | | | Volatility | 55.0% | Increase |
| Preferred Securities | $ 19,551,861 | Market approach | Transaction price | $100.00 | Increase |
A Represents the directional change in the fair value of the Level 3 investments that could have resulted from an increase in the corresponding input as of period end. A decrease to the unobservable input would have had the opposite effect. Significant changes in these inputs may have resulted in a significantly higher or lower fair value measurement at period end.
Changes in valuation techniques may result in transfers in or out of an assigned level within the disclosure hierarchy. The aggregate value of investments by input level as of August 31, 2022, as well as a roll forward of Level 3 investments, is included at the end of each Fund's Schedule of Investments.
Foreign Currency. Certain Funds may use foreign currency contracts to facilitate transactions in foreign-denominated securities. Gains and losses from these transactions may arise from changes in the value of the foreign currency or if the counterparties do not perform under the contracts' terms.
Foreign-denominated assets, including investment securities, and liabilities are translated into U.S. dollars at the exchange rates at period end. Purchases and sales of investment securities, income and dividends received, and expenses denominated in foreign currencies are translated into U.S. dollars at the exchange rate in effect on the transaction date.
The effects of exchange rate fluctuations on investments are included with the net realized and unrealized gain (loss) on investment securities. Other foreign currency transactions resulting in realized and unrealized gain (loss) are disclosed separately.
Investment Transactions and Income. For financial reporting purposes, the Funds' investment holdings and NAV include trades executed through the end of the last business day of the period. The NAV per share for processing shareholder transactions is calculated as of the close of business of the New York Stock Exchange (NYSE), normally 4:00 p.m. Eastern time and includes trades executed through the end of the prior business day. Gains and losses on securities sold are determined on the basis of identified cost and for certain Funds include proceeds received from litigation. Commissions paid to certain brokers with whom the investment adviser, or its affiliates, places trades on behalf of a fund include an amount in addition to trade execution, which may be rebated back to a fund. Any such rebates are included in net realized gain (loss) on investments in the Statement of Operations. Dividend income is recorded on the ex-dividend date, except for certain dividends from foreign securities where the ex-dividend date may have passed, which are recorded as soon as the Funds are informed of the ex-dividend date. Non-cash dividends included in dividend income, if any, are recorded at the fair market value of the securities received. Income and capital gain distributions from Fidelity Central Funds, if any, are recorded on the ex-dividend date. Interest income is accrued as earned and includes coupon interest and amortization of premium and accretion of discount on debt securities as applicable. Investment income is recorded net of foreign taxes withheld where recovery of such taxes is uncertain. Funds may file withholding tax reclaims in certain jurisdictions to recover a portion of amounts previously withheld. Any withholding tax reclaims income is included in the Statement of Operations in dividends or foreign tax reclaims. Any receivables for withholding tax reclaims are included in the Statement of Assets and Liabilities in dividends receivable or reclaims receivable.
Expenses. Expenses directly attributable to a fund are charged to that fund. Expenses attributable to more than one fund are allocated among the respective funds on the basis of relative net assets or other appropriate methods. Expenses included in the accompanying financial statements reflect the expenses of that fund and do not include any expenses associated with any underlying mutual funds or exchange-traded funds. Although not included in a fund's expenses, a fund indirectly bears its proportionate share of these expenses through the net asset value of each underlying mutual fund or exchange-traded fund. Expense estimates are accrued in the period to which they relate and adjustments are made when actual amounts are known.
Deferred Trustee Compensation. Under a Deferred Compensation Plan (the Plan) for certain Funds, certain independent Trustees have elected to defer receipt of a portion of their annual compensation. Deferred amounts are invested in affiliated mutual funds, are marked-to-market and remain in a fund until distributed in accordance with the Plan. The investment of deferred amounts and the offsetting payable to the Trustees presented below are included in the accompanying Statement of Assets and Liabilities in other receivables and other payables and accrued expenses, as applicable.
| Biotechnology Portfolio | $1,047,684 |
| Health Care Portfolio | 689,724 |
| Health Care Services Portfolio | 77,584 |
| Medical Technology and Devices Portfolio | 227,384 |
| Pharmaceuticals Portfolio | 141,259 |
Income Tax Information and Distributions to Shareholders. Each year, each Fund intends to qualify as a regulated investment company under Subchapter M of the Internal Revenue Code, including distributing substantially all of its taxable income and realized gains. As a result, no provision for U.S. Federal income taxes is required. Each Fund files a U.S. federal tax return, in addition to state and local tax returns as required. Each Fund's federal income tax returns are subject to examination by the Internal Revenue Service (IRS) for a period of three fiscal years after they are filed. State and local tax returns may be subject to examination for an additional fiscal year depending on the jurisdiction. Foreign taxes are provided for based on each Fund's understanding of the tax rules and rates that exist in the foreign markets in which it invests.
Distributions are declared and recorded on the ex-dividend date. Income and capital gain distributions are determined in accordance with income tax regulations, which may differ from GAAP. These differences resulted in distribution reclassifications for the period ended February 28, 2022.
Capital accounts within the financial statements are adjusted for permanent book-tax differences. These adjustments have no impact on net assets or the results of operations. Capital accounts are not adjusted for temporary book-tax differences which will reverse in a subsequent period.
Book-tax differences are primarily due to foreign currency transactions, passive foreign investment companies (PFIC), deferred Trustee compensation, net operating losses and losses deferred due to wash sales and excise tax regulations.
As of period end, the cost and unrealized appreciation (depreciation) in securities, and derivatives if applicable, for federal income tax purposes were as follows for each Fund:
| | Tax cost | Gross unrealized appreciation | Gross unrealized depreciation | Net unrealized appreciation (depreciation) |
| Biotechnology Portfolio | $5,011,141,067 | $1,642,440,509 | $(892,392,059) | $ 750,048,450 |
| Health Care Portfolio | 6,048,498,494 | 3,117,473,378 | (708,256,947) | 2,409,216,431 |
| Health Care Services Portfolio | 966,056,787 | 742,236,199 | (71,935,995) | 670,300,204 |
Medical Technology and Devices Portfolio | 5,021,771,678 | 2,649,935,561 | (454,192,502) | 2,195,743,059 |
| Pharmaceuticals Portfolio | 649,773,778 | 241,045,499 | (63,303,729) | 177,741,770 |
Certain of the Funds elected to defer to the next fiscal year capital losses recognized during the period November 1, 2021 to February 28, 2022, and ordinary losses recognized during the period January 1, 2022 to February 28, 2022. Loss deferrals were as follows:
| | Capital losses | Ordinary losses |
| Biotechnology Portfolio | $ (98,907,002) | $ (11,118,831) |
| Health Care Portfolio | - | (4,977,672) |
Medical Technology and Devices Portfolio | (87,545,004) | (8,394,767) |
Restricted Securities (including Private Placements). Funds may invest in securities that are subject to legal or contractual restrictions on resale. These securities generally may be resold in transactions exempt from registration or to the public if the securities are registered. Disposal of these securities may involve time-consuming negotiations and expense, and prompt sale at an acceptable price may be difficult. Information regarding restricted securities held at period end is included at the end of the Schedule of Investments, if applicable.
Consolidated Subsidiary. The Funds included in the table below hold certain investments through a wholly-owned subsidiary ("Subsidiary"), which may be subject to federal and state taxes upon disposition.
As of period end, investments in Subsidiaries were as follows:
| | $ Amount | % of Net Assets |
| Biotechnology Portfolio | 84,762,124 | 1.62 |
| Health Care Portfolio | 9,735,164 | .12 |
| Health Care Services Portfolio | 1,432,474 | .09 |
The financial statements have been consolidated to include the Subsidiary accounts where applicable. Accordingly, all inter-company transactions and balances have been eliminated.
At period end, any estimated tax liability for these investments is presented as "Deferred taxes" in the Statement of Assets and Liabilities and included in "Change in net unrealized appreciation (depreciation) on investment securities" in the Statement of Operations. The tax liability incurred may differ materially depending on conditions when these investments are disposed. Any cash held by a Subsidiary is restricted as to its use and is presented as "Restricted cash" in the Statement of Assets and Liabilities, if applicable.
4. Purchases and Sales of Investments.
Purchases and sales of securities, other than short-term securities and in-kind transactions, as applicable, are noted in the table below.
| | Purchases ($) | Sales ($) |
| Biotechnology Portfolio | 1,252,665,977 | 1,313,437,936 |
| Health Care Portfolio | 1,426,332,655 | 1,744,088,858 |
| Health Care Services Portfolio | 380,039,659 | 112,701,814 |
| Medical Technology and Devices Portfolio | 1,065,879,812 | 1,567,716,549 |
| Pharmaceuticals Portfolio | 179,757,703 | 286,934,715 |
5. Fees and Other Transactions with Affiliates.
Management Fee. Fidelity Management & Research Company LLC (the investment adviser) and its affiliates provide the Funds with investment management related services for which the Funds pay a monthly management fee. The management fee is the sum of an individual fund fee rate and an annualized group fee rate. The individual fund fee rate is applied to each Fund's average net assets. The group fee rate is based upon the monthly average net assets of a group of registered investment companies with which the investment adviser has management contracts. The group fee rate decreases as assets under management increase and increases as assets under management decrease. For the reporting period, each Fund's annualized management fee rate expressed as a percentage of each Fund's average net assets was as follows:
| | Individual Rate | Group Rate | Total |
| Biotechnology Portfolio | .30% | .23% | .53% |
| Health Care Portfolio | .30% | .23% | .53% |
| Health Care Services Portfolio | .30% | .23% | .53% |
| Medical Technology and Devices Portfolio | .30% | .23% | .53% |
| Pharmaceuticals Portfolio | .30% | .23% | .53% |
Transfer Agent Fees. Fidelity Investments Institutional Operations Company LLC (FIIOC), an affiliate of the investment adviser, is the Funds' transfer, dividend disbursing and shareholder servicing agent. FIIOC receives account fees and asset-based fees that vary according to account size and type of account. FIIOC pays for typesetting, printing and mailing of shareholder reports, except proxy statements. For the period, transfer agent fees were equivalent to the following annualized rates expressed as a percentage of average net assets:
| Biotechnology Portfolio | .16% |
| Health Care Portfolio | .14% |
| Health Care Services Portfolio | .15% |
| Medical Technology and Devices Portfolio | .15% |
| Pharmaceuticals Portfolio | .17% |
Accounting Fees. Fidelity Service Company, Inc. (FSC), an affiliate of the investment adviser, maintains each Fund's accounting records. The accounting fee is based on the level of average net assets for each month. For the period, the fees were equivalent to the following annualized rates:
| | % of Average Net Assets |
| Biotechnology Portfolio | .02 |
| Health Care Portfolio | .01 |
| Health Care Services Portfolio | .03 |
| Medical Technology and Devices Portfolio | .01 |
| Pharmaceuticals Portfolio | .03 |
Brokerage Commissions. A portion of portfolio transactions were placed with brokerage firms which are affiliates of the investment adviser. Brokerage commissions are included in net realized gain (loss) and change in net unrealized appreciation (depreciation) in the Statement of Operations. The commissions paid to these affiliated firms were as follows:
| | Amount |
| Biotechnology Portfolio | $ 85,075 |
| Health Care Portfolio | 36,907 |
| Health Care Services Portfolio | 5,536 |
| Medical Technology and Devices Portfolio | 26,883 |
| Pharmaceuticals Portfolio | 4,438 |
Interfund Lending Program. Pursuant to an Exemptive Order issued by the Securities and Exchange Commission (the SEC), each Fund, along with other registered investment companies having management contracts with Fidelity Management & Research Company LLC (FMR), or other affiliated entities of FMR, may participate in an interfund lending program. This program provides an alternative credit facility allowing each Fund to borrow from, or lend money to, other participating affiliated funds. At period end, there were no interfund loans outstanding. Activity in this program during the period for which loans were outstanding was as follows:
| | Borrower or Lender | Average Loan Balance | Weighted Average Interest Rate | Interest Expense |
| Health Care Portfolio | Borrower | $ 6,882,364 | .46% | $ 958 |
Medical Technology and Devices Portfolio | Borrower | $ 9,169,800 | .64% | $ 814 |
| Pharmaceuticals Portfolio | Borrower | $ 25,482,000 | .57% | $ 400 |
Interfund Trades. Funds may purchase from or sell securities to other Fidelity Funds under procedures adopted by the Board. The procedures have been designed to ensure these interfund trades are executed in accordance with Rule 17a-7 of the 1940 Act. Any interfund trades are included within the respective purchases and sales amounts shown in the Purchases and Sales of Investments note. Interfund trades during the period are noted in the table below.
| | Purchases ($) | Sales ($) | Realized Gain (Loss) ($) |
| Biotechnology Portfolio | 38,833,406 | 60,204,210 | (14,662,883) |
| Health Care Portfolio | 90,415,639 | 182,300,791 | 26,623,108 |
| Health Care Services Portfolio | 39,842,765 | 10,707,722 | (197,048) |
| Medical Technology and Devices Portfolio | 64,764,230 | 36,279,772 | (5,286,051) |
| Pharmaceuticals Portfolio | 25,537,279 | 24,228,189 | 5,001,382 |
6. Committed Line of Credit.
Certain Funds participate with other funds managed by the investment adviser or an affiliate in a $4.25 billion credit facility (the "line of credit") to be utilized for temporary or emergency purposes to fund shareholder redemptions or for other short-term liquidity purposes. The participating funds have agreed to pay commitment fees on their pro-rata portion of the line of credit, which are reflected in Miscellaneous expenses on the Statement of Operations, and are listed below. During the period, there were no borrowings on this line of credit.
| | Amount |
| Biotechnology Portfolio | $ 4,524 |
| Health Care Portfolio | 7,638 |
| Health Care Services Portfolio | 1,103 |
| Medical Technology and Devices Portfolio | 7,316 |
| Pharmaceuticals Portfolio | 764 |
7. Security Lending.
Funds lend portfolio securities from time to time in order to earn additional income. Lending agents are used, including National Financial Services (NFS), an affiliate of the investment adviser. Pursuant to a securities lending agreement, NFS will receive a fee, which is capped at 9.9% of a fund's daily lending revenue, for its services as lending agent. A fund may lend securities to certain qualified borrowers, including NFS. On the settlement date of the loan, a fund receives collateral (in the form of U.S. Treasury obligations, letters of credit and/or cash) against the loaned securities and maintains collateral in an amount not less than 100% of the market value of the loaned securities during the period of the loan. The market value of the loaned securities is determined at the close of business of a fund and any additional required collateral is delivered to a fund on the next business day. A fund or borrower may terminate the loan at any time, and if the borrower defaults on its obligation to return the securities loaned because of insolvency or other reasons, a fund may apply collateral received from the borrower against the obligation. A fund may experience delays and costs in recovering the securities loaned. Any cash collateral received is invested in the Fidelity Securities Lending Cash Central Fund. Any loaned securities are identified as such in the Schedule of Investments, and the value of loaned securities and cash collateral at period end, as applicable, are presented in the Statement of Assets and Liabilities. Security lending income represents the income earned on investing cash collateral, less rebates paid to borrowers and any lending agent fees associated with the loan, plus any premium payments received for lending certain types of securities. Security lending income is presented in the Statement of Operations as a component of income from Fidelity Central Funds. Affiliated security lending activity, if any, was as follows:
| | Total Security Lending Fees Paid to NFS | Security Lending Income From Securities Loaned to NFS | Value of Securities Loaned to NFS at Period End |
| Biotechnology Portfolio | $ 478,578 | $ 31,811 | $5,485,701 |
| Health Care Portfolio | $ 128,144 | $ 49,017 | $- |
| Health Care Services Portfolio | $ 18,936 | $ 4,499 | $ 1,653,228 |
| Medical Technology and Devices Portfolio | $ 101,289 | $ 8,978 | $ - |
| Pharmaceuticals Portfolio | $ 2,325 | $ 1,926 | $479,108 |
8. Expense Reductions.
Through arrangements with each applicable Fund's custodian and transfer agent, credits realized as a result of certain uninvested cash balances were used to reduce each applicable Fund's expenses. All of the applicable expense reductions are noted in the table below.
| | Custodian credits |
| Biotechnology Portfolio | $ 395 |
| Health Care Services Portfolio | 67 |
In addition, during the period the investment adviser or an affiliate reimbursed and/or waived a portion of operating expenses as follows:
| | Amount |
| Biotechnology Portfolio | $ 82,230 |
| Health Care Portfolio | 138,308 |
| Health Care Services Portfolio | 20,723 |
| Medical Technology and Devices Portfolio | 130,112 |
| Pharmaceuticals Portfolio | 13,861 |
9. Other.
A fund's organizational documents provide former and current trustees and officers with a limited indemnification against liabilities arising in connection with the performance of their duties to the fund. In the normal course of business, a fund may also enter into contracts that provide general indemnifications. A fund's maximum exposure under these arrangements is unknown as this would be dependent on future claims that may be made against a fund. The risk of material loss from such claims is considered remote.
10. Risk and Uncertainties.
Many factors affect a fund's performance. Developments that disrupt global economies and financial markets, such as pandemics, epidemics, outbreaks of infectious diseases, war, terrorism, and environmental disasters, may significantly affect a fund's investment performance. The effects of these developments to a fund will be impacted by the types of securities in which a fund invests, the financial condition, industry, economic sector, and geographic location of an issuer, and a fund's level of investment in the securities of that issuer.
As a shareholder, you incur two types of costs: (1) transaction costs, which may include sales charges (loads) on purchase payments or redemption proceeds, as applicable and (2) ongoing costs, which generally include management fees, distribution and/or service (12b-1) fees and other Fund expenses. This Example is intended to help you understand your ongoing costs (in dollars) of investing in a fund and to compare these costs with the ongoing costs of investing in other mutual funds.
| The Example is based on an investment of $1,000 invested at the beginning of the period and held for the entire period (March 1, 2022 to August 31, 2022). |
Actual Expenses
The first line of the accompanying table provides information about actual account values and actual expenses. You may use the information in this line, together with the amount you invested, to estimate the expenses that you paid over the period. Simply divide your account value by $1,000.00 (for example, an $8,600 account value divided by $1,000.00 = 8.6), then multiply the result by the number in the first line for a class/Fund under the heading entitled "Expenses Paid During Period" to estimate the expenses you paid on your account during this period. If any fund is a shareholder of any underlying mutual funds or exchange-traded funds (ETFs) (the Underlying Funds), such fund indirectly bears its proportional share of the expenses of the Underlying Funds in addition to the direct expenses incurred presented in the table. These fees and expenses are not included in the annualized expense ratio used to calculate the expense estimate in the table below.
Hypothetical Example for Comparison Purposes
The second line of the accompanying table provides information about hypothetical account values and hypothetical expenses based on the actual expense ratio and an assumed rate of return of 5% per year before expenses, which is not the actual return. The hypothetical account values and expenses may not be used to estimate the actual ending account balance or expenses you paid for the period. You may use this information to compare the ongoing costs of investing in the Fund and other funds. To do so, compare this 5% hypothetical example with the 5% hypothetical examples that appear in the shareholder reports of the other funds. If any fund is a shareholder of any Underlying Funds, such fund indirectly bears its proportional share of the expenses of the Underlying Funds in addition to the direct expenses as presented in the table. These fees and expenses are not included in the annualized expense ratio used to calculate the expense estimate in the table below.
Please note that the expenses shown in the table are meant to highlight your ongoing costs only and do not reflect any transaction costs. Therefore, the second line of the table is useful in comparing ongoing costs only, and will not help you determine the relative total costs of owning different funds. In addition, if these transactional costs were included, your costs would have been higher.
| | | | | Annualized Expense Ratio- A | | Beginning Account Value March 1, 2022 | | Ending Account Value August 31, 2022 | | Expenses Paid During Period- C March 1, 2022 to August 31, 2022 |
| | | | | | | | | | |
| Biotechnology Portfolio | | | | .72% | | | | | | |
| Actual | | | | | | $ 1,000 | | $ 1,003.20 | | $ 3.64 |
Hypothetical- B | | | | | | $ 1,000 | | $ 1,021.58 | | $ 3.67 |
| | | | | | | | | | |
| Health Care Portfolio | | | | .68% | | | | | | |
| Actual | | | | | | $ 1,000 | | $ 960.40 | | $ 3.36 |
Hypothetical- B | | | | | | $ 1,000 | | $ 1,021.78 | | $ 3.47 |
| | | | | | | | | | |
| Health Care Services Portfolio | | | | .71% | | | | | | |
| Actual | | | | | | $ 1,000 | | $ 1,050.60 | | $ 3.67 |
Hypothetical- B | | | | | | $ 1,000 | | $ 1,021.63 | | $ 3.62 |
| | | | | | | | | | |
| Medical Technology and Devices Portfolio | | | | .69% | | | | | | |
| Actual | | | | | | $ 1,000 | | $ 850.50 | | $ 3.22 |
Hypothetical- B | | | | | | $ 1,000 | | $ 1,021.73 | | $ 3.52 |
| | | | | | | | | | |
| Pharmaceuticals Portfolio | | | | .75% | | | | | | |
| Actual | | | | | | $ 1,000 | | $ 988.80 | | $ 3.76 |
Hypothetical- B | | | | | | $ 1,000 | | $ 1,021.42 | | $ 3.82 |
| |
A Annualized expense ratio reflects expenses net of applicable fee waivers.
B 5% return per year before expenses
C Expenses are equal to the annualized expense ratio, multiplied by the average account value over the period, multiplied by 184/ 365 (to reflect the one-half year period). The fees and expenses of any Underlying Funds are not included in each annualized expense ratio.
Biotechnology Portfolio
Health Care Portfolio
Health Care Services Portfolio
Medical Technology and Devices Portfolio
Pharmaceuticals Portfolio
Each year, the Board of Trustees, including the Independent Trustees (together, the Board), votes on the renewal of the management contract with Fidelity Management & Research Company LLC (FMR) and the sub-advisory agreements (together, the Advisory Contracts) for each fund. FMR and the sub-advisers are referred to herein as the Investment Advisers. The Board, assisted by the advice of fund counsel and Independent Trustees' counsel, requests and considers a broad range of information relevant to the renewal of the Advisory Contracts throughout the year.
The Board meets regularly and, at each of its meetings, covers an extensive agenda of topics and materials and considers factors that are relevant to its annual consideration of the renewal of each fund's Advisory Contracts, including the services and support provided to each fund and its shareholders. The Board has established various standing committees (Committees), each composed of and chaired by Independent Trustees with varying backgrounds, to which the Board has assigned specific subject matter responsibilities in order to enhance effective decision-making by the Board. The Board, acting directly and through its Committees, requests and receives information concerning the annual consideration of the renewal of each fund's Advisory Contracts. The Board also meets as needed to review matters specifically related to the Board's annual consideration of the renewal of the Advisory Contracts. Members of the Board may also meet with trustees of other Fidelity funds through joint ad hoc committees to discuss certain matters relevant to all of the Fidelity funds.
At its May 2022 meeting, the Board unanimously determined to renew each fund's Advisory Contracts. In reaching its determination, the Board considered all factors it believed relevant, including (i) the nature, extent, and quality of the services provided to each fund and its shareholders (including the investment performance of each fund); (ii) the competitiveness relative to peer funds of each fund's management fee and total expense ratio; (iii) the total costs of the services provided by and the profits realized by Fidelity from its relationships with each fund; and (iv) the extent to which, if any, economies of scale exist and are realized as each fund grows, and whether any economies of scale are appropriately shared with fund shareholders.
In considering whether to renew the Advisory Contracts for each fund, the Board reached a determination, with the assistance of fund counsel and Independent Trustees' counsel and through the exercise of its business judgment, that the renewal of the Advisory Contracts was in the best interests of each fund and its shareholders and that the compensation payable under the Advisory Contracts was fair and reasonable. The Board's decision to renew the Advisory Contracts was not based on any single factor, but rather was based on a comprehensive consideration of all the information provided to the Board at its meetings throughout the year. The Board, in reaching its determination to renew the Advisory Contracts, was aware that shareholders of each fund have a broad range of investment choices available to them, including a wide choice among funds offered by Fidelity's competitors, and that each fund's shareholders, who have the opportunity to review and weigh the disclosure provided by the fund in its prospectus and other public disclosures, have chosen to invest in that fund, which is part of the Fidelity family of funds.
Nature, Extent, and Quality of Services Provided. The Board considered Fidelity's staffing as it relates to the funds, including the backgrounds of investment personnel of Fidelity, and also considered the funds' investment objectives, strategies, and related investment philosophies. The Independent Trustees also had discussions with senior management of Fidelity's investment operations and investment groups. The Board considered the structure of the investment personnel compensation program and whether this structure provides appropriate incentives to act in the best interests of each fund. Additionally, the Board considered the portfolio managers' investments, if any, in the funds that they manage. The Board also considered the steps Fidelity had taken to ensure the continued provision of high quality services to the Fidelity funds during the COVID-19 pandemic, including the expansion of staff in client facing positions to maintain service levels in periods of high volumes and volatility.
Resources Dedicated to Investment Management and Support Services . The Board and the Fund Oversight and Research Committees reviewed the general qualifications and capabilities of Fidelity's investment staff, including its size, education, experience, and resources, as well as Fidelity's approach to recruiting, training, managing, and compensating investment personnel. The Board noted the resources devoted to expansion of Fidelity's global investment organization, and that Fidelity's analysts have extensive resources, tools, and capabilities that allow them to conduct sophisticated quantitative and fundamental analysis, as well as credit analysis of issuers, counterparties, and guarantors. Further, the Board considered that Fidelity's investment professionals have sufficient access to global information and data so as to provide competitive investment results over time, and that those professionals also have access to sophisticated tools that permit them to assess portfolio construction and risk and performance attribution characteristics continuously, as well as to transmit new information and research conclusions rapidly around the world. Additionally, in its deliberations, the Board considered Fidelity's trading, risk management, compliance, and technology and operations capabilities and resources, which are integral parts of the investment management process.
Shareholder and Administrative Services . The Board considered (i) the nature, extent, quality, and cost of advisory, administrative, and shareholder services performed by the Investment Advisers and their affiliates under the Advisory Contracts and under separate agreements covering transfer agency, pricing and bookkeeping, and securities lending services for each fund; (ii) the nature and extent of the supervision of third party service providers, principally custodians, subcustodians, and pricing vendors; and (iii) the resources devoted to, and the record of compliance with, each fund's compliance policies and procedures. The Board also reviewed the allocation of fund brokerage, including allocations to brokers affiliated with the Investment Advisers, the use of brokerage commissions to pay fund expenses, and the use of "soft" commission dollars to pay for research services.
The Board noted that the growth of fund assets over time across the complex allows Fidelity to reinvest in the development of services designed to enhance the value and convenience of the Fidelity funds as investment vehicles. These services include 24-hour access to account information and market information over the Internet and through telephone representatives, investor education materials, and asset allocation tools. The Board also considered that it reviews customer service metrics such as telephone response times, continuity of services on the website and metrics addressing services at Fidelity Investor Centers.
Investment in a Large Fund Family . The Board considered the benefits to shareholders of investing in a Fidelity fund, including the benefits of investing in a fund that is part of a large family of funds offering a variety of investment disciplines and providing a large variety of mutual fund investor services. The Board noted that Fidelity had taken, or had made recommendations that resulted in the Fidelity funds taking, a number of actions over the previous year that benefited particular funds, including: (i) continuing to dedicate additional resources to Fidelity's investment research process, which includes meetings with management of issuers of securities in which the funds invest; (ii) continuing efforts to enhance Fidelity's global research capabilities; (iii) launching new funds and ETFs with innovative structures, strategies and pricing and making other enhancements to meet client needs; (iv) launching new share classes of existing funds; (v) eliminating purchase minimums and broadening eligibility requirements for certain funds and share classes; (vi) reducing management fees and total expenses for certain target date funds and classes and index funds; (vii) lowering expenses for certain existing funds and classes by implementing or lowering expense caps; (viii) rationalizing product lines and gaining increased efficiencies from fund mergers and liquidations; (ix) continuing to develop, acquire and implement systems and technology to improve services to the funds and shareholders, strengthen information security, and increase efficiency; and (x) continuing to implement enhancements to further strengthen Fidelity's product line to increase investors' probability of success in achieving their investment goals, including retirement income goals.
Investment Performance . The Board considered whether each fund has operated in accordance with its investment objective, as well as its record of compliance with its investment restrictions and its performance history.
The Board took into account discussions that occur at Board meetings throughout the year with representatives of the Investment Advisers about fund investment performance. In this regard the Board noted that as part of regularly scheduled fund reviews and other reports to the Board on fund performance, the Board considers annualized return information for each fund for different time periods, measured against an appropriate securities market index (benchmark index). The Board also reviews and considers information about performance attribution. In its evaluation of fund investment performance, the Board gave particular attention to information indicating changes in performance of certain Fidelity funds for specific time periods and discussed with the Investment Advisers the reasons for any overperformance or underperformance.
In addition to reviewing absolute and relative fund performance, the Independent Trustees periodically consider the appropriateness of fund performance metrics in evaluating the results achieved. In general, the Independent Trustees believe that fund performance should be evaluated based on net performance (after fees and expenses) of the fund compared to appropriate benchmark indices, over appropriate time periods that may include full market cycles, taking into account relevant factors including the following: general market conditions; issuer-specific information; and fund cash flows and other factors.
The Independent Trustees recognize that shareholders evaluate performance on a net basis over their own holding periods, for which one-, three-, and five-year periods are often used as a proxy. For this reason, the performance information reviewed by the Board also included net cumulative total return information for each fund and an appropriate benchmark index for the most recent one-, three-, and five-year periods ended September 30, 2021, as shown below.
Biotechnology Portfolio
Health Care Portfolio
Health Care Services Portfolio
The Board considered the fund's underperformance for different time periods ended September 30, 2021 and for different time periods ended December 31, 2021 (which periods are not reflected in the chart above). The Board's discussions with FMR regarding underperformance cover topics including, but not limited to: the longer-term track record of a fund's portfolio manager(s); broader trends in the market that may adversely impact a fund's performance; and attribution reports on contributors to the fund's underperformance. The Board engages with FMR on steps that might be taken to address a fund's underperformance.
Medical Technology and Devices Portfolio
Pharmaceuticals Portfolio
Based on its review, the Board concluded that the nature, extent, and quality of services provided to each fund under the Advisory Contracts should continue to benefit the shareholders of each fund.
Competitiveness of Management Fee and Total Expense Ratio . The Board considered each fund's management fee and total expense ratio compared to "mapped groups" of competitive funds and classes created for the purpose of facilitating the Trustees' competitive analysis of management fees and total expenses. Fidelity creates "mapped groups" by combining similar Lipper investment objective categories that have comparable investment mandates. For this purpose, all sector focused equity funds are grouped in the same mapped group. Combining Lipper investment objective categories aids the Board's management fee and total expense ratio comparisons by broadening the competitive group used for comparison.
Management Fee . The Board considered two proprietary management fee comparisons for the 12-month periods ended September 30 (June 30 for periods ended 2019 and 2018 and December 31 for periods prior to 2018) shown in basis points (BP) in the charts below. The group of Lipper funds used by the Board for management fee comparisons is referred to below as the "Total Mapped Group." The Total Mapped Group comparison focuses on a fund's standing in terms of gross management fees before expense reimbursements or caps relative to the total universe of funds with comparable investment mandates (i.e., sector equities), regardless of whether their management fee structures also are comparable. Funds with comparable management fee structures have similar management fee contractual arrangements (e.g., flat rate charged for advisory services, all-inclusive fee rate, etc.). "TMG %" represents the percentage of funds in the Total Mapped Group that had management fees that were lower than a fund's. For example, a hypothetical TMG % of 20% would mean that 80% of the funds in the Total Mapped Group had higher, and 20% had lower, management fees than a fund. The funds' actual TMG %s and the number of funds in the Total Mapped Group are in the charts below. The "Asset-Sized Peer Group" (ASPG) comparison focuses on a fund's standing relative to a subset of non-Fidelity funds within the Total Mapped Group that are similar in size and management fee structure. For example, if a fund is in the first quartile of the ASPG, the fund's management fee ranks in the least expensive or lowest 25% of funds in the ASPG. The ASPG represents at least 15% of the funds in the Total Mapped Group with comparable asset size and management fee structures, subject to a minimum of 50 funds (or all funds in the Total Mapped Group if fewer than 50). Additional information, such as the ASPG quartile in which a fund's management fee rate ranked, is also included in the charts and was considered by the Board.
Biotechnology Portfolio
Health Care Portfolio
Health Care Services Portfolio
Medical Technology and Devices Portfolio
Pharmaceuticals Portfolio
The Board noted that each fund's management fee rate ranked below the median of its Total Mapped Group and below the median of its ASPG for the 12-month period ended September 30, 2021.
The Board also considered that, for funds subject to the group fee, FMR agreed to voluntarily waive fees over a specified period of time in amounts designed to account for assets converted from certain funds to certain collective investment trusts.
Based on its review, the Board concluded that each fund's management fee is fair and reasonable in light of the services that the fund receives and the other factors considered.
Total Expense Ratio . In its review of each fund's total expense ratio, the Board considered the fund's management fee rate as well as other fund expenses, such as transfer agent fees, pricing and bookkeeping fees, and custodial, legal, and audit fees. The Board also noted that Fidelity may agree to waive fees or reimburse expenses from time to time, and the extent to which, if any, it has done so for each fund. Each fund is compared to those funds and classes in the Total Mapped Group (used by the Board for management fee comparisons) that have a similar sales load structure. The Board also considered a total expense ASPG comparison for each fund, which focuses on the total expenses of each fund relative to a subset of non-Fidelity funds within the total expense similar sales load structure group. The total expense ASPG is limited to 15 larger and 15 smaller classes in fund average assets for a total of 30 classes, where possible. The total expense ASPG comparison excludes performance adjustments and fund-paid 12b-1 fees to eliminate variability in fee structures.
The Board noted that each fund's total net expense ratio ranked below the similar sales load structure group competitive median and below the ASPG competitive median for the 12-month period ended September 30, 2021.
Fees Charged to Other Fidelity Clients . The Board also considered Fidelity fee structures and other information with respect to clients of Fidelity, such as other funds advised or subadvised by Fidelity, pension plan clients, and other institutional clients with similar mandates. The Board noted that a joint ad hoc committee created by it and the boards of other Fidelity funds periodically reviews and compares Fidelity's institutional investment advisory business with its business of providing services to the Fidelity funds and also noted the most recent findings of the committee. The Board noted that the committee's review included a consideration of the differences in services provided, fees charged, and costs incurred, as well as competition in the markets serving the different categories of clients.
Based on its review of total expense ratios and fees charged to other Fidelity clients, the Board concluded that each fund's total expense ratio was reasonable in light of the services that the fund and its shareholders receive and the other factors considered.
Costs of the Services and Profitability . The Board considered the revenues earned and the expenses incurred by Fidelity in conducting the business of developing, marketing, distributing, managing, administering and servicing each fund and servicing each fund's shareholders. The Board also considered the level of Fidelity's profits in respect of all the Fidelity funds.
On an annual basis, Fidelity presents to the Board information about the profitability of its relationships with each fund. Fidelity calculates profitability information for each fund, as well as aggregate profitability information for groups of Fidelity funds and all Fidelity funds, using a series of detailed revenue and cost allocation methodologies which originate with the books and records of Fidelity on which Fidelity's audited financial statements are based. The Audit Committee of the Board reviews any significant changes from the prior year's methodologies and the full Board approves such changes.
A public accounting firm has been engaged annually by the Board as part of the Board's assessment of Fidelity's profitability analysis. The engagement includes the review and assessment of the methodologies used by Fidelity in determining the revenues and expenses attributable to Fidelity's mutual fund business, and completion of agreed-upon procedures in respect of the mathematical accuracy of certain fund profitability information and its conformity to established allocation methodologies. After considering the reports issued under the engagement and information provided by Fidelity, the Board concluded that while other allocation methods may also be reasonable, Fidelity's profitability methodologies are reasonable in all material respects.
The Board also reviewed Fidelity's non-fund businesses and potential indirect benefits such businesses may have received as a result of their association with Fidelity's mutual fund business (i.e., fall-out benefits) as well as cases where Fidelity's affiliates may benefit from the funds' business. The Board considered areas where potential indirect benefits to the Fidelity funds from their relationships with Fidelity may exist. The Board's consideration of these matters was informed by the findings of a joint ad hoc committee created by it and the boards of other Fidelity funds to evaluate potential fall-out benefits.
The Board considered the costs of the services provided by and the profits realized by Fidelity in connection with the operation of each fund and was satisfied that the profitability was not excessive.
Economies of Scale . The Board considered whether there have been economies of scale in respect of the management of the Fidelity funds, whether the Fidelity funds (including each fund) have appropriately benefited from any such economies of scale, and whether there is potential for realization of any further economies of scale. The Board considered the extent to which each fund will benefit from economies of scale as assets grow through increased services to the fund, through waivers or reimbursements, or through fee or expense ratio reductions. The Board also noted that a committee (the Economies of Scale Committee) created by it and the boards of other Fidelity funds periodically analyzes whether Fidelity attains economies of scale in respect of the management and servicing of the Fidelity funds, whether the Fidelity funds have appropriately benefited from such economies of scale, and whether there is potential for realization of any further economies of scale.
The Board recognized that each fund's management contract incorporates a "group fee" structure, which provides for lower group fee rates as total "group assets" increase, and for higher group fee rates as total "group assets" decrease ("group assets" as defined in the management contracts). FMR calculates the group fee rates based on a tiered asset "breakpoint" schedule that varies based on asset class. The Board considered that the group fee is designed to deliver the benefits of economies of scale to fund shareholders when total Fidelity fund assets increase, even if assets of any particular fund are unchanged or have declined, because some portion of Fidelity's costs are attributable to services provided to all Fidelity funds, and all funds benefit if those costs can be allocated among more assets. The Board further considered that Fidelity agreed to impose a temporary fee waiver in the form of additional breakpoints to the current breakpoint schedule. The Board concluded that, given the group fee structure, fund shareholders will benefit from lower management fees as "group assets" increase at the fund complex level, regardless of whether Fidelity achieves any such economies of scale.
The Board concluded, taking into account the analysis of the Economies of Scale Committee, that economies of scale, if any, are being appropriately shared between fund shareholders and Fidelity.
Additional Information Requested by the Board . In order to develop fully the factual basis for consideration of the Fidelity funds' advisory contracts, the Board requested and received additional information on certain topics, including: (i) fund flow and performance trends, in particular the underperformance of certain funds and strategies, and Fidelity's long-term strategies for certain funds, including any consideration of fund liquidations or mergers; (ii) the operation of performance fees, competitor use of performance fees, and consideration of the expansion of performance fees to additional funds; (iii) Fidelity's pricing philosophy compared to competitors; (iv) fund profitability methodology and data; (v) evaluation of competitive fund data and peer group classifications and fee and expense comparisons; (vi) the management fee and expense structures for different funds and classes and information about the differences between various fee and expense structures; (vii) group fee breakpoints and related voluntary fee waivers; and (viii) information regarding other accounts managed by Fidelity and the funds' sub-advisory arrangements.
Based on its evaluation of all of the conclusions noted above, and after considering all factors it believed relevant, the Board concluded that the advisory fee arrangements are fair and reasonable and that each fund's Advisory Contracts should be renewed.
1.813645.117
SELHC-SANN-1022
Fidelity® Select Portfolios®
Financials Sector
Banking Portfolio
Brokerage and Investment Management Portfolio
Financial Services Portfolio
FinTech Portfolio
Insurance Portfolio
Semi-Annual Report
August 31, 2022
Contents
To view a fund's proxy voting guidelines and proxy voting record for the 12-month period ended June 30, visit http://www.fidelity.com/proxyvotingresults or visit the Securities and Exchange Commission's (SEC) web site at http://www.sec.gov.
You may also call 1-800-544-8544 to request a free copy of the proxy voting guidelines.
Standard & Poor's, S&P and S&P 500 are registered service marks of The McGraw-Hill Companies, Inc. and have been licensed for use by Fidelity Distributors Corporation.
Other third-party marks appearing herein are the property of their respective owners.
All other marks appearing herein are registered or unregistered trademarks or service marks of FMR LLC or an affiliated company. © 2022 FMR LLC. All rights reserved.
This report and the financial statements contained herein are submitted for the general information of the shareholders of the Fund. This report is not authorized for distribution to prospective investors in the Fund unless preceded or accompanied by an effective prospectus.
A fund files its complete schedule of portfolio holdings with the SEC for the first and third quarters of each fiscal year on Form N-PORT. Forms N-PORT are available on the SEC's web site at http://www.sec.gov. A fund's Forms N-PORT may be reviewed and copied at the SEC's Public Reference Room in Washington, DC. Information regarding the operation of the SEC's Public Reference Room may be obtained by calling 1-800-SEC-0330.
For a complete list of a fund's portfolio holdings, view the most recent holdings listing, semiannual report, or annual report on Fidelity's web site at http://www.fidelity.com, http://www.institutional.fidelity.com, or http://www.401k.com, as applicable.
NOT FDIC INSURED •MAY LOSE VALUE •NO BANK GUARANTEE
Neither the Fund nor Fidelity Distributors Corporation is a bank.
Top Holdings (% of Fund's net assets) |
| |
| Wells Fargo & Co. | 7.4 | |
| M&T Bank Corp. | 6.6 | |
| Bank of America Corp. | 6.0 | |
| U.S. Bancorp | 5.8 | |
| Citigroup, Inc. | 4.9 | |
| Truist Financial Corp. | 4.6 | |
| Huntington Bancshares, Inc. | 3.9 | |
| First Citizens Bancshares, Inc. | 3.1 | |
| East West Bancorp, Inc. | 3.0 | |
| First Interstate Bancsystem, Inc. | 2.9 | |
| | 48.2 | |
| |
| Industries (% of Fund's net assets) |
| |
| Banks | 85.6 | |
| Thrifts & Mortgage Finance | 8.6 | |
| Capital Markets | 3.0 | |
| Consumer Finance | 1.8 | |
| IT Services | 0.5 | |
| |
Percentages shown as 0.0% reflect amounts less than 0.05%.
Banking Portfolio
| Common Stocks - 99.0% |
| | | Shares | Value ($) |
| Banks - 85.6% | | | |
| Diversified Banks - 25.4% | | | |
| Bank of America Corp. | | 863,376 | 29,018,067 |
| Citigroup, Inc. | | 480,000 | 23,428,800 |
| JPMorgan Chase & Co. | | 49,971 | 5,683,202 |
| Piraeus Financial Holdings SA (a) | | 330,200 | 347,763 |
| U.S. Bancorp | | 615,300 | 28,063,833 |
| Wells Fargo & Co. | | 821,992 | 35,929,271 |
| | | | 122,470,936 |
| Regional Banks - 60.2% | | | |
| 1st Source Corp. | | 119,281 | 5,628,870 |
| American National Bankshares, Inc. | | 153,286 | 5,047,708 |
| Associated Banc-Corp. | | 563,900 | 11,300,556 |
| Bank OZK | | 151,200 | 6,128,136 |
| BankUnited, Inc. | | 111,769 | 4,141,041 |
| BOK Financial Corp. (b) | | 123,400 | 10,966,558 |
| Cadence Bank | | 384,539 | 9,798,054 |
| Camden National Corp. | | 9,532 | 431,132 |
| Comerica, Inc. | | 146,500 | 11,763,950 |
| Community Trust Bancorp, Inc. (b) | | 147,076 | 6,213,961 |
| ConnectOne Bancorp, Inc. | | 125,200 | 3,133,756 |
| East West Bancorp, Inc. | | 198,300 | 14,311,311 |
| Eastern Bankshares, Inc. | | 143,400 | 2,781,960 |
| First Citizens Bancshares, Inc. (b) | | 18,400 | 14,940,064 |
| First Interstate Bancsystem, Inc. | | 351,834 | 14,164,837 |
| Heartland Financial U.S.A., Inc. | | 223,700 | 9,992,679 |
| Huntington Bancshares, Inc. | | 1,403,400 | 18,805,560 |
| Independent Bank Group, Inc. | | 71,900 | 4,843,184 |
| M&T Bank Corp. | | 175,160 | 31,840,585 |
| Old National Bancorp, Indiana | | 238,754 | 3,984,804 |
| PacWest Bancorp | | 321,036 | 8,452,878 |
| PNC Financial Services Group, Inc. | | 43,000 | 6,794,000 |
| Popular, Inc. | | 157,900 | 12,193,038 |
| Preferred Bank, Los Angeles | | 107,095 | 7,265,325 |
| Sierra Bancorp | | 156,400 | 3,240,608 |
| Signature Bank | | 39,890 | 6,955,220 |
| Trico Bancshares | | 96,087 | 4,534,346 |
| Truist Financial Corp. | | 468,200 | 21,930,488 |
| UMB Financial Corp. | | 60,866 | 5,445,681 |
| Univest Corp. of Pennsylvania | | 243,300 | 6,033,840 |
| Wintrust Financial Corp. | | 109,900 | 9,268,966 |
| Zions Bancorp NA | | 136,450 | 7,508,844 |
| | | | 289,841,940 |
TOTAL BANKS | | | 412,312,876 |
| Capital Markets - 3.0% | | | |
| Asset Management & Custody Banks - 3.0% | | | |
| Bank of New York Mellon Corp. | | 93,000 | 3,862,290 |
| Phoenix Vega Mezz PLC (a) | | 330,200 | 21,569 |
| State Street Corp. | | 155,900 | 10,655,765 |
| | | | 14,539,624 |
| Consumer Finance - 1.8% | | | |
| Consumer Finance - 1.8% | | | |
| Capital One Financial Corp. | | 55,400 | 5,862,428 |
| OneMain Holdings, Inc. | | 81,600 | 2,850,288 |
| | | | 8,712,716 |
| Thrifts & Mortgage Finance - 8.6% | | | |
| Thrifts & Mortgage Finance - 8.6% | | | |
| Essent Group Ltd. | | 308,229 | 12,326,078 |
| MGIC Investment Corp. | | 380,249 | 5,433,758 |
| NMI Holdings, Inc. (a) | | 526,402 | 10,807,033 |
| Radian Group, Inc. | | 289,836 | 6,118,438 |
| Southern Missouri Bancorp, Inc. | | 26,700 | 1,407,891 |
| Walker & Dunlop, Inc. | | 52,100 | 5,233,966 |
| | | | 41,327,164 |
| TOTAL COMMON STOCKS (Cost $405,655,059) | | | 476,892,380 |
| | | | |
| Convertible Bonds - 0.5% |
| | | Principal Amount (c) | Value ($) |
| IT Services - 0.5% | | | |
| Data Processing & Outsourced Services - 0.5% | | | |
Affirm Holdings, Inc. 0% 11/15/26 (d) (Cost $2,422,103) | | 4,117,000 | 2,600,947 |
| | | | |
| Money Market Funds - 3.8% |
| | | Shares | Value ($) |
| Fidelity Cash Central Fund 2.33% (e) | | 1,745,142 | 1,745,491 |
| Fidelity Securities Lending Cash Central Fund 2.34% (e)(f) | | 16,425,607 | 16,427,250 |
| TOTAL MONEY MARKET FUNDS (Cost $18,172,741) | | | 18,172,741 |
| | | | |
| TOTAL INVESTMENT IN SECURITIES - 103.3% (Cost $426,249,903) | 497,666,068 |
NET OTHER ASSETS (LIABILITIES) - (3.3)% | (16,082,681) |
| NET ASSETS - 100.0% | 481,583,387 |
| | |
Legend
| (b) | Security or a portion of the security is on loan at period end. |
| (c) | Amount is stated in United States dollars unless otherwise noted. |
| (d) | Security exempt from registration under Rule 144A of the Securities Act of 1933. These securities may be resold in transactions exempt from registration, normally to qualified institutional buyers. At the end of the period, the value of these securities amounted to $2,600,947 or 0.5% of net assets. |
| (e) | Affiliated fund that is generally available only to investment companies and other accounts managed by Fidelity Investments. The rate quoted is the annualized seven-day yield of the fund at period end. A complete unaudited listing of the fund's holdings as of its most recent quarter end is available upon request. In addition, each Fidelity Central Fund's financial statements are available on the SEC's website or upon request. |
| (f) | Investment made with cash collateral received from securities on loan. |
Affiliated Central Funds
Fiscal year to date information regarding the Fund's investments in Fidelity Central Funds, including the ownership percentage, is presented below.
| Affiliate | Value, beginning of period ($) | Purchases ($) | Sales Proceeds ($) | Dividend Income ($) | Realized Gain (loss) ($) | Change in Unrealized appreciation (depreciation) ($) | Value, end of period ($) | %ownership, end of period |
| Fidelity Cash Central Fund 2.33% | 70,784 | 48,495,455 | 46,820,748 | 3,284 | - | - | 1,745,491 | 0.0% |
| Fidelity Securities Lending Cash Central Fund 2.34% | 39,878,125 | 221,414,616 | 244,865,491 | 9,897 | - | - | 16,427,250 | 0.0% |
| Total | 39,948,909 | 269,910,071 | 291,686,239 | 13,181 | - | - | 18,172,741 | |
| | | | | | | | | |
Amounts in the income column in the above table include any capital gain distributions from underlying funds, which are presented in the corresponding line item in the Statement of Operations, if applicable.
Amount for Fidelity Securities Lending Cash Central Fund represents the income earned on investing cash collateral, less rebates paid to borrowers and any lending agent fees associated with the loan, plus any premium payments received for lending certain types of securities.
Investment Valuation
The following is a summary of the inputs used, as of August 31, 2022, involving the Fund's assets and liabilities carried at fair value. The inputs or methodology used for valuing securities may not be an indication of the risk associated with investing in those securities. For more information on valuation inputs, and their aggregation into the levels used below, please refer to the Investment Valuation section in the accompanying Notes to Financial Statements.
| Valuation Inputs at Reporting Date: |
| Description | Total ($) | Level 1 ($) | Level 2 ($) | Level 3 ($) |
Investments in Securities: | | | | |
|
| Common Stocks | 476,892,380 | 476,892,380 | - | - |
|
| Convertible Bonds | 2,600,947 | - | 2,600,947 | - |
|
| Money Market Funds | 18,172,741 | 18,172,741 | - | - |
| Total Investments in Securities: | 497,666,068 | 495,065,121 | 2,600,947 | - |
Banking Portfolio
| Statement of Assets and Liabilities |
| | | | August 31, 2022 (Unaudited) |
| | | | | |
| Assets | | | | |
| Investment in securities, at value (including securities loaned of $16,043,753) - See accompanying schedule: | | $479,493,327 | | |
Unaffiliated issuers (cost $408,077,162) | | | |
Fidelity Central Funds (cost $18,172,741) | | 18,172,741 | | |
| | | | | |
| Total Investment in Securities (cost $426,249,903) | | | $ | 497,666,068 |
| Receivable for investments sold | | | | 6,024,219 |
| Receivable for fund shares sold | | | | 44,535 |
| Dividends receivable | | | | 1,039,481 |
| Distributions receivable from Fidelity Central Funds | | | | 2,279 |
| Prepaid expenses | | | | 3,462 |
| Other receivables | | | | 2,649 |
Total assets | | | | 504,782,693 |
| Liabilities | | | | |
| Payable for investments purchased | | $5,690,185 | | |
| Payable for fund shares redeemed | | 757,390 | | |
| Accrued management fee | | 223,419 | | |
| Other affiliated payables | | 81,301 | | |
| Other payables and accrued expenses | | 19,761 | | |
| Collateral on securities loaned | | 16,427,250 | | |
| Total Liabilities | | | | 23,199,306 |
| Net Assets | | | $ | 481,583,387 |
| Net Assets consist of: | | | | |
| Paid in capital | | | $ | 396,488,697 |
| Total accumulated earnings (loss) | | | | 85,094,690 |
| Net Assets | | | $ | 481,583,387 |
Net Asset Value , offering price and redemption price per share ($481,583,387 ÷ 18,528,589 shares) | | | $ | 25.99 |
| | | | | |
| Statement of Operations |
| | | | Six months ended August 31, 2022 (Unaudited) |
| Investment Income | | | | |
| Dividends | | | $ | 7,896,066 |
| Interest | | | | 54,202 |
| Income from Fidelity Central Funds (including $9,897 from security lending) | | | | 13,181 |
| Total Income | | | | 7,963,449 |
| Expenses | | | | |
| Management fee | $ | 1,415,463 | | |
| Transfer agent fees | | 433,542 | | |
| Accounting fees | | 97,796 | | |
| Custodian fees and expenses | | 5,067 | | |
| Independent trustees' fees and expenses | | 910 | | |
| Registration fees | | 35,241 | | |
| Audit | | 17,629 | | |
| Legal | | 161 | | |
| Miscellaneous | | 2,052 | | |
| Total expenses before reductions | | 2,007,861 | | |
| Expense reductions | | (9,217) | | |
| Total expenses after reductions | | | | 1,998,644 |
| Net Investment income (loss) | | | | 5,964,805 |
| Realized and Unrealized Gain (Loss) | | | | |
| Net realized gain (loss) on: | | | | |
| Investment Securities: | | | | |
| Unaffiliated issuers | | 9,350,563 | | |
| Total net realized gain (loss) | | | | 9,350,563 |
| Change in net unrealized appreciation (depreciation) on investment securities | | | | (119,316,578) |
| Net gain (loss) | | | | (109,966,015) |
| Net increase (decrease) in net assets resulting from operations | | | $ | (104,001,210) |
| Statement of Changes in Net Assets |
| |
| | Six months ended August 31, 2022 (Unaudited) | | Year ended February 28, 2022 |
| Increase (Decrease) in Net Assets | | | | |
| Operations | | | | |
| Net investment income (loss) | $ | 5,964,805 | $ | 12,596,370 |
| Net realized gain (loss) | | 9,350,563 | | 29,218,859 |
| Change in net unrealized appreciation (depreciation) | | (119,316,578) | | 75,273,957 |
| Net increase (decrease) in net assets resulting from operations | | (104,001,210) | | 117,089,186 |
| Distributions to shareholders | | (12,053,747) | | (20,298,948) |
| Share transactions | | | | |
| Proceeds from sales of shares | | 62,184,327 | | 519,785,682 |
| Reinvestment of distributions | | 11,319,007 | | 19,052,468 |
| Cost of shares redeemed | | (192,698,639) | | (456,654,461) |
Net increase (decrease) in net assets resulting from share transactions | | (119,195,305) | | 82,183,689 |
| Total increase (decrease) in net assets | | (235,250,262) | | 178,973,927 |
| | | | | |
| Net Assets | | | | |
| Beginning of period | | 716,833,649 | | 537,859,722 |
| End of period | $ | 481,583,387 | $ | 716,833,649 |
| | | | | |
| Other Information | | | | |
| Shares | | | | |
| Sold | | 2,239,568 | | 17,252,319 |
| Issued in reinvestment of distributions | | 413,403 | | 659,756 |
| Redeemed | | (6,978,484) | | (15,503,674) |
| Net increase (decrease) | | (4,325,513) | | 2,408,401 |
| | | | | |
| | Six months ended (Unaudited) August 31, 2022 | | Years ended February 28, 2022 | | 2021 | | 2020 A | | 2019 | | 2018 |
Selected Per-Share Data | | | | | | | | | | | | |
| Net asset value, beginning of period | $ | 31.37 | $ | 26.31 | $ | 23.37 | $ | 26.42 | $ | 36.82 | $ | 33.63 |
| Income from Investment Operations | | | | | | | | | | | | |
Net investment income (loss) B,C | | .30 | | .58 | | .54 | | .58 | | .49 | | .42 |
| Net realized and unrealized gain (loss) | | (5.10) | | 5.48 | | 4.32 | | (1.96) | | (3.62) | | 3.68 |
| Total from investment operations | | (4.80) | | 6.06 | | 4.86 | | (1.38) | | (3.13) | | 4.10 |
| Distributions from net investment income | | (.09) | | (.54) | | (.55) | | (.53) | | (.54) | | (.33) |
| Distributions from net realized gain | | (.49) | | (.46) | | (1.37) | | (1.14) | | (6.73) | | (.58) |
| Total distributions | | (.58) | | (1.00) | | (1.92) | | (1.67) | | (7.27) | | (.91) |
Redemption fees added to paid in capital B | | - | | - | | - | | - | | - | | - D |
| Net asset value, end of period | $ | 25.99 | $ | 31.37 | $ | 26.31 | $ | 23.37 | $ | 26.42 | $ | 36.82 |
Total Return E,F | | (15.40)% | | 23.37% | | 25.90% | | (6.05)% | | (6.57)% | | 12.31% |
Ratios to Average Net Assets C,G,H | | | | | | | | | | | | |
| Expenses before reductions | | .74% I | | .73% | | .79% | | .77% | | .77% | | .77% |
| Expenses net of fee waivers, if any | | .74% I | | .73% | | .79% | | .77% | | .77% | | .77% |
| Expenses net of all reductions | | .74% I | | .73% | | .79% | | .77% | | .76% | | .77% |
| Net investment income (loss) | | 2.21% I | | 1.93% | | 2.84% | | 2.21% | | 1.54% | | 1.26% |
| Supplemental Data | | | | | | | | | | | | |
| Net assets, end of period (000 omitted) | $ | 481,583 | $ | 716,834 | $ | 537,860 | $ | 361,696 | $ | 514,650 | $ | 830,245 |
Portfolio turnover rate J | | 12% I | | 34% | | 32% | | 31% | | 44% | | 35% |
A For the year ended February 29.
B Calculated based on average shares outstanding during the period.
C Net investment income (loss) is affected by the timing of the declaration of dividends by any underlying mutual funds or exchange-traded funds (ETFs). Net investment income (loss) of any such underlying funds is not included in the Fund's net investment income (loss) ratio.
D Amount represents less than $.005 per share.
E Total returns for periods of less than one year are not annualized.
F Total returns would have been lower if certain expenses had not been reduced during the applicable periods shown.
G Fees and expenses of any underlying mutual funds or exchange-traded funds (ETFs) are not included in the Fund's expense ratio. The Fund indirectly bears its proportionate share of these expenses. For additional expense information related to investments in Fidelity Central Funds, please refer to the "Investments in Fidelity Central Funds" note found in the Notes to Financial Statements section of the most recent Annual or Semi-Annual report.
H Expense ratios reflect operating expenses of the class. Expenses before reductions do not reflect amounts reimbursed, waived, or reduced through arrangements with the investment adviser, brokerage services, or other offset arrangements, if applicable, and do not represent the amount paid by the class during periods when reimbursements, waivers or reductions occur.
I Annualized
J Amount does not include the portfolio activity of any underlying mutual funds or exchange-traded funds (ETFs).
Top Holdings (% of Fund's net assets) |
| |
| S&P Global, Inc. | 6.0 | |
| BlackRock, Inc. Class A | 5.8 | |
| LPL Financial | 5.7 | |
| Morgan Stanley | 5.7 | |
| Ameriprise Financial, Inc. | 5.4 | |
| Charles Schwab Corp. | 5.3 | |
| Intercontinental Exchange, Inc. | 5.1 | |
| Bank of New York Mellon Corp. | 4.0 | |
| NASDAQ, Inc. | 3.9 | |
| KKR & Co. LP | 3.9 | |
| | 50.8 | |
| |
| Industries (% of Fund's net assets) |
| |
| Capital Markets | 96.2 | |
| Diversified Financial Services | 2.4 | |
| Banks | 0.6 | |
| IT Services | 0.3 | |
| |
Percentages shown as 0.0% reflect amounts less than 0.05%.
Brokerage and Investment Management Portfolio
| Common Stocks - 99.5% |
| | | Shares | Value ($) |
| Banks - 0.6% | | | |
| Diversified Banks - 0.6% | | | |
| Wells Fargo & Co. | | 125,200 | 5,472,492 |
| Capital Markets - 96.2% | | | |
| Asset Management & Custody Banks - 39.8% | | | |
| Affiliated Managers Group, Inc. | | 44,700 | 5,692,992 |
| Ameriprise Financial, Inc. | | 181,200 | 48,563,412 |
| Ares Management Corp. (a) | | 427,600 | 31,702,264 |
| Artisan Partners Asset Management, Inc. (a) | | 67,500 | 2,278,800 |
| Bank of New York Mellon Corp. | | 881,300 | 36,600,389 |
| BlackRock, Inc. Class A | | 79,100 | 52,711,449 |
| Blackstone, Inc. | | 252,000 | 23,672,880 |
| Blucora, Inc. (b) | | 22,800 | 457,824 |
| Blue Owl Capital, Inc. Class A (a) | | 950,400 | 10,549,440 |
| Bridge Investment Group Holdings, Inc. | | 113,400 | 1,849,554 |
| Carlyle Group LP | | 404,500 | 13,158,385 |
| Cohen & Steers, Inc. | | 12,228 | 872,835 |
| Focus Financial Partners, Inc. Class A (b) | | 10,900 | 426,735 |
| Franklin Resources, Inc. (a) | | 366,100 | 9,544,227 |
| Invesco Ltd. | | 424,200 | 6,986,574 |
| Janus Henderson Group PLC (a) | | 164,100 | 3,839,940 |
| KKR & Co. LP | | 689,200 | 34,845,952 |
| Northern Trust Corp. | | 126,000 | 11,981,340 |
| P10, Inc. | | 173,600 | 2,166,528 |
| Patria Investments Ltd. | | 474,072 | 6,850,340 |
| Petershill Partners PLC (c) | | 313,800 | 822,041 |
| State Street Corp. | | 360,800 | 24,660,680 |
| T. Rowe Price Group, Inc. | | 186,500 | 22,380,000 |
| Virtus Investment Partners, Inc. | | 39,000 | 7,458,750 |
| | | | 360,073,331 |
| Financial Exchanges & Data - 28.9% | | | |
| Cboe Global Markets, Inc. | | 108,938 | 12,851,416 |
| CME Group, Inc. | | 167,500 | 32,764,675 |
| Coinbase Global, Inc. (a)(b) | | 93,500 | 6,245,800 |
| FactSet Research Systems, Inc. | | 2,400 | 1,040,016 |
| Intercontinental Exchange, Inc. | | 458,500 | 46,239,725 |
| MarketAxess Holdings, Inc. | | 29,200 | 7,258,828 |
| Moody's Corp. | | 93,700 | 26,659,524 |
| MSCI, Inc. | | 65,600 | 29,470,144 |
| NASDAQ, Inc. (a) | | 593,700 | 35,342,961 |
| Open Lending Corp. (a)(b) | | 252,500 | 2,451,775 |
| S&P Global, Inc. | | 153,700 | 54,130,065 |
| Tradeweb Markets, Inc. Class A | | 100,400 | 6,986,836 |
| | | | 261,441,765 |
| Investment Banking & Brokerage - 27.5% | | | |
| BGC Partners, Inc. Class A | | 468,000 | 1,881,360 |
| Charles Schwab Corp. | | 671,861 | 47,668,538 |
| Goldman Sachs Group, Inc. | | 98,700 | 32,834,529 |
| Interactive Brokers Group, Inc. | | 124,800 | 7,686,432 |
| LPL Financial | | 232,000 | 51,348,560 |
| Moelis & Co. Class A (a) | | 117,700 | 4,903,382 |
| Morgan Stanley | | 601,416 | 51,252,672 |
| Piper Jaffray Companies (a) | | 3,800 | 435,366 |
| PJT Partners, Inc. | | 172,312 | 11,927,437 |
| Raymond James Financial, Inc. | | 260,500 | 27,188,385 |
| Robinhood Markets, Inc. (a)(b) | | 380,900 | 3,637,595 |
| Virtu Financial, Inc. Class A | | 327,400 | 7,517,104 |
| | | | 248,281,360 |
TOTAL CAPITAL MARKETS | | | 869,796,456 |
| Diversified Financial Services - 2.4% | | | |
| Other Diversified Financial Services - 2.4% | | | |
| Apollo Global Management, Inc. (a) | | 399,500 | 22,204,210 |
| IT Services - 0.3% | | | |
| Data Processing & Outsourced Services - 0.3% | | | |
| PayPal Holdings, Inc. (b) | | 28,300 | 2,644,352 |
| TOTAL COMMON STOCKS (Cost $785,204,535) | | | 900,117,510 |
| | | | |
| Money Market Funds - 5.4% |
| | | Shares | Value ($) |
| Fidelity Cash Central Fund 2.33% (d) | | 4,125,431 | 4,126,256 |
| Fidelity Securities Lending Cash Central Fund 2.34% (d)(e) | | 44,178,024 | 44,182,442 |
| TOTAL MONEY MARKET FUNDS (Cost $48,308,698) | | | 48,308,698 |
| | | | |
| TOTAL INVESTMENT IN SECURITIES - 104.9% (Cost $833,513,233) | 948,426,208 |
NET OTHER ASSETS (LIABILITIES) - (4.9)% | (43,974,837) |
| NET ASSETS - 100.0% | 904,451,371 |
| | |
Legend
| (a) | Security or a portion of the security is on loan at period end. |
| (c) | Security exempt from registration under Rule 144A of the Securities Act of 1933. These securities may be resold in transactions exempt from registration, normally to qualified institutional buyers. At the end of the period, the value of these securities amounted to $822,041 or 0.1% of net assets. |
| (d) | Affiliated fund that is generally available only to investment companies and other accounts managed by Fidelity Investments. The rate quoted is the annualized seven-day yield of the fund at period end. A complete unaudited listing of the fund's holdings as of its most recent quarter end is available upon request. In addition, each Fidelity Central Fund's financial statements are available on the SEC's website or upon request. |
| (e) | Investment made with cash collateral received from securities on loan. |
Affiliated Central Funds
Fiscal year to date information regarding the Fund's investments in Fidelity Central Funds, including the ownership percentage, is presented below.
| Affiliate | Value, beginning of period ($) | Purchases ($) | Sales Proceeds ($) | Dividend Income ($) | Realized Gain (loss) ($) | Change in Unrealized appreciation (depreciation) ($) | Value, end of period ($) | %ownership, end of period |
| Fidelity Cash Central Fund 2.33% | 8,617,943 | 45,591,112 | 50,082,799 | 16,402 | - | - | 4,126,256 | 0.0% |
| Fidelity Securities Lending Cash Central Fund 2.34% | 47,542,900 | 331,685,535 | 335,045,993 | 67,558 | - | - | 44,182,442 | 0.1% |
| Total | 56,160,843 | 377,276,647 | 385,128,792 | 83,960 | - | - | 48,308,698 | |
| | | | | | | | | |
Amounts in the income column in the above table include any capital gain distributions from underlying funds, which are presented in the corresponding line item in the Statement of Operations, if applicable.
Amount for Fidelity Securities Lending Cash Central Fund represents the income earned on investing cash collateral, less rebates paid to borrowers and any lending agent fees associated with the loan, plus any premium payments received for lending certain types of securities.
Investment Valuation
The following is a summary of the inputs used, as of August 31, 2022, involving the Fund's assets and liabilities carried at fair value. The inputs or methodology used for valuing securities may not be an indication of the risk associated with investing in those securities. For more information on valuation inputs, and their aggregation into the levels used below, please refer to the Investment Valuation section in the accompanying Notes to Financial Statements.
| Valuation Inputs at Reporting Date: |
| Description | Total ($) | Level 1 ($) | Level 2 ($) | Level 3 ($) |
Investments in Securities: | | | | |
|
| Common Stocks | 900,117,510 | 900,117,510 | - | - |
|
| Money Market Funds | 48,308,698 | 48,308,698 | - | - |
| Total Investments in Securities: | 948,426,208 | 948,426,208 | - | - |
Brokerage and Investment Management Portfolio
| Statement of Assets and Liabilities |
| | | | August 31, 2022 (Unaudited) |
| | | | | |
| Assets | | | | |
| Investment in securities, at value (including securities loaned of $43,039,269) - See accompanying schedule: | | $900,117,510 | | |
Unaffiliated issuers (cost $785,204,535) | | | |
Fidelity Central Funds (cost $48,308,698) | | 48,308,698 | | |
| | | | | |
| Total Investment in Securities (cost $833,513,233) | | | $ | 948,426,208 |
| Receivable for investments sold | | | | 445,160 |
| Receivable for fund shares sold | | | | 218,465 |
| Dividends receivable | | | | 752,202 |
| Distributions receivable from Fidelity Central Funds | | | | 29,704 |
| Prepaid expenses | | | | 3,266 |
| Other receivables | | | | 52,199 |
Total assets | | | | 949,927,204 |
| Liabilities | | | | |
| Payable for fund shares redeemed | | 649,756 | | |
| Accrued management fee | | 418,043 | | |
| Other affiliated payables | | 154,672 | | |
| Other payables and accrued expenses | | 70,920 | | |
| Collateral on securities loaned | | 44,182,442 | | |
| Total Liabilities | | | | 45,475,833 |
| Net Assets | | | $ | 904,451,371 |
| Net Assets consist of: | | | | |
| Paid in capital | | | $ | 818,859,818 |
| Total accumulated earnings (loss) | | | | 85,591,553 |
| Net Assets | | | $ | 904,451,371 |
Net Asset Value , offering price and redemption price per share ($904,451,371 ÷ 8,483,353 shares) | | | $ | 106.61 |
| | | | | |
| Statement of Operations |
| | | | Six months ended August 31, 2022 (Unaudited) |
| Investment Income | | | | |
| Dividends | | | $ | 10,297,309 |
| Income from Fidelity Central Funds (including $67,558 from security lending) | | | | 83,960 |
| Total Income | | | | 10,381,269 |
| Expenses | | | | |
| Management fee | $ | 2,576,678 | | |
| Transfer agent fees | | 843,215 | | |
| Accounting fees | | 155,209 | | |
| Custodian fees and expenses | | 7,476 | | |
| Independent trustees' fees and expenses | | 1,635 | | |
| Registration fees | | 49,586 | | |
| Audit | | 17,704 | | |
| Legal | | 296 | | |
| Interest | | 1,404 | | |
| Miscellaneous | | 2,201 | | |
| Total expenses before reductions | | 3,655,404 | | |
| Expense reductions | | (16,448) | | |
| Total expenses after reductions | | | | 3,638,956 |
| Net Investment income (loss) | | | | 6,742,313 |
| Realized and Unrealized Gain (Loss) | | | | |
| Net realized gain (loss) on: | | | | |
| Investment Securities: | | | | |
| Unaffiliated issuers | | (35,550,693) | | |
| Foreign currency transactions | | 575 | | |
| Total net realized gain (loss) | | | | (35,550,118) |
| Change in net unrealized appreciation (depreciation) on: | | | | |
| Investment Securities: | | | | |
| Unaffiliated issuers | | (106,222,205) | | |
| Assets and liabilities in foreign currencies | | (2,807) | | |
| Total change in net unrealized appreciation (depreciation) | | | | (106,225,012) |
| Net gain (loss) | | | | (141,775,130) |
| Net increase (decrease) in net assets resulting from operations | | | $ | (135,032,817) |
| Statement of Changes in Net Assets |
| |
| | Six months ended August 31, 2022 (Unaudited) | | Year ended February 28, 2022 |
| Increase (Decrease) in Net Assets | | | | |
| Operations | | | | |
| Net investment income (loss) | $ | 6,742,313 | $ | 8,497,410 |
| Net realized gain (loss) | | (35,550,118) | | 5,615,492 |
| Change in net unrealized appreciation (depreciation) | | (106,225,012) | | 42,391,470 |
| Net increase (decrease) in net assets resulting from operations | | (135,032,817) | | 56,504,372 |
| Distributions to shareholders | | (5,342,806) | | (11,958,952) |
| Share transactions | | | | |
| Proceeds from sales of shares | | 97,855,743 | | 1,076,173,907 |
| Reinvestment of distributions | | 4,921,795 | | 11,131,114 |
| Cost of shares redeemed | | (267,672,352) | | (351,448,797) |
Net increase (decrease) in net assets resulting from share transactions | | (164,894,814) | | 735,856,224 |
| Total increase (decrease) in net assets | | (305,270,437) | | 780,401,644 |
| | | | | |
| Net Assets | | | | |
| Beginning of period | | 1,209,721,808 | | 429,320,164 |
| End of period | $ | 904,451,371 | $ | 1,209,721,808 |
| | | | | |
| Other Information | | | | |
| Shares | | | | |
| Sold | | 868,879 | | 8,446,490 |
| Issued in reinvestment of distributions | | 41,381 | | 92,249 |
| Redeemed | | (2,424,028) | | (2,792,832) |
| Net increase (decrease) | | (1,513,768) | | 5,745,907 |
| | | | | |
| Brokerage and Investment Management Portfolio |
| |
| | Six months ended (Unaudited) August 31, 2022 | | Years ended February 28, 2022 | | 2021 | | 2020 A | | 2019 | | 2018 |
Selected Per-Share Data | | | | | | | | | | | | |
| Net asset value, beginning of period | $ | 121.01 | $ | 100.99 | $ | 74.99 | $ | 71.71 | $ | 84.47 | $ | 71.13 |
| Income from Investment Operations | | | | | | | | | | | | |
Net investment income (loss) B,C | | .75 | | 1.31 | | .93 | | 1.01 | | .77 | | 1.15 |
| Net realized and unrealized gain (loss) | | (14.59) | | 20.54 | | 28.01 | | 5.70 | | (7.60) | | 17.88 |
| Total from investment operations | | (13.84) | | 21.85 | | 28.94 | | 6.71 | | (6.83) | | 19.03 |
| Distributions from net investment income | | (.16) | | (.83) | | (1.06) | | (.98) | | (.96) | | (.82) |
| Distributions from net realized gain | | (.41) | | (1.01) | | (1.88) | | (2.45) | | (4.96) | | (4.87) |
| Total distributions | | (.56) D | | (1.83) D | | (2.94) | | (3.43) | | (5.93) D | | (5.69) |
Redemption fees added to paid in capital B | | - | | - | | - | | - | | - | | - E |
| Net asset value, end of period | $ | 106.61 | $ | 121.01 | $ | 100.99 | $ | 74.99 | $ | 71.71 | $ | 84.47 |
Total Return F,G | | (11.48)% | | 21.70% | | 39.69% | | 9.28% | | (8.04)% | | 27.51% |
Ratios to Average Net Assets C,H,I | | | | | | | | | | | | |
| Expenses before reductions | | .75% J | | .74% | | .76% | | .77% | | .78% | | .79% |
| Expenses net of fee waivers, if any | | .74% J | | .74% | | .76% | | .77% | | .77% | | .79% |
| Expenses net of all reductions | | .74% J | | .74% | | .76% | | .77% | | .77% | | .78% |
| Net investment income (loss) | | 1.37% J | | 1.06% | | 1.14% | | 1.33% | | 1.01% | | 1.49% |
| Supplemental Data | | | | | | | | | | | | |
| Net assets, end of period (000 omitted) | $ | 904,451 | $ | 1,209,722 | $ | 429,320 | $ | 309,088 | $ | 327,128 | $ | 461,981 |
Portfolio turnover rate K | | 6% J | | 3% | | 11% | | 9% | | 30% | | 75% |
A For the year ended February 29.
B Calculated based on average shares outstanding during the period.
C Net investment income (loss) is affected by the timing of the declaration of dividends by any underlying mutual funds or exchange-traded funds (ETFs). Net investment income (loss) of any such underlying funds is not included in the Fund's net investment income (loss) ratio.
D Total distributions per share do not sum due to rounding.
E Amount represents less than $.005 per share.
F Total returns for periods of less than one year are not annualized.
G Total returns would have been lower if certain expenses had not been reduced during the applicable periods shown.
H Fees and expenses of any underlying mutual funds or exchange-traded funds (ETFs) are not included in the Fund's expense ratio. The Fund indirectly bears its proportionate share of these expenses. For additional expense information related to investments in Fidelity Central Funds, please refer to the "Investments in Fidelity Central Funds" note found in the Notes to Financial Statements section of the most recent Annual or Semi-Annual report.
I Expense ratios reflect operating expenses of the class. Expenses before reductions do not reflect amounts reimbursed, waived, or reduced through arrangements with the investment adviser, brokerage services, or other offset arrangements, if applicable, and do not represent the amount paid by the class during periods when reimbursements, waivers or reductions occur.
J Annualized
K Amount does not include the portfolio activity of any underlying mutual funds or exchange-traded funds (ETFs).
Top Holdings (% of Fund's net assets) |
| |
| Wells Fargo & Co. | 7.4 | |
| Bank of America Corp. | 5.2 | |
| M&T Bank Corp. | 4.1 | |
| Morgan Stanley | 3.8 | |
| Citigroup, Inc. | 3.3 | |
| Arthur J. Gallagher & Co. | 3.0 | |
| State Street Corp. | 2.8 | |
| Marsh & McLennan Companies, Inc. | 2.8 | |
| Reinsurance Group of America, Inc. | 2.8 | |
| U.S. Bancorp | 2.7 | |
| | 37.9 | |
| |
| Industries (% of Fund's net assets) |
| |
| Banks | 39.9 | |
| Insurance | 25.5 | |
| Capital Markets | 17.9 | |
| Thrifts & Mortgage Finance | 4.8 | |
| Consumer Finance | 4.4 | |
| IT Services | 3.5 | |
| Diversified Financial Services | 2.1 | |
| Professional Services | 1.5 | |
| Software | 0.6 | |
| |
Geographic Diversification (% of Fund's net assets) |
|
* Includes Short-Term investments and Net Other Assets (Liabilities). Percentages are based on country or territory of incorporation and are adjusted for the effect of futures contracts, if applicable. |
| |
Percentages shown as 0.0% reflect amounts less than 0.05%.
Financial Services Portfolio
| Common Stocks - 99.7% |
| | | Shares | Value ($) |
| Banks - 39.9% | | | |
| Diversified Banks - 21.2% | | | |
| Bank of America Corp. | | 923,800 | 31,048,918 |
| Citigroup, Inc. | | 398,500 | 19,450,785 |
| JPMorgan Chase & Co. | | 130,100 | 14,796,273 |
| Piraeus Financial Holdings SA (a) | | 380,900 | 401,159 |
| U.S. Bancorp | | 358,000 | 16,328,380 |
| Wells Fargo & Co. | | 1,009,090 | 44,107,324 |
| | | | 126,132,839 |
| Regional Banks - 18.7% | | | |
| Associated Banc-Corp. | | 227,100 | 4,551,084 |
| Bank OZK (b) | | 102,600 | 4,158,378 |
| BankUnited, Inc. | | 83,700 | 3,101,085 |
| BOK Financial Corp. | | 41,000 | 3,643,670 |
| Cadence Bank | | 173,330 | 4,416,448 |
| Comerica, Inc. | | 58,700 | 4,713,610 |
| East West Bancorp, Inc. | | 92,000 | 6,639,640 |
| First Citizens Bancshares, Inc. (b) | | 10,000 | 8,119,600 |
| First Interstate Bancsystem, Inc. | | 141,721 | 5,705,687 |
| Heartland Financial U.S.A., Inc. | | 89,300 | 3,989,031 |
| Huntington Bancshares, Inc. | | 666,300 | 8,928,420 |
| M&T Bank Corp. | | 133,737 | 24,310,712 |
| PacWest Bancorp | | 136,200 | 3,586,146 |
| Popular, Inc. | | 67,500 | 5,212,350 |
| Signature Bank | | 26,300 | 4,585,668 |
| Truist Financial Corp. | | 243,800 | 11,419,592 |
| Wintrust Financial Corp. | | 53,400 | 4,503,756 |
| | | | 111,584,877 |
TOTAL BANKS | | | 237,717,716 |
| Capital Markets - 17.9% | | | |
| Asset Management & Custody Banks - 8.6% | | | |
| Affiliated Managers Group, Inc. | | 28,300 | 3,604,288 |
| AllianceBernstein Holding LP | | 273 | 11,761 |
| Bank of New York Mellon Corp. | | 232,400 | 9,651,572 |
| Brookfield Asset Management, Inc. Class A | | 108,715 | 5,230,279 |
| Carlyle Group LP | | 186,100 | 6,053,833 |
| Northern Trust Corp. | | 43,400 | 4,126,906 |
| Patria Investments Ltd. (b) | | 391,600 | 5,658,620 |
| Phoenix Vega Mezz PLC (a) | | 380,900 | 24,881 |
| State Street Corp. | | 246,800 | 16,868,780 |
| | | | 51,230,920 |
| Financial Exchanges & Data - 1.6% | | | |
| Bolsa Mexicana de Valores S.A.B. de CV | | 1,884,700 | 3,404,275 |
| Cboe Global Markets, Inc. | | 55,100 | 6,500,147 |
| | | | 9,904,422 |
| Investment Banking & Brokerage - 7.7% | | | |
| Lazard Ltd. Class A | | 241,792 | 8,789,139 |
| Morgan Stanley | | 262,400 | 22,361,728 |
| Raymond James Financial, Inc. | | 97,500 | 10,176,075 |
| Virtu Financial, Inc. Class A | | 193,800 | 4,449,648 |
| | | | 45,776,590 |
TOTAL CAPITAL MARKETS | | | 106,911,932 |
| Consumer Finance - 4.4% | | | |
| Consumer Finance - 4.4% | | | |
| Capital One Financial Corp. | | 139,800 | 14,793,636 |
| FirstCash Holdings, Inc. | | 85,611 | 6,674,234 |
| OneMain Holdings, Inc. | | 133,300 | 4,656,169 |
| | | | 26,124,039 |
| Diversified Financial Services - 2.1% | | | |
| Multi-Sector Holdings - 0.8% | | | |
| Cannae Holdings, Inc. (a) | | 220,690 | 4,769,111 |
| Other Diversified Financial Services - 1.3% | | | |
| Apollo Global Management, Inc. (b) | | 139,100 | 7,731,178 |
TOTAL DIVERSIFIED FINANCIAL SERVICES | | | 12,500,289 |
| Insurance - 25.5% | | | |
| Insurance Brokers - 5.8% | | | |
| Arthur J. Gallagher & Co. | | 97,700 | 17,739,389 |
| Marsh & McLennan Companies, Inc. | | 104,500 | 16,863,165 |
| | | | 34,602,554 |
| Life & Health Insurance - 2.7% | | | |
| Globe Life, Inc. | | 100,500 | 9,767,595 |
| Primerica, Inc. | | 50,300 | 6,375,525 |
| | | | 16,143,120 |
| Multi-Line Insurance - 2.6% | | | |
| Assurant, Inc. | | 43,900 | 6,957,711 |
| Hartford Financial Services Group, Inc. | | 134,200 | 8,630,402 |
| | | | 15,588,113 |
| Property & Casualty Insurance - 11.6% | | | |
| American Financial Group, Inc. | | 40,900 | 5,222,112 |
| Beazley PLC | | 741,200 | 5,019,933 |
| Chubb Ltd. | | 84,100 | 15,899,105 |
| Fidelity National Financial, Inc. | | 190,100 | 7,432,910 |
| First American Financial Corp. | | 169,100 | 9,046,850 |
| Hiscox Ltd. | | 573,700 | 5,983,543 |
| Old Republic International Corp. | | 176,300 | 3,850,392 |
| Selective Insurance Group, Inc. | | 47,000 | 3,732,740 |
| The Travelers Companies, Inc. | | 81,400 | 13,157,496 |
| | | | 69,345,081 |
| Reinsurance - 2.8% | | | |
| Reinsurance Group of America, Inc. | | 133,100 | 16,685,416 |
TOTAL INSURANCE | | | 152,364,284 |
| IT Services - 3.0% | | | |
| Data Processing & Outsourced Services - 3.0% | | | |
| Global Payments, Inc. | | 68,500 | 8,509,755 |
| MasterCard, Inc. Class A | | 28,200 | 9,147,234 |
| | | | 17,656,989 |
| Professional Services - 1.5% | | | |
| Research & Consulting Services - 1.5% | | | |
| Dun & Bradstreet Holdings, Inc. (a)(b) | | 306,000 | 4,360,500 |
| Equifax, Inc. | | 24,000 | 4,530,000 |
| | | | 8,890,500 |
| Software - 0.6% | | | |
| Application Software - 0.6% | | | |
| Black Knight, Inc. (a) | | 56,500 | 3,738,040 |
| Thrifts & Mortgage Finance - 4.8% | | | |
| Thrifts & Mortgage Finance - 4.8% | | | |
| Essent Group Ltd. | | 315,138 | 12,602,369 |
| MGIC Investment Corp. | | 204,409 | 2,921,005 |
| NMI Holdings, Inc. (a) | | 475,443 | 9,760,845 |
| Walker & Dunlop, Inc. | | 31,400 | 3,154,444 |
| | | | 28,438,663 |
| TOTAL COMMON STOCKS (Cost $518,018,416) | | | 594,342,452 |
| | | | |
| Convertible Bonds - 0.5% |
| | | Principal Amount (c) | Value ($) |
| IT Services - 0.5% | | | |
| Data Processing & Outsourced Services - 0.5% | | | |
Affirm Holdings, Inc. 0% 11/15/26 (d) (Cost $3,124,880) | | 5,175,000 | 3,269,347 |
| | | | |
| Money Market Funds - 3.8% |
| | | Shares | Value ($) |
| Fidelity Cash Central Fund 2.33% (e) | | 1,841,844 | 1,842,212 |
| Fidelity Securities Lending Cash Central Fund 2.34% (e)(f) | | 20,717,928 | 20,720,000 |
| TOTAL MONEY MARKET FUNDS (Cost $22,562,212) | | | 22,562,212 |
| | | | |
| TOTAL INVESTMENT IN SECURITIES - 104.0% (Cost $543,705,508) | 620,174,011 |
NET OTHER ASSETS (LIABILITIES) - (4.0)% | (23,739,838) |
| NET ASSETS - 100.0% | 596,434,173 |
| | |
Legend
| (b) | Security or a portion of the security is on loan at period end. |
| (c) | Amount is stated in United States dollars unless otherwise noted. |
| (d) | Security exempt from registration under Rule 144A of the Securities Act of 1933. These securities may be resold in transactions exempt from registration, normally to qualified institutional buyers. At the end of the period, the value of these securities amounted to $3,269,347 or 0.5% of net assets. |
| (e) | Affiliated fund that is generally available only to investment companies and other accounts managed by Fidelity Investments. The rate quoted is the annualized seven-day yield of the fund at period end. A complete unaudited listing of the fund's holdings as of its most recent quarter end is available upon request. In addition, each Fidelity Central Fund's financial statements are available on the SEC's website or upon request. |
| (f) | Investment made with cash collateral received from securities on loan. |
Affiliated Central Funds
Fiscal year to date information regarding the Fund's investments in Fidelity Central Funds, including the ownership percentage, is presented below.
| Affiliate | Value, beginning of period ($) | Purchases ($) | Sales Proceeds ($) | Dividend Income ($) | Realized Gain (loss) ($) | Change in Unrealized appreciation (depreciation) ($) | Value, end of period ($) | %ownership, end of period |
| Fidelity Cash Central Fund 2.33% | 3,554,184 | 56,125,788 | 57,837,760 | 4,778 | - | - | 1,842,212 | 0.0% |
| Fidelity Securities Lending Cash Central Fund 2.34% | 19,553,600 | 124,515,904 | 123,349,504 | 8,769 | - | - | 20,720,000 | 0.1% |
| Total | 23,107,784 | 180,641,692 | 181,187,264 | 13,547 | - | - | 22,562,212 | |
| | | | | | | | | |
Amounts in the income column in the above table include any capital gain distributions from underlying funds, which are presented in the corresponding line item in the Statement of Operations, if applicable.
Amount for Fidelity Securities Lending Cash Central Fund represents the income earned on investing cash collateral, less rebates paid to borrowers and any lending agent fees associated with the loan, plus any premium payments received for lending certain types of securities.
Investment Valuation
The following is a summary of the inputs used, as of August 31, 2022, involving the Fund's assets and liabilities carried at fair value. The inputs or methodology used for valuing securities may not be an indication of the risk associated with investing in those securities. For more information on valuation inputs, and their aggregation into the levels used below, please refer to the Investment Valuation section in the accompanying Notes to Financial Statements.
| Valuation Inputs at Reporting Date: |
| Description | Total ($) | Level 1 ($) | Level 2 ($) | Level 3 ($) |
Investments in Securities: | | | | |
|
| Common Stocks | 594,342,452 | 594,342,452 | - | - |
|
| Convertible Bonds | 3,269,347 | - | 3,269,347 | - |
|
| Money Market Funds | 22,562,212 | 22,562,212 | - | - |
| Total Investments in Securities: | 620,174,011 | 616,904,664 | 3,269,347 | - |
Financial Services Portfolio
| Statement of Assets and Liabilities |
| | | | August 31, 2022 (Unaudited) |
| | | | | |
| Assets | | | | |
| Investment in securities, at value (including securities loaned of $20,303,894) - See accompanying schedule: | | $597,611,799 | | |
Unaffiliated issuers (cost $521,143,296) | | | |
Fidelity Central Funds (cost $22,562,212) | | 22,562,212 | | |
| | | | | |
| Total Investment in Securities (cost $543,705,508) | | | $ | 620,174,011 |
| Receivable for investments sold | | | | 5,586,462 |
| Receivable for fund shares sold | | | | 653,050 |
| Dividends receivable | | | | 1,247,099 |
| Distributions receivable from Fidelity Central Funds | | | | 2,665 |
| Prepaid expenses | | | | 5,150 |
| Other receivables | | | | 4,696 |
Total assets | | | | 627,673,133 |
| Liabilities | | | | |
| Payable for investments purchased | | 8,698,403 | | |
| Payable for fund shares redeemed | | 1,421,234 | | |
| Accrued management fee | | 273,389 | | |
| Other affiliated payables | | 104,283 | | |
| Other payables and accrued expenses | | 21,651 | | |
| Collateral on securities loaned | | 20,720,000 | | |
| Total Liabilities | | | | 31,238,960 |
| Net Assets | | | $ | 596,434,173 |
| Net Assets consist of: | | | | |
| Paid in capital | | | $ | 491,632,316 |
| Total accumulated earnings (loss) | | | | 104,801,857 |
| Net Assets | | | $ | 596,434,173 |
Net Asset Value , offering price and redemption price per share ($596,434,173 ÷ 53,614,322 shares) | | | $ | 11.12 |
| | | | | |
| Statement of Operations |
| | | | Six months ended August 31, 2022 (Unaudited) |
| Investment Income | | | | |
| Dividends | | | $ | 9,098,236 |
| Interest | | | | 76,632 |
| Income from Fidelity Central Funds (including $8,769 from security lending) | | | | 13,547 |
| Total Income | | | | 9,188,415 |
| Expenses | | | | |
| Management fee | $ | 1,729,058 | | |
| Transfer agent fees | | 565,049 | | |
| Accounting fees | | 113,496 | | |
| Custodian fees and expenses | | 6,822 | | |
| Independent trustees' fees and expenses | | 1,098 | | |
| Registration fees | | 37,933 | | |
| Audit | | 17,929 | | |
| Legal | | 194 | | |
| Interest | | 239 | | |
| Miscellaneous | | 2,834 | | |
| Total expenses before reductions | | 2,474,652 | | |
| Expense reductions | | (11,053) | | |
| Total expenses after reductions | | | | 2,463,599 |
| Net Investment income (loss) | | | | 6,724,816 |
| Realized and Unrealized Gain (Loss) | | | | |
| Net realized gain (loss) on: | | | | |
| Investment Securities: | | | | |
| Unaffiliated issuers | | 23,928,169 | | |
| Foreign currency transactions | | (2,324) | | |
| Total net realized gain (loss) | | | | 23,925,845 |
| Change in net unrealized appreciation (depreciation) on: | | | | |
| Investment Securities: | | | | |
| Unaffiliated issuers | | (121,633,101) | | |
| Assets and liabilities in foreign currencies | | (3,302) | | |
| Total change in net unrealized appreciation (depreciation) | | | | (121,636,403) |
| Net gain (loss) | | | | (97,710,558) |
| Net increase (decrease) in net assets resulting from operations | | | $ | (90,985,742) |
| Statement of Changes in Net Assets |
| |
| | Six months ended August 31, 2022 (Unaudited) | | Year ended February 28, 2022 |
| Increase (Decrease) in Net Assets | | | | |
| Operations | | | | |
| Net investment income (loss) | $ | 6,724,816 | $ | 15,691,678 |
| Net realized gain (loss) | | 23,925,845 | | 64,214,173 |
| Change in net unrealized appreciation (depreciation) | | (121,636,403) | | 59,571,315 |
| Net increase (decrease) in net assets resulting from operations | | (90,985,742) | | 139,477,166 |
| Distributions to shareholders | | (36,261,794) | | (29,541,664) |
| Share transactions | | | | |
| Proceeds from sales of shares | | 67,251,122 | | 634,993,625 |
| Reinvestment of distributions | | 33,493,073 | | 27,204,727 |
| Cost of shares redeemed | | (196,972,218) | | (558,271,824) |
Net increase (decrease) in net assets resulting from share transactions | | (96,228,023) | | 103,926,528 |
| Total increase (decrease) in net assets | | (223,475,559) | | 213,862,030 |
| | | | | |
| Net Assets | | | | |
| Beginning of period | | 819,909,732 | | 606,047,702 |
| End of period | $ | 596,434,173 | $ | 819,909,732 |
| | | | | |
| Other Information | | | | |
| Shares | | | | |
| Sold | | 5,615,051 | | 48,475,233 |
| Issued in reinvestment of distributions | | 2,802,767 | | 2,146,844 |
| Redeemed | | (16,756,282) | | (42,497,145) |
| Net increase (decrease) | | (8,338,464) | | 8,124,932 |
| | | | | |
| Financial Services Portfolio |
| |
| | Six months ended (Unaudited) August 31, 2022 | | Years ended February 28, 2022 | | 2021 | | 2020 A | | 2019 B | | 2018 B |
Selected Per-Share Data | | | | | | | | | | | | |
| Net asset value, beginning of period | $ | 13.23 | $ | 11.26 | $ | 9.49 | $ | 9.65 | $ | 11.67 | $ | 10.31 |
| Income from Investment Operations | | | | | | | | | | | | |
Net investment income (loss) C,D | | .12 | | .25 | | .20 | | .19 | | .14 | | .09 |
| Net realized and unrealized gain (loss) | | (1.61) | | 2.26 | | 2.17 | | .26 | | (1.04) | | 1.76 |
| Total from investment operations | | (1.49) | | 2.51 | | 2.37 | | .45 | | (.90) | | 1.85 |
| Distributions from net investment income | | (.04) | | (.26) | | (.21) | | (.16) | | (.14) | | (.07) |
| Distributions from net realized gain | | (.59) | | (.28) | | (.39) | | (.45) | | (.98) | | (.42) |
| Total distributions | | (.62) E | | (.54) | | (.60) | | (.61) | | (1.12) | | (.49) |
| Net asset value, end of period | $ | 11.12 | $ | 13.23 | $ | 11.26 | $ | 9.49 | $ | 9.65 | $ | 11.67 |
Total Return F,G | | (11.56)% | | 22.47% | | 27.89% | | 3.81% | | (6.91)% | | 18.33% |
Ratios to Average Net Assets D,H,I | | | | | | | | | | | | |
| Expenses before reductions | | .75% J | | .73% | | .77% | | .77% | | .76% | | .77% |
| Expenses net of fee waivers, if any | | .75% J | | .72% | | .77% | | .77% | | .76% | | .77% |
| Expenses net of all reductions | | .75% J | | .72% | | .77% | | .76% | | .75% | | .76% |
| Net investment income (loss) | | 2.04% J | | 1.89% | | 2.36% | | 1.81% | | 1.28% | | .87% |
| Supplemental Data | | | | | | | | | | | | |
| Net assets, end of period (000 omitted) | $ | 596,434 | $ | 819,910 | $ | 606,048 | $ | 483,337 | $ | 558,429 | $ | 1,308,254 |
Portfolio turnover rate K | | 29% J | | 53% | | 63% | | 61% L | | 49% L | | 54% |
A For the year ended February 29.
B Per share amounts have been adjusted to reflect the impact of the 10 for 1 share split that soccurred on August 10, 2018.
C Calculated based on average shares outstanding during the period.
D Net investment income (loss) is affected by the timing of the declaration of dividends by any underlying mutual funds or exchange-traded funds (ETFs). Net investment income (loss) of any such underlying funds is not included in the Fund's net investment income (loss) ratio.
E Total distributions per share do not sum due to rounding.
F Total returns for periods of less than one year are not annualized.
G Total returns would have been lower if certain expenses had not been reduced during the applicable periods shown.
H Fees and expenses of any underlying mutual funds or exchange-traded funds (ETFs) are not included in the Fund's expense ratio. The Fund indirectly bears its proportionate share of these expenses. For additional expense information related to investments in Fidelity Central Funds, please refer to the "Investments in Fidelity Central Funds" note found in the Notes to Financial Statements section of the most recent Annual or Semi-Annual report.
I Expense ratios reflect operating expenses of the class. Expenses before reductions do not reflect amounts reimbursed, waived, or reduced through arrangements with the investment adviser, brokerage services, or other offset arrangements, if applicable, and do not represent the amount paid by the class during periods when reimbursements, waivers or reductions occur.
J Annualized
K Amount does not include the portfolio activity of any underlying mutual funds or exchange-traded funds (ETFs).
L Portfolio turnover rate excludes securities received or delivered in-kind.
Top Holdings (% of Fund's net assets) |
| |
| MasterCard, Inc. Class A | 13.6 | |
| Intuit, Inc. | 12.3 | |
| Visa, Inc. Class A | 12.3 | |
| PayPal Holdings, Inc. | 5.6 | |
| American Express Co. | 5.3 | |
| Fiserv, Inc. | 4.9 | |
| Global Payments, Inc. | 4.9 | |
| Fidelity National Information Services, Inc. | 4.7 | |
| Discover Financial Services | 4.7 | |
| Adyen BV | 4.5 | |
| | 72.8 | |
| |
| Industries (% of Fund's net assets) |
| |
| IT Services | 64.1 | |
| Software | 19.5 | |
| Consumer Finance | 15.4 | |
| Banks | 0.7 | |
| |
Percentages shown as 0.0% reflect amounts less than 0.05%.
FinTech Portfolio
| Common Stocks - 99.7% |
| | | Shares | Value ($) |
| Banks - 0.7% | | | |
| Diversified Banks - 0.5% | | | |
| Wells Fargo & Co. | | 14,966 | 654,164 |
| Regional Banks - 0.2% | | | |
| Signature Bank | | 1,147 | 199,991 |
TOTAL BANKS | | | 854,155 |
| Consumer Finance - 15.4% | | | |
| Consumer Finance - 15.4% | | | |
| American Express Co. | | 43,329 | 6,586,008 |
| Capital One Financial Corp. | | 52,092 | 5,512,375 |
| Discover Financial Services | | 58,156 | 5,844,096 |
| OneMain Holdings, Inc. | | 33,192 | 1,159,397 |
| | | | 19,101,876 |
| IT Services - 64.1% | | | |
| Data Processing & Outsourced Services - 64.1% | | | |
| Adyen BV (a)(b) | | 3,632 | 5,604,703 |
| Affirm Holdings, Inc. (a)(c) | | 13,359 | 313,001 |
| Block, Inc. Class A (a) | | 62,018 | 4,273,660 |
| Dlocal Ltd. (a) | | 34,631 | 861,273 |
| Edenred SA | | 50,520 | 2,563,889 |
| EVO Payments, Inc. Class A (a) | | 10,863 | 361,955 |
| Fidelity National Information Services, Inc. | | 64,407 | 5,884,868 |
| Fiserv, Inc. (a) | | 60,639 | 6,136,060 |
| FleetCor Technologies, Inc. (a) | | 20,222 | 4,297,782 |
| Flywire Corp. (a) | | 66,967 | 1,664,800 |
| Global Payments, Inc. | | 49,337 | 6,129,136 |
| MasterCard, Inc. Class A | | 52,193 | 16,929,844 |
| Nuvei Corp. (a)(b) | | 10,943 | 334,868 |
| PagSeguro Digital Ltd. (a) | | 60,492 | 940,046 |
| PayPal Holdings, Inc. (a) | | 73,987 | 6,913,345 |
| Repay Holdings Corp. (a) | | 49,025 | 455,442 |
| Shift4 Payments, Inc. (a)(c) | | 14,100 | 638,589 |
| Visa, Inc. Class A | | 76,573 | 15,215,821 |
| | | | 79,519,082 |
| Software - 19.5% | | | |
| Application Software - 19.5% | | | |
| Bill.Com Holdings, Inc. (a) | | 15,702 | 2,541,840 |
| Black Knight, Inc. (a) | | 48,550 | 3,212,068 |
| EngageSmart, Inc. | | 63,051 | 1,259,128 |
| Guidewire Software, Inc. (a) | | 11,559 | 828,896 |
| Intuit, Inc. | | 35,401 | 15,285,444 |
| Lightspeed Commerce, Inc. (Canada) (a) | | 10,719 | 205,100 |
| Workiva, Inc. (a) | | 12,153 | 825,067 |
| | | | 24,157,543 |
| TOTAL COMMON STOCKS (Cost $146,635,882) | | | 123,632,656 |
| | | | |
| Money Market Funds - 1.2% |
| | | Shares | Value ($) |
| Fidelity Cash Central Fund 2.33% (d) | | 481,095 | 481,191 |
| Fidelity Securities Lending Cash Central Fund 2.34% (d)(e) | | 979,766 | 979,864 |
| TOTAL MONEY MARKET FUNDS (Cost $1,461,055) | | | 1,461,055 |
| | | | |
| TOTAL INVESTMENT IN SECURITIES - 100.9% (Cost $148,096,937) | 125,093,711 |
NET OTHER ASSETS (LIABILITIES) - (0.9)% | (1,081,636) |
| NET ASSETS - 100.0% | 124,012,075 |
| | |
Legend
| (b) | Security exempt from registration under Rule 144A of the Securities Act of 1933. These securities may be resold in transactions exempt from registration, normally to qualified institutional buyers. At the end of the period, the value of these securities amounted to $5,939,571 or 4.8% of net assets. |
| (c) | Security or a portion of the security is on loan at period end. |
| (d) | Affiliated fund that is generally available only to investment companies and other accounts managed by Fidelity Investments. The rate quoted is the annualized seven-day yield of the fund at period end. A complete unaudited listing of the fund's holdings as of its most recent quarter end is available upon request. In addition, each Fidelity Central Fund's financial statements are available on the SEC's website or upon request. |
| (e) | Investment made with cash collateral received from securities on loan. |
Affiliated Central Funds
Fiscal year to date information regarding the Fund's investments in Fidelity Central Funds, including the ownership percentage, is presented below.
| Affiliate | Value, beginning of period ($) | Purchases ($) | Sales Proceeds ($) | Dividend Income ($) | Realized Gain (loss) ($) | Change in Unrealized appreciation (depreciation) ($) | Value, end of period ($) | %ownership, end of period |
| Fidelity Cash Central Fund 2.33% | 870,270 | 13,040,599 | 13,429,678 | 2,306 | - | - | 481,191 | 0.0% |
| Fidelity Securities Lending Cash Central Fund 2.34% | 8,602,318 | 24,971,028 | 32,593,482 | 5,399 | - | - | 979,864 | 0.0% |
| Total | 9,472,588 | 38,011,627 | 46,023,160 | 7,705 | - | - | 1,461,055 | |
| | | | | | | | | |
Amounts in the income column in the above table include any capital gain distributions from underlying funds, which are presented in the corresponding line item in the Statement of Operations, if applicable.
Amount for Fidelity Securities Lending Cash Central Fund represents the income earned on investing cash collateral, less rebates paid to borrowers and any lending agent fees associated with the loan, plus any premium payments received for lending certain types of securities.
Investment Valuation
The following is a summary of the inputs used, as of August 31, 2022, involving the Fund's assets and liabilities carried at fair value. The inputs or methodology used for valuing securities may not be an indication of the risk associated with investing in those securities. For more information on valuation inputs, and their aggregation into the levels used below, please refer to the Investment Valuation section in the accompanying Notes to Financial Statements.
| Valuation Inputs at Reporting Date: |
| Description | Total ($) | Level 1 ($) | Level 2 ($) | Level 3 ($) |
Investments in Securities: | | | | |
|
| Common Stocks | 123,632,656 | 118,027,953 | 5,604,703 | - |
|
| Money Market Funds | 1,461,055 | 1,461,055 | - | - |
| Total Investments in Securities: | 125,093,711 | 119,489,008 | 5,604,703 | - |
FinTech Portfolio
| Statement of Assets and Liabilities |
| | | | August 31, 2022 (Unaudited) |
| | | | | |
| Assets | | | | |
| Investment in securities, at value (including securities loaned of $944,226) - See accompanying schedule: | | $123,632,656 | | |
Unaffiliated issuers (cost $146,635,882) | | | |
Fidelity Central Funds (cost $1,461,055) | | 1,461,055 | | |
| | | | | |
| Total Investment in Securities (cost $148,096,937) | | | $ | 125,093,711 |
| Receivable for fund shares sold | | | | 15,779 |
| Dividends receivable | | | | 68,098 |
| Distributions receivable from Fidelity Central Funds | | | | 1,100 |
| Prepaid expenses | | | | 517 |
| Other receivables | | | | 415 |
Total assets | | | | 125,179,620 |
| Liabilities | | | | |
| Payable for fund shares redeemed | | 80,176 | | |
| Accrued management fee | | 58,137 | | |
| Other affiliated payables | | 30,593 | | |
| Other payables and accrued expenses | | 19,617 | | |
| Collateral on securities loaned | | 979,022 | | |
| Total Liabilities | | | | 1,167,545 |
| Net Assets | | | $ | 124,012,075 |
| Net Assets consist of: | | | | |
| Paid in capital | | | $ | 160,190,352 |
| Total accumulated earnings (loss) | | | | (36,178,277) |
| Net Assets | | | $ | 124,012,075 |
Net Asset Value , offering price and redemption price per share ($124,012,075 ÷ 9,042,665 shares) | | | $ | 13.71 |
| | | | | |
| Statement of Operations |
| | | | Six months ended August 31, 2022 (Unaudited) |
| Investment Income | | | | |
| Dividends | | | $ | 570,271 |
| Income from Fidelity Central Funds (including $5,399 from security lending) | | | | 7,705 |
| Total Income | | | | 577,976 |
| Expenses | | | | |
| Management fee | $ | 358,662 | | |
| Transfer agent fees | | 168,313 | | |
| Accounting fees | | 25,387 | | |
| Custodian fees and expenses | | 1,157 | | |
| Independent trustees' fees and expenses | | 227 | | |
| Registration fees | | 26,318 | | |
| Audit | | 17,704 | | |
| Legal | | 327 | | |
| Miscellaneous | | (1,651) | | |
| Total expenses before reductions | | 596,444 | | |
| Expense reductions | | (2,349) | | |
| Total expenses after reductions | | | | 594,095 |
| Net Investment income (loss) | | | | (16,119) |
| Realized and Unrealized Gain (Loss) | | | | |
| Net realized gain (loss) on: | | | | |
| Investment Securities: | | | | |
| Unaffiliated issuers | | (5,944,355) | | |
| Foreign currency transactions | | 4,849 | | |
| Total net realized gain (loss) | | | | (5,939,506) |
| Change in net unrealized appreciation (depreciation) on: | | | | |
| Investment Securities: | | | | |
| Unaffiliated issuers | | (17,095,128) | | |
| Assets and liabilities in foreign currencies | | (380) | | |
| Total change in net unrealized appreciation (depreciation) | | | | (17,095,508) |
| Net gain (loss) | | | | (23,035,014) |
| Net increase (decrease) in net assets resulting from operations | | | $ | (23,051,133) |
| Statement of Changes in Net Assets |
| |
| | Six months ended August 31, 2022 (Unaudited) | | Year ended February 28, 2022 |
| Increase (Decrease) in Net Assets | | | | |
| Operations | | | | |
| Net investment income (loss) | $ | (16,119) | $ | 1,580,188 |
| Net realized gain (loss) | | (5,939,506) | | 42,675,935 |
| Change in net unrealized appreciation (depreciation) | | (17,095,508) | | (51,830,285) |
| Net increase (decrease) in net assets resulting from operations | | (23,051,133) | | (7,574,162) |
| Distributions to shareholders | | - | | (37,026,602) |
| Share transactions | | | | |
| Proceeds from sales of shares | | 9,979,350 | | 281,706,628 |
| Reinvestment of distributions | | - | | 33,727,405 |
| Cost of shares redeemed | | (24,767,421) | | (253,862,105) |
Net increase (decrease) in net assets resulting from share transactions | | (14,788,071) | | 61,571,928 |
| Total increase (decrease) in net assets | | (37,839,204) | | 16,971,164 |
| | | | | |
| Net Assets | | | | |
| Beginning of period | | 161,851,279 | | 144,880,115 |
| End of period | $ | 124,012,075 | $ | 161,851,279 |
| | | | | |
| Other Information | | | | |
| Shares | | | | |
| Sold | | 674,587 | | 12,489,588 |
| Issued in reinvestment of distributions | | 43 | | 1,901,219 |
| Redeemed | | (1,706,757) | | (11,797,499) |
| Net increase (decrease) | | (1,032,127) | | 2,593,308 |
| | | | | |
| | Six months ended (Unaudited) August 31, 2022 | | Years ended February 28, 2022 | | 2021 | | 2020 A | | 2019 | | 2018 |
Selected Per-Share Data | | | | | | | | | | | | |
| Net asset value, beginning of period | $ | 16.06 | $ | 19.37 | $ | 16.23 | $ | 15.80 | $ | 16.29 | $ | 14.02 |
| Income from Investment Operations | | | | | | | | | | | | |
Net investment income (loss) B,C | | - D | | .14 E | | .34 F | | .39 | | .24 | | .20 |
| Net realized and unrealized gain (loss) | | (2.35) | | .04 G,H | | 3.14 | | .35 | | .43 | | 2.33 I |
| Total from investment operations | | (2.35) | | .18 | | 3.48 | | .74 | | .67 | | 2.53 |
| Distributions from net investment income | | - | | (.25) | | (.34) | | (.31) | | (.20) | | (.26) |
| Distributions from net realized gain | | - | | (3.24) | | - | | (.01) | | (.95) | | - |
| Total distributions | | - | | (3.49) | | (.34) | | (.31) J | | (1.16) J | | (.26) |
Redemption fees added to paid in capital B | | - | | - | | - | | - | | - | | - D |
| Net asset value, end of period | $ | 13.71 | $ | 16.06 | $ | 19.37 | $ | 16.23 | $ | 15.80 | $ | 16.29 |
Total Return K,L | | (14.63)% | | (.75)% H | | 21.94% | | 4.54% | | 4.83% | | 18.07% I |
Ratios to Average Net Assets C,M,N | | | | | | | | | | | | |
| Expenses before reductions | | .87% O | | .81% | | .89% | | .86% | | .87% | | .90% |
| Expenses net of fee waivers, if any | | .87% O | | .81% | | .89% | | .86% | | .87% | | .89% |
| Expenses net of all reductions | | .87% O | | .81% | | .89% | | .85% | | .86% | | .89% |
| Net investment income (loss) | | (.02)% O | | .63% E | | 2.35% F | | 2.29% | | 1.57% | | 1.38% |
| Supplemental Data | | | | | | | | | | | | |
| Net assets, end of period (000 omitted) | $ | 124,012 | $ | 161,851 | $ | 144,880 | $ | 148,247 | $ | 102,334 | $ | 104,105 |
Portfolio turnover rate P | | 12% O | | 164% | | 25% | | 20% | | 32% | | 81% |
A For the year ended February 29.
B Calculated based on average shares outstanding during the period.
C Net investment income (loss) is affected by the timing of the declaration of dividends by any underlying mutual funds or exchange-traded funds (ETFs). Net investment income (loss) of any such underlying funds is not included in the Fund's net investment income (loss) ratio.
D Amount represents less than $.005 per share.
E Net investment income per share reflects one or more large, non-recurring dividend(s) which amounted to $.05 per share. Excluding such non-recurring dividend(s), the ratio of net investment income (loss) to average net assets would have been .40%.
F Net investment income per share reflects one or more large, non-recurring dividend(s) which amounted to $.07 per share. Excluding such non-recurring dividend(s), the ratio of net investment income (loss) to average net assets would have been 1.89%.
G The amount shown for a share outstanding does not correspond with the aggregate net gain (loss) on investments for the period due to the timing of sales and repurchases of shares in relation to fluctuating market values of the investments of the Fund.
H Net realized and unrealized gain (loss) per share reflects proceeds received from litigation which amounted to $.01 per share. Excluding these litigation proceeds, the total return would have been (.78)%.
I Net realized and unrealized gain (loss) per share reflects proceeds received from litigation which amounted to $.28 per share. Excluding these litigation proceeds, the total return would have been 16.18%.
J Total distributions per share do not sum due to rounding.
K Total returns for periods of less than one year are not annualized.
L Total returns would have been lower if certain expenses had not been reduced during the applicable periods shown.
M Fees and expenses of any underlying mutual funds or exchange-traded funds (ETFs) are not included in the Fund's expense ratio. The Fund indirectly bears its proportionate share of these expenses. For additional expense information related to investments in Fidelity Central Funds, please refer to the "Investments in Fidelity Central Funds" note found in the Notes to Financial Statements section of the most recent Annual or Semi-Annual report.
N Expense ratios reflect operating expenses of the class. Expenses before reductions do not reflect amounts reimbursed, waived, or reduced through arrangements with the investment adviser, brokerage services, or other offset arrangements, if applicable, and do not represent the amount paid by the class during periods when reimbursements, waivers or reductions occur.
O Annualized
P Amount does not include the portfolio activity of any underlying mutual funds or exchange-traded funds (ETFs).
Top Holdings (% of Fund's net assets) |
| |
| Marsh & McLennan Companies, Inc. | 10.9 | |
| The Travelers Companies, Inc. | 8.7 | |
| Chubb Ltd. | 7.5 | |
| American International Group, Inc. | 7.0 | |
| Arthur J. Gallagher & Co. | 6.0 | |
| Progressive Corp. | 5.7 | |
| MetLife, Inc. | 4.9 | |
| Aon PLC | 4.4 | |
| Hartford Financial Services Group, Inc. | 4.2 | |
| Allstate Corp. | 3.9 | |
| | 63.2 | |
| |
| Industries (% of Fund's net assets) |
| |
| Insurance | 91.2 | |
| Diversified Financial Services | 5.2 | |
| Capital Markets | 2.4 | |
| Consumer Finance | 0.2 | |
| |
Percentages shown as 0.0% reflect amounts less than 0.05%.
Geographic Diversification (% of Fund's net assets) |
|
* Includes Short-Term investments and Net Other Assets (Liabilities). Percentages are based on country or territory of incorporation and are adjusted for the effect of futures contracts, if applicable. |
| |
Insurance Portfolio
| Common Stocks - 99.0% |
| | | Shares | Value ($) |
| Capital Markets - 2.4% | | | |
| Asset Management & Custody Banks - 2.3% | | | |
| Ares Management Corp. | | 73,914 | 5,479,984 |
| BlackRock, Inc. Class A | | 1,400 | 932,946 |
| | | | 6,412,930 |
| Financial Exchanges & Data - 0.1% | | | |
| Moody's Corp. | | 1,300 | 369,876 |
TOTAL CAPITAL MARKETS | | | 6,782,806 |
| Consumer Finance - 0.2% | | | |
| Consumer Finance - 0.2% | | | |
| OneMain Holdings, Inc. | | 20,900 | 730,037 |
| Diversified Financial Services - 5.2% | | | |
| Multi-Sector Holdings - 2.6% | | | |
| Berkshire Hathaway, Inc. Class B (a) | | 26,600 | 7,469,280 |
| Other Diversified Financial Services - 2.6% | | | |
| Apollo Global Management, Inc. | | 130,537 | 7,255,246 |
| Jackson Financial, Inc. | | 895 | 27,978 |
| | | | 7,283,224 |
TOTAL DIVERSIFIED FINANCIAL SERVICES | | | 14,752,504 |
| Insurance - 91.2% | | | |
| Insurance Brokers - 26.5% | | | |
| Aon PLC | | 45,000 | 12,566,700 |
| Arthur J. Gallagher & Co. | | 93,700 | 17,013,109 |
| Brown & Brown, Inc. | | 135,800 | 8,560,832 |
| Marsh & McLennan Companies, Inc. | | 192,700 | 31,095,999 |
| Willis Towers Watson PLC | | 30,928 | 6,396,838 |
| | | | 75,633,478 |
| Life & Health Insurance - 14.3% | | | |
| AFLAC, Inc. | | 51,000 | 3,030,420 |
| CNO Financial Group, Inc. | | 169,200 | 3,114,972 |
| Globe Life, Inc. | | 41,100 | 3,994,509 |
| MetLife, Inc. | | 216,275 | 13,912,971 |
| Primerica, Inc. | | 22,200 | 2,813,850 |
| Principal Financial Group, Inc. | | 89,400 | 6,683,544 |
| Prudential Financial, Inc. | | 70,589 | 6,758,897 |
| Prudential PLC | | 33,900 | 355,786 |
| | | | 40,664,949 |
| Multi-Line Insurance - 13.3% | | | |
| American International Group, Inc. | | 387,050 | 20,029,838 |
| Assurant, Inc. | | 25,800 | 4,089,042 |
| China Pacific Insurance (Group) Co. Ltd. (H Shares) | | 177,400 | 375,790 |
| Hartford Financial Services Group, Inc. | | 187,600 | 12,064,556 |
| Zurich Insurance Group Ltd. | | 3,156 | 1,400,947 |
| | | | 37,960,173 |
| Property & Casualty Insurance - 34.0% | | | |
| Allstate Corp. | | 93,100 | 11,218,550 |
| American Financial Group, Inc. | | 200 | 25,536 |
| Arch Capital Group Ltd. (a) | | 148,400 | 6,784,848 |
| Assured Guaranty Ltd. | | 38,200 | 1,950,874 |
| Chubb Ltd. | | 113,305 | 21,420,310 |
| Cincinnati Financial Corp. | | 16,900 | 1,638,624 |
| Fidelity National Financial, Inc. | | 57,900 | 2,263,890 |
| First American Financial Corp. | | 54,800 | 2,931,800 |
| Loews Corp. | | 83,500 | 4,618,385 |
| Markel Corp. (a) | | 2,520 | 3,009,157 |
| Mercury General Corp. | | 200 | 6,380 |
| Progressive Corp. | | 131,700 | 16,153,005 |
| The Travelers Companies, Inc. | | 153,700 | 24,844,068 |
| | | | 96,865,427 |
| Reinsurance - 3.1% | | | |
| Everest Re Group Ltd. | | 3,400 | 914,770 |
| Maiden Holdings Ltd. (a)(b) | | 400 | 912 |
| Reinsurance Group of America, Inc. | | 62,200 | 7,797,392 |
| | | | 8,713,074 |
TOTAL INSURANCE | | | 259,837,101 |
| TOTAL COMMON STOCKS (Cost $174,890,233) | | | 282,102,448 |
| | | | |
| Money Market Funds - 0.9% |
| | | Shares | Value ($) |
| Fidelity Cash Central Fund 2.33% (c) | | 2,609,289 | 2,609,811 |
| Fidelity Securities Lending Cash Central Fund 2.34% (c)(d) | | 750 | 750 |
| TOTAL MONEY MARKET FUNDS (Cost $2,610,561) | | | 2,610,561 |
| | | | |
| TOTAL INVESTMENT IN SECURITIES - 99.9% (Cost $177,500,794) | 284,713,009 |
NET OTHER ASSETS (LIABILITIES) - 0.1% | 241,431 |
| NET ASSETS - 100.0% | 284,954,440 |
| | |
Legend
| (b) | Security or a portion of the security is on loan at period end. |
| (c) | Affiliated fund that is generally available only to investment companies and other accounts managed by Fidelity Investments. The rate quoted is the annualized seven-day yield of the fund at period end. A complete unaudited listing of the fund's holdings as of its most recent quarter end is available upon request. In addition, each Fidelity Central Fund's financial statements are available on the SEC's website or upon request. |
| (d) | Investment made with cash collateral received from securities on loan. |
Affiliated Central Funds
Fiscal year to date information regarding the Fund's investments in Fidelity Central Funds, including the ownership percentage, is presented below.
| Affiliate | Value, beginning of period ($) | Purchases ($) | Sales Proceeds ($) | Dividend Income ($) | Realized Gain (loss) ($) | Change in Unrealized appreciation (depreciation) ($) | Value, end of period ($) | %ownership, end of period |
| Fidelity Cash Central Fund 2.33% | 1,824,492 | 74,775,177 | 73,989,858 | 11,373 | - | - | 2,609,811 | 0.0% |
| Fidelity Securities Lending Cash Central Fund 2.34% | 550 | 11,922,730 | 11,922,530 | 455 | - | - | 750 | 0.0% |
| Total | 1,825,042 | 86,697,907 | 85,912,388 | 11,828 | - | - | 2,610,561 | |
| | | | | | | | | |
Amounts in the income column in the above table include any capital gain distributions from underlying funds, which are presented in the corresponding line item in the Statement of Operations, if applicable.
Amount for Fidelity Securities Lending Cash Central Fund represents the income earned on investing cash collateral, less rebates paid to borrowers and any lending agent fees associated with the loan, plus any premium payments received for lending certain types of securities.
Investment Valuation
The following is a summary of the inputs used, as of August 31, 2022, involving the Fund's assets and liabilities carried at fair value. The inputs or methodology used for valuing securities may not be an indication of the risk associated with investing in those securities. For more information on valuation inputs, and their aggregation into the levels used below, please refer to the Investment Valuation section in the accompanying Notes to Financial Statements.
| Valuation Inputs at Reporting Date: |
| Description | Total ($) | Level 1 ($) | Level 2 ($) | Level 3 ($) |
Investments in Securities: | | | | |
|
| Common Stocks | 282,102,448 | 279,969,925 | 2,132,523 | - |
|
| Money Market Funds | 2,610,561 | 2,610,561 | - | - |
| Total Investments in Securities: | 284,713,009 | 282,580,486 | 2,132,523 | - |
Insurance Portfolio
| Statement of Assets and Liabilities |
| | | | August 31, 2022 (Unaudited) |
| | | | | |
| Assets | | | | |
| Investment in securities, at value (including securities loaned of $684) - See accompanying schedule: | | $282,102,448 | | |
Unaffiliated issuers (cost $174,890,233) | | | |
Fidelity Central Funds (cost $2,610,561) | | 2,610,561 | | |
| | | | | |
| Total Investment in Securities (cost $177,500,794) | | | $ | 284,713,009 |
| Receivable for fund shares sold | | | | 449,080 |
| Dividends receivable | | | | 447,430 |
| Distributions receivable from Fidelity Central Funds | | | | 4,818 |
| Prepaid expenses | | | | 1,666 |
| Other receivables | | | | 1,158 |
Total assets | | | | 285,617,161 |
| Liabilities | | | | |
| Payable for investments purchased | | 16,290 | | |
| Payable for fund shares redeemed | | 441,396 | | |
| Accrued management fee | | 127,986 | | |
| Transfer agent fee payable | | 47,899 | | |
| Other affiliated payables | | 8,591 | | |
| Other payables and accrued expenses | | 19,809 | | |
| Collateral on securities loaned | | 750 | | |
| Total Liabilities | | | | 662,721 |
| Net Assets | | | $ | 284,954,440 |
| Net Assets consist of: | | | | |
| Paid in capital | | | $ | 179,400,786 |
| Total accumulated earnings (loss) | | | | 105,553,654 |
| Net Assets | | | $ | 284,954,440 |
Net Asset Value , offering price and redemption price per share ($284,954,440 ÷ 4,250,899 shares) | | | $ | 67.03 |
| | | | | |
| Statement of Operations |
| | | | Six months ended August 31, 2022 (Unaudited) |
| Investment Income | | | | |
| Dividends | | | $ | 2,739,132 |
| Income from Fidelity Central Funds (including $455 from security lending) | | | | 11,828 |
| Total Income | | | | 2,750,960 |
| Expenses | | | | |
| Management fee | $ | 770,148 | | |
| Transfer agent fees | | 289,266 | | |
| Accounting fees | | 54,340 | | |
| Custodian fees and expenses | | 3,861 | | |
| Independent trustees' fees and expenses | | 458 | | |
| Registration fees | | 49,719 | | |
| Audit | | 17,704 | | |
| Legal | | 75 | | |
| Interest | | 1,125 | | |
| Miscellaneous | | 651 | | |
| Total expenses before reductions | | 1,187,347 | | |
| Expense reductions | | (4,446) | | |
| Total expenses after reductions | | | | 1,182,901 |
| Net Investment income (loss) | | | | 1,568,059 |
| Realized and Unrealized Gain (Loss) | | | | |
| Net realized gain (loss) on: | | | | |
| Investment Securities: | | | | |
| Unaffiliated issuers | | (2,805,110) | | |
| Foreign currency transactions | | (1,278) | | |
| Total net realized gain (loss) | | | | (2,806,388) |
| Change in net unrealized appreciation (depreciation) on: | | | | |
| Investment Securities: | | | | |
| Unaffiliated issuers | | (15,799,911) | | |
| Assets and liabilities in foreign currencies | | (4,710) | | |
| Total change in net unrealized appreciation (depreciation) | | | | (15,804,621) |
| Net gain (loss) | | | | (18,611,009) |
| Net increase (decrease) in net assets resulting from operations | | | $ | (17,042,950) |
| Statement of Changes in Net Assets |
| |
| | Six months ended August 31, 2022 (Unaudited) | | Year ended February 28, 2022 |
| Increase (Decrease) in Net Assets | | | | |
| Operations | | | | |
| Net investment income (loss) | $ | 1,568,059 | $ | 2,475,589 |
| Net realized gain (loss) | | (2,806,388) | | 6,591,336 |
| Change in net unrealized appreciation (depreciation) | | (15,804,621) | | 35,822,023 |
| Net increase (decrease) in net assets resulting from operations | | (17,042,950) | | 44,888,948 |
| Distributions to shareholders | | - | | (17,750,181) |
| Share transactions | | | | |
| Proceeds from sales of shares | | 142,330,586 | | 71,913,727 |
| Reinvestment of distributions | | - | | 16,623,368 |
| Cost of shares redeemed | | (86,263,699) | | (54,446,500) |
Net increase (decrease) in net assets resulting from share transactions | | 56,066,887 | | 34,090,595 |
| Total increase (decrease) in net assets | | 39,023,937 | | 61,229,362 |
| | | | | |
| Net Assets | | | | |
| Beginning of period | | 245,930,503 | | 184,701,141 |
| End of period | $ | 284,954,440 | $ | 245,930,503 |
| | | | | |
| Other Information | | | | |
| Shares | | | | |
| Sold | | 2,013,299 | | 1,054,727 |
| Issued in reinvestment of distributions | | 17 | | 256,213 |
| Redeemed | | (1,282,674) | | (810,083) |
| Net increase (decrease) | | 730,642 | | 500,857 |
| | | | | |
| | Six months ended (Unaudited) August 31, 2022 | | Years ended February 28, 2022 | | 2021 | | 2020 A | | 2019 | | 2018 |
Selected Per-Share Data | | | | | | | | | | | | |
| Net asset value, beginning of period | $ | 69.86 | $ | 61.17 | $ | 58.44 | $ | 59.27 | $ | 78.49 | $ | 80.60 |
| Income from Investment Operations | | | | | | | | | | | | |
Net investment income (loss) B,C | | .37 | | .78 | | .88 | | .87 | | .98 | | 1.08 |
| Net realized and unrealized gain (loss) | | (3.20) | | 13.73 | | 6.99 | | 2.77 | | (2.40) | | 6.76 |
| Total from investment operations | | (2.83) | | 14.51 | | 7.87 | | 3.64 | | (1.42) | | 7.84 |
| Distributions from net investment income | | - | | (.89) | | (.94) | | (.91) | | (1.16) | | (.96) |
| Distributions from net realized gain | | - | | (4.93) | | (4.20) | | (3.56) | | (16.63) | | (8.99) |
| Total distributions | | - | | (5.82) | | (5.14) | | (4.47) | | (17.80) D | | (9.95) |
Redemption fees added to paid in capital B | | - | | - | | - | | - | | - | | - E |
| Net asset value, end of period | $ | 67.03 | $ | 69.86 | $ | 61.17 | $ | 58.44 | $ | 59.27 | $ | 78.49 |
Total Return F,G | | (4.05)% | | 24.68% | | 15.54% | | 5.95% | | (.29)% | | 9.62% |
Ratios to Average Net Assets C,H,I | | | | | | | | | | | | |
| Expenses before reductions | | .81% J | | .78% | | .83% | | .81% | | .82% | | .79% |
| Expenses net of fee waivers, if any | | .81% J | | .78% | | .83% | | .81% | | .81% | | .79% |
| Expenses net of all reductions | | .81% J | | .78% | | .83% | | .80% | | .81% | | .79% |
| Net investment income (loss) | | 1.08% J | | 1.16% | | 1.68% | | 1.37% | | 1.48% | | 1.30% |
| Supplemental Data | | | | | | | | | | | | |
| Net assets, end of period (000 omitted) | $ | 284,954 | $ | 245,931 | $ | 184,701 | $ | 219,539 | $ | 223,081 | $ | 341,743 |
Portfolio turnover rate K | | 24% J | | 15% | | 18% | | 28% | | 9% | | 21% |
A For the year ended February 29.
B Calculated based on average shares outstanding during the period.
C Net investment income (loss) is affected by the timing of the declaration of dividends by any underlying mutual funds or exchange-traded funds (ETFs). Net investment income (loss) of any such underlying funds is not included in the Fund's net investment income (loss) ratio.
D Total distributions per share do not sum due to rounding.
E Amount represents less than $.005 per share.
F Total returns for periods of less than one year are not annualized.
G Total returns would have been lower if certain expenses had not been reduced during the applicable periods shown.
H Fees and expenses of any underlying mutual funds or exchange-traded funds (ETFs) are not included in the Fund's expense ratio. The Fund indirectly bears its proportionate share of these expenses. For additional expense information related to investments in Fidelity Central Funds, please refer to the "Investments in Fidelity Central Funds" note found in the Notes to Financial Statements section of the most recent Annual or Semi-Annual report.
I Expense ratios reflect operating expenses of the class. Expenses before reductions do not reflect amounts reimbursed, waived, or reduced through arrangements with the investment adviser, brokerage services, or other offset arrangements, if applicable, and do not represent the amount paid by the class during periods when reimbursements, waivers or reductions occur.
J Annualized
K Amount does not include the portfolio activity of any underlying mutual funds or exchange-traded funds (ETFs).
For the period ended August 31, 2022
1. Organization.
Banking Portfolio, Brokerage and Investment Management Portfolio, Financial Services Portfolio, FinTech Portfolio and Insurance Portfolio (the Funds) are non-diversified funds of Fidelity Select Portfolios (the Trust). The Trust is registered under the Investment Company Act of 1940, as amended (the 1940 Act), as an open-end management investment company organized as a Massachusetts business trust. The Funds invest primarily in securities of companies whose principal business activities fall within specific industries. Each Fund is authorized to issue an unlimited number of shares. Share transactions on the Statement of Changes in Net Assets may contain exchanges between affiliated funds.
2. Investments in Fidelity Central Funds.
Funds may invest in Fidelity Central Funds, which are open-end investment companies generally available only to other investment companies and accounts managed by the investment adviser and its affiliates. The Schedule of Investments lists any Fidelity Central Funds held as an investment as of period end, but does not include the underlying holdings of each Fidelity Central Fund. An investing fund indirectly bears its proportionate share of the expenses of the underlying Fidelity Central Funds.
Based on its investment objective, each Fidelity Central Fund may invest or participate in various investment vehicles or strategies that are similar to those of the investing fund. These strategies are consistent with the investment objectives of the investing fund and may involve certain economic risks which may cause a decline in value of each of the Fidelity Central Funds and thus a decline in the value of the investing fund.
| Fidelity Central Fund | Investment Manager | Investment Objective | Investment Practices | Expense Ratio A |
| Fidelity Money Market Central Funds | Fidelity Management & Research Company LLC (FMR) | Each fund seeks to obtain a high level of current income consistent with the preservation of capital and liquidity. | Short-term Investments | Less than .005% |
A Expenses expressed as a percentage of average net assets and are as of each underlying Central Fund's most recent annual or semi-annual shareholder report.
A complete unaudited list of holdings for each Fidelity Central Fund is available upon request or at the Securities and Exchange Commission website at www.sec.gov. In addition, the financial statements of the Fidelity Central Funds which contain the significant accounting policies (including investment valuation policies) of those funds, and are not covered by the Report of Independent Registered Public Accounting Firm, are available on the Securities and Exchange Commission website or upon request.
3. Significant Accounting Policies.
Each Fund is an investment company and applies the accounting and reporting guidance of the Financial Accounting Standards Board (FASB) Accounting Standards Codification Topic 946 Financial Services - Investment Companies . The financial statements have been prepared in conformity with accounting principles generally accepted in the United States of America (GAAP), which require management to make certain estimates and assumptions at the date of the financial statements. Actual results could differ from those estimates. Subsequent events, if any, through the date that the financial statements were issued have been evaluated in the preparation of the financial statements. Each Fund's Schedule of Investments lists any underlying mutual funds or exchange-traded funds (ETFs) but does not include the underlying holdings of these funds. The following summarizes the significant accounting policies of each Fund:
Investment Valuation. Investments are valued as of 4:00 p.m. Eastern time on the last calendar day of the period. The Board of Trustees (the Board) has delegated the day to day responsibility for the valuation of each Fund's investments to the Fair Value Committee (the Committee) established by each Fund's investment adviser. In accordance with valuation policies and procedures approved by the Board, each Fund attempts to obtain prices from one or more third party pricing vendors or brokers to value its investments. When current market prices, quotations or currency exchange rates are not readily available or reliable, investments will be fair valued in good faith by the Committee, in accordance with procedures adopted by the Board. Factors used in determining fair value vary by investment type and may include market or investment specific events, changes in interest rates and credit quality. The frequency with which these procedures are used cannot be predicted and they may be utilized to a significant extent. The Committee oversees each Fund's valuation policies and procedures and reports to the Board on the Committee's activities and fair value determinations. The Board monitors the appropriateness of the procedures used in valuing each Fund's investments and ratifies the fair value determinations of the Committee.
Each Fund categorizes the inputs to valuation techniques used to value its investments into a disclosure hierarchy consisting of three levels as shown below:
Level 1 - unadjusted quoted prices in active markets for identical investments
Level 2 - other significant observable inputs (including quoted prices for similar investments, interest rates, prepayment speeds, etc.)
Level 3 - unobservable inputs (including the Fund's own assumptions based on the best information available)
Valuation techniques used to value each Fund's investments by major category are as follows:
Equity securities, including restricted securities, for which market quotations are readily available, are valued at the last reported sale price or official closing price as reported by a third party pricing vendor on the primary market or exchange on which they are traded and are categorized as Level 1 in the hierarchy. In the event there were no sales during the day or closing prices are not available, securities are valued at the last quoted bid price or may be valued using the last available price and are generally categorized as Level 2 in the hierarchy. For foreign equity securities, when market or security specific events arise, comparisons to the valuation of American Depositary Receipts (ADRs), futures contracts, Exchange-Traded Funds (ETFs) and certain indexes as well as quoted prices for similar securities may be used and would be categorized as Level 2 in the hierarchy. For equity securities, including restricted securities, where observable inputs are limited, assumptions about market activity and risk are used and these securities may be categorized as Level 3 in the hierarchy.
Debt securities, including restricted securities, are valued based on evaluated prices received from third party pricing vendors or from brokers who make markets in such securities. Corporate bonds are valued by pricing vendors who utilize matrix pricing which considers yield or price of bonds of comparable quality, coupon, maturity and type or by broker-supplied prices. When independent prices are unavailable or unreliable, debt securities may be valued utilizing pricing methodologies which consider similar factors that would be used by third party pricing vendors. Debt securities are generally categorized as Level 2 in the hierarchy but may be Level 3 depending on the circumstances.
Investments in open-end mutual funds, including the Fidelity Central Funds, are valued at their closing net asset value (NAV) each business day and are categorized as Level 1 in the hierarchy.
Changes in valuation techniques may result in transfers in or out of an assigned level within the disclosure hierarchy. The aggregate value of investments by input level as of August 31, 2022 is included at the end of each Fund's Schedule of Investments.
Foreign Currency. Certain Funds may use foreign currency contracts to facilitate transactions in foreign-denominated securities. Gains and losses from these transactions may arise from changes in the value of the foreign currency or if the counterparties do not perform under the contracts' terms.
Foreign-denominated assets, including investment securities, and liabilities are translated into U.S. dollars at the exchange rates at period end. Purchases and sales of investment securities, income and dividends received, and expenses denominated in foreign currencies are translated into U.S. dollars at the exchange rate in effect on the transaction date.
The effects of exchange rate fluctuations on investments are included with the net realized and unrealized gain (loss) on investment securities. Other foreign currency transactions resulting in realized and unrealized gain (loss) are disclosed separately.
Investment Transactions and Income. For financial reporting purposes, the Funds' investment holdings and NAV include trades executed through the end of the last business day of the period. The NAV per share for processing shareholder transactions is calculated as of the close of business of the New York Stock Exchange (NYSE), normally 4:00 p.m. Eastern time and includes trades executed through the end of the prior business day. Gains and losses on securities sold are determined on the basis of identified cost and for certain Funds include proceeds received from litigation. Commissions paid to certain brokers with whom the investment adviser, or its affiliates, places trades on behalf of a fund include an amount in addition to trade execution, which may be rebated back to a fund. Any such rebates are included in net realized gain (loss) on investments in the Statement of Operations. Dividend income is recorded on the ex-dividend date, except for certain dividends from foreign securities where the ex-dividend date may have passed, which are recorded as soon as the Funds are informed of the ex-dividend date. Non-cash dividends included in dividend income, if any, are recorded at the fair market value of the securities received. Income and capital gain distributions from Fidelity Central Funds, if any, are recorded on the ex-dividend date. Certain distributions received by the Funds represent a return of capital or capital gain. The Funds determine the components of these distributions subsequent to the ex-dividend date, based upon receipt of tax filings or other correspondence relating to the underlying investment. These distributions are recorded as a reduction of cost of investments and/or as a realized gain. Interest income is accrued as earned and includes coupon interest and amortization of premium and accretion of discount on debt securities as applicable. Investment income is recorded net of foreign taxes withheld where recovery of such taxes is uncertain. Funds may file withholding tax reclaims in certain jurisdictions to recover a portion of amounts previously withheld. Any withholding tax reclaims income is included in the Statement of Operations in dividends. Any receivables for withholding tax reclaims are included in the Statement of Assets and Liabilities in dividends receivable.
Expenses. Expenses directly attributable to a fund are charged to that fund. Expenses attributable to more than one fund are allocated among the respective funds on the basis of relative net assets or other appropriate methods. Expenses included in the accompanying financial statements reflect the expenses of that fund and do not include any expenses associated with any underlying mutual funds or exchange-traded funds. Although not included in a fund's expenses, a fund indirectly bears its proportionate share of these expenses through the net asset value of each underlying mutual fund or exchange-traded fund. Expense estimates are accrued in the period to which they relate and adjustments are made when actual amounts are known.
Deferred Trustee Compensation. Under a Deferred Compensation Plan (the Plan) for certain Funds, certain independent Trustees have elected to defer receipt of a portion of their annual compensation. Deferred amounts are invested in affiliated mutual funds, are marked-to-market and remain in a fund until distributed in accordance with the Plan. The investment of deferred amounts and the offsetting payable to the Trustees presented below are included in the accompanying Statement of Assets and Liabilities in other receivables and other payables and accrued expenses, as applicable.
| Brokerage and Investment Management Portfolio | $49,216 |
Income Tax Information and Distributions to Shareholders. Each year, each Fund intends to qualify as a regulated investment company under Subchapter M of the Internal Revenue Code, including distributing substantially all of its taxable income and realized gains. As a result, no provision for U.S. Federal income taxes is required. Each Fund files a U.S. federal tax return, in addition to state and local tax returns as required. Each Fund's federal income tax returns are subject to examination by the Internal Revenue Service (IRS) for a period of three fiscal years after they are filed. State and local tax returns may be subject to examination for an additional fiscal year depending on the jurisdiction. Foreign taxes are provided for based on each Fund's understanding of the tax rules and rates that exist in the foreign markets in which it invests.
Distributions are declared and recorded on the ex-dividend date. Income and capital gain distributions are determined in accordance with income tax regulations, which may differ from GAAP.
Capital accounts within the financial statements are adjusted for permanent book-tax differences. These adjustments have no impact on net assets or the results of operations. Capital accounts are not adjusted for temporary book-tax differences which will reverse in a subsequent period.
Book-tax differences are primarily due to foreign currency transactions, passive foreign investment companies (PFIC), partnerships, equity-debt classifications, deferred Trustee compensation, capital loss carryforwards and losses deferred due to wash sales and excise tax regulations.
As of period end, the cost and unrealized appreciation (depreciation) in securities, and derivatives if applicable, for federal income tax purposes were as follows for each Fund:
| | Tax cost | Gross unrealized appreciation | Gross unrealized depreciation | Net unrealized appreciation (depreciation) |
| Banking Portfolio | $ 426,883,505 | $ 96,392,067 | $(25,609,504) | $ 70,782,563 |
Brokerage and Investment Management Portfolio | 834,412,943 | 222,374,669 | (108,361,404) | 114,013,265 |
| Financial Services Portfolio | 544,661,382 | 110,359,686 | (34,847,057) | 75,512,629 |
| FinTech Portfolio | 148,717,415 | 21,070,682 | (44,694,386) | (23,623,704) |
| Insurance Portfolio | 179,616,766 | 114,174,697 | (9,078,454) | 105,096,243 |
Certain of the Funds elected to defer to the next fiscal year capital losses recognized during the period November 1, 2021 to February 2022, and ordinary losses recognized during the period January 1, 2022 to February 28, 2022. Loss deferrals were as follows:
| | Capital losses | Ordinary losses |
| FinTech Portfolio | $(5,474,286) | $(985,815) |
| Insurance Portfolio | (83,589) | - |
| | | |
| | | |
Restricted Securities (including Private Placements). Funds may invest in securities that are subject to legal or contractual restrictions on resale. These securities generally may be resold in transactions exempt from registration or to the public if the securities are registered. Disposal of these securities may involve time-consuming negotiations and expense, and prompt sale at an acceptable price may be difficult. Information regarding restricted securities held at period end is included at the end of the Schedule of Investments, if applicable.
4. Purchases and Sales of Investments.
Purchases and sales of securities, other than short-term securities and in-kind transactions, as applicable, are noted in the table below.
| | Purchases ($) | Sales ($) |
| Banking Portfolio | 32,853,431 | 154,095,592 |
| Brokerage and Investment Management Portfolio | 30,973,906 | 192,502,188 |
| Financial Services Portfolio | 95,015,406 | 214,757,641 |
| FinTech Portfolio | 8,218,094 | 20,965,527 |
| Insurance Portfolio | 91,247,673 | 33,700,540 |
5. Fees and Other Transactions with Affiliates.
Management Fee. Fidelity Management & Research Company LLC (the investment adviser) and its affiliates provide the Funds with investment management related services for which the Funds pay a monthly management fee. The management fee is the sum of an individual fund fee rate and an annualized group fee rate. The individual fund fee rate is applied to each Fund's average net assets. The group fee rate is based upon the monthly average net assets of a group of registered investment companies with which the investment adviser has management contracts. The group fee rate decreases as assets under management increase and increases as assets under management decrease. For the reporting period, each Fund's annualized management fee rate expressed as a percentage of each Fund's average net assets was as follows:
| | Individual Rate | Group Rate | Total |
| Banking Portfolio | .30% | .23% | .53% |
| Brokerage and Investment Management Portfolio | .30% | .23% | .53% |
| Financial Services Portfolio | .30% | .23% | .53% |
| FinTech Portfolio | .30% | .23% | .53% |
| Insurance Portfolio | .30% | .23% | .53% |
Transfer Agent Fees. Fidelity Investments Institutional Operations Company LLC (FIIOC), an affiliate of the investment adviser, is the Funds' transfer, dividend disbursing and shareholder servicing agent. FIIOC receives account fees and asset-based fees that vary according to account size and type of account. FIIOC pays for typesetting, printing and mailing of shareholder reports, except proxy statements. For the period, transfer agent fees were equivalent to the following annualized rates expressed as a percentage of average net assets:
| Banking Portfolio | .16% |
| Brokerage and Investment Management Portfolio | .17% |
| Financial Services Portfolio | .17% |
| FinTech Portfolio | .25% |
| Insurance Portfolio | .20% |
Accounting Fees. Fidelity Service Company, Inc. (FSC), an affiliate of the investment adviser, maintains each Fund's accounting records. The accounting fee is based on the level of average net assets for each month. For the period, the fees were equivalent to the following annualized rates:
| | % of Average Net Assets |
| Banking Portfolio | .04 |
| Brokerage and Investment Management Portfolio | .03 |
| Financial Services Portfolio | .03 |
| FinTech Portfolio | .04 |
| Insurance Portfolio | .04 |
Brokerage Commissions. A portion of portfolio transactions were placed with brokerage firms which are affiliates of the investment adviser. Brokerage commissions are included in net realized gain (loss) and change in net unrealized appreciation (depreciation) in the Statement of Operations. The commissions paid to these affiliated firms were as follows:
| | Amount |
| Banking Portfolio | $ 2,177 |
| Brokerage and Investment Management Portfolio | 1,345 |
| Financial Services Portfolio | 2,917 |
| FinTech Portfolio | 78 |
| Insurance Portfolio | 306 |
Interfund Lending Program. Pursuant to an Exemptive Order issued by the Securities and Exchange Commission (the SEC), each Fund, along with other registered investment companies having management contracts with Fidelity Management & Research Company LLC (FMR), or other affiliated entities of FMR, may participate in an interfund lending program. This program provides an alternative credit facility allowing each Fund to borrow from, or lend money to, other participating affiliated funds. At period end, there were no interfund loans outstanding. Activity in this program during the period for which loans were outstanding was as follows:
| | Borrower or Lender | Average Loan Balance | Weighted Average Interest Rate | Interest Expense |
Brokerage and Investment Management Portfolio | Borrower | $ 2,655,650 | .55% | $ 817 |
| Financial Services Portfolio | Borrower | $6,833,250 | .32% | $ 239 |
| Insurance Portfolio | Borrower | $ 10,400,000 | 1.81% | $ 525 |
Interfund Trades. Funds may purchase from or sell securities to other Fidelity Funds under procedures adopted by the Board. The procedures have been designed to ensure these interfund trades are executed in accordance with Rule 17a-7 of the 1940 Act. Any interfund trades are included within the respective purchases and sales amounts shown in the Purchases and Sales of Investments note. Interfund trades during the period are noted in the table below.
| | Purchases ($) | Sales ($) | Realized Gain (Loss) ($) |
| Banking Portfolio | 1,267,896 | 4,668,597 | (733,983) |
| Brokerage and Investment Management Portfolio | 356,760 | 7,714,058 | (188,068) |
| Financial Services Portfolio | 4,538,940 | 12,044,664 | 2,705,189 |
| FinTech Portfolio | 324,688 | 25,378 | 11,484 |
| Insurance Portfolio | 1,224,423 | - | - |
6. Committed Line of Credit.
Certain Funds participate with other funds managed by the investment adviser or an affiliate in a $4.25 billion credit facility (the "line of credit") to be utilized for temporary or emergency purposes to fund shareholder redemptions or for other short-term liquidity purposes. The participating funds have agreed to pay commitment fees on their pro-rata portion of the line of credit, which are reflected in Miscellaneous expenses on the Statement of Operations, and are listed below. During the period, there were no borrowings on this line of credit.
| | Amount |
| Banking Portfolio | $ 535 |
| Brokerage and Investment Management Portfolio | 953 |
| Financial Services Portfolio | 632 |
| FinTech Portfolio | 135 |
| Insurance Portfolio | 235 |
7. Security Lending.
Funds lend portfolio securities from time to time in order to earn additional income. Lending agents are used, including National Financial Services (NFS), an affiliate of the investment adviser. Pursuant to a securities lending agreement, NFS will receive a fee, which is capped at 9.9% of a fund's daily lending revenue, for its services as lending agent. A fund may lend securities to certain qualified borrowers, including NFS. On the settlement date of the loan, a fund receives collateral (in the form of U.S. Treasury obligations, letters of credit and/or cash) against the loaned securities and maintains collateral in an amount not less than 100% of the market value of the loaned securities during the period of the loan. The market value of the loaned securities is determined at the close of business of a fund and any additional required collateral is delivered to a fund on the next business day. A fund or borrower may terminate the loan at any time, and if the borrower defaults on its obligation to return the securities loaned because of insolvency or other reasons, a fund may apply collateral received from the borrower against the obligation. A fund may experience delays and costs in recovering the securities loaned. Any cash collateral received is invested in the Fidelity Securities Lending Cash Central Fund. Any loaned securities are identified as such in the Schedule of Investments, and the value of loaned securities and cash collateral at period end, as applicable, are presented in the Statement of Assets and Liabilities. Security lending income represents the income earned on investing cash collateral, less rebates paid to borrowers and any lending agent fees associated with the loan, plus any premium payments received for lending certain types of securities. Security lending income is presented in the Statement of Operations as a component of income from Fidelity Central Funds. Affiliated security lending activity, if any, was as follows:
| | Total Security Lending Fees Paid to NFS | Security Lending Income From Securities Loaned to NFS | Value of Securities Loaned to NFS at Period End |
| Banking Portfolio | $ 977 | $ 4 | $- |
| Brokerage and Investment Management Portfolio | $ 6,956 | $ 1,586 | $- |
| Financial Services Portfolio | $ 862 | $ - | $ - |
| FinTech Portfolio | $ 542 | $ - | $ - |
| Insurance Portfolio | $ 48 | $ - | $- |
8. Bank Borrowings.
Each Fund is permitted to have bank borrowings for temporary or emergency purposes to fund shareholder redemptions or for other short-term liquidity requirements. Each Fund has established borrowing arrangements with certain banks. The interest rate on the borrowings is the bank's base rate, as revised from time to time. Any open loans, including accrued interest, at period end are presented under the caption "Notes payable" in the Statement of Assets and Liabilities, if applicable. Activity in this program during the period for which loans were outstanding was as follows:
| | Average Loan Balance | Weighted Average Interest Rate | Interest Expense |
| Brokerage and Investment Management Portfolio | $ 656,179 | 1.15% | $ 587 |
| Insurance Portfolio | $ 10,389,000 | 2.08% | $ 600 |
9. Expense Reductions.
During the period the investment adviser or an affiliate reimbursed and/or waived a portion of operating expenses as follows:
| | Amount |
| Banking Portfolio | $ 9,217 |
| Brokerage and Investment Management Portfolio | 16,448 |
| Financial Services Portfolio | 11,053 |
| FinTech Portfolio | 2,349 |
| Insurance Portfolio | 4,446 |
10. Other.
A fund's organizational documents provide former and current trustees and officers with a limited indemnification against liabilities arising in connection with the performance of their duties to the fund. In the normal course of business, a fund may also enter into contracts that provide general indemnifications. A fund's maximum exposure under these arrangements is unknown as this would be dependent on future claims that may be made against a fund. The risk of material loss from such claims is considered remote.
11. Risk and Uncertainties.
Many factors affect a fund's performance. Developments that disrupt global economies and financial markets, such as pandemics, epidemics, outbreaks of infectious diseases, war, terrorism, and environmental disasters, may significantly affect a fund's investment performance. The effects of these developments to a fund will be impacted by the types of securities in which a fund invests, the financial condition, industry, economic sector, and geographic location of an issuer, and a fund's level of investment in the securities of that issuer.
As a shareholder, you incur two types of costs: (1) transaction costs, which may include sales charges (loads) on purchase payments or redemption proceeds, as applicable and (2) ongoing costs, which generally include management fees, distribution and/or service (12b-1) fees and other Fund expenses. This Example is intended to help you understand your ongoing costs (in dollars) of investing in a fund and to compare these costs with the ongoing costs of investing in other mutual funds.
| The Example is based on an investment of $1,000 invested at the beginning of the period and held for the entire period (March 1, 2022 to August 31, 2022). |
Actual Expenses
The first line of the accompanying table provides information about actual account values and actual expenses. You may use the information in this line, together with the amount you invested, to estimate the expenses that you paid over the period. Simply divide your account value by $1,000.00 (for example, an $8,600 account value divided by $1,000.00 = 8.6), then multiply the result by the number in the first line for a class/Fund under the heading entitled "Expenses Paid During Period" to estimate the expenses you paid on your account during this period. If any fund is a shareholder of any underlying mutual funds or exchange-traded funds (ETFs) (the Underlying Funds), such fund indirectly bears its proportional share of the expenses of the Underlying Funds in addition to the direct expenses incurred presented in the table. These fees and expenses are not included in the annualized expense ratio used to calculate the expense estimate in the table below.
Hypothetical Example for Comparison Purposes
The second line of the accompanying table provides information about hypothetical account values and hypothetical expenses based on the actual expense ratio and an assumed rate of return of 5% per year before expenses, which is not the actual return. The hypothetical account values and expenses may not be used to estimate the actual ending account balance or expenses you paid for the period. You may use this information to compare the ongoing costs of investing in the Fund and other funds. To do so, compare this 5% hypothetical example with the 5% hypothetical examples that appear in the shareholder reports of the other funds. If any fund is a shareholder of any Underlying Funds, such fund indirectly bears its proportional share of the expenses of the Underlying Funds in addition to the direct expenses as presented in the table. These fees and expenses are not included in the annualized expense ratio used to calculate the expense estimate in the table below.
Please note that the expenses shown in the table are meant to highlight your ongoing costs only and do not reflect any transaction costs. Therefore, the second line of the table is useful in comparing ongoing costs only, and will not help you determine the relative total costs of owning different funds. In addition, if these transactional costs were included, your costs would have been higher.
| | | | | Annualized Expense Ratio- A | | Beginning Account Value March 1, 2022 | | Ending Account Value August 31, 2022 | | Expenses Paid During Period- C March 1, 2022 to August 31, 2022 |
| | | | | | | | | | |
| Banking Portfolio | | | | .74% | | | | | | |
| Actual | | | | | | $ 1,000 | | $ 846.00 | | $ 3.44 |
Hypothetical- B | | | | | | $ 1,000 | | $ 1,021.48 | | $ 3.77 |
| | | | | | | | | | |
| Brokerage and Investment Management Portfolio | | | | .74% | | | | | | |
| Actual | | | | | | $ 1,000 | | $ 885.20 | | $ 3.52 |
Hypothetical- B | | | | | | $ 1,000 | | $ 1,021.48 | | $ 3.77 |
| | | | | | | | | | |
| Financial Services Portfolio | | | | .75% | | | | | | |
| Actual | | | | | | $ 1,000 | | $ 884.40 | | $ 3.56 |
Hypothetical- B | | | | | | $ 1,000 | | $ 1,021.42 | | $ 3.82 |
| | | | | | | | | | |
| FinTech Portfolio | | | | .87% | | | | | | |
| Actual | | | | | | $ 1,000 | | $ 853.70 | | $ 4.06 |
Hypothetical- B | | | | | | $ 1,000 | | $ 1,020.82 | | $ 4.43 |
| | | | | | | | | | |
| Insurance Portfolio | | | | .81% | | | | | | |
| Actual | | | | | | $ 1,000 | | $ 959.50 | | $ 4.00 |
Hypothetical- B | | | | | | $ 1,000 | | $ 1,021.12 | | $ 4.13 |
| |
A Annualized expense ratio reflects expenses net of applicable fee waivers.
B 5% return per year before expenses
C Expenses are equal to the annualized expense ratio, multiplied by the average account value over the period, multiplied by 184/ 365 (to reflect the one-half year period). The fees and expenses of any Underlying Funds are not included in each annualized expense ratio.
Banking Portfolio
Brokerage and Investment Management Portfolio
Fintech Portfolio (formerly, Consumer Finance Portfolio)
Financial Services Portfolio
Insurance Portfolio
Each year, the Board of Trustees, including the Independent Trustees (together, the Board), votes on the renewal of the management contract with Fidelity Management & Research Company LLC (FMR) and the sub-advisory agreements (together, the Advisory Contracts) for each fund. FMR and the sub-advisers are referred to herein as the Investment Advisers. The Board, assisted by the advice of fund counsel and Independent Trustees' counsel, requests and considers a broad range of information relevant to the renewal of the Advisory Contracts throughout the year.
The Board meets regularly and, at each of its meetings, covers an extensive agenda of topics and materials and considers factors that are relevant to its annual consideration of the renewal of each fund's Advisory Contracts, including the services and support provided to each fund and its shareholders. The Board has established various standing committees (Committees), each composed of and chaired by Independent Trustees with varying backgrounds, to which the Board has assigned specific subject matter responsibilities in order to enhance effective decision-making by the Board. The Board, acting directly and through its Committees, requests and receives information concerning the annual consideration of the renewal of each fund's Advisory Contracts. The Board also meets as needed to review matters specifically related to the Board's annual consideration of the renewal of the Advisory Contracts. Members of the Board may also meet with trustees of other Fidelity funds through joint ad hoc committees to discuss certain matters relevant to all of the Fidelity funds.
At its May 2022 meeting, the Board unanimously determined to renew each fund's Advisory Contracts. In reaching its determination, the Board considered all factors it believed relevant, including (i) the nature, extent, and quality of the services provided to each fund and its shareholders (including the investment performance of each fund); (ii) the competitiveness relative to peer funds of each fund's management fee and total expense ratio; (iii) the total costs of the services provided by and the profits realized by Fidelity from its relationships with each fund; and (iv) the extent to which, if any, economies of scale exist and are realized as each fund grows, and whether any economies of scale are appropriately shared with fund shareholders.
In considering whether to renew the Advisory Contracts for each fund, the Board reached a determination, with the assistance of fund counsel and Independent Trustees' counsel and through the exercise of its business judgment, that the renewal of the Advisory Contracts was in the best interests of each fund and its shareholders and that the compensation payable under the Advisory Contracts was fair and reasonable. The Board's decision to renew the Advisory Contracts was not based on any single factor, but rather was based on a comprehensive consideration of all the information provided to the Board at its meetings throughout the year. The Board, in reaching its determination to renew the Advisory Contracts, was aware that shareholders of each fund have a broad range of investment choices available to them, including a wide choice among funds offered by Fidelity's competitors, and that each fund's shareholders, who have the opportunity to review and weigh the disclosure provided by the fund in its prospectus and other public disclosures, have chosen to invest in that fund, which is part of the Fidelity family of funds.
Nature, Extent, and Quality of Services Provided. The Board considered Fidelity's staffing as it relates to the funds, including the backgrounds of investment personnel of Fidelity, and also considered the funds' investment objectives, strategies, and related investment philosophies. The Independent Trustees also had discussions with senior management of Fidelity's investment operations and investment groups. The Board considered the structure of the investment personnel compensation program and whether this structure provides appropriate incentives to act in the best interests of each fund. Additionally, the Board considered the portfolio managers' investments, if any, in the funds that they manage. The Board also considered the steps Fidelity had taken to ensure the continued provision of high quality services to the Fidelity funds during the COVID-19 pandemic, including the expansion of staff in client facing positions to maintain service levels in periods of high volumes and volatility.
Resources Dedicated to Investment Management and Support Services . The Board and the Fund Oversight and Research Committees reviewed the general qualifications and capabilities of Fidelity's investment staff, including its size, education, experience, and resources, as well as Fidelity's approach to recruiting, training, managing, and compensating investment personnel. The Board noted the resources devoted to expansion of Fidelity's global investment organization, and that Fidelity's analysts have extensive resources, tools, and capabilities that allow them to conduct sophisticated quantitative and fundamental analysis, as well as credit analysis of issuers, counterparties, and guarantors. Further, the Board considered that Fidelity's investment professionals have sufficient access to global information and data so as to provide competitive investment results over time, and that those professionals also have access to sophisticated tools that permit them to assess portfolio construction and risk and performance attribution characteristics continuously, as well as to transmit new information and research conclusions rapidly around the world. Additionally, in its deliberations, the Board considered Fidelity's trading, risk management, compliance, and technology and operations capabilities and resources, which are integral parts of the investment management process.
Shareholder and Administrative Services . The Board considered (i) the nature, extent, quality, and cost of advisory, administrative, and shareholder services performed by the Investment Advisers and their affiliates under the Advisory Contracts and under separate agreements covering transfer agency, pricing and bookkeeping, and securities lending services for each fund; (ii) the nature and extent of the supervision of third party service providers, principally custodians, subcustodians, and pricing vendors; and (iii) the resources devoted to, and the record of compliance with, each fund's compliance policies and procedures. The Board also reviewed the allocation of fund brokerage, including allocations to brokers affiliated with the Investment Advisers, the use of brokerage commissions to pay fund expenses, and the use of "soft" commission dollars to pay for research services.
The Board noted that the growth of fund assets over time across the complex allows Fidelity to reinvest in the development of services designed to enhance the value and convenience of the Fidelity funds as investment vehicles. These services include 24-hour access to account information and market information over the Internet and through telephone representatives, investor education materials, and asset allocation tools. The Board also considered that it reviews customer service metrics such as telephone response times, continuity of services on the website and metrics addressing services at Fidelity Investor Centers.
Investment in a Large Fund Family . The Board considered the benefits to shareholders of investing in a Fidelity fund, including the benefits of investing in a fund that is part of a large family of funds offering a variety of investment disciplines and providing a large variety of mutual fund investor services. The Board noted that Fidelity had taken, or had made recommendations that resulted in the Fidelity funds taking, a number of actions over the previous year that benefited particular funds, including: (i) continuing to dedicate additional resources to Fidelity's investment research process, which includes meetings with management of issuers of securities in which the funds invest; (ii) continuing efforts to enhance Fidelity's global research capabilities; (iii) launching new funds and ETFs with innovative structures, strategies and pricing and making other enhancements to meet client needs; (iv) launching new share classes of existing funds; (v) eliminating purchase minimums and broadening eligibility requirements for certain funds and share classes; (vi) reducing management fees and total expenses for certain target date funds and classes and index funds; (vii) lowering expenses for certain existing funds and classes by implementing or lowering expense caps; (viii) rationalizing product lines and gaining increased efficiencies from fund mergers and liquidations; (ix) continuing to develop, acquire and implement systems and technology to improve services to the funds and shareholders, strengthen information security, and increase efficiency; and (x) continuing to implement enhancements to further strengthen Fidelity's product line to increase investors' probability of success in achieving their investment goals, including retirement income goals.
Investment Performance . The Board considered whether each fund has operated in accordance with its investment objective, as well as its record of compliance with its investment restrictions and its performance history. The Board noted that Fintech Portfolio had a portfolio manager change in February 2022 and Financial Services Portfolio had a portfolio manager change in May 2019 and October 2019. The Board will continue to monitor closely each fund's performance, taking into account the portfolio manager changes.
The Board took into account discussions that occur at Board meetings throughout the year with representatives of the Investment Advisers about fund investment performance. In this regard the Board noted that as part of regularly scheduled fund reviews and other reports to the Board on fund performance, the Board considers annualized return information for each fund for different time periods, measured against an appropriate securities market index (benchmark index). The Board also reviews and considers information about performance attribution. In its evaluation of fund investment performance, the Board gave particular attention to information indicating changes in performance of certain Fidelity funds for specific time periods and discussed with the Investment Advisers the reasons for any overperformance or underperformance.
In addition to reviewing absolute and relative fund performance, the Independent Trustees periodically consider the appropriateness of fund performance metrics in evaluating the results achieved. In general, the Independent Trustees believe that fund performance should be evaluated based on net performance (after fees and expenses) of the fund compared to appropriate benchmark indices, over appropriate time periods that may include full market cycles, taking into account relevant factors including the following: general market conditions; issuer-specific information; and fund cash flows and other factors.
The Independent Trustees recognize that shareholders evaluate performance on a net basis over their own holding periods, for which one-, three-, and five-year periods are often used as a proxy. For this reason, the performance information reviewed by the Board also included net cumulative total return information for each fund and an appropriate benchmark index for the most recent one-, three-, and five-year periods ended September 30, 2021, as shown below.
Banking Portfolio
Brokerage and Investment Management Portfolio
The Board considered the fund's underperformance for different time periods ended December 31, 2021 (which periods are not reflected in the chart above). The Board's discussions with FMR regarding underperformance cover topics including, but not limited to: the longer-term track record of a fund's portfolio manager(s); broader trends in the market that may adversely impact a fund's performance; and attribution reports on contributors to the fund's underperformance. The Board engages with FMR on steps that might be taken to address a fund's underperformance.
FinTech Portfolio
Financial Services Portfolio
Insurance Portfolio
Based on its review, the Board concluded that the nature, extent, and quality of services provided to each fund under the Advisory Contracts should continue to benefit the shareholders of each fund.
Competitiveness of Management Fee and Total Expense Ratio. The Board considered each fund's management fee and total expense ratio compared to "mapped groups" of competitive funds and classes created for the purpose of facilitating the Trustees' competitive analysis of management fees and total expenses. Fidelity creates "mapped groups" by combining similar Lipper investment objective categories that have comparable investment mandates. For this purpose, all sector focused equity funds are grouped in the same mapped group. Combining Lipper investment objective categories aids the Board's management fee and total expense ratio comparisons by broadening the competitive group used for comparison.
Management Fee . The Board considered two proprietary management fee comparisons for the 12-month periods ended September 30 (June 30 for periods ended 2019 and 2018 and December 31 for periods prior to 2018) shown in basis points (BP) in the charts below. The group of Lipper funds used by the Board for management fee comparisons is referred to below as the "Total Mapped Group." The Total Mapped Group comparison focuses on a fund's standing in terms of gross management fees before expense reimbursements or caps relative to the total universe of funds with comparable investment mandates (i.e., sector equities), regardless of whether their management fee structures also are comparable. Funds with comparable management fee structures have similar management fee contractual arrangements (e.g., flat rate charged for advisory services, all-inclusive fee rate, etc.). "TMG %" represents the percentage of funds in the Total Mapped Group that had management fees that were lower than a fund's. For example, a hypothetical TMG % of 20% would mean that 80% of the funds in the Total Mapped Group had higher, and 20% had lower, management fees than a fund. The funds' actual TMG %s and the number of funds in the Total Mapped Group are in the charts below. The "Asset-Sized Peer Group" (ASPG) comparison focuses on a fund's standing relative to a subset of non-Fidelity funds within the Total Mapped Group that are similar in size and management fee structure. For example, if a fund is in the first quartile of the ASPG, the fund's management fee ranks in the least expensive or lowest 25% of funds in the ASPG. The ASPG represents at least 15% of the funds in the Total Mapped Group with comparable asset size and management fee structures, subject to a minimum of 50 funds (or all funds in the Total Mapped Group if fewer than 50). Additional information, such as the ASPG quartile in which a fund's management fee rate ranked, is also included in the charts and was considered by the Board.
Banking Portfolio
Brokerage and Investment Management Portfolio
FinTech Portfolio
Financial Services Portfolio
Insurance Portfolio
The Board noted that each fund's management fee rate ranked below the median of its Total Mapped Group and below the median of its ASPG for the 12-month period ended September 30, 2021.
The Board also considered that, for funds subject to the group fee, FMR agreed to voluntarily waive fees over a specified period of time in amounts designed to account for assets converted from certain funds to certain collective investment trusts.
Based on its review, the Board concluded that each fund's management fee is fair and reasonable in light of the services that the fund receives and the other factors considered.
Total Expense Ratio . In its review of each fund's total expense ratio, the Board considered the fund's management fee rate as well as other fund expenses, such as transfer agent fees, pricing and bookkeeping fees, and custodial, legal, and audit fees. The Board also noted that Fidelity may agree to waive fees or reimburse expenses from time to time, and the extent to which, if any, it has done so for each fund. Each fund is compared to those funds and classes in the Total Mapped Group (used by the Board for management fee comparisons) that have a similar sales load structure. The Board also considered a total expense ASPG comparison for each fund, which focuses on the total expenses of the fund relative to a subset of non-Fidelity funds within the total expense similar sales load structure group. The total expense ASPG is limited to 15 larger and 15 smaller classes in fund average assets for a total of 30 classes, where possible. The total expense ASPG comparison excludes performance adjustments and fund-paid 12b-1 fees to eliminate variability in fee structures.
The Board noted that each fund's total net expense ratio ranked below the similar sales load structure group competitive median and below the ASPG competitive median for the 12-month period ended September 30, 2021.
Fees Charged to Other Fidelity Clients . The Board also considered Fidelity fee structures and other information with respect to clients of Fidelity, such as other funds advised or subadvised by Fidelity, pension plan clients, and other institutional clients with similar mandates. The Board noted that a joint ad hoc committee created by it and the boards of other Fidelity funds periodically reviews and compares Fidelity's institutional investment advisory business with its business of providing services to the Fidelity funds and also noted the most recent findings of the committee. The Board noted that the committee's review included a consideration of the differences in services provided, fees charged, and costs incurred, as well as competition in the markets serving the different categories of clients.
Based on its review of total expense ratios and fees charged to other Fidelity clients, the Board concluded that each fund's total expense ratio was reasonable in light of the services that the fund and its shareholders receive and the other factors considered.
Costs of the Services and Profitability. The Board considered the revenues earned and the expenses incurred by Fidelity in conducting the business of developing, marketing, distributing, managing, administering and servicing each fund and servicing each fund's shareholders. The Board also considered the level of Fidelity's profits in respect of all the Fidelity funds.
On an annual basis, Fidelity presents to the Board information about the profitability of its relationships with each fund. Fidelity calculates profitability information for each fund, as well as aggregate profitability information for groups of Fidelity funds and all Fidelity funds, using a series of detailed revenue and cost allocation methodologies which originate with the books and records of Fidelity on which Fidelity's audited financial statements are based. The Audit Committee of the Board reviews any significant changes from the prior year's methodologies and the full Board approves such changes.
A public accounting firm has been engaged annually by the Board as part of the Board's assessment of Fidelity's profitability analysis. The engagement includes the review and assessment of the methodologies used by Fidelity in determining the revenues and expenses attributable to Fidelity's mutual fund business, and completion of agreed-upon procedures in respect of the mathematical accuracy of certain fund profitability information and its conformity to established allocation methodologies. After considering the reports issued under the engagement and information provided by Fidelity, the Board concluded that while other allocation methods may also be reasonable, Fidelity's profitability methodologies are reasonable in all material respects.
The Board also reviewed Fidelity's non-fund businesses and potential indirect benefits such businesses may have received as a result of their association with Fidelity's mutual fund business (i.e., fall-out benefits) as well as cases where Fidelity's affiliates may benefit from the funds' business. The Board considered areas where potential indirect benefits to the Fidelity funds from their relationships with Fidelity may exist. The Board's consideration of these matters was informed by the findings of a joint ad hoc committee created by it and the boards of other Fidelity funds to evaluate potential fall-out benefits.
The Board considered the costs of the services provided by and the profits realized by Fidelity in connection with the operation of each fund and was satisfied that the profitability was not excessive.
Economies of Scale. The Board considered whether there have been economies of scale in respect of the management of the Fidelity funds, whether the Fidelity funds (including each fund) have appropriately benefited from any such economies of scale, and whether there is potential for realization of any further economies of scale. The Board considered the extent to which each fund will benefit from economies of scale as assets grow through increased services to the fund, through waivers or reimbursements, or through fee or expense ratio reductions. The Board also noted that a committee (the Economies of Scale Committee) created by it and the boards of other Fidelity funds periodically analyzes whether Fidelity attains economies of scale in respect of the management and servicing of the Fidelity funds, whether the Fidelity funds have appropriately benefited from such economies of scale, and whether there is potential for realization of any further economies of scale.
The Board recognized that each fund's management contract incorporates a "group fee" structure, which provides for lower group fee rates as total "group assets" increase, and for higher group fee rates as total "group assets" decrease ("group assets" as defined in the management contracts). FMR calculates the group fee rates based on a tiered asset "breakpoint" schedule that varies based on asset class. The Board considered that the group fee is designed to deliver the benefits of economies of scale to fund shareholders when total Fidelity fund assets increase, even if assets of any particular fund are unchanged or have declined, because some portion of Fidelity's costs are attributable to services provided to all Fidelity funds, and all funds benefit if those costs can be allocated among more assets. The Board further considered that Fidelity agreed to impose a temporary fee waiver in the form of additional breakpoints to the current breakpoint schedule. The Board concluded that, given the group fee structure, fund shareholders will benefit from lower management fees as "group assets" increase at the fund complex level, regardless of whether Fidelity achieves any such economies of scale.
The Board concluded, taking into account the analysis of the Economies of Scale Committee, that economies of scale, if any, are being appropriately shared between fund shareholders and Fidelity.
Additional Information Requested by the Board. In order to develop fully the factual basis for consideration of the Fidelity funds' advisory contracts, the Board requested and received additional information on certain topics, including: (i) fund flow and performance trends, in particular the underperformance of certain funds and strategies, and Fidelity's long-term strategies for certain funds, including any consideration of fund liquidations or mergers; (ii) the operation of performance fees, competitor use of performance fees, and consideration of the expansion of performance fees to additional funds; (iii) Fidelity's pricing philosophy compared to competitors; (iv) fund profitability methodology and data; (v) evaluation of competitive fund data and peer group classifications and fee and expense comparisons; (vi) the management fee and expense structures for different funds and classes and information about the differences between various fee and expense structures; (vii) group fee breakpoints and related voluntary fee waivers; and (viii) information regarding other accounts managed by Fidelity and the funds' sub-advisory arrangements.
Based on its evaluation of all of the conclusions noted above, and after considering all factors it believed relevant, the Board concluded that the advisory fee arrangements are fair and reasonable and that each fund's Advisory Contracts should be renewed.
1.813666.117
SELFIN-SANN-1022
Fidelity® Select Portfolios®
Energy Sector
Energy Portfolio
Semi-Annual Report
August 31, 2022
Contents
To view a fund's proxy voting guidelines and proxy voting record for the 12-month period ended June 30, visit http://www.fidelity.com/proxyvotingresults or visit the Securities and Exchange Commission's (SEC) web site at http://www.sec.gov.
You may also call 1-800-544-8544 to request a free copy of the proxy voting guidelines.
Standard & Poor's, S&P and S&P 500 are registered service marks of The McGraw-Hill Companies, Inc. and have been licensed for use by Fidelity Distributors Corporation.
Other third-party marks appearing herein are the property of their respective owners.
All other marks appearing herein are registered or unregistered trademarks or service marks of FMR LLC or an affiliated company. © 2022 FMR LLC. All rights reserved.
This report and the financial statements contained herein are submitted for the general information of the shareholders of the Fund. This report is not authorized for distribution to prospective investors in the Fund unless preceded or accompanied by an effective prospectus.
A fund files its complete schedule of portfolio holdings with the SEC for the first and third quarters of each fiscal year on Form N-PORT. Forms N-PORT are available on the SEC's web site at http://www.sec.gov. A fund's Forms N-PORT may be reviewed and copied at the SEC's Public Reference Room in Washington, DC. Information regarding the operation of the SEC's Public Reference Room may be obtained by calling 1-800-SEC-0330.
For a complete list of a fund's portfolio holdings, view the most recent holdings listing, semiannual report, or annual report on Fidelity's web site at http://www.fidelity.com, http://www.institutional.fidelity.com, or http://www.401k.com, as applicable.
NOT FDIC INSURED •MAY LOSE VALUE •NO BANK GUARANTEE
Neither the Fund nor Fidelity Distributors Corporation is a bank.
Top Holdings (% of Fund's net assets) |
| |
| Exxon Mobil Corp. | 20.9 | |
| Chevron Corp. | 6.8 | |
| ConocoPhillips Co. | 5.0 | |
| Cenovus Energy, Inc. (Canada) | 4.5 | |
| Hess Corp. | 4.4 | |
| Valero Energy Corp. | 3.8 | |
| Occidental Petroleum Corp. | 3.7 | |
| Devon Energy Corp. | 3.7 | |
| Cheniere Energy, Inc. | 3.5 | |
| Canadian Natural Resources Ltd. | 3.5 | |
| | 59.8 | |
| |
| Industries (% of Fund's net assets) |
| |
| Oil, Gas & Consumable Fuels | 88.7 | |
| Energy Equipment & Services | 9.9 | |
| Independent Power and Renewable Electricity Producers | 0.7 | |
| |
Geographic Diversification (% of Fund's net assets) |
|
* Includes Short-Term investments and Net Other Assets (Liabilities). Percentages are based on country or territory of incorporation and are adjusted for the effect of futures contracts, if applicable. |
| |
Showing Percentage of Net Assets
| Common Stocks - 99.3% |
| | | Shares | Value ($) |
| Energy Equipment & Services - 9.9% | | | |
| Oil & Gas Drilling - 0.5% | | | |
| Nabors Industries Ltd. (a) | | 16,199 | 2,146,529 |
| Nabors Industries Ltd. warrants 6/11/26 (a) | | 36,999 | 1,267,216 |
| Odfjell Drilling Ltd. (a) | | 1,596,418 | 4,345,317 |
| Odfjell Technology Ltd. (a) | | 266,069 | 661,568 |
| Shelf Drilling Ltd. (a)(b) | | 1,404,689 | 2,216,327 |
| Valaris Ltd. (a) | | 80,800 | 4,119,184 |
| | | | 14,756,141 |
| Oil & Gas Equipment & Services - 9.4% | | | |
| Baker Hughes Co. Class A | | 331,278 | 8,368,082 |
| Cactus, Inc. | | 72,286 | 2,887,826 |
| Halliburton Co. | | 2,085,200 | 62,827,076 |
| Nextier Oilfield Solutions, Inc. (a) | | 3,496,600 | 32,763,142 |
| NOV, Inc. | | 772,000 | 13,641,240 |
| Oceaneering International, Inc. (a) | | 974,530 | 8,624,591 |
| ProPetro Holding Corp. (a) | | 1,369,901 | 12,548,293 |
| Schlumberger Ltd. | | 2,156,569 | 82,273,107 |
| Technip Energies NV | | 225,834 | 2,831,225 |
| TechnipFMC PLC (a) | | 4,084,772 | 33,413,435 |
| | | | 260,178,017 |
TOTAL ENERGY EQUIPMENT & SERVICES | | | 274,934,158 |
| Independent Power and Renewable Electricity Producers - 0.7% | | | |
| Independent Power Producers & Energy Traders - 0.7% | | | |
| The AES Corp. | | 46,700 | 1,188,515 |
| Vistra Corp. | | 735,100 | 18,193,725 |
| | | | 19,382,240 |
| Oil, Gas & Consumable Fuels - 88.7% | | | |
| Coal & Consumable Fuels - 0.8% | | | |
| Arch Resources, Inc. (c) | | 63,500 | 9,244,330 |
| Enviva, Inc. | | 27,500 | 1,911,800 |
| Peabody Energy Corp. (a)(c) | | 393,700 | 9,708,642 |
| | | | 20,864,772 |
| Integrated Oil & Gas - 38.4% | | | |
| Cenovus Energy, Inc.: | | | |
| warrants (a) | | 97,500 | 1,371,825 |
| (Canada) | | 6,566,106 | 123,187,918 |
| Chevron Corp. | | 1,181,903 | 186,811,588 |
| Exxon Mobil Corp. | | 6,059,146 | 579,193,765 |
| Imperial Oil Ltd. | | 518,700 | 25,458,105 |
| Occidental Petroleum Corp. | | 1,446,515 | 102,702,565 |
| Occidental Petroleum Corp. warrants 8/3/27 (a) | | 99,550 | 4,870,982 |
| Suncor Energy, Inc. | | 1,151,600 | 37,257,002 |
| | | | 1,060,853,750 |
| Oil & Gas Exploration & Production - 35.7% | | | |
| Antero Resources Corp. (a) | | 1,418,000 | 56,833,440 |
| APA Corp. | | 1,023,800 | 40,040,818 |
| Callon Petroleum Co. (a) | | 138,300 | 5,886,048 |
| Canadian Natural Resources Ltd. | | 25,780 | 1,413,002 |
| Canadian Natural Resources Ltd. (c) | | 1,780,100 | 97,588,000 |
| Chesapeake Energy Corp. (c) | | 156,500 | 15,726,685 |
| Chord Energy Corp. | | 85,552 | 12,109,886 |
| Civitas Resources, Inc. | | 231,754 | 15,571,551 |
| ConocoPhillips Co. | | 1,266,666 | 138,636,594 |
| Coterra Energy, Inc. | | 1,203,198 | 37,190,850 |
| Devon Energy Corp. | | 1,430,600 | 101,028,972 |
| Diamondback Energy, Inc. | | 176,700 | 23,550,576 |
| EOG Resources, Inc. | | 421,864 | 51,172,103 |
| Hess Corp. | | 1,014,300 | 122,507,154 |
| Magnolia Oil & Gas Corp. Class A | | 500,700 | 11,951,709 |
| National Energy Services Reunited Corp. (a) | | 1,659,518 | 11,649,816 |
| Northern Oil & Gas, Inc. | | 173,860 | 5,500,930 |
| Ovintiv, Inc. | | 747,700 | 39,732,778 |
| PDC Energy, Inc. | | 1,034,107 | 70,226,206 |
| Pioneer Natural Resources Co. | | 365,966 | 92,669,911 |
| Range Resources Corp. | | 631,100 | 20,737,946 |
| SM Energy Co. | | 286,200 | 12,612,834 |
| Viper Energy Partners LP | | 126,159 | 3,850,373 |
| | | | 988,188,182 |
| Oil & Gas Refining & Marketing - 8.5% | | | |
| Marathon Petroleum Corp. | | 815,192 | 82,130,594 |
| Phillips 66 Co. | | 526,373 | 47,089,329 |
| Valero Energy Corp. | | 896,000 | 104,939,520 |
| | | | 234,159,443 |
| Oil & Gas Storage & Transport - 5.3% | | | |
| Cheniere Energy, Inc. | | 610,312 | 97,759,776 |
| Energy Transfer LP | | 3,070,900 | 35,960,239 |
| Golar LNG Ltd. (a) | | 341,133 | 9,302,697 |
| Targa Resources Corp. | | 73,400 | 5,008,082 |
| | | | 148,030,794 |
TOTAL OIL, GAS & CONSUMABLE FUELS | | | 2,452,096,941 |
| TOTAL COMMON STOCKS (Cost $1,682,899,047) | | | 2,746,413,339 |
| | | | |
| Money Market Funds - 5.0% |
| | | Shares | Value ($) |
| Fidelity Cash Central Fund 2.33% (d) | | 4,941,634 | 4,942,622 |
| Fidelity Securities Lending Cash Central Fund 2.34% (d)(e) | | 132,630,195 | 132,643,458 |
| TOTAL MONEY MARKET FUNDS (Cost $137,586,080) | | | 137,586,080 |
| | | | |
| TOTAL INVESTMENT IN SECURITIES - 104.3% (Cost $1,820,485,127) | 2,883,999,419 |
NET OTHER ASSETS (LIABILITIES) - (4.3)% | (118,242,576) |
| NET ASSETS - 100.0% | 2,765,756,843 |
| | |
Legend
| (b) | Security exempt from registration under Rule 144A of the Securities Act of 1933. These securities may be resold in transactions exempt from registration, normally to qualified institutional buyers. At the end of the period, the value of these securities amounted to $2,216,327 or 0.1% of net assets. |
| (c) | Security or a portion of the security is on loan at period end. |
| (d) | Affiliated fund that is generally available only to investment companies and other accounts managed by Fidelity Investments. The rate quoted is the annualized seven-day yield of the fund at period end. A complete unaudited listing of the fund's holdings as of its most recent quarter end is available upon request. In addition, each Fidelity Central Fund's financial statements are available on the SEC's website or upon request. |
| (e) | Investment made with cash collateral received from securities on loan. |
Affiliated Central Funds
Fiscal year to date information regarding the Fund's investments in Fidelity Central Funds, including the ownership percentage, is presented below.
| Affiliate | Value, beginning of period ($) | Purchases ($) | Sales Proceeds ($) | Dividend Income ($) | Realized Gain (loss) ($) | Change in Unrealized appreciation (depreciation) ($) | Value, end of period ($) | %ownership, end of period |
| Fidelity Cash Central Fund 2.33% | 7,528,525 | 232,058,455 | 234,644,358 | 24,262 | - | - | 4,942,622 | 0.0% |
| Fidelity Securities Lending Cash Central Fund 2.34% | 23,406,482 | 667,518,628 | 558,281,652 | 82,114 | - | - | 132,643,458 | 0.4% |
| Total | 30,935,007 | 899,577,083 | 792,926,010 | 106,376 | - | - | 137,586,080 | |
| | | | | | | | | |
Amounts in the income column in the above table include any capital gain distributions from underlying funds, which are presented in the corresponding line item in the Statement of Operations, if applicable.
Amount for Fidelity Securities Lending Cash Central Fund represents the income earned on investing cash collateral, less rebates paid to borrowers and any lending agent fees associated with the loan, plus any premium payments received for lending certain types of securities.
Investment Valuation
The following is a summary of the inputs used, as of August 31, 2022, involving the Fund's assets and liabilities carried at fair value. The inputs or methodology used for valuing securities may not be an indication of the risk associated with investing in those securities. For more information on valuation inputs, and their aggregation into the levels used below, please refer to the Investment Valuation section in the accompanying Notes to Financial Statements.
| Valuation Inputs at Reporting Date: |
| Description | Total ($) | Level 1 ($) | Level 2 ($) | Level 3 ($) |
Investments in Securities: | | | | |
|
| Common Stocks | 2,746,413,339 | 2,746,413,339 | - | - |
|
| Money Market Funds | 137,586,080 | 137,586,080 | - | - |
| Total Investments in Securities: | 2,883,999,419 | 2,883,999,419 | - | - |
| Statement of Assets and Liabilities |
| | | | August 31, 2022 (Unaudited) |
| | | | | |
| Assets | | | | |
| Investment in securities, at value (including securities loaned of $126,143,603) - See accompanying schedule: | | $2,746,413,339 | | |
Unaffiliated issuers (cost $1,682,899,047) | | | |
Fidelity Central Funds (cost $137,586,080) | | 137,586,080 | | |
| | | | | |
| Total Investment in Securities (cost $1,820,485,127) | | | $ | 2,883,999,419 |
| Foreign currency held at value (cost $1,633,954) | | | | 1,633,954 |
| Receivable for fund shares sold | | | | 8,478,961 |
| Dividends receivable | | | | 10,214,454 |
| Distributions receivable from Fidelity Central Funds | | | | 35,339 |
| Prepaid expenses | | | | 10,900 |
| Other receivables | | | | 408,302 |
Total assets | | | | 2,904,781,329 |
| Liabilities | | | | |
| Payable to custodian bank | | $259 | | |
| Payable for fund shares redeemed | | 4,440,643 | | |
| Accrued management fee | | 1,166,577 | | |
| Other affiliated payables | | 407,500 | | |
| Other payables and accrued expenses | | 366,657 | | |
| Collateral on securities loaned | | 132,642,850 | | |
| Total Liabilities | | | | 139,024,486 |
| Net Assets | | | $ | 2,765,756,843 |
| Net Assets consist of: | | | | |
| Paid in capital | | | $ | 2,950,227,402 |
| Total accumulated earnings (loss) | | | | (184,470,559) |
| Net Assets | | | $ | 2,765,756,843 |
Net Asset Value , offering price and redemption price per share ($2,765,756,843 ÷ 52,232,967 shares) | | | $ | 52.95 |
| | | | | |
| Statement of Operations |
| | | | Six months ended August 31, 2022 (Unaudited) |
| Investment Income | | | | |
| Dividends | | | $ | 49,919,519 |
| Income from Fidelity Central Funds (including $82,114 from security lending) | | | | 106,376 |
| Total Income | | | | 50,025,895 |
| Expenses | | | | |
| Management fee | $ | 7,355,550 | | |
| Transfer agent fees | | 2,262,035 | | |
| Accounting fees | | 388,481 | | |
| Custodian fees and expenses | | 25,046 | | |
| Independent trustees' fees and expenses | | 4,388 | | |
| Registration fees | | 175,064 | | |
| Audit | | 25,358 | | |
| Legal | | 714 | | |
| Interest | | 40,866 | | |
| Miscellaneous | | 1,546 | | |
| Total expenses before reductions | | 10,279,048 | | |
| Expense reductions | | (45,606) | | |
| Total expenses after reductions | | | | 10,233,442 |
| Net Investment income (loss) | | | | 39,792,453 |
| Realized and Unrealized Gain (Loss) | | | | |
| Net realized gain (loss) on: | | | | |
| Investment Securities: | | | | |
| Unaffiliated issuers | | (10,797,591) | | |
| Foreign currency transactions | | (9,818) | | |
| Total net realized gain (loss) | | | | (10,807,409) |
| Change in net unrealized appreciation (depreciation) on: | | | | |
| Investment Securities: | | | | |
| Unaffiliated issuers | | 323,798,640 | | |
| Assets and liabilities in foreign currencies | | (2,106) | | |
| Total change in net unrealized appreciation (depreciation) | | | | 323,796,534 |
| Net gain (loss) | | | | 312,989,125 |
| Net increase (decrease) in net assets resulting from operations | | | $ | 352,781,578 |
| Statement of Changes in Net Assets |
| |
| | Six months ended August 31, 2022 (Unaudited) | | Year ended February 28, 2022 |
| Increase (Decrease) in Net Assets | | | | |
| Operations | | | | |
| Net investment income (loss) | $ | 39,792,453 | $ | 37,737,303 |
| Net realized gain (loss) | | (10,807,409) | | (5,935,534) |
| Change in net unrealized appreciation (depreciation) | | 323,796,534 | | 661,757,391 |
| Net increase (decrease) in net assets resulting from operations | | 352,781,578 | | 693,559,160 |
| Distributions to shareholders | | (6,252,155) | | (31,460,812) |
| Share transactions | | | | |
| Proceeds from sales of shares | | 1,284,965,443 | | 1,435,953,793 |
| Net asset value of shares issued in exchange for the net assets of the Target Fund(s) (see Merger Information note) | | - | | 388,960,944 |
| Reinvestment of distributions | | 5,906,535 | | 29,620,722 |
| Cost of shares redeemed | | (1,279,285,289) | | (1,089,636,722) |
Net increase (decrease) in net assets resulting from share transactions | | 11,586,689 | | 764,898,737 |
| Total increase (decrease) in net assets | | 358,116,112 | | 1,426,997,085 |
| | | | | |
| Net Assets | | | | |
| Beginning of period | | 2,407,640,731 | | 980,643,646 |
| End of period | $ | 2,765,756,843 | $ | 2,407,640,731 |
| | | | | |
| Other Information | | | | |
| Shares | | | | |
| Sold | | 25,140,727 | | 39,603,793 |
| Issued in exchange for the shares of the Target Fund(s) (see Merger Information note) | | - | | 11,161,009 |
| Issued in reinvestment of distributions | | 114,801 | | 884,794 |
| Redeemed | | (26,243,094) | | (31,953,761) |
| Net increase (decrease) | | (987,566) | | 19,695,835 |
| | | | | |
| | Six months ended (Unaudited) August 31, 2022 | | Years ended February 28, 2022 | | 2021 | | 2020 A | | 2019 | | 2018 |
Selected Per-Share Data | | | | | | | | | | | | |
| Net asset value, beginning of period | $ | 45.24 | $ | 29.25 | $ | 26.79 | $ | 37.50 | $ | 41.01 | $ | 44.10 |
| Income from Investment Operations | | | | | | | | | | | | |
Net investment income (loss) B,C | | .72 | | .96 | | .99 D | | .71 | | .49 | | .75 E |
| Net realized and unrealized gain (loss) | | 7.10 | | 15.82 | | 2.27 | | (10.76) | | (3.51) | | (3.06) |
| Total from investment operations | | 7.82 | | 16.78 | | 3.26 | | (10.05) | | (3.02) | | (2.31) |
| Distributions from net investment income | | (.11) | | (.79) | | (.80) | | (.64) | | (.48) | | (.68) |
| Distributions from net realized gain | | - | | - | | - | | (.02) | | (.01) | | (.10) |
| Total distributions | | (.11) | | (.79) | | (.80) | | (.66) | | (.49) | | (.78) |
| Net asset value, end of period | $ | 52.95 | $ | 45.24 | $ | 29.25 | $ | 26.79 | $ | 37.50 | $ | 41.01 |
Total Return F,G | | 17.30% | | 58.37% | | 13.03% | | (27.24)% | | (7.30)% | | (5.27)% |
Ratios to Average Net Assets C,H,I | | | | | | | | | | | | |
| Expenses before reductions | | .74% J | | .77% | | .85% | | .81% | | .78% | | .79% |
| Expenses net of fee waivers, if any | | .73% J | | .77% | | .85% | | .81% | | .78% | | .79% |
| Expenses net of all reductions | | .73% J | | .77% | | .84% | | .80% | | .77% | | .78% |
| Net investment income (loss) | | 2.85% J | | 2.79% | | 4.50% D | | 2.00% | | 1.12% | | 1.82% E |
| Supplemental Data | | | | | | | | | | | | |
| Net assets, end of period (000 omitted) | $ | 2,765,757 | $ | 2,407,641 | $ | 980,644 | $ | 676,312 | $ | 1,152,173 | $ | 1,778,436 |
Portfolio turnover rate K | | 51% J | | 56% L | | 31% | | 79% M | | 59% M | | 59% |
A For the year ended February 29.
B Calculated based on average shares outstanding during the period.
C Net investment income (loss) is affected by the timing of the declaration of dividends by any underlying mutual funds or exchange-traded funds (ETFs). Net investment income (loss) of any such underlying funds is not included in the Fund's net investment income (loss) ratio.
D Net investment income per share reflects one or more large, non-recurring dividend(s) which amounted to $.15 per share. Excluding such non-recurring dividend(s), the ratio of net investment income (loss) to average net assets would have been 3.82%.
E Net investment income per share reflects one or more large, non-recurring dividend(s) which amounted to $.48 per share. Excluding such non-recurring dividend(s), the ratio of net investment income (loss) to average net assets would have been .66%.
F Total returns for periods of less than one year are not annualized.
G Total returns would have been lower if certain expenses had not been reduced during the applicable periods shown.
H Fees and expenses of any underlying mutual funds or exchange-traded funds (ETFs) are not included in the Fund's expense ratio. The Fund indirectly bears its proportionate share of these expenses. For additional expense information related to investments in Fidelity Central Funds, please refer to the "Investments in Fidelity Central Funds" note found in the Notes to Financial Statements section of the most recent Annual or Semi-Annual report.
I Expense ratios reflect operating expenses of the class. Expenses before reductions do not reflect amounts reimbursed, waived, or reduced through arrangements with the investment adviser, brokerage services, or other offset arrangements, if applicable, and do not represent the amount paid by the class during periods when reimbursements, waivers or reductions occur.
J Annualized
K Amount does not include the portfolio activity of any underlying mutual funds or exchange-traded funds (ETFs).
L The portfolio turnover rate does not include the assets acquired in the merger.
M Portfolio turnover rate excludes securities received or delivered in-kind.
For the period ended August 31, 2022
1. Organization.
Energy Portfolio (the Fund) is a non-diversified fund of Fidelity Select Portfolios (the Trust) and is authorized to issue an unlimited number of shares. Share transactions on the Statement of Changes in Net Assets may contain exchanges between affiliated funds. The Trust is registered under the Investment Company Act of 1940, as amended (the 1940 Act), as an open-end management investment company organized as a Massachusetts business trust. The Fund invests primarily in securities of companies whose principal business activities fall within specific industries.
2. Investments in Fidelity Central Funds.
Funds may invest in Fidelity Central Funds, which are open-end investment companies generally available only to other investment companies and accounts managed by the investment adviser and its affiliates. The Schedule of Investments lists any Fidelity Central Funds held as an investment as of period end, but does not include the underlying holdings of each Fidelity Central Fund. An investing fund indirectly bears its proportionate share of the expenses of the underlying Fidelity Central Funds.
Based on its investment objective, each Fidelity Central Fund may invest or participate in various investment vehicles or strategies that are similar to those of the investing fund. These strategies are consistent with the investment objectives of the investing fund and may involve certain economic risks which may cause a decline in value of each of the Fidelity Central Funds and thus a decline in the value of the investing fund.
| Fidelity Central Fund | Investment Manager | Investment Objective | Investment Practices | Expense Ratio A |
| Fidelity Money Market Central Funds | Fidelity Management & Research Company LLC (FMR) | Each fund seeks to obtain a high level of current income consistent with the preservation of capital and liquidity. | Short-term Investments | Less than .005% |
A Expenses expressed as a percentage of average net assets and are as of each underlying Central Fund's most recent annual or semi-annual shareholder report.
A complete unaudited list of holdings for each Fidelity Central Fund is available upon request or at the Securities and Exchange Commission website at www.sec.gov. In addition, the financial statements of the Fidelity Central Funds which contain the significant accounting policies (including investment valuation policies) of those funds, and are not covered by the Report of Independent Registered Public Accounting Firm, are available on the Securities and Exchange Commission website or upon request.
3. Significant Accounting Policies.
The Fund is an investment company and applies the accounting and reporting guidance of the Financial Accounting Standards Board (FASB) Accounting Standards Codification Topic 946 Financial Services - Investment Companies . The financial statements have been prepared in conformity with accounting principles generally accepted in the United States of America (GAAP), which require management to make certain estimates and assumptions at the date of the financial statements. Actual results could differ from those estimates. Subsequent events, if any, through the date that the financial statements were issued have been evaluated in the preparation of the financial statements. The Fund's Schedule of Investments lists any underlying mutual funds or exchange-traded funds (ETFs) but does not include the underlying holdings of these funds. The following summarizes the significant accounting policies of the Fund:
Investment Valuation. Investments are valued as of 4:00 p.m. Eastern time on the last calendar day of the period. The Board of Trustees (the Board) has delegated the day to day responsibility for the valuation of the Fund's investments to the Fair Value Committee (the Committee) established by the Fund's investment adviser. In accordance with valuation policies and procedures approved by the Board, the Fund attempts to obtain prices from one or more third party pricing vendors or brokers to value its investments. When current market prices, quotations or currency exchange rates are not readily available or reliable, investments will be fair valued in good faith by the Committee, in accordance with procedures adopted by the Board. Factors used in determining fair value vary by investment type and may include market or investment specific events. The frequency with which these procedures are used cannot be predicted and they may be utilized to a significant extent. The Committee oversees the Fund's valuation policies and procedures and reports to the Board on the Committee's activities and fair value determinations. The Board monitors the appropriateness of the procedures used in valuing the Fund's investments and ratifies the fair value determinations of the Committee.
The Fund categorizes the inputs to valuation techniques used to value its investments into a disclosure hierarchy consisting of three levels as shown below:
Level 1 - unadjusted quoted prices in active markets for identical investments
Level 2 - other significant observable inputs (including quoted prices for similar investments, interest rates, prepayment speeds, etc.)
Level 3 - unobservable inputs (including the Fund's own assumptions based on the best information available)
Valuation techniques used to value the Fund's investments by major category are as follows:
Equity securities, including restricted securities, for which market quotations are readily available, are valued at the last reported sale price or official closing price as reported by a third party pricing vendor on the primary market or exchange on which they are traded and are categorized as Level 1 in the hierarchy. In the event there were no sales during the day or closing prices are not available, securities are valued at the last quoted bid price or may be valued using the last available price and are generally categorized as Level 2 in the hierarchy. For foreign equity securities, when market or security specific events arise, comparisons to the valuation of American Depositary Receipts (ADRs), futures contracts, ETFs and certain indexes as well as quoted prices for similar securities may be used and would be categorized as Level 2 in the hierarchy. For equity securities, including restricted securities, where observable inputs are limited, assumptions about market activity and risk are used and these securities may be categorized as Level 3 in the hierarchy.
Investments in open-end mutual funds, including the Fidelity Central Funds, are valued at their closing net asset value (NAV) each business day and are categorized as Level 1 in the hierarchy.
Changes in valuation techniques may result in transfers in or out of an assigned level within the disclosure hierarchy. The aggregate value of investments by input level as of August 31, 2022, is included at the end of the Fund's Schedule of Investments.
Foreign Currency. Certain Funds may use foreign currency contracts to facilitate transactions in foreign-denominated securities. Gains and losses from these transactions may arise from changes in the value of the foreign currency or if the counterparties do not perform under the contracts' terms.
Foreign-denominated assets, including investment securities, and liabilities are translated into U.S. dollars at the exchange rates at period end. Purchases and sales of investment securities, income and dividends received, and expenses denominated in foreign currencies are translated into U.S. dollars at the exchange rate in effect on the transaction date.
The effects of exchange rate fluctuations on investments are included with the net realized and unrealized gain (loss) on investment securities. Other foreign currency transactions resulting in realized and unrealized gain (loss) are disclosed separately.
Investment Transactions and Income. For financial reporting purposes, the Fund's investment holdings and NAV include trades executed through the end of the last business day of the period. The NAV per share for processing shareholder transactions is calculated as of the close of business of the New York Stock Exchange (NYSE), normally 4:00 p.m. Eastern time and includes trades executed through the end of the prior business day. Gains and losses on securities sold are determined on the basis of identified cost and include proceeds received from litigation. Commissions paid to certain brokers with whom the investment adviser, or its affiliates, places trades on behalf of a fund include an amount in addition to trade execution, which may be rebated back to a fund. Any such rebates are included in net realized gain (loss) on investments in the Statement of Operations. Dividend income is recorded on the ex-dividend date, except for certain dividends from foreign securities where the ex-dividend date may have passed, which are recorded as soon as the Fund is informed of the ex-dividend date. Non-cash dividends included in dividend income, if any, are recorded at the fair market value of the securities received. Income and capital gain distributions from Fidelity Central Funds, if any, are recorded on the ex-dividend date. Certain distributions received by the Fund represent a return of capital or capital gain. The Fund determines the components of these distributions subsequent to the ex-dividend date, based upon receipt of tax filings or other correspondence relating to the underlying investment. These distributions are recorded as a reduction of cost of investments and/or as a realized gain. Investment income is recorded net of foreign taxes withheld where recovery of such taxes is uncertain. Funds may file withholding tax reclaims in certain jurisdictions to recover a portion of amounts previously withheld. Any withholding tax reclaims income is included in the Statement of Operations in dividends. Any receivables for withholding tax reclaims are included in the Statement of Assets and Liabilities in dividends receivable.
Expenses. Expenses directly attributable to a fund are charged to that fund. Expenses attributable to more than one fund are allocated among the respective funds on the basis of relative net assets or other appropriate methods. Expenses included in the accompanying financial statements reflect the expenses of that fund and do not include any expenses associated with any underlying mutual funds or exchange-traded funds. Although not included in a fund's expenses, a fund indirectly bears its proportionate share of these expenses through the net asset value of each underlying mutual fund or exchange-traded fund. Expense estimates are accrued in the period to which they relate and adjustments are made when actual amounts are known.
Deferred Trustee Compensation. Under a Deferred Compensation Plan (the Plan) for certain Funds, certain independent Trustees have elected to defer receipt of a portion of their annual compensation. Deferred amounts are invested in affiliated mutual funds, are marked-to-market and remain in a fund until distributed in accordance with the Plan. The investment of deferred amounts and the offsetting payable to the Trustees presented below are included in the accompanying Statement of Assets and Liabilities in other receivables and other payables and accrued expenses, as applicable.
Income Tax Information and Distributions to Shareholders. Each year, the Fund intends to qualify as a regulated investment company under Subchapter M of the Internal Revenue Code, including distributing substantially all of its taxable income and realized gains. As a result, no provision for U.S. Federal income taxes is required. The Fund files a U.S. federal tax return, in addition to state and local tax returns as required. The Fund's federal income tax returns are subject to examination by the Internal Revenue Service (IRS) for a period of three fiscal years after they are filed. State and local tax returns may be subject to examination for an additional fiscal year depending on the jurisdiction. Foreign taxes are provided for based on the Fund's understanding of the tax rules and rates that exist in the foreign markets in which it invests.
Distributions are declared and recorded on the ex-dividend date. Income and capital gain distributions are determined in accordance with income tax regulations, which may differ from GAAP.
Capital accounts within the financial statements are adjusted for permanent book-tax differences. These adjustments have no impact on net assets or the results of operations. Capital accounts are not adjusted for temporary book-tax differences which will reverse in a subsequent period.
Book-tax differences are primarily due to foreign currency transactions, partnerships, deferred trustees compensation, capital loss carryforwards and losses deferred due to wash sales.
As of period end, the cost and unrealized appreciation (depreciation) in securities, and derivatives if applicable, for federal income tax purposes were as follows:
| Gross unrealized appreciation | $1,083,746,137 |
| Gross unrealized depreciation | (39,978,645) |
| Net unrealized appreciation (depreciation) | $1,043,767,492 |
| Tax cost | $1,840,231,927 |
Capital loss carryforwards are only available to offset future capital gains of the Fund to the extent provided by regulations and may be limited. The capital loss carryforward information presented below, including any applicable limitation, is estimated as of prior fiscal period end and is subject to adjustment.
| Short-term | $(433,155,172) |
| Long-term | (824,729,052) |
| Total capital loss carryforward | $(1,257,884,224) |
Due to a merger in the prior period, approximately $392,837,894 of the Fund's realized losses are subject to limitation. Due to this limitation, the Fund will only be permitted to use approximately $2,077,904 of those capital losses per year to offset gains. These realized losses were acquired from Select Natural Gas Portfolio when it merged into the Fund on November 19, 2021.
Due to a merger in the prior period, approximately $323,278,709 of the Fund's realized losses and a portion of the Fund's unrealized losses are subject to limitation. Due to this limitation, the Fund will only be permitted to use approximately $3,367,549 of those capital losses per year to offset gains. These realized and unrealized losses were acquired from Select Energy Service Portfolio when it merged into the Fund on November 19, 2021.
Restricted Securities (including Private Placements). Funds may invest in securities that are subject to legal or contractual restrictions on resale. These securities generally may be resold in transactions exempt from registration or to the public if the securities are registered. Disposal of these securities may involve time-consuming negotiations and expense, and prompt sale at an acceptable price may be difficult. Information regarding restricted securities held at period end is included at the end of the Schedule of Investments, if applicable.
4. Purchases and Sales of Investments.
Purchases and sales of securities, other than short-term securities and in-kind transactions, as applicable, are noted in the table below.
| | Purchases ($) | Sales ($) |
| Energy Portfolio | 747,070,947 | 699,067,612 |
5. Fees and Other Transactions with Affiliates.
Management Fee. Fidelity Management & Research Company LLC (the investment adviser) and its affiliates provide the Fund with investment management related services for which the Fund pays a monthly management fee. The management fee is the sum of an individual fund fee rate that is based on an annual rate of .30% of the Fund's average net assets and an annualized group fee rate that averaged .23% during the period. The group fee rate is based upon the monthly average net assets of a group of registered investment companies with which the investment adviser has management contracts. The group fee rate decreases as assets under management increase and increases as assets under management decrease. For the reporting period, the total annualized management fee rate was .53% of the Fund's average net assets.
Transfer Agent Fees. Fidelity Investments Institutional Operations Company LLC (FIIOC), an affiliate of the investment adviser, is the Fund's transfer, dividend disbursing and shareholder servicing agent. FIIOC receives account fees and asset-based fees that vary according to account size and type of account. FIIOC pays for typesetting, printing and mailing of shareholder reports, except proxy statements. For the period, the transfer agent fees were equivalent to an annualized rate of .16% of average net assets.
Accounting Fees. Fidelity Service Company, Inc. (FSC), an affiliate of the investment adviser, maintains the Fund's accounting records. The accounting fee is based on the level of average net assets for each month. For the period, the fees were equivalent to the following annualized rates:
| | % of Average Net Assets |
| Energy Portfolio | .03 |
Brokerage Commissions. A portion of portfolio transactions were placed with brokerage firms which are affiliates of the investment adviser. Brokerage commissions are included in net realized gain (loss) and change in net unrealized appreciation (depreciation) in the Statement of Operations. The commissions paid to these affiliated firms were as follows:
| | Amount |
| Energy Portfolio | $ 20,724 |
Interfund Lending Program. Pursuant to an Exemptive Order issued by the Securities and Exchange Commission (the SEC), the Fund, along with other registered investment companies having management contracts with Fidelity Management & Research Company LLC (FMR), or other affiliated entities of FMR, may participate in an interfund lending program. This program provides an alternative credit facility allowing the Fund to borrow from, or lend money to, other participating affiliated funds. At period end, there were no interfund loans outstanding. Activity in this program during the period for which loans were outstanding was as follows:
| | Borrower or Lender | Average Loan Balance | Weighted Average Interest Rate | Interest Expense |
| Energy Portfolio | Borrower | $ 11,905,244 | 1.53% | $ 39,476 |
Interfund Trades. Funds may purchase from or sell securities to other Fidelity Funds under procedures adopted by the Board. The procedures have been designed to ensure these interfund trades are executed in accordance with Rule 17a-7 of the 1940 Act. Any interfund trades are included within the respective purchases and sales amounts shown in the Purchases and Sales of Investments note.
| | Purchases ($) | Sales ($) | Realized Gain (Loss) ($) |
| Energy Portfolio | 32,992,309 | 104,465,757 | (1,608,400) |
6. Committed Line of Credit.
Certain Funds participate with other funds managed by the investment adviser or an affiliate in a $4.25 billion credit facility (the "line of credit") to be utilized for temporary or emergency purposes to fund shareholder redemptions or for other short-term liquidity purposes. The participating funds have agreed to pay commitment fees on their pro-rata portion of the line of credit, which are reflected in Miscellaneous expenses on the Statement of Operations, and are listed below. During the period, there were no borrowings on this line of credit.
| | Amount |
| Energy Portfolio | $ 2,264 |
7. Security Lending.
Funds lend portfolio securities from time to time in order to earn additional income. Lending agents are used, including National Financial Services (NFS), an affiliate of the investment adviser. Pursuant to a securities lending agreement, NFS will receive a fee, which is capped at 9.9% of a fund's daily lending revenue, for its services as lending agent. A fund may lend securities to certain qualified borrowers, including NFS. On the settlement date of the loan, a fund receives collateral (in the form of U.S. Treasury obligations, letters of credit and/or cash) against the loaned securities and maintains collateral in an amount not less than 100% of the market value of the loaned securities during the period of the loan. The market value of the loaned securities is determined at the close of business of a fund and any additional required collateral is delivered to a fund on the next business day. A fund or borrower may terminate the loan at any time, and if the borrower defaults on its obligation to return the securities loaned because of insolvency or other reasons, a fund may apply collateral received from the borrower against the obligation. A fund may experience delays and costs in recovering the securities loaned. Any cash collateral received is invested in the Fidelity Securities Lending Cash Central Fund. Any loaned securities are identified as such in the Schedule of Investments, and the value of loaned securities and cash collateral at period end, as applicable, are presented in the Statement of Assets and Liabilities. Security lending income represents the income earned on investing cash collateral, less rebates paid to borrowers and any lending agent fees associated with the loan, plus any premium payments received for lending certain types of securities. Security lending income is presented in the Statement of Operations as a component of income from Fidelity Central Funds. Affiliated security lending activity, if any, was as follows:
| | Total Security Lending Fees Paid to NFS | Security Lending Income From Securities Loaned to NFS | Value of Securities Loaned to NFS at Period End |
| Energy Portfolio | $ 8,444 | $ - | $- |
8. Bank Borrowings.
The Fund is permitted to have bank borrowings for temporary or emergency purposes to fund shareholder redemptions or for other short-term liquidity requirements. The Fund has established borrowing arrangements with certain banks. The interest rate on the borrowings is the bank's base rate, as revised from time to time. Any open loans, including accrued interest, at period end are presented under the caption "Notes payable" in the Statement of Assets and Liabilities, if applicable. Activity in this program during the period for which loans were outstanding was as follows:
| | Average Loan Balance | Weighted Average Interest Rate | Interest Expense |
| Energy Portfolio | $ 6,501,250 | 1.92% | $ 1,390 |
9. Expense Reductions.
During the period the investment adviser or an affiliate reimbursed and/or waived a portion of operating expenses in the amount of $45,606.
10. Other.
A fund's organizational documents provide former and current trustees and officers with a limited indemnification against liabilities arising in connection with the performance of their duties to the fund. In the normal course of business, a fund may also enter into contracts that provide general indemnifications. A fund's maximum exposure under these arrangements is unknown as this would be dependent on future claims that may be made against a fund. The risk of material loss from such claims is considered remote.
11. Risk and Uncertainties.
Many factors affect a fund's performance. Developments that disrupt global economies and financial markets, such as pandemics, epidemics, outbreaks of infectious diseases, war, terrorism, and environmental disasters, may significantly affect a fund's investment performance. The effects of these developments to a fund will be impacted by the types of securities in which a fund invests, the financial condition, industry, economic sector, and geographic location of an issuer, and a fund's level of investment in the securities of that issuer.
12. Prior Fiscal Year Merger Information.
On November 19, 2021, the Fund acquired all of the assets and assumed all of the liabilities of each Target Fund listed in the below table pursuant to an Agreement and Plan of Reorganization approved by the Board of Trustees ("The Board"). The securities held by each Target Fund were the primary assets acquired by the Fund. The acquisition was accomplished by an exchange of shares of the Fund for shares then outstanding of each Target Fund at their respective net asset value on the acquisition date. The reorganization provides shareholders of each Target Fund access to a larger portfolio with a similar investment objective and lower projected expenses. For financial reporting purposes, the assets and liabilities of each Target Fund and shares issued by the Fund were recorded at fair value; however, the cost basis of the investments received from each Target Fund were carried forward and will be utilized for purposes of the Fund's ongoing reporting of realized and unrealized gains and losses to more closely align subsequent reporting of realized gains with amounts distributable to shareholders for tax purposes. The reorganization qualified as a tax-free reorganization for federal income tax purposes with no gain or loss recognized to the funds or their shareholders.
| Target Fund | Investments $ | Unrealized appreciation (depreciation) $ | Net Assets $ | Shares Exchanged | Shares Exchanged Ratio |
| Energy Service Portfolio | 239,225,585 | (29,042,821) | 240,539,236 | 6,902,147 | .5578794835 |
| Natural Gas Portfolio | 148,458,051 | 3,907,464 | 148,421,708 | 4,258,862 | .4453142037 |
| Surviving Fund | Net Assets $ | Total net assets after the acquisition $ |
| Energy Portfolio | 1,269,646,810 | 1,658,607,754 |
Pro forma results of operations of the combined entity for the entire period ended February 28, 2022, as though the acquisition had occurred as of the beginning of the year (rather than on the actual acquisition date), are as follows:
| Net investment income (loss) | $41,213,855 |
| Total net realized gain (loss) | 31,547,962 |
| Total change in net unrealized appreciation (depreciation) | 637,928,213 |
| Net increase (decrease) in net assets resulting from operations | $710,690,030 |
Because the combined investment portfolios have been managed as a single portfolio since the acquisitions were completed, it is not practicable to separate the amounts of revenue and earnings of the acquired funds that have been included in the Fund's Statement of Operations since November 19, 2021.
As a shareholder, you incur two types of costs: (1) transaction costs, which may include sales charges (loads) on purchase payments or redemption proceeds, as applicable and (2) ongoing costs, which generally include management fees, distribution and/or service (12b-1) fees and other Fund expenses. This Example is intended to help you understand your ongoing costs (in dollars) of investing in a fund and to compare these costs with the ongoing costs of investing in other mutual funds.
| The Example is based on an investment of $1,000 invested at the beginning of the period and held for the entire period (March 1, 2022 to August 31, 2022). |
Actual Expenses
The first line of the accompanying table provides information about actual account values and actual expenses. You may use the information in this line, together with the amount you invested, to estimate the expenses that you paid over the period. Simply divide your account value by $1,000.00 (for example, an $8,600 account value divided by $1,000.00 = 8.6), then multiply the result by the number in the first line for a class/Fund under the heading entitled "Expenses Paid During Period" to estimate the expenses you paid on your account during this period. If any fund is a shareholder of any underlying mutual funds or exchange-traded funds (ETFs) (the Underlying Funds), such fund indirectly bears its proportional share of the expenses of the Underlying Funds in addition to the direct expenses incurred presented in the table. These fees and expenses are not included in the annualized expense ratio used to calculate the expense estimate in the table below.
Hypothetical Example for Comparison Purposes
The second line of the accompanying table provides information about hypothetical account values and hypothetical expenses based on the actual expense ratio and an assumed rate of return of 5% per year before expenses, which is not the actual return. The hypothetical account values and expenses may not be used to estimate the actual ending account balance or expenses you paid for the period. You may use this information to compare the ongoing costs of investing in the Fund and other funds. To do so, compare this 5% hypothetical example with the 5% hypothetical examples that appear in the shareholder reports of the other funds. If any fund is a shareholder of any Underlying Funds, such fund indirectly bears its proportional share of the expenses of the Underlying Funds in addition to the direct expenses as presented in the table. These fees and expenses are not included in the annualized expense ratio used to calculate the expense estimate in the table below.
Please note that the expenses shown in the table are meant to highlight your ongoing costs only and do not reflect any transaction costs. Therefore, the second line of the table is useful in comparing ongoing costs only, and will not help you determine the relative total costs of owning different funds. In addition, if these transactional costs were included, your costs would have been higher.
| | | | | Annualized Expense Ratio- A | | Beginning Account Value March 1, 2022 | | Ending Account Value August 31, 2022 | | Expenses Paid During Period- C March 1, 2022 to August 31, 2022 |
| | | | | | | | | | |
| Energy Portfolio | | | | .73% | | | | | | |
| Actual | | | | | | $ 1,000 | | $ 1,173.00 | | $ 4.00 |
Hypothetical- B | | | | | | $ 1,000 | | $ 1,021.53 | | $ 3.72 |
| |
A Annualized expense ratio reflects expenses net of applicable fee waivers.
B 5% return per year before expenses
C Expenses are equal to the annualized expense ratio, multiplied by the average account value over the period, multiplied by 184/ 365 (to reflect the one-half year period). The fees and expenses of any Underlying Funds are not included in each annualized expense ratio.
Energy Portfolio
Each year, the Board of Trustees, including the Independent Trustees (together, the Board), votes on the renewal of the management contract with Fidelity Management & Research Company LLC (FMR) and the sub-advisory agreements (together, the Advisory Contracts) for the fund. FMR and the sub-advisers are referred to herein as the Investment Advisers. The Board, assisted by the advice of fund counsel and Independent Trustees' counsel, requests and considers a broad range of information relevant to the renewal of the Advisory Contracts throughout the year.
The Board meets regularly and, at each of its meetings, covers an extensive agenda of topics and materials and considers factors that are relevant to its annual consideration of the renewal of the fund's Advisory Contracts, including the services and support provided to the fund and its shareholders. The Board has established various standing committees (Committees), each composed of and chaired by Independent Trustees with varying backgrounds, to which the Board has assigned specific subject matter responsibilities in order to enhance effective decision-making by the Board. The Board, acting directly and through its Committees, requests and receives information concerning the annual consideration of the renewal of the fund's Advisory Contracts. The Board also meets as needed to review matters specifically related to the Board's annual consideration of the renewal of the Advisory Contracts. Members of the Board may also meet with trustees of other Fidelity funds through joint ad hoc committees to discuss certain matters relevant to all of the Fidelity funds.
At its May 2022 meeting, the Board unanimously determined to renew the fund's Advisory Contracts. In reaching its determination, the Board considered all factors it believed relevant, including (i) the nature, extent, and quality of the services provided to the fund and its shareholders (including the investment performance of the fund); (ii) the competitiveness relative to peer funds of the fund's management fee and total expense ratio; (iii) the total costs of the services provided by and the profits realized by Fidelity from its relationships with the fund; and (iv) the extent to which, if any, economies of scale exist and are realized as the fund grows, and whether any economies of scale are appropriately shared with fund shareholders.
In considering whether to renew the Advisory Contracts for the fund, the Board reached a determination, with the assistance of fund counsel and Independent Trustees' counsel and through the exercise of its business judgment, that the renewal of the Advisory Contracts was in the best interests of the fund and its shareholders and that the compensation payable under the Advisory Contracts was fair and reasonable. The Board's decision to renew the Advisory Contracts was not based on any single factor, but rather was based on a comprehensive consideration of all the information provided to the Board at its meetings throughout the year. The Board, in reaching its determination to renew the Advisory Contracts, was aware that shareholders of the fund have a broad range of investment choices available to them, including a wide choice among funds offered by Fidelity's competitors, and that the fund's shareholders, who have the opportunity to review and weigh the disclosure provided by the fund in its prospectus and other public disclosures, have chosen to invest in this fund, which is part of the Fidelity family of funds.
Nature, Extent, and Quality of Services Provided. The Board considered Fidelity's staffing as it relates to the fund, including the backgrounds of investment personnel of Fidelity, and also considered the fund's investment objective, strategies, and related investment philosophy. The Independent Trustees also had discussions with senior management of Fidelity's investment operations and investment groups. The Board considered the structure of the investment personnel compensation program and whether this structure provides appropriate incentives to act in the best interests of the fund. Additionally, the Board considered the portfolio managers' investments, if any, in the funds that they manage. The Board also considered the steps Fidelity had taken to ensure the continued provision of high quality services to the Fidelity funds during the COVID-19 pandemic, including the expansion of staff in client facing positions to maintain service levels in periods of high volumes and volatility.
Resources Dedicated to Investment Management and Support Services . The Board and the Fund Oversight and Research Committees reviewed the general qualifications and capabilities of Fidelity's investment staff, including its size, education, experience, and resources, as well as Fidelity's approach to recruiting, training, managing, and compensating investment personnel. The Board noted the resources devoted to expansion of Fidelity's global investment organization, and that Fidelity's analysts have extensive resources, tools, and capabilities that allow them to conduct sophisticated quantitative and fundamental analysis, as well as credit analysis of issuers, counterparties, and guarantors. Further, the Board considered that Fidelity's investment professionals have sufficient access to global information and data so as to provide competitive investment results over time, and that those professionals also have access to sophisticated tools that permit them to assess portfolio construction and risk and performance attribution characteristics continuously, as well as to transmit new information and research conclusions rapidly around the world. Additionally, in its deliberations, the Board considered Fidelity's trading, risk management, compliance, and technology and operations capabilities and resources, which are integral parts of the investment management process.
Shareholder and Administrative Services . The Board considered (i) the nature, extent, quality, and cost of advisory, administrative, and shareholder services performed by the Investment Advisers and their affiliates under the Advisory Contracts and under separate agreements covering transfer agency, pricing and bookkeeping, and securities lending services for the fund; (ii) the nature and extent of the supervision of third party service providers, principally custodians, subcustodians, and pricing vendors; and (iii) the resources devoted to, and the record of compliance with, the fund's compliance policies and procedures. The Board also reviewed the allocation of fund brokerage, including allocations to brokers affiliated with the Investment Advisers, the use of brokerage commissions to pay fund expenses, and the use of "soft" commission dollars to pay for research services.
The Board noted that the growth of fund assets over time across the complex allows Fidelity to reinvest in the development of services designed to enhance the value and convenience of the Fidelity funds as investment vehicles. These services include 24-hour access to account information and market information over the Internet and through telephone representatives, investor education materials, and asset allocation tools. The Board also considered that it reviews customer service metrics such as telephone response times, continuity of services on the website and metrics addressing services at Fidelity Investor Centers.
Investment in a Large Fund Family . The Board considered the benefits to shareholders of investing in a Fidelity fund, including the benefits of investing in a fund that is part of a large family of funds offering a variety of investment disciplines and providing a large variety of mutual fund investor services. The Board noted that Fidelity had taken, or had made recommendations that resulted in the Fidelity funds taking, a number of actions over the previous year that benefited particular funds, including: (i) continuing to dedicate additional resources to Fidelity's investment research process, which includes meetings with management of issuers of securities in which the funds invest; (ii) continuing efforts to enhance Fidelity's global research capabilities; (iii) launching new funds and ETFs with innovative structures, strategies and pricing and making other enhancements to meet client needs; (iv) launching new share classes of existing funds; (v) eliminating purchase minimums and broadening eligibility requirements for certain funds and share classes; (vi) reducing management fees and total expenses for certain target date funds and classes and index funds; (vii) lowering expenses for certain existing funds and classes by implementing or lowering expense caps; (viii) rationalizing product lines and gaining increased efficiencies from fund mergers and liquidations; (ix) continuing to develop, acquire and implement systems and technology to improve services to the funds and shareholders, strengthen information security, and increase efficiency; and (x) continuing to implement enhancements to further strengthen Fidelity's product line to increase investors' probability of success in achieving their investment goals, including retirement income goals.
Investment Performance . The Board considered whether the fund has operated in accordance with its investment objective, as well as its record of compliance with its investment restrictions and its performance history. The Board noted that the fund had a portfolio manager change in January 2020. The Board will continue to monitor closely the fund's performance, taking into account the portfolio manager change.
The Board took into account discussions that occur at Board meetings throughout the year with representatives of the Investment Advisers about fund investment performance. In this regard the Board noted that as part of regularly scheduled fund reviews and other reports to the Board on fund performance, the Board considers annualized return information for the fund for different time periods, measured against an appropriate securities market index (benchmark index). The Board also reviews and considers information about performance attribution. In its evaluation of fund investment performance, the Board gave particular attention to information indicating changes in performance of certain Fidelity funds for specific time periods and discussed with the Investment Advisers the reasons for any overperformance or underperformance.
In addition to reviewing absolute and relative fund performance, the Independent Trustees periodically consider the appropriateness of fund performance metrics in evaluating the results achieved. In general, the Independent Trustees believe that fund performance should be evaluated based on net performance (after fees and expenses) of the fund compared to appropriate benchmark indices, over appropriate time periods that may include full market cycles, taking into account relevant factors including the following: general market conditions; issuer-specific information; and fund cash flows and other factors.
The Independent Trustees recognize that shareholders evaluate performance on a net basis over their own holding periods, for which one-, three-, and five-year periods are often used as a proxy. For this reason, the performance information reviewed by the Board also included net cumulative total return information for the fund and an appropriate benchmark index for the most recent one-, three-, and five-year periods ended September 30, 2021, as shown below.
Energy Portfolio
The Board considered the fund's underperformance for different time periods ended September 30, 2021 (which periods are reflected in the chart above). The Board's discussions with FMR regarding underperformance cover topics including, but not limited to: the longer-term track record of a fund's portfolio manager(s); broader trends in the market that may adversely impact a fund's performance; attribution reports on contributors to the fund's underperformance; and the applicable portfolio manager's explanation of his or her underperformance. The Board engages with FMR on steps that might be taken to address a fund's underperformance.
Based on its review, the Board concluded that the nature, extent, and quality of services provided to the fund under the Advisory Contracts should continue to benefit the shareholders of the fund.
Competitiveness of Management Fee and Total Expense Ratio. The Board considered the fund's management fee and total expense ratio compared to "mapped groups" of competitive funds and classes created for the purpose of facilitating the Trustees' competitive analysis of management fees and total expenses. Fidelity creates "mapped groups" by combining similar Lipper investment objective categories that have comparable investment mandates. For this purpose, all sector focused equity funds are grouped in the same mapped group. Combining Lipper investment objective categories aids the Board's management fee and total expense ratio comparisons by broadening the competitive group used for comparison.
Management Fee . The Board considered two proprietary management fee comparisons for the 12-month periods ended September 30 (June 30 for periods ended 2019 and 2018 and December 31 for periods prior to 2018) shown in basis points (BP) in the chart below. The group of Lipper funds used by the Board for management fee comparisons is referred to below as the "Total Mapped Group." The Total Mapped Group comparison focuses on a fund's standing in terms of gross management fees before expense reimbursements or caps relative to the total universe of funds with comparable investment mandates (i.e., sector equities), regardless of whether their management fee structures also are comparable. Funds with comparable management fee structures have similar management fee contractual arrangements (e.g., flat rate charged for advisory services, all-inclusive fee rate, etc.). "TMG %" represents the percentage of funds in the Total Mapped Group that had management fees that were lower than the fund's. For example, a hypothetical TMG % of 20% would mean that 80% of the funds in the Total Mapped Group had higher, and 20% had lower, management fees than the fund. The fund's actual TMG %s and the number of funds in the Total Mapped Group are in the chart below. The "Asset-Sized Peer Group" (ASPG) comparison focuses on a fund's standing relative to a subset of non-Fidelity funds within the Total Mapped Group that are similar in size and management fee structure. For example, if a fund is in the first quartile of the ASPG, the fund's management fee ranks in the least expensive or lowest 25% of funds in the ASPG. The ASPG represents at least 15% of the funds in the Total Mapped Group with comparable asset size and management fee structures, subject to a minimum of 50 funds (or all funds in the Total Mapped Group if fewer than 50). Additional information, such as the ASPG quartile in which the fund's management fee rate ranked, is also included in the chart and was considered by the Board.
Energy Portfolio
The Board noted that the fund's management fee rate ranked below the median of its Total Mapped Group and below the median of its ASPG for the 12-month period ended September 30, 2021.
The Board also considered that, for funds subject to the group fee, FMR agreed to voluntarily waive fees over a specified period of time in amounts designed to account for assets converted from certain funds to certain collective investment trusts.
Based on its review, the Board concluded that the fund's management fee is fair and reasonable in light of the services that the fund receives and the other factors considered.
Total Expense Ratio . In its review of the fund's total expense ratio, the Board considered the fund's management fee rate as well as other fund expenses, such as transfer agent fees, pricing and bookkeeping fees, and custodial, legal, and audit fees. The Board also noted that Fidelity may agree to waive fees or reimburse expenses from time to time, and the extent to which, if any, it has done so for the fund. The fund is compared to those funds and classes in the Total Mapped Group (used by the Board for management fee comparisons) that have a similar sales load structure. The Board also considered a total expense ASPG comparison for the fund, which focuses on the total expenses of the fund relative to a subset of non-Fidelity funds within the total expense similar sales load structure group. The total expense ASPG is limited to 15 larger and 15 smaller classes in fund average assets for a total of 30 classes, where possible. The total expense ASPG comparison excludes performance adjustments and fund-paid 12b-1 fees to eliminate variability in fee structures.
The Board noted that the fund's total net expense ratio ranked below the similar sales load structure group competitive median and below the ASPG competitive median for the 12-month period ended September 30, 2021.
Fees Charged to Other Fidelity Clients . The Board also considered Fidelity fee structures and other information with respect to clients of Fidelity, such as other funds advised or subadvised by Fidelity, pension plan clients, and other institutional clients with similar mandates. The Board noted that a joint ad hoc committee created by it and the boards of other Fidelity funds periodically reviews and compares Fidelity's institutional investment advisory business with its business of providing services to the Fidelity funds and also noted the most recent findings of the committee. The Board noted that the committee's review included a consideration of the differences in services provided, fees charged, and costs incurred, as well as competition in the markets serving the different categories of clients.
Based on its review of total expense ratios and fees charged to other Fidelity clients, the Board concluded that the fund's total expense ratio was reasonable in light of the services that the fund and its shareholders receive and the other factors considered.
Costs of the Services and Profitability. The Board considered the revenues earned and the expenses incurred by Fidelity in conducting the business of developing, marketing, distributing, managing, administering and servicing the fund and servicing the fund's shareholders. The Board also considered the level of Fidelity's profits in respect of all the Fidelity funds.
On an annual basis, Fidelity presents to the Board information about the profitability of its relationships with the fund. Fidelity calculates profitability information for each fund, as well as aggregate profitability information for groups of Fidelity funds and all Fidelity funds, using a series of detailed revenue and cost allocation methodologies which originate with the books and records of Fidelity on which Fidelity's audited financial statements are based. The Audit Committee of the Board reviews any significant changes from the prior year's methodologies and the full Board approves such changes.
A public accounting firm has been engaged annually by the Board as part of the Board's assessment of Fidelity's profitability analysis. The engagement includes the review and assessment of the methodologies used by Fidelity in determining the revenues and expenses attributable to Fidelity's mutual fund business, and completion of agreed-upon procedures in respect of the mathematical accuracy of certain fund profitability information and its conformity to established allocation methodologies. After considering the reports issued under the engagement and information provided by Fidelity, the Board concluded that while other allocation methods may also be reasonable, Fidelity's profitability methodologies are reasonable in all material respects.
The Board also reviewed Fidelity's non-fund businesses and potential indirect benefits such businesses may have received as a result of their association with Fidelity's mutual fund business (i.e., fall-out benefits) as well as cases where Fidelity's affiliates may benefit from the funds' business. The Board considered areas where potential indirect benefits to the Fidelity funds from their relationships with Fidelity may exist. The Board's consideration of these matters was informed by the findings of a joint ad hoc committee created by it and the boards of other Fidelity funds to evaluate potential fall-out benefits.
The Board considered the costs of the services provided by and the profits realized by Fidelity in connection with the operation of the fund and was satisfied that the profitability was not excessive.
Economies of Scale. The Board considered whether there have been economies of scale in respect of the management of the Fidelity funds, whether the Fidelity funds (including the fund) have appropriately benefited from any such economies of scale, and whether there is potential for realization of any further economies of scale. The Board considered the extent to which the fund will benefit from economies of scale as assets grow through increased services to the fund, through waivers or reimbursements, or through fee or expense ratio reductions. The Board also noted that a committee (the Economies of Scale Committee) created by it and the boards of other Fidelity funds periodically analyzes whether Fidelity attains economies of scale in respect of the management and servicing of the Fidelity funds, whether the Fidelity funds have appropriately benefited from such economies of scale, and whether there is potential for realization of any further economies of scale.
The Board recognized that the fund's management contract incorporates a "group fee" structure, which provides for lower group fee rates as total "group assets" increase, and for higher group fee rates as total "group assets" decrease ("group assets" as defined in the management contract). FMR calculates the group fee rates based on a tiered asset "breakpoint" schedule that varies based on asset class. The Board considered that the group fee is designed to deliver the benefits of economies of scale to fund shareholders when total Fidelity fund assets increase, even if assets of any particular fund are unchanged or have declined, because some portion of Fidelity's costs are attributable to services provided to all Fidelity funds, and all funds benefit if those costs can be allocated among more assets. The Board further considered that Fidelity agreed to impose a temporary fee waiver in the form of additional breakpoints to the current breakpoint schedule. The Board concluded that, given the group fee structure, fund shareholders will benefit from lower management fees as "group assets" increase at the fund complex level, regardless of whether Fidelity achieves any such economies of scale.
The Board concluded, taking into account the analysis of the Economies of Scale Committee, that economies of scale, if any, are being appropriately shared between fund shareholders and Fidelity.
Additional Information Requested by the Board. In order to develop fully the factual basis for consideration of the Fidelity funds' advisory contracts, the Board requested and received additional information on certain topics, including: (i) fund flow and performance trends, in particular the underperformance of certain funds and strategies, and Fidelity's long-term strategies for certain funds, including any consideration of fund liquidations or mergers; (ii) the operation of performance fees, competitor use of performance fees, and consideration of the expansion of performance fees to additional funds; (iii) Fidelity's pricing philosophy compared to competitors; (iv) fund profitability methodology and data; (v) evaluation of competitive fund data and peer group classifications and fee and expense comparisons; (vi) the management fee and expense structures for different funds and classes and information about the differences between various fee and expense structures; (vii) group fee breakpoints and related voluntary fee waivers; and (viii) information regarding other accounts managed by Fidelity and the funds' sub-advisory arrangements.
Based on its evaluation of all of the conclusions noted above, and after considering all factors it believed relevant, the Board concluded that the advisory fee arrangements are fair and reasonable, and that the fund's Advisory Contracts should be renewed.
1.813654.117
SELNR-SANN-1022
Fidelity® Select Portfolios®
Consumer Staples Sector
Consumer Staples Portfolio
Semi-Annual Report
August 31, 2022
Includes Fidelity and Fidelity Advisor share classes
Contents
To view a fund's proxy voting guidelines and proxy voting record for the 12-month period ended June 30, visit http://www.fidelity.com/proxyvotingresults or visit the Securities and Exchange Commission's (SEC) web site at http://www.sec.gov.
You may also call 1-800-544-8544 if you're an individual investing directly with Fidelity, call 1-800-835-5092 if you're a plan sponsor or participant with Fidelity as your recordkeeper or call 1-877-208-0098 on institutional accounts or if you're an advisor or invest through one to request a free copy of the proxy voting guidelines.
Standard & Poor's, S&P and S&P 500 are registered service marks of The McGraw-Hill Companies, Inc. and have been licensed for use by Fidelity Distributors Corporation.
Other third-party marks appearing herein are the property of their respective owners.
All other marks appearing herein are registered or unregistered trademarks or service marks of FMR LLC or an affiliated company. © 2022 FMR LLC. All rights reserved.
This report and the financial statements contained herein are submitted for the general information of the shareholders of the Fund. This report is not authorized for distribution to prospective investors in the Fund unless preceded or accompanied by an effective prospectus.
A fund files its complete schedule of portfolio holdings with the SEC for the first and third quarters of each fiscal year on Form N-PORT. Forms N-PORT are available on the SEC's web site at http://www.sec.gov. A fund's Forms N-PORT may be reviewed and copied at the SEC's Public Reference Room in Washington, DC. Information regarding the operation of the SEC's Public Reference Room may be obtained by calling 1-800-SEC-0330.
For a complete list of a fund's portfolio holdings, view the most recent holdings listing, semiannual report, or annual report on Fidelity's web site at http://www.fidelity.com, http://www.institutional.fidelity.com, or http://www.401k.com, as applicable.
NOT FDIC INSURED •MAY LOSE VALUE •NO BANK GUARANTEE
Neither the Fund nor Fidelity Distributors Corporation is a bank.
Top Holdings (% of Fund's net assets) |
| |
| The Coca-Cola Co. | 15.3 | |
| Procter & Gamble Co. | 14.1 | |
| Walmart, Inc. | 8.0 | |
| Mondelez International, Inc. | 5.6 | |
| Philip Morris International, Inc. | 4.3 | |
| Monster Beverage Corp. | 4.3 | |
| Altria Group, Inc. | 3.8 | |
| Boston Beer Co., Inc. Class A | 3.5 | |
| Constellation Brands, Inc. Class A (sub. vtg.) | 3.4 | |
| Keurig Dr. Pepper, Inc. | 3.2 | |
| | 65.5 | |
| |
| Industries (% of Fund's net assets) |
| |
| Beverages | 33.6 | |
| Household Products | 21.5 | |
| Food Products | 17.5 | |
| Food & Staples Retailing | 12.8 | |
| Tobacco | 8.3 | |
| Personal Products | 4.7 | |
| Media | 0.8 | |
| Household Durables | 0.4 | |
| Hotels, Restaurants & Leisure | 0.0 | |
| |
Percentages shown as 0.0% may reflect amounts less than 0.05%.
Showing Percentage of Net Assets
| Common Stocks - 99.6% |
| | | Shares | Value ($) |
| Beverages - 33.6% | | | |
| Brewers - 3.8% | | | |
| Boston Beer Co., Inc. Class A (a)(b) | | 159,900 | 53,899,092 |
| Molson Coors Beverage Co. Class B | | 98,300 | 5,079,161 |
| | | | 58,978,253 |
| Distillers & Vintners - 3.8% | | | |
| Constellation Brands, Inc. Class A (sub. vtg.) | | 215,584 | 53,044,443 |
| Diageo PLC | | 151,993 | 6,603,548 |
| | | | 59,647,991 |
| Soft Drinks - 26.0% | | | |
| Celsius Holdings, Inc. (a) | | 15,000 | 1,552,350 |
| Keurig Dr. Pepper, Inc. | | 1,303,327 | 49,682,825 |
| Monster Beverage Corp. (a) | | 758,313 | 67,360,944 |
| PepsiCo, Inc. | | 258,004 | 44,446,349 |
| Primo Water Corp. | | 394,200 | 5,179,788 |
| The Coca-Cola Co. | | 3,866,818 | 238,621,339 |
| The Vita Coco Co., Inc. | | 8,800 | 131,912 |
| | | | 406,975,507 |
TOTAL BEVERAGES | | | 525,601,751 |
| Food & Staples Retailing - 12.8% | | | |
| Drug Retail - 0.1% | | | |
| Walgreens Boots Alliance, Inc. | | 59,100 | 2,072,046 |
| Food Distributors - 3.8% | | | |
| Performance Food Group Co. (a) | | 282,000 | 14,094,360 |
| Sysco Corp. | | 118,656 | 9,755,896 |
| U.S. Foods Holding Corp. (a) | | 1,176,674 | 36,029,758 |
| | | | 59,880,014 |
| Food Retail - 0.8% | | | |
| Albertsons Companies, Inc. | | 254,100 | 6,990,291 |
| Alimentation Couche-Tard, Inc. Class A (multi-vtg.) | | 14,400 | 618,827 |
| Grocery Outlet Holding Corp. (a) | | 75,450 | 3,027,054 |
| Sprouts Farmers Market LLC (a) | | 35,000 | 1,011,500 |
| | | | 11,647,672 |
| Hypermarkets & Super Centers - 8.1% | | | |
| BJ's Wholesale Club Holdings, Inc. (a) | | 24,900 | 1,854,801 |
| Walmart, Inc. | | 944,600 | 125,206,730 |
| | | | 127,061,531 |
TOTAL FOOD & STAPLES RETAILING | | | 200,661,263 |
| Food Products - 17.5% | | | |
| Agricultural Products - 3.6% | | | |
| Archer Daniels Midland Co. | | 86,000 | 7,558,540 |
| Bunge Ltd. | | 320,893 | 31,822,959 |
| Darling Ingredients, Inc. (a) | | 214,500 | 16,314,870 |
| Ingredion, Inc. | | 12,900 | 1,123,203 |
| | | | 56,819,572 |
| Packaged Foods & Meats - 13.9% | | | |
| Conagra Brands, Inc. | | 384,841 | 13,230,834 |
| Freshpet, Inc. (a)(b) | | 355,800 | 15,487,974 |
| Laird Superfood, Inc. (a) | | 220,582 | 555,867 |
| Lamb Weston Holdings, Inc. | | 498,327 | 39,631,946 |
| McCormick & Co., Inc. (non-vtg.) | | 39,000 | 3,278,730 |
| Mondelez International, Inc. | | 1,421,097 | 87,909,060 |
| Nomad Foods Ltd. (a) | | 505,759 | 8,946,877 |
| Pilgrim's Pride Corp. (a) | | 32,200 | 916,734 |
| Sovos Brands, Inc. | | 6,398 | 97,697 |
| The Hain Celestial Group, Inc. (a) | | 148,200 | 3,002,532 |
| The Real Good Food Co. LLC: | | | |
| Class B (c) | | 58,667 | 1 |
| Class B unit (d) | | 58,667 | 418,296 |
| The Simply Good Foods Co. (a) | | 104,100 | 3,180,255 |
| TreeHouse Foods, Inc. (a) | | 546,685 | 25,475,521 |
| Tyson Foods, Inc. Class A | | 203,666 | 15,352,343 |
| | | | 217,484,667 |
TOTAL FOOD PRODUCTS | | | 274,304,239 |
| Hotels, Restaurants & Leisure - 0.0% | | | |
| Restaurants - 0.0% | | | |
| Compass Group PLC | | 4 | 86 |
| Household Durables - 0.4% | | | |
| Household Appliances - 0.2% | | | |
| Helen of Troy Ltd. (a) | | 29,500 | 3,647,085 |
| Housewares & Specialties - 0.2% | | | |
| Tupperware Brands Corp. (a)(b) | | 276,662 | 3,109,681 |
TOTAL HOUSEHOLD DURABLES | | | 6,756,766 |
| Household Products - 21.5% | | | |
| Household Products - 21.5% | | | |
| Energizer Holdings, Inc. | | 711,344 | 19,988,766 |
| Kimberly-Clark Corp. | | 329,933 | 42,073,056 |
| Procter & Gamble Co. | | 1,594,882 | 219,998,023 |
| Reynolds Consumer Products, Inc. (b) | | 845,454 | 23,613,530 |
| Spectrum Brands Holdings, Inc. | | 224,300 | 14,128,657 |
| The Clorox Co. | | 111,674 | 16,119,025 |
| | | | 335,921,057 |
| Media - 0.8% | | | |
| Advertising - 0.8% | | | |
| Advantage Solutions, Inc. Class A (a)(b) | | 3,487,067 | 12,692,924 |
| Personal Products - 4.7% | | | |
| Personal Products - 4.7% | | | |
| BellRing Brands, Inc. (a) | | 80,200 | 1,899,938 |
| Edgewell Personal Care Co. (b) | | 402,500 | 15,681,400 |
| Estee Lauder Companies, Inc. Class A | | 98,255 | 24,994,107 |
| Herbalife Nutrition Ltd. (a) | | 903,150 | 23,563,184 |
| Olaplex Holdings, Inc. (b) | | 379,600 | 5,056,272 |
| Shiseido Co. Ltd. | | 70,975 | 2,680,996 |
| Unilever PLC | | 31 | 1,406 |
| | | | 73,877,303 |
| Tobacco - 8.3% | | | |
| Tobacco - 8.3% | | | |
| Altria Group, Inc. | | 1,329,017 | 59,965,247 |
| Philip Morris International, Inc. | | 706,482 | 67,461,966 |
| RLX Technology, Inc. ADR (a)(b) | | 1,588,169 | 2,271,082 |
| | | | 129,698,295 |
| TOTAL COMMON STOCKS (Cost $1,260,439,722) | | | 1,559,513,684 |
| | | | |
| Money Market Funds - 3.1% |
| | | Shares | Value ($) |
| Fidelity Cash Central Fund 2.33% (e) | | 2,467,280 | 2,467,774 |
| Fidelity Securities Lending Cash Central Fund 2.34% (e)(f) | | 46,392,267 | 46,396,906 |
| TOTAL MONEY MARKET FUNDS (Cost $48,864,680) | | | 48,864,680 |
| | | | |
| TOTAL INVESTMENT IN SECURITIES - 102.7% (Cost $1,309,304,402) | 1,608,378,364 |
NET OTHER ASSETS (LIABILITIES) - (2.7)% | (42,555,406) |
| NET ASSETS - 100.0% | 1,565,822,958 |
| | |
Legend
| (b) | Security or a portion of the security is on loan at period end. |
| (d) | Security exempt from registration under Rule 144A of the Securities Act of 1933. These securities may be resold in transactions exempt from registration, normally to qualified institutional buyers. At the end of the period, the value of these securities amounted to $418,296 or 0.0% of net assets. |
| (e) | Affiliated fund that is generally available only to investment companies and other accounts managed by Fidelity Investments. The rate quoted is the annualized seven-day yield of the fund at period end. A complete unaudited listing of the fund's holdings as of its most recent quarter end is available upon request. In addition, each Fidelity Central Fund's financial statements are available on the SEC's website or upon request. |
| (f) | Investment made with cash collateral received from securities on loan. |
Affiliated Central Funds
Fiscal year to date information regarding the Fund's investments in Fidelity Central Funds, including the ownership percentage, is presented below.
| Affiliate | Value, beginning of period ($) | Purchases ($) | Sales Proceeds ($) | Dividend Income ($) | Realized Gain (loss) ($) | Change in Unrealized appreciation (depreciation) ($) | Value, end of period ($) | %ownership, end of period |
| Fidelity Cash Central Fund 2.33% | 14,588,277 | 144,531,057 | 156,651,560 | 30,801 | - | - | 2,467,774 | 0.0% |
| Fidelity Securities Lending Cash Central Fund 2.34% | 13,163,424 | 174,174,075 | 140,940,593 | 16,696 | - | - | 46,396,906 | 0.1% |
| Total | 27,751,701 | 318,705,132 | 297,592,153 | 47,497 | - | - | 48,864,680 | |
| | | | | | | | | |
Amounts in the income column in the above table include any capital gain distributions from underlying funds, which are presented in the corresponding line item in the Statement of Operations, if applicable.
Amount for Fidelity Securities Lending Cash Central Fund represents the income earned on investing cash collateral, less rebates paid to borrowers and any lending agent fees associated with the loan, plus any premium payments received for lending certain types of securities.
Investment Valuation
The following is a summary of the inputs used, as of August 31, 2022, involving the Fund's assets and liabilities carried at fair value. The inputs or methodology used for valuing securities may not be an indication of the risk associated with investing in those securities. For more information on valuation inputs, and their aggregation into the levels used below, please refer to the Investment Valuation section in the accompanying Notes to Financial Statements.
| Valuation Inputs at Reporting Date: |
| Description | Total ($) | Level 1 ($) | Level 2 ($) | Level 3 ($) |
Investments in Securities: | | | | |
|
| Common Stocks | 1,559,513,684 | 1,550,227,647 | 9,286,036 | 1 |
|
| Money Market Funds | 48,864,680 | 48,864,680 | - | - |
| Total Investments in Securities: | 1,608,378,364 | 1,599,092,327 | 9,286,036 | 1 |
| Statement of Assets and Liabilities |
| | | | August 31, 2022 (Unaudited) |
| | | | | |
| Assets | | | | |
| Investment in securities, at value (including securities loaned of $44,722,396) - See accompanying schedule: | | $1,559,513,684 | | |
Unaffiliated issuers (cost $1,260,439,722) | | | |
Fidelity Central Funds (cost $48,864,680) | | 48,864,680 | | |
| | | | | |
| Total Investment in Securities (cost $1,309,304,402) | | | $ | 1,608,378,364 |
| Receivable for investments sold | | | | 3,512,127 |
| Receivable for fund shares sold | | | | 4,011,592 |
| Dividends receivable | | | | 1,737,155 |
| Distributions receivable from Fidelity Central Funds | | | | 16,305 |
| Prepaid expenses | | | | 9,982 |
| Other receivables | | | | 278,447 |
Total assets | | | | 1,617,943,972 |
| Liabilities | | | | |
| Payable to custodian bank | | $2 | | |
| Payable for investments purchased | | 2,840,837 | | |
| Payable for fund shares redeemed | | 1,465,987 | | |
| Distributions payable | | 10 | | |
| Accrued management fee | | 712,954 | | |
| Distribution and service plan fees payable | | 159,953 | | |
| Other affiliated payables | | 253,227 | | |
| Other payables and accrued expenses | | 291,366 | | |
| Collateral on securities loaned | | 46,396,678 | | |
| Total Liabilities | | | | 52,121,014 |
| Net Assets | | | $ | 1,565,822,958 |
| Net Assets consist of: | | | | |
| Paid in capital | | | $ | 1,277,700,505 |
| Total accumulated earnings (loss) | | | | 288,122,453 |
| Net Assets | | | $ | 1,565,822,958 |
| | | | | |
| Net Asset Value and Maximum Offering Price | | | | |
| Class A : | | | | |
Net Asset Value and redemption price per share ($289,177,978 ÷ 3,215,395 shares) (a) | | | $ | 89.94 |
| Maximum offering price per share (100/94.25 of $89.94) | | | $ | 95.43 |
| Class M : | | | | |
Net Asset Value and redemption price per share ($62,224,231 ÷ 700,615 shares) (a) | | | $ | 88.81 |
| Maximum offering price per share (100/96.50 of $88.81) | | | $ | 92.03 |
| Class C : | | | | |
Net Asset Value and offering price per share ($81,161,640 ÷ 933,354 shares) (a) | | | $ | 86.96 |
| Consumer Staples : | | | | |
Net Asset Value , offering price and redemption price per share ($888,814,165 ÷ 9,756,513 shares) | | | $ | 91.10 |
| Class I : | | | | |
Net Asset Value , offering price and redemption price per share ($163,460,402 ÷ 1,799,427 shares) | | | $ | 90.84 |
| Class Z : | | | | |
Net Asset Value , offering price and redemption price per share ($80,984,542 ÷ 892,611 shares) | | | $ | 90.73 |
(a)Redemption price per share is equal to net asset value less any applicable contingent deferred sales charge. |
| Statement of Operations |
| | | | Six months ended August 31, 2022 (Unaudited) |
| Investment Income | | | | |
| Dividends | | | $ | 19,303,334 |
| Income from Fidelity Central Funds (including $16,696 from security lending) | | | | 47,497 |
| Total Income | | | | 19,350,831 |
| Expenses | | | | |
| Management fee | $ | 4,305,737 | | |
| Transfer agent fees | | 1,333,992 | | |
| Distribution and service plan fees | | 946,093 | | |
| Accounting fees | | 239,569 | | |
| Custodian fees and expenses | | 10,516 | | |
| Independent trustees' fees and expenses | | 2,640 | | |
| Registration fees | | 82,052 | | |
| Audit | | 20,776 | | |
| Legal | | 3,371 | | |
| Interest | | 2,586 | | |
| Miscellaneous | | 5,069 | | |
| Total expenses before reductions | | 6,952,401 | | |
| Expense reductions | | (25,592) | | |
| Total expenses after reductions | | | | 6,926,809 |
| Net Investment income (loss) | | | | 12,424,022 |
| Realized and Unrealized Gain (Loss) | | | | |
| Net realized gain (loss) on: | | | | |
| Investment Securities: | | | | |
| Unaffiliated issuers | | (7,180,609) | | |
| Foreign currency transactions | | (50,267) | | |
| Total net realized gain (loss) | | | | (7,230,876) |
| Change in net unrealized appreciation (depreciation) on: | | | | |
| Investment Securities: | | | | |
| Unaffiliated issuers | | (73,831,446) | | |
| Assets and liabilities in foreign currencies | | (11,171) | | |
| Total change in net unrealized appreciation (depreciation) | | | | (73,842,617) |
| Net gain (loss) | | | | (81,073,493) |
| Net increase (decrease) in net assets resulting from operations | | | $ | (68,649,471) |
| Statement of Changes in Net Assets |
| |
| | Six months ended August 31, 2022 (Unaudited) | | Year ended February 28, 2022 |
| Increase (Decrease) in Net Assets | | | | |
| Operations | | | | |
| Net investment income (loss) | $ | 12,424,022 | $ | 23,869,410 |
| Net realized gain (loss) | | (7,230,876) | | 117,808,690 |
| Change in net unrealized appreciation (depreciation) | | (73,842,617) | | 106,519,256 |
| Net increase (decrease) in net assets resulting from operations | | (68,649,471) | | 248,197,356 |
| Distributions to shareholders | | (36,946,846) | | (153,414,832) |
| Share transactions - net increase (decrease) | | (35,151,083) | | 254,802,169 |
| Total increase (decrease) in net assets | | (140,747,400) | | 349,584,693 |
| | | | | |
| Net Assets | | | | |
| Beginning of period | | 1,706,570,358 | | 1,356,985,665 |
| End of period | $ | 1,565,822,958 | $ | 1,706,570,358 |
| | | | | |
| | | | | |
| Fidelity Advisor® Consumer Staples Fund Class A |
| |
| | Six months ended (Unaudited) August 31, 2022 | | Years ended February 28, 2022 | | 2021 | | 2020 A | | 2019 | | 2018 |
Selected Per-Share Data | | | | | | | | | | | | |
| Net asset value, beginning of period | $ | 95.55 | $ | 89.40 | $ | 79.57 | $ | 76.88 | $ | 87.07 | $ | 96.18 |
| Income from Investment Operations | | | | | | | | | | | | |
Net investment income (loss) B,C | | .63 | | 1.40 | | 1.34 | | 1.40 | | 2.08 D | | 1.54 |
| Net realized and unrealized gain (loss) | | (4.21) | | 14.98 | | 11.24 | | 3.54 | | (2.64) | | (2.80) |
| Total from investment operations | | (3.58) | | 16.38 | | 12.58 | | 4.94 | | (.56) | | (1.26) |
| Distributions from net investment income | | (.50) | | (1.55) | | (1.42) | | (1.35) | | (2.11) | | (1.55) |
| Distributions from net realized gain | | (1.53) | | (8.68) | | (1.33) | | (.90) | | (7.53) | | (6.30) |
| Total distributions | | (2.03) | | (10.23) | | (2.75) | | (2.25) | | (9.63) E | | (7.85) |
| Net asset value, end of period | $ | 89.94 | $ | 95.55 | $ | 89.40 | $ | 79.57 | $ | 76.88 | $ | 87.07 |
Total Return F,G,H | | (3.84)% | | 18.83% | | 16.00% | | 6.17% | | (.32)% | | (1.68)% |
Ratios to Average Net Assets C,I,J | | | | | | | | | | | | |
| Expenses before reductions | | 1.01% K | | 1.01% | | 1.04% | | 1.04% | | 1.05% | | 1.05% |
| Expenses net of fee waivers, if any | | 1.01% K | | 1.01% | | 1.04% | | 1.04% | | 1.05% | | 1.05% |
| Expenses net of all reductions | | 1.01% K | | 1.01% | | 1.03% | | 1.04% | | 1.04% | | 1.04% |
| Net investment income (loss) | | 1.36% K | | 1.45% | | 1.57% | | 1.67% | | 2.65% D | | 1.60% |
| Supplemental Data | | | | | | | | | | | | |
| Net assets, end of period (000 omitted) | $ | 289,178 | $ | 293,276 | $ | 248,234 | $ | 239,067 | $ | 232,020 | $ | 317,366 |
Portfolio turnover rate L | | 48% K | | 61% | | 51% | | 40% | | 41% M | | 76% |
A For the year ended February 29.
B Calculated based on average shares outstanding during the period.
C Net investment income (loss) is affected by the timing of the declaration of dividends by any underlying mutual funds or exchange-traded funds (ETFs). Net investment income (loss) of any such underlying funds is not included in the Fund's net investment income (loss) ratio.
D Net investment income per share reflects one or more large, non-recurring dividend(s) which amounted to $.69 per share. Excluding such non-recurring dividend(s), the ratio of net investment income (loss) to average net assets would have been 1.78%.
E Total distributions per share do not sum due to rounding.
F Total returns for periods of less than one year are not annualized.
G Total returns would have been lower if certain expenses had not been reduced during the applicable periods shown.
H Total returns do not include the effect of the sales charges.
I Fees and expenses of any underlying mutual funds or exchange-traded funds (ETFs) are not included in the Fund's expense ratio. The Fund indirectly bears its proportionate share of these expenses. For additional expense information related to investments in Fidelity Central Funds, please refer to the "Investments in Fidelity Central Funds" note found in the Notes to Financial Statements section of the most recent Annual or Semi-Annual report.
J Expense ratios reflect operating expenses of the class. Expenses before reductions do not reflect amounts reimbursed, waived, or reduced through arrangements with the investment adviser, brokerage services, or other offset arrangements, if applicable, and do not represent the amount paid by the class during periods when reimbursements, waivers or reductions occur.
K Annualized
L Amount does not include the portfolio activity of any underlying mutual funds or exchange-traded funds (ETFs).
M Portfolio turnover rate excludes securities received or delivered in-kind.
| Fidelity Advisor® Consumer Staples Fund Class M |
| |
| | Six months ended (Unaudited) August 31, 2022 | | Years ended February 28, 2022 | | 2021 | | 2020 A | | 2019 | | 2018 |
Selected Per-Share Data | | | | | | | | | | | | |
| Net asset value, beginning of period | $ | 94.39 | $ | 88.43 | $ | 78.74 | $ | 76.13 | $ | 86.30 | $ | 95.42 |
| Income from Investment Operations | | | | | | | | | | | | |
Net investment income (loss) B,C | | .50 | | 1.13 | | 1.10 | | 1.16 | | 1.85 D | | 1.27 |
| Net realized and unrealized gain (loss) | | (4.16) | | 14.81 | | 11.11 | | 3.50 | | (2.61) | | (2.78) |
| Total from investment operations | | (3.66) | | 15.94 | | 12.21 | | 4.66 | | (.76) | | (1.51) |
| Distributions from net investment income | | (.39) | | (1.30) | | (1.19) | | (1.15) | | (1.88) | | (1.31) |
| Distributions from net realized gain | | (1.53) | | (8.68) | | (1.33) | | (.90) | | (7.53) | | (6.30) |
| Total distributions | | (1.92) | | (9.98) | | (2.52) | | (2.05) | | (9.41) | | (7.61) |
| Net asset value, end of period | $ | 88.81 | $ | 94.39 | $ | 88.43 | $ | 78.74 | $ | 76.13 | $ | 86.30 |
Total Return E,F,G | | (3.97)% | | 18.51% | | 15.69% | | 5.88% | | (.59)% | | (1.94)% |
Ratios to Average Net Assets C,H,I | | | | | | | | | | | | |
| Expenses before reductions | | 1.28% J | | 1.28% | | 1.31% | | 1.31% | | 1.33% | | 1.32% |
| Expenses net of fee waivers, if any | | 1.27% J | | 1.28% | | 1.31% | | 1.31% | | 1.32% | | 1.32% |
| Expenses net of all reductions | | 1.27% J | | 1.28% | | 1.30% | | 1.31% | | 1.31% | | 1.31% |
| Net investment income (loss) | | 1.09% J | | 1.18% | | 1.30% | | 1.40% | | 2.37% D | | 1.33% |
| Supplemental Data | | | | | | | | | | | | |
| Net assets, end of period (000 omitted) | $ | 62,224 | $ | 64,707 | $ | 56,664 | $ | 55,954 | $ | 60,069 | $ | 76,572 |
Portfolio turnover rate K | | 48% J | | 61% | | 51% | | 40% | | 41% L | | 76% |
A For the year ended February 29.
B Calculated based on average shares outstanding during the period.
C Net investment income (loss) is affected by the timing of the declaration of dividends by any underlying mutual funds or exchange-traded funds (ETFs). Net investment income (loss) of any such underlying funds is not included in the Fund's net investment income (loss) ratio.
D Net investment income per share reflects one or more large, non-recurring dividend(s) which amounted to $.68 per share. Excluding such non-recurring dividend(s), the ratio of net investment income (loss) to average net assets would have been 1.50%.
E Total returns would have been lower if certain expenses had not been reduced during the applicable periods shown.
F Total returns for periods of less than one year are not annualized.
G Total returns do not include the effect of the sales charges.
H Fees and expenses of any underlying mutual funds or exchange-traded funds (ETFs) are not included in the Fund's expense ratio. The Fund indirectly bears its proportionate share of these expenses. For additional expense information related to investments in Fidelity Central Funds, please refer to the "Investments in Fidelity Central Funds" note found in the Notes to Financial Statements section of the most recent Annual or Semi-Annual report.
I Expense ratios reflect operating expenses of the class. Expenses before reductions do not reflect amounts reimbursed, waived, or reduced through arrangements with the investment adviser, brokerage services, or other offset arrangements, if applicable, and do not represent the amount paid by the class during periods when reimbursements, waivers or reductions occur.
J Annualized
K Amount does not include the portfolio activity of any underlying mutual funds or exchange-traded funds (ETFs).
L Portfolio turnover rate excludes securities received or delivered in-kind.
| Fidelity Advisor® Consumer Staples Fund Class C |
| |
| | Six months ended (Unaudited) August 31, 2022 | | Years ended February 28, 2022 | | 2021 | | 2020 A | | 2019 | | 2018 |
Selected Per-Share Data | | | | | | | | | | | | |
| Net asset value, beginning of period | $ | 92.48 | $ | 86.73 | $ | 77.27 | $ | 74.79 | $ | 84.85 | $ | 93.89 |
| Income from Investment Operations | | | | | | | | | | | | |
Net investment income (loss) B,C | | .27 | | .65 | | .68 | | .75 | | 1.46 D | | .81 |
| Net realized and unrealized gain (loss) | | (4.06) | | 14.51 | | 10.87 | | 3.44 | | (2.57) | | (2.73) |
| Total from investment operations | | (3.79) | | 15.16 | | 11.55 | | 4.19 | | (1.11) | | (1.92) |
| Distributions from net investment income | | (.20) | | (.79) | | (.80) | | (.81) | | (1.43) | | (.82) |
| Distributions from net realized gain | | (1.53) | | (8.62) | | (1.30) | | (.90) | | (7.53) | | (6.30) |
| Total distributions | | (1.73) | | (9.41) | | (2.09) E | | (1.71) | | (8.95) E | | (7.12) |
| Net asset value, end of period | $ | 86.96 | $ | 92.48 | $ | 86.73 | $ | 77.27 | $ | 74.79 | $ | 84.85 |
Total Return F,G,H | | (4.20)% | | 17.92% | | 15.14% | | 5.39% | | (1.05)% | | (2.41)% |
Ratios to Average Net Assets C,I,J | | | | | | | | | | | | |
| Expenses before reductions | | 1.77% K | | 1.77% | | 1.79% | | 1.79% | | 1.79% | | 1.79% |
| Expenses net of fee waivers, if any | | 1.76% K | | 1.76% | | 1.79% | | 1.79% | | 1.79% | | 1.79% |
| Expenses net of all reductions | | 1.76% K | | 1.76% | | 1.78% | | 1.79% | | 1.78% | | 1.78% |
| Net investment income (loss) | | .61% K | | .70% | | .83% | | .92% | | 1.91% D | | .86% |
| Supplemental Data | | | | | | | | | | | | |
| Net assets, end of period (000 omitted) | $ | 81,162 | $ | 88,645 | $ | 104,955 | $ | 117,328 | $ | 150,822 | $ | 228,874 |
Portfolio turnover rate L | | 48% K | | 61% | | 51% | | 40% | | 41% M | | 76% |
A For the year ended February 29.
B Calculated based on average shares outstanding during the period.
C Net investment income (loss) is affected by the timing of the declaration of dividends by any underlying mutual funds or exchange-traded funds (ETFs). Net investment income (loss) of any such underlying funds is not included in the Fund's net investment income (loss) ratio.
D Net investment income per share reflects one or more large, non-recurring dividend(s) which amounted to $.67 per share. Excluding such non-recurring dividend(s), the ratio of net investment income (loss) to average net assets would have been 1.04%.
E Total distributions per share do not sum due to rounding.
F Total returns for periods of less than one year are not annualized.
G Total returns would have been lower if certain expenses had not been reduced during the applicable periods shown.
H Total returns do not include the effect of the contingent deferred sales charge.
I Fees and expenses of any underlying mutual funds or exchange-traded funds (ETFs) are not included in the Fund's expense ratio. The Fund indirectly bears its proportionate share of these expenses. For additional expense information related to investments in Fidelity Central Funds, please refer to the "Investments in Fidelity Central Funds" note found in the Notes to Financial Statements section of the most recent Annual or Semi-Annual report.
J Expense ratios reflect operating expenses of the class. Expenses before reductions do not reflect amounts reimbursed, waived, or reduced through arrangements with the investment adviser, brokerage services, or other offset arrangements, if applicable, and do not represent the amount paid by the class during periods when reimbursements, waivers or reductions occur.
K Annualized
L Amount does not include the portfolio activity of any underlying mutual funds or exchange-traded funds (ETFs).
M Portfolio turnover rate excludes securities received or delivered in-kind.
| Consumer Staples Portfolio |
| |
| | Six months ended (Unaudited) August 31, 2022 | | Years ended February 28, 2022 | | 2021 | | 2020 A | | 2019 | | 2018 |
Selected Per-Share Data | | | | | | | | | | | | |
| Net asset value, beginning of period | $ | 96.75 | $ | 90.40 | $ | 80.42 | $ | 77.63 | $ | 87.85 | $ | 97.01 |
| Income from Investment Operations | | | | | | | | | | | | |
Net investment income (loss) B,C | | .77 | | 1.69 | | 1.60 | | 1.66 | | 2.34 D | | 1.82 |
| Net realized and unrealized gain (loss) | | (4.27) | | 15.16 | | 11.39 | | 3.59 | | (2.67) | | (2.82) |
| Total from investment operations | | (3.50) | | 16.85 | | 12.99 | | 5.25 | | (.33) | | (1.00) |
| Distributions from net investment income | | (.62) | | (1.81) | | (1.68) | | (1.55) | | (2.36) | | (1.86) |
| Distributions from net realized gain | | (1.53) | | (8.68) | | (1.33) | | (.90) | | (7.53) | | (6.30) |
| Total distributions | | (2.15) | | (10.50) E | | (3.01) | | (2.46) E | | (9.89) | | (8.16) |
| Net asset value, end of period | $ | 91.10 | $ | 96.75 | $ | 90.40 | $ | 80.42 | $ | 77.63 | $ | 87.85 |
Total Return F,G | | (3.71)% | | 19.16% | | 16.34% | | 6.48% | | (.03)% | | (1.40)% |
Ratios to Average Net Assets B,H,I | | | | | | | | | | | | |
| Expenses before reductions | | .73% J | | .73% | | .75% | | .75% | | .77% | | .76% |
| Expenses net of fee waivers, if any | | .73% J | | .73% | | .75% | | .75% | | .76% | | .76% |
| Expenses net of all reductions | | .73% J | | .73% | | .74% | | .75% | | .75% | | .76% |
| Net investment income (loss) | | 1.64% J | | 1.74% | | 1.86% | | 1.96% | | 2.94% D | | 1.89% |
| Supplemental Data | | | | | | | | | | | | |
| Net assets, end of period (000 omitted) | $ | 888,814 | $ | 1,032,956 | $ | 770,644 | $ | 773,437 | $ | 814,350 | $ | 1,328,696 |
Portfolio turnover rate K | | 48% J | | 61% | | 51% | | 40% | | 41% L | | 76% |
A For the year ended February 29.
B Net investment income (loss) is affected by the timing of the declaration of dividends by any underlying mutual funds or exchange-traded funds (ETFs). Net investment income (loss) of any such underlying funds is not included in the Fund's net investment income (loss) ratio.
C Calculated based on average shares outstanding during the period.
D Net investment income per share reflects one or more large, non-recurring dividend(s) which amounted to $.69 per share. Excluding such non-recurring dividend(s), the ratio of net investment income (loss) to average net assets would have been 2.07%.
E Total distributions per share do not sum due to rounding.
F Total returns for periods of less than one year are not annualized.
G Total returns would have been lower if certain expenses had not been reduced during the applicable periods shown.
H Fees and expenses of any underlying mutual funds or exchange-traded funds (ETFs) are not included in the Fund's expense ratio. The Fund indirectly bears its proportionate share of these expenses. For additional expense information related to investments in Fidelity Central Funds, please refer to the "Investments in Fidelity Central Funds" note found in the Notes to Financial Statements section of the most recent Annual or Semi-Annual report.
I Expense ratios reflect operating expenses of the class. Expenses before reductions do not reflect amounts reimbursed, waived, or reduced through arrangements with the investment adviser, brokerage services, or other offset arrangements, if applicable, and do not represent the amount paid by the class during periods when reimbursements, waivers or reductions occur.
J Annualized
K Amount does not include the portfolio activity of any underlying mutual funds or exchange-traded funds (ETFs).
L Portfolio turnover rate excludes securities received or delivered in-kind.
| Fidelity Advisor® Consumer Staples Fund Class I |
| |
| | Six months ended (Unaudited) August 31, 2022 | | Years ended February 28, 2022 | | 2021 | | 2020 A | | 2019 | | 2018 |
Selected Per-Share Data | | | | | | | | | | | | |
| Net asset value, beginning of period | $ | 96.48 | $ | 90.17 | $ | 80.23 | $ | 77.45 | $ | 87.68 | $ | 96.82 |
| Income from Investment Operations | | | | | | | | | | | | |
Net investment income (loss) B,C | | .76 | | 1.67 | | 1.60 | | 1.65 | | 2.33 D | | 1.81 |
| Net realized and unrealized gain (loss) | | (4.25) | | 15.13 | | 11.34 | | 3.58 | | (2.68) | | (2.82) |
| Total from investment operations | | (3.49) | | 16.80 | | 12.94 | | 5.23 | | (.35) | | (1.01) |
| Distributions from net investment income | | (.62) | | (1.80) | | (1.67) | | (1.55) | | (2.36) | | (1.83) |
| Distributions from net realized gain | | (1.53) | | (8.68) | | (1.33) | | (.90) | | (7.53) | | (6.30) |
| Total distributions | | (2.15) | | (10.49) E | | (3.00) | | (2.45) | | (9.88) E | | (8.13) |
| Net asset value, end of period | $ | 90.84 | $ | 96.48 | $ | 90.17 | $ | 80.23 | $ | 77.45 | $ | 87.68 |
Total Return F,G | | (3.71)% | | 19.15% | | 16.32% | | 6.48% | | (.04)% | | (1.41)% |
Ratios to Average Net Assets C,H,I | | | | | | | | | | | | |
| Expenses before reductions | | .74% J | | .74% | | .76% | | .76% | | .77% | | .78% |
| Expenses net of fee waivers, if any | | .74% J | | .74% | | .75% | | .76% | | .77% | | .78% |
| Expenses net of all reductions | | .74% J | | .74% | | .75% | | .76% | | .76% | | .77% |
| Net investment income (loss) | | 1.63% J | | 1.72% | | 1.86% | | 1.95% | | 2.93% D | | 1.88% |
| Supplemental Data | | | | | | | | | | | | |
| Net assets, end of period (000 omitted) | $ | 163,460 | $ | 149,160 | $ | 132,898 | $ | 149,514 | $ | 159,614 | $ | 240,605 |
Portfolio turnover rate K | | 48% J | | 61% | | 51% | | 40% | | 41% L | | 76% |
A For the year ended February 29.
B Calculated based on average shares outstanding during the period.
C Net investment income (loss) is affected by the timing of the declaration of dividends by any underlying mutual funds or exchange-traded funds (ETFs). Net investment income (loss) of any such underlying funds is not included in the Fund's net investment income (loss) ratio.
D Net investment income per share reflects one or more large, non-recurring dividend(s) which amounted to $.69 per share. Excluding such non-recurring dividend(s), the ratio of net investment income (loss) to average net assets would have been 2.06%.
E Total distributions per share do not sum due to rounding.
F Total returns for periods of less than one year are not annualized.
G Total returns would have been lower if certain expenses had not been reduced during the applicable periods shown.
H Fees and expenses of any underlying mutual funds or exchange-traded funds (ETFs) are not included in the Fund's expense ratio. The Fund indirectly bears its proportionate share of these expenses. For additional expense information related to investments in Fidelity Central Funds, please refer to the "Investments in Fidelity Central Funds" note found in the Notes to Financial Statements section of the most recent Annual or Semi-Annual report.
I Expense ratios reflect operating expenses of the class. Expenses before reductions do not reflect amounts reimbursed, waived, or reduced through arrangements with the investment adviser, brokerage services, or other offset arrangements, if applicable, and do not represent the amount paid by the class during periods when reimbursements, waivers or reductions occur.
J Annualized
K Amount does not include the portfolio activity of any underlying mutual funds or exchange-traded funds (ETFs).
L Portfolio turnover rate excludes securities received or delivered in-kind.
| Fidelity Advisor® Consumer Staples Fund Class Z |
| |
| | Six months ended (Unaudited) August 31, 2022 | | Years ended February 28, 2022 | | 2021 | | 2020 A | | 2019 B |
Selected Per-Share Data | | | | | | | | | | |
| Net asset value, beginning of period | $ | 96.36 | $ | 90.08 | $ | 80.14 | $ | 77.36 | $ | 81.61 |
| Income from Investment Operations | | | | | | | | | | |
Net investment income (loss) C,D | | .82 | | 1.79 | | 1.71 | | 1.78 | | .05 E |
| Net realized and unrealized gain (loss) | | (4.24) | | 15.10 | | 11.35 | | 3.56 | | .33 F |
| Total from investment operations | | (3.42) | | 16.89 | | 13.06 | | 5.34 | | .38 |
| Distributions from net investment income | | (.68) | | (1.93) | | (1.79) | | (1.66) | | (2.23) |
| Distributions from net realized gain | | (1.53) | | (8.68) | | (1.33) | | (.90) | | (2.40) |
| Total distributions | | (2.21) | | (10.61) | | (3.12) | | (2.56) | | (4.63) |
| Net asset value, end of period | $ | 90.73 | $ | 96.36 | $ | 90.08 | $ | 80.14 | $ | 77.36 |
Total Return G,H | | (3.65)% | | 19.29% | | 16.49% | | 6.61% | | .79% |
Ratios to Average Net Assets D,I,J | | | | | | | | | | |
| Expenses before reductions | | .61% K | | .61% | | .62% | | .63% | | .63% K |
| Expenses net of fee waivers, if any | | .61% K | | .61% | | .62% | | .63% | | .62% K |
| Expenses net of all reductions | | .61% K | | .61% | | .62% | | .62% | | .61% K |
| Net investment income (loss) | | 1.76% K | | 1.85% | | 1.99% | | 2.08% | | .16% E,K |
| Supplemental Data | | | | | | | | | | |
| Net assets, end of period (000 omitted) | $ | 80,985 | $ | 77,826 | $ | 43,591 | $ | 41,629 | $ | 8,052 |
Portfolio turnover rate L | | 48% K | | 61% | | 51% | | 40% | | 41% K,M |
A For the year ended February 29.
B For the period October 2, 2018 (commencement of sale of shares) through February 28, 2019.
C Calculated based on average shares outstanding during the period.
D Net investment income (loss) is affected by the timing of the declaration of dividends by any underlying mutual funds or exchange-traded funds (ETFs). Net investment income (loss) of any such underlying funds is not included in the Fund's net investment income (loss) ratio.
E Net investment income per share reflects one or more large, non-recurring dividend(s) which amounted to $.26 per share. Excluding such non-recurring dividend(s), the ratio of net investment income (loss) to average net assets would have been (.69)%.
F The amount shown for a share outstanding does not correspond with the aggregate net gain (loss) on investments for the period due to the timing of sales and repurchases of shares in relation to fluctuating market values of the investments of the Fund.
G Total returns for periods of less than one year are not annualized.
H Total returns would have been lower if certain expenses had not been reduced during the applicable periods shown.
I Fees and expenses of any underlying mutual funds or exchange-traded funds (ETFs) are not included in the Fund's expense ratio. The Fund indirectly bears its proportionate share of these expenses. For additional expense information related to investments in Fidelity Central Funds, please refer to the "Investments in Fidelity Central Funds" note found in the Notes to Financial Statements section of the most recent Annual or Semi-Annual report.
J Expense ratios reflect operating expenses of the class. Expenses before reductions do not reflect amounts reimbursed, waived, or reduced through arrangements with the investment adviser, brokerage services, or other offset arrangements, if applicable, and do not represent the amount paid by the class during periods when reimbursements, waivers or reductions occur.
K Annualized
L Amount does not include the portfolio activity of any underlying mutual funds or exchange-traded funds (ETFs).
M Portfolio turnover rate excludes securities received or delivered in-kind.
For the period ended August 31, 2022
1. Organization.
Consumer Staples Portfolio (the Fund) is a non-diversified fund of Fidelity Select Portfolios (the Trust) and is authorized to issue an unlimited number of shares. The Trust is registered under the Investment Company Act of 1940, as amended (the 1940 Act), as an open-end management investment company organized as a Massachusetts business trust. The Fund invests primarily in securities of companies whose principal business activities fall within specific industries. The Fund offers Class A, Class M, Class C, Consumer Staples, Class I and Class Z shares, each of which has equal rights as to assets and voting privileges. Each class has exclusive voting rights with respect to matters that affect that class. Class C shares will automatically convert to Class A shares after a holding period of eight years from the initial date of purchase, with certain exceptions.
2. Investments in Fidelity Central Funds.
Funds may invest in Fidelity Central Funds, which are open-end investment companies generally available only to other investment companies and accounts managed by the investment adviser and its affiliates. The Schedule of Investments lists any Fidelity Central Funds held as an investment as of period end, but does not include the underlying holdings of each Fidelity Central Fund. An investing fund indirectly bears its proportionate share of the expenses of the underlying Fidelity Central Funds.
Based on its investment objective, each Fidelity Central Fund may invest or participate in various investment vehicles or strategies that are similar to those of the investing fund. These strategies are consistent with the investment objectives of the investing fund and may involve certain economic risks which may cause a decline in value of each of the Fidelity Central Funds and thus a decline in the value of the investing fund.
| Fidelity Central Fund | Investment Manager | Investment Objective | Investment Practices | Expense Ratio A |
| Fidelity Money Market Central Funds | Fidelity Management & Research Company LLC (FMR) | Each fund seeks to obtain a high level of current income consistent with the preservation of capital and liquidity. | Short-term Investments | Less than .005 % |
A Expenses expressed as a percentage of average net assets and are as of each underlying Central Fund's most recent annual or semi-annual shareholder report.
A complete unaudited list of holdings for each Fidelity Central Fund is available upon request or at the Securities and Exchange Commission website at www.sec.gov. In addition, the financial statements of the Fidelity Central Funds which contain the significant accounting policies (including investment valuation policies) of those funds, and are not covered by the Report of Independent Registered Public Accounting Firm, are available on the Securities and Exchange Commission website or upon request.
3. Significant Accounting Policies.
The Fund is an investment company and applies the accounting and reporting guidance of the Financial Accounting Standards Board (FASB) Accounting Standards Codification Topic 946 Financial Services - Investment Companies . The financial statements have been prepared in conformity with accounting principles generally accepted in the United States of America (GAAP), which require management to make certain estimates and assumptions at the date of the financial statements. Actual results could differ from those estimates. Subsequent events, if any, through the date that the financial statements were issued have been evaluated in the preparation of the financial statements. The Fund's Schedule of Investments lists any underlying mutual funds or exchange-traded funds (ETFs) but does not include the underlying holdings of these funds. The following summarizes the significant accounting policies of the Fund:
Investment Valuation. Investments are valued as of 4:00 p.m. Eastern time on the last calendar day of the period. The Board of Trustees (the Board) has delegated the day to day responsibility for the valuation of the Fund's investments to the Fair Value Committee (the Committee) established by the Fund's investment adviser. In accordance with valuation policies and procedures approved by the Board, the Fund attempts to obtain prices from one or more third party pricing vendors or brokers to value its investments. When current market prices, quotations or currency exchange rates are not readily available or reliable, investments will be fair valued in good faith by the Committee, in accordance with procedures adopted by the Board. Factors used in determining fair value vary by investment type and may include market or investment specific events. The frequency with which these procedures are used cannot be predicted and they may be utilized to a significant extent. The Committee oversees the Fund's valuation policies and procedures and reports to the Board on the Committee's activities and fair value determinations. The Board monitors the appropriateness of the procedures used in valuing the Fund's investments and ratifies the fair value determinations of the Committee.
The Fund categorizes the inputs to valuation techniques used to value its investments into a disclosure hierarchy consisting of three levels as shown below:
Level 1 - unadjusted quoted prices in active markets for identical investments
Level 2 - other significant observable inputs (including quoted prices for similar investments, interest rates, prepayment speeds, etc.)
Level 3 - unobservable inputs (including the Fund's own assumptions based on the best information available)
Valuation techniques used to value the Fund's investments by major category are as follows:
Equity securities, including restricted securities, for which market quotations are readily available, are valued at the last reported sale price or official closing price as reported by a third party pricing vendor on the primary market or exchange on which they are traded and are categorized as Level 1 in the hierarchy. In the event there were no sales during the day or closing prices are not available, securities are valued at the last quoted bid price or may be valued using the last available price and are generally categorized as Level 2 in the hierarchy. For foreign equity securities, when market or security specific events arise, comparisons to the valuation of American Depositary Receipts (ADRs), futures contracts, ETFs and certain indexes as well as quoted prices for similar securities may be used and would be categorized as Level 2 in the hierarchy. For equity securities, including restricted securities, where observable inputs are limited, assumptions about market activity and risk are used and these securities may be categorized as Level 3 in the hierarchy.
Investments in open-end mutual funds, including the Fidelity Central Funds, are valued at their closing net asset value (NAV) each business day and are categorized as Level 1 in the hierarchy.
Changes in valuation techniques may result in transfers in or out of an assigned level within the disclosure hierarchy. The aggregate value of investments by input level as of August 31, 2022, is included at the end of the Fund's Schedule of Investments.
Foreign Currency. Certain Funds may use foreign currency contracts to facilitate transactions in foreign-denominated securities. Gains and losses from these transactions may arise from changes in the value of the foreign currency or if the counterparties do not perform under the contracts' terms.
Foreign-denominated assets, including investment securities, and liabilities are translated into U.S. dollars at the exchange rates at period end. Purchases and sales of investment securities, income and dividends received, and expenses denominated in foreign currencies are translated into U.S. dollars at the exchange rate in effect on the transaction date.
The effects of exchange rate fluctuations on investments are included with the net realized and unrealized gain (loss) on investment securities. Other foreign currency transactions resulting in realized and unrealized gain (loss) are disclosed separately.
Investment Transactions and Income. For financial reporting purposes, the Fund's investment holdings and NAV include trades executed through the end of the last business day of the period. The NAV per share for processing shareholder transactions is calculated as of the close of business of the New York Stock Exchange (NYSE), normally 4:00 p.m. Eastern time and includes trades executed through the end of the prior business day. Gains and losses on securities sold are determined on the basis of identified cost and include proceeds received from litigation. Commissions paid to certain brokers with whom the investment adviser, or its affiliates, places trades on behalf of a fund include an amount in addition to trade execution, which may be rebated back to a fund. Any such rebates are included in net realized gain (loss) on investments in the Statement of Operations. Dividend income is recorded on the ex-dividend date, except for certain dividends from foreign securities where the ex-dividend date may have passed, which are recorded as soon as the Fund is informed of the ex-dividend date. Non-cash dividends included in dividend income, if any, are recorded at the fair market value of the securities received. Income and capital gain distributions from Fidelity Central Funds, if any, are recorded on the ex-dividend date. Certain distributions received by the Fund represent a return of capital or capital gain. The Fund determines the components of these distributions subsequent to the ex-dividend date, based upon receipt of tax filings or other correspondence relating to the underlying investment. These distributions are recorded as a reduction of cost of investments and/or as a realized gain. Investment income is recorded net of foreign taxes withheld where recovery of such taxes is uncertain. Funds may file withholding tax reclaims in certain jurisdictions to recover a portion of amounts previously withheld. Any withholding tax reclaims income is included in the Statement of Operations in dividends. Any receivables for withholding tax reclaims are included in the Statement of Assets and Liabilities in dividends receivable.
Class Allocations and Expenses. Investment income, realized and unrealized capital gains and losses, common expenses of a fund, and certain fund-level expense reductions, if any, are allocated daily on a pro-rata basis to each class based on the relative net assets of each class to the total net assets of a fund. Each class differs with respect to transfer agent and distribution and service plan fees incurred, as applicable. Certain expense reductions may also differ by class, if applicable. For the reporting period, the allocated portion of income and expenses to each class as a percent of its average net assets may vary due to the timing of recording these transactions in relation to fluctuating net assets of the classes. Expenses directly attributable to a fund are charged to that fund. Expenses attributable to more than one fund are allocated among the respective funds on the basis of relative net assets or other appropriate methods. Expenses included in the accompanying financial statements reflect the expenses of that fund and do not include any expenses associated with any underlying mutual funds or exchange-traded funds. Although not included in a fund's expenses, a fund indirectly bears its proportionate share of these expenses through the net asset value of each underlying mutual fund or exchange-traded fund. Expense estimates are accrued in the period to which they relate and adjustments are made when actual amounts are known.
Deferred Trustee Compensation. Under a Deferred Compensation Plan (the Plan) for certain Funds, certain independent Trustees have elected to defer receipt of a portion of their annual compensation. Deferred amounts are invested in affiliated mutual funds, are marked-to-market and remain in a fund until distributed in accordance with the Plan. The investment of deferred amounts and the offsetting payable to the Trustees presented below are included in the accompanying Statement of Assets and Liabilities in other receivables and other payables and accrued expenses, as applicable.
| Consumer Staples Portfolio | $265,233 |
Income Tax Information and Distributions to Shareholders. Each year, the Fund intends to qualify as a regulated investment company under Subchapter M of the Internal Revenue Code, including distributing substantially all of its taxable income and realized gains. As a result, no provision for U.S. Federal income taxes is required. The Fund files a U.S. federal tax return, in addition to state and local tax returns as required. The Fund's federal income tax returns are subject to examination by the Internal Revenue Service (IRS) for a period of three fiscal years after they are filed. State and local tax returns may be subject to examination for an additional fiscal year depending on the jurisdiction. Foreign taxes are provided for based on the Fund's understanding of the tax rules and rates that exist in the foreign markets in which it invests.
Distributions are declared and recorded on the ex-dividend date. Income and capital gain distributions are declared separately for each class. Income and capital gain distributions are determined in accordance with income tax regulations, which may differ from GAAP.
Capital accounts within the financial statements are adjusted for permanent book-tax differences. These adjustments have no impact on net assets or the results of operations. Capital accounts are not adjusted for temporary book-tax differences which will reverse in a subsequent period.
Book-tax differences are primarily due to foreign currency transactions, deferred Trustee compensation and losses deferred due to wash sales.
As of period end, the cost and unrealized appreciation (depreciation) in securities, and derivatives if applicable, for federal income tax purposes were as follows:
| Gross unrealized appreciation | $ 371,893,975 |
| Gross unrealized depreciation | (81,734,801) |
| Net unrealized appreciation (depreciation) | $ 290,159,174 |
| Tax cost | $1,318,219,190 |
Restricted Securities (including Private Placements). Funds may invest in securities that are subject to legal or contractual restrictions on resale. These securities generally may be resold in transactions exempt from registration or to the public if the securities are registered. Disposal of these securities may involve time-consuming negotiations and expense, and prompt sale at an acceptable price may be difficult. Information regarding restricted securities held at period end is included at the end of the Schedule of Investments, if applicable.
4. Purchases and Sales of Investments.
Purchases and sales of securities, other than short-term securities and in-kind transactions, as applicable, are noted in the table below.
| | Purchases ($) | Sales ($) |
| Consumer Staples Portfolio | 392,540,895 | 436,244,303 |
5. Fees and Other Transactions with Affiliates.
Management Fee. Fidelity Management & Research Company LLC (the investment adviser) and its affiliates provide the Fund with investment management related services for which the Fund pays a monthly management fee. The management fee is the sum of an individual fund fee rate that is based on an annual rate of .30% of the Fund's average net assets and an annualized group fee rate that averaged .23% during the period. The group fee rate is based upon the monthly average net assets of a group of registered investment companies with which the investment adviser has management contracts. The group fee rate decreases as assets under management increase and increases as assets under management decrease. For the reporting period, the total annualized management fee rate was .53% of the Fund's average net assets.
Distribution and Service Plan Fees. In accordance with Rule 12b-1 of the 1940 Act, the Fund has adopted separate Distribution and Service Plans for each class of shares. Certain classes pay Fidelity Distributors Company LLC (FDC), an affiliate of the investment adviser, separate Distribution and Service Fees, each of which is based on an annual percentage of each class' average net assets. In addition, FDC may pay financial intermediaries for selling shares of the Fund and providing shareholder support services. For the period, the Distribution and Service Fee rates, total fees and amounts retained by FDC were as follows:
| | Distribution Fee | Service Fee | Total Fees | Retained by FDC |
| Class A | - % | .25% | $ 364,590 | $ 2,111 |
| Class M | .25% | .25% | 158,438 | - |
| Class C | .75% | .25% | 423,065 | 25,719 |
| | | | $ 946,093 | $ 27,830 |
Sales Load. FDC may receive a front-end sales charge of up to 5.75% for selling Class A shares and 3.50% for selling Class M shares, some of which is paid to financial intermediaries for selling shares of the Fund. Depending on the holding period, FDC may receive contingent deferred sales charges levied on Class A, Class M and Class C redemptions. The deferred sales charges are 1.00% for Class C shares, 1.00% for certain purchases of Class A shares and .25% for certain purchases of Class M shares.
For the period, sales charge amounts retained by FDC were as follows:
| | Retained by FDC |
| Class A | $ 52,247 |
| Class M | 5,888 |
Class C A | 397 |
| | $ 58,532 |
A When Class C shares are initially sold, FDC pays commissions from its own resources to financial intermediaries through which the sales are made.
Transfer Agent Fees. Fidelity Investments Institutional Operations Company LLC (FIIOC), an affiliate of the investment adviser, is the transfer, dividend disbursing and shareholder servicing agent for each class of the Fund. FIIOC receives account fees and asset-based fees that vary according to the account size and type of account of the shareholders of the respective classes of the Fund, except for Class Z. FIIOC receives an asset-based fee of Class Z's average net assets. FIIOC pays for typesetting, printing and mailing of shareholder reports, except proxy statements.
For the period, transfer agent fees for each class were as follows:
| | Amount | % of Class-Level Average Net Assets A |
| Class A | $ 278,361 | .19 |
| Class M | 64,717 | .20 |
| Class C | 82,060 | .19 |
| Consumer Staples | 760,980 | .16 |
| Class I | 131,720 | .17 |
| Class Z | 16,154 | .04 |
| | $ 1,333,992 | |
A Annualized
Accounting Fees. Fidelity Service Company, Inc. (FSC), an affiliate of the investment adviser, maintains the Fund's accounting records. The accounting fee is based on the level of average net assets for each month. For the period, the fees were equivalent to the following annualized rates:
| | % of Average Net Assets |
| Consumer Staples Portfolio | .03 |
Brokerage Commissions. A portion of portfolio transactions were placed with brokerage firms which are affiliates of the investment adviser. Brokerage commissions are included in net realized gain (loss) and change in net unrealized appreciation (depreciation) in the Statement of Operations. The commissions paid to these affiliated firms were as follows:
| | |
| | Amount |
| Consumer Staples Portfolio | $ 11,391 |
Interfund Lending Program. Pursuant to an Exemptive Order issued by the Securities and Exchange Commission (the SEC), the Fund, along with other registered investment companies having management contracts with Fidelity Management & Research Company LLC (FMR), or other affiliated entities of FMR, may participate in an interfund lending program. This program provides an alternative credit facility allowing the Fund to borrow from, or lend money to, other participating affiliated funds. At period end, there were no interfund loans outstanding. Activity in this program during the period for which loans were outstanding was as follows:
| | Borrower or Lender | Average Loan Balance | Weighted Average Interest Rate | Interest Expense |
| Consumer Staples Portfolio | Borrower | $ 7,946,818 | 1.06% | $ 2,586 |
Interfund Trades. Funds may purchase from or sell securities to other Fidelity Funds under procedures adopted by the Board. The procedures have been designed to ensure these interfund trades are executed in accordance with Rule 17a-7 of the 1940 Act. Any interfund trades are included within the respective purchases and sales amounts shown in the Purchases and Sales of Investments note. Interfund trades during the period are noted in the table below.
| | Purchases ($) | Sales ($) | Realized Gain (Loss) ($) |
| Consumer Staples Portfolio | 40,514,132 | 41,868,297 | (636,516) |
6. Committed Line of Credit.
Certain Funds participate with other funds managed by the investment adviser or an affiliate in a $4.25 billion credit facility (the "line of credit") to be utilized for temporary or emergency purposes to fund shareholder redemptions or for other short-term liquidity purposes. The participating funds have agreed to pay commitment fees on their pro-rata portion of the line of credit, which are reflected in Miscellaneous expenses on the Statement of Operations, and are listed below. During the period, there were no borrowings on this line of credit.
| | Amount |
| Consumer Staples Portfolio | $ 1,438 |
7. Security Lending.
Funds lend portfolio securities from time to time in order to earn additional income. Lending agents are used, including National Financial Services (NFS), an affiliate of the investment adviser. Pursuant to a securities lending agreement, NFS will receive a fee, which is capped at 9.9% of a fund's daily lending revenue, for its services as lending agent. A fund may lend securities to certain qualified borrowers, including NFS. On the settlement date of the loan, a fund receives collateral (in the form of U.S. Treasury obligations, letters of credit and/or cash) against the loaned securities and maintains collateral in an amount not less than 100% of the market value of the loaned securities during the period of the loan. The market value of the loaned securities is determined at the close of business of a fund and any additional required collateral is delivered to a fund on the next business day. A fund or borrower may terminate the loan at any time, and if the borrower defaults on its obligation to return the securities loaned because of insolvency or other reasons, a fund may apply collateral received from the borrower against the obligation. A fund may experience delays and costs in recovering the securities loaned. Any cash collateral received is invested in the Fidelity Securities Lending Cash Central Fund. Any loaned securities are identified as such in the Schedule of Investments, and the value of loaned securities and cash collateral at period end, as applicable, are presented in the Statement of Assets and Liabilities. Security lending income represents the income earned on investing cash collateral, less rebates paid to borrowers and any lending agent fees associated with the loan, plus any premium payments received for lending certain types of securities. Security lending income is presented in the Statement of Operations as a component of income from Fidelity Central Funds. Affiliated security lending activity, if any, was as follows:
| | Total Security Lending Fees Paid to NFS | Security Lending Income From Securities Loaned to NFS | Value of Securities Loaned to NFS at Period End |
| Consumer Staples Portfolio | $ 1,642 | $ - | $- |
8. Expense Reductions.
Through arrangements with the Fund's custodian, credits realized as a result of certain uninvested cash balances were used to reduce the Fund's expenses. During the period, custodian credits reduced the Fund's expenses by $17.
In addition, during the period the investment adviser or an affiliate reimbursed and/or waived a portion of fund-level operating expenses in the amount of $25,575.
9. Distributions to Shareholders.
Distributions to shareholders of each class were as follows:
| | Six months ended August 31, 2022 | Year ended February 28, 2022 |
| Consumer Staples Portfolio | | |
| Distributions to shareholders | | |
| Class A | $ 6,291,135 | $28,728,133 |
| Class M | 1,312,252 | 6,378,016 |
| Class C | 1,630,664 | 9,724,881 |
| Consumer Staples | 22,510,952 | 88,326,666 |
| Class I | 3,440,575 | 14,778,169 |
| Class Z | 1,761,268 | 5,478,967 |
Total | $ 36,946,846 | $ 153,414,832 |
10. Share Transactions.
Share transactions for each class were as follows and may contain in-kind transactions, automatic conversions between classes or exchanges between affiliated funds:
| | Shares | Shares | Dollars | Dollars |
| | Six months ended August 31, 2022 | Year ended February 28, 2022 | Six months ended August 31, 2022 | Year ended February 28, 2022 |
| Consumer Staples Portfolio | | | | |
| Class A | | | | |
| Shares sold | 305,580 | 512,430 | $ 28,236,826 | $ 49,258,142 |
| Reinvestment of distributions | 64,640 | 295,095 | 6,094,871 | 27,710,518 |
| Shares redeemed | (224,239) | (514,641) | (20,667,513) | (49,392,846) |
| Net increase (decrease) | 145,981 | 292,884 | $ 13,664,184 | $ 27,575,814 |
| Class M | | | | |
| Shares sold | 42,814 | 69,762 | $ 3,887,131 | $ 6,632,101 |
| Reinvestment of distributions | 13,993 | 68,289 | 1,305,149 | 6,339,502 |
| Shares redeemed | (41,744) | (93,262) | (3,790,659) | (8,856,119) |
| Net increase (decrease) | 15,063 | 44,789 | $ 1,401,621 | $ 4,115,484 |
| Class C | | | | |
| Shares sold | 78,223 | 80,488 | $ 6,995,287 | $ 7,503,197 |
| Reinvestment of distributions | 17,604 | 105,499 | 1,613,732 | 9,608,492 |
| Shares redeemed | (120,976) | (437,630) | (10,752,756) | (40,618,649) |
| Net increase (decrease) | (25,149) | (251,643) | $ (2,143,737) | $ (23,506,960) |
| Consumer Staples | | | | |
| Shares sold | 1,427,689 | 3,003,388 | $ 134,099,466 | $ 293,188,867 |
| Reinvestment of distributions | 218,881 | 851,019 | 20,900,039 | 80,858,070 |
| Shares redeemed | (2,567,039) | (1,702,337) | (235,464,693) | (165,649,882) |
| Net increase (decrease) | (920,469) | 2,152,070 | $ (80,465,188) | $ 208,397,055 |
| Class I | | | | |
| Shares sold | 510,125 | 366,907 | $ 47,490,526 | $ 35,605,195 |
| Reinvestment of distributions | 34,078 | 144,626 | 3,237,605 | 13,704,710 |
| Shares redeemed | (290,742) | (439,361) | (26,910,943) | (42,622,622) |
| Net increase (decrease) | 253,461 | 72,172 | $ 23,817,188 | $ 6,687,283 |
| Class Z | | | | |
| Shares sold | 351,460 | 567,361 | $ 33,000,383 | $ 55,256,648 |
| Reinvestment of distributions | 17,481 | 53,280 | 1,659,504 | 5,041,341 |
| Shares redeemed | (283,987) | (296,902) | (26,085,038) | (28,764,496) |
| Net increase (decrease) | 84,954 | 323,739 | $ 8,574,849 | $ 31,533,493 |
11. Other.
A fund's organizational documents provide former and current trustees and officers with a limited indemnification against liabilities arising in connection with the performance of their duties to the fund. In the normal course of business, a fund may also enter into contracts that provide general indemnifications. A fund's maximum exposure under these arrangements is unknown as this would be dependent on future claims that may be made against a fund. The risk of material loss from such claims is considered remote.
12. Risk and Uncertainties.
Many factors affect a fund's performance. Developments that disrupt global economies and financial markets, such as pandemics, epidemics, outbreaks of infectious diseases, war, terrorism, and environmental disasters, may significantly affect a fund's investment performance. The effects of these developments to a fund will be impacted by the types of securities in which a fund invests, the financial condition, industry, economic sector, and geographic location of an issuer, and a fund's level of investment in the securities of that issuer.
As a shareholder, you incur two types of costs: (1) transaction costs, which may include sales charges (loads) on purchase payments or redemption proceeds, as applicable and (2) ongoing costs, which generally include management fees, distribution and/or service (12b-1) fees and other Fund expenses. This Example is intended to help you understand your ongoing costs (in dollars) of investing in a fund and to compare these costs with the ongoing costs of investing in other mutual funds.
| The Example is based on an investment of $1,000 invested at the beginning of the period and held for the entire period (March 1, 2022 to August 31, 2022). |
Actual Expenses
The first line of the accompanying table provides information about actual account values and actual expenses. You may use the information in this line, together with the amount you invested, to estimate the expenses that you paid over the period. Simply divide your account value by $1,000.00 (for example, an $8,600 account value divided by $1,000.00 = 8.6), then multiply the result by the number in the first line for a class/Fund under the heading entitled "Expenses Paid During Period" to estimate the expenses you paid on your account during this period. If any fund is a shareholder of any underlying mutual funds or exchange-traded funds (ETFs) (the Underlying Funds), such fund indirectly bears its proportional share of the expenses of the Underlying Funds in addition to the direct expenses incurred presented in the table. These fees and expenses are not included in the annualized expense ratio used to calculate the expense estimate in the table below.
Hypothetical Example for Comparison Purposes
The second line of the accompanying table provides information about hypothetical account values and hypothetical expenses based on the actual expense ratio and an assumed rate of return of 5% per year before expenses, which is not the actual return. The hypothetical account values and expenses may not be used to estimate the actual ending account balance or expenses you paid for the period. You may use this information to compare the ongoing costs of investing in the Fund and other funds. To do so, compare this 5% hypothetical example with the 5% hypothetical examples that appear in the shareholder reports of the other funds. If any fund is a shareholder of any Underlying Funds, such fund indirectly bears its proportional share of the expenses of the Underlying Funds in addition to the direct expenses as presented in the table. These fees and expenses are not included in the annualized expense ratio used to calculate the expense estimate in the table below.
Please note that the expenses shown in the table are meant to highlight your ongoing costs only and do not reflect any transaction costs. Therefore, the second line of the table is useful in comparing ongoing costs only, and will not help you determine the relative total costs of owning different funds. In addition, if these transactional costs were included, your costs would have been higher.
| | | | | Annualized Expense Ratio- A | | Beginning Account Value March 1, 2022 | | Ending Account Value August 31, 2022 | | Expenses Paid During Period- C March 1, 2022 to August 31, 2022 |
| Consumer Staples Portfolio | | | | | | | | | | |
| Class A | | | | 1.01% | | | | | | |
| Actual | | | | | | $ 1,000 | | $ 961.60 | | $ 4.99 |
Hypothetical- B | | | | | | $ 1,000 | | $ 1,020.11 | | $ 5.14 |
| Class M | | | | 1.27% | | | | | | |
| Actual | | | | | | $ 1,000 | | $ 960.30 | | $ 6.28 |
Hypothetical- B | | | | | | $ 1,000 | | $ 1,018.80 | | $ 6.46 |
| Class C | | | | 1.76% | | | | | | |
| Actual | | | | | | $ 1,000 | | $ 958.00 | | $ 8.69 |
Hypothetical- B | | | | | | $ 1,000 | | $ 1,016.33 | | $ 8.94 |
| Consumer Staples Portfolio | | | | .73% | | | | | | |
| Actual | | | | | | $ 1,000 | | $ 962.90 | | $ 3.61 |
Hypothetical- B | | | | | | $ 1,000 | | $ 1,021.53 | | $ 3.72 |
| Class I | | | | .74% | | | | | | |
| Actual | | | | | | $ 1,000 | | $ 962.90 | | $ 3.66 |
Hypothetical- B | | | | | | $ 1,000 | | $ 1,021.48 | | $ 3.77 |
| Class Z | | | | .61% | | | | | | |
| Actual | | | | | | $ 1,000 | | $ 963.50 | | $ 3.02 |
Hypothetical- B | | | | | | $ 1,000 | | $ 1,022.13 | | $ 3.11 |
| |
A Annualized expense ratio reflects expenses net of applicable fee waivers.
B 5% return per year before expenses
C Expenses are equal to the annualized expense ratio, multiplied by the average account value over the period, multiplied by 184/ 365 (to reflect the one-half year period). The fees and expenses of any Underlying Funds are not included in each annualized expense ratio.
Consumer Staples Portfolio
Each year, the Board of Trustees, including the Independent Trustees (together, the Board), votes on the renewal of the management contract with Fidelity Management & Research Company LLC (FMR) and the sub-advisory agreements (together, the Advisory Contracts) for the fund. FMR and the sub-advisers are referred to herein as the Investment Advisers. The Board, assisted by the advice of fund counsel and Independent Trustees' counsel, requests and considers a broad range of information relevant to the renewal of the Advisory Contracts throughout the year.
The Board meets regularly and, at each of its meetings, covers an extensive agenda of topics and materials and considers factors that are relevant to its annual consideration of the renewal of the fund's Advisory Contracts, including the services and support provided to the fund and its shareholders. The Board has established various standing committees (Committees), each composed of and chaired by Independent Trustees with varying backgrounds, to which the Board has assigned specific subject matter responsibilities in order to enhance effective decision-making by the Board. The Board, acting directly and through its Committees, requests and receives information concerning the annual consideration of the renewal of the fund's Advisory Contracts. The Board also meets as needed to review matters specifically related to the Board's annual consideration of the renewal of the Advisory Contracts. Members of the Board may also meet with trustees of other Fidelity funds through joint ad hoc committees to discuss certain matters relevant to all of the Fidelity funds.
At its May 2022 meeting, the Board unanimously determined to renew the fund's Advisory Contracts. In reaching its determination, the Board considered all factors it believed relevant, including (i) the nature, extent, and quality of the services provided to the fund and its shareholders (including the investment performance of the fund); (ii) the competitiveness relative to peer funds of the fund's management fee and the total expense ratio of a representative class (retail class); (iii) the total costs of the services provided by and the profits realized by Fidelity from its relationships with the fund; and (iv) the extent to which, if any, economies of scale exist and are realized as the fund grows, and whether any economies of scale are appropriately shared with fund shareholders.
In considering whether to renew the Advisory Contracts for the fund, the Board reached a determination, with the assistance of fund counsel and Independent Trustees' counsel and through the exercise of its business judgment, that the renewal of the Advisory Contracts was in the best interests of the fund and its shareholders and that the compensation payable under the Advisory Contracts was fair and reasonable. The Board's decision to renew the Advisory Contracts was not based on any single factor, but rather was based on a comprehensive consideration of all the information provided to the Board at its meetings throughout the year. The Board, in reaching its determination to renew the Advisory Contracts, was aware that shareholders of the fund have a broad range of investment choices available to them, including a wide choice among funds offered by Fidelity's competitors, and that the fund's shareholders, who have the opportunity to review and weigh the disclosure provided by the fund in its prospectus and other public disclosures, have chosen to invest in this fund, which is part of the Fidelity family of funds.
Nature, Extent, and Quality of Services Provided. The Board considered Fidelity's staffing as it relates to the fund, including the backgrounds of investment personnel of Fidelity, and also considered the fund's investment objective, strategies, and related investment philosophy. The Independent Trustees also had discussions with senior management of Fidelity's investment operations and investment groups. The Board considered the structure of the investment personnel compensation program and whether this structure provides appropriate incentives to act in the best interests of the fund. Additionally, the Board considered the portfolio managers' investments, if any, in the funds that they manage. The Board also considered the steps Fidelity had taken to ensure the continued provision of high quality services to the Fidelity funds during the COVID-19 pandemic, including the expansion of staff in client facing positions to maintain service levels in periods of high volumes and volatility.
Resources Dedicated to Investment Management and Support Services . The Board and the Fund Oversight and Research Committees reviewed the general qualifications and capabilities of Fidelity's investment staff, including its size, education, experience, and resources, as well as Fidelity's approach to recruiting, training, managing, and compensating investment personnel. The Board noted the resources devoted to expansion of Fidelity's global investment organization, and that Fidelity's analysts have extensive resources, tools, and capabilities that allow them to conduct sophisticated quantitative and fundamental analysis, as well as credit analysis of issuers, counterparties, and guarantors. Further, the Board considered that Fidelity's investment professionals have sufficient access to global information and data so as to provide competitive investment results over time, and that those professionals also have access to sophisticated tools that permit them to assess portfolio construction and risk and performance attribution characteristics continuously, as well as to transmit new information and research conclusions rapidly around the world. Additionally, in its deliberations, the Board considered Fidelity's trading, risk management, compliance, and technology and operations capabilities and resources, which are integral parts of the investment management process.
Shareholder and Administrative Services . The Board considered (i) the nature, extent, quality, and cost of advisory, administrative, and shareholder services performed by the Investment Advisers and their affiliates under the Advisory Contracts and under separate agreements covering transfer agency, pricing and bookkeeping, and securities lending services for the fund; (ii) the nature and extent of the supervision of third party service providers, principally custodians, subcustodians, and pricing vendors; and (iii) the resources devoted to, and the record of compliance with, the fund's compliance policies and procedures. The Board also reviewed the allocation of fund brokerage, including allocations to brokers affiliated with the Investment Advisers, the use of brokerage commissions to pay fund expenses, and the use of "soft" commission dollars to pay for research services.
The Board noted that the growth of fund assets over time across the complex allows Fidelity to reinvest in the development of services designed to enhance the value and convenience of the Fidelity funds as investment vehicles. These services include 24-hour access to account information and market information over the Internet and through telephone representatives, investor education materials, and asset allocation tools. The Board also considered that it reviews customer service metrics such as telephone response times, continuity of services on the website and metrics addressing services at Fidelity Investor Centers.
Investment in a Large Fund Family . The Board considered the benefits to shareholders of investing in a Fidelity fund, including the benefits of investing in a fund that is part of a large family of funds offering a variety of investment disciplines and providing a large variety of mutual fund investor services. The Board noted that Fidelity had taken, or had made recommendations that resulted in the Fidelity funds taking, a number of actions over the previous year that benefited particular funds, including: (i) continuing to dedicate additional resources to Fidelity's investment research process, which includes meetings with management of issuers of securities in which the funds invest; (ii) continuing efforts to enhance Fidelity's global research capabilities; (iii) launching new funds and ETFs with innovative structures, strategies and pricing and making other enhancements to meet client needs; (iv) launching new share classes of existing funds; (v) eliminating purchase minimums and broadening eligibility requirements for certain funds and share classes; (vi) reducing management fees and total expenses for certain target date funds and classes and index funds; (vii) lowering expenses for certain existing funds and classes by implementing or lowering expense caps; (viii) rationalizing product lines and gaining increased efficiencies from fund mergers and liquidations; (ix) continuing to develop, acquire and implement systems and technology to improve services to the funds and shareholders, strengthen information security, and increase efficiency; and (x) continuing to implement enhancements to further strengthen Fidelity's product line to increase investors' probability of success in achieving their investment goals, including retirement income goals.
Investment Performance . The Board considered whether the fund has operated in accordance with its investment objective, as well as its record of compliance with its investment restrictions and its performance history. The Board noted that the fund had a portfolio manager change in November 2019 and July 2020. The Board will continue to monitor closely the fund's performance, taking into account the portfolio manager change.
The Board took into account discussions that occur at Board meetings throughout the year with representatives of the Investment Advisers about fund investment performance. In this regard the Board noted that as part of regularly scheduled fund reviews and other reports to the Board on fund performance, the Board considers annualized return information for the fund for different time periods, measured against an appropriate securities market index (benchmark index). The Board also reviews and considers information about performance attribution. In its evaluation of fund investment performance, the Board gave particular attention to information indicating changes in performance of certain Fidelity funds for specific time periods and discussed with the Investment Advisers the reasons for any overperformance or underperformance.
In addition to reviewing absolute and relative fund performance, the Independent Trustees periodically consider the appropriateness of fund performance metrics in evaluating the results achieved. In general, the Independent Trustees believe that fund performance should be evaluated based on net performance (after fees and expenses) of the representative class, compared to appropriate benchmark indices, over appropriate time periods that may include full market cycles, taking into account relevant factors including the following: general market conditions; issuer-specific information; and fund cash flows and other factors.
The Independent Trustees recognize that shareholders evaluate performance on a net basis over their own holding periods, for which one-, three-, and five-year periods are often used as a proxy. For this reason, the performance information reviewed by the Board also included net cumulative total return information for the fund and an appropriate benchmark index for the most recent one-, three-, and five-year periods ended September 30, 2021, as shown below.
Consumer Staples Portfolio
Based on its review, the Board concluded that the nature, extent, and quality of services provided to the fund under the Advisory Contracts should continue to benefit the shareholders of the fund.
Competitiveness of Management Fee and Total Expense Ratio . The Board considered the fund's management fee and total expense ratio compared to "mapped groups" of competitive funds and classes created for the purpose of facilitating the Trustees' competitive analysis of management fees and total expenses. Fidelity creates "mapped groups" by combining similar Lipper investment objective categories that have comparable investment mandates. For this purpose, all sector focused equity funds are grouped in the same mapped group. Combining Lipper investment objective categories aids the Board's management fee and total expense ratio comparisons by broadening the competitive group used for comparison.
Management Fee . The Board considered two proprietary management fee comparisons for the 12-month periods ended September 30 (June 30 for periods ended 2019 and 2018 and December 31 for periods prior to 2018) shown in basis points (BP) in the chart below. The group of Lipper funds used by the Board for management fee comparisons is referred to below as the "Total Mapped Group." The Total Mapped Group comparison focuses on a fund's standing in terms of gross management fees before expense reimbursements or caps relative to the total universe of funds with comparable investment mandates (i.e., sector equities), regardless of whether their management fee structures also are comparable. Funds with comparable management fee structures have similar management fee contractual arrangements (e.g., flat rate charged for advisory services, all-inclusive fee rate, etc.). "TMG %" represents the percentage of funds in the Total Mapped Group that had management fees that were lower than the fund's. For example, a hypothetical TMG % of 20% would mean that 80% of the funds in the Total Mapped Group had higher, and 20% had lower, management fees than the fund. The fund's actual TMG %s and the number of funds in the Total Mapped Group are in the chart below. The "Asset-Sized Peer Group" (ASPG) comparison focuses on a fund's standing relative to a subset of non-Fidelity funds within the Total Mapped Group that are similar in size and management fee structure. For example, if a fund is in the first quartile of the ASPG, the fund's management fee ranks in the least expensive or lowest 25% of funds in the ASPG. The ASPG represents at least 15% of the funds in the Total Mapped Group with comparable asset size and management fee structures, subject to a minimum of 50 funds (or all funds in the Total Mapped Group if fewer than 50). Additional information, such as the ASPG quartile in which the fund's management fee rate ranked, is also included in the chart and was considered by the Board.
Consumer Staples Portfolio
The Board noted that the fund's management fee rate ranked below the median of its Total Mapped Group and below the median of its ASPG for the 12-month period ended September 30, 2021.
The Board also considered that, for funds subject to the group fee, FMR agreed to voluntarily waive fees over a specified period of time in amounts designed to account for assets converted from certain funds to certain collective investment trusts.
Based on its review, the Board concluded that the fund's management fee is fair and reasonable in light of the services that the fund receives and the other factors considered.
Total Expense Ratio . In its review of the total expense ratio of the representative class (retail class), the Board considered the fund's management fee rate as well as other fund or class expenses, as applicable, such as transfer agent fees, pricing and bookkeeping fees, fund-paid 12b-1 fees, and custodial, legal, and audit fees. The Board also noted that Fidelity may agree to waive fees or reimburse expenses from time to time, and the extent to which, if any, it has done so for the fund. The fund's representative class is compared to those funds and classes in the Total Mapped Group (used by the Board for management fee comparisons) that have a similar sales load structure. The Board also considered a total expense ASPG comparison, which focuses on the total expenses of the representative class relative to a subset of non-Fidelity funds within the total expense similar sales load structure group. The total expense ASPG is limited to 15 larger and 15 smaller classes in fund average assets for a total of 30 classes, where possible. The total expense ASPG comparison excludes performance adjustments and fund-paid 12b-1 fees to eliminate variability in fee structures.
The Board noted that the total net expense ratio of the retail class ranked below the similar sales load structure group competitive median and below the ASPG competitive median for the 12-month period ended September 30, 2021.
Fees Charged to Other Fidelity Clients . The Board also considered Fidelity fee structures and other information with respect to clients of Fidelity, such as other funds advised or subadvised by Fidelity, pension plan clients, and other institutional clients with similar mandates. The Board noted that a joint ad hoc committee created by it and the boards of other Fidelity funds periodically reviews and compares Fidelity's institutional investment advisory business with its business of providing services to the Fidelity funds and also noted the most recent findings of the committee. The Board noted that the committee's review included a consideration of the differences in services provided, fees charged, and costs incurred, as well as competition in the markets serving the different categories of clients.
Based on its review of total expense ratios and fees charged to other Fidelity clients, the Board concluded that the total expense ratio of each class of the fund was reasonable in light of the services that the fund and its shareholders receive and the other factors considered.
Costs of the Services and Profitability. The Board considered the revenues earned and the expenses incurred by Fidelity in conducting the business of developing, marketing, distributing, managing, administering and servicing the fund and servicing the fund's shareholders. The Board also considered the level of Fidelity's profits in respect of all the Fidelity funds.
On an annual basis, Fidelity presents to the Board information about the profitability of its relationships with the fund. Fidelity calculates profitability information for each fund, as well as aggregate profitability information for groups of Fidelity funds and all Fidelity funds, using a series of detailed revenue and cost allocation methodologies which originate with the books and records of Fidelity on which Fidelity's audited financial statements are based. The Audit Committee of the Board reviews any significant changes from the prior year's methodologies and the full Board approves such changes.
A public accounting firm has been engaged annually by the Board as part of the Board's assessment of Fidelity's profitability analysis. The engagement includes the review and assessment of the methodologies used by Fidelity in determining the revenues and expenses attributable to Fidelity's mutual fund business, and completion of agreed-upon procedures in respect of the mathematical accuracy of certain fund profitability information and its conformity to established allocation methodologies. After considering the reports issued under the engagement and information provided by Fidelity, the Board concluded that while other allocation methods may also be reasonable, Fidelity's profitability methodologies are reasonable in all material respects.
The Board also reviewed Fidelity's non-fund businesses and potential indirect benefits such businesses may have received as a result of their association with Fidelity's mutual fund business (i.e., fall-out benefits) as well as cases where Fidelity's affiliates may benefit from the funds' business. The Board considered areas where potential indirect benefits to the Fidelity funds from their relationships with Fidelity may exist. The Board's consideration of these matters was informed by the findings of a joint ad hoc committee created by it and the boards of other Fidelity funds to evaluate potential fall-out benefits.
The Board considered the costs of the services provided by and the profits realized by Fidelity in connection with the operation of the fund and was satisfied that the profitability was not excessive.
Economies of Scale . The Board considered whether there have been economies of scale in respect of the management of the Fidelity funds, whether the Fidelity funds (including the fund) have appropriately benefited from any such economies of scale, and whether there is potential for realization of any further economies of scale. The Board considered the extent to which the fund will benefit from economies of scale as assets grow through increased services to the fund, through waivers or reimbursements, or through fee or expense ratio reductions. The Board also noted that a committee (the Economies of Scale Committee) created by it and the boards of other Fidelity funds periodically analyzes whether Fidelity attains economies of scale in respect of the management and servicing of the Fidelity funds, whether the Fidelity funds have appropriately benefited from such economies of scale, and whether there is potential for realization of any further economies of scale.
The Board recognized that the fund's management contract incorporates a "group fee" structure, which provides for lower group fee rates as total "group assets" increase, and for higher group fee rates as total "group assets" decrease ("group assets" as defined in the management contract). FMR calculates the group fee rates based on a tiered asset "breakpoint" schedule that varies based on asset class. The Board considered that the group fee is designed to deliver the benefits of economies of scale to fund shareholders when total Fidelity fund assets increase, even if assets of any particular fund are unchanged or have declined, because some portion of Fidelity's costs are attributable to services provided to all Fidelity funds, and all funds benefit if those costs can be allocated among more assets. The Board further considered that Fidelity agreed to impose a temporary fee waiver in the form of additional breakpoints to the current breakpoint schedule. The Board concluded that, given the group fee structure, fund shareholders will benefit from lower management fees as "group assets" increase at the fund complex level, regardless of whether Fidelity achieves any such economies of scale.
The Board concluded, taking into account the analysis of the Economies of Scale Committee, that economies of scale, if any, are being appropriately shared between fund shareholders and Fidelity.
Additional Information Requested by the Board. In order to develop fully the factual basis for consideration of the Fidelity funds' advisory contracts, the Board requested and received additional information on certain topics, including: (i) fund flow and performance trends, in particular the underperformance of certain funds and strategies, and Fidelity's long-term strategies for certain funds, including any consideration of fund liquidations or mergers; (ii) the operation of performance fees, competitor use of performance fees, and consideration of the expansion of performance fees to additional funds; (iii) Fidelity's pricing philosophy compared to competitors; (iv) fund profitability methodology and data; (v) evaluation of competitive fund data and peer group classifications and fee and expense comparisons; (vi) the management fee and expense structures for different funds and classes and information about the differences between various fee and expense structures; (vii) group fee breakpoints and related voluntary fee waivers; and (viii) information regarding other accounts managed by Fidelity and the funds' sub-advisory arrangements.
Based on its evaluation of all of the conclusions noted above, and after considering all factors it believed relevant, the Board concluded that the advisory fee arrangements are fair and reasonable and that the fund's Advisory Contracts should be renewed.
1.846045.115
SELCS-SANN-1022
Fidelity® Select Portfolios®
Utilities Sector
Utilities Portfolio
Semi-Annual Report
August 31, 2022
Contents
To view a fund's proxy voting guidelines and proxy voting record for the 12-month period ended June 30, visit http://www.fidelity.com/proxyvotingresults or visit the Securities and Exchange Commission's (SEC) web site at http://www.sec.gov.
You may also call 1-800-544-8544 to request a free copy of the proxy voting guidelines.
Standard & Poor's, S&P and S&P 500 are registered service marks of The McGraw-Hill Companies, Inc. and have been licensed for use by Fidelity Distributors Corporation.
Other third-party marks appearing herein are the property of their respective owners.
All other marks appearing herein are registered or unregistered trademarks or service marks of FMR LLC or an affiliated company. © 2022 FMR LLC. All rights reserved.
This report and the financial statements contained herein are submitted for the general information of the shareholders of the Fund. This report is not authorized for distribution to prospective investors in the Fund unless preceded or accompanied by an effective prospectus.
A fund files its complete schedule of portfolio holdings with the SEC for the first and third quarters of each fiscal year on Form N-PORT. Forms N-PORT are available on the SEC's web site at http://www.sec.gov. A fund's Forms N-PORT may be reviewed and copied at the SEC's Public Reference Room in Washington, DC. Information regarding the operation of the SEC's Public Reference Room may be obtained by calling 1-800-SEC-0330.
For a complete list of a fund's portfolio holdings, view the most recent holdings listing, semiannual report, or annual report on Fidelity's web site at http://www.fidelity.com, http://www.institutional.fidelity.com, or http://www.401k.com, as applicable.
NOT FDIC INSURED •MAY LOSE VALUE •NO BANK GUARANTEE
Neither the Fund nor Fidelity Distributors Corporation is a bank.
Top Holdings (% of Fund's net assets) |
| |
| NextEra Energy, Inc. | 14.3 | |
| Southern Co. | 11.4 | |
| Sempra Energy | 6.3 | |
| Constellation Energy Corp. | 4.4 | |
| Exelon Corp. | 4.4 | |
| PPL Corp. | 4.0 | |
| PG&E Corp. | 4.0 | |
| American Electric Power Co., Inc. | 3.9 | |
| Edison International | 3.5 | |
| NiSource, Inc. | 3.4 | |
| | 59.6 | |
| |
| Industries (% of Fund's net assets) |
| |
| Electric Utilities | 66.8 | |
| Multi-Utilities | 19.1 | |
| Independent Power and Renewable Electricity Producers | 7.5 | |
| Diversified Telecommunication Services | 1.0 | |
| Gas Utilities | 0.7 | |
| |
Showing Percentage of Net Assets
| Common Stocks - 95.1% |
| | | Shares | Value ($) |
| Diversified Telecommunication Services - 1.0% | | | |
| Integrated Telecommunication Services - 1.0% | | | |
| AT&T, Inc. | | 880,400 | 15,442,216 |
| Electric Utilities - 66.8% | | | |
| Electric Utilities - 66.8% | | | |
| American Electric Power Co., Inc. | | 612,350 | 61,357,470 |
| Avangrid, Inc. (a) | | 239,925 | 11,852,295 |
| Constellation Energy Corp. | | 847,090 | 69,114,073 |
| Duke Energy Corp. | | 499,547 | 53,406,570 |
| Edison International | | 797,110 | 54,020,145 |
| Entergy Corp. | | 396,800 | 45,751,040 |
| Evergy, Inc. | | 44,804 | 3,070,418 |
| Eversource Energy | | 567,784 | 50,924,547 |
| Exelon Corp. | | 1,553,389 | 68,209,311 |
| FirstEnergy Corp. | | 912,384 | 36,084,787 |
| NextEra Energy, Inc. | | 2,620,489 | 222,898,792 |
| OGE Energy Corp. (a) | | 423,648 | 17,174,690 |
| PG&E Corp. (a)(b) | | 4,991,766 | 61,548,475 |
| PNM Resources, Inc. | | 24,727 | 1,172,802 |
| PPL Corp. | | 2,153,900 | 62,635,412 |
| Southern Co. | | 2,307,965 | 177,874,863 |
| Xcel Energy, Inc. | | 586,800 | 43,569,900 |
| | | | 1,040,665,590 |
| Gas Utilities - 0.7% | | | |
| Gas Utilities - 0.7% | | | |
| Southwest Gas Corp. | | 146,000 | 11,366,100 |
| Independent Power and Renewable Electricity Producers - 7.5% | | | |
| Independent Power Producers & Energy Traders - 5.4% | | | |
| Clearway Energy, Inc.: | | | |
| Class A | | 166,124 | 5,727,956 |
| Class C | | 65,958 | 2,447,042 |
| Energy Harbor Corp. (b) | | 118,500 | 9,065,250 |
| The AES Corp. | | 1,598,515 | 40,682,207 |
| Vistra Corp. | | 1,074,597 | 26,596,276 |
| | | | 84,518,731 |
| Renewable Electricity - 2.1% | | | |
| NextEra Energy Partners LP (a) | | 322,575 | 26,480,182 |
| Sunnova Energy International, Inc. (a)(b) | | 210,300 | 5,303,766 |
| | | | 31,783,948 |
TOTAL INDEPENDENT POWER AND RENEWABLE ELECTRICITY PRODUCERS | | | 116,302,679 |
| Multi-Utilities - 19.1% | | | |
| Multi-Utilities - 19.1% | | | |
| CenterPoint Energy, Inc. | | 1,204,708 | 37,984,443 |
| Consolidated Edison, Inc. | | 127,200 | 12,432,528 |
| Dominion Energy, Inc. | | 622,560 | 50,925,408 |
| NiSource, Inc. | | 1,826,419 | 53,897,625 |
| Public Service Enterprise Group, Inc. | | 706,903 | 45,496,277 |
| Sempra Energy | | 592,171 | 97,690,450 |
| | | | 298,426,731 |
| TOTAL COMMON STOCKS (Cost $1,138,101,812) | | | 1,482,203,316 |
| | | | |
| Money Market Funds - 8.8% |
| | | Shares | Value ($) |
| Fidelity Cash Central Fund 2.33% (c) | | 85,507,854 | 85,524,955 |
| Fidelity Securities Lending Cash Central Fund 2.34% (c)(d) | | 50,770,298 | 50,775,375 |
| TOTAL MONEY MARKET FUNDS (Cost $136,300,330) | | | 136,300,330 |
| | | | |
| TOTAL INVESTMENT IN SECURITIES - 103.9% (Cost $1,274,402,142) | 1,618,503,646 |
NET OTHER ASSETS (LIABILITIES) - (3.9)% | (60,340,810) |
| NET ASSETS - 100.0% | 1,558,162,836 |
| | |
Legend
| (a) | Security or a portion of the security is on loan at period end. |
| (c) | Affiliated fund that is generally available only to investment companies and other accounts managed by Fidelity Investments. The rate quoted is the annualized seven-day yield of the fund at period end. A complete unaudited listing of the fund's holdings as of its most recent quarter end is available upon request. In addition, each Fidelity Central Fund's financial statements are available on the SEC's website or upon request. |
| (d) | Investment made with cash collateral received from securities on loan. |
Affiliated Central Funds
Fiscal year to date information regarding the Fund's investments in Fidelity Central Funds, including the ownership percentage, is presented below.
| Affiliate | Value, beginning of period ($) | Purchases ($) | Sales Proceeds ($) | Dividend Income ($) | Realized Gain (loss) ($) | Change in Unrealized appreciation (depreciation) ($) | Value, end of period ($) | %ownership, end of period |
| Fidelity Cash Central Fund 2.33% | 15,713,381 | 371,729,772 | 301,918,198 | 220,794 | - | - | 85,524,955 | 0.2% |
| Fidelity Securities Lending Cash Central Fund 2.34% | 21,483,975 | 362,589,480 | 333,298,080 | 20,070 | - | - | 50,775,375 | 0.1% |
| Total | 37,197,356 | 734,319,252 | 635,216,278 | 240,864 | - | - | 136,300,330 | |
| | | | | | | | | |
Amounts in the income column in the above table include any capital gain distributions from underlying funds, which are presented in the corresponding line item in the Statement of Operations, if applicable.
Amount for Fidelity Securities Lending Cash Central Fund represents the income earned on investing cash collateral, less rebates paid to borrowers and any lending agent fees associated with the loan, plus any premium payments received for lending certain types of securities.
Investment Valuation
The following is a summary of the inputs used, as of August 31, 2022, involving the Fund's assets and liabilities carried at fair value. The inputs or methodology used for valuing securities may not be an indication of the risk associated with investing in those securities. For more information on valuation inputs, and their aggregation into the levels used below, please refer to the Investment Valuation section in the accompanying Notes to Financial Statements.
| Valuation Inputs at Reporting Date: |
| Description | Total ($) | Level 1 ($) | Level 2 ($) | Level 3 ($) |
Investments in Securities: | | | | |
|
| Common Stocks | 1,482,203,316 | 1,482,203,316 | - | - |
|
| Money Market Funds | 136,300,330 | 136,300,330 | - | - |
| Total Investments in Securities: | 1,618,503,646 | 1,618,503,646 | - | - |
| Statement of Assets and Liabilities |
| | | | August 31, 2022 (Unaudited) |
| | | | | |
| Assets | | | | |
| Investment in securities, at value (including securities loaned of $49,535,181) - See accompanying schedule: | | $1,482,203,316 | | |
Unaffiliated issuers (cost $1,138,101,812) | | | |
Fidelity Central Funds (cost $136,300,330) | | 136,300,330 | | |
| | | | | |
| Total Investment in Securities (cost $1,274,402,142) | | | $ | 1,618,503,646 |
| Receivable for investments sold | | | | 16,560,656 |
| Receivable for fund shares sold | | | | 6,775,693 |
| Dividends receivable | | | | 5,605,913 |
| Distributions receivable from Fidelity Central Funds | | | | 142,213 |
| Prepaid expenses | | | | 5,035 |
| Other receivables | | | | 19,944 |
Total assets | | | | 1,647,613,100 |
| Liabilities | | | | |
| Payable for investments purchased | | $36,122,963 | | |
| Payable for fund shares redeemed | | 1,636,600 | | |
| Accrued management fee | | 671,583 | | |
| Other affiliated payables | | 223,158 | | |
| Other payables and accrued expenses | | 20,585 | | |
| Collateral on securities loaned | | 50,775,375 | | |
| Total Liabilities | | | | 89,450,264 |
| Net Assets | | | $ | 1,558,162,836 |
| Net Assets consist of: | | | | |
| Paid in capital | | | $ | 1,199,009,150 |
| Total accumulated earnings (loss) | | | | 359,153,686 |
| Net Assets | | | $ | 1,558,162,836 |
Net Asset Value , offering price and redemption price per share ($1,558,162,836 ÷ 14,187,740 shares) | | | $ | 109.82 |
| | | | | |
| Statement of Operations |
| | | | Six months ended August 31, 2022 (Unaudited) |
| Investment Income | | | | |
| Dividends | | | $ | 17,065,542 |
| Income from Fidelity Central Funds (including $20,070 from security lending) | | | | 240,864 |
| Total Income | | | | 17,306,406 |
| Expenses | | | | |
| Management fee | $ | 3,487,832 | | |
| Transfer agent fees | | 1,075,294 | | |
| Accounting fees | | 198,410 | | |
| Custodian fees and expenses | | 4,542 | | |
| Independent trustees' fees and expenses | | 2,013 | | |
| Registration fees | | 75,142 | | |
| Audit | | 17,704 | | |
| Legal | | 552 | | |
| Miscellaneous | | 3,052 | | |
| Total expenses before reductions | | 4,864,541 | | |
| Expense reductions | | (20,147) | | |
| Total expenses after reductions | | | | 4,844,394 |
| Net Investment income (loss) | | | | 12,462,012 |
| Realized and Unrealized Gain (Loss) | | | | |
| Net realized gain (loss) on: | | | | |
| Investment Securities: | | | | |
| Unaffiliated issuers | | 12,429,563 | | |
| Total net realized gain (loss) | | | | 12,429,563 |
| Change in net unrealized appreciation (depreciation) on: | | | | |
| Investment Securities: | | | | |
| Unaffiliated issuers | | 110,031,940 | | |
| Assets and liabilities in foreign currencies | | (1,840) | | |
| Total change in net unrealized appreciation (depreciation) | | | | 110,030,100 |
| Net gain (loss) | | | | 122,459,663 |
| Net increase (decrease) in net assets resulting from operations | | | $ | 134,921,675 |
| Statement of Changes in Net Assets |
| |
| | Six months ended August 31, 2022 (Unaudited) | | Year ended February 28, 2022 |
| Increase (Decrease) in Net Assets | | | | |
| Operations | | | | |
| Net investment income (loss) | $ | 12,462,012 | $ | 19,728,195 |
| Net realized gain (loss) | | 12,429,563 | | 38,512,444 |
| Change in net unrealized appreciation (depreciation) | | 110,030,100 | | 110,781,817 |
| Net increase (decrease) in net assets resulting from operations | | 134,921,675 | | 169,022,456 |
| Distributions to shareholders | | (32,357,737) | | (28,337,938) |
| Share transactions | | | | |
| Proceeds from sales of shares | | 563,745,433 | | 248,500,596 |
| Reinvestment of distributions | | 30,059,487 | | 26,334,666 |
| Cost of shares redeemed | | (210,261,618) | | (239,748,839) |
Net increase (decrease) in net assets resulting from share transactions | | 383,543,302 | | 35,086,423 |
| Total increase (decrease) in net assets | | 486,107,240 | | 175,770,941 |
| | | | | |
| Net Assets | | | | |
| Beginning of period | | 1,072,055,596 | | 896,284,655 |
| End of period | $ | 1,558,162,836 | $ | 1,072,055,596 |
| | | | | |
| Other Information | | | | |
| Shares | | | | |
| Sold | | 5,260,483 | | 2,524,118 |
| Issued in reinvestment of distributions | | 270,802 | | 259,200 |
| Redeemed | | (2,023,074) | | (2,459,097) |
| Net increase (decrease) | | 3,508,211 | | 324,221 |
| | | | | |
| | Six months ended (Unaudited) August 31, 2022 | | Years ended February 28, 2022 | | 2021 | | 2020 A | | 2019 | | 2018 |
Selected Per-Share Data | | | | | | | | | | | | |
| Net asset value, beginning of period | $ | 100.38 | $ | 86.55 | $ | 91.20 | $ | 85.32 | $ | 76.75 | $ | 77.05 |
| Income from Investment Operations | | | | | | | | | | | | |
Net investment income (loss) B,C | | 1.00 | | 1.92 | | 1.61 | | 2.09 | | 2.06 | | 1.62 |
| Net realized and unrealized gain (loss) | | 11.25 | | 14.72 | | (1.81) | | 5.99 | | 13.35 | | 2.56 |
| Total from investment operations | | 12.25 | | 16.64 | | (.20) | | 8.08 | | 15.41 | | 4.18 |
| Distributions from net investment income | | (.58) | | (1.71) | | (2.12) | | (1.94) | | (1.37) | | (1.29) |
| Distributions from net realized gain | | (2.23) | | (1.10) | | (2.34) | | (.26) | | (5.46) | | (3.19) |
| Total distributions | | (2.81) | | (2.81) | | (4.45) D | | (2.20) | | (6.84) D | | (4.48) |
Redemption fees added to paid in capital B | | - | | - | | - | | - | | - | | - E |
| Net asset value, end of period | $ | 109.82 | $ | 100.38 | $ | 86.55 | $ | 91.20 | $ | 85.32 | $ | 76.75 |
Total Return F,G | | 12.18% | | 19.19% | | (.05)% | | 9.34% | | 20.17% | | 4.99% |
Ratios to Average Net Assets C,H,I | | | | | | | | | | | | |
| Expenses before reductions | | .73% J | | .74% | | .76% | | .75% | | .78% | | .78% |
| Expenses net of fee waivers, if any | | .73% J | | .73% | | .76% | | .75% | | .78% | | .78% |
| Expenses net of all reductions | | .73% J | | .73% | | .75% | | .74% | | .76% | | .77% |
| Net investment income (loss) | | 1.88% J | | 1.96% | | 1.88% | | 2.25% | | 2.45% | | 2.00% |
| Supplemental Data | | | | | | | | | | | | |
| Net assets, end of period (000 omitted) | $ | 1,558,163 | $ | 1,072,056 | $ | 896,285 | $ | 1,247,009 | $ | 1,040,763 | $ | 716,979 |
Portfolio turnover rate K | | 40% J | | 37% | | 64% | | 65% L | | 97% L | | 66% L |
A For the year ended February 29.
B Calculated based on average shares outstanding during the period.
C Net investment income (loss) is affected by the timing of the declaration of dividends by any underlying mutual funds or exchange-traded funds (ETFs). Net investment income (loss) of any such underlying funds is not included in the Fund's net investment income (loss) ratio.
D Total distributions per share do not sum due to rounding.
E Amount represents less than $.005 per share.
F Total returns for periods of less than one year are not annualized.
G Total returns would have been lower if certain expenses had not been reduced during the applicable periods shown.
H Fees and expenses of any underlying mutual funds or exchange-traded funds (ETFs) are not included in the Fund's expense ratio. The Fund indirectly bears its proportionate share of these expenses. For additional expense information related to investments in Fidelity Central Funds, please refer to the "Investments in Fidelity Central Funds" note found in the Notes to Financial Statements section of the most recent Annual or Semi-Annual report.
I Expense ratios reflect operating expenses of the class. Expenses before reductions do not reflect amounts reimbursed, waived, or reduced through arrangements with the investment adviser, brokerage services, or other offset arrangements, if applicable, and do not represent the amount paid by the class during periods when reimbursements, waivers or reductions occur.
J Annualized
K Amount does not include the portfolio activity of any underlying mutual funds or exchange-traded funds (ETFs).
L Portfolio turnover rate excludes securities received or delivered in-kind.
For the period ended August 31, 2022
1. Organization.
Utilities Portfolio (the Fund) is a non-diversified fund of Fidelity Select Portfolios (the Trust) and is authorized to issue an unlimited number of shares. Share transactions on the Statement of Changes in Net Assets may contain exchanges between affiliated funds. The Trust is registered under the Investment Company Act of 1940, as amended (the 1940 Act), as an open-end management investment company organized as a Massachusetts business trust. The Fund invests primarily in securities of companies whose principal business activities fall within specific industries.
2. Investments in Fidelity Central Funds.
Funds may invest in Fidelity Central Funds, which are open-end investment companies generally available only to other investment companies and accounts managed by the investment adviser and its affiliates. The Schedule of Investments lists any Fidelity Central Funds held as an investment as of period end, but does not include the underlying holdings of each Fidelity Central Fund. An investing fund indirectly bears its proportionate share of the expenses of the underlying Fidelity Central Funds.
Based on its investment objective, each Fidelity Central Fund may invest or participate in various investment vehicles or strategies that are similar to those of the investing fund. These strategies are consistent with the investment objectives of the investing fund and may involve certain economic risks which may cause a decline in value of each of the Fidelity Central Funds and thus a decline in the value of the investing fund.
| Fidelity Central Fund | Investment Manager | Investment Objective | Investment Practices | Expense Ratio A |
| Fidelity Money Market Central Funds | Fidelity Management & Research Company LLC (FMR) | Each fund seeks to obtain a high level of current income consistent with the preservation of capital and liquidity. | Short-term Investments | Less than .005% |
A Expenses expressed as a percentage of average net assets and are as of each underlying Central Fund's most recent annual or semi-annual shareholder report.
A complete unaudited list of holdings for each Fidelity Central Fund is available upon request or at the Securities and Exchange Commission website at www.sec.gov. In addition, the financial statements of the Fidelity Central Funds which contain the significant accounting policies (including investment valuation policies) of those funds, and are not covered by the Report of Independent Registered Public Accounting Firm, are available on the Securities and Exchange Commission website or upon request.
3. Significant Accounting Policies.
The Fund is an investment company and applies the accounting and reporting guidance of the Financial Accounting Standards Board (FASB) Accounting Standards Codification Topic 946 Financial Services - Investment Companies . The financial statements have been prepared in conformity with accounting principles generally accepted in the United States of America (GAAP), which require management to make certain estimates and assumptions at the date of the financial statements. Actual results could differ from those estimates. Subsequent events, if any, through the date that the financial statements were issued have been evaluated in the preparation of the financial statements. The Fund's Schedule of Investments lists any underlying mutual funds or exchange-traded funds (ETFs) but does not include the underlying holdings of these funds. The following summarizes the significant accounting policies of the Fund:
Investment Valuation. Investments are valued as of 4:00 p.m. Eastern time on the last calendar day of the period. The Board of Trustees (the Board) has delegated the day to day responsibility for the valuation of the Fund's investments to the Fair Value Committee (the Committee) established by the Fund's investment adviser. In accordance with valuation policies and procedures approved by the Board, the Fund attempts to obtain prices from one or more third party pricing vendors or brokers to value its investments. When current market prices, quotations or currency exchange rates are not readily available or reliable, investments will be fair valued in good faith by the Committee, in accordance with procedures adopted by the Board. Factors used in determining fair value vary by investment type and may include market or investment specific events. The frequency with which these procedures are used cannot be predicted and they may be utilized to a significant extent. The Committee oversees the Fund's valuation policies and procedures and reports to the Board on the Committee's activities and fair value determinations. The Board monitors the appropriateness of the procedures used in valuing the Fund's investments and ratifies the fair value determinations of the Committee.
The Fund categorizes the inputs to valuation techniques used to value its investments into a disclosure hierarchy consisting of three levels as shown below:
Level 1 - unadjusted quoted prices in active markets for identical investments
Level 2 - other significant observable inputs (including quoted prices for similar investments, interest rates, prepayment speeds, etc.)
Level 3 - unobservable inputs (including the Fund's own assumptions based on the best information available)
Valuation techniques used to value the Fund's investments by major category are as follows:
Equity securities, including restricted securities, for which market quotations are readily available, are valued at the last reported sale price or official closing price as reported by a third party pricing vendor on the primary market or exchange on which they are traded and are categorized as Level 1 in the hierarchy. In the event there were no sales during the day or closing prices are not available, securities are valued at the last quoted bid price or may be valued using the last available price and are generally categorized as Level 2 in the hierarchy. For foreign equity securities, when market or security specific events arise, comparisons to the valuation of American Depositary Receipts (ADRs), futures contracts, ETFs and certain indexes as well as quoted prices for similar securities may be used and would be categorized as Level 2 in the hierarchy. For equity securities, including restricted securities, where observable inputs are limited, assumptions about market activity and risk are used and these securities may be categorized as Level 3 in the hierarchy.
Investments in open-end mutual funds, including the Fidelity Central Funds, are valued at their closing net asset value (NAV) each business day and are categorized as Level 1 in the hierarchy.
Changes in valuation techniques may result in transfers in or out of an assigned level within the disclosure hierarchy. The aggregate value of investments by input level as of August 31, 2022 is included at the end of the Fund's Schedule of Investments.
Foreign Currency. Certain Funds may use foreign currency contracts to facilitate transactions in foreign-denominated securities. Gains and losses from these transactions may arise from changes in the value of the foreign currency or if the counterparties do not perform under the contracts' terms.
Foreign-denominated assets, including investment securities, and liabilities are translated into U.S. dollars at the exchange rates at period end. Purchases and sales of investment securities, income and dividends received, and expenses denominated in foreign currencies are translated into U.S. dollars at the exchange rate in effect on the transaction date.
The effects of exchange rate fluctuations on investments are included with the net realized and unrealized gain (loss) on investment securities. Other foreign currency transactions resulting in realized and unrealized gain (loss) are disclosed separately.
Investment Transactions and Income. For financial reporting purposes, the Fund's investment holdings and NAV include trades executed through the end of the last business day of the period. The NAV per share for processing shareholder transactions is calculated as of the close of business of the New York Stock Exchange (NYSE), normally 4:00 p.m. Eastern time and includes trades executed through the end of the prior business day. Gains and losses on securities sold are determined on the basis of identified cost. Commissions paid to certain brokers with whom the investment adviser, or its affiliates, places trades on behalf of a fund include an amount in addition to trade execution, which may be rebated back to a fund. Any such rebates are included in net realized gain (loss) on investments in the Statement of Operations. Dividend income is recorded on the ex-dividend date, except for certain dividends from foreign securities where the ex-dividend date may have passed, which are recorded as soon as the Fund is informed of the ex-dividend date. Non-cash dividends included in dividend income, if any, are recorded at the fair market value of the securities received. Income and capital gain distributions from Fidelity Central Funds, if any, are recorded on the ex-dividend date. Certain distributions received by the Fund represent a return of capital or capital gain. The Fund determines the components of these distributions subsequent to the ex-dividend date, based upon receipt of tax filings or other correspondence relating to the underlying investment. These distributions are recorded as a reduction of cost of investments and/or as a realized gain. Investment income is recorded net of foreign taxes withheld where recovery of such taxes is uncertain. Funds may file withholding tax reclaims in certain jurisdictions to recover a portion of amounts previously withheld. Any withholding tax reclaims income is included in the Statement of Operations in dividends. Any receivables for withholding tax reclaims are included in the Statement of Assets and Liabilities in dividends receivable.
Expenses. Expenses directly attributable to a fund are charged to that fund. Expenses attributable to more than one fund are allocated among the respective funds on the basis of relative net assets or other appropriate methods. Expenses included in the accompanying financial statements reflect the expenses of that fund and do not include any expenses associated with any underlying mutual funds or exchange-traded funds. Although not included in a fund's expenses, a fund indirectly bears its proportionate share of these expenses through the net asset value of each underlying mutual fund or exchange-traded fund. Expense estimates are accrued in the period to which they relate and adjustments are made when actual amounts are known.
Income Tax Information and Distributions to Shareholders. Each year, the Fund intends to qualify as a regulated investment company under Subchapter M of the Internal Revenue Code, including distributing substantially all of its taxable income and realized gains. As a result, no provision for U.S. Federal income taxes is required. The Fund files a U.S. federal tax return, in addition to state and local tax returns as required. The Fund's federal income tax returns are subject to examination by the Internal Revenue Service (IRS) for a period of three fiscal years after they are filed. State and local tax returns may be subject to examination for an additional fiscal year depending on the jurisdiction. Foreign taxes are provided for based on the Fund's understanding of the tax rules and rates that exist in the foreign markets in which it invests.
Distributions are declared and recorded on the ex-dividend date. Income and capital gain distributions are determined in accordance with income tax regulations, which may differ from GAAP.
Capital accounts within the financial statements are adjusted for permanent book-tax differences. These adjustments have no impact on net assets or the results of operations. Capital accounts are not adjusted for temporary book-tax differences which will reverse in a subsequent period.
Book-tax differences are primarily due to capital loss carryforwards and losses deferred due to wash sales and excise tax regulations.
As of period end, the cost and unrealized appreciation (depreciation) in securities, and derivatives if applicable, for federal income tax purposes were as follows:
| Gross unrealized appreciation | $ 347,814,239 |
| Gross unrealized depreciation | (7,034,958) |
| Net unrealized appreciation (depreciation) | $ 340,779,281 |
| Tax cost | $1,277,724,365 |
4. Purchases and Sales of Investments.
Purchases and sales of securities, other than short-term securities and in-kind transactions, as applicable, are noted in the table below.
| | Purchases ($) | Sales ($) |
| Utilities Portfolio | 573,448,178 | 258,210,292 |
5. Fees and Other Transactions with Affiliates.
Management Fee. Fidelity Management & Research Company LLC (the investment adviser) and its affiliates provide the Fund with investment management related services for which the Fund pays a monthly management fee. The management fee is the sum of an individual fund fee rate that is based on an annual rate of .30% of the Fund's average net assets and an annualized group fee rate that averaged .23% during the period. The group fee rate is based upon the monthly average net assets of a group of registered investment companies with which the investment adviser has management contracts. The group fee rate decreases as assets under management increase and increases as assets under management decrease. For the reporting period, the total annualized management fee rate was .53% of the Fund's average net assets.
Transfer Agent Fees. Fidelity Investments Institutional Operations Company LLC (FIIOC), an affiliate of the investment adviser, is the Fund's transfer, dividend disbursing and shareholder servicing agent. FIIOC receives account fees and asset-based fees that vary according to account size and type of account. FIIOC pays for typesetting, printing and mailing of shareholder reports, except proxy statements. For the period, the transfer agent fees were equivalent to an annualized rate of .16% of average net assets.
Accounting Fees. Fidelity Service Company, Inc. (FSC), an affiliate of the investment adviser, maintains the Fund's accounting records. The accounting fee is based on the level of average net assets for each month. For the period, the fees were equivalent to the following annualized rates:
| | % of Average Net Assets |
| Utilities Portfolio | .03 |
Brokerage Commissions. A portion of portfolio transactions were placed with brokerage firms which are affiliates of the investment adviser. Brokerage commissions are included in net realized gain (loss) and change in net unrealized appreciation (depreciation) in the Statement of Operations. The commissions paid to these affiliated firms were as follows:
| | Amount |
| Utilities Portfolio | $ 8,582 |
Interfund Trades. Funds may purchase from or sell securities to other Fidelity Funds under procedures adopted by the Board. The procedures have been designed to ensure these interfund trades are executed in accordance with Rule 17a-7 of the 1940 Act. Any interfund trades are included within the respective purchases and sales amounts shown in the Purchases and Sales of Investments note. Interfund trades during the period are noted in the table below.
| | Purchases ($) | Sales ($) | Realized Gain (Loss) ($) |
| Utilities Portfolio | 8,926,678 | 3,863,389 | (547,743) |
6. Committed Line of Credit.
Certain Funds participate with other funds managed by the investment adviser or an affiliate in a $4.25 billion credit facility (the "line of credit") to be utilized for temporary or emergency purposes to fund shareholder redemptions or for other short-term liquidity purposes. The participating funds have agreed to pay commitment fees on their pro-rata portion of the line of credit, which are reflected in Miscellaneous expenses on the Statement of Operations, and are listed below. During the period, there were no borrowings on this line of credit.
| | Amount |
| Utilities Portfolio | $ 1,041 |
7. Security Lending.
Funds lend portfolio securities from time to time in order to earn additional income. Lending agents are used, including National Financial Services (NFS), an affiliate of the investment adviser. Pursuant to a securities lending agreement, NFS will receive a fee, which is capped at 9.9% of a fund's daily lending revenue, for its services as lending agent. A fund may lend securities to certain qualified borrowers, including NFS. On the settlement date of the loan, a fund receives collateral (in the form of U.S. Treasury obligations, letters of credit and/or cash) against the loaned securities and maintains collateral in an amount not less than 100% of the market value of the loaned securities during the period of the loan. The market value of the loaned securities is determined at the close of business of a fund and any additional required collateral is delivered to a fund on the next business day. A fund or borrower may terminate the loan at any time, and if the borrower defaults on its obligation to return the securities loaned because of insolvency or other reasons, a fund may apply collateral received from the borrower against the obligation. A fund may experience delays and costs in recovering the securities loaned. Any cash collateral received is invested in the Fidelity Securities Lending Cash Central Fund. Any loaned securities are identified as such in the Schedule of Investments, and the value of loaned securities and cash collateral at period end, as applicable, are presented in the Statement of Assets and Liabilities. Security lending income represents the income earned on investing cash collateral, less rebates paid to borrowers and any lending agent fees associated with the loan, plus any premium payments received for lending certain types of securities. Security lending income is presented in the Statement of Operations as a component of income from Fidelity Central Funds. Affiliated security lending activity, if any, was as follows:
| | Total Security Lending Fees Paid to NFS | Security Lending Income From Securities Loaned to NFS | Value of Securities Loaned to NFS at Period End |
| Utilities Portfolio | $ 2,040 | $ - | $- |
8. Expense Reductions.
Through arrangements with the Fund's custodian and, credits realized as a result of certain uninvested cash balances were used to reduce the Fund's expenses by $245.
In addition, during the period the investment adviser or an affiliate reimbursed and/or waived a portion of operating expenses in the amount of $19,902.
9. Other.
A fund's organizational documents provide former and current trustees and officers with a limited indemnification against liabilities arising in connection with the performance of their duties to the fund. In the normal course of business, a fund may also enter into contracts that provide general indemnifications. A fund's maximum exposure under these arrangements is unknown as this would be dependent on future claims that may be made against a fund. The risk of material loss from such claims is considered remote.
10. Risk and Uncertainties.
Many factors affect a fund's performance. Developments that disrupt global economies and financial markets, such as pandemics, epidemics, outbreaks of infectious diseases, war, terrorism, and environmental disasters, may significantly affect a fund's investment performance. The effects of these developments to a fund will be impacted by the types of securities in which a fund invests, the financial condition, industry, economic sector, and geographic location of an issuer, and a fund's level of investment in the securities of that issuer.
As a shareholder, you incur two types of costs: (1) transaction costs, which may include sales charges (loads) on purchase payments or redemption proceeds, as applicable and (2) ongoing costs, which generally include management fees, distribution and/or service (12b-1) fees and other Fund expenses. This Example is intended to help you understand your ongoing costs (in dollars) of investing in a fund and to compare these costs with the ongoing costs of investing in other mutual funds.
| The Example is based on an investment of $1,000 invested at the beginning of the period and held for the entire period (March 1, 2022 to August 31, 2022). |
Actual Expenses
The first line of the accompanying table provides information about actual account values and actual expenses. You may use the information in this line, together with the amount you invested, to estimate the expenses that you paid over the period. Simply divide your account value by $1,000.00 (for example, an $8,600 account value divided by $1,000.00 = 8.6), then multiply the result by the number in the first line for a class/Fund under the heading entitled "Expenses Paid During Period" to estimate the expenses you paid on your account during this period. If any fund is a shareholder of any underlying mutual funds or exchange-traded funds (ETFs) (the Underlying Funds), such fund indirectly bears its proportional share of the expenses of the Underlying Funds in addition to the direct expenses incurred presented in the table. These fees and expenses are not included in the annualized expense ratio used to calculate the expense estimate in the table below.
Hypothetical Example for Comparison Purposes
The second line of the accompanying table provides information about hypothetical account values and hypothetical expenses based on the actual expense ratio and an assumed rate of return of 5% per year before expenses, which is not the actual return. The hypothetical account values and expenses may not be used to estimate the actual ending account balance or expenses you paid for the period. You may use this information to compare the ongoing costs of investing in the Fund and other funds. To do so, compare this 5% hypothetical example with the 5% hypothetical examples that appear in the shareholder reports of the other funds. If any fund is a shareholder of any Underlying Funds, such fund indirectly bears its proportional share of the expenses of the Underlying Funds in addition to the direct expenses as presented in the table. These fees and expenses are not included in the annualized expense ratio used to calculate the expense estimate in the table below.
Please note that the expenses shown in the table are meant to highlight your ongoing costs only and do not reflect any transaction costs. Therefore, the second line of the table is useful in comparing ongoing costs only, and will not help you determine the relative total costs of owning different funds. In addition, if these transactional costs were included, your costs would have been higher.
| | | | | Annualized Expense Ratio- A | | Beginning Account Value March 1, 2022 | | Ending Account Value August 31, 2022 | | Expenses Paid During Period- C March 1, 2022 to August 31, 2022 |
| | | | | | | | | | |
| Utilities Portfolio | | | | .73% | | | | | | |
| Actual | | | | | | $ 1,000 | | $ 1,121.80 | | $ 3.90 |
Hypothetical- B | | | | | | $ 1,000 | | $ 1,021.53 | | $ 3.72 |
| |
A Annualized expense ratio reflects expenses net of applicable fee waivers.
B 5% return per year before expenses
C Expenses are equal to the annualized expense ratio, multiplied by the average account value over the period, multiplied by 184/ 365 (to reflect the one-half year period). The fees and expenses of any Underlying Funds are not included in each annualized expense ratio.
Utilities Portfolio
Each year, the Board of Trustees, including the Independent Trustees (together, the Board), votes on the renewal of the management contract with Fidelity Management & Research Company LLC (FMR) and the sub-advisory agreements (together, the Advisory Contracts) for the fund. FMR and the sub-advisers are referred to herein as the Investment Advisers. The Board, assisted by the advice of fund counsel and Independent Trustees' counsel, requests and considers a broad range of information relevant to the renewal of the Advisory Contracts throughout the year.
The Board meets regularly and, at each of its meetings, covers an extensive agenda of topics and materials and considers factors that are relevant to its annual consideration of the renewal of the fund's Advisory Contracts, including the services and support provided to the fund and its shareholders. The Board has established various standing committees (Committees), each composed of and chaired by Independent Trustees with varying backgrounds, to which the Board has assigned specific subject matter responsibilities in order to enhance effective decision-making by the Board. The Board, acting directly and through its Committees, requests and receives information concerning the annual consideration of the renewal of the fund's Advisory Contracts. The Board also meets as needed to review matters specifically related to the Board's annual consideration of the renewal of the Advisory Contracts. Members of the Board may also meet with trustees of other Fidelity funds through joint ad hoc committees to discuss certain matters relevant to all of the Fidelity funds.
At its May 2022 meeting, the Board unanimously determined to renew the fund's Advisory Contracts. In reaching its determination, the Board considered all factors it believed relevant, including (i) the nature, extent, and quality of the services provided to the fund and its shareholders (including the investment performance of the fund); (ii) the competitiveness relative to peer funds of the fund's management fee and total expense ratio; (iii) the total costs of the services provided by and the profits realized by Fidelity from its relationships with the fund; and (iv) the extent to which, if any, economies of scale exist and are realized as the fund grows, and whether any economies of scale are appropriately shared with fund shareholders.
In considering whether to renew the Advisory Contracts for the fund, the Board reached a determination, with the assistance of fund counsel and Independent Trustees' counsel and through the exercise of its business judgment, that the renewal of the Advisory Contracts was in the best interests of the fund and its shareholders and that the compensation payable under the Advisory Contracts was fair and reasonable. The Board's decision to renew the Advisory Contracts was not based on any single factor, but rather was based on a comprehensive consideration of all the information provided to the Board at its meetings throughout the year. The Board, in reaching its determination to renew the Advisory Contracts, was aware that shareholders of the fund have a broad range of investment choices available to them, including a wide choice among funds offered by Fidelity's competitors, and that the fund's shareholders, who have the opportunity to review and weigh the disclosure provided by the fund in its prospectus and other public disclosures, have chosen to invest in this fund, which is part of the Fidelity family of funds.
Nature, Extent, and Quality of Services Provided. The Board considered Fidelity's staffing as it relates to the fund, including the backgrounds of investment personnel of Fidelity, and also considered the fund's investment objective, strategies, and related investment philosophy. The Independent Trustees also had discussions with senior management of Fidelity's investment operations and investment groups. The Board considered the structure of the investment personnel compensation program and whether this structure provides appropriate incentives to act in the best interests of the fund. Additionally, the Board considered the portfolio managers' investments, if any, in the funds that they manage. The Board also considered the steps Fidelity had taken to ensure the continued provision of high quality services to the Fidelity funds during the COVID-19 pandemic, including the expansion of staff in client facing positions to maintain service levels in periods of high volumes and volatility.
Resources Dedicated to Investment Management and Support Services. The Board and the Fund Oversight and Research Committees reviewed the general qualifications and capabilities of Fidelity's investment staff, including its size, education, experience, and resources, as well as Fidelity's approach to recruiting, training, managing, and compensating investment personnel. The Board noted the resources devoted to expansion of Fidelity's global investment organization, and that Fidelity's analysts have extensive resources, tools, and capabilities that allow them to conduct sophisticated quantitative and fundamental analysis, as well as credit analysis of issuers, counterparties, and guarantors. Further, the Board considered that Fidelity's investment professionals have sufficient access to global information and data so as to provide competitive investment results over time, and that those professionals also have access to sophisticated tools that permit them to assess portfolio construction and risk and performance attribution characteristics continuously, as well as to transmit new information and research conclusions rapidly around the world. Additionally, in its deliberations, the Board considered Fidelity's trading, risk management, compliance, and technology and operations capabilities and resources, which are integral parts of the investment management process.
Shareholder and Administrative Services. The Board considered (i) the nature, extent, quality, and cost of advisory, administrative, and shareholder services performed by the Investment Advisers and their affiliates under the Advisory Contracts and under separate agreements covering transfer agency, pricing and bookkeeping, and securities lending services for the fund; (ii) the nature and extent of the supervision of third party service providers, principally custodians, subcustodians, and pricing vendors; and (iii) the resources devoted to, and the record of compliance with, the fund's compliance policies and procedures. The Board also reviewed the allocation of fund brokerage, including allocations to brokers affiliated with the Investment Advisers, the use of brokerage commissions to pay fund expenses, and the use of "soft" commission dollars to pay for research services.
The Board noted that the growth of fund assets over time across the complex allows Fidelity to reinvest in the development of services designed to enhance the value and convenience of the Fidelity funds as investment vehicles. These services include 24-hour access to account information and market information over the Internet and through telephone representatives, investor education materials, and asset allocation tools. The Board also considered that it reviews customer service metrics such as telephone response times, continuity of services on the website and metrics addressing services at Fidelity Investor Centers.
Investment in a Large Fund Family. The Board considered the benefits to shareholders of investing in a Fidelity fund, including the benefits of investing in a fund that is part of a large family of funds offering a variety of investment disciplines and providing a large variety of mutual fund investor services. The Board noted that Fidelity had taken, or had made recommendations that resulted in the Fidelity funds taking, a number of actions over the previous year that benefited particular funds, including: (i) continuing to dedicate additional resources to Fidelity's investment research process, which includes meetings with management of issuers of securities in which the funds invest; (ii) continuing efforts to enhance Fidelity's global research capabilities; (iii) launching new funds and ETFs with innovative structures, strategies and pricing and making other enhancements to meet client needs; (iv) launching new share classes of existing funds; (v) eliminating purchase minimums and broadening eligibility requirements for certain funds and share classes; (vi) reducing management fees and total expenses for certain target date funds and classes and index funds; (vii) lowering expenses for certain existing funds and classes by implementing or lowering expense caps; (viii) rationalizing product lines and gaining increased efficiencies from fund mergers and liquidations; (ix) continuing to develop, acquire and implement systems and technology to improve services to the funds and shareholders, strengthen information security, and increase efficiency; and (x) continuing to implement enhancements to further strengthen Fidelity's product line to increase investors' probability of success in achieving their investment goals, including retirement income goals.
Investment Performance. The Board considered whether the fund has operated in accordance with its investment objective, as well as its record of compliance with its investment restrictions and its performance history.
The Board took into account discussions that occur at Board meetings throughout the year with representatives of the Investment Advisers about fund investment performance. In this regard the Board noted that as part of regularly scheduled fund reviews and other reports to the Board on fund performance, the Board considers annualized return information for the fund for different time periods, measured against an appropriate securities market index (benchmark index). The Board also reviews and considers information about performance attribution. In its evaluation of fund investment performance, the Board gave particular attention to information indicating changes in performance of certain Fidelity funds for specific time periods and discussed with the Investment Advisers the reasons for any overperformance or underperformance.
In addition to reviewing absolute and relative fund performance, the Independent Trustees periodically consider the appropriateness of fund performance metrics in evaluating the results achieved. In general, the Independent Trustees believe that fund performance should be evaluated based on net performance (after fees and expenses) of the fund compared to appropriate benchmark indices, over appropriate time periods that may include full market cycles, taking into account relevant factors including the following: general market conditions; issuer-specific information; and fund cash flows and other factors.
The Independent Trustees recognize that shareholders evaluate performance on a net basis over their own holding periods, for which one-, three-, and five-year periods are often used as a proxy. For this reason, the performance information reviewed by the Board also included net cumulative total return information for the fund and an appropriate benchmark index for the most recent one-, three-, and five-year periods ended September 30, 2021, as shown below.
Utilities Portfolio
Based on its review, the Board concluded that the nature, extent, and quality of services provided to the fund under the Advisory Contracts should continue to benefit the shareholders of the fund.
Competitiveness of Management Fee and Total Expense Ratio. The Board considered the fund's management fee and total expense ratio compared to "mapped groups" of competitive funds and classes created for the purpose of facilitating the Trustees' competitive analysis of management fees and total expenses. Fidelity creates "mapped groups" by combining similar Lipper investment objective categories that have comparable investment mandates. For this purpose, all sector focused equity funds are grouped in the same mapped group. Combining Lipper investment objective categories aids the Board's management fee and total expense ratio comparisons by broadening the competitive group used for comparison.
Management Fee. The Board considered two proprietary management fee comparisons for the 12-month periods ended September 30 (June 30 for periods ended 2019 and 2018 and December 31 for periods prior to 2018) shown in basis points (BP) in the chart below. The group of Lipper funds used by the Board for management fee comparisons is referred to below as the "Total Mapped Group." The Total Mapped Group comparison focuses on a fund's standing in terms of gross management fees before expense reimbursements or caps relative to the total universe of funds with comparable investment mandates (i.e., sector equities), regardless of whether their management fee structures also are comparable. Funds with comparable management fee structures have similar management fee contractual arrangements (e.g., flat rate charged for advisory services, all-inclusive fee rate, etc.). "TMG %" represents the percentage of funds in the Total Mapped Group that had management fees that were lower than the fund's. For example, a hypothetical TMG % of 20% would mean that 80% of the funds in the Total Mapped Group had higher, and 20% had lower, management fees than the fund. The fund's actual TMG %s and the number of funds in the Total Mapped Group are in the chart below. The "Asset-Sized Peer Group" (ASPG) comparison focuses on a fund's standing relative to a subset of non-Fidelity funds within the Total Mapped Group that are similar in size and management fee structure. For example, if a fund is in the first quartile of the ASPG, the fund's management fee ranks in the least expensive or lowest 25% of funds in the ASPG. The ASPG represents at least 15% of the funds in the Total Mapped Group with comparable asset size and management fee structures, subject to a minimum of 50 funds (or all funds in the Total Mapped Group if fewer than 50). Additional information, such as the ASPG quartile in which the fund's management fee rate ranked, is also included in the chart and was considered by the Board.
Utilities Portfolio
The Board noted that the fund's management fee rate ranked below the median of its Total Mapped Group and below the median of its ASPG for the 12-month period ended September 30, 2021.
The Board also considered that, for funds subject to the group fee, FMR agreed to voluntarily waive fees over a specified period of time in amounts designed to account for assets converted from certain funds to certain collective investment trusts.
Based on its review, the Board concluded that the fund's management fee is fair and reasonable in light of the services that the fund receives and the other factors considered.
Total Expense Ratio. In its review of the fund's total expense ratio, the Board considered the fund's management fee rate as well as other fund expenses, such as transfer agent fees, pricing and bookkeeping fees, and custodial, legal, and audit fees. The Board also noted that Fidelity may agree to waive fees or reimburse expenses from time to time, and the extent to which, if any, it has done so for the fund. The fund is compared to those funds and classes in the Total Mapped Group (used by the Board for management fee comparisons) that have a similar sales load structure. The Board also considered a total expense ASPG comparison for the fund, which focuses on the total expenses of the fund relative to a subset of non-Fidelity funds within the total expense similar sales load structure group. The total expense ASPG is limited to 15 larger and 15 smaller classes in fund average assets for a total of 30 classes, where possible. The total expense ASPG comparison excludes performance adjustments and fund-paid 12b-1 fees to eliminate variability in fee structures.
The Board noted that the fund's total net expense ratio ranked below the similar sales load structure group competitive median and below the ASPG competitive median for the 12-month period ended September 30, 2021.
Fees Charged to Other Fidelity Clients. The Board also considered Fidelity fee structures and other information with respect to clients of Fidelity, such as other funds advised or subadvised by Fidelity, pension plan clients, and other institutional clients with similar mandates. The Board noted that a joint ad hoc committee created by it and the boards of other Fidelity funds periodically reviews and compares Fidelity's institutional investment advisory business with its business of providing services to the Fidelity funds and also noted the most recent findings of the committee. The Board noted that the committee's review included a consideration of the differences in services provided, fees charged, and costs incurred, as well as competition in the markets serving the different categories of clients.
Based on its review of total expense ratios and fees charged to other Fidelity clients, the Board concluded that the fund's total expense ratio was reasonable in light of the services that the fund and its shareholders receive and the other factors considered.
Costs of the Services and Profitability . The Board considered the revenues earned and the expenses incurred by Fidelity in conducting the business of developing, marketing, distributing, managing, administering and servicing the fund and servicing the fund's shareholders. The Board also considered the level of Fidelity's profits in respect of all the Fidelity funds.
On an annual basis, Fidelity presents to the Board information about the profitability of its relationships with the fund. Fidelity calculates profitability information for each fund, as well as aggregate profitability information for groups of Fidelity funds and all Fidelity funds, using a series of detailed revenue and cost allocation methodologies which originate with the books and records of Fidelity on which Fidelity's audited financial statements are based. The Audit Committee of the Board reviews any significant changes from the prior year's methodologies and the full Board approves such changes.
A public accounting firm has been engaged annually by the Board as part of the Board's assessment of Fidelity's profitability analysis. The engagement includes the review and assessment of the methodologies used by Fidelity in determining the revenues and expenses attributable to Fidelity's mutual fund business, and completion of agreed-upon procedures in respect of the mathematical accuracy of certain fund profitability information and its conformity to established allocation methodologies. After considering the reports issued under the engagement and information provided by Fidelity, the Board concluded that while other allocation methods may also be reasonable, Fidelity's profitability methodologies are reasonable in all material respects.
The Board also reviewed Fidelity's non-fund businesses and potential indirect benefits such businesses may have received as a result of their association with Fidelity's mutual fund business (i.e., fall-out benefits) as well as cases where Fidelity's affiliates may benefit from the funds' business. The Board considered areas where potential indirect benefits to the Fidelity funds from their relationships with Fidelity may exist. The Board's consideration of these matters was informed by the findings of a joint ad hoc committee created by it and the boards of other Fidelity funds to evaluate potential fall-out benefits.
The Board considered the costs of the services provided by and the profits realized by Fidelity in connection with the operation of the fund and was satisfied that the profitability was not excessive.
Economies of Scale. The Board considered whether there have been economies of scale in respect of the management of the Fidelity funds, whether the Fidelity funds (including the fund) have appropriately benefited from any such economies of scale, and whether there is potential for realization of any further economies of scale. The Board considered the extent to which the fund will benefit from economies of scale as assets grow through increased services to the fund, through waivers or reimbursements, or through fee or expense ratio reductions. The Board also noted that a committee (the Economies of Scale Committee) created by it and the boards of other Fidelity funds periodically analyzes whether Fidelity attains economies of scale in respect of the management and servicing of the Fidelity funds, whether the Fidelity funds have appropriately benefited from such economies of scale, and whether there is potential for realization of any further economies of scale.
The Board recognized that the fund's management contract incorporates a "group fee" structure, which provides for lower group fee rates as total "group assets" increase, and for higher group fee rates as total "group assets" decrease ("group assets" as defined in the management contract). FMR calculates the group fee rates based on a tiered asset "breakpoint" schedule that varies based on asset class. The Board considered that the group fee is designed to deliver the benefits of economies of scale to fund shareholders when total Fidelity fund assets increase, even if assets of any particular fund are unchanged or have declined, because some portion of Fidelity's costs are attributable to services provided to all Fidelity funds, and all funds benefit if those costs can be allocated among more assets. The Board further considered that Fidelity agreed to impose a temporary fee waiver in the form of additional breakpoints to the current breakpoint schedule. The Board concluded that, given the group fee structure, fund shareholders will benefit from lower management fees as "group assets" increase at the fund complex level, regardless of whether Fidelity achieves any such economies of scale.
The Board concluded, taking into account the analysis of the Economies of Scale Committee, that economies of scale, if any, are being appropriately shared between fund shareholders and Fidelity .
Additional Information Requested by the Board. In order to develop fully the factual basis for consideration of the Fidelity funds' advisory contracts, the Board requested and received additional information on certain topics, including: (i) fund flow and performance trends, in particular the underperformance of certain funds and strategies, and Fidelity's long-term strategies for certain funds, including any consideration of fund liquidations or mergers; (ii) the operation of performance fees, competitor use of performance fees, and consideration of the expansion of performance fees to additional funds; (iii) Fidelity's pricing philosophy compared to competitors; (iv) fund profitability methodology and data; (v) evaluation of competitive fund data and peer group classifications and fee and expense comparisons; (vi) the management fee and expense structures for different funds and classes and information about the differences between various fee and expense structures; (vii) group fee breakpoints and related voluntary fee waivers; and (viii) information regarding other accounts managed by Fidelity and the funds' sub-advisory arrangements.
Based on its evaluation of all of the conclusions noted above, and after considering all factors it believed relevant, the Board concluded that the advisory fee arrangements are fair and reasonable and that the fund's Advisory Contracts should be renewed.
1.813630.117
SELUTL-SANN-1022
Fidelity® Select Portfolios®
Consumer Discretionary Sector
Automotive Portfolio
Communication Services Portfolio
Construction and Housing Portfolio
Consumer Discretionary Portfolio
Leisure Portfolio
Retailing Portfolio
Semi-Annual Report
August 31, 2022
Includes Fidelity and Fidelity Advisor share classes
Contents
To view a fund's proxy voting guidelines and proxy voting record for the 12-month period ended June 30, visit http://www.fidelity.com/proxyvotingresults or visit the Securities and Exchange Commission's (SEC) web site at http://www.sec.gov.
You may also call 1-800-544-8544 if you're an individual investing directly with Fidelity, call 1-800-835-5092 if you're a plan sponsor or participant with Fidelity as your recordkeeper or call 1-877-208-0098 on institutional accounts or if you're an advisor or invest through one to request a free copy of the proxy voting guidelines.
Standard & Poor's, S&P and S&P 500 are registered service marks of The McGraw-Hill Companies, Inc. and have been licensed for use by Fidelity Distributors Corporation.
Other third-party marks appearing herein are the property of their respective owners.
All other marks appearing herein are registered or unregistered trademarks or service marks of FMR LLC or an affiliated company. © 2022 FMR LLC. All rights reserved.
This report and the financial statements contained herein are submitted for the general information of the shareholders of the Fund. This report is not authorized for distribution to prospective investors in the Fund unless preceded or accompanied by an effective prospectus.
A fund files its complete schedule of portfolio holdings with the SEC for the first and third quarters of each fiscal year on Form N-PORT. Forms N-PORT are available on the SEC's web site at http://www.sec.gov. A fund's Forms N-PORT may be reviewed and copied at the SEC's Public Reference Room in Washington, DC. Information regarding the operation of the SEC's Public Reference Room may be obtained by calling 1-800-SEC-0330.
For a complete list of a fund's portfolio holdings, view the most recent holdings listing, semiannual report, or annual report on Fidelity's web site at http://www.fidelity.com, http://www.institutional.fidelity.com, or http://www.401k.com, as applicable.
NOT FDIC INSURED •MAY LOSE VALUE •NO BANK GUARANTEE
Neither the Fund nor Fidelity Distributors Corporation is a bank.
Top Holdings (% of Fund's net assets) |
| |
| Tesla, Inc. | 11.8 | |
| Toyota Motor Corp. sponsored ADR | 10.4 | |
| General Motors Co. | 8.3 | |
| O'Reilly Automotive, Inc. | 6.7 | |
| Ford Motor Co. | 5.6 | |
| Copart, Inc. | 4.7 | |
| AutoZone, Inc. | 4.4 | |
| Aptiv PLC | 4.0 | |
| Li Auto, Inc. ADR | 3.6 | |
| Ferrari NV | 3.5 | |
| | 63.0 | |
| |
| Industries (% of Fund's net assets) |
| |
| Automobiles | 59.2 | |
| Specialty Retail | 15.0 | |
| Auto Components | 14.1 | |
| Distributors | 4.9 | |
| Commercial Services & Supplies | 4.7 | |
| Internet & Direct Marketing Retail | 1.4 | |
| Electrical Equipment | 0.4 | |
| Textiles, Apparel & Luxury Goods | 0.1 | |
| |
Geographic Diversification (% of Fund's net assets) |
|
* Includes Short-Term investments and Net Other Assets (Liabilities). Percentages are based on country or territory of incorporation and are adjusted for the effect of futures contracts, if applicable. |
| |
Automotive Portfolio
| Common Stocks - 99.7% |
| | | Shares | Value ($) |
| Auto Components - 14.1% | | | |
| Auto Parts & Equipment - 14.1% | | | |
| Adient PLC (a) | | 44,548 | 1,478,994 |
| Aptiv PLC (a) | | 54,047 | 5,049,611 |
| Autoliv, Inc. | | 21,900 | 1,703,601 |
| DENSO Corp. | | 48,785 | 2,662,721 |
| Lear Corp. | | 20,551 | 2,849,191 |
| Magna International, Inc. Class A (sub. vtg.) | | 56,641 | 3,272,054 |
| Novem Group SA | | 77,600 | 653,507 |
| | | | 17,669,679 |
| Automobiles - 59.2% | | | |
| Automobile Manufacturers - 59.2% | | | |
| Ferrari NV | | 22,718 | 4,422,286 |
| Ford Motor Co. | | 465,909 | 7,100,453 |
| General Motors Co. | | 274,337 | 10,482,417 |
| Honda Motor Co. Ltd. sponsored ADR | | 130,495 | 3,460,727 |
| Li Auto, Inc. ADR (a) | | 156,342 | 4,497,959 |
| Lucid Group, Inc. Class A (a)(b) | | 41,222 | 632,345 |
| Mercedes-Benz Group AG (Germany) | | 17,278 | 968,703 |
| NIO, Inc. sponsored ADR (a) | | 124,653 | 2,481,841 |
| Rivian Automotive, Inc. | | 61,178 | 2,001,132 |
| Stellantis NV (b) | | 169,101 | 2,265,953 |
| Suzuki Motor Corp. | | 61,772 | 2,159,002 |
| Tata Motors Ltd. sponsored ADR (a)(b) | | 71,359 | 2,069,411 |
| Tesla, Inc. (a) | | 53,997 | 14,882,114 |
| Toyota Motor Corp. sponsored ADR (b) | | 87,091 | 13,008,783 |
| XPeng, Inc. ADR (a) | | 217,573 | 4,029,452 |
| | | | 74,462,578 |
| Commercial Services & Supplies - 4.7% | | | |
| Diversified Support Services - 4.7% | | | |
| Copart, Inc. (a) | | 49,564 | 5,930,333 |
| Distributors - 4.9% | | | |
| Distributors - 4.9% | | | |
| Central Automotive Products Ltd. | | 300 | 4,913 |
| Genuine Parts Co. | | 19,628 | 3,062,164 |
| LKQ Corp. | | 57,415 | 3,055,626 |
| | | | 6,122,703 |
| Electrical Equipment - 0.4% | | | |
| Electrical Components & Equipment - 0.4% | | | |
| Sensata Technologies, Inc. PLC | | 11,644 | 469,020 |
| Internet & Direct Marketing Retail - 1.4% | | | |
| Internet & Direct Marketing Retail - 1.4% | | | |
| Uber Technologies, Inc. (a) | | 61,281 | 1,762,442 |
| Specialty Retail - 15.0% | | | |
| Automotive Retail - 15.0% | | | |
| Advance Auto Parts, Inc. | | 3,275 | 552,296 |
| AutoZone, Inc. (a) | | 2,584 | 5,476,039 |
| CarMax, Inc. (a)(b) | | 16,531 | 1,462,002 |
| Carvana Co. Class A (a) | | 23,318 | 769,261 |
| Lithia Motors, Inc. Class A (sub. vtg.) | | 7,903 | 2,097,772 |
| O'Reilly Automotive, Inc. (a) | | 12,149 | 8,469,311 |
| | | | 18,826,681 |
| TOTAL COMMON STOCKS (Cost $96,433,634) | | | 125,243,436 |
| | | | |
| Convertible Preferred Stocks - 0.1% |
| | | Shares | Value ($) |
| Textiles, Apparel & Luxury Goods - 0.1% | | | |
| Textiles - 0.1% | | | |
CelLink Corp. Series D (c)(d) (Cost $77,048) | | 3,700 | 68,672 |
| | | | |
| Money Market Funds - 9.3% |
| | | Shares | Value ($) |
| Fidelity Cash Central Fund 2.33% (e) | | 636,650 | 636,777 |
| Fidelity Securities Lending Cash Central Fund 2.34% (e)(f) | | 11,113,173 | 11,114,285 |
| TOTAL MONEY MARKET FUNDS (Cost $11,751,062) | | | 11,751,062 |
| | | | |
| TOTAL INVESTMENT IN SECURITIES - 109.1% (Cost $108,261,744) | 137,063,170 |
NET OTHER ASSETS (LIABILITIES) - (9.1)% | (11,394,273) |
| NET ASSETS - 100.0% | 125,668,897 |
| | |
Legend
| (b) | Security or a portion of the security is on loan at period end. |
| (c) | Restricted securities (including private placements) - Investment in securities not registered under the Securities Act of 1933 (excluding 144A issues). At the end of the period, the value of restricted securities (excluding 144A issues) amounted to $68,672 or 0.1% of net assets. |
| (e) | Affiliated fund that is generally available only to investment companies and other accounts managed by Fidelity Investments. The rate quoted is the annualized seven-day yield of the fund at period end. A complete unaudited listing of the fund's holdings as of its most recent quarter end is available upon request. In addition, each Fidelity Central Fund's financial statements are available on the SEC's website or upon request. |
| (f) | Investment made with cash collateral received from securities on loan. |
| Additional information on each restricted holding is as follows: |
| Security | Acquisition Date | Acquisition Cost ($) |
| CelLink Corp. Series D | 1/20/22 | 77,048 |
Affiliated Central Funds
Fiscal year to date information regarding the Fund's investments in Fidelity Central Funds, including the ownership percentage, is presented below.
| Affiliate | Value, beginning of period ($) | Purchases ($) | Sales Proceeds ($) | Dividend Income ($) | Realized Gain (loss) ($) | Change in Unrealized appreciation (depreciation) ($) | Value, end of period ($) | %ownership, end of period |
| Fidelity Cash Central Fund 2.33% | 252,289 | 21,116,792 | 20,732,304 | 3,723 | - | - | 636,777 | 0.0% |
| Fidelity Securities Lending Cash Central Fund 2.34% | 18,145,010 | 113,025,907 | 120,056,632 | 158,429 | - | - | 11,114,285 | 0.0% |
| Total | 18,397,299 | 134,142,699 | 140,788,936 | 162,152 | - | - | 11,751,062 | |
| | | | | | | | | |
Amounts in the income column in the above table include any capital gain distributions from underlying funds, which are presented in the corresponding line item in the Statement of Operations, if applicable.
Amount for Fidelity Securities Lending Cash Central Fund represents the income earned on investing cash collateral, less rebates paid to borrowers and any lending agent fees associated with the loan, plus any premium payments received for lending certain types of securities.
Investment Valuation
The following is a summary of the inputs used, as of August 31, 2022, involving the Fund's assets and liabilities carried at fair value. The inputs or methodology used for valuing securities may not be an indication of the risk associated with investing in those securities. For more information on valuation inputs, and their aggregation into the levels used below, please refer to the Investment Valuation section in the accompanying Notes to Financial Statements.
| Valuation Inputs at Reporting Date: |
| Description | Total ($) | Level 1 ($) | Level 2 ($) | Level 3 ($) |
Investments in Securities: | | | | |
|
| Common Stocks | 125,243,436 | 119,448,097 | 5,795,339 | - |
|
| Convertible Preferred Stocks | 68,672 | - | - | 68,672 |
|
| Money Market Funds | 11,751,062 | 11,751,062 | - | - |
| Total Investments in Securities: | 137,063,170 | 131,199,159 | 5,795,339 | 68,672 |
Automotive Portfolio
| Statement of Assets and Liabilities |
| | | | August 31, 2022 (Unaudited) |
| | | | | |
| Assets | | | | |
| Investment in securities, at value (including securities loaned of $10,802,101) - See accompanying schedule: | | $125,312,108 | | |
Unaffiliated issuers (cost $96,510,682) | | | |
Fidelity Central Funds (cost $11,751,062) | | 11,751,062 | | |
| | | | | |
| Total Investment in Securities (cost $108,261,744) | | | $ | 137,063,170 |
| Cash | | | | 29,356 |
| Receivable for fund shares sold | | | | 100,927 |
| Dividends receivable | | | | 130,851 |
| Distributions receivable from Fidelity Central Funds | | | | 22,127 |
| Prepaid expenses | | | | 381 |
| Other receivables | | | | 5,450 |
Total assets | | | | 137,352,262 |
| Liabilities | | | | |
| Payable for investments purchased | | $324,580 | | |
| Payable for fund shares redeemed | | 134,170 | | |
| Accrued management fee | | 60,176 | | |
| Other affiliated payables | | 28,816 | | |
| Other payables and accrued expenses | | 21,748 | | |
| Collateral on securities loaned | | 11,113,875 | | |
| Total Liabilities | | | | 11,683,365 |
| Net Assets | | | $ | 125,668,897 |
| Net Assets consist of: | | | | |
| Paid in capital | | | $ | 107,014,416 |
| Total accumulated earnings (loss) | | | | 18,654,481 |
| Net Assets | | | $ | 125,668,897 |
Net Asset Value , offering price and redemption price per share ($125,668,897 ÷ 2,670,955 shares) | | | $ | 47.05 |
| | | | | |
| Statement of Operations |
| | | | Six months ended August 31, 2022 (Unaudited) |
| Investment Income | | | | |
| Dividends | | | $ | 914,730 |
| Income from Fidelity Central Funds (including $158,429 from security lending) | | | | 162,152 |
| Income before foreign taxes withheld | | | | 1,076,882 |
| Less foreign taxes withheld | | | | (82,217) |
| Total Income | | | | 994,665 |
| Expenses | | | | |
| Management fee | $ | 336,442 | | |
| Transfer agent fees | | 155,582 | | |
| Accounting fees | | 23,801 | | |
| Custodian fees and expenses | | 8,280 | | |
| Independent trustees' fees and expenses | | 215 | | |
| Registration fees | | 22,061 | | |
| Audit | | 18,231 | | |
| Legal | | 445 | | |
| Miscellaneous | | 358 | | |
| Total expenses before reductions | | 565,415 | | |
| Expense reductions | | (2,537) | | |
| Total expenses after reductions | | | | 562,878 |
| Net Investment income (loss) | | | | 431,787 |
| Realized and Unrealized Gain (Loss) | | | | |
| Net realized gain (loss) on: | | | | |
| Investment Securities: | | | | |
| Unaffiliated issuers | | (10,238,707) | | |
| Foreign currency transactions | | (3,579) | | |
| Total net realized gain (loss) | | | | (10,242,286) |
| Change in net unrealized appreciation (depreciation) on: | | | | |
| Investment Securities: | | | | |
| Unaffiliated issuers | | (15,516,791) | | |
| Assets and liabilities in foreign currencies | | (1,227) | | |
| Total change in net unrealized appreciation (depreciation) | | | | (15,518,018) |
| Net gain (loss) | | | | (25,760,304) |
| Net increase (decrease) in net assets resulting from operations | | | $ | (25,328,517) |
| Statement of Changes in Net Assets |
| |
| | Six months ended August 31, 2022 (Unaudited) | | Year ended February 28, 2022 |
| Increase (Decrease) in Net Assets | | | | |
| Operations | | | | |
| Net investment income (loss) | $ | 431,787 | $ | 753,430 |
| Net realized gain (loss) | | (10,242,286) | | 10,793,755 |
| Change in net unrealized appreciation (depreciation) | | (15,518,018) | | 607,122 |
| Net increase (decrease) in net assets resulting from operations | | (25,328,517) | | 12,154,307 |
| Distributions to shareholders | | (2,066,777) | | (6,137,128) |
| Share transactions | | | | |
| Proceeds from sales of shares | | 28,288,696 | | 189,559,902 |
| Reinvestment of distributions | | 1,948,844 | | 5,872,623 |
| Cost of shares redeemed | | (42,348,936) | | (234,498,841) |
Net increase (decrease) in net assets resulting from share transactions | | (12,111,396) | | (39,066,316) |
| Total increase (decrease) in net assets | | (39,506,690) | | (33,049,137) |
| | | | | |
| Net Assets | | | | |
| Beginning of period | | 165,175,587 | | 198,224,724 |
| End of period | $ | 125,668,897 | $ | 165,175,587 |
| | | | | |
| Other Information | | | | |
| Shares | | | | |
| Sold | | 571,191 | | 3,055,146 |
| Issued in reinvestment of distributions | | 37,864 | | 95,061 |
| Redeemed | | (858,339) | | (3,886,592) |
| Net increase (decrease) | | (249,284) | | (736,385) |
| | | | | |
| | Six months ended (Unaudited) August 31, 2022 | | Years ended February 28, 2022 | | 2021 | | 2020 A | | 2019 | | 2018 |
Selected Per-Share Data | | | | | | | | | | | | |
| Net asset value, beginning of period | $ | 56.56 | $ | 54.21 | $ | 34.91 | $ | 33.29 | $ | 37.52 | $ | 36.78 |
| Income from Investment Operations | | | | | | | | | | | | |
Net investment income (loss) B,C | | .16 | | .23 D | | .05 E | | .46 F | | .36 | | .39 G |
| Net realized and unrealized gain (loss) | | (8.90) | | 3.82 | | 23.73 | | 2.67 H | | (2.15) | | 6.11 |
| Total from investment operations | | (8.74) | | 4.05 | | 23.78 | | 3.13 | | (1.79) | | 6.50 |
| Distributions from net investment income | | - | | (.29) | | (.01) | | (.49) I | | (.38) | | (.20) |
| Distributions from net realized gain | | (.77) | | (1.40) | | (4.47) | | (1.02) I | | (2.06) | | (5.56) |
| Total distributions | | (.77) | | (1.70) J | | (4.48) | | (1.51) | | (2.44) | | (5.76) |
Redemption fees added to paid in capital B | | - | | - | | - | | - | | - | | - K |
| Net asset value, end of period | $ | 47.05 | $ | 56.56 | $ | 54.21 | $ | 34.91 | $ | 33.29 | $ | 37.52 |
Total Return L,M | | (15.58)% | | 7.20% | | 78.19% | | 9.14% H | | (4.66)% | | 19.08% |
Ratios to Average Net Assets C,N,O | | | | | | | | | | | | |
| Expenses before reductions | | .88% P | | .80% | | .88% | | 1.00% | | .97% | | .97% |
| Expenses net of fee waivers, if any | | .88% P | | .80% | | .88% | | 1.00% | | .97% | | .96% |
| Expenses net of all reductions | | .88% P | | .80% | | .87% | | .99% | | .97% | | .96% |
| Net investment income (loss) | | .67% P | | .37% D | | .10% E | | 1.33% F | | 1.04% | | 1.04% G |
| Supplemental Data | | | | | | | | | | | | |
| Net assets, end of period (000 omitted) | $ | 125,669 | $ | 165,176 | $ | 198,225 | $ | 36,480 | $ | 40,781 | $ | 56,139 |
Portfolio turnover rate Q | | 66% P | | 69% | | 56% | | 45% | | 31% | | 117% |
A For the year ended February 29.
B Calculated based on average shares outstanding during the period.
C Net investment income (loss) is affected by the timing of the declaration of dividends by any underlying mutual funds or exchange-traded funds (ETFs). Net investment income (loss) of any such underlying funds is not included in the Fund's net investment income (loss) ratio.
D Net investment income per share reflects one or more large, non-recurring dividend(s) which amounted to $.10 per share. Excluding such non-recurring dividend(s), the ratio of net investment income (loss) to average net assets would have been .20%.
E Net investment income per share reflects one or more large, non-recurring dividend(s) which amounted to $.14 per share. Excluding such non-recurring dividend(s), the ratio of net investment income (loss) to average net assets would have been (.21)%.
F Net investment income per share reflects one or more large, non-recurring dividend(s) which amounted to $.09 per share. Excluding such non-recurring dividend(s), the ratio of net investment income (loss) to average net assets would have been 1.07%.
G Net investment income per share reflects one or more large, non-recurring dividend(s) which amounted to $.08 per share. Excluding such non-recurring dividend(s), the ratio of net investment income (loss) to average net assets would have been .83%.
H Net realized and unrealized gain (loss) per share reflects proceeds received from litigation which amounted to $.19 per share. Excluding these litigation proceeds, the total return would have been 8.58%.
I The amount shown reflects reclassifications related to book to tax differences that were made in the year shown.
J Total distributions per share do not sum due to rounding.
K Amount represents less than $.005 per share.
L Total returns for periods of less than one year are not annualized.
M Total returns would have been lower if certain expenses had not been reduced during the applicable periods shown.
N Fees and expenses of any underlying mutual funds or exchange-traded funds (ETFs) are not included in the Fund's expense ratio. The Fund indirectly bears its proportionate share of these expenses. For additional expense information related to investments in Fidelity Central Funds, please refer to the "Investments in Fidelity Central Funds" note found in the Notes to Financial Statements section of the most recent Annual or Semi-Annual report.
O Expense ratios reflect operating expenses of the class. Expenses before reductions do not reflect amounts reimbursed, waived, or reduced through arrangements with the investment adviser, brokerage services, or other offset arrangements, if applicable, and do not represent the amount paid by the class during periods when reimbursements, waivers or reductions occur.
P Annualized
Q Amount does not include the portfolio activity of any underlying mutual funds or exchange-traded funds (ETFs).
Top Holdings (% of Fund's net assets) |
| |
| Alphabet, Inc. Class A | 21.6 | |
| Meta Platforms, Inc. Class A | 16.2 | |
| T-Mobile U.S., Inc. | 9.4 | |
| The Walt Disney Co. | 4.9 | |
| Netflix, Inc. | 4.7 | |
| Activision Blizzard, Inc. | 4.4 | |
| Uber Technologies, Inc. | 3.3 | |
| Liberty Global PLC Class C | 2.9 | |
| Liberty Media Corp. Liberty Media Class A | 2.7 | |
| Liberty Broadband Corp. Class A | 2.6 | |
| | 72.7 | |
| |
| Industries (% of Fund's net assets) |
| |
| Interactive Media & Services | 42.3 | |
| Entertainment | 22.8 | |
| Media | 11.1 | |
| Wireless Telecommunication Services | 9.4 | |
| Diversified Telecommunication Services | 6.6 | |
| Internet & Direct Marketing Retail | 5.3 | |
| Hotels, Restaurants & Leisure | 1.2 | |
| Equity Real Estate Investment Trusts (Reits) | 0.8 | |
| Real Estate Management & Development | 0.2 | |
| Software | 0.2 | |
| |
Communication Services Portfolio
| Common Stocks - 99.6% |
| | | Shares | Value ($) |
| Diversified Telecommunication Services - 6.6% | | | |
| Alternative Carriers - 4.3% | | | |
| EchoStar Holding Corp. Class A (a)(b) | | 121,900 | 2,244,179 |
| Iridium Communications, Inc. (a) | | 28,600 | 1,269,554 |
| Liberty Global PLC Class C (a) | | 1,043,500 | 22,236,985 |
| Liberty Latin America Ltd. Class C (a) | | 1,020,386 | 7,112,090 |
| | | | 32,862,808 |
| Integrated Telecommunication Services - 2.3% | | | |
| AT&T, Inc. | | 1,015,500 | 17,811,870 |
TOTAL DIVERSIFIED TELECOMMUNICATION SERVICES | | | 50,674,678 |
| Entertainment - 22.8% | | | |
| Interactive Home Entertainment - 7.5% | | | |
| Activision Blizzard, Inc. | | 428,900 | 33,664,361 |
| Electronic Arts, Inc. | | 105,900 | 13,435,533 |
| Motorsport Games, Inc. Class A (a) | | 4,300 | 2,746 |
| Skillz, Inc. (a)(b) | | 26,600 | 35,378 |
| Take-Two Interactive Software, Inc. (a) | | 83,900 | 10,282,784 |
| | | | 57,420,802 |
| Movies & Entertainment - 15.3% | | | |
| Cinemark Holdings, Inc. (a)(b) | | 437,600 | 6,161,408 |
| Endeavor Group Holdings, Inc. (a) | | 190,900 | 4,318,158 |
| Lions Gate Entertainment Corp.: | | | |
| Class A (a)(b) | | 34,500 | 339,825 |
| Class B (a)(b) | | 486,834 | 4,542,161 |
| Marcus Corp. (b) | | 256,300 | 4,123,867 |
| Netflix, Inc. (a) | | 159,600 | 35,680,176 |
| The Walt Disney Co. (a) | | 335,271 | 37,577,174 |
| Warner Bros Discovery, Inc. (a) | | 322,814 | 4,274,057 |
| Warner Music Group Corp. Class A | | 412,400 | 11,039,948 |
| World Wrestling Entertainment, Inc. Class A (b) | | 131,500 | 8,943,315 |
| | | | 117,000,089 |
TOTAL ENTERTAINMENT | | | 174,420,891 |
| Equity Real Estate Investment Trusts (REITs) - 0.8% | | | |
| Specialized REITs - 0.8% | | | |
| Lamar Advertising Co. Class A | | 61,100 | 5,736,679 |
| Hotels, Restaurants & Leisure - 1.2% | | | |
| Casinos & Gaming - 1.2% | | | |
| Flutter Entertainment PLC (a) | | 76,000 | 9,504,332 |
| Interactive Media & Services - 42.0% | | | |
| Interactive Media & Services - 42.0% | | | |
| Alphabet, Inc. Class A (a) | | 1,528,900 | 165,457,559 |
| Angi, Inc. (a)(b) | | 864,600 | 3,510,276 |
| Match Group, Inc. (a) | | 48,170 | 2,723,050 |
| Meta Platforms, Inc. Class A (a) | | 759,600 | 123,761,628 |
| Snap, Inc. Class A (a) | | 1,076,200 | 11,709,056 |
| Twitter, Inc. (a) | | 208,100 | 8,063,875 |
| Vimeo, Inc. (a) | | 51,464 | 304,667 |
| Zoominfo Technologies, Inc. (a) | | 143,000 | 6,495,060 |
| | | | 322,025,171 |
| Internet & Direct Marketing Retail - 5.3% | | | |
| Internet & Direct Marketing Retail - 5.3% | | | |
| Amazon.com, Inc. (a) | | 122,300 | 15,503,971 |
| Uber Technologies, Inc. (a) | | 872,500 | 25,093,100 |
| | | | 40,597,071 |
| Media - 11.1% | | | |
| Advertising - 0.2% | | | |
| S4 Capital PLC (a) | | 427,000 | 659,245 |
| TechTarget, Inc. (a) | | 12,100 | 785,290 |
| | | | 1,444,535 |
| Broadcasting - 4.3% | | | |
| Fox Corp. Class A | | 54,400 | 1,859,392 |
| Liberty Media Corp.: | | | |
| Liberty Media Class A (a) | | 361,362 | 21,005,973 |
| Liberty SiriusXM Series A (a)(b) | | 250,970 | 10,425,294 |
| | | | 33,290,659 |
| Cable & Satellite - 6.6% | | | |
| Altice U.S.A., Inc. Class A (a) | | 724,700 | 7,247,000 |
| Comcast Corp. Class A | | 376,300 | 13,618,297 |
| DISH Network Corp. Class A (a) | | 44,539 | 772,752 |
| Liberty Broadband Corp.: | | | |
| Class A (a)(b) | | 195,323 | 19,692,465 |
| Class C (a) | | 88,500 | 9,000,450 |
| | | | 50,330,964 |
TOTAL MEDIA | | | 85,066,158 |
| Real Estate Management & Development - 0.2% | | | |
| Real Estate Services - 0.2% | | | |
| Zillow Group, Inc. Class A (a)(b) | | 55,600 | 1,857,040 |
| Software - 0.2% | | | |
| Application Software - 0.2% | | | |
| Viant Technology, Inc. (a) | | 257,200 | 1,162,544 |
| Wireless Telecommunication Services - 9.4% | | | |
| Wireless Telecommunication Services - 9.4% | | | |
| T-Mobile U.S., Inc. (a) | | 498,450 | 71,756,862 |
| TOTAL COMMON STOCKS (Cost $702,842,084) | | | 762,801,426 |
| | | | |
| Convertible Preferred Stocks - 0.3% |
| | | Shares | Value ($) |
| Interactive Media & Services - 0.3% | | | |
| Interactive Media & Services - 0.3% | | | |
Reddit, Inc. Series F (c)(d) (Cost $3,584,075) | | 58,000 | 2,281,720 |
| | | | |
| Money Market Funds - 7.4% |
| | | Shares | Value ($) |
| Fidelity Cash Central Fund 2.33% (e) | | 8,820,319 | 8,822,083 |
| Fidelity Securities Lending Cash Central Fund 2.34% (e)(f) | | 47,765,643 | 47,770,419 |
| TOTAL MONEY MARKET FUNDS (Cost $56,592,502) | | | 56,592,502 |
| | | | |
| TOTAL INVESTMENT IN SECURITIES - 107.3% (Cost $763,018,661) | 821,675,648 |
NET OTHER ASSETS (LIABILITIES) - (7.3)% | (55,781,967) |
| NET ASSETS - 100.0% | 765,893,681 |
| | |
Legend
| (b) | Security or a portion of the security is on loan at period end. |
| (c) | Restricted securities (including private placements) - Investment in securities not registered under the Securities Act of 1933 (excluding 144A issues). At the end of the period, the value of restricted securities (excluding 144A issues) amounted to $2,281,720 or 0.3% of net assets. |
| (e) | Affiliated fund that is generally available only to investment companies and other accounts managed by Fidelity Investments. The rate quoted is the annualized seven-day yield of the fund at period end. A complete unaudited listing of the fund's holdings as of its most recent quarter end is available upon request. In addition, each Fidelity Central Fund's financial statements are available on the SEC's website or upon request. |
| (f) | Investment made with cash collateral received from securities on loan. |
| Additional information on each restricted holding is as follows: |
| Security | Acquisition Date | Acquisition Cost ($) |
| Reddit, Inc. Series F | 8/11/21 | 3,584,075 |
Affiliated Central Funds
Fiscal year to date information regarding the Fund's investments in Fidelity Central Funds, including the ownership percentage, is presented below.
| Affiliate | Value, beginning of period ($) | Purchases ($) | Sales Proceeds ($) | Dividend Income ($) | Realized Gain (loss) ($) | Change in Unrealized appreciation (depreciation) ($) | Value, end of period ($) | %ownership, end of period |
| Fidelity Cash Central Fund 2.33% | 605 | 98,540,723 | 89,719,245 | 23,519 | - | - | 8,822,083 | 0.0% |
| Fidelity Securities Lending Cash Central Fund 2.34% | 30,567,219 | 172,658,450 | 155,455,250 | 15,998 | - | - | 47,770,419 | 0.1% |
| Total | 30,567,824 | 271,199,173 | 245,174,495 | 39,517 | - | - | 56,592,502 | |
| | | | | | | | | |
Amounts in the income column in the above table include any capital gain distributions from underlying funds, which are presented in the corresponding line item in the Statement of Operations, if applicable.
Amount for Fidelity Securities Lending Cash Central Fund represents the income earned on investing cash collateral, less rebates paid to borrowers and any lending agent fees associated with the loan, plus any premium payments received for lending certain types of securities.
Investment Valuation
The following is a summary of the inputs used, as of August 31, 2022, involving the Fund's assets and liabilities carried at fair value. The inputs or methodology used for valuing securities may not be an indication of the risk associated with investing in those securities. For more information on valuation inputs, and their aggregation into the levels used below, please refer to the Investment Valuation section in the accompanying Notes to Financial Statements.
| Valuation Inputs at Reporting Date: |
| Description | Total ($) | Level 1 ($) | Level 2 ($) | Level 3 ($) |
Investments in Securities: | | | | |
|
| Common Stocks | 762,801,426 | 762,801,426 | - | - |
|
| Convertible Preferred Stocks | 2,281,720 | - | - | 2,281,720 |
|
| Money Market Funds | 56,592,502 | 56,592,502 | - | - |
| Total Investments in Securities: | 821,675,648 | 819,393,928 | - | 2,281,720 |
Communication Services Portfolio
| Statement of Assets and Liabilities |
| | | | August 31, 2022 (Unaudited) |
| | | | | |
| Assets | | | | |
| Investment in securities, at value (including securities loaned of $46,175,773) - See accompanying schedule: | | $765,083,146 | | |
Unaffiliated issuers (cost $706,426,159) | | | |
Fidelity Central Funds (cost $56,592,502) | | 56,592,502 | | |
| | | | | |
| Total Investment in Securities (cost $763,018,661) | | | $ | 821,675,648 |
| Receivable for investments sold | | | | 7,816,810 |
| Receivable for fund shares sold | | | | 2,322,346 |
| Dividends receivable | | | | 112,007 |
| Distributions receivable from Fidelity Central Funds | | | | 16,093 |
| Prepaid expenses | | | | 2,981 |
| Other receivables | | | | 4,398 |
Total assets | | | | 831,950,283 |
| Liabilities | | | | |
| Payable for investments purchased | | 10,723,795 | | |
| Payable for fund shares redeemed | | 7,007,866 | | |
| Accrued management fee | | 355,974 | | |
| Distribution and service plan fees payable | | 13,801 | | |
| Other affiliated payables | | 162,871 | | |
| Other payables and accrued expenses | | 22,770 | | |
| Collateral on securities loaned | | 47,769,525 | | |
| Total Liabilities | | | | 66,056,602 |
| Net Assets | | | $ | 765,893,681 |
| Net Assets consist of: | | | | |
| Paid in capital | | | $ | 728,913,051 |
| Total accumulated earnings (loss) | | | | 36,980,630 |
| Net Assets | | | $ | 765,893,681 |
| | | | | |
| Net Asset Value and Maximum Offering Price | | | | |
| Class A : | | | | |
Net Asset Value and redemption price per share ($26,069,177 ÷ 413,750 shares) (a) | | | $ | 63.01 |
| Maximum offering price per share (100/94.25 of $63.01) | | | $ | 66.85 |
| Class M : | | | | |
Net Asset Value and redemption price per share ($4,573,445 ÷ 73,073 shares) (a) | | | $ | 62.59 |
| Maximum offering price per share (100/96.50 of $62.59) | | | $ | 64.86 |
| Class C : | | | | |
Net Asset Value and offering price per share ($7,580,905 ÷ 123,205 shares) (a) | | | $ | 61.53 |
| Communication Services : | | | | |
Net Asset Value , offering price and redemption price per share ($709,556,412 ÷ 11,158,881 shares) | | | $ | 63.59 |
| Class I : | | | | |
Net Asset Value , offering price and redemption price per share ($14,470,512 ÷ 227,687 shares) | | | $ | 63.55 |
| Class Z : | | | | |
Net Asset Value , offering price and redemption price per share ($3,643,230 ÷ 57,093 shares) | | | $ | 63.81 |
(a)Redemption price per share is equal to net asset value less any applicable contingent deferred sales charge. |
| Statement of Operations |
| | | | Six months ended August 31, 2022 (Unaudited) |
| Investment Income | | | | |
| Dividends | | | $ | 1,475,262 |
| Income from Fidelity Central Funds (including $15,998 from security lending) | | | | 39,517 |
| Total Income | | | | 1,514,779 |
| Expenses | | | | |
| Management fee | $ | 2,268,788 | | |
| Transfer agent fees | | 890,984 | | |
| Distribution and service plan fees | | 85,590 | | |
| Accounting fees | | 140,080 | | |
| Custodian fees and expenses | | 4,109 | | |
| Independent trustees' fees and expenses | | 1,442 | | |
| Registration fees | | 54,839 | | |
| Audit | | 20,603 | | |
| Legal | | 1,116 | | |
| Miscellaneous | | 3,097 | | |
| Total expenses before reductions | | 3,470,648 | | |
| Expense reductions | | (14,885) | | |
| Total expenses after reductions | | | | 3,455,763 |
| Net Investment income (loss) | | | | (1,940,984) |
| Realized and Unrealized Gain (Loss) | | | | |
| Net realized gain (loss) on: | | | | |
| Investment Securities: | | | | |
| Unaffiliated issuers | | (2,393,324) | | |
| Foreign currency transactions | | 6,429 | | |
| Total net realized gain (loss) | | | | (2,386,895) |
| Change in net unrealized appreciation (depreciation) on: | | | | |
| Investment Securities: | | | | |
| Unaffiliated issuers | | (192,739,005) | | |
| Assets and liabilities in foreign currencies | | (122) | | |
| Total change in net unrealized appreciation (depreciation) | | | | (192,739,127) |
| Net gain (loss) | | | | (195,126,022) |
| Net increase (decrease) in net assets resulting from operations | | | $ | (197,067,006) |
| Statement of Changes in Net Assets |
| |
| | Six months ended August 31, 2022 (Unaudited) | | Year ended February 28, 2022 |
| Increase (Decrease) in Net Assets | | | | |
| Operations | | | | |
| Net investment income (loss) | $ | (1,940,984) | $ | (4,780,267) |
| Net realized gain (loss) | | (2,386,895) | | 19,842,720 |
| Change in net unrealized appreciation (depreciation) | | (192,739,127) | | (98,753,641) |
| Net increase (decrease) in net assets resulting from operations | | (197,067,006) | | (83,691,188) |
| Distributions to shareholders | | - | | (63,905,764) |
| Share transactions - net increase (decrease) | | (82,342,124) | | 267,487,210 |
| Total increase (decrease) in net assets | | (279,409,130) | | 119,890,258 |
| | | | | |
| Net Assets | | | | |
| Beginning of period | | 1,045,302,811 | | 925,412,553 |
| End of period | $ | 765,893,681 | $ | 1,045,302,811 |
| | | | | |
| | | | | |
| Fidelity Advisor® Communication Services Fund Class A |
| |
| | Six months ended (Unaudited) August 31, 2022 | | Years ended February 28, 2022 | | 2021 | | 2020 A | | 2019 B |
Selected Per-Share Data | | | | | | | | | | |
| Net asset value, beginning of period | $ | 78.37 | $ | 87.31 | $ | 60.63 | $ | 74.85 | $ | 78.20 |
| Income from Investment Operations | | | | | | | | | | |
Net investment income (loss) C,D | | (.24) | | (.60) | | (.59) | | (.30) | | (.12) |
| Net realized and unrealized gain (loss) | | (15.12) | | (3.18) | | 30.37 | | 8.77 | | 2.68 |
| Total from investment operations | | (15.36) | | (3.78) | | 29.78 | | 8.47 | | 2.56 |
| Distributions from net investment income | | - | | - | | - | | - | | (.14) |
| Distributions from net realized gain | | - | | (5.16) | | (3.10) | | (22.69) | | (5.77) |
| Total distributions | | - | | (5.16) | | (3.10) | | (22.69) | | (5.91) |
| Net asset value, end of period | $ | 63.01 | $ | 78.37 | $ | 87.31 | $ | 60.63 | $ | 74.85 |
Total Return E,F,G | | (19.60)% | | (5.05)% | | 50.81% | | 11.90% | | 3.83% |
Ratios to Average Net Assets D,H,I | | | | | | | | | | |
| Expenses before reductions | | 1.06% J | | 1.03% | | 1.08% | | 1.07% | | 1.13% J |
| Expenses net of fee waivers, if any | | 1.06% J | | 1.03% | | 1.08% | | 1.07% | | 1.12% J |
| Expenses net of all reductions | | 1.06% J | | 1.03% | | 1.07% | | 1.06% | | 1.11% J |
| Net investment income (loss) | | (.71)% J | | (.65)% | | (.81)% | | (.47)% | | (.68)% J |
| Supplemental Data | | | | | | | | | | |
| Net assets, end of period (000 omitted) | $ | 26,069 | $ | 33,679 | $ | 22,962 | $ | 9,947 | $ | 715 |
Portfolio turnover rate K | | 22% J | | 57% | | 63% | | 73% | | 107% |
A For the year ended February 29.
B For the period November 30, 2018 (commencement of sale of shares) through February 28, 2019.
C Calculated based on average shares outstanding during the period.
D Net investment income (loss) is affected by the timing of the declaration of dividends by any underlying mutual funds or exchange-traded funds (ETFs). Net investment income (loss) of any such underlying funds is not included in the Fund's net investment income (loss) ratio.
E Total returns for periods of less than one year are not annualized.
F Total returns would have been lower if certain expenses had not been reduced during the applicable periods shown.
G Total returns do not include the effect of the sales charges.
H Fees and expenses of any underlying mutual funds or exchange-traded funds (ETFs) are not included in the Fund's expense ratio. The Fund indirectly bears its proportionate share of these expenses. For additional expense information related to investments in Fidelity Central Funds, please refer to the "Investments in Fidelity Central Funds" note found in the Notes to Financial Statements section of the most recent Annual or Semi-Annual report.
I Expense ratios reflect operating expenses of the class. Expenses before reductions do not reflect amounts reimbursed, waived, or reduced through arrangements with the investment adviser, brokerage services, or other offset arrangements, if applicable, and do not represent the amount paid by the class during periods when reimbursements, waivers or reductions occur.
J Annualized
K Amount does not include the portfolio activity of any underlying mutual funds or exchange-traded funds (ETFs).
| Fidelity Advisor® Communication Services Fund Class M |
| |
| | Six months ended (Unaudited) August 31, 2022 | | Years ended February 28, 2022 | | 2021 | | 2020 A | | 2019 B |
Selected Per-Share Data | | | | | | | | | | |
| Net asset value, beginning of period | $ | 77.94 | $ | 86.94 | $ | 60.52 | $ | 74.82 | $ | 78.20 |
| Income from Investment Operations | | | | | | | | | | |
Net investment income (loss) C,D | | (.32) | | (.82) | | (.77) | | (.48) | | (.16) |
| Net realized and unrealized gain (loss) | | (15.03) | | (3.15) | | 30.29 | | 8.75 | | 2.67 |
| Total from investment operations | | (15.35) | | (3.97) | | 29.52 | | 8.27 | | 2.51 |
| Distributions from net investment income | | - | | - | | - | | - | | (.12) |
| Distributions from net realized gain | | - | | (5.03) | | (3.10) | | (22.57) | | (5.77) |
| Total distributions | | - | | (5.03) | | (3.10) | | (22.57) | | (5.89) |
| Net asset value, end of period | $ | 62.59 | $ | 77.94 | $ | 86.94 | $ | 60.52 | $ | 74.82 |
Total Return E,F,G | | (19.69)% | | (5.28)% | | 50.47% | | 11.58% | | 3.76% |
Ratios to Average Net Assets D,H,I | | | | | | | | | | |
| Expenses before reductions | | 1.30% J | | 1.27% | | 1.32% | | 1.35% | | 1.36% J |
| Expenses net of fee waivers, if any | | 1.30% J | | 1.27% | | 1.32% | | 1.35% | | 1.35% J |
| Expenses net of all reductions | | 1.30% J | | 1.27% | | 1.32% | | 1.34% | | 1.34% J |
| Net investment income (loss) | | (.95)% J | | (.88)% | | (1.06)% | | (.75)% | | (.90)% J |
| Supplemental Data | | | | | | | | | | |
| Net assets, end of period (000 omitted) | $ | 4,573 | $ | 5,817 | $ | 5,386 | $ | 2,264 | $ | 485 |
Portfolio turnover rate K | | 22% J | | 57% | | 63% | | 73% | | 107% |
A For the year ended February 29.
B For the period November 30, 2018 (commencement of sale of shares) through February 28, 2019.
C Calculated based on average shares outstanding during the period.
D Net investment income (loss) is affected by the timing of the declaration of dividends by any underlying mutual funds or exchange-traded funds (ETFs). Net investment income (loss) of any such underlying funds is not included in the Fund's net investment income (loss) ratio.
E Total returns for periods of less than one year are not annualized.
F Total returns would have been lower if certain expenses had not been reduced during the applicable periods shown.
G Total returns do not include the effect of the sales charges.
H Fees and expenses of any underlying mutual funds or exchange-traded funds (ETFs) are not included in the Fund's expense ratio. The Fund indirectly bears its proportionate share of these expenses. For additional expense information related to investments in Fidelity Central Funds, please refer to the "Investments in Fidelity Central Funds" note found in the Notes to Financial Statements section of the most recent Annual or Semi-Annual report.
I Expense ratios reflect operating expenses of the class. Expenses before reductions do not reflect amounts reimbursed, waived, or reduced through arrangements with the investment adviser, brokerage services, or other offset arrangements, if applicable, and do not represent the amount paid by the class during periods when reimbursements, waivers or reductions occur.
J Annualized
K Amount does not include the portfolio activity of any underlying mutual funds or exchange-traded funds (ETFs).
| Fidelity Advisor® Communication Services Fund Class C |
| |
| | Six months ended (Unaudited) August 31, 2022 | | Years ended February 28, 2022 | | 2021 | | 2020 A | | 2019 B |
Selected Per-Share Data | | | | | | | | | | |
| Net asset value, beginning of period | $ | 76.81 | $ | 86.05 | $ | 60.20 | $ | 74.76 | $ | 78.20 |
| Income from Investment Operations | | | | | | | | | | |
Net investment income (loss) C,D | | (.48) | | (1.27) | | (1.12) | | (.81) | | (.25) |
| Net realized and unrealized gain (loss) | | (14.80) | | (3.07) | | 30.07 | | 8.74 | | 2.67 |
| Total from investment operations | | (15.28) | | (4.34) | | 28.95 | | 7.93 | | 2.42 |
| Distributions from net investment income | | - | | - | | - | | - | | (.09) |
| Distributions from net realized gain | | - | | (4.90) | | (3.10) | | (22.49) | | (5.77) |
| Total distributions | | - | | (4.90) | | (3.10) | | (22.49) | | (5.86) |
| Net asset value, end of period | $ | 61.53 | $ | 76.81 | $ | 86.05 | $ | 60.20 | $ | 74.76 |
Total Return E,F,G | | (19.89)% | | (5.76)% | | 49.77% | | 11.01% | | 3.63% |
Ratios to Average Net Assets D,H,I | | | | | | | | | | |
| Expenses before reductions | | 1.78% J | | 1.78% | | 1.80% | | 1.86% | | 1.87% J |
| Expenses net of fee waivers, if any | | 1.78% J | | 1.78% | | 1.80% | | 1.86% | | 1.85% J |
| Expenses net of all reductions | | 1.78% J | | 1.78% | | 1.79% | | 1.85% | | 1.84% J |
| Net investment income (loss) | | (1.43)% J | | (1.39)% | | (1.53)% | | (1.26)% | | (1.37)% J |
| Supplemental Data | | | | | | | | | | |
| Net assets, end of period (000 omitted) | $ | 7,581 | $ | 8,938 | $ | 6,856 | $ | 1,982 | $ | 377 |
Portfolio turnover rate K | | 22% J | | 57% | | 63% | | 73% | | 107% |
A For the year ended February 29.
B For the period November 30, 2018 (commencement of sale of shares) through February 28, 2019.
C Calculated based on average shares outstanding during the period.
D Net investment income (loss) is affected by the timing of the declaration of dividends by any underlying mutual funds or exchange-traded funds (ETFs). Net investment income (loss) of any such underlying funds is not included in the Fund's net investment income (loss) ratio.
E Total returns for periods of less than one year are not annualized.
F Total returns would have been lower if certain expenses had not been reduced during the applicable periods shown.
G Total returns do not include the effect of the contingent deferred sales charge.
H Fees and expenses of any underlying mutual funds or exchange-traded funds (ETFs) are not included in the Fund's expense ratio. The Fund indirectly bears its proportionate share of these expenses. For additional expense information related to investments in Fidelity Central Funds, please refer to the "Investments in Fidelity Central Funds" note found in the Notes to Financial Statements section of the most recent Annual or Semi-Annual report.
I Expense ratios reflect operating expenses of the class. Expenses before reductions do not reflect amounts reimbursed, waived, or reduced through arrangements with the investment adviser, brokerage services, or other offset arrangements, if applicable, and do not represent the amount paid by the class during periods when reimbursements, waivers or reductions occur.
J Annualized
K Amount does not include the portfolio activity of any underlying mutual funds or exchange-traded funds (ETFs).
| Communication Services Portfolio |
| |
| | Six months ended (Unaudited) August 31, 2022 | | Years ended February 28, 2022 | | 2021 | | 2020 A | | 2019 | | 2018 |
Selected Per-Share Data | | | | | | | | | | | | |
| Net asset value, beginning of period | $ | 78.98 | $ | 87.88 | $ | 60.82 | $ | 74.88 | $ | 79.70 | $ | 80.75 |
| Income from Investment Operations | | | | | | | | | | | | |
Net investment income (loss) B,C | | (.15) | | (.34) | | (.36) | | (.12) | | .13 | | .21 |
| Net realized and unrealized gain (loss) | | (15.24) | | (3.22) | | 30.52 | | 8.79 | | 5.31 | | 3.14 |
| Total from investment operations | | (15.39) | | (3.56) | | 30.16 | | 8.67 | | 5.44 | | 3.35 |
| Distributions from net investment income | | - | | - | | - | | - | | (.20) | | (.16) |
| Distributions from net realized gain | | - | | (5.34) | | (3.10) | | (22.73) | | (10.06) | | (4.23) |
| Total distributions | | - | | (5.34) | | (3.10) | | (22.73) | | (10.26) | | (4.40) D |
Redemption fees added to paid in capital B | | - | | - | | - | | - | | - | | - E |
| Net asset value, end of period | $ | 63.59 | $ | 78.98 | $ | 87.88 | $ | 60.82 | $ | 74.88 | $ | 79.70 |
Total Return F,G | | (19.49)% | | (4.79)% | | 51.29% | | 12.22% | | 8.12% | | 4.16% |
Ratios to Average Net Assets C,H,I | | | | | | | | | | | | |
| Expenses before reductions | | .79% J | | .75% | | .77% | | .78% | | .82% | | .80% |
| Expenses net of fee waivers, if any | | .78% J | | .74% | | .77% | | .78% | | .81% | | .80% |
| Expenses net of all reductions | | .78% J | | .74% | | .76% | | .77% | | .80% | | .79% |
| Net investment income (loss) | | (.43)% J | | (.36)% | | (.51)% | | (.18)% | | .17% | | .26% |
| Supplemental Data | | | | | | | | | | | | |
| Net assets, end of period (000 omitted) | $ | 709,556 | $ | 958,304 | $ | 859,871 | $ | 577,157 | $ | 562,422 | $ | 509,375 |
Portfolio turnover rate K | | 22% J | | 57% | | 63% | | 73% | | 107% | | 22% |
A For the year ended February 29.
B Calculated based on average shares outstanding during the period.
C Net investment income (loss) is affected by the timing of the declaration of dividends by any underlying mutual funds or exchange-traded funds (ETFs). Net investment income (loss) of any such underlying funds is not included in the Fund's net investment income (loss) ratio.
D Total distributions per share do not sum due to rounding.
E Amount represents less than $.005 per share.
F Total returns for periods of less than one year are not annualized.
G Total returns would have been lower if certain expenses had not been reduced during the applicable periods shown.
H Fees and expenses of any underlying mutual funds or exchange-traded funds (ETFs) are not included in the Fund's expense ratio. The Fund indirectly bears its proportionate share of these expenses. For additional expense information related to investments in Fidelity Central Funds, please refer to the "Investments in Fidelity Central Funds" note found in the Notes to Financial Statements section of the most recent Annual or Semi-Annual report.
I Expense ratios reflect operating expenses of the class. Expenses before reductions do not reflect amounts reimbursed, waived, or reduced through arrangements with the investment adviser, brokerage services, or other offset arrangements, if applicable, and do not represent the amount paid by the class during periods when reimbursements, waivers or reductions occur.
J Annualized
K Amount does not include the portfolio activity of any underlying mutual funds or exchange-traded funds (ETFs).
| Fidelity Advisor® Communication Services Fund Class I |
| |
| | Six months ended (Unaudited) August 31, 2022 | | Years ended February 28, 2022 | | 2021 | | 2020 A | | 2019 B |
Selected Per-Share Data | | | | | | | | | | |
| Net asset value, beginning of period | $ | 78.93 | $ | 87.86 | $ | 60.80 | $ | 74.89 | $ | 78.20 |
| Income from Investment Operations | | | | | | | | | | |
Net investment income (loss) C,D | | (.14) | | (.34) | | (.39) | | (.11) | | (.06) |
| Net realized and unrealized gain (loss) | | (15.24) | | (3.22) | | 30.55 | | 8.78 | | 2.67 |
| Total from investment operations | | (15.38) | | (3.56) | | 30.16 | | 8.67 | | 2.61 |
| Distributions from net investment income | | - | | - | | - | | - | | (.15) |
| Distributions from net realized gain | | - | | (5.37) | | (3.10) | | (22.76) | | (5.77) |
| Total distributions | | - | | (5.37) | | (3.10) | | (22.76) | | (5.92) |
| Net asset value, end of period | $ | 63.55 | $ | 78.93 | $ | 87.86 | $ | 60.80 | $ | 74.89 |
Total Return E,F | | (19.49)% | | (4.79)% | | 51.31% | | 12.22% | | 3.91% |
Ratios to Average Net Assets D,G,H | | | | | | | | | | |
| Expenses before reductions | | .76% I | | .75% | | .78% | | .77% | | .70% I |
| Expenses net of fee waivers, if any | | .76% I | | .75% | | .77% | | .77% | | .69% I |
| Expenses net of all reductions | | .76% I | | .75% | | .77% | | .76% | | .68% I |
| Net investment income (loss) | | (.41)% I | | (.37)% | | (.51)% | | (.17)% | | (.30)% I |
| Supplemental Data | | | | | | | | | | |
| Net assets, end of period (000 omitted) | $ | 14,471 | $ | 32,089 | $ | 26,521 | $ | 2,493 | $ | 452 |
Portfolio turnover rate J | | 22% I | | 57% | | 63% | | 73% | | 107% |
A For the year ended February 29.
B For the period November 30, 2018 (commencement of sale of shares) through February 28, 2019.
C Calculated based on average shares outstanding during the period.
D Net investment income (loss) is affected by the timing of the declaration of dividends by any underlying mutual funds or exchange-traded funds (ETFs). Net investment income (loss) of any such underlying funds is not included in the Fund's net investment income (loss) ratio.
E Total returns for periods of less than one year are not annualized.
F Total returns would have been lower if certain expenses had not been reduced during the applicable periods shown.
G Fees and expenses of any underlying mutual funds or exchange-traded funds (ETFs) are not included in the Fund's expense ratio. The Fund indirectly bears its proportionate share of these expenses. For additional expense information related to investments in Fidelity Central Funds, please refer to the "Investments in Fidelity Central Funds" note found in the Notes to Financial Statements section of the most recent Annual or Semi-Annual report.
H Expense ratios reflect operating expenses of the class. Expenses before reductions do not reflect amounts reimbursed, waived, or reduced through arrangements with the investment adviser, brokerage services, or other offset arrangements, if applicable, and do not represent the amount paid by the class during periods when reimbursements, waivers or reductions occur.
I Annualized
J Amount does not include the portfolio activity of any underlying mutual funds or exchange-traded funds (ETFs).
| Fidelity Advisor® Communication Services Fund Class Z |
| |
| | Six months ended (Unaudited) August 31, 2022 | | Years ended February 28, 2022 | | 2021 | | 2020 A | | 2019 B |
Selected Per-Share Data | | | | | | | | | | |
| Net asset value, beginning of period | $ | 79.20 | $ | 88.04 | $ | 60.85 | $ | 74.89 | $ | 78.20 |
| Income from Investment Operations | | | | | | | | | | |
Net investment income (loss) C,D | | (.09) | | (.22) | | (.28) | | (.03) | | (.03) |
| Net realized and unrealized gain (loss) | | (15.30) | | (3.23) | | 30.57 | | 8.80 | | 2.65 |
| Total from investment operations | | (15.39) | | (3.45) | | 30.29 | | 8.77 | | 2.62 |
| Distributions from net investment income | | - | | - | | - | | - | | (.16) |
| Distributions from net realized gain | | - | | (5.39) | | (3.10) | | (22.81) | | (5.77) |
| Total distributions | | - | | (5.39) | | (3.10) | | (22.81) | | (5.93) |
| Net asset value, end of period | $ | 63.81 | $ | 79.20 | $ | 88.04 | $ | 60.85 | $ | 74.89 |
Total Return E,F | | (19.43)% | | (4.65)% | | 51.48% | | 12.38% | | 3.92% |
Ratios to Average Net Assets D,G,H | | | | | | | | | | |
| Expenses before reductions | | .62% I | | .62% | | .64% | | .65% | | .64% I |
| Expenses net of fee waivers, if any | | .62% I | | .61% | | .64% | | .65% | | .62% I |
| Expenses net of all reductions | | .62% I | | .61% | | .63% | | .64% | | .61% I |
| Net investment income (loss) | | (.26)% I | | (.23)% | | (.38)% | | (.05)% | | (.16)% I |
| Supplemental Data | | | | | | | | | | |
| Net assets, end of period (000 omitted) | $ | 3,643 | $ | 6,477 | $ | 3,817 | $ | 1,833 | $ | 529 |
Portfolio turnover rate J | | 22% I | | 57% | | 63% | | 73% | | 107% |
A For the year ended February 29.
B For the period November 30, 2018 (commencement of sale of shares) through February 28, 2019.
C Calculated based on average shares outstanding during the period.
D Net investment income (loss) is affected by the timing of the declaration of dividends by any underlying mutual funds or exchange-traded funds (ETFs). Net investment income (loss) of any such underlying funds is not included in the Fund's net investment income (loss) ratio.
E Total returns for periods of less than one year are not annualized.
F Total returns would have been lower if certain expenses had not been reduced during the applicable periods shown.
G Fees and expenses of any underlying mutual funds or exchange-traded funds (ETFs) are not included in the Fund's expense ratio. The Fund indirectly bears its proportionate share of these expenses. For additional expense information related to investments in Fidelity Central Funds, please refer to the "Investments in Fidelity Central Funds" note found in the Notes to Financial Statements section of the most recent Annual or Semi-Annual report.
H Expense ratios reflect operating expenses of the class. Expenses before reductions do not reflect amounts reimbursed, waived, or reduced through arrangements with the investment adviser, brokerage services, or other offset arrangements, if applicable, and do not represent the amount paid by the class during periods when reimbursements, waivers or reductions occur.
I Annualized
J Amount does not include the portfolio activity of any underlying mutual funds or exchange-traded funds (ETFs).
Top Holdings (% of Fund's net assets) |
| |
| The Home Depot, Inc. | 17.5 | |
| Lowe's Companies, Inc. | 16.2 | |
| Johnson Controls International PLC | 5.8 | |
| Invitation Homes, Inc. | 4.2 | |
| Vulcan Materials Co. | 3.5 | |
| Equity Residential (SBI) | 3.4 | |
| Mid-America Apartment Communities, Inc. | 3.3 | |
| Willscot Mobile Mini Holdings | 3.2 | |
| Trane Technologies PLC | 3.2 | |
| Floor & Decor Holdings, Inc. Class A | 3.1 | |
| | 63.4 | |
| |
| Industries (% of Fund's net assets) |
| |
| Specialty Retail | 38.1 | |
| Building Products | 19.6 | |
| Equity Real Estate Investment Trusts (Reits) | 15.0 | |
| Household Durables | 10.5 | |
| Construction & Engineering | 7.6 | |
| Construction Materials | 4.0 | |
| Trading Companies & Distributors | 2.1 | |
| Chemicals | 1.2 | |
| Real Estate Management & Development | 0.9 | |
| IT Services | 0.3 | |
| |
Construction and Housing Portfolio
| Common Stocks - 99.3% |
| | | Shares | Value ($) |
| Building Products - 19.6% | | | |
| Building Products - 19.6% | | | |
| Apogee Enterprises, Inc. | | 116,300 | 4,749,692 |
| Armstrong World Industries, Inc. | | 57,000 | 4,787,430 |
| Builders FirstSource, Inc. (a) | | 234,635 | 13,751,957 |
| Carrier Global Corp. | | 168,300 | 6,583,896 |
| Fortune Brands Home & Security, Inc. | | 91,100 | 5,596,273 |
| Johnson Controls International PLC | | 520,751 | 28,193,459 |
| Resideo Technologies, Inc. (a) | | 92,600 | 1,927,932 |
| Simpson Manufacturing Co. Ltd. | | 59,300 | 5,493,552 |
| The AZEK Co., Inc. (a) | | 181,600 | 3,314,200 |
| Trane Technologies PLC | | 100,900 | 15,545,663 |
| UFP Industries, Inc. | | 66,826 | 5,305,316 |
| | | | 95,249,370 |
| Chemicals - 1.2% | | | |
| Specialty Chemicals - 1.2% | | | |
| PPG Industries, Inc. | | 23,300 | 2,958,634 |
| Sherwin-Williams Co. | | 12,600 | 2,924,460 |
| | | | 5,883,094 |
| Construction & Engineering - 7.6% | | | |
| Construction & Engineering - 7.6% | | | |
| Comfort Systems U.S.A., Inc. | | 28,229 | 2,832,498 |
| EMCOR Group, Inc. | | 25,870 | 3,076,460 |
| Fluor Corp. (a) | | 95,800 | 2,532,952 |
| Granite Construction, Inc. (b) | | 112,018 | 3,358,300 |
| Quanta Services, Inc. | | 68,899 | 9,735,429 |
| Willscot Mobile Mini Holdings (a) | | 389,350 | 15,628,509 |
| | | | 37,164,148 |
| Construction Materials - 4.0% | | | |
| Construction Materials - 4.0% | | | |
| Summit Materials, Inc. (a) | | 90,814 | 2,580,934 |
| Vulcan Materials Co. | | 101,576 | 16,911,388 |
| | | | 19,492,322 |
| Equity Real Estate Investment Trusts (REITs) - 15.0% | | | |
| Residential REITs - 15.0% | | | |
| Equity Lifestyle Properties, Inc. | | 124,600 | 8,734,460 |
| Equity Residential (SBI) | | 223,900 | 16,385,002 |
| Invitation Homes, Inc. | | 570,100 | 20,683,228 |
| Mid-America Apartment Communities, Inc. | | 97,700 | 16,185,959 |
| Washington REIT (SBI) | | 563,200 | 11,044,352 |
| | | | 73,033,001 |
| Household Durables - 10.5% | | | |
| Home Furnishings - 1.8% | | | |
| Tempur Sealy International, Inc. | | 344,000 | 8,603,440 |
| Homebuilding - 8.3% | | | |
| Blu Investments LLC (a)(c)(d) | | 11,990,913 | 3,717 |
| D.R. Horton, Inc. | | 45,156 | 3,212,849 |
| Installed Building Products, Inc. (b) | | 68,838 | 6,233,969 |
| KB Home | | 147,200 | 4,217,280 |
| NVR, Inc. (a) | | 2,403 | 9,948,564 |
| PulteGroup, Inc. | | 232,185 | 9,440,642 |
| Toll Brothers, Inc. | | 169,500 | 7,422,405 |
| | | | 40,479,426 |
| Household Appliances - 0.4% | | | |
| Whirlpool Corp. (b) | | 11,800 | 1,847,880 |
TOTAL HOUSEHOLD DURABLES | | | 50,930,746 |
| IT Services - 0.3% | | | |
| Internet Services & Infrastructure - 0.3% | | | |
| Cyxtera Technologies, Inc. (a)(c) | | 200,000 | 1,268,000 |
| Real Estate Management & Development - 0.9% | | | |
| Diversified Real Estate Activities - 0.4% | | | |
| The RMR Group, Inc. | | 65,260 | 1,699,370 |
| Real Estate Services - 0.5% | | | |
| Cushman & Wakefield PLC (a) | | 177,595 | 2,656,821 |
TOTAL REAL ESTATE MANAGEMENT & DEVELOPMENT | | | 4,356,191 |
| Specialty Retail - 38.1% | | | |
| Home Improvement Retail - 36.8% | | | |
| Floor & Decor Holdings, Inc. Class A (a)(b) | | 186,600 | 15,181,776 |
| Lowe's Companies, Inc. | | 406,695 | 78,955,767 |
| The Home Depot, Inc. | | 294,790 | 85,023,334 |
| | | | 179,160,877 |
| Homefurnishing Retail - 1.3% | | | |
| Williams-Sonoma, Inc. (b) | | 42,300 | 6,292,125 |
TOTAL SPECIALTY RETAIL | | | 185,453,002 |
| Trading Companies & Distributors - 2.1% | | | |
| Trading Companies & Distributors - 2.1% | | | |
| Beacon Roofing Supply, Inc. (a) | | 190,503 | 10,460,520 |
| TOTAL COMMON STOCKS (Cost $360,832,227) | | | 483,290,394 |
| | | | |
| Money Market Funds - 6.7% |
| | | Shares | Value ($) |
| Fidelity Cash Central Fund 2.33% (e) | | 3,484,515 | 3,485,212 |
| Fidelity Securities Lending Cash Central Fund 2.34% (e)(f) | | 29,118,794 | 29,121,706 |
| TOTAL MONEY MARKET FUNDS (Cost $32,606,918) | | | 32,606,918 |
| | | | |
| TOTAL INVESTMENT IN SECURITIES - 106.0% (Cost $393,439,145) | 515,897,312 |
NET OTHER ASSETS (LIABILITIES) - (6.0)% | (29,164,046) |
| NET ASSETS - 100.0% | 486,733,266 |
| | |
Legend
| (b) | Security or a portion of the security is on loan at period end. |
| (c) | Restricted securities (including private placements) - Investment in securities not registered under the Securities Act of 1933 (excluding 144A issues). At the end of the period, the value of restricted securities (excluding 144A issues) amounted to $1,271,717 or 0.3% of net assets. |
| (e) | Affiliated fund that is generally available only to investment companies and other accounts managed by Fidelity Investments. The rate quoted is the annualized seven-day yield of the fund at period end. A complete unaudited listing of the fund's holdings as of its most recent quarter end is available upon request. In addition, each Fidelity Central Fund's financial statements are available on the SEC's website or upon request. |
| (f) | Investment made with cash collateral received from securities on loan. |
| Additional information on each restricted holding is as follows: |
| Security | Acquisition Date | Acquisition Cost ($) |
| Blu Investments LLC | 5/21/20 | 20,739 |
| Cyxtera Technologies, Inc. | 2/21/21 | 2,000,000 |
Affiliated Central Funds
Fiscal year to date information regarding the Fund's investments in Fidelity Central Funds, including the ownership percentage, is presented below.
| Affiliate | Value, beginning of period ($) | Purchases ($) | Sales Proceeds ($) | Dividend Income ($) | Realized Gain (loss) ($) | Change in Unrealized appreciation (depreciation) ($) | Value, end of period ($) | %ownership, end of period |
| Fidelity Cash Central Fund 2.33% | 5,377,678 | 94,532,234 | 96,424,700 | 9,124 | - | - | 3,485,212 | 0.0% |
| Fidelity Securities Lending Cash Central Fund 2.34% | 2,014,150 | 68,677,119 | 41,569,563 | 6,689 | - | - | 29,121,706 | 0.1% |
| Total | 7,391,828 | 163,209,353 | 137,994,263 | 15,813 | - | - | 32,606,918 | |
| | | | | | | | | |
Amounts in the income column in the above table include any capital gain distributions from underlying funds, which are presented in the corresponding line item in the Statement of Operations, if applicable.
Amount for Fidelity Securities Lending Cash Central Fund represents the income earned on investing cash collateral, less rebates paid to borrowers and any lending agent fees associated with the loan, plus any premium payments received for lending certain types of securities.
Investment Valuation
The following is a summary of the inputs used, as of August 31, 2022, involving the Fund's assets and liabilities carried at fair value. The inputs or methodology used for valuing securities may not be an indication of the risk associated with investing in those securities. For more information on valuation inputs, and their aggregation into the levels used below, please refer to the Investment Valuation section in the accompanying Notes to Financial Statements.
| Valuation Inputs at Reporting Date: |
| Description | Total ($) | Level 1 ($) | Level 2 ($) | Level 3 ($) |
Investments in Securities: | | | | |
|
| Common Stocks | 483,290,394 | 483,286,677 | - | 3,717 |
|
| Money Market Funds | 32,606,918 | 32,606,918 | - | - |
| Total Investments in Securities: | 515,897,312 | 515,893,595 | - | 3,717 |
Construction and Housing Portfolio
| Statement of Assets and Liabilities |
| | | | August 31, 2022 (Unaudited) |
| | | | | |
| Assets | | | | |
| Investment in securities, at value (including securities loaned of $27,923,504) - See accompanying schedule: | | $483,290,394 | | |
Unaffiliated issuers (cost $360,832,227) | | | |
Fidelity Central Funds (cost $32,606,918) | | 32,606,918 | | |
| | | | | |
| Total Investment in Securities (cost $393,439,145) | | | $ | 515,897,312 |
| Receivable for fund shares sold | | | | 266,439 |
| Dividends receivable | | | | 686,002 |
| Distributions receivable from Fidelity Central Funds | | | | 4,937 |
| Prepaid expenses | | | | 1,979 |
| Other receivables | | | | 2,495 |
Total assets | | | | 516,859,164 |
| Liabilities | | | | |
| Payable for fund shares redeemed | | 662,387 | | |
| Accrued management fee | | 228,409 | | |
| Other affiliated payables | | 93,528 | | |
| Other payables and accrued expenses | | 19,868 | | |
| Collateral on securities loaned | | 29,121,706 | | |
| Total Liabilities | | | | 30,125,898 |
| Net Assets | | | $ | 486,733,266 |
| Net Assets consist of: | | | | |
| Paid in capital | | | $ | 379,277,221 |
| Total accumulated earnings (loss) | | | | 107,456,045 |
| Net Assets | | | $ | 486,733,266 |
Net Asset Value , offering price and redemption price per share ($486,733,266 ÷ 6,049,091 shares) | | | $ | 80.46 |
| | | | | |
| Statement of Operations |
| | | | Six months ended August 31, 2022 (Unaudited) |
| Investment Income | | | | |
| Dividends | | | $ | 5,132,588 |
| Income from Fidelity Central Funds (including $6,689 from security lending) | | | | 15,813 |
| Total Income | | | | 5,148,401 |
| Expenses | | | | |
| Management fee | $ | 1,440,006 | | |
| Transfer agent fees | | 496,370 | | |
| Accounting fees | | 99,098 | | |
| Custodian fees and expenses | | 5,794 | | |
| Independent trustees' fees and expenses | | 935 | | |
| Registration fees | | 36,598 | | |
| Audit | | 17,247 | | |
| Legal | | 450 | | |
| Interest | | 72 | | |
| Miscellaneous | | 1,639 | | |
| Total expenses before reductions | | 2,098,209 | | |
| Expense reductions | | (9,574) | | |
| Total expenses after reductions | | | | 2,088,635 |
| Net Investment income (loss) | | | | 3,059,766 |
| Realized and Unrealized Gain (Loss) | | | | |
| Net realized gain (loss) on: | | | | |
| Investment Securities: | | | | |
| Unaffiliated issuers | | (13,252,430) | | |
| Total net realized gain (loss) | | | | (13,252,430) |
| Change in net unrealized appreciation (depreciation) on investment securities | | | | (54,392,499) |
| Net gain (loss) | | | | (67,644,929) |
| Net increase (decrease) in net assets resulting from operations | | | $ | (64,585,163) |
| Statement of Changes in Net Assets |
| |
| | Six months ended August 31, 2022 (Unaudited) | | Year ended February 28, 2022 |
| Increase (Decrease) in Net Assets | | | | |
| Operations | | | | |
| Net investment income (loss) | $ | 3,059,766 | $ | 3,741,270 |
| Net realized gain (loss) | | (13,252,430) | | 26,178,157 |
| Change in net unrealized appreciation (depreciation) | | (54,392,499) | | 24,955,718 |
| Net increase (decrease) in net assets resulting from operations | | (64,585,163) | | 54,875,145 |
| Distributions to shareholders | | - | | (39,900,442) |
| Share transactions | | | | |
| Proceeds from sales of shares | | 36,785,821 | | 712,970,980 |
| Reinvestment of distributions | | - | | 37,862,407 |
| Cost of shares redeemed | | (198,805,690) | | (395,931,225) |
Net increase (decrease) in net assets resulting from share transactions | | (162,019,869) | | 354,902,162 |
| Total increase (decrease) in net assets | | (226,605,032) | | 369,876,865 |
| | | | | |
| Net Assets | | | | |
| Beginning of period | | 713,338,298 | | 343,461,433 |
| End of period | $ | 486,733,266 | $ | 713,338,298 |
| | | | | |
| Other Information | | | | |
| Shares | | | | |
| Sold | | 430,363 | | 7,347,600 |
| Issued in reinvestment of distributions | | - | | 384,753 |
| Redeemed | | (2,324,624) | | (4,219,107) |
| Net increase (decrease) | | (1,894,261) | | 3,513,246 |
| | | | | |
| Construction and Housing Portfolio |
| |
| | Six months ended (Unaudited) August 31, 2022 | | Years ended February 28, 2022 | | 2021 | | 2020 A | | 2019 | | 2018 |
Selected Per-Share Data | | | | | | | | | | | | |
| Net asset value, beginning of period | $ | 89.80 | $ | 77.53 | $ | 58.56 | $ | 54.22 | $ | 59.88 | $ | 61.70 |
| Income from Investment Operations | | | | | | | | | | | | |
Net investment income (loss) B,C | | .47 | | .57 | | .59 | | .53 | | .49 | | .44 |
| Net realized and unrealized gain (loss) | | (9.81) | | 17.59 | | 21.82 | | 8.71 | | 1.32 | | 6.58 |
| Total from investment operations | | (9.34) | | 18.16 | | 22.41 | | 9.24 | | 1.81 | | 7.02 |
| Distributions from net investment income | | - | | (.53) | | (.61) | | (.60) | | (.55) | | (.30) |
| Distributions from net realized gain | | - | | (5.36) | | (2.83) | | (4.31) | | (6.92) | | (8.53) |
| Total distributions | | - | | (5.89) | | (3.44) | | (4.90) D | | (7.47) | | (8.84) D |
Redemption fees added to paid in capital B | | - | | - | | - | | - | | - | | - E |
| Net asset value, end of period | $ | 80.46 | $ | 89.80 | $ | 77.53 | $ | 58.56 | $ | 54.22 | $ | 59.88 |
Total Return F,G | | (10.40)% | | 22.95% | | 41.70% | | 17.10% | | 4.03% | | 11.07% |
Ratios to Average Net Assets C,H,I | | | | | | | | | | | | |
| Expenses before reductions | | .76% J | | .75% | | .78% | | .79% | | .80% | | .80% |
| Expenses net of fee waivers, if any | | .76% J | | .75% | | .78% | | .79% | | .80% | | .80% |
| Expenses net of all reductions | | .76% J | | .75% | | .77% | | .79% | | .79% | | .79% |
| Net investment income (loss) | | 1.11% J | | .60% | | .94% | | .88% | | .86% | | .69% |
| Supplemental Data | | | | | | | | | | | | |
| Net assets, end of period (000 omitted) | $ | 486,733 | $ | 713,338 | $ | 343,461 | $ | 318,905 | $ | 225,255 | $ | 331,418 |
Portfolio turnover rate K | | 14% J | | 70% | | 93% | | 161% | | 90% | | 56% |
A For the year ended February 29.
B Calculated based on average shares outstanding during the period.
C Net investment income (loss) is affected by the timing of the declaration of dividends by any underlying mutual funds or exchange-traded funds (ETFs). Net investment income (loss) of any such underlying funds is not included in the Fund's net investment income (loss) ratio.
D Total distributions per share do not sum due to rounding.
E Amount represents less than $.005 per share.
F Total returns for periods of less than one year are not annualized.
G Total returns would have been lower if certain expenses had not been reduced during the applicable periods shown.
H Fees and expenses of any underlying mutual funds or exchange-traded funds (ETFs) are not included in the Fund's expense ratio. The Fund indirectly bears its proportionate share of these expenses. For additional expense information related to investments in Fidelity Central Funds, please refer to the "Investments in Fidelity Central Funds" note found in the Notes to Financial Statements section of the most recent Annual or Semi-Annual report.
I Expense ratios reflect operating expenses of the class. Expenses before reductions do not reflect amounts reimbursed, waived, or reduced through arrangements with the investment adviser, brokerage services, or other offset arrangements, if applicable, and do not represent the amount paid by the class during periods when reimbursements, waivers or reductions occur.
J Annualized
K Amount does not include the portfolio activity of any underlying mutual funds or exchange-traded funds (ETFs).
Top Holdings (% of Fund's net assets) |
| |
| Amazon.com, Inc. | 23.6 | |
| Tesla, Inc. | 15.0 | |
| The Home Depot, Inc. | 4.8 | |
| Lowe's Companies, Inc. | 4.8 | |
| TJX Companies, Inc. | 3.5 | |
| NIKE, Inc. Class B | 3.5 | |
| Hilton Worldwide Holdings, Inc. | 2.7 | |
| Booking Holdings, Inc. | 2.3 | |
| Marriott International, Inc. Class A | 2.1 | |
| Capri Holdings Ltd. | 2.0 | |
| | 64.3 | |
| |
| Industries (% of Fund's net assets) |
| |
| Internet & Direct Marketing Retail | 24.4 | |
| Specialty Retail | 19.8 | |
| Hotels, Restaurants & Leisure | 17.7 | |
| Automobiles | 15.4 | |
| Textiles, Apparel & Luxury Goods | 12.0 | |
| Multiline Retail | 6.0 | |
| Household Durables | 1.9 | |
| Food & Staples Retailing | 0.9 | |
| Commercial Services & Supplies | 0.4 | |
| Auto Components | 0.3 | |
| Building Products | 0.3 | |
| Distributors | 0.1 | |
| |
Consumer Discretionary Portfolio
| Common Stocks - 99.2% |
| | | Shares | Value ($) |
| Auto Components - 0.3% | | | |
| Auto Parts & Equipment - 0.3% | | | |
| Adient PLC (a) | | 44,600 | 1,480,720 |
| Automobiles - 15.4% | | | |
| Automobile Manufacturers - 15.4% | | | |
| Ferrari NV | | 8,547 | 1,663,759 |
| Tesla, Inc. (a) | | 235,771 | 64,980,845 |
| | | | 66,644,604 |
| Building Products - 0.3% | | | |
| Building Products - 0.3% | | | |
| The AZEK Co., Inc. (a) | | 66,406 | 1,211,910 |
| Commercial Services & Supplies - 0.4% | | | |
| Diversified Support Services - 0.4% | | | |
| Copart, Inc. (a) | | 14,328 | 1,714,345 |
| Distributors - 0.1% | | | |
| Distributors - 0.1% | | | |
| Pool Corp. | | 1,688 | 572,553 |
| Food & Staples Retailing - 0.9% | | | |
| Food Distributors - 0.9% | | | |
| Performance Food Group Co. (a) | | 78,978 | 3,947,320 |
| Hotels, Restaurants & Leisure - 17.7% | | | |
| Casinos & Gaming - 2.7% | | | |
| Caesars Entertainment, Inc. (a) | | 76,308 | 3,290,401 |
| Churchill Downs, Inc. | | 28,691 | 5,654,709 |
| Penn Entertainment, Inc. (a) | | 88,794 | 2,773,037 |
| | | | 11,718,147 |
| Hotels, Resorts & Cruise Lines - 7.6% | | | |
| Airbnb, Inc. Class A (a) | | 10,663 | 1,206,199 |
| Booking Holdings, Inc. (a) | | 5,235 | 9,819,865 |
| Hilton Worldwide Holdings, Inc. | | 92,331 | 11,759,276 |
| Lindblad Expeditions Holdings (a) | | 111,731 | 863,681 |
| Marriott International, Inc. Class A | | 60,679 | 9,328,789 |
| | | | 32,977,810 |
| Leisure Facilities - 1.0% | | | |
| Planet Fitness, Inc. (a) | | 41,333 | 2,800,311 |
| Vail Resorts, Inc. | | 5,481 | 1,231,471 |
| | | | 4,031,782 |
| Restaurants - 6.4% | | | |
| ARAMARK Holdings Corp. | | 157,044 | 5,608,041 |
| Brinker International, Inc. (a) | | 29,430 | 721,329 |
| Chipotle Mexican Grill, Inc. (a) | | 4,735 | 7,560,848 |
| Domino's Pizza, Inc. | | 12,574 | 4,675,768 |
| Dutch Bros, Inc. (b) | | 29,371 | 1,072,042 |
| McDonald's Corp. | | 22,865 | 5,768,382 |
| Wingstop, Inc. (b) | | 21,121 | 2,404,837 |
| | | | 27,811,247 |
TOTAL HOTELS, RESTAURANTS & LEISURE | | | 76,538,986 |
| Household Durables - 1.9% | | | |
| Home Furnishings - 0.7% | | | |
| Tempur Sealy International, Inc. | | 117,887 | 2,948,354 |
| Homebuilding - 1.2% | | | |
| KB Home | | 65,600 | 1,879,440 |
| PulteGroup, Inc. | | 87,400 | 3,553,684 |
| | | | 5,433,124 |
TOTAL HOUSEHOLD DURABLES | | | 8,381,478 |
| Internet & Direct Marketing Retail - 24.4% | | | |
| Internet & Direct Marketing Retail - 24.4% | | | |
| Amazon.com, Inc. (a) | | 805,115 | 102,064,429 |
| eBay, Inc. | | 79,916 | 3,526,693 |
| | | | 105,591,122 |
| Multiline Retail - 6.0% | | | |
| General Merchandise Stores - 6.0% | | | |
| Dollar General Corp. | | 34,424 | 8,172,946 |
| Dollar Tree, Inc. (a) | | 52,470 | 7,119,130 |
| Ollie's Bargain Outlet Holdings, Inc. (a) | | 55,682 | 3,079,771 |
| Target Corp. | | 46,125 | 7,395,683 |
| | | | 25,767,530 |
| Specialty Retail - 19.8% | | | |
| Apparel Retail - 5.3% | | | |
| Burlington Stores, Inc. (a) | | 45,017 | 6,310,933 |
| TJX Companies, Inc. | | 246,187 | 15,349,759 |
| Victoria's Secret & Co. (a) | | 40,749 | 1,362,647 |
| | | | 23,023,339 |
| Automotive Retail - 0.2% | | | |
| O'Reilly Automotive, Inc. (a) | | 1,500 | 1,045,680 |
| Home Improvement Retail - 11.1% | | | |
| Floor & Decor Holdings, Inc. Class A (a)(b) | | 79,857 | 6,497,166 |
| Lowe's Companies, Inc. | | 105,591 | 20,499,437 |
| The Home Depot, Inc. | | 72,541 | 20,922,275 |
| | | | 47,918,878 |
| Specialty Stores - 3.2% | | | |
| Bath & Body Works, Inc. | | 39,528 | 1,475,580 |
| Dick's Sporting Goods, Inc. (b) | | 62,247 | 6,621,213 |
| Five Below, Inc. (a) | | 38,772 | 4,958,163 |
| Sally Beauty Holdings, Inc. (a) | | 53,100 | 790,128 |
| | | | 13,845,084 |
TOTAL SPECIALTY RETAIL | | | 85,832,981 |
| Textiles, Apparel & Luxury Goods - 12.0% | | | |
| Apparel, Accessories & Luxury Goods - 6.2% | | | |
| Capri Holdings Ltd. (a) | | 182,518 | 8,611,199 |
| lululemon athletica, Inc. (a) | | 20,030 | 6,008,199 |
| LVMH Moet Hennessy Louis Vuitton SE | | 3,173 | 2,047,432 |
| PVH Corp. | | 53,368 | 3,001,950 |
| Tapestry, Inc. | | 210,688 | 7,317,194 |
| | | | 26,985,974 |
| Footwear - 5.8% | | | |
| Crocs, Inc. (a) | | 18,608 | 1,371,410 |
| Deckers Outdoor Corp. (a) | | 21,727 | 6,986,751 |
| NIKE, Inc. Class B | | 143,262 | 15,250,240 |
| On Holding AG | | 41,093 | 821,449 |
| Skechers U.S.A., Inc. Class A (sub. vtg.) (a) | | 20,600 | 778,680 |
| | | | 25,208,530 |
TOTAL TEXTILES, APPAREL & LUXURY GOODS | | | 52,194,504 |
| TOTAL COMMON STOCKS (Cost $291,343,022) | | | 429,878,053 |
| | | | |
| Money Market Funds - 4.1% |
| | | Shares | Value ($) |
| Fidelity Cash Central Fund 2.33% (c) | | 2,697,270 | 2,697,809 |
| Fidelity Securities Lending Cash Central Fund 2.34% (c)(d) | | 15,158,898 | 15,160,414 |
| TOTAL MONEY MARKET FUNDS (Cost $17,858,223) | | | 17,858,223 |
| | | | |
| TOTAL INVESTMENT IN SECURITIES - 103.3% (Cost $309,201,245) | 447,736,276 |
NET OTHER ASSETS (LIABILITIES) - (3.3)% | (14,200,752) |
| NET ASSETS - 100.0% | 433,535,524 |
| | |
Legend
| (b) | Security or a portion of the security is on loan at period end. |
| (c) | Affiliated fund that is generally available only to investment companies and other accounts managed by Fidelity Investments. The rate quoted is the annualized seven-day yield of the fund at period end. A complete unaudited listing of the fund's holdings as of its most recent quarter end is available upon request. In addition, each Fidelity Central Fund's financial statements are available on the SEC's website or upon request. |
| (d) | Investment made with cash collateral received from securities on loan. |
Affiliated Central Funds
Fiscal year to date information regarding the Fund's investments in Fidelity Central Funds, including the ownership percentage, is presented below.
| Affiliate | Value, beginning of period ($) | Purchases ($) | Sales Proceeds ($) | Dividend Income ($) | Realized Gain (loss) ($) | Change in Unrealized appreciation (depreciation) ($) | Value, end of period ($) | %ownership, end of period |
| Fidelity Cash Central Fund 2.33% | - | 47,446,101 | 44,748,292 | 13,714 | - | - | 2,697,809 | 0.0% |
| Fidelity Securities Lending Cash Central Fund 2.34% | 6,819,964 | 53,133,269 | 44,792,819 | 206,017 | - | - | 15,160,414 | 0.0% |
| Total | 6,819,964 | 100,579,370 | 89,541,111 | 219,731 | - | - | 17,858,223 | |
| | | | | | | | | |
Amounts in the income column in the above table include any capital gain distributions from underlying funds, which are presented in the corresponding line item in the Statement of Operations, if applicable.
Amount for Fidelity Securities Lending Cash Central Fund represents the income earned on investing cash collateral, less rebates paid to borrowers and any lending agent fees associated with the loan, plus any premium payments received for lending certain types of securities.
Investment Valuation
The following is a summary of the inputs used, as of August 31, 2022, involving the Fund's assets and liabilities carried at fair value. The inputs or methodology used for valuing securities may not be an indication of the risk associated with investing in those securities. For more information on valuation inputs, and their aggregation into the levels used below, please refer to the Investment Valuation section in the accompanying Notes to Financial Statements.
| Valuation Inputs at Reporting Date: |
| Description | Total ($) | Level 1 ($) | Level 2 ($) | Level 3 ($) |
Investments in Securities: | | | | |
|
| Common Stocks | 429,878,053 | 427,830,621 | 2,047,432 | - |
|
| Money Market Funds | 17,858,223 | 17,858,223 | - | - |
| Total Investments in Securities: | 447,736,276 | 445,688,844 | 2,047,432 | - |
Consumer Discretionary Portfolio
| Statement of Assets and Liabilities |
| | | | August 31, 2022 (Unaudited) |
| | | | | |
| Assets | | | | |
| Investment in securities, at value (including securities loaned of $14,669,114) - See accompanying schedule: | | $429,878,053 | | |
Unaffiliated issuers (cost $291,343,022) | | | |
Fidelity Central Funds (cost $17,858,223) | | 17,858,223 | | |
| | | | | |
| Total Investment in Securities (cost $309,201,245) | | | $ | 447,736,276 |
| Receivable for investments sold | | | | 5,610,155 |
| Receivable for fund shares sold | | | | 676,772 |
| Dividends receivable | | | | 357,229 |
| Distributions receivable from Fidelity Central Funds | | | | 52,008 |
| Prepaid expenses | | | | 3,274 |
| Other receivables | | | | 18,283 |
Total assets | | | | 454,453,997 |
| Liabilities | | | | |
| Payable for investments purchased | | 4,881,708 | | |
| Payable for fund shares redeemed | | 585,473 | | |
| Accrued management fee | | 202,206 | | |
| Other affiliated payables | | 71,893 | | |
| Other payables and accrued expenses | | 21,068 | | |
| Collateral on securities loaned | | 15,156,125 | | |
| Total Liabilities | | | | 20,918,473 |
| Net Assets | | | $ | 433,535,524 |
| Net Assets consist of: | | | | |
| Paid in capital | | | $ | 296,913,877 |
| Total accumulated earnings (loss) | | | | 136,621,647 |
| Net Assets | | | $ | 433,535,524 |
Net Asset Value , offering price and redemption price per share ($433,535,524 ÷ 9,009,185 shares) | | | $ | 48.12 |
| | | | | |
| Statement of Operations |
| | | | Six months ended August 31, 2022 (Unaudited) |
| Investment Income | | | | |
| Dividends | | | $ | 1,522,999 |
| Income from Fidelity Central Funds (including $206,017 from security lending) | | | | 219,731 |
| Total Income | | | | 1,742,730 |
| Expenses | | | | |
| Management fee | $ | 1,041,046 | | |
| Transfer agent fees | | 329,506 | | |
| Accounting fees | | 73,206 | | |
| Custodian fees and expenses | | 7,617 | | |
| Independent trustees' fees and expenses | | 626 | | |
| Registration fees | | 44,530 | | |
| Audit | | 18,117 | | |
| Legal | | 1,296 | | |
| Interest | | 966 | | |
| Miscellaneous | | 1,814 | | |
| Total expenses before reductions | | 1,518,724 | | |
| Expense reductions | | (6,882) | | |
| Total expenses after reductions | | | | 1,511,842 |
| Net Investment income (loss) | | | | 230,888 |
| Realized and Unrealized Gain (Loss) | | | | |
| Net realized gain (loss) on: | | | | |
| Investment Securities: | | | | |
| Unaffiliated issuers | | 9,855,521 | | |
| Foreign currency transactions | | 4,289 | | |
| Total net realized gain (loss) | | | | 9,859,810 |
| Change in net unrealized appreciation (depreciation) on: | | | | |
| Investment Securities: | | | | |
| Unaffiliated issuers | | (66,011,127) | | |
| Assets and liabilities in foreign currencies | | (1,580) | | |
| Total change in net unrealized appreciation (depreciation) | | | | (66,012,707) |
| Net gain (loss) | | | | (56,152,897) |
| Net increase (decrease) in net assets resulting from operations | | | $ | (55,922,009) |
| Statement of Changes in Net Assets |
| |
| | Six months ended August 31, 2022 (Unaudited) | | Year ended February 28, 2022 |
| Increase (Decrease) in Net Assets | | | | |
| Operations | | | | |
| Net investment income (loss) | $ | 230,888 | $ | (1,380,277) |
| Net realized gain (loss) | | 9,859,810 | | 69,875,616 |
| Change in net unrealized appreciation (depreciation) | | (66,012,707) | | (55,774,464) |
| Net increase (decrease) in net assets resulting from operations | | (55,922,009) | | 12,720,875 |
| Distributions to shareholders | | (36,774,708) | | (57,919,716) |
| Share transactions | | | | |
| Proceeds from sales of shares | | 155,370,794 | | 211,466,743 |
| Reinvestment of distributions | | 34,045,259 | | 54,428,730 |
| Cost of shares redeemed | | (81,858,376) | | (385,959,972) |
Net increase (decrease) in net assets resulting from share transactions | | 107,557,677 | | (120,064,499) |
| Total increase (decrease) in net assets | | 14,860,960 | | (165,263,340) |
| | | | | |
| Net Assets | | | | |
| Beginning of period | | 418,674,564 | | 583,937,904 |
| End of period | $ | 433,535,524 | $ | 418,674,564 |
| | | | | |
| Other Information | | | | |
| Shares | | | | |
| Sold | | 3,373,508 | | 2,966,018 |
| Issued in reinvestment of distributions | | 613,871 | | 780,014 |
| Redeemed | | (1,600,113) | | (5,710,596) |
| Net increase (decrease) | | 2,387,266 | | (1,964,564) |
| | | | | |
| Consumer Discretionary Portfolio |
| |
| | Six months ended (Unaudited) August 31, 2022 | | Years ended February 28, 2022 | | 2021 | | 2020 A | | 2019 | | 2018 |
Selected Per-Share Data | | | | | | | | | | | | |
| Net asset value, beginning of period | $ | 63.23 | $ | 68.01 | $ | 45.58 | $ | 44.31 | $ | 43.65 | $ | 37.00 |
| Income from Investment Operations | | | | | | | | | | | | |
Net investment income (loss) B,C | | .03 | | (.16) | | (.03) | | .11 | | .12 | | .16 |
| Net realized and unrealized gain (loss) | | (9.31) | | 1.92 | | 23.23 | | 2.26 | | 1.87 | | 8.17 |
| Total from investment operations | | (9.28) | | 1.76 | | 23.20 | | 2.37 | | 1.99 | | 8.33 |
| Distributions from net investment income | | - | | - | | - | | (.11) | | (.15) | | (.14) |
| Distributions from net realized gain | | (5.83) | | (6.54) | | (.77) | | (.99) | | (1.18) | | (1.54) |
| Total distributions | | (5.83) | | (6.54) | | (.77) | | (1.10) | | (1.33) | | (1.68) |
| Net asset value, end of period | $ | 48.12 | $ | 63.23 | $ | 68.01 | $ | 45.58 | $ | 44.31 | $ | 43.65 |
Total Return D,E | | (15.90)% | | 1.88% | | 50.96% | | 5.30% | | 4.81% | | 22.79% |
Ratios to Average Net Assets C,F,G | | | | | | | | | | | | |
| Expenses before reductions | | .77% H | | .73% | | .76% | | .76% | | .78% | | .78% |
| Expenses net of fee waivers, if any | | .76% H | | .73% | | .76% | | .76% | | .77% | | .78% |
| Expenses net of all reductions | | .76% H | | .73% | | .75% | | .76% | | .77% | | .77% |
| Net investment income (loss) | | .12% H | | (.22)% | | (.06)% | | .23% | | .27% | | .40% |
| Supplemental Data | | | | | | | | | | | | |
| Net assets, end of period (000 omitted) | $ | 433,536 | $ | 418,675 | $ | 583,938 | $ | 402,403 | $ | 433,188 | $ | 819,937 |
Portfolio turnover rate I | | 57% H | | 38% | | 55% | | 41% J | | 46% J | | 74% |
A For the year ended February 29.
B Calculated based on average shares outstanding during the period.
C Net investment income (loss) is affected by the timing of the declaration of dividends by any underlying mutual funds or exchange-traded funds (ETFs). Net investment income (loss) of any such underlying funds is not included in the Fund's net investment income (loss) ratio.
D Total returns for periods of less than one year are not annualized.
E Total returns would have been lower if certain expenses had not been reduced during the applicable periods shown.
F Fees and expenses of any underlying mutual funds or exchange-traded funds (ETFs) are not included in the Fund's expense ratio. The Fund indirectly bears its proportionate share of these expenses. For additional expense information related to investments in Fidelity Central Funds, please refer to the "Investments in Fidelity Central Funds" note found in the Notes to Financial Statements section of the most recent Annual or Semi-Annual report.
G Expense ratios reflect operating expenses of the class. Expenses before reductions do not reflect amounts reimbursed, waived, or reduced through arrangements with the investment adviser, brokerage services, or other offset arrangements, if applicable, and do not represent the amount paid by the class during periods when reimbursements, waivers or reductions occur.
H Annualized
I Amount does not include the portfolio activity of any underlying mutual funds or exchange-traded funds (ETFs).
J Portfolio turnover rate excludes securities received or delivered in-kind.
Top Holdings (% of Fund's net assets) |
| |
| McDonald's Corp. | 17.4 | |
| Booking Holdings, Inc. | 12.8 | |
| Marriott International, Inc. Class A | 7.9 | |
| Hilton Worldwide Holdings, Inc. | 7.3 | |
| Airbnb, Inc. Class A | 4.9 | |
| Chipotle Mexican Grill, Inc. | 4.8 | |
| Domino's Pizza, Inc. | 4.8 | |
| Yum! Brands, Inc. | 4.4 | |
| Restaurant Brands International, Inc. | 3.7 | |
| Caesars Entertainment, Inc. | 3.6 | |
| | 71.6 | |
| |
| Industries (% of Fund's net assets) |
| |
| Hotels, Restaurants & Leisure | 87.0 | |
| Food & Staples Retailing | 3.6 | |
| Beverages | 2.3 | |
| IT Services | 1.8 | |
| Media | 1.7 | |
| Diversified Consumer Services | 1.0 | |
| Textiles, Apparel & Luxury Goods | 1.0 | |
| Specialty Retail | 0.3 | |
| Entertainment | 0.2 | |
| |
Leisure Portfolio
| Common Stocks - 98.9% |
| | | Shares | Value ($) |
| Beverages - 2.3% | | | |
| Soft Drinks - 2.3% | | | |
| The Coca-Cola Co. | | 193,400 | 11,934,714 |
| Diversified Consumer Services - 1.0% | | | |
| Specialized Consumer Services - 1.0% | | | |
| OneSpaWorld Holdings Ltd. (a)(b) | | 498,100 | 4,388,261 |
| Rover Group, Inc. Class A (a) | | 203,700 | 776,097 |
| | | | 5,164,358 |
| Entertainment - 0.2% | | | |
| Interactive Home Entertainment - 0.2% | | | |
| Playstudios, Inc. Class A (a)(b) | | 324,500 | 1,174,690 |
| Food & Staples Retailing - 3.6% | | | |
| Food Distributors - 2.7% | | | |
| U.S. Foods Holding Corp. (a) | | 467,600 | 14,317,912 |
| Food Retail - 0.9% | | | |
| Alimentation Couche-Tard, Inc. Class A (multi-vtg.) | | 106,500 | 4,576,739 |
TOTAL FOOD & STAPLES RETAILING | | | 18,894,651 |
| Hotels, Restaurants & Leisure - 87.0% | | | |
| Casinos & Gaming - 7.8% | | | |
| Bally's Corp. (a)(b) | | 133,700 | 3,167,353 |
| Caesars Entertainment, Inc. (a) | | 435,949 | 18,798,121 |
| Churchill Downs, Inc. | | 59,448 | 11,716,606 |
| Flutter Entertainment PLC (a) | | 42,500 | 5,314,923 |
| Penn Entertainment, Inc. (a) | | 63,000 | 1,967,490 |
| | | | 40,964,493 |
| Hotels, Resorts & Cruise Lines - 33.7% | | | |
| Airbnb, Inc. Class A (a) | | 228,100 | 25,802,672 |
| Booking Holdings, Inc. (a) | | 35,976 | 67,484,141 |
| Hilton Worldwide Holdings, Inc. | | 303,332 | 38,632,364 |
| Lindblad Expeditions Holdings (a)(b) | | 524,900 | 4,057,477 |
| Marriott International, Inc. Class A | | 273,825 | 42,097,856 |
| | | | 178,074,510 |
| Leisure Facilities - 1.6% | | | |
| Vail Resorts, Inc. | | 37,182 | 8,354,052 |
| Restaurants - 43.9% | | | |
| Brinker International, Inc. (a) | | 222,400 | 5,451,024 |
| Chipotle Mexican Grill, Inc. (a) | | 16,009 | 25,563,171 |
| Domino's Pizza, Inc. | | 68,142 | 25,339,284 |
| Dutch Bros, Inc. (b) | | 78,700 | 2,872,550 |
| First Watch Restaurant Group, Inc. (b) | | 217,000 | 3,639,090 |
| McDonald's Corp. | | 364,993 | 92,080,431 |
| Noodles & Co. (a) | | 544,100 | 2,584,475 |
| Restaurant Brands International, Inc. | | 334,174 | 19,727,042 |
| Ruth's Hospitality Group, Inc. | | 318,000 | 5,793,960 |
| Starbucks Corp. | | 212,956 | 17,903,211 |
| Wingstop, Inc. (b) | | 72,400 | 8,243,464 |
| Yum! Brands, Inc. | | 207,300 | 23,060,052 |
| | | | 232,257,754 |
TOTAL HOTELS, RESTAURANTS & LEISURE | | | 459,650,809 |
| IT Services - 1.8% | | | |
| Data Processing & Outsourced Services - 1.8% | | | |
| Flywire Corp. (a) | | 245,300 | 6,098,158 |
| Toast, Inc. | | 188,800 | 3,573,984 |
| | | | 9,672,142 |
| Media - 1.7% | | | |
| Broadcasting - 1.7% | | | |
| Liberty Media Corp. Liberty Media Class A (a) | | 155,700 | 9,050,841 |
| Specialty Retail - 0.3% | | | |
| Automotive Retail - 0.3% | | | |
| Diversified Royalty Corp. (b) | | 834,100 | 1,784,613 |
| Textiles, Apparel & Luxury Goods - 1.0% | | | |
| Apparel, Accessories & Luxury Goods - 1.0% | | | |
| LVMH Moet Hennessy Louis Vuitton SE | | 8,400 | 5,420,242 |
| TOTAL COMMON STOCKS (Cost $424,518,169) | | | 522,747,060 |
| | | | |
| Money Market Funds - 4.1% |
| | | Shares | Value ($) |
| Fidelity Cash Central Fund 2.33% (c) | | 3,701,089 | 3,701,830 |
| Fidelity Securities Lending Cash Central Fund 2.34% (c)(d) | | 17,979,542 | 17,981,340 |
| TOTAL MONEY MARKET FUNDS (Cost $21,683,170) | | | 21,683,170 |
| | | | |
| TOTAL INVESTMENT IN SECURITIES - 103.0% (Cost $446,201,339) | 544,430,230 |
NET OTHER ASSETS (LIABILITIES) - (3.0)% | (15,858,460) |
| NET ASSETS - 100.0% | 528,571,770 |
| | |
Legend
| (b) | Security or a portion of the security is on loan at period end. |
| (c) | Affiliated fund that is generally available only to investment companies and other accounts managed by Fidelity Investments. The rate quoted is the annualized seven-day yield of the fund at period end. A complete unaudited listing of the fund's holdings as of its most recent quarter end is available upon request. In addition, each Fidelity Central Fund's financial statements are available on the SEC's website or upon request. |
| (d) | Investment made with cash collateral received from securities on loan. |
Affiliated Central Funds
Fiscal year to date information regarding the Fund's investments in Fidelity Central Funds, including the ownership percentage, is presented below.
| Affiliate | Value, beginning of period ($) | Purchases ($) | Sales Proceeds ($) | Dividend Income ($) | Realized Gain (loss) ($) | Change in Unrealized appreciation (depreciation) ($) | Value, end of period ($) | %ownership, end of period |
| Fidelity Cash Central Fund 2.33% | 1,262,544 | 26,204,504 | 23,765,218 | 8,260 | - | - | 3,701,830 | 0.0% |
| Fidelity Securities Lending Cash Central Fund 2.34% | 19,544,251 | 154,391,873 | 155,954,784 | 656,353 | - | - | 17,981,340 | 0.1% |
| Total | 20,806,795 | 180,596,377 | 179,720,002 | 664,613 | - | - | 21,683,170 | |
| | | | | | | | | |
Amounts in the income column in the above table include any capital gain distributions from underlying funds, which are presented in the corresponding line item in the Statement of Operations, if applicable.
Amount for Fidelity Securities Lending Cash Central Fund represents the income earned on investing cash collateral, less rebates paid to borrowers and any lending agent fees associated with the loan, plus any premium payments received for lending certain types of securities.
Investment Valuation
The following is a summary of the inputs used, as of August 31, 2022, involving the Fund's assets and liabilities carried at fair value. The inputs or methodology used for valuing securities may not be an indication of the risk associated with investing in those securities. For more information on valuation inputs, and their aggregation into the levels used below, please refer to the Investment Valuation section in the accompanying Notes to Financial Statements.
| Valuation Inputs at Reporting Date: |
| Description | Total ($) | Level 1 ($) | Level 2 ($) | Level 3 ($) |
Investments in Securities: | | | | |
|
| Common Stocks | 522,747,060 | 517,326,818 | 5,420,242 | - |
|
| Money Market Funds | 21,683,170 | 21,683,170 | - | - |
| Total Investments in Securities: | 544,430,230 | 539,009,988 | 5,420,242 | - |
Leisure Portfolio
| Statement of Assets and Liabilities |
| | | | August 31, 2022 (Unaudited) |
| | | | | |
| Assets | | | | |
| Investment in securities, at value (including securities loaned of $17,447,513) - See accompanying schedule: | | $522,747,060 | | |
Unaffiliated issuers (cost $424,518,169) | | | |
Fidelity Central Funds (cost $21,683,170) | | 21,683,170 | | |
| | | | | |
| Total Investment in Securities (cost $446,201,339) | | | $ | 544,430,230 |
| Foreign currency held at value (cost $6,846) | | | | 6,755 |
| Receivable for investments sold | | | | 2,038,336 |
| Receivable for fund shares sold | | | | 89,284 |
| Dividends receivable | | | | 816,732 |
| Distributions receivable from Fidelity Central Funds | | | | 99,708 |
| Prepaid expenses | | | | 2,637 |
| Other receivables | | | | 3,571 |
Total assets | | | | 547,487,253 |
| Liabilities | | | | |
| Payable for fund shares redeemed | | 580,487 | | |
| Accrued management fee | | 244,618 | | |
| Other affiliated payables | | 88,821 | | |
| Other payables and accrued expenses | | 20,217 | | |
| Collateral on securities loaned | | 17,981,340 | | |
| Total Liabilities | | | | 18,915,483 |
| Net Assets | | | $ | 528,571,770 |
| Net Assets consist of: | | | | |
| Paid in capital | | | $ | 433,560,826 |
| Total accumulated earnings (loss) | | | | 95,010,944 |
| Net Assets | | | $ | 528,571,770 |
Net Asset Value , offering price and redemption price per share ($528,571,770 ÷ 37,456,808 shares) | | | $ | 14.11 |
| | | | | |
| Statement of Operations |
| | | | Six months ended August 31, 2022 (Unaudited) |
| Investment Income | | | | |
| Dividends | | | $ | 2,761,453 |
| Income from Fidelity Central Funds (including $656,353 from security lending) | | | | 664,613 |
| Total Income | | | | 3,426,066 |
| Expenses | | | | |
| Management fee | $ | 1,484,709 | | |
| Transfer agent fees | | 463,888 | | |
| Accounting fees | | 101,387 | | |
| Custodian fees and expenses | | 3,415 | | |
| Independent trustees' fees and expenses | | 928 | | |
| Registration fees | | 24,078 | | |
| Audit | | 17,704 | | |
| Legal | | 1,299 | | |
| Miscellaneous | | 2,021 | | |
| Total expenses before reductions | | 2,099,429 | | |
| Expense reductions | | (9,337) | | |
| Total expenses after reductions | | | | 2,090,092 |
| Net Investment income (loss) | | | | 1,335,974 |
| Realized and Unrealized Gain (Loss) | | | | |
| Net realized gain (loss) on: | | | | |
| Investment Securities: | | | | |
| Unaffiliated issuers | | (2,239,628) | | |
| Foreign currency transactions | | 256 | | |
| Total net realized gain (loss) | | | | (2,239,372) |
| Change in net unrealized appreciation (depreciation) on: | | | | |
| Investment Securities: | | | | |
| Unaffiliated issuers | | (72,131,702) | | |
| Assets and liabilities in foreign currencies | | (1,705) | | |
| Total change in net unrealized appreciation (depreciation) | | | | (72,133,407) |
| Net gain (loss) | | | | (74,372,779) |
| Net increase (decrease) in net assets resulting from operations | | | $ | (73,036,805) |
| Statement of Changes in Net Assets |
| |
| | Six months ended August 31, 2022 (Unaudited) | | Year ended February 28, 2022 |
| Increase (Decrease) in Net Assets | | | | |
| Operations | | | | |
| Net investment income (loss) | $ | 1,335,974 | $ | 336,640 |
| Net realized gain (loss) | | (2,239,372) | | 141,336,647 |
| Change in net unrealized appreciation (depreciation) | | (72,133,407) | | (91,223,907) |
| Net increase (decrease) in net assets resulting from operations | | (73,036,805) | | 50,449,380 |
| Distributions to shareholders | | (16,564,419) | | (140,839,314) |
| Share transactions | | | | |
| Proceeds from sales of shares | | 25,133,200 | | 249,737,495 |
| Reinvestment of distributions | | 15,579,357 | | 130,602,409 |
| Cost of shares redeemed | | (69,339,825) | | (296,858,478) |
Net increase (decrease) in net assets resulting from share transactions | | (28,627,268) | | 83,481,426 |
| Total increase (decrease) in net assets | | (118,228,492) | | (6,908,508) |
| | | | | |
| Net Assets | | | | |
| Beginning of period | | 646,800,262 | | 653,708,770 |
| End of period | $ | 528,571,770 | $ | 646,800,262 |
| | | | | |
| Other Information | | | | |
| Shares | | | | |
| Sold | | 1,692,062 | | 13,101,449 |
| Issued in reinvestment of distributions | | 1,011,647 | | 7,680,514 |
| Redeemed | | (4,744,914) | | (15,791,115) |
| Net increase (decrease) | | (2,041,205) | | 4,990,848 |
| | | | | |
| | Six months ended (Unaudited) August 31, 2022 | | Years ended February 28, 2022 | | 2021 | | 2020 A | | 2019 B | | 2018 B |
Selected Per-Share Data | | | | | | | | | | | | |
| Net asset value, beginning of period | $ | 16.38 | $ | 18.94 | $ | 13.89 | $ | 14.53 | $ | 16.58 | $ | 14.14 |
| Income from Investment Operations | | | | | | | | | | | | |
Net investment income (loss) C,D | | .03 | | .01 | | .07 | | .12 | | .16 | | .18 |
| Net realized and unrealized gain (loss) | | (1.87) | | 1.41 | | 5.40 | | .25 | | .39 | | 3.31 |
| Total from investment operations | | (1.84) | | 1.42 | | 5.47 | | .37 | | .55 | | 3.49 |
| Distributions from net investment income | | (.01) | | (.02) | | (.08) | | (.11) | | (.16) | | (.14) |
| Distributions from net realized gain | | (.42) | | (3.96) | | (.34) | | (.89) | | (2.44) | | (.91) |
| Total distributions | | (.43) | | (3.98) | | (.42) | | (1.01) E | | (2.60) | | (1.05) |
Redemption fees added to paid in capital C | | - | | - | | - | | - | | - F | | - F |
| Net asset value, end of period | $ | 14.11 | $ | 16.38 | $ | 18.94 | $ | 13.89 | $ | 14.53 | $ | 16.58 |
Total Return G,H | | (11.45)% | | 7.53% | | 41.30% | | 1.76% | | 4.48% | | 24.75% |
Ratios to Average Net Assets D,I,J | | | | | | | | | | | | |
| Expenses before reductions | | .74% K | | .73% | | .77% | | .76% | | .76% | | .77% |
| Expenses net of fee waivers, if any | | .74% K | | .73% | | .77% | | .75% | | .76% | | .77% |
| Expenses net of all reductions | | .74% K | | .73% | | .76% | | .75% | | .76% | | .77% |
| Net investment income (loss) | | .47% K | | .05% | | .48% | | .79% | | 1.05% | | 1.09% |
| Supplemental Data | | | | | | | | | | | | |
| Net assets, end of period (000 omitted) | $ | 528,572 | $ | 646,800 | $ | 653,709 | $ | 431,146 | $ | 472,923 | $ | 544,540 |
Portfolio turnover rate L | | 32% K | | 79% | | 72% | | 53% | | 41% | | 56% |
A For the year ended February 29.
B Per share amounts have been adjusted to reflect the impact of the 10 for 1 share split that soccurred on August 10, 2018.
C Calculated based on average shares outstanding during the period.
D Net investment income (loss) is affected by the timing of the declaration of dividends by any underlying mutual funds or exchange-traded funds (ETFs). Net investment income (loss) of any such underlying funds is not included in the Fund's net investment income (loss) ratio.
E Total distributions per share do not sum due to rounding.
F Amount represents less than $.005 per share.
G Total returns for periods of less than one year are not annualized.
H Total returns would have been lower if certain expenses had not been reduced during the applicable periods shown.
I Fees and expenses of any underlying mutual funds or exchange-traded funds (ETFs) are not included in the Fund's expense ratio. The Fund indirectly bears its proportionate share of these expenses. For additional expense information related to investments in Fidelity Central Funds, please refer to the "Investments in Fidelity Central Funds" note found in the Notes to Financial Statements section of the most recent Annual or Semi-Annual report.
J Expense ratios reflect operating expenses of the class. Expenses before reductions do not reflect amounts reimbursed, waived, or reduced through arrangements with the investment adviser, brokerage services, or other offset arrangements, if applicable, and do not represent the amount paid by the class during periods when reimbursements, waivers or reductions occur.
K Annualized
L Amount does not include the portfolio activity of any underlying mutual funds or exchange-traded funds (ETFs).
Top Holdings (% of Fund's net assets) |
| |
| Amazon.com, Inc. | 24.5 | |
| The Home Depot, Inc. | 10.9 | |
| Lowe's Companies, Inc. | 7.9 | |
| Target Corp. | 5.8 | |
| Dollar General Corp. | 4.9 | |
| TJX Companies, Inc. | 4.8 | |
| Dollar Tree, Inc. | 3.8 | |
| O'Reilly Automotive, Inc. | 3.8 | |
| eBay, Inc. | 3.8 | |
| Five Below, Inc. | 3.3 | |
| | 73.5 | |
| |
| Industries (% of Fund's net assets) |
| |
| Specialty Retail | 43.6 | |
| Internet & Direct Marketing Retail | 31.6 | |
| Multiline Retail | 17.5 | |
| Textiles, Apparel & Luxury Goods | 5.3 | |
| Food & Staples Retailing | 0.5 | |
| |
Retailing Portfolio
| Common Stocks - 98.5% |
| | | Shares | Value ($) |
| Food & Staples Retailing - 0.5% | | | |
| Hypermarkets & Super Centers - 0.5% | | | |
| BJ's Wholesale Club Holdings, Inc. (a) | | 191,640 | 14,275,264 |
| Internet & Direct Marketing Retail - 31.6% | | | |
| Internet & Direct Marketing Retail - 31.6% | | | |
| Amazon.com, Inc. (a) | | 5,541,400 | 702,483,276 |
| eBay, Inc. (b) | | 2,440,100 | 107,681,613 |
| Etsy, Inc. (a) | | 290,860 | 30,717,725 |
| MercadoLibre, Inc. (a) | | 65,400 | 55,940,544 |
| The RealReal, Inc. (a)(b) | | 2,040,833 | 4,367,383 |
| thredUP, Inc. (a) | | 677,862 | 1,633,647 |
| Wayfair LLC Class A (a) | | 37,600 | 1,981,896 |
| | | | 904,806,084 |
| Multiline Retail - 17.5% | | | |
| Department Stores - 0.8% | | | |
| Nordstrom, Inc. (b) | | 1,310,100 | 22,415,811 |
| General Merchandise Stores - 16.7% | | | |
| Dollar General Corp. | | 597,500 | 141,858,450 |
| Dollar Tree, Inc. (a) | | 807,800 | 109,602,304 |
| Franchise Group, Inc. | | 53,774 | 1,822,401 |
| Ollie's Bargain Outlet Holdings, Inc. (a) | | 1,082,959 | 59,898,462 |
| Target Corp. | | 1,036,600 | 166,208,444 |
| | | | 479,390,061 |
TOTAL MULTILINE RETAIL | | | 501,805,872 |
| Specialty Retail - 43.6% | | | |
| Apparel Retail - 8.7% | | | |
| American Eagle Outfitters, Inc. (b) | | 1,485,400 | 16,725,604 |
| Burlington Stores, Inc. (a) | | 401,694 | 56,313,482 |
| TJX Companies, Inc. | | 2,208,832 | 137,720,675 |
| Victoria's Secret & Co. (a)(b) | | 1,108,633 | 37,072,688 |
| | | | 247,832,449 |
| Automotive Retail - 3.8% | | | |
| O'Reilly Automotive, Inc. (a) | | 154,900 | 107,983,888 |
| Home Improvement Retail - 21.8% | | | |
| Floor & Decor Holdings, Inc. Class A (a)(b) | | 1,046,737 | 85,162,522 |
| Lowe's Companies, Inc. | | 1,172,800 | 227,687,392 |
| The Home Depot, Inc. | | 1,083,700 | 312,560,754 |
| | | | 625,410,668 |
| Homefurnishing Retail - 1.2% | | | |
| RH (a) | | 135,000 | 34,547,850 |
| Specialty Stores - 8.1% | | | |
| Bath & Body Works, Inc. | | 1,077,800 | 40,234,274 |
| Dick's Sporting Goods, Inc. (b) | | 125,000 | 13,296,250 |
| Five Below, Inc. (a)(b) | | 728,900 | 93,211,732 |
| Ulta Beauty, Inc. (a) | | 200,500 | 84,183,935 |
| | | | 230,926,191 |
TOTAL SPECIALTY RETAIL | | | 1,246,701,046 |
| Textiles, Apparel & Luxury Goods - 5.3% | | | |
| Apparel, Accessories & Luxury Goods - 4.4% | | | |
| Canada Goose Holdings, Inc. (a)(b) | | 278,600 | 5,018,979 |
| Capri Holdings Ltd. (a) | | 1,340,200 | 63,230,636 |
| lululemon athletica, Inc. (a) | | 80,657 | 24,193,874 |
| Tapestry, Inc. | | 988,200 | 34,320,186 |
| | | | 126,763,675 |
| Footwear - 0.9% | | | |
| Deckers Outdoor Corp. (a) | | 79,400 | 25,532,658 |
TOTAL TEXTILES, APPAREL & LUXURY GOODS | | | 152,296,333 |
| TOTAL COMMON STOCKS (Cost $1,702,877,266) | | | 2,819,884,599 |
| | | | |
| Money Market Funds - 7.0% |
| | | Shares | Value ($) |
| Fidelity Cash Central Fund 2.33% (c) | | 12,951,696 | 12,954,287 |
| Fidelity Securities Lending Cash Central Fund 2.34% (c)(d) | | 186,593,022 | 186,611,682 |
| TOTAL MONEY MARKET FUNDS (Cost $199,565,969) | | | 199,565,969 |
| | | | |
| TOTAL INVESTMENT IN SECURITIES - 105.5% (Cost $1,902,443,235) | 3,019,450,568 |
NET OTHER ASSETS (LIABILITIES) - (5.5)% | (156,801,426) |
| NET ASSETS - 100.0% | 2,862,649,142 |
| | |
Legend
| (b) | Security or a portion of the security is on loan at period end. |
| (c) | Affiliated fund that is generally available only to investment companies and other accounts managed by Fidelity Investments. The rate quoted is the annualized seven-day yield of the fund at period end. A complete unaudited listing of the fund's holdings as of its most recent quarter end is available upon request. In addition, each Fidelity Central Fund's financial statements are available on the SEC's website or upon request. |
| (d) | Investment made with cash collateral received from securities on loan. |
Affiliated Central Funds
Fiscal year to date information regarding the Fund's investments in Fidelity Central Funds, including the ownership percentage, is presented below.
| Affiliate | Value, beginning of period ($) | Purchases ($) | Sales Proceeds ($) | Dividend Income ($) | Realized Gain (loss) ($) | Change in Unrealized appreciation (depreciation) ($) | Value, end of period ($) | %ownership, end of period |
| Fidelity Cash Central Fund 2.33% | - | 284,926,971 | 271,972,684 | 216,866 | - | - | 12,954,287 | 0.0% |
| Fidelity Securities Lending Cash Central Fund 2.34% | 262,083,095 | 896,038,423 | 971,509,836 | 91,557 | - | - | 186,611,682 | 0.5% |
| Total | 262,083,095 | 1,180,965,394 | 1,243,482,520 | 308,423 | - | - | 199,565,969 | |
| | | | | | | | | |
Amounts in the income column in the above table include any capital gain distributions from underlying funds, which are presented in the corresponding line item in the Statement of Operations, if applicable.
Amount for Fidelity Securities Lending Cash Central Fund represents the income earned on investing cash collateral, less rebates paid to borrowers and any lending agent fees associated with the loan, plus any premium payments received for lending certain types of securities.
Investment Valuation
The following is a summary of the inputs used, as of August 31, 2022, involving the Fund's assets and liabilities carried at fair value. The inputs or methodology used for valuing securities may not be an indication of the risk associated with investing in those securities. For more information on valuation inputs, and their aggregation into the levels used below, please refer to the Investment Valuation section in the accompanying Notes to Financial Statements.
| Valuation Inputs at Reporting Date: |
| Description | Total ($) | Level 1 ($) | Level 2 ($) | Level 3 ($) |
Investments in Securities: | | | | |
|
| Common Stocks | 2,819,884,599 | 2,819,884,599 | - | - |
|
| Money Market Funds | 199,565,969 | 199,565,969 | - | - |
| Total Investments in Securities: | 3,019,450,568 | 3,019,450,568 | - | - |
Retailing Portfolio
| Statement of Assets and Liabilities |
| | | | August 31, 2022 (Unaudited) |
| | | | | |
| Assets | | | | |
| Investment in securities, at value (including securities loaned of $178,483,080) - See accompanying schedule: | | $2,819,884,599 | | |
Unaffiliated issuers (cost $1,702,877,266) | | | |
Fidelity Central Funds (cost $199,565,969) | | 199,565,969 | | |
| | | | | |
| Total Investment in Securities (cost $1,902,443,235) | | | $ | 3,019,450,568 |
| Receivable for investments sold | | | | 28,673,462 |
| Receivable for fund shares sold | | | | 390,023 |
| Dividends receivable | | | | 5,063,132 |
| Distributions receivable from Fidelity Central Funds | | | | 59,120 |
| Prepaid expenses | | | | 12,359 |
| Other receivables | | | | 18,093 |
Total assets | | | | 3,053,666,757 |
| Liabilities | | | | |
| Payable for fund shares redeemed | | 2,561,244 | | |
| Accrued management fee | | 1,355,229 | | |
| Other affiliated payables | | 471,475 | | |
| Other payables and accrued expenses | | 22,320 | | |
| Collateral on securities loaned | | 186,607,347 | | |
| Total Liabilities | | | | 191,017,615 |
| Net Assets | | | $ | 2,862,649,142 |
| Net Assets consist of: | | | | |
| Paid in capital | | | $ | 1,776,081,898 |
| Total accumulated earnings (loss) | | | | 1,086,567,244 |
| Net Assets | | | $ | 2,862,649,142 |
Net Asset Value , offering price and redemption price per share ($2,862,649,142 ÷ 174,268,556 shares) | | | $ | 16.43 |
| | | | | |
| Statement of Operations |
| | | | Six months ended August 31, 2022 (Unaudited) |
| Investment Income | | | | |
| Dividends | | | $ | 18,705,659 |
| Income from Fidelity Central Funds (including $91,557 from security lending) | | | | 308,423 |
| Total Income | | | | 19,014,082 |
| Expenses | | | | |
| Management fee | $ | 8,317,896 | | |
| Transfer agent fees | | 2,562,043 | | |
| Accounting fees | | 432,806 | | |
| Custodian fees and expenses | | 8,490 | | |
| Independent trustees' fees and expenses | | 5,219 | | |
| Registration fees | | 22,731 | | |
| Audit | | 17,704 | | |
| Legal | | 1,385 | | |
| Interest | | 3,488 | | |
| Miscellaneous | | 11,331 | | |
| Total expenses before reductions | | 11,383,093 | | |
| Expense reductions | | (53,349) | | |
| Total expenses after reductions | | | | 11,329,744 |
| Net Investment income (loss) | | | | 7,684,338 |
| Realized and Unrealized Gain (Loss) | | | | |
| Net realized gain (loss) on: | | | | |
| Investment Securities: | | | | |
| Unaffiliated issuers | | (35,650,121) | | |
| Foreign currency transactions | | 1,437 | | |
| Total net realized gain (loss) | | | | (35,648,684) |
| Change in net unrealized appreciation (depreciation) on: | | | | |
| Investment Securities: | | | | |
| Unaffiliated issuers | | (546,638,583) | | |
| Unfunded commitments | | 1,090,000 | | |
| Assets and liabilities in foreign currencies | | (2,792) | | |
| Total change in net unrealized appreciation (depreciation) | | | | (545,551,375) |
| Net gain (loss) | | | | (581,200,059) |
| Net increase (decrease) in net assets resulting from operations | | | $ | (573,515,721) |
| Statement of Changes in Net Assets |
| |
| | Six months ended August 31, 2022 (Unaudited) | | Year ended February 28, 2022 |
| Increase (Decrease) in Net Assets | | | | |
| Operations | | | | |
| Net investment income (loss) | $ | 7,684,338 | $ | (3,062,137) |
| Net realized gain (loss) | | (35,648,684) | | 530,772,015 |
| Change in net unrealized appreciation (depreciation) | | (545,551,375) | | (548,230,610) |
| Net increase (decrease) in net assets resulting from operations | | (573,515,721) | | (20,520,732) |
| Distributions to shareholders | | (73,979,629) | | (645,718,415) |
| Share transactions | | | | |
| Proceeds from sales of shares | | 87,168,320 | | 589,399,734 |
| Reinvestment of distributions | | 69,737,425 | | 608,923,199 |
| Cost of shares redeemed | | (350,952,082) | | (883,831,786) |
Net increase (decrease) in net assets resulting from share transactions | | (194,046,337) | | 314,491,147 |
| Total increase (decrease) in net assets | | (841,541,687) | | (351,748,000) |
| | | | | |
| Net Assets | | | | |
| Beginning of period | | 3,704,190,829 | | 4,055,938,829 |
| End of period | $ | 2,862,649,142 | $ | 3,704,190,829 |
| | | | | |
| Other Information | | | | |
| Shares | | | | |
| Sold | | 4,905,945 | | 24,397,911 |
| Issued in reinvestment of distributions | | 3,587,316 | | 26,457,673 |
| Redeemed | | (20,173,527) | | (37,526,804) |
| Net increase (decrease) | | (11,680,266) | | 13,328,780 |
| | | | | |
| | Six months ended (Unaudited) August 31, 2022 | | Years ended February 28, 2022 | | 2021 | | 2020 A | | 2019 B | | 2018 B |
Selected Per-Share Data | | | | | | | | | | | | |
| Net asset value, beginning of period | $ | 19.92 | $ | 23.50 | $ | 15.71 | $ | 15.01 | $ | 14.35 | $ | 11.56 |
| Income from Investment Operations | | | | | | | | | | | | |
Net investment income (loss) C,D | | .04 | | (.02) | | (.01) | | .04 | | .03 | | .04 |
| Net realized and unrealized gain (loss) | | (3.12) | | .11 | | 9.35 | | 1.02 | | .93 | | 3.23 |
| Total from investment operations | | (3.08) | | .09 | | 9.34 | | 1.06 | | .96 | | 3.27 |
| Distributions from net investment income | | - | | - | | - | | (.05) | | (.02) | | (.03) |
| Distributions from net realized gain | | (.41) | | (3.67) | | (1.55) | | (.31) | | (.27) | | (.45) |
| Total distributions | | (.41) | | (3.67) | | (1.55) | | (.36) | | (.30) E | | (.48) |
| Net asset value, end of period | $ | 16.43 | $ | 19.92 | $ | 23.50 | $ | 15.71 | $ | 15.01 | $ | 14.35 |
Total Return F,G | | (15.80)% | | (1.23)% | | 59.90% | | 7.02% | | 6.83% | | 28.66% |
Ratios to Average Net Assets D,H,I | | | | | | | | | | | | |
| Expenses before reductions | | .72% J | | .70% | | .73% | | .74% | | .76% | | .78% |
| Expenses net of fee waivers, if any | | .72% J | | .70% | | .73% | | .74% | | .75% | | .77% |
| Expenses net of all reductions | | .72% J | | .70% | | .73% | | .74% | | .75% | | .77% |
| Net investment income (loss) | | .49% J | | (.07)% | | (.07)% | | .26% | | .20% | | .29% |
| Supplemental Data | | | | | | | | | | | | |
| Net assets, end of period (000 omitted) | $ | 2,862,649 | $ | 3,704,191 | $ | 4,055,939 | $ | 2,698,998 | $ | 3,035,591 | $ | 2,329,366 |
Portfolio turnover rate K | | 34% J | | 33% | | 46% | | 17% | | 34% | | 24% |
A For the year ended February 29.
B Per share amounts have been adjusted to reflect the impact of the 10 for 1 share split that occurred on May 11, 2018.
C Calculated based on average shares outstanding during the period.
D Net investment income (loss) is affected by the timing of the declaration of dividends by any underlying mutual funds or exchange-traded funds (ETFs). Net investment income (loss) of any such underlying funds is not included in the Fund's net investment income (loss) ratio.
E Total distributions per share do not sum due to rounding.
F Total returns for periods of less than one year are not annualized.
G Total returns would have been lower if certain expenses had not been reduced during the applicable periods shown.
H Fees and expenses of any underlying mutual funds or exchange-traded funds (ETFs) are not included in the Fund's expense ratio. The Fund indirectly bears its proportionate share of these expenses. For additional expense information related to investments in Fidelity Central Funds, please refer to the "Investments in Fidelity Central Funds" note found in the Notes to Financial Statements section of the most recent Annual or Semi-Annual report.
I Expense ratios reflect operating expenses of the class. Expenses before reductions do not reflect amounts reimbursed, waived, or reduced through arrangements with the investment adviser, brokerage services, or other offset arrangements, if applicable, and do not represent the amount paid by the class during periods when reimbursements, waivers or reductions occur.
J Annualized
K Amount does not include the portfolio activity of any underlying mutual funds or exchange-traded funds (ETFs).
For the period ended August 31, 2022
1. Organization.
Automotive Portfolio, Communication Services Portfolio, Construction and Housing Portfolio, Consumer Discretionary Portfolio, Leisure Portfolio, and Retailing Portfolio (the Funds) are non-diversified funds of Fidelity Select Portfolios (the Trust). The Trust is registered under the Investment Company Act of 1940, as amended (the 1940 Act), as an open-end management investment company organized as a Massachusetts business trust. Each Fund is authorized to issue an unlimited number of shares. Each Fund offers a single class of shares, with the exception of Communication Services Portfolio. Communication Services Portfolio offers Class A, Class M, Class C, Communication Services, Class I and Class Z shares. Each class of Communication Services Portfolio has equal rights as to assets and voting privileges, and each class has exclusive voting rights with respect to matters that affect that class. Class C shares will automatically convert to Class A shares after a holding period of eight years from the initial date of purchase, with certain exceptions. The Funds invest primarily in securities of companies whose principal business activities fall within specific industries. Share transactions on the Statement of Changes in Net Assets and Share Transactions note may contain exchanges between affiliated funds.
2. Investments in Fidelity Central Funds.
Funds may invest in Fidelity Central Funds, which are open-end investment companies generally available only to other investment companies and accounts managed by the investment adviser and its affiliates. The Schedule of Investments lists any Fidelity Central Funds held as an investment as of period end, but does not include the underlying holdings of each Fidelity Central Fund. An investing fund indirectly bears its proportionate share of the expenses of the underlying Fidelity Central Funds.
Based on its investment objective, each Fidelity Central Fund may invest or participate in various investment vehicles or strategies that are similar to those of the investing fund. These strategies are consistent with the investment objectives of the investing fund and may involve certain economic risks which may cause a decline in value of each of the Fidelity Central Funds and thus a decline in the value of the investing fund.
| Fidelity Central Fund | Investment Manager | Investment Objective | Investment Practices | Expense Ratio A |
| Fidelity Money Market Central Funds | Fidelity Management & Research Company LLC (FMR) | Each fund seeks to obtain a high level of current income consistent with the preservation of capital and liquidity. | Short-term Investments | Less than .005% |
A Expenses expressed as a percentage of average net assets and are as of each underlying Central Fund's most recent annual or semi-annual shareholder report.
A complete unaudited list of holdings for each Fidelity Central Fund is available upon request or at the Securities and Exchange Commission website at www.sec.gov. In addition, the financial statements of the Fidelity Central Funds which contain the significant accounting policies (including investment valuation policies) of those funds, and are not covered by the Report of Independent Registered Public Accounting Firm, are available on the Securities and Exchange Commission website or upon request.
3. Significant Accounting Policies.
Each Fund is an investment company and applies the accounting and reporting guidance of the Financial Accounting Standards Board (FASB) Accounting Standards Codification Topic 946 Financial Services - Investment Companies . The financial statements have been prepared in conformity with accounting principles generally accepted in the United States of America (GAAP), which require management to make certain estimates and assumptions at the date of the financial statements. Actual results could differ from those estimates. Subsequent events, if any, through the date that the financial statements were issued have been evaluated in the preparation of the financial statements. Each Fund's Schedule of Investments lists any underlying mutual funds or exchange-traded funds (ETFs) but does not include the underlying holdings of these funds. The following summarizes the significant accounting policies of each Fund:
Investment Valuation. Investments are valued as of 4:00 p.m. Eastern time on the last calendar day of the period. The Board of Trustees (the Board) has delegated the day to day responsibility for the valuation of each Fund's investments to the Fair Value Committee (the Committee) established by each Fund's investment adviser. In accordance with valuation policies and procedures approved by the Board, each Fund attempts to obtain prices from one or more third party pricing vendors or brokers to value its investments. When current market prices, quotations or currency exchange rates are not readily available or reliable, investments will be fair valued in good faith by the Committee, in accordance with procedures adopted by the Board. Factors used in determining fair value vary by investment type and may include market or investment specific events. The frequency with which these procedures are used cannot be predicted and they may be utilized to a significant extent. The Committee oversees each Fund's valuation policies and procedures and reports to the Board on the Committee's activities and fair value determinations. The Board monitors the appropriateness of the procedures used in valuing each Fund's investments and ratifies the fair value determinations of the Committee.
Each Fund categorizes the inputs to valuation techniques used to value its investments into a disclosure hierarchy consisting of three levels as shown below:
Level 1 - unadjusted quoted prices in active markets for identical investments
Level 2 - other significant observable inputs (including quoted prices for similar investments, interest rates, prepayment speeds, etc.)
Level 3 - unobservable inputs (including the Fund's own assumptions based on the best information available)
Valuation techniques used to value each Fund's investments by major category are as follows:
Equity securities, including restricted securities, for which market quotations are readily available, are valued at the last reported sale price or official closing price as reported by a third party pricing vendor on the primary market or exchange on which they are traded and are categorized as Level 1 in the hierarchy. In the event there were no sales during the day or closing prices are not available, securities are valued at the last quoted bid price or may be valued using the last available price and are generally categorized as Level 2 in the hierarchy. For foreign equity securities, when market or security specific events arise, comparisons to the valuation of American Depositary Receipts (ADRs), futures contracts, ETFs and certain indexes as well as quoted prices for similar securities may be used and would be categorized as Level 2 in the hierarchy. For equity securities, including restricted securities, where observable inputs are limited, assumptions about market activity and risk are used and these securities may be categorized as Level 3 in the hierarchy.
Investments in open-end mutual funds, including the Fidelity Central Funds, are valued at their closing net asset value (NAV) each business day and are categorized as Level 1 in the hierarchy.
Changes in valuation techniques may result in transfers in or out of an assigned level within the disclosure hierarchy. The aggregate value of investments by input level as of August 31, 2022 is included at the end of each Fund's Schedule of Investments.
Foreign Currency. Certain Funds may use foreign currency contracts to facilitate transactions in foreign-denominated securities. Gains and losses from these transactions may arise from changes in the value of the foreign currency or if the counterparties do not perform under the contracts' terms.
Foreign-denominated assets, including investment securities, and liabilities are translated into U.S. dollars at the exchange rates at period end. Purchases and sales of investment securities, income and dividends received, and expenses denominated in foreign currencies are translated into U.S. dollars at the exchange rate in effect on the transaction date.
The effects of exchange rate fluctuations on investments are included with the net realized and unrealized gain (loss) on investment securities. Other foreign currency transactions resulting in realized and unrealized gain (loss) are disclosed separately.
Investment Transactions and Income. For financial reporting purposes, the Funds' investment holdings and NAV include trades executed through the end of the last business day of the period. The NAV per share for processing shareholder transactions is calculated as of the close of business of the New York Stock Exchange (NYSE), normally 4:00 p.m. Eastern time and includes trades executed through the end of the prior business day. Gains and losses on securities sold are determined on the basis of identified cost and for certain Funds include proceeds received from litigation. Commissions paid to certain brokers with whom the investment adviser, or its affiliates, places trades on behalf of a fund include an amount in addition to trade execution, which may be rebated back to a fund. Any such rebates are included in net realized gain (loss) on investments in the Statement of Operations. Dividend income is recorded on the ex-dividend date, except for certain dividends from foreign securities where the ex-dividend date may have passed, which are recorded as soon as the Funds are informed of the ex-dividend date. Non-cash dividends included in dividend income, if any, are recorded at the fair market value of the securities received. Income and capital gain distributions from Fidelity Central Funds, if any, are recorded on the ex-dividend date. Certain distributions received by the Funds represent a return of capital or capital gain. The Funds determine the components of these distributions subsequent to the ex-dividend date, based upon receipt of tax filings or other correspondence relating to the underlying investment. These distributions are recorded as a reduction of cost of investments and/or as a realized gain. Investment income is recorded net of foreign taxes withheld where recovery of such taxes is uncertain. Funds may file withholding tax reclaims in certain jurisdictions to recover a portion of amounts previously withheld. Any withholding tax reclaims income is included in the Statement of Operations in dividends. Any receivables for withholding tax reclaims are included in the Statement of Assets and Liabilities in dividends receivable.
Class Allocations and Expenses. Expenses directly attributable to a fund are charged to that fund. Expenses attributable to more than one fund are allocated among the respective funds on the basis of relative net assets or other appropriate methods. Expenses included in the accompanying financial statements reflect the expenses of that fund and do not include any expenses associated with any underlying mutual funds or exchange-traded funds. Although not included in a fund's expenses, a fund indirectly bears its proportionate share of these expenses through the net asset value of each underlying mutual fund or exchange-traded fund. Expense estimates are accrued in the period to which they relate and adjustments are made when actual amounts are known.
For Communication Services Portfolio, investment income, realized and unrealized capital gains and losses, common expenses, and certain fund-level expense reductions, if any, are allocated daily on a pro-rata basis to each class based on the relative net assets of each class to the total net assets. Each class differs with respect to transfer agent and distribution and service plan fees incurred. Certain expense reductions may also differ by class. For the reporting period, the allocated portion of income and expenses to each class as a percent of its average net assets may vary due to the timing of recording these transactions in relation to fluctuating net assets of the classes.
Income Tax Information and Distributions to Shareholders. Each year, each Fund intends to qualify as a regulated investment company under Subchapter M of the Internal Revenue Code, including distributing substantially all of its taxable income and realized gains. As a result, no provision for U.S. Federal income taxes is required. Each Fund files a U.S. federal tax return, in addition to state and local tax returns as required. Each Fund's federal income tax returns are subject to examination by the Internal Revenue Service (IRS) for a period of three fiscal years after they are filed. State and local tax returns may be subject to examination for an additional fiscal year depending on the jurisdiction. Foreign taxes are provided for based on each Fund's understanding of the tax rules and rates that exist in the foreign markets in which it invests.
Distributions are declared and recorded on the ex-dividend date. Income and capital gain distributions are declared separately for each class. Income and capital gain distributions are determined in accordance with income tax regulations, which may differ from GAAP.
Capital accounts within the financial statements are adjusted for permanent book-tax differences. These adjustments have no impact on net assets or the results of operations. Capital accounts are not adjusted for temporary book-tax differences which will reverse in a subsequent period.
Book-tax differences are primarily due to foreign currency transactions, passive foreign investment companies (PFIC), net operating losses, and losses deferred due to wash sales and excise tax regulations.
As of period end, the cost and unrealized appreciation (depreciation) in securities, and derivatives if applicable, for federal income tax purposes were as follows for each Fund:
| | Tax cost | Gross unrealized appreciation | Gross unrealized depreciation | Net unrealized appreciation (depreciation) |
| Automotive Portfolio | $ 109,645,877 | $ 36,389,789 | $ (8,972,496) | $ 27,417,293 |
| Communication Services Portfolio | 776,436,055 | 195,675,659 | (150,436,066) | 45,239,593 |
| Construction and Housing Portfolio | 395,542,441 | 167,539,809 | (47,184,938) | 120,354,871 |
| Consumer Discretionary Portfolio | 311,271,010 | 149,311,645 | (12,846,379) | 136,465,266 |
| Leisure Portfolio | 447,838,718 | 148,324,958 | (51,733,446) | 96,591,512 |
| Retailing Portfolio | 1,904,664,933 | 1,332,852,163 | (218,066,528) | 1,114,785,635 |
Certain of the Funds elected to defer to the next fiscal year capital losses recognized during the period November 1, 2021 to February 28, 2022. Loss deferrals were as follows:
| | Capital losses |
| Communication Services Portfolio | $(5,076,729) |
| Construction and Housing Portfolio | (79,816) |
| Consumer Discretionary Portfolio | (9,825,218) |
Restricted Securities (including Private Placements). Funds may invest in securities that are subject to legal or contractual restrictions on resale. These securities generally may be resold in transactions exempt from registration or to the public if the securities are registered. Disposal of these securities may involve time-consuming negotiations and expense, and prompt sale at an acceptable price may be difficult. Information regarding restricted securities held at period end is included at the end of the Schedule of Investments, if applicable.
Commitments. A commitment is an agreement to acquire an investment at a future date (subject to conditions) in connection with a potential public or non-public offering. Commitments outstanding at period end are presented in the table below. Unrealized appreciation (depreciation) on any commitments outstanding at period end is separately presented in the Statements of Assets and Liabilities as Unrealized appreciation (depreciation) on unfunded commitments, and any change in unrealized appreciation (depreciation) on unfunded commitments during the period is separately presented in the Statement of Operations, as applicable based on contractual conditions of each commitment.
| | Investment to be Acquired | Commitment Amount | Unrealized Appreciation (Depreciation) |
| Communication Services Portfolio | Twitter, Inc. | $1,724,102 | -- |
Special Purpose Acquisition Companies. Funds may invest in stock, warrants, and other securities of special purpose acquisition companies (SPACs) or similar special purpose entities. A SPAC is a publicly traded company that raises investment capital via an initial public offering (IPO) for the purpose of acquiring the equity securities of one or more existing companies via merger, business combination, acquisition or other similar transactions within a
designated time frame.
Private Investment in Public Equity. Funds may acquire equity securities of an issuer through a private investment in a public equity (PIPE) transaction, including through commitments to purchase securities on a when-issued basis. A PIPE typically involves the purchase of securities directly from a publicly traded company in a private placement transaction. Securities purchased through PIPE transactions will be restricted from trading and considered illiquid until a resale registration statement for the shares is filed and declared effective.
At the current and/or prior period end, Retailing Portfolio had commitments to purchase when-issued securities through PIPE transactions with SPACs. The commitments are contingent upon the SPACs acquiring the securities of target companies. Unrealized appreciation (depreciation) on any commitments outstanding at period end is separately presented in the Statements of Assets and Liabilities as Unrealized appreciation (depreciation) on unfunded commitments, and any change in unrealized appreciation (depreciation) on unfunded commitments during the period is separately presented in the Statement of Operations, as applicable.
4. Purchases and Sales of Investments.
Purchases and sales of securities, other than short-term securities and in-kind transactions, as applicable, are noted in the table below.
| | Purchases ($) | Sales ($) |
| Automotive Portfolio | 43,453,927 | 58,029,664 |
| Communication Services Portfolio | 95,840,034 | 177,199,915 |
| Construction and Housing Portfolio | 37,519,244 | 199,079,520 |
| Consumer Discretionary Portfolio | 179,401,853 | 115,709,471 |
| Leisure Portfolio | 90,257,687 | 138,749,736 |
| Retailing Portfolio | 522,825,616 | 809,036,571 |
5. Fees and Other Transactions with Affiliates.
Management Fee. Fidelity Management & Research Company LLC (the investment adviser) and its affiliates provide the Funds with investment management related services for which the Funds pay a monthly management fee. The management fee is the sum of an individual fund fee rate and an annualized group fee rate. The individual fund fee rate is applied to each Fund's average net assets. The group fee rate is based upon the monthly average net assets of a group of registered investment companies with which the investment adviser has management contracts. The group fee rate decreases as assets under management increase and increases as assets under management decrease. For the reporting period, each Fund's annualized management fee rate expressed as a percentage of each Fund's average net assets was as follows:
| | Individual Rate | Group Rate | Total |
| Automotive Portfolio | .30% | .23% | .52% |
| Communication Services Portfolio | .30% | .23% | .53% |
| Construction and Housing Portfolio | .30% | .23% | .52% |
| Consumer Discretionary Portfolio | .30% | .23% | .53% |
| Leisure Portfolio | .30% | .23% | .53% |
| Retailing Portfolio | .30% | .23% | .53% |
Distribution and Service Plan Fees. In accordance with Rule 12b-1 of the 1940 Act, Communication Services Portfolio has adopted separate Distribution and Service Plans for each class of shares. Certain classes pay Fidelity Distributors Company LLC (FDC), an affiliate of the investment adviser, separate Distribution and Service Fees, each of which is based on an annual percentage of each class' average net assets. In addition, FDC may pay financial intermediaries for selling shares of each Fund and providing shareholder support services. For the period, the Distribution and Service Fee rates, total fees and amounts retained by FDC were as follows:
| | Distribution Fee | Service Fee | Total Fees | Retained by FDC |
| Communication Services Portfolio | | | | |
| Class A | -% | .25% | $ 34,192 | $ 918 |
| Class M | .25% | .25% | 12,350 | - |
| Class C | .75% | .25% | 39,048 | 9,895 |
| | | | $ 85,590 | $ 10,813 |
Sales Load. For Communication Services Portfolio, FDC may receive a front-end sales charge of up to 5.75% for selling Class A shares and 3.50% for selling Class M shares, some of which is paid to financial intermediaries for selling shares of the Fund. Depending on the holding period, FDC may receive contingent deferred sales charges levied on Class A, Class M and Class C redemptions. The deferred sales charges are 1.00% for Class C shares, 1.00% for certain purchases of Class A shares and .25% for certain purchases of Class M shares.
For the period, sales charge amounts retained by FDC were as follows:
| | Retained by FDC |
| Communication Services Portfolio | |
| Class A | $ 5,863 |
| Class M | 401 |
Class C A | 379 |
| | $ 6,643 |
A When Class C shares are initially sold, FDC pays commissions from its own resources to financial intermediaries through which the sales are made.
Transfer Agent Fees. Fidelity Investments Institutional Operations Company LLC (FIIOC), an affiliate of the investment adviser, is the transfer, dividend disbursing and shareholder servicing agent for each class (Communication Services Portfolio) or Fund (all other Funds). FIIOC receives account fees and asset-based fees that vary according to the account size and type of account of the shareholders of the respective class or Fund, except for Class Z. FIIOC receives an asset-based fee of Class Z's average net assets. FIIOC pays for typesetting, printing and mailing of shareholder reports, except proxy statements. For the period, transfer agent fees were as follows:
| | Amount | % of Average Net Assets A |
| Automotive Portfolio | $155,582 | .24 |
| Communication Services Portfolio | | |
| Class A | 31,820 | .23 |
| Class M | 5,571 | .23 |
| Class C | 8,032 | .21 |
| Communication Services | 825,432 | .21 |
| Class I | 19,112 | .18 |
| Class Z | 1,017 | .04 |
| | 890,984 | |
| Construction and Housing Portfolio | 496,370 | .18 |
| Consumer Discretionary Portfolio | 329,506 | .17 |
| Leisure Portfolio | 463,888 | .16 |
| Retailing Portfolio | 2,562,043 | .16 |
A Annualized.
Accounting Fees. Fidelity Service Company, Inc. (FSC), an affiliate of the investment adviser, maintains each Fund's accounting records. The accounting fee is based on the level of average net assets for each month. For the period, the fees were equivalent to the following annualized rates:
| | % of Average Net Assets |
| Automotive Portfolio | .04 |
| Communication Services Portfolio | .03 |
| Construction and Housing Portfolio | .04 |
| Consumer Discretionary Portfolio | .04 |
| Leisure Portfolio | .04 |
| Retailing Portfolio | .03 |
Brokerage Commissions. A portion of portfolio transactions were placed with brokerage firms which are affiliates of the investment adviser. Brokerage commissions are included in net realized gain (loss) and change in net unrealized appreciation (depreciation) in the Statement of Operations. The commissions paid to these affiliated firms were as follows:
| | Amount |
| Automotive Portfolio | $ 1,590 |
| Communication Services Portfolio | 3,174 |
| Construction and Housing Portfolio | 1,279 |
| Consumer Discretionary Portfolio | 1,803 |
| Leisure Portfolio | 2,497 |
| Retailing Portfolio | 6,844 |
Interfund Lending Program. Pursuant to an Exemptive Order issued by the Securities and Exchange Commission (the SEC), each Fund, along with other registered investment companies having management contracts with Fidelity Management & Research Company LLC (FMR), or other affiliated entities of FMR, may participate in an interfund lending program. This program provides an alternative credit facility allowing each Fund to borrow from, or lend money to, other participating affiliated funds. At period end, there were no interfund loans outstanding. Activity in this program during the period for which loans were outstanding was as follows:
| | Borrower or Lender | Average Loan Balance | Weighted Average Interest Rate | Interest Expense |
| Construction and Housing Portfolio | Borrower | $8,206,000 | .32% | $72 |
| Consumer Discretionary Portfolio | Borrower | $ 3,766,000 | .75% | $866 |
| Retailing Portfolio | Borrower | $ 6,545,864 | .87% | $3,488 |
Interfund Trades. Funds may purchase from or sell securities to other Fidelity Funds under procedures adopted by the Board. The procedures have been designed to ensure these interfund trades are executed in accordance with Rule 17a-7 of the 1940 Act. Any interfund trades are included within the respective purchases and sales amounts shown in the Purchases and Sales of Investments note. Interfund trades during the period are noted in the table below.
| | Purchases ($) | Sales ($) | Realized Gain (Loss) ($) |
| Automotive Portfolio | 13,173 | 547,464 | (147,225) |
| Communication Services Portfolio | 1,825,396 | 3,799,821 | 615,355 |
| Construction and Housing Portfolio | 2,651,753 | 8,020,386 | (92,961) |
| Consumer Discretionary Portfolio | 14,177,689 | 7,367,526 | (5,043,737) |
| Leisure Portfolio | 6,850,092 | 8,333,248 | (3,087,269) |
| Retailing Portfolio | 48,798,865 | 48,105,815 | (2,306,505) |
6. Committed Line of Credit.
Certain Funds participate with other funds managed by the investment adviser or an affiliate in a $4.25 billion credit facility (the "line of credit") to be utilized for temporary or emergency purposes to fund shareholder redemptions or for other short-term liquidity purposes. The participating funds have agreed to pay commitment fees on their pro-rata portion of the line of credit, which are reflected in Miscellaneous expenses on the Statement of Operations, and are listed below. During the period, there were no borrowings on this line of credit.
| | Amount |
| Automotive Portfolio | $ 134 |
| Communication Services Portfolio | 858 |
| Construction and Housing Portfolio | 579 |
| Consumer Discretionary Portfolio | 369 |
| Leisure Portfolio | 532 |
| Retailing Portfolio | 3,059 |
7. Security Lending.
Funds lend portfolio securities from time to time in order to earn additional income. Lending agents are used, including National Financial Services (NFS), an affiliate of the investment adviser. Pursuant to a securities lending agreement, NFS will receive a fee, which is capped at 9.9% of a fund's daily lending revenue, for its services as lending agent. A fund may lend securities to certain qualified borrowers, including NFS. On the settlement date of the loan, a fund receives collateral (in the form of U.S. Treasury obligations, letters of credit and/or cash) against the loaned securities and maintains collateral in an amount not less than 100% of the market value of the loaned securities during the period of the loan. The market value of the loaned securities is determined at the close of business of a fund and any additional required collateral is delivered to a fund on the next business day. A fund or borrower may terminate the loan at any time, and if the borrower defaults on its obligation to return the securities loaned because of insolvency or other reasons, a fund may apply collateral received from the borrower against the obligation. A fund may experience delays and costs in recovering the securities loaned. Any cash collateral received is invested in the Fidelity Securities Lending Cash Central Fund. Any loaned securities are identified as such in the Schedule of Investments, and the value of loaned securities and cash collateral at period end, as applicable, are presented in the Statement of Assets and Liabilities. Security lending income represents the income earned on investing cash collateral, less rebates paid to borrowers and any lending agent fees associated with the loan, plus any premium payments received for lending certain types of securities. Security lending income is presented in the Statement of Operations as a component of income from Fidelity Central Funds. Affiliated security lending activity, if any, was as follows:
| | Total Security Lending Fees Paid to NFS | Security Lending Income From Securities Loaned to NFS | Value of Securities Loaned to NFS at Period End |
| Automotive Portfolio | $ 16,571 | $ 3 | $- |
| Communication Services Portfolio | $ 1,530 | $ 55 | $- |
| Construction and Housing Portfolio | $ 671 | $ - | $ - |
| Consumer Discretionary Portfolio | $ 21,539 | $ 23,071 | $ - |
| Leisure Portfolio | $ 67,903 | $ 126,839 | $- |
| Retailing Portfolio | $ 9,123 | $ - | $ - |
8. Bank Borrowings.
Each Fund is permitted to have bank borrowings for temporary or emergency purposes to fund shareholder redemptions or for other short-term liquidity requirements. Each Fund has established borrowing arrangements with certain banks. The interest rate on the borrowings is the bank's base rate, as revised from time to time. Any open loans, including accrued interest, at period end are presented under the caption "Notes payable" in the Statement of Assets and Liabilities, if applicable. Activity in this program during the period for which loans were outstanding was as follows:
| | Average Loan Balance | Weighted Average Interest Rate | Interest Expense |
| Consumer Discretionary Portfolio | $ 288,000 | .83% | $ 100 |
9. Expense Reductions.
Through arrangements with each custodian, credits realized as a result of certain uninvested cash balances were used to reduce each applicable Fund's or class' expenses. All of the applicable expense reductions are noted in the table below.
| | Custodian credits |
| Automotive Portfolio | $ 275 |
In addition, during the period the investment adviser or an affiliate reimbursed and/or waived a portion of operating expenses as follows:
| | Amount |
| Automotive Portfolio | $ 2,262 |
| Construction and Housing Portfolio | 9,574 |
| Consumer Discretionary Portfolio | 6,882 |
| Leisure Portfolio | 9,337 |
| Retailing Portfolio | 53,349 |
In addition, during the period the investment adviser or an affiliate reimbursed and/or waived a portion of fund-level operating expenses as follows:
| | Fund-Level Amount |
| Communication Services Portfolio | $14,885 |
10. Distributions to Shareholders.
Distributions to shareholders of each class were as follows:
| | Six months ended August 31, 2022 | Year ended February 28, 2022 |
| Communication Services Portfolio | | |
| Distributions to shareholders | | |
| Class A | $ - | $ 1,776,273 |
| Class M | - | 363,201 |
| Class C | - | 474,822 |
| Communication Services | - | 59,014,431 |
| Class I | - | 1,922,707 |
| Class Z | - | 354,330 |
Total | $ - | $ 63,905,764 |
11. Share Transactions.
Share transactions for each class were as follows and may contain in-kind transactions, automatic conversions between classes or exchanges between affiliated funds:
| | Shares | Shares | Dollars | Dollars |
| | Six months ended August 31, 2022 | Year ended February 28, 2022 | Six months ended August 31, 2022 | Year ended February 28, 2022 |
| Communication Services Portfolio | | | | |
| Class A | | | | |
| Shares sold | 67,287 | 288,312 | $ 4,448,593 | $ 27,200,334 |
| Reinvestment of distributions | - | 19,346 | - | 1,740,757 |
| Shares redeemed | (83,267) | (140,910) | (5,640,573) | (12,635,364) |
| Net increase (decrease) | (15,980) | 166,748 | $ (1,191,980) | $ 16,305,727 |
| Class M | | | | |
| Shares sold | 6,670 | 38,436 | $ 436,486 | $ 3,599,648 |
| Reinvestment of distributions | - | 3,956 | - | 355,421 |
| Shares redeemed | (8,224) | (29,716) | (569,652) | (2,591,005) |
| Net increase (decrease) | (1,554) | 12,676 | $ (133,166) | $ 1,364,064 |
| Class C | | | | |
| Shares sold | 25,013 | 59,277 | $ 1,627,983 | $ 5,482,069 |
| Reinvestment of distributions | - | 5,320 | - | 471,861 |
| Shares redeemed | (18,167) | (27,914) | (1,213,588) | (2,486,600) |
| Net increase (decrease) | 6,846 | 36,683 | $ 414,395 | $ 3,467,330 |
| Communication Services | | | | |
| Shares sold | 582,671 | 6,404,833 | $ 40,395,880 | $ 608,572,415 |
| Reinvestment of distributions | - | 621,227 | - | 56,410,302 |
| Shares redeemed | (1,556,642) | (4,677,647) | (107,674,662) | (433,498,431) |
| Net increase (decrease) | (973,971) | 2,348,413 | $ (67,278,782) | $ 231,484,286 |
| Class I | | | | |
| Shares sold | 37,374 | 316,400 | $ 2,599,501 | $ 30,080,975 |
| Reinvestment of distributions | - | 19,631 | - | 1,780,227 |
| Shares redeemed | (216,214) | (231,351) | (15,083,741) | (20,888,532) |
| Net increase (decrease) | (178,840) | 104,680 | $ (12,484,240) | $ 10,972,670 |
| Class Z | | | | |
| Shares sold | 12,504 | 98,916 | $ 873,915 | $ 9,255,551 |
| Reinvestment of distributions | - | 3,767 | - | 340,659 |
| Shares redeemed | (37,190) | (64,255) | (2,542,266) | (5,703,077) |
| Net increase (decrease) | (24,686) | 38,428 | $ (1,668,351) | $ 3,893,133 |
12. Other.
A fund's organizational documents provide former and current trustees and officers with a limited indemnification against liabilities arising in connection with the performance of their duties to the fund. In the normal course of business, a fund may also enter into contracts that provide general indemnifications. A fund's maximum exposure under these arrangements is unknown as this would be dependent on future claims that may be made against a fund. The risk of material loss from such claims is considered remote.
13. Risk and Uncertainties.
Many factors affect a fund's performance. Developments that disrupt global economies and financial markets, such as pandemics, epidemics, outbreaks of infectious diseases, war, terrorism, and environmental disasters, may significantly affect a fund's investment performance. The effects of these developments to a fund will be impacted by the types of securities in which a fund invests, the financial condition, industry, economic sector, and geographic location of an issuer, and a fund's level of investment in the securities of that issuer.
As a shareholder, you incur two types of costs: (1) transaction costs, which may include sales charges (loads) on purchase payments or redemption proceeds, as applicable and (2) ongoing costs, which generally include management fees, distribution and/or service (12b-1) fees and other Fund expenses. This Example is intended to help you understand your ongoing costs (in dollars) of investing in a fund and to compare these costs with the ongoing costs of investing in other mutual funds.
| The Example is based on an investment of $1,000 invested at the beginning of the period and held for the entire period (March 1, 2022 to August 31, 2022). |
Actual Expenses
The first line of the accompanying table provides information about actual account values and actual expenses. You may use the information in this line, together with the amount you invested, to estimate the expenses that you paid over the period. Simply divide your account value by $1,000.00 (for example, an $8,600 account value divided by $1,000.00 = 8.6), then multiply the result by the number in the first line for a class/Fund under the heading entitled "Expenses Paid During Period" to estimate the expenses you paid on your account during this period. If any fund is a shareholder of any underlying mutual funds or exchange-traded funds (ETFs) (the Underlying Funds), such fund indirectly bears its proportional share of the expenses of the Underlying Funds in addition to the direct expenses incurred presented in the table. These fees and expenses are not included in the annualized expense ratio used to calculate the expense estimate in the table below.
Hypothetical Example for Comparison Purposes
The second line of the accompanying table provides information about hypothetical account values and hypothetical expenses based on the actual expense ratio and an assumed rate of return of 5% per year before expenses, which is not the actual return. The hypothetical account values and expenses may not be used to estimate the actual ending account balance or expenses you paid for the period. You may use this information to compare the ongoing costs of investing in the Fund and other funds. To do so, compare this 5% hypothetical example with the 5% hypothetical examples that appear in the shareholder reports of the other funds. If any fund is a shareholder of any Underlying Funds, such fund indirectly bears its proportional share of the expenses of the Underlying Funds in addition to the direct expenses as presented in the table. These fees and expenses are not included in the annualized expense ratio used to calculate the expense estimate in the table below.
Please note that the expenses shown in the table are meant to highlight your ongoing costs only and do not reflect any transaction costs. Therefore, the second line of the table is useful in comparing ongoing costs only, and will not help you determine the relative total costs of owning different funds. In addition, if these transactional costs were included, your costs would have been higher.
| | | | | Annualized Expense Ratio- A | | Beginning Account Value March 1, 2022 | | Ending Account Value August 31, 2022 | | Expenses Paid During Period- C March 1, 2022 to August 31, 2022 |
| | | | | | | | | | |
| Automotive Portfolio | | | | .88% | | | | | | |
| Actual | | | | | | $ 1,000 | | $ 844.20 | | $ 4.09 |
Hypothetical- B | | | | | | $ 1,000 | | $ 1,020.77 | | $ 4.48 |
| Communication Services Portfolio | | | | | | | | | | |
| Class A | | | | 1.06% | | | | | | |
| Actual | | | | | | $ 1,000 | | $ 804.00 | | $ 4.82 |
Hypothetical- B | | | | | | $ 1,000 | | $ 1,019.86 | | $ 5.40 |
| Class M | | | | 1.30% | | | | | | |
| Actual | | | | | | $ 1,000 | | $ 803.10 | | $ 5.91 |
Hypothetical- B | | | | | | $ 1,000 | | $ 1,018.65 | | $ 6.61 |
| Class C | | | | 1.78% | | | | | | |
| Actual | | | | | | $ 1,000 | | $ 801.10 | | $ 8.08 |
Hypothetical- B | | | | | | $ 1,000 | | $ 1,016.23 | | $ 9.05 |
| Communication Services Portfolio | | | | .78% | | | | | | |
| Actual | | | | | | $ 1,000 | | $ 805.10 | | $ 3.55 |
Hypothetical- B | | | | | | $ 1,000 | | $ 1,021.27 | | $ 3.97 |
| Class I | | | | .76% | | | | | | |
| Actual | | | | | | $ 1,000 | | $ 805.10 | | $ 3.46 |
Hypothetical- B | | | | | | $ 1,000 | | $ 1,021.37 | | $ 3.87 |
| Class Z | | | | .62% | | | | | | |
| Actual | | | | | | $ 1,000 | | $ 805.70 | | $ 2.82 |
Hypothetical- B | | | | | | $ 1,000 | | $ 1,022.08 | | $ 3.16 |
| | | | | | | | | | |
| Construction and Housing Portfolio | | | | .76% | | | | | | |
| Actual | | | | | | $ 1,000 | | $ 896.00 | | $ 3.63 |
Hypothetical- B | | | | | | $ 1,000 | | $ 1,021.37 | | $ 3.87 |
| | | | | | | | | | |
| Consumer Discretionary Portfolio | | | | .76% | | | | | | |
| Actual | | | | | | $ 1,000 | | $ 841.00 | | $ 3.53 |
Hypothetical- B | | | | | | $ 1,000 | | $ 1,021.37 | | $ 3.87 |
| | | | | | | | | | |
| Leisure Portfolio | | | | .74% | | | | | | |
| Actual | | | | | | $ 1,000 | | $ 885.50 | | $ 3.52 |
Hypothetical- B | | | | | | $ 1,000 | | $ 1,021.48 | | $ 3.77 |
| | | | | | | | | | |
| Retailing Portfolio | | | | .72% | | | | | | |
| Actual | | | | | | $ 1,000 | | $ 842.00 | | $ 3.34 |
Hypothetical- B | | | | | | $ 1,000 | | $ 1,021.58 | | $ 3.67 |
| |
A Annualized expense ratio reflects expenses net of applicable fee waivers.
B 5% return per year before expenses
C Expenses are equal to the annualized expense ratio, multiplied by the average account value over the period, multiplied by 184/ 365 (to reflect the one-half year period). The fees and expenses of any Underlying Funds are not included in each annualized expense ratio.
Automotive Portfolio
Communication Services Portfolio
Construction and Housing Portfolio
Consumer Discretionary Portfolio
Leisure Portfolio
Retailing Portfolio
Each year, the Board of Trustees, including the Independent Trustees (together, the Board), votes on the renewal of the management contract with Fidelity Management & Research Company LLC (FMR) and the sub-advisory agreements (together, the Advisory Contracts) for each fund. FMR and the sub-advisers are referred to herein as the Investment Advisers. The Board, assisted by the advice of fund counsel and Independent Trustees' counsel, requests and considers a broad range of information relevant to the renewal of the Advisory Contracts throughout the year.
The Board meets regularly and, at each of its meetings, covers an extensive agenda of topics and materials and considers factors that are relevant to its annual consideration of the renewal of each fund's Advisory Contracts, including the services and support provided to each fund and its shareholders. The Board has established various standing committees (Committees), each composed of and chaired by Independent Trustees with varying backgrounds, to which the Board has assigned specific subject matter responsibilities in order to enhance effective decision-making by the Board. The Board, acting directly and through its Committees, requests and receives information concerning the annual consideration of the renewal of each fund's Advisory Contracts. The Board also meets as needed to review matters specifically related to the Board's annual consideration of the renewal of the Advisory Contracts. Members of the Board may also meet with trustees of other Fidelity funds through joint ad hoc committees to discuss certain matters relevant to all of the Fidelity funds.
At its May 2022 meeting, the Board unanimously determined to renew each fund's Advisory Contracts. In reaching its determination, the Board considered all factors it believed relevant, including (i) the nature, extent, and quality of the services provided to each fund and its shareholders (including the investment performance of each fund); (ii) the competitiveness relative to peer funds of the management fee and total expense ratio of the fund or a representative class (retail class), as applicable; (iii) the total costs of the services provided by and the profits realized by Fidelity from its relationships with each fund; and (iv) the extent to which, if any, economies of scale exist and are realized as each fund grows, and whether any economies of scale are appropriately shared with fund shareholders.
In considering whether to renew the Advisory Contracts for each fund, the Board reached a determination, with the assistance of fund counsel and Independent Trustees' counsel and through the exercise of its business judgment, that the renewal of the Advisory Contracts was in the best interests of each fund and its shareholders and that the compensation payable under the Advisory Contracts was fair and reasonable. The Board's decision to renew the Advisory Contracts was not based on any single factor, but rather was based on a comprehensive consideration of all the information provided to the Board at its meetings throughout the year. The Board, in reaching its determination to renew the Advisory Contracts, was aware that shareholders of each fund have a broad range of investment choices available to them, including a wide choice among funds offered by Fidelity's competitors, and that each fund's shareholders, who have the opportunity to review and weigh the disclosure provided by the fund in its prospectus and other public disclosures, have chosen to invest in that fund, which is part of the Fidelity family of funds.
Nature, Extent, and Quality of Services Provided. The Board considered Fidelity's staffing as it relates to the funds, including the backgrounds of investment personnel of Fidelity, and also considered the funds' investment objectives, strategies, and related investment philosophies. The Independent Trustees also had discussions with senior management of Fidelity's investment operations and investment groups. The Board considered the structure of the investment personnel compensation program and whether this structure provides appropriate incentives to act in the best interests of each fund. Additionally, the Board considered the portfolio managers' investments, if any, in the funds that they manage. The Board also considered the steps Fidelity had taken to ensure the continued provision of high quality services to the Fidelity funds during the COVID-19 pandemic, including the expansion of staff in client facing positions to maintain service levels in periods of high volumes and volatility.
Resources Dedicated to Investment Management and Support Services. The Board and the Fund Oversight and Research Committees reviewed the general qualifications and capabilities of Fidelity's investment staff, including its size, education, experience, and resources, as well as Fidelity's approach to recruiting, training, managing, and compensating investment personnel. The Board noted the resources devoted to expansion of Fidelity's global investment organization, and that Fidelity's analysts have extensive resources, tools, and capabilities that allow them to conduct sophisticated quantitative and fundamental analysis, as well as credit analysis of issuers, counterparties, and guarantors. Further, the Board considered that Fidelity's investment professionals have sufficient access to global information and data so as to provide competitive investment results over time, and that those professionals also have access to sophisticated tools that permit them to assess portfolio construction and risk and performance attribution characteristics continuously, as well as to transmit new information and research conclusions rapidly around the world. Additionally, in its deliberations, the Board considered Fidelity's trading, risk management, compliance, and technology and operations capabilities and resources, which are integral parts of the investment management process.
Shareholder and Administrative Services. The Board considered (i) the nature, extent, quality, and cost of advisory, administrative, and shareholder services performed by the Investment Advisers and their affiliates under the Advisory Contracts and under separate agreements covering transfer agency, pricing and bookkeeping, and securities lending services for each fund; (ii) the nature and extent of the supervision of third party service providers, principally custodians, subcustodians, and pricing vendors; and (iii) the resources devoted to, and the record of compliance with, each fund's compliance policies and procedures. The Board also reviewed the allocation of fund brokerage, including allocations to brokers affiliated with the Investment Advisers, the use of brokerage commissions to pay fund expenses, and the use of "soft" commission dollars to pay for research services.
The Board noted that the growth of fund assets over time across the complex allows Fidelity to reinvest in the development of services designed to enhance the value and convenience of the Fidelity funds as investment vehicles. These services include 24-hour access to account information and market information over the Internet and through telephone representatives, investor education materials, and asset allocation tools. The Board also considered that it reviews customer service metrics such as telephone response times, continuity of services on the website and metrics addressing services at Fidelity Investor Centers.
Investment in a Large Fund Family. The Board considered the benefits to shareholders of investing in a Fidelity fund, including the benefits of investing in a fund that is part of a large family of funds offering a variety of investment disciplines and providing a large variety of mutual fund investor services. The Board noted that Fidelity had taken, or had made recommendations that resulted in the Fidelity funds taking, a number of actions over the previous year that benefited particular funds, including: (i) continuing to dedicate additional resources to Fidelity's investment research process, which includes meetings with management of issuers of securities in which the funds invest; (ii) continuing efforts to enhance Fidelity's global research capabilities; (iii) launching new funds and ETFs with innovative structures, strategies and pricing and making other enhancements to meet client needs; (iv) launching new share classes of existing funds; (v) eliminating purchase minimums and broadening eligibility requirements for certain funds and share classes; (vi) reducing management fees and total expenses for certain target date funds and classes and index funds; (vii) lowering expenses for certain existing funds and classes by implementing or lowering expense caps; (viii) rationalizing product lines and gaining increased efficiencies from fund mergers and liquidations; (ix) continuing to develop, acquire and implement systems and technology to improve services to the funds and shareholders, strengthen information security, and increase efficiency; and (x) continuing to implement enhancements to further strengthen Fidelity's product line to increase investors' probability of success in achieving their investment goals, including retirement income goals.
Investment Performance. The Board considered whether each fund has operated in accordance with its investment objective, as well as its record of compliance with its investment restrictions and its performance history. The Board noted that Automotive Portfolio had a portfolio manager change in February 2022, Construction and Housing Portfolio had a portfolio manager change in September 2021 and January 2022, and Leisure Portfolio had a portfolio manager change in February 2021. The Board will continue to monitor closely the applicable fund's performance, taking into account the portfolio manager changes.
The Board took into account discussions that occur at Board meetings throughout the year with representatives of the Investment Advisers about fund investment performance. In this regard the Board noted that as part of regularly scheduled fund reviews and other reports to the Board on fund performance, the Board considers annualized return information for each fund for different time periods, measured against an appropriate securities market index (benchmark index). The Board also reviews and considers information about performance attribution. In its evaluation of fund investment performance, the Board gave particular attention to information indicating changes in performance of certain Fidelity funds for specific time periods and discussed with the Investment Advisers the reasons for any overperformance or underperformance.
In addition to reviewing absolute and relative fund performance, the Independent Trustees periodically consider the appropriateness of fund performance metrics in evaluating the results achieved. In general, the Independent Trustees believe that fund performance should be evaluated based on net performance (after fees and expenses) of the fund or representative class, as applicable, compared to appropriate benchmark indices, over appropriate time periods that may include full market cycles, taking into account relevant factors including the following: general market conditions; issuer-specific information; and fund cash flows and other factors.
The Independent Trustees recognize that shareholders evaluate performance on a net basis over their own holding periods, for which one-, three-, and five-year periods are often used as a proxy. For this reason, the performance information reviewed by the Board also included net cumulative total return information for each fund and an appropriate benchmark index for the most recent one-, three-, and five-year periods ended September 30, 2021, as shown below.
Automotive Portfolio
Communication Services Portfolio
Construction and Housing Portfolio
Consumer Discretionary Portfolio
The Board considered the fund's underperformance for different time periods ended September 30, 2021 and for different time periods ended December 31, 2021 (which periods are not reflected in the charts above). The Board noted that the fund's underperformance has continued since the Board approved the management contract in May 2021. The Board's discussions with FMR regarding underperformance cover topics including, but not limited to: the longer-term track record of a fund's portfolio manager(s); broader trends in the market that may adversely impact a fund's performance; and attribution reports on contributors to the fund's underperformance. The Board engages with FMR on steps that might be taken to address a fund's underperformance. For a fund with underperformance over longer periods of time, the Board typically monitors the fund's performance more closely.
Leisure Portfolio
Retailing Portfolio
The Board considered the fund's underperformance for different time periods ended September 30, 2021 and for different time periods ended December 31, 2021 (which periods are not reflected in the charts above). The Board noted that the fund's underperformance has continued since the Board approved the management contract in May 2021. The Board's discussions with FMR regarding underperformance cover topics including, but not limited to: the longer-term track record of a fund's portfolio manager(s); broader trends in the market that may adversely impact a fund's performance; and attribution reports on contributors to the fund's underperformance. The Board engages with FMR on steps that might be taken to address a fund's underperformance. For a fund with underperformance over longer periods of time, the Board typically monitors the fund's performance more closely.
Based on its review, the Board concluded that the nature, extent, and quality of services provided to each fund under the Advisory Contracts should continue to benefit the shareholders of each fund.
Competitiveness of Management Fee and Total Expense Ratio. The Board considered each fund's management fee and total expense ratio compared to "mapped groups" of competitive funds and classes created for the purpose of facilitating the Trustees' competitive analysis of management fees and total expenses. Fidelity creates "mapped groups" by combining similar Lipper investment objective categories that have comparable investment mandates. For this purpose, all sector focused equity funds are grouped in the same mapped group. Combining Lipper investment objective categories aids the Board's management fee and total expense ratio comparisons by broadening the competitive group used for comparison.
Management Fee. The Board considered two proprietary management fee comparisons for the 12-month periods ended September 30 (June 30 for periods ended 2019 and 2018 and December 31 for periods prior to 2018) shown in basis points (BP) in the charts below. The group of Lipper funds used by the Board for management fee comparisons is referred to below as the "Total Mapped Group." The Total Mapped Group comparison focuses on a fund's standing in terms of gross management fees before expense reimbursements or caps relative to the total universe of funds with comparable investment mandates (i.e., sector equities), regardless of whether their management fee structures also are comparable. Funds with comparable management fee structures have similar management fee contractual arrangements (e.g., flat rate charged for advisory services, all-inclusive fee rate, etc.). "TMG %" represents the percentage of funds in the Total Mapped Group that had management fees that were lower than a fund's. For example, a hypothetical TMG % of 20% would mean that 80% of the funds in the Total Mapped Group had higher, and 20% had lower, management fees than a fund. The funds' actual TMG %s and the number of funds in the Total Mapped Group are in the charts below. The "Asset-Sized Peer Group" (ASPG) comparison focuses on a fund's standing relative to a subset of non-Fidelity funds within the Total Mapped Group that are similar in size and management fee structure. For example, if a fund is in the first quartile of the ASPG, the fund's management fee ranks in the least expensive or lowest 25% of funds in the ASPG. The ASPG represents at least 15% of the funds in the Total Mapped Group with comparable asset size and management fee structures, subject to a minimum of 50 funds (or all funds in the Total Mapped Group if fewer than 50). Additional information, such as the ASPG quartile in which a fund's management fee rate ranked, is also included in the charts and was considered by the Board.
Automotive Portfolio
Communication Services Portfolio
Construction and Housing Portfolio
Consumer Discretionary Portfolio
Leisure Portfolio
Retailing Portfolio
The Board noted that each fund's management fee rate ranked below the median of its Total Mapped Group and below the median of its ASPG for the 12-month period ended September 30, 2021.
The Board also considered that, for funds subject to the group fee, FMR agreed to voluntarily waive fees over a specified period of time in amounts designed to account for assets converted from certain funds to certain collective investment trusts.
Based on its review, the Board concluded that each fund's management fee is fair and reasonable in light of the services that the fund receives and the other factors considered.
Total Expense Ratio. In its review of the total expense ratio of each of Automotive Portfolio, Construction and Housing Portfolio, Consumer Discretionary Portfolio, Leisure Portfolio, and Retailing Portfolio, the Board considered the fund's management fee rate as well as other fund expenses, such as transfer agent fees, pricing and bookkeeping fees, and custodial, legal, and audit fees. The Board also noted that Fidelity may agree to waive fees or reimburse expenses from time to time, and the extent to which, if any, it has done so for each fund. Each fund is compared to those funds and classes in the Total Mapped Group (used by the Board for management fee comparisons) that have a similar sales load structure. The Board also considered a total expense ASPG comparison for each fund, which focuses on the total expenses of each fund relative to a subset of non-Fidelity funds within the total expense similar sales load structure group. The total expense ASPG is limited to 15 larger and 15 smaller classes in fund average assets for a total of 30 classes, where possible. The total expense ASPG comparison excludes performance adjustments and fund-paid 12b-1 fees to eliminate variability in fee structures.
The Board noted that the total net expense ratio of each of Automotive Portfolio, Construction and Housing Portfolio, Consumer Discretionary Portfolio, Leisure Portfolio, and Retailing Portfolio ranked below the similar sales load structure group competitive median and below the ASPG competitive median for the 12-month period ended September 30, 2021.
In its review of the total expense ratio of the representative class (retail class) of Communication Services Portfolio, the Board considered the fund's management fee rate as well as other fund or class expenses, as applicable, such as transfer agent fees, pricing and bookkeeping fees, fund-paid 12b-1 fees, and custodial, legal, and audit fees. The Board also noted that Fidelity may agree to waive fees or reimburse expenses from time to time, and the extent to which, if any, it has done so for each fund. The Fund's representative class is compared to those funds and classes in the Total Mapped Group (used by the Board for management fee comparisons) that have a similar sales load structure. The Board also considered a total expense ASPG comparison for each fund, which focuses on the total expenses of the representative class relative to a subset of non-Fidelity funds within the total expense similar sales load structure group. The total expense ASPG is limited to 15 larger and 15 smaller classes in fund average assets for a total of 30 classes, where possible. The total expense ASPG comparison excludes performance adjustments and fund-paid 12b-1 fees to eliminate variability in fee structures.
The Board noted that the total net expense ratio of the retail class of Communication Services Portfolio ranked below the similar sales load structure group competitive median and below the ASPG competitive median for the 12-month period ended September 30, 2021.
The Board considered that Fidelity has contractually agreed to reimburse the Automotive Portfolio to the extent that total operating expenses to the extent that total operating expenses, with certain exceptions, exceed 0.95% through June 30, 2023.
Fees Charged to Other Fidelity Clients. The Board also considered Fidelity fee structures and other information with respect to clients of Fidelity, such as other funds advised or subadvised by Fidelity, pension plan clients, and other institutional clients with similar mandates. The Board noted that a joint ad hoc committee created by it and the boards of other Fidelity funds periodically reviews and compares Fidelity's institutional investment advisory business with its business of providing services to the Fidelity funds and also noted the most recent findings of the committee. The Board noted that the committee's review included a consideration of the differences in services provided, fees charged, and costs incurred, as well as competition in the markets serving the different categories of clients.
Based on its review of total expense ratios and fees charged to other Fidelity clients, the Board concluded that the total expense ratio of each class of each fund was reasonable in light of the services that the fund and its shareholders receive and the other factors considered.
Costs of the Services and Profitability. The Board considered the revenues earned and the expenses incurred by Fidelity in conducting the business of developing, marketing, distributing, managing, administering and servicing each fund and servicing each fund's shareholders. The Board also considered the level of Fidelity's profits in respect of all the Fidelity funds.
On an annual basis, Fidelity presents to the Board information about the profitability of its relationships with each fund. Fidelity calculates profitability information for each fund, as well as aggregate profitability information for groups of Fidelity funds and all Fidelity funds, using a series of detailed revenue and cost allocation methodologies which originate with the books and records of Fidelity on which Fidelity's audited financial statements are based. The Audit Committee of the Board reviews any significant changes from the prior year's methodologies and the full Board approves such changes.
A public accounting firm has been engaged annually by the Board as part of the Board's assessment of Fidelity's profitability analysis. The engagement includes the review and assessment of the methodologies used by Fidelity in determining the revenues and expenses attributable to Fidelity's mutual fund business, and completion of agreed-upon procedures in respect of the mathematical accuracy of certain fund profitability information and its conformity to established allocation methodologies. After considering the reports issued under the engagement and information provided by Fidelity, the Board concluded that while other allocation methods may also be reasonable, Fidelity's profitability methodologies are reasonable in all material respects.
The Board also reviewed Fidelity's non-fund businesses and potential indirect benefits such businesses may have received as a result of their association with Fidelity's mutual fund business (i.e., fall-out benefits) as well as cases where Fidelity's affiliates may benefit from the funds' business. The Board considered areas where potential indirect benefits to the Fidelity funds from their relationships with Fidelity may exist. The Board's consideration of these matters was informed by the findings of a joint ad hoc committee created by it and the boards of other Fidelity funds to evaluate potential fall-out benefits.
The Board considered the costs of the services provided by and the profits realized by Fidelity in connection with the operation of each fund and was satisfied that the profitability was not excessive.
Economies of Scale. The Board considered whether there have been economies of scale in respect of the management of the Fidelity funds, whether the Fidelity funds (including each fund) have appropriately benefited from any such economies of scale, and whether there is potential for realization of any further economies of scale. The Board considered the extent to which each fund will benefit from economies of scale as assets grow through increased services to the fund, through waivers or reimbursements, or through fee or expense ratio reductions. The Board also noted that a committee (the Economies of Scale Committee) created by it and the boards of other Fidelity funds periodically analyzes whether Fidelity attains economies of scale in respect of the management and servicing of the Fidelity funds, whether the Fidelity funds have appropriately benefited from such economies of scale, and whether there is potential for realization of any further economies of scale.
The Board recognized that each fund's management contract incorporates a "group fee" structure, which provides for lower group fee rates as total "group assets" increase, and for higher group fee rates as total "group assets" decrease ("group assets" as defined in the management contracts). FMR calculates the group fee rates based on a tiered asset "breakpoint" schedule that varies based on asset class. The Board considered that the group fee is designed to deliver the benefits of economies of scale to fund shareholders when total Fidelity fund assets increase, even if assets of any particular fund are unchanged or have declined, because some portion of Fidelity's costs are attributable to services provided to all Fidelity funds, and all funds benefit if those costs can be allocated among more assets. The Board further considered that Fidelity agreed to impose a temporary fee waiver in the form of additional breakpoints to the current breakpoint schedule. The Board concluded that, given the group fee structure, fund shareholders will benefit from lower management fees as "group assets" increase at the fund complex level, regardless of whether Fidelity achieves any such economies of scale.
The Board concluded, taking into account the analysis of the Economies of Scale Committee, that economies of scale, if any, are being appropriately shared between fund shareholders and Fidelity.
Additional Information Requested by the Board. In order to develop fully the factual basis for consideration of the Fidelity funds' advisory contracts, the Board requested and received additional information on certain topics, including: (i) fund flow and performance trends, in particular the underperformance of certain funds and strategies, and Fidelity's long-term strategies for certain funds, including any consideration of fund liquidations or mergers; (ii) the operation of performance fees, competitor use of performance fees, and consideration of the expansion of performance fees to additional funds; (iii) Fidelity's pricing philosophy compared to competitors; (iv) fund profitability methodology and data; (v) evaluation of competitive fund data and peer group classifications and fee and expense comparisons; (vi) the management fee and expense structures for different funds and classes and information about the differences between various fee and expense structures; (vii) group fee breakpoints and related voluntary fee waivers; and (viii) information regarding other accounts managed by Fidelity and the funds' sub-advisory arrangements.
Based on its evaluation of all of the conclusions noted above, and after considering all factors it believed relevant, the Board concluded that the advisory fee arrangements are fair and reasonable, and that each fund's Advisory Contracts should be renewed.
1.813637.117
SELCON-SANN-1022
Fidelity® Environment and Alternative Energy Fund
Fidelity® Natural Resources Fund
Semi-Annual Report
August 31, 2022
Contents
To view a fund's proxy voting guidelines and proxy voting record for the 12-month period ended June 30, visit http://www.fidelity.com/proxyvotingresults or visit the Securities and Exchange Commission's (SEC) web site at http://www.sec.gov.
You may also call 1-800-544-8544 to request a free copy of the proxy voting guidelines.
Standard & Poor's, S&P and S&P 500 are registered service marks of The McGraw-Hill Companies, Inc. and have been licensed for use by Fidelity Distributors Corporation.
Other third-party marks appearing herein are the property of their respective owners.
All other marks appearing herein are registered or unregistered trademarks or service marks of FMR LLC or an affiliated company. © 2022 FMR LLC. All rights reserved.
This report and the financial statements contained herein are submitted for the general information of the shareholders of the Fund. This report is not authorized for distribution to prospective investors in the Fund unless preceded or accompanied by an effective prospectus.
A fund files its complete schedule of portfolio holdings with the SEC for the first and third quarters of each fiscal year on Form N-PORT. Forms N-PORT are available on the SEC's web site at http://www.sec.gov. A fund's Forms N-PORT may be reviewed and copied at the SEC's Public Reference Room in Washington, DC. Information regarding the operation of the SEC's Public Reference Room may be obtained by calling 1-800-SEC-0330.
For a complete list of a fund's portfolio holdings, view the most recent holdings listing, semiannual report, or annual report on Fidelity's web site at http://www.fidelity.com, http://www.institutional.fidelity.com, or http://www.401k.com, as applicable.
NOT FDIC INSURED •MAY LOSE VALUE •NO BANK GUARANTEE
Neither the Fund nor Fidelity Distributors Corporation is a bank.
Top Holdings (% of Fund's net assets) |
| |
| Microsoft Corp. | 12.3 | |
| Tesla, Inc. | 10.5 | |
| Danaher Corp. | 7.2 | |
| Linde PLC | 6.0 | |
| Prologis (REIT), Inc. | 4.7 | |
| Analog Devices, Inc. | 3.8 | |
| IBM Corp. | 3.8 | |
| NextEra Energy, Inc. | 3.3 | |
| Eaton Corp. PLC | 3.2 | |
| Xcel Energy, Inc. | 2.6 | |
| | 57.4 | |
| |
| Industries (% of Fund's net assets) |
| |
| Software | 12.3 | |
| Automobiles | 10.9 | |
| Semiconductors & Semiconductor Equipment | 10.1 | |
| Chemicals | 9.2 | |
| Electric Utilities | 9.1 | |
| Life Sciences Tools & Services | 8.2 | |
| Electrical Equipment | 6.8 | |
| Equity Real Estate Investment Trusts (Reits) | 6.2 | |
| Building Products | 5.0 | |
| Independent Power and Renewable Electricity Producers | 4.4 | |
| Machinery | 3.9 | |
| IT Services | 3.8 | |
| Containers & Packaging | 1.6 | |
| Commercial Services & Supplies | 1.0 | |
| Electronic Equipment & Components | 1.0 | |
| Professional Services | 0.9 | |
| Construction & Engineering | 0.8 | |
| Metals & Mining | 0.8 | |
| Oil, Gas & Consumable Fuels | 0.8 | |
| Capital Markets | 0.6 | |
| Communications Equipment | 0.5 | |
| Energy Equipment & Services | 0.5 | |
| Textiles, Apparel & Luxury Goods | 0.1 | |
| |
Geographic Diversification (% of Fund's net assets) |
|
* Includes Short-Term investments and Net Other Assets (Liabilities). Percentages are based on country or territory of incorporation and are adjusted for the effect of futures contracts, if applicable. |
| |
Fidelity® Environment and Alternative Energy Fund
| Common Stocks - 98.4% |
| | | Shares | Value ($) |
| Automobiles - 10.9% | | | |
| Automobile Manufacturers - 10.9% | | | |
| Tesla, Inc. (a) | | 255,120 | 70,313,623 |
| XPeng, Inc. ADR (a) | | 158,450 | 2,934,494 |
| | | | 73,248,117 |
| Building Products - 5.0% | | | |
| Building Products - 5.0% | | | |
| Johnson Controls International PLC | | 187,460 | 10,149,084 |
| Owens Corning | | 89,220 | 7,291,951 |
| The AZEK Co., Inc. (a) | | 130,780 | 2,386,735 |
| Trane Technologies PLC | | 89,100 | 13,727,637 |
| | | | 33,555,407 |
| Capital Markets - 0.6% | | | |
| Financial Exchanges & Data - 0.6% | | | |
| Intercontinental Exchange, Inc. | | 37,090 | 3,740,527 |
| Chemicals - 9.2% | | | |
| Industrial Gases - 6.0% | | | |
| Linde PLC | | 142,390 | 40,276,435 |
| Specialty Chemicals - 3.2% | | | |
| Eastman Chemical Co. | | 29,240 | 2,660,840 |
| Ecolab, Inc. | | 56,530 | 9,261,310 |
| Koninklijke DSM NV | | 73,923 | 9,426,344 |
| | | | 21,348,494 |
TOTAL CHEMICALS | | | 61,624,929 |
| Commercial Services & Supplies - 1.0% | | | |
| Environmental & Facility Services - 1.0% | | | |
| Aker Carbon Capture A/S (a) | | 762,830 | 1,648,806 |
| Tetra Tech, Inc. | | 38,200 | 5,187,942 |
| | | | 6,836,748 |
| Communications Equipment - 0.5% | | | |
| Communications Equipment - 0.5% | | | |
| Cisco Systems, Inc. | | 75,840 | 3,391,565 |
| Construction & Engineering - 0.8% | | | |
| Construction & Engineering - 0.8% | | | |
| Quanta Services, Inc. | | 39,200 | 5,538,960 |
| Containers & Packaging - 1.6% | | | |
| Metal & Glass Containers - 1.6% | | | |
| Ball Corp. | | 193,160 | 10,780,260 |
| Electric Utilities - 9.1% | | | |
| Electric Utilities - 9.1% | | | |
| NextEra Energy, Inc. | | 263,730 | 22,432,874 |
| ORSTED A/S (b) | | 86,900 | 8,481,659 |
| PG&E Corp. (a) | | 690,590 | 8,514,975 |
| Verbund AG | | 41,680 | 3,993,860 |
| Xcel Energy, Inc. | | 235,230 | 17,465,828 |
| | | | 60,889,196 |
| Electrical Equipment - 6.8% | | | |
| Electrical Components & Equipment - 5.8% | | | |
| Acuity Brands, Inc. | | 61,140 | 10,022,680 |
| Ceres Power Holdings PLC (a)(c) | | 214,290 | 1,616,123 |
| Eaton Corp. PLC | | 155,010 | 21,180,566 |
| Sunrun, Inc. (a) | | 184,950 | 6,108,899 |
| | | | 38,928,268 |
| Heavy Electrical Equipment - 1.0% | | | |
| Vestas Wind Systems A/S | | 275,410 | 6,891,065 |
TOTAL ELECTRICAL EQUIPMENT | | | 45,819,333 |
| Electronic Equipment & Components - 1.0% | | | |
| Electronic Equipment & Instruments - 1.0% | | | |
| Teledyne Technologies, Inc. (a) | | 18,140 | 6,682,050 |
| Energy Equipment & Services - 0.5% | | | |
| Oil & Gas Equipment & Services - 0.5% | | | |
| Baker Hughes Co. Class A | | 123,200 | 3,112,032 |
| Equity Real Estate Investment Trusts (REITs) - 6.2% | | | |
| Industrial REITs - 4.7% | | | |
| Prologis (REIT), Inc. | | 254,380 | 31,672,854 |
| Specialized REITs - 1.5% | | | |
| Weyerhaeuser Co. | | 286,360 | 9,782,058 |
TOTAL EQUITY REAL ESTATE INVESTMENT TRUSTS (REITS) | | | 41,454,912 |
| Independent Power and Renewable Electricity Producers - 4.4% | | | |
| Independent Power Producers & Energy Traders - 2.7% | | | |
| RWE AG | | 156,100 | 5,973,712 |
| The AES Corp. | | 472,220 | 12,017,999 |
| | | | 17,991,711 |
| Renewable Electricity - 1.7% | | | |
| Adani Green Energy Ltd. (a) | | 126,470 | 3,819,554 |
| Brookfield Renewable Corp. | | 167,920 | 6,446,449 |
| Energy Absolute PCL NVDR | | 652,340 | 1,518,537 |
| | | | 11,784,540 |
TOTAL INDEPENDENT POWER AND RENEWABLE ELECTRICITY PRODUCERS | | | 29,776,251 |
| IT Services - 3.8% | | | |
| IT Consulting & Other Services - 3.8% | | | |
| IBM Corp. | | 199,230 | 25,591,094 |
| Life Sciences Tools & Services - 8.2% | | | |
| Life Sciences Tools & Services - 8.2% | | | |
| Agilent Technologies, Inc. | | 54,540 | 6,994,755 |
| Danaher Corp. | | 177,610 | 47,938,715 |
| | | | 54,933,470 |
| Machinery - 3.9% | | | |
| Agricultural & Farm Machinery - 1.8% | | | |
| Deere & Co. | | 32,520 | 11,877,930 |
| Construction Machinery & Heavy Trucks - 1.8% | | | |
| Cummins, Inc. | | 54,922 | 11,828,551 |
| Industrial Machinery - 0.3% | | | |
| Xylem, Inc. | | 23,110 | 2,105,321 |
TOTAL MACHINERY | | | 25,811,802 |
| Metals & Mining - 0.8% | | | |
| Aluminum - 0.3% | | | |
| Alcoa Corp. | | 45,070 | 2,230,064 |
| Diversified Metals & Mining - 0.5% | | | |
| Lynas Rare Earths Ltd. (a) | | 624,972 | 3,733,628 |
TOTAL METALS & MINING | | | 5,963,692 |
| Oil, Gas & Consumable Fuels - 0.8% | | | |
| Oil & Gas Exploration & Production - 0.8% | | | |
| Denbury, Inc. (a) | | 57,650 | 5,126,815 |
| Professional Services - 0.9% | | | |
| Research & Consulting Services - 0.9% | | | |
| Jacobs Solutions, Inc. | | 49,090 | 6,115,632 |
| Semiconductors & Semiconductor Equipment - 10.1% | | | |
| Semiconductor Equipment - 4.0% | | | |
| Enphase Energy, Inc. (a) | | 46,940 | 13,445,494 |
| SolarEdge Technologies, Inc. (a) | | 35,950 | 9,921,122 |
| Xinyi Solar Holdings Ltd. | | 2,316,000 | 3,185,008 |
| | | | 26,551,624 |
| Semiconductors - 6.1% | | | |
| Allegro MicroSystems LLC (a) | | 146,410 | 3,414,281 |
| Analog Devices, Inc. | | 169,910 | 25,746,462 |
| onsemi (a) | | 172,600 | 11,869,702 |
| | | | 41,030,445 |
TOTAL SEMICONDUCTORS & SEMICONDUCTOR EQUIPMENT | | | 67,582,069 |
| Software - 12.3% | | | |
| Systems Software - 12.3% | | | |
| Microsoft Corp. | | 316,980 | 82,880,758 |
| TOTAL COMMON STOCKS (Cost $652,796,085) | | | 660,455,619 |
| | | | |
| Convertible Preferred Stocks - 0.1% |
| | | Shares | Value ($) |
| Textiles, Apparel & Luxury Goods - 0.1% | | | |
| Textiles - 0.1% | | | |
CelLink Corp. Series D (d)(e) (Cost $295,699) | | 14,200 | 263,552 |
| | | | |
| Money Market Funds - 1.5% |
| | | Shares | Value ($) |
| Fidelity Cash Central Fund 2.33% (f) | | 9,899,645 | 9,901,625 |
| Fidelity Securities Lending Cash Central Fund 2.34% (f)(g) | | 373,110 | 373,148 |
| TOTAL MONEY MARKET FUNDS (Cost $10,274,773) | | | 10,274,773 |
| | | | |
| TOTAL INVESTMENT IN SECURITIES - 100.0% (Cost $663,366,557) | 670,993,944 |
NET OTHER ASSETS (LIABILITIES) - 0.0% | (17,930) |
| NET ASSETS - 100.0% | 670,976,014 |
| | |
Legend
| (b) | Security exempt from registration under Rule 144A of the Securities Act of 1933. These securities may be resold in transactions exempt from registration, normally to qualified institutional buyers. At the end of the period, the value of these securities amounted to $8,481,659 or 1.3% of net assets. |
| (c) | Security or a portion of the security is on loan at period end. |
| (d) | Restricted securities (including private placements) - Investment in securities not registered under the Securities Act of 1933 (excluding 144A issues). At the end of the period, the value of restricted securities (excluding 144A issues) amounted to $263,552 or 0.0% of net assets. |
| (f) | Affiliated fund that is generally available only to investment companies and other accounts managed by Fidelity Investments. The rate quoted is the annualized seven-day yield of the fund at period end. A complete unaudited listing of the fund's holdings as of its most recent quarter end is available upon request. In addition, each Fidelity Central Fund's financial statements are available on the SEC's website or upon request. |
| (g) | Investment made with cash collateral received from securities on loan. |
| Additional information on each restricted holding is as follows: |
| Security | Acquisition Date | Acquisition Cost ($) |
| CelLink Corp. Series D | 1/20/22 | 295,699 |
Affiliated Central Funds
Fiscal year to date information regarding the Fund's investments in Fidelity Central Funds, including the ownership percentage, is presented below.
| Affiliate | Value, beginning of period ($) | Purchases ($) | Sales Proceeds ($) | Dividend Income ($) | Realized Gain (loss) ($) | Change in Unrealized appreciation (depreciation) ($) | Value, end of period ($) | %ownership, end of period |
| Fidelity Cash Central Fund 2.33% | 620,575 | 39,579,985 | 30,298,935 | 17,083 | - | - | 9,901,625 | 0.0% |
| Fidelity Securities Lending Cash Central Fund 2.34% | 1,297,050 | 43,525,883 | 44,449,785 | 1,734 | - | - | 373,148 | 0.0% |
| Total | 1,917,625 | 83,105,868 | 74,748,720 | 18,817 | - | - | 10,274,773 | |
| | | | | | | | | |
Amounts in the income column in the above table include any capital gain distributions from underlying funds, which are presented in the corresponding line item in the Statement of Operations, if applicable.
Amount for Fidelity Securities Lending Cash Central Fund represents the income earned on investing cash collateral, less rebates paid to borrowers and any lending agent fees associated with the loan, plus any premium payments received for lending certain types of securities.
Investment Valuation
The following is a summary of the inputs used, as of August 31, 2022, involving the Fund's assets and liabilities carried at fair value. The inputs or methodology used for valuing securities may not be an indication of the risk associated with investing in those securities. For more information on valuation inputs, and their aggregation into the levels used below, please refer to the Investment Valuation section in the accompanying Notes to Financial Statements.
| Valuation Inputs at Reporting Date: |
| Description | Total ($) | Level 1 ($) | Level 2 ($) | Level 3 ($) |
Investments in Securities: | | | | |
|
| Common Stocks | 660,455,619 | 623,399,824 | 37,055,795 | - |
|
| Convertible Preferred Stocks | 263,552 | - | - | 263,552 |
|
| Money Market Funds | 10,274,773 | 10,274,773 | - | - |
| Total Investments in Securities: | 670,993,944 | 633,674,597 | 37,055,795 | 263,552 |
Fidelity® Environment and Alternative Energy Fund
| Statement of Assets and Liabilities |
| | | | August 31, 2022 (Unaudited) |
| | | | | |
| Assets | | | | |
| Investment in securities, at value (including securities loaned of $341,671) - See accompanying schedule: | | $660,719,171 | | |
Unaffiliated issuers (cost $653,091,784) | | | |
Fidelity Central Funds (cost $10,274,773) | | 10,274,773 | | |
| | | | | |
| Total Investment in Securities (cost $663,366,557) | | | $ | 670,993,944 |
| Receivable for fund shares sold | | | | 773,684 |
| Dividends receivable | | | | 1,057,532 |
| Distributions receivable from Fidelity Central Funds | | | | 13,967 |
| Prepaid expenses | | | | 1,932 |
| Other receivables | | | | 4,987 |
Total assets | | | | 672,846,046 |
| Liabilities | | | | |
| Payable for fund shares redeemed | | $851,757 | | |
| Accrued management fee | | 310,479 | | |
| Transfer agent fee payable | | 115,202 | | |
| Other affiliated payables | | 18,879 | | |
| Deferred taxes | | 178,392 | | |
| Other payables and accrued expenses | | 22,175 | | |
| Collateral on securities loaned | | 373,148 | | |
| Total Liabilities | | | | 1,870,032 |
| Net Assets | | | $ | 670,976,014 |
| Net Assets consist of: | | | | |
| Paid in capital | | | $ | 724,593,335 |
| Total accumulated earnings (loss) | | | | (53,617,321) |
| Net Assets | | | $ | 670,976,014 |
Net Asset Value , offering price and redemption price per share ($670,976,014 ÷ 23,778,417 shares) | | | $ | 28.22 |
| | | | | |
| Statement of Operations |
| | | | Six months ended August 31, 2022 (Unaudited) |
| Investment Income | | | | |
| Dividends | | | $ | 4,935,180 |
| Income from Fidelity Central Funds (including $1,734 from security lending) | | | | 18,817 |
| Total Income | | | | 4,953,997 |
| Expenses | | | | |
| Management fee | $ | 1,842,028 | | |
| Transfer agent fees | | 705,338 | | |
| Accounting fees | | 118,848 | | |
| Custodian fees and expenses | | 7,774 | | |
| Independent trustees' fees and expenses | | 1,132 | | |
| Registration fees | | 28,405 | | |
| Audit | | 18,254 | | |
| Legal | | 2,332 | | |
| Miscellaneous | | 1,552 | | |
| Total expenses before reductions | | 2,725,663 | | |
| Expense reductions | | (11,599) | | |
| Total expenses after reductions | | | | 2,714,064 |
| Net Investment income (loss) | | | | 2,239,933 |
| Realized and Unrealized Gain (Loss) | | | | |
| Net realized gain (loss) on: | | | | |
| Investment Securities: | | | | |
| Unaffiliated issuers | | (37,156,663) | | |
| Foreign currency transactions | | 25,393 | | |
| Total net realized gain (loss) | | | | (37,131,270) |
| Change in net unrealized appreciation (depreciation) on: | | | | |
| Investment Securities: | | | | |
| Unaffiliated issuers(net of increase in deferred foreign taxes of $168,703) | | (33,583,423) | | |
| Assets and liabilities in foreign currencies | | (9,493) | | |
| Total change in net unrealized appreciation (depreciation) | | | | (33,592,916) |
| Net gain (loss) | | | | (70,724,186) |
| Net increase (decrease) in net assets resulting from operations | | | $ | (68,484,253) |
| Statement of Changes in Net Assets |
| |
| | Six months ended August 31, 2022 (Unaudited) | | Year ended February 28, 2022 |
| Increase (Decrease) in Net Assets | | | | |
| Operations | | | | |
| Net investment income (loss) | $ | 2,239,933 | $ | 2,066,511 |
| Net realized gain (loss) | | (37,131,270) | | 45,207,872 |
| Change in net unrealized appreciation (depreciation) | | (33,592,916) | | (30,454,510) |
| Net increase (decrease) in net assets resulting from operations | | (68,484,253) | | 16,819,873 |
| Distributions to shareholders | | - | | (64,644,758) |
| Share transactions | | | | |
| Proceeds from sales of shares | | 77,519,098 | | 631,087,095 |
| Reinvestment of distributions | | - | | 61,338,201 |
| Cost of shares redeemed | | (93,800,531) | | (262,840,215) |
Net increase (decrease) in net assets resulting from share transactions | | (16,281,433) | | 429,585,081 |
| Total increase (decrease) in net assets | | (84,765,686) | | 381,760,196 |
| | | | | |
| Net Assets | | | | |
| Beginning of period | | 755,741,700 | | 373,981,504 |
| End of period | $ | 670,976,014 | $ | 755,741,700 |
| | | | | |
| Other Information | | | | |
| Shares | | | | |
| Sold | | 2,587,070 | | 18,010,951 |
| Issued in reinvestment of distributions | | - | | 1,802,725 |
| Redeemed | | (3,209,173) | | (7,814,961) |
| Net increase (decrease) | | (622,103) | | 11,998,715 |
| | | | | |
| Fidelity® Environment and Alternative Energy Fund |
| |
| | Six months ended (Unaudited) August 31, 2022 | | Years ended February 28, 2022 | | 2021 | | 2020 A | | 2019 | | 2018 |
Selected Per-Share Data | | | | | | | | | | | | |
| Net asset value, beginning of period | $ | 30.97 | $ | 30.16 | $ | 23.80 | $ | 24.92 | $ | 26.31 | $ | 23.89 |
| Income from Investment Operations | | | | | | | | | | | | |
Net investment income (loss) B,C | | .09 | | .11 | | .24 | | .27 | | .24 | | .27 |
| Net realized and unrealized gain (loss) | | (2.84) | | 3.46 | | 8.02 | | (.81) | | (.25) | | 3.83 |
| Total from investment operations | | (2.75) | | 3.57 | | 8.26 | | (.54) | | (.01) | | 4.10 |
| Distributions from net investment income | | - | | (.10) | | (.26) | | (.23) | | (.22) | | (.22) |
| Distributions from net realized gain | | - | | (2.66) | | (1.64) | | (.35) | | (1.16) | | (1.46) |
| Total distributions | | - | | (2.76) | | (1.90) | | (.58) | | (1.38) | | (1.68) |
Redemption fees added to paid in capital B | | - | | - | | - | | - | | - | | - D |
| Net asset value, end of period | $ | 28.22 | $ | 30.97 | $ | 30.16 | $ | 23.80 | $ | 24.92 | $ | 26.31 |
Total Return E,F | | (8.88)% | | 11.02% | | 38.97% | | (2.35)% | | .39% | | 17.73% |
Ratios to Average Net Assets C,G,H | | | | | | | | | | | | |
| Expenses before reductions | | .78% I | | .79% | | .85% | | .85% | | .87% | | .87% |
| Expenses net of fee waivers, if any | | .78% I | | .79% | | .85% | | .85% | | .87% | | .87% |
| Expenses net of all reductions | | .78% I | | .79% | | .85% | | .85% | | .87% | | .86% |
| Net investment income (loss) | | .64% I | | .33% | | .95% | | 1.08% | | .96% | | 1.07% |
| Supplemental Data | | | | | | | | | | | | |
| Net assets, end of period (000 omitted) | $ | 670,976 | $ | 755,742 | $ | 373,982 | $ | 181,456 | $ | 160,960 | $ | 188,383 |
Portfolio turnover rate J | | 24% I | | 89% | | 28% | | 49% | | 62% | | 47% |
A For the year ended February 29.
B Calculated based on average shares outstanding during the period.
C Net investment income (loss) is affected by the timing of the declaration of dividends by any underlying mutual funds or exchange-traded funds (ETFs). Net investment income (loss) of any such underlying funds is not included in the Fund's net investment income (loss) ratio.
D Amount represents less than $.005 per share.
E Total returns for periods of less than one year are not annualized.
F Total returns would have been lower if certain expenses had not been reduced during the applicable periods shown.
G Fees and expenses of any underlying mutual funds or exchange-traded funds (ETFs) are not included in the Fund's expense ratio. The Fund indirectly bears its proportionate share of these expenses. For additional expense information related to investments in Fidelity Central Funds, please refer to the "Investments in Fidelity Central Funds" note found in the Notes to Financial Statements section of the most recent Annual or Semi-Annual report.
H Expense ratios reflect operating expenses of the class. Expenses before reductions do not reflect amounts reimbursed, waived, or reduced through arrangements with the investment adviser, brokerage services, or other offset arrangements, if applicable, and do not represent the amount paid by the class during periods when reimbursements, waivers or reductions occur.
I Annualized
J Amount does not include the portfolio activity of any underlying mutual funds or exchange-traded funds (ETFs).
Top Holdings (% of Fund's net assets) |
| |
| Exxon Mobil Corp. | 18.4 | |
| Hess Corp. | 9.2 | |
| Canadian Natural Resources Ltd. | 8.9 | |
| Imperial Oil Ltd. | 7.2 | |
| MEG Energy Corp. | 4.4 | |
| Valero Energy Corp. | 4.3 | |
| Tourmaline Oil Corp. | 4.2 | |
| Schlumberger Ltd. | 4.1 | |
| Glencore Xstrata PLC | 3.9 | |
| Freeport-McMoRan, Inc. | 3.7 | |
| | 68.3 | |
| |
| Industries (% of Fund's net assets) |
| |
| Oil, Gas & Consumable Fuels | 73.0 | |
| Metals & Mining | 11.8 | |
| Energy Equipment & Services | 9.0 | |
| Containers & Packaging | 4.7 | |
| |
Geographic Diversification (% of Fund's net assets) |
|
* Includes Short-Term investments and Net Other Assets (Liabilities). Percentages are based on country or territory of incorporation and are adjusted for the effect of futures contracts, if applicable. |
| |
Fidelity® Natural Resources Fund
| Common Stocks - 98.5% |
| | | Shares | Value ($) |
| Containers & Packaging - 4.7% | | | |
| Metal & Glass Containers - 2.0% | | | |
| Aptargroup, Inc. | | 75,300 | 7,741,593 |
| Greif, Inc. Class A | | 92,900 | 6,228,945 |
| | | | 13,970,538 |
| Paper Packaging - 2.7% | | | |
| Avery Dennison Corp. | | 55,100 | 10,117,462 |
| Sealed Air Corp. | | 150,000 | 8,071,500 |
| | | | 18,188,962 |
TOTAL CONTAINERS & PACKAGING | | | 32,159,500 |
| Energy Equipment & Services - 9.0% | | | |
| Oil & Gas Drilling - 0.3% | | | |
| Helmerich & Payne, Inc. | | 48,100 | 2,056,275 |
| Oil & Gas Equipment & Services - 8.7% | | | |
| Expro Group Holdings NV (a) | | 226,600 | 3,063,632 |
| Halliburton Co. | | 499,800 | 15,058,974 |
| Liberty Oilfield Services, Inc. Class A (a) | | 189,235 | 2,838,525 |
| Schlumberger Ltd. | | 739,400 | 28,208,110 |
| TechnipFMC PLC (a) | | 896,100 | 7,330,098 |
| Weatherford International PLC (a) | | 133,427 | 3,754,636 |
| | | | 60,253,975 |
TOTAL ENERGY EQUIPMENT & SERVICES | | | 62,310,250 |
| Metals & Mining - 11.8% | | | |
| Copper - 5.9% | | | |
| First Quantum Minerals Ltd. | | 849,600 | 15,033,848 |
| Freeport-McMoRan, Inc. | | 873,900 | 25,867,440 |
| | | | 40,901,288 |
| Diversified Metals & Mining - 4.5% | | | |
| E3 Lithium Ltd. (a) | | 436,700 | 884,473 |
| Glencore Xstrata PLC | | 4,912,200 | 26,857,744 |
| Ivanhoe Mines Ltd. (a) | | 523,854 | 3,366,451 |
| | | | 31,108,668 |
| Gold - 1.4% | | | |
| Franco-Nevada Corp. | | 77,900 | 9,365,676 |
TOTAL METALS & MINING | | | 81,375,632 |
| Oil, Gas & Consumable Fuels - 73.0% | | | |
| Coal & Consumable Fuels - 1.2% | | | |
| Cameco Corp. | | 11,700 | 341,055 |
| Whitehaven Coal Ltd. | | 1,460,272 | 7,778,300 |
| | | | 8,119,355 |
| Integrated Oil & Gas - 28.6% | | | |
| Equinor ASA sponsored ADR | | 537,700 | 20,857,383 |
| Exxon Mobil Corp. | | 1,329,700 | 127,106,021 |
| Imperial Oil Ltd. | | 1,008,200 | 49,483,056 |
| | | | 197,446,460 |
| Oil & Gas Exploration & Production - 34.4% | | | |
| Africa Oil Corp. | | 1,359,400 | 2,660,112 |
| Antero Resources Corp. (a) | | 467,800 | 18,749,424 |
| Canadian Natural Resources Ltd. | | 1,117,000 | 61,222,770 |
| Deltic Energy PLC (a) | | 15,835,400 | 706,406 |
| Hess Corp. | | 526,000 | 63,530,280 |
| Kosmos Energy Ltd. (a) | | 3,452,500 | 24,409,175 |
| MEG Energy Corp. (a) | | 2,191,312 | 30,633,486 |
| Range Resources Corp. | | 199,500 | 6,555,570 |
| Tourmaline Oil Corp. | | 484,600 | 28,651,304 |
| | | | 237,118,527 |
| Oil & Gas Refining & Marketing - 7.4% | | | |
| CVR Energy, Inc. | | 107,800 | 3,520,748 |
| Delek U.S. Holdings, Inc. | | 156,000 | 4,407,000 |
| Phillips 66 Co. | | 148,016 | 13,241,511 |
| Valero Energy Corp. | | 252,800 | 29,607,936 |
| | | | 50,777,195 |
| Oil & Gas Storage & Transport - 1.4% | | | |
| Genesis Energy LP | | 820,548 | 9,501,946 |
TOTAL OIL, GAS & CONSUMABLE FUELS | | | 502,963,483 |
| TOTAL COMMON STOCKS (Cost $512,393,205) | | | 678,808,865 |
| | | | |
| Money Market Funds - 1.2% |
| | | Shares | Value ($) |
Fidelity Cash Central Fund 2.33% (b) (Cost $8,716,656) | | 8,714,913 | 8,716,656 |
| | | | |
| TOTAL INVESTMENT IN SECURITIES - 99.7% (Cost $521,109,861) | 687,525,521 |
NET OTHER ASSETS (LIABILITIES) - 0.3% | 1,856,918 |
| NET ASSETS - 100.0% | 689,382,439 |
| | |
Legend
| (b) | Affiliated fund that is generally available only to investment companies and other accounts managed by Fidelity Investments. The rate quoted is the annualized seven-day yield of the fund at period end. A complete unaudited listing of the fund's holdings as of its most recent quarter end is available upon request. In addition, each Fidelity Central Fund's financial statements are available on the SEC's website or upon request. |
Affiliated Central Funds
Fiscal year to date information regarding the Fund's investments in Fidelity Central Funds, including the ownership percentage, is presented below.
| Affiliate | Value, beginning of period ($) | Purchases ($) | Sales Proceeds ($) | Dividend Income ($) | Realized Gain (loss) ($) | Change in Unrealized appreciation (depreciation) ($) | Value, end of period ($) | %ownership, end of period |
| Fidelity Cash Central Fund 2.33% | 5,185,303 | 125,838,265 | 122,306,912 | 18,114 | - | - | 8,716,656 | 0.0% |
| Fidelity Securities Lending Cash Central Fund 2.34% | 18,439,385 | 74,563,572 | 93,002,957 | 29,952 | - | - | - | 0.0% |
| Total | 23,624,688 | 200,401,837 | 215,309,869 | 48,066 | - | - | 8,716,656 | |
| | | | | | | | | |
Amounts in the income column in the above table include any capital gain distributions from underlying funds, which are presented in the corresponding line item in the Statement of Operations, if applicable.
Amount for Fidelity Securities Lending Cash Central Fund represents the income earned on investing cash collateral, less rebates paid to borrowers and any lending agent fees associated with the loan, plus any premium payments received for lending certain types of securities.
Investment Valuation
The following is a summary of the inputs used, as of August 31, 2022, involving the Fund's assets and liabilities carried at fair value. The inputs or methodology used for valuing securities may not be an indication of the risk associated with investing in those securities. For more information on valuation inputs, and their aggregation into the levels used below, please refer to the Investment Valuation section in the accompanying Notes to Financial Statements.
| Valuation Inputs at Reporting Date: |
| Description | Total ($) | Level 1 ($) | Level 2 ($) | Level 3 ($) |
Investments in Securities: | | | | |
|
| Common Stocks | 678,808,865 | 644,172,821 | 34,636,044 | - |
|
| Money Market Funds | 8,716,656 | 8,716,656 | - | - |
| Total Investments in Securities: | 687,525,521 | 652,889,477 | 34,636,044 | - |
Fidelity® Natural Resources Fund
| Statement of Assets and Liabilities |
| | | | August 31, 2022 (Unaudited) |
| | | | | |
| Assets | | | | |
| Investment in securities, at value - See accompanying schedule: | | $678,808,865 | | |
Unaffiliated issuers (cost $512,393,205) | | | |
Fidelity Central Funds (cost $8,716,656) | | 8,716,656 | | |
| | | | | |
| Total Investment in Securities (cost $521,109,861) | | | $ | 687,525,521 |
| Foreign currency held at value (cost $19) | | | | 25 |
| Receivable for investments sold | | | | 6,179,740 |
| Receivable for fund shares sold | | | | 1,694,793 |
| Dividends receivable | | | | 1,709,673 |
| Distributions receivable from Fidelity Central Funds | | | | 12,810 |
| Prepaid expenses | | | | 4,220 |
| Other receivables | | | | 106,290 |
Total assets | | | | 697,233,072 |
| Liabilities | | | | |
| Payable to custodian bank | | 11,959 | | |
| Payable for investments purchased | | 5,895,990 | | |
| Payable for fund shares redeemed | | 1,415,384 | | |
| Accrued management fee | | 296,456 | | |
| Other affiliated payables | | 122,242 | | |
| Other payables and accrued expenses | | 108,602 | | |
| Total Liabilities | | | | 7,850,633 |
| Net Assets | | | $ | 689,382,439 |
| Net Assets consist of: | | | | |
| Paid in capital | | | $ | 802,501,560 |
| Total accumulated earnings (loss) | | | | (113,119,121) |
| Net Assets | | | $ | 689,382,439 |
Net Asset Value , offering price and redemption price per share ($689,382,439 ÷ 19,207,125 shares) | | | $ | 35.89 |
| | | | | |
| Statement of Operations |
| | | | Six months ended August 31, 2022 (Unaudited) |
| Investment Income | | | | |
| Dividends | | | $ | 11,048,966 |
| Interest | | | | 19 |
| Income from Fidelity Central Funds (including $29,952 from security lending) | | | | 48,066 |
| Total Income | | | | 11,097,051 |
| Expenses | | | | |
| Management fee | $ | 1,955,812 | | |
| Transfer agent fees | | 678,114 | | |
| Accounting fees | | 124,310 | | |
| Custodian fees and expenses | | 22,970 | | |
| Independent trustees' fees and expenses | | 1,164 | | |
| Registration fees | | 65,748 | | |
| Audit | | 17,136 | | |
| Legal | | 186 | | |
| Interest | | 8,330 | | |
| Miscellaneous | | 1,564 | | |
| Total expenses before reductions | | 2,875,334 | | |
| Expense reductions | | (12,038) | | |
| Total expenses after reductions | | | | 2,863,296 |
| Net Investment income (loss) | | | | 8,233,755 |
| Realized and Unrealized Gain (Loss) | | | | |
| Net realized gain (loss) on: | | | | |
| Investment Securities: | | | | |
| Unaffiliated issuers | | 2,021,484 | | |
| Foreign currency transactions | | (82,258) | | |
| Total net realized gain (loss) | | | | 1,939,226 |
| Change in net unrealized appreciation (depreciation) on: | | | | |
| Investment Securities: | | | | |
| Unaffiliated issuers | | (441,691) | | |
| Assets and liabilities in foreign currencies | | (1,521) | | |
| Total change in net unrealized appreciation (depreciation) | | | | (443,212) |
| Net gain (loss) | | | | 1,496,014 |
| Net increase (decrease) in net assets resulting from operations | | | $ | 9,729,769 |
| Statement of Changes in Net Assets |
| |
| | Six months ended August 31, 2022 (Unaudited) | | Year ended February 28, 2022 |
| Increase (Decrease) in Net Assets | | | | |
| Operations | | | | |
| Net investment income (loss) | $ | 8,233,755 | $ | 7,161,576 |
| Net realized gain (loss) | | 1,939,226 | | 22,873,313 |
| Change in net unrealized appreciation (depreciation) | | (443,212) | | 124,171,738 |
| Net increase (decrease) in net assets resulting from operations | | 9,729,769 | | 154,206,627 |
| Distributions to shareholders | | (3,884,661) | | (5,734,164) |
| Share transactions | | | | |
| Proceeds from sales of shares | | 414,666,657 | | 383,163,467 |
| Reinvestment of distributions | | 3,662,049 | | 5,352,192 |
| Cost of shares redeemed | | (332,824,905) | | (231,841,612) |
Net increase (decrease) in net assets resulting from share transactions | | 85,503,801 | | 156,674,047 |
| Total increase (decrease) in net assets | | 91,348,909 | | 305,146,510 |
| | | | | |
| Net Assets | | | | |
| Beginning of period | | 598,033,530 | | 292,887,020 |
| End of period | $ | 689,382,439 | $ | 598,033,530 |
| | | | | |
| Other Information | | | | |
| Shares | | | | |
| Sold | | 11,247,110 | | 13,086,738 |
| Issued in reinvestment of distributions | | 95,416 | | 199,634 |
| Redeemed | | (9,610,172) | | (8,430,799) |
| Net increase (decrease) | | 1,732,354 | | 4,855,573 |
| | | | | |
| Fidelity® Natural Resources Fund |
| |
| | Six months ended (Unaudited) August 31, 2022 | | Years ended February 28, 2022 | | 2021 | | 2020 A | | 2019 | | 2018 |
Selected Per-Share Data | | | | | | | | | | | | |
| Net asset value, beginning of period | $ | 34.22 | $ | 23.21 | $ | 20.59 | $ | 25.55 | $ | 27.51 | $ | 29.13 |
| Income from Investment Operations | | | | | | | | | | | | |
Net investment income (loss) B,C | | .40 | | .51 | | .30 | | .30 | | .29 | | .43 D |
| Net realized and unrealized gain (loss) | | 1.46 | | 10.91 | | 2.69 | | (4.88) | | (1.97) | | (1.64) |
| Total from investment operations | | 1.86 | | 11.42 | | 2.99 | | (4.58) | | (1.68) | | (1.21) |
| Distributions from net investment income | | (.19) | | (.41) | | (.37) | | (.30) | | (.28) | | (.39) |
| Distributions from net realized gain | | - | | - | | - | | (.08) | | - E | | (.02) |
| Total distributions | | (.19) | | (.41) | | (.37) | | (.38) | | (.28) | | (.41) |
Redemption fees added to paid in capital B | | - | | - | | - | | - | | - | | - E |
| Net asset value, end of period | $ | 35.89 | $ | 34.22 | $ | 23.21 | $ | 20.59 | $ | 25.55 | $ | 27.51 |
Total Return F,G | | 5.41% | | 49.71% | | 14.76% | | (18.25)% | | (6.06)% | | (4.16)% |
Ratios to Average Net Assets C,H,I | | | | | | | | | | | | |
| Expenses before reductions | | .78% J | | .82% | | .89% | | .84% | | .81% | | .83% |
| Expenses net of fee waivers, if any | | .77% J | | .81% | | .89% | | .84% | | .81% | | .83% |
| Expenses net of all reductions | | .77% J | | .81% | | .88% | | .84% | | .80% | | .82% |
| Net investment income (loss) | | 2.22% J | | 1.84% | | 1.62% | | 1.18% | | 1.02% | | 1.54% D |
| Supplemental Data | | | | | | | | | | | | |
| Net assets, end of period (000 omitted) | $ | 689,382 | $ | 598,034 | $ | 292,887 | $ | 315,533 | $ | 424,167 | $ | 910,733 |
Portfolio turnover rate K | | 103% J | | 98% | | 90% | | 8% | | 26% | | 78% |
A For the year ended February 29.
B Calculated based on average shares outstanding during the period.
C Net investment income (loss) is affected by the timing of the declaration of dividends by any underlying mutual funds or exchange-traded funds (ETFs). Net investment income (loss) of any such underlying funds is not included in the Fund's net investment income (loss) ratio.
D Net investment income per share reflects one or more large, non-recurring dividend(s) which amounted to $.31 per share. Excluding such non-recurring dividend(s), the ratio of net investment income (loss) to average net assets would have been .41%.
E Amount represents less than $.005 per share.
F Total returns for periods of less than one year are not annualized.
G Total returns would have been lower if certain expenses had not been reduced during the applicable periods shown.
H Fees and expenses of any underlying mutual funds or exchange-traded funds (ETFs) are not included in the Fund's expense ratio. The Fund indirectly bears its proportionate share of these expenses. For additional expense information related to investments in Fidelity Central Funds, please refer to the "Investments in Fidelity Central Funds" note found in the Notes to Financial Statements section of the most recent Annual or Semi-Annual report.
I Expense ratios reflect operating expenses of the class. Expenses before reductions do not reflect amounts reimbursed, waived, or reduced through arrangements with the investment adviser, brokerage services, or other offset arrangements, if applicable, and do not represent the amount paid by the class during periods when reimbursements, waivers or reductions occur.
J Annualized
K Amount does not include the portfolio activity of any underlying mutual funds or exchange-traded funds (ETFs).
For the period ended August 31, 2022
1. Organization.
Fidelity Environment and Alternative Energy Fund and Fidelity Natural Resources Fund (the Funds) are non-diversified funds of Fidelity Select Portfolios (the Trust). Each Fund is authorized to issue an unlimited number of shares. Share transactions on the Statement of Changes in Net Assets may contain exchanges between affiliated funds. The Trust is registered under the Investment Company Act of 1940, as amended (the 1940 Act), as an open-end management investment company organized as a Massachusetts business trust. The Funds invest primarily in securities of companies whose principal business activities fall within specific industries. Fidelity Natural Resources Fund may also invest in certain precious metals.
2. Investments in Fidelity Central Funds.
Funds may invest in Fidelity Central Funds, which are open-end investment companies generally available only to other investment companies and accounts managed by the investment adviser and its affiliates. The Schedule of Investments lists any Fidelity Central Funds held as an investment as of period end, but does not include the underlying holdings of each Fidelity Central Fund. An investing fund indirectly bears its proportionate share of the expenses of the underlying Fidelity Central Funds.
Based on its investment objective, each Fidelity Central Fund may invest or participate in various investment vehicles or strategies that are similar to those of the investing fund. These strategies are consistent with the investment objectives of the investing fund and may involve certain economic risks which may cause a decline in value of each of the Fidelity Central Funds and thus a decline in the value of the investing fund.
| Fidelity Central Fund | Investment Manager | Investment Objective | Investment Practices | Expense Ratio A |
| Fidelity Money Market Central Funds | Fidelity Management & Research Company LLC (FMR) | Each fund seeks to obtain a high level of current income consistent with the preservation of capital and liquidity. | Short-term Investments | Less than .005% |
A Expenses expressed as a percentage of average net assets and are as of each underlying Central Fund's most recent annual or semi-annual shareholder report.
A complete unaudited list of holdings for each Fidelity Central Fund is available upon request or at the Securities and Exchange Commission website at www.sec.gov. In addition, the financial statements of the Fidelity Central Funds which contain the significant accounting policies (including investment valuation policies) of those funds, and are not covered by the Report of Independent Registered Public Accounting Firm, are available on the Securities and Exchange Commission website or upon request.
3. Significant Accounting Policies.
Each Fund is an investment company and applies the accounting and reporting guidance of the Financial Accounting Standards Board (FASB) Accounting Standards Codification Topic 946 Financial Services - Investment Companies . The financial statements have been prepared in conformity with accounting principles generally accepted in the United States of America (GAAP), which require management to make certain estimates and assumptions at the date of the financial statements. Actual results could differ from those estimates. Subsequent events, if any, through the date that the financial statements were issued have been evaluated in the preparation of the financial statements. Each Fund's Schedule of Investments lists any underlying mutual funds or exchange-traded funds (ETFs) but does not include the underlying holdings of these funds. The following summarizes the significant accounting policies of each Fund:
Investment Valuation. Investments are valued as of 4:00 p.m. Eastern time on the last calendar day of the period. The Board of Trustees (the Board) has delegated the day to day responsibility for the valuation of each Fund's investments to the Fair Value Committee (the Committee) established by each Fund's investment adviser. In accordance with valuation policies and procedures approved by the Board, each Fund attempts to obtain prices from one or more third party pricing vendors or brokers to value its investments. When current market prices, quotations or currency exchange rates are not readily available or reliable, investments will be fair valued in good faith by the Committee, in accordance with procedures adopted by the Board. Factors used in determining fair value vary by investment type and may include market or investment specific events. The frequency with which these procedures are used cannot be predicted and they may be utilized to a significant extent. The Committee oversees each Fund's valuation policies and procedures and reports to the Board on the Committee's activities and fair value determinations. The Board monitors the appropriateness of the procedures used in valuing each Fund's investments and ratifies the fair value determinations of the Committee.
Each Fund categorizes the inputs to valuation techniques used to value its investments into a disclosure hierarchy consisting of three levels as shown below:
Level 1 - unadjusted quoted prices in active markets for identical investments
Level 2 - other significant observable inputs (including quoted prices for similar investments, interest rates, prepayment speeds, etc.)
Level 3 - unobservable inputs (including the Fund's own assumptions based on the best information available)
Valuation techniques used to value each Fund's investments by major category are as follows:
Equity securities, including restricted securities, for which market quotations are readily available, are valued at the last reported sale price or official closing price as reported by a third party pricing vendor on the primary market or exchange on which they are traded and are categorized as Level 1 in the hierarchy. In the event there were no sales during the day or closing prices are not available, securities are valued at the last quoted bid price or may be valued using the last available price and are generally categorized as Level 2 in the hierarchy. For foreign equity securities, when market or security specific events arise, comparisons to the valuation of American Depositary Receipts (ADRs), futures contracts, ETFs and certain indexes as well as quoted prices for similar securities may be used and would be categorized as Level 2 in the hierarchy. For equity securities, including restricted securities, where observable inputs are limited, assumptions about market activity and risk are used and these securities may be categorized as Level 3 in the hierarchy.
Investments in open-end mutual funds, including the Fidelity Central Funds, are valued at their closing net asset value (NAV) each business day and are categorized as Level 1 in the hierarchy.
Changes in valuation techniques may result in transfers in or out of an assigned level within the disclosure hierarchy. The aggregate value of investments by input level as of August 31, 2022 is included at the end of each Fund's Schedule of Investments.
Foreign Currency. Certain Funds may use foreign currency contracts to facilitate transactions in foreign-denominated securities. Gains and losses from these transactions may arise from changes in the value of the foreign currency or if the counterparties do not perform under the contracts' terms.
Foreign-denominated assets, including investment securities, and liabilities are translated into U.S. dollars at the exchange rates at period end. Purchases and sales of investment securities, income and dividends received, and expenses denominated in foreign currencies are translated into U.S. dollars at the exchange rate in effect on the transaction date.
The effects of exchange rate fluctuations on investments are included with the net realized and unrealized gain (loss) on investment securities. Other foreign currency transactions resulting in realized and unrealized gain (loss) are disclosed separately.
Investment Transactions and Income. For financial reporting purposes, the Funds' investment holdings and NAV include trades executed through the end of the last business day of the period. The NAV per share for processing shareholder transactions is calculated as of the close of business of the New York Stock Exchange (NYSE), normally 4:00 p.m. Eastern time and includes trades executed through the end of the prior business day. Gains and losses on securities sold are determined on the basis of identified cost and for certain Funds include proceeds received from litigation. Commissions paid to certain brokers with whom the investment adviser, or its affiliates, places trades on behalf of a fund include an amount in addition to trade execution, which may be rebated back to a fund. Any such rebates are included in net realized gain (loss) on investments in the Statement of Operations. Dividend income is recorded on the ex-dividend date, except for certain dividends from foreign securities where the ex-dividend date may have passed, which are recorded as soon as the Funds are informed of the ex-dividend date. Non-cash dividends included in dividend income, if any, are recorded at the fair market value of the securities received. Income and capital gain distributions from Fidelity Central Funds, if any, are recorded on the ex-dividend date. Certain distributions received by the Funds represent a return of capital or capital gain. The Funds determine the components of these distributions subsequent to the ex-dividend date, based upon receipt of tax filings or other correspondence relating to the underlying investment. These distributions are recorded as a reduction of cost of investments and/or as a realized gain. Interest income is accrued as earned and includes coupon interest and amortization of premium and accretion of discount on debt securities as applicable. Investment income is recorded net of foreign taxes withheld where recovery of such taxes is uncertain. Funds may file withholding tax reclaims in certain jurisdictions to recover a portion of amounts previously withheld. Any withholding tax reclaims income is included in the Statement of Operations in dividends. Any receivables for withholding tax reclaims are included in the Statement of Assets and Liabilities in dividends receivable.
Expenses. Expenses directly attributable to a fund are charged to that fund. Expenses attributable to more than one fund are allocated among the respective funds on the basis of relative net assets or other appropriate methods. Expenses included in the accompanying financial statements reflect the expenses of that fund and do not include any expenses associated with any underlying mutual funds or exchange-traded funds. Although not included in a fund's expenses, a fund indirectly bears its proportionate share of these expenses through the net asset value of each underlying mutual fund or exchange-traded fund. Expense estimates are accrued in the period to which they relate and adjustments are made when actual amounts are known.
Deferred Trustee Compensation. Under a Deferred Compensation Plan (the Plan) for certain Funds, certain independent Trustees have elected to defer receipt of a portion of their annual compensation. Deferred amounts are invested in affiliated mutual funds, are marked-to-market and remain in a fund until distributed in accordance with the Plan. The investment of deferred amounts and the offsetting payable to the Trustees presented below are included in the accompanying Statement of Assets and Liabilities in other receivables and other payables and accrued expenses, as applicable.
| Fidelity Natural Resources Fund | $ 80,977 |
Income Tax Information and Distributions to Shareholders. Each year, each Fund intends to qualify as a regulated investment company under Subchapter M of the Internal Revenue Code, including distributing substantially all of its taxable income and realized gains. As a result, no provision for U.S. Federal income taxes is required. Each Fund files a U.S. federal tax return, in addition to state and local tax returns as required. Each Fund's federal income tax returns are subject to examination by the Internal Revenue Service (IRS) for a period of three fiscal years after they are filed. State and local tax returns may be subject to examination for an additional fiscal year depending on the jurisdiction. Foreign taxes are provided for based on each Fund's understanding of the tax rules and rates that exist in the foreign markets in which it invests. Fidelity Environment and Alternative Energy Fund is subject to a tax imposed on capital gains by certain countries in which it invests. An estimated deferred tax liability for net unrealized appreciation on the applicable securities is included in Deferred taxes on the Statement of Assets & Liabilities.
Distributions are declared and recorded on the ex-dividend date. Income and capital gain distributions are determined in accordance with income tax regulations, which may differ from GAAP.
Capital accounts within the financial statements are adjusted for permanent book-tax differences. These adjustments have no impact on net assets or the results of operations. Capital accounts are not adjusted for temporary book-tax differences which will reverse in a subsequent period.
Book-tax differences are primarily due to foreign currency transactions, partnerships, passive foreign investment companies (PFIC), deferred Trustee compensation, capital loss carryforwards and losses deferred due to wash sales and excise tax regulations.
As of period end, the cost and unrealized appreciation (depreciation) in securities, and derivatives if applicable, for federal income tax purposes were as follows for each Fund:
| | Tax cost | Gross unrealized appreciation | Gross unrealized depreciation | Net unrealized appreciation (depreciation) |
Fidelity Environment and Alternative Energy Fund | $ 663,578,371 | $ 73,754,124 | $ (66,338,551) | $ 7,415,573 |
| Fidelity Natural Resources Fund | 524,629,042 | 182,582,493 | (19,686,014) | 162,896,479 |
Capital loss carryforwards are only available to offset future capital gains of the Funds to the extent provided by regulations and may be limited. The capital loss carryforward information presented below, including any applicable limitation, is estimated as of prior fiscal period end and is subject to adjustment.
| | Short-term | Long-term | Total capital loss carryforward |
| Fidelity Natural Resources Fund | $(81,832,559) | $(201,972,245) | $(283,804,804) |
Certain of the Funds elected to defer to the next fiscal year capital losses recognized during the period November 1, 2021 to February 28, 2022. Loss deferrals were as follows:
| | Capital losses |
Fidelity Environment and Alternative Energy Fund | $ (25,207,903) |
Restricted Securities (including Private Placements). Funds may invest in securities that are subject to legal or contractual restrictions on resale. These securities generally may be resold in transactions exempt from registration or to the public if the securities are registered. Disposal of these securities may involve time-consuming negotiations and expense, and prompt sale at an acceptable price may be difficult. Information regarding restricted securities held at period end is included at the end of the Schedule of Investments, if applicable.
4. Purchases and Sales of Investments.
Purchases and sales of securities, other than short-term securities and in-kind transactions, as applicable, are noted in the table below.
| | Purchases ($) | Sales ($) |
| Fidelity Environment and Alternative Energy Fund | 84,393,101 | 106,918,841 |
| Fidelity Natural Resources Fund | 457,042,356 | 372,274,003 |
5. Fees and Other Transactions with Affiliates.
Management Fee. Fidelity Management & Research Company LLC (the investment adviser) and its affiliates provide the Funds with investment management related services for which the Funds pay a monthly management fee. The management fee is the sum of an individual fund fee rate and an annualized group fee rate. The individual fund fee rate is applied to each Fund's average net assets. The group fee rate is based upon the monthly average net assets of a group of registered investment companies with which the investment adviser has management contracts. The group fee rate decreases as assets under management increase and increases as assets under management decrease. For the reporting period, each Fund's annualized management fee rate expressed as a percentage of each Fund's average net assets was as follows:
| | Individual Rate | Group Rate | Total |
| Fidelity Environment and Alternative Energy Fund | .30% | .23% | .53% |
| Fidelity Natural Resources Fund | .30% | .23% | .53% |
Transfer Agent Fees. Fidelity Investments Institutional Operations Company LLC (FIIOC), an affiliate of the investment adviser, is the Funds' transfer, dividend disbursing and shareholder servicing agent. FIIOC receives account fees and asset-based fees that vary according to account size and type of account. FIIOC pays for typesetting, printing and mailing of shareholder reports, except proxy statements. For the period, transfer agent fees were equivalent to the following annualized rates expressed as a percentage of average net assets:
| Fidelity Environment and Alternative Energy Fund | .20% |
| Fidelity Natural Resources Fund | .18% |
Accounting Fees. Fidelity Service Company, Inc. (FSC), an affiliate of the investment adviser, maintains each Fund's accounting records. The accounting fee is based on the level of average net assets for each month. For the period, the fees were equivalent to the following annualized rates:
| | % of Average Net Assets |
| Fidelity Environment and Alternative Energy Fund | .03 |
| Fidelity Natural Resources Fund | .03 |
Brokerage Commissions. A portion of portfolio transactions were placed with brokerage firms which are affiliates of the investment adviser. Brokerage commissions are included in net realized gain (loss) and change in net unrealized appreciation (depreciation) in the Statement of Operations. The commissions paid to these affiliated firms were as follows:
| | Amount |
| Fidelity Environment and Alternative Energy Fund | $ 2,133 |
| Fidelity Natural Resources Fund | 15,786 |
Interfund Lending Program. Pursuant to an Exemptive Order issued by the Securities and Exchange Commission (the SEC), each Fund, along with other registered investment companies having management contracts with Fidelity Management & Research Company LLC (FMR), or other affiliated entities of FMR, may participate in an interfund lending program. This program provides an alternative credit facility allowing each Fund to borrow from, or lend money to, other participating affiliated funds. At period end, there were no interfund loans outstanding. Activity in this program during the period for which loans were outstanding was as follows:
| | Borrower or Lender | Average Loan Balance | Weighted Average Interest Rate | Interest Expense |
| Fidelity Natural Resources Fund | Borrower | $ 5,089,618 | 1.56% | $ 7,487 |
Interfund Trades. Funds may purchase from or sell securities to other Fidelity Funds under procedures adopted by the Board. The procedures have been designed to ensure these interfund trades are executed in accordance with Rule 17a-7 of the 1940 Act. Interfund trades during the period are noted in the table below.
| | Purchases ($) | Sales ($) | Realized Gain (Loss) ($) |
| Fidelity Environment and Alternative Energy Fund | 1,690,788 | 10,206,653 | (3,515,641) |
| Fidelity Natural Resources Fund | 33,517,115 | 30,130,409 | (2,255,377) |
6. Committed Line of Credit.
Certain Funds participate with other funds managed by the investment adviser or an affiliate in a $4.25 billion credit facility (the "line of credit") to be utilized for temporary or emergency purposes to fund shareholder redemptions or for other short-term liquidity purposes. The participating funds have agreed to pay commitment fees on their pro-rata portion of the line of credit, which are reflected in Miscellaneous expenses on the Statement of Operations, and are listed below. During the period, there were no borrowings on this line of credit.
| | Amount |
| Fidelity Environment and Alternative Energy Fund | $ 646 |
| Fidelity Natural Resources Fund | 592 |
7. Security Lending.
Funds lend portfolio securities from time to time in order to earn additional income. Lending agents are used, including National Financial Services (NFS), an affiliate of the investment adviser. Pursuant to a securities lending agreement, NFS will receive a fee, which is capped at 9.9% of a fund's daily lending revenue, for its services as lending agent. A fund may lend securities to certain qualified borrowers, including NFS. On the settlement date of the loan, a fund receives collateral (in the form of U.S. Treasury obligations, letters of credit and/or cash) against the loaned securities and maintains collateral in an amount not less than 100% of the market value of the loaned securities during the period of the loan. The market value of the loaned securities is determined at the close of business of a fund and any additional required collateral is delivered to a fund on the next business day. A fund or borrower may terminate the loan at any time, and if the borrower defaults on its obligation to return the securities loaned because of insolvency or other reasons, a fund may apply collateral received from the borrower against the obligation. A fund may experience delays and costs in recovering the securities loaned. Any cash collateral received is invested in the Fidelity Securities Lending Cash Central Fund. Any loaned securities are identified as such in the Schedule of Investments, and the value of loaned securities and cash collateral at period end, as applicable, are presented in the Statement of Assets and Liabilities. Security lending income represents the income earned on investing cash collateral, less rebates paid to borrowers and any lending agent fees associated with the loan, plus any premium payments received for lending certain types of securities. Security lending income is presented in the Statement of Operations as a component of income from Fidelity Central Funds. Affiliated security lending activity, if any, was as follows:
| | Total Security Lending Fees Paid to NFS | Security Lending Income From Securities Loaned to NFS | Value of Securities Loaned to NFS at Period End |
| Fidelity Environment and Alternative Energy Fund | $ 171 | $ 1 | $- |
| Fidelity Natural Resources Fund | $ 3,058 | $ - | $- |
8. Bank Borrowings.
Each Fund is permitted to have bank borrowings for temporary or emergency purposes to fund shareholder redemptions or for other short-term liquidity requirements. Each Fund has established borrowing arrangements with certain banks. The interest rate on the borrowings is the bank's base rate, as revised from time to time. Any open loans, including accrued interest, at period end are presented under the caption "Notes payable" in the Statement of Assets and Liabilities, if applicable. Activity in this program during the period for which loans were outstanding was as follows:
| | Average Loan Balance | Weighted Average Interest Rate | Interest Expense |
| Fidelity Natural Resources Fund | $ 1,824,000 | 2.08% | $ 843 |
9. Expense Reductions.
During the period the investment adviser or an affiliate reimbursed and/or waived a portion of operating expenses as follows:
| | Amount |
| Fidelity Environment and Alternative Energy Fund | $ 11,599 |
| Fidelity Natural Resources Fund | 12,038 |
10. Other.
A fund's organizational documents provide former and current trustees and officers with a limited indemnification against liabilities arising in connection with the performance of their duties to the fund. In the normal course of business, a fund may also enter into contracts that provide general indemnifications. A fund's maximum exposure under these arrangements is unknown as this would be dependent on future claims that may be made against a fund. The risk of material loss from such claims is considered remote.
11. Risk and Uncertainties.
Many factors affect a fund's performance. Developments that disrupt global economies and financial markets, such as pandemics, epidemics, outbreaks of infectious diseases, war, terrorism, and environmental disasters, may significantly affect a fund's investment performance. The effects of these developments to a fund will be impacted by the types of securities in which a fund invests, the financial condition, industry, economic sector, and geographic location of an issuer, and a fund's level of investment in the securities of that issuer.
As a shareholder, you incur two types of costs: (1) transaction costs, which may include sales charges (loads) on purchase payments or redemption proceeds, as applicable and (2) ongoing costs, which generally include management fees, distribution and/or service (12b-1) fees and other Fund expenses. This Example is intended to help you understand your ongoing costs (in dollars) of investing in a fund and to compare these costs with the ongoing costs of investing in other mutual funds.
| The Example is based on an investment of $1,000 invested at the beginning of the period and held for the entire period (March 1, 2022 to August 31, 2022). |
Actual Expenses
The first line of the accompanying table provides information about actual account values and actual expenses. You may use the information in this line, together with the amount you invested, to estimate the expenses that you paid over the period. Simply divide your account value by $1,000.00 (for example, an $8,600 account value divided by $1,000.00 = 8.6), then multiply the result by the number in the first line for a class/Fund under the heading entitled "Expenses Paid During Period" to estimate the expenses you paid on your account during this period. If any fund is a shareholder of any underlying mutual funds or exchange-traded funds (ETFs) (the Underlying Funds), such fund indirectly bears its proportional share of the expenses of the Underlying Funds in addition to the direct expenses incurred presented in the table. These fees and expenses are not included in the annualized expense ratio used to calculate the expense estimate in the table below.
Hypothetical Example for Comparison Purposes
The second line of the accompanying table provides information about hypothetical account values and hypothetical expenses based on the actual expense ratio and an assumed rate of return of 5% per year before expenses, which is not the actual return. The hypothetical account values and expenses may not be used to estimate the actual ending account balance or expenses you paid for the period. You may use this information to compare the ongoing costs of investing in the Fund and other funds. To do so, compare this 5% hypothetical example with the 5% hypothetical examples that appear in the shareholder reports of the other funds. If any fund is a shareholder of any Underlying Funds, such fund indirectly bears its proportional share of the expenses of the Underlying Funds in addition to the direct expenses as presented in the table. These fees and expenses are not included in the annualized expense ratio used to calculate the expense estimate in the table below.
Please note that the expenses shown in the table are meant to highlight your ongoing costs only and do not reflect any transaction costs. Therefore, the second line of the table is useful in comparing ongoing costs only, and will not help you determine the relative total costs of owning different funds. In addition, if these transactional costs were included, your costs would have been higher.
| | | | | Annualized Expense Ratio- A | | Beginning Account Value March 1, 2022 | | Ending Account Value August 31, 2022 | | Expenses Paid During Period- C March 1, 2022 to August 31, 2022 |
| | | | | | | | | | |
| Fidelity® Environment and Alternative Energy Fund | | | | .78% | | | | | | |
| Actual | | | | | | $ 1,000 | | $ 911.20 | | $ 3.76 |
Hypothetical- B | | | | | | $ 1,000 | | $ 1,021.27 | | $ 3.97 |
| | | | | | | | | | |
| Fidelity® Natural Resources Fund | | | | .77% | | | | | | |
| Actual | | | | | | $ 1,000 | | $ 1,054.10 | | $ 3.99 |
Hypothetical- B | | | | | | $ 1,000 | | $ 1,021.32 | | $ 3.92 |
| |
A Annualized expense ratio reflects expenses net of applicable fee waivers.
B 5% return per year before expenses
C Expenses are equal to the annualized expense ratio, multiplied by the average account value over the period, multiplied by 184/ 365 (to reflect the one-half year period). The fees and expenses of any Underlying Funds are not included in each annualized expense ratio.
Fidelity Environment and Alternative Energy Fund
Fidelity Natural Resources Fund
Each year, the Board of Trustees, including the Independent Trustees (together, the Board), votes on the renewal of the management contract with Fidelity Management & Research Company LLC (FMR) and the sub-advisory agreements (together, the Advisory Contracts) for each fund. FMR and the sub-advisers are referred to herein as the Investment Advisers. The Board, assisted by the advice of fund counsel and Independent Trustees' counsel, requests and considers a broad range of information relevant to the renewal of the Advisory Contracts throughout the year.
The Board meets regularly and, at each of its meetings, covers an extensive agenda of topics and materials and considers factors that are relevant to its annual consideration of the renewal of each fund's Advisory Contracts, including the services and support provided to each fund and its shareholders. The Board has established various standing committees (Committees), each composed of and chaired by Independent Trustees with varying backgrounds, to which the Board has assigned specific subject matter responsibilities in order to enhance effective decision-making by the Board. The Board, acting directly and through its Committees, requests and receives information concerning the annual consideration of the renewal of each fund's Advisory Contracts. The Board also meets as needed to review matters specifically related to the Board's annual consideration of the renewal of the Advisory Contracts. Members of the Board may also meet with trustees of other Fidelity funds through joint ad hoc committees to discuss certain matters relevant to all of the Fidelity funds.
At its May 2022 meeting, the Board unanimously determined to renew each fund's Advisory Contracts. In reaching its determination, the Board considered all factors it believed relevant, including (i) the nature, extent, and quality of the services provided to each fund and its shareholders (including the investment performance of each fund); (ii) the competitiveness relative to peer funds of each fund's management fee and the total expense ratio of each fund; (iii) the total costs of the services provided by and the profits realized by Fidelity from its relationships with each fund; and (iv) the extent to which, if any, economies of scale exist and are realized as each fund grows, and whether any economies of scale are appropriately shared with fund shareholders.
In considering whether to renew the Advisory Contracts for each fund, the Board reached a determination, with the assistance of fund counsel and Independent Trustees' counsel and through the exercise of its business judgment, that the renewal of the Advisory Contracts was in the best interests of each fund and its shareholders and that the compensation payable under the Advisory Contracts was fair and reasonable. The Board's decision to renew the Advisory Contracts was not based on any single factor, but rather was based on a comprehensive consideration of all the information provided to the Board at its meetings throughout the year. The Board, in reaching its determination to renew the Advisory Contracts, was aware that shareholders of each fund have a broad range of investment choices available to them, including a wide choice among funds offered by Fidelity's competitors, and that each fund's shareholders, who have the opportunity to review and weigh the disclosure provided by the fund in its prospectus and other public disclosures, have chosen to invest in that fund, which is part of the Fidelity family of funds.
Nature, Extent, and Quality of Services Provided. The Board considered Fidelity's staffing as it relates to the funds, including the backgrounds of investment personnel of Fidelity, and also considered the funds' investment objectives, strategies, and related investment philosophies. The Independent Trustees also had discussions with senior management of Fidelity's investment operations and investment groups. The Board considered the structure of the investment personnel compensation program and whether this structure provides appropriate incentives to act in the best interests of each fund. Additionally, the Board considered the portfolio managers' investments, if any, in the funds that they manage. The Board also considered the steps Fidelity had taken to ensure the continued provision of high quality services to the Fidelity funds during the COVID-19 pandemic, including the expansion of staff in client facing positions to maintain service levels in periods of high volumes and volatility.
Resources Dedicated to Investment Management and Support Services. The Board and the Fund Oversight and Research Committees reviewed the general qualifications and capabilities of Fidelity's investment staff, including its size, education, experience, and resources, as well as Fidelity's approach to recruiting, training, managing, and compensating investment personnel. The Board noted the resources devoted to expansion of Fidelity's global investment organization and that Fidelity's analysts have extensive resources, tools and capabilities that allow them to conduct sophisticated quantitative and fundamental analysis, as well as credit analysis of issuers, counterparties and guarantors. Further, the Board considered that Fidelity's investment professionals have sufficient access to global information and data so as to provide competitive investment results over time, and that those professionals also have access to sophisticated tools that permit them to assess portfolio construction and risk and performance attribution characteristics continuously, as well as to transmit new information and research conclusions rapidly around the world. Additionally, in its deliberations, the Board considered Fidelity's trading, risk management, compliance, and technology and operations capabilities and resources, which are integral parts of the investment management process.
Shareholder and Administrative Services. The Board considered (i) the nature, extent, quality, and cost of advisory, administrative, and shareholder services performed by the Investment Advisers and their affiliates under the Advisory Contracts and under separate agreements covering transfer agency, pricing and bookkeeping, and securities lending services for each fund; (ii) the nature and extent of the supervision of third party service providers, principally custodians, subcustodians, and pricing vendors; and (iii) the resources devoted to, and the record of compliance with, each fund's compliance policies and procedures. The Board also reviewed the allocation of fund brokerage, including allocations to brokers affiliated with the Investment Advisers, the use of brokerage commissions to pay fund expenses, and the use of "soft" commission dollars to pay for research services.
The Board noted that the growth of fund assets over time across the complex allows Fidelity to reinvest in the development of services designed to enhance the value and convenience of the Fidelity funds as investment vehicles. These services include 24-hour access to account information and market information over the Internet and through telephone representatives, investor education materials and asset allocation tools. The Board also considered that it reviews customer service metrics such as telephone response times, continuity of services on the website and metrics addressing services at Fidelity Investor Centers.
Investment in a Large Fund Family. The Board considered the benefits to shareholders of investing in a Fidelity fund, including the benefits of investing in a fund that is part of a large family of funds offering a variety of investment disciplines and providing a large variety of mutual fund investor services. The Board noted that Fidelity had taken, or had made recommendations that resulted in the Fidelity funds taking, a number of actions over the previous year that benefited particular funds, including: (i) continuing to dedicate additional resources to Fidelity's investment research process, which includes meetings with management of issuers of securities in which the funds invest; (ii) continuing efforts to enhance Fidelity's global research capabilities; (iii) launching new funds and ETFs with innovative structures, strategies and pricing and making other enhancements to meet client needs; (iv) launching new share classes of existing funds; (v) eliminating purchase minimums and broadening eligibility requirements for certain funds and share classes; (vi) reducing management fees and total expenses for certain target date funds and classes and index funds; (vii) lowering expenses for certain existing funds and classes by implementing or lowering expense caps; (vii) rationalizing product lines and gaining increased efficiencies from fund mergers and liquidations; (ix) continuing to develop, acquire and implement systems and technology to improve services to the funds and shareholders, strengthen information security, and increase efficiency; and (x) continuing to implement enhancements to further strengthen Fidelity's product line to increase investors' probability of success in achieving their investment goals, including retirement income goals.
Investment Performance. The Board considered whether each fund has operated in accordance with its investment objective, as well as its record of compliance with its investment restrictions and its performance history. The Board noted that the Fidelity Environment and Alternative Energy Fund had portfolio manager changes in July 2021 and August 2021 and the Fidelity Natural Resources Fund had a portfolio manager change in January 2021. The Board will continue to monitor closely the funds' performance, taking into account the portfolio manager changes.
The Board took into account discussions that occur at Board meetings throughout the year with representatives of the Investment Advisers about fund investment performance. In this regard the Board noted that as part of regularly scheduled fund reviews and other reports to the Board on fund performance, the Board considers annualized return information for each fund for different time periods, measured against an appropriate securities market index (benchmark index). The Board also reviews and considers information about performance attribution. In its evaluation of fund investment performance, the Board gave particular attention to information indicating changes in performance of certain Fidelity funds for specific time periods and discussed with the Investment Advisers the reasons for any overperformance or underperformance.
In addition to reviewing absolute and relative fund performance, the Independent Trustees periodically consider the appropriateness of fund performance metrics in evaluating the results achieved. In general, the Independent Trustees believe that fund performance should be evaluated based on net performance (after fees and expenses) of the fund compared to appropriate benchmark indices, over appropriate time periods that may include full market cycles, taking into account relevant factors including the following: general market conditions; issuer-specific information; and fund cash flows and other factors.
The Independent Trustees recognize that shareholders evaluate performance on a net basis over their own holding periods, for which one-, three-, and five-year periods are often used as a proxy. For this reason, the performance information reviewed by the Board also included net cumulative total return information for each fund and an appropriate benchmark index for the most recent one-, three-, and five-year periods ended September 30, 2021, as shown below.
Fidelity Environment and Alternative Energy Fund
Fidelity Natural Resources Fund
The Board considered the fund's underperformance for different time periods ended September 30, 2021 and for different time periods ended December 31, 2021 (which periods are not reflected in the chart above). The Board noted that the fund's underperformance has continued since the Board approved the management contract in January 2020 and May 2021. The Board's discussions with FMR regarding underperformance cover topics including, but not limited to: the longer-term track record of a fund's portfolio manager(s); broader trends in the market that may adversely impact a fund's performance; and attribution reports on contributors to the fund's underperformance. The Board engages with FMR on steps that might be taken to address a fund's underperformance. For a fund with underperformance over longer periods of time, the Board typically monitors the fund's performance more closely.
Based on its review, the Board concluded that the nature, extent, and quality of services provided to each fund under the Advisory Contracts should continue to benefit the shareholders of each fund.
Competitiveness of Management Fee and Total Expense Ratio. The Board considered each fund's management fee and total expense ratio compared to "mapped groups" of competitive funds and classes created for the purpose of facilitating the Trustees' competitive analysis of management fees and total expenses. Fidelity creates "mapped groups" by combining similar Lipper investment objective categories that have comparable investment mandates. For this purpose, all sector focused equity funds are grouped in the same mapped group. Combining Lipper investment objective categories aids the Board's management fee and total expense ratio comparisons by broadening the competitive group used for comparison.
Management Fee. The Board considered two proprietary management fee comparisons for the 12-month periods ended September 30 (June 30 for periods ended 2019 and 2018 and December 31 for periods prior to 2018) shown in basis points (BP) in the charts below. The group of Lipper funds used by the Board for management fee comparisons is referred to below as the "Total Mapped Group." The Total Mapped Group comparison focuses on a fund's standing in terms of gross management fees before expense reimbursements or caps relative to the total universe of funds with comparable investment mandates (i.e., sector equities), regardless of whether their management fee structures also are comparable. Funds with comparable management fee structures have similar management fee contractual arrangements (e.g., flat rate charged for advisory services, all-inclusive fee rate, etc.). "TMG %" represents the percentage of funds in the Total Mapped Group that had management fees that were lower than a fund's. For example, a hypothetical TMG % of 20% would mean that 80% of the funds in the Total Mapped Group had higher, and 20% had lower, management fees than a fund. The funds' actual TMG %s and the number of funds in the Total Mapped Group are in the charts below. The "Asset-Sized Peer Group" (ASPG) comparison focuses on a fund's standing relative to a subset of non-Fidelity funds within the Total Mapped Group that are similar in size and management fee structure. For example, if a fund is in the first quartile of the ASPG, the fund's management fee ranks in the least expensive or lowest 25% of funds in the ASPG. The ASPG represents at least 15% of the funds in the Total Mapped Group with comparable asset size and management fee structures, subject to a minimum of 50 funds (or all funds in the Total Mapped Group if fewer than 50). Additional information, such as the ASPG quartile in which a fund's management fee rate ranked, is also included in the charts and was considered by the Board.
Fidelity Environment and Alternative Energy Fund
Fidelity Natural Resources Fund
The Board noted that each fund's management fee rate ranked below the median of its Total Mapped Group and below the median of its ASPG for the 12-month period ended September 30, 2021.
The Board also considered that, for funds subject to the group fee, FMR agreed to voluntarily waive fees over a specified period of time in amounts designed to account for assets converted from certain funds to certain collective investment trusts.
Based on its review, the Board concluded that each fund's management fee is fair and reasonable in light of the services that the fund receives and the other factors considered.
Total Expense Ratio. In its review of each fund's total expense ratio, the Board considered the fund's management fee rate as well as other fund expenses, such as transfer agent fees, pricing and bookkeeping fees, and custodial, legal, and audit fees. The Board also noted that Fidelity may agree to waive fees or reimburse expenses from time to time, and the extent to which, if any, it has done so for each fund. Each fund is compared to those funds and classes in the Total Mapped Group (used by the Board for management fee comparisons) that have a similar sales load structure. The Board also considered a total expense ASPG comparison for each fund, which focuses on the total expenses of the fund relative to a subset of non-Fidelity funds within the total expense similar sales load structure group. The total expense ASPG is limited to 15 larger and 15 smaller classes in fund average assets for a total of 30 classes, where possible. The total expense ASPG comparison excludes performance adjustments and fund-paid 12b-1 fees to eliminate variability in fee structures.
The Board noted that each fund's total net expense ratio ranked below the similar sales load structure group competitive median and below the ASPG competitive median for the 12-month period ended September 30, 2021.
Fees Charged to Other Fidelity Clients. The Board also considered Fidelity fee structures and other information with respect to clients of Fidelity, such as other funds advised or subadvised by Fidelity, pension plan clients, and other institutional clients with similar mandates. The Board noted that a joint ad hoc committee created by it and the boards of other Fidelity funds periodically reviews and compares Fidelity's institutional investment advisory business with its business of providing services to the Fidelity funds and also noted the most recent findings of the committee. The Board noted that the committee's review included a consideration of the differences in services provided, fees charged, and costs incurred, as well as competition in the markets serving the different categories of clients.
Based on its review of total expense ratios and fees charged to other Fidelity clients, the Board concluded that each fund's total expense ratio was reasonable in light of the services that the fund and its shareholders receive and the other factors considered.
Costs of the Services and Profitability. The Board considered the revenues earned and the expenses incurred by Fidelity in conducting the business of developing, marketing, distributing, managing, administering and servicing each fund and servicing each fund's shareholders. The Board also considered the level of Fidelity's profits in respect of all the Fidelity funds.
On an annual basis, Fidelity presents to the Board information about the profitability of its relationships with each fund. Fidelity calculates profitability information for each fund, as well as aggregate profitability information for groups of Fidelity funds and all Fidelity funds, using a series of detailed revenue and cost allocation methodologies which originate with the books and records of Fidelity on which Fidelity's audited financial statements are based. The Audit Committee of the Board reviews any significant changes from the prior year's methodologies and the full Board approves such changes.
A public accounting firm has been engaged annually by the Board as part of the Board's assessment of Fidelity's profitability analysis. The engagement includes the review and assessment of the methodologies used by Fidelity in determining the revenues and expenses attributable to Fidelity's mutual fund business, and completion of agreed-upon procedures in respect of the mathematical accuracy of certain fund profitability information and its conformity to established allocation methodologies. After considering the reports issued under the engagement and information provided by Fidelity, the Board concluded that while other allocation methods may also be reasonable, Fidelity's profitability methodologies are reasonable in all material respects.
The Board also reviewed Fidelity's non-fund businesses and potential indirect benefits such businesses may have received as a result of their association with Fidelity's mutual fund business (i.e., fall-out benefits) as well as cases where Fidelity's affiliates may benefit from the funds' business. The Board considered areas where potential indirect benefits to the Fidelity funds from their relationships with Fidelity may exist. The Board's consideration of these matters was informed by the findings of a joint ad hoc committee created by it and the boards of other Fidelity funds to evaluate potential fall-out benefits.
The Board considered the costs of the services provided by and the profits realized by Fidelity in connection with the operation of each fund and was satisfied that the profitability was not excessive.
Economies of Scale. The Board considered whether there have been economies of scale in respect of the management of the Fidelity funds, whether the Fidelity funds (including each fund) have appropriately benefited from any such economies of scale, and whether there is potential for realization of any further economies of scale. The Board considered the extent to which each fund will benefit from economies of scale as assets grow through increased services to the fund, through waivers or reimbursements, or through fee or expense ratio reductions. The Board also noted that a committee (the Economies of Scale Committee) created by it and the boards of other Fidelity funds periodically analyzes whether Fidelity attains economies of scale in respect of the management and servicing of the Fidelity funds, whether the Fidelity funds have appropriately benefited from such economies of scale, and whether there is potential for realization of any further economies of scale.
The Board recognized that each fund's management contract incorporates a "group fee" structure, which provides for lower group fee rates as total "group assets" increase, and for higher group fee rates as total "group assets" decrease ("group assets" as defined in the management contracts). FMR calculates the group fee rates based on a tiered asset "breakpoint" schedule that varies based on asset class. The Board considered that the group fee is designed to deliver the benefits of economies of scale to fund shareholders when total Fidelity fund assets increase, even if assets of any particular fund are unchanged or have declined, because some portion of Fidelity's costs are attributable to services provided to all Fidelity funds, and all funds benefit if those costs can be allocated among more assets. The Board further considered that Fidelity agreed to impose a temporary fee waiver in the form of additional breakpoints to the current breakpoint schedule. The Board concluded that, given the group fee structure, fund shareholders will benefit from lower management fees as "group assets" increase at the fund complex level, regardless of whether Fidelity achieves any such economies of scale.
The Board concluded, taking into account the analysis of the Economies of Scale Committee, that economies of scale, if any, are being appropriately shared between fund shareholders and Fidelity.
Additional Information Requested by the Board. In order to develop fully the factual basis for consideration of the Fidelity funds' advisory contracts, the Board requested and received additional information on certain topics, including: (i) fund flow and performance trends, in particular the underperformance of certain funds and strategies, and Fidelity's long-term strategies for certain funds, including any consideration of fund liquidations or mergers; (ii) the operation of performance fees, competitor use of performance fees, and consideration of the expansion of performance fees to additional funds; (iii) Fidelity's pricing philosophy compared to competitors; (iv) fund profitability methodology and data; (v) evaluation of competitive fund data and peer group classifications and fee and expense comparisons; (vi) the management fee and expense structures for different funds and classes and information about the differences between various fee and expense structures; (vii) group fee breakpoints and related voluntary fee waivers; and (viii) information regarding other accounts managed by Fidelity and the funds' sub-advisory arrangements.
Based on its evaluation of all of the conclusions noted above, and after considering all factors it believed relevant, the Board concluded that the advisory fee arrangements are fair and reasonable and that each fund's Advisory Contracts should be renewed.
1.9901476.101
EAE-NRF-SANN-1022
Item 2.
Code of Ethics
Not applicable.
Item 3.
Audit Committee Financial Expert
Not applicable.
Item 4.
Principal Accountant Fees and Services
Not applicable.
Item 5.
Audit Committee of Listed Registrants
Not applicable.
Item 6.
Investments
(a)
Not applicable.
(b)
Not applicable
Item 7.
Disclosure of Proxy Voting Policies and Procedures for Closed-End Management Investment Companies
Not applicable.
Item 8.
Portfolio Managers of Closed-End Management Investment Companies
Not applicable.
Item 9.
Purchase of Equity Securities by Closed-End Management Investment Company and Affiliated Purchasers
Not applicable.
Item 10.
Submission of Matters to a Vote of Security Holders
There were no material changes to the procedures by which shareholders may recommend nominees to the Fidelity Select Portfolios’s Board of Trustees.
Item 11.
Controls and Procedures
(a)(i) The President and Treasurer and the Chief Financial Officer have concluded that the Fidelity Select Portfolios’s (the “Trust”) disclosure controls and procedures (as
defined in Rule 30a-3(c) under the Investment Company Act) provide reasonable assurances that material information relating to the Trust is made known to them by the appropriate persons, based on their evaluation of these controls and procedures as of a date within 90 days of the filing date of this report.
(a)(ii) There was no change in the Trust’s internal control over financial reporting (as defined in Rule 30a-3(d) under the Investment Company Act) that occurred during the period covered by this report that has materially affected, or is reasonably likely to materially affect, the Trust’s internal control over financial reporting.
Item 12.
Disclosure of Securities Lending Activities for Closed-End Management
Investment Companies
Not applicable.
Item 13.
Exhibits
SIGNATURES
Pursuant to the requirements of the Securities Exchange Act of 1934 and the Investment Company Act of 1940, the registrant has duly caused this report to be signed on its behalf by the undersigned, thereunto duly authorized.
Fidelity Select Portfolios
| |
By: | /s/Stacie M. Smith |
| Stacie M. Smith |
| President and Treasurer |
|
|
Date: | October 20, 2022 |
Pursuant to the requirements of the Securities Exchange Act of 1934 and the Investment Company Act of 1940, this report has been signed below by the following persons on behalf of the registrant and in the capacities and on the dates indicated.
| |
By: | /s/Stacie M. Smith |
| Stacie M. Smith |
| President and Treasurer |
|
|
Date: | October 20, 2022 |
| |
By: | /s/John J. Burke III |
| John J. Burke III |
| Chief Financial Officer |
|
|
Date: | October 20, 2022 |