UNITED STATES
SECURITIES AND EXCHANGE COMMISSION
Washington, D.C. 20549
FORM N-CSR
CERTIFIED SHAREHOLDER REPORT OF REGISTERED
MANAGEMENT INVESTMENT COMPANIES
Investment Company Act file number 811-03114
Fidelity Select Portfolios
(Exact name of registrant as specified in charter)
245 Summer St., Boston, Massachusetts 02210
(Address of principal executive offices) (Zip code)
Margaret Carey, Secretary
245 Summer St.
Boston, Massachusetts 02210
(Name and address of agent for service)
Registrant's telephone number, including area code:
617-563-7000
| |
Date of fiscal year end: | February 28 |
|
|
Date of reporting period: | February 28, 2023 |
Item 1.
Reports to Stockholders
Fidelity® Select Portfolios®
Materials Sector
Chemicals Portfolio
Gold Portfolio
Materials Portfolio
Annual Report
February 28, 2023
Includes Fidelity and Fidelity Advisor share classes
Contents
To view a fund's proxy voting guidelines and proxy voting record for the 12-month period ended June 30, visit http://www.fidelity.com/proxyvotingresults or visit the Securities and Exchange Commission's (SEC) web site at http://www.sec.gov.
You may also call 1-800-544-8544 if you're an individual investing directly with Fidelity, call 1-800-835-5092 if you're a plan sponsor or participant with Fidelity as your recordkeeper or call 1-877-208-0098 on institutional accounts or if you're an advisor or invest through one to request a free copy of the proxy voting guidelines.
Standard & Poor's, S&P and S&P 500 are registered service marks of The McGraw-Hill Companies, Inc. and have been licensed for use by Fidelity Distributors Corporation.
Other third-party marks appearing herein are the property of their respective owners.
All other marks appearing herein are registered or unregistered trademarks or service marks of FMR LLC or an affiliated company. © 2023 FMR LLC. All rights reserved.
This report and the financial statements contained herein are submitted for the general information of the shareholders of the Funds. This report is not authorized for distribution to prospective investors in the Funds unless preceded or accompanied by an effective prospectus.
A fund files its complete schedule of portfolio holdings with the SEC for the first and third quarters of each fiscal year on Form N-PORT. Forms N-PORT are available on the SEC's web site at http://www.sec.gov. A fund's Forms N-PORT may be reviewed and copied at the SEC's Public Reference Room in Washington, DC. Information regarding the operation of the SEC's Public Reference Room may be obtained by calling 1-800-SEC-0330.
For a complete list of a fund's portfolio holdings, view the most recent holdings listing, semiannual report, or annual report on Fidelity's web site at http://www.fidelity.com, http://www.institutional.fidelity.com, or http://www.401k.com, as applicable.
NOT FDIC INSURED •MAY LOSE VALUE •NO BANK GUARANTEE
Neither the Funds nor Fidelity Distributors Corporation is a bank.
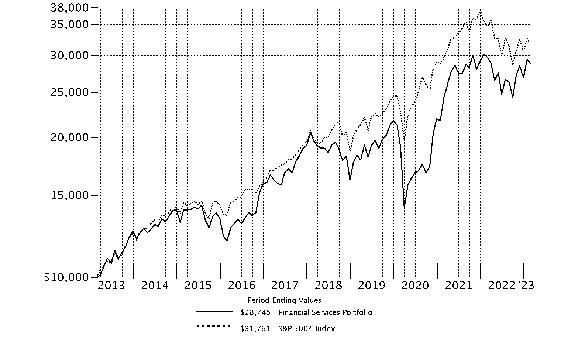
Average annual total return reflects the change in the value of an investment, assuming reinvestment of distributions from dividend income and capital gains (the profits earned upon the sale of securities that have grown in value, if any) and assuming a constant rate of performance each year. The hypothetical investment and the average annual total returns do not reflect the deduction of taxes that a shareholder would pay on fund distributions or the redemption of fund shares. During periods of reimbursement by Fidelity, a fund's total return will be greater than it would be had the reimbursement not occurred. How a fund did yesterday is no guarantee of how it will do tomorrow.
| Average Annual Total Returns |
| | | | |
Periods ended February 28, 2023 | Past 1 year | Past 5 years | Past 10 years |
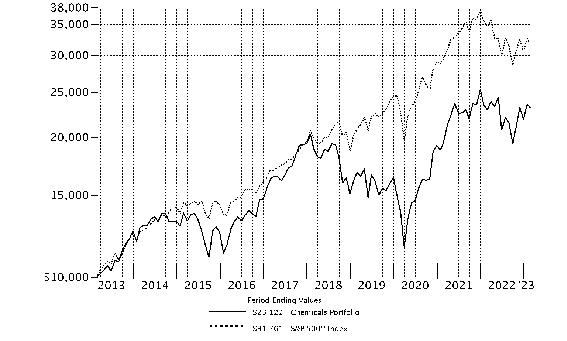
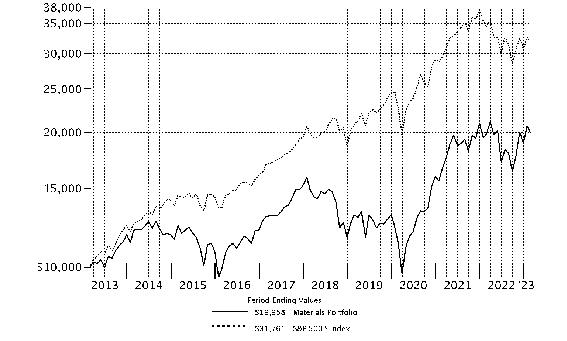
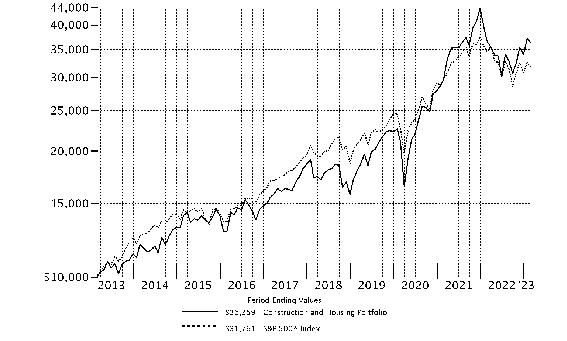
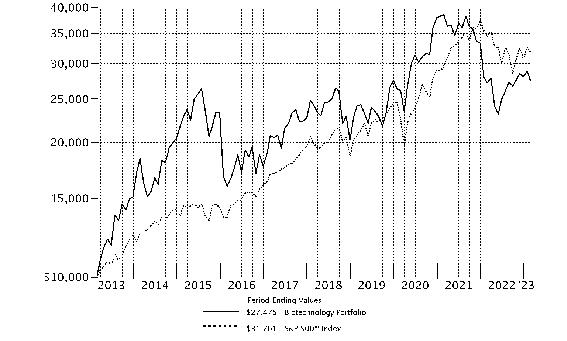
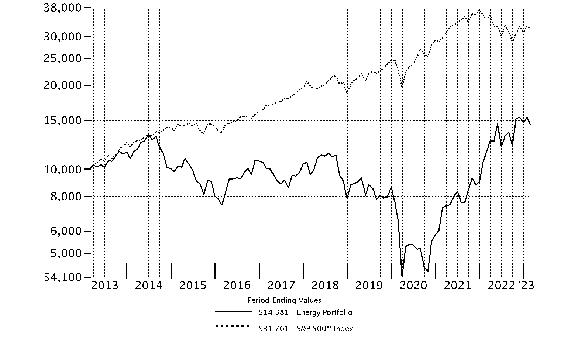
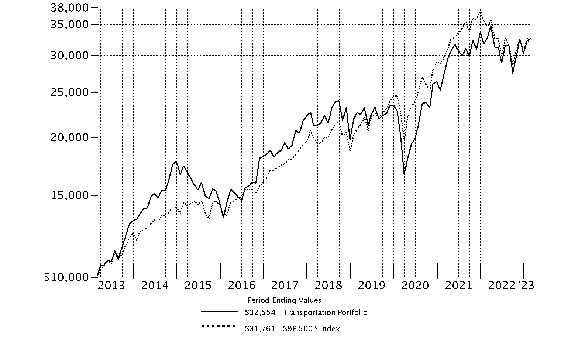
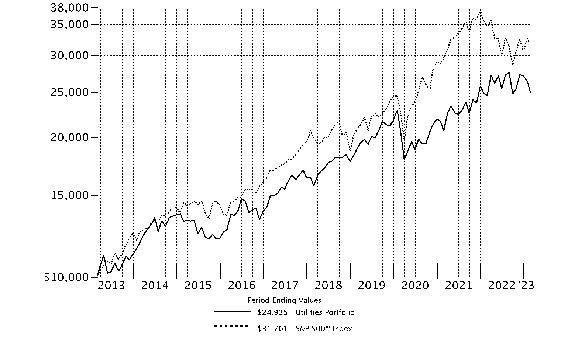
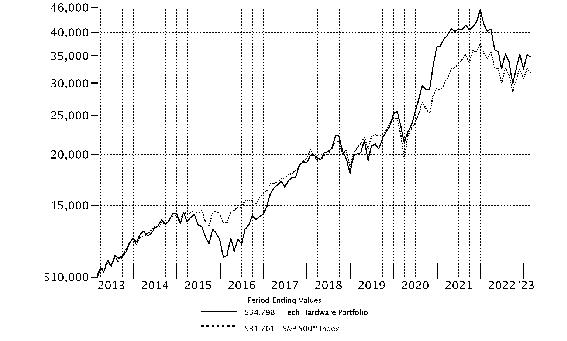
| Chemicals Portfolio | 1.09% | 4.16% | 8.74% |
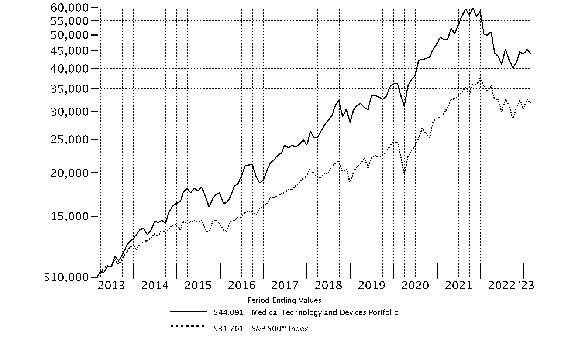
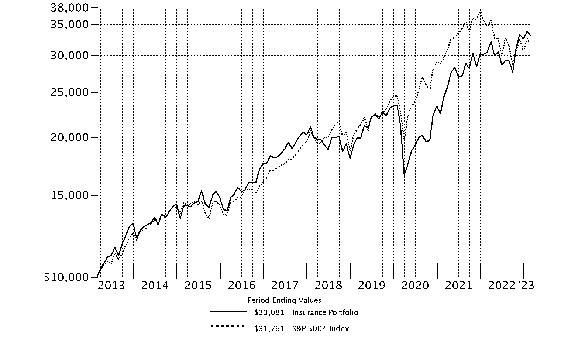
| $10,000 Over 10 Years |
| |
Let's say hypothetically that $10,000 was invested in Chemicals Portfolio on February 28, 2013. The chart shows how the value of your investment would have changed, and also shows how the S&P 500® Index performed over the same period. |
|
|
Chemicals Portfolio
Market Recap:
U.S. equities returned -7.69% for the 12 months ending February 28, 2023, according to the S&P 500 ® index. The new year began with an encouraging upturn in January (+6.28%), but stocks lost momentum in February (-2.44%) amid higher-than-expected inflation and strong jobs data. Investors took these as signs that the economy continued to run hot, even after a year of historic policy adjustment by the Federal Reserve aimed at cooling economic growth. Record inflation in 2022 prompted the Fed to aggressively tighten monetary policy, and market interest rates eclipsed their highest level in a decade, stoking recession fears and sending stocks into bear market territory. Since March 2022, the central bank has hiked its benchmark rate eight times, by 4.5 percentage points - the fastest-ever pace of monetary tightening - while also shrinking its massive asset portfolio. The latest bump came on February 2, along with a signal that the Fed plans to lift rates in March while it considers whether and when to pause increases. Against this dynamic backdrop, stocks struggled to gain traction until a strong rally ignited heading into the summer. But in September, the index returned -9.21%, one of its worst monthly results ever, before advancing 7.56% in Q4, as risky assets regained favor. For the full 12 months, value stocks handily outpaced growth. The headwind for the latter was most pronounced in the growth-oriented communication services (-25%) and consumer discretionary (-18%) sectors. In sharp contrast, energy gained 24%.
Comments from Portfolio Manager David Wagner:
For the fiscal year ending February 28, 2023, the fund gained 1.09%, trailing the 4.27% advance of the MSCI U.S. IMI Chemicals 25/50 Linked Index, but outperforming the broad-based S&P 500 ® index. Versus the industry index, security selection was the primary detractor, especially within specialty chemicals. Stock selection in commodity chemicals and an overweighting in fertilizers & agricultural chemicals also hampered the fund's relative result. The fund's largest individual relative detractor was our lighter-than-index stake in Air Products & Chemicals, which gained 24% the past 12 months. The company was among our biggest holdings, and we increased the position. Also hampering performance was our overweighting in Huntsman, which returned roughly -34%. Huntsman was not held at period end. Also holding back performance was our overweighting in Element Solutions, which returned -15%. Conversely, the largest contributor to performance versus the industry index was an underweighting in specialty chemicals. Stock selection in fertilizers & agricultural chemicals and an overweighting in industrial gases also helped the fund's relative result. The fund's largest individual relative contributor was an outsized stake in Orion Engineered Carbons, which gained 64% the past year. Also lifting performance was our overweighting in Linde, which gained about 20%. The company was the fund's largest holding. Another notable relative contributor was an outsized stake in Chemours (+28%), which was one of our biggest holdings at period end. Notable changes in positioning include increased exposure to the commodity chemicals subindustry and a lower allocation to diversified chemicals.
The views expressed above reflect those of the portfolio manager(s) only through the end of the period as stated on the cover of this report and do not necessarily represent the views of Fidelity or any other person in the Fidelity organization. Any such views are subject to change at any time based upon market or other conditions and Fidelity disclaims any responsibility to update such views. These views may not be relied on as investment advice and, because investment decisions for a Fidelity fund are based on numerous factors, may not be relied on as an indication of trading intent on behalf of any Fidelity fund.
Chemicals Portfolio
Top Holdings (% of Fund's net assets) |
| |
| Linde PLC | 25.0 | |
| Air Products & Chemicals, Inc. | 8.5 | |
| Corteva, Inc. | 8.4 | |
| DuPont de Nemours, Inc. | 4.9 | |
| Celanese Corp. Class A | 4.8 | |
| Westlake Corp. | 4.8 | |
| FMC Corp. | 4.3 | |
| Olin Corp. | 3.8 | |
| LyondellBasell Industries NV Class A | 3.8 | |
| The Chemours Co. LLC | 3.6 | |
| | 71.9 | |
| |
| Industries (% of Fund's net assets) |
| |
| Chemicals | 98.9 | |
| |
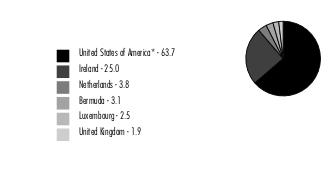
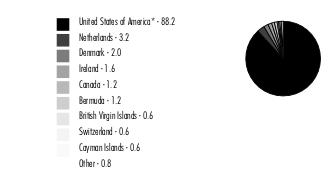
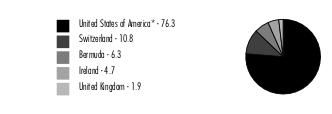
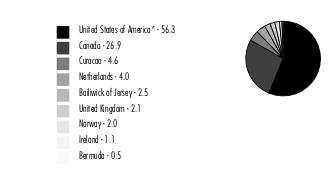
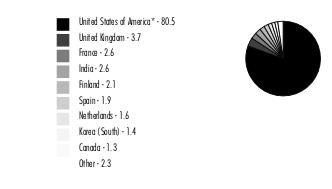
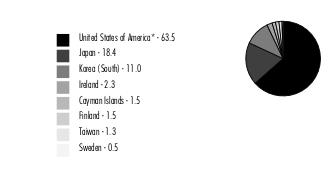
Geographic Diversification (% of Fund's net assets) |
|
* Includes Short-Term investments and Net Other Assets (Liabilities). Percentages are based on country or territory of incorporation and are adjusted for the effect of derivatives, if applicable. |
| |
Chemicals Portfolio
Showing Percentage of Net Assets
| Common Stocks - 98.9% |
| | | Shares | Value ($) |
| Chemicals - 98.9% | | | |
| Commodity Chemicals - 19.4% | | | |
| Cabot Corp. | | 220,700 | 17,552,271 |
| LyondellBasell Industries NV Class A | | 268,494 | 25,772,739 |
| Olin Corp. | | 448,500 | 25,900,875 |
| Orion Engineered Carbons SA | | 672,126 | 17,139,213 |
| Tronox Holdings PLC | | 828,269 | 12,920,996 |
| Westlake Corp. (a) | | 272,856 | 32,508,064 |
| | | | 131,794,158 |
| Diversified Chemicals - 3.6% | | | |
| The Chemours Co. LLC | | 717,959 | 24,539,839 |
| Fertilizers & Agricultural Chemicals - 16.4% | | | |
| CF Industries Holdings, Inc. | | 148,517 | 12,756,125 |
| Corteva, Inc. | | 916,793 | 57,107,036 |
| FMC Corp. | | 227,300 | 29,355,795 |
| The Mosaic Co. | | 229,000 | 12,180,510 |
| | | | 111,399,466 |
| Industrial Gases - 33.5% | | | |
| Air Products & Chemicals, Inc. | | 202,811 | 57,999,890 |
| Linde PLC | | 486,016 | 169,313,394 |
| | | | 227,313,284 |
| Specialty Chemicals - 26.0% | | | |
| Albemarle Corp. | | 74,600 | 18,971,526 |
| Axalta Coating Systems Ltd. (b) | | 709,600 | 21,146,080 |
| Celanese Corp. Class A | | 281,100 | 32,672,253 |
| DuPont de Nemours, Inc. | | 459,094 | 33,527,635 |
| Ecolab, Inc. | | 107,200 | 17,084,464 |
| Element Solutions, Inc. | | 776,443 | 15,948,139 |
| International Flavors & Fragrances, Inc. (a) | | 85,616 | 7,979,411 |
| Livent Corp. (a)(b) | | 200 | 4,690 |
| PPG Industries, Inc. | | 38,900 | 5,137,134 |
| Sherwin-Williams Co. | | 105,999 | 23,462,879 |
| | | | 175,934,211 |
| TOTAL COMMON STOCKS (Cost $419,011,180) | | | 670,980,958 |
| | | | |
| Money Market Funds - 6.5% |
| | | Shares | Value ($) |
| Fidelity Cash Central Fund 4.63% (c) | | 2,631,044 | 2,631,570 |
| Fidelity Securities Lending Cash Central Fund 4.63% (c)(d) | | 41,322,193 | 41,326,325 |
| TOTAL MONEY MARKET FUNDS (Cost $43,957,895) | | | 43,957,895 |
| | | | |
| TOTAL INVESTMENT IN SECURITIES - 105.4% (Cost $462,969,075) | 714,938,853 |
NET OTHER ASSETS (LIABILITIES) - (5.4)% | (36,829,759) |
| NET ASSETS - 100.0% | 678,109,094 |
| | |
Legend
| (a) | Security or a portion of the security is on loan at period end. |
| (c) | Affiliated fund that is generally available only to investment companies and other accounts managed by Fidelity Investments. The rate quoted is the annualized seven-day yield of the fund at period end. A complete unaudited listing of the fund's holdings as of its most recent quarter end is available upon request. In addition, each Fidelity Central Fund's financial statements, which are not covered by the Fund's Report of Independent Registered Public Accounting Firm, are available on the SEC's website or upon request. |
| (d) | Investment made with cash collateral received from securities on loan. |
Affiliated Central Funds
Fiscal year to date information regarding the Fund's investments in Fidelity Central Funds, including the ownership percentage, is presented below.
| Affiliate | Value, beginning of period ($) | Purchases ($) | Sales Proceeds ($) | Dividend Income ($) | Realized Gain (loss) ($) | Change in Unrealized appreciation (depreciation) ($) | Value, end of period ($) | % ownership, end of period |
| Fidelity Cash Central Fund 4.63% | 1,042,443 | 148,771,348 | 147,182,221 | 376,790 | - | - | 2,631,570 | 0.0% |
| Fidelity Securities Lending Cash Central Fund 4.63% | 2,247,252 | 145,594,708 | 106,515,635 | 7,624 | - | - | 41,326,325 | 0.1% |
| Total | 3,289,695 | 294,366,056 | 253,697,856 | 384,414 | - | - | 43,957,895 | |
| | | | | | | | | |
Amounts in the dividend income column in the above table include any capital gain distributions from underlying funds, which are presented in the corresponding line item in the Statement of Operations, if applicable.
Amount for Fidelity Securities Lending Cash Central Fund represents the income earned on investing cash collateral, less rebates paid to borrowers and any lending agent fees associated with the loan, plus any premium payments received for lending certain types of securities.
Amounts included in the purchases and sales proceeds columns may include in-kind transactions, if applicable.
Investment Valuation
The following is a summary of the inputs used, as of February 28, 2023, involving the Fund's assets and liabilities carried at fair value. The inputs or methodology used for valuing securities may not be an indication of the risk associated with investing in those securities. For more information on valuation inputs, and their aggregation into the levels used below, please refer to the Investment Valuation section in the accompanying Notes to Financial Statements.
| Valuation Inputs at Reporting Date: |
| Description | Total ($) | Level 1 ($) | Level 2 ($) | Level 3 ($) |
Investments in Securities: | | | | |
|
| Common Stocks | 670,980,958 | 670,980,958 | - | - |
|
| Money Market Funds | 43,957,895 | 43,957,895 | - | - |
| Total Investments in Securities: | 714,938,853 | 714,938,853 | - | - |
Chemicals Portfolio
| Statement of Assets and Liabilities |
| | | | February 28, 2023 |
| | | | | |
| Assets | | | | |
| Investment in securities, at value (including securities loaned of $39,941,579) - See accompanying schedule: | | | | |
Unaffiliated issuers (cost $419,011,180) | $ | 670,980,958 | | |
Fidelity Central Funds (cost $43,957,895) | | 43,957,895 | | |
| | | | | |
| | | | | |
| Total Investment in Securities (cost $462,969,075) | | | $ | 714,938,853 |
| Receivable for investments sold | | | | 6,068,859 |
| Receivable for fund shares sold | | | | 106,376 |
| Dividends receivable | | | | 1,349,688 |
| Distributions receivable from Fidelity Central Funds | | | | 33,162 |
| Prepaid expenses | | | | 4,988 |
| Other receivables | | | | 141,795 |
Total assets | | | | 722,643,721 |
| Liabilities | | | | |
| Payable for investments purchased | $ | 2,477,027 | | |
| Payable for fund shares redeemed | | 141,943 | | |
| Accrued management fee | | 296,781 | | |
| Other affiliated payables | | 117,593 | | |
| Other payables and accrued expenses | | 174,958 | | |
| Collateral on securities loaned | | 41,326,325 | | |
| Total Liabilities | | | | 44,534,627 |
| Net Assets | | | $ | 678,109,094 |
| Net Assets consist of: | | | | |
| Paid in capital | | | $ | 420,461,913 |
| Total accumulated earnings (loss) | | | | 257,647,181 |
| Net Assets | | | $ | 678,109,094 |
Net Asset Value , offering price and redemption price per share ($678,109,094 ÷ 43,948,589 shares) | | | $ | 15.43 |
| Statement of Operations |
| | | | Year ended February 28, 2023 |
| Investment Income | | | | |
| Dividends | | | $ | 11,504,338 |
| Income from Fidelity Central Funds (including $7,624 from security lending) | | | | 384,414 |
| Total Income | | | | 11,888,752 |
| Expenses | | | | |
| Management fee | $ | 3,669,372 | | |
| Transfer agent fees | | 1,232,002 | | |
| Accounting fees | | 230,856 | | |
| Custodian fees and expenses | | 7,452 | | |
| Independent trustees' fees and expenses | | 2,392 | | |
| Registration fees | | 27,058 | | |
| Audit | | 48,685 | | |
| Legal | | 593 | | |
| Miscellaneous | | 5,668 | | |
| Total expenses before reductions | | 5,224,078 | | |
| Expense reductions | | (24,670) | | |
| Total expenses after reductions | | | | 5,199,408 |
| Net Investment income (loss) | | | | 6,689,344 |
| Realized and Unrealized Gain (Loss) | | | | |
| Net realized gain (loss) on: | | | | |
| Investment Securities: | | | | |
| Unaffiliated issuers | | 48,437,834 | | |
| Foreign currency transactions | | (22,734) | | |
| Total net realized gain (loss) | | | | 48,415,100 |
| Change in net unrealized appreciation (depreciation) on: | | | | |
| Investment Securities: | | | | |
| Unaffiliated issuers | | (52,566,540) | | |
| Assets and liabilities in foreign currencies | | (19,547) | | |
| Total change in net unrealized appreciation (depreciation) | | | | (52,586,087) |
| Net gain (loss) | | | | (4,170,987) |
| Net increase (decrease) in net assets resulting from operations | | | $ | 2,518,357 |
| Statement of Changes in Net Assets |
| |
| | Year ended February 28, 2023 | | Year ended February 28, 2022 |
| Increase (Decrease) in Net Assets | | | | |
| Operations | | | | |
| Net investment income (loss) | $ | 6,689,344 | $ | 6,746,277 |
| Net realized gain (loss) | | 48,415,100 | | 54,079,063 |
| Change in net unrealized appreciation (depreciation) | | (52,586,087) | | 56,407,256 |
| Net increase (decrease) in net assets resulting from operations | | 2,518,357 | | 117,232,596 |
| Distributions to shareholders | | (71,422,793) | | (9,969,040) |
| Share transactions | | | | |
| Proceeds from sales of shares | | 27,760,569 | | 88,405,055 |
| Reinvestment of distributions | | 67,243,473 | | 9,337,590 |
| Cost of shares redeemed | | (106,890,154) | | (146,786,766) |
Net increase (decrease) in net assets resulting from share transactions | | (11,886,112) | | (49,044,121) |
| Total increase (decrease) in net assets | | (80,790,548) | | 58,219,435 |
| | | | | |
| Net Assets | | | | |
| Beginning of period | | 758,899,642 | | 700,680,207 |
| End of period | $ | 678,109,094 | $ | 758,899,642 |
| | | | | |
| Other Information | | | | |
| Shares | | | | |
| Sold | | 1,728,193 | | 5,113,175 |
| Issued in reinvestment of distributions | | 4,320,957 | | 520,200 |
| Redeemed | | (6,887,077) | | (8,619,384) |
| Net increase (decrease) | | (837,927) | | (2,986,009) |
| | | | | |
Financial Highlights
| Years ended February 28, | | 2023 | | 2022 | | 2021 | | 2020 A | | 2019 B |
Selected Per-Share Data | | | | | | | | | | |
| Net asset value, beginning of period | $ | 16.94 | $ | 14.67 | $ | 10.47 | $ | 13.57 | $ | 17.34 |
| Income from Investment Operations | | | | | | | | | | |
Net investment income (loss) C,D | | .15 | | .15 | | .15 | | .15 | | .23 |
| Net realized and unrealized gain (loss) | | .01 | | 2.34 | | 4.21 | | (2.39) | | (2.17) |
| Total from investment operations | | .16 | | 2.49 | | 4.36 | | (2.24) | | (1.94) |
| Distributions from net investment income | | (.16) | | (.14) | | (.16) | | (.20) | | (.21) |
| Distributions from net realized gain | | (1.51) | | (.08) | | - | | (.66) | | (1.62) |
| Total distributions | | (1.67) | | (.22) | | (.16) | | (.86) | | (1.83) |
| Net asset value, end of period | $ | 15.43 | $ | 16.94 | $ | 14.67 | $ | 10.47 | $ | 13.57 |
Total Return E | | 1.09% | | 16.90% | | 41.65% | | (17.63)% | | (11.10)% |
Ratios to Average Net Assets D,F,G | | | | | | | | | | |
| Expenses before reductions | | .75% | | .74% | | .79% | | .78% | | .77% |
| Expenses net of fee waivers, if any | | .75% | | .74% | | .79% | | .78% | | .77% |
| Expenses net of all reductions | | .75% | | .74% | | .78% | | .77% | | .76% |
| Net investment income (loss) | | .96% | | .85% | | 1.28% | | 1.21% | | 1.50% |
| Supplemental Data | | | | | | | | | | |
| Net assets, end of period (000 omitted) | $ | 678,109 | $ | 758,900 | $ | 700,680 | $ | 656,441 | $ | 1,153,379 |
Portfolio turnover rate H | | 54% | | 15% | | 50% | | 77% | | 62% |
A For the year ended February 29.
B Per share amounts have been adjusted to reflect the impact of the 10 for 1 share split that occurred on August 10, 2018.
C Calculated based on average shares outstanding during the period.
D Net investment income (loss) is affected by the timing of the declaration of dividends by any underlying mutual funds or exchange-traded funds (ETFs). Net investment income (loss) of any mutual funds or ETFs is not included in the Fund's net investment income (loss) ratio.
E Total returns would have been lower if certain expenses had not been reduced during the applicable periods shown.
F Fees and expenses of any underlying mutual funds or exchange-traded funds (ETFs) are not included in the Fund's expense ratio. The Fund indirectly bears its proportionate share of these expenses. For additional expense information related to investments in Fidelity Central Funds, please refer to the "Investments in Fidelity Central Funds" note found in the Notes to Financial Statements section of the most recent Annual or Semi-Annual report.
G Expense ratios reflect operating expenses of the class. Expenses before reductions do not reflect amounts reimbursed, waived, or reduced through arrangements with the investment adviser, brokerage services, or other offset arrangements, if applicable, and do not represent the amount paid by the class during periods when reimbursements, waivers or reductions occur.
H Amount does not include the portfolio activity of any underlying mutual funds or exchange-traded funds (ETFs).
For the period ended February 28, 2023
1. Organization.
Chemicals Portfolio (the Fund) is a non-diversified fund of Fidelity Select Portfolios (the Trust) and is authorized to issue an unlimited number of shares. Share transactions on the Statement of Changes in Net Assets may contain exchanges between affiliated funds. The Trust is registered under the Investment Company Act of 1940, as amended (the 1940 Act), as an open-end management investment company organized as a Massachusetts business trust. The Fund invests primarily in securities of companies whose principal business activities fall within specific industries.
2. Investments in Fidelity Central Funds.
Funds may invest in Fidelity Central Funds, which are open-end investment companies generally available only to other investment companies and accounts managed by the investment adviser and its affiliates. The Schedule of Investments lists any Fidelity Central Funds held as an investment as of period end, but does not include the underlying holdings of each Fidelity Central Fund. An investing fund indirectly bears its proportionate share of the expenses of the underlying Fidelity Central Funds.
Based on its investment objective, each Fidelity Central Fund may invest or participate in various investment vehicles or strategies that are similar to those of the investing fund. These strategies are consistent with the investment objectives of the investing fund and may involve certain economic risks which may cause a decline in value of each of the Fidelity Central Funds and thus a decline in the value of the investing fund.
| Fidelity Central Fund | Investment Manager | Investment Objective | Investment Practices | Expense Ratio A |
| Fidelity Money Market Central Funds | Fidelity Management & Research Company LLC (FMR) | Each fund seeks to obtain a high level of current income consistent with the preservation of capital and liquidity. | Short-term Investments | Less than .005% |
A Expenses expressed as a percentage of average net assets and are as of each underlying Central Fund's most recent annual or semi-annual shareholder report.
A complete unaudited list of holdings for each Fidelity Central Fund is available upon request or at the Securities and Exchange Commission website at www.sec.gov. In addition, the financial statements of the Fidelity Central Funds which contain the significant accounting policies (including investment valuation policies) of those funds, and are not covered by the Report of Independent Registered Public Accounting Firm, are available on the Securities and Exchange Commission website or upon request.
3. Significant Accounting Policies.
The Fund is an investment company and applies the accounting and reporting guidance of the Financial Accounting Standards Board (FASB) Accounting Standards Codification Topic 946 Financial Services - Investment Companies . The financial statements have been prepared in conformity with accounting principles generally accepted in the United States of America (GAAP), which require management to make certain estimates and assumptions at the date of the financial statements. Actual results could differ from those estimates. Subsequent events, if any, through the date that the financial statements were issued have been evaluated in the preparation of the financial statements. The Fund's Schedule of Investments lists any underlying mutual funds or exchange-traded funds (ETFs) but does not include the underlying holdings of these funds. The following summarizes the significant accounting policies of the Fund:
Investment Valuation. Investments are valued as of 4:00 p.m. Eastern time on the last calendar day of the period. The Board of Trustees (the Board) has designated the Fund's investment adviser as the valuation designee responsible for the fair valuation function and performing fair value determinations as needed. The investment adviser has established a Fair Value Committee (the Committee) to carry out the day-to-day fair valuation responsibilities and has adopted policies and procedures to govern the fair valuation process and the activities of the Committee. In accordance with these fair valuation policies and procedures, which have been approved by the Board, the Fund attempts to obtain prices from one or more third party pricing services or brokers to value its investments. When current market prices, quotations or currency exchange rates are not readily available or reliable, investments will be fair valued in good faith by the Committee, in accordance with the policies and procedures. Factors used in determining fair value vary by investment type and may include market or investment specific events, transaction data, estimated cash flows, and market observations of comparable investments. The frequency that the fair valuation procedures are used cannot be predicted and they may be utilized to a significant extent. The Committee manages the Fund's fair valuation practices and maintains the fair valuation policies and procedures. The Fund's investment adviser reports to the Board information regarding the fair valuation process and related material matters.
The Fund categorizes the inputs to valuation techniques used to value its investments into a disclosure hierarchy consisting of three levels as shown below:
Level 1 - unadjusted quoted prices in active markets for identical investments
Level 2 - other significant observable inputs (including quoted prices for similar investments, interest rates, prepayment speeds, etc.)
Level 3 - unobservable inputs (including the Fund's own assumptions based on the best information available)
Valuation techniques used to value the Fund's investments by major category are as follows:
Equity securities, including restricted securities, for which market quotations are readily available, are valued at the last reported sale price or official closing price as reported by a third party pricing service on the primary market or exchange on which they are traded and are categorized as Level 1 in the hierarchy. In the event there were no sales during the day or closing prices are not available, securities are valued at the last quoted bid price or may be valued using the last available price and are generally categorized as Level 2 in the hierarchy. For foreign equity securities, when market or security specific events arise, comparisons to the valuation of American Depositary Receipts (ADRs), futures contracts, ETFs and certain indexes as well as quoted prices for similar securities may be used and would be categorized as Level 2 in the hierarchy. For equity securities, including restricted securities, where observable inputs are limited, assumptions about market activity and risk are used and these securities may be categorized as Level 3 in the hierarchy.
Investments in open-end mutual funds, including the Fidelity Central Funds, are valued at their closing net asset value (NAV) each business day and are categorized as Level 1 in the hierarchy.
Changes in valuation techniques may result in transfers in or out of an assigned level within the disclosure hierarchy. The aggregate value of investments by input level as of February 28, 2023 is included at the end of the Fund's Schedule of Investments.
Foreign Currency. Certain Funds may use foreign currency contracts to facilitate transactions in foreign-denominated securities. Gains and losses from these transactions may arise from changes in the value of the foreign currency or if the counterparties do not perform under the contracts' terms.
Foreign-denominated assets, including investment securities, and liabilities are translated into U.S. dollars at the exchange rates at period end. Purchases and sales of investment securities, income and dividends received, and expenses denominated in foreign currencies are translated into U.S. dollars at the exchange rate in effect on the transaction date.
The effects of exchange rate fluctuations on investments are included with the net realized and unrealized gain (loss) on investment securities. Other foreign currency transactions resulting in realized and unrealized gain (loss) are disclosed separately.
Investment Transactions and Income. For financial reporting purposes, the Fund's investment holdings and NAV include trades executed through the end of the last business day of the period. The NAV per share for processing shareholder transactions is calculated as of the close of business of the New York Stock Exchange (NYSE), normally 4:00 p.m. Eastern time and includes trades executed through the end of the prior business day. Gains and losses on securities sold are determined on the basis of identified cost. Commissions paid to certain brokers with whom the investment adviser, or its affiliates, places trades on behalf of a fund include an amount in addition to trade execution, which may be rebated back to a fund. Any such rebates are included in net realized gain (loss) on investments in the Statement of Operations. Dividend income is recorded on the ex-dividend date, except for certain dividends from foreign securities where the ex-dividend date may have passed, which are recorded as soon as the Fund is informed of the ex-dividend date. Non-cash dividends included in dividend income, if any, are recorded at the fair market value of the securities received. Income and capital gain distributions from Fidelity Central Funds, if any, are recorded on the ex-dividend date. Certain distributions received by the Fund represent a return of capital or capital gain. The Fund determines the components of these distributions subsequent to the ex-dividend date, based upon receipt of tax filings or other correspondence relating to the underlying investment. These distributions are recorded as a reduction of cost of investments and/or as a realized gain. Investment income is recorded net of foreign taxes withheld where recovery of such taxes is uncertain. Funds may file withholding tax reclaims in certain jurisdictions to recover a portion of amounts previously withheld. Any withholding tax reclaims income is included in the Statement of Operations in dividends. Any receivables for withholding tax reclaims are included in the Statement of Assets and Liabilities in dividends receivable.
Expenses. Expenses directly attributable to a fund are charged to that fund. Expenses attributable to more than one fund are allocated among the respective funds on the basis of relative net assets or other appropriate methods. Expenses included in the accompanying financial statements reflect the expenses of that fund and do not include any expenses associated with any underlying mutual funds or exchange-traded funds. Although not included in a fund's expenses, a fund indirectly bears its proportionate share of these expenses through the net asset value of each underlying mutual fund or exchange-traded fund. Expense estimates are accrued in the period to which they relate and adjustments are made when actual amounts are known.
Deferred Trustee Compensation. Under a Deferred Compensation Plan (the Plan) for certain Funds, certain independent Trustees have elected to defer receipt of a portion of their annual compensation. Deferred amounts are invested in affiliated mutual funds, are marked-to-market and remain in a fund until distributed in accordance with the Plan. The investment of deferred amounts and the offsetting payable to the Trustees presented below are included in the accompanying Statement of Assets and Liabilities in other receivables and other payables and accrued expenses, as applicable.
| Chemicals Portfolio | $141,795 |
Income Tax Information and Distributions to Shareholders. Each year, the Fund intends to qualify as a regulated investment company under Subchapter M of the Internal Revenue Code, including distributing substantially all of its taxable income and realized gains. As a result, no provision for U.S. Federal income taxes is required. As of February 28, 2023, the Fund did not have any unrecognized tax benefits in the financial statements; nor is the Fund aware of any tax positions for which it is reasonably possible that the total amounts of unrecognized tax benefits will significantly change in the next twelve months. The Fund files a U.S. federal tax return, in addition to state and local tax returns as required. The Fund's federal income tax returns are subject to examination by the Internal Revenue Service (IRS) for a period of three fiscal years after they are filed. State and local tax returns may be subject to examination for an additional fiscal year depending on the jurisdiction. Foreign taxes are provided for based on the Fund's understanding of the tax rules and rates that exist in the foreign markets in which it invests.
Distributions are declared and recorded on the ex-dividend date. Income and capital gain distributions are determined in accordance with income tax regulations, which may differ from GAAP. In addition, the Fund claimed a portion of the payment made to redeeming shareholders as a distribution for income tax purposes.
Capital accounts within the financial statements are adjusted for permanent book-tax differences. These adjustments have no impact on net assets or the results of operations. Capital accounts are not adjusted for temporary book-tax differences which will reverse in a subsequent period.
Book-tax differences are primarily due to foreign currency transactions, deferred Trustees compensation and losses deferred due to wash sales.
As of period end, the cost and unrealized appreciation (depreciation) in securities, and derivatives if applicable, for federal income tax purposes were as follows:
| Gross unrealized appreciation | $255,745,309 |
| Gross unrealized depreciation | (4,268,823) |
| Net unrealized appreciation (depreciation) | $251,476,486 |
| Tax Cost | $463,462,367 |
The tax-based components of distributable earnings as of period end were as follows:
| Undistributed ordinary income | $375,046 |
| Undistributed long-term capital gain | $5,979,128 |
| Net unrealized appreciation (depreciation) on securities and other investments | $251,436,703 |
The tax character of distributions paid was as follows:
| | February 28, 2023 | February 28, 2022 |
| Ordinary Income | $6,622,169 | $ 6,405,447 |
| Long-term Capital Gains | 64,800,624 | 3,563,593 |
| Total | $71,422,793 | $ 9,969,040 |
4. Purchases and Sales of Investments.
Purchases and sales of securities, other than short-term securities and in-kind transactions, as applicable, are noted in the table below.
| | Purchases ($) | Sales ($) |
| Chemicals Portfolio | 368,444,547 | 450,291,682 |
5. Fees and Other Transactions with Affiliates.
Management Fee. Fidelity Management & Research Company LLC (the investment adviser) and its affiliates provide the Fund with investment management related services for which the Fund pays a monthly management fee. The management fee is the sum of an individual fund fee rate that is based on an annual rate of .30% of the Fund's average net assets and an annualized group fee rate that averaged .23% during the period. The group fee rate is based upon the monthly average net assets of a group of registered investment companies with which the investment adviser has management contracts. The group fee rate decreases as assets under management increase and increases as assets under management decrease. For the reporting period, the total annual management fee rate was .53% of the Fund's average net assets.
Transfer Agent Fees. Fidelity Investments Institutional Operations Company LLC (FIIOC), an affiliate of the investment adviser, is the Fund's transfer, dividend disbursing and shareholder servicing agent. FIIOC receives account fees and asset-based fees that vary according to account size and type of account. FIIOC pays for typesetting, printing and mailing of shareholder reports, except proxy statements. For the period, the transfer agent fees were equivalent to an annual rate of .18% of average net assets.
Accounting Fees. Fidelity Service Company, Inc. (FSC), an affiliate of the investment adviser, maintains the Fund's accounting records. The accounting fee is based on the level of average net assets for each month. For the period, the fees were equivalent to the following annual rates:
| | % of Average Net Assets |
| Chemicals Portfolio | .03 |
Brokerage Commissions. A portion of portfolio transactions were placed with brokerage firms which are affiliates of the investment adviser. Brokerage commissions are included in net realized gain (loss) and change in net unrealized appreciation (depreciation) in the Statement of Operations. The commissions paid to these affiliated firms were as follows:
| | Amount |
| Chemicals Portfolio | $8,236 |
Interfund Trades. Funds may purchase from or sell securities to other Fidelity Funds under procedures adopted by the Board. The procedures have been designed to ensure these interfund trades are executed in accordance with Rule 17a-7 of the 1940 Act. Any interfund trades are included within the respective purchases and sales amounts shown in the Purchases and Sales of Investments note. Interfund trades during the period are noted in the table below.
| | Purchases ($) | Sales ($) | Realized Gain (Loss) ($) |
| Chemicals Portfolio | 14,920,593 | 23,445,219 | 5,158,708 |
6. Committed Line of Credit.
Certain Funds participate with other funds managed by the investment adviser or an affiliate in a $4.25 billion credit facility (the "line of credit") to be utilized for temporary or emergency purposes to fund shareholder redemptions or for other short-term liquidity purposes. The participating funds have agreed to pay commitment fees on their pro-rata portion of the line of credit, which are reflected in Miscellaneous expenses on the Statement of Operations, and are listed below. During the period, there were no borrowings on this line of credit.
| | Amount |
| Chemicals Portfolio | $1,272 |
7. Security Lending.
Funds lend portfolio securities from time to time in order to earn additional income. Lending agents are used, including National Financial Services (NFS), an affiliate of the investment adviser. Pursuant to a securities lending agreement, NFS will receive a fee, which is capped at 9.9% of a fund's daily lending revenue, for its services as lending agent. A fund may lend securities to certain qualified borrowers, including NFS. On the settlement date of the loan, a fund receives collateral (in the form of U.S. Treasury obligations, letters of credit and/or cash) against the loaned securities and maintains collateral in an amount not less than 100% of the market value of the loaned securities during the period of the loan. The market value of the loaned securities is determined at the close of business of a fund and any additional required collateral is delivered to a fund on the next business day. A fund or borrower may terminate the loan at any time, and if the borrower defaults on its obligation to return the securities loaned because of insolvency or other reasons, a fund may apply collateral received from the borrower against the obligation. A fund may experience delays and costs in recovering the securities loaned. Any cash collateral received is invested in the Fidelity Securities Lending Cash Central Fund. Any loaned securities are identified as such in the Schedule of Investments, and the value of loaned securities and cash collateral at period end, as applicable, are presented in the Statement of Assets and Liabilities. Security lending income represents the income earned on investing cash collateral, less rebates paid to borrowers and any lending agent fees associated with the loan, plus any premium payments received for lending certain types of securities. Security lending income is presented in the Statement of Operations as a component of income from Fidelity Central Funds. Affiliated security lending activity, if any, was as follows:
| | Total Security Lending Fees Paid to NFS | Security Lending Income From Securities Loaned to NFS | Value of Securities Loaned to NFS at Period End |
| Chemicals Portfolio | $807 | $- | $- |
8. Expense Reductions.
During the period the investment adviser or an affiliate reimbursed and/or waived a portion of operating expenses in the amount of $24,670.
9. Other.
A fund's organizational documents provide former and current trustees and officers with a limited indemnification against liabilities arising in connection with the performance of their duties to the fund. In the normal course of business, a fund may also enter into contracts that provide general indemnifications. A fund's maximum exposure under these arrangements is unknown as this would be dependent on future claims that may be made against a fund. The risk of material loss from such claims is considered remote.
10. Risk and Uncertainties.
Many factors affect a fund's performance. Developments that disrupt global economies and financial markets, such as pandemics, epidemics, outbreaks of infectious diseases, war, terrorism, and environmental disasters, may significantly affect a fund's investment performance. The effects of these developments to a fund will be impacted by the types of securities in which a fund invests, the financial condition, industry, economic sector, and geographic location of an issuer, and a fund's level of investment in the securities of that issuer. Significant concentrations in security types, issuers, industries, sectors, and geographic locations may magnify the factors that affect a fund's performance.
Average annual total return reflects the change in the value of an investment, assuming reinvestment of distributions from dividend income and capital gains (the profits earned upon the sale of securities that have grown in value, if any) and assuming a constant rate of performance each year. The hypothetical investment and the average annual total returns do not reflect the deduction of taxes that a shareholder would pay on fund distributions or the redemption of fund shares. During periods of reimbursement by Fidelity, a fund's total return will be greater than it would be had the reimbursement not occurred. How a fund did yesterday is no guarantee of how it will do tomorrow.
| Average Annual Total Returns |
| | | | |
Periods ended February 28, 2023 | Past 1 year | Past 5 years | Past 10 years |
| Class A (incl.5.75% sales charge) | -24.05% | 3.00% | -3.15% |
| Class M (incl.3.50% sales charge) | -22.47% | 3.20% | -3.20% |
Class C (incl. contingent deferred sales charge) | -20.80% | 3.51% | -3.11% |
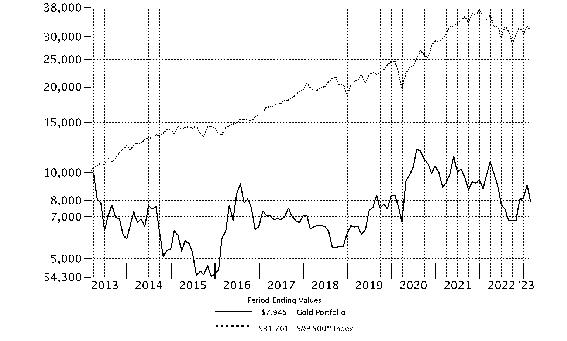
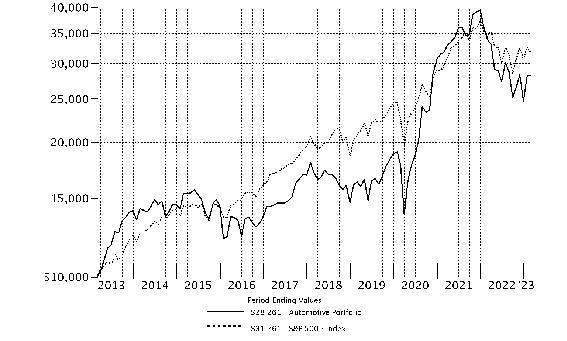
| Gold Portfolio | -19.17% | 4.56% | -2.27% |
| Class I | -19.20% | 4.56% | -2.26% |
| Class Z | -19.07% | 4.69% | -2.20% |
Class C shares' contingent deferred sales charges included in the past one year, past five years and past ten years total return figures are 1%, 0% and 0%, respectively.
The initial offering of Class Z shares took place on October 2, 2018. Returns prior to October 2, 2018, are those of Class I.
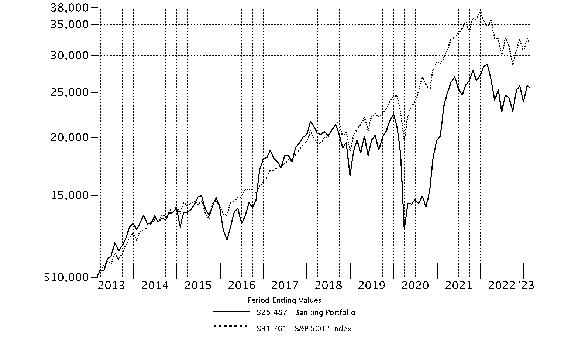
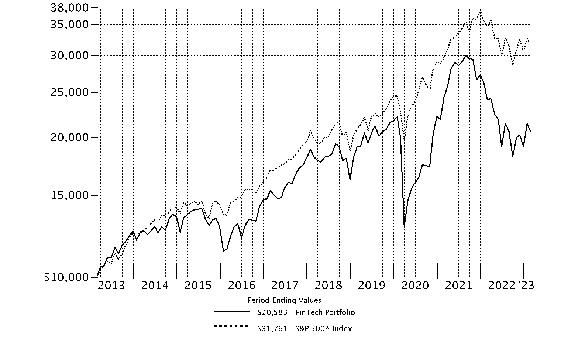
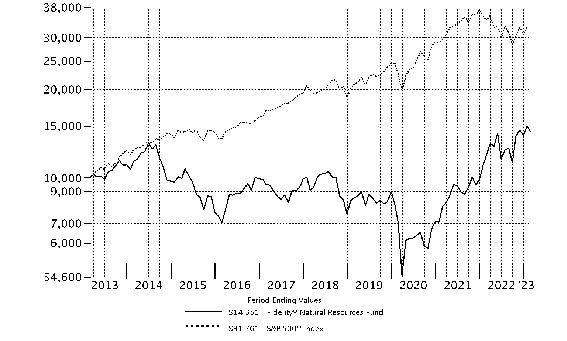
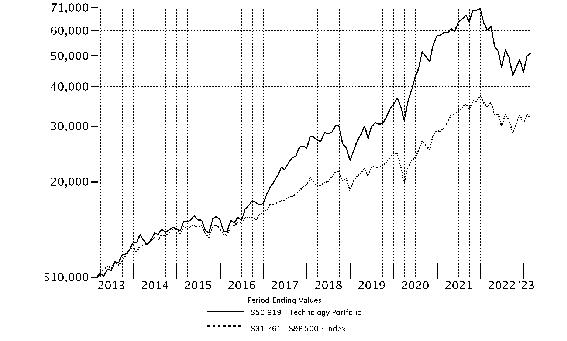
| $10,000 Over 10 Years |
| |
Let's say hypothetically that $10,000 was invested in Gold Portfolio, a class of the fund, on February 28, 2013. The chart shows how the value of your investment would have changed, and also shows how the S&P 500® Index performed over the same period. |
|
|
Gold Portfolio
Market Recap:
U.S. equities returned -7.69% for the 12 months ending February 28, 2023, according to the S&P 500 ® index. The new year began with an encouraging upturn in January (+6.28%), but stocks lost momentum in February (-2.44%) amid higher-than-expected inflation and strong jobs data. Investors took these as signs that the economy continued to run hot, even after a year of historic policy adjustment by the Federal Reserve aimed at cooling economic growth. Record inflation in 2022 prompted the Fed to aggressively tighten monetary policy, and market interest rates eclipsed their highest level in a decade, stoking recession fears and sending stocks into bear market territory. Since March 2022, the central bank has hiked its benchmark rate eight times, by 4.5 percentage points - the fastest-ever pace of monetary tightening - while also shrinking its massive asset portfolio. The latest bump came on February 2, along with a signal that the Fed plans to lift rates in March while it considers whether and when to pause increases. Against this dynamic backdrop, stocks struggled to gain traction until a strong rally ignited heading into the summer. But in September, the index returned -9.21%, one of its worst monthly results ever, before advancing 7.56% in Q4, as risky assets regained favor. For the full 12 months, value stocks handily outpaced growth. The headwind for the latter was most pronounced in the growth-oriented communication services (-25%) and consumer discretionary (-18%) sectors. In sharp contrast, energy gained 24%.
Comments from Portfolio Manager Steven Calhoun:
For the fiscal year ending February 28, 2023, the fund's share classes (excluding sales charges, if applicable) returned roughly -20% to -19%, roughly in line with the -19.56% return of the S&P Global BMI Gold Capped Index 20/45 Linked Index, but underperforming the broad-based S&P 500 ® index. Versus the industry index, security selection was the primary contributor, led by choices in the diversified metals & mining group. One of the biggest individual relative contributors was an overweight position in Orla Mining (+10%). Orla Mining was among the fund's largest holdings. Another top relative contributor was an out-of-index stake in Gatos Silver (+20%). The fund's non-index investment in Triple Flag Precious Metals also meaningfully contributed, gaining 18%. In contrast, the largest detractor from performance versus the industry index was our stock selection in gold. Weak-performing stock picks in copper also hurt relative performance. The fund's biggest individual relative detractor was an underweighting in Zijin Mining, which gained roughly 2% the past 12 months. The company was among the largest holdings at period end. Another notable relative detractor was an outsized stake in Marathon Gold (-70%). Another notable relative detractor was an overweighting in Wesdome Gold Mines (-58%).
The views expressed above reflect those of the portfolio manager(s) only through the end of the period as stated on the cover of this report and do not necessarily represent the views of Fidelity or any other person in the Fidelity organization. Any such views are subject to change at any time based upon market or other conditions and Fidelity disclaims any responsibility to update such views. These views may not be relied on as investment advice and, because investment decisions for a Fidelity fund are based on numerous factors, may not be relied on as an indication of trading intent on behalf of any Fidelity fund.
Gold Portfolio
The information in the following tables is based on the consolidated investments of the Fund.
Top Holdings (% of Fund's net assets) |
| |
| Newmont Corp. | 9.8 | |
| Agnico Eagle Mines Ltd. (Canada) | 8.9 | |
| Franco-Nevada Corp. | 8.2 | |
| Wheaton Precious Metals Corp. | 8.0 | |
| Barrick Gold Corp. (Canada) | 7.3 | |
| Zijin Mining Group Co. Ltd. (A Shares) | 4.2 | |
| Orla Mining Ltd. | 4.2 | |
| OceanaGold Corp. | 3.9 | |
| Alamos Gold, Inc. | 3.3 | |
| Osisko Gold Royalties Ltd. | 2.5 | |
| | 60.3 | |
| |
| Industries (% of Fund's net assets) |
| |
| Gold | 88.3 | |
| Silver | 4.7 | |
| Diversified Metals & Mining | 3.3 | |
| Precious Metals & Minerals | 0.8 | |
| Commodities & Related Investments* | 0.7 | |
| Copper | 0.7 | |
| |
*Includes gold bullion and/or silver bullion.
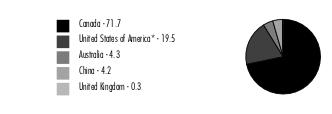
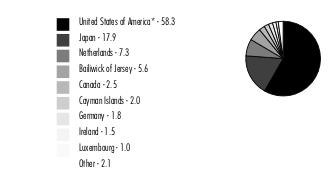
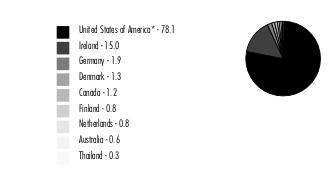
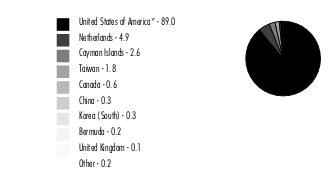
Geographic Diversification (% of Fund's net assets) |
|
* Includes Short-Term investments and Net Other Assets (Liabilities). Percentages are based on country or territory of incorporation and are adjusted for the effect of derivatives, if applicable. |
| |
Gold Portfolio
Showing Percentage of Net Assets
| Common Stocks - 97.8% |
| | | Shares | Value ($) |
| Australia - 4.3% | | | |
| Metals & Mining - 4.3% | | | |
| Gold - 4.3% | | | |
| Gold Road Resources Ltd. | | 12,500,000 | 12,364,537 |
| Newcrest Mining Ltd. | | 1,750,000 | 26,790,307 |
| Northern Star Resources Ltd. | | 4,000,000 | 27,911,892 |
| | | | 67,066,736 |
| Canada - 71.7% | | | |
| Metals & Mining - 71.7% | | | |
| Copper - 0.4% | | | |
| Faraday Copper Corp. (a)(b) | | 10,000,000 | 6,449,249 |
| | | | |
| Diversified Metals & Mining - 2.3% | | | |
| BeMetals Corp. (a) | | 2,000,000 | 197,875 |
| Foran Mining Corp. (a) | | 5,000,000 | 13,741,297 |
| Paycore Minerals, Inc. (a) | | 2,000,000 | 3,048,736 |
| Vizsla Silver Corp. | | 5,000,000 | 5,936,240 |
| Western Copper & Gold Corp. (TSX) (a)(b)(c) | | 8,740,500 | 13,772,133 |
| | | | 36,696,281 |
| Gold - 67.3% | | | |
| Agnico Eagle Mines Ltd. (Canada) (c) | | 3,000,000 | 138,116,526 |
| Alamos Gold, Inc. | | 5,000,000 | 50,971,052 |
| Artemis Gold, Inc. (a)(c) | | 5,000,000 | 16,086,479 |
| Ascot Resources Ltd. (a)(b) | | 25,000,000 | 11,542,690 |
| B2Gold Corp. | | 7,000,000 | 23,906,193 |
| Banyan Gold Corp. (a)(b) | | 21,000,000 | 6,310,004 |
| Barrick Gold Corp. (Canada) (c) | | 7,000,000 | 113,118,358 |
| Bonterra Resources, Inc. (a)(b) | | 7,500,000 | 1,786,369 |
| Franco-Nevada Corp. | | 1,000,000 | 127,643,826 |
| Fury Gold Mines Ltd. (b)(d) | | 10,000,000 | 6,375,962 |
| i-80 Gold Corp. (a)(b)(c) | | 10,000,000 | 22,792,232 |
| i-80 Gold Corp. (b)(d) | | 2,500,000 | 5,698,058 |
| Lundin Gold, Inc. | | 2,500,000 | 25,833,639 |
| Maple Gold Mines Ltd. (a)(b) | | 20,000,000 | 2,638,329 |
| Marathon Gold Corp. (a)(b)(c) | | 25,000,000 | 16,306,339 |
| Marathon Gold Corp. warrants 9/20/24 (a)(b) | | 5,000,000 | 432,958 |
| Novagold Resources, Inc. (a) | | 3,000,000 | 16,885,306 |
| OceanaGold Corp. | | 30,000,000 | 61,121,290 |
| Orla Mining Ltd. (a)(c) | | 15,000,000 | 65,408,575 |
| Osisko Development Corp. (a)(c) | | 2,000,000 | 8,647,856 |
| Osisko Development Corp.: | | | |
| unit(e) | | 1,144,505 | 6,223,272 |
| rights(a) | | 666,666 | 304,390 |
| Osisko Gold Royalties Ltd. (c) | | 3,000,000 | 39,311,103 |
| Osisko Mining, Inc. (a) | | 9,723,000 | 22,018,373 |
| Osisko Mining, Inc. unit | | 2,700,000 | 5,983,988 |
| Pure Gold Mining, Inc. warrants 3/28/23 (a) | | 1,500,000 | 11 |
| Rupert Resources Ltd. (a) | | 4,000,000 | 13,660,682 |
| Sabina Gold & Silver Corp. (a) | | 5,000,000 | 6,485,892 |
| Seabridge Gold, Inc. (a) | | 1,000,000 | 10,978,380 |
| Skeena Resources Ltd. (a)(c) | | 3,000,000 | 15,522,169 |
| Torex Gold Resources, Inc. (a) | | 1,000,000 | 12,312,202 |
| Triple Flag Precious Metals Corp. | | 2,000,000 | 27,145,475 |
| Victoria Gold Corp. (a)(b) | | 4,000,000 | 24,829,608 |
| Wesdome Gold Mines, Inc. (a) | | 3,500,000 | 16,698,424 |
| Wheaton Precious Metals Corp. | | 3,000,000 | 124,990,839 |
| | | | 1,048,086,849 |
| Precious Metals & Minerals - 0.8% | | | |
| Dolly Varden Silver Corp. (a)(b) | | 17,000,000 | 11,835,837 |
| | | | |
| Silver - 0.9% | | | |
| GoGold Resources, Inc. (a)(c) | | 9,000,000 | 13,851,228 |
| | | | |
TOTAL METALS & MINING | | | 1,116,919,444 |
| | | | |
| China - 4.2% | | | |
| Metals & Mining - 4.2% | | | |
| Gold - 4.2% | | | |
| Zijin Mining Group Co. Ltd. (A Shares) | | 39,999,964 | 65,826,231 |
| | | | |
| United Kingdom - 0.3% | | | |
| Metals & Mining - 0.3% | | | |
| Copper - 0.3% | | | |
| Solgold PLC (a) | | 20,000,000 | 3,979,028 |
| | | | |
| United States of America - 17.3% | | | |
| Metals & Mining - 17.3% | | | |
| Diversified Metals & Mining - 1.0% | | | |
| Ivanhoe Electric, Inc. (a)(c) | | 1,000,000 | 15,030,000 |
| | | | |
| Gold - 12.5% | | | |
| Dakota Gold Corp. (a)(c) | | 2,500,000 | 7,025,000 |
| Newmont Corp. | | 3,500,000 | 152,634,997 |
| Royal Gold, Inc. (c) | | 300,000 | 35,637,000 |
| | | | 195,296,997 |
| Silver - 3.8% | | | |
| Gatos Silver, Inc. (a)(b)(c) | | 6,900,000 | 27,876,000 |
| Hecla Mining Co. (c) | | 6,000,000 | 30,900,000 |
| | | | 58,776,000 |
TOTAL METALS & MINING | | | 269,102,997 |
| | | | |
| TOTAL COMMON STOCKS (Cost $1,212,110,032) | | | 1,522,894,436 |
| | | | |
| Commodities - 0.7% |
| | | Troy Ounces | Value ($) |
Gold Bullion (a) (Cost $4,575,085) | | 5,582 | 10,199,654 |
| | | | |
| Money Market Funds - 20.0% |
| | | Shares | Value ($) |
| Fidelity Cash Central Fund 4.63% (f) | | 14,255,006 | 14,257,857 |
| Fidelity Securities Lending Cash Central Fund 4.63% (f)(g) | | 297,681,559 | 297,711,327 |
| TOTAL MONEY MARKET FUNDS (Cost $311,969,184) | | | 311,969,184 |
| | | | |
| TOTAL INVESTMENT IN SECURITIES - 118.5% (Cost $1,528,654,301) | 1,845,063,274 |
NET OTHER ASSETS (LIABILITIES) - (18.5)% | (288,281,971) |
| NET ASSETS - 100.0% | 1,556,781,303 |
| | |
Legend
| (c) | Security or a portion of the security is on loan at period end. |
| (d) | Security exempt from registration under Rule 144A of the Securities Act of 1933. These securities may be resold in transactions exempt from registration, normally to qualified institutional buyers. At the end of the period, the value of these securities amounted to $12,074,020 or 0.8% of net assets. |
| (e) | Security or a portion of the security purchased on a delayed delivery or when-issued basis. |
| (f) | Affiliated fund that is generally available only to investment companies and other accounts managed by Fidelity Investments. The rate quoted is the annualized seven-day yield of the fund at period end. A complete unaudited listing of the fund's holdings as of its most recent quarter end is available upon request. In addition, each Fidelity Central Fund's financial statements, which are not covered by the Fund's Report of Independent Registered Public Accounting Firm, are available on the SEC's website or upon request. |
| (g) | Investment made with cash collateral received from securities on loan. |
Affiliated Central Funds
Fiscal year to date information regarding the Fund's investments in Fidelity Central Funds, including the ownership percentage, is presented below.
| Affiliate | Value, beginning of period ($) | Purchases ($) | Sales Proceeds ($) | Dividend Income ($) | Realized Gain (loss) ($) | Change in Unrealized appreciation (depreciation) ($) | Value, end of period ($) | % ownership, end of period |
| Fidelity Cash Central Fund 4.63% | 58,603,905 | 597,039,758 | 641,385,806 | 438,329 | - | - | 14,257,857 | 0.0% |
| Fidelity Securities Lending Cash Central Fund 4.63% | 105,810,777 | 1,178,638,323 | 986,737,773 | 762,133 | - | - | 297,711,327 | 0.9% |
| Total | 164,414,682 | 1,775,678,081 | 1,628,123,579 | 1,200,462 | - | - | 311,969,184 | |
| | | | | | | | | |
Amounts in the dividend income column in the above table include any capital gain distributions from underlying funds, which are presented in the corresponding line item in the Consolidated Statement of Operations, if applicable.
Amount for Fidelity Securities Lending Cash Central Fund represents the income earned on investing cash collateral, less rebates paid to borrowers and any lending agent fees associated with the loan, plus any premium payments received for lending certain types of securities.
Amounts included in the purchases and sales proceeds columns may include in-kind transactions, if applicable.
Consolidated Subsidiary
| Fund | Value, beginning of period ($) | Purchases ($) | Sales Proceeds ($) | Dividend Income ($) | Realized Gain /loss ($) | Change in Unrealized appreciation (depreciation) ($) | Value, end of period ($) |
| Fidelity Select Gold Cayman Ltd. | 13,353,169 | - | 2,474,914 | - | 1,074,938 | (1,734,410) | 10,218,783 |
Other Affiliated Issuers
An affiliated company is a company in which the Fund has ownership of at least 5% of the voting securities. Fiscal year to date transactions with companies which are or were affiliates are presented in the table below. Certain corporate actions, such as mergers, are excluded from the amounts in this table if applicable. A dash in the Value end of period ($) column means either the issuer is no longer held at period end, or the issuer is held at period end but is no longer an affiliate.
| Affiliate | Value, beginning of period ($) | Purchases ($) | Sales Proceeds ($) | Dividend Income ($) | Realized Gain (loss) ($) | Change in Unrealized appreciation (depreciation) ($) | Value, end of period ($) |
| Ascot Resources Ltd. | 17,199,211 | 3,907,938 | - | - | - | (9,564,459) | 11,542,690 |
| Banyan Gold Corp. | - | 6,168,986 | - | - | - | 141,018 | 6,310,004 |
| Bonterra Resources, Inc. | 1,352,663 | - | - | - | - | 69,807 | - |
| Bonterra Resources, Inc. | 6,011,834 | - | - | - | - | (5,647,935) | 1,786,369 |
| Dolly Varden Silver Corp. | - | 4,989,727 | - | - | - | 6,846,110 | 11,835,837 |
| Faraday Copper Corp. | - | 5,966,439 | - | - | - | 482,810 | 6,449,249 |
| Fury Gold Mines Ltd. | - | 6,328,113 | - | - | - | - | - |
| Fury Gold Mines Ltd. | - | - | - | - | - | 47,849 | 6,375,962 |
| Gatos Silver, Inc. | 16,850,000 | 7,052,371 | - | - | - | 3,973,629 | 27,876,000 |
| Gold Standard Ventures Corp. | 10,256,410 | 767,541 | 11,621,826 | - | (12,324,901) | 12,922,776 | - |
| Maple Gold Mines Ltd. | 5,285,996 | - | - | - | - | (2,647,667) | 2,638,329 |
| Marathon Gold Corp. | 22,406,312 | 3,994,624 | - | - | - | (17,776,315) | 16,306,339 |
| Marathon Gold Corp. warrants 9/20/24 | - | - | - | - | - | (240,493) | 432,958 |
| Orla Mining Ltd. | 51,692,308 | 12,624,099 | 4,918,086 | - | (728,760) | 6,739,014 | - |
| Pure Gold Mining, Inc. | 16,173,570 | - | 4,101,640 | - | (24,122,553) | 12,050,623 | - |
| Pure Gold Mining, Inc. warrants 3/28/23 | 58,434 | - | - | - | - | (58,423) | - |
| Victoria Gold Corp. | 25,341,223 | 21,109,331 | 5,907,354 | - | (986,601) | (14,726,991) | 24,829,608 |
| Western Copper & Gold Corp. (TSX) | 14,327,416 | 1,130,705 | - | - | - | (1,685,988) | 13,772,133 |
| i-80 Gold Corp. | 5,369,822 | - | - | - | - | (78,175) | - |
| i-80 Gold Corp. | 21,696,252 | - | - | - | - | 1,095,980 | 22,792,232 |
| i-80 Gold Corp. | - | - | - | - | - | 406,411 | 5,698,058 |
| i-80 Gold Corp. warrants 9/30/22 | 76,880 | - | - | - | (340) | (76,540) | - |
| Total | 214,098,331 | 74,039,874 | 26,548,906 | - | (38,163,155) | (7,726,959) | 158,645,768 |
Amounts included in the purchases and sales proceeds columns may include in-kind transactions, if applicable.
Investment Valuation
The following is a summary of the inputs used, as of February 28, 2023, involving the Fund's assets and liabilities carried at fair value. The inputs or methodology used for valuing securities may not be an indication of the risk associated with investing in those securities. For more information on valuation inputs, and their aggregation into the levels used below, please refer to the Investment Valuation section in the accompanying Notes to Consolidated Financial Statements.
| Valuation Inputs at Reporting Date: |
| Description | Total ($) | Level 1 ($) | Level 2 ($) | Level 3 ($) |
Investments in Securities: | | | | |
|
| Common Stocks | 1,522,894,436 | 1,477,223,270 | 45,671,166 | - |
|
| Commodities | 10,199,654 | 10,199,654 | - | - |
|
| Money Market Funds | 311,969,184 | 311,969,184 | - | - |
| Total Investments in Securities: | 1,845,063,274 | 1,799,392,108 | 45,671,166 | - |
Gold Portfolio
| Consolidated Statement of Assets and Liabilities |
| | | | February 28, 2023 |
| | | | | |
| Assets | | | | |
| Investment in securities, at value (including securities loaned of $283,944,222) - See accompanying schedule: | | | | |
Unaffiliated issuers (cost $1,018,589,358) | $ | 1,364,248,668 | | |
Fidelity Central Funds (cost $311,969,184) | | 311,969,184 | | |
Commodities (cost $4,575,085) | | 10,199,654 | | |
Other affiliated issuers (cost $193,520,674) | | 158,645,768 | | |
| | | | | |
| | | | | |
| Total Investment in Securities (cost $1,528,654,301) | | | $ | 1,845,063,274 |
| Cash | | | | 19,429 |
| Foreign currency held at value (cost $724,631) | | | | 724,631 |
| Receivable for investments sold | | | | 13,958,096 |
| Receivable for fund shares sold | | | | 1,662,448 |
| Dividends receivable | | | | 2,228,171 |
| Distributions receivable from Fidelity Central Funds | | | | 98,226 |
| Prepaid expenses | | | | 4,110 |
| Other receivables | | | | 131,460 |
Total assets | | | | 1,863,889,845 |
| Liabilities | | | | |
| Payable for investments purchased | | | | |
Regular delivery | $ | 779,103 | | |
Delayed delivery | | 5,535,898 | | |
| Payable for fund shares redeemed | | 1,799,080 | | |
| Accrued management fee | | 723,443 | | |
| Distribution and service plan fees payable | | 50,384 | | |
| Other affiliated payables | | 305,491 | | |
| Other payables and accrued expenses | | 203,110 | | |
| Collateral on securities loaned | | 297,712,033 | | |
| Total Liabilities | | | | 307,108,542 |
| Net Assets | | | $ | 1,556,781,303 |
| Net Assets consist of: | | | | |
| Paid in capital | | | $ | 2,807,202,133 |
| Total accumulated earnings (loss) | | | | (1,250,420,830) |
| Net Assets | | | $ | 1,556,781,303 |
| | | | | |
| Net Asset Value and Maximum Offering Price | | | | |
| Class A : | | | | |
Net Asset Value and redemption price per share ($73,943,387 ÷ 3,501,509 shares) (a) | | | $ | 21.12 |
| Maximum offering price per share (100/94.25 of $21.12) | | | $ | 22.41 |
| Class M : | | | | |
Net Asset Value and redemption price per share ($21,586,448 ÷ 1,050,434 shares) (a) | | | $ | 20.55 |
| Maximum offering price per share (100/96.50 of $20.55) | | | $ | 21.30 |
| Class C : | | | | |
Net Asset Value and offering price per share ($27,977,723 ÷ 1,445,354 shares) (a) | | | $ | 19.36 |
| Gold : | | | | |
Net Asset Value , offering price and redemption price per share ($1,229,415,990 ÷ 56,191,220 shares) | | | $ | 21.88 |
| Class I : | | | | |
Net Asset Value , offering price and redemption price per share ($110,223,764 ÷ 5,036,837 shares) | | | $ | 21.88 |
| Class Z : | | | | |
Net Asset Value , offering price and redemption price per share ($93,633,991 ÷ 4,271,325 shares) | | | $ | 21.92 |
(a)Redemption price per share is equal to net asset value less any applicable contingent deferred sales charge. |
| Consolidated Statement of Operations |
| | | | Year ended February 28, 2023 |
| Investment Income | | | | |
| Dividends | | | $ | 27,797,934 |
| Income from Fidelity Central Funds (including $762,133 from security lending) | | | | 1,200,462 |
| Income before foreign taxes withheld | | | $ | 28,998,396 |
| Less foreign taxes withheld | | | | (2,469,785) |
| Total Income | | | | 26,528,611 |
| Expenses | | | | |
| Management fee | $ | 7,996,988 | | |
| Transfer agent fees | | 2,771,363 | | |
| Distribution and service plan fees | | 648,308 | | |
| Accounting fees | | 660,646 | | |
| Custodian fees and expenses | | 71,865 | | |
| Independent trustees' fees and expenses | | 5,125 | | |
| Registration fees | | 141,062 | | |
| Audit | | 72,523 | | |
| Legal | | 907 | | |
| Interest | | 2,027 | | |
| Miscellaneous | | 8,679 | | |
| Total expenses before reductions | | 12,379,493 | | |
| Expense reductions | | (63,432) | | |
| Total expenses after reductions | | | | 12,316,061 |
| Net Investment income (loss) | | | | 14,212,550 |
| Realized and Unrealized Gain (Loss) | | | | |
| Net realized gain (loss) on: | | | | |
| Investments: | | | | |
| Unaffiliated issuers | | (70,010,728) | | |
| Affiliated issuers | | (38,163,155) | | |
| Commodities | | 998,453 | | |
| Foreign currency transactions | | (73,020) | | |
| Total net realized gain (loss) | | | | (107,248,450) |
| Change in net unrealized appreciation (depreciation) on: | | | | |
| Investments: | | | | |
| Investments | | (274,248,514) | | |
| Affiliated issuers | | (7,726,959) | | |
| Assets and liabilities in foreign currencies | | 63,595 | | |
| Commodities | | (1,656,941) | | |
| Total change in net unrealized appreciation (depreciation) | | | | (283,568,819) |
| Net gain (loss) | | | | (390,817,269) |
| Net increase (decrease) in net assets resulting from operations | | | $ | (376,604,719) |
| Consolidated Statement of Changes in Net Assets |
| |
| | Year ended February 28, 2023 | | Year ended February 28, 2022 |
| Increase (Decrease) in Net Assets | | | | |
| Operations | | | | |
| Net investment income (loss) | $ | 14,212,550 | $ | 23,266,597 |
| Net realized gain (loss) | | (107,248,450) | | 68,341,551 |
| Change in net unrealized appreciation (depreciation) | | (283,568,819) | | 70,246,590 |
| Net increase (decrease) in net assets resulting from operations | | (376,604,719) | | 161,854,738 |
| Distributions to shareholders | | (5,320,281) | | (27,126,849) |
| Share transactions - net increase (decrease) | | 189,254,819 | | (106,344,853) |
| Total increase (decrease) in net assets | | (192,670,181) | | 28,383,036 |
| | | | | |
| Net Assets | | | | |
| Beginning of period | | 1,749,451,484 | | 1,721,068,448 |
| End of period | $ | 1,556,781,303 | $ | 1,749,451,484 |
| | | | | |
| | | | | |
Consolidated Financial Highlights
| Fidelity Advisor® Gold Fund Class A |
| |
| Years ended February 28, | | 2023 | | 2022 | | 2021 | | 2020 A | | 2019 |
Selected Per-Share Data | | | | | | | | | | |
| Net asset value, beginning of period | $ | 26.27 | $ | 24.15 | $ | 21.67 | $ | 18.52 | $ | 18.30 |
| Income from Investment Operations | | | | | | | | | | |
Net investment income (loss) B,C | | .15 | | .27 D | | (.04) | | (.01) E | | (.03) |
| Net realized and unrealized gain (loss) | | (5.23) | | 2.20 | | 3.74 | | 3.20 | | .25 |
| Total from investment operations | | (5.08) | | 2.47 | | 3.70 | | 3.19 | | .22 |
| Distributions from net investment income | | (.07) | | (.35) | | (1.22) | | (.01) | | - |
| Distributions from net realized gain | | - | | - | | - | | (.03) | | - |
| Total distributions | | (.07) | | (.35) | | (1.22) | | (.04) | | - |
| Net asset value, end of period | $ | 21.12 | $ | 26.27 | $ | 24.15 | $ | 21.67 | $ | 18.52 |
Total Return F,G | | (19.42)% | | 10.37% | | 16.59% | | 17.23% | | 1.20% |
Ratios to Average Net Assets C,H,I | | | | | | | | | | |
| Expenses before reductions | | 1.09% | | 1.07% | | 1.08% | | 1.13% | | 1.19% |
| Expenses net of fee waivers, if any | | 1.08% | | 1.07% | | 1.08% | | 1.13% | | 1.18% |
| Expenses net of all reductions | | 1.08% | | 1.07% | | 1.07% | | 1.12% | | 1.18% |
| Net investment income (loss) | | .67% | | 1.02% D | | (.12)% | | (.05)% E | | (.15)% |
| Supplemental Data | | | | | | | | | | |
| Net assets, end of period (000 omitted) | $ | 73,943 | $ | 86,977 | $ | 82,989 | $ | 64,971 | $ | 50,479 |
Portfolio turnover rate J | | 46% | | 38% | | 46% | | 56% | | 37% |
A For the year ended February 29.
B Calculated based on average shares outstanding during the period.
C Net investment income (loss) is affected by the timing of the declaration of dividends by any underlying mutual funds or exchange-traded funds (ETFs). Net investment income (loss) of any mutual funds or ETFs is not included in the Fund's net investment income (loss) ratio.
D Net investment income per share reflects one or more large, non-recurring dividend(s) which amounted to $.12 per share. Excluding such non-recurring dividend(s), the ratio of net investment income (loss) to average net assets would have been .57%.
E Net investment income per share reflects one or more large, non-recurring dividend(s) which amounted to $.05 per share. Excluding such non-recurring dividend(s), the ratio of net investment income (loss) to average net assets would have been (.26)%.
F Total returns would have been lower if certain expenses had not been reduced during the applicable periods shown.
G Total returns do not include the effect of the sales charges.
H Fees and expenses of any underlying mutual funds or exchange-traded funds (ETFs) are not included in the Fund's expense ratio. The Fund indirectly bears its proportionate share of these expenses. For additional expense information related to investments in Fidelity Central Funds, please refer to the "Investments in Fidelity Central Funds" note found in the Notes to Financial Statements section of the most recent Annual or Semi-Annual report.
I Expense ratios reflect operating expenses of the class. Expenses before reductions do not reflect amounts reimbursed, waived, or reduced through arrangements with the investment adviser, brokerage services, or other offset arrangements, if applicable, and do not represent the amount paid by the class during periods when reimbursements, waivers or reductions occur.
J Amount does not include the portfolio activity of any underlying mutual funds or exchange-traded funds (ETFs).
| Fidelity Advisor® Gold Fund Class M |
| |
| Years ended February 28, | | 2023 | | 2022 | | 2021 | | 2020 A | | 2019 |
Selected Per-Share Data | | | | | | | | | | |
| Net asset value, beginning of period | $ | 25.63 | $ | 23.57 | $ | 21.16 | $ | 18.11 | $ | 17.94 |
| Income from Investment Operations | | | | | | | | | | |
Net investment income (loss) B,C | | .09 | | .19 D | | (.12) | | (.07) E | | (.07) |
| Net realized and unrealized gain (loss) | | (5.11) | | 2.16 | | 3.67 | | 3.12 | | .24 |
| Total from investment operations | | (5.02) | | 2.35 | | 3.55 | | 3.05 | | .17 |
| Distributions from net investment income | | (.06) | | (.29) | | (1.14) | | - | | - |
| Total distributions | | (.06) | | (.29) | | (1.14) | | - | | - |
| Net asset value, end of period | $ | 20.55 | $ | 25.63 | $ | 23.57 | $ | 21.16 | $ | 18.11 |
Total Return F,G | | (19.66)% | | 10.08% | | 16.28% | | 16.84% | | .95% |
Ratios to Average Net Assets C,H,I | | | | | | | | | | |
| Expenses before reductions | | 1.35% | | 1.36% | | 1.37% | | 1.42% | | 1.48% |
| Expenses net of fee waivers, if any | | 1.35% | | 1.35% | | 1.37% | | 1.42% | | 1.46% |
| Expenses net of all reductions | | 1.35% | | 1.35% | | 1.36% | | 1.41% | | 1.46% |
| Net investment income (loss) | | .40% | | .74% D | | (.42)% | | (.34)% E | | (.43)% |
| Supplemental Data | | | | | | | | | | |
| Net assets, end of period (000 omitted) | $ | 21,586 | $ | 26,201 | $ | 24,535 | $ | 19,620 | $ | 17,401 |
Portfolio turnover rate J | | 46% | | 38% | | 46% | | 56% | | 37% |
A For the year ended February 29.
B Calculated based on average shares outstanding during the period.
C Net investment income (loss) is affected by the timing of the declaration of dividends by any underlying mutual funds or exchange-traded funds (ETFs). Net investment income (loss) of any mutual funds or ETFs is not included in the Fund's net investment income (loss) ratio.
D Net investment income per share reflects one or more large, non-recurring dividend(s) which amounted to $.11 per share. Excluding such non-recurring dividend(s), the ratio of net investment income (loss) to average net assets would have been .29%.
E Net investment income per share reflects one or more large, non-recurring dividend(s) which amounted to $.04 per share. Excluding such non-recurring dividend(s), the ratio of net investment income (loss) to average net assets would have been (.56)%.
F Total returns would have been lower if certain expenses had not been reduced during the applicable periods shown.
G Total returns do not include the effect of the sales charges.
H Fees and expenses of any underlying mutual funds or exchange-traded funds (ETFs) are not included in the Fund's expense ratio. The Fund indirectly bears its proportionate share of these expenses. For additional expense information related to investments in Fidelity Central Funds, please refer to the "Investments in Fidelity Central Funds" note found in the Notes to Financial Statements section of the most recent Annual or Semi-Annual report.
I Expense ratios reflect operating expenses of the class. Expenses before reductions do not reflect amounts reimbursed, waived, or reduced through arrangements with the investment adviser, brokerage services, or other offset arrangements, if applicable, and do not represent the amount paid by the class during periods when reimbursements, waivers or reductions occur.
J Amount does not include the portfolio activity of any underlying mutual funds or exchange-traded funds (ETFs).
| Fidelity Advisor® Gold Fund Class C |
| |
| Years ended February 28, | | 2023 | | 2022 | | 2021 | | 2020 A | | 2019 |
Selected Per-Share Data | | | | | | | | | | |
| Net asset value, beginning of period | $ | 24.24 | $ | 22.30 | $ | 20.07 | $ | 17.24 | $ | 17.15 |
| Income from Investment Operations | | | | | | | | | | |
Net investment income (loss) B,C | | (.01) | | .08 D | | (.22) | | (.14) E | | (.13) |
| Net realized and unrealized gain (loss) | | (4.82) | | 2.05 | | 3.49 | | 2.97 | | .22 |
| Total from investment operations | | (4.83) | | 2.13 | | 3.27 | | 2.83 | | .09 |
| Distributions from net investment income | | (.05) | | (.19) | | (1.04) | | - | | - |
| Total distributions | | (.05) | | (.19) | | (1.04) | | - | | - |
| Net asset value, end of period | $ | 19.36 | $ | 24.24 | $ | 22.30 | $ | 20.07 | $ | 17.24 |
Total Return F,G | | (20.00)% | | 9.62% | | 15.81% | | 16.42% | | .52% |
Ratios to Average Net Assets C,H,I | | | | | | | | | | |
| Expenses before reductions | | 1.79% | | 1.77% | | 1.78% | | 1.80% | | 1.84% |
| Expenses net of fee waivers, if any | | 1.78% | | 1.77% | | 1.78% | | 1.80% | | 1.83% |
| Expenses net of all reductions | | 1.78% | | 1.77% | | 1.77% | | 1.79% | | 1.83% |
| Net investment income (loss) | | (.03)% | | .32% D | | (.83)% | | (.72)% E | | (.80)% |
| Supplemental Data | | | | | | | | | | |
| Net assets, end of period (000 omitted) | $ | 27,978 | $ | 43,031 | $ | 51,195 | $ | 52,375 | $ | 67,760 |
Portfolio turnover rate J | | 46% | | 38% | | 46% | | 56% | | 37% |
A For the year ended February 29.
B Calculated based on average shares outstanding during the period.
C Net investment income (loss) is affected by the timing of the declaration of dividends by any underlying mutual funds or exchange-traded funds (ETFs). Net investment income (loss) of any mutual funds or ETFs is not included in the Fund's net investment income (loss) ratio.
D Net investment income per share reflects one or more large, non-recurring dividend(s) which amounted to $.11 per share. Excluding such non-recurring dividend(s), the ratio of net investment income (loss) to average net assets would have been (.12)%.
E Net investment income per share reflects one or more large, non-recurring dividend(s) which amounted to $.04 per share. Excluding such non-recurring dividend(s), the ratio of net investment income (loss) to average net assets would have been (.94)%.
F Total returns would have been lower if certain expenses had not been reduced during the applicable periods shown.
G Total returns do not include the effect of the contingent deferred sales charge.
H Fees and expenses of any underlying mutual funds or exchange-traded funds (ETFs) are not included in the Fund's expense ratio. The Fund indirectly bears its proportionate share of these expenses. For additional expense information related to investments in Fidelity Central Funds, please refer to the "Investments in Fidelity Central Funds" note found in the Notes to Financial Statements section of the most recent Annual or Semi-Annual report.
I Expense ratios reflect operating expenses of the class. Expenses before reductions do not reflect amounts reimbursed, waived, or reduced through arrangements with the investment adviser, brokerage services, or other offset arrangements, if applicable, and do not represent the amount paid by the class during periods when reimbursements, waivers or reductions occur.
J Amount does not include the portfolio activity of any underlying mutual funds or exchange-traded funds (ETFs).
| Years ended February 28, | | 2023 | | 2022 | | 2021 | | 2020 A | | 2019 |
Selected Per-Share Data | | | | | | | | | | |
| Net asset value, beginning of period | $ | 27.14 | $ | 24.93 | $ | 22.33 | $ | 19.07 | $ | 18.78 |
| Income from Investment Operations | | | | | | | | | | |
Net investment income (loss) B,C | | .23 | | .36 D | | .06 | | .06 E | | .03 |
| Net realized and unrealized gain (loss) | | (5.41) | | 2.27 | | 3.84 | | 3.30 | | .26 |
| Total from investment operations | | (5.18) | | 2.63 | | 3.90 | | 3.36 | | .29 |
| Distributions from net investment income | | (.08) | | (.42) | | (1.30) | | (.06) | | - |
| Distributions from net realized gain | | - | | - | | - | | (.03) | | - |
| Total distributions | | (.08) | | (.42) | | (1.30) | | (.10) F | | - |
| Net asset value, end of period | $ | 21.88 | $ | 27.14 | $ | 24.93 | $ | 22.33 | $ | 19.07 |
Total Return G | | (19.17)% | | 10.71% | | 16.96% | | 17.60% | | 1.54% |
Ratios to Average Net Assets C,H,I | | | | | | | | | | |
| Expenses before reductions | | .78% | | .76% | | .76% | | .79% | | .86% |
| Expenses net of fee waivers, if any | | .78% | | .76% | | .76% | | .79% | | .85% |
| Expenses net of all reductions | | .77% | | .76% | | .75% | | .78% | | .85% |
| Net investment income (loss) | | .97% | | 1.33% D | | .19% | | .29% E | | .18% |
| Supplemental Data | | | | | | | | | | |
| Net assets, end of period (000 omitted) | $ | 1,229,416 | $ | 1,330,602 | $ | 1,319,440 | $ | 1,292,204 | $ | 1,035,697 |
Portfolio turnover rate J | | 46% | | 38% | | 46% | | 56% | | 37% |
A For the year ended February 29.
B Calculated based on average shares outstanding during the period.
C Net investment income (loss) is affected by the timing of the declaration of dividends by any underlying mutual funds or exchange-traded funds (ETFs). Net investment income (loss) of any mutual funds or ETFs is not included in the Fund's net investment income (loss) ratio.
D Net investment income per share reflects one or more large, non-recurring dividend(s) which amounted to $.12 per share. Excluding such non-recurring dividend(s), the ratio of net investment income (loss) to average net assets would have been .89%.
E Net investment income per share reflects one or more large, non-recurring dividend(s) which amounted to $.05 per share. Excluding such non-recurring dividend(s), the ratio of net investment income (loss) to average net assets would have been .07%.
F Total distributions per share do not sum due to rounding.
G Total returns would have been lower if certain expenses had not been reduced during the applicable periods shown.
H Fees and expenses of any underlying mutual funds or exchange-traded funds (ETFs) are not included in the Fund's expense ratio. The Fund indirectly bears its proportionate share of these expenses. For additional expense information related to investments in Fidelity Central Funds, please refer to the "Investments in Fidelity Central Funds" note found in the Notes to Financial Statements section of the most recent Annual or Semi-Annual report.
I Expense ratios reflect operating expenses of the class. Expenses before reductions do not reflect amounts reimbursed, waived, or reduced through arrangements with the investment adviser, brokerage services, or other offset arrangements, if applicable, and do not represent the amount paid by the class during periods when reimbursements, waivers or reductions occur.
J Amount does not include the portfolio activity of any underlying mutual funds or exchange-traded funds (ETFs).
| Fidelity Advisor® Gold Fund Class I |
| |
| Years ended February 28, | | 2023 | | 2022 | | 2021 | | 2020 A | | 2019 |
Selected Per-Share Data | | | | | | | | | | |
| Net asset value, beginning of period | $ | 27.15 | $ | 24.93 | $ | 22.33 | $ | 19.07 | $ | 18.78 |
| Income from Investment Operations | | | | | | | | | | |
Net investment income (loss) B,C | | .23 | | .36 D | | .05 | | .06 E | | .04 |
| Net realized and unrealized gain (loss) | | (5.42) | | 2.27 | | 3.85 | | 3.30 | | .25 |
| Total from investment operations | | (5.19) | | 2.63 | | 3.90 | | 3.36 | | .29 |
| Distributions from net investment income | | (.08) | | (.41) | | (1.30) | | (.07) | | - |
| Distributions from net realized gain | | - | | - | | - | | (.03) | | - |
| Total distributions | | (.08) | | (.41) | | (1.30) | | (.10) | | - |
| Net asset value, end of period | $ | 21.88 | $ | 27.15 | $ | 24.93 | $ | 22.33 | $ | 19.07 |
Total Return F | | (19.20)% | | 10.74% | | 16.96% | | 17.60% | | 1.54% |
Ratios to Average Net Assets C,G,H | | | | | | | | | | |
| Expenses before reductions | | .77% | | .76% | | .77% | | .79% | | .84% |
| Expenses net of fee waivers, if any | | .77% | | .76% | | .77% | | .79% | | .82% |
| Expenses net of all reductions | | .77% | | .76% | | .76% | | .77% | | .82% |
| Net investment income (loss) | | .98% | | 1.33% D | | .18% | | .30% E | | .21% |
| Supplemental Data | | | | | | | | | | |
| Net assets, end of period (000 omitted) | $ | 110,224 | $ | 152,799 | $ | 137,617 | $ | 115,699 | $ | 84,956 |
Portfolio turnover rate I | | 46% | | 38% | | 46% | | 56% | | 37% |
A For the year ended February 29.
B Calculated based on average shares outstanding during the period.
C Net investment income (loss) is affected by the timing of the declaration of dividends by any underlying mutual funds or exchange-traded funds (ETFs). Net investment income (loss) of any mutual funds or ETFs is not included in the Fund's net investment income (loss) ratio.
D Net investment income per share reflects one or more large, non-recurring dividend(s) which amounted to $.12 per share. Excluding such non-recurring dividend(s), the ratio of net investment income (loss) to average net assets would have been .89%.
E Net investment income per share reflects one or more large, non-recurring dividend(s) which amounted to $.05 per share. Excluding such non-recurring dividend(s), the ratio of net investment income (loss) to average net assets would have been .08%.
F Total returns would have been lower if certain expenses had not been reduced during the applicable periods shown.
G Fees and expenses of any underlying mutual funds or exchange-traded funds (ETFs) are not included in the Fund's expense ratio. The Fund indirectly bears its proportionate share of these expenses. For additional expense information related to investments in Fidelity Central Funds, please refer to the "Investments in Fidelity Central Funds" note found in the Notes to Financial Statements section of the most recent Annual or Semi-Annual report.
H Expense ratios reflect operating expenses of the class. Expenses before reductions do not reflect amounts reimbursed, waived, or reduced through arrangements with the investment adviser, brokerage services, or other offset arrangements, if applicable, and do not represent the amount paid by the class during periods when reimbursements, waivers or reductions occur.
I Amount does not include the portfolio activity of any underlying mutual funds or exchange-traded funds (ETFs).
| Fidelity Advisor® Gold Fund Class Z |
| |
| Years ended February 28, | | 2023 | | 2022 | | 2021 | | 2020 A | | 2019 B |
Selected Per-Share Data | | | | | | | | | | |
| Net asset value, beginning of period | $ | 27.16 | $ | 24.94 | $ | 22.34 | $ | 19.08 | $ | 16.62 |
| Income from Investment Operations | | | | | | | | | | |
Net investment income (loss) C,D | | .26 | | .40 E | | .09 | | .10 F | | .07 |
| Net realized and unrealized gain (loss) | | (5.41) | | 2.27 | | 3.85 | | 3.29 | | 2.39 |
| Total from investment operations | | (5.15) | | 2.67 | | 3.94 | | 3.39 | | 2.46 |
| Distributions from net investment income | | (.09) | | (.45) | | (1.34) | | (.10) | | - |
| Distributions from net realized gain | | - | | - | | - | | (.03) | | - |
| Total distributions | | (.09) | | (.45) | | (1.34) | | (.13) | | - |
| Net asset value, end of period | $ | 21.92 | $ | 27.16 | $ | 24.94 | $ | 22.34 | $ | 19.08 |
Total Return G,H | | (19.07)% | | 10.88% | | 17.12% | | 17.75% | | 14.80% |
Ratios to Average Net Assets D,I,J | | | | | | | | | | |
| Expenses before reductions | | .63% | | .63% | | .64% | | .65% | | .68% K |
| Expenses net of fee waivers, if any | | .63% | | .62% | | .64% | | .64% | | .68% K |
| Expenses net of all reductions | | .63% | | .62% | | .62% | | .63% | | .67% K |
| Net investment income (loss) | | 1.12% | | 1.47% E | | .32% | | .44% F | | .97% K |
| Supplemental Data | | | | | | | | | | |
| Net assets, end of period (000 omitted) | $ | 93,634 | $ | 109,842 | $ | 105,293 | $ | 95,076 | $ | 3,037 |
Portfolio turnover rate L | | 46% | | 38% | | 46% | | 56% | | 37% |
A For the year ended February 29.
B For the period October 2, 2018 (commencement of sale of shares) through February 28, 2019.
C Calculated based on average shares outstanding during the period.
D Net investment income (loss) is affected by the timing of the declaration of dividends by any underlying mutual funds or exchange-traded funds (ETFs). Net investment income (loss) of any mutual funds or ETFs is not included in the Fund's net investment income (loss) ratio.
E Net investment income per share reflects one or more large, non-recurring dividend(s) which amounted to $.12 per share. Excluding such non-recurring dividend(s), the ratio of net investment income (loss) to average net assets would have been 1.02%.
F Net investment income per share reflects one or more large, non-recurring dividend(s) which amounted to $.05 per share. Excluding such non-recurring dividend(s), the ratio of net investment income (loss) to average net assets would have been .22%.
G Total returns for periods of less than one year are not annualized.
H Total returns would have been lower if certain expenses had not been reduced during the applicable periods shown.
I Fees and expenses of any underlying mutual funds or exchange-traded funds (ETFs) are not included in the Fund's expense ratio. The Fund indirectly bears its proportionate share of these expenses. For additional expense information related to investments in Fidelity Central Funds, please refer to the "Investments in Fidelity Central Funds" note found in the Notes to Financial Statements section of the most recent Annual or Semi-Annual report.
J Expense ratios reflect operating expenses of the class. Expenses before reductions do not reflect amounts reimbursed, waived, or reduced through arrangements with the investment adviser, brokerage services, or other offset arrangements, if applicable, and do not represent the amount paid by the class during periods when reimbursements, waivers or reductions occur.
K Annualized.
L Amount does not include the portfolio activity of any underlying mutual funds or exchange-traded funds (ETFs).
For the period ended February 28, 2023
1. Organization.
Gold Portfolio (the Fund) is a non-diversified fund of Fidelity Select Portfolios (the Trust) and is authorized to issue an unlimited number of shares. The Trust is registered under the Investment Company Act of 1940, as amended (the 1940 Act), as an open-end management investment company organized as a Massachusetts business trust. The Fund invests primarily in securities of companies whose principal business activities fall within specific industries. The Fund offers Fidelity Advisor Gold Fund Class A (Class A), Fidelity Advisor Gold Fund Class M (Class M), Fidelity Advisor Gold Fund Class C (Class C), Gold Portfolio (Gold), Fidelity Advisor Gold Fund Class I (Class I) and Fidelity Advisor Gold Fund Class Z (Class Z) shares, each of which has equal rights as to assets and voting privileges. Each class has exclusive voting rights with respect to matters that affect that class. Class C shares will automatically convert to Class A shares after a holding period of eight years from the initial date of purchase, with certain exceptions.
2. Consolidated Subsidiary.
The Funds included in the table below hold certain commodity-related investments through a wholly owned subsidiary (the "Subsidiary"). As of period end, the investments in the Subsidiaries, were as follows:
| | Subsidiary Name | $ Amount | % of Fund's Net Assets |
| Gold Portfolio | Fidelity Select Gold Cayman Ltd. | 10,218,783 | .7 |
The financial statements have been consolidated to include the Subsidiary accounts where applicable. Accordingly, all inter-company transactions and balances have been eliminated.
3. Investments in Fidelity Central Funds.
Funds may invest in Fidelity Central Funds, which are open-end investment companies generally available only to other investment companies and accounts managed by the investment adviser and its affiliates. The Consolidated Schedule of Investments lists any Fidelity Central Funds held as an investment as of period end, but does not include the underlying holdings of each Fidelity Central Fund. An investing fund indirectly bears its proportionate share of the expenses of the underlying Fidelity Central Funds.
Based on its investment objective, each Fidelity Central Fund may invest or participate in various investment vehicles or strategies that are similar to those of the investing fund. These strategies are consistent with the investment objectives of the investing fund and may involve certain economic risks which may cause a decline in value of each of the Fidelity Central Funds and thus a decline in the value of the investing fund.
| Fidelity Central Fund | Investment Manager | Investment Objective | Investment Practices | Expense Ratio A |
| Fidelity Money Market Central Funds | Fidelity Management & Research Company LLC (FMR) | Each fund seeks to obtain a high level of current income consistent with the preservation of capital and liquidity. | Short-term Investments | Less than .005% |
A Expenses expressed as a percentage of average net assets and are as of each underlying Central Fund's most recent annual or semi-annual shareholder report.
A complete unaudited list of holdings for each Fidelity Central Fund is available upon request or at the Securities and Exchange Commission website at www.sec.gov. In addition, the financial statements of the Fidelity Central Funds which contain the significant accounting policies (including investment valuation policies) of those funds, and are not covered by the Report of Independent Registered Public Accounting Firm, are available on the Securities and Exchange Commission website or upon request.
4. Significant Accounting Policies.
The Fund is an investment company and applies the accounting and reporting guidance of the Financial Accounting Standards Board (FASB) Accounting Standards Codification Topic 946 Financial Services - Investment Companies . The consolidated financial statements have been prepared in conformity with accounting principles generally accepted in the United States of America (GAAP), which require management to make certain estimates and assumptions at the date of the consolidated financial statements. Actual results could differ from those estimates. Subsequent events, if any, through the date that the consolidated financial statements were issued have been evaluated in the preparation of the consolidated financial statements. The Fund's Consolidated Schedule of Investments lists any underlying mutual funds or exchange-traded funds (ETFs) but does not include the underlying holdings of these funds. The following summarizes the significant accounting policies of the Fund:
Investment Valuation. Investments are valued as of 4:00 p.m. Eastern time on the last calendar day of the period. The Board of Trustees (the Board) has designated the Fund's investment adviser as the valuation designee responsible for the fair valuation function and performing fair value determinations as needed. The investment adviser has established a Fair Value Committee (the Committee) to carry out the day-to-day fair valuation responsibilities and has adopted policies and procedures to govern the fair valuation process and the activities of the Committee. In accordance with these fair valuation policies and procedures, which have been approved by the Board, the Fund attempts to obtain prices from one or more third party pricing services or brokers to value its investments. When current market prices, quotations or currency exchange rates are not readily available or reliable, investments will be fair valued in good faith by the Committee, in accordance with the policies and procedures. Factors used in determining fair value vary by investment type and may include market or investment specific events, transaction data, estimated cash flows, and market observations of comparable investments. The frequency that the fair valuation procedures are used cannot be predicted and they may be utilized to a significant extent. The Committee manages the Fund's fair valuation practices and maintains the fair valuation policies and procedures. The Fund's investment adviser reports to the Board information regarding the fair valuation process and related material matters.
The Fund categorizes the inputs to valuation techniques used to value its investments into a disclosure hierarchy consisting of three levels as shown below:
Level 1 - unadjusted quoted prices in active markets for identical investments
Level 2 - other significant observable inputs (including quoted prices for similar investments, interest rates, prepayment speeds, etc.)
Level 3 - unobservable inputs (including the Fund's own assumptions based on the best information available)
Valuation techniques used to value the Fund's investments by major category are as follows:
Equity securities, including restricted securities, for which market quotations are readily available, are valued at the last reported sale price or official closing price as reported by a third party pricing service on the primary market or exchange on which they are traded and are categorized as Level 1 in the hierarchy. In the event there were no sales during the day or closing prices are not available, securities are valued at the last quoted bid price or may be valued using the last available price and are generally categorized as Level 2 in the hierarchy. For foreign equity securities, when market or security specific events arise, comparisons to the valuation of American Depositary Receipts (ADRs), futures contracts, ETFs and certain indexes as well as quoted prices for similar securities may be used and would be categorized as Level 2 in the hierarchy. For equity securities, including restricted securities, where observable inputs are limited, assumptions about market activity and risk are used and these securities may be categorized as Level 3 in the hierarchy.
Investments in commodities are valued at their last traded price at 4:00 p.m. Eastern time each business day and are categorized as Level 1 in the hierarchy. Investments in open-end mutual funds, including the Fidelity Central Funds, are valued at their closing net asset value (NAV) each business day and are categorized as Level 1 in the hierarchy.
Changes in valuation techniques may result in transfers in or out of an assigned level within the disclosure hierarchy. The aggregate value of investments by input level as of February 28, 2023 is included at the end of the Fund's Consolidated Schedule of Investments.
Foreign Currency. Certain Funds may use foreign currency contracts to facilitate transactions in foreign-denominated securities. Gains and losses from these transactions may arise from changes in the value of the foreign currency or if the counterparties do not perform under the contracts' terms.
Foreign-denominated assets, including investment securities, and liabilities are translated into U.S. dollars at the exchange rates at period end. Purchases and sales of investment securities, income and dividends received, and expenses denominated in foreign currencies are translated into U.S. dollars at the exchange rate in effect on the transaction date.
The effects of exchange rate fluctuations on investments are included with the net realized and unrealized gain (loss) on investment securities. Other foreign currency transactions resulting in realized and unrealized gain (loss) are disclosed separately.
Investment Transactions and Income. For financial reporting purposes, the Fund's investment holdings and NAV include trades executed through the end of the last business day of the period. The NAV per share for processing shareholder transactions is calculated as of the close of business of the New York Stock Exchange (NYSE), normally 4:00 p.m. Eastern time and includes trades executed through the end of the prior business day. Gains and losses on securities sold are determined on the basis of identified cost and include proceeds received from litigation. Commissions paid to certain brokers with whom the investment adviser, or its affiliates, places trades on behalf of a fund include an amount in addition to trade execution, which may be rebated back to a fund. Any such rebates are included in net realized gain (loss) on investments in the Consolidated Statement of Operations. Dividend income is recorded on the ex-dividend date, except for certain dividends from foreign securities where the ex-dividend date may have passed, which are recorded as soon as the Fund is informed of the ex-dividend date. Non-cash dividends included in dividend income, if any, are recorded at the fair market value of the securities received. Income and capital gain distributions from Fidelity Central Funds, if any, are recorded on the ex-dividend date. Investment income is recorded net of foreign taxes withheld where recovery of such taxes is uncertain. Funds may file withholding tax reclaims in certain jurisdictions to recover a portion of amounts previously withheld. Any withholding tax reclaims income is included in the Consolidated Statement of Operations in foreign taxes withheld. Any receivables for withholding tax reclaims are included in the Consolidated Statement of Assets and Liabilities in dividends receivable.
Class Allocations and Expenses. Investment income, realized and unrealized capital gains and losses, common expenses of a fund, and certain fund-level expense reductions, if any, are allocated daily on a pro-rata basis to each class based on the relative net assets of each class to the total net assets of a fund. Each class differs with respect to transfer agent and distribution and service plan fees incurred, as applicable. Certain expense reductions may also differ by class, if applicable. For the reporting period, the allocated portion of income and expenses to each class as a percent of its average net assets may vary due to the timing of recording these transactions in relation to fluctuating net assets of the classes. Expenses directly attributable to a fund are charged to that fund. Expenses attributable to more than one fund are allocated among the respective funds on the basis of relative net assets or other appropriate methods. Expenses included in the accompanying consolidated financial statements reflect the expenses of that fund and do not include any expenses associated with any underlying mutual funds or exchange-traded funds. Although not included in a fund's expenses, a fund indirectly bears its proportionate share of these expenses through the net asset value of each underlying mutual fund or exchange-traded fund. Expense estimates are accrued in the period to which they relate and adjustments are made when actual amounts are known.
Deferred Trustee Compensation. Under a Deferred Compensation Plan (the Plan) for certain Funds, certain independent Trustees have elected to defer receipt of a portion of their annual compensation. Deferred amounts are invested in affiliated mutual funds, are marked-to-market and remain in a fund until distributed in accordance with the Plan. The investment of deferred amounts and the offsetting payable to the Trustees presented below are included in the accompanying Consolidated Statement of Assets and Liabilities in other receivables and other payables and accrued expenses, as applicable.
Income Tax Information and Distributions to Shareholders. Each year, the Fund intends to qualify as a regulated investment company under Subchapter M of the Internal Revenue Code, including distributing substantially all of its taxable income and realized gains. As a result, no provision for U.S. Federal income taxes is required. As of February 28, 2023, the Fund did not have any unrecognized tax benefits in the consolidated financial statements; nor is the Fund aware of any tax positions for which it is reasonably possible that the total amounts of unrecognized tax benefits will significantly change in the next twelve months. The Fund files a U.S. federal tax return, in addition to state and local tax returns as required. The Fund's federal income tax returns are subject to examination by the Internal Revenue Service (IRS) for a period of three fiscal years after they are filed. State and local tax returns may be subject to examination for an additional fiscal year depending on the jurisdiction. Foreign taxes are provided for based on the Fund's understanding of the tax rules and rates that exist in the foreign markets in which it invests.
The Subsidiary is classified as a controlled foreign corporation under Subchapter N of the Internal Revenue Code. Therefore, the Fund is required to increase its taxable income by its share of the Subsidiary's income. Net investment losses of the Subsidiary cannot be deducted by the Fund in the current period nor carried forward to offset taxable income in future periods.
Distributions are declared and recorded on the ex-dividend date. Income and capital gain distributions are declared separately for each class. Income and capital gain distributions are determined in accordance with income tax regulations, which may differ from GAAP. In addition, the Fund claimed a portion of the payment made to redeeming shareholders as a distribution for income tax purposes.
Capital accounts within the consolidated financial statements are adjusted for permanent book-tax differences. These adjustments have no impact on net assets or the results of operations. Capital accounts are not adjusted for temporary book-tax differences which will reverse in a subsequent period.
Book-tax differences are primarily due to foreign currency transactions, passive foreign investment companies (PFIC), controlled foreign corporations, deferred Trustees compensation, capital loss carryforwards and losses deferred due to wash sales.
As of period end, the cost and unrealized appreciation (depreciation) in securities, and derivatives if applicable, for federal income tax purposes were as follows:
| Gross unrealized appreciation | $390,850,953 |
| Gross unrealized depreciation | (187,874,314) |
| Net unrealized appreciation (depreciation) | $202,976,639 |
| Tax Cost | $1,642,086,635 |
The tax-based components of distributable earnings as of period end were as follows:
| Undistributed ordinary income | $8,563,393 |
| Capital loss carryforward | $(1,461,988,083) |
| Net unrealized appreciation (depreciation) on securities and other investments | $203,138,503 |
Capital loss carryforwards are only available to offset future capital gains of the Fund to the extent provided by regulations and may be limited. The capital loss carryforward information presented below, including any applicable limitation, is estimated as of fiscal period end and is subject to adjustment.
Short-term | $(274,109,326) |
Long-term | (1,187,878,757) |
| Total capital loss carryforward | $(1,461,988,083) |
The tax character of distributions paid was as follows:
| | February 28, 2023 | February 28, 2022 |
| Ordinary Income | $5,320,281 | $27,126,849 |
Delayed Delivery Transactions and When-Issued Securities. During the period, certain Funds transacted in securities on a delayed delivery or when-issued basis. Payment and delivery may take place after the customary settlement period for that security. The price of the underlying securities and the date when the securities will be delivered and paid for are fixed at the time the transaction is negotiated. Securities purchased on a delayed delivery or when-issued basis are identified as such in the Consolidated Schedule of Investments. Compensation for interest forgone in the purchase of a delayed delivery or when-issued debt security may be received. With respect to purchase commitments, each applicable Fund identifies securities as segregated in its records with a value at least equal to the amount of the commitment. Payables and receivables associated with the purchases and sales of delayed delivery securities having the same coupon, settlement date and broker are offset. Delayed delivery or when-issued securities that have been purchased from and sold to different brokers are reflected as both payables and receivables in the Consolidated Statement of Assets and Liabilities under the caption "Delayed delivery", as applicable. Losses may arise due to changes in the value of the underlying securities or if the counterparty does not perform under the contract's terms, or if the issuer does not issue the securities due to political, economic, or other factors.
Restricted Securities (including Private Placements). Funds may invest in securities that are subject to legal or contractual restrictions on resale. These securities generally may be resold in transactions exempt from registration or to the public if the securities are registered. Disposal of these securities may involve time-consuming negotiations and expense, and prompt sale at an acceptable price may be difficult. Information regarding restricted securities held at period end is included at the end of the Consolidated Schedule of Investments, if applicable.
New Accounting Pronouncement. In June 2022, the Financial Accounting Standards Board (FASB) issued Accounting Standards Update (ASU) 2022-03 Fair Value Measurement (Topic 820): Fair Value Measurement of Equity Securities Subject to Contractual Sale Restrictions. The amendments in this ASU clarify that a contractual restriction on the sale of an equity security is not considered part of the unit of account of the equity security and, therefore, is not considered in measuring fair value. They also clarify that an entity cannot, as a separate unit of account, recognize and measure a contractual sale restriction. They also require additional disclosures for equity securities subject to contractual sale restrictions. ASU 2022-03 will be effective for fiscal years, including interim periods within those fiscal years, beginning after December 15, 2023, and allows for early adoption. ASU 2022-03 will only be applicable to an equity security in which the contractual arrangement that restricts its sale is executed or modified on or after the adoption date. Management is currently evaluating the potential impact of ASU 2022-03 to the financial statements.
5. Purchases and Sales of Investments.
Purchases and sales of securities, other than short-term securities and in-kind transactions, as applicable, are noted in the table below.
| | Purchases ($) | Sales ($) |
| Gold Portfolio | 861,480,974 | 675,375,560 |
6. Fees and Other Transactions with Affiliates.
Management Fee. Fidelity Management & Research Company LLC (the investment adviser) and its affiliates provide the Fund with investment management related services for which the Fund pays a monthly management fee. The management fee is the sum of an individual fund fee rate that is based on an annual rate of .30% of the Fund's average net assets and an annualized group fee rate that averaged .23% during the period. The group fee rate is based upon the monthly average net assets of a group of registered investment companies with which the investment adviser has management contracts. The group fee rate decreases as assets under management increase and increases as assets under management decrease. For the reporting period, the total annual management fee rate was .53% of the Fund's average net assets.
The investment adviser, either through itself or through an affiliate provides investment management related services to the Subsidiary. The Subsidiary does not pay the investment adviser a fee for these services. Under the management contract with the subsidiary, the investment adviser pays all other expenses of the Subsidiary, except custodian fees.
Distribution and Service Plan Fees. In accordance with Rule 12b-1 of the 1940 Act, the Fund has adopted separate Distribution and Service Plans for each class of shares. Certain classes pay Fidelity Distributors Company LLC (FDC), an affiliate of the investment adviser, separate Distribution and Service Fees, each of which is based on an annual percentage of each class' average net assets. In addition, FDC may pay financial intermediaries for selling shares of the Fund and providing shareholder support services. For the period, the Distribution and Service Fee rates, total fees and amounts retained by FDC were as follows:
| | Distribution Fee | Service Fee | Total Fees | Retained by FDC |
| Class A | - % | .25% | $194,867 | $4,428 |
| Class M | .25% | .25% | 117,966 | - |
| Class C | .75% | .25% | 335,475 | 24,479 |
| | | | $648,308 | $28,907 |
Sales Load. FDC may receive a front-end sales charge of up to 5.75% for selling Class A shares and 3.50% for selling Class M shares, some of which is paid to financial intermediaries for selling shares of the Fund. Depending on the holding period, FDC may receive contingent deferred sales charges levied on Class A, Class M and Class C redemptions. The deferred sales charges are 1.00% for Class C shares, 1.00% for certain purchases of Class A shares and .25% for certain purchases of Class M shares.
For the period, sales charge amounts retained by FDC were as follows:
| | Retained by FDC |
| Class A | $40,149 |
| Class M | 3,412 |
Class C A | 196 |
| | $43,757 |
A When Class C shares are initially sold, FDC pays commissions from its own resources to financial intermediaries through which the sales are made.
Transfer Agent Fees. Fidelity Investments Institutional Operations Company LLC (FIIOC), an affiliate of the investment adviser, is the transfer, dividend disbursing and shareholder servicing agent for each class of the Fund. FIIOC receives account fees and asset-based fees that vary according to the account size and type of account of the shareholders of the respective classes of the Fund, except for Class Z. FIIOC receives an asset-based fee of Class Z's average net assets. FIIOC pays for typesetting, printing and mailing of shareholder reports, except proxy statements.
For the period, transfer agent fees for each class were as follows:
| | Amount | % of Class-Level Average Net Assets |
| Class A | $192,552 | .25 |
| Class M | 62,058 | .26 |
| Class C | 66,798 | .20 |
| Gold | 2,182,343 | .19 |
| Class I | 227,241 | .18 |
| Class Z | 40,371 | .04 |
| | $2,771,363 | |
Accounting Fees. Fidelity Service Company, Inc. (FSC), an affiliate of the investment adviser, maintains the Fund's accounting records. The accounting fee is based on the level of average net assets for each month. For the period, the fees were equivalent to the following annual rates:
| | % of Average Net Assets |
| Gold Portfolio | .04 |
Brokerage Commissions. A portion of portfolio transactions were placed with brokerage firms which are affiliates of the investment adviser. Brokerage commissions are included in net realized gain (loss) and change in net unrealized appreciation (depreciation) in the Consolidated Statement of Operations. The commissions paid to these affiliated firms were as follows:
| | Amount |
| Gold Portfolio | $5,875 |
Interfund Lending Program. Pursuant to an Exemptive Order issued by the Securities and Exchange Commission (the SEC), the Fund, along with other registered investment companies having management contracts with Fidelity Management & Research Company LLC (FMR), or other affiliated entities of FMR, may participate in an interfund lending program. This program provides an alternative credit facility allowing the Fund to borrow from, or lend money to, other participating affiliated funds. At period end, there were no interfund loans outstanding. Activity in this program during the period for which loans were outstanding was as follows:
| | Borrower or Lender | Average Loan Balance | Weighted Average Interest Rate | Interest Expense |
| Gold Portfolio | Borrower | $ 3,344,667 | 3.64% | $2,027 |
Interfund Trades. Funds may purchase from or sell securities to other Fidelity Funds under procedures adopted by the Board. The procedures have been designed to ensure these interfund trades are executed in accordance with Rule 17a-7 of the 1940 Act. Any interfund trades are included within the respective purchases and sales amounts shown in the Purchases and Sales of Investments note. Interfund trades during the period are noted in the table below.
| | Purchases ($) | Sales ($) | Realized Gain (Loss) ($) |
| Gold Portfolio | 8,187,898 | 37,112,292 | (1,397,642) |
7. Committed Line of Credit.
Certain Funds participate with other funds managed by the investment adviser or an affiliate in a $4.25 billion credit facility (the "line of credit") to be utilized for temporary or emergency purposes to fund shareholder redemptions or for other short-term liquidity purposes. The participating funds have agreed to pay commitment fees on their pro-rata portion of the line of credit, which are reflected in Miscellaneous expenses on the Consolidated Statement of Operations, and are listed below. During the period, there were no borrowings on this line of credit.
| | Amount |
| Gold Portfolio | $2,689 |
8. Security Lending.
Funds lend portfolio securities from time to time in order to earn additional income. Lending agents are used, including National Financial Services (NFS), an affiliate of the investment adviser. Pursuant to a securities lending agreement, NFS will receive a fee, which is capped at 9.9% of a fund's daily lending revenue, for its services as lending agent. A fund may lend securities to certain qualified borrowers, including NFS. On the settlement date of the loan, a fund receives collateral (in the form of U.S. Treasury obligations, letters of credit and/or cash) against the loaned securities and maintains collateral in an amount not less than 100% of the market value of the loaned securities during the period of the loan. The market value of the loaned securities is determined at the close of business of a fund and any additional required collateral is delivered to a fund on the next business day. A fund or borrower may terminate the loan at any time, and if the borrower defaults on its obligation to return the securities loaned because of insolvency or other reasons, a fund may apply collateral received from the borrower against the obligation. A fund may experience delays and costs in recovering the securities loaned. Any cash collateral received is invested in the Fidelity Securities Lending Cash Central Fund. Any loaned securities are identified as such in the Consolidated Schedule of Investments, and the value of loaned securities and cash collateral at period end, as applicable, are presented in the Consolidated Statement of Assets and Liabilities. Security lending income represents the income earned on investing cash collateral, less rebates paid to borrowers and any lending agent fees associated with the loan, plus any premium payments received for lending certain types of securities. Security lending income is presented in the Consolidated Statement of Operations as a component of income from Fidelity Central Funds. Affiliated security lending activity, if any, was as follows:
| | Total Security Lending Fees Paid to NFS | Security Lending Income From Securities Loaned to NFS | Value of Securities Loaned to NFS at Period End |
| Gold Portfolio | $79,640 | $70 | $- |
9. Expense Reductions.
Through arrangements with the Fund's custodian, credits realized as a result of certain uninvested cash balances were used to reduce the Fund's expenses. During the period, custodian credits reduced the Fund's expenses by $10,043 . During the period, transfer agent credits reduced each class' expenses as noted in the table below.
| | Expense reduction |
| | |
| Class M | $255 |
In addition, during the period the investment adviser or an affiliate reimbursed and/or waived a portion of fund-level operating expenses in the amount of $53,134.
10. Distributions to Shareholders.
Distributions to shareholders of each class were as follows:
| | Year ended February 28, 2023 | Year ended February 28, 2022 |
| Gold Portfolio | | |
| Distributions to shareholders | | |
| Class A | $236,581 | $1,159,197 |
| Class M | 64,063 | 296,704 |
| Class C | 82,259 | 340,514 |
| Gold | 4,119,368 | 21,360,877 |
| Class I | 460,437 | 2,173,450 |
| Class Z | 357,573 | 1,796,107 |
Total | $5,320,281 | $27,126,849 |
11. Share Transactions.
Share transactions for each class were as follows and may contain in-kind transactions, automatic conversions between classes or exchanges between affiliated funds:
| | Shares | Shares | Dollars | Dollars |
| | Year ended February 28, 2023 | Year ended February 28, 2022 | Year ended February 28, 2023 | Year ended February 28, 2022 |
| Gold Portfolio | | | | |
| Class A | | | | |
| Shares sold | 1,122,921 | 1,096,721 | $27,099,950 | $29,272,417 |
| Reinvestment of distributions | 7,775 | 47,654 | 230,842 | 1,130,833 |
| Shares redeemed | (939,774) | (1,270,387) | (21,685,894) | (33,037,200) |
| Net increase (decrease) | 190,922 | (126,012) | $5,644,898 | $(2,633,950) |
| Class M | | | | |
| Shares sold | 371,999 | 261,284 | $8,541,059 | $6,743,876 |
| Reinvestment of distributions | 2,211 | 12,798 | 64,030 | 296,405 |
| Shares redeemed | (346,180) | (292,712) | (7,235,921) | (7,361,263) |
| Net increase (decrease) | 28,030 | (18,630) | $1,369,168 | $(320,982) |
| Class C | | | | |
| Shares sold | 330,090 | 196,401 | $7,857,068 | $4,759,229 |
| Reinvestment of distributions | 2,997 | 15,464 | 82,054 | 339,121 |
| Shares redeemed | (663,298) | (732,472) | (13,627,374) | (17,728,207) |
| Net increase (decrease) | (330,211) | (520,607) | $(5,688,252) | $(12,629,857) |
| Gold | | | | |
| Shares sold | 24,882,743 | 15,683,398 | $614,447,230 | $428,540,719 |
| Reinvestment of distributions | 128,260 | 836,569 | 3,933,734 | 20,495,942 |
| Shares redeemed | (17,838,751) | (20,431,260) | (424,861,608) | (537,992,891) |
| Net increase (decrease) | 7,172,252 | (3,911,293) | $193,519,356 | $(88,956,230) |
| Class I | | | | |
| Shares sold | 1,703,267 | 1,719,405 | $41,572,132 | $46,014,104 |
| Reinvestment of distributions | 14,570 | 85,689 | 447,009 | 2,100,234 |
| Shares redeemed | (2,309,414) | (1,696,668) | (53,976,142) | (45,357,188) |
| Net increase (decrease) | (591,577) | 108,426 | $(11,957,001) | $2,757,150 |
| Class Z | | | | |
| Shares sold | 2,207,248 | 1,719,289 | $52,782,706 | $46,800,221 |
| Reinvestment of distributions | 11,475 | 72,350 | 352,174 | 1,773,309 |
| Shares redeemed | (1,991,473) | (1,969,124) | (46,768,230) | (53,134,514) |
| Net increase (decrease) | 227,250 | (177,485) | $6,366,650 | $(4,560,984) |
12. Other.
A fund's organizational documents provide former and current trustees and officers with a limited indemnification against liabilities arising in connection with the performance of their duties to the fund. In the normal course of business, a fund may also enter into contracts that provide general indemnifications. A fund's maximum exposure under these arrangements is unknown as this would be dependent on future claims that may be made against a fund. The risk of material loss from such claims is considered remote.
13. Risk and Uncertainties.
Many factors affect a fund's performance. Developments that disrupt global economies and financial markets, such as pandemics, epidemics, outbreaks of infectious diseases, war, terrorism, and environmental disasters, may significantly affect a fund's investment performance. The effects of these developments to a fund will be impacted by the types of securities in which a fund invests, the financial condition, industry, economic sector, and geographic location of an issuer, and a fund's level of investment in the securities of that issuer. Significant concentrations in security types, issuers, industries, sectors, and geographic locations may magnify the factors that affect a fund's performance.
Average annual total return reflects the change in the value of an investment, assuming reinvestment of distributions from dividend income and capital gains (the profits earned upon the sale of securities that have grown in value, if any) and assuming a constant rate of performance each year. The hypothetical investment and the average annual total returns do not reflect the deduction of taxes that a shareholder would pay on fund distributions or the redemption of fund shares. During periods of reimbursement by Fidelity, a fund's total return will be greater than it would be had the reimbursement not occurred. How a fund did yesterday is no guarantee of how it will do tomorrow.
| Average Annual Total Returns |
| | | | |
Periods ended February 28, 2023 | Past 1 year | Past 5 years | Past 10 years |
| Class A (incl.5.75% sales charge) | -5.38% | 4.49% | 6.23% |
| Class M (incl.3.50% sales charge) | -3.36% | 4.70% | 6.18% |
Class C (incl. contingent deferred sales charge) | -1.33% | 4.95% | 6.22% |
| Materials Portfolio | 0.67% | 6.03% | 7.15% |
| Class I | 0.66% | 6.03% | 7.17% |
| Class Z | 0.81% | 6.17% | 7.24% |
Class C shares' contingent deferred sales charges included in the past one year, past five years and past ten years total return figures are 1%, 0% and 0%, respectively.
The initial offering of Class Z shares took place on October 2, 2018. Returns prior to October 2, 2018, are those of Class I.
| $10,000 Over 10 Years |
| |
Let's say hypothetically that $10,000 was invested in Materials Portfolio, a class of the fund, on February 28, 2013. The chart shows how the value of your investment would have changed, and also shows how the S&P 500® Index performed over the same period. |
|
|
Materials Portfolio
Market Recap:
U.S. equities returned -7.69% for the 12 months ending February 28, 2023, according to the S&P 500® index. The new year began with an encouraging upturn in January (+6.28%), but stocks lost momentum in February (-2.44%) amid higher-than-expected inflation and strong jobs data. Investors took these as signs that the economy continued to run hot, even after a year of historic policy adjustment by the Federal Reserve aimed at cooling economic growth. Record inflation in 2022 prompted the Fed to aggressively tighten monetary policy, and market interest rates eclipsed their highest level in a decade, stoking recession fears and sending stocks into bear market territory. Since March 2022, the central bank has hiked its benchmark rate eight times, by 4.5 percentage points - the fastest-ever pace of monetary tightening - while also shrinking its massive asset portfolio. The latest bump came on February 2, along with a signal that the Fed plans to lift rates in March while it considers whether and when to pause increases. Against this dynamic backdrop, stocks struggled to gain traction until a strong rally ignited heading into the summer. But in September, the index returned -9.21%, one of its worst monthly results ever, before advancing 7.56% in Q4, as risky assets regained favor. For the full 12 months, value stocks handily outpaced growth. The headwind for the latter was most pronounced in the growth-oriented communication services (-25%) and consumer discretionary (-18%) sectors. In sharp contrast, energy gained 24%.
Comments from Co-Manager Ashley Fernandes:
For the fiscal year ending February 28, 2023, the fund's share classes (excluding sales charges, if applicable) returned about 0% to 1%, roughly in line with the 0.65% advance of the MSCI U.S. IMI Materials 25/50 Linked Index and well ahead of the broad-based S&P 500 ® index. The top contributors to performance versus the sector index were stock selection and an underweighting in specialty chemicals. Also bolstering the fund's relative result was an overweighting in fertilizers & agricultural chemicals. The fund's largest individual relative contributor was an outsized stake in CF Industries Holdings, which gained roughly 9% the past 12 months. The company was among our largest holdings. Also bolstering performance was our overweighting in Albemarle, which gained roughly 27%. We decreased our investment the past year. Another notable relative contributor was an underweighting in Sherwin Williams (-12%), a position not held at period end. In contrast, a notable detractor from performance versus the sector index was an underweighting in steel. An overweighting and security selection in aluminum and stock selection in copper also hindered the fund's relative result. The fund's biggest individual relative detractor was an outsized stake in Alcoa, which returned -34% the past 12 months. Our second-largest relative detractor this period was avoiding Nucor, an index component that gained approximately 29%. Also hindering performance was our overweighting in Tronox Holdings, which returned -21%. Notable changes in positioning include a higher allocation to the commodity chemicals and industrial gases subindustries.
Note to shareholders: On January 1, 2023, Ashley Fernandes assumed sole management responsibilities for the fund after having served as co-manager with Jody Simes since April 2022.
The views expressed above reflect those of the portfolio manager(s) only through the end of the period as stated on the cover of this report and do not necessarily represent the views of Fidelity or any other person in the Fidelity organization. Any such views are subject to change at any time based upon market or other conditions and Fidelity disclaims any responsibility to update such views. These views may not be relied on as investment advice and, because investment decisions for a Fidelity fund are based on numerous factors, may not be relied on as an indication of trading intent on behalf of any Fidelity fund.
Materials Portfolio
Top Holdings (% of Fund's net assets) |
| |
| Linde PLC | 17.2 | |
| Air Products & Chemicals, Inc. | 7.5 | |
| Freeport-McMoRan, Inc. | 7.3 | |
| Corteva, Inc. | 5.9 | |
| First Quantum Minerals Ltd. | 5.1 | |
| LyondellBasell Industries NV Class A | 4.7 | |
| DuPont de Nemours, Inc. | 3.8 | |
| Celanese Corp. Class A | 3.5 | |
| CF Industries Holdings, Inc. | 3.1 | |
| Olin Corp. | 2.8 | |
| | 60.9 | |
| |
| Industries (% of Fund's net assets) |
| |
| Chemicals | 64.6 | |
| Metals & Mining | 21.4 | |
| Containers & Packaging | 8.3 | |
| Construction Materials | 4.2 | |
| |
Geographic Diversification (% of Fund's net assets) |
|
* Includes Short-Term investments and Net Other Assets (Liabilities). Percentages are based on country or territory of incorporation and are adjusted for the effect of derivatives, if applicable. |
| |
Materials Portfolio
Showing Percentage of Net Assets
| Common Stocks - 98.5% |
| | | Shares | Value ($) |
| Chemicals - 64.6% | | | |
| Commodity Chemicals - 16.4% | | | |
| Cabot Corp. (a) | | 289,600 | 23,031,888 |
| Chemtrade Logistics Income Fund | | 1,926,900 | 12,963,680 |
| Dow, Inc. | | 210,100 | 12,017,720 |
| LyondellBasell Industries NV Class A | | 542,739 | 52,097,517 |
| Olin Corp. | | 525,600 | 30,353,400 |
| Orion Engineered Carbons SA | | 194,500 | 4,959,750 |
| Tronox Holdings PLC | | 1,765,203 | 27,537,167 |
| Westlake Corp. (a) | | 139,900 | 16,667,686 |
| | | | 179,628,808 |
| Diversified Chemicals - 3.4% | | | |
| Huntsman Corp. | | 262,500 | 7,701,750 |
| The Chemours Co. LLC | | 874,303 | 29,883,677 |
| | | | 37,585,427 |
| Fertilizers & Agricultural Chemicals - 9.0% | | | |
| CF Industries Holdings, Inc. | | 396,300 | 34,038,207 |
| Corteva, Inc. | | 1,035,811 | 64,520,667 |
| | | | 98,558,874 |
| Industrial Gases - 24.7% | | | |
| Air Products & Chemicals, Inc. | | 288,200 | 82,419,436 |
| Linde PLC | | 541,486 | 188,637,477 |
| | | | 271,056,913 |
| Specialty Chemicals - 11.1% | | | |
| Albemarle Corp. | | 7,900 | 2,009,049 |
| Ashland, Inc. | | 179,000 | 18,218,620 |
| Celanese Corp. Class A | | 326,500 | 37,949,095 |
| DuPont de Nemours, Inc. | | 578,417 | 42,241,794 |
| Eastman Chemical Co. | | 70,200 | 5,981,040 |
| Element Solutions, Inc. | | 390,200 | 8,014,708 |
| RPM International, Inc. | | 85,200 | 7,551,276 |
| | | | 121,965,582 |
TOTAL CHEMICALS | | | 708,795,604 |
| Construction Materials - 4.2% | | | |
| Construction Materials - 4.2% | | | |
| Martin Marietta Materials, Inc. | | 61,900 | 22,275,953 |
| Vulcan Materials Co. | | 131,700 | 23,825,847 |
| | | | 46,101,800 |
| Containers & Packaging - 8.3% | | | |
| Metal & Glass Containers - 5.7% | | | |
| Aptargroup, Inc. | | 226,700 | 26,460,424 |
| Crown Holdings, Inc. | | 187,959 | 16,260,333 |
| Greif, Inc. Class A | | 281,200 | 19,979,260 |
| | | | 62,700,017 |
| Paper Packaging - 2.6% | | | |
| Avery Dennison Corp. | | 103,000 | 18,765,570 |
| Sealed Air Corp. | | 203,149 | 9,877,104 |
| | | | 28,642,674 |
TOTAL CONTAINERS & PACKAGING | | | 91,342,691 |
| Metals & Mining - 21.4% | | | |
| Aluminum - 2.1% | | | |
| Alcoa Corp. | | 477,100 | 23,349,274 |
| Copper - 12.4% | | | |
| First Quantum Minerals Ltd. | | 2,524,900 | 55,161,062 |
| Freeport-McMoRan, Inc. | | 1,960,300 | 80,313,491 |
| | | | 135,474,553 |
| Diversified Metals & Mining - 1.9% | | | |
| Glencore PLC | | 3,396,600 | 20,250,073 |
| Steel - 5.0% | | | |
| Commercial Metals Co. | | 319,700 | 16,544,475 |
| Reliance Steel & Aluminum Co. | | 105,200 | 26,072,768 |
| Steel Dynamics, Inc. | | 99,000 | 12,484,890 |
| | | | 55,102,133 |
TOTAL METALS & MINING | | | 234,176,033 |
| TOTAL COMMON STOCKS (Cost $796,683,232) | | | 1,080,416,128 |
| | | | |
| Money Market Funds - 2.7% |
| | | Shares | Value ($) |
| Fidelity Cash Central Fund 4.63% (b) | | 12,466,384 | 12,468,877 |
| Fidelity Securities Lending Cash Central Fund 4.63% (b)(c) | | 17,447,305 | 17,449,050 |
| TOTAL MONEY MARKET FUNDS (Cost $29,917,927) | | | 29,917,927 |
| | | | |
| TOTAL INVESTMENT IN SECURITIES - 101.2% (Cost $826,601,159) | 1,110,334,055 |
NET OTHER ASSETS (LIABILITIES) - (1.2)% | (13,033,869) |
| NET ASSETS - 100.0% | 1,097,300,186 |
| | |
Legend
| (a) | Security or a portion of the security is on loan at period end. |
| (b) | Affiliated fund that is generally available only to investment companies and other accounts managed by Fidelity Investments. The rate quoted is the annualized seven-day yield of the fund at period end. A complete unaudited listing of the fund's holdings as of its most recent quarter end is available upon request. In addition, each Fidelity Central Fund's financial statements, which are not covered by the Fund's Report of Independent Registered Public Accounting Firm, are available on the SEC's website or upon request. |
| (c) | Investment made with cash collateral received from securities on loan. |
Affiliated Central Funds
Fiscal year to date information regarding the Fund's investments in Fidelity Central Funds, including the ownership percentage, is presented below.
| Affiliate | Value, beginning of period ($) | Purchases ($) | Sales Proceeds ($) | Dividend Income ($) | Realized Gain (loss) ($) | Change in Unrealized appreciation (depreciation) ($) | Value, end of period ($) | % ownership, end of period |
| Fidelity Cash Central Fund 4.63% | 1,212,250 | 270,921,057 | 259,664,430 | 245,566 | - | - | 12,468,877 | 0.0% |
| Fidelity Securities Lending Cash Central Fund 4.63% | 20,127,155 | 202,620,830 | 205,298,935 | 15,081 | - | - | 17,449,050 | 0.1% |
| Total | 21,339,405 | 473,541,887 | 464,963,365 | 260,647 | - | - | 29,917,927 | |
| | | | | | | | | |
Amounts in the dividend income column in the above table include any capital gain distributions from underlying funds, which are presented in the corresponding line item in the Statement of Operations, if applicable.
Amount for Fidelity Securities Lending Cash Central Fund represents the income earned on investing cash collateral, less rebates paid to borrowers and any lending agent fees associated with the loan, plus any premium payments received for lending certain types of securities.
Amounts included in the purchases and sales proceeds columns may include in-kind transactions, if applicable.
Investment Valuation
The following is a summary of the inputs used, as of February 28, 2023, involving the Fund's assets and liabilities carried at fair value. The inputs or methodology used for valuing securities may not be an indication of the risk associated with investing in those securities. For more information on valuation inputs, and their aggregation into the levels used below, please refer to the Investment Valuation section in the accompanying Notes to Financial Statements.
| Valuation Inputs at Reporting Date: |
| Description | Total ($) | Level 1 ($) | Level 2 ($) | Level 3 ($) |
Investments in Securities: | | | | |
|
| Common Stocks | 1,080,416,128 | 1,060,166,055 | 20,250,073 | - |
|
| Money Market Funds | 29,917,927 | 29,917,927 | - | - |
| Total Investments in Securities: | 1,110,334,055 | 1,090,083,982 | 20,250,073 | - |
Materials Portfolio
| Statement of Assets and Liabilities |
| | | | February 28, 2023 |
| | | | | |
| Assets | | | | |
| Investment in securities, at value (including securities loaned of $16,870,503) - See accompanying schedule: | | | | |
Unaffiliated issuers (cost $796,683,232) | $ | 1,080,416,128 | | |
Fidelity Central Funds (cost $29,917,927) | | 29,917,927 | | |
| | | | | |
| | | | | |
| Total Investment in Securities (cost $826,601,159) | | | $ | 1,110,334,055 |
| Foreign currency held at value (cost $19,046) | | | | 18,872 |
| Receivable for investments sold | | | | 16,053,961 |
| Receivable for fund shares sold | | | | 453,744 |
| Dividends receivable | | | | 1,564,527 |
| Distributions receivable from Fidelity Central Funds | | | | 20,504 |
| Prepaid expenses | | | | 5,442 |
| Other receivables | | | | 170,960 |
Total assets | | | | 1,128,622,065 |
| Liabilities | | | | |
| Payable for investments purchased | $ | 11,940,264 | | |
| Payable for fund shares redeemed | | 997,681 | | |
| Accrued management fee | | 483,068 | | |
| Distribution and service plan fees payable | | 56,550 | | |
| Other affiliated payables | | 183,135 | | |
| Other payables and accrued expenses | | 212,131 | | |
| Collateral on securities loaned | | 17,449,050 | | |
| Total Liabilities | | | | 31,321,879 |
| Net Assets | | | $ | 1,097,300,186 |
| Net Assets consist of: | | | | |
| Paid in capital | | | $ | 773,543,103 |
| Total accumulated earnings (loss) | | | | 323,757,083 |
| Net Assets | | | $ | 1,097,300,186 |
| | | | | |
| Net Asset Value and Maximum Offering Price | | | | |
| Class A : | | | | |
Net Asset Value and redemption price per share ($124,776,777 ÷ 1,247,999 shares) (a) | | | $ | 99.98 |
| Maximum offering price per share (100/94.25 of $99.98) | | | $ | 106.08 |
| Class M : | | | | |
Net Asset Value and redemption price per share ($38,569,794 ÷ 390,508 shares) (a) | | | $ | 98.77 |
| Maximum offering price per share (100/96.50 of $98.77) | | | $ | 102.35 |
| Class C : | | | | |
Net Asset Value and offering price per share ($17,052,876 ÷ 177,917 shares) (a) | | | $ | 95.85 |
| Materials : | | | | |
Net Asset Value , offering price and redemption price per share ($603,330,274 ÷ 5,995,367 shares) | | | $ | 100.63 |
| Class I : | | | | |
Net Asset Value , offering price and redemption price per share ($208,630,149 ÷ 2,077,644 shares) | | | $ | 100.42 |
| Class Z : | | | | |
Net Asset Value , offering price and redemption price per share ($104,940,316 ÷ 1,046,539 shares) | | | $ | 100.27 |
(a)Redemption price per share is equal to net asset value less any applicable contingent deferred sales charge. |
| Statement of Operations |
| | | | Year ended February 28, 2023 |
| Investment Income | | | | |
| Dividends | | | $ | 19,398,883 |
| Income from Fidelity Central Funds (including $15,081 from security lending) | | | | 260,647 |
| Total Income | | | | 19,659,530 |
| Expenses | | | | |
| Management fee | $ | 5,632,622 | | |
| Transfer agent fees | | 1,875,435 | | |
| Distribution and service plan fees | | 681,630 | | |
| Accounting fees | | 323,931 | | |
| Custodian fees and expenses | | 14,513 | | |
| Independent trustees' fees and expenses | | 3,645 | | |
| Registration fees | | 113,186 | | |
| Audit | | 49,937 | | |
| Legal | | 804 | | |
| Interest | | 201 | | |
| Miscellaneous | | 7,525 | | |
| Total expenses before reductions | | 8,703,429 | | |
| Expense reductions | | (38,566) | | |
| Total expenses after reductions | | | | 8,664,863 |
| Net Investment income (loss) | | | | 10,994,667 |
| Realized and Unrealized Gain (Loss) | | | | |
| Net realized gain (loss) on: | | | | |
| Investment Securities: | | | | |
| Unaffiliated issuers | | 108,078,773 | | |
| Foreign currency transactions | | 20,417 | | |
| Total net realized gain (loss) | | | | 108,099,190 |
| Change in net unrealized appreciation (depreciation) on: | | | | |
| Investment Securities: | | | | |
| Unaffiliated issuers | | (119,331,153) | | |
| Assets and liabilities in foreign currencies | | (16,905) | | |
| Total change in net unrealized appreciation (depreciation) | | | | (119,348,058) |
| Net gain (loss) | | | | (11,248,868) |
| Net increase (decrease) in net assets resulting from operations | | | $ | (254,201) |
| Statement of Changes in Net Assets |
| |
| | Year ended February 28, 2023 | | Year ended February 28, 2022 |
| Increase (Decrease) in Net Assets | | | | |
| Operations | | | | |
| Net investment income (loss) | $ | 10,994,667 | $ | 8,580,339 |
| Net realized gain (loss) | | 108,099,190 | | 32,188,411 |
| Change in net unrealized appreciation (depreciation) | | (119,348,058) | | 129,763,897 |
| Net increase (decrease) in net assets resulting from operations | | (254,201) | | 170,532,647 |
| Distributions to shareholders | | (33,314,365) | | (8,437,183) |
| Share transactions - net increase (decrease) | | (23,554,987) | | 72,770,453 |
| Total increase (decrease) in net assets | | (57,123,553) | | 234,865,917 |
| | | | | |
| Net Assets | | | | |
| Beginning of period | | 1,154,423,739 | | 919,557,822 |
| End of period | $ | 1,097,300,186 | $ | 1,154,423,739 |
| | | | | |
| | | | | |
Financial Highlights
| Fidelity Advisor® Materials Fund Class A |
| |
| Years ended February 28, | | 2023 | | 2022 | | 2021 | | 2020 A | | 2019 |
Selected Per-Share Data | | | | | | | | | | |
| Net asset value, beginning of period | $ | 102.68 | $ | 87.03 | $ | 59.39 | $ | 69.57 | $ | 88.50 |
| Income from Investment Operations | | | | | | | | | | |
Net investment income (loss) B,C | | .79 | | .46 | | .33 | | .58 | | .84 |
| Net realized and unrealized gain (loss) | | (.54) | | 15.77 | | 27.72 | | (10.10) | | (12.01) |
| Total from investment operations | | .25 | | 16.23 | | 28.05 | | (9.52) | | (11.17) |
| Distributions from net investment income | | (.80) | | (.58) | | (.41) | | (.66) | | (.67) |
| Distributions from net realized gain | | (2.15) | | - | | - | | - | | (7.09) |
| Total distributions | | (2.95) | | (.58) | | (.41) | | (.66) | | (7.76) |
| Net asset value, end of period | $ | 99.98 | $ | 102.68 | $ | 87.03 | $ | 59.39 | $ | 69.57 |
Total Return D,E | | .39% | | 18.64% | | 47.27% | | (13.81)% | | (12.59)% |
Ratios to Average Net Assets C,F,G | | | | | | | | | | |
| Expenses before reductions | | 1.03% | | 1.03% | | 1.08% | | 1.08% | | 1.06% |
| Expenses net of fee waivers, if any | | 1.03% | | 1.03% | | 1.08% | | 1.08% | | 1.06% |
| Expenses net of all reductions | | 1.03% | | 1.03% | | 1.08% | | 1.07% | | 1.05% |
| Net investment income (loss) | | .81% | | .46% | | .48% | | .87% | | 1.08% |
| Supplemental Data | | | | | | | | | | |
| Net assets, end of period (000 omitted) | $ | 124,777 | $ | 138,219 | $ | 101,238 | $ | 76,869 | $ | 126,182 |
Portfolio turnover rate H | | 47% | | 43% | | 36% | | 69% | | 77% I |
A For the year ended February 29.
B Calculated based on average shares outstanding during the period.
C Net investment income (loss) is affected by the timing of the declaration of dividends by any underlying mutual funds or exchange-traded funds (ETFs). Net investment income (loss) of any mutual funds or ETFs is not included in the Fund's net investment income (loss) ratio.
D Total returns would have been lower if certain expenses had not been reduced during the applicable periods shown.
E Total returns do not include the effect of the sales charges.
F Fees and expenses of any underlying mutual funds or exchange-traded funds (ETFs) are not included in the Fund's expense ratio. The Fund indirectly bears its proportionate share of these expenses. For additional expense information related to investments in Fidelity Central Funds, please refer to the "Investments in Fidelity Central Funds" note found in the Notes to Financial Statements section of the most recent Annual or Semi-Annual report.
G Expense ratios reflect operating expenses of the class. Expenses before reductions do not reflect amounts reimbursed, waived, or reduced through arrangements with the investment adviser, brokerage services, or other offset arrangements, if applicable, and do not represent the amount paid by the class during periods when reimbursements, waivers or reductions occur.
H Amount does not include the portfolio activity of any underlying mutual funds or exchange-traded funds (ETFs).
I Portfolio turnover rate excludes securities received or delivered in-kind.
| Fidelity Advisor® Materials Fund Class M |
| |
| Years ended February 28, | | 2023 | | 2022 | | 2021 | | 2020 A | | 2019 |
Selected Per-Share Data | | | | | | | | | | |
| Net asset value, beginning of period | $ | 101.52 | $ | 86.14 | $ | 58.84 | $ | 68.98 | $ | 87.79 |
| Income from Investment Operations | | | | | | | | | | |
Net investment income (loss) B,C | | .54 | | .20 | | .14 | | .39 | | .61 |
| Net realized and unrealized gain (loss) | | (.53) | | 15.59 | | 27.42 | | (10.01) | | (11.88) |
| Total from investment operations | | .01 | | 15.79 | | 27.56 | | (9.62) | | (11.27) |
| Distributions from net investment income | | (.61) | | (.41) | | (.26) | | (.52) | | (.45) |
| Distributions from net realized gain | | (2.15) | | - | | - | | - | | (7.09) |
| Total distributions | | (2.76) | | (.41) | | (.26) | | (.52) | | (7.54) |
| Net asset value, end of period | $ | 98.77 | $ | 101.52 | $ | 86.14 | $ | 58.84 | $ | 68.98 |
Total Return D,E | | .15% | | 18.32% | | 46.86% | | (14.05)% | | (12.84)% |
Ratios to Average Net Assets C,F,G | | | | | | | | | | |
| Expenses before reductions | | 1.28% | | 1.29% | | 1.36% | | 1.37% | | 1.35% |
| Expenses net of fee waivers, if any | | 1.28% | | 1.29% | | 1.36% | | 1.36% | | 1.35% |
| Expenses net of all reductions | | 1.28% | | 1.29% | | 1.36% | | 1.36% | | 1.34% |
| Net investment income (loss) | | .56% | | .20% | | .21% | | .58% | | .79% |
| Supplemental Data | | | | | | | | | | |
| Net assets, end of period (000 omitted) | $ | 38,570 | $ | 37,100 | $ | 24,768 | $ | 19,423 | $ | 27,436 |
Portfolio turnover rate H | | 47% | | 43% | | 36% | | 69% | | 77% I |
A For the year ended February 29.
B Calculated based on average shares outstanding during the period.
C Net investment income (loss) is affected by the timing of the declaration of dividends by any underlying mutual funds or exchange-traded funds (ETFs). Net investment income (loss) of any mutual funds or ETFs is not included in the Fund's net investment income (loss) ratio.
D Total returns would have been lower if certain expenses had not been reduced during the applicable periods shown.
E Total returns do not include the effect of the sales charges.
F Fees and expenses of any underlying mutual funds or exchange-traded funds (ETFs) are not included in the Fund's expense ratio. The Fund indirectly bears its proportionate share of these expenses. For additional expense information related to investments in Fidelity Central Funds, please refer to the "Investments in Fidelity Central Funds" note found in the Notes to Financial Statements section of the most recent Annual or Semi-Annual report.
G Expense ratios reflect operating expenses of the class. Expenses before reductions do not reflect amounts reimbursed, waived, or reduced through arrangements with the investment adviser, brokerage services, or other offset arrangements, if applicable, and do not represent the amount paid by the class during periods when reimbursements, waivers or reductions occur.
H Amount does not include the portfolio activity of any underlying mutual funds or exchange-traded funds (ETFs).
I Portfolio turnover rate excludes securities received or delivered in-kind.
| Fidelity Advisor® Materials Fund Class C |
| |
| Years ended February 28, | | 2023 | | 2022 | | 2021 | | 2020 A | | 2019 |
Selected Per-Share Data | | | | | | | | | | |
| Net asset value, beginning of period | $ | 98.63 | $ | 83.76 | $ | 57.30 | $ | 67.13 | $ | 85.52 |
| Income from Investment Operations | | | | | | | | | | |
Net investment income (loss) B,C | | .06 | | (.28) | | (.18) | | .08 | | .25 |
| Net realized and unrealized gain (loss) | | (.53) | | 15.15 | | 26.64 | | (9.76) | | (11.50) |
| Total from investment operations | | (.47) | | 14.87 | | 26.46 | | (9.68) | | (11.25) |
| Distributions from net investment income | | (.16) | | - | | - | | (.15) | | (.04) |
| Distributions from net realized gain | | (2.15) | | - | | - | | - | | (7.09) |
| Total distributions | | (2.31) | | - | | - | | (.15) | | (7.14) D |
| Net asset value, end of period | $ | 95.85 | $ | 98.63 | $ | 83.76 | $ | 57.30 | $ | 67.13 |
Total Return E,F | | (.36)% | | 17.75% | | 46.18% | | (14.46)% | | (13.24)% |
Ratios to Average Net Assets C,G,H | | | | | | | | | | |
| Expenses before reductions | | 1.78% | | 1.78% | | 1.83% | | 1.82% | | 1.81% |
| Expenses net of fee waivers, if any | | 1.78% | | 1.78% | | 1.83% | | 1.82% | | 1.81% |
| Expenses net of all reductions | | 1.78% | | 1.78% | | 1.83% | | 1.81% | | 1.79% |
| Net investment income (loss) | | .06% | | (.29)% | | (.27)% | | .12% | | .33% |
| Supplemental Data | | | | | | | | | | |
| Net assets, end of period (000 omitted) | $ | 17,053 | $ | 21,261 | $ | 23,296 | $ | 24,239 | $ | 51,659 |
Portfolio turnover rate I | | 47% | | 43% | | 36% | | 69% | | 77% J |
A For the year ended February 29.
B Calculated based on average shares outstanding during the period.
C Net investment income (loss) is affected by the timing of the declaration of dividends by any underlying mutual funds or exchange-traded funds (ETFs). Net investment income (loss) of any mutual funds or ETFs is not included in the Fund's net investment income (loss) ratio.
D Total distributions per share do not sum due to rounding.
E Total returns would have been lower if certain expenses had not been reduced during the applicable periods shown.
F Total returns do not include the effect of the contingent deferred sales charge.
G Fees and expenses of any underlying mutual funds or exchange-traded funds (ETFs) are not included in the Fund's expense ratio. The Fund indirectly bears its proportionate share of these expenses. For additional expense information related to investments in Fidelity Central Funds, please refer to the "Investments in Fidelity Central Funds" note found in the Notes to Financial Statements section of the most recent Annual or Semi-Annual report.
H Expense ratios reflect operating expenses of the class. Expenses before reductions do not reflect amounts reimbursed, waived, or reduced through arrangements with the investment adviser, brokerage services, or other offset arrangements, if applicable, and do not represent the amount paid by the class during periods when reimbursements, waivers or reductions occur.
I Amount does not include the portfolio activity of any underlying mutual funds or exchange-traded funds (ETFs).
J Portfolio turnover rate excludes securities received or delivered in-kind.
| Years ended February 28, | | 2023 | | 2022 | | 2021 | | 2020 A | | 2019 |
Selected Per-Share Data | | | | | | | | | | |
| Net asset value, beginning of period | $ | 103.29 | $ | 87.46 | $ | 59.63 | $ | 69.84 | $ | 88.90 |
| Income from Investment Operations | | | | | | | | | | |
Net investment income (loss) B,C | | 1.07 | | .75 | | .53 | | .77 | | 1.06 |
| Net realized and unrealized gain (loss) | | (.55) | | 15.86 | | 27.87 | | (10.14) | | (12.09) |
| Total from investment operations | | .52 | | 16.61 | | 28.40 | | (9.37) | | (11.03) |
| Distributions from net investment income | | (1.03) | | (.78) | | (.57) | | (.84) | | (.93) |
| Distributions from net realized gain | | (2.15) | | - | | - | | - | | (7.09) |
| Total distributions | | (3.18) | | (.78) | | (.57) | | (.84) | | (8.03) D |
| Net asset value, end of period | $ | 100.63 | $ | 103.29 | $ | 87.46 | $ | 59.63 | $ | 69.84 |
Total Return E | | .67% | | 18.98% | | 47.68% | | (13.57)% | | (12.35)% |
Ratios to Average Net Assets C,F,G | | | | | | | | | | |
| Expenses before reductions | | .76% | | .75% | | .80% | | .80% | | .79% |
| Expenses net of fee waivers, if any | | .75% | | .74% | | .80% | | .80% | | .79% |
| Expenses net of all reductions | | .75% | | .74% | | .80% | | .79% | | .78% |
| Net investment income (loss) | | 1.09% | | .75% | | .76% | | 1.14% | | 1.35% |
| Supplemental Data | | | | | | | | | | |
| Net assets, end of period (000 omitted) | $ | 603,330 | $ | 645,773 | $ | 533,073 | $ | 405,668 | $ | 626,759 |
Portfolio turnover rate H | | 47% | | 43% | | 36% | | 69% | | 77% I |
A For the year ended February 29.
B Calculated based on average shares outstanding during the period.
C Net investment income (loss) is affected by the timing of the declaration of dividends by any underlying mutual funds or exchange-traded funds (ETFs). Net investment income (loss) of any mutual funds or ETFs is not included in the Fund's net investment income (loss) ratio.
D Total distributions per share do not sum due to rounding.
E Total returns would have been lower if certain expenses had not been reduced during the applicable periods shown.
F Fees and expenses of any underlying mutual funds or exchange-traded funds (ETFs) are not included in the Fund's expense ratio. The Fund indirectly bears its proportionate share of these expenses. For additional expense information related to investments in Fidelity Central Funds, please refer to the "Investments in Fidelity Central Funds" note found in the Notes to Financial Statements section of the most recent Annual or Semi-Annual report.
G Expense ratios reflect operating expenses of the class. Expenses before reductions do not reflect amounts reimbursed, waived, or reduced through arrangements with the investment adviser, brokerage services, or other offset arrangements, if applicable, and do not represent the amount paid by the class during periods when reimbursements, waivers or reductions occur.
H Amount does not include the portfolio activity of any underlying mutual funds or exchange-traded funds (ETFs).
I Portfolio turnover rate excludes securities received or delivered in-kind.
| Fidelity Advisor® Materials Fund Class I |
| |
| Years ended February 28, | | 2023 | | 2022 | | 2021 | | 2020 A | | 2019 |
Selected Per-Share Data | | | | | | | | | | |
| Net asset value, beginning of period | $ | 103.07 | $ | 87.29 | $ | 59.52 | $ | 69.70 | $ | 88.73 |
| Income from Investment Operations | | | | | | | | | | |
Net investment income (loss) B,C | | 1.06 | | .74 | | .55 | | .78 | | 1.07 |
| Net realized and unrealized gain (loss) | | (.54) | | 15.83 | | 27.80 | | (10.12) | | (12.08) |
| Total from investment operations | | .52 | | 16.57 | | 28.35 | | (9.34) | | (11.01) |
| Distributions from net investment income | | (1.02) | | (.79) | | (.58) | | (.84) | | (.93) |
| Distributions from net realized gain | | (2.15) | | - | | - | | - | | (7.09) |
| Total distributions | | (3.17) | | (.79) | | (.58) | | (.84) | | (8.02) |
| Net asset value, end of period | $ | 100.42 | $ | 103.07 | $ | 87.29 | $ | 59.52 | $ | 69.70 |
Total Return D | | .66% | | 18.97% | | 47.70% | | (13.55)% | | (12.34)% |
Ratios to Average Net Assets C,E,F | | | | | | | | | | |
| Expenses before reductions | | .76% | | .75% | | .78% | | .79% | | .78% |
| Expenses net of fee waivers, if any | | .76% | | .75% | | .78% | | .79% | | .78% |
| Expenses net of all reductions | | .76% | | .75% | | .78% | | .78% | | .77% |
| Net investment income (loss) | | 1.08% | | .74% | | .78% | | 1.16% | | 1.36% |
| Supplemental Data | | | | | | | | | | |
| Net assets, end of period (000 omitted) | $ | 208,630 | $ | 238,282 | $ | 190,132 | $ | 137,887 | $ | 254,240 |
Portfolio turnover rate G | | 47% | | 43% | | 36% | | 69% | | 77% H |
A For the year ended February 29.
B Calculated based on average shares outstanding during the period.
C Net investment income (loss) is affected by the timing of the declaration of dividends by any underlying mutual funds or exchange-traded funds (ETFs). Net investment income (loss) of any mutual funds or ETFs is not included in the Fund's net investment income (loss) ratio.
D Total returns would have been lower if certain expenses had not been reduced during the applicable periods shown.
E Fees and expenses of any underlying mutual funds or exchange-traded funds (ETFs) are not included in the Fund's expense ratio. The Fund indirectly bears its proportionate share of these expenses. For additional expense information related to investments in Fidelity Central Funds, please refer to the "Investments in Fidelity Central Funds" note found in the Notes to Financial Statements section of the most recent Annual or Semi-Annual report.
F Expense ratios reflect operating expenses of the class. Expenses before reductions do not reflect amounts reimbursed, waived, or reduced through arrangements with the investment adviser, brokerage services, or other offset arrangements, if applicable, and do not represent the amount paid by the class during periods when reimbursements, waivers or reductions occur.
G Amount does not include the portfolio activity of any underlying mutual funds or exchange-traded funds (ETFs).
H Portfolio turnover rate excludes securities received or delivered in-kind.
| Fidelity Advisor® Materials Fund Class Z |
| |
| Years ended February 28, | | 2023 | | 2022 | | 2021 | | 2020 A | | 2019 B |
Selected Per-Share Data | | | | | | | | | | |
| Net asset value, beginning of period | $ | 102.92 | $ | 87.14 | $ | 59.40 | $ | 69.58 | $ | 79.81 |
| Income from Investment Operations | | | | | | | | | | |
Net investment income (loss) C,D | | 1.20 | | .88 | | .67 | | .88 | | .62 |
| Net realized and unrealized gain (loss) | | (.54) | | 15.81 | | 27.75 | | (10.10) | | (6.96) |
| Total from investment operations | | .66 | | 16.69 | | 28.42 | | (9.22) | | (6.34) |
| Distributions from net investment income | | (1.16) | | (.91) | | (.68) | | (.96) | | (.96) |
| Distributions from net realized gain | | (2.15) | | - | | - | | - | | (2.93) |
| Total distributions | | (3.31) | | (.91) | | (.68) | | (.96) | | (3.89) |
| Net asset value, end of period | $ | 100.27 | $ | 102.92 | $ | 87.14 | $ | 59.40 | $ | 69.58 |
Total Return E,F | | .81% | | 19.14% | | 47.92% | | (13.43)% | | (7.35)% |
Ratios to Average Net Assets D,G,H | | | | | | | | | | |
| Expenses before reductions | | .62% | | .62% | | .64% | | .63% | | .63% I |
| Expenses net of fee waivers, if any | | .61% | | .62% | | .64% | | .63% | | .62% I |
| Expenses net of all reductions | | .61% | | .62% | | .63% | | .62% | | .61% I |
| Net investment income (loss) | | 1.23% | | .88% | | .93% | | 1.31% | | 2.27% I |
| Supplemental Data | | | | | | | | | | |
| Net assets, end of period (000 omitted) | $ | 104,940 | $ | 73,790 | $ | 47,051 | $ | 13,267 | $ | 10,039 |
Portfolio turnover rate J | | 47% | | 43% | | 36% | | 69% | | 77% K |
A For the year ended February 29.
B For the period October 2, 2018 (commencement of sale of shares) through February 28, 2019.
C Calculated based on average shares outstanding during the period.
D Net investment income (loss) is affected by the timing of the declaration of dividends by any underlying mutual funds or exchange-traded funds (ETFs). Net investment income (loss) of any mutual funds or ETFs is not included in the Fund's net investment income (loss) ratio.
E Total returns for periods of less than one year are not annualized.
F Total returns would have been lower if certain expenses had not been reduced during the applicable periods shown.
G Fees and expenses of any underlying mutual funds or exchange-traded funds (ETFs) are not included in the Fund's expense ratio. The Fund indirectly bears its proportionate share of these expenses. For additional expense information related to investments in Fidelity Central Funds, please refer to the "Investments in Fidelity Central Funds" note found in the Notes to Financial Statements section of the most recent Annual or Semi-Annual report.
H Expense ratios reflect operating expenses of the class. Expenses before reductions do not reflect amounts reimbursed, waived, or reduced through arrangements with the investment adviser, brokerage services, or other offset arrangements, if applicable, and do not represent the amount paid by the class during periods when reimbursements, waivers or reductions occur.
I Annualized.
J Amount does not include the portfolio activity of any underlying mutual funds or exchange-traded funds (ETFs).
K Portfolio turnover rate excludes securities received or delivered in-kind.
For the period ended February 28, 2023
1. Organization.
Materials Portfolio (the Fund) is a non-diversified fund of Fidelity Select Portfolios (the Trust) and is authorized to issue an unlimited number of shares. The Trust is registered under the Investment Company Act of 1940, as amended (the 1940 Act), as an open-end management investment company organized as a Massachusetts business trust. The Fund invests primarily in securities of companies whose principal business activities fall within specific industries. The Fund offers Fidelity Advisor Materials Fund Class A (Class A), Fidelity Advisor Materials Fund Class M (Class M), Fidelity Advisor Materials Fund Class C (Class C), Materials Portfolio (Materials), Fidelity Advisor Materials Fund Class I (Class I) and Fidelity Advisor Materials Fund Class Z (Class Z) shares, each of which has equal rights as to assets and voting privileges. Each class has exclusive voting rights with respect to matters that affect that class. Class C shares will automatically convert to Class A shares after a holding period of eight years from the initial date of purchase, with certain exceptions.
2. Investments in Fidelity Central Funds.
Funds may invest in Fidelity Central Funds, which are open-end investment companies generally available only to other investment companies and accounts managed by the investment adviser and its affiliates. The Schedule of Investments lists any Fidelity Central Funds held as an investment as of period end, but does not include the underlying holdings of each Fidelity Central Fund. An investing fund indirectly bears its proportionate share of the expenses of the underlying Fidelity Central Funds.
Based on its investment objective, each Fidelity Central Fund may invest or participate in various investment vehicles or strategies that are similar to those of the investing fund. These strategies are consistent with the investment objectives of the investing fund and may involve certain economic risks which may cause a decline in value of each of the Fidelity Central Funds and thus a decline in the value of the investing fund.
| Fidelity Central Fund | Investment Manager | Investment Objective | Investment Practices | Expense Ratio A |
| Fidelity Money Market Central Funds | Fidelity Management & Research Company LLC (FMR) | Each fund seeks to obtain a high level of current income consistent with the preservation of capital and liquidity. | Short-term Investments | Less than .005% |
A Expenses expressed as a percentage of average net assets and are as of each underlying Central Fund's most recent annual or semi-annual shareholder report.
A complete unaudited list of holdings for each Fidelity Central Fund is available upon request or at the Securities and Exchange Commission website at www.sec.gov. In addition, the financial statements of the Fidelity Central Funds which contain the significant accounting policies (including investment valuation policies) of those funds, and are not covered by the Report of Independent Registered Public Accounting Firm, are available on the Securities and Exchange Commission website or upon request.
3. Significant Accounting Policies.
The Fund is an investment company and applies the accounting and reporting guidance of the Financial Accounting Standards Board (FASB) Accounting Standards Codification Topic 946 Financial Services - Investment Companies . The financial statements have been prepared in conformity with accounting principles generally accepted in the United States of America (GAAP), which require management to make certain estimates and assumptions at the date of the financial statements. Actual results could differ from those estimates. Subsequent events, if any, through the date that the financial statements were issued have been evaluated in the preparation of the financial statements. The Fund's Schedule of Investments lists any underlying mutual funds or exchange-traded funds (ETFs) but does not include the underlying holdings of these funds. The following summarizes the significant accounting policies of the Fund:
Investment Valuation. Investments are valued as of 4:00 p.m. Eastern time on the last calendar day of the period. The Board of Trustees (the Board) has designated the Fund's investment adviser as the valuation designee responsible for the fair valuation function and performing fair value determinations as needed. The investment adviser has established a Fair Value Committee (the Committee) to carry out the day-to-day fair valuation responsibilities and has adopted policies and procedures to govern the fair valuation process and the activities of the Committee. In accordance with these fair valuation policies and procedures, which have been approved by the Board, the Fund attempts to obtain prices from one or more third party pricing services or brokers to value its investments. When current market prices, quotations or currency exchange rates are not readily available or reliable, investments will be fair valued in good faith by the Committee, in accordance with the policies and procedures. Factors used in determining fair value vary by investment type and may include market or investment specific events, transaction data, estimated cash flows, and market observations of comparable investments. The frequency that the fair valuation procedures are used cannot be predicted and they may be utilized to a significant extent. The Committee manages the Fund's fair valuation practices and maintains the fair valuation policies and procedures. The Fund's investment adviser reports to the Board information regarding the fair valuation process and related material matters.
The Fund categorizes the inputs to valuation techniques used to value its investments into a disclosure hierarchy consisting of three levels as shown below:
Level 1 - unadjusted quoted prices in active markets for identical investments
Level 2 - other significant observable inputs (including quoted prices for similar investments, interest rates, prepayment speeds, etc.)
Level 3 - unobservable inputs (including the Fund's own assumptions based on the best information available)
Valuation techniques used to value the Fund's investments by major category are as follows:
Equity securities, including restricted securities, for which market quotations are readily available, are valued at the last reported sale price or official closing price as reported by a third party pricing service on the primary market or exchange on which they are traded and are categorized as Level 1 in the hierarchy. In the event there were no sales during the day or closing prices are not available, securities are valued at the last quoted bid price or may be valued using the last available price and are generally categorized as Level 2 in the hierarchy. For foreign equity securities, when market or security specific events arise, comparisons to the valuation of American Depositary Receipts (ADRs), futures contracts, ETFs and certain indexes as well as quoted prices for similar securities may be used and would be categorized as Level 2 in the hierarchy. For equity securities, including restricted securities, where observable inputs are limited, assumptions about market activity and risk are used and these securities may be categorized as Level 3 in the hierarchy.
Investments in open-end mutual funds, including the Fidelity Central Funds, are valued at their closing net asset value (NAV) each business day and are categorized as Level 1 in the hierarchy.
Changes in valuation techniques may result in transfers in or out of an assigned level within the disclosure hierarchy. The aggregate value of investments by input level as of February 28, 2023 is included at the end of the Fund's Schedule of Investments.
Foreign Currency. Certain Funds may use foreign currency contracts to facilitate transactions in foreign-denominated securities. Gains and losses from these transactions may arise from changes in the value of the foreign currency or if the counterparties do not perform under the contracts' terms.
Foreign-denominated assets, including investment securities, and liabilities are translated into U.S. dollars at the exchange rates at period end. Purchases and sales of investment securities, income and dividends received, and expenses denominated in foreign currencies are translated into U.S. dollars at the exchange rate in effect on the transaction date.
The effects of exchange rate fluctuations on investments are included with the net realized and unrealized gain (loss) on investment securities. Other foreign currency transactions resulting in realized and unrealized gain (loss) are disclosed separately.
Investment Transactions and Income. For financial reporting purposes, the Fund's investment holdings and NAV include trades executed through the end of the last business day of the period. The NAV per share for processing shareholder transactions is calculated as of the close of business of the New York Stock Exchange (NYSE), normally 4:00 p.m. Eastern time and includes trades executed through the end of the prior business day. Gains and losses on securities sold are determined on the basis of identified cost and include proceeds received from litigation. Commissions paid to certain brokers with whom the investment adviser, or its affiliates, places trades on behalf of a fund include an amount in addition to trade execution, which may be rebated back to a fund. Any such rebates are included in net realized gain (loss) on investments in the Statement of Operations. Dividend income is recorded on the ex-dividend date, except for certain dividends from foreign securities where the ex-dividend date may have passed, which are recorded as soon as the Fund is informed of the ex-dividend date. Non-cash dividends included in dividend income, if any, are recorded at the fair market value of the securities received. Income and capital gain distributions from Fidelity Central Funds, if any, are recorded on the ex-dividend date. Certain distributions received by the Fund represent a return of capital or capital gain. The Fund determines the components of these distributions subsequent to the ex-dividend date, based upon receipt of tax filings or other correspondence relating to the underlying investment. These distributions are recorded as a reduction of cost of investments and/or as a realized gain. Investment income is recorded net of foreign taxes withheld where recovery of such taxes is uncertain. Funds may file withholding tax reclaims in certain jurisdictions to recover a portion of amounts previously withheld. Any withholding tax reclaims income is included in the Statement of Operations in dividends. Any receivables for withholding tax reclaims are included in the Statement of Assets and Liabilities in dividends receivable.
Class Allocations and Expenses. Investment income, realized and unrealized capital gains and losses, common expenses of a fund, and certain fund-level expense reductions, if any, are allocated daily on a pro-rata basis to each class based on the relative net assets of each class to the total net assets of a fund. Each class differs with respect to transfer agent and distribution and service plan fees incurred, as applicable. Certain expense reductions may also differ by class, if applicable. For the reporting period, the allocated portion of income and expenses to each class as a percent of its average net assets may vary due to the timing of recording these transactions in relation to fluctuating net assets of the classes. Expenses directly attributable to a fund are charged to that fund. Expenses attributable to more than one fund are allocated among the respective funds on the basis of relative net assets or other appropriate methods. Expenses included in the accompanying financial statements reflect the expenses of that fund and do not include any expenses associated with any underlying mutual funds or exchange-traded funds. Although not included in a fund's expenses, a fund indirectly bears its proportionate share of these expenses through the net asset value of each underlying mutual fund or exchange-traded fund. Expense estimates are accrued in the period to which they relate and adjustments are made when actual amounts are known.
Deferred Trustee Compensation. Under a Deferred Compensation Plan (the Plan) for certain Funds, certain independent Trustees have elected to defer receipt of a portion of their annual compensation. Deferred amounts are invested in affiliated mutual funds, are marked-to-market and remain in a fund until distributed in accordance with the Plan. The investment of deferred amounts and the offsetting payable to the Trustees presented below are included in the accompanying Statement of Assets and Liabilities in other receivables and other payables and accrued expenses, as applicable.
| Materials Portfolio | $170,960 |
Income Tax Information and Distributions to Shareholders. Each year, the Fund intends to qualify as a regulated investment company under Subchapter M of the Internal Revenue Code, including distributing substantially all of its taxable income and realized gains. As a result, no provision for U.S. Federal income taxes is required. As of February 28, 2023, the Fund did not have any unrecognized tax benefits in the financial statements; nor is the Fund aware of any tax positions for which it is reasonably possible that the total amounts of unrecognized tax benefits will significantly change in the next twelve months. The Fund files a U.S. federal tax return, in addition to state and local tax returns as required. The Fund's federal income tax returns are subject to examination by the Internal Revenue Service (IRS) for a period of three fiscal years after they are filed. State and local tax returns may be subject to examination for an additional fiscal year depending on the jurisdiction. Foreign taxes are provided for based on the Fund's understanding of the tax rules and rates that exist in the foreign markets in which it invests.
Distributions are declared and recorded on the ex-dividend date. Income and capital gain distributions are declared separately for each class. Income and capital gain distributions are determined in accordance with income tax regulations, which may differ from GAAP. In addition, the Fund claimed a portion of the payment made to redeeming shareholders as a distribution for income tax purposes.
Capital accounts within the financial statements are adjusted for permanent book-tax differences. These adjustments have no impact on net assets or the results of operations. Capital accounts are not adjusted for temporary book-tax differences which will reverse in a subsequent period.
Book-tax differences are primarily due to foreign currency transactions, deferred Trustees compensation, capital loss carryforwards and losses deferred due to wash sales and excise tax regulations.
As of period end, the cost and unrealized appreciation (depreciation) in securities, and derivatives if applicable, for federal income tax purposes were as follows:
| Gross unrealized appreciation | $298,730,549 |
| Gross unrealized depreciation | (17,040,907) |
| Net unrealized appreciation (depreciation) | $281,689,642 |
| Tax Cost | $828,644,413 |
The tax-based components of distributable earnings as of period end were as follows:
| Undistributed ordinary income | $404,924 |
| Undistributed long-term capital gain | $41,868,671 |
| Net unrealized appreciation (depreciation) on securities and other investments | $281,655,866 |
The tax character of distributions paid was as follows:
| | February 28, 2023 | February 28, 2022 |
| Ordinary Income | $10,457,127 | $ 8,437,183 |
| Long-term Capital Gains | 22,857,238 | - |
| Total | $33,314,365 | $ 8,437,183 |
4. Purchases and Sales of Investments.
Purchases and sales of securities, other than short-term securities and in-kind transactions, as applicable, are noted in the table below.
| | Purchases ($) | Sales ($) |
| Materials Portfolio | 504,389,945 | 559,316,282 |
5. Fees and Other Transactions with Affiliates.
Management Fee. Fidelity Management & Research Company LLC (the investment adviser) and its affiliates provide the Fund with investment management related services for which the Fund pays a monthly management fee. The management fee is the sum of an individual fund fee rate that is based on an annual rate of .30% of the Fund's average net assets and an annualized group fee rate that averaged .23% during the period. The group fee rate is based upon the monthly average net assets of a group of registered investment companies with which the investment adviser has management contracts. The group fee rate decreases as assets under management increase and increases as assets under management decrease. For the reporting period, the total annual management fee rate was .53% of the Fund's average net assets.
Distribution and Service Plan Fees. In accordance with Rule 12b-1 of the 1940 Act, the Fund has adopted separate Distribution and Service Plans for each class of shares. Certain classes pay Fidelity Distributors Company LLC (FDC), an affiliate of the investment adviser, separate Distribution and Service Fees, each of which is based on an annual percentage of each class' average net assets. In addition, FDC may pay financial intermediaries for selling shares of the Fund and providing shareholder support services. For the period, the Distribution and Service Fee rates, total fees and amounts retained by FDC were as follows:
| | Distribution Fee | Service Fee | Total Fees | Retained by FDC |
| Class A | - % | .25% | $313,970 | $5,234 |
| Class M | .25% | .25% | 181,244 | 496 |
| Class C | .75% | .25% | 186,416 | 27,734 |
| | | | $681,630 | $33,464 |
Sales Load. FDC may receive a front-end sales charge of up to 5.75% for selling Class A shares and 3.50% for selling Class M shares, some of which is paid to financial intermediaries for selling shares of the Fund. Depending on the holding period, FDC may receive contingent deferred sales charges levied on Class A, Class M and Class C redemptions. The deferred sales charges are 1.00% for Class C shares, 1.00% for certain purchases of Class A shares and .25% for certain purchases of Class M shares.
For the period, sales charge amounts retained by FDC were as follows:
| | Retained by FDC |
| Class A | $20,160 |
| Class M | 2,307 |
Class C A | 106 |
| | $22,573 |
A When Class C shares are initially sold, FDC pays commissions from its own resources to financial intermediaries through which the sales are made.
Transfer Agent Fees. Fidelity Investments Institutional Operations Company LLC (FIIOC), an affiliate of the investment adviser, is the transfer, dividend disbursing and shareholder servicing agent for each class of the Fund. FIIOC receives account fees and asset-based fees that vary according to the account size and type of account of the shareholders of the respective classes of the Fund, except for Class Z. FIIOC receives an asset-based fee of Class Z's average net assets. FIIOC pays for typesetting, printing and mailing of shareholder reports, except proxy statements.
For the period, transfer agent fees for each class were as follows:
| | Amount | % of Class-Level Average Net Assets |
| Class A | $257,456 | .20 |
| Class M | 74,589 | .21 |
| Class C | 38,561 | .21 |
| Materials | 1,069,263 | .18 |
| Class I | 402,014 | .18 |
| Class Z | 33,552 | .04 |
| | $1,875,435 | |
Accounting Fees. Fidelity Service Company, Inc. (FSC), an affiliate of the investment adviser, maintains the Fund's accounting records. The accounting fee is based on the level of average net assets for each month. For the period, the fees were equivalent to the following annual rates:
| | % of Average Net Assets |
| Materials Portfolio | .03 |
Brokerage Commissions. A portion of portfolio transactions were placed with brokerage firms which are affiliates of the investment adviser. Brokerage commissions are included in net realized gain (loss) and change in net unrealized appreciation (depreciation) in the Statement of Operations. The commissions paid to these affiliated firms were as follows:
| | Amount |
| Materials Portfolio | $6,556 |
Interfund Lending Program. Pursuant to an Exemptive Order issued by the Securities and Exchange Commission (the SEC), the Fund, along with other registered investment companies having management contracts with Fidelity Management & Research Company LLC (FMR), or other affiliated entities of FMR, may participate in an interfund lending program. This program provides an alternative credit facility allowing the Fund to borrow from, or lend money to, other participating affiliated funds. At period end, there were no interfund loans outstanding. Activity in this program during the period for which loans were outstanding was as follows:
| | Borrower or Lender | Average Loan Balance | Weighted Average Interest Rate | Interest Expense |
| Materials Portfolio | Borrower | $ 7,643,667 | .32% | $201 |
Interfund Trades. Funds may purchase from or sell securities to other Fidelity Funds under procedures adopted by the Board. The procedures have been designed to ensure these interfund trades are executed in accordance with Rule 17a-7 of the 1940 Act. Any interfund trades are included within the respective purchases and sales amounts shown in the Purchases and Sales of Investments note. Interfund trades during the period are noted in the table below.
| | Purchases ($) | Sales ($) | Realized Gain (Loss) ($) |
| Materials Portfolio | 23,186,744 | 9,817,568 | 1,313,266 |
6. Committed Line of Credit.
Certain Funds participate with other funds managed by the investment adviser or an affiliate in a $4.25 billion credit facility (the "line of credit") to be utilized for temporary or emergency purposes to fund shareholder redemptions or for other short-term liquidity purposes. The participating funds have agreed to pay commitment fees on their pro-rata portion of the line of credit, which are reflected in Miscellaneous expenses on the Statement of Operations, and are listed below. During the period, there were no borrowings on this line of credit.
| | Amount |
| Materials Portfolio | $1,920 |
7. Security Lending.
Funds lend portfolio securities from time to time in order to earn additional income. Lending agents are used, including National Financial Services (NFS), an affiliate of the investment adviser. Pursuant to a securities lending agreement, NFS will receive a fee, which is capped at 9.9% of a fund's daily lending revenue, for its services as lending agent. A fund may lend securities to certain qualified borrowers, including NFS. On the settlement date of the loan, a fund receives collateral (in the form of U.S. Treasury obligations, letters of credit and/or cash) against the loaned securities and maintains collateral in an amount not less than 100% of the market value of the loaned securities during the period of the loan. The market value of the loaned securities is determined at the close of business of a fund and any additional required collateral is delivered to a fund on the next business day. A fund or borrower may terminate the loan at any time, and if the borrower defaults on its obligation to return the securities loaned because of insolvency or other reasons, a fund may apply collateral received from the borrower against the obligation. A fund may experience delays and costs in recovering the securities loaned. Any cash collateral received is invested in the Fidelity Securities Lending Cash Central Fund. Any loaned securities are identified as such in the Schedule of Investments, and the value of loaned securities and cash collateral at period end, as applicable, are presented in the Statement of Assets and Liabilities. Security lending income represents the income earned on investing cash collateral, less rebates paid to borrowers and any lending agent fees associated with the loan, plus any premium payments received for lending certain types of securities. Security lending income is presented in the Statement of Operations as a component of income from Fidelity Central Funds. Affiliated security lending activity, if any, was as follows:
| | Total Security Lending Fees Paid to NFS | Security Lending Income From Securities Loaned to NFS | Value of Securities Loaned to NFS at Period End |
| Materials Portfolio | $1,523 | $- | $- |
8. Expense Reductions.
Through arrangements with the Fund's custodian, credits realized as a result of certain uninvested cash balances were used to reduce the Fund's expenses. During the period, custodian credits reduced the Fund's expenses by $887. During the period, transfer agent credits reduced each class' expenses as noted in the table below.
| | Expense reduction |
| Class M | $73 |
In addition, during the period the investment adviser or an affiliate reimbursed and/or waived a portion of fund-level operating expenses in the amount of $37,606.
9. Distributions to Shareholders.
Distributions to shareholders of each class were as follows:
| | Year ended February 28, 2023 | Year ended February 28, 2022 |
| Materials Portfolio | | |
| Distributions to shareholders | | |
| Class A | $ 3,653,799 | $762,533 |
| Class M | 1,013,870 | 147,448 |
| Class C | 430,794 | - |
| Materials | 18,471,243 | 5,007,156 |
| Class I | 6,523,647 | 1,869,092 |
| Class Z | 3,221,012 | 650,954 |
Total | $33,314,365 | $8,437,183 |
10. Share Transactions.
Share transactions for each class were as follows and may contain in-kind transactions, automatic conversions between classes or exchanges between affiliated funds:
| | Shares | Shares | Dollars | Dollars |
| | Year ended February 28, 2023 | Year ended February 28, 2022 | Year ended February 28, 2023 | Year ended February 28, 2022 |
| Materials Portfolio | | | | |
| Class A | | | | |
| Shares sold | 174,329 | 462,367 | $17,454,764 | $46,208,008 |
| Reinvestment of distributions | 37,585 | 7,168 | 3,573,539 | 745,309 |
| Shares redeemed | (310,006) | (286,710) | (30,402,251) | (28,650,346) |
| Net increase (decrease) | (98,092) | 182,825 | $(9,373,948) | $18,302,971 |
| Class M | | | | |
| Shares sold | 92,789 | 179,127 | $9,181,513 | $17,772,580 |
| Reinvestment of distributions | 10,767 | 1,429 | 1,011,814 | 147,010 |
| Shares redeemed | (78,482) | (102,671) | (7,550,323) | (10,013,298) |
| Net increase (decrease) | 25,074 | 77,885 | $2,643,004 | $7,906,292 |
| Class C | | | | |
| Shares sold | 33,396 | 94,534 | $3,198,388 | $9,060,563 |
| Reinvestment of distributions | 4,589 | - | 418,955 | - |
| Shares redeemed | (75,621) | (157,099) | (7,005,317) | (14,767,417) |
| Net increase (decrease) | (37,636) | (62,565) | $(3,387,974) | $(5,706,854) |
| Materials | | | | |
| Shares sold | 1,012,996 | 5,001,453 | $103,105,703 | $502,734,189 |
| Reinvestment of distributions | 179,022 | 44,769 | 17,121,716 | 4,680,116 |
| Shares redeemed | (1,448,920) | (4,889,252) | (140,887,042) | (485,592,599) |
| Net increase (decrease) | (256,902) | 156,970 | $(20,659,623) | $21,821,706 |
| Class I | | | | |
| Shares sold | 699,555 | 1,335,457 | $69,977,727 | $132,303,721 |
| Reinvestment of distributions | 64,549 | 16,505 | 6,160,539 | 1,721,641 |
| Shares redeemed | (998,267) | (1,218,271) | (97,071,794) | (121,416,087) |
| Net increase (decrease) | (234,163) | 133,691 | $(20,933,528) | $12,609,275 |
| Class Z | | | | |
| Shares sold | 598,908 | 511,529 | $54,583,653 | $50,914,703 |
| Reinvestment of distributions | 32,902 | 5,860 | 3,134,918 | 610,221 |
| Shares redeemed | (302,227) | (340,358) | (29,561,489) | (33,687,861) |
| Net increase (decrease) | 329,583 | 177,031 | $28,157,082 | $17,837,063 |
11. Other.
A fund's organizational documents provide former and current trustees and officers with a limited indemnification against liabilities arising in connection with the performance of their duties to the fund. In the normal course of business, a fund may also enter into contracts that provide general indemnifications. A fund's maximum exposure under these arrangements is unknown as this would be dependent on future claims that may be made against a fund. The risk of material loss from such claims is considered remote.
12. Risk and Uncertainties.
Many factors affect a fund's performance. Developments that disrupt global economies and financial markets, such as pandemics, epidemics, outbreaks of infectious diseases, war, terrorism, and environmental disasters, may significantly affect a fund's investment performance. The effects of these developments to a fund will be impacted by the types of securities in which a fund invests, the financial condition, industry, economic sector, and geographic location of an issuer, and a fund's level of investment in the securities of that issuer. Significant concentrations in security types, issuers, industries, sectors, and geographic locations may magnify the factors that affect a fund's performance.
To the Board of Trustees of Fidelity Select Portfolios and Shareholders of Chemicals Portfolio, Gold Portfolio and Materials Portfolio
Opinions on the Financial Statements
We have audited the accompanying statements of assets and liabilities, including the schedules of investments, of each of the funds listed in the table below (three of the funds constituting Fidelity Select Portfolios, hereafter collectively referred to as the "Funds") as of February 28, 2023, the related statements of operations and of changes in net assets for each of the periods indicated in the table below, including the related notes, and the financial highlights for each of the periods indicated in the table below (collectively referred to as the "financial statements"). In our opinion, the financial statements present fairly, in all material respects, the financial position of each of the Funds as of February 28, 2023, and the results of each of their operations, the changes in each of their net assets, and each of the financial highlights for each of the periods indicated in the table below, in conformity with accounting principles generally accepted in the United States of America.
| Chemicals Portfolio (1) |
| Gold Portfolio (2) |
| Materials Portfolio (1) |
(1) Statement of assets and liabilities, including the schedule of investments, as of February 28, 2023, the related statement of operations for the year ended February 28, 2023, the statement of changes in net assets for each of the two years in the period ended February 28, 2023, and the financial highlights for each of the periods indicated therein. (2) Consolidated statement of asset and liabilities, including the consolidated schedule of investments, as of February 28, 2023, the related consolidated statement of operations for the year ended February 28, 2023, the consolidated statement of changes in net assets for each of the two years in the period ended February 28, 2023, and the consolidated financial highlights for each of the periods indicated therein. |
Basis for Opinions
These financial statements are the responsibility of the Funds' management. Our responsibility is to express an opinion on the Funds' financial statements based on our audits. We are a public accounting firm registered with the Public Company Accounting Oversight Board (United States) (PCAOB) and are required to be independent with respect to the Funds in accordance with the U.S. federal securities laws and the applicable rules and regulations of the Securities and Exchange Commission and the PCAOB.
We conducted our audits of these financial statements in accordance with the standards of the PCAOB. Those standards require that we plan and perform the audit to obtain reasonable assurance about whether the financial statements are free of material misstatement, whether due to error or fraud.
Our audits included performing procedures to assess the risks of material misstatement of the financial statements, whether due to error or fraud, and performing procedures that respond to those risks. Such procedures included examining, on a test basis, evidence regarding the amounts and disclosures in the financial statements. Our audits also included evaluating the accounting principles used and significant estimates made by management, as well as evaluating the overall presentation of the financial statements. Our procedures included confirmation of securities owned as of February 28, 2023 by correspondence with the custodians and brokers; when replies were not received from brokers, we performed other auditing procedures. We believe that our audits provide a reasonable basis for our opinions.
/s/ PricewaterhouseCoopers LLP
Boston, Massachusetts
April 13, 2023
We have served as the auditor of one or more investment companies in the Fidelity group of funds since 1932.
The Trustees, Members of the Advisory Board (if any), and officers of the trust and funds, as applicable, are listed below. The Board of Trustees governs each fund and is responsible for protecting the interests of shareholders. The Trustees are experienced executives who meet periodically throughout the year to oversee each fund's activities, review contractual arrangements with companies that provide services to each fund, oversee management of the risks associated with such activities and contractual arrangements, and review each fund's performance. Each of the Trustees oversees 318 funds.
The Trustees hold office without limit in time except that (a) any Trustee may resign; (b) any Trustee may be removed by written instrument, signed by at least two-thirds of the number of Trustees prior to such removal; (c) any Trustee who requests to be retired or who has become incapacitated by illness or injury may be retired by written instrument signed by a majority of the other Trustees; and (d) any Trustee may be removed at any special meeting of shareholders by a two-thirds vote of the outstanding voting securities of the trust. Each Trustee who is not an interested person (as defined in the 1940 Act) of the trust and the funds is referred to herein as an Independent Trustee. Each Independent Trustee shall retire not later than the last day of the calendar year in which his or her 75th birthday occurs. The Independent Trustees may waive this mandatory retirement age policy with respect to individual Trustees. Officers and Advisory Board Members hold office without limit in time, except that any officer or Advisory Board Member may resign or may be removed by a vote of a majority of the Trustees at any regular meeting or any special meeting of the Trustees. Except as indicated, each individual has held the office shown or other offices in the same company for the past five years.
The funds' Statement of Additional Information (SAI) includes more information about the Trustees. To request a free copy, call Fidelity at 1-800-544-8544 if you're an individual investing directly with Fidelity, call 1-800-835-5092 if you're a plan sponsor or participant with Fidelity as your recordkeeper or call 1-877-208-0098 on institutional accounts or if you're an advisor or invest through one.
Experience, Skills, Attributes, and Qualifications of the Trustees. The Governance and Nominating Committee has adopted a statement of policy that describes the experience, qualifications, attributes, and skills that are necessary and desirable for potential Independent Trustee candidates (Statement of Policy). The Board believes that each Trustee satisfied at the time he or she was initially elected or appointed a Trustee, and continues to satisfy, the standards contemplated by the Statement of Policy. The Governance and Nominating Committee also engages professional search firms to help identify potential Independent Trustee candidates who have the experience, qualifications, attributes, and skills consistent with the Statement of Policy. From time to time, additional criteria based on the composition and skills of the current Independent Trustees, as well as experience or skills that may be appropriate in light of future changes to board composition, business conditions, and regulatory or other developments, have also been considered by the professional search firms and the Governance and Nominating Committee. In addition, the Board takes into account the Trustees' commitment and participation in Board and committee meetings, as well as their leadership of standing and ad hoc committees throughout their tenure.
In determining that a particular Trustee was and continues to be qualified to serve as a Trustee, the Board has considered a variety of criteria, none of which, in isolation, was controlling. The Board believes that, collectively, the Trustees have balanced and diverse experience, qualifications, attributes, and skills, which allow the Board to operate effectively in governing each fund and protecting the interests of shareholders. Information about the specific experience, skills, attributes, and qualifications of each Trustee, which in each case led to the Board's conclusion that the Trustee should serve (or continue to serve) as a trustee of the funds, is provided below.
Board Structure and Oversight Function. Robert A. Lawrence is an interested person and currently serves as Chair. The Trustees have determined that an interested Chair is appropriate and benefits shareholders because an interested Chair has a personal and professional stake in the quality and continuity of services provided to the funds. Independent Trustees exercise their informed business judgment to appoint an individual of their choosing to serve as Chair, regardless of whether the Trustee happens to be independent or a member of management. The Independent Trustees have determined that they can act independently and effectively without having an Independent Trustee serve as Chair and that a key structural component for assuring that they are in a position to do so is for the Independent Trustees to constitute a substantial majority for the Board. The Independent Trustees also regularly meet in executive session. David M. Thomas serves as Lead Independent Trustee and as such (i) acts as a liaison between the Independent Trustees and management with respect to matters important to the Independent Trustees and (ii) with management prepares agendas for Board meetings.
Fidelity ® funds are overseen by different Boards of Trustees. The funds' Board oversees Fidelity's high income and certain equity funds, and other Boards oversee Fidelity's alternative investment, investment-grade bond, money market, asset allocation, and other equity funds. The asset allocation funds may invest in Fidelity ® funds overseen by the funds' Board. The use of separate Boards, each with its own committee structure, allows the Trustees of each group of Fidelity ® funds to focus on the unique issues of the funds they oversee, including common research, investment, and operational issues. On occasion, the separate Boards establish joint committees to address issues of overlapping consequences for the Fidelity ® funds overseen by each Board.
The Trustees operate using a system of committees to facilitate the timely and efficient consideration of all matters of importance to the Trustees, each fund, and fund shareholders and to facilitate compliance with legal and regulatory requirements and oversight of the funds' activities and associated risks. The Board, acting through its committees, has charged FMR and its affiliates with (i) identifying events or circumstances the occurrence of which could have demonstrably adverse effects on the funds' business and/or reputation; (ii) implementing processes and controls to lessen the possibility that such events or circumstances occur or to mitigate the effects of such events or circumstances if they do occur; and (iii) creating and maintaining a system designed to evaluate continuously business and market conditions in order to facilitate the identification and implementation processes described in (i) and (ii) above. Because the day-to-day operations and activities of the funds are carried out by or through FMR, its affiliates, and other service providers, the funds' exposure to risks is mitigated but not eliminated by the processes overseen by the Trustees. While each of the Board's committees has responsibility for overseeing different aspects of the funds' activities, oversight is exercised primarily through the Operations, Audit, and Compliance Committees. Appropriate personnel, including but not limited to the funds' Chief Compliance Officer (CCO), FMR's internal auditor, the independent accountants, the funds' Treasurer and portfolio management personnel, make periodic reports to the Board's committees, as appropriate, including an annual review of Fidelity's risk management program for the Fidelity ® funds. The responsibilities of each standing committee, including their oversight responsibilities, are described further under "Standing Committees of the Trustees."
Interested Trustees*:
Correspondence intended for a Trustee who is an interested person may be sent to Fidelity Investments, 245 Summer Street, Boston, Massachusetts 02210.
Name, Year of Birth; Principal Occupations and Other Relevant Experience+
Bettina Doulton (1964)
Year of Election or Appointment: 2020
Trustee
Ms. Doulton also serves as Trustee of other Fidelity ® funds. Prior to her retirement, Ms. Doulton served in a variety of positions at Fidelity Investments, including as a managing director of research (2006-2007), portfolio manager to certain Fidelity ® funds (1993-2005), equity analyst and portfolio assistant (1990-1993), and research assistant (1987-1990). Ms. Doulton currently owns and operates Phi Builders + Architects and Cellardoor Winery. Previously, Ms. Doulton served as a member of the Board of Brown Capital Management, LLC (2014-2018).
Robert A. Lawrence (1952)
Year of Election or Appointment: 2020
Trustee
Chair of the Board of Trustees
Mr. Lawrence also serves as Trustee of other funds. Previously, Mr. Lawrence served as a Trustee and Member of the Advisory Board of certain funds. Prior to his retirement in 2008, Mr. Lawrence served as Vice President of certain Fidelity ® funds (2006-2008), Senior Vice President, Head of High Income Division of Fidelity Management & Research Company (investment adviser firm, 2006-2008), and President of Fidelity Strategic Investments (investment adviser firm, 2002-2005).
* Determined to be an "Interested Trustee" by virtue of, among other things, his or her affiliation with the trust or various entities under common control with FMR.
+ The information includes the Trustee's principal occupation during the last five years and other information relating to the experience, attributes, and skills relevant to the Trustee's qualifications to serve as a Trustee, which led to the conclusion that the Trustee should serve as a Trustee for each fund.
Independent Trustees:
Correspondence intended for an Independent Trustee may be sent to Fidelity Investments, P.O. Box 55235, Boston, Massachusetts 02205-5235.
Name, Year of Birth; Principal Occupations and Other Relevant Experience+
Thomas P. Bostick (1956)
Year of Election or Appointment: 2021
Trustee
Lieutenant General Bostick also serves as Trustee of other Fidelity ® funds. Prior to his retirement, General Bostick (United States Army, Retired) held a variety of positions within the U.S. Army, including Commanding General and Chief of Engineers, U.S. Army Corps of Engineers (2012-2016) and Deputy Chief of Staff and Director of Human Resources, U.S. Army (2009-2012). General Bostick currently serves as a member of the Board and Finance and Governance & Sustainability Committees of CSX Corporation (transportation, 2020-present) and a member of the Board and Corporate Governance and Nominating Committee of Perma-Fix Environmental Services, Inc. (nuclear waste management, 2020-present). General Bostick serves as Chief Executive Officer of Bostick Global Strategies, LLC (consulting, 2016-present), as a member of the Board of HireVue, Inc. (video interview and assessment, 2020-present), as a member of the Board of Allonnia (biotechnology and engineering solutions, 2022-present) and on the Advisory Board of Solugen, Inc. (specialty bio-based chemicals manufacturer, 2022-present). Previously, General Bostick served as a Member of the Advisory Board of certain Fidelity ® funds (2021), President, Intrexon Bioengineering (2018-2020) and Chief Operating Officer (2017-2020) and Senior Vice President of the Environment Sector (2016-2017) of Intrexon Corporation (biopharmaceutical company).
Dennis J. Dirks (1948)
Year of Election or Appointment: 2018
Trustee
Mr. Dirks also serves as Trustee of other Fidelity ® funds. Prior to his retirement in May 2003, Mr. Dirks served as Chief Operating Officer and as a member of the Board of The Depository Trust & Clearing Corporation (financial markets infrastructure), President, Chief Operating Officer and a member of the Board of The Depository Trust Company (DTC), President and a member of the Board of the National Securities Clearing Corporation (NSCC), Chief Executive Officer and a member of the Board of the Government Securities Clearing Corporation and Chief Executive Officer and a member of the Board of the Mortgage-Backed Securities Clearing Corporation. Mr. Dirks currently serves as a member of the Finance Committee (2016-present) and Board (2017-present) and is Treasurer (2018-present) of the Asolo Repertory Theatre.
Donald F. Donahue (1950)
Year of Election or Appointment: 2018
Trustee
Mr. Donahue also serves as Trustee of other Fidelity ® funds. Mr. Donahue serves as President and Chief Executive Officer of Miranda Partners, LLC (risk consulting for the financial services industry, 2012-present). Previously, Mr. Donahue served as Chief Executive Officer (2006-2012), Chief Operating Officer (2003-2006) and Managing Director, Customer Marketing and Development (1999-2003) of The Depository Trust & Clearing Corporation (financial markets infrastructure). Mr. Donahue currently serves as a member (2007-present) and Co-Chairman (2016-present) of the Board of United Way of New York. Mr. Donahue previously served as a member of the Advisory Board of certain Fidelity ® funds (2015-2018) and as a member of the Board of The Leadership Academy (previously NYC Leadership Academy) (2012-2022).
Vicki L. Fuller (1957)
Year of Election or Appointment: 2020
Trustee
Ms. Fuller also serves as Trustee of other Fidelity ® funds. Previously, Ms. Fuller served as a member of the Advisory Board of certain Fidelity ® funds (2018-2020), Chief Investment Officer of the New York State Common Retirement Fund (2012-2018) and held a variety of positions at AllianceBernstein L.P. (global asset management, 1985-2012), including Managing Director (2006-2012) and Senior Vice President and Senior Portfolio Manager (2001-2006). Ms. Fuller currently serves as a member of the Board, Audit Committee and Nominating and Governance Committee of two Blackstone business development companies (2020-present), as a member of the Board of Treliant, LLC (consulting, 2019-present), as a member of the Board of Ariel Alternatives, LLC (private equity, 2022-present) and as a member of the Board and Chair of the Audit Committee of Gusto, Inc. (software, 2021-present). In addition, Ms. Fuller currently serves as a member of the Board of Roosevelt University (2019-present) and as a member of the Executive Board of New York University's Stern School of Business. Ms. Fuller previously served as a member of the Board, Audit Committee and Nominating and Governance Committee of The Williams Companies, Inc. (natural gas infrastructure, 2018-2021).
Patricia L. Kampling (1959)
Year of Election or Appointment: 2020
Trustee
Ms. Kampling also serves as Trustee of other Fidelity ® funds. Prior to her retirement, Ms. Kampling served as Chairman of the Board and Chief Executive Officer (2012-2019), President and Chief Operating Officer (2011-2012) and Executive Vice President and Chief Financial Officer (2010-2011) of Alliant Energy Corporation. Ms. Kampling currently serves as a member of the Board, Finance Committee and Governance, Compensation and Nominating Committee of Xcel Energy Inc. (utilities company, 2020-present) and as a member of the Board, Audit, Finance and Risk Committee and Safety, Environmental, Technology and Operations Committee and Chair of the Executive Development and Compensation Committee of American Water Works Company, Inc. (utilities company, 2019-present). In addition, Ms. Kampling currently serves as a member of the Board of the Nature Conservancy, Wisconsin Chapter (2019-present). Previously, Ms. Kampling served as a Member of the Advisory Board of certain Fidelity® funds (2020), a member of the Board, Compensation Committee and Executive Committee and Chair of the Audit Committee of Briggs & Stratton Corporation (manufacturing, 2011-2021), a member of the Board of Interstate Power and Light Company (2012-2019) and Wisconsin Power and Light Company (2012-2019) (each a subsidiary of Alliant Energy Corporation) and as a member of the Board and Workforce Development Committee of the Business Roundtable (2018-2019).
Thomas A. Kennedy (1955)
Year of Election or Appointment: 2021
Trustee
Mr. Kennedy also serves as Trustee of other Fidelity ® funds. Previously, Mr. Kennedy served as a Member of the Advisory Board of certain Fidelity ® funds (2020) and held a variety of positions at Raytheon Company (aerospace and defense, 1983-2020), including Chairman and Chief Executive Officer (2014-2020) and Executive Vice President and Chief Operating Officer (2013-2014). Mr. Kennedy served as Executive Chairman of the Board of Directors of Raytheon Technologies Corporation (aerospace and defense, 2020-2021). Mr. Kennedy serves as a Director of the Board of Directors of Textron Inc. (aerospace and defense, 2023-present).
Oscar Munoz (1959)
Year of Election or Appointment: 2021
Trustee
Mr. Munoz also serves as Trustee of other Fidelity ® funds. Prior to his retirement, Mr. Munoz served as Executive Chairman (2020-2021), Chief Executive Officer (2015-2020), President (2015-2016) and a member of the Board (2010-2021) of United Airlines Holdings, Inc. Mr. Munoz currently serves as a member of the Board of CBRE Group, Inc. (commercial real estate, 2020-present), a member of the Board of Univision Communications, Inc. (Hispanic media, 2020-present), a member of the Board of Archer Aviation Inc. (2021-present), a member of the Defense Business Board of the United States Department of Defense (2021-present) and a member of the Board of Salesforce.com, Inc. (cloud-based software, 2022-present). Previously, Mr. Munoz served as a Member of the Advisory Board of certain Fidelity ® funds (2021).
David M. Thomas (1949)
Year of Election or Appointment: 2018
Trustee
Lead Independent Trustee
Mr. Thomas also serves as Trustee of other Fidelity ® funds. Previously, Mr. Thomas served as Executive Chairman (2005-2006) and Chairman and Chief Executive Officer (2000-2005) of IMS Health, Inc. (pharmaceutical and healthcare information solutions). Mr. Thomas currently serves as a member of the Board of Fortune Brands Home and Security (home and security products, 2004-present) and as Director (2013-present) and Non-Executive Chairman of the Board (2022-present) of Interpublic Group of Companies, Inc. (marketing communication).
Susan Tomasky (1953)
Year of Election or Appointment: 2020
Trustee
Ms. Tomasky also serves as Trustee of other Fidelity ® funds. Prior to her retirement, Ms. Tomasky served in various executive officer positions at American Electric Power Company, Inc. (1998-2011), including most recently as President of AEP Transmission (2007-2011). Ms. Tomasky currently serves as a member of the Board and Sustainability Committee and as Chair of the Audit Committee of Marathon Petroleum Corporation (2018-present) and as a member of the Board, Executive Committee, Corporate Governance Committee and Organization and Compensation Committee and as Lead Director of the Board of Public Service Enterprise Group, Inc. (utilities company, 2012-present) and as a member of the Board of its subsidiary company, Public Service Electric and Gas Co. (2021-present). In addition, Ms. Tomasky currently serves as a member (2009-present) and President (2020-present) of the Board of the Royal Shakespeare Company - America (2009-present), as a member of the Board of the Columbus Association for the Performing Arts (2011-present) and as a member of the Board and Kenyon in the World Committee of Kenyon College (2016-present). Previously, Ms. Tomasky served as a Member of the Advisory Board of certain Fidelity ® funds (2020), as a member of the Board of the Columbus Regional Airport Authority (2007-2020), as a member of the Board (2011-2018) and Lead Independent Director (2015-2018) of Andeavor Corporation (previously Tesoro Corporation) (independent oil refiner and marketer) and as a member of the Board of Summit Midstream Partners LP (energy, 2012-2018).
Michael E. Wiley (1950)
Year of Election or Appointment: 2008
Trustee
Mr. Wiley also serves as Trustee of other Fidelity ® funds. Previously, Mr. Wiley served as a member of the Advisory Board of certain Fidelity ® funds (2018-2020), Chairman, President and CEO of Baker Hughes, Inc. (oilfield services, 2000-2004). Mr. Wiley also previously served as a member of the Board of Andeavor Corporation (independent oil refiner and marketer, 2005-2018), a member of the Board of Andeavor Logistics LP (natural resources logistics, 2015-2018) and a member of the Board of High Point Resources (exploration and production, 2005-2020).
+ The information includes the Trustee's principal occupation during the last five years and other information relating to the experience, attributes, and skills relevant to the Trustee's qualifications to serve as a Trustee, which led to the conclusion that the Trustee should serve as a Trustee for each fund.
Advisory Board Members and Officers:
Correspondence intended for a Member of the Advisory Board (if any) may be sent to Fidelity Investments, P.O. Box 55235, Boston, Massachusetts 02205-5235. Correspondence intended for an officer or Peter S. Lynch may be sent to Fidelity Investments, 245 Summer Street, Boston, Massachusetts 02210. Officers appear below in alphabetical order.
Name, Year of Birth; Principal Occupation
Peter S. Lynch (1944)
Year of Election or Appointment: 2018
Member of the Advisory Board
Mr. Lynch also serves as a Member of the Advisory Board of other Fidelity ® funds. Mr. Lynch is Vice Chairman and a Director of Fidelity Management & Research Company LLC (investment adviser firm). In addition, Mr. Lynch serves as a Trustee of Boston College and as the Chairman of the Inner-City Scholarship Fund. Previously, Mr. Lynch served as Vice Chairman and a Director of FMR Co., Inc. (investment adviser firm) and on the Special Olympics International Board of Directors (1997-2006).
Heather Bonner (1977)
Year of Election or Appointment: 2023
Assistant Treasurer
Ms. Bonner also serves as an officer of other funds. Ms. Bonner serves as Senior Vice President (2022-present), and is an employee of Fidelity Investments. Ms. Bonner serves as Assistant Treasurer of Fidelity CRET Trustee LLC (2022-present). Prior to joining Fidelity, Ms. Bonner served as Managing Director at AQR Capital Management (2013-2022) and was the Treasurer and Principal Financial Officer of the AQR Funds (2013-2022).
Craig S. Brown (1977)
Year of Election or Appointment: 2022
Deputy Treasurer
Mr. Brown also serves as an officer of other funds. Mr. Brown serves as Assistant Treasurer of FIMM, LLC (2021-present) and is an employee of Fidelity Investments (2013-present). Previously, Mr. Brown served as Assistant Treasurer of certain Fidelity ® funds (2019-2022).
John J. Burke III (1964)
Year of Election or Appointment: 2018
Chief Financial Officer
Mr. Burke also serves as Chief Financial Officer of other funds. Mr. Burke serves as Head of Investment Operations for Fidelity Fund and Investment Operations (2018-present) and is an employee of Fidelity Investments (1998-present). Previously Mr. Burke served as head of Asset Management Investment Operations (2012-2018).
Margaret Carey (1973)
Year of Election or Appointment: 2023
Secretary and Chief Legal Officer (CLO)
Ms. Carey also serves as an officer of other funds and as CLO of certain other Fidelity entities. She is a Senior Vice President and Deputy General Counsel of FMR LLC (diversified financial services company, 2019-present), and is an employee of Fidelity Investments.
William C. Coffey (1969)
Year of Election or Appointment: 2019
Assistant Secretary
Mr. Coffey also serves as Assistant Secretary of other funds. He is Senior Vice President and Deputy General Counsel of FMR LLC (diversified financial services company, 2010-present), and is an employee of Fidelity Investments. Previously, Mr. Coffey served as Secretary and CLO of certain funds (2018-2019); CLO, Secretary, and Senior Vice President of Fidelity Management & Research Company and FMR Co., Inc. (investment adviser firms, 2018-2019); Secretary of Fidelity SelectCo, LLC and Fidelity Investments Money Management, Inc. (investment adviser firms, 2018-2019); CLO of Fidelity Management & Research (Hong Kong) Limited, FMR Investment Management (UK) Limited, and Fidelity Management & Research (Japan) Limited (investment adviser firms, 2018-2019); and Assistant Secretary of certain funds (2009-2018).
Timothy M. Cohen (1969)
Year of Election or Appointment: 2018
Vice President
Mr. Cohen also serves as Vice President of other funds. Mr. Cohen serves as Co-Head of Equity (2018-present), a Director of Fidelity Management & Research (Japan) Limited (investment adviser firm, 2016-present), and is an employee of Fidelity Investments. Previously, Mr. Cohen served as Executive Vice President of Fidelity SelectCo, LLC (2019), Head of Global Equity Research (2016-2018), Chief Investment Officer - Equity and a Director of Fidelity Management & Research (U.K.) Inc. (investment adviser firm, 2013-2015) and as a Director of Fidelity Management & Research (Hong Kong) Limited (investment adviser firm, 2017).
Jonathan Davis (1968)
Year of Election or Appointment: 2010
Assistant Treasurer
Mr. Davis also serves as an officer of other funds. Mr. Davis serves as Assistant Treasurer of FIMM, LLC (2021-present), FMR Capital, Inc. (2017-present), FD Funds GP LLC (2021-present), FD Funds Holding LLC (2021-present), and FD Funds Management LLC (2021-present); and is an employee of Fidelity Investments. Previously, Mr. Davis served as Vice President and Associate General Counsel of FMR LLC (diversified financial services company, 2003-2010).
Laura M. Del Prato (1964)
Year of Election or Appointment: 2018
Assistant Treasurer
Ms. Del Prato also serves as an officer of other funds. Ms. Del Prato serves as Assistant Treasurer of FIMM, LLC (2021-present) and is an employee of Fidelity Investments (2017-present). Previously, Ms. Del Prato served as President and Treasurer of The North Carolina Capital Management Trust: Cash Portfolio and Term Portfolio (2018-2020). Prior to joining Fidelity Investments, Ms. Del Prato served as a Managing Director and Treasurer of the JPMorgan Mutual Funds (2014-2017). Prior to JPMorgan, Ms. Del Prato served as a partner at Cohen Fund Audit Services (accounting firm, 2012-2013) and KPMG LLP (accounting firm, 2004-2012).
Colm A. Hogan (1973)
Year of Election or Appointment: 2020
Assistant Treasurer
Mr. Hogan also serves as an officer of other funds. Mr. Hogan serves as Assistant Treasurer of FIMM, LLC (2021-present) and FMR Capital, Inc. (2017-present) and is an employee of Fidelity Investments (2005-present). Previously, Mr. Hogan served as Deputy Treasurer of certain Fidelity ® funds (2016-2020) and Assistant Treasurer of certain Fidelity ® funds (2016-2018).
Pamela R. Holding (1964)
Year of Election or Appointment: 2018
Vice President
Ms. Holding also serves as Vice President of other funds. Ms. Holding serves as Co-Head of Equity (2018-present) and is an employee of Fidelity Investments (2013-present). Previously, Ms. Holding served as Executive Vice President of Fidelity SelectCo, LLC (2019) and as Chief Investment Officer of Fidelity Institutional Asset Management (2013-2018).
Chris Maher (1972)
Year of Election or Appointment: 2020
Deputy Treasurer
Mr. Maher also serves as an officer of other funds. Mr. Maher serves as Assistant Treasurer of FIMM, LLC (2021-present) and FMR Capital, Inc. (2017-present), and is an employee of Fidelity Investments (2008-present). Previously, Mr. Maher served as Assistant Treasurer of certain funds (2013-2020); Vice President of Asset Management Compliance (2013), Vice President of the Program Management Group of FMR (investment adviser firm, 2010-2013), and Vice President of Valuation Oversight (2008-2010).
Jason P. Pogorelec (1975)
Year of Election or Appointment: 2020
Chief Compliance Officer
Mr. Pogorelec also serves as Chief Compliance Officer of other funds. Mr. Pogorelec is a Senior Vice President of Asset Management Compliance for Fidelity Investments and is an employee of Fidelity Investments. Mr. Pogorelec serves as Compliance Officer of Fidelity Management & Research Company LLC (investment adviser firm, 2023-present). Previously, Mr. Pogorelec served as Vice President, Associate General Counsel for Fidelity Investments (2010-2020) and Assistant Secretary of certain Fidelity ® funds (2015-2020).
Brett Segaloff (1972)
Year of Election or Appointment: 2021
Anti-Money Laundering (AML) Officer
Mr. Segaloff also serves as an AML Officer of other funds and other related entities. He is Director, Anti-Money Laundering (2007-present) of FMR LLC (diversified financial services company) and is an employee of Fidelity Investments (1996-present).
Stacie M. Smith (1974)
Year of Election or Appointment: 2018
President and Treasurer
Ms. Smith also serves as an officer of other funds. Ms. Smith serves as Assistant Treasurer of FIMM, LLC (2021-present) and FMR Capital, Inc. (2017-present), is an employee of Fidelity Investments (2009-present), and has served in other fund officer roles. Prior to joining Fidelity Investments, Ms. Smith served as Senior Audit Manager of Ernst & Young LLP (accounting firm, 1996-2009). Previously, Ms. Smith served as Assistant Treasurer (2013-2019) and Deputy Treasurer (2013-2016) of certain Fidelity ® funds.
Jim Wegmann (1979)
Year of Election or Appointment: 2019
Assistant Treasurer
Mr. Wegmann also serves as an officer of other funds. Mr. Wegmann serves as Assistant Treasurer of FIMM, LLC (2021-present) and is an employee of Fidelity Investments (2011-present). Previously, Mr. Wegmann served as Assistant Treasurer of certain Fidelity ® funds (2019-2021).
As a shareholder, you incur two types of costs: (1) transaction costs, which may include sales charges (loads) on purchase payments or redemption proceeds, as applicable and (2) ongoing costs, which generally include management fees, distribution and/or service (12b-1) fees and other Fund expenses. This Example is intended to help you understand your ongoing costs (in dollars) of investing in a fund and to compare these costs with the ongoing costs of investing in other mutual funds.
| The Example is based on an investment of $1,000 invested at the beginning of the period and held for the entire period (September 1, 2022 to February 28, 2023). |
Actual Expenses
The first line of the accompanying table provides information about actual account values and actual expenses. You may use the information in this line, together with the amount you invested, to estimate the expenses that you paid over the period. Simply divide your account value by $1,000.00 (for example, an $8,600 account value divided by $1,000.00 = 8.6), then multiply the result by the number in the first line for a class/Fund under the heading entitled "Expenses Paid During Period" to estimate the expenses you paid on your account during this period. If any fund is a shareholder of any underlying mutual funds or exchange-traded funds (ETFs) (the Underlying Funds), such fund indirectly bears its proportional share of the expenses of the Underlying Funds in addition to the direct expenses incurred presented in the table. These fees and expenses are not included in the annualized expense ratio used to calculate the expense estimate in the table below.
Hypothetical Example for Comparison Purposes
The second line of the accompanying table provides information about hypothetical account values and hypothetical expenses based on the actual expense ratio and an assumed rate of return of 5% per year before expenses, which is not the actual return. The hypothetical account values and expenses may not be used to estimate the actual ending account balance or expenses you paid for the period. You may use this information to compare the ongoing costs of investing in the Fund and other funds. To do so, compare this 5% hypothetical example with the 5% hypothetical examples that appear in the shareholder reports of the other funds. If any fund is a shareholder of any Underlying Funds, such fund indirectly bears its proportional share of the expenses of the Underlying Funds in addition to the direct expenses as presented in the table. These fees and expenses are not included in the annualized expense ratio used to calculate the expense estimate in the table below.
Please note that the expenses shown in the table are meant to highlight your ongoing costs only and do not reflect any transaction costs. Therefore, the second line of the table is useful in comparing ongoing costs only, and will not help you determine the relative total costs of owning different funds. In addition, if these transactional costs were included, your costs would have been higher.
| | | | | Annualized Expense Ratio- A | | Beginning Account Value September 1, 2022 | | Ending Account Value February 28, 2023 | | Expenses Paid During Period- C September 1, 2022 to February 28, 2023 |
| | | | | | | | | | |
| Chemicals Portfolio | | | | .75% | | | | | | |
| Actual | | | | | | $ 1,000 | | $ 1,077.90 | | $ 3.86 |
Hypothetical- B | | | | | | $ 1,000 | | $ 1,021.08 | | $ 3.76 |
| Gold Portfolio | | | | | | | | | | |
| Class A | | | | 1.09% | | | | | | |
| Actual | | | | | | $ 1,000 | | $ 1,165.60 | | $ 5.85 |
Hypothetical- B | | | | | | $ 1,000 | | $ 1,019.39 | | $ 5.46 |
| Class M | | | | 1.35% | | | | | | |
| Actual | | | | | | $ 1,000 | | $ 1,163.60 | | $ 7.24 |
Hypothetical- B | | | | | | $ 1,000 | | $ 1,018.10 | | $ 6.76 |
| Class C | | | | 1.80% | | | | | | |
| Actual | | | | | | $ 1,000 | | $ 1,161.40 | | $ 9.65 |
Hypothetical- B | | | | | | $ 1,000 | | $ 1,015.87 | | $ 9.00 |
| Gold Portfolio | | | | .78% | | | | | | |
| Actual | | | | | | $ 1,000 | | $ 1,166.90 | | $ 4.19 |
Hypothetical- B | | | | | | $ 1,000 | | $ 1,020.93 | | $ 3.91 |
| Class I | | | | .77% | | | | | | |
| Actual | | | | | | $ 1,000 | | $ 1,166.90 | | $ 4.14 |
Hypothetical- B | | | | | | $ 1,000 | | $ 1,020.98 | | $ 3.86 |
| Class Z | | | | .63% | | | | | | |
| Actual | | | | | | $ 1,000 | | $ 1,167.80 | | $ 3.39 |
Hypothetical- B | | | | | | $ 1,000 | | $ 1,021.67 | | $ 3.16 |
| Materials Portfolio | | | | | | | | | | |
| Class A | | | | 1.03% | | | | | | |
| Actual | | | | | | $ 1,000 | | $ 1,110.00 | | $ 5.39 |
Hypothetical- B | | | | | | $ 1,000 | | $ 1,019.69 | | $ 5.16 |
| Class M | | | | 1.28% | | | | | | |
| Actual | | | | | | $ 1,000 | | $ 1,108.60 | | $ 6.69 |
Hypothetical- B | | | | | | $ 1,000 | | $ 1,018.45 | | $ 6.41 |
| Class C | | | | 1.78% | | | | | | |
| Actual | | | | | | $ 1,000 | | $ 1,105.90 | | $ 9.29 |
Hypothetical- B | | | | | | $ 1,000 | | $ 1,015.97 | | $ 8.90 |
| Materials Portfolio | | | | .76% | | | | | | |
| Actual | | | | | | $ 1,000 | | $ 1,111.50 | | $ 3.98 |
Hypothetical- B | | | | | | $ 1,000 | | $ 1,021.03 | | $ 3.81 |
| Class I | | | | .76% | | | | | | |
| Actual | | | | | | $ 1,000 | | $ 1,111.60 | | $ 3.98 |
Hypothetical- B | | | | | | $ 1,000 | | $ 1,021.03 | | $ 3.81 |
| Class Z | | | | .61% | | | | | | |
| Actual | | | | | | $ 1,000 | | $ 1,112.20 | | $ 3.19 |
Hypothetical- B | | | | | | $ 1,000 | | $ 1,021.77 | | $ 3.06 |
| |
A Annualized expense ratio reflects expenses net of applicable fee waivers.
B 5% return per year before expenses
C Expenses are equal to the annualized expense ratio, multiplied by the average account value over the period, multiplied by 181/ 365 (to reflect the one-half year period). The fees and expenses of any Underlying Funds are not included in each annualized expense ratio.
The dividend and capital gains distributions for the fund(s) are available on Fidelity.com or Institutional.Fidelity.com.
The funds hereby designate as capital gain dividend the amounts noted below for the taxable year ended February 28, 2023, or, if subsequently determined to be different, the net capital gain of such year.
| Chemicals Portfolio | $48,236,858 |
| Materials Portfolio | $67,863,923 |
The funds hereby designate the amounts noted below as distributions paid during the fiscal year ended 2023 as qualifying to be taxed as section 163(j) interest dividends:
A percentage of the dividends distributed during the fiscal year for the following funds qualify for the dividends-received deduction for corporate shareholders:
| | April 2022 | December 2022 |
| Chemicals Portfolio | 100% | 100% |
| Gold Portfolio | | |
| Class A | 3% | - |
| Class M | 4% | - |
| Class C | 5% | - |
| Gold | 3% | - |
| Class I | 3% | - |
| Class Z | 3% | - |
| Materials Portfolio | | |
| Class A | - | 100% |
| Class M | - | 100% |
| Class C | - | 100% |
| Materials | - | 98% |
| Class I | - | 99% |
| Class Z | - | 87% |
A percentage of the dividends distributed during the fiscal year for the following funds may be taken into account as a dividend for purposes of the maximum rate under section 1(h)(11) of the Internal Revenue Code.
| | April 2022 | December 2022 |
| Chemicals Portfolio | 100% | 100% |
| Gold Portfolio | | |
| Class A | 100% | - |
| Class M | 100% | - |
| Class C | 100% | - |
| Gold | 100% | - |
| Class I | 100% | - |
| Class Z | 100% | - |
| Materials Portfolio | | |
| Class A | - | 100% |
| Class M | - | 100% |
| Class C | - | 100% |
| Materials | - | 100% |
| Class I | - | 100% |
| Class Z | - | 100% |
The amounts per share which represent income derived from sources within, and taxes paid to, foreign countries or possessions of the United States are as follows:
| | Pay Date | Income | Taxes |
| Gold Portfolio | | | |
| Class A | 04/11/2022 | $0.0728 | $0.0038 |
| Class M | 04/11/2022 | $0.0628 | $0.0038 |
| Class C | 04/11/2022 | $0.0488 | $0.0038 |
| Gold | 04/11/2022 | $0.0848 | $0.0038 |
| Class I | 04/11/2022 | $0.0848 | $0.0038 |
| Class Z | 04/11/2022 | $0.0898 | $0.0038 |
The funds will notify shareholders in January 2024 of amounts for use in preparing 2023 income tax returns.
The Securities and Exchange Commission adopted Rule 22e-4 under the Investment Company Act of 1940 (the Liquidity Rule) to promote effective liquidity risk management throughout the open-end investment company industry, thereby reducing the risk that funds will be unable to meet their redemption obligations and mitigating dilution of the interests of fund shareholders.
The Funds have adopted and implemented a liquidity risk management program (the Program) reasonably designed to assess and manage each Fund's liquidity risk and to comply with the requirements of the Liquidity Rule. Each Fund's Board of Trustees (the Board) has designated each Fund's investment adviser as administrator of the Program. The Fidelity advisers have established a Liquidity Risk Management Committee (the LRM Committee) to manage the Program for each of the Fidelity Funds. The LRM Committee monitors the adequacy and effectiveness of implementation of the Program and on a periodic basis assesses each Fund's liquidity risk based on a variety of factors including (1) the Fund's investment strategy, (2) portfolio liquidity and cash flow projections during normal and reasonably foreseeable stressed conditions, (3) shareholder redemptions, (4) borrowings and other funding sources and (5) certain factor specific to ETFs including the effect of the Fund's prices and spreads, market participants, and basket compositions on the overall liquidity of the Fund's portfolio, as applicable.
In accordance with the Program, each of the Fund's portfolio investments is classified into one of four defined liquidity categories based on a determination of a reasonable expectation for how long it would take to convert the investment to cash (or sell or dispose of the investment) without significantly changing its market value.
- Highly liquid investments - cash or convertible to cash within three business days or less
- Moderately liquid investments - convertible to cash in three to seven calendar days
- Less liquid investments - can be sold or disposed of, but not settled, within seven calendar days
- Illiquid investments - cannot be sold or disposed of within seven calendar days
Liquidity classification determinations take into account a variety of factors including various market, trading and investment-specific considerations, as well as market depth, and generally utilize analysis from a third-party liquidity metrics service.
The Liquidity Rule places a 15% limit on a fund's illiquid investments and requires funds that do not primarily hold assets that are highly liquid investments to determine and maintain a minimum percentage of the fund's net assets to be invested in highly liquid investments (highly liquid investment minimum or HLIM). The Program includes provisions reasonably designed to comply with the 15% limit on illiquid investments and for determining, periodically reviewing and complying with the HLIM requirement as applicable.
At a recent meeting of the Fund's Board of Trustees, the LRM Committee provided a written report to the Board pertaining to the operation, adequacy, and effectiveness of the Program for the period December 1, 2021 through November 30, 2022. The report concluded that the Program is operating effectively and is reasonably designed to assess and manage the Fund's liquidity risk.
1.846032.116
SELMT-ANN-0423
Fidelity® Select Portfolios®
Consumer Discretionary Sector
Automotive Portfolio
Communication Services Portfolio
Construction and Housing Portfolio
Consumer Discretionary Portfolio
Leisure Portfolio
Retailing Portfolio
Annual Report
February 28, 2023
Includes Fidelity and Fidelity Advisor share classes
Contents
To view a fund's proxy voting guidelines and proxy voting record for the 12-month period ended June 30, visit http://www.fidelity.com/proxyvotingresults or visit the Securities and Exchange Commission's (SEC) web site at http://www.sec.gov.
You may also call 1-800-544-8544 if you're an individual investing directly with Fidelity, call 1-800-835-5092 if you're a plan sponsor or participant with Fidelity as your recordkeeper or call 1-877-208-0098 on institutional accounts or if you're an advisor or invest through one to request a free copy of the proxy voting guidelines.
Standard & Poor's, S&P and S&P 500 are registered service marks of The McGraw-Hill Companies, Inc. and have been licensed for use by Fidelity Distributors Corporation.
Other third-party marks appearing herein are the property of their respective owners.
All other marks appearing herein are registered or unregistered trademarks or service marks of FMR LLC or an affiliated company. © 2023 FMR LLC. All rights reserved.
This report and the financial statements contained herein are submitted for the general information of the shareholders of the Funds. This report is not authorized for distribution to prospective investors in the Funds unless preceded or accompanied by an effective prospectus.
A fund files its complete schedule of portfolio holdings with the SEC for the first and third quarters of each fiscal year on Form N-PORT. Forms N-PORT are available on the SEC's web site at http://www.sec.gov. A fund's Forms N-PORT may be reviewed and copied at the SEC's Public Reference Room in Washington, DC. Information regarding the operation of the SEC's Public Reference Room may be obtained by calling 1-800-SEC-0330.
For a complete list of a fund's portfolio holdings, view the most recent holdings listing, semiannual report, or annual report on Fidelity's web site at http://www.fidelity.com, http://www.institutional.fidelity.com, or http://www.401k.com, as applicable.
NOT FDIC INSURED •MAY LOSE VALUE •NO BANK GUARANTEE
Neither the Funds nor Fidelity Distributors Corporation is a bank.
Average annual total return reflects the change in the value of an investment, assuming reinvestment of distributions from dividend income and capital gains (the profits earned upon the sale of securities that have grown in value, if any) and assuming a constant rate of performance each year. The hypothetical investment and the average annual total returns do not reflect the deduction of taxes that a shareholder would pay on fund distributions or the redemption of fund shares. During periods of reimbursement by Fidelity, a fund's total return will be greater than it would be had the reimbursement not occurred. How a fund did yesterday is no guarantee of how it will do tomorrow.
| Average Annual Total Returns |
| | | | |
Periods ended February 28, 2023 | Past 1 year | Past 5 years | Past 10 years |
| Automotive Portfolio | -16.92% | 10.56% | 10.95% |
| $10,000 Over 10 Years |
| |
Let's say hypothetically that $10,000 was invested in Automotive Portfolio on February 28, 2013. The chart shows how the value of your investment would have changed, and also shows how the S&P 500® Index performed over the same period. |
|
|
Automotive Portfolio
Market Recap:
U.S. equities returned -7.69% for the 12 months ending February 28, 2023, according to the S&P 500 ® index. The new year began with an encouraging upturn in January (+6.28%), but stocks lost momentum in February (-2.44%) amid higher-than-expected inflation and strong jobs data. Investors took these as signs that the economy continued to run hot, even after a year of historic policy adjustment by the Federal Reserve aimed at cooling economic growth. Record inflation in 2022 prompted the Fed to aggressively tighten monetary policy, and market interest rates eclipsed their highest level in a decade, stoking recession fears and sending stocks into bear market territory. Since March 2022, the central bank has hiked its benchmark rate eight times, by 4.5 percentage points - the fastest-ever pace of monetary tightening - while also shrinking its massive asset portfolio. The latest bump came on February 2, along with a signal that the Fed plans to lift rates in March while it considers whether and when to pause increases. Against this dynamic backdrop, stocks struggled to gain traction until a strong rally ignited heading into the summer. But in September, the index returned -9.21%, one of its worst monthly results ever, before advancing 7.56% in Q4, as risky assets regained favor. For the full 12 months, value stocks handily outpaced growth. The headwind for the latter was most pronounced in the growth-oriented communication services (-25%) and consumer discretionary (-18%) sectors. In sharp contrast, energy gained 24%.
Comments from Portfolio Manager Hiroki Sugihara:
For the fiscal year ending February 28, 2023, the fund returned -16.92%, underperforming the -15.57% result of the FactSet Automotive Linked Index, as well as the broad-based S&P 500 ® index. Versus the industry index, security selection was the primary detractor, especially within auto parts & equipment category. Subpar picks and an underweighting among automotive retail stocks, in addition to an underweighting in motorcycle manufacturers, also hurt. The biggest individual relative detractor was an overweight position in Xpeng (-75%). Outsized exposure to Carvana (-93%) also proved detrimental. Avoiding BorgWarner, an index component that gained roughly 25%, further weighed on relative performance. In contrast, the top contributor to performance versus the industry index proved to be investment choices among automobile manufacturers. An overweighting in auto parts & equipment companies, as well as picks in the trucking group, aided the portfolio's relative result. The biggest individual relative contributor was an underweight position in NIO (-59%), though we reduced our investment during the period. Also adding value was an outsized stake in Tesla, which returned approximately -29% and was among the portfolio's more sizable holdings. Another key relative contributor was an overweighting in O'Reilly Automotive (+28%), one of the fund's largest holdings on February 28. Notable changes in positioning the past 12 months include a higher allocation to both distributors and auto parts & equipment stocks.
Notes to shareholders:
On August 1, 2022, Elliot Mattingly came off the fund, leaving Hiroki Sugihara as sole portfolio manager of the fund.
The views expressed above reflect those of the portfolio manager(s) only through the end of the period as stated on the cover of this report and do not necessarily represent the views of Fidelity or any other person in the Fidelity organization. Any such views are subject to change at any time based upon market or other conditions and Fidelity disclaims any responsibility to update such views. These views may not be relied on as investment advice and, because investment decisions for a Fidelity fund are based on numerous factors, may not be relied on as an indication of trading intent on behalf of any Fidelity fund.
Automotive Portfolio
Top Holdings (% of Fund's net assets) |
| |
| Tesla, Inc. | 11.9 | |
| Toyota Motor Corp. sponsored ADR | 10.7 | |
| General Motors Co. | 8.6 | |
| O'Reilly Automotive, Inc. | 7.7 | |
| Aptiv PLC | 5.6 | |
| Ferrari NV | 4.9 | |
| Ford Motor Co. | 4.3 | |
| AutoZone, Inc. | 4.0 | |
| Copart, Inc. | 3.7 | |
| Li Auto, Inc. ADR | 3.2 | |
| | 64.6 | |
| |
| Industries (% of Fund's net assets) |
| |
| Automobiles | 55.4 | |
| Auto Components | 18.2 | |
| Specialty Retail | 14.8 | |
| Distributors | 5.0 | |
| Commercial Services & Supplies | 3.7 | |
| Internet & Direct Marketing Retail | 1.0 | |
| Semiconductors & Semiconductor Equipment | 0.8 | |
| Electrical Equipment | 0.5 | |
| Electronic Equipment & Components | 0.0 | |
| |
Percentages shown as 0.0% may reflect amounts less than 0.05%.
Geographic Diversification (% of Fund's net assets) |
|
* Includes Short-Term investments and Net Other Assets (Liabilities). Percentages are based on country or territory of incorporation and are adjusted for the effect of derivatives, if applicable. |
| |
Automotive Portfolio
Showing Percentage of Net Assets
| Common Stocks - 98.8% |
| | | Shares | Value ($) |
| Auto Components - 18.2% | | | |
| Auto Parts & Equipment - 18.2% | | | |
| Adient PLC (a) | | 38,245 | 1,633,826 |
| Aptiv PLC (a) | | 50,920 | 5,920,978 |
| Autoliv, Inc. | | 23,935 | 2,215,902 |
| Cie Automotive SA | | 32,800 | 960,290 |
| DENSO Corp. | | 33,858 | 1,800,140 |
| Hanon Systems | | 104,270 | 712,659 |
| Lear Corp. | | 16,762 | 2,340,813 |
| Magna International, Inc. Class A (sub. vtg.) | | 48,241 | 2,688,698 |
| Novem Group SA | | 117,407 | 1,092,796 |
| | | | 19,366,102 |
| Automobiles - 54.8% | | | |
| Automobile Manufacturers - 54.8% | | | |
| Ferrari NV | | 20,234 | 5,268,327 |
| Ford Motor Co. | | 379,179 | 4,576,691 |
| General Motors Co. | | 236,161 | 9,148,877 |
| Honda Motor Co. Ltd. sponsored ADR | | 117,000 | 3,038,490 |
| Li Auto, Inc. ADR (a)(b) | | 145,852 | 3,443,566 |
| Lucid Group, Inc. Class A (a)(b) | | 35,764 | 326,525 |
| Mercedes-Benz Group AG (Germany) | | 16,447 | 1,260,544 |
| NIO, Inc. sponsored ADR (a)(b) | | 103,784 | 974,532 |
| Rivian Automotive, Inc. (a)(b) | | 32,680 | 630,724 |
| Stellantis NV (b) | | 144,048 | 2,523,721 |
| Suzuki Motor Corp. | | 53,701 | 1,886,467 |
| Tesla, Inc. (a) | | 61,848 | 12,722,752 |
| Toyota Motor Corp. sponsored ADR (b) | | 83,507 | 11,350,271 |
| XPeng, Inc. ADR (a)(b) | | 130,945 | 1,168,029 |
| | | | 58,319,516 |
| Commercial Services & Supplies - 3.7% | | | |
| Diversified Support Services - 3.7% | | | |
| Copart, Inc. (a) | | 55,597 | 3,917,365 |
| Distributors - 5.0% | | | |
| Distributors - 5.0% | | | |
| Central Automotive Products Ltd. | | 300 | 5,927 |
| Genuine Parts Co. | | 16,721 | 2,957,276 |
| LKQ Corp. | | 40,709 | 2,332,219 |
| | | | 5,295,422 |
| Electrical Equipment - 0.5% | | | |
| Electrical Components & Equipment - 0.5% | | | |
| Sensata Technologies, Inc. PLC | | 11,023 | 557,543 |
| Internet & Direct Marketing Retail - 1.0% | | | |
| Internet & Direct Marketing Retail - 1.0% | | | |
| Uber Technologies, Inc. (a) | | 33,454 | 1,112,680 |
| Semiconductors & Semiconductor Equipment - 0.8% | | | |
| Semiconductors - 0.8% | | | |
| Mitsui High-Tec, Inc. | | 16,000 | 823,767 |
| Specialty Retail - 14.8% | | | |
| Automotive Retail - 14.8% | | | |
| Advance Auto Parts, Inc. | | 2,978 | 431,691 |
| AutoZone, Inc. (a) | | 1,706 | 4,242,037 |
| CarMax, Inc. (a)(b) | | 13,986 | 965,593 |
| Carvana Co. Class A (a)(b) | | 21,410 | 201,682 |
| Lithia Motors, Inc. Class A (sub. vtg.) | | 6,638 | 1,693,885 |
| O'Reilly Automotive, Inc. (a) | | 9,917 | 8,232,102 |
| | | | 15,766,990 |
| TOTAL COMMON STOCKS (Cost $77,309,580) | | | 105,159,385 |
| | | | |
| Preferred Stocks - 0.6% |
| | | Shares | Value ($) |
| Convertible Preferred Stocks - 0.0% | | | |
| Electronic Equipment & Components - 0.0% | | | |
| Electronic Components - 0.0% | | | |
| CelLink Corp. Series D (a)(c)(d) | | 3,700 | 48,174 |
| | | | |
| Nonconvertible Preferred Stocks - 0.6% | | | |
| Automobiles - 0.6% | | | |
| Automobile Manufacturers - 0.6% | | | |
| Dr. Ing. h.c. F. Porsche AG Series F (a) | | 4,864 | 587,005 |
| | | | |
| TOTAL PREFERRED STOCKS (Cost $482,262) | | | 635,179 |
| | | | |
| Money Market Funds - 18.5% |
| | | Shares | Value ($) |
| Fidelity Cash Central Fund 4.63% (e) | | 311,851 | 311,913 |
| Fidelity Securities Lending Cash Central Fund 4.63% (e)(f) | | 19,446,540 | 19,448,485 |
| TOTAL MONEY MARKET FUNDS (Cost $19,760,398) | | | 19,760,398 |
| | | | |
| TOTAL INVESTMENT IN SECURITIES - 117.9% (Cost $97,552,240) | 125,554,962 |
NET OTHER ASSETS (LIABILITIES) - (17.9)% | (19,075,791) |
| NET ASSETS - 100.0% | 106,479,171 |
| | |
Legend
| (b) | Security or a portion of the security is on loan at period end. |
| (c) | Restricted securities (including private placements) - Investment in securities not registered under the Securities Act of 1933 (excluding 144A issues). At the end of the period, the value of restricted securities (excluding 144A issues) amounted to $48,174 or 0.0% of net assets. |
| (e) | Affiliated fund that is generally available only to investment companies and other accounts managed by Fidelity Investments. The rate quoted is the annualized seven-day yield of the fund at period end. A complete unaudited listing of the fund's holdings as of its most recent quarter end is available upon request. In addition, each Fidelity Central Fund's financial statements, which are not covered by the Fund's Report of Independent Registered Public Accounting Firm, are available on the SEC's website or upon request. |
| (f) | Investment made with cash collateral received from securities on loan. |
| Additional information on each restricted holding is as follows: |
| Security | Acquisition Date | Acquisition Cost ($) |
| CelLink Corp. Series D | 1/20/22 | 77,048 |
| | | |
Affiliated Central Funds
Fiscal year to date information regarding the Fund's investments in Fidelity Central Funds, including the ownership percentage, is presented below.
| Affiliate | Value, beginning of period ($) | Purchases ($) | Sales Proceeds ($) | Dividend Income ($) | Realized Gain (loss) ($) | Change in Unrealized appreciation (depreciation) ($) | Value, end of period ($) | % ownership, end of period |
| Fidelity Cash Central Fund 4.63% | 252,289 | 33,405,522 | 33,345,898 | 12,217 | - | - | 311,913 | 0.0% |
| Fidelity Securities Lending Cash Central Fund 4.63% | 18,145,010 | 179,259,737 | 177,956,262 | 291,519 | - | - | 19,448,485 | 0.1% |
| Total | 18,397,299 | 212,665,259 | 211,302,160 | 303,736 | - | - | 19,760,398 | |
| | | | | | | | | |
Amounts in the dividend income column in the above table include any capital gain distributions from underlying funds, which are presented in the corresponding line item in the Statement of Operations, if applicable.
Amount for Fidelity Securities Lending Cash Central Fund represents the income earned on investing cash collateral, less rebates paid to borrowers and any lending agent fees associated with the loan, plus any premium payments received for lending certain types of securities.
Amounts included in the purchases and sales proceeds columns may include in-kind transactions, if applicable.
Investment Valuation
The following is a summary of the inputs used, as of February 28, 2023, involving the Fund's assets and liabilities carried at fair value. The inputs or methodology used for valuing securities may not be an indication of the risk associated with investing in those securities. For more information on valuation inputs, and their aggregation into the levels used below, please refer to the Investment Valuation section in the accompanying Notes to Financial Statements.
| Valuation Inputs at Reporting Date: |
| Description | Total ($) | Level 1 ($) | Level 2 ($) | Level 3 ($) |
Investments in Securities: | | | | |
|
| Common Stocks | 105,159,385 | 103,898,841 | 1,260,544 | - |
|
| Preferred Stocks | 635,179 | 587,005 | - | 48,174 |
|
| Money Market Funds | 19,760,398 | 19,760,398 | - | - |
| Total Investments in Securities: | 125,554,962 | 124,246,244 | 1,260,544 | 48,174 |
Automotive Portfolio
| Statement of Assets and Liabilities |
| | | | February 28, 2023 |
| | | | | |
| Assets | | | | |
| Investment in securities, at value (including securities loaned of $19,098,673) - See accompanying schedule: | | | | |
Unaffiliated issuers (cost $77,791,842) | $ | 105,794,564 | | |
Fidelity Central Funds (cost $19,760,398) | | 19,760,398 | | |
| | | | | |
| | | | | |
| Total Investment in Securities (cost $97,552,240) | | | $ | 125,554,962 |
| Foreign currency held at value (cost $10,651) | | | | 10,651 |
| Receivable for fund shares sold | | | | 168,722 |
| Dividends receivable | | | | 305,078 |
| Distributions receivable from Fidelity Central Funds | | | | 29,707 |
| Prepaid expenses | | | | 230 |
| Other receivables | | | | 2,213 |
Total assets | | | | 126,071,563 |
| Liabilities | | | | |
| Payable for investments purchased | $ | 10,649 | | |
| Payable for fund shares redeemed | | 30,330 | | |
| Accrued management fee | | 46,050 | | |
| Other affiliated payables | | 23,466 | | |
| Other payables and accrued expenses | | 33,822 | | |
| Collateral on securities loaned | | 19,448,075 | | |
| Total Liabilities | | | | 19,592,392 |
| Net Assets | | | $ | 106,479,171 |
| Net Assets consist of: | | | | |
| Paid in capital | | | $ | 92,929,377 |
| Total accumulated earnings (loss) | | | | 13,549,794 |
| Net Assets | | | $ | 106,479,171 |
Net Asset Value , offering price and redemption price per share ($106,479,171 ÷ 2,315,078 shares) | | | $ | 45.99 |
| Statement of Operations |
| | | | Year ended February 28, 2023 |
| Investment Income | | | | |
| Dividends | | | $ | 1,342,022 |
| Special dividends | | | | 222,964 |
| Income from Fidelity Central Funds (including $291,519 from security lending) | | | | 303,736 |
| Total Income | | | | 1,868,722 |
| Expenses | | | | |
| Management fee | $ | 606,539 | | |
| Transfer agent fees | | 289,869 | | |
| Accounting fees | | 41,943 | | |
| Custodian fees and expenses | | 15,351 | | |
| Independent trustees' fees and expenses | | 407 | | |
| Registration fees | | 28,143 | | |
| Audit | | 40,354 | | |
| Legal | | 738 | | |
| Miscellaneous | | 696 | | |
| Total expenses before reductions | | 1,024,040 | | |
| Expense reductions | | (4,274) | | |
| Total expenses after reductions | | | | 1,019,766 |
| Net Investment income (loss) | | | | 848,956 |
| Realized and Unrealized Gain (Loss) | | | | |
| Net realized gain (loss) on: | | | | |
| Investment Securities: | | | | |
| Unaffiliated issuers | | (14,151,090) | | |
| Foreign currency transactions | | 3,546 | | |
| Total net realized gain (loss) | | | | (14,147,544) |
| Change in net unrealized appreciation (depreciation) on: | | | | |
| Investment Securities: | | | | |
| Unaffiliated issuers | | (16,315,495) | | |
| Assets and liabilities in foreign currencies | | (713) | | |
| Total change in net unrealized appreciation (depreciation) | | | | (16,316,208) |
| Net gain (loss) | | | | (30,463,752) |
| Net increase (decrease) in net assets resulting from operations | | | $ | (29,614,796) |
| Statement of Changes in Net Assets |
| |
| | Year ended February 28, 2023 | | Year ended February 28, 2022 |
| Increase (Decrease) in Net Assets | | | | |
| Operations | | | | |
| Net investment income (loss) | $ | 848,956 | $ | 753,430 |
| Net realized gain (loss) | | (14,147,544) | | 10,793,755 |
| Change in net unrealized appreciation (depreciation) | | (16,316,208) | | 607,122 |
| Net increase (decrease) in net assets resulting from operations | | (29,614,796) | | 12,154,307 |
| Distributions to shareholders | | (2,701,513) | | (6,137,128) |
| Share transactions | | | | |
| Proceeds from sales of shares | | 45,458,045 | | 189,559,902 |
| Reinvestment of distributions | | 2,537,929 | | 5,872,623 |
| Cost of shares redeemed | | (74,376,081) | | (234,498,841) |
Net increase (decrease) in net assets resulting from share transactions | | (26,380,107) | | (39,066,316) |
| Total increase (decrease) in net assets | | (58,696,416) | | (33,049,137) |
| | | | | |
| Net Assets | | | | |
| Beginning of period | | 165,175,587 | | 198,224,724 |
| End of period | $ | 106,479,171 | $ | 165,175,587 |
| | | | | |
| Other Information | | | | |
| Shares | | | | |
| Sold | | 949,641 | | 3,055,146 |
| Issued in reinvestment of distributions | | 51,998 | | 95,061 |
| Redeemed | | (1,606,800) | | (3,886,592) |
| Net increase (decrease) | | (605,161) | | (736,385) |
| | | | | |
Financial Highlights
| Years ended February 28, | | 2023 | | 2022 | | 2021 | | 2020 A | | 2019 |
Selected Per-Share Data | | | | | | | | | | |
| Net asset value, beginning of period | $ | 56.56 | $ | 54.21 | $ | 34.91 | $ | 33.29 | $ | 37.52 |
| Income from Investment Operations | | | | | | | | | | |
Net investment income (loss) B,C | | .34 D | | .23 E | | .05 F | | .46 G | | .36 |
| Net realized and unrealized gain (loss) | | (9.86) | | 3.82 | | 23.73 | | 2.67 H | | (2.15) |
| Total from investment operations | | (9.52) | | 4.05 | | 23.78 | | 3.13 | | (1.79) |
| Distributions from net investment income | | (.28) | | (.29) | | (.01) | | (.49) I | | (.38) |
| Distributions from net realized gain | | (.77) | | (1.40) | | (4.47) | | (1.02) I | | (2.06) |
| Total distributions | | (1.05) | | (1.70) J | | (4.48) | | (1.51) | | (2.44) |
| Net asset value, end of period | $ | 45.99 | $ | 56.56 | $ | 54.21 | $ | 34.91 | $ | 33.29 |
Total Return K | | (16.92)% | | 7.20% | | 78.19% | | 9.14% H | | (4.66)% |
Ratios to Average Net Assets C,L,M | | | | | | | | | | |
| Expenses before reductions | | .89% | | .80% | | .88% | | 1.00% | | .97% |
| Expenses net of fee waivers, if any | | .88% | | .80% | | .88% | | 1.00% | | .97% |
| Expenses net of all reductions | | .88% | | .80% | | .87% | | .99% | | .97% |
| Net investment income (loss) | | .73% D | | .37% E | | .10% F | | 1.33% G | | 1.04% |
| Supplemental Data | | | | | | | | | | |
| Net assets, end of period (000 omitted) | $ | 106,479 | $ | 165,176 | $ | 198,225 | $ | 36,480 | $ | 40,781 |
Portfolio turnover rate N | | 54% | | 69% | | 56% | | 45% | | 31% |
A For the year ended February 29.
B Calculated based on average shares outstanding during the period.
C Net investment income (loss) is affected by the timing of the declaration of dividends by any underlying mutual funds or exchange-traded funds (ETFs). Net investment income (loss) of any mutual funds or ETFs is not included in the Fund's net investment income (loss) ratio.
D Net investment income per share reflects one or more large, non-recurring dividend(s) which amounted to $.09 per share. Excluding such non-recurring dividend(s), the ratio of net investment income (loss) to average net assets would have been .54%.
E Net investment income per share reflects one or more large, non-recurring dividend(s) which amounted to $.10 per share. Excluding such non-recurring dividend(s), the ratio of net investment income (loss) to average net assets would have been .20%.
F Net investment income per share reflects one or more large, non-recurring dividend(s) which amounted to $.14 per share. Excluding such non-recurring dividend(s), the ratio of net investment income (loss) to average net assets would have been (.21)%.
G Net investment income per share reflects one or more large, non-recurring dividend(s) which amounted to $.09 per share. Excluding such non-recurring dividend(s), the ratio of net investment income (loss) to average net assets would have been 1.07%.
H Net realized and unrealized gain (loss) per share reflects proceeds received from litigation which amounted to $.19 per share. Excluding these litigation proceeds, the total return would have been 8.58%.
I The amount shown reflects reclassifications related to book to tax differences that were made in the year shown.
J Total distributions per share do not sum due to rounding.
K Total returns would have been lower if certain expenses had not been reduced during the applicable periods shown.
L Fees and expenses of any underlying mutual funds or exchange-traded funds (ETFs) are not included in the Fund's expense ratio. The Fund indirectly bears its proportionate share of these expenses. For additional expense information related to investments in Fidelity Central Funds, please refer to the "Investments in Fidelity Central Funds" note found in the Notes to Financial Statements section of the most recent Annual or Semi-Annual report.
M Expense ratios reflect operating expenses of the class. Expenses before reductions do not reflect amounts reimbursed, waived, or reduced through arrangements with the investment adviser, brokerage services, or other offset arrangements, if applicable, and do not represent the amount paid by the class during periods when reimbursements, waivers or reductions occur.
N Amount does not include the portfolio activity of any underlying mutual funds or exchange-traded funds (ETFs).
Average annual total return reflects the change in the value of an investment, assuming reinvestment of distributions from dividend income and capital gains (the profits earned upon the sale of securities that have grown in value, if any) and assuming a constant rate of performance each year. The hypothetical investment and the average annual total returns do not reflect the deduction of taxes that a shareholder would pay on fund distributions or the redemption of fund shares. During periods of reimbursement by Fidelity, a fund's total return will be greater than it would be had the reimbursement not occurred. How a fund did yesterday is no guarantee of how it will do tomorrow.
| Average Annual Total Returns |
| | | | |
Periods ended February 28, 2023 | Past 1 year | Past 5 years | Past 10 years |
| Class A (incl.5.75% sales charge) | -25.15% | 5.32% | 8.70% |
| Class M (incl.3.50% sales charge) | -23.55% | 5.59% | 8.84% |
Class C (incl. contingent deferred sales charge) | -21.93% | 5.91% | 9.00% |
| Communication Services Portfolio | -20.36% | 6.84% | 9.48% |
| Class I | -20.32% | 6.85% | 9.49% |
| Class Z | -20.23% | 6.97% | 9.55% |
Class C shares' contingent deferred sales charges included in the past one year, past five years and past ten years total return figures are 1%, 0% and 0%, respectively.
The initial offering of Class A, Class M, Class C, Class I and Class Z shares took place on November 30, 2018. Returns prior to November 30, 2018, are those of Communication Services Portfolio, the original class of the fund.
| $10,000 Over 10 Years |
| |
Let's say hypothetically that $10,000 was invested in Communication Services Portfolio, a class of the fund, on February 28, 2013. The chart shows how the value of your investment would have changed, and also shows how the S&P 500® Index performed over the same period. |
|
|
Communication Services Portfolio
Market Recap:
U.S. equities returned -7.69% for the 12 months ending February 28, 2023, according to the S&P 500 ® index. The new year began with an encouraging upturn in January (+6.28%), but stocks lost momentum in February (-2.44%) amid higher-than-expected inflation and strong jobs data. Investors took these as signs that the economy continued to run hot, even after a year of historic policy adjustment by the Federal Reserve aimed at cooling economic growth. Record inflation in 2022 prompted the Fed to aggressively tighten monetary policy, and market interest rates eclipsed their highest level in a decade, stoking recession fears and sending stocks into bear market territory. Since March 2022, the central bank has hiked its benchmark rate eight times, by 4.5 percentage points - the fastest-ever pace of monetary tightening - while also shrinking its massive asset portfolio. The latest bump came on February 2, along with a signal that the Fed plans to lift rates in March while it considers whether and when to pause increases. Against this dynamic backdrop, stocks struggled to gain traction until a strong rally ignited heading into the summer. But in September, the index returned -9.21%, one of its worst monthly results ever, before advancing 7.56% in Q4, as risky assets regained favor. For the full 12 months, value stocks handily outpaced growth. The headwind for the latter was most pronounced in the growth-oriented communication services (-25%) and consumer discretionary (-18%) sectors. In sharp contrast, energy gained 24%.
Comments from Portfolio Manager Matthew Drukker:
For the fiscal year ending February 28, 2023, the fund's share classes (excluding sales charges, if applicable) returned roughly -21% to -20%, outperforming the -23.61% result of the MSCI US IMI Communication Services 25/50 (Media Linked) Index, but underperforming the broad-based S&P 500 ® index. The primary contributors to performance versus the sector index were security selection and an overweight in the movies & entertainment industry. Picks among trucking stocks and an overweight in the wireless telecommunication services category also lifted the fund's relative result. The biggest individual relative contributor was an overweight position in T-Mobile U.S. (+14%), one portfolio's more sizable holdings at period end. Also lifting performance was an outsized stake in Netflix, which returned approximately -18%. We added to our position in the company this past year. Adding further value was the fund's non-index investment in Uber Technologies (-6%), one of our largest holdings as of February 28. In contrast, the largest detractor from performance versus the sector index was an underweighting among integrated telecommunication services firms. Stock picks and an overweighting in the interactive media & services group, as well as investment choices in the internet & direct marketing retail industry, also hindered relative performance. The biggest individual relative detractor was an overweight position in Snap (-75%). A smaller-than-index stake in AT&T (+11%), where we reduced our holding size this period, hurt as well. Another notable relative detractor was a larger-than-index position in Liberty Broadband (-40%), which was among the fund's biggest holdings. Notable changes in positioning include a higher allocation to the cable & satellite industry and movies & entertainment stocks.
The views expressed above reflect those of the portfolio manager(s) only through the end of the period as stated on the cover of this report and do not necessarily represent the views of Fidelity or any other person in the Fidelity organization. Any such views are subject to change at any time based upon market or other conditions and Fidelity disclaims any responsibility to update such views. These views may not be relied on as investment advice and, because investment decisions for a Fidelity fund are based on numerous factors, may not be relied on as an indication of trading intent on behalf of any Fidelity fund.
Communication Services Portfolio
Top Holdings (% of Fund's net assets) |
| |
| Meta Platforms, Inc. Class A | 17.8 | |
| Alphabet, Inc. Class A | 17.8 | |
| Netflix, Inc. | 8.9 | |
| Activision Blizzard, Inc. | 5.8 | |
| Liberty Broadband Corp. Class A | 4.4 | |
| T-Mobile U.S., Inc. | 4.4 | |
| Charter Communications, Inc. Class A | 4.4 | |
| Comcast Corp. Class A | 4.2 | |
| The Walt Disney Co. | 3.9 | |
| Uber Technologies, Inc. | 2.4 | |
| | 74.0 | |
| |
| Industries (% of Fund's net assets) |
| |
| Interactive Media & Services | 39.9 | |
| Entertainment | 29.5 | |
| Media | 15.7 | |
| Internet & Direct Marketing Retail | 4.7 | |
| Wireless Telecommunication Services | 4.4 | |
| Diversified Telecommunication Services | 4.0 | |
| Real Estate Management & Development | 0.3 | |
| Software | 0.1 | |
| IT Services | 0.1 | |
| |
Communication Services Portfolio
Showing Percentage of Net Assets
| Common Stocks - 98.4% |
| | | Shares | Value ($) |
| Diversified Telecommunication Services - 4.0% | | | |
| Alternative Carriers - 4.0% | | | |
| EchoStar Holding Corp. Class A (a)(b) | | 129,700 | 2,588,812 |
| Iridium Communications, Inc. | | 28,600 | 1,755,182 |
| Liberty Global PLC Class C (a) | | 677,300 | 14,392,625 |
| Liberty Latin America Ltd. Class C (a) | | 1,274,786 | 11,192,621 |
| | | | 29,929,240 |
| Integrated Telecommunication Services - 0.0% | | | |
| AT&T, Inc. | | 4,000 | 75,640 |
TOTAL DIVERSIFIED TELECOMMUNICATION SERVICES | | | 30,004,880 |
| Entertainment - 29.5% | | | |
| Interactive Home Entertainment - 7.8% | | | |
| Activision Blizzard, Inc. | | 579,400 | 44,179,250 |
| Roblox Corp. (a)(b) | | 61,100 | 2,238,704 |
| Skillz, Inc. (a) | | 26,600 | 16,638 |
| Take-Two Interactive Software, Inc. (a) | | 118,300 | 12,959,765 |
| | | | 59,394,357 |
| Movies & Entertainment - 21.7% | | | |
| Cinemark Holdings, Inc. (a)(b) | | 590,000 | 8,029,900 |
| Endeavor Group Holdings, Inc. (a)(b) | | 306,500 | 6,838,015 |
| Liberty Media Corp. Liberty Formula One Class A (a) | | 222,262 | 13,504,639 |
| Lions Gate Entertainment Corp.: | | | |
| Class A (a) | | 34,500 | 366,045 |
| Class B (a) | | 562,434 | 5,596,218 |
| Marcus Corp. (b) | | 297,200 | 4,781,948 |
| Netflix, Inc. (a) | | 209,400 | 67,454,022 |
| The Walt Disney Co. (a) | | 300,971 | 29,979,721 |
| Warner Bros Discovery, Inc. (a) | | 427,014 | 6,669,959 |
| Warner Music Group Corp. Class A | | 501,600 | 15,830,496 |
| World Wrestling Entertainment, Inc. Class A (b) | | 68,700 | 5,770,800 |
| | | | 164,821,763 |
TOTAL ENTERTAINMENT | | | 224,216,120 |
| Interactive Media & Services - 39.6% | | | |
| Interactive Media & Services - 39.6% | | | |
| Alphabet, Inc. Class A (a) | | 1,504,400 | 135,486,264 |
| Angi, Inc. (a)(b) | | 2,088,100 | 5,345,536 |
| Match Group, Inc. (a)(b) | | 237,070 | 9,819,439 |
| Meta Platforms, Inc. Class A (a) | | 774,900 | 135,561,007 |
| Shutterstock, Inc. (b) | | 19,600 | 1,474,312 |
| Snap, Inc. Class A (a) | | 895,600 | 9,090,340 |
| Vimeo, Inc. (a) | | 51,464 | 197,107 |
| Zoominfo Technologies, Inc. (a) | | 172,800 | 4,176,576 |
| | | | 301,150,581 |
| Internet & Direct Marketing Retail - 4.7% | | | |
| Internet & Direct Marketing Retail - 4.7% | | | |
| Amazon.com, Inc. (a) | | 187,700 | 17,686,971 |
| Uber Technologies, Inc. (a) | | 553,100 | 18,396,106 |
| | | | 36,083,077 |
| IT Services - 0.1% | | | |
| Internet Services & Infrastructure - 0.1% | | | |
| X Holdings I, Inc. (c)(d) | | 1,724 | 629,950 |
| Media - 15.7% | | | |
| Advertising - 0.6% | | | |
| S4 Capital PLC (a) | | 1,876,500 | 4,636,182 |
| TechTarget, Inc. (a) | | 12,100 | 456,533 |
| | | | 5,092,715 |
| Broadcasting - 0.3% | | | |
| Fox Corp. Class A (b) | | 58,600 | 2,052,172 |
| Cable & Satellite - 14.8% | | | |
| Altice U.S.A., Inc. Class A (a) | | 1,361,600 | 5,391,936 |
| Charter Communications, Inc. Class A (a) | | 90,200 | 33,158,422 |
| Comcast Corp. Class A | | 865,400 | 32,166,918 |
| DISH Network Corp. Class A (a) | | 44,539 | 508,190 |
| Liberty Broadband Corp. Class A (a) | | 389,123 | 33,748,638 |
| Liberty Media Corp. Liberty SiriusXM Series A (a) | | 232,800 | 7,540,392 |
| | | | 112,514,496 |
TOTAL MEDIA | | | 119,659,383 |
| Real Estate Management & Development - 0.3% | | | |
| Real Estate Services - 0.3% | | | |
| Zillow Group, Inc. Class A (a) | | 59,600 | 2,464,460 |
| Software - 0.1% | | | |
| Application Software - 0.1% | | | |
| Viant Technology, Inc. (a) | | 257,200 | 1,010,796 |
| Wireless Telecommunication Services - 4.4% | | | |
| Wireless Telecommunication Services - 4.4% | | | |
| T-Mobile U.S., Inc. (a) | | 235,750 | 33,518,935 |
| TOTAL COMMON STOCKS (Cost $674,835,934) | | | 748,738,182 |
| | | | |
| Convertible Preferred Stocks - 0.3% |
| | | Shares | Value ($) |
| Interactive Media & Services - 0.3% | | | |
| Interactive Media & Services - 0.3% | | | |
Reddit, Inc. Series F (a)(c)(d) (Cost $3,584,075) | | 58,000 | 2,209,800 |
| | | | |
| Money Market Funds - 5.2% |
| | | Shares | Value ($) |
| Fidelity Cash Central Fund 4.63% (e) | | 10,669,917 | 10,672,051 |
| Fidelity Securities Lending Cash Central Fund 4.63% (e)(f) | | 29,123,764 | 29,126,676 |
| TOTAL MONEY MARKET FUNDS (Cost $39,798,727) | | | 39,798,727 |
| | | | |
| TOTAL INVESTMENT IN SECURITIES - 103.9% (Cost $718,218,736) | 790,746,709 |
NET OTHER ASSETS (LIABILITIES) - (3.9)% | (29,498,696) |
| NET ASSETS - 100.0% | 761,248,013 |
| | |
Legend
| (b) | Security or a portion of the security is on loan at period end. |
| (c) | Restricted securities (including private placements) - Investment in securities not registered under the Securities Act of 1933 (excluding 144A issues). At the end of the period, the value of restricted securities (excluding 144A issues) amounted to $2,839,750 or 0.4% of net assets. |
| (e) | Affiliated fund that is generally available only to investment companies and other accounts managed by Fidelity Investments. The rate quoted is the annualized seven-day yield of the fund at period end. A complete unaudited listing of the fund's holdings as of its most recent quarter end is available upon request. In addition, each Fidelity Central Fund's financial statements, which are not covered by the Fund's Report of Independent Registered Public Accounting Firm, are available on the SEC's website or upon request. |
| (f) | Investment made with cash collateral received from securities on loan. |
| Additional information on each restricted holding is as follows: |
| Security | Acquisition Date | Acquisition Cost ($) |
| Reddit, Inc. Series F | 8/11/21 | 3,584,075 |
| | | |
| X Holdings I, Inc. | 10/27/21 | 1,266,192 |
| | | |
Affiliated Central Funds
Fiscal year to date information regarding the Fund's investments in Fidelity Central Funds, including the ownership percentage, is presented below.
| Affiliate | Value, beginning of period ($) | Purchases ($) | Sales Proceeds ($) | Dividend Income ($) | Realized Gain (loss) ($) | Change in Unrealized appreciation (depreciation) ($) | Value, end of period ($) | % ownership, end of period |
| Fidelity Cash Central Fund 4.63% | 605 | 252,151,916 | 241,480,470 | 138,792 | - | - | 10,672,051 | 0.0% |
| Fidelity Securities Lending Cash Central Fund 4.63% | 30,567,219 | 304,774,181 | 306,214,724 | 32,570 | - | - | 29,126,676 | 0.1% |
| Total | 30,567,824 | 556,926,097 | 547,695,194 | 171,362 | - | - | 39,798,727 | |
| | | | | | | | | |
Amounts in the dividend income column in the above table include any capital gain distributions from underlying funds, which are presented in the corresponding line item in the Statement of Operations, if applicable.
Amount for Fidelity Securities Lending Cash Central Fund represents the income earned on investing cash collateral, less rebates paid to borrowers and any lending agent fees associated with the loan, plus any premium payments received for lending certain types of securities.
Amounts included in the purchases and sales proceeds columns may include in-kind transactions, if applicable.
Investment Valuation
The following is a summary of the inputs used, as of February 28, 2023, involving the Fund's assets and liabilities carried at fair value. The inputs or methodology used for valuing securities may not be an indication of the risk associated with investing in those securities. For more information on valuation inputs, and their aggregation into the levels used below, please refer to the Investment Valuation section in the accompanying Notes to Financial Statements.
| Valuation Inputs at Reporting Date: |
| Description | Total ($) | Level 1 ($) | Level 2 ($) | Level 3 ($) |
Investments in Securities: | | | | |
|
| Common Stocks | 748,738,182 | 748,108,232 | - | 629,950 |
|
| Convertible Preferred Stocks | 2,209,800 | - | - | 2,209,800 |
|
| Money Market Funds | 39,798,727 | 39,798,727 | - | - |
| Total Investments in Securities: | 790,746,709 | 787,906,959 | - | 2,839,750 |
Communication Services Portfolio
| Statement of Assets and Liabilities |
| | | | February 28, 2023 |
| | | | | |
| Assets | | | | |
| Investment in securities, at value (including securities loaned of $28,132,058) - See accompanying schedule: | | | | |
Unaffiliated issuers (cost $678,420,009) | $ | 750,947,982 | | |
Fidelity Central Funds (cost $39,798,727) | | 39,798,727 | | |
| | | | | |
| | | | | |
| Total Investment in Securities (cost $718,218,736) | | | $ | 790,746,709 |
| Foreign currency held at value (cost $799) | | | | 797 |
| Receivable for fund shares sold | | | | 632,792 |
| Dividends receivable | | | | 94,144 |
| Distributions receivable from Fidelity Central Funds | | | | 39,302 |
| Prepaid expenses | | | | 1,869 |
Total assets | | | | 791,515,613 |
| Liabilities | | | | |
| Payable for fund shares redeemed | $ | 587,717 | | |
| Accrued management fee | | 346,801 | | |
| Distribution and service plan fees payable | | 13,210 | | |
| Other affiliated payables | | 154,278 | | |
| Other payables and accrued expenses | | 39,812 | | |
| Collateral on securities loaned | | 29,125,782 | | |
| Total Liabilities | | | | 30,267,600 |
| Net Assets | | | $ | 761,248,013 |
| Net Assets consist of: | | | | |
| Paid in capital | | | $ | 734,201,364 |
| Total accumulated earnings (loss) | | | | 27,046,649 |
| Net Assets | | | $ | 761,248,013 |
| | | | | |
| Net Asset Value and Maximum Offering Price | | | | |
| Class A : | | | | |
Net Asset Value and redemption price per share ($24,285,213 ÷ 390,186 shares) (a) | | | $ | 62.24 |
| Maximum offering price per share (100/94.25 of $62.24) | | | $ | 66.04 |
| Class M : | | | | |
Net Asset Value and redemption price per share ($3,499,049 ÷ 56,665 shares) (a) | | | $ | 61.75 |
| Maximum offering price per share (100/96.50 of $61.75) | | | $ | 63.99 |
| Class C : | | | | |
Net Asset Value and offering price per share ($7,478,221 ÷ 123,463 shares) (a) | | | $ | 60.57 |
| Communication Services : | | | | |
Net Asset Value , offering price and redemption price per share ($710,710,435 ÷ 11,299,039 shares) | | | $ | 62.90 |
| Class I : | | | | |
Net Asset Value , offering price and redemption price per share ($11,960,813 ÷ 190,199 shares) | | | $ | 62.89 |
| Class Z : | | | | |
Net Asset Value , offering price and redemption price per share ($3,314,282 ÷ 52,456 shares) | | | $ | 63.18 |
(a)Redemption price per share is equal to net asset value less any applicable contingent deferred sales charge. |
| Statement of Operations |
| | | | Year ended February 28, 2023 |
| Investment Income | | | | |
| Dividends | | | $ | 2,373,848 |
| Income from Fidelity Central Funds (including $32,570 from security lending) | | | | 171,362 |
| Total Income | | | | 2,545,210 |
| Expenses | | | | |
| Management fee | $ | 4,130,707 | | |
| Transfer agent fees | | 1,693,195 | | |
| Distribution and service plan fees | | 159,757 | | |
| Accounting fees | | 253,372 | | |
| Custodian fees and expenses | | 8,848 | | |
| Independent trustees' fees and expenses | | 2,720 | | |
| Registration fees | | 98,848 | | |
| Audit | | 45,964 | | |
| Legal | | 1,915 | | |
| Interest | | 993 | | |
| Miscellaneous | | 4,948 | | |
| Total expenses before reductions | | 6,401,267 | | |
| Expense reductions | | (27,974) | | |
| Total expenses after reductions | | | | 6,373,293 |
| Net Investment income (loss) | | | | (3,828,083) |
| Realized and Unrealized Gain (Loss) | | | | |
| Net realized gain (loss) on: | | | | |
| Investment Securities: | | | | |
| Unaffiliated issuers | | (27,501,704) | | |
| Foreign currency transactions | | (65,206) | | |
| Total net realized gain (loss) | | | | (27,566,910) |
| Change in net unrealized appreciation (depreciation) on: | | | | |
| Investment Securities: | | | | |
| Unaffiliated issuers | | (178,868,019) | | |
| Assets and liabilities in foreign currencies | | 29 | | |
| Total change in net unrealized appreciation (depreciation) | | | | (178,867,990) |
| Net gain (loss) | | | | (206,434,900) |
| Net increase (decrease) in net assets resulting from operations | | | $ | (210,262,983) |
| Statement of Changes in Net Assets |
| |
| | Year ended February 28, 2023 | | Year ended February 28, 2022 |
| Increase (Decrease) in Net Assets | | | | |
| Operations | | | | |
| Net investment income (loss) | $ | (3,828,083) | $ | (4,780,267) |
| Net realized gain (loss) | | (27,566,910) | | 19,842,720 |
| Change in net unrealized appreciation (depreciation) | | (178,867,990) | | (98,753,641) |
| Net increase (decrease) in net assets resulting from operations | | (210,262,983) | | (83,691,188) |
| Distributions to shareholders | | - | | (63,905,764) |
| Share transactions - net increase (decrease) | | (73,791,815) | | 267,487,210 |
| Total increase (decrease) in net assets | | (284,054,798) | | 119,890,258 |
| | | | | |
| Net Assets | | | | |
| Beginning of period | | 1,045,302,811 | | 925,412,553 |
| End of period | $ | 761,248,013 | $ | 1,045,302,811 |
| | | | | |
| | | | | |
Financial Highlights
| Fidelity Advisor® Communication Services Fund Class A |
| |
| Years ended February 28, | | 2023 | | 2022 | | 2021 | | 2020 A | | 2019 B |
Selected Per-Share Data | | | | | | | | | | |
| Net asset value, beginning of period | $ | 78.37 | $ | 87.31 | $ | 60.63 | $ | 74.85 | $ | 78.20 |
| Income from Investment Operations | | | | | | | | | | |
Net investment income (loss) C,D | | (.48) | | (.60) | | (.59) | | (.30) | | (.12) |
| Net realized and unrealized gain (loss) | | (15.65) | | (3.18) | | 30.37 | | 8.77 | | 2.68 |
| Total from investment operations | | (16.13) | | (3.78) | | 29.78 | | 8.47 | | 2.56 |
| Distributions from net investment income | | - | | - | | - | | - | | (.14) |
| Distributions from net realized gain | | - | | (5.16) | | (3.10) | | (22.69) | | (5.77) |
| Total distributions | | - | | (5.16) | | (3.10) | | (22.69) | | (5.91) |
| Net asset value, end of period | $ | 62.24 | $ | 78.37 | $ | 87.31 | $ | 60.63 | $ | 74.85 |
Total Return E,F,G | | (20.58)% | | (5.05)% | | 50.81% | | 11.90% | | 3.83% |
Ratios to Average Net Assets D,H,I | | | | | | | | | | |
| Expenses before reductions | | 1.07% | | 1.03% | | 1.08% | | 1.07% | | 1.13% J |
| Expenses net of fee waivers, if any | | 1.07% | | 1.03% | | 1.08% | | 1.07% | | 1.12% J |
| Expenses net of all reductions | | 1.07% | | 1.03% | | 1.07% | | 1.06% | | 1.11% J |
| Net investment income (loss) | | (.74)% | | (.65)% | | (.81)% | | (.47)% | | (.68)% J |
| Supplemental Data | | | | | | | | | | |
| Net assets, end of period (000 omitted) | $ | 24,285 | $ | 33,679 | $ | 22,962 | $ | 9,947 | $ | 715 |
Portfolio turnover rate K | | 45% | | 57% | | 63% | | 73% | | 107% |
A For the year ended February 29.
B For the period November 30, 2018 (commencement of sale of shares) through February 28, 2019.
C Calculated based on average shares outstanding during the period.
D Net investment income (loss) is affected by the timing of the declaration of dividends by any underlying mutual funds or exchange-traded funds (ETFs). Net investment income (loss) of any mutual funds or ETFs is not included in the Fund's net investment income (loss) ratio.
E Total returns for periods of less than one year are not annualized.
F Total returns would have been lower if certain expenses had not been reduced during the applicable periods shown.
G Total returns do not include the effect of the sales charges.
H Fees and expenses of any underlying mutual funds or exchange-traded funds (ETFs) are not included in the Fund's expense ratio. The Fund indirectly bears its proportionate share of these expenses. For additional expense information related to investments in Fidelity Central Funds, please refer to the "Investments in Fidelity Central Funds" note found in the Notes to Financial Statements section of the most recent Annual or Semi-Annual report.
I Expense ratios reflect operating expenses of the class. Expenses before reductions do not reflect amounts reimbursed, waived, or reduced through arrangements with the investment adviser, brokerage services, or other offset arrangements, if applicable, and do not represent the amount paid by the class during periods when reimbursements, waivers or reductions occur.
J Annualized.
K Amount does not include the portfolio activity of any underlying mutual funds or exchange-traded funds (ETFs).
| Fidelity Advisor® Communication Services Fund Class M |
| |
| Years ended February 28, | | 2023 | | 2022 | | 2021 | | 2020 A | | 2019 B |
Selected Per-Share Data | | | | | | | | | | |
| Net asset value, beginning of period | $ | 77.94 | $ | 86.94 | $ | 60.52 | $ | 74.82 | $ | 78.20 |
| Income from Investment Operations | | | | | | | | | | |
Net investment income (loss) C,D | | (.63) | | (.82) | | (.77) | | (.48) | | (.16) |
| Net realized and unrealized gain (loss) | | (15.56) | | (3.15) | | 30.29 | | 8.75 | | 2.67 |
| Total from investment operations | | (16.19) | | (3.97) | | 29.52 | | 8.27 | | 2.51 |
| Distributions from net investment income | | - | | - | | - | | - | | (.12) |
| Distributions from net realized gain | | - | | (5.03) | | (3.10) | | (22.57) | | (5.77) |
| Total distributions | | - | | (5.03) | | (3.10) | | (22.57) | | (5.89) |
| Net asset value, end of period | $ | 61.75 | $ | 77.94 | $ | 86.94 | $ | 60.52 | $ | 74.82 |
Total Return E,F,G | | (20.77)% | | (5.28)% | | 50.47% | | 11.58% | | 3.76% |
Ratios to Average Net Assets D,H,I | | | | | | | | | | |
| Expenses before reductions | | 1.31% | | 1.27% | | 1.32% | | 1.35% | | 1.36% J |
| Expenses net of fee waivers, if any | | 1.31% | | 1.27% | | 1.32% | | 1.35% | | 1.35% J |
| Expenses net of all reductions | | 1.31% | | 1.27% | | 1.32% | | 1.34% | | 1.34% J |
| Net investment income (loss) | | (.98)% | | (.88)% | | (1.06)% | | (.75)% | | (.90)% J |
| Supplemental Data | | | | | | | | | | |
| Net assets, end of period (000 omitted) | $ | 3,499 | $ | 5,817 | $ | 5,386 | $ | 2,264 | $ | 485 |
Portfolio turnover rate K | | 45% | | 57% | | 63% | | 73% | | 107% |
A For the year ended February 29.
B For the period November 30, 2018 (commencement of sale of shares) through February 28, 2019.
C Calculated based on average shares outstanding during the period.
D Net investment income (loss) is affected by the timing of the declaration of dividends by any underlying mutual funds or exchange-traded funds (ETFs). Net investment income (loss) of any mutual funds or ETFs is not included in the Fund's net investment income (loss) ratio.
E Total returns for periods of less than one year are not annualized.
F Total returns would have been lower if certain expenses had not been reduced during the applicable periods shown.
G Total returns do not include the effect of the sales charges.
H Fees and expenses of any underlying mutual funds or exchange-traded funds (ETFs) are not included in the Fund's expense ratio. The Fund indirectly bears its proportionate share of these expenses. For additional expense information related to investments in Fidelity Central Funds, please refer to the "Investments in Fidelity Central Funds" note found in the Notes to Financial Statements section of the most recent Annual or Semi-Annual report.
I Expense ratios reflect operating expenses of the class. Expenses before reductions do not reflect amounts reimbursed, waived, or reduced through arrangements with the investment adviser, brokerage services, or other offset arrangements, if applicable, and do not represent the amount paid by the class during periods when reimbursements, waivers or reductions occur.
J Annualized.
K Amount does not include the portfolio activity of any underlying mutual funds or exchange-traded funds (ETFs).
| Fidelity Advisor® Communication Services Fund Class C |
| |
| Years ended February 28, | | 2023 | | 2022 | | 2021 | | 2020 A | | 2019 B |
Selected Per-Share Data | | | | | | | | | | |
| Net asset value, beginning of period | $ | 76.81 | $ | 86.05 | $ | 60.20 | $ | 74.76 | $ | 78.20 |
| Income from Investment Operations | | | | | | | | | | |
Net investment income (loss) C,D | | (.90) | | (1.27) | | (1.12) | | (.81) | | (.25) |
| Net realized and unrealized gain (loss) | | (15.34) | | (3.07) | | 30.07 | | 8.74 | | 2.67 |
| Total from investment operations | | (16.24) | | (4.34) | | 28.95 | | 7.93 | | 2.42 |
| Distributions from net investment income | | - | | - | | - | | - | | (.09) |
| Distributions from net realized gain | | - | | (4.90) | | (3.10) | | (22.49) | | (5.77) |
| Total distributions | | - | | (4.90) | | (3.10) | | (22.49) | | (5.86) |
| Net asset value, end of period | $ | 60.57 | $ | 76.81 | $ | 86.05 | $ | 60.20 | $ | 74.76 |
Total Return E,F,G | | (21.14)% | | (5.76)% | | 49.77% | | 11.01% | | 3.63% |
Ratios to Average Net Assets D,H,I | | | | | | | | | | |
| Expenses before reductions | | 1.78% | | 1.78% | | 1.80% | | 1.86% | | 1.87% J |
| Expenses net of fee waivers, if any | | 1.78% | | 1.78% | | 1.80% | | 1.86% | | 1.85% J |
| Expenses net of all reductions | | 1.78% | | 1.78% | | 1.79% | | 1.85% | | 1.84% J |
| Net investment income (loss) | | (1.45)% | | (1.39)% | | (1.53)% | | (1.26)% | | (1.37)% J |
| Supplemental Data | | | | | | | | | | |
| Net assets, end of period (000 omitted) | $ | 7,478 | $ | 8,938 | $ | 6,856 | $ | 1,982 | $ | 377 |
Portfolio turnover rate K | | 45% | | 57% | | 63% | | 73% | | 107% |
A For the year ended February 29.
B For the period November 30, 2018 (commencement of sale of shares) through February 28, 2019.
C Calculated based on average shares outstanding during the period.
D Net investment income (loss) is affected by the timing of the declaration of dividends by any underlying mutual funds or exchange-traded funds (ETFs). Net investment income (loss) of any mutual funds or ETFs is not included in the Fund's net investment income (loss) ratio.
E Total returns for periods of less than one year are not annualized.
F Total returns would have been lower if certain expenses had not been reduced during the applicable periods shown.
G Total returns do not include the effect of the contingent deferred sales charge.
H Fees and expenses of any underlying mutual funds or exchange-traded funds (ETFs) are not included in the Fund's expense ratio. The Fund indirectly bears its proportionate share of these expenses. For additional expense information related to investments in Fidelity Central Funds, please refer to the "Investments in Fidelity Central Funds" note found in the Notes to Financial Statements section of the most recent Annual or Semi-Annual report.
I Expense ratios reflect operating expenses of the class. Expenses before reductions do not reflect amounts reimbursed, waived, or reduced through arrangements with the investment adviser, brokerage services, or other offset arrangements, if applicable, and do not represent the amount paid by the class during periods when reimbursements, waivers or reductions occur.
J Annualized.
K Amount does not include the portfolio activity of any underlying mutual funds or exchange-traded funds (ETFs).
| Communication Services Portfolio |
| |
| Years ended February 28, | | 2023 | | 2022 | | 2021 | | 2020 A | | 2019 |
Selected Per-Share Data | | | | | | | | | | |
| Net asset value, beginning of period | $ | 78.98 | $ | 87.88 | $ | 60.82 | $ | 74.88 | $ | 79.70 |
| Income from Investment Operations | | | | | | | | | | |
Net investment income (loss) B,C | | (.30) | | (.34) | | (.36) | | (.12) | | .13 |
| Net realized and unrealized gain (loss) | | (15.78) | | (3.22) | | 30.52 | | 8.79 | | 5.31 |
| Total from investment operations | | (16.08) | | (3.56) | | 30.16 | | 8.67 | | 5.44 |
| Distributions from net investment income | | - | | - | | - | | - | | (.20) |
| Distributions from net realized gain | | - | | (5.34) | | (3.10) | | (22.73) | | (10.06) |
| Total distributions | | - | | (5.34) | | (3.10) | | (22.73) | | (10.26) |
| Net asset value, end of period | $ | 62.90 | $ | 78.98 | $ | 87.88 | $ | 60.82 | $ | 74.88 |
Total Return D | | (20.36)% | | (4.79)% | | 51.29% | | 12.22% | | 8.12% |
Ratios to Average Net Assets C,E,F | | | | | | | | | | |
| Expenses before reductions | | .80% | | .75% | | .77% | | .78% | | .82% |
| Expenses net of fee waivers, if any | | .79% | | .74% | | .77% | | .78% | | .81% |
| Expenses net of all reductions | | .79% | | .74% | | .76% | | .77% | | .80% |
| Net investment income (loss) | | (.47)% | | (.36)% | | (.51)% | | (.18)% | | .17% |
| Supplemental Data | | | | | | | | | | |
| Net assets, end of period (000 omitted) | $ | 710,710 | $ | 958,304 | $ | 859,871 | $ | 577,157 | $ | 562,422 |
Portfolio turnover rate G | | 45% | | 57% | | 63% | | 73% | | 107% |
A For the year ended February 29.
B Calculated based on average shares outstanding during the period.
C Net investment income (loss) is affected by the timing of the declaration of dividends by any underlying mutual funds or exchange-traded funds (ETFs). Net investment income (loss) of any mutual funds or ETFs is not included in the Fund's net investment income (loss) ratio.
D Total returns would have been lower if certain expenses had not been reduced during the applicable periods shown.
E Fees and expenses of any underlying mutual funds or exchange-traded funds (ETFs) are not included in the Fund's expense ratio. The Fund indirectly bears its proportionate share of these expenses. For additional expense information related to investments in Fidelity Central Funds, please refer to the "Investments in Fidelity Central Funds" note found in the Notes to Financial Statements section of the most recent Annual or Semi-Annual report.
F Expense ratios reflect operating expenses of the class. Expenses before reductions do not reflect amounts reimbursed, waived, or reduced through arrangements with the investment adviser, brokerage services, or other offset arrangements, if applicable, and do not represent the amount paid by the class during periods when reimbursements, waivers or reductions occur.
G Amount does not include the portfolio activity of any underlying mutual funds or exchange-traded funds (ETFs).
| Fidelity Advisor® Communication Services Fund Class I |
| |
| Years ended February 28, | | 2023 | | 2022 | | 2021 | | 2020 A | | 2019 B |
Selected Per-Share Data | | | | | | | | | | |
| Net asset value, beginning of period | $ | 78.93 | $ | 87.86 | $ | 60.80 | $ | 74.89 | $ | 78.20 |
| Income from Investment Operations | | | | | | | | | | |
Net investment income (loss) C,D | | (.28) | | (.34) | | (.39) | | (.11) | | (.06) |
| Net realized and unrealized gain (loss) | | (15.76) | | (3.22) | | 30.55 | | 8.78 | | 2.67 |
| Total from investment operations | | (16.04) | | (3.56) | | 30.16 | | 8.67 | | 2.61 |
| Distributions from net investment income | | - | | - | | - | | - | | (.15) |
| Distributions from net realized gain | | - | | (5.37) | | (3.10) | | (22.76) | | (5.77) |
| Total distributions | | - | | (5.37) | | (3.10) | | (22.76) | | (5.92) |
| Net asset value, end of period | $ | 62.89 | $ | 78.93 | $ | 87.86 | $ | 60.80 | $ | 74.89 |
Total Return E,F | | (20.32)% | | (4.79)% | | 51.31% | | 12.22% | | 3.91% |
Ratios to Average Net Assets D,G,H | | | | | | | | | | |
| Expenses before reductions | | .76% | | .75% | | .78% | | .77% | | .70% I |
| Expenses net of fee waivers, if any | | .75% | | .75% | | .77% | | .77% | | .69% I |
| Expenses net of all reductions | | .75% | | .75% | | .77% | | .76% | | .68% I |
| Net investment income (loss) | | (.43)% | | (.37)% | | (.51)% | | (.17)% | | (.30)% I |
| Supplemental Data | | | | | | | | | | |
| Net assets, end of period (000 omitted) | $ | 11,961 | $ | 32,089 | $ | 26,521 | $ | 2,493 | $ | 452 |
Portfolio turnover rate J | | 45% | | 57% | | 63% | | 73% | | 107% |
A For the year ended February 29.
B For the period November 30, 2018 (commencement of sale of shares) through February 28, 2019.
C Calculated based on average shares outstanding during the period.
D Net investment income (loss) is affected by the timing of the declaration of dividends by any underlying mutual funds or exchange-traded funds (ETFs). Net investment income (loss) of any mutual funds or ETFs is not included in the Fund's net investment income (loss) ratio.
E Total returns for periods of less than one year are not annualized.
F Total returns would have been lower if certain expenses had not been reduced during the applicable periods shown.
G Fees and expenses of any underlying mutual funds or exchange-traded funds (ETFs) are not included in the Fund's expense ratio. The Fund indirectly bears its proportionate share of these expenses. For additional expense information related to investments in Fidelity Central Funds, please refer to the "Investments in Fidelity Central Funds" note found in the Notes to Financial Statements section of the most recent Annual or Semi-Annual report.
H Expense ratios reflect operating expenses of the class. Expenses before reductions do not reflect amounts reimbursed, waived, or reduced through arrangements with the investment adviser, brokerage services, or other offset arrangements, if applicable, and do not represent the amount paid by the class during periods when reimbursements, waivers or reductions occur.
I Annualized.
J Amount does not include the portfolio activity of any underlying mutual funds or exchange-traded funds (ETFs).
| Fidelity Advisor® Communication Services Fund Class Z |
| |
| Years ended February 28, | | 2023 | | 2022 | | 2021 | | 2020 A | | 2019 B |
Selected Per-Share Data | | | | | | | | | | |
| Net asset value, beginning of period | $ | 79.20 | $ | 88.04 | $ | 60.85 | $ | 74.89 | $ | 78.20 |
| Income from Investment Operations | | | | | | | | | | |
Net investment income (loss) C,D | | (.19) | | (.22) | | (.28) | | (.03) | | (.03) |
| Net realized and unrealized gain (loss) | | (15.83) | | (3.23) | | 30.57 | | 8.80 | | 2.65 |
| Total from investment operations | | (16.02) | | (3.45) | | 30.29 | | 8.77 | | 2.62 |
| Distributions from net investment income | | - | | - | | - | | - | | (.16) |
| Distributions from net realized gain | | - | | (5.39) | | (3.10) | | (22.81) | | (5.77) |
| Total distributions | | - | | (5.39) | | (3.10) | | (22.81) | | (5.93) |
| Net asset value, end of period | $ | 63.18 | $ | 79.20 | $ | 88.04 | $ | 60.85 | $ | 74.89 |
Total Return E,F | | (20.23)% | | (4.65)% | | 51.48% | | 12.38% | | 3.92% |
Ratios to Average Net Assets C,G,H | | | | | | | | | | |
| Expenses before reductions | | .62% | | .62% | | .64% | | .65% | | .64% I |
| Expenses net of fee waivers, if any | | .62% | | .61% | | .64% | | .65% | | .62% I |
| Expenses net of all reductions | | .62% | | .61% | | .63% | | .64% | | .61% I |
| Net investment income (loss) | | (.29)% | | (.23)% | | (.38)% | | (.05)% | | (.16)% I |
| Supplemental Data | | | | | | | | | | |
| Net assets, end of period (000 omitted) | $ | 3,314 | $ | 6,477 | $ | 3,817 | $ | 1,833 | $ | 529 |
Portfolio turnover rate J | | 45% | | 57% | | 63% | | 73% | | 107% |
A For the year ended February 29.
B For the period November 30, 2018 (commencement of sale of shares) through February 28, 2019.
C Net investment income (loss) is affected by the timing of the declaration of dividends by any underlying mutual funds or exchange-traded funds (ETFs). Net investment income (loss) of any mutual funds or ETFs is not included in the Fund's net investment income (loss) ratio.
D Calculated based on average shares outstanding during the period.
E Total returns for periods of less than one year are not annualized.
F Total returns would have been lower if certain expenses had not been reduced during the applicable periods shown.
G Expense ratios reflect operating expenses of the class. Expenses before reductions do not reflect amounts reimbursed, waived, or reduced through arrangements with the investment adviser, brokerage services, or other offset arrangements, if applicable, and do not represent the amount paid by the class during periods when reimbursements, waivers or reductions occur.
H Fees and expenses of any underlying mutual funds or exchange-traded funds (ETFs) are not included in the Fund's expense ratio. The Fund indirectly bears its proportionate share of these expenses. For additional expense information related to investments in Fidelity Central Funds, please refer to the "Investments in Fidelity Central Funds" note found in the Notes to Financial Statements section of the most recent Annual or Semi-Annual report.
I Annualized.
J Amount does not include the portfolio activity of any underlying mutual funds or exchange-traded funds (ETFs).
Average annual total return reflects the change in the value of an investment, assuming reinvestment of distributions from dividend income and capital gains (the profits earned upon the sale of securities that have grown in value, if any) and assuming a constant rate of performance each year. The hypothetical investment and the average annual total returns do not reflect the deduction of taxes that a shareholder would pay on fund distributions or the redemption of fund shares. During periods of reimbursement by Fidelity, a fund's total return will be greater than it would be had the reimbursement not occurred. How a fund did yesterday is no guarantee of how it will do tomorrow.
| Average Annual Total Returns |
| | | | |
Periods ended February 28, 2023 | Past 1 year | Past 5 years | Past 10 years |
| Construction and Housing Portfolio | -0.70% | 16.08% | 13.75% |
| $10,000 Over 10 Years |
| |
Let's say hypothetically that $10,000 was invested in Construction and Housing Portfolio on February 28, 2013. The chart shows how the value of your investment would have changed, and also shows how the S&P 500® Index performed over the same period. |
|
|
Construction and Housing Portfolio
Market Recap:
U.S. equities returned -7.69% for the 12 months ending February 28, 2023, according to the S&P 500 ® index. The new year began with an encouraging upturn in January (+6.28%), but stocks lost momentum in February (-2.44%) amid higher-than-expected inflation and strong jobs data. Investors took these as signs that the economy continued to run hot, even after a year of historic policy adjustment by the Federal Reserve aimed at cooling economic growth. Record inflation in 2022 prompted the Fed to aggressively tighten monetary policy, and market interest rates eclipsed their highest level in a decade, stoking recession fears and sending stocks into bear market territory. Since March 2022, the central bank has hiked its benchmark rate eight times, by 4.5 percentage points - the fastest-ever pace of monetary tightening - while also shrinking its massive asset portfolio. The latest bump came on February 2, along with a signal that the Fed plans to lift rates in March while it considers whether and when to pause increases. Against this dynamic backdrop, stocks struggled to gain traction until a strong rally ignited heading into the summer. But in September, the index returned -9.21%, one of its worst monthly results ever, before advancing 7.56% in Q4, as risky assets regained favor. For the full 12 months, value stocks handily outpaced growth. The headwind for the latter was most pronounced in the growth-oriented communication services (-25%) and consumer discretionary (-18%) sectors. In sharp contrast, energy gained 24%.
Comments from Portfolio Manager Jordan Michaels:
For the fiscal year ending February 28, 2023, the fund returned -0.70%, outperforming the -2.34% result of the MSCI US IMI Construction & Housing 25/50 Index, as well as the broad-based S&P 500 ® index. Versus the industry index, security selection was the primary contributor, led by choices in the construction & engineering group. Also helping was stock selection and an underweighting in residential REITs. The fund's biggest individual relative contributor was an overweighting in WillScot Mobile Mini Holdings, which gained 44% the past year. Though we decreased our stake, the company was among the biggest holdings as of February 28. Our second-largest relative contributor this period was avoiding AvalonBay Communities, an index component that returned approximately -25%. Another top relative contributor was an out-of-index position in Tempur Sealy International (+31%). We reduced the size of our position this period. In contrast, the largest detractor from performance versus the industry index was security selection in internet services & infrastructure. An underweighting in the outperforming construction & engineering group also modestly hurt, as did stock selection in real estate services. Our non-index stake in Cyxtera Technologies was the fund's largest individual relative detractor, due to its roughly -82% result. Also hurting performance was our outsized stake in Elme Communities, which returned about -17%. We reduced our holdings this period. The fund's non-index investment in Cushman & Wakefield returned -41%, and we increased the fund's holdings. Notable changes in positioning include a higher allocation to the homebuilding and construction & engineering subindustries.
The views expressed above reflect those of the portfolio manager(s) only through the end of the period as stated on the cover of this report and do not necessarily represent the views of Fidelity or any other person in the Fidelity organization. Any such views are subject to change at any time based upon market or other conditions and Fidelity disclaims any responsibility to update such views. These views may not be relied on as investment advice and, because investment decisions for a Fidelity fund are based on numerous factors, may not be relied on as an indication of trading intent on behalf of any Fidelity fund.
Construction and Housing Portfolio
Top Holdings (% of Fund's net assets) |
| |
| The Home Depot, Inc. | 16.8 | |
| Lowe's Companies, Inc. | 15.4 | |
| Johnson Controls International PLC | 5.8 | |
| Trane Technologies PLC | 4.0 | |
| Vulcan Materials Co. | 3.3 | |
| Invitation Homes, Inc. | 3.2 | |
| Willscot Mobile Mini Holdings | 3.1 | |
| Floor & Decor Holdings, Inc. Class A | 3.0 | |
| Builders FirstSource, Inc. | 3.0 | |
| Essex Property Trust, Inc. | 2.6 | |
| | 60.2 | |
| |
| Industries (% of Fund's net assets) |
| |
| Specialty Retail | 36.2 | |
| Building Products | 23.4 | |
| Equity Real Estate Investment Trusts (Reits) | 12.8 | |
| Household Durables | 12.6 | |
| Construction & Engineering | 8.7 | |
| Construction Materials | 3.7 | |
| Real Estate Management & Development | 0.9 | |
| Chemicals | 0.5 | |
| Electrical Equipment | 0.3 | |
| Trading Companies & Distributors | 0.3 | |
| IT Services | 0.1 | |
| |
Geographic Diversification (% of Fund's net assets) |
|
* Includes Short-Term investments and Net Other Assets (Liabilities). Percentages are based on country or territory of incorporation and are adjusted for the effect of derivatives, if applicable. |
| |
Construction and Housing Portfolio
Showing Percentage of Net Assets
| Common Stocks - 99.5% |
| | | Shares | Value ($) |
| Building Products - 23.4% | | | |
| Building Products - 23.4% | | | |
| Apogee Enterprises, Inc. | | 96,400 | 4,411,264 |
| Armstrong World Industries, Inc. (a) | | 64,400 | 5,077,940 |
| Builders FirstSource, Inc. (b) | | 174,935 | 14,830,989 |
| Carlisle Companies, Inc. | | 46,100 | 11,903,942 |
| Carrier Global Corp. | | 216,400 | 9,744,492 |
| Fortune Brands Home & Security, Inc. | | 77,100 | 4,776,345 |
| Johnson Controls International PLC | | 459,951 | 28,848,127 |
| MasterBrand, Inc. (b) | | 219,600 | 2,138,904 |
| Resideo Technologies, Inc. (b) | | 85,200 | 1,562,568 |
| Simpson Manufacturing Co. Ltd. | | 50,900 | 5,490,074 |
| The AZEK Co., Inc. (a)(b) | | 145,000 | 3,493,050 |
| Trane Technologies PLC | | 107,700 | 19,921,269 |
| UFP Industries, Inc. | | 55,326 | 4,732,033 |
| | | | 116,930,997 |
| Chemicals - 0.5% | | | |
| Specialty Chemicals - 0.5% | | | |
| PPG Industries, Inc. | | 8,500 | 1,122,510 |
| Sherwin-Williams Co. | | 6,400 | 1,416,640 |
| | | | 2,539,150 |
| Construction & Engineering - 8.7% | | | |
| Construction & Engineering - 8.7% | | | |
| AECOM | | 62,600 | 5,406,136 |
| EMCOR Group, Inc. | | 41,370 | 6,917,891 |
| Fluor Corp. (b) | | 17,100 | 627,057 |
| Granite Construction, Inc. | | 96,818 | 4,182,538 |
| Quanta Services, Inc. | | 66,599 | 10,749,079 |
| Willscot Mobile Mini Holdings (b) | | 303,350 | 15,592,190 |
| | | | 43,474,891 |
| Construction Materials - 3.7% | | | |
| Construction Materials - 3.7% | | | |
| Summit Materials, Inc. | | 75,558 | 2,231,983 |
| Vulcan Materials Co. | | 89,876 | 16,259,467 |
| | | | 18,491,450 |
| Electrical Equipment - 0.3% | | | |
| Electrical Components & Equipment - 0.3% | | | |
| Generac Holdings, Inc. (b) | | 13,200 | 1,584,132 |
| Equity Real Estate Investment Trusts (REITs) - 12.8% | | | |
| Residential REITs - 12.8% | | | |
| Elme Communities (SBI) | | 482,400 | 8,977,464 |
| Equity Lifestyle Properties, Inc. | | 129,700 | 8,885,747 |
| Equity Residential (SBI) | | 83,000 | 5,189,160 |
| Essex Property Trust, Inc. | | 56,600 | 12,908,196 |
| Invitation Homes, Inc. | | 515,100 | 16,102,026 |
| Mid-America Apartment Communities, Inc. | | 72,200 | 11,559,220 |
| | | | 63,621,813 |
| Household Durables - 12.6% | | | |
| Home Furnishings - 1.9% | | | |
| Tempur Sealy International, Inc. | | 215,500 | 9,210,470 |
| Homebuilding - 10.4% | | | |
| Blu Investments LLC (b)(c)(d) | | 11,990,913 | 3,717 |
| D.R. Horton, Inc. | | 44,156 | 4,083,547 |
| Installed Building Products, Inc. | | 57,938 | 6,684,886 |
| KB Home | | 172,700 | 6,091,129 |
| Lennar Corp. Class A | | 11,000 | 1,064,140 |
| NVR, Inc. (b) | | 2,421 | 12,525,334 |
| PulteGroup, Inc. | | 224,485 | 12,272,595 |
| Toll Brothers, Inc. | | 154,400 | 9,254,736 |
| | | | 51,980,084 |
| Household Appliances - 0.3% | | | |
| Whirlpool Corp. (a) | | 10,400 | 1,434,992 |
TOTAL HOUSEHOLD DURABLES | | | 62,625,546 |
| IT Services - 0.1% | | | |
| Internet Services & Infrastructure - 0.1% | | | |
| Cyxtera Technologies, Inc. Class A (b) | | 200,000 | 448,000 |
| Real Estate Management & Development - 0.9% | | | |
| Diversified Real Estate Activities - 0.3% | | | |
| The RMR Group, Inc. | | 56,060 | 1,577,528 |
| Real Estate Services - 0.6% | | | |
| Cushman & Wakefield PLC (b) | | 219,895 | 2,845,441 |
TOTAL REAL ESTATE MANAGEMENT & DEVELOPMENT | | | 4,422,969 |
| Specialty Retail - 36.2% | | | |
| Home Improvement Retail - 35.2% | | | |
| Floor & Decor Holdings, Inc. Class A (a)(b) | | 162,900 | 14,955,849 |
| Lowe's Companies, Inc. | | 372,695 | 76,681,996 |
| The Home Depot, Inc. | | 283,190 | 83,977,164 |
| | | | 175,615,009 |
| Homefurnishing Retail - 1.0% | | | |
| Williams-Sonoma, Inc. (a) | | 40,400 | 5,046,768 |
TOTAL SPECIALTY RETAIL | | | 180,661,777 |
| Trading Companies & Distributors - 0.3% | | | |
| Trading Companies & Distributors - 0.3% | | | |
| Beacon Roofing Supply, Inc. (b) | | 19,903 | 1,293,695 |
| TOTAL COMMON STOCKS (Cost $328,519,990) | | | 496,094,420 |
| | | | |
| Money Market Funds - 5.8% |
| | | Shares | Value ($) |
| Fidelity Cash Central Fund 4.63% (e) | | 3,548,798 | 3,549,508 |
| Fidelity Securities Lending Cash Central Fund 4.63% (e)(f) | | 25,264,199 | 25,266,725 |
| TOTAL MONEY MARKET FUNDS (Cost $28,816,233) | | | 28,816,233 |
| | | | |
| TOTAL INVESTMENT IN SECURITIES - 105.3% (Cost $357,336,223) | 524,910,653 |
NET OTHER ASSETS (LIABILITIES) - (5.3)% | (26,213,732) |
| NET ASSETS - 100.0% | 498,696,921 |
| | |
Legend
| (a) | Security or a portion of the security is on loan at period end. |
| (c) | Restricted securities (including private placements) - Investment in securities not registered under the Securities Act of 1933 (excluding 144A issues). At the end of the period, the value of restricted securities (excluding 144A issues) amounted to $3,717 or 0.0% of net assets. |
| (e) | Affiliated fund that is generally available only to investment companies and other accounts managed by Fidelity Investments. The rate quoted is the annualized seven-day yield of the fund at period end. A complete unaudited listing of the fund's holdings as of its most recent quarter end is available upon request. In addition, each Fidelity Central Fund's financial statements, which are not covered by the Fund's Report of Independent Registered Public Accounting Firm, are available on the SEC's website or upon request. |
| (f) | Investment made with cash collateral received from securities on loan. |
| Additional information on each restricted holding is as follows: |
| Security | Acquisition Date | Acquisition Cost ($) |
| Blu Investments LLC | 5/21/20 | 20,739 |
| | | |
Affiliated Central Funds
Fiscal year to date information regarding the Fund's investments in Fidelity Central Funds, including the ownership percentage, is presented below.
| Affiliate | Value, beginning of period ($) | Purchases ($) | Sales Proceeds ($) | Dividend Income ($) | Realized Gain (loss) ($) | Change in Unrealized appreciation (depreciation) ($) | Value, end of period ($) | % ownership, end of period |
| Fidelity Cash Central Fund 4.63% | 5,377,678 | 135,395,564 | 137,223,734 | 43,281 | - | - | 3,549,508 | 0.0% |
| Fidelity Securities Lending Cash Central Fund 4.63% | 2,014,150 | 161,339,327 | 138,086,752 | 15,855 | - | - | 25,266,725 | 0.1% |
| Total | 7,391,828 | 296,734,891 | 275,310,486 | 59,136 | - | - | 28,816,233 | |
| | | | | | | | | |
Amounts in the dividend income column in the above table include any capital gain distributions from underlying funds, which are presented in the corresponding line item in the Statement of Operations, if applicable.
Amount for Fidelity Securities Lending Cash Central Fund represents the income earned on investing cash collateral, less rebates paid to borrowers and any lending agent fees associated with the loan, plus any premium payments received for lending certain types of securities.
Amounts included in the purchases and sales proceeds columns may include in-kind transactions, if applicable.
Investment Valuation
The following is a summary of the inputs used, as of February 28, 2023, involving the Fund's assets and liabilities carried at fair value. The inputs or methodology used for valuing securities may not be an indication of the risk associated with investing in those securities. For more information on valuation inputs, and their aggregation into the levels used below, please refer to the Investment Valuation section in the accompanying Notes to Financial Statements.
| Valuation Inputs at Reporting Date: |
| Description | Total ($) | Level 1 ($) | Level 2 ($) | Level 3 ($) |
Investments in Securities: | | | | |
|
| Common Stocks | 496,094,420 | 496,090,703 | - | 3,717 |
|
| Money Market Funds | 28,816,233 | 28,816,233 | - | - |
| Total Investments in Securities: | 524,910,653 | 524,906,936 | - | 3,717 |
Construction and Housing Portfolio
| Statement of Assets and Liabilities |
| | | | February 28, 2023 |
| | | | | |
| Assets | | | | |
| Investment in securities, at value (including securities loaned of $24,852,288) - See accompanying schedule: | | | | |
Unaffiliated issuers (cost $328,519,990) | $ | 496,094,420 | | |
Fidelity Central Funds (cost $28,816,233) | | 28,816,233 | | |
| | | | | |
| | | | | |
| Total Investment in Securities (cost $357,336,223) | | | $ | 524,910,653 |
| Receivable for investments sold | | | | 6,093,975 |
| Receivable for fund shares sold | | | | 290,632 |
| Dividends receivable | | | | 97,561 |
| Distributions receivable from Fidelity Central Funds | | | | 13,250 |
| Prepaid expenses | | | | 1,202 |
Total assets | | | | 531,407,273 |
| Liabilities | | | | |
| Payable for investments purchased | $ | 6,930,955 | | |
| Payable for fund shares redeemed | | 164,442 | | |
| Accrued management fee | | 222,923 | | |
| Other affiliated payables | | 91,966 | | |
| Other payables and accrued expenses | | 33,341 | | |
| Collateral on securities loaned | | 25,266,725 | | |
| Total Liabilities | | | | 32,710,352 |
| Net Assets | | | $ | 498,696,921 |
| Net Assets consist of: | | | | |
| Paid in capital | | | $ | 347,408,093 |
| Total accumulated earnings (loss) | | | | 151,288,828 |
| Net Assets | | | $ | 498,696,921 |
Net Asset Value , offering price and redemption price per share ($498,696,921 ÷ 5,636,414 shares) | | | $ | 88.48 |
| Statement of Operations |
| | | | Year ended February 28, 2023 |
| Investment Income | | | | |
| Dividends | | | $ | 8,517,917 |
| Income from Fidelity Central Funds (including $15,855 from security lending) | | | | 59,136 |
| Total Income | | | | 8,577,053 |
| Expenses | | | | |
| Management fee | $ | 2,702,438 | | |
| Transfer agent fees | | 955,911 | | |
| Accounting fees | | 183,832 | | |
| Custodian fees and expenses | | 9,809 | | |
| Independent trustees' fees and expenses | | 1,802 | | |
| Registration fees | | 45,219 | | |
| Audit | | 39,151 | | |
| Legal | | 1,525 | | |
| Interest | | 952 | | |
| Miscellaneous | | 2,937 | | |
| Total expenses before reductions | | 3,943,576 | | |
| Expense reductions | | (18,633) | | |
| Total expenses after reductions | | | | 3,924,943 |
| Net Investment income (loss) | | | | 4,652,110 |
| Realized and Unrealized Gain (Loss) | | | | |
| Net realized gain (loss) on: | | | | |
| Investment Securities: | | | | |
| Unaffiliated issuers | | (12,450,749) | | |
| Total net realized gain (loss) | | | | (12,450,749) |
| Change in net unrealized appreciation (depreciation) on investment securities | | | | (9,276,236) |
| Net gain (loss) | | | | (21,726,985) |
| Net increase (decrease) in net assets resulting from operations | | | $ | (17,074,875) |
| Statement of Changes in Net Assets |
| |
| | Year ended February 28, 2023 | | Year ended February 28, 2022 |
| Increase (Decrease) in Net Assets | | | | |
| Operations | | | | |
| Net investment income (loss) | $ | 4,652,110 | $ | 3,741,270 |
| Net realized gain (loss) | | (12,450,749) | | 26,178,157 |
| Change in net unrealized appreciation (depreciation) | | (9,276,236) | | 24,955,718 |
| Net increase (decrease) in net assets resulting from operations | | (17,074,875) | | 54,875,145 |
| Distributions to shareholders | | (3,697,710) | | (39,900,442) |
| Share transactions | | | | |
| Proceeds from sales of shares | | 79,113,675 | | 712,970,980 |
| Reinvestment of distributions | | 3,425,079 | | 37,862,407 |
| Cost of shares redeemed | | (276,407,546) | | (395,931,225) |
Net increase (decrease) in net assets resulting from share transactions | | (193,868,792) | | 354,902,162 |
| Total increase (decrease) in net assets | | (214,641,377) | | 369,876,865 |
| | | | | |
| Net Assets | | | | |
| Beginning of period | | 713,338,298 | | 343,461,433 |
| End of period | $ | 498,696,921 | $ | 713,338,298 |
| | | | | |
| Other Information | | | | |
| Shares | | | | |
| Sold | | 926,693 | | 7,347,600 |
| Issued in reinvestment of distributions | | 40,601 | | 384,753 |
| Redeemed | | (3,274,232) | | (4,219,107) |
| Net increase (decrease) | | (2,306,938) | | 3,513,246 |
| | | | | |
Financial Highlights
| Construction and Housing Portfolio |
| |
| Years ended February 28, | | 2023 | | 2022 | | 2021 | | 2020 A | | 2019 |
Selected Per-Share Data | | | | | | | | | | |
| Net asset value, beginning of period | $ | 89.80 | $ | 77.53 | $ | 58.56 | $ | 54.22 | $ | 59.88 |
| Income from Investment Operations | | | | | | | | | | |
Net investment income (loss) B,C | | .76 | | .57 | | .59 | | .53 | | .49 |
| Net realized and unrealized gain (loss) | | (1.42) | | 17.59 | | 21.82 | | 8.71 | | 1.32 |
| Total from investment operations | | (.66) | | 18.16 | | 22.41 | | 9.24 | | 1.81 |
| Distributions from net investment income | | (.66) | | (.53) | | (.61) | | (.60) | | (.55) |
| Distributions from net realized gain | | - | | (5.36) | | (2.83) | | (4.31) | | (6.92) |
| Total distributions | | (.66) | | (5.89) | | (3.44) | | (4.90) D | | (7.47) |
| Net asset value, end of period | $ | 88.48 | $ | 89.80 | $ | 77.53 | $ | 58.56 | $ | 54.22 |
Total Return E | | (.70)% | | 22.95% | | 41.70% | | 17.10% | | 4.03% |
Ratios to Average Net Assets C,F,G | | | | | | | | | | |
| Expenses before reductions | | .77% | | .75% | | .78% | | .79% | | .80% |
| Expenses net of fee waivers, if any | | .76% | | .75% | | .78% | | .79% | | .80% |
| Expenses net of all reductions | | .76% | | .75% | | .77% | | .79% | | .79% |
| Net investment income (loss) | | .90% | | .60% | | .94% | | .88% | | .86% |
| Supplemental Data | | | | | | | | | | |
| Net assets, end of period (000 omitted) | $ | 498,697 | $ | 713,338 | $ | 343,461 | $ | 318,905 | $ | 225,255 |
Portfolio turnover rate H | | 20% | | 70% | | 93% | | 161% | | 90% |
A For the year ended February 29.
B Calculated based on average shares outstanding during the period.
C Net investment income (loss) is affected by the timing of the declaration of dividends by any underlying mutual funds or exchange-traded funds (ETFs). Net investment income (loss) of any mutual funds or ETFs is not included in the Fund's net investment income (loss) ratio.
D Total distributions per share do not sum due to rounding.
E Total returns would have been lower if certain expenses had not been reduced during the applicable periods shown.
F Fees and expenses of any underlying mutual funds or exchange-traded funds (ETFs) are not included in the Fund's expense ratio. The Fund indirectly bears its proportionate share of these expenses. For additional expense information related to investments in Fidelity Central Funds, please refer to the "Investments in Fidelity Central Funds" note found in the Notes to Financial Statements section of the most recent Annual or Semi-Annual report.
G Expense ratios reflect operating expenses of the class. Expenses before reductions do not reflect amounts reimbursed, waived, or reduced through arrangements with the investment adviser, brokerage services, or other offset arrangements, if applicable, and do not represent the amount paid by the class during periods when reimbursements, waivers or reductions occur.
H Amount does not include the portfolio activity of any underlying mutual funds or exchange-traded funds (ETFs).
Average annual total return reflects the change in the value of an investment, assuming reinvestment of distributions from dividend income and capital gains (the profits earned upon the sale of securities that have grown in value, if any) and assuming a constant rate of performance each year. The hypothetical investment and the average annual total returns do not reflect the deduction of taxes that a shareholder would pay on fund distributions or the redemption of fund shares. During periods of reimbursement by Fidelity, a fund's total return will be greater than it would be had the reimbursement not occurred. How a fund did yesterday is no guarantee of how it will do tomorrow.
| Average Annual Total Returns |
| | | | |
Periods ended February 28, 2023 | Past 1 year | Past 5 years | Past 10 years |
| Consumer Discretionary Portfolio | -16.87% | 7.13% | 11.20% |
| $10,000 Over 10 Years |
| |
Let's say hypothetically that $10,000 was invested in Consumer Discretionary Portfolio on February 28, 2013. The chart shows how the value of your investment would have changed, and also shows how the S&P 500® Index performed over the same period. |
|
|
Consumer Discretionary Portfolio
Market Recap:
U.S. equities returned -7.69% for the 12 months ending February 28, 2023, according to the S&P 500 ® index. The new year began with an encouraging upturn in January (+6.28%), but stocks lost momentum in February (-2.44%) amid higher-than-expected inflation and strong jobs data. Investors took these as signs that the economy continued to run hot, even after a year of historic policy adjustment by the Federal Reserve aimed at cooling economic growth. Record inflation in 2022 prompted the Fed to aggressively tighten monetary policy, and market interest rates eclipsed their highest level in a decade, stoking recession fears and sending stocks into bear market territory. Since March 2022, the central bank has hiked its benchmark rate eight times, by 4.5 percentage points - the fastest-ever pace of monetary tightening - while also shrinking its massive asset portfolio. The latest bump came on February 2, along with a signal that the Fed plans to lift rates in March while it considers whether and when to pause increases. Against this dynamic backdrop, stocks struggled to gain traction until a strong rally ignited heading into the summer. But in September, the index returned -9.21%, one of its worst monthly results ever, before advancing 7.56% in Q4, as risky assets regained favor. For the full 12 months, value stocks handily outpaced growth. The headwind for the latter was most pronounced in the growth-oriented communication services (-25%) and consumer discretionary (-18%) sectors. In sharp contrast, energy gained 24%.
Comments from Portfolio Manager Jordan Michaels:
For the fiscal year ending February 28, 2023, the fund returned -16.87%, trailing the -15.75% result of the MSCI US IMI Consumer Discretionary 25/50 Index, as well as the broad-based S&P 500 ® index. The largest detractors from performance versus the sector index were an underweighting and security selection in the restaurants group. An underweighting and stock picks in automotive retail and security selection in apparel retail also hurt. The fund's biggest individual relative detractor was our lighter-than-index stake in Mcdonalds, which gained about 10% the past year. We increased our stake this period, and it was among the fund's largest holdings as of February 28. Our second-largest relative detractor this period was avoiding Starbucks, an index component that gained 14%. Also hindering performance was our overweighting in Capri Holdings, which returned -27%. We reduced our stake in Capri Holdings the past 12 months. Conversely, the biggest contributor to performance versus the sector index was stock selection in hotels, resorts & cruise lines. Stock selection and an overweighting in footwear and an overweighting in apparel retail also bolstered the fund's relative performance. The fund's biggest individual relative contributor was an outsized stake in Deckers Outdoor, which gained about 45% the past 12 months. Also helping performance was our overweighting in TJX Companies, which gained 18%. TJX Companies was among the fund's biggest holdings. Another notable relative contributor was an outsized stake in Dicks Sporting Goods (+26%). This period we added to our stake. Notable changes in positioning include increased exposure to the general merchandise stores subindustry and a lower allocation to apparel, accessories & luxury goods.
Note to shareholders: On October 1, 2022, Jordan Michaels assumed sole management responsibilities for the fund after having served as co-manager with Katherine Shaw since July 2022.
The views expressed above reflect those of the portfolio manager(s) only through the end of the period as stated on the cover of this report and do not necessarily represent the views of Fidelity or any other person in the Fidelity organization. Any such views are subject to change at any time based upon market or other conditions and Fidelity disclaims any responsibility to update such views. These views may not be relied on as investment advice and, because investment decisions for a Fidelity fund are based on numerous factors, may not be relied on as an indication of trading intent on behalf of any Fidelity fund.
Consumer Discretionary Portfolio
Top Holdings (% of Fund's net assets) |
| |
| Amazon.com, Inc. | 21.1 | |
| Tesla, Inc. | 12.4 | |
| The Home Depot, Inc. | 4.9 | |
| Lowe's Companies, Inc. | 4.9 | |
| NIKE, Inc. Class B | 4.1 | |
| TJX Companies, Inc. | 3.9 | |
| Hilton Worldwide Holdings, Inc. | 2.9 | |
| Booking Holdings, Inc. | 2.6 | |
| Dollar Tree, Inc. | 2.5 | |
| Target Corp. | 2.2 | |
| | 61.5 | |
| |
| Industries (% of Fund's net assets) |
| |
| Internet & Direct Marketing Retail | 21.9 | |
| Specialty Retail | 21.9 | |
| Hotels, Restaurants & Leisure | 17.5 | |
| Automobiles | 12.8 | |
| Textiles, Apparel & Luxury Goods | 12.0 | |
| Multiline Retail | 7.1 | |
| Household Durables | 3.1 | |
| Auto Components | 2.0 | |
| Food & Staples Retailing | 0.8 | |
| Building Products | 0.4 | |
| |
Consumer Discretionary Portfolio
Showing Percentage of Net Assets
| Common Stocks - 99.5% |
| | | Shares | Value ($) |
| Auto Components - 2.0% | | | |
| Auto Parts & Equipment - 2.0% | | | |
| Adient PLC (a) | | 73,900 | 3,157,008 |
| Aptiv PLC (a) | | 17,400 | 2,023,272 |
| Magna International, Inc. Class A (b) | | 60,090 | 3,348,816 |
| | | | 8,529,096 |
| Automobiles - 12.8% | | | |
| Automobile Manufacturers - 12.8% | | | |
| Ferrari NV | | 6,127 | 1,595,287 |
| Tesla, Inc. (a) | | 255,951 | 52,651,680 |
| | | | 54,246,967 |
| Building Products - 0.4% | | | |
| Building Products - 0.4% | | | |
| The AZEK Co., Inc. (a)(b) | | 68,146 | 1,641,637 |
| Food & Staples Retailing - 0.8% | | | |
| Food Distributors - 0.8% | | | |
| Performance Food Group Co. (a) | | 62,778 | 3,552,607 |
| Hotels, Restaurants & Leisure - 17.5% | | | |
| Casinos & Gaming - 3.1% | | | |
| Caesars Entertainment, Inc. (a) | | 57,448 | 2,916,060 |
| Churchill Downs, Inc. | | 26,581 | 6,533,078 |
| Penn Entertainment, Inc. (a) | | 112,374 | 3,430,778 |
| | | | 12,879,916 |
| Hotels, Resorts & Cruise Lines - 7.8% | | | |
| Booking Holdings, Inc. (a) | | 4,312 | 10,883,488 |
| Hilton Worldwide Holdings, Inc. | | 86,081 | 12,439,565 |
| Marriott International, Inc. Class A | | 51,179 | 8,661,534 |
| Royal Caribbean Cruises Ltd. (a) | | 17,400 | 1,229,136 |
| | | | 33,213,723 |
| Leisure Facilities - 0.5% | | | |
| Planet Fitness, Inc. (a) | | 25,233 | 2,045,135 |
| Restaurants - 6.1% | | | |
| ARAMARK Holdings Corp. | | 127,664 | 4,698,035 |
| Brinker International, Inc. (a) | | 25,830 | 981,540 |
| Chipotle Mexican Grill, Inc. (a) | | 3,855 | 5,748,113 |
| Domino's Pizza, Inc. | | 17,194 | 5,055,208 |
| Dutch Bros, Inc. (a)(b) | | 19,571 | 652,693 |
| McDonald's Corp. | | 33,425 | 8,821,192 |
| | | | 25,956,781 |
TOTAL HOTELS, RESTAURANTS & LEISURE | | | 74,095,555 |
| Household Durables - 3.1% | | | |
| Home Furnishings - 1.4% | | | |
| Tempur Sealy International, Inc. | | 136,687 | 5,842,002 |
| Homebuilding - 1.7% | | | |
| KB Home | | 81,330 | 2,868,509 |
| PulteGroup, Inc. | | 84,060 | 4,595,560 |
| | | | 7,464,069 |
TOTAL HOUSEHOLD DURABLES | | | 13,306,071 |
| Internet & Direct Marketing Retail - 21.9% | | | |
| Internet & Direct Marketing Retail - 21.9% | | | |
| Amazon.com, Inc. (a) | | 953,605 | 89,858,201 |
| eBay, Inc. | | 70,656 | 3,243,110 |
| Wayfair LLC Class A (a) | | 1,500 | 60,735 |
| | | | 93,162,046 |
| Multiline Retail - 7.1% | | | |
| General Merchandise Stores - 7.1% | | | |
| Dollar General Corp. | | 32,104 | 6,944,095 |
| Dollar Tree, Inc. (a) | | 73,200 | 10,634,496 |
| Ollie's Bargain Outlet Holdings, Inc. (a) | | 55,682 | 3,203,942 |
| Target Corp. | | 54,625 | 9,204,313 |
| | | | 29,986,846 |
| Specialty Retail - 21.9% | | | |
| Apparel Retail - 5.7% | | | |
| Burlington Stores, Inc. (a) | | 23,587 | 5,053,515 |
| TJX Companies, Inc. | | 217,297 | 16,644,950 |
| Victoria's Secret & Co. (a) | | 69,439 | 2,752,562 |
| | | | 24,451,027 |
| Automotive Retail - 0.5% | | | |
| O'Reilly Automotive, Inc. (a) | | 2,410 | 2,000,541 |
| Home Improvement Retail - 11.6% | | | |
| Floor & Decor Holdings, Inc. Class A (a)(b) | | 84,567 | 7,764,096 |
| Lowe's Companies, Inc. | | 100,441 | 20,665,736 |
| The Home Depot, Inc. | | 70,531 | 20,915,263 |
| | | | 49,345,095 |
| Homefurnishing Retail - 0.6% | | | |
| Williams-Sonoma, Inc. (b) | | 19,020 | 2,375,978 |
| Specialty Stores - 3.5% | | | |
| Bath & Body Works, Inc. | | 39,688 | 1,622,049 |
| Dick's Sporting Goods, Inc. (b) | | 67,837 | 8,725,873 |
| Five Below, Inc. (a) | | 18,052 | 3,688,024 |
| Sally Beauty Holdings, Inc. (a) | | 53,100 | 854,379 |
| | | | 14,890,325 |
TOTAL SPECIALTY RETAIL | | | 93,062,966 |
| Textiles, Apparel & Luxury Goods - 12.0% | | | |
| Apparel, Accessories & Luxury Goods - 5.9% | | | |
| Capri Holdings Ltd. (a) | | 147,768 | 7,324,860 |
| lululemon athletica, Inc. (a) | | 20,130 | 6,224,196 |
| LVMH Moet Hennessy Louis Vuitton SE | | 2,833 | 2,355,150 |
| PVH Corp. | | 36,578 | 2,935,019 |
| Tapestry, Inc. | | 149,128 | 6,488,559 |
| | | | 25,327,784 |
| Footwear - 6.1% | | | |
| Deckers Outdoor Corp. (a) | | 16,527 | 6,881,016 |
| NIKE, Inc. Class B | | 144,202 | 17,129,756 |
| On Holding AG (a) | | 41,093 | 898,704 |
| Skechers U.S.A., Inc. Class A (sub. vtg.) (a) | | 20,500 | 912,455 |
| | | | 25,821,931 |
TOTAL TEXTILES, APPAREL & LUXURY GOODS | | | 51,149,715 |
| TOTAL COMMON STOCKS (Cost $296,361,047) | | | 422,733,506 |
| | | | |
| Money Market Funds - 4.2% |
| | | Shares | Value ($) |
| Fidelity Cash Central Fund 4.63% (c) | | 1,290,574 | 1,290,832 |
| Fidelity Securities Lending Cash Central Fund 4.63% (c)(d) | | 16,276,186 | 16,277,814 |
| TOTAL MONEY MARKET FUNDS (Cost $17,568,646) | | | 17,568,646 |
| | | | |
| TOTAL INVESTMENT IN SECURITIES - 103.7% (Cost $313,929,693) | 440,302,152 |
NET OTHER ASSETS (LIABILITIES) - (3.7)% | (15,510,805) |
| NET ASSETS - 100.0% | 424,791,347 |
| | |
Legend
| (b) | Security or a portion of the security is on loan at period end. |
| (c) | Affiliated fund that is generally available only to investment companies and other accounts managed by Fidelity Investments. The rate quoted is the annualized seven-day yield of the fund at period end. A complete unaudited listing of the fund's holdings as of its most recent quarter end is available upon request. In addition, each Fidelity Central Fund's financial statements, which are not covered by the Fund's Report of Independent Registered Public Accounting Firm, are available on the SEC's website or upon request. |
| (d) | Investment made with cash collateral received from securities on loan. |
Affiliated Central Funds
Fiscal year to date information regarding the Fund's investments in Fidelity Central Funds, including the ownership percentage, is presented below.
| Affiliate | Value, beginning of period ($) | Purchases ($) | Sales Proceeds ($) | Dividend Income ($) | Realized Gain (loss) ($) | Change in Unrealized appreciation (depreciation) ($) | Value, end of period ($) | % ownership, end of period |
| Fidelity Cash Central Fund 4.63% | - | 82,765,441 | 81,474,609 | 48,808 | - | - | 1,290,832 | 0.0% |
| Fidelity Securities Lending Cash Central Fund 4.63% | 6,819,964 | 125,949,027 | 116,491,177 | 230,764 | - | - | 16,277,814 | 0.1% |
| Total | 6,819,964 | 208,714,468 | 197,965,786 | 279,572 | - | - | 17,568,646 | |
| | | | | | | | | |
Amounts in the dividend income column in the above table include any capital gain distributions from underlying funds, which are presented in the corresponding line item in the Statement of Operations, if applicable.
Amount for Fidelity Securities Lending Cash Central Fund represents the income earned on investing cash collateral, less rebates paid to borrowers and any lending agent fees associated with the loan, plus any premium payments received for lending certain types of securities.
Amounts included in the purchases and sales proceeds columns may include in-kind transactions, if applicable.
Investment Valuation
The following is a summary of the inputs used, as of February 28, 2023, involving the Fund's assets and liabilities carried at fair value. The inputs or methodology used for valuing securities may not be an indication of the risk associated with investing in those securities. For more information on valuation inputs, and their aggregation into the levels used below, please refer to the Investment Valuation section in the accompanying Notes to Financial Statements.
| Valuation Inputs at Reporting Date: |
| Description | Total ($) | Level 1 ($) | Level 2 ($) | Level 3 ($) |
Investments in Securities: | | | | |
|
| Common Stocks | 422,733,506 | 420,378,356 | 2,355,150 | - |
|
| Money Market Funds | 17,568,646 | 17,568,646 | - | - |
| Total Investments in Securities: | 440,302,152 | 437,947,002 | 2,355,150 | - |
Consumer Discretionary Portfolio
| Statement of Assets and Liabilities |
| | | | February 28, 2023 |
| | | | | |
| Assets | | | | |
| Investment in securities, at value (including securities loaned of $16,046,701) - See accompanying schedule: | | | | |
Unaffiliated issuers (cost $296,361,047) | $ | 422,733,506 | | |
Fidelity Central Funds (cost $17,568,646) | | 17,568,646 | | |
| | | | | |
| | | | | |
| Total Investment in Securities (cost $313,929,693) | | | $ | 440,302,152 |
| Cash | | | | 16,056 |
| Foreign currency held at value (cost $1) | | | | 1 |
| Receivable for investments sold | | | | 3,563,098 |
| Receivable for fund shares sold | | | | 173,902 |
| Dividends receivable | | | | 273,971 |
| Distributions receivable from Fidelity Central Funds | | | | 17,868 |
| Prepaid expenses | | | | 2,350 |
| Other receivables | | | | 15,085 |
Total assets | | | | 444,364,483 |
| Liabilities | | | | |
| Payable for investments purchased | $ | 2,441,904 | | |
| Payable for fund shares redeemed | | 562,994 | | |
| Accrued management fee | | 190,921 | | |
| Other affiliated payables | | 70,259 | | |
| Other payables and accrued expenses | | 33,533 | | |
| Collateral on securities loaned | | 16,273,525 | | |
| Total Liabilities | | | | 19,573,136 |
| Net Assets | | | $ | 424,791,347 |
| Net Assets consist of: | | | | |
| Paid in capital | | | $ | 296,165,809 |
| Total accumulated earnings (loss) | | | | 128,625,538 |
| Net Assets | | | $ | 424,791,347 |
Net Asset Value , offering price and redemption price per share ($424,791,347 ÷ 8,936,375 shares) | | | $ | 47.54 |
| Statement of Operations |
| | | | Year ended February 28, 2023 |
| Investment Income | | | | |
| Dividends | | | $ | 2,849,741 |
| Income from Fidelity Central Funds (including $230,764 from security lending) | | | | 279,572 |
| Total Income | | | | 3,129,313 |
| Expenses | | | | |
| Management fee | $ | 2,109,514 | | |
| Transfer agent fees | | 681,929 | | |
| Accounting fees | | 144,975 | | |
| Custodian fees and expenses | | 12,064 | | |
| Independent trustees' fees and expenses | | 1,364 | | |
| Registration fees | | 50,963 | | |
| Audit | | 40,160 | | |
| Legal | | 3,356 | | |
| Interest | | 966 | | |
| Miscellaneous | | 3,196 | | |
| Total expenses before reductions | | 3,048,487 | | |
| Expense reductions | | (14,515) | | |
| Total expenses after reductions | | | | 3,033,972 |
| Net Investment income (loss) | | | | 95,341 |
| Realized and Unrealized Gain (Loss) | | | | |
| Net realized gain (loss) on: | | | | |
| Investment Securities: | | | | |
| Unaffiliated issuers | | 14,819,825 | | |
| Foreign currency transactions | | 3,643 | | |
| Total net realized gain (loss) | | | | 14,823,468 |
| Change in net unrealized appreciation (depreciation) on: | | | | |
| Investment Securities: | | | | |
| Unaffiliated issuers | | (78,173,699) | | |
| Assets and liabilities in foreign currencies | | (1,786) | | |
| Total change in net unrealized appreciation (depreciation) | | | | (78,175,485) |
| Net gain (loss) | | | | (63,352,017) |
| Net increase (decrease) in net assets resulting from operations | | | $ | (63,256,676) |
| Statement of Changes in Net Assets |
| |
| | Year ended February 28, 2023 | | Year ended February 28, 2022 |
| Increase (Decrease) in Net Assets | | | | |
| Operations | | | | |
| Net investment income (loss) | $ | 95,341 | $ | (1,380,277) |
| Net realized gain (loss) | | 14,823,468 | | 69,875,616 |
| Change in net unrealized appreciation (depreciation) | | (78,175,485) | | (55,774,464) |
| Net increase (decrease) in net assets resulting from operations | | (63,256,676) | | 12,720,875 |
| Distributions to shareholders | | (36,965,013) | | (57,919,716) |
| Share transactions | | | | |
| Proceeds from sales of shares | | 214,276,530 | | 211,466,743 |
| Reinvestment of distributions | | 34,220,095 | | 54,428,730 |
| Cost of shares redeemed | | (142,158,153) | | (385,959,972) |
Net increase (decrease) in net assets resulting from share transactions | | 106,338,472 | | (120,064,499) |
| Total increase (decrease) in net assets | | 6,116,783 | | (165,263,340) |
| | | | | |
| Net Assets | | | | |
| Beginning of period | | 418,674,564 | | 583,937,904 |
| End of period | $ | 424,791,347 | $ | 418,674,564 |
| | | | | |
| Other Information | | | | |
| Shares | | | | |
| Sold | | 4,618,411 | | 2,966,018 |
| Issued in reinvestment of distributions | | 617,903 | | 780,014 |
| Redeemed | | (2,921,858) | | (5,710,596) |
| Net increase (decrease) | | 2,314,456 | | (1,964,564) |
| | | | | |
Financial Highlights
| Consumer Discretionary Portfolio |
| |
| Years ended February 28, | | 2023 | | 2022 | | 2021 | | 2020 A | | 2019 |
Selected Per-Share Data | | | | | | | | | | |
| Net asset value, beginning of period | $ | 63.23 | $ | 68.01 | $ | 45.58 | $ | 44.31 | $ | 43.65 |
| Income from Investment Operations | | | | | | | | | | |
Net investment income (loss) B,C | | .01 | | (.16) | | (.03) | | .11 | | .12 |
| Net realized and unrealized gain (loss) | | (9.85) | | 1.92 | | 23.23 | | 2.26 | | 1.87 |
| Total from investment operations | | (9.84) | | 1.76 | | 23.20 | | 2.37 | | 1.99 |
| Distributions from net investment income | | (.02) | | - | | - | | (.11) | | (.15) |
| Distributions from net realized gain | | (5.83) | | (6.54) | | (.77) | | (.99) | | (1.18) |
| Total distributions | | (5.85) | | (6.54) | | (.77) | | (1.10) | | (1.33) |
| Net asset value, end of period | $ | 47.54 | $ | 63.23 | $ | 68.01 | $ | 45.58 | $ | 44.31 |
Total Return D | | (16.87)% | | 1.88% | | 50.96% | | 5.30% | | 4.81% |
Ratios to Average Net Assets C,E,F | | | | | | | | | | |
| Expenses before reductions | | .76% | | .73% | | .76% | | .76% | | .78% |
| Expenses net of fee waivers, if any | | .76% | | .73% | | .76% | | .76% | | .77% |
| Expenses net of all reductions | | .76% | | .73% | | .75% | | .76% | | .77% |
| Net investment income (loss) | | .02% | | (.22)% | | (.06)% | | .23% | | .27% |
| Supplemental Data | | | | | | | | | | |
| Net assets, end of period (000 omitted) | $ | 424,791 | $ | 418,675 | $ | 583,938 | $ | 402,403 | $ | 433,188 |
Portfolio turnover rate G | | 46% | | 38% | | 55% | | 41% H | | 46% H |
A For the year ended February 29.
B Calculated based on average shares outstanding during the period.
C Net investment income (loss) is affected by the timing of the declaration of dividends by any underlying mutual funds or exchange-traded funds (ETFs). Net investment income (loss) of any mutual funds or ETFs is not included in the Fund's net investment income (loss) ratio.
D Total returns would have been lower if certain expenses had not been reduced during the applicable periods shown.
E Fees and expenses of any underlying mutual funds or exchange-traded funds (ETFs) are not included in the Fund's expense ratio. The Fund indirectly bears its proportionate share of these expenses. For additional expense information related to investments in Fidelity Central Funds, please refer to the "Investments in Fidelity Central Funds" note found in the Notes to Financial Statements section of the most recent Annual or Semi-Annual report.
F Expense ratios reflect operating expenses of the class. Expenses before reductions do not reflect amounts reimbursed, waived, or reduced through arrangements with the investment adviser, brokerage services, or other offset arrangements, if applicable, and do not represent the amount paid by the class during periods when reimbursements, waivers or reductions occur.
G Amount does not include the portfolio activity of any underlying mutual funds or exchange-traded funds (ETFs).
H Portfolio turnover rate excludes securities received or delivered in-kind.
Average annual total return reflects the change in the value of an investment, assuming reinvestment of distributions from dividend income and capital gains (the profits earned upon the sale of securities that have grown in value, if any) and assuming a constant rate of performance each year. The hypothetical investment and the average annual total returns do not reflect the deduction of taxes that a shareholder would pay on fund distributions or the redemption of fund shares. During periods of reimbursement by Fidelity, a fund's total return will be greater than it would be had the reimbursement not occurred. How a fund did yesterday is no guarantee of how it will do tomorrow.
| Average Annual Total Returns |
| | | | |
Periods ended February 28, 2023 | Past 1 year | Past 5 years | Past 10 years |
| Leisure Portfolio | -0.22% | 10.02% | 12.63% |
| $10,000 Over 10 Years |
| |
Let's say hypothetically that $10,000 was invested in Leisure Portfolio on February 28, 2013. The chart shows how the value of your investment would have changed, and also shows how the S&P 500® Index performed over the same period. |
|
|
Leisure Portfolio
Market Recap:
U.S. equities returned -7.69% for the 12 months ending February 28, 2023, according to the S&P 500 ® index. The new year began with an encouraging upturn in January (+6.28%), but stocks lost momentum in February (-2.44%) amid higher-than-expected inflation and strong jobs data. Investors took these as signs that the economy continued to run hot, even after a year of historic policy adjustment by the Federal Reserve aimed at cooling economic growth. Record inflation in 2022 prompted the Fed to aggressively tighten monetary policy, and market interest rates eclipsed their highest level in a decade, stoking recession fears and sending stocks into bear market territory. Since March 2022, the central bank has hiked its benchmark rate eight times, by 4.5 percentage points - the fastest-ever pace of monetary tightening - while also shrinking its massive asset portfolio. The latest bump came on February 2, along with a signal that the Fed plans to lift rates in March while it considers whether and when to pause increases. Against this dynamic backdrop, stocks struggled to gain traction until a strong rally ignited heading into the summer. But in September, the index returned -9.21%, one of its worst monthly results ever, before advancing 7.56% in Q4, as risky assets regained favor. For the full 12 months, value stocks handily outpaced growth. The headwind for the latter was most pronounced in the growth-oriented communication services (-25%) and consumer discretionary (-18%) sectors. In sharp contrast, energy gained 24%.
Comments from Portfolio Manager Kevin Francfort:
For the fiscal year ending February 28, 2023, the fund returned -0.22%, roughly in line with the -0.19% return of the MSCI US IMI Consumer Services 25/50 Index, but outperforming the broad-based S&P 500 ® index. Versus the industry index, security selection was the primary contributor, led by choices in the hotels, resorts & cruise lines group. Also helping was stock selection and an underweighting in leisure facilities. Our lighter-than-index investment in Expedia, a position we established this period, was the fund's largest individual relative contributor because the stock returned about -44% the past 12 months. Our second-largest contributor this period was Wingstop, an investment we established this period. The stock gained 95% the past year and contributed meaningfully to relative performance. Another notable relative contributor was our lighter-than-index position in Carnival (-48%). We established a small position later in the period and our stake gained 5%. The fund's foreign holdings also contributed overall despite a broadly strong U.S. dollar. In contrast, the largest detractor from performance versus the industry index was our stock selection in casinos & gaming. An underweighting and security selection in restaurants and stock picks in soft drinks also hurt the fund's relative performance. The biggest individual relative detractor was an overweight position in Caesars Entertainment (-39%). Caesars Entertainment was among the fund's largest holdings the past 12 months, though we reduced our stake. Also hurting performance was our lighter-than-index stake in Starbucks, which gained 14%. We added to our stake the past year. Another notable relative detractor was an overweighting in Dominos Pizza (-31%), which was among our biggest holdings even though we trimmed the position this period.
Note to shareholders: On March 1, 2023, Kevin Francfort assumed sole management responsibilities for the fund after having served as co-manager with Will Hilkert since September 2022.
The views expressed above reflect those of the portfolio manager(s) only through the end of the period as stated on the cover of this report and do not necessarily represent the views of Fidelity or any other person in the Fidelity organization. Any such views are subject to change at any time based upon market or other conditions and Fidelity disclaims any responsibility to update such views. These views may not be relied on as investment advice and, because investment decisions for a Fidelity fund are based on numerous factors, may not be relied on as an indication of trading intent on behalf of any Fidelity fund.
Leisure Portfolio
Top Holdings (% of Fund's net assets) |
| |
| McDonald's Corp. | 16.7 | |
| Booking Holdings, Inc. | 11.5 | |
| Hilton Worldwide Holdings, Inc. | 7.9 | |
| Starbucks Corp. | 7.1 | |
| Yum! Brands, Inc. | 6.3 | |
| Marriott International, Inc. Class A | 4.7 | |
| Airbnb, Inc. Class A | 4.7 | |
| Chipotle Mexican Grill, Inc. | 3.7 | |
| Las Vegas Sands Corp. | 3.4 | |
| Domino's Pizza, Inc. | 3.3 | |
| | 69.3 | |
| |
| Industries (% of Fund's net assets) |
| |
| Hotels, Restaurants & Leisure | 91.5 | |
| Food & Staples Retailing | 2.5 | |
| Diversified Consumer Services | 2.1 | |
| Beverages | 1.8 | |
| IT Services | 0.7 | |
| Specialty Retail | 0.3 | |
| |
Leisure Portfolio
Showing Percentage of Net Assets
| Common Stocks - 98.9% |
| | | Shares | Value ($) |
| Beverages - 1.8% | | | |
| Soft Drinks - 1.8% | | | |
| The Coca-Cola Co. | | 168,900 | 10,051,239 |
| Diversified Consumer Services - 2.1% | | | |
| Specialized Consumer Services - 2.1% | | | |
| H&R Block, Inc. | | 117,200 | 4,312,960 |
| OneSpaWorld Holdings Ltd. (a)(b) | | 464,500 | 5,383,555 |
| Service Corp. International | | 35,400 | 2,390,562 |
| | | | 12,087,077 |
| Food & Staples Retailing - 2.5% | | | |
| Food Distributors - 2.5% | | | |
| U.S. Foods Holding Corp. (a) | | 368,300 | 13,822,299 |
| Hotels, Restaurants & Leisure - 91.5% | | | |
| Casinos & Gaming - 12.9% | | | |
| Bally's Corp. (a)(b) | | 130,900 | 2,585,275 |
| Boyd Gaming Corp. | | 200 | 13,026 |
| Caesars Entertainment, Inc. (a) | | 216,949 | 11,012,331 |
| Churchill Downs, Inc. | | 64,648 | 15,889,185 |
| Draftkings Holdings, Inc. (a) | | 32,400 | 611,064 |
| Flutter Entertainment PLC (a) | | 48,600 | 7,795,442 |
| Las Vegas Sands Corp. (a)(b) | | 337,200 | 19,378,884 |
| MGM Resorts International | | 212,500 | 9,139,625 |
| Penn Entertainment, Inc. (a) | | 87,708 | 2,677,725 |
| Red Rock Resorts, Inc. (b) | | 87,200 | 3,808,024 |
| | | | 72,910,581 |
| Hotels, Resorts & Cruise Lines - 32.3% | | | |
| Airbnb, Inc. Class A (a) | | 215,300 | 26,542,184 |
| Booking Holdings, Inc. (a) | | 25,576 | 64,553,824 |
| Carnival Corp. (a)(b) | | 100,000 | 1,062,000 |
| Expedia, Inc. (a) | | 25,800 | 2,811,426 |
| Hilton Grand Vacations, Inc. (a) | | 63,400 | 3,026,716 |
| Hilton Worldwide Holdings, Inc. | | 308,532 | 44,585,959 |
| Marriott International, Inc. Class A | | 157,525 | 26,659,531 |
| Royal Caribbean Cruises Ltd. (a)(b) | | 176,400 | 12,460,896 |
| | | | 181,702,536 |
| Leisure Facilities - 2.0% | | | |
| Planet Fitness, Inc. (a) | | 38,744 | 3,140,201 |
| Vail Resorts, Inc. | | 33,682 | 7,864,410 |
| | | | 11,004,611 |
| Restaurants - 44.3% | | | |
| ARAMARK Holdings Corp. | | 61,200 | 2,252,160 |
| Brinker International, Inc. (a) | | 218,300 | 8,295,400 |
| Chipotle Mexican Grill, Inc. (a) | | 14,009 | 20,888,540 |
| Darden Restaurants, Inc. | | 26,900 | 3,846,431 |
| Domino's Pizza, Inc. | | 63,642 | 18,711,384 |
| Dutch Bros, Inc. (a)(b) | | 135,300 | 4,512,255 |
| First Watch Restaurant Group, Inc. (a) | | 235,000 | 3,590,800 |
| McDonald's Corp. | | 357,493 | 94,345,980 |
| Noodles & Co. (a) | | 628,700 | 3,671,608 |
| Restaurant Brands International, Inc. | | 154,674 | 9,980,979 |
| Ruth's Hospitality Group, Inc. | | 79,800 | 1,488,270 |
| Starbucks Corp. | | 394,456 | 40,270,013 |
| Wingstop, Inc. | | 15,300 | 2,606,355 |
| Yum! Brands, Inc. | | 278,400 | 35,401,344 |
| | | | 249,861,519 |
TOTAL HOTELS, RESTAURANTS & LEISURE | | | 515,479,247 |
| IT Services - 0.7% | | | |
| Data Processing & Outsourced Services - 0.7% | | | |
| Toast, Inc. (a)(b) | | 211,000 | 3,992,120 |
| Specialty Retail - 0.3% | | | |
| Automotive Retail - 0.3% | | | |
| Diversified Royalty Corp. (b) | | 782,000 | 1,931,359 |
| TOTAL COMMON STOCKS (Cost $402,647,832) | | | 557,363,341 |
| | | | |
| Money Market Funds - 3.0% |
| | | Shares | Value ($) |
| Fidelity Cash Central Fund 4.63% (c) | | 4,288,587 | 4,289,445 |
| Fidelity Securities Lending Cash Central Fund 4.63% (c)(d) | | 12,552,861 | 12,554,116 |
| TOTAL MONEY MARKET FUNDS (Cost $16,843,561) | | | 16,843,561 |
| | | | |
| TOTAL INVESTMENT IN SECURITIES - 101.9% (Cost $419,491,393) | 574,206,902 |
NET OTHER ASSETS (LIABILITIES) - (1.9)% | (10,826,226) |
| NET ASSETS - 100.0% | 563,380,676 |
| | |
Legend
| (b) | Security or a portion of the security is on loan at period end. |
| (c) | Affiliated fund that is generally available only to investment companies and other accounts managed by Fidelity Investments. The rate quoted is the annualized seven-day yield of the fund at period end. A complete unaudited listing of the fund's holdings as of its most recent quarter end is available upon request. In addition, each Fidelity Central Fund's financial statements, which are not covered by the Fund's Report of Independent Registered Public Accounting Firm, are available on the SEC's website or upon request. |
| (d) | Investment made with cash collateral received from securities on loan. |
Affiliated Central Funds
Fiscal year to date information regarding the Fund's investments in Fidelity Central Funds, including the ownership percentage, is presented below.
| Affiliate | Value, beginning of period ($) | Purchases ($) | Sales Proceeds ($) | Dividend Income ($) | Realized Gain (loss) ($) | Change in Unrealized appreciation (depreciation) ($) | Value, end of period ($) | % ownership, end of period |
| Fidelity Cash Central Fund 4.63% | 1,262,544 | 75,531,284 | 72,504,383 | 49,634 | - | - | 4,289,445 | 0.0% |
| Fidelity Securities Lending Cash Central Fund 4.63% | 19,544,251 | 292,662,916 | 299,653,051 | 775,162 | - | - | 12,554,116 | 0.0% |
| Total | 20,806,795 | 368,194,200 | 372,157,434 | 824,796 | - | - | 16,843,561 | |
| | | | | | | | | |
Amounts in the dividend income column in the above table include any capital gain distributions from underlying funds, which are presented in the corresponding line item in the Statement of Operations, if applicable.
Amount for Fidelity Securities Lending Cash Central Fund represents the income earned on investing cash collateral, less rebates paid to borrowers and any lending agent fees associated with the loan, plus any premium payments received for lending certain types of securities.
Amounts included in the purchases and sales proceeds columns may include in-kind transactions, if applicable.
Investment Valuation
The following is a summary of the inputs used, as of February 28, 2023, involving the Fund's assets and liabilities carried at fair value. The inputs or methodology used for valuing securities may not be an indication of the risk associated with investing in those securities. For more information on valuation inputs, and their aggregation into the levels used below, please refer to the Investment Valuation section in the accompanying Notes to Financial Statements.
| Valuation Inputs at Reporting Date: |
| Description | Total ($) | Level 1 ($) | Level 2 ($) | Level 3 ($) |
Investments in Securities: | | | | |
|
| Common Stocks | 557,363,341 | 557,363,341 | - | - |
|
| Money Market Funds | 16,843,561 | 16,843,561 | - | - |
| Total Investments in Securities: | 574,206,902 | 574,206,902 | - | - |
Leisure Portfolio
| Statement of Assets and Liabilities |
| | | | February 28, 2023 |
| | | | | |
| Assets | | | | |
| Investment in securities, at value (including securities loaned of $12,235,162) - See accompanying schedule: | | | | |
Unaffiliated issuers (cost $402,647,832) | $ | 557,363,341 | | |
Fidelity Central Funds (cost $16,843,561) | | 16,843,561 | | |
| | | | | |
| | | | | |
| Total Investment in Securities (cost $419,491,393) | | | $ | 574,206,902 |
| Cash | | | | 3,460 |
| Foreign currency held at value (cost $498) | | | | 497 |
| Receivable for investments sold | | | | 4,438,124 |
| Receivable for fund shares sold | | | | 99,887 |
| Dividends receivable | | | | 847,195 |
| Distributions receivable from Fidelity Central Funds | | | | 34,220 |
| Prepaid expenses | | | | 1,753 |
Total assets | | | | 579,632,038 |
| Liabilities | | | | |
| Payable for investments purchased | $ | 3,062,964 | | |
| Payable for fund shares redeemed | | 257,516 | | |
| Accrued management fee | | 251,791 | | |
| Other affiliated payables | | 89,986 | | |
| Other payables and accrued expenses | | 34,989 | | |
| Collateral on securities loaned | | 12,554,116 | | |
| Total Liabilities | | | | 16,251,362 |
| Net Assets | | | $ | 563,380,676 |
| Net Assets consist of: | | | | |
| Paid in capital | | | $ | 409,344,281 |
| Total accumulated earnings (loss) | | | | 154,036,395 |
| Net Assets | | | $ | 563,380,676 |
Net Asset Value , offering price and redemption price per share ($563,380,676 ÷ 35,542,715 shares) | | | $ | 15.85 |
| Statement of Operations |
| | | | Year ended February 28, 2023 |
| Investment Income | | | | |
| Dividends | | | $ | 5,720,008 |
| Income from Fidelity Central Funds (including $775,162 from security lending) | | | | 824,796 |
| Total Income | | | | 6,544,804 |
| Expenses | | | | |
| Management fee | $ | 2,896,810 | | |
| Transfer agent fees | | 906,194 | | |
| Accounting fees | | 194,142 | | |
| Custodian fees and expenses | | 10,583 | | |
| Independent trustees' fees and expenses | | 1,889 | | |
| Registration fees | | 33,005 | | |
| Audit | | 40,049 | | |
| Legal | | 1,835 | | |
| Interest | | 7,139 | | |
| Miscellaneous | | 3,469 | | |
| Total expenses before reductions | | 4,095,115 | | |
| Expense reductions | | (19,474) | | |
| Total expenses after reductions | | | | 4,075,641 |
| Net Investment income (loss) | | | | 2,469,163 |
| Realized and Unrealized Gain (Loss) | | | | |
| Net realized gain (loss) on: | | | | |
| Investment Securities: | | | | |
| Unaffiliated issuers | | 1,162,305 | | |
| Foreign currency transactions | | (15,965) | | |
| Total net realized gain (loss) | | | | 1,146,340 |
| Change in net unrealized appreciation (depreciation) on: | | | | |
| Investment Securities: | | | | |
| Unaffiliated issuers | | (15,645,084) | | |
| Assets and liabilities in foreign currencies | | (3,349) | | |
| Total change in net unrealized appreciation (depreciation) | | | | (15,648,433) |
| Net gain (loss) | | | | (14,502,093) |
| Net increase (decrease) in net assets resulting from operations | | | $ | (12,032,930) |
| Statement of Changes in Net Assets |
| |
| | Year ended February 28, 2023 | | Year ended February 28, 2022 |
| Increase (Decrease) in Net Assets | | | | |
| Operations | | | | |
| Net investment income (loss) | $ | 2,469,163 | $ | 336,640 |
| Net realized gain (loss) | | 1,146,340 | | 141,336,647 |
| Change in net unrealized appreciation (depreciation) | | (15,648,433) | | (91,223,907) |
| Net increase (decrease) in net assets resulting from operations | | (12,032,930) | | 50,449,380 |
| Distributions to shareholders | | (18,288,153) | | (140,839,314) |
| Share transactions | | | | |
| Proceeds from sales of shares | | 73,923,002 | | 249,737,495 |
| Reinvestment of distributions | | 17,168,093 | | 130,602,409 |
| Cost of shares redeemed | | (144,189,598) | | (296,858,478) |
Net increase (decrease) in net assets resulting from share transactions | | (53,098,503) | | 83,481,426 |
| Total increase (decrease) in net assets | | (83,419,586) | | (6,908,508) |
| | | | | |
| Net Assets | | | | |
| Beginning of period | | 646,800,262 | | 653,708,770 |
| End of period | $ | 563,380,676 | $ | 646,800,262 |
| | | | | |
| Other Information | | | | |
| Shares | | | | |
| Sold | | 4,908,793 | | 13,101,449 |
| Issued in reinvestment of distributions | | 1,119,877 | | 7,680,514 |
| Redeemed | | (9,983,968) | | (15,791,115) |
| Net increase (decrease) | | (3,955,298) | | 4,990,848 |
| | | | | |
Financial Highlights
| Years ended February 28, | | 2023 | | 2022 | | 2021 | | 2020 A | | 2019 B |
Selected Per-Share Data | | | | | | | | | | |
| Net asset value, beginning of period | $ | 16.38 | $ | 18.94 | $ | 13.89 | $ | 14.53 | $ | 16.58 |
| Income from Investment Operations | | | | | | | | | | |
Net investment income (loss) C,D | | .07 | | .01 | | .07 | | .12 | | .16 |
| Net realized and unrealized gain (loss) | | (.12) | | 1.41 | | 5.40 | | .25 | | .39 |
| Total from investment operations | | (.05) | | 1.42 | | 5.47 | | .37 | | .55 |
| Distributions from net investment income | | (.05) | | (.02) | | (.08) | | (.11) | | (.16) |
| Distributions from net realized gain | | (.42) | | (3.96) | | (.34) | | (.89) | | (2.44) |
| Total distributions | | (.48) E | | (3.98) | | (.42) | | (1.01) E | | (2.60) |
Redemption fees added to paid in capital C | | - | | - | | - | | - | | - F |
| Net asset value, end of period | $ | 15.85 | $ | 16.38 | $ | 18.94 | $ | 13.89 | $ | 14.53 |
Total Return G | | (.22)% | | 7.53% | | 41.30% | | 1.76% | | 4.48% |
Ratios to Average Net Assets D,H,I | | | | | | | | | | |
| Expenses before reductions | | .74% | | .73% | | .77% | | .76% | | .76% |
| Expenses net of fee waivers, if any | | .74% | | .73% | | .77% | | .75% | | .76% |
| Expenses net of all reductions | | .74% | | .73% | | .76% | | .75% | | .76% |
| Net investment income (loss) | | .45% | | .05% | | .48% | | .79% | | 1.05% |
| Supplemental Data | | | | | | | | | | |
| Net assets, end of period (000 omitted) | $ | 563,381 | $ | 646,800 | $ | 653,709 | $ | 431,146 | $ | 472,923 |
Portfolio turnover rate J | | 46% | | 79% | | 72% | | 53% | | 41% |
A For the year ended February 29.
B Per share amounts have been adjusted to reflect the impact of the 10 for 1 share split that occurred on August 10, 2018.
C Calculated based on average shares outstanding during the period.
D Net investment income (loss) is affected by the timing of the declaration of dividends by any underlying mutual funds or exchange-traded funds (ETFs). Net investment income (loss) of any mutual funds or ETFs is not included in the Fund's net investment income (loss) ratio.
E Total distributions per share do not sum due to rounding.
F Amount represents less than $.005 per share.
G Total returns would have been lower if certain expenses had not been reduced during the applicable periods shown.
H Fees and expenses of any underlying mutual funds or exchange-traded funds (ETFs) are not included in the Fund's expense ratio. The Fund indirectly bears its proportionate share of these expenses. For additional expense information related to investments in Fidelity Central Funds, please refer to the "Investments in Fidelity Central Funds" note found in the Notes to Financial Statements section of the most recent Annual or Semi-Annual report.
I Expense ratios reflect operating expenses of the class. Expenses before reductions do not reflect amounts reimbursed, waived, or reduced through arrangements with the investment adviser, brokerage services, or other offset arrangements, if applicable, and do not represent the amount paid by the class during periods when reimbursements, waivers or reductions occur.
J Amount does not include the portfolio activity of any underlying mutual funds or exchange-traded funds (ETFs).
Average annual total return reflects the change in the value of an investment, assuming reinvestment of distributions from dividend income and capital gains (the profits earned upon the sale of securities that have grown in value, if any) and assuming a constant rate of performance each year. The hypothetical investment and the average annual total returns do not reflect the deduction of taxes that a shareholder would pay on fund distributions or the redemption of fund shares. During periods of reimbursement by Fidelity, a fund's total return will be greater than it would be had the reimbursement not occurred. How a fund did yesterday is no guarantee of how it will do tomorrow.
| Average Annual Total Returns |
| | | | |
Periods ended February 28, 2023 | Past 1 year | Past 5 years | Past 10 years |
| Retailing Portfolio | -13.86% | 9.24% | 14.66% |
| $10,000 Over 10 Years |
| |
Let's say hypothetically that $10,000 was invested in Retailing Portfolio on February 28, 2013. The chart shows how the value of your investment would have changed, and also shows how the S&P 500® Index performed over the same period. |
|
|
Retailing Portfolio
Market Recap:
U.S. equities returned -7.69% for the 12 months ending February 28, 2023, according to the S&P 500 ® index. The new year began with an encouraging upturn in January (+6.28%), but stocks lost momentum in February (-2.44%) amid higher-than-expected inflation and strong jobs data. Investors took these as signs that the economy continued to run hot, even after a year of historic policy adjustment by the Federal Reserve aimed at cooling economic growth. Record inflation in 2022 prompted the Fed to aggressively tighten monetary policy, and market interest rates eclipsed their highest level in a decade, stoking recession fears and sending stocks into bear market territory. Since March 2022, the central bank has hiked its benchmark rate eight times, by 4.5 percentage points - the fastest-ever pace of monetary tightening - while also shrinking its massive asset portfolio. The latest bump came on February 2, along with a signal that the Fed plans to lift rates in March while it considers whether and when to pause increases. Against this dynamic backdrop, stocks struggled to gain traction until a strong rally ignited heading into the summer. But in September, the index returned -9.21%, one of its worst monthly results ever, before advancing 7.56% in Q4, as risky assets regained favor. For the full 12 months, value stocks handily outpaced growth. The headwind for the latter was most pronounced in the growth-oriented communication services (-25%) and consumer discretionary (-18%) sectors. In sharp contrast, energy gained 24%.
Comments from Portfolio Manager Boris Shepov:
For the fiscal year ending February 28, 2023, the fund returned -13.86%, trailing the -11.69% result of the MSCI US IMI Retailing 25/50 Index, as well as the broad-based S&P 500 ® index. Versus the industry index, subindustry allocation decisions proved to be the primary detractor, especially an underweighting within automotive retail. Security selection in apparel retail and an underweighting in distributors also hurt. Not owning AutoZone, an index component that gained approximately 33%, was the largest individual relative detractor. Also hampering performance was an overweight in Amazon.com, which returned about -39% and was the fund's biggest holding on February 28. Avoiding Genuine Parts, an index component that increased roughly 48%, further pressured the portfolio's relative result. In contrast, the largest contributors to performance versus the industry index were an overweighting and security selection among department stores. Investment choices and outsized exposure to general merchandise stores, along with favorable picks in the footwear category, also bolstered the fund's relative return. The top individual relative contributor within the portfolio was an outsized investment in Nordstrom, which gained 16%. This is a position that was sold the past year. Also lifting performance was a larger-than-index stake in Ollie's Bargain Outlet Holdings, which gained rose 33%. Another notable relative contributor was an overweight in Five Below (+22%), where we reduced our stake this period. Noteworthy changes in positioning the past 12 months include increased exposure to general merchandise stores and a lower allocation to apparel, accessories & luxury goods stocks.
Notes to shareholders:
On June 1, 2023, following an update to the Global Industry Classification Standard (GICS), the fund's benchmark will change from the MSCI U.S. IMI Retailing 25/50 Index to the MSCI U.S. IMI Multi-Sector Retailing 25/50 Index. This new benchmark will better reflect the fund's investment mandate by capturing retailers across multiple industries.
The views expressed above reflect those of the portfolio manager(s) only through the end of the period as stated on the cover of this report and do not necessarily represent the views of Fidelity or any other person in the Fidelity organization. Any such views are subject to change at any time based upon market or other conditions and Fidelity disclaims any responsibility to update such views. These views may not be relied on as investment advice and, because investment decisions for a Fidelity fund are based on numerous factors, may not be relied on as an indication of trading intent on behalf of any Fidelity fund.
Retailing Portfolio
Top Holdings (% of Fund's net assets) |
| |
| Amazon.com, Inc. | 23.8 | |
| The Home Depot, Inc. | 11.6 | |
| Lowe's Companies, Inc. | 7.5 | |
| Target Corp. | 5.3 | |
| TJX Companies, Inc. | 4.8 | |
| Dollar General Corp. | 4.8 | |
| O'Reilly Automotive, Inc. | 4.3 | |
| Dollar Tree, Inc. | 4.3 | |
| Capri Holdings Ltd. | 2.9 | |
| eBay, Inc. | 2.8 | |
| | 72.1 | |
| |
| Industries (% of Fund's net assets) |
| |
| Specialty Retail | 39.3 | |
| Internet & Direct Marketing Retail | 30.3 | |
| Multiline Retail | 18.6 | |
| Textiles, Apparel & Luxury Goods | 6.2 | |
| Food & Staples Retailing | 1.5 | |
| Interactive Media & Services | 0.4 | |
| |
Retailing Portfolio
Showing Percentage of Net Assets
| Common Stocks - 96.3% |
| | | Shares | Value ($) |
| Food & Staples Retailing - 1.5% | | | |
| Food Retail - 1.0% | | | |
| Alimentation Couche-Tard, Inc. Class A (multi-vtg.) | | 562,300 | 26,378,031 |
| Hypermarkets & Super Centers - 0.5% | | | |
| Walmart, Inc. | | 100,600 | 14,298,278 |
TOTAL FOOD & STAPLES RETAILING | | | 40,676,309 |
| Interactive Media & Services - 0.4% | | | |
| Interactive Media & Services - 0.4% | | | |
| Pinterest, Inc. Class A (a) | | 507,100 | 12,733,281 |
| Internet & Direct Marketing Retail - 30.3% | | | |
| Internet & Direct Marketing Retail - 30.3% | | | |
| Amazon.com, Inc. (a) | | 7,006,900 | 660,260,186 |
| eBay, Inc. | | 1,662,600 | 76,313,340 |
| Etsy, Inc. (a) | | 276,560 | 33,577,150 |
| MercadoLibre, Inc. (a) | | 54,400 | 66,368,000 |
| thredUP, Inc. (a)(b) | | 677,862 | 1,077,801 |
| Wayfair LLC Class A (a) | | 48,100 | 1,947,569 |
| | | | 839,544,046 |
| Multiline Retail - 18.6% | | | |
| Department Stores - 1.0% | | | |
| Kohl's Corp. (b) | | 966,100 | 27,089,444 |
| General Merchandise Stores - 17.6% | | | |
| Dollar General Corp. | | 618,900 | 133,868,070 |
| Dollar Tree, Inc. (a) | | 828,200 | 120,320,896 |
| Dollarama, Inc. | | 412,900 | 23,851,065 |
| Ollie's Bargain Outlet Holdings, Inc. (a)(b) | | 1,106,864 | 63,688,955 |
| Target Corp. (b) | | 872,000 | 146,932,000 |
| | | | 488,660,986 |
TOTAL MULTILINE RETAIL | | | 515,750,430 |
| Specialty Retail - 39.3% | | | |
| Apparel Retail - 9.4% | | | |
| American Eagle Outfitters, Inc. (b) | | 1,604,000 | 23,049,480 |
| Burlington Stores, Inc. (a) | | 176,394 | 37,792,415 |
| TJX Companies, Inc. | | 1,748,232 | 133,914,571 |
| Victoria's Secret & Co. (a) | | 1,685,533 | 66,814,528 |
| | | | 261,570,994 |
| Automotive Retail - 4.4% | | | |
| CarMax, Inc. (a)(b) | | 30,200 | 2,085,008 |
| O'Reilly Automotive, Inc. (a) | | 146,000 | 121,194,600 |
| | | | 123,279,608 |
| Home Improvement Retail - 19.6% | | | |
| Floor & Decor Holdings, Inc. Class A (a)(b) | | 150,737 | 13,839,164 |
| Lowe's Companies, Inc. | | 1,019,900 | 209,844,425 |
| The Home Depot, Inc. | | 1,083,700 | 321,360,398 |
| | | | 545,043,987 |
| Homefurnishing Retail - 0.9% | | | |
| RH (a)(b) | | 79,800 | 23,862,594 |
| Specialty Stores - 5.0% | | | |
| Bath & Body Works, Inc. | | 1,027,200 | 41,981,664 |
| Dick's Sporting Goods, Inc. (b) | | 135,000 | 17,365,050 |
| Five Below, Inc. (a) | | 133,800 | 27,335,340 |
| Ulta Beauty, Inc. (a) | | 97,700 | 50,686,760 |
| | | | 137,368,814 |
TOTAL SPECIALTY RETAIL | | | 1,091,125,997 |
| Textiles, Apparel & Luxury Goods - 6.2% | | | |
| Apparel, Accessories & Luxury Goods - 5.0% | | | |
| Canada Goose Holdings, Inc. (a)(b) | | 274,800 | 5,165,716 |
| Capri Holdings Ltd. (a) | | 1,640,300 | 81,309,671 |
| lululemon athletica, Inc. (a) | | 80,557 | 24,908,224 |
| Tapestry, Inc. (b) | | 622,300 | 27,076,273 |
| | | | 138,459,884 |
| Footwear - 1.2% | | | |
| Deckers Outdoor Corp. (a) | | 79,300 | 33,016,555 |
TOTAL TEXTILES, APPAREL & LUXURY GOODS | | | 171,476,439 |
| TOTAL COMMON STOCKS (Cost $1,532,466,845) | | | 2,671,306,502 |
| | | | |
| Money Market Funds - 7.2% |
| | | Shares | Value ($) |
| Fidelity Cash Central Fund 4.63% (c) | | 87,145,065 | 87,162,494 |
| Fidelity Securities Lending Cash Central Fund 4.63% (c)(d) | | 112,251,534 | 112,262,759 |
| TOTAL MONEY MARKET FUNDS (Cost $199,425,253) | | | 199,425,253 |
| | | | |
| TOTAL INVESTMENT IN SECURITIES - 103.5% (Cost $1,731,892,098) | 2,870,731,755 |
NET OTHER ASSETS (LIABILITIES) - (3.5)% | (96,641,369) |
| NET ASSETS - 100.0% | 2,774,090,386 |
| | |
Legend
| (b) | Security or a portion of the security is on loan at period end. |
| (c) | Affiliated fund that is generally available only to investment companies and other accounts managed by Fidelity Investments. The rate quoted is the annualized seven-day yield of the fund at period end. A complete unaudited listing of the fund's holdings as of its most recent quarter end is available upon request. In addition, each Fidelity Central Fund's financial statements, which are not covered by the Fund's Report of Independent Registered Public Accounting Firm, are available on the SEC's website or upon request. |
| (d) | Investment made with cash collateral received from securities on loan. |
Affiliated Central Funds
Fiscal year to date information regarding the Fund's investments in Fidelity Central Funds, including the ownership percentage, is presented below.
| Affiliate | Value, beginning of period ($) | Purchases ($) | Sales Proceeds ($) | Dividend Income ($) | Realized Gain (loss) ($) | Change in Unrealized appreciation (depreciation) ($) | Value, end of period ($) | % ownership, end of period |
| Fidelity Cash Central Fund 4.63% | - | 563,016,645 | 475,854,151 | 551,894 | - | - | 87,162,494 | 0.2% |
| Fidelity Securities Lending Cash Central Fund 4.63% | 262,083,095 | 1,748,991,828 | 1,898,812,164 | 185,199 | - | - | 112,262,759 | 0.4% |
| Total | 262,083,095 | 2,312,008,473 | 2,374,666,315 | 737,093 | - | - | 199,425,253 | |
| | | | | | | | | |
Amounts in the dividend income column in the above table include any capital gain distributions from underlying funds, which are presented in the corresponding line item in the Statement of Operations, if applicable.
Amount for Fidelity Securities Lending Cash Central Fund represents the income earned on investing cash collateral, less rebates paid to borrowers and any lending agent fees associated with the loan, plus any premium payments received for lending certain types of securities.
Amounts included in the purchases and sales proceeds columns may include in-kind transactions, if applicable.
Investment Valuation
The following is a summary of the inputs used, as of February 28, 2023, involving the Fund's assets and liabilities carried at fair value. The inputs or methodology used for valuing securities may not be an indication of the risk associated with investing in those securities. For more information on valuation inputs, and their aggregation into the levels used below, please refer to the Investment Valuation section in the accompanying Notes to Financial Statements.
| Valuation Inputs at Reporting Date: |
| Description | Total ($) | Level 1 ($) | Level 2 ($) | Level 3 ($) |
Investments in Securities: | | | | |
|
| Common Stocks | 2,671,306,502 | 2,671,306,502 | - | - |
|
| Money Market Funds | 199,425,253 | 199,425,253 | - | - |
| Total Investments in Securities: | 2,870,731,755 | 2,870,731,755 | - | - |
Retailing Portfolio
| Statement of Assets and Liabilities |
| | | | February 28, 2023 |
| | | | | |
| Assets | | | | |
| Investment in securities, at value (including securities loaned of $108,125,906) - See accompanying schedule: | | | | |
Unaffiliated issuers (cost $1,532,466,845) | $ | 2,671,306,502 | | |
Fidelity Central Funds (cost $199,425,253) | | 199,425,253 | | |
| | | | | |
| | | | | |
| Total Investment in Securities (cost $1,731,892,098) | | | $ | 2,870,731,755 |
| Receivable for investments sold | | | | 17,476,425 |
| Receivable for fund shares sold | | | | 316,258 |
| Dividends receivable | | | | 1,873,752 |
| Distributions receivable from Fidelity Central Funds | | | | 114,068 |
| Prepaid expenses | | | | 7,983 |
Total assets | | | | 2,890,520,241 |
| Liabilities | | | | |
| Payable for investments purchased | $ | 334,907 | | |
| Payable for fund shares redeemed | | 2,067,609 | | |
| Accrued management fee | | 1,273,782 | | |
| Other affiliated payables | | 459,664 | | |
| Other payables and accrued expenses | | 35,468 | | |
| Collateral on securities loaned | | 112,258,425 | | |
| Total Liabilities | | | | 116,429,855 |
| Net Assets | | | $ | 2,774,090,386 |
| Net Assets consist of: | | | | |
| Paid in capital | | | $ | 1,634,485,112 |
| Total accumulated earnings (loss) | | | | 1,139,605,274 |
| Net Assets | | | $ | 2,774,090,386 |
Net Asset Value , offering price and redemption price per share ($2,774,090,386 ÷ 165,601,459 shares) | | | $ | 16.75 |
| Statement of Operations |
| | | | Year ended February 28, 2023 |
| Investment Income | | | | |
| Dividends | | | $ | 29,926,342 |
| Income from Fidelity Central Funds (including $185,199 from security lending) | | | | 737,093 |
| Total Income | | | | 30,663,435 |
| Expenses | | | | |
| Management fee | $ | 15,701,471 | | |
| Transfer agent fees | | 4,957,643 | | |
| Accounting fees | | 797,545 | | |
| Custodian fees and expenses | | 17,004 | | |
| Independent trustees' fees and expenses | | 10,324 | | |
| Registration fees | | 31,718 | | |
| Audit | | 40,053 | | |
| Legal | | 2,876 | | |
| Interest | | 3,488 | | |
| Miscellaneous | | 18,359 | | |
| Total expenses before reductions | | 21,580,481 | | |
| Expense reductions | | (106,174) | | |
| Total expenses after reductions | | | | 21,474,307 |
| Net Investment income (loss) | | | | 9,189,128 |
| Realized and Unrealized Gain (Loss) | | | | |
| Net realized gain (loss) on: | | | | |
| Investment Securities: | | | | |
| Unaffiliated issuers | | 3,484,457 | | |
| Foreign currency transactions | | 9,603 | | |
| Total net realized gain (loss) | | | | 3,494,060 |
| Change in net unrealized appreciation (depreciation) on: | | | | |
| Investment Securities: | | | | |
| Unaffiliated issuers | | (524,806,259) | | |
| Unfunded commitments | | 1,090,000 | | |
| Assets and liabilities in foreign currencies | | (1,526) | | |
| Total change in net unrealized appreciation (depreciation) | | | | (523,717,785) |
| Net gain (loss) | | | | (520,223,725) |
| Net increase (decrease) in net assets resulting from operations | | | $ | (511,034,597) |
| Statement of Changes in Net Assets |
| |
| | Year ended February 28, 2023 | | Year ended February 28, 2022 |
| Increase (Decrease) in Net Assets | | | | |
| Operations | | | | |
| Net investment income (loss) | $ | 9,189,128 | $ | (3,062,137) |
| Net realized gain (loss) | | 3,494,060 | | 530,772,015 |
| Change in net unrealized appreciation (depreciation) | | (523,717,785) | | (548,230,610) |
| Net increase (decrease) in net assets resulting from operations | | (511,034,597) | | (20,520,732) |
| Distributions to shareholders | | (83,419,587) | | (645,718,415) |
| Share transactions | | | | |
| Proceeds from sales of shares | | 155,857,098 | | 589,399,734 |
| Reinvestment of distributions | | 78,542,305 | | 608,923,199 |
| Cost of shares redeemed | | (570,045,662) | | (883,831,786) |
Net increase (decrease) in net assets resulting from share transactions | | (335,646,259) | | 314,491,147 |
| Total increase (decrease) in net assets | | (930,100,443) | | (351,748,000) |
| | | | | |
| Net Assets | | | | |
| Beginning of period | | 3,704,190,829 | | 4,055,938,829 |
| End of period | $ | 2,774,090,386 | $ | 3,704,190,829 |
| | | | | |
| Other Information | | | | |
| Shares | | | | |
| Sold | | 9,021,587 | | 24,397,911 |
| Issued in reinvestment of distributions | | 4,134,935 | | 26,457,673 |
| Redeemed | | (33,503,885) | | (37,526,804) |
| Net increase (decrease) | | (20,347,363) | | 13,328,780 |
| | | | | |
Financial Highlights
| Years ended February 28, | | 2023 | | 2022 | | 2021 | | 2020 A | | 2019 B |
Selected Per-Share Data | | | | | | | | | | |
| Net asset value, beginning of period | $ | 19.92 | $ | 23.50 | $ | 15.71 | $ | 15.01 | $ | 14.35 |
| Income from Investment Operations | | | | | | | | | | |
Net investment income (loss) C,D | | .05 | | (.02) | | (.01) | | .04 | | .03 |
| Net realized and unrealized gain (loss) | | (2.76) | | .11 | | 9.35 | | 1.02 | | .93 |
| Total from investment operations | | (2.71) | | .09 | | 9.34 | | 1.06 | | .96 |
| Distributions from net investment income | | (.06) | | - | | - | | (.05) | | (.02) |
| Distributions from net realized gain | | (.41) | | (3.67) | | (1.55) | | (.31) | | (.27) |
| Total distributions | | (.46) E | | (3.67) | | (1.55) | | (.36) | | (.30) E |
| Net asset value, end of period | $ | 16.75 | $ | 19.92 | $ | 23.50 | $ | 15.71 | $ | 15.01 |
Total Return F | | (13.86)% | | (1.23)% | | 59.90% | | 7.02% | | 6.83% |
Ratios to Average Net Assets D,G,H | | | | | | | | | | |
| Expenses before reductions | | .72% | | .70% | | .73% | | .74% | | .76% |
| Expenses net of fee waivers, if any | | .72% | | .70% | | .73% | | .74% | | .75% |
| Expenses net of all reductions | | .72% | | .70% | | .73% | | .74% | | .75% |
| Net investment income (loss) | | .31% | | (.07)% | | (.07)% | | .26% | | .20% |
| Supplemental Data | | | | | | | | | | |
| Net assets, end of period (000 omitted) | $ | 2,774,090 | $ | 3,704,191 | $ | 4,055,939 | $ | 2,698,998 | $ | 3,035,591 |
Portfolio turnover rate I | | 32% | | 33% | | 46% | | 17% | | 34% |
A For the year ended February 29.
B Per share amounts have been adjusted to reflect the impact of the 10 for 1 share split that occurred on May 11, 2018.
C Calculated based on average shares outstanding during the period.
D Net investment income (loss) is affected by the timing of the declaration of dividends by any underlying mutual funds or exchange-traded funds (ETFs). Net investment income (loss) of any mutual funds or ETFs is not included in the Fund's net investment income (loss) ratio.
E Total distributions per share do not sum due to rounding.
F Total returns would have been lower if certain expenses had not been reduced during the applicable periods shown.
G Fees and expenses of any underlying mutual funds or exchange-traded funds (ETFs) are not included in the Fund's expense ratio. The Fund indirectly bears its proportionate share of these expenses. For additional expense information related to investments in Fidelity Central Funds, please refer to the "Investments in Fidelity Central Funds" note found in the Notes to Financial Statements section of the most recent Annual or Semi-Annual report.
H Expense ratios reflect operating expenses of the class. Expenses before reductions do not reflect amounts reimbursed, waived, or reduced through arrangements with the investment adviser, brokerage services, or other offset arrangements, if applicable, and do not represent the amount paid by the class during periods when reimbursements, waivers or reductions occur.
I Amount does not include the portfolio activity of any underlying mutual funds or exchange-traded funds (ETFs).
For the period ended February 28, 2023
1. Organization.
Automotive Portfolio, Communication Services Portfolio, Construction and Housing Portfolio, Consumer Discretionary Portfolio, Leisure Portfolio, and Retailing Portfolio (the Funds) are non-diversified funds of Fidelity Select Portfolios (the Trust). The Trust is registered under the Investment Company Act of 1940, as amended (the 1940 Act), as an open-end management investment company organized as a Massachusetts business trust. Each Fund is authorized to issue an unlimited number of shares. Each Fund offers a single class of shares, with the exception of Communication Services Portfolio. Communication Services Portfolio offers Fidelity Advisor Communication Services Fund Class A (Class A), Fidelity Advisor Communication Services Fund Class M (Class M), Fidelity Advisor Communication Services Fund Class C (Class C), Communication Services Portfolio (Communication Services), Fidelity Advisor Communication Services Fund Class I (Class I) and Fidelity Advisor Communication Services Class Z (Class Z) shares. Each class of Communication Services Portfolio has equal rights as to assets and voting privileges, and each class has exclusive voting rights with respect to matters that affect that class. Class C shares will automatically convert to Class A shares after a holding period of eight years from the initial date of purchase, with certain exceptions. The Funds invest primarily in securities of companies whose principal business activities fall within specific industries. Share transactions on the Statement of Changes in Net Assets and Share Transactions note may contain exchanges between affiliated funds.
2. Investments in Fidelity Central Funds.
Funds may invest in Fidelity Central Funds, which are open-end investment companies generally available only to other investment companies and accounts managed by the investment adviser and its affiliates. The Schedule of Investments lists any Fidelity Central Funds held as an investment as of period end, but does not include the underlying holdings of each Fidelity Central Fund. An investing fund indirectly bears its proportionate share of the expenses of the underlying Fidelity Central Funds.
Based on its investment objective, each Fidelity Central Fund may invest or participate in various investment vehicles or strategies that are similar to those of the investing fund. These strategies are consistent with the investment objectives of the investing fund and may involve certain economic risks which may cause a decline in value of each of the Fidelity Central Funds and thus a decline in the value of the investing fund.
| Fidelity Central Fund | Investment Manager | Investment Objective | Investment Practices | Expense Ratio A |
| Fidelity Money Market Central Funds | Fidelity Management & Research Company LLC (FMR) | Each fund seeks to obtain a high level of current income consistent with the preservation of capital and liquidity. | Short-term Investments | Less than .005% |
A Expenses expressed as a percentage of average net assets and are as of each underlying Central Fund's most recent annual or semi-annual shareholder report.
A complete unaudited list of holdings for each Fidelity Central Fund is available upon request or at the Securities and Exchange Commission website at www.sec.gov. In addition, the financial statements of the Fidelity Central Funds which contain the significant accounting policies (including investment valuation policies) of those funds, and are not covered by the Report of Independent Registered Public Accounting Firm, are available on the Securities and Exchange Commission website or upon request.
3. Significant Accounting Policies.
Each Fund is an investment company and applies the accounting and reporting guidance of the Financial Accounting Standards Board (FASB) Accounting Standards Codification Topic 946 Financial Services - Investment Companies . The financial statements have been prepared in conformity with accounting principles generally accepted in the United States of America (GAAP), which require management to make certain estimates and assumptions at the date of the financial statements. Actual results could differ from those estimates. Subsequent events, if any, through the date that the financial statements were issued have been evaluated in the preparation of the financial statements. Each Fund's Schedule of Investments lists any underlying mutual funds or exchange-traded funds (ETFs) but does not include the underlying holdings of these funds. The following summarizes the significant accounting policies of each Fund:
Investment Valuation. Investments are valued as of 4:00 p.m. Eastern time on the last calendar day of the period. The Board of Trustees (the Board) has designated each Fund's investment adviser as the valuation designee responsible for the fair valuation function and performing fair value determinations as needed. The investment adviser has established a Fair Value Committee (the Committee) to carry out the day-to-day fair valuation responsibilities and has adopted policies and procedures to govern the fair valuation process and the activities of the Committee. In accordance with these fair valuation policies and procedures, which have been approved by the Board, each Fund attempts to obtain prices from one or more third party pricing services or brokers to value its investments. When current market prices, quotations or currency exchange rates are not readily available or reliable, investments will be fair valued in good faith by the Committee, in accordance with the policies and procedures. Factors used in determining fair value vary by investment type and may include market or investment specific events, transaction data, estimated cash flows, and market observations of comparable investments. The frequency that the fair valuation procedures are used cannot be predicted and they may be utilized to a significant extent. The Committee manages each Fund's fair valuation practices and maintains the fair valuation policies and procedures. Each Fund's investment adviser reports to the Board information regarding the fair valuation process and related material matters.
Each Fund categorizes the inputs to valuation techniques used to value its investments into a disclosure hierarchy consisting of three levels as shown below:
Level 1 - unadjusted quoted prices in active markets for identical investments
Level 2 - other significant observable inputs (including quoted prices for similar investments, interest rates, prepayment speeds, etc.)
Level 3 - unobservable inputs (including the Fund's own assumptions based on the best information available)
Valuation techniques used to value each Fund's investments by major category are as follows:
Equity securities, including restricted securities, for which market quotations are readily available, are valued at the last reported sale price or official closing price as reported by a third party pricing service on the primary market or exchange on which they are traded and are categorized as Level 1 in the hierarchy. In the event there were no sales during the day or closing prices are not available, securities are valued at the last quoted bid price or may be valued using the last available price and are generally categorized as Level 2 in the hierarchy. For foreign equity securities, when market or security specific events arise, comparisons to the valuation of American Depositary Receipts (ADRs), futures contracts, ETFs and certain indexes as well as quoted prices for similar securities may be used and would be categorized as Level 2 in the hierarchy. For equity securities, including restricted securities, where observable inputs are limited, assumptions about market activity and risk are used and these securities may be categorized as Level 3 in the hierarchy.
Investments in open-end mutual funds, including the Fidelity Central Funds, are valued at their closing net asset value (NAV) each business day and are categorized as Level 1 in the hierarchy.
Changes in valuation techniques may result in transfers in or out of an assigned level within the disclosure hierarchy. The aggregate value of investments by input level as of February 28, 2023 is included at the end of each Fund's Schedule of Investments.
Foreign Currency. Certain Funds may use foreign currency contracts to facilitate transactions in foreign-denominated securities. Gains and losses from these transactions may arise from changes in the value of the foreign currency or if the counterparties do not perform under the contracts' terms.
Foreign-denominated assets, including investment securities, and liabilities are translated into U.S. dollars at the exchange rates at period end. Purchases and sales of investment securities, income and dividends received, and expenses denominated in foreign currencies are translated into U.S. dollars at the exchange rate in effect on the transaction date.
The effects of exchange rate fluctuations on investments are included with the net realized and unrealized gain (loss) on investment securities. Other foreign currency transactions resulting in realized and unrealized gain (loss) are disclosed separately.
Investment Transactions and Income. For financial reporting purposes, the Funds' investment holdings and NAV include trades executed through the end of the last business day of the period. The NAV per share for processing shareholder transactions is calculated as of the close of business of the New York Stock Exchange (NYSE), normally 4:00 p.m. Eastern time and includes trades executed through the end of the prior business day. Gains and losses on securities sold are determined on the basis of identified cost and for certain Funds include proceeds received from litigation. Commissions paid to certain brokers with whom the investment adviser, or its affiliates, places trades on behalf of a fund include an amount in addition to trade execution, which may be rebated back to a fund. Any such rebates are included in net realized gain (loss) on investments in the Statement of Operations. Dividend income is recorded on the ex-dividend date, except for certain dividends from foreign securities where the ex-dividend date may have passed, which are recorded as soon as the Funds are informed of the ex-dividend date. Non-cash dividends included in dividend income, if any, are recorded at the fair market value of the securities received. Income and capital gain distributions from Fidelity Central Funds, if any, are recorded on the ex-dividend date. Certain distributions received by the Funds represent a return of capital or capital gain. The Funds determine the components of these distributions subsequent to the ex-dividend date, based upon receipt of tax filings or other correspondence relating to the underlying investment. These distributions are recorded as a reduction of cost of investments and/or as a realized gain. Large, non-recurring dividends recognized by the Funds are presented separately on the Statement of Operations as "Special Dividends" and the impact of these dividends is presented in the Financial Highlights. Investment income is recorded net of foreign taxes withheld where recovery of such taxes is uncertain. Funds may file withholding tax reclaims in certain jurisdictions to recover a portion of amounts previously withheld. Any withholding tax reclaims income is included in the Statement of Operations in dividends. Any receivables for withholding tax reclaims are included in the Statement of Assets and Liabilities in dividends receivable.
Class Allocations and Expenses. Expenses directly attributable to a fund are charged to that fund. Expenses attributable to more than one fund are allocated among the respective funds on the basis of relative net assets or other appropriate methods. Expenses included in the accompanying financial statements reflect the expenses of that fund and do not include any expenses associated with any underlying mutual funds or exchange-traded funds. Although not included in a fund's expenses, a fund indirectly bears its proportionate share of these expenses through the net asset value of each underlying mutual fund or exchange-traded fund. Expense estimates are accrued in the period to which they relate and adjustments are made when actual amounts are known.
For Communication Services Portfolio, investment income, realized and unrealized capital gains and losses, common expenses, and certain fund-level expense reductions, if any, are allocated daily on a pro-rata basis to each class based on the relative net assets of each class to the total net assets. Each class differs with respect to transfer agent and distribution and service plan fees incurred. Certain expense reductions may also differ by class. For the reporting period, the allocated portion of income and expenses to each class as a percent of its average net assets may vary due to the timing of recording these transactions in relation to fluctuating net assets of the classes.
Income Tax Information and Distributions to Shareholders. Each year, each Fund intends to qualify as a regulated investment company under Subchapter M of the Internal Revenue Code, including distributing substantially all of its taxable income and realized gains. As a result, no provision for U.S. Federal income taxes is required. As of February 28, 2023, each Fund did not have any unrecognized tax benefits in the financial statements; nor is each Fund aware of any tax positions for which it is reasonably possible that the total amounts of unrecognized tax benefits will significantly change in the next twelve months. Each Fund files a U.S. federal tax return, in addition to state and local tax returns as required. Each Fund's federal income tax returns are subject to examination by the Internal Revenue Service (IRS) for a period of three fiscal years after they are filed. State and local tax returns may be subject to examination for an additional fiscal year depending on the jurisdiction. Foreign taxes are provided for based on each Fund's understanding of the tax rules and rates that exist in the foreign markets in which it invests.
Distributions are declared and recorded on the ex-dividend date. Income and capital gain distributions are declared separately for each class. Income and capital gain distributions are determined in accordance with income tax regulations, which may differ from GAAP. In addition, certain Funds claimed a portion of the payment made to redeeming shareholders as a distribution for income tax purposes.
Capital accounts within the financial statements are adjusted for permanent book-tax differences. These adjustments have no impact on net assets or the results of operations. Capital accounts are not adjusted for temporary book-tax differences which will reverse in a subsequent period.
Book-tax differences are primarily due to foreign currency transactions, passive foreign investment companies (PFIC), net operating losses, capital loss carryforwards and losses deferred due to wash sales and excise tax regulations.
As of period end, the cost and unrealized appreciation (depreciation) in securities, and derivatives if applicable, for federal income tax purposes were as follows for each Fund:
| | Tax cost | Gross unrealized appreciation | Gross unrealized depreciation | Net unrealized appreciation (depreciation) |
| Automotive Portfolio | $98,166,405 | $34,016,849 | $ (6,628,292) | $27,388,557 |
| Communication Services Portfolio | 745,607,110 | 170,561,391 | (125,421,792) | 45,139,599 |
| Construction and Housing Portfolio | 359,157,041 | 192,962,924 | (27,209,312) | 165,753,612 |
| Consumer Discretionary Portfolio | 317,301,952 | 137,226,512 | (14,226,312) | 123,000,200 |
| Leisure Portfolio | 423,253,375 | 170,793,304 | (19,839,777) | 150,953,527 |
| Retailing Portfolio | 1,739,310,620 | 1,261,124,421 | (129,703,286) | 1,131,421,135 |
The tax-based components of distributable earnings as of period end were as follows for each Fund:
| | Undistributed ordinary income | Undistributed long-term capital gain | Capital loss carryforward | Net unrealized appreciation (depreciation) on securities and other investments |
| Automotive Portfolio | $30,141 | $- | $(13,865,998) | $27,385,652 |
| Communication Services Portfolio | - | - | (17,461,483) | 45,139,430 |
| Construction and Housing Portfolio | - | - | (14,661,781) | 165,753,612 |
| Consumer Discretionary Portfolio | - | 5,720,978 | - | 122,995,881 |
| Leisure Portfolio | 699,955 | 2,386,264 | - | 150,950,176 |
| Retailing Portfolio | - | 8,369,938 | - | 1,131,419,620 |
Capital loss carryforwards are only available to offset future capital gains of the Funds to the extent provided by regulations and may be limited. The capital loss carryforward information presented below, including any applicable limitation, is estimated as of fiscal period end and is subject to adjustment.
| | Short-term | Long-term | Total capital loss carryforward |
| Automotive Portfolio | $ (9,853,453) | $ (4,012,545) | $(13,865,998) |
| Communication Services Portfolio | (17,461,483) | - | (17,461,483) |
| Construction and Housing Portfolio | (14,661,781) | - | (14,661,781) |
Certain of the Funds intend to elect to defer to the next fiscal year ordinary losses recognized during the period January 1, 2023 to February 28, 2023. Loss deferrals were as follows:
| | Ordinary losses |
| Communication Services Portfolio | $(631,297) |
| Consumer Discretionary Portfolio | (91,321) |
| Retailing Portfolio | (184,284) |
The tax character of distributions paid was as follows:
| February 28, 2023 | | | |
| | Ordinary Income | Long-term Capital Gains | Total |
| Automotive Portfolio | $634,736 | $2,066,777 | $2,701,513 |
| Construction and Housing Portfolio | 3,697,710 | - | 3,697,710 |
| Consumer Discretionary Portfolio | 190,305 | 36,774,708 | 36,965,013 |
| Leisure Portfolio | 1,954,866 | 16,333,287 | 18,288,153 |
| Retailing Portfolio | 9,439,958 | 73,979,629 | 83,419,587 |
| February 28, 2022 | | | |
| | Ordinary Income | Long-term Capital Gains | Total |
| Automotive Portfolio | $1,558,029 | $4,579,099 | $6,137,128 |
| Communication Services Portfolio | 29,776,343 | 34,129,421 | 63,905,764 |
| Construction and Housing Portfolio | 14,753,592 | 25,146,850 | 39,900,442 |
| Consumer Discretionary Portfolio | 1,098,748 | 56,820,968 | 57,919,716 |
| Leisure Portfolio | 26,867,028 | 113,972,286 | 140,839,314 |
| Retailing Portfolio | 157,489,329 | 488,229,086 | 645,718,415 |
Restricted Securities (including Private Placements). Funds may invest in securities that are subject to legal or contractual restrictions on resale. These securities generally may be resold in transactions exempt from registration or to the public if the securities are registered. Disposal of these securities may involve time-consuming negotiations and expense, and prompt sale at an acceptable price may be difficult. Information regarding restricted securities held at period end is included at the end of the Schedule of Investments, if applicable.
Special Purpose Acquisition Companies. Funds may invest in stock, warrants, and other securities of special purpose acquisition companies (SPACs) or similar special purpose entities. A SPAC is a publicly traded company that raises investment capital via an initial public offering (IPO) for the purpose of acquiring the equity securities of one or more existing companies via merger, business combination, acquisition or other similar transactions within a designated time frame.
Private Investment in Public Equity. Funds may acquire equity securities of an issuer through a private investment in a public equity (PIPE) transaction, including through commitments to purchase securities on a when-issued basis. A PIPE typically involves the purchase of securities directly from a publicly traded company in a private placement transaction. Securities purchased through PIPE transactions will be restricted from trading and considered illiquid until a resale registration statement for the shares is filed and declared effective.
At the current and/or prior period end, Retailing Portfolio had commitments to purchase when-issued securities through PIPE transactions with SPACs. The commitments are contingent upon the SPACs acquiring the securities of target companies. Unrealized appreciation (depreciation) on any commitments outstanding at period end is separately presented in the Statements of Assets and Liabilities as Unrealized appreciation (depreciation) on unfunded commitments, and any change in unrealized appreciation (depreciation) on unfunded commitments during the period is separately presented in the Statement of Operations, as applicable.
4. Purchases and Sales of Investments.
Purchases and sales of securities, other than short-term securities and in-kind transactions, as applicable, are noted in the table below.
| | Purchases ($) | Sales ($) |
| Automotive Portfolio | 63,784,327 | 93,165,795 |
| Communication Services Portfolio | 355,925,584 | 440,179,830 |
| Construction and Housing Portfolio | 102,428,686 | 296,780,970 |
| Consumer Discretionary Portfolio | 248,907,854 | 185,143,873 |
| Leisure Portfolio | 253,896,509 | 327,657,234 |
| Retailing Portfolio | 944,520,411 | 1,440,265,904 |
5. Fees and Other Transactions with Affiliates.
Management Fee. Fidelity Management & Research Company LLC (the investment adviser) and its affiliates provide the Funds with investment management related services for which the Funds pay a monthly management fee. The management fee is the sum of an individual fund fee rate and an annualized group fee rate. The individual fund fee rate is applied to each Fund's average net assets. The group fee rate is based upon the monthly average net assets of a group of registered investment companies with which the investment adviser has management contracts. The group fee rate decreases as assets under management increase and increases as assets under management decrease. For the reporting period, each Fund's annual management fee rate expressed as a percentage of each Fund's average net assets was as follows:
| | Individual Rate | Group Rate | Total |
| Automotive Portfolio | .30% | .23% | .52% |
| Communication Services Portfolio | .30% | .23% | .53% |
| Construction and Housing Portfolio | .30% | .23% | .53% |
| Consumer Discretionary Portfolio | .30% | .23% | .53% |
| Leisure Portfolio | .30% | .23% | .53% |
| Retailing Portfolio | .30% | .23% | .53% |
Distribution and Service Plan Fees. In accordance with Rule 12b-1 of the 1940 Act, Communication Services Portfolio has adopted separate Distribution and Service Plans for each class of shares. Certain classes pay Fidelity Distributors Company LLC (FDC), an affiliate of the investment adviser, separate Distribution and Service Fees, each of which is based on an annual percentage of each class' average net assets. In addition, FDC may pay financial intermediaries for selling shares of each Fund and providing shareholder support services. For the period, the Distribution and Service Fee rates, total fees and amounts retained by FDC were as follows:
| | Distribution Fee | Service Fee | Total Fees | Retained by FDC |
| Communication Services Portfolio | | | | |
Class A | -% | .25% | $63,176 | $1,611 |
Class M | .25% | .25% | 21,462 | - |
Class C | .75% | .25% | 75,119 | 19,487 |
| | | | $159,757 | $21,098 |
Sales Load. For Communication Services Portfolio, FDC may receive a front-end sales charge of up to 5.75% for selling Class A shares and 3.50% for selling Class M shares, some of which is paid to financial intermediaries for selling shares of the Fund. Depending on the holding period, FDC may receive contingent deferred sales charges levied on Class A, Class M and Class C redemptions. The deferred sales charges are 1.00% for Class C shares, 1.00% for certain purchases of Class A shares and .25% for certain purchases of Class M shares.
For the period, sales charge amounts retained by FDC were as follows:
| | Retained by FDC |
| Communication Services Portfolio | |
Class A | $10,526 |
Class M | 739 |
Class C A | 398 |
| | $11,663 |
A When Class C shares are initially sold, FDC pays commissions from its own resources to financial intermediaries through which the sales are made.
Transfer Agent Fees. Fidelity Investments Institutional Operations Company LLC (FIIOC), an affiliate of the investment adviser, is the transfer, dividend disbursing and shareholder servicing agent for each class (Communication Services Portfolio) or Fund (all other Funds). FIIOC receives account fees and asset-based fees that vary according to the account size and type of account of the shareholders of the respective class or Fund, except for Class Z. FIIOC receives an asset-based fee of Class Z's average net assets. FIIOC pays for typesetting, printing and mailing of shareholder reports, except proxy statements. For the period, transfer agent fees were as follows:
| | Amount | % of Average Net Assets |
| Automotive Portfolio | $289,869 | .25 |
| Communication Services Portfolio | | |
| Class A | 61,436 | .24 |
| Class M | 10,175 | .24 |
Class C | 15,346 | .20 |
| Communication Services | 1,575,629 | .22 |
Class I | 28,925 | .18 |
Class Z | 1,684 | .04 |
| | 1,693,195 | |
| Construction and Housing Portfolio | 955,911 | .19 |
| Consumer Discretionary Portfolio | 681,929 | .17 |
| Leisure Portfolio | 906,194 | .16 |
| Retailing Portfolio | 4,957,643 | .17 |
Accounting Fees. Fidelity Service Company, Inc. (FSC), an affiliate of the investment adviser, maintains each Fund's accounting records. The accounting fee is based on the level of average net assets for each month. For the period, the fees were equivalent to the following annual rates:
| | % of Average Net Assets |
| Automotive Portfolio | .04 |
| Communication Services Portfolio | .03 |
| Construction and Housing Portfolio | .04 |
| Consumer Discretionary Portfolio | .04 |
| Leisure Portfolio | .04 |
| Retailing Portfolio | .03 |
Brokerage Commissions. A portion of portfolio transactions were placed with brokerage firms which are affiliates of the investment adviser. Brokerage commissions are included in net realized gain (loss) and change in net unrealized appreciation (depreciation) in the Statement of Operations. The commissions paid to these affiliated firms were as follows:
| | Amount |
| Automotive Portfolio | $2,114 |
| Communication Services Portfolio | 9,791 |
| Construction and Housing Portfolio | 2,144 |
| Consumer Discretionary Portfolio | 3,231 |
| Leisure Portfolio | 5,770 |
| Retailing Portfolio | 12,106 |
Interfund Lending Program. Pursuant to an Exemptive Order issued by the Securities and Exchange Commission (the SEC), each Fund, along with other registered investment companies having management contracts with Fidelity Management & Research Company LLC (FMR), or other affiliated entities of FMR, may participate in an interfund lending program. This program provides an alternative credit facility allowing each Fund to borrow from, or lend money to, other participating affiliated funds. At period end, there were no interfund loans outstanding. Activity in this program during the period for which loans were outstanding was as follows:
| | Borrower or Lender | Average Loan Balance | Weighted Average Interest Rate | Interest Expense |
| Communication Services Portfolio | Borrower | $13,940,000 | 2.57% | $993 |
| Construction and Housing Portfolio | Borrower | $8,880,000 | 1.93% | $952 |
| Consumer Discretionary Portfolio | Borrower | $3,766,000 | .75% | $866 |
| Leisure Portfolio | Borrower | $9,977,000 | 4.29% | $7,139 |
| Retailing Portfolio | Borrower | $6,545,864 | .87% | $3,488 |
Interfund Trades. Funds may purchase from or sell securities to other Fidelity Funds under procedures adopted by the Board. The procedures have been designed to ensure these interfund trades are executed in accordance with Rule 17a-7 of the 1940 Act. Any interfund trades are included within the respective purchases and sales amounts shown in the Purchases and Sales of Investments note. Interfund trades during the period are noted in the table below.
| | Purchases ($) | Sales ($) | Realized Gain (Loss) ($) |
| Automotive Portfolio | 2,067,487 | 1,521,202 | (382,780) |
| Communication Services Portfolio | 5,862,139 | 19,203,525 | 176,263 |
| Construction and Housing Portfolio | 8,565,222 | 13,309,552 | 1,282,292 |
| Consumer Discretionary Portfolio | 21,503,056 | 10,570,951 | (4,953,312) |
| Leisure Portfolio | 10,544,150 | 12,232,907 | (3,452,866) |
| Retailing Portfolio | 87,932,284 | 71,324,019 | (2,442,672) |
6. Committed Line of Credit.
Certain Funds participate with other funds managed by the investment adviser or an affiliate in a $4.25 billion credit facility (the "line of credit") to be utilized for temporary or emergency purposes to fund shareholder redemptions or for other short-term liquidity purposes. The participating funds have agreed to pay commitment fees on their pro-rata portion of the line of credit, which are reflected in Miscellaneous expenses on the Statement of Operations, and are listed below. During the period, there were no borrowings on this line of credit.
| | Amount |
| Automotive Portfolio | $234 |
| Communication Services Portfolio | 1,510 |
| Construction and Housing Portfolio | 1,014 |
| Consumer Discretionary Portfolio | 741 |
| Leisure Portfolio | 1,009 |
| Retailing Portfolio | 5,620 |
7. Security Lending.
Funds lend portfolio securities from time to time in order to earn additional income. Lending agents are used, including National Financial Services (NFS), an affiliate of the investment adviser. Pursuant to a securities lending agreement, NFS will receive a fee, which is capped at 9.9% of a fund's daily lending revenue, for its services as lending agent. A fund may lend securities to certain qualified borrowers, including NFS. On the settlement date of the loan, a fund receives collateral (in the form of U.S. Treasury obligations, letters of credit and/or cash) against the loaned securities and maintains collateral in an amount not less than 100% of the market value of the loaned securities during the period of the loan. The market value of the loaned securities is determined at the close of business of a fund and any additional required collateral is delivered to a fund on the next business day. A fund or borrower may terminate the loan at any time, and if the borrower defaults on its obligation to return the securities loaned because of insolvency or other reasons, a fund may apply collateral received from the borrower against the obligation. A fund may experience delays and costs in recovering the securities loaned. Any cash collateral received is invested in the Fidelity Securities Lending Cash Central Fund. Any loaned securities are identified as such in the Schedule of Investments, and the value of loaned securities and cash collateral at period end, as applicable, are presented in the Statement of Assets and Liabilities. Security lending income represents the income earned on investing cash collateral, less rebates paid to borrowers and any lending agent fees associated with the loan, plus any premium payments received for lending certain types of securities. Security lending income is presented in the Statement of Operations as a component of income from Fidelity Central Funds. Affiliated security lending activity, if any, was as follows:
| | Total Security Lending Fees Paid to NFS | Security Lending Income From Securities Loaned to NFS | Value of Securities Loaned to NFS at Period End |
| Automotive Portfolio | $30,647 | $3,806 | $314,985 |
| Communication Services Portfolio | $3,175 | $148 | $- |
| Construction and Housing Portfolio | $1,616 | $- | $- |
| Consumer Discretionary Portfolio | $24,073 | $23,071 | $- |
| Leisure Portfolio | $80,257 | $129,817 | $- |
| Retailing Portfolio | $18,762 | $24 | $- |
8. Bank Borrowings.
Each Fund is permitted to have bank borrowings for temporary or emergency purposes to fund shareholder redemptions or for other short-term liquidity requirements. Each Fund has established borrowing arrangements with certain banks. The interest rate on the borrowings is the bank's base rate, as revised from time to time. Any open loans, including accrued interest, at period end are presented under the caption "Notes payable" in the Statement of Assets and Liabilities, if applicable. Activity in this program during the period for which loans were outstanding was as follows:
| | Average Loan Balance | Weighted Average Interest Rate | Interest Expense |
| Consumer Discretionary Portfolio | $288,000 | .83% | $100 |
9. Expense Reductions.
During the period the investment adviser or an affiliate reimbursed and/or waived a portion of operating expenses as follows:
| | Amount |
| Automotive Portfolio | $4,274 |
| Construction and Housing Portfolio | 18,633 |
| Consumer Discretionary Portfolio | 14,515 |
| Leisure Portfolio | 19,474 |
| Retailing Portfolio | 106,174 |
In addition, during the period the investment adviser or an affiliate reimbursed and/or waived a portion of fund-level operating expenses as follows:
| | Fund-Level Amount |
| Communication Services Portfolio | 27,974 |
10. Distributions to Shareholders.
Distributions to shareholders of each class were as follows:
| | Year ended February 28, 2023 | Year ended February 28, 2022 |
| Communication Services Portfolio | | |
| Distributions to shareholders | | |
| Class A | $- | $1,776,273 |
| Class M | - | 363,201 |
| Class C | - | 474,822 |
| Communication Services | - | 59,014,431 |
| Class I | - | 1,922,707 |
| Class Z | - | 354,330 |
| Total | $- | $63,905,764 |
11. Share Transactions.
Share transactions for each class were as follows and may contain in-kind transactions, automatic conversions between classes or exchanges between affiliated funds:
| | Shares | Shares | Dollars | Dollars |
| | Year ended February 28, 2023 | Year ended February 28, 2022 | Year ended February 28, 2023 | Year ended February 28, 2022 |
| Communication Services Portfolio | | | | |
| Class A | | | | |
| Shares sold | 106,946 | 288,312 | $6,909,623 | $27,200,334 |
| Reinvestment of distributions | - | 19,346 | - | 1,740,757 |
| Shares redeemed | (146,490) | (140,910) | (9,350,947) | (12,635,364) |
| Net increase (decrease) | (39,544) | 166,748 | $(2,441,324) | $16,305,727 |
| Class M | | | | |
| Shares sold | 11,811 | 38,436 | $749,050 | $3,599,648 |
| Reinvestment of distributions | - | 3,956 | - | 355,421 |
| Shares redeemed | (29,773) | (29,716) | (1,798,790) | (2,591,005) |
| Net increase (decrease) | (17,962) | 12,676 | $(1,049,740) | $1,364,064 |
| Class C | | | | |
| Shares sold | 44,574 | 59,277 | $2,778,261 | $5,482,069 |
| Reinvestment of distributions | - | 5,320 | - | 471,861 |
| Shares redeemed | (37,470) | (27,914) | (2,303,544) | (2,486,600) |
| Net increase (decrease) | 7,104 | 36,683 | $474,717 | $3,467,330 |
| Communication Services | | | | |
| Shares sold | 2,037,740 | 6,404,833 | $131,199,352 | $608,572,415 |
| Reinvestment of distributions | - | 621,227 | - | 56,410,302 |
| Shares redeemed | (2,871,553) | (4,677,647) | (185,590,458) | (433,498,431) |
| Net increase (decrease) | (833,813) | 2,348,413 | $(54,391,106) | $231,484,286 |
| Class I | | | | |
| Shares sold | 74,777 | 316,400 | $4,946,728 | $30,080,975 |
| Reinvestment of distributions | - | 19,631 | - | 1,780,227 |
| Shares redeemed | (291,105) | (231,351) | (19,399,461) | (20,888,532) |
| Net increase (decrease) | (216,328) | 104,680 | $(14,452,733) | $10,972,670 |
| Class Z | | | | |
| Shares sold | 19,696 | 98,916 | $1,307,319 | $9,255,551 |
| Reinvestment of distributions | - | 3,767 | - | 340,659 |
| Shares redeemed | (49,019) | (64,255) | (3,238,948) | (5,703,077) |
| Net increase (decrease) | (29,323) | 38,428 | $(1,931,629) | $3,893,133 |
12. Other.
A fund's organizational documents provide former and current trustees and officers with a limited indemnification against liabilities arising in connection with the performance of their duties to the fund. In the normal course of business, a fund may also enter into contracts that provide general indemnifications. A fund's maximum exposure under these arrangements is unknown as this would be dependent on future claims that may be made against a fund. The risk of material loss from such claims is considered remote.
13. Risk and Uncertainties.
Many factors affect a fund's performance. Developments that disrupt global economies and financial markets, such as pandemics, epidemics, outbreaks of infectious diseases, war, terrorism, and environmental disasters, may significantly affect a fund's investment performance. The effects of these developments to a fund will be impacted by the types of securities in which a fund invests, the financial condition, industry, economic sector, and geographic location of an issuer, and a fund's level of investment in the securities of that issuer. Significant concentrations in security types, issuers, industries, sectors, and geographic locations may magnify the factors that affect a fund's performance.
To the Board of Trustees of Fidelity Select Portfolios and the Shareholders of Automotive Portfolio, Communication Services Portfolio, Construction and Housing Portfolio, Consumer Discretionary Portfolio, Leisure Portfolio and Retailing Portfolio
Opinions on the Financial Statements
We have audited the accompanying statements of assets and liabilities, including the schedules of investments, of Automotive Portfolio, Communication Services Portfolio, Construction and Housing Portfolio, Consumer Discretionary Portfolio, Leisure Portfolio and Retailing Portfolio (six of the funds constituting Fidelity Select Portfolios, hereafter collectively referred to as the "Funds") as of February 28, 2023, the related statements of operations for the year ended February 28, 2023, the statements of changes in net assets for each of the two years in the period ended February 28, 2023, including the related notes, and the financial highlights for each of the periods indicated therein (collectively referred to as the "financial statements"). In our opinion, the financial statements present fairly, in all material respects, the financial position of each of the Funds as of February 28, 2023, the results of each of their operations for the year then ended, the changes in each of their net assets for each of the two years in the period ended February 28, 2023 and each of the financial highlights for each of the periods indicated therein in conformity with accounting principles generally accepted in the United States of America.
Basis for Opinions
These financial statements are the responsibility of the Funds' management. Our responsibility is to express an opinion on the Funds' financial statements based on our audits. We are a public accounting firm registered with the Public Company Accounting Oversight Board (United States) (PCAOB) and are required to be independent with respect to the Funds in accordance with the U.S. federal securities laws and the applicable rules and regulations of the Securities and Exchange Commission and the PCAOB.
We conducted our audits of these financial statements in accordance with the standards of the PCAOB. Those standards require that we plan and perform the audit to obtain reasonable assurance about whether the financial statements are free of material misstatement, whether due to error or fraud.
Our audits included performing procedures to assess the risks of material misstatement of the financial statements, whether due to error or fraud, and performing procedures that respond to those risks. Such procedures included examining, on a test basis, evidence regarding the amounts and disclosures in the financial statements. Our audits also included evaluating the accounting principles used and significant estimates made by management, as well as evaluating the overall presentation of the financial statements. Our procedures included confirmation of securities owned as of February 28, 2023 by correspondence with the custodian, issuers of privately offered securities and brokers; when replies were not received from brokers, we performed other auditing procedures. We believe that our audits provide a reasonable basis for our opinions.
/s/ PricewaterhouseCoopers LLP
Boston, Massachusetts
April 13, 2023
We have served as the auditor of one or more investment companies in the Fidelity group of funds since 1932.
The Trustees, Members of the Advisory Board (if any), and officers of the trust and funds, as applicable, are listed below. The Board of Trustees governs each fund and is responsible for protecting the interests of shareholders. The Trustees are experienced executives who meet periodically throughout the year to oversee each fund's activities, review contractual arrangements with companies that provide services to each fund, oversee management of the risks associated with such activities and contractual arrangements, and review each fund's performance. Each of the Trustees oversees 318 funds.
The Trustees hold office without limit in time except that (a) any Trustee may resign; (b) any Trustee may be removed by written instrument, signed by at least two-thirds of the number of Trustees prior to such removal; (c) any Trustee who requests to be retired or who has become incapacitated by illness or injury may be retired by written instrument signed by a majority of the other Trustees; and (d) any Trustee may be removed at any special meeting of shareholders by a two-thirds vote of the outstanding voting securities of the trust. Each Trustee who is not an interested person (as defined in the 1940 Act) of the trust and the funds is referred to herein as an Independent Trustee. Each Independent Trustee shall retire not later than the last day of the calendar year in which his or her 75th birthday occurs. The Independent Trustees may waive this mandatory retirement age policy with respect to individual Trustees. Officers and Advisory Board Members hold office without limit in time, except that any officer or Advisory Board Member may resign or may be removed by a vote of a majority of the Trustees at any regular meeting or any special meeting of the Trustees. Except as indicated, each individual has held the office shown or other offices in the same company for the past five years.
The funds' Statement of Additional Information (SAI) includes more information about the Trustees. To request a free copy, call Fidelity at 1-800-544-8544 if you're an individual investing directly with Fidelity, call 1-800-835-5092 if you're a plan sponsor or participant with Fidelity as your recordkeeper or call 1-877-208-0098 on institutional accounts or if you're an advisor or invest through one.
Experience, Skills, Attributes, and Qualifications of the Trustees. The Governance and Nominating Committee has adopted a statement of policy that describes the experience, qualifications, attributes, and skills that are necessary and desirable for potential Independent Trustee candidates (Statement of Policy). The Board believes that each Trustee satisfied at the time he or she was initially elected or appointed a Trustee, and continues to satisfy, the standards contemplated by the Statement of Policy. The Governance and Nominating Committee also engages professional search firms to help identify potential Independent Trustee candidates who have the experience, qualifications, attributes, and skills consistent with the Statement of Policy. From time to time, additional criteria based on the composition and skills of the current Independent Trustees, as well as experience or skills that may be appropriate in light of future changes to board composition, business conditions, and regulatory or other developments, have also been considered by the professional search firms and the Governance and Nominating Committee. In addition, the Board takes into account the Trustees' commitment and participation in Board and committee meetings, as well as their leadership of standing and ad hoc committees throughout their tenure.
In determining that a particular Trustee was and continues to be qualified to serve as a Trustee, the Board has considered a variety of criteria, none of which, in isolation, was controlling. The Board believes that, collectively, the Trustees have balanced and diverse experience, qualifications, attributes, and skills, which allow the Board to operate effectively in governing each fund and protecting the interests of shareholders. Information about the specific experience, skills, attributes, and qualifications of each Trustee, which in each case led to the Board's conclusion that the Trustee should serve (or continue to serve) as a trustee of the funds, is provided below.
Board Structure and Oversight Function. Robert A. Lawrence is an interested person and currently serves as Chair. The Trustees have determined that an interested Chair is appropriate and benefits shareholders because an interested Chair has a personal and professional stake in the quality and continuity of services provided to the funds. Independent Trustees exercise their informed business judgment to appoint an individual of their choosing to serve as Chair, regardless of whether the Trustee happens to be independent or a member of management. The Independent Trustees have determined that they can act independently and effectively without having an Independent Trustee serve as Chair and that a key structural component for assuring that they are in a position to do so is for the Independent Trustees to constitute a substantial majority for the Board. The Independent Trustees also regularly meet in executive session. David M. Thomas serves as Lead Independent Trustee and as such (i) acts as a liaison between the Independent Trustees and management with respect to matters important to the Independent Trustees and (ii) with management prepares agendas for Board meetings.
Fidelity ® funds are overseen by different Boards of Trustees. The funds' Board oversees Fidelity's high income and certain equity funds, and other Boards oversee Fidelity's alternative investment, investment-grade bond, money market, asset allocation, and other equity funds. The asset allocation funds may invest in Fidelity ® funds overseen by the funds' Board. The use of separate Boards, each with its own committee structure, allows the Trustees of each group of Fidelity ® funds to focus on the unique issues of the funds they oversee, including common research, investment, and operational issues. On occasion, the separate Boards establish joint committees to address issues of overlapping consequences for the Fidelity ® funds overseen by each Board.
The Trustees operate using a system of committees to facilitate the timely and efficient consideration of all matters of importance to the Trustees, each fund, and fund shareholders and to facilitate compliance with legal and regulatory requirements and oversight of the funds' activities and associated risks. The Board, acting through its committees, has charged FMR and its affiliates with (i) identifying events or circumstances the occurrence of which could have demonstrably adverse effects on the funds' business and/or reputation; (ii) implementing processes and controls to lessen the possibility that such events or circumstances occur or to mitigate the effects of such events or circumstances if they do occur; and (iii) creating and maintaining a system designed to evaluate continuously business and market conditions in order to facilitate the identification and implementation processes described in (i) and (ii) above. Because the day-to-day operations and activities of the funds are carried out by or through FMR, its affiliates, and other service providers, the funds' exposure to risks is mitigated but not eliminated by the processes overseen by the Trustees. While each of the Board's committees has responsibility for overseeing different aspects of the funds' activities, oversight is exercised primarily through the Operations, Audit, and Compliance Committees. Appropriate personnel, including but not limited to the funds' Chief Compliance Officer (CCO), FMR's internal auditor, the independent accountants, the funds' Treasurer and portfolio management personnel, make periodic reports to the Board's committees, as appropriate, including an annual review of Fidelity's risk management program for the Fidelity ® funds. The responsibilities of each standing committee, including their oversight responsibilities, are described further under "Standing Committees of the Trustees."
Interested Trustees*:
Correspondence intended for a Trustee who is an interested person may be sent to Fidelity Investments, 245 Summer Street, Boston, Massachusetts 02210.
Name, Year of Birth; Principal Occupations and Other Relevant Experience+
Bettina Doulton (1964)
Year of Election or Appointment: 2020
Trustee
Ms. Doulton also serves as Trustee of other Fidelity ® funds. Prior to her retirement, Ms. Doulton served in a variety of positions at Fidelity Investments, including as a managing director of research (2006-2007), portfolio manager to certain Fidelity ® funds (1993-2005), equity analyst and portfolio assistant (1990-1993), and research assistant (1987-1990). Ms. Doulton currently owns and operates Phi Builders + Architects and Cellardoor Winery. Previously, Ms. Doulton served as a member of the Board of Brown Capital Management, LLC (2014-2018).
Robert A. Lawrence (1952)
Year of Election or Appointment: 2020
Trustee
Chair of the Board of Trustees
Mr. Lawrence also serves as Trustee of other funds. Previously, Mr. Lawrence served as a Trustee and Member of the Advisory Board of certain funds. Prior to his retirement in 2008, Mr. Lawrence served as Vice President of certain Fidelity ® funds (2006-2008), Senior Vice President, Head of High Income Division of Fidelity Management & Research Company (investment adviser firm, 2006-2008), and President of Fidelity Strategic Investments (investment adviser firm, 2002-2005).
* Determined to be an "Interested Trustee" by virtue of, among other things, his or her affiliation with the trust or various entities under common control with FMR.
+ The information includes the Trustee's principal occupation during the last five years and other information relating to the experience, attributes, and skills relevant to the Trustee's qualifications to serve as a Trustee, which led to the conclusion that the Trustee should serve as a Trustee for each fund.
Independent Trustees:
Correspondence intended for an Independent Trustee may be sent to Fidelity Investments, P.O. Box 55235, Boston, Massachusetts 02205-5235.
Name, Year of Birth; Principal Occupations and Other Relevant Experience+
Thomas P. Bostick (1956)
Year of Election or Appointment: 2021
Trustee
Lieutenant General Bostick also serves as Trustee of other Fidelity ® funds. Prior to his retirement, General Bostick (United States Army, Retired) held a variety of positions within the U.S. Army, including Commanding General and Chief of Engineers, U.S. Army Corps of Engineers (2012-2016) and Deputy Chief of Staff and Director of Human Resources, U.S. Army (2009-2012). General Bostick currently serves as a member of the Board and Finance and Governance & Sustainability Committees of CSX Corporation (transportation, 2020-present) and a member of the Board and Corporate Governance and Nominating Committee of Perma-Fix Environmental Services, Inc. (nuclear waste management, 2020-present). General Bostick serves as Chief Executive Officer of Bostick Global Strategies, LLC (consulting, 2016-present), as a member of the Board of HireVue, Inc. (video interview and assessment, 2020-present), as a member of the Board of Allonnia (biotechnology and engineering solutions, 2022-present) and on the Advisory Board of Solugen, Inc. (specialty bio-based chemicals manufacturer, 2022-present). Previously, General Bostick served as a Member of the Advisory Board of certain Fidelity ® funds (2021), President, Intrexon Bioengineering (2018-2020) and Chief Operating Officer (2017-2020) and Senior Vice President of the Environment Sector (2016-2017) of Intrexon Corporation (biopharmaceutical company).
Dennis J. Dirks (1948)
Year of Election or Appointment: 2018
Trustee
Mr. Dirks also serves as Trustee of other Fidelity ® funds. Prior to his retirement in May 2003, Mr. Dirks served as Chief Operating Officer and as a member of the Board of The Depository Trust & Clearing Corporation (financial markets infrastructure), President, Chief Operating Officer and a member of the Board of The Depository Trust Company (DTC), President and a member of the Board of the National Securities Clearing Corporation (NSCC), Chief Executive Officer and a member of the Board of the Government Securities Clearing Corporation and Chief Executive Officer and a member of the Board of the Mortgage-Backed Securities Clearing Corporation. Mr. Dirks currently serves as a member of the Finance Committee (2016-present) and Board (2017-present) and is Treasurer (2018-present) of the Asolo Repertory Theatre.
Donald F. Donahue (1950)
Year of Election or Appointment: 2018
Trustee
Mr. Donahue also serves as Trustee of other Fidelity ® funds. Mr. Donahue serves as President and Chief Executive Officer of Miranda Partners, LLC (risk consulting for the financial services industry, 2012-present). Previously, Mr. Donahue served as Chief Executive Officer (2006-2012), Chief Operating Officer (2003-2006) and Managing Director, Customer Marketing and Development (1999-2003) of The Depository Trust & Clearing Corporation (financial markets infrastructure). Mr. Donahue currently serves as a member (2007-present) and Co-Chairman (2016-present) of the Board of United Way of New York. Mr. Donahue previously served as a member of the Advisory Board of certain Fidelity ® funds (2015-2018) and as a member of the Board of The Leadership Academy (previously NYC Leadership Academy) (2012-2022).
Vicki L. Fuller (1957)
Year of Election or Appointment: 2020
Trustee
Ms. Fuller also serves as Trustee of other Fidelity ® funds. Previously, Ms. Fuller served as a member of the Advisory Board of certain Fidelity ® funds (2018-2020), Chief Investment Officer of the New York State Common Retirement Fund (2012-2018) and held a variety of positions at AllianceBernstein L.P. (global asset management, 1985-2012), including Managing Director (2006-2012) and Senior Vice President and Senior Portfolio Manager (2001-2006). Ms. Fuller currently serves as a member of the Board, Audit Committee and Nominating and Governance Committee of two Blackstone business development companies (2020-present), as a member of the Board of Treliant, LLC (consulting, 2019-present), as a member of the Board of Ariel Alternatives, LLC (private equity, 2022-present) and as a member of the Board and Chair of the Audit Committee of Gusto, Inc. (software, 2021-present). In addition, Ms. Fuller currently serves as a member of the Board of Roosevelt University (2019-present) and as a member of the Executive Board of New York University's Stern School of Business. Ms. Fuller previously served as a member of the Board, Audit Committee and Nominating and Governance Committee of The Williams Companies, Inc. (natural gas infrastructure, 2018-2021).
Patricia L. Kampling (1959)
Year of Election or Appointment: 2020
Trustee
Ms. Kampling also serves as Trustee of other Fidelity ® funds. Prior to her retirement, Ms. Kampling served as Chairman of the Board and Chief Executive Officer (2012-2019), President and Chief Operating Officer (2011-2012) and Executive Vice President and Chief Financial Officer (2010-2011) of Alliant Energy Corporation. Ms. Kampling currently serves as a member of the Board, Finance Committee and Governance, Compensation and Nominating Committee of Xcel Energy Inc. (utilities company, 2020-present) and as a member of the Board, Audit, Finance and Risk Committee and Safety, Environmental, Technology and Operations Committee and Chair of the Executive Development and Compensation Committee of American Water Works Company, Inc. (utilities company, 2019-present). In addition, Ms. Kampling currently serves as a member of the Board of the Nature Conservancy, Wisconsin Chapter (2019-present). Previously, Ms. Kampling served as a Member of the Advisory Board of certain Fidelity® funds (2020), a member of the Board, Compensation Committee and Executive Committee and Chair of the Audit Committee of Briggs & Stratton Corporation (manufacturing, 2011-2021), a member of the Board of Interstate Power and Light Company (2012-2019) and Wisconsin Power and Light Company (2012-2019) (each a subsidiary of Alliant Energy Corporation) and as a member of the Board and Workforce Development Committee of the Business Roundtable (2018-2019).
Thomas A. Kennedy (1955)
Year of Election or Appointment: 2021
Trustee
Mr. Kennedy also serves as Trustee of other Fidelity ® funds. Previously, Mr. Kennedy served as a Member of the Advisory Board of certain Fidelity ® funds (2020) and held a variety of positions at Raytheon Company (aerospace and defense, 1983-2020), including Chairman and Chief Executive Officer (2014-2020) and Executive Vice President and Chief Operating Officer (2013-2014). Mr. Kennedy served as Executive Chairman of the Board of Directors of Raytheon Technologies Corporation (aerospace and defense, 2020-2021). Mr. Kennedy serves as a Director of the Board of Directors of Textron Inc. (aerospace and defense, 2023-present).
Oscar Munoz (1959)
Year of Election or Appointment: 2021
Trustee
Mr. Munoz also serves as Trustee of other Fidelity ® funds. Prior to his retirement, Mr. Munoz served as Executive Chairman (2020-2021), Chief Executive Officer (2015-2020), President (2015-2016) and a member of the Board (2010-2021) of United Airlines Holdings, Inc. Mr. Munoz currently serves as a member of the Board of CBRE Group, Inc. (commercial real estate, 2020-present), a member of the Board of Univision Communications, Inc. (Hispanic media, 2020-present), a member of the Board of Archer Aviation Inc. (2021-present), a member of the Defense Business Board of the United States Department of Defense (2021-present) and a member of the Board of Salesforce.com, Inc. (cloud-based software, 2022-present). Previously, Mr. Munoz served as a Member of the Advisory Board of certain Fidelity ® funds (2021).
David M. Thomas (1949)
Year of Election or Appointment: 2018
Trustee
Lead Independent Trustee
Mr. Thomas also serves as Trustee of other Fidelity ® funds. Previously, Mr. Thomas served as Executive Chairman (2005-2006) and Chairman and Chief Executive Officer (2000-2005) of IMS Health, Inc. (pharmaceutical and healthcare information solutions). Mr. Thomas currently serves as a member of the Board of Fortune Brands Home and Security (home and security products, 2004-present) and as Director (2013-present) and Non-Executive Chairman of the Board (2022-present) of Interpublic Group of Companies, Inc. (marketing communication).
Susan Tomasky (1953)
Year of Election or Appointment: 2020
Trustee
Ms. Tomasky also serves as Trustee of other Fidelity ® funds. Prior to her retirement, Ms. Tomasky served in various executive officer positions at American Electric Power Company, Inc. (1998-2011), including most recently as President of AEP Transmission (2007-2011). Ms. Tomasky currently serves as a member of the Board and Sustainability Committee and as Chair of the Audit Committee of Marathon Petroleum Corporation (2018-present) and as a member of the Board, Executive Committee, Corporate Governance Committee and Organization and Compensation Committee and as Lead Director of the Board of Public Service Enterprise Group, Inc. (utilities company, 2012-present) and as a member of the Board of its subsidiary company, Public Service Electric and Gas Co. (2021-present). In addition, Ms. Tomasky currently serves as a member (2009-present) and President (2020-present) of the Board of the Royal Shakespeare Company - America (2009-present), as a member of the Board of the Columbus Association for the Performing Arts (2011-present) and as a member of the Board and Kenyon in the World Committee of Kenyon College (2016-present). Previously, Ms. Tomasky served as a Member of the Advisory Board of certain Fidelity ® funds (2020), as a member of the Board of the Columbus Regional Airport Authority (2007-2020), as a member of the Board (2011-2018) and Lead Independent Director (2015-2018) of Andeavor Corporation (previously Tesoro Corporation) (independent oil refiner and marketer) and as a member of the Board of Summit Midstream Partners LP (energy, 2012-2018).
Michael E. Wiley (1950)
Year of Election or Appointment: 2008
Trustee
Mr. Wiley also serves as Trustee of other Fidelity ® funds. Previously, Mr. Wiley served as a member of the Advisory Board of certain Fidelity ® funds (2018-2020), Chairman, President and CEO of Baker Hughes, Inc. (oilfield services, 2000-2004). Mr. Wiley also previously served as a member of the Board of Andeavor Corporation (independent oil refiner and marketer, 2005-2018), a member of the Board of Andeavor Logistics LP (natural resources logistics, 2015-2018) and a member of the Board of High Point Resources (exploration and production, 2005-2020).
+ The information includes the Trustee's principal occupation during the last five years and other information relating to the experience, attributes, and skills relevant to the Trustee's qualifications to serve as a Trustee, which led to the conclusion that the Trustee should serve as a Trustee for each fund.
Advisory Board Members and Officers:
Correspondence intended for a Member of the Advisory Board (if any) may be sent to Fidelity Investments, P.O. Box 55235, Boston, Massachusetts 02205-5235. Correspondence intended for an officer or Peter S. Lynch may be sent to Fidelity Investments, 245 Summer Street, Boston, Massachusetts 02210. Officers appear below in alphabetical order.
Name, Year of Birth; Principal Occupation
Peter S. Lynch (1944)
Year of Election or Appointment: 2018
Member of the Advisory Board
Mr. Lynch also serves as a Member of the Advisory Board of other Fidelity ® funds. Mr. Lynch is Vice Chairman and a Director of Fidelity Management & Research Company LLC (investment adviser firm). In addition, Mr. Lynch serves as a Trustee of Boston College and as the Chairman of the Inner-City Scholarship Fund. Previously, Mr. Lynch served as Vice Chairman and a Director of FMR Co., Inc. (investment adviser firm) and on the Special Olympics International Board of Directors (1997-2006).
Heather Bonner (1977)
Year of Election or Appointment: 2023
Assistant Treasurer
Ms. Bonner also serves as an officer of other funds. Ms. Bonner serves as Senior Vice President (2022-present), and is an employee of Fidelity Investments. Ms. Bonner serves as Assistant Treasurer of Fidelity CRET Trustee LLC (2022-present). Prior to joining Fidelity, Ms. Bonner served as Managing Director at AQR Capital Management (2013-2022) and was the Treasurer and Principal Financial Officer of the AQR Funds (2013-2022).
Craig S. Brown (1977)
Year of Election or Appointment: 2022
Deputy Treasurer
Mr. Brown also serves as an officer of other funds. Mr. Brown serves as Assistant Treasurer of FIMM, LLC (2021-present) and is an employee of Fidelity Investments (2013-present). Previously, Mr. Brown served as Assistant Treasurer of certain Fidelity ® funds (2019-2022).
John J. Burke III (1964)
Year of Election or Appointment: 2018
Chief Financial Officer
Mr. Burke also serves as Chief Financial Officer of other funds. Mr. Burke serves as Head of Investment Operations for Fidelity Fund and Investment Operations (2018-present) and is an employee of Fidelity Investments (1998-present). Previously Mr. Burke served as head of Asset Management Investment Operations (2012-2018).
Margaret Carey (1973)
Year of Election or Appointment: 2023
Secretary and Chief Legal Officer (CLO)
Ms. Carey also serves as an officer of other funds and as CLO of certain other Fidelity entities. She is a Senior Vice President and Deputy General Counsel of FMR LLC (diversified financial services company, 2019-present), and is an employee of Fidelity Investments.
William C. Coffey (1969)
Year of Election or Appointment: 2019
Assistant Secretary
Mr. Coffey also serves as Assistant Secretary of other funds. He is Senior Vice President and Deputy General Counsel of FMR LLC (diversified financial services company, 2010-present), and is an employee of Fidelity Investments. Previously, Mr. Coffey served as Secretary and CLO of certain funds (2018-2019); CLO, Secretary, and Senior Vice President of Fidelity Management & Research Company and FMR Co., Inc. (investment adviser firms, 2018-2019); Secretary of Fidelity SelectCo, LLC and Fidelity Investments Money Management, Inc. (investment adviser firms, 2018-2019); CLO of Fidelity Management & Research (Hong Kong) Limited, FMR Investment Management (UK) Limited, and Fidelity Management & Research (Japan) Limited (investment adviser firms, 2018-2019); and Assistant Secretary of certain funds (2009-2018).
Timothy M. Cohen (1969)
Year of Election or Appointment: 2018
Vice President
Mr. Cohen also serves as Vice President of other funds. Mr. Cohen serves as Co-Head of Equity (2018-present), a Director of Fidelity Management & Research (Japan) Limited (investment adviser firm, 2016-present), and is an employee of Fidelity Investments. Previously, Mr. Cohen served as Executive Vice President of Fidelity SelectCo, LLC (2019), Head of Global Equity Research (2016-2018), Chief Investment Officer - Equity and a Director of Fidelity Management & Research (U.K.) Inc. (investment adviser firm, 2013-2015) and as a Director of Fidelity Management & Research (Hong Kong) Limited (investment adviser firm, 2017).
Jonathan Davis (1968)
Year of Election or Appointment: 2010
Assistant Treasurer
Mr. Davis also serves as an officer of other funds. Mr. Davis serves as Assistant Treasurer of FIMM, LLC (2021-present), FMR Capital, Inc. (2017-present), FD Funds GP LLC (2021-present), FD Funds Holding LLC (2021-present), and FD Funds Management LLC (2021-present); and is an employee of Fidelity Investments. Previously, Mr. Davis served as Vice President and Associate General Counsel of FMR LLC (diversified financial services company, 2003-2010).
Laura M. Del Prato (1964)
Year of Election or Appointment: 2018
Assistant Treasurer
Ms. Del Prato also serves as an officer of other funds. Ms. Del Prato serves as Assistant Treasurer of FIMM, LLC (2021-present) and is an employee of Fidelity Investments (2017-present). Previously, Ms. Del Prato served as President and Treasurer of The North Carolina Capital Management Trust: Cash Portfolio and Term Portfolio (2018-2020). Prior to joining Fidelity Investments, Ms. Del Prato served as a Managing Director and Treasurer of the JPMorgan Mutual Funds (2014-2017). Prior to JPMorgan, Ms. Del Prato served as a partner at Cohen Fund Audit Services (accounting firm, 2012-2013) and KPMG LLP (accounting firm, 2004-2012).
Colm A. Hogan (1973)
Year of Election or Appointment: 2020
Assistant Treasurer
Mr. Hogan also serves as an officer of other funds. Mr. Hogan serves as Assistant Treasurer of FIMM, LLC (2021-present) and FMR Capital, Inc. (2017-present) and is an employee of Fidelity Investments (2005-present). Previously, Mr. Hogan served as Deputy Treasurer of certain Fidelity ® funds (2016-2020) and Assistant Treasurer of certain Fidelity ® funds (2016-2018).
Pamela R. Holding (1964)
Year of Election or Appointment: 2018
Vice President
Ms. Holding also serves as Vice President of other funds. Ms. Holding serves as Co-Head of Equity (2018-present) and is an employee of Fidelity Investments (2013-present). Previously, Ms. Holding served as Executive Vice President of Fidelity SelectCo, LLC (2019) and as Chief Investment Officer of Fidelity Institutional Asset Management (2013-2018).
Chris Maher (1972)
Year of Election or Appointment: 2020
Deputy Treasurer
Mr. Maher also serves as an officer of other funds. Mr. Maher serves as Assistant Treasurer of FIMM, LLC (2021-present) and FMR Capital, Inc. (2017-present), and is an employee of Fidelity Investments (2008-present). Previously, Mr. Maher served as Assistant Treasurer of certain funds (2013-2020); Vice President of Asset Management Compliance (2013), Vice President of the Program Management Group of FMR (investment adviser firm, 2010-2013), and Vice President of Valuation Oversight (2008-2010).
Jason P. Pogorelec (1975)
Year of Election or Appointment: 2020
Chief Compliance Officer
Mr. Pogorelec also serves as Chief Compliance Officer of other funds. Mr. Pogorelec is a Senior Vice President of Asset Management Compliance for Fidelity Investments and is an employee of Fidelity Investments. Mr. Pogorelec serves as Compliance Officer of Fidelity Management & Research Company LLC (investment adviser firm, 2023-present). Previously, Mr. Pogorelec served as Vice President, Associate General Counsel for Fidelity Investments (2010-2020) and Assistant Secretary of certain Fidelity ® funds (2015-2020).
Brett Segaloff (1972)
Year of Election or Appointment: 2021
Anti-Money Laundering (AML) Officer
Mr. Segaloff also serves as an AML Officer of other funds and other related entities. He is Director, Anti-Money Laundering (2007-present) of FMR LLC (diversified financial services company) and is an employee of Fidelity Investments (1996-present).
Stacie M. Smith (1974)
Year of Election or Appointment: 2018
President and Treasurer
Ms. Smith also serves as an officer of other funds. Ms. Smith serves as Assistant Treasurer of FIMM, LLC (2021-present) and FMR Capital, Inc. (2017-present), is an employee of Fidelity Investments (2009-present), and has served in other fund officer roles. Prior to joining Fidelity Investments, Ms. Smith served as Senior Audit Manager of Ernst & Young LLP (accounting firm, 1996-2009). Previously, Ms. Smith served as Assistant Treasurer (2013-2019) and Deputy Treasurer (2013-2016) of certain Fidelity ® funds.
Jim Wegmann (1979)
Year of Election or Appointment: 2019
Assistant Treasurer
Mr. Wegmann also serves as an officer of other funds. Mr. Wegmann serves as Assistant Treasurer of FIMM, LLC (2021-present) and is an employee of Fidelity Investments (2011-present). Previously, Mr. Wegmann served as Assistant Treasurer of certain Fidelity ® funds (2019-2021).
As a shareholder, you incur two types of costs: (1) transaction costs, which may include sales charges (loads) on purchase payments or redemption proceeds, as applicable and (2) ongoing costs, which generally include management fees, distribution and/or service (12b-1) fees and other Fund expenses. This Example is intended to help you understand your ongoing costs (in dollars) of investing in a fund and to compare these costs with the ongoing costs of investing in other mutual funds.
| The Example is based on an investment of $1,000 invested at the beginning of the period and held for the entire period (September 1, 2022 to February 28, 2023). |
Actual Expenses
The first line of the accompanying table provides information about actual account values and actual expenses. You may use the information in this line, together with the amount you invested, to estimate the expenses that you paid over the period. Simply divide your account value by $1,000.00 (for example, an $8,600 account value divided by $1,000.00 = 8.6), then multiply the result by the number in the first line for a class/Fund under the heading entitled "Expenses Paid During Period" to estimate the expenses you paid on your account during this period. If any fund is a shareholder of any underlying mutual funds or exchange-traded funds (ETFs) (the Underlying Funds), such fund indirectly bears its proportional share of the expenses of the Underlying Funds in addition to the direct expenses incurred presented in the table. These fees and expenses are not included in the annualized expense ratio used to calculate the expense estimate in the table below.
Hypothetical Example for Comparison Purposes
The second line of the accompanying table provides information about hypothetical account values and hypothetical expenses based on the actual expense ratio and an assumed rate of return of 5% per year before expenses, which is not the actual return. The hypothetical account values and expenses may not be used to estimate the actual ending account balance or expenses you paid for the period. You may use this information to compare the ongoing costs of investing in the Fund and other funds. To do so, compare this 5% hypothetical example with the 5% hypothetical examples that appear in the shareholder reports of the other funds. If any fund is a shareholder of any Underlying Funds, such fund indirectly bears its proportional share of the expenses of the Underlying Funds in addition to the direct expenses as presented in the table. These fees and expenses are not included in the annualized expense ratio used to calculate the expense estimate in the table below.
Please note that the expenses shown in the table are meant to highlight your ongoing costs only and do not reflect any transaction costs. Therefore, the second line of the table is useful in comparing ongoing costs only, and will not help you determine the relative total costs of owning different funds. In addition, if these transactional costs were included, your costs would have been higher.
| | | | | Annualized Expense Ratio- A | | Beginning Account Value September 1, 2022 | | Ending Account Value February 28, 2023 | | Expenses Paid During Period- C September 1, 2022 to February 28, 2023 |
| | | | | | | | | | |
| Automotive Portfolio | | | | .89% | | | | | | |
| Actual | | | | | | $ 1,000 | | $ 984.10 | | $ 4.38 |
Hypothetical- B | | | | | | $ 1,000 | | $ 1,020.38 | | $ 4.46 |
| Communication Services Portfolio | | | | | | | | | | |
| Class A | | | | 1.08% | | | | | | |
| Actual | | | | | | $ 1,000 | | $ 987.80 | | $ 5.32 |
Hypothetical- B | | | | | | $ 1,000 | | $ 1,019.44 | | $ 5.41 |
| Class M | | | | 1.33% | | | | | | |
| Actual | | | | | | $ 1,000 | | $ 986.60 | | $ 6.55 |
Hypothetical- B | | | | | | $ 1,000 | | $ 1,018.20 | | $ 6.66 |
| Class C | | | | 1.78% | | | | | | |
| Actual | | | | | | $ 1,000 | | $ 984.40 | | $ 8.76 |
Hypothetical- B | | | | | | $ 1,000 | | $ 1,015.97 | | $ 8.90 |
| Communication Services Portfolio | | | | .81% | | | | | | |
| Actual | | | | | | $ 1,000 | | $ 989.10 | | $ 3.99 |
Hypothetical- B | | | | | | $ 1,000 | | $ 1,020.78 | | $ 4.06 |
| Class I | | | | .76% | | | | | | |
| Actual | | | | | | $ 1,000 | | $ 989.60 | | $ 3.75 |
Hypothetical- B | | | | | | $ 1,000 | | $ 1,021.03 | | $ 3.81 |
| Class Z | | | | .62% | | | | | | |
| Actual | | | | | | $ 1,000 | | $ 990.10 | | $ 3.06 |
Hypothetical- B | | | | | | $ 1,000 | | $ 1,021.72 | | $ 3.11 |
| | | | | | | | | | |
| Construction and Housing Portfolio | | | | .77% | | | | | | |
| Actual | | | | | | $ 1,000 | | $ 1,108.30 | | $ 4.03 |
Hypothetical- B | | | | | | $ 1,000 | | $ 1,020.98 | | $ 3.86 |
| | | | | | | | | | |
| Consumer Discretionary Portfolio | | | | .75% | | | | | | |
| Actual | | | | | | $ 1,000 | | $ 988.40 | | $ 3.70 |
Hypothetical- B | | | | | | $ 1,000 | | $ 1,021.08 | | $ 3.76 |
| | | | | | | | | | |
| Leisure Portfolio | | | | .74% | | | | | | |
| Actual | | | | | | $ 1,000 | | $ 1,126.90 | | $ 3.90 |
Hypothetical- B | | | | | | $ 1,000 | | $ 1,021.12 | | $ 3.71 |
| | | | | | | | | | |
| Retailing Portfolio | | | | .72% | | | | | | |
| Actual | | | | | | $ 1,000 | | $ 1,023.00 | | $ 3.61 |
Hypothetical- B | | | | | | $ 1,000 | | $ 1,021.22 | | $ 3.61 |
| |
A Annualized expense ratio reflects expenses net of applicable fee waivers.
B 5% return per year before expenses
C Expenses are equal to the annualized expense ratio, multiplied by the average account value over the period, multiplied by 181/ 365 (to reflect the one-half year period). The fees and expenses of any Underlying Funds are not included in each annualized expense ratio.
The dividend and capital gains distributions for the fund(s) are available on Fidelity.com or Institutional.Fidelity.com.
The funds hereby designate as capital gain dividend the amounts noted below for the taxable year ended February 28, 2023, or, if subsequently determined to be different, the net capital gain of such year.
| Leisure Portfolio | $2,661,213 |
| Retailing Portfolio | $8,641,370 |
| Consumer Discretionary Portfolio | $6,203,283 |
A percentage of the dividends distributed during the fiscal year for the following funds qualify for the dividends-received deduction for corporate shareholders:
| Leisure Portfolio | |
April 2022 December 2022 | 100% 100% |
| Retailing Portfolio | |
| December 2022 | 100% |
| Automotive Portfolio | |
| December 2022 | 77% |
| Construction and Housing Portfolio | |
| December 2022 | 100% |
| Consumer Discretionary Portfolio | |
| December 2022 | 100% |
A percentage of the dividends distributed during the fiscal year for the following funds may be taken into account as a dividend for purposes of the maximum rate under section 1(h)(11) of the Internal Revenue Code.
| Leisure Portfolio | |
| April 2022 | 100% |
| December 2022 | 100% |
| Retailing Portfolio | |
| December 2022 | 100% |
| Automotive Portfolio | |
| December 2022 | 100% |
| Construction and Housing Portfolio | |
| December 2022 | 100% |
| Consumer Discretionary Portfolio | |
| December 2022 | 100% |
The funds will notify shareholders in January 2024 of amounts for use in preparing 2023 income tax returns.
The Securities and Exchange Commission adopted Rule 22e-4 under the Investment Company Act of 1940 (the Liquidity Rule) to promote effective liquidity risk management throughout the open-end investment company industry, thereby reducing the risk that funds will be unable to meet their redemption obligations and mitigating dilution of the interests of fund shareholders.
The Funds have adopted and implemented a liquidity risk management program (the Program) reasonably designed to assess and manage each Fund's liquidity risk and to comply with the requirements of the Liquidity Rule. Each Fund's Board of Trustees (the Board) has designated each Fund's investment adviser as administrator of the Program. The Fidelity advisers have established a Liquidity Risk Management Committee (the LRM Committee) to manage the Program for each of the Fidelity Funds. The LRM Committee monitors the adequacy and effectiveness of implementation of the Program and on a periodic basis assesses each Fund's liquidity risk based on a variety of factors including (1) the Fund's investment strategy, (2) portfolio liquidity and cash flow projections during normal and reasonably foreseeable stressed conditions, (3) shareholder redemptions, (4) borrowings and other funding sources and (5) certain factor specific to ETFs including the effect of the Fund's prices and spreads, market participants, and basket compositions on the overall liquidity of the Fund's portfolio, as applicable.
In accordance with the Program, each of the Fund's portfolio investments is classified into one of four defined liquidity categories based on a determination of a reasonable expectation for how long it would take to convert the investment to cash (or sell or dispose of the investment) without significantly changing its market value.
- Highly liquid investments - cash or convertible to cash within three business days or less
- Moderately liquid investments - convertible to cash in three to seven calendar days
- Less liquid investments - can be sold or disposed of, but not settled, within seven calendar days
- Illiquid investments - cannot be sold or disposed of within seven calendar days
Liquidity classification determinations take into account a variety of factors including various market, trading and investment-specific considerations, as well as market depth, and generally utilize analysis from a third-party liquidity metrics service.
The Liquidity Rule places a 15% limit on a fund's illiquid investments and requires funds that do not primarily hold assets that are highly liquid investments to determine and maintain a minimum percentage of the fund's net assets to be invested in highly liquid investments (highly liquid investment minimum or HLIM). The Program includes provisions reasonably designed to comply with the 15% limit on illiquid investments and for determining, periodically reviewing and complying with the HLIM requirement as applicable.
At a recent meeting of the Fund's Board of Trustees, the LRM Committee provided a written report to the Board pertaining to the operation, adequacy, and effectiveness of the Program for the period December 1, 2021 through November 30, 2022. The report concluded that the Program is operating effectively and is reasonably designed to assess and manage the Fund's liquidity risk.
1.813633.118
SELCON-ANN-0423
Fidelity® Select Portfolios®
Health Care Sector
Biotechnology Portfolio
Health Care Portfolio
Health Care Services Portfolio
Medical Technology and Devices Portfolio
Pharmaceuticals Portfolio
Annual Report
February 28, 2023
Contents
To view a fund's proxy voting guidelines and proxy voting record for the 12-month period ended June 30, visit http://www.fidelity.com/proxyvotingresults or visit the Securities and Exchange Commission's (SEC) web site at http://www.sec.gov.
You may also call 1-800-544-8544 to request a free copy of the proxy voting guidelines.
Standard & Poor's, S&P and S&P 500 are registered service marks of The McGraw-Hill Companies, Inc. and have been licensed for use by Fidelity Distributors Corporation.
Other third-party marks appearing herein are the property of their respective owners.
All other marks appearing herein are registered or unregistered trademarks or service marks of FMR LLC or an affiliated company. © 2023 FMR LLC. All rights reserved.
This report and the financial statements contained herein are submitted for the general information of the shareholders of the Funds. This report is not authorized for distribution to prospective investors in the Funds unless preceded or accompanied by an effective prospectus.
A fund files its complete schedule of portfolio holdings with the SEC for the first and third quarters of each fiscal year on Form N-PORT. Forms N-PORT are available on the SEC's web site at http://www.sec.gov. A fund's Forms N-PORT may be reviewed and copied at the SEC's Public Reference Room in Washington, DC. Information regarding the operation of the SEC's Public Reference Room may be obtained by calling 1-800-SEC-0330.
For a complete list of a fund's portfolio holdings, view the most recent holdings listing, semiannual report, or annual report on Fidelity's web site at http://www.fidelity.com, http://www.institutional.fidelity.com, or http://www.401k.com, as applicable.
NOT FDIC INSURED •MAY LOSE VALUE •NO BANK GUARANTEE
Neither the Funds nor Fidelity Distributors Corporation is a bank.
Average annual total return reflects the change in the value of an investment, assuming reinvestment of distributions from dividend income and capital gains (the profits earned upon the sale of securities that have grown in value, if any) and assuming a constant rate of performance each year. The hypothetical investment and the average annual total returns do not reflect the deduction of taxes that a shareholder would pay on fund distributions or the redemption of fund shares. During periods of reimbursement by Fidelity, a fund's total return will be greater than it would be had the reimbursement not occurred. How a fund did yesterday is no guarantee of how it will do tomorrow.
| Average Annual Total Returns |
| | | | |
Periods ended February 28, 2023 | Past 1 year | Past 5 years | Past 10 years |
| Biotechnology Portfolio | 1.14% | 2.58% | 10.64% |
| $10,000 Over 10 Years |
| |
Let's say hypothetically that $10,000 was invested in Biotechnology Portfolio on February 28, 2013. The chart shows how the value of your investment would have changed, and also shows how the S&P 500® Index performed over the same period. |
|
|
Biotechnology Portfolio
Market Recap:
U.S. equities returned -7.69% for the 12 months ending February 28, 2023, according to the S&P 500 ® index. The new year began with an encouraging upturn in January (+6.28%), but stocks lost momentum in February (-2.44%) amid higher-than-expected inflation and strong jobs data. Investors took these as signs that the economy continued to run hot, even after a year of historic policy adjustment by the Federal Reserve aimed at cooling economic growth. Record inflation in 2022 prompted the Fed to aggressively tighten monetary policy, and market interest rates eclipsed their highest level in a decade, stoking recession fears and sending stocks into bear market territory. Since March 2022, the central bank has hiked its benchmark rate eight times, by 4.5 percentage points - the fastest-ever pace of monetary tightening - while also shrinking its massive asset portfolio. The latest bump came on February 2, along with a signal that the Fed plans to lift rates in March while it considers whether and when to pause increases. Against this dynamic backdrop, stocks struggled to gain traction until a strong rally ignited heading into the summer. But in September, the index returned -9.21%, one of its worst monthly results ever, before advancing 7.56% in Q4, as risky assets regained favor. For the full 12 months, value stocks handily outpaced growth. The headwind for the latter was most pronounced in the growth-oriented communication services (-25%) and consumer discretionary (-18%) sectors. In sharp contrast, energy gained 24%.
Comments from Portfolio Manager Rajiv Kaul:
For the fiscal year, the fund gained 1.14%, trailing the 10.57% advance of the MSCI US IMI Biotechnology 25/50 Index, but outperforming the broad-based S&P 500 ® index. Versus the industry index, security selection was the primary detractor, especially within biotechnology. We also had weak stock picks in pharmaceuticals and life sciences tools & services. The fund's biggest individual relative detractor was a lighter-than-index stake in Gilead Sciences, which gained about 39% the past year. We decreased our stake this period. Also hindering performance was an overweighting in Arcus Biosciences, which returned -51%. Also holding back performance was our lighter-than-index investment in Horizon Therapeutics, which gained 20%. Horizon Therapeutics was not held at period end. The fund's top individual relative contributor was our outsized position in Biohaven Pharmaceutical Holding, which gained 19%. The company was acquired by Pfizer in October and then spun out as a newly independent company, trading under the same ticker symbol. The fund retained a position in the new company at period end. Also lifting performance was an underweighting in Novavax, which returned -89%. Novavax was not held at period end. Another key contributor was our out-of-index position in Roivant Sciences (+28%).
The views expressed above reflect those of the portfolio manager(s) only through the end of the period as stated on the cover of this report and do not necessarily represent the views of Fidelity or any other person in the Fidelity organization. Any such views are subject to change at any time based upon market or other conditions and Fidelity disclaims any responsibility to update such views. These views may not be relied on as investment advice and, because investment decisions for a Fidelity fund are based on numerous factors, may not be relied on as an indication of trading intent on behalf of any Fidelity fund.
Biotechnology Portfolio
Top Holdings (% of Fund's net assets) |
| |
| AbbVie, Inc. | 12.6 | |
| Regeneron Pharmaceuticals, Inc. | 5.1 | |
| Vertex Pharmaceuticals, Inc. | 5.0 | |
| Alnylam Pharmaceuticals, Inc. | 5.0 | |
| Krystal Biotech, Inc. | 3.5 | |
| Argenx SE ADR | 2.9 | |
| Biogen, Inc. | 2.5 | |
| Moderna, Inc. | 2.3 | |
| Apellis Pharmaceuticals, Inc. | 2.0 | |
| Cytokinetics, Inc. | 1.7 | |
| | 42.6 | |
| |
| Industries (% of Fund's net assets) |
| |
| Biotechnology | 92.1 | |
| Pharmaceuticals | 7.1 | |
| Health Care Technology | 0.2 | |
| Health Care Providers & Services | 0.2 | |
| Health Care Equipment & Supplies | 0.1 | |
| Life Sciences Tools & Services | 0.0 | |
| Food & Staples Retailing | 0.0 | |
| |
Percentages shown as 0.0% may reflect amounts less than 0.05%.
Geographic Diversification (% of Fund's net assets) |
|
* Includes Short-Term investments and Net Other Assets (Liabilities). Percentages are based on country or territory of incorporation and are adjusted for the effect of derivatives, if applicable. |
| |
Biotechnology Portfolio
Showing Percentage of Net Assets
| Common Stocks - 98.4% |
| | | Shares | Value ($) |
| Biotechnology - 91.0% | | | |
| Biotechnology - 91.0% | | | |
| 2seventy bio, Inc. (a) | | 103,752 | 1,399,614 |
| AbbVie, Inc. | | 4,077,678 | 627,554,646 |
| Absci Corp. (a)(b) | | 993,000 | 2,105,160 |
| ADC Therapeutics SA (a) | | 546,270 | 1,966,572 |
| Adverum Biotechnologies, Inc. (a)(c) | | 7,472,259 | 5,380,026 |
| Aerovate Therapeutics, Inc. (a)(b) | | 174,813 | 4,295,155 |
| Aldeyra Therapeutics, Inc. (a)(b) | | 888,537 | 6,006,510 |
| Alector, Inc. (a) | | 1,351,818 | 11,544,526 |
| Alkermes PLC (a) | | 640,536 | 17,127,933 |
| Allena Pharmaceuticals, Inc. (a) | | 93,683 | 56 |
| Allogene Therapeutics, Inc. (a)(b) | | 1,556,685 | 9,884,950 |
| Allovir, Inc. (a)(b) | | 852,383 | 5,753,585 |
| Alnylam Pharmaceuticals, Inc. (a) | | 1,298,706 | 248,637,264 |
| ALX Oncology Holdings, Inc. (a) | | 1,280,549 | 8,477,234 |
| Ambrx Biopharma, Inc. ADR (a)(b) | | 1,361,508 | 8,754,496 |
| Amgen, Inc. | | 40,497 | 9,381,535 |
| Amicus Therapeutics, Inc. (a) | | 2,268,301 | 29,918,890 |
| AnaptysBio, Inc. (a)(b) | | 289,228 | 7,201,777 |
| Apellis Pharmaceuticals, Inc. (a)(b) | | 1,487,684 | 97,413,548 |
| Applied Therapeutics, Inc. (a)(b)(c) | | 2,639,536 | 2,665,931 |
| Arcellx, Inc. | | 643,801 | 18,032,866 |
| Arcturus Therapeutics Holdings, Inc. (a)(b) | | 794,024 | 12,902,890 |
| Arcus Biosciences, Inc. (a)(b) | | 3,193,396 | 58,151,741 |
| Arcutis Biotherapeutics, Inc. (a) | | 802,774 | 12,988,883 |
| Argenx SE ADR (a) | | 393,547 | 144,046,073 |
| Arrowhead Pharmaceuticals, Inc. (a) | | 1,337,032 | 43,186,134 |
| Ars Pharmaceuticals, Inc. (a)(b) | | 1,541,977 | 13,754,435 |
| Ascendis Pharma A/S sponsored ADR (a) | | 659,409 | 73,253,746 |
| Astria Therapeutics, Inc. (a) | | 1,177,041 | 14,336,359 |
| aTyr Pharma, Inc. (a)(b) | | 2,258,063 | 4,764,513 |
| Aura Biosciences, Inc. (a) | | 356,492 | 3,561,355 |
| Avidity Biosciences, Inc. (a)(b) | | 762,250 | 18,065,325 |
| Axcella Health, Inc. (a)(b) | | 1,661,354 | 963,918 |
| Beam Therapeutics, Inc. (a)(b) | | 669,379 | 26,935,811 |
| BeiGene Ltd. ADR (a) | | 37,198 | 8,355,787 |
| BELLUS Health, Inc. (a) | | 1,621,196 | 12,483,209 |
| Bicycle Therapeutics PLC ADR (a)(b) | | 377,647 | 8,583,916 |
| BioCryst Pharmaceuticals, Inc. (a)(b) | | 2,693,042 | 23,833,422 |
| Biogen, Inc. (a) | | 467,336 | 126,115,293 |
| Biohaven Ltd. (a)(b) | | 2,038,409 | 31,146,890 |
| BioInvent International AB (a) | | 153,043 | 423,251 |
| BioMarin Pharmaceutical, Inc. (a) | | 402,236 | 40,058,683 |
| Biomea Fusion, Inc. (a)(b) | | 358,129 | 4,598,376 |
| BioNTech SE ADR | | 60,750 | 7,900,538 |
| BioXcel Therapeutics, Inc. (a)(b) | | 351,727 | 11,227,126 |
| Blueprint Medicines Corp. (a) | | 1,254,408 | 53,149,267 |
| BridgeBio Pharma, Inc. (a)(b) | | 820,042 | 9,364,880 |
| Candel Therapeutics, Inc. (a)(b) | | 716,096 | 1,288,973 |
| Celldex Therapeutics, Inc. (a) | | 819,700 | 35,074,963 |
| Centessa Pharmaceuticals PLC ADR (a)(b) | | 1,230,909 | 4,332,800 |
| Century Therapeutics, Inc. (a) | | 834,618 | 3,764,127 |
| Cerevel Therapeutics Holdings (a) | | 1,028,280 | 27,444,793 |
| Chinook Therapeutics, Inc. (a)(b) | | 303,781 | 6,628,501 |
| Chinook Therapeutics, Inc. rights (a)(d) | | 115,821 | 1 |
| Codiak Biosciences, Inc. (a)(b) | | 448,539 | 215,299 |
| Codiak Biosciences, Inc. warrants 9/15/27 (a) | | 46,000 | 2,611 |
| Cogent Biosciences, Inc. (a) | | 1,096,367 | 14,504,935 |
| Compass Therapeutics, Inc. (a)(b) | | 1,709,500 | 6,479,005 |
| Crinetics Pharmaceuticals, Inc. (a) | | 891,534 | 17,509,728 |
| CRISPR Therapeutics AG (a)(b) | | 295,222 | 14,560,349 |
| Cyclerion Therapeutics, Inc. (a) | | 837,285 | 545,073 |
| Cyclerion Therapeutics, Inc. (a)(e) | | 94,809 | 61,721 |
| Cytokinetics, Inc. (a)(b) | | 1,922,671 | 83,367,015 |
| Day One Biopharmaceuticals, Inc. (a) | | 664,771 | 12,245,082 |
| Denali Therapeutics, Inc. (a) | | 333,369 | 9,050,968 |
| Design Therapeutics, Inc. (a)(b) | | 1,119,405 | 7,914,193 |
| Disc Medicine, Inc. (a)(b) | | 155,590 | 3,889,750 |
| Disc Medicine, Inc. rights (a)(b)(d) | | 1,555,907 | 16 |
| Dyne Therapeutics, Inc. (a) | | 380,913 | 4,906,159 |
| Enanta Pharmaceuticals, Inc. (a) | | 212,946 | 10,327,881 |
| Entrada Therapeutics, Inc. (a)(b) | | 503,853 | 6,424,126 |
| EQRx, Inc. (a) | | 507,567 | 1,147,101 |
| EQRx, Inc.: | | | |
| rights (a)(d) | | 116,649 | 75,822 |
| rights (a)(d) | | 49,993 | 22,497 |
| Erasca, Inc. (a)(b) | | 583,402 | 2,100,247 |
| Evelo Biosciences, Inc. (a)(b) | | 1,098,999 | 681,269 |
| Exact Sciences Corp. (a) | | 27,000 | 1,682,910 |
| Exelixis, Inc. (a) | | 1,040,134 | 17,765,489 |
| Fate Therapeutics, Inc. (a) | | 516,787 | 3,162,736 |
| FibroGen, Inc. (a) | | 76,500 | 1,698,300 |
| Foghorn Therapeutics, Inc. (a)(b) | | 178,719 | 1,024,060 |
| Fusion Pharmaceuticals, Inc. (a) | | 1,142,702 | 5,050,743 |
| Fusion Pharmaceuticals, Inc. (e) | | 1,483,000 | 5,899,374 |
| Generation Bio Co. (a) | | 137,100 | 542,916 |
| Geron Corp. (a) | | 3,753,406 | 10,434,469 |
| Geron Corp. warrants 12/31/25 (a) | | 2,100,000 | 1,828,679 |
| Gilead Sciences, Inc. | | 558,701 | 44,992,192 |
| Gritstone Bio, Inc. (a) | | 669,785 | 1,640,973 |
| Halozyme Therapeutics, Inc. (a) | | 478,800 | 22,977,612 |
| Hookipa Pharma, Inc. (a) | | 1,480,200 | 1,280,373 |
| Icosavax, Inc. (a)(b) | | 788,357 | 6,448,760 |
| Ideaya Biosciences, Inc. (a)(b) | | 647,657 | 11,431,146 |
| Idorsia Ltd. (a)(b) | | 1,092,661 | 14,455,121 |
| IGM Biosciences, Inc. (a)(b) | | 690,509 | 14,514,499 |
| Immuneering Corp. (a)(b) | | 476,458 | 2,329,880 |
| Immunocore Holdings PLC ADR (a) | | 248,518 | 13,631,212 |
| ImmunoGen, Inc. (a) | | 922,023 | 3,577,449 |
| Incyte Corp. (a) | | 434,700 | 33,463,206 |
| Inhibrx, Inc. (a)(b) | | 210,609 | 5,067,253 |
| Inozyme Pharma, Inc. (a) | | 640,812 | 1,813,498 |
| Insmed, Inc. (a) | | 412,092 | 8,398,435 |
| Instil Bio, Inc. (a) | | 1,173,143 | 911,649 |
| Intellia Therapeutics, Inc. (a) | | 885,001 | 35,550,490 |
| Ionis Pharmaceuticals, Inc. (a) | | 987,777 | 35,461,194 |
| Iovance Biotherapeutics, Inc. (a) | | 136,800 | 997,272 |
| iTeos Therapeutics, Inc. (a) | | 211,500 | 3,745,665 |
| Iveric Bio, Inc. (a) | | 356,209 | 7,402,023 |
| Janux Therapeutics, Inc. (a)(b) | | 498,148 | 8,284,201 |
| Karuna Therapeutics, Inc. (a) | | 328,542 | 65,517,846 |
| Keros Therapeutics, Inc. (a) | | 466,029 | 24,802,063 |
| Kiniksa Pharmaceuticals Ltd. (a) | | 177,166 | 2,278,355 |
| Kinnate Biopharma, Inc. (a) | | 979,677 | 5,172,695 |
| Kronos Bio, Inc. (a)(b) | | 279,857 | 486,951 |
| Krystal Biotech, Inc. (a)(c) | | 2,097,722 | 171,824,409 |
| Kymera Therapeutics, Inc. (a)(b) | | 647,713 | 20,325,234 |
| Legend Biotech Corp. ADR (a) | | 839,216 | 38,754,995 |
| Madrigal Pharmaceuticals, Inc. (a) | | 153,340 | 41,556,673 |
| MannKind Corp. (a)(b) | | 6,449,301 | 34,052,309 |
| Merus BV (a)(b) | | 597,056 | 11,385,858 |
| Mirati Therapeutics, Inc. (a)(b) | | 321,748 | 14,748,928 |
| Moderna, Inc. (a) | | 822,986 | 114,238,687 |
| Monte Rosa Therapeutics, Inc. (a)(b) | | 1,257,805 | 7,647,454 |
| Morphic Holding, Inc. (a) | | 809,437 | 34,417,261 |
| Natera, Inc. (a) | | 356,133 | 17,290,257 |
| Nkarta, Inc. (a)(b) | | 63,730 | 267,666 |
| Nurix Therapeutics, Inc. (a)(b) | | 739,346 | 6,972,033 |
| Nuvalent, Inc. Class A (a) | | 218,574 | 6,620,606 |
| Omega Therapeutics, Inc. (a)(b) | | 1,088,551 | 7,032,039 |
| Oragenics, Inc. (a) | | 2,596 | 11,942 |
| PepGen, Inc. | | 440,591 | 6,727,825 |
| Poseida Therapeutics, Inc. (a) | | 570,083 | 3,243,772 |
| Prelude Therapeutics, Inc. (a) | | 359,156 | 2,032,823 |
| Prime Medicine, Inc. (b) | | 53,800 | 883,934 |
| Prometheus Biosciences, Inc. (a) | | 397,555 | 48,656,756 |
| Prothena Corp. PLC (a) | | 933,189 | 52,034,619 |
| PTC Therapeutics, Inc. (a) | | 1,621,544 | 70,812,826 |
| Rallybio Corp. (a)(b) | | 1,550,692 | 12,203,946 |
| RAPT Therapeutics, Inc. (a) | | 724,582 | 21,338,940 |
| Recursion Pharmaceuticals, Inc. (a) | | 89,200 | 726,980 |
| Regeneron Pharmaceuticals, Inc. (a) | | 333,148 | 253,332,402 |
| Regulus Therapeutics, Inc. (a)(b)(c) | | 2,195,000 | 2,941,300 |
| Relay Therapeutics, Inc. (a)(b) | | 632,189 | 10,209,852 |
| Repare Therapeutics, Inc. (a)(b) | | 174,960 | 1,793,340 |
| Replimune Group, Inc. (a) | | 1,121,714 | 24,565,537 |
| Revolution Medicines, Inc. (a) | | 517,472 | 13,847,551 |
| Rezolute, Inc. (a) | | 200 | 496 |
| Rhythm Pharmaceuticals, Inc. (a)(b) | | 752,703 | 18,298,210 |
| Rocket Pharmaceuticals, Inc. (a) | | 223,736 | 4,297,969 |
| Roivant Sciences Ltd. (a) | | 6,582,325 | 53,251,009 |
| Sage Therapeutics, Inc. (a) | | 989,753 | 41,213,315 |
| Sarepta Therapeutics, Inc. (a) | | 552,604 | 67,489,527 |
| Scholar Rock Holding Corp. (a)(b) | | 1,693,925 | 14,533,877 |
| Scholar Rock Holding Corp. warrants 12/31/25 (a)(e) | | 17,850 | 64,915 |
| Seagen, Inc. (a) | | 420,136 | 75,494,238 |
| Selecta Biosciences, Inc. (a) | | 395,568 | 644,776 |
| Sensorion SA (a)(b) | | 1,973,044 | 813,887 |
| Seres Therapeutics, Inc. (a)(b) | | 854,347 | 4,314,452 |
| Shattuck Labs, Inc. (a) | | 110,936 | 523,618 |
| SpringWorks Therapeutics, Inc. (a)(b) | | 463,611 | 14,789,191 |
| SpringWorks Therapeutics, Inc. (e) | | 54,800 | 1,573,308 |
| Stoke Therapeutics, Inc. (a) | | 146,536 | 1,302,705 |
| Sutro Biopharma, Inc. (a) | | 304,500 | 1,717,380 |
| Tango Therapeutics, Inc. (a) | | 1,289,988 | 6,746,637 |
| Taysha Gene Therapies, Inc. (a)(b) | | 811,647 | 819,763 |
| Tenaya Therapeutics, Inc. (a) | | 2,081,279 | 6,389,527 |
| TG Therapeutics, Inc. (a)(b) | | 1,718,820 | 27,535,496 |
| Travere Therapeutics, Inc. (a) | | 167,028 | 3,701,340 |
| Twist Bioscience Corp. (a) | | 681,332 | 13,258,721 |
| Tyra Biosciences, Inc. (a) | | 301,101 | 3,977,544 |
| Ultragenyx Pharmaceutical, Inc. (a) | | 876,351 | 38,988,856 |
| uniQure B.V. (a) | | 255,608 | 5,357,544 |
| United Therapeutics Corp. (a) | | 269,569 | 66,324,757 |
| Vaxcyte, Inc. (a) | | 1,319,350 | 54,053,770 |
| Vera Therapeutics, Inc. (a)(b) | | 910,368 | 6,764,034 |
| Vertex Pharmaceuticals, Inc. (a) | | 861,862 | 250,189,920 |
| Verve Therapeutics, Inc. (a)(b) | | 348,293 | 6,617,567 |
| Vigil Neuroscience, Inc. (a)(b) | | 86,610 | 1,039,320 |
| Viking Therapeutics, Inc. (a) | | 25,000 | 275,250 |
| Viridian Therapeutics, Inc. (a) | | 60,700 | 1,988,532 |
| Vor Biopharma, Inc. (a)(b) | | 1,194,902 | 6,667,553 |
| Werewolf Therapeutics, Inc. (a) | | 2,100 | 6,059 |
| X4 Pharmaceuticals, Inc. warrants 4/12/24 (a) | | 450,000 | 5 |
| Xencor, Inc. (a) | | 179,643 | 5,771,930 |
| Xenon Pharmaceuticals, Inc. (a) | | 977,333 | 38,565,560 |
| Zealand Pharma A/S (a) | | 776,333 | 24,755,988 |
| Zentalis Pharmaceuticals, Inc. (a) | | 638,433 | 12,085,537 |
| | | | 4,522,643,626 |
| Food & Staples Retailing - 0.0% | | | |
| Drug Retail - 0.0% | | | |
| MedAvail Holdings, Inc. (a) | | 2,777 | 1,032 |
| Health Care Equipment & Supplies - 0.1% | | | |
| Health Care Equipment - 0.1% | | | |
| Alpha Tau Medical Ltd. Class A (a)(b) | | 362,046 | 1,144,065 |
| Novocure Ltd. (a) | | 11,113 | 855,368 |
| | | | 1,999,433 |
| Health Care Providers & Services - 0.1% | | | |
| Health Care Services - 0.1% | | | |
| 23andMe Holding Co. Class A (a)(b) | | 1,488,074 | 3,735,066 |
| Health Care Technology - 0.2% | | | |
| Health Care Technology - 0.2% | | | |
| Akili, Inc. (a)(b) | | 1,500 | 2,475 |
| Schrodinger, Inc. (a) | | 539,101 | 11,714,665 |
| | | | 11,717,140 |
| Life Sciences Tools & Services - 0.0% | | | |
| Life Sciences Tools & Services - 0.0% | | | |
| Olink Holding AB ADR (a) | | 53,800 | 1,261,072 |
| Pharmaceuticals - 7.0% | | | |
| Pharmaceuticals - 7.0% | | | |
| Acelyrin, Inc. (d) | | 2,378,678 | 14,795,615 |
| Acelyrin, Inc. rights (a)(d) | | 289,045 | 1,713,028 |
| Adimab LLC (a)(d)(e)(f) | | 1,954,526 | 79,959,659 |
| Afferent Pharmaceuticals, Inc. rights 12/31/24 (a)(d) | | 8,274,568 | 9,184,770 |
| Aradigm Corp. (a)(d) | | 11,945 | 549 |
| Aradigm Corp. (a)(d) | | 148,009 | 6,808 |
| Arvinas Holding Co. LLC (a) | | 297,316 | 9,112,735 |
| Atea Pharmaceuticals, Inc. (a) | | 66,800 | 236,472 |
| Axsome Therapeutics, Inc. (a)(b) | | 369,673 | 25,208,002 |
| Corcept Therapeutics, Inc. (a) | | 88,400 | 1,841,372 |
| DICE Therapeutics, Inc. (a) | | 338,246 | 10,093,261 |
| Edgewise Therapeutics, Inc. (a) | | 1,177,285 | 11,278,390 |
| Fulcrum Therapeutics, Inc. (a)(b) | | 1,448,597 | 8,749,526 |
| GH Research PLC (a)(b) | | 893,124 | 8,556,128 |
| Harmony Biosciences Holdings, Inc. (a) | | 124,525 | 5,482,836 |
| Ikena Oncology, Inc. (a) | | 416,547 | 1,670,353 |
| Intra-Cellular Therapies, Inc. (a) | | 464,276 | 22,763,452 |
| Longboard Pharmaceuticals, Inc. (a) | | 869,289 | 4,520,303 |
| Nuvation Bio, Inc. (a) | | 2,913,126 | 5,651,464 |
| Ocular Therapeutix, Inc. (a) | | 45,654 | 275,750 |
| OptiNose, Inc. (a)(b) | | 794,031 | 1,429,256 |
| OptiNose, Inc. warrants (a) | | 91,712 | 60,319 |
| Pharvaris BV (a) | | 353,507 | 2,937,643 |
| Pliant Therapeutics, Inc. (a) | | 314,631 | 10,024,144 |
| Rain Oncology, Inc. (a)(b) | | 349,069 | 3,124,168 |
| Reata Pharmaceuticals, Inc. (a)(b) | | 116,773 | 3,639,814 |
| Royalty Pharma PLC | | 52,920 | 1,897,182 |
| Structure Therapeutics, Inc. ADR (b) | | 301,997 | 7,719,043 |
| Terns Pharmaceuticals, Inc. (a) | | 1,140,467 | 11,552,931 |
| Theseus Pharmaceuticals, Inc. (a)(b) | | 1,343,694 | 12,469,480 |
| UCB SA | | 95,777 | 8,244,065 |
| Ventyx Biosciences, Inc. (a) | | 785,545 | 33,974,821 |
| Verona Pharma PLC ADR (a) | | 548,295 | 11,755,445 |
| Verrica Pharmaceuticals, Inc. (a)(b) | | 1,451,876 | 11,252,039 |
| WAVE Life Sciences (a)(b) | | 1,477,633 | 6,206,059 |
| | | | 347,386,882 |
| TOTAL COMMON STOCKS (Cost $3,731,521,360) | | | 4,888,744,251 |
| | | | |
| Convertible Preferred Stocks - 1.3% |
| | | Shares | Value ($) |
| Biotechnology - 1.1% | | | |
| Biotechnology - 1.1% | | | |
| ElevateBio LLC Series C (a)(d)(e) | | 216,600 | 688,788 |
| Korro Bio, Inc.: | | | |
| Series B1 (a)(d)(e) | | 957,854 | 2,059,386 |
| Series B2 (a)(d)(e) | | 899,280 | 1,978,416 |
| National Resilience, Inc. Series B (a)(d)(e) | | 732,064 | 44,458,247 |
| SalioGen Therapeutics, Inc. Series B (a)(d)(e) | | 94,461 | 7,047,735 |
| | | | 56,232,572 |
| Health Care Providers & Services - 0.1% | | | |
| Health Care Services - 0.1% | | | |
| Scorpion Therapeutics, Inc. Series B (a)(d)(e) | | 3,099,905 | 4,804,853 |
| Pharmaceuticals - 0.1% | | | |
| Pharmaceuticals - 0.1% | | | |
| Afferent Pharmaceuticals, Inc. Series C (a)(d)(e) | | 8,274,568 | 83 |
| Aristea Therapeutics, Inc. Series B (a)(d)(e) | | 836,400 | 4,608,564 |
| | | | 4,608,647 |
| TOTAL CONVERTIBLE PREFERRED STOCKS (Cost $38,020,306) | | | 65,646,072 |
| | | | |
| Money Market Funds - 7.5% |
| | | Shares | Value ($) |
| Fidelity Cash Central Fund 4.63% (g) | | 16,572,078 | 16,575,392 |
| Fidelity Securities Lending Cash Central Fund 4.63% (g)(h) | | 353,586,391 | 353,621,750 |
| TOTAL MONEY MARKET FUNDS (Cost $370,163,501) | | | 370,197,142 |
| | | | |
| TOTAL INVESTMENT IN SECURITIES - 107.2% (Cost $4,139,705,167) | 5,324,587,465 |
NET OTHER ASSETS (LIABILITIES) - (7.2)% | (355,480,379) |
| NET ASSETS - 100.0% | 4,969,107,086 |
| | |
Legend
| (b) | Security or a portion of the security is on loan at period end. |
| (e) | Restricted securities (including private placements) - Investment in securities not registered under the Securities Act of 1933 (excluding 144A issues). At the end of the period, the value of restricted securities (excluding 144A issues) amounted to $153,205,049 or 3.1% of net assets. |
| (f) | Investment is owned by a wholly-owned subsidiary (Subsidiary) that is treated as a corporation for U.S. tax purposes. |
| (g) | Affiliated fund that is generally available only to investment companies and other accounts managed by Fidelity Investments. The rate quoted is the annualized seven-day yield of the fund at period end. A complete unaudited listing of the fund's holdings as of its most recent quarter end is available upon request. In addition, each Fidelity Central Fund's financial statements, which are not covered by the Fund's Report of Independent Registered Public Accounting Firm, are available on the SEC's website or upon request. |
| (h) | Investment made with cash collateral received from securities on loan. |
| Additional information on each restricted holding is as follows: |
| Security | Acquisition Date | Acquisition Cost ($) |
| Adimab LLC | 9/17/14 - 6/05/15 | 31,091,029 |
| | | |
| Afferent Pharmaceuticals, Inc. Series C | 7/01/15 | 0 |
| | | |
| Aristea Therapeutics, Inc. Series B | 10/06/20 | 4,611,659 |
| | | |
| Cyclerion Therapeutics, Inc. | 4/02/19 | 1,404,026 |
| | | |
| ElevateBio LLC Series C | 3/09/21 | 908,637 |
| | | |
| Fusion Pharmaceuticals, Inc. | 2/13/23 | 5,042,200 |
| | | |
| Korro Bio, Inc. Series B1 | 12/17/21 | 2,499,999 |
| | | |
| Korro Bio, Inc. Series B2 | 12/17/21 | 2,499,998 |
| | | |
| National Resilience, Inc. Series B | 12/01/20 | 9,999,994 |
| | | |
| SalioGen Therapeutics, Inc. Series B | 12/10/21 | 10,000,019 |
| | | |
| Scholar Rock Holding Corp. warrants 12/31/25 | 6/17/22 | 0 |
| | | |
| Scorpion Therapeutics, Inc. Series B | 1/08/21 | 7,500,000 |
| | | |
| SpringWorks Therapeutics, Inc. | 9/07/22 | 1,425,348 |
| | | |
Affiliated Central Funds
Fiscal year to date information regarding the Fund's investments in Fidelity Central Funds, including the ownership percentage, is presented below.
| Affiliate | Value, beginning of period ($) | Purchases ($) | Sales Proceeds ($) | Dividend Income ($) | Realized Gain (loss) ($) | Change in Unrealized appreciation (depreciation) ($) | Value, end of period ($) | % ownership, end of period |
| Fidelity Cash Central Fund 4.63% | 42,446,755 | 1,036,118,462 | 1,061,989,825 | 598,495 | 3,258 | (3,258) | 16,575,392 | 0.0% |
| Fidelity Securities Lending Cash Central Fund 4.63% | 492,109,261 | 2,216,802,618 | 2,355,290,129 | 7,098,036 | - | - | 353,621,750 | 1.1% |
| Total | 534,556,016 | 3,252,921,080 | 3,417,279,954 | 7,696,531 | 3,258 | (3,258) | 370,197,142 | |
| | | | | | | | | |
Amounts in the dividend income column in the above table include any capital gain distributions from underlying funds, which are presented in the corresponding line item in the Statement of Operations, if applicable.
Amount for Fidelity Securities Lending Cash Central Fund represents the income earned on investing cash collateral, less rebates paid to borrowers and any lending agent fees associated with the loan, plus any premium payments received for lending certain types of securities.
Amounts included in the purchases and sales proceeds columns may include in-kind transactions, if applicable.
Other Affiliated Issuers
An affiliated company is a company in which the Fund has ownership of at least 5% of the voting securities. Fiscal year to date transactions with companies which are or were affiliates are presented in the table below. Certain corporate actions, such as mergers, are excluded from the amounts in this table if applicable. A dash in the Value end of period ($) column means either the issuer is no longer held at period end, or the issuer is held at period end but is no longer an affiliate.
| Affiliate | Value, beginning of period ($) | Purchases ($) | Sales Proceeds ($) | Dividend Income ($) | Realized Gain (loss) ($) | Change in Unrealized appreciation (depreciation) ($) | Value, end of period ($) |
| Adverum Biotechnologies, Inc. | - | 14,311,388 | 2,132,127 | - | (2,107,259) | (4,691,976) | 5,380,026 |
| Applied Therapeutics, Inc. | 1,070,923 | 2,575,660 | 1,176,547 | - | (14,439,872) | 14,635,767 | 2,665,931 |
| Candel Therapeutics, Inc. | 8,593,545 | - | 6,186,049 | - | (4,771,678) | 3,653,155 | - |
| Krystal Biotech, Inc. | 126,760,516 | 6,531,325 | 631,314 | - | 13,464 | 39,150,418 | 171,824,409 |
| Regulus Therapeutics, Inc. | - | 4,631,450 | - | - | - | (1,690,150) | 2,941,300 |
| Total | 136,424,984 | 28,049,823 | 10,126,037 | - | (21,305,345) | 51,057,214 | 182,811,666 |
Amounts included in the purchases and sales proceeds columns may include in-kind transactions, if applicable.
Investment Valuation
The following is a summary of the inputs used, as of February 28, 2023, involving the Fund's assets and liabilities carried at fair value. The inputs or methodology used for valuing securities may not be an indication of the risk associated with investing in those securities. For more information on valuation inputs, and their aggregation into the levels used below, please refer to the Investment Valuation section in the accompanying Notes to Financial Statements.
| Valuation Inputs at Reporting Date: |
| Description | Total ($) | Level 1 ($) | Level 2 ($) | Level 3 ($) |
Investments in Securities: | | | | |
|
| Common Stocks | 4,888,744,251 | 4,773,556,275 | 9,429,211 | 105,758,765 |
|
| Convertible Preferred Stocks | 65,646,072 | - | - | 65,646,072 |
|
| Money Market Funds | 370,197,142 | 370,197,142 | - | - |
| Total Investments in Securities: | 5,324,587,465 | 5,143,753,417 | 9,429,211 | 171,404,837 |
The following is a reconciliation of Investments in Securities for which Level 3 inputs were used in determining value:
| |
| Investments in Securities: | |
| Common Stocks | | | |
| Beginning Balance | $ | 90,662,671 | |
| Net Realized Gain (Loss) on Investment Securities | | 109,862 | |
| Net Unrealized Gain (Loss) on Investment Securities | | 4,185,734 | |
| Cost of Purchases | | 23,265 | |
| Proceeds of Sales | | (109,876) | |
| Amortization/Accretion | | - | |
| Transfers into Level 3 | | 10,887,109 | |
| Transfers out of Level 3 | | - | |
| Ending Balance | $ | 105,758,765 | |
| The change in unrealized gain (loss) for the period attributable to Level 3 securities held at February 28, 2023 | $ | 4,185,734 | |
| Convertible Preferred Stocks | | | |
| Beginning Balance | $ | 80,070,979 | |
| Net Realized Gain (Loss) on Investment Securities | | - | |
| Net Unrealized Gain (Loss) on Investment Securities | | (3,537,798) | |
| Cost of Purchases | | - | |
| Proceeds of Sales | | - | |
| Amortization/Accretion | | - | |
| Transfers into Level 3 | | - | |
| Transfers out of Level 3 | | (10,887,109) | |
| Ending Balance | $ | 65,646,072 | |
| The change in unrealized gain (loss) for the period attributable to Level 3 securities held at February 28, 2023 | $ | (3,537,798) | |
| The information used in the above reconciliation represents fiscal year to date activity for any Investments in Securities identified as using Level 3 inputs at either the beginning or the end of the current fiscal period. Cost of purchases and proceeds of sales may include securities received and/or delivered through in-kind transactions. Transfers into Level 3 were attributable to a lack of observable market data resulting from decreases in market activity, decreases in liquidity, security restructurings or corporate actions. Transfers out of Level 3 were attributable to observable market data becoming available for those securities. Transfers in or out of Level 3 represent the beginning value of any Security or Instrument where a change in the pricing level occurred from the beginning to the end of the period. The cost of purchases and the proceeds of sales may include securities received or delivered through corporate actions or exchanges. Realized and unrealized gains (losses) disclosed in the reconciliation are included in Net Gain (Loss) on the Fund's Statement of Operations. | |
Biotechnology Portfolio
| Statement of Assets and Liabilities |
| | | | February 28, 2023 |
| | | | | |
| Assets | | | | |
| Investment in securities, at value (including securities loaned of $342,668,967) - See accompanying schedule: | | | | |
Unaffiliated issuers (cost $3,666,478,431) | $ | 4,771,578,657 | | |
Fidelity Central Funds (cost $370,163,501) | | 370,197,142 | | |
Other affiliated issuers (cost $103,063,235) | | 182,811,666 | | |
| | | | | |
| | | | | |
| Total Investment in Securities (cost $4,139,705,167) | | | $ | 5,324,587,465 |
| Foreign currency held at value (cost $748) | | | | 748 |
| Receivable for investments sold | | | | 34,503,570 |
| Receivable for fund shares sold | | | | 199,281 |
| Dividends receivable | | | | 284,333 |
| Distributions receivable from Fidelity Central Funds | | | | 340,399 |
| Prepaid expenses | | | | 26,248 |
| Other receivables | | | | 1,094,128 |
Total assets | | | | 5,361,036,172 |
| Liabilities | | | | |
| Payable for investments purchased | $ | 31,855,192 | | |
| Payable for fund shares redeemed | | 2,427,899 | | |
| Accrued management fee | | 2,245,745 | | |
| Other affiliated payables | | 771,070 | | |
| Other payables and accrued expenses | | 1,168,498 | | |
| Collateral on securities loaned | | 353,460,682 | | |
| Total Liabilities | | | | 391,929,086 |
| Net Assets | | | $ | 4,969,107,086 |
| Net Assets consist of: | | | | |
| Paid in capital | | | $ | 4,464,873,986 |
| Total accumulated earnings (loss) | | | | 504,233,100 |
| Net Assets | | | $ | 4,969,107,086 |
Net Asset Value , offering price and redemption price per share ($4,969,107,086 ÷ 311,304,219 shares) | | | $ | 15.96 |
| Statement of Operations |
| | | | Year ended February 28, 2023 |
| Investment Income | | | | |
| Dividends | | | $ | 26,156,334 |
| Income from Fidelity Central Funds (including $7,098,036 from security lending) | | | | 7,696,531 |
| Total Income | | | | 33,852,865 |
| Expenses | | | | |
| Management fee | $ | 26,913,334 | | |
| Transfer agent fees | | 8,279,353 | | |
| Accounting fees | | 993,571 | | |
| Custodian fees and expenses | | 137,419 | | |
| Independent trustees' fees and expenses | | 17,490 | | |
| Registration fees | | 67,130 | | |
| Audit | | 116,132 | | |
| Legal | | 4,678 | | |
| Miscellaneous | | 37,989 | | |
| Total expenses before reductions | | 36,567,096 | | |
| Expense reductions | | (185,851) | | |
| Total expenses after reductions | | | | 36,381,245 |
| Net Investment income (loss) | | | | (2,528,380) |
| Realized and Unrealized Gain (Loss) | | | | |
| Net realized gain (loss) on: | | | | |
| Investment Securities: | | | | |
| Unaffiliated issuers | | (525,539,837) | | |
| Fidelity Central Funds | | 3,258 | | |
| Other affiliated issuers | | (21,305,345) | | |
| Foreign currency transactions | | (13,547) | | |
| Total net realized gain (loss) | | | | (546,855,471) |
| Change in net unrealized appreciation (depreciation) on: | | | | |
| Investment Securities: | | | | |
| Unaffiliated issuers | | 557,700,901 | | |
| Fidelity Central Funds | | (3,258) | | |
| Other affiliated issuers | | 51,057,214 | | |
| Assets and liabilities in foreign currencies | | (8,889) | | |
| Total change in net unrealized appreciation (depreciation) | | | | 608,745,968 |
| Net gain (loss) | | | | 61,890,497 |
| Net increase (decrease) in net assets resulting from operations | | | $ | 59,362,117 |
| Statement of Changes in Net Assets |
| |
| | Year ended February 28, 2023 | | Year ended February 28, 2022 |
| Increase (Decrease) in Net Assets | | | | |
| Operations | | | | |
| Net investment income (loss) | $ | (2,528,380) | $ | (10,105,462) |
| Net realized gain (loss) | | (546,855,471) | | 288,016,862 |
| Change in net unrealized appreciation (depreciation) | | 608,745,968 | | (2,639,724,294) |
| Net increase (decrease) in net assets resulting from operations | | 59,362,117 | | (2,361,812,894) |
| Distributions to shareholders | | - | | (951,630,731) |
| Share transactions | | | | |
| Proceeds from sales of shares | | 544,996,692 | | 514,676,797 |
| Reinvestment of distributions | | - | | 898,472,847 |
| Cost of shares redeemed | | (915,943,690) | | (1,692,638,148) |
Net increase (decrease) in net assets resulting from share transactions | | (370,946,998) | | (279,488,504) |
| Total increase (decrease) in net assets | | (311,584,881) | | (3,592,932,129) |
| | | | | |
| Net Assets | | | | |
| Beginning of period | | 5,280,691,967 | | 8,873,624,096 |
| End of period | $ | 4,969,107,086 | $ | 5,280,691,967 |
| | | | | |
| Other Information | | | | |
| Shares | | | | |
| Sold | | 35,714,869 | | 24,447,337 |
| Issued in reinvestment of distributions | | - | | 43,520,026 |
| Redeemed | | (58,965,046) | | (81,104,304) |
| Net increase (decrease) | | (23,250,177) | | (13,136,941) |
| | | | | |
Financial Highlights
| Years ended February 28, | | 2023 | | 2022 | | 2021 | | 2020 A | | 2019 B |
Selected Per-Share Data | | | | | | | | | | |
| Net asset value, beginning of period | $ | 15.78 | $ | 25.52 | $ | 21.02 | $ | 21.14 | $ | 23.45 |
| Income from Investment Operations | | | | | | | | | | |
Net investment income (loss) C,D | | (.01) | | (.03) | | (.01) | | .05 | | (.04) |
| Net realized and unrealized gain (loss) | | .19 | | (6.91) | | 9.41 | | 1.79 | | (.29) E |
| Total from investment operations | | .18 | | (6.94) | | 9.40 | | 1.84 | | (.33) |
| Distributions from net investment income | | - | | (.03) | | (.07) | | (.03) | | - |
| Distributions from net realized gain | | - | | (2.77) | | (4.84) | | (1.93) | | (1.98) |
| Total distributions | | - | | (2.80) | | (4.90) F | | (1.96) | | (1.98) |
| Net asset value, end of period | $ | 15.96 | $ | 15.78 | $ | 25.52 | $ | 21.02 | $ | 21.14 |
Total Return G | | 1.14% | | (29.49)% | | 47.35% | | 8.57% | | (.46)% E |
Ratios to Average Net Assets D,H,I | | | | | | | | | | |
| Expenses before reductions | | .72% | | .69% | | .70% | | .72% | | .72% |
| Expenses net of fee waivers, if any | | .71% | | .69% | | .70% | | .72% | | .72% |
| Expenses net of all reductions | | .71% | | .69% | | .69% | | .72% | | .72% |
| Net investment income (loss) | | (.05)% | | (.14)% | | (.03)% | | .22% | | (.20)% |
| Supplemental Data | | | | | | | | | | |
| Net assets, end of period (000 omitted) | $ | 4,969,107 | $ | 5,280,692 | $ | 8,873,624 | $ | 6,624,752 | $ | 7,583,722 |
Portfolio turnover rate J | | 51% | | 46% | | 78% | | 50% | | 37% |
A For the year ended February 29.
B Per share amounts have been adjusted to reflect the impact of the 10 for 1 share split that occurred on August 10, 2018.
C Calculated based on average shares outstanding during the period.
D Net investment income (loss) is affected by the timing of the declaration of dividends by any underlying mutual funds or exchange-traded funds (ETFs). Net investment income (loss) of any mutual funds or ETFs is not included in the Fund's net investment income (loss) ratio.
E Net realized and unrealized gain (loss) per share reflects proceeds received from litigation which amounted to $.01 per share. Excluding these litigation proceeds, the total return would have been (.53)%.
F Total distributions per share do not sum due to rounding.
G Total returns would have been lower if certain expenses had not been reduced during the applicable periods shown.
H Fees and expenses of any underlying mutual funds or exchange-traded funds (ETFs) are not included in the Fund's expense ratio. The Fund indirectly bears its proportionate share of these expenses. For additional expense information related to investments in Fidelity Central Funds, please refer to the "Investments in Fidelity Central Funds" note found in the Notes to Financial Statements section of the most recent Annual or Semi-Annual report.
I Expense ratios reflect operating expenses of the class. Expenses before reductions do not reflect amounts reimbursed, waived, or reduced through arrangements with the investment adviser, brokerage services, or other offset arrangements, if applicable, and do not represent the amount paid by the class during periods when reimbursements, waivers or reductions occur.
J Amount does not include the portfolio activity of any underlying mutual funds or exchange-traded funds (ETFs).
Average annual total return reflects the change in the value of an investment, assuming reinvestment of distributions from dividend income and capital gains (the profits earned upon the sale of securities that have grown in value, if any) and assuming a constant rate of performance each year. The hypothetical investment and the average annual total returns do not reflect the deduction of taxes that a shareholder would pay on fund distributions or the redemption of fund shares. During periods of reimbursement by Fidelity, a fund's total return will be greater than it would be had the reimbursement not occurred. How a fund did yesterday is no guarantee of how it will do tomorrow.
| Average Annual Total Returns |
| | | | |
Periods ended February 28, 2023 | Past 1 year | Past 5 years | Past 10 years |
| Health Care Portfolio | -2.05% | 9.82% | 14.38% |
| $10,000 Over 10 Years |
| |
Let's say hypothetically that $10,000 was invested in Health Care Portfolio on February 28, 2013. The chart shows how the value of your investment would have changed, and also shows how the S&P 500® Index performed over the same period. |
|
|
Health Care Portfolio
Market Recap:
U.S. equities returned -7.69% for the 12 months ending February 28, 2023, according to the S&P 500 ® index. The new year began with an encouraging upturn in January (+6.28%), but stocks lost momentum in February (-2.44%) amid higher-than-expected inflation and strong jobs data. Investors took these as signs that the economy continued to run hot, even after a year of historic policy adjustment by the Federal Reserve aimed at cooling economic growth. Record inflation in 2022 prompted the Fed to aggressively tighten monetary policy, and market interest rates eclipsed their highest level in a decade, stoking recession fears and sending stocks into bear market territory. Since March 2022, the central bank has hiked its benchmark rate eight times, by 4.5 percentage points - the fastest-ever pace of monetary tightening - while also shrinking its massive asset portfolio. The latest bump came on February 2, along with a signal that the Fed plans to lift rates in March while it considers whether and when to pause increases. Against this dynamic backdrop, stocks struggled to gain traction until a strong rally ignited heading into the summer. But in September, the index returned -9.21%, one of its worst monthly results ever, before advancing 7.56% in Q4, as risky assets regained favor. For the full 12 months, value stocks handily outpaced growth. The headwind for the latter was most pronounced in the growth-oriented communication services (-25%) and consumer discretionary (-18%) sectors. In sharp contrast, energy gained 24%.
Comments from Portfolio Manager Eddie Yoon:
For the fiscal year ending February 28, 2023, the fund returned -2.05%, roughly in line with the -1.92% result of the MSCI US IMI Health Care 25/50 Index, but outperforming the broad-based S&P 500 ® index. Versus the sector index, security selection was the primary contributor, led by the health care equipment sector. Security selection in health care services also helped. The fund's largest individual relative contributor was an overweighting in Oak Street Health, which gained 99% the past 12 months. We decreased our stake in this company. Also adding value was our outsized stake in Penumbra, which gained about 17%. Penumbra was among the fund's largest holdings. Another notable relative contributor was an overweighting in Humana (+15%). This period we reduced our stake. Conversely, the primary detractor from performance versus the sector index were stock picks in biotechnology. An underweighting in pharmaceuticals and security selection in health care facilities also hindered the fund's relative result. An underweighting in Merck, a stake we established this period, was the fund's biggest individual relative detractor because the stock gained 43% the past year. Also hampering performance was our outsized stake in Tandem Diabetes Care, which returned -68%. We added to our investment the past 12 months. Avoiding Gilead Sciences, an index component that gained approximately 39%, also hurt relative performance. The fund's foreign holdings modestly detracted overall, partly due to a broadly strong U.S. dollar. Notable changes in positioning include a higher allocation to the health care services and health care equipment subindustries.
The views expressed above reflect those of the portfolio manager(s) only through the end of the period as stated on the cover of this report and do not necessarily represent the views of Fidelity or any other person in the Fidelity organization. Any such views are subject to change at any time based upon market or other conditions and Fidelity disclaims any responsibility to update such views. These views may not be relied on as investment advice and, because investment decisions for a Fidelity fund are based on numerous factors, may not be relied on as an indication of trading intent on behalf of any Fidelity fund.
Health Care Portfolio
Top Holdings (% of Fund's net assets) |
| |
| UnitedHealth Group, Inc. | 9.4 | |
| Boston Scientific Corp. | 6.1 | |
| Thermo Fisher Scientific, Inc. | 6.0 | |
| Eli Lilly & Co. | 5.5 | |
| Danaher Corp. | 4.7 | |
| Penumbra, Inc. | 4.6 | |
| Regeneron Pharmaceuticals, Inc. | 3.9 | |
| Cigna Group | 3.3 | |
| Insulet Corp. | 3.2 | |
| Centene Corp. | 2.8 | |
| | 49.5 | |
| |
| Industries (% of Fund's net assets) |
| |
| Health Care Providers & Services | 25.5 | |
| Health Care Equipment & Supplies | 21.8 | |
| Biotechnology | 19.5 | |
| Life Sciences Tools & Services | 15.8 | |
| Pharmaceuticals | 14.4 | |
| Health Care Technology | 2.2 | |
| Personal Products | 0.4 | |
| Specialty Retail | 0.2 | |
| Diversified Financial Services | 0.1 | |
| |
Health Care Portfolio
Showing Percentage of Net Assets
| Common Stocks - 98.7% |
| | | Shares | Value ($) |
| Biotechnology - 18.8% | | | |
| Biotechnology - 18.8% | | | |
| ADC Therapeutics SA (a)(b) | | 825,782 | 2,972,815 |
| Alnylam Pharmaceuticals, Inc. (a) | | 280,000 | 53,606,000 |
| Ambrx Biopharma, Inc. ADR (a)(b) | | 354,700 | 2,280,721 |
| Arcutis Biotherapeutics, Inc. (a) | | 900,000 | 14,562,000 |
| Argenx SE ADR (a) | | 485,000 | 177,519,700 |
| Ascendis Pharma A/S sponsored ADR (a) | | 900,000 | 99,981,000 |
| Avidity Biosciences, Inc. (a) | | 400,000 | 9,480,000 |
| Beam Therapeutics, Inc. (a)(b) | | 400,000 | 16,096,000 |
| Blueprint Medicines Corp. (a) | | 1,000,000 | 42,370,000 |
| Caris Life Sciences, Inc. (c)(d) | | 1,420,479 | 7,954,682 |
| Celldex Therapeutics, Inc. (a) | | 672,066 | 28,757,704 |
| Cerevel Therapeutics Holdings (a) | | 1,363,500 | 36,391,815 |
| Cytokinetics, Inc. (a) | | 1,500,000 | 65,040,000 |
| Exact Sciences Corp. (a) | | 585,000 | 36,463,050 |
| Generation Bio Co. (a) | | 509,353 | 2,017,038 |
| Instil Bio, Inc. (a) | | 570,745 | 443,526 |
| Janux Therapeutics, Inc. (a) | | 500,000 | 8,315,000 |
| Karuna Therapeutics, Inc. (a) | | 240,000 | 47,860,800 |
| Keros Therapeutics, Inc. (a) | | 540,000 | 28,738,800 |
| Legend Biotech Corp. ADR (a) | | 1,800,000 | 83,124,000 |
| Morphic Holding, Inc. (a) | | 320,000 | 13,606,400 |
| Nuvalent, Inc. Class A (a) | | 382,530 | 11,586,834 |
| Poseida Therapeutics, Inc. (a)(b) | | 1,922,313 | 10,937,961 |
| PTC Therapeutics, Inc. (a) | | 670,000 | 29,258,900 |
| Regeneron Pharmaceuticals, Inc. (a) | | 415,000 | 315,574,300 |
| Relay Therapeutics, Inc. (a)(b) | | 800,000 | 12,920,000 |
| Repligen Corp. (a) | | 320,000 | 55,798,400 |
| Sarepta Therapeutics, Inc. (a) | | 460,000 | 56,179,800 |
| Scholar Rock Holding Corp. (a) | | 155,315 | 1,332,603 |
| Shattuck Labs, Inc. (a) | | 1,162,800 | 5,488,416 |
| Stoke Therapeutics, Inc. (a)(b) | | 500,000 | 4,445,000 |
| uniQure B.V. (a)(b) | | 670,000 | 14,043,200 |
| Vaxcyte, Inc. (a) | | 900,000 | 36,873,000 |
| Vertex Pharmaceuticals, Inc. (a) | | 280,000 | 81,281,200 |
| Verve Therapeutics, Inc. (a)(b) | | 280,000 | 5,320,000 |
| Xencor, Inc. (a) | | 1,400,000 | 44,982,000 |
| Xenon Pharmaceuticals, Inc. (a) | | 528,214 | 20,843,324 |
| Zai Lab Ltd. (a)(e) | | 6,700,000 | 24,532,952 |
| Zentalis Pharmaceuticals, Inc. (a) | | 1,200,000 | 22,716,000 |
| | | | 1,531,694,941 |
| Health Care Equipment & Supplies - 21.8% | | | |
| Health Care Equipment - 21.8% | | | |
| Boston Scientific Corp. (a) | | 10,600,000 | 495,232,000 |
| Inspire Medical Systems, Inc. (a) | | 145,000 | 37,689,850 |
| Insulet Corp. (a) | | 950,000 | 262,542,000 |
| Intuitive Surgical, Inc. (a) | | 100,000 | 22,939,000 |
| iRhythm Technologies, Inc. (a) | | 291,067 | 34,252,765 |
| Masimo Corp. (a) | | 1,000,000 | 167,310,000 |
| Nevro Corp. (a) | | 850,000 | 26,724,000 |
| Novocure Ltd. (a) | | 488,501 | 37,599,922 |
| Outset Medical, Inc. (a) | | 1,000,000 | 22,810,000 |
| Penumbra, Inc. (a) | | 1,460,000 | 379,585,400 |
| PROCEPT BioRobotics Corp. (a) | | 600,000 | 22,470,000 |
| ResMed, Inc. | | 540,000 | 115,020,000 |
| Stryker Corp. | | 400,000 | 105,152,000 |
| Tandem Diabetes Care, Inc. (a) | | 1,400,000 | 50,204,000 |
| | | | 1,779,530,937 |
| Health Care Providers & Services - 25.5% | | | |
| Health Care Facilities - 2.4% | | | |
| Acadia Healthcare Co., Inc. (a) | | 720,000 | 52,207,200 |
| HCA Holdings, Inc. | | 75,000 | 18,258,750 |
| Surgery Partners, Inc. (a) | | 3,756,500 | 125,654,925 |
| The Oncology Institute, Inc. (a)(c) | | 2,232,581 | 3,147,939 |
| | | | 199,268,814 |
| Health Care Services - 7.1% | | | |
| agilon health, Inc. (a)(b) | | 9,400,000 | 199,374,000 |
| Cigna Group | | 920,000 | 268,732,000 |
| CVS Health Corp. | | 650,000 | 54,301,000 |
| LifeStance Health Group, Inc. (a) | | 3,816,138 | 19,538,627 |
| Oak Street Health, Inc. (a) | | 1,000,000 | 35,400,000 |
| | | | 577,345,627 |
| Managed Health Care - 16.0% | | | |
| Alignment Healthcare, Inc. (a) | | 3,800,000 | 37,772,000 |
| Centene Corp. (a) | | 3,300,000 | 225,720,000 |
| Humana, Inc. | | 440,000 | 217,808,800 |
| Molina Healthcare, Inc. (a) | | 190,000 | 52,312,700 |
| UnitedHealth Group, Inc. | | 1,620,000 | 771,022,801 |
| | | | 1,304,636,301 |
TOTAL HEALTH CARE PROVIDERS & SERVICES | | | 2,081,250,742 |
| Health Care Technology - 1.9% | | | |
| Health Care Technology - 1.9% | | | |
| Doximity, Inc. (a)(b) | | 850,000 | 28,585,500 |
| Evolent Health, Inc. (a) | | 450,000 | 15,754,500 |
| Medlive Technology Co. Ltd. (f) | | 3,000,000 | 3,661,426 |
| Phreesia, Inc. (a) | | 1,080,000 | 39,744,000 |
| Veeva Systems, Inc. Class A (a) | | 400,000 | 66,264,000 |
| | | | 154,009,426 |
| Life Sciences Tools & Services - 15.8% | | | |
| Life Sciences Tools & Services - 15.8% | | | |
| 10X Genomics, Inc. Class B (a)(f) | | 500,000 | 23,760,000 |
| Bruker Corp. | | 1,200,000 | 82,704,000 |
| Danaher Corp. | | 1,560,000 | 386,146,800 |
| IQVIA Holdings, Inc. (a) | | 670,000 | 139,674,900 |
| Lonza Group AG | | 75,000 | 44,673,128 |
| Olink Holding AB ADR (a) | | 1,156,600 | 27,110,704 |
| Sartorius Stedim Biotech | | 60,000 | 19,590,719 |
| Thermo Fisher Scientific, Inc. | | 900,000 | 487,584,000 |
| West Pharmaceutical Services, Inc. | | 235,000 | 74,502,050 |
| | | | 1,285,746,301 |
| Personal Products - 0.4% | | | |
| Personal Products - 0.4% | | | |
| The Beauty Health Co. (a)(b) | | 479,105 | 6,041,514 |
| The Beauty Health Co. (a)(c) | | 1,800,000 | 22,698,000 |
| | | | 28,739,514 |
| Pharmaceuticals - 14.3% | | | |
| Pharmaceuticals - 14.3% | | | |
| Arvinas Holding Co. LLC (a) | | 750,000 | 22,987,500 |
| AstraZeneca PLC (United Kingdom) | | 1,500,000 | 195,417,133 |
| Eli Lilly & Co. | | 1,450,000 | 451,269,000 |
| Merck & Co., Inc. | | 1,400,000 | 148,736,000 |
| Novo Nordisk A/S Series B | | 500,000 | 70,627,636 |
| Pharvaris BV (a) | | 620,000 | 5,152,200 |
| Royalty Pharma PLC | | 5,700,000 | 204,345,000 |
| UCB SA | | 600,000 | 51,645,376 |
| Ventyx Biosciences, Inc. (a) | | 250,000 | 10,812,500 |
| Verona Pharma PLC ADR (a) | | 400,000 | 8,576,000 |
| | | | 1,169,568,345 |
| Specialty Retail - 0.2% | | | |
| Specialty Stores - 0.2% | | | |
| Warby Parker, Inc. (a) | | 1,000,000 | 13,010,000 |
| TOTAL COMMON STOCKS (Cost $5,503,766,184) | | | 8,043,550,206 |
| | | | |
| Preferred Stocks - 1.2% |
| | | Shares | Value ($) |
| Convertible Preferred Stocks - 1.1% | | | |
| Biotechnology - 0.7% | | | |
| Biotechnology - 0.7% | | | |
| Asimov, Inc. Series B (a)(c)(d) | | 101,438 | 5,166,237 |
| Caris Life Sciences, Inc. Series D (a)(c)(d) | | 3,206,021 | 17,953,718 |
| Cleerly, Inc. Series C (c)(d) | | 1,285,367 | 14,935,965 |
| Element Biosciences, Inc. Series C (a)(c)(d) | | 572,265 | 9,413,759 |
| ElevateBio LLC Series C (a)(c)(d) | | 254,900 | 810,582 |
| Inscripta, Inc. Series E (a)(c)(d) | | 1,282,228 | 5,423,824 |
| | | | 53,704,085 |
| Health Care Providers & Services - 0.0% | | | |
| Health Care Services - 0.0% | | | |
| dMed Biopharmaceutical Co. Ltd. Series C (a)(c)(d) | | 380,451 | 4,127,893 |
| | | | |
| Health Care Technology - 0.3% | | | |
| Health Care Technology - 0.3% | | | |
| Aledade, Inc.: | | | |
| Series B1(a)(c)(d) | | 201,220 | 10,733,075 |
| Series E1(c)(d) | | 56,664 | 3,022,458 |
| Omada Health, Inc. Series E (a)(c)(d) | | 2,153,073 | 7,708,001 |
| Wugen, Inc. Series B (a)(c)(d) | | 454,342 | 2,421,643 |
| | | | 23,885,177 |
| Pharmaceuticals - 0.1% | | | |
| Pharmaceuticals - 0.1% | | | |
| Aristea Therapeutics, Inc. Series B (a)(c)(d) | | 1,037,400 | 5,716,074 |
| Galvanize Therapeutics Series B (c)(d) | | 3,696,429 | 6,246,965 |
| | | | 11,963,039 |
| TOTAL CONVERTIBLE PREFERRED STOCKS | | | 93,680,194 |
| Nonconvertible Preferred Stocks - 0.1% | | | |
| Diversified Financial Services - 0.1% | | | |
| Other Diversified Financial Services - 0.1% | | | |
| Thriveworks TopCo LLC Series B (a)(c)(d)(g) | | 473,270 | 7,794,757 |
| | | | |
| TOTAL PREFERRED STOCKS (Cost $132,756,423) | | | 101,474,951 |
| | | | |
| Money Market Funds - 2.3% |
| | | Shares | Value ($) |
Fidelity Securities Lending Cash Central Fund 4.63% (h)(i) (Cost $189,952,575) | | 189,935,332 | 189,954,325 |
| | | | |
| TOTAL INVESTMENT IN SECURITIES - 102.2% (Cost $5,826,475,182) | 8,334,979,482 |
NET OTHER ASSETS (LIABILITIES) - (2.2)% | (181,515,079) |
| NET ASSETS - 100.0% | 8,153,464,403 |
| | |
Legend
| (b) | Security or a portion of the security is on loan at period end. |
| (c) | Restricted securities (including private placements) - Investment in securities not registered under the Securities Act of 1933 (excluding 144A issues). At the end of the period, the value of restricted securities (excluding 144A issues) amounted to $135,275,572 or 1.7% of net assets. |
| (f) | Security exempt from registration under Rule 144A of the Securities Act of 1933. These securities may be resold in transactions exempt from registration, normally to qualified institutional buyers. At the end of the period, the value of these securities amounted to $27,421,426 or 0.3% of net assets. |
| (g) | Investment is owned by a wholly-owned subsidiary (Subsidiary) that is treated as a corporation for U.S. tax purposes. |
| (h) | Affiliated fund that is generally available only to investment companies and other accounts managed by Fidelity Investments. The rate quoted is the annualized seven-day yield of the fund at period end. A complete unaudited listing of the fund's holdings as of its most recent quarter end is available upon request. In addition, each Fidelity Central Fund's financial statements, which are not covered by the Fund's Report of Independent Registered Public Accounting Firm, are available on the SEC's website or upon request. |
| (i) | Investment made with cash collateral received from securities on loan. |
| Additional information on each restricted holding is as follows: |
| Security | Acquisition Date | Acquisition Cost ($) |
| Aledade, Inc. Series B1 | 5/07/21 | 7,704,855 |
| | | |
| Aledade, Inc. Series E1 | 5/20/22 | 2,822,683 |
| | | |
| Aristea Therapeutics, Inc. Series B | 10/06/20 | 5,719,912 |
| | | |
| Asimov, Inc. Series B | 10/29/21 | 9,401,345 |
| | | |
| Caris Life Sciences, Inc. | 10/06/22 | 7,954,682 |
| | | |
| Caris Life Sciences, Inc. Series D | 5/11/21 | 25,968,770 |
| | | |
| Cleerly, Inc. Series C | 7/08/22 | 15,142,394 |
| | | |
| dMed Biopharmaceutical Co. Ltd. Series C | 12/01/20 | 5,403,602 |
| | | |
| Element Biosciences, Inc. Series C | 6/21/21 | 11,763,880 |
| | | |
| ElevateBio LLC Series C | 3/09/21 | 1,069,306 |
| | | |
| Galvanize Therapeutics Series B | 3/29/22 | 6,399,572 |
| | | |
| Inscripta, Inc. Series E | 3/30/21 | 11,322,073 |
| | | |
| Omada Health, Inc. Series E | 12/22/21 | 12,908,103 |
| | | |
| The Beauty Health Co. | 12/08/20 | 18,000,000 |
| | | |
| The Oncology Institute, Inc. | 6/28/21 | 22,325,810 |
| | | |
| Thriveworks TopCo LLC Series B | 7/23/21 - 2/25/22 | 13,584,368 |
| | | |
| Wugen, Inc. Series B | 7/09/21 | 3,523,377 |
| | | |
Affiliated Central Funds
Fiscal year to date information regarding the Fund's investments in Fidelity Central Funds, including the ownership percentage, is presented below.
| Affiliate | Value, beginning of period ($) | Purchases ($) | Sales Proceeds ($) | Dividend Income ($) | Realized Gain (loss) ($) | Change in Unrealized appreciation (depreciation) ($) | Value, end of period ($) | % ownership, end of period |
| Fidelity Cash Central Fund 4.63% | 36,264,694 | 1,123,481,826 | 1,159,746,520 | 1,215,198 | - | - | - | 0.0% |
| Fidelity Securities Lending Cash Central Fund 4.63% | 202,861,851 | 1,295,221,054 | 1,308,128,580 | 1,754,556 | - | - | 189,954,325 | 0.6% |
| Total | 239,126,545 | 2,418,702,880 | 2,467,875,100 | 2,969,754 | - | - | 189,954,325 | |
| | | | | | | | | |
Amounts in the dividend income column in the above table include any capital gain distributions from underlying funds, which are presented in the corresponding line item in the Statement of Operations, if applicable.
Amount for Fidelity Securities Lending Cash Central Fund represents the income earned on investing cash collateral, less rebates paid to borrowers and any lending agent fees associated with the loan, plus any premium payments received for lending certain types of securities.
Amounts included in the purchases and sales proceeds columns may include in-kind transactions, if applicable.
Other Affiliated Issuers
An affiliated company is a company in which the Fund has ownership of at least 5% of the voting securities. Fiscal year to date transactions with companies which are or were affiliates are presented in the table below. Certain corporate actions, such as mergers, are excluded from the amounts in this table if applicable. A dash in the Value end of period ($) column means either the issuer is no longer held at period end, or the issuer is held at period end but is no longer an affiliate.
| Affiliate | Value, beginning of period ($) | Purchases ($) | Sales Proceeds ($) | Dividend Income ($) | Realized Gain (loss) ($) | Change in Unrealized appreciation (depreciation) ($) | Value, end of period ($) |
| Zai Lab Ltd. | 26,625,199 | 15,386,597 | 4,441,986 | - | (22,717,266) | 9,680,408 | 24,532,952 |
| Total | 26,625,199 | 15,386,597 | 4,441,986 | - | (22,717,266) | 9,680,408 | 24,532,952 |
Amounts included in the purchases and sales proceeds columns may include in-kind transactions, if applicable.
Investment Valuation
The following is a summary of the inputs used, as of February 28, 2023, involving the Fund's assets and liabilities carried at fair value. The inputs or methodology used for valuing securities may not be an indication of the risk associated with investing in those securities. For more information on valuation inputs, and their aggregation into the levels used below, please refer to the Investment Valuation section in the accompanying Notes to Financial Statements.
| Valuation Inputs at Reporting Date: |
| Description | Total ($) | Level 1 ($) | Level 2 ($) | Level 3 ($) |
Investments in Securities: | | | | |
|
| Common Stocks | 8,043,550,206 | 7,700,344,675 | 335,250,849 | 7,954,682 |
|
| Preferred Stocks | 101,474,951 | - | - | 101,474,951 |
|
| Money Market Funds | 189,954,325 | 189,954,325 | - | - |
| Total Investments in Securities: | 8,334,979,482 | 7,890,299,000 | 335,250,849 | 109,429,633 |
The following is a reconciliation of Investments in Securities for which Level 3 inputs were used in determining value:
| |
| Investments in Securities: | |
| Preferred Stocks | | | |
| Beginning Balance | $ | 99,854,613 | |
| Net Realized Gain (Loss) on Investment Securities | | - | |
| Net Unrealized Gain (Loss) on Investment Securities | | (22,766,495) | |
| Cost of Purchases | | 24,386,833 | |
| Proceeds of Sales | | - | |
| Amortization/Accretion | | - | |
| Transfers into Level 3 | | - | |
| Transfers out of Level 3 | | - | |
| Ending Balance | $ | 101,474,951 | |
| The change in unrealized gain (loss) for the period attributable to Level 3 securities held at February 28, 2023 | $ | (22,766,495) | |
| Other Investments in Securities | | | |
| Beginning Balance | $ | - | |
| Net Realized Gain (Loss) on Investment Securities | | - | |
| Net Unrealized Gain (Loss) on Investment Securities | | - | |
| Cost of Purchases | | 7,954,682 | |
| Proceeds of Sales | | - | |
| Amortization/Accretion | | - | |
| Transfers into Level 3 | | - | |
| Transfers out of Level 3 | | - | |
| Ending Balance | $ | 7,954,682 | |
| The change in unrealized gain (loss) for the period attributable to Level 3 securities held at February 28, 2023 | $ | - | |
| The information used in the above reconciliation represents fiscal year to date activity for any Investments in Securities identified as using Level 3 inputs at either the beginning or the end of the current fiscal period. Cost of purchases and proceeds of sales may include securities received and/or delivered through in-kind transactions. Transfers into Level 3 were attributable to a lack of observable market data resulting from decreases in market activity, decreases in liquidity, security restructurings or corporate actions. Transfers out of Level 3 were attributable to observable market data becoming available for those securities. Transfers in or out of Level 3 represent the beginning value of any Security or Instrument where a change in the pricing level occurred from the beginning to the end of the period. The cost of purchases and the proceeds of sales may include securities received or delivered through corporate actions or exchanges. Realized and unrealized gains (losses) disclosed in the reconciliation are included in Net Gain (Loss) on the Fund's Statement of Operations. | |
Health Care Portfolio
| Statement of Assets and Liabilities |
| | | | February 28, 2023 |
| | | | | |
| Assets | | | | |
| Investment in securities, at value (including securities loaned of $186,141,172) - See accompanying schedule: | | | | |
Unaffiliated issuers (cost $5,600,449,554) | $ | 8,120,492,205 | | |
Fidelity Central Funds (cost $189,952,575) | | 189,954,325 | | |
Other affiliated issuers (cost $36,073,053) | | 24,532,952 | | |
| | | | | |
| | | | | |
| Total Investment in Securities (cost $5,826,475,182) | | | $ | 8,334,979,482 |
| Foreign currency held at value (cost $8) | | | | 8 |
| Receivable for investments sold | | | | 41,227,458 |
| Receivable for fund shares sold | | | | 1,146,495 |
| Dividends receivable | | | | 5,955,720 |
| Reclaims receivable | | | | 5,412,240 |
| Distributions receivable from Fidelity Central Funds | | | | 227,672 |
| Prepaid expenses | | | | 23,661 |
| Other receivables | | | | 761,986 |
Total assets | | | | 8,389,734,722 |
| Liabilities | | | | |
| Payable to custodian bank | $ | 1,425,616 | | |
| Payable for investments purchased | | 35,003,078 | | |
| Payable for fund shares redeemed | | 4,264,695 | | |
| Accrued management fee | | 3,706,834 | | |
| Other affiliated payables | | 1,106,774 | | |
| Other payables and accrued expenses | | 830,822 | | |
| Collateral on securities loaned | | 189,932,500 | | |
| Total Liabilities | | | | 236,270,319 |
| Net Assets | | | $ | 8,153,464,403 |
| Net Assets consist of: | | | | |
| Paid in capital | | | $ | 5,757,809,383 |
| Total accumulated earnings (loss) | | | | 2,395,655,020 |
| Net Assets | | | $ | 8,153,464,403 |
Net Asset Value , offering price and redemption price per share ($8,153,464,403 ÷ 299,940,737 shares) | | | $ | 27.18 |
| Statement of Operations |
| | | | Year ended February 28, 2023 |
| Investment Income | | | | |
| Dividends | | | $ | 45,809,321 |
| Income from Fidelity Central Funds (including $1,754,556 from security lending) | | | | 2,969,754 |
| Total Income | | | | 48,779,075 |
| Expenses | | | | |
| Management fee | $ | 44,295,591 | | |
| Transfer agent fees | | 12,171,724 | | |
| Accounting fees | | 1,128,857 | | |
| Custodian fees and expenses | | 97,261 | | |
| Independent trustees' fees and expenses | | 28,748 | | |
| Registration fees | | 69,017 | | |
| Audit | | 55,185 | | |
| Legal | | 7,343 | | |
| Interest | | 4,620 | | |
| Miscellaneous | | 49,613 | | |
| Total expenses before reductions | | 57,907,959 | | |
| Expense reductions | | (300,032) | | |
| Total expenses after reductions | | | | 57,607,927 |
| Net Investment income (loss) | | | | (8,828,852) |
| Realized and Unrealized Gain (Loss) | | | | |
| Net realized gain (loss) on: | | | | |
| Investment Securities: | | | | |
| Unaffiliated issuers | | (54,216,767) | | |
| Affiliated issuers | | (22,717,266) | | |
| Foreign currency transactions | | (128,287) | | |
| Total net realized gain (loss) | | | | (77,062,320) |
| Change in net unrealized appreciation (depreciation) on: | | | | |
| Investment Securities: | | | | |
| Unaffiliated issuers | | (119,731,988) | | |
| Affiliated issuers | | 9,680,408 | | |
| Assets and liabilities in foreign currencies | | (335,389) | | |
| Total change in net unrealized appreciation (depreciation) | | | | (110,386,969) |
| Net gain (loss) | | | | (187,449,289) |
| Net increase (decrease) in net assets resulting from operations | | | $ | (196,278,141) |
| Statement of Changes in Net Assets |
| |
| | Year ended February 28, 2023 | | Year ended February 28, 2022 |
| Increase (Decrease) in Net Assets | | | | |
| Operations | | | | |
| Net investment income (loss) | $ | (8,828,852) | $ | (10,700,587) |
| Net realized gain (loss) | | (77,062,320) | | 831,099,766 |
| Change in net unrealized appreciation (depreciation) | | (110,386,969) | | (1,151,771,898) |
| Net increase (decrease) in net assets resulting from operations | | (196,278,141) | | (331,372,719) |
| Distributions to shareholders | | (185,553,756) | | (929,859,235) |
| Share transactions | | | | |
| Proceeds from sales of shares | | 519,950,859 | | 1,043,831,682 |
| Reinvestment of distributions | | 171,960,992 | | 861,023,255 |
| Cost of shares redeemed | | (1,155,824,340) | | (1,997,490,811) |
Net increase (decrease) in net assets resulting from share transactions | | (463,912,489) | | (92,635,874) |
| Total increase (decrease) in net assets | | (845,744,386) | | (1,353,867,828) |
| | | | | |
| Net Assets | | | | |
| Beginning of period | | 8,999,208,789 | | 10,353,076,617 |
| End of period | $ | 8,153,464,403 | $ | 8,999,208,789 |
| | | | | |
| Other Information | | | | |
| Shares | | | | |
| Sold | | 19,098,646 | | 32,480,198 |
| Issued in reinvestment of distributions | | 5,803,593 | | 27,447,935 |
| Redeemed | | (42,956,929) | | (63,667,769) |
| Net increase (decrease) | | (18,054,690) | | (3,739,636) |
| | | | | |
Financial Highlights
| Years ended February 28, | | 2023 | | 2022 | | 2021 | | 2020 A | | 2019 B |
Selected Per-Share Data | | | | | | | | | | |
| Net asset value, beginning of period | $ | 28.30 | $ | 32.18 | $ | 26.53 | $ | 24.48 | $ | 23.56 |
| Income from Investment Operations | | | | | | | | | | |
Net investment income (loss) C,D | | (.03) | | (.03) | | - E | | .04 | | .02 |
| Net realized and unrealized gain (loss) | | (.50) | | (.92) | | 9.23 | | 2.40 | | 2.90 |
| Total from investment operations | | (.53) | | (.95) | | 9.23 | | 2.44 | | 2.92 |
| Distributions from net investment income | | - | | (.04) F | | (.18) | | (.03) | | (.03) |
| Distributions from net realized gain | | (.59) | | (2.89) F | | (3.40) | | (.36) | | (1.97) |
| Total distributions | | (.59) | | (2.93) | | (3.58) | | (.39) | | (2.00) |
| Net asset value, end of period | $ | 27.18 | $ | 28.30 | $ | 32.18 | $ | 26.53 | $ | 24.48 |
Total Return G | | (2.05)% | | (3.67)% | | 36.00% | | 9.84% | | 13.30% |
Ratios to Average Net Assets D,H,I | | | | | | | | | | |
| Expenses before reductions | | .69% | | .68% | | .69% | | .70% | | .71% |
| Expenses net of fee waivers, if any | | .68% | | .67% | | .69% | | .70% | | .71% |
| Expenses net of all reductions | | .68% | | .67% | | .69% | | .70% | | .71% |
| Net investment income (loss) | | (.10)% | | (.10)% | | (.01)% | | .16% | | .10% |
| Supplemental Data | | | | | | | | | | |
| Net assets, end of period (000 omitted) | $ | 8,153,464 | $ | 8,999,209 | $ | 10,353,077 | $ | 7,220,187 | $ | 7,450,707 |
Portfolio turnover rate J | | 40% | | 31% | | 52% | | 36% K | | 60% K |
A For the year ended February 29.
B Per share amounts have been adjusted to reflect the impact of the 10 for 1 share split that occurred on August 10, 2018.
C Calculated based on average shares outstanding during the period.
D Net investment income (loss) is affected by the timing of the declaration of dividends by any underlying mutual funds or exchange-traded funds (ETFs). Net investment income (loss) of any mutual funds or ETFs is not included in the Fund's net investment income (loss) ratio.
E Amount represents less than $.005 per share.
F The amount shown reflects reclassifications related to book to tax differences that were made in the year shown.
G Total returns would have been lower if certain expenses had not been reduced during the applicable periods shown.
H Fees and expenses of any underlying mutual funds or exchange-traded funds (ETFs) are not included in the Fund's expense ratio. The Fund indirectly bears its proportionate share of these expenses. For additional expense information related to investments in Fidelity Central Funds, please refer to the "Investments in Fidelity Central Funds" note found in the Notes to Financial Statements section of the most recent Annual or Semi-Annual report.
I Expense ratios reflect operating expenses of the class. Expenses before reductions do not reflect amounts reimbursed, waived, or reduced through arrangements with the investment adviser, brokerage services, or other offset arrangements, if applicable, and do not represent the amount paid by the class during periods when reimbursements, waivers or reductions occur.
J Amount does not include the portfolio activity of any underlying mutual funds or exchange-traded funds (ETFs).
K Portfolio turnover rate excludes securities received or delivered in-kind.
Average annual total return reflects the change in the value of an investment, assuming reinvestment of distributions from dividend income and capital gains (the profits earned upon the sale of securities that have grown in value, if any) and assuming a constant rate of performance each year. The hypothetical investment and the average annual total returns do not reflect the deduction of taxes that a shareholder would pay on fund distributions or the redemption of fund shares. During periods of reimbursement by Fidelity, a fund's total return will be greater than it would be had the reimbursement not occurred. How a fund did yesterday is no guarantee of how it will do tomorrow.
| Average Annual Total Returns |
| | | | |
Periods ended February 28, 2023 | Past 1 year | Past 5 years | Past 10 years |
| Health Care Services Portfolio | -0.64% | 11.87% | 14.63% |
| $10,000 Over 10 Years |
| |
Let's say hypothetically that $10,000 was invested in Health Care Services Portfolio on February 28, 2013. The chart shows how the value of your investment would have changed, and also shows how the S&P 500® Index performed over the same period. |
|
|
Health Care Services Portfolio
Market Recap:
U.S. equities returned -7.69% for the 12 months ending February 28, 2023, according to the S&P 500 ® index. The new year began with an encouraging upturn in January (+6.28%), but stocks lost momentum in February (-2.44%) amid higher-than-expected inflation and strong jobs data. Investors took these as signs that the economy continued to run hot, even after a year of historic policy adjustment by the Federal Reserve aimed at cooling economic growth. Record inflation in 2022 prompted the Fed to aggressively tighten monetary policy, and market interest rates eclipsed their highest level in a decade, stoking recession fears and sending stocks into bear market territory. Since March 2022, the central bank has hiked its benchmark rate eight times, by 4.5 percentage points - the fastest-ever pace of monetary tightening - while also shrinking its massive asset portfolio. The latest bump came on February 2, along with a signal that the Fed plans to lift rates in March while it considers whether and when to pause increases. Against this dynamic backdrop, stocks struggled to gain traction until a strong rally ignited heading into the summer. But in September, the index returned -9.21%, one of its worst monthly results ever, before advancing 7.56% in Q4, as risky assets regained favor. For the full 12 months, value stocks handily outpaced growth. The headwind for the latter was most pronounced in the growth-oriented communication services (-25%) and consumer discretionary (-18%) sectors. In sharp contrast, energy gained 24%.
Comments from Portfolio Manager Justin Segalini:
For the fiscal year ending February 28, 2023, the fund returned -0.64%, trailing the -0.37% result of the MSCI US IMI Health Care Providers & Services 25/50 Index, but outperforming the broad-based S&P 500 ® index. Versus the industry index, stock selection in health care facilities hurt most, followed by an underweighting within health care distributors. The fund's biggest individual relative detractor was an overweighting in Surgery Partners, which returned roughly -36% the past year. We increased our stake in this company. Also holding back performance was our overweighting in Tenet Healthcare, which returned -45%. Tenet Healthcare was not held at period end. Avoiding Cardinal Health, an index component that gained about 45%, also hurt relative performance. Conversely, the top contributor to performance versus the industry index was stock selection in health care services. Security selection in health care technology and health care distributors also boosted the fund's relative performance. The biggest individual relative contributor was an underweight position in CVS Health (-17%), which was among our largest holdings. Also adding value was our outsized stake in Cigna Group, which gained roughly 24%. Cigna was among the fund's biggest holdings. Another notable relative contributor was an overweighting in Humana (+15%), which was one of our largest holdings. Notable changes in positioning include increased exposure to the health care distributors subindustry and a lower allocation to health care facilities.
The views expressed above reflect those of the portfolio manager(s) only through the end of the period as stated on the cover of this report and do not necessarily represent the views of Fidelity or any other person in the Fidelity organization. Any such views are subject to change at any time based upon market or other conditions and Fidelity disclaims any responsibility to update such views. These views may not be relied on as investment advice and, because investment decisions for a Fidelity fund are based on numerous factors, may not be relied on as an indication of trading intent on behalf of any Fidelity fund.
Health Care Services Portfolio
Top Holdings (% of Fund's net assets) |
| |
| UnitedHealth Group, Inc. | 24.6 | |
| CVS Health Corp. | 8.9 | |
| Humana, Inc. | 8.2 | |
| Centene Corp. | 7.7 | |
| Cigna Group | 4.8 | |
| Elevance Health, Inc. | 4.7 | |
| Molina Healthcare, Inc. | 4.4 | |
| AmerisourceBergen Corp. | 4.3 | |
| McKesson Corp. | 4.3 | |
| HCA Holdings, Inc. | 3.5 | |
| | 75.4 | |
| |
| Industries (% of Fund's net assets) |
| |
| Health Care Providers & Services | 96.5 | |
| Health Care Technology | 2.0 | |
| Diversified Financial Services | 0.1 | |
| |
Health Care Services Portfolio
Showing Percentage of Net Assets
| Common Stocks - 98.2% |
| | | Shares | Value ($) |
| Health Care Providers & Services - 96.5% | | | |
| Health Care Distributors & Services - 8.6% | | | |
| AmerisourceBergen Corp. | | 475,300 | 73,937,668 |
| McKesson Corp. | | 207,500 | 72,585,575 |
| | | | 146,523,243 |
| Health Care Facilities - 12.1% | | | |
| Acadia Healthcare Co., Inc. (a) | | 532,600 | 38,618,826 |
| Encompass Health Corp. | | 446,600 | 25,241,832 |
| HCA Holdings, Inc. | | 247,200 | 60,180,840 |
| Surgery Partners, Inc. (a) | | 1,304,400 | 43,632,180 |
| U.S. Physical Therapy, Inc. (b) | | 180,300 | 18,269,799 |
| Universal Health Services, Inc. Class B | | 164,000 | 21,905,480 |
| | | | 207,848,957 |
| Health Care Services - 24.0% | | | |
| agilon health, Inc. (a)(b) | | 2,325,673 | 49,327,524 |
| Andlauer Healthcare Group, Inc. | | 184,939 | 6,477,270 |
| Chemed Corp. | | 52,200 | 27,226,476 |
| Cigna Group | | 282,572 | 82,539,281 |
| CVS Health Corp. | | 1,824,570 | 152,424,578 |
| DaVita HealthCare Partners, Inc. (a) | | 99,900 | 8,217,774 |
| LifeStance Health Group, Inc. (a) | | 3,643,950 | 18,657,024 |
| Option Care Health, Inc. (a) | | 1,298,932 | 39,838,244 |
| Privia Health Group, Inc. (a)(b) | | 654,800 | 18,288,564 |
| Quest Diagnostics, Inc. | | 48,000 | 6,641,280 |
| | | | 409,638,015 |
| Managed Health Care - 51.8% | | | |
| Alignment Healthcare, Inc. (a) | | 828,696 | 8,237,238 |
| Centene Corp. (a) | | 1,918,284 | 131,210,626 |
| Elevance Health, Inc. | | 171,802 | 80,690,245 |
| HealthEquity, Inc. (a) | | 460,900 | 30,036,853 |
| Humana, Inc. | | 282,900 | 140,041,158 |
| Molina Healthcare, Inc. (a) | | 271,500 | 74,752,095 |
| UnitedHealth Group, Inc. | | 883,950 | 420,707,164 |
| | | | 885,675,379 |
TOTAL HEALTH CARE PROVIDERS & SERVICES | | | 1,649,685,594 |
| Health Care Technology - 1.7% | | | |
| Health Care Technology - 1.7% | | | |
| Evolent Health, Inc. (a)(b) | | 581,900 | 20,372,319 |
| Phreesia, Inc. (a) | | 239,335 | 8,807,528 |
| | | | 29,179,847 |
| TOTAL COMMON STOCKS (Cost $1,085,319,586) | | | 1,678,865,441 |
| | | | |
| Preferred Stocks - 0.4% |
| | | Shares | Value ($) |
| Convertible Preferred Stocks - 0.3% | | | |
| Health Care Technology - 0.3% | | | |
| Health Care Technology - 0.3% | | | |
| Aledade, Inc.: | | | |
| Series B1(a)(c)(d) | | 52,232 | 2,786,055 |
| Series E1(c)(d) | | 40,149 | 2,141,548 |
| | | | 4,927,603 |
| Nonconvertible Preferred Stocks - 0.1% | | | |
| Diversified Financial Services - 0.1% | | | |
| Other Diversified Financial Services - 0.1% | | | |
| Thriveworks TopCo LLC Series B (a)(c)(d)(e) | | 69,639 | 1,146,954 |
| | | | |
| TOTAL PREFERRED STOCKS (Cost $6,021,044) | | | 6,074,557 |
| | | | |
| Money Market Funds - 4.8% |
| | | Shares | Value ($) |
| Fidelity Cash Central Fund 4.63% (f) | | 18,113,222 | 18,116,844 |
| Fidelity Securities Lending Cash Central Fund 4.63% (f)(g) | | 63,164,293 | 63,170,610 |
| TOTAL MONEY MARKET FUNDS (Cost $81,287,454) | | | 81,287,454 |
| | | | |
| TOTAL INVESTMENT IN SECURITIES - 103.4% (Cost $1,172,628,084) | 1,766,227,452 |
NET OTHER ASSETS (LIABILITIES) - (3.4)% | (57,525,285) |
| NET ASSETS - 100.0% | 1,708,702,167 |
| | |
Legend
| (b) | Security or a portion of the security is on loan at period end. |
| (c) | Restricted securities (including private placements) - Investment in securities not registered under the Securities Act of 1933 (excluding 144A issues). At the end of the period, the value of restricted securities (excluding 144A issues) amounted to $6,074,557 or 0.4% of net assets. |
| (e) | Investment is owned by a wholly-owned subsidiary (Subsidiary) that is treated as a corporation for U.S. tax purposes. |
| (f) | Affiliated fund that is generally available only to investment companies and other accounts managed by Fidelity Investments. The rate quoted is the annualized seven-day yield of the fund at period end. A complete unaudited listing of the fund's holdings as of its most recent quarter end is available upon request. In addition, each Fidelity Central Fund's financial statements, which are not covered by the Fund's Report of Independent Registered Public Accounting Firm, are available on the SEC's website or upon request. |
| (g) | Investment made with cash collateral received from securities on loan. |
| Additional information on each restricted holding is as follows: |
| Security | Acquisition Date | Acquisition Cost ($) |
| Aledade, Inc. Series B1 | 5/07/21 | 2,000,000 |
| | | |
| Aledade, Inc. Series E1 | 5/20/22 | 1,999,998 |
| | | |
| Thriveworks TopCo LLC Series B | 7/23/21 - 2/25/22 | 1,998,863 |
| | | |
Affiliated Central Funds
Fiscal year to date information regarding the Fund's investments in Fidelity Central Funds, including the ownership percentage, is presented below.
| Affiliate | Value, beginning of period ($) | Purchases ($) | Sales Proceeds ($) | Dividend Income ($) | Realized Gain (loss) ($) | Change in Unrealized appreciation (depreciation) ($) | Value, end of period ($) | % ownership, end of period |
| Fidelity Cash Central Fund 4.63% | 1,067,186 | 580,484,359 | 563,434,701 | 1,076,184 | - | - | 18,116,844 | 0.0% |
| Fidelity Securities Lending Cash Central Fund 4.63% | 47,754,630 | 445,979,300 | 430,563,320 | 235,417 | - | - | 63,170,610 | 0.2% |
| Total | 48,821,816 | 1,026,463,659 | 993,998,021 | 1,311,601 | - | - | 81,287,454 | |
| | | | | | | | | |
Amounts in the dividend income column in the above table include any capital gain distributions from underlying funds, which are presented in the corresponding line item in the Statement of Operations, if applicable.
Amount for Fidelity Securities Lending Cash Central Fund represents the income earned on investing cash collateral, less rebates paid to borrowers and any lending agent fees associated with the loan, plus any premium payments received for lending certain types of securities.
Amounts included in the purchases and sales proceeds columns may include in-kind transactions, if applicable.
Investment Valuation
The following is a summary of the inputs used, as of February 28, 2023, involving the Fund's assets and liabilities carried at fair value. The inputs or methodology used for valuing securities may not be an indication of the risk associated with investing in those securities. For more information on valuation inputs, and their aggregation into the levels used below, please refer to the Investment Valuation section in the accompanying Notes to Financial Statements.
| Valuation Inputs at Reporting Date: |
| Description | Total ($) | Level 1 ($) | Level 2 ($) | Level 3 ($) |
Investments in Securities: | | | | |
|
| Common Stocks | 1,678,865,441 | 1,678,865,441 | - | - |
|
| Preferred Stocks | 6,074,557 | - | - | 6,074,557 |
|
| Money Market Funds | 81,287,454 | 81,287,454 | - | - |
| Total Investments in Securities: | 1,766,227,452 | 1,760,152,895 | - | 6,074,557 |
Health Care Services Portfolio
| Statement of Assets and Liabilities |
| | | | February 28, 2023 |
| | | | | |
| Assets | | | | |
| Investment in securities, at value (including securities loaned of $61,908,240) - See accompanying schedule: | | | | |
Unaffiliated issuers (cost $1,091,340,630) | $ | 1,684,939,998 | | |
Fidelity Central Funds (cost $81,287,454) | | 81,287,454 | | |
| | | | | |
| | | | | |
| Total Investment in Securities (cost $1,172,628,084) | | | $ | 1,766,227,452 |
| Receivable for investments sold | | | | 8,761,110 |
| Receivable for fund shares sold | | | | 1,664,275 |
| Dividends receivable | | | | 164,686 |
| Distributions receivable from Fidelity Central Funds | | | | 60,883 |
| Prepaid expenses | | | | 3,156 |
| Other receivables | | | | 81,398 |
Total assets | | | | 1,776,962,960 |
| Liabilities | | | | |
| Payable for investments purchased | $ | 2,292,067 | | |
| Payable for fund shares redeemed | | 1,625,946 | | |
| Accrued management fee | | 772,314 | | |
| Other affiliated payables | | 289,699 | | |
| Other payables and accrued expenses | | 113,586 | | |
| Collateral on securities loaned | | 63,167,181 | | |
| Total Liabilities | | | | 68,260,793 |
| Net Assets | | | $ | 1,708,702,167 |
| Net Assets consist of: | | | | |
| Paid in capital | | | $ | 1,155,599,730 |
| Total accumulated earnings (loss) | | | | 553,102,437 |
| Net Assets | | | $ | 1,708,702,167 |
Net Asset Value , offering price and redemption price per share ($1,708,702,167 ÷ 13,694,715 shares) | | | $ | 124.77 |
| Statement of Operations |
| | | | Year ended February 28, 2023 |
| Investment Income | | | | |
| Dividends | | | $ | 13,140,050 |
| Income from Fidelity Central Funds (including $235,417 from security lending) | | | | 1,311,601 |
| Total Income | | | | 14,451,651 |
| Expenses | | | | |
| Management fee | $ | 8,157,383 | | |
| Transfer agent fees | | 2,462,813 | | |
| Accounting fees | | 440,095 | | |
| Custodian fees and expenses | | 11,182 | | |
| Independent trustees' fees and expenses | | 5,168 | | |
| Registration fees | | 135,537 | | |
| Audit | | 39,601 | | |
| Legal | | 1,783 | | |
| Miscellaneous | | 7,423 | | |
| Total expenses before reductions | | 11,260,985 | | |
| Expense reductions | | (54,520) | | |
| Total expenses after reductions | | | | 11,206,465 |
| Net Investment income (loss) | | | | 3,245,186 |
| Realized and Unrealized Gain (Loss) | | | | |
| Net realized gain (loss) on: | | | | |
| Investment Securities: | | | | |
| Unaffiliated issuers | | (18,499,864) | | |
| Foreign currency transactions | | (1,200) | | |
| Total net realized gain (loss) | | | | (18,501,064) |
| Change in net unrealized appreciation (depreciation) on: | | | | |
| Investment Securities: | | | | |
| Unaffiliated issuers | | (28,481,279) | | |
| Assets and liabilities in foreign currencies | | (180) | | |
| Total change in net unrealized appreciation (depreciation) | | | | (28,481,459) |
| Net gain (loss) | | | | (46,982,523) |
| Net increase (decrease) in net assets resulting from operations | | | $ | (43,737,337) |
| Statement of Changes in Net Assets |
| |
| | Year ended February 28, 2023 | | Year ended February 28, 2022 |
| Increase (Decrease) in Net Assets | | | | |
| Operations | | | | |
| Net investment income (loss) | $ | 3,245,186 | $ | 2,679,968 |
| Net realized gain (loss) | | (18,501,064) | | 122,701,804 |
| Change in net unrealized appreciation (depreciation) | | (28,481,459) | | 56,927,180 |
| Net increase (decrease) in net assets resulting from operations | | (43,737,337) | | 182,308,952 |
| Distributions to shareholders | | (70,592,721) | | (87,625,390) |
| Share transactions | | | | |
| Proceeds from sales of shares | | 1,010,359,737 | | 148,662,940 |
| Reinvestment of distributions | | 65,526,668 | | 81,964,453 |
| Cost of shares redeemed | | (466,886,272) | | (212,192,301) |
Net increase (decrease) in net assets resulting from share transactions | | 609,000,133 | | 18,435,092 |
| Total increase (decrease) in net assets | | 494,670,075 | | 113,118,654 |
| | | | | |
| Net Assets | | | | |
| Beginning of period | | 1,214,032,092 | | 1,100,913,438 |
| End of period | $ | 1,708,702,167 | $ | 1,214,032,092 |
| | | | | |
| Other Information | | | | |
| Shares | | | | |
| Sold | | 7,599,624 | | 1,120,061 |
| Issued in reinvestment of distributions | | 474,418 | | 621,521 |
| Redeemed | | (3,577,704) | | (1,608,688) |
| Net increase (decrease) | | 4,496,338 | | 132,894 |
| | | | | |
Financial Highlights
| Health Care Services Portfolio |
| |
| Years ended February 28, | | 2023 | | 2022 | | 2021 | | 2020 A | | 2019 |
Selected Per-Share Data | | | | | | | | | | |
| Net asset value, beginning of period | $ | 131.98 | $ | 121.44 | $ | 94.72 | $ | 89.28 | $ | 92.21 |
| Income from Investment Operations | | | | | | | | | | |
Net investment income (loss) B,C | | .28 | | .29 | | .06 | | .23 | | .13 |
| Net realized and unrealized gain (loss) | | (.47) | | 20.01 | | 27.59 | | 5.50 | | 8.27 |
| Total from investment operations | | (.19) | | 20.30 | | 27.65 | | 5.73 | | 8.40 |
| Distributions from net investment income | | (.31) | | (.22) D | | (.93) | | (.29) | | (.10) |
| Distributions from net realized gain | | (6.71) | | (9.55) D | | - | | - | | (11.23) |
| Total distributions | | (7.02) | | (9.76) E | | (.93) | | (.29) | | (11.33) |
| Net asset value, end of period | $ | 124.77 | $ | 131.98 | $ | 121.44 | $ | 94.72 | $ | 89.28 |
Total Return F | | (.64)% | | 16.85% | | 29.43% | | 6.39% | | 9.61% |
Ratios to Average Net Assets C,G,H | | | | | | | | | | |
| Expenses before reductions | | .73% | | .71% | | .73% | | .75% | | .76% |
| Expenses net of fee waivers, if any | | .73% | | .71% | | .73% | | .75% | | .76% |
| Expenses net of all reductions | | .73% | | .71% | | .73% | | .75% | | .76% |
| Net investment income (loss) | | .21% | | .22% | | .05% | | .25% | | .14% |
| Supplemental Data | | | | | | | | | | |
| Net assets, end of period (000 omitted) | $ | 1,708,702 | $ | 1,214,032 | $ | 1,100,913 | $ | 1,003,206 | $ | 1,343,070 |
Portfolio turnover rate I | | 30% | | 35% | | 34% | | 37% | | 60% |
A For the year ended February 29.
B Calculated based on average shares outstanding during the period.
C Net investment income (loss) is affected by the timing of the declaration of dividends by any underlying mutual funds or exchange-traded funds (ETFs). Net investment income (loss) of any mutual funds or ETFs is not included in the Fund's net investment income (loss) ratio.
D The amount shown reflects reclassifications related to book to tax differences that were made in the year shown.
E Total distributions per share do not sum due to rounding.
F Total returns would have been lower if certain expenses had not been reduced during the applicable periods shown.
G Fees and expenses of any underlying mutual funds or exchange-traded funds (ETFs) are not included in the Fund's expense ratio. The Fund indirectly bears its proportionate share of these expenses. For additional expense information related to investments in Fidelity Central Funds, please refer to the "Investments in Fidelity Central Funds" note found in the Notes to Financial Statements section of the most recent Annual or Semi-Annual report.
H Expense ratios reflect operating expenses of the class. Expenses before reductions do not reflect amounts reimbursed, waived, or reduced through arrangements with the investment adviser, brokerage services, or other offset arrangements, if applicable, and do not represent the amount paid by the class during periods when reimbursements, waivers or reductions occur.
I Amount does not include the portfolio activity of any underlying mutual funds or exchange-traded funds (ETFs).
Average annual total return reflects the change in the value of an investment, assuming reinvestment of distributions from dividend income and capital gains (the profits earned upon the sale of securities that have grown in value, if any) and assuming a constant rate of performance each year. The hypothetical investment and the average annual total returns do not reflect the deduction of taxes that a shareholder would pay on fund distributions or the redemption of fund shares. During periods of reimbursement by Fidelity, a fund's total return will be greater than it would be had the reimbursement not occurred. How a fund did yesterday is no guarantee of how it will do tomorrow.
| Average Annual Total Returns |
| | | | |
Periods ended February 28, 2023 | Past 1 year | Past 5 years | Past 10 years |
| Medical Technology and Devices Portfolio | -11.64% | 11.79% | 15.99% |
| $10,000 Over 10 Years |
| |
Let's say hypothetically that $10,000 was invested in Medical Technology and Devices Portfolio on February 28, 2013. The chart shows how the value of your investment would have changed, and also shows how the S&P 500® Index performed over the same period. |
|
|
Medical Technology and Devices Portfolio
Market Recap:
U.S. equities returned -7.69% for the 12 months ending February 28, 2023, according to the S&P 500 ® index. The new year began with an encouraging upturn in January (+6.28%), but stocks lost momentum in February (-2.44%) amid higher-than-expected inflation and strong jobs data. Investors took these as signs that the economy continued to run hot, even after a year of historic policy adjustment by the Federal Reserve aimed at cooling economic growth. Record inflation in 2022 prompted the Fed to aggressively tighten monetary policy, and market interest rates eclipsed their highest level in a decade, stoking recession fears and sending stocks into bear market territory. Since March 2022, the central bank has hiked its benchmark rate eight times, by 4.5 percentage points - the fastest-ever pace of monetary tightening - while also shrinking its massive asset portfolio. The latest bump came on February 2, along with a signal that the Fed plans to lift rates in March while it considers whether and when to pause increases. Against this dynamic backdrop, stocks struggled to gain traction until a strong rally ignited heading into the summer. But in September, the index returned -9.21%, one of its worst monthly results ever, before advancing 7.56% in Q4, as risky assets regained favor. For the full 12 months, value stocks handily outpaced growth. The headwind for the latter was most pronounced in the growth-oriented communication services (-25%) and consumer discretionary (-18%) sectors. In sharp contrast, energy gained 24%.
Comments from Portfolio Manager Eddie Yoon:
For the fiscal year ending February 28, 2023, the fund returned -11.64%, outperforming the -13.45% result of the MSCI U.S. IMI Custom Health Care Technology and Equipment 25/50 Linked Index, but underperforming the broad-based S&P 500 ® index. The top contributor to performance versus the industry index were stock picks in health care equipment. An overweighting in life sciences tools & services and security selection in health care technology also helped. The fund's biggest individual relative contributor was an outsized stake in Penumbra, which gained about 18% the past year. The company was among our biggest holdings. Also bolstering performance was our overweighting in Boston Scientific, which gained 6%. Boston Scientific was among our largest holdings. Avoiding Baxter Intl, an index component that returned -52%, also helped relative performance. The fund's foreign holdings also contributed overall despite a broadly strong U.S. dollar. In contrast, the biggest detractor from performance versus the industry index was stock selection in life sciences tools & services. Weak stock selection in specialty stores and personal products - two groups that were not part of the index - also hindered the fund's relative result. The fund's biggest individual relative detractor was an outsized stake in Tandem Diabetes Care, which returned -68% the past 12 months. Also hindering performance was our overweighting in Nevro, which returned -56%. Also hurting performance was an underweighting in Dexcom, which gained roughly 7%. We decreased our position the past year.
The views expressed above reflect those of the portfolio manager(s) only through the end of the period as stated on the cover of this report and do not necessarily represent the views of Fidelity or any other person in the Fidelity organization. Any such views are subject to change at any time based upon market or other conditions and Fidelity disclaims any responsibility to update such views. These views may not be relied on as investment advice and, because investment decisions for a Fidelity fund are based on numerous factors, may not be relied on as an indication of trading intent on behalf of any Fidelity fund.
Medical Technology and Devices Portfolio
Top Holdings (% of Fund's net assets) |
| |
| Thermo Fisher Scientific, Inc. | 16.3 | |
| Danaher Corp. | 11.6 | |
| Boston Scientific Corp. | 11.4 | |
| Stryker Corp. | 5.7 | |
| Penumbra, Inc. | 5.1 | |
| Insulet Corp. | 4.6 | |
| IQVIA Holdings, Inc. | 4.4 | |
| Masimo Corp. | 3.5 | |
| Abbott Laboratories | 3.5 | |
| ResMed, Inc. | 3.3 | |
| | 69.4 | |
| |
| Industries (% of Fund's net assets) |
| |
| Health Care Equipment & Supplies | 48.2 | |
| Life Sciences Tools & Services | 41.2 | |
| Biotechnology | 4.6 | |
| Health Care Technology | 4.2 | |
| Personal Products | 0.6 | |
| Health Care Providers & Services | 0.5 | |
| Textiles, Apparel & Luxury Goods | 0.4 | |
| Specialty Retail | 0.2 | |
| Professional Services | 0.2 | |
| Pharmaceuticals | 0.1 | |
| |
Medical Technology and Devices Portfolio
Showing Percentage of Net Assets
| Common Stocks - 96.9% |
| | | Shares | Value ($) |
| Biotechnology - 3.2% | | | |
| Biotechnology - 3.2% | | | |
| Abcam PLC ADR (a) | | 2,800,000 | 40,348,000 |
| Exact Sciences Corp. (a) | | 600,000 | 37,398,000 |
| Natera, Inc. (a)(b) | | 840,000 | 40,782,000 |
| Repligen Corp. (a)(b) | | 600,000 | 104,622,000 |
| Saluda Medical Pty Ltd. warrants (a)(c)(d) | | 235,185 | 585,611 |
| | | | 223,735,611 |
| Health Care Equipment & Supplies - 47.7% | | | |
| Health Care Equipment - 46.8% | | | |
| Abbott Laboratories | | 2,340,000 | 238,024,800 |
| Angelalign Technology, Inc. (e) | | 1,000,000 | 13,708,054 |
| Boston Scientific Corp. (a) | | 16,800,000 | 784,896,000 |
| DexCom, Inc. (a) | | 700,000 | 77,707,000 |
| Inspire Medical Systems, Inc. (a) | | 250,000 | 64,982,500 |
| Insulet Corp. (a)(b) | | 1,140,000 | 315,050,400 |
| Intuitive Surgical, Inc. (a) | | 700,000 | 160,573,000 |
| iRhythm Technologies, Inc. (a) | | 424,559 | 49,962,103 |
| Masimo Corp. (a) | | 1,450,000 | 242,599,500 |
| Nevro Corp. (a)(f) | | 2,000,000 | 62,880,000 |
| Novocure Ltd. (a) | | 800,000 | 61,576,000 |
| Outset Medical, Inc. (a) | | 1,000,000 | 22,810,000 |
| Penumbra, Inc. (a)(b) | | 1,342,460 | 349,026,175 |
| PROCEPT BioRobotics Corp. (a)(b) | | 1,280,000 | 47,936,000 |
| ResMed, Inc. | | 1,063,647 | 226,556,811 |
| Shockwave Medical, Inc. (a) | | 210,000 | 39,950,400 |
| Stryker Corp. | | 1,500,000 | 394,320,000 |
| Tandem Diabetes Care, Inc. (a) | | 2,180,000 | 78,174,800 |
| | | | 3,230,733,543 |
| Health Care Supplies - 0.9% | | | |
| Nanosonics Ltd. (a) | | 8,500,000 | 25,967,211 |
| The Cooper Companies, Inc. | | 118,000 | 38,582,460 |
| | | | 64,549,671 |
TOTAL HEALTH CARE EQUIPMENT & SUPPLIES | | | 3,295,283,214 |
| Health Care Providers & Services - 0.3% | | | |
| Health Care Services - 0.3% | | | |
| LifeStance Health Group, Inc. (a) | | 3,861,743 | 19,772,124 |
| Health Care Technology - 3.5% | | | |
| Health Care Technology - 3.5% | | | |
| DNA Script (a)(c)(d) | | 1,220 | 845,492 |
| DNA Script (a)(c)(d) | | 4,668 | 3,235,046 |
| Doximity, Inc. (a)(b) | | 1,080,000 | 36,320,400 |
| Evolent Health, Inc. (a) | | 396,500 | 13,881,465 |
| Medlive Technology Co. Ltd. (e) | | 5,000,000 | 6,102,377 |
| Phreesia, Inc. (a) | | 1,670,000 | 61,456,000 |
| Veeva Systems, Inc. Class A (a) | | 700,000 | 115,962,000 |
| | | | 237,802,780 |
| Life Sciences Tools & Services - 41.2% | | | |
| Life Sciences Tools & Services - 41.2% | | | |
| 10X Genomics, Inc. Class B (a)(e) | | 392,772 | 18,664,525 |
| Agilent Technologies, Inc. | | 500,000 | 70,985,000 |
| Bio-Techne Corp. | | 870,000 | 63,196,800 |
| Bruker Corp. | | 1,800,000 | 124,056,000 |
| Danaher Corp. | | 3,240,000 | 801,997,200 |
| Eurofins Scientific SA | | 500,000 | 34,904,100 |
| IQVIA Holdings, Inc. (a) | | 1,475,000 | 307,493,250 |
| Lonza Group AG | | 90,000 | 53,607,754 |
| Olink Holding AB ADR (a)(b) | | 1,227,800 | 28,779,632 |
| Pacific Biosciences of California, Inc. (a)(b) | | 2,000,000 | 18,160,000 |
| Sartorius Stedim Biotech | | 160,000 | 52,241,918 |
| Seer, Inc. (a)(b) | | 2,800,000 | 11,452,000 |
| Thermo Fisher Scientific, Inc. | | 2,080,000 | 1,126,860,800 |
| West Pharmaceutical Services, Inc. | | 435,000 | 137,908,050 |
| | | | 2,850,307,029 |
| Personal Products - 0.6% | | | |
| Personal Products - 0.6% | | | |
| The Beauty Health Co. (a)(b) | | 155,239 | 1,957,564 |
| The Beauty Health Co. (a)(c) | | 3,000,000 | 37,830,000 |
| | | | 39,787,564 |
| Professional Services - 0.2% | | | |
| Research & Consulting Services - 0.2% | | | |
| Clarivate Analytics PLC (a)(b) | | 1,500,000 | 15,195,000 |
| Specialty Retail - 0.2% | | | |
| Specialty Stores - 0.2% | | | |
| Warby Parker, Inc. (a)(b) | | 1,200,000 | 15,612,000 |
| TOTAL COMMON STOCKS (Cost $4,107,275,816) | | | 6,697,495,322 |
| | | | |
| Convertible Preferred Stocks - 3.0% |
| | | Shares | Value ($) |
| Biotechnology - 1.4% | | | |
| Biotechnology - 1.4% | | | |
| Asimov, Inc. Series B (a)(c)(d) | | 97,985 | 4,990,376 |
| Caris Life Sciences, Inc. Series D (a)(c)(d) | | 2,803,935 | 15,702,036 |
| Element Biosciences, Inc. Series B (a)(c)(d) | | 2,385,223 | 39,236,918 |
| ElevateBio LLC Series C (a)(c)(d) | | 214,700 | 682,746 |
| Inscripta, Inc. Series D (a)(c)(d) | | 3,938,731 | 16,660,832 |
| Saluda Medical Pty Ltd. Series D (a)(c)(d) | | 1,567,904 | 18,140,649 |
| | | | 95,413,557 |
| Health Care Equipment & Supplies - 0.2% | | | |
| Health Care Supplies - 0.2% | | | |
| Kardium, Inc. Series D6 (a)(c)(d) | | 13,783,189 | 13,645,357 |
| Health Care Providers & Services - 0.2% | | | |
| Health Care Services - 0.2% | | | |
| Conformal Medical, Inc. Series C (a)(c)(d) | | 2,605,625 | 9,276,025 |
| dMed Biopharmaceutical Co. Ltd. Series C (a)(c)(d) | | 309,255 | 3,355,417 |
| | | | 12,631,442 |
| Health Care Technology - 0.7% | | | |
| Health Care Technology - 0.7% | | | |
| Aledade, Inc.: | | | |
| Series B1 (a)(c)(d) | | 175,232 | 9,346,875 |
| Series E1 (c)(d) | | 58,567 | 3,123,964 |
| DNA Script: | | | |
| Series B (a)(c)(d) | | 59 | 40,889 |
| Series C (a)(c)(d) | | 28,249 | 19,577,297 |
| Omada Health, Inc. Series E (a)(c)(d) | | 2,182,939 | 7,814,922 |
| PrognomIQ, Inc.: | | | |
| Series A5 (a)(c)(d) | | 833,333 | 1,366,666 |
| Series B (a)(c)(d) | | 2,735,093 | 6,372,767 |
| Series C (c)(d) | | 752,098 | 2,000,581 |
| | | | 49,643,961 |
| Pharmaceuticals - 0.1% | | | |
| Pharmaceuticals - 0.1% | | | |
| Galvanize Therapeutics Series B (c)(d) | | 3,641,139 | 6,153,525 |
| Textiles, Apparel & Luxury Goods - 0.4% | | | |
| Textiles - 0.4% | | | |
| Freenome, Inc.: | | | |
| Series C (a)(c)(d) | | 2,268,156 | 17,668,935 |
| Series D (a)(c)(d) | | 1,325,855 | 10,832,235 |
| | | | 28,501,170 |
| TOTAL CONVERTIBLE PREFERRED STOCKS (Cost $198,835,399) | | | 205,989,012 |
| | | | |
| Preferred Securities - 0.3% |
| | | Principal Amount (g) | Value ($) |
| Health Care Equipment & Supplies - 0.3% | | | |
| Health Care Supplies - 0.3% | | | |
Kardium, Inc. 0% (c)(d)(h) (Cost $19,551,861) | | 19,551,861 | 19,043,513 |
| | | | |
| Money Market Funds - 1.7% |
| | | Shares | Value ($) |
| Fidelity Cash Central Fund 4.63% (i) | | 12,566,738 | 12,569,252 |
| Fidelity Securities Lending Cash Central Fund 4.63% (i)(j) | | 104,968,993 | 104,979,490 |
| TOTAL MONEY MARKET FUNDS (Cost $117,548,742) | | | 117,548,742 |
| | | | |
| TOTAL INVESTMENT IN SECURITIES - 101.9% (Cost $4,443,211,818) | 7,040,076,589 |
NET OTHER ASSETS (LIABILITIES) - (1.9)% | (128,591,920) |
| NET ASSETS - 100.0% | 6,911,484,669 |
| | |
Legend
| (b) | Security or a portion of the security is on loan at period end. |
| (c) | Restricted securities (including private placements) - Investment in securities not registered under the Securities Act of 1933 (excluding 144A issues). At the end of the period, the value of restricted securities (excluding 144A issues) amounted to $267,528,674 or 3.9% of net assets. |
| (e) | Security exempt from registration under Rule 144A of the Securities Act of 1933. These securities may be resold in transactions exempt from registration, normally to qualified institutional buyers. At the end of the period, the value of these securities amounted to $38,474,956 or 0.6% of net assets. |
| (g) | Amount is stated in United States dollars unless otherwise noted. |
| (h) | Security is perpetual in nature with no stated maturity date. |
| (i) | Affiliated fund that is generally available only to investment companies and other accounts managed by Fidelity Investments. The rate quoted is the annualized seven-day yield of the fund at period end. A complete unaudited listing of the fund's holdings as of its most recent quarter end is available upon request. In addition, each Fidelity Central Fund's financial statements, which are not covered by the Fund's Report of Independent Registered Public Accounting Firm, are available on the SEC's website or upon request. |
| (j) | Investment made with cash collateral received from securities on loan. |
| Additional information on each restricted holding is as follows: |
| Security | Acquisition Date | Acquisition Cost ($) |
| Aledade, Inc. Series B1 | 5/07/21 | 6,709,756 |
| | | |
| Aledade, Inc. Series E1 | 5/20/22 | 2,917,480 |
| | | |
| Asimov, Inc. Series B | 10/29/21 | 9,081,318 |
| | | |
| Caris Life Sciences, Inc. Series D | 5/11/21 | 22,711,874 |
| | | |
| Conformal Medical, Inc. Series C | 7/24/20 | 9,554,996 |
| | | |
| dMed Biopharmaceutical Co. Ltd. Series C | 12/01/20 | 4,392,395 |
| | | |
| DNA Script | 12/17/21 | 4,714,776 |
| | | |
| DNA Script Series B | 12/17/21 | 47,244 |
| | | |
| DNA Script Series C | 10/01/21 | 24,572,393 |
| | | |
| Element Biosciences, Inc. Series B | 12/13/19 | 12,500,000 |
| | | |
| ElevateBio LLC Series C | 3/09/21 | 900,667 |
| | | |
| Freenome, Inc. Series C | 8/14/20 | 14,999,996 |
| | | |
| Freenome, Inc. Series D | 11/22/21 | 9,999,996 |
| | | |
| Galvanize Therapeutics Series B | 3/29/22 | 6,303,849 |
| | | |
| Inscripta, Inc. Series D | 11/13/20 | 18,000,001 |
| | | |
| Kardium, Inc. Series D6 | 12/30/20 | 14,001,515 |
| | | |
| Kardium, Inc. 0% | 12/30/20 | 19,551,861 |
| | | |
| Omada Health, Inc. Series E | 12/22/21 | 13,087,156 |
| | | |
| PrognomIQ, Inc. Series A5 | 8/20/20 | 503,333 |
| | | |
| PrognomIQ, Inc. Series B | 9/11/20 | 6,249,999 |
| | | |
| PrognomIQ, Inc. Series C | 2/16/22 | 2,301,420 |
| | | |
| Saluda Medical Pty Ltd. Series D | 1/20/22 | 20,000,011 |
| | | |
| Saluda Medical Pty Ltd. warrants | 1/20/22 | 0 |
| | | |
| The Beauty Health Co. | 12/08/20 | 30,000,000 |
| | | |
Affiliated Central Funds
Fiscal year to date information regarding the Fund's investments in Fidelity Central Funds, including the ownership percentage, is presented below.
| Affiliate | Value, beginning of period ($) | Purchases ($) | Sales Proceeds ($) | Dividend Income ($) | Realized Gain (loss) ($) | Change in Unrealized appreciation (depreciation) ($) | Value, end of period ($) | % ownership, end of period |
| Fidelity Cash Central Fund 4.63% | 21,433,102 | 1,229,311,033 | 1,238,174,883 | 1,366,847 | - | - | 12,569,252 | 0.0% |
| Fidelity Securities Lending Cash Central Fund 4.63% | 73,452,626 | 1,009,017,643 | 977,490,779 | 2,117,441 | - | - | 104,979,490 | 0.3% |
| Total | 94,885,728 | 2,238,328,676 | 2,215,665,662 | 3,484,288 | - | - | 117,548,742 | |
| | | | | | | | | |
Amounts in the dividend income column in the above table include any capital gain distributions from underlying funds, which are presented in the corresponding line item in the Statement of Operations, if applicable.
Amount for Fidelity Securities Lending Cash Central Fund represents the income earned on investing cash collateral, less rebates paid to borrowers and any lending agent fees associated with the loan, plus any premium payments received for lending certain types of securities.
Amounts included in the purchases and sales proceeds columns may include in-kind transactions, if applicable.
Other Affiliated Issuers
An affiliated company is a company in which the Fund has ownership of at least 5% of the voting securities. Fiscal year to date transactions with companies which are or were affiliates are presented in the table below. Certain corporate actions, such as mergers, are excluded from the amounts in this table if applicable. A dash in the Value end of period ($) column means either the issuer is no longer held at period end, or the issuer is held at period end but is no longer an affiliate.
| Affiliate | Value, beginning of period ($) | Purchases ($) | Sales Proceeds ($) | Dividend Income ($) | Realized Gain (loss) ($) | Change in Unrealized appreciation (depreciation) ($) | Value, end of period ($) |
| Nanosonics Ltd. | 63,907,137 | - | 37,068,368 | - | 5,841,844 | (6,713,402) | - |
| Nevro Corp. | 91,776,000 | 63,146,247 | 30,147,923 | - | (49,499,645) | (12,394,679) | 62,880,000 |
| Total | 155,683,137 | 63,146,247 | 67,216,291 | - | (43,657,801) | (19,108,081) | 62,880,000 |
Amounts included in the purchases and sales proceeds columns may include in-kind transactions, if applicable.
Investment Valuation
The following is a summary of the inputs used, as of February 28, 2023, involving the Fund's assets and liabilities carried at fair value. The inputs or methodology used for valuing securities may not be an indication of the risk associated with investing in those securities. For more information on valuation inputs, and their aggregation into the levels used below, please refer to the Investment Valuation section in the accompanying Notes to Financial Statements.
| Valuation Inputs at Reporting Date: |
| Description | Total ($) | Level 1 ($) | Level 2 ($) | Level 3 ($) |
Investments in Securities: | | | | |
|
| Common Stocks | 6,697,495,322 | 6,639,221,419 | 53,607,754 | 4,666,149 |
|
| Convertible Preferred Stocks | 205,989,012 | - | - | 205,989,012 |
|
| Preferred Securities | 19,043,513 | - | - | 19,043,513 |
|
| Money Market Funds | 117,548,742 | 117,548,742 | - | - |
| Total Investments in Securities: | 7,040,076,589 | 6,756,770,161 | 53,607,754 | 229,698,674 |
The following is a reconciliation of Investments in Securities for which Level 3 inputs were used in determining value:
| |
| Investments in Securities: | |
| Convertible Preferred Stocks | | | |
| Beginning Balance | $ | 240,783,918 | |
| Net Realized Gain (Loss) on Investment Securities | | - | |
| Net Unrealized Gain (Loss) on Investment Securities | | (44,016,235) | |
| Cost of Purchases | | 9,221,329 | |
| Proceeds of Sales | | - | |
| Amortization/Accretion | | - | |
| Transfers into Level 3 | | - | |
| Transfers out of Level 3 | | - | |
| Ending Balance | $ | 205,989,012 | |
| The change in unrealized gain (loss) for the period attributable to Level 3 securities held at February 28, 2023 | $ | (44,016,235) | |
| Other Investments in Securities | | | |
| Beginning Balance | $ | 25,605,694 | |
| Net Realized Gain (Loss) on Investment Securities | | - | |
| Net Unrealized Gain (Loss) on Investment Securities | | (1,896,032) | |
| Cost of Purchases | | - | |
| Proceeds of Sales | | - | |
| Amortization/Accretion | | - | |
| Transfers into Level 3 | | - | |
| Transfers out of Level 3 | | - | |
| Ending Balance | $ | 23,709,662 | |
| The change in unrealized gain (loss) for the period attributable to Level 3 securities held at February 28, 2023 | $ | (1,896,032) | |
| The information used in the above reconciliation represents fiscal year to date activity for any Investments in Securities identified as using Level 3 inputs at either the beginning or the end of the current fiscal period. Cost of purchases and proceeds of sales may include securities received and/or delivered through in-kind transactions. Transfers into Level 3 were attributable to a lack of observable market data resulting from decreases in market activity, decreases in liquidity, security restructurings or corporate actions. Transfers out of Level 3 were attributable to observable market data becoming available for those securities. Transfers in or out of Level 3 represent the beginning value of any Security or Instrument where a change in the pricing level occurred from the beginning to the end of the period. The cost of purchases and the proceeds of sales may include securities received or delivered through corporate actions or exchanges. Realized and unrealized gains (losses) disclosed in the reconciliation are included in Net Gain (Loss) on the Fund's Statement of Operations. | |
Medical Technology and Devices Portfolio
| Statement of Assets and Liabilities |
| | | | February 28, 2023 |
| | | | | |
| Assets | | | | |
| Investment in securities, at value (including securities loaned of $103,361,313) - See accompanying schedule: | | | | |
Unaffiliated issuers (cost $4,207,610,407) | $ | 6,859,647,847 | | |
Fidelity Central Funds (cost $117,548,742) | | 117,548,742 | | |
Other affiliated issuers (cost $118,052,669) | | 62,880,000 | | |
| | | | | |
| | | | | |
| Total Investment in Securities (cost $4,443,211,818) | | | $ | 7,040,076,589 |
| Foreign currency held at value (cost $84) | | | | 83 |
| Receivable for investments sold | | | | 60,512,509 |
| Receivable for fund shares sold | | | | 734,870 |
| Dividends receivable | | | | 851,175 |
| Distributions receivable from Fidelity Central Funds | | | | 376,931 |
| Prepaid expenses | | | | 15,703 |
| Other receivables | | | | 230,636 |
Total assets | | | | 7,102,798,496 |
| Liabilities | | | | |
| Payable for investments purchased | $ | 66,888,599 | | |
| Payable for fund shares redeemed | | 14,995,911 | | |
| Accrued management fee | | 3,158,294 | | |
| Other affiliated payables | | 1,025,159 | | |
| Other payables and accrued expenses | | 274,939 | | |
| Collateral on securities loaned | | 104,970,925 | | |
| Total Liabilities | | | | 191,313,827 |
| Net Assets | | | $ | 6,911,484,669 |
| Net Assets consist of: | | | | |
| Paid in capital | | | $ | 4,664,629,971 |
| Total accumulated earnings (loss) | | | | 2,246,854,698 |
| Net Assets | | | $ | 6,911,484,669 |
Net Asset Value , offering price and redemption price per share ($6,911,484,669 ÷ 112,133,731 shares) | | | $ | 61.64 |
| Statement of Operations |
| | | | Year ended February 28, 2023 |
| Investment Income | | | | |
| Dividends | | | $ | 19,804,120 |
| Income from Fidelity Central Funds (including $2,117,441 from security lending) | | | | 3,484,288 |
| Total Income | | | | 23,288,408 |
| Expenses | | | | |
| Management fee | $ | 38,848,557 | | |
| Transfer agent fees | | 11,566,502 | | |
| Accounting fees | | 1,086,483 | | |
| Custodian fees and expenses | | 75,956 | | |
| Independent trustees' fees and expenses | | 25,455 | | |
| Registration fees | | 32,525 | | |
| Audit | | 41,138 | | |
| Legal | | 4,741 | | |
| Interest | | 2,108 | | |
| Miscellaneous | | 41,425 | | |
| Total expenses before reductions | | 51,724,890 | | |
| Expense reductions | | (266,416) | | |
| Total expenses after reductions | | | | 51,458,474 |
| Net Investment income (loss) | | | | (28,170,066) |
| Realized and Unrealized Gain (Loss) | | | | |
| Net realized gain (loss) on: | | | | |
| Investment Securities: | | | | |
| Unaffiliated issuers | | (202,286,083) | | |
| Affiliated issuers | | (43,657,801) | | |
| Foreign currency transactions | | (91,142) | | |
| Total net realized gain (loss) | | | | (246,035,026) |
| Change in net unrealized appreciation (depreciation) on: | | | | |
| Investment Securities: | | | | |
| Unaffiliated issuers | | (752,446,539) | | |
| Affiliated issuers | | (19,108,081) | | |
| Assets and liabilities in foreign currencies | | (7,069) | | |
| Total change in net unrealized appreciation (depreciation) | | | | (771,561,689) |
| Net gain (loss) | | | | (1,017,596,715) |
| Net increase (decrease) in net assets resulting from operations | | | $ | (1,045,766,781) |
| Statement of Changes in Net Assets |
| |
| | Year ended February 28, 2023 | | Year ended February 28, 2022 |
| Increase (Decrease) in Net Assets | | | | |
| Operations | | | | |
| Net investment income (loss) | $ | (28,170,066) | $ | (44,939,672) |
| Net realized gain (loss) | | (246,035,026) | | 498,712,415 |
| Change in net unrealized appreciation (depreciation) | | (771,561,689) | | (241,663,649) |
| Net increase (decrease) in net assets resulting from operations | | (1,045,766,781) | | 212,109,094 |
| Distributions to shareholders | | (137,786,409) | | (808,325,364) |
| Share transactions | | | | |
| Proceeds from sales of shares | | 418,873,849 | | 1,949,163,820 |
| Reinvestment of distributions | | 128,702,740 | | 757,192,690 |
| Cost of shares redeemed | | (1,358,373,047) | | (1,877,605,232) |
Net increase (decrease) in net assets resulting from share transactions | | (810,796,458) | | 828,751,278 |
| Total increase (decrease) in net assets | | (1,994,349,648) | | 232,535,008 |
| | | | | |
| Net Assets | | | | |
| Beginning of period | | 8,905,834,317 | | 8,673,299,309 |
| End of period | $ | 6,911,484,669 | $ | 8,905,834,317 |
| | | | | |
| Other Information | | | | |
| Shares | | | | |
| Sold | | 6,616,291 | | 24,345,738 |
| Issued in reinvestment of distributions | | 1,786,046 | | 9,855,790 |
| Redeemed | | (22,012,597) | | (24,120,700) |
| Net increase (decrease) | | (13,610,260) | | 10,080,828 |
| | | | | |
Financial Highlights
| Medical Technology and Devices Portfolio |
| |
| Years ended February 28, | | 2023 | | 2022 | | 2021 | | 2020 A | | 2019 |
Selected Per-Share Data | | | | | | | | | | |
| Net asset value, beginning of period | $ | 70.83 | $ | 74.99 | $ | 55.88 | $ | 52.92 | $ | 46.09 |
| Income from Investment Operations | | | | | | | | | | |
Net investment income (loss) B,C | | (.24) | | (.37) | | (.24) | | (.08) | | (.04) |
| Net realized and unrealized gain (loss) | | (7.84) | | 2.97 | | 24.19 | | 4.10 | | 10.40 |
| Total from investment operations | | (8.08) | | 2.60 | | 23.95 | | 4.02 | | 10.36 |
| Distributions from net realized gain | | (1.11) | | (6.76) | | (4.84) | | (1.06) | | (3.53) |
| Total distributions | | (1.11) | | (6.76) | | (4.84) | | (1.06) | | (3.53) |
| Net asset value, end of period | $ | 61.64 | $ | 70.83 | $ | 74.99 | $ | 55.88 | $ | 52.92 |
Total Return D | | (11.64)% | | 2.95% | | 44.20% | | 7.46% | | 23.85% |
Ratios to Average Net Assets C,E,F | | | | | | | | | | |
| Expenses before reductions | | .70% | | .68% | | .70% | | .71% | | .73% |
| Expenses net of fee waivers, if any | | .70% | | .68% | | .70% | | .71% | | .73% |
| Expenses net of all reductions | | .70% | | .68% | | .70% | | .71% | | .73% |
| Net investment income (loss) | | (.38)% | | (.46)% | | (.36)% | | (.15)% | | (.07)% |
| Supplemental Data | | | | | | | | | | |
| Net assets, end of period (000 omitted) | $ | 6,911,485 | $ | 8,905,834 | $ | 8,673,299 | $ | 6,058,766 | $ | 6,787,645 |
Portfolio turnover rate G | | 37% | | 32% | | 58% | | 35% | | 43% |
A For the year ended February 29.
B Calculated based on average shares outstanding during the period.
C Net investment income (loss) is affected by the timing of the declaration of dividends by any underlying mutual funds or exchange-traded funds (ETFs). Net investment income (loss) of any mutual funds or ETFs is not included in the Fund's net investment income (loss) ratio.
D Total returns would have been lower if certain expenses had not been reduced during the applicable periods shown.
E Fees and expenses of any underlying mutual funds or exchange-traded funds (ETFs) are not included in the Fund's expense ratio. The Fund indirectly bears its proportionate share of these expenses. For additional expense information related to investments in Fidelity Central Funds, please refer to the "Investments in Fidelity Central Funds" note found in the Notes to Financial Statements section of the most recent Annual or Semi-Annual report.
F Expense ratios reflect operating expenses of the class. Expenses before reductions do not reflect amounts reimbursed, waived, or reduced through arrangements with the investment adviser, brokerage services, or other offset arrangements, if applicable, and do not represent the amount paid by the class during periods when reimbursements, waivers or reductions occur.
G Amount does not include the portfolio activity of any underlying mutual funds or exchange-traded funds (ETFs).
Average annual total return reflects the change in the value of an investment, assuming reinvestment of distributions from dividend income and capital gains (the profits earned upon the sale of securities that have grown in value, if any) and assuming a constant rate of performance each year. The hypothetical investment and the average annual total returns do not reflect the deduction of taxes that a shareholder would pay on fund distributions or the redemption of fund shares. During periods of reimbursement by Fidelity, a fund's total return will be greater than it would be had the reimbursement not occurred. How a fund did yesterday is no guarantee of how it will do tomorrow.
| Average Annual Total Returns |
| | | | |
Periods ended February 28, 2023 | Past 1 year | Past 5 years | Past 10 years |
| Pharmaceuticals Portfolio | 1.60% | 10.48% | 10.57% |
| $10,000 Over 10 Years |
| |
Let's say hypothetically that $10,000 was invested in Pharmaceuticals Portfolio on February 28, 2013. The chart shows how the value of your investment would have changed, and also shows how the S&P 500® Index performed over the same period. |
|
|
Pharmaceuticals Portfolio
Market Recap:
U.S. equities returned -7.69% for the 12 months ending February 28, 2023, according to the S&P 500 ® index. The new year began with an encouraging upturn in January (+6.28%), but stocks lost momentum in February (-2.44%) amid higher-than-expected inflation and strong jobs data. Investors took these as signs that the economy continued to run hot, even after a year of historic policy adjustment by the Federal Reserve aimed at cooling economic growth. Record inflation in 2022 prompted the Fed to aggressively tighten monetary policy, and market interest rates eclipsed their highest level in a decade, stoking recession fears and sending stocks into bear market territory. Since March 2022, the central bank has hiked its benchmark rate eight times, by 4.5 percentage points - the fastest-ever pace of monetary tightening - while also shrinking its massive asset portfolio. The latest bump came on February 2, along with a signal that the Fed plans to lift rates in March while it considers whether and when to pause increases. Against this dynamic backdrop, stocks struggled to gain traction until a strong rally ignited heading into the summer. But in September, the index returned -9.21%, one of its worst monthly results ever, before advancing 7.56% in Q4, as risky assets regained favor. For the full 12 months, value stocks handily outpaced growth. The headwind for the latter was most pronounced in the growth-oriented communication services (-25%) and consumer discretionary (-18%) sectors. In sharp contrast, energy gained 24%.
Comments from Portfolio Manager Karim Suwwan de Felipe:
For the fiscal year ending February 28, 2023, the fund gained 1.60%, outperforming the -1.60% result of the MSCI North America IMI + ADR Custom Pharmaceuticals 25/50 Linked Index, as well as the broad-based S&P 500 ® index. Versus the industry index, security selection was the primary contributor, led by the pharmaceuticals sector. The fund's largest individual relative contributor was an outsized stake in Eli Lilly, which gained roughly 25% the past year. It was the fund's largest holding. Also helping performance was an underweighting in GSK, which returned -32%. Avoiding Pfizer, an index component that returned about -11%, also helped relative performance. Conversely, the largest detractor from performance versus the industry index were stock picks in life sciences tools & services. Weak stock picks in health care equipment also hurt the fund's relative performance. Our non-index investment in Roche Holdings was the fund's biggest individual relative detractor, due to its roughly -23% result. This was among our largest holdings. Another notable relative detractor was our lighter-than-index stake in Merck (+43%). The company was among the fund's biggest holdings. Also hurting performance was an underweighting in Novo-Nordisk, which gained about 39%. The company was among the largest holdings at period end. The fund's foreign holdings also detracted overall, partly due to a broadly strong U.S. dollar. Notable changes in positioning include increased exposure to the biotechnology subindustry.
The views expressed above reflect those of the portfolio manager(s) only through the end of the period as stated on the cover of this report and do not necessarily represent the views of Fidelity or any other person in the Fidelity organization. Any such views are subject to change at any time based upon market or other conditions and Fidelity disclaims any responsibility to update such views. These views may not be relied on as investment advice and, because investment decisions for a Fidelity fund are based on numerous factors, may not be relied on as an indication of trading intent on behalf of any Fidelity fund.
Pharmaceuticals Portfolio
Top Holdings (% of Fund's net assets) |
| |
| Eli Lilly & Co. | 14.3 | |
| AstraZeneca PLC sponsored ADR | 10.9 | |
| Novo Nordisk A/S Series B sponsored ADR | 8.8 | |
| Sanofi SA sponsored ADR | 8.2 | |
| Merck & Co., Inc. | 7.1 | |
| Royalty Pharma PLC | 4.2 | |
| Roche Holding AG (participation certificate) | 4.0 | |
| Gilead Sciences, Inc. | 3.8 | |
| UCB SA | 3.4 | |
| Merck KGaA | 3.1 | |
| | 67.8 | |
| |
| Industries (% of Fund's net assets) |
| |
| Pharmaceuticals | 74.4 | |
| Biotechnology | 20.9 | |
| Health Care Providers & Services | 1.9 | |
| Diversified Financial Services | 0.3 | |
| Software | 0.0 | |
| Food & Staples Retailing | 0.0 | |
| |
Percentages shown as 0.0% may reflect amounts less than 0.05%.
Geographic Diversification (% of Fund's net assets) |
|
* Includes Short-Term investments and Net Other Assets (Liabilities). Percentages are based on country or territory of incorporation and are adjusted for the effect of derivatives, if applicable. |
| |
Pharmaceuticals Portfolio
Showing Percentage of Net Assets
| Common Stocks - 97.0% |
| | | Shares | Value ($) |
| Biotechnology - 20.7% | | | |
| Biotechnology - 20.7% | | | |
| 2seventy bio, Inc. (a) | | 183,600 | 2,476,764 |
| ADC Therapeutics SA (a)(b) | | 419,700 | 1,510,920 |
| Alnylam Pharmaceuticals, Inc. (a) | | 29,471 | 5,642,223 |
| Apellis Pharmaceuticals, Inc. (a) | | 60,400 | 3,954,992 |
| Arcus Biosciences, Inc. (a) | | 115,100 | 2,095,971 |
| Argenx SE (a) | | 15,200 | 5,532,882 |
| Argenx SE ADR (a) | | 11,000 | 4,026,220 |
| Ascendis Pharma A/S sponsored ADR (a) | | 40,500 | 4,499,145 |
| Avidity Biosciences, Inc. (a) | | 302,800 | 7,176,360 |
| Biogen, Inc. (a) | | 61,100 | 16,488,446 |
| BioInvent International AB (a) | | 396,505 | 1,096,563 |
| Blueprint Medicines Corp. (a) | | 153,900 | 6,520,743 |
| Cullinan Oncology, Inc. (a) | | 88,100 | 994,649 |
| Cytokinetics, Inc. (a) | | 67,100 | 2,909,456 |
| Galapagos NV sponsored ADR (a) | | 36,900 | 1,383,197 |
| Generation Bio Co. (a) | | 387,856 | 1,535,910 |
| Gilead Sciences, Inc. | | 356,100 | 28,676,733 |
| Intellia Therapeutics, Inc. (a) | | 15,400 | 618,618 |
| iTeos Therapeutics, Inc. (a) | | 116,000 | 2,054,360 |
| Kalvista Pharmaceuticals, Inc. (a) | | 374,800 | 2,747,284 |
| Leap Therapeutics, Inc. warrants 1/31/26 (a) | | 606,000 | 22,749 |
| Legend Biotech Corp. ADR (a) | | 293,400 | 13,549,212 |
| Moderna, Inc. (a) | | 15,100 | 2,096,031 |
| Natera, Inc. (a) | | 96,000 | 4,660,800 |
| Oxurion NV (a)(b) | | 3,128,819 | 41,698 |
| PepGen, Inc. | | 243,600 | 3,719,772 |
| Prothena Corp. PLC (a) | | 104,100 | 5,804,616 |
| PTC Therapeutics, Inc. (a) | | 49,500 | 2,161,665 |
| Relay Therapeutics, Inc. (a)(b) | | 168,000 | 2,713,200 |
| Sarepta Therapeutics, Inc. (a) | | 101,100 | 12,347,343 |
| Synlogic, Inc. (a) | | 520,500 | 364,350 |
| uniQure B.V. (a) | | 150,300 | 3,150,288 |
| Xencor, Inc. (a) | | 123,168 | 3,957,388 |
| XOMA Corp. (a)(b) | | 53,300 | 1,134,224 |
| | | | 157,664,772 |
| Food & Staples Retailing - 0.0% | | | |
| Drug Retail - 0.0% | | | |
| MedAvail Holdings, Inc. (a) | | 3,333 | 1,239 |
| Health Care Providers & Services - 1.9% | | | |
| Health Care Services - 1.9% | | | |
| Cigna Group | | 49,500 | 14,458,950 |
| Pharmaceuticals - 74.4% | | | |
| Pharmaceuticals - 74.4% | | | |
| Acelyrin, Inc. (c) | | 317,157 | 1,972,748 |
| Acelyrin, Inc. rights (a)(c) | | 38,539 | 228,402 |
| Arvinas Holding Co. LLC (a) | | 55,600 | 1,704,140 |
| AstraZeneca PLC sponsored ADR | | 1,268,300 | 82,667,794 |
| Axsome Therapeutics, Inc. (a)(b) | | 43,400 | 2,959,446 |
| Bristol-Myers Squibb Co. | | 234,280 | 16,155,949 |
| Edgewise Therapeutics, Inc. (a) | | 532,200 | 5,098,476 |
| Eli Lilly & Co. | | 349,561 | 108,790,372 |
| GSK PLC sponsored ADR | | 345,060 | 11,825,206 |
| Harmony Biosciences Holdings, Inc. (a) | | 73,077 | 3,217,580 |
| Intra-Cellular Therapies, Inc. (a) | | 11,200 | 549,136 |
| Jazz Pharmaceuticals PLC (a) | | 31,600 | 4,436,640 |
| Johnson & Johnson | | 41,550 | 6,367,953 |
| Merck & Co., Inc. | | 508,136 | 53,984,369 |
| Merck KGaA | | 124,300 | 23,579,523 |
| Novartis AG sponsored ADR | | 150,096 | 12,626,076 |
| Novo Nordisk A/S Series B sponsored ADR | | 477,800 | 67,365,022 |
| Reata Pharmaceuticals, Inc. (a) | | 52,100 | 1,623,957 |
| Roche Holding AG (participation certificate) | | 105,596 | 30,447,443 |
| Royalty Pharma PLC | | 888,500 | 31,852,725 |
| Sanofi SA sponsored ADR | | 1,329,022 | 62,264,681 |
| Sosei Group Corp. (a) | | 181,400 | 2,939,065 |
| Structure Therapeutics, Inc. ADR | | 98,000 | 2,504,880 |
| UCB SA | | 302,000 | 25,994,839 |
| Zoetis, Inc. Class A | | 29,500 | 4,926,500 |
| | | | 566,082,922 |
| TOTAL COMMON STOCKS (Cost $579,287,424) | | | 738,207,883 |
| | | | |
| Convertible Preferred Stocks - 0.5% |
| | | Shares | Value ($) |
| Biotechnology - 0.2% | | | |
| Biotechnology - 0.2% | | | |
| Castle Creek Biosciences, Inc.: | | | |
| Series D1 (c)(d) | | 6,308 | 1,285,192 |
| Series D2 (c)(d) | | 85 | 17,318 |
| | | | 1,302,510 |
| Diversified Financial Services - 0.3% | | | |
| Other Diversified Financial Services - 0.3% | | | |
| Paragon Biosciences Emalex Capital, Inc.: | | | |
| Series C (a)(c)(d) | | 158,879 | 1,720,660 |
| Series D1 (c)(d) | | 14,400 | 155,952 |
| Series D2 (c)(d) | | 22,477 | 243,426 |
| | | | 2,120,038 |
| Pharmaceuticals - 0.0% | | | |
| Pharmaceuticals - 0.0% | | | |
| Castle Creek Pharmaceutical Holdings, Inc. Series C (a)(c)(d) | | 200 | 44,304 |
| Software - 0.0% | | | |
| Systems Software - 0.0% | | | |
| Evozyne LLC Series A (a)(c)(d) | | 5,900 | 91,981 |
| TOTAL CONVERTIBLE PREFERRED STOCKS (Cost $3,635,756) | | | 3,558,833 |
| | | | |
| Money Market Funds - 3.1% |
| | | Shares | Value ($) |
| Fidelity Cash Central Fund 4.63% (e) | | 16,714,569 | 16,717,912 |
| Fidelity Securities Lending Cash Central Fund 4.63% (e)(f) | | 7,205,438 | 7,206,158 |
| TOTAL MONEY MARKET FUNDS (Cost $23,924,070) | | | 23,924,070 |
| | | | |
| TOTAL INVESTMENT IN SECURITIES - 100.6% (Cost $606,847,250) | 765,690,786 |
NET OTHER ASSETS (LIABILITIES) - (0.6)% | (4,511,787) |
| NET ASSETS - 100.0% | 761,178,999 |
| | |
Legend
| (b) | Security or a portion of the security is on loan at period end. |
| (d) | Restricted securities (including private placements) - Investment in securities not registered under the Securities Act of 1933 (excluding 144A issues). At the end of the period, the value of restricted securities (excluding 144A issues) amounted to $3,558,833 or 0.5% of net assets. |
| (e) | Affiliated fund that is generally available only to investment companies and other accounts managed by Fidelity Investments. The rate quoted is the annualized seven-day yield of the fund at period end. A complete unaudited listing of the fund's holdings as of its most recent quarter end is available upon request. In addition, each Fidelity Central Fund's financial statements, which are not covered by the Fund's Report of Independent Registered Public Accounting Firm, are available on the SEC's website or upon request. |
| (f) | Investment made with cash collateral received from securities on loan. |
| Additional information on each restricted holding is as follows: |
| Security | Acquisition Date | Acquisition Cost ($) |
| Castle Creek Biosciences, Inc. Series D1 | 4/19/22 | 1,356,409 |
| | | |
| Castle Creek Biosciences, Inc. Series D2 | 6/28/21 | 14,700 |
| | | |
| Castle Creek Pharmaceutical Holdings, Inc. Series C | 12/09/19 | 82,370 |
| | | |
| Evozyne LLC Series A | 4/09/21 | 132,573 |
| | | |
| Paragon Biosciences Emalex Capital, Inc. Series C | 2/26/21 | 1,700,005 |
| | | |
| Paragon Biosciences Emalex Capital, Inc. Series D1 | 10/21/22 | 155,952 |
| | | |
| Paragon Biosciences Emalex Capital, Inc. Series D2 | 5/18/22 | 193,747 |
| | | |
Affiliated Central Funds
Fiscal year to date information regarding the Fund's investments in Fidelity Central Funds, including the ownership percentage, is presented below.
| Affiliate | Value, beginning of period ($) | Purchases ($) | Sales Proceeds ($) | Dividend Income ($) | Realized Gain (loss) ($) | Change in Unrealized appreciation (depreciation) ($) | Value, end of period ($) | % ownership, end of period |
| Fidelity Cash Central Fund 4.63% | 10,726,575 | 345,673,519 | 339,682,182 | 260,885 | - | - | 16,717,912 | 0.0% |
| Fidelity Securities Lending Cash Central Fund 4.63% | 7,039,136 | 316,048,806 | 315,881,784 | 70,984 | - | - | 7,206,158 | 0.0% |
| Total | 17,765,711 | 661,722,325 | 655,563,966 | 331,869 | - | - | 23,924,070 | |
| | | | | | | | | |
Amounts in the dividend income column in the above table include any capital gain distributions from underlying funds, which are presented in the corresponding line item in the Statement of Operations, if applicable.
Amount for Fidelity Securities Lending Cash Central Fund represents the income earned on investing cash collateral, less rebates paid to borrowers and any lending agent fees associated with the loan, plus any premium payments received for lending certain types of securities.
Amounts included in the purchases and sales proceeds columns may include in-kind transactions, if applicable.
Other Affiliated Issuers
An affiliated company is a company in which the Fund has ownership of at least 5% of the voting securities. Fiscal year to date transactions with companies which are or were affiliates are presented in the table below. Certain corporate actions, such as mergers, are excluded from the amounts in this table if applicable. A dash in the Value end of period ($) column means either the issuer is no longer held at period end, or the issuer is held at period end but is no longer an affiliate.
| Affiliate | Value, beginning of period ($) | Purchases ($) | Sales Proceeds ($) | Dividend Income ($) | Realized Gain (loss) ($) | Change in Unrealized appreciation (depreciation) ($) | Value, end of period ($) |
| Oxurion NV | - | 4,984,659 | - | - | - | (4,942,961) | - |
| Total | - | 4,984,659 | - | - | - | (4,942,961) | - |
Amounts included in the purchases and sales proceeds columns may include in-kind transactions, if applicable.
Investment Valuation
The following is a summary of the inputs used, as of February 28, 2023, involving the Fund's assets and liabilities carried at fair value. The inputs or methodology used for valuing securities may not be an indication of the risk associated with investing in those securities. For more information on valuation inputs, and their aggregation into the levels used below, please refer to the Investment Valuation section in the accompanying Notes to Financial Statements.
| Valuation Inputs at Reporting Date: |
| Description | Total ($) | Level 1 ($) | Level 2 ($) | Level 3 ($) |
Investments in Securities: | | | | |
|
| Common Stocks | 738,207,883 | 700,003,659 | 36,003,074 | 2,201,150 |
|
| Convertible Preferred Stocks | 3,558,833 | - | - | 3,558,833 |
|
| Money Market Funds | 23,924,070 | 23,924,070 | - | - |
| Total Investments in Securities: | 765,690,786 | 723,927,729 | 36,003,074 | 5,759,983 |
Pharmaceuticals Portfolio
| Statement of Assets and Liabilities |
| | | | February 28, 2023 |
| | | | | |
| Assets | | | | |
| Investment in securities, at value (including securities loaned of $6,996,498) - See accompanying schedule: | | | | |
Unaffiliated issuers (cost $582,923,180) | $ | 741,766,716 | | |
Fidelity Central Funds (cost $23,924,070) | | 23,924,070 | | |
| | | | | |
| | | | | |
| Total Investment in Securities (cost $606,847,250) | | | $ | 765,690,786 |
| Cash | | | | 159,847 |
| Foreign currency held at value (cost $412) | | | | 407 |
| Receivable for investments sold | | | | 1,230,882 |
| Receivable for fund shares sold | | | | 248,073 |
| Dividends receivable | | | | 2,043,399 |
| Reclaims receivable | | | | 1,581,798 |
| Distributions receivable from Fidelity Central Funds | | | | 20,089 |
| Prepaid expenses | | | | 2,521 |
| Other receivables | | | | 152,095 |
Total assets | | | | 771,129,897 |
| Liabilities | | | | |
| Payable for investments purchased | $ | 1,626,236 | | |
| Payable for fund shares redeemed | | 392,504 | | |
| Accrued management fee | | 346,935 | | |
| Other affiliated payables | | 140,229 | | |
| Other payables and accrued expenses | | 239,544 | | |
| Collateral on securities loaned | | 7,205,450 | | |
| Total Liabilities | | | | 9,950,898 |
| Net Assets | | | $ | 761,178,999 |
| Net Assets consist of: | | | | |
| Paid in capital | | | $ | 568,675,833 |
| Total accumulated earnings (loss) | | | | 192,503,166 |
| Net Assets | | | $ | 761,178,999 |
Net Asset Value , offering price and redemption price per share ($761,178,999 ÷ 34,967,627 shares) | | | $ | 21.77 |
| Statement of Operations |
| | | | Year ended February 28, 2023 |
| Investment Income | | | | |
| Dividends | | | $ | 15,133,055 |
| Foreign Tax Reclaims | | | | 1,005,089 |
| Interest | | | | 64 |
| Income from Fidelity Central Funds (including $70,984 from security lending) | | | | 331,869 |
| Income before foreign taxes withheld | | | $ | 16,470,077 |
| Less foreign taxes withheld | | | | (1,896,569) |
| Total Income | | | | 14,573,508 |
| Expenses | | | | |
| Management fee | $ | 4,390,775 | | |
| Transfer agent fees | | 1,461,483 | | |
| Accounting fees | | 264,946 | | |
| Custodian fees and expenses | | 126,989 | | |
| Independent trustees' fees and expenses | | 2,865 | | |
| Registration fees | | 42,492 | | |
| Audit | | 55,353 | | |
| Legal | | 5,429 | | |
| Interest | | 3,363 | | |
| Miscellaneous | | 4,916 | | |
| Total expenses before reductions | | 6,358,611 | | |
| Expense reductions | | (29,167) | | |
| Total expenses after reductions | | | | 6,329,444 |
| Net Investment income (loss) | | | | 8,244,064 |
| Realized and Unrealized Gain (Loss) | | | | |
| Net realized gain (loss) on: | | | | |
| Investment Securities: | | | | |
| Unaffiliated issuers | | 67,953,495 | | |
| Foreign currency transactions | | 71,322 | | |
| Total net realized gain (loss) | | | | 68,024,817 |
| Change in net unrealized appreciation (depreciation) on: | | | | |
| Investment Securities: | | | | |
| Unaffiliated issuers | | (55,955,025) | | |
| Affiliated issuers | | (4,942,961) | | |
| Assets and liabilities in foreign currencies | | (71,565) | | |
| Total change in net unrealized appreciation (depreciation) | | | | (60,969,551) |
| Net gain (loss) | | | | 7,055,266 |
| Net increase (decrease) in net assets resulting from operations | | | $ | 15,299,330 |
| Statement of Changes in Net Assets |
| |
| | Year ended February 28, 2023 | | Year ended February 28, 2022 |
| Increase (Decrease) in Net Assets | | | | |
| Operations | | | | |
| Net investment income (loss) | $ | 8,244,064 | $ | 9,312,735 |
| Net realized gain (loss) | | 68,024,817 | | 66,607,987 |
| Change in net unrealized appreciation (depreciation) | | (60,969,551) | | (29,793,616) |
| Net increase (decrease) in net assets resulting from operations | | 15,299,330 | | 46,127,106 |
| Distributions to shareholders | | (41,990,940) | | (87,692,898) |
| Share transactions | | | | |
| Proceeds from sales of shares | | 164,880,948 | | 223,427,519 |
| Reinvestment of distributions | | 39,396,332 | | 83,261,883 |
| Cost of shares redeemed | | (351,154,587) | | (163,755,378) |
Net increase (decrease) in net assets resulting from share transactions | | (146,877,307) | | 142,934,024 |
| Total increase (decrease) in net assets | | (173,568,917) | | 101,368,232 |
| | | | | |
| Net Assets | | | | |
| Beginning of period | | 934,747,916 | | 833,379,684 |
| End of period | $ | 761,178,999 | $ | 934,747,916 |
| | | | | |
| Other Information | | | | |
| Shares | | | | |
| Sold | | 7,124,169 | | 9,855,327 |
| Issued in reinvestment of distributions | | 1,698,146 | | 3,596,826 |
| Redeemed | | (15,341,002) | | (6,801,557) |
| Net increase (decrease) | | (6,518,687) | | 6,650,596 |
| | | | | |
Financial Highlights
| Pharmaceuticals Portfolio |
| |
| Years ended February 28, | | 2023 | | 2022 | | 2021 | | 2020 A | | 2019 |
Selected Per-Share Data | | | | | | | | | | |
| Net asset value, beginning of period | $ | 22.53 | $ | 23.92 | $ | 21.71 | $ | 21.07 | $ | 18.82 |
| Income from Investment Operations | | | | | | | | | | |
Net investment income (loss) B,C | | .23 | | .27 | | .27 | | .29 | | .29 |
| Net realized and unrealized gain (loss) | | .19 | | .97 | | 4.04 | | 2.29 | | 2.34 |
| Total from investment operations | | .42 | | 1.24 | | 4.31 | | 2.58 | | 2.63 |
| Distributions from net investment income | | (.30) | | (.28) | | (.31) | | (.31) | | (.28) |
| Distributions from net realized gain | | (.88) | | (2.35) | | (1.79) | | (1.64) | | (.10) |
| Total distributions | | (1.18) | | (2.63) | | (2.10) | | (1.94) D | | (.38) |
| Net asset value, end of period | $ | 21.77 | $ | 22.53 | $ | 23.92 | $ | 21.71 | $ | 21.07 |
Total Return E | | 1.60% | | 5.15% | | 20.46% | | 12.06% | | 14.15% |
Ratios to Average Net Assets C,F,G | | | | | | | | | | |
| Expenses before reductions | | .76% | | .75% | | .77% | | .78% | | .80% |
| Expenses net of fee waivers, if any | | .76% | | .75% | | .77% | | .78% | | .79% |
| Expenses net of all reductions | | .76% | | .75% | | .76% | | .77% | | .79% |
| Net investment income (loss) | | .99% | | 1.10% | | 1.13% | | 1.36% | | 1.48% |
| Supplemental Data | | | | | | | | | | |
| Net assets, end of period (000 omitted) | $ | 761,179 | $ | 934,748 | $ | 833,380 | $ | 764,285 | $ | 747,604 |
Portfolio turnover rate H | | 45% | | 29% | | 32% | | 52% | | 55% |
A For the year ended February 29.
B Calculated based on average shares outstanding during the period.
C Net investment income (loss) is affected by the timing of the declaration of dividends by any underlying mutual funds or exchange-traded funds (ETFs). Net investment income (loss) of any mutual funds or ETFs is not included in the Fund's net investment income (loss) ratio.
D Total distributions per share do not sum due to rounding.
E Total returns would have been lower if certain expenses had not been reduced during the applicable periods shown.
F Fees and expenses of any underlying mutual funds or exchange-traded funds (ETFs) are not included in the Fund's expense ratio. The Fund indirectly bears its proportionate share of these expenses. For additional expense information related to investments in Fidelity Central Funds, please refer to the "Investments in Fidelity Central Funds" note found in the Notes to Financial Statements section of the most recent Annual or Semi-Annual report.
G Expense ratios reflect operating expenses of the class. Expenses before reductions do not reflect amounts reimbursed, waived, or reduced through arrangements with the investment adviser, brokerage services, or other offset arrangements, if applicable, and do not represent the amount paid by the class during periods when reimbursements, waivers or reductions occur.
H Amount does not include the portfolio activity of any underlying mutual funds or exchange-traded funds (ETFs).
For the period ended February 28, 2023
1. Organization.
Biotechnology Portfolio, Health Care Portfolio, Health Care Services Portfolio, Medical Technology and Devices Portfolio, and Pharmaceuticals Portfolio (the Funds) are non-diversified funds of Fidelity Select Portfolios (the Trust). The Trust is registered under the Investment Company Act of 1940, as amended (the 1940 Act), as an open-end management investment company organized as a Massachusetts business trust. The Funds invest primarily in securities of companies whose principal business activities fall within specific industries. Each Fund is authorized to issue an unlimited number of shares. Share transactions on the Statement of Changes in Net Assets may contain exchanges between affiliated funds.
2. Investments in Fidelity Central Funds.
Funds may invest in Fidelity Central Funds, which are open-end investment companies generally available only to other investment companies and accounts managed by the investment adviser and its affiliates. The Schedule of Investments lists any Fidelity Central Funds held as an investment as of period end, but does not include the underlying holdings of each Fidelity Central Fund. An investing fund indirectly bears its proportionate share of the expenses of the underlying Fidelity Central Funds.
Based on its investment objective, each Fidelity Central Fund may invest or participate in various investment vehicles or strategies that are similar to those of the investing fund. These strategies are consistent with the investment objectives of the investing fund and may involve certain economic risks which may cause a decline in value of each of the Fidelity Central Funds and thus a decline in the value of the investing fund.
| Fidelity Central Fund | Investment Manager | Investment Objective | Investment Practices | Expense Ratio A |
| Fidelity Money Market Central Funds | Fidelity Management & Research Company LLC (FMR) | Each fund seeks to obtain a high level of current income consistent with the preservation of capital and liquidity. | Short-term Investments | Less than .005% |
A Expenses expressed as a percentage of average net assets and are as of each underlying Central Fund's most recent annual or semi-annual shareholder report.
A complete unaudited list of holdings for each Fidelity Central Fund is available upon request or at the Securities and Exchange Commission website at www.sec.gov. In addition, the financial statements of the Fidelity Central Funds which contain the significant accounting policies (including investment valuation policies) of those funds, and are not covered by the Report of Independent Registered Public Accounting Firm, are available on the Securities and Exchange Commission website or upon request.
3. Significant Accounting Policies.
Each Fund is an investment company and applies the accounting and reporting guidance of the Financial Accounting Standards Board (FASB) Accounting Standards Codification Topic 946 Financial Services - Investment Companies . The financial statements have been prepared in conformity with accounting principles generally accepted in the United States of America (GAAP), which require management to make certain estimates and assumptions at the date of the financial statements. Actual results could differ from those estimates. Subsequent events, if any, through the date that the financial statements were issued have been evaluated in the preparation of the financial statements. Each Fund's Schedule of Investments lists any underlying mutual funds or exchange-traded funds (ETFs) but does not include the underlying holdings of these funds. The following summarizes the significant accounting policies of each Fund:
Investment Valuation. Investments are valued as of 4:00 p.m. Eastern time on the last calendar day of the period. The Board of Trustees (the Board) has designated each Fund's investment adviser as the valuation designee responsible for the fair valuation function and performing fair value determinations as needed. The investment adviser has established a Fair Value Committee (the Committee) to carry out the day-to-day fair valuation responsibilities and has adopted policies and procedures to govern the fair valuation process and the activities of the Committee. In accordance with these fair valuation policies and procedures, which have been approved by the Board, each Fund attempts to obtain prices from one or more third party pricing services or brokers to value its investments. When current market prices, quotations or currency exchange rates are not readily available or reliable, investments will be fair valued in good faith by the Committee, in accordance with the policies and procedures. Factors used in determining fair value vary by investment type and may include market or investment specific events, transaction data, estimated cash flows, and market observations of comparable investments. The frequency that the fair valuation procedures are used cannot be predicted and they may be utilized to a significant extent. The Committee manages each Fund's fair valuation practices and maintains the fair valuation policies and procedures. Each Fund's investment adviser reports to the Board information regarding the fair valuation process and related material matters.
Each Fund categorizes the inputs to valuation techniques used to value its investments into a disclosure hierarchy consisting of three levels as shown below:
Level 1 - unadjusted quoted prices in active markets for identical investments
Level 2 - other significant observable inputs (including quoted prices for similar investments, interest rates, prepayment speeds, etc.)
Level 3 - unobservable inputs (including the Fund's own assumptions based on the best information available)
Valuation techniques used to value each Fund's investments by major category are as follows:
Equity securities, including restricted securities, for which market quotations are readily available, are valued at the last reported sale price or official closing price as reported by a third party pricing service on the primary market or exchange on which they are traded and are categorized as Level 1 in the hierarchy. In the event there were no sales during the day or closing prices are not available, securities are valued at the last quoted bid price or may be valued using the last available price and are generally categorized as Level 2 in the hierarchy. For foreign equity securities, when market or security specific events arise, comparisons to the valuation of American Depositary Receipts (ADRs), futures contracts, ETFs and certain indexes as well as quoted prices for similar securities may be used and would be categorized as Level 2 in the hierarchy. For equity securities, including restricted securities, where observable inputs are limited, assumptions about market activity and risk are used and these securities may be categorized as Level 3 in the hierarchy. Securities, including private placements or other restricted securities, for which observable inputs are not available are valued using alternate valuation approaches, including the market approach, the income approach and cost approach, and are categorized as Level 3 in the hierarchy. The market approach considers factors including the price of recent investments in the same or a similar security or financial metrics of comparable securities. The income approach considers factors including expected future cash flows, security specific risks and corresponding discount rates. The cost approach considers factors including the value of the security's underlying assets and liabilities.
Debt securities, including restricted securities, are valued based on evaluated prices received from third party pricing services or from brokers who make markets in such securities. Preferred securities are valued by pricing services who utilize matrix pricing which considers yield or price of bonds of comparable quality, coupon, maturity and type or by broker-supplied prices. When independent prices are unavailable or unreliable, debt securities may be valued utilizing pricing methodologies which consider similar factors that would be used by third party pricing services. Debt securities are generally categorized as Level 2 in the hierarchy but may be Level 3 depending on the circumstances.
Investments in open-end mutual funds, including the Fidelity Central Funds, are valued at their closing net asset value (NAV) each business day and are categorized as Level 1 in the hierarchy.
The following provides information on Level 3 securities held by the Fund that were valued at period end based on unobservable inputs. These amounts exclude valuations provided by a broker.
Biotechnology Portfolio:
| Asset Type | Fair Value | Valuation Technique(s) | Unobservable Input | Amount or Range/Weighted Average | Impact to Valuation from an Increase in Input A |
| Equities | $171,404,837 | Market comparable | Enterprise value/Revenue multiple (EV/R) | 18.0 | Increase |
| | | Recovery value | Recovery value | $0.00 - $5.51 / $5.50 | Increase |
| | | Market Approach | Transaction price | $2.42 - $105.86 / $46.47 | Increase |
| | | | Discount rate | 4.7% - 40.0% / 32.0% | Decrease |
| | | | Parity Price | $0.00 | Increase |
| | | Discounted cash flow | Discount rate | 4.9% - 14.1% / 10.5% | Decrease |
| | | | Probability rate | 0.0% - 90.0% / 39.0% | Increase |
| | | | Term | 0.1 - 7.8 / 4.3 | Increase |
| | | Black scholes | Discount rate | 4.2% - 4.4% / 4.4% | Increase |
| | | | Volatility | 80.0% - 85.0% / 82.8% | Increase |
| | | | Term | 2.0 - 3.0 / 3.0 | Increase |
Health Care Portfolio:
| Asset Type | Fair Value | Valuation Technique(s) | Unobservable Input | Amount or Range/Weighted Average | Impact to Valuation from an Increase in Input A |
| Equities | $ 109,429,633 | Market comparable | Enterprise value/Revenue multiple (EV/R) | 3.6 - 18.0/6.7 | Increase |
| | | Recovery Value | Recovery Value | $5.51 | Increase |
| | | Market Approach | Transaction price Discount rate | $7.75 - $20.56 / $13.55 20.0%-50.0% / 31.0% | Increase Decrease |
| | | Black scholes | Discount rate | 4.3%-4.9% / 4.5% | Increase |
| | | | Term | 1.5-4.0/3.2 | Increase |
| | | | Volatility | 45.0%-90.0% / 52.3% | Increase |
A Represents the directional change in the fair value of the Level 3 investments that could have resulted from an increase in the corresponding input as of period end. A decrease to the unobservable input would have had the opposite effect. Significant changes in these inputs may have resulted in a significantly higher or lower fair value measurement at period end.
Medical Technology and Devices Portfolio:
| Asset Type | Fair Value | Valuation Technique(s) | Unobservable Input | Amount or Range/Weighted Average | Impact to Valuation from an Increase in Input A |
| Equities | $210,655,161 | Market Comparable | Enterprise value/Revenue multiple (EV/R) | 3.6% - 18.0 / 6.4 | Increase |
| | | Market approach | Transaction price | $1.02 - $20.56 / $11.75 | Increase |
| | | | Discount rate | 15.0% - 50.0% / 23.6% | Decrease |
| | | Discounted cash flow | Weighted average cost of capital (WACC) | 28.3% | Decrease |
| | | | Exit multiple | 2.0 | Increase |
| | | Black scholes | Discount rate | 4.3% - 4.9% /4.6% | Increase |
| | | | Volatility | 55.0% - 80.0% /67.3% | Increase |
| | | | Term | 1.5 - 4.0 / 2.5 | Increase |
| Preferred Securities | $19,043,513 | Market approach | Transaction price | $100.00 | Increase |
| | | Black scholes | Discount rate | 4.4% | Increase |
| | | | Volatility | 70.0% | Increase |
| | | | Term | 3.0 | Increase |
A Represents the directional change in the fair value of the Level 3 investments that could have resulted from an increase in the corresponding input as of period end. A decrease to the unobservable input would have had the opposite effect. Significant changes in these inputs may have resulted in a significantly higher or lower fair value measurement at period end.
Changes in valuation techniques may result in transfers in or out of an assigned level within the disclosure hierarchy. The aggregate value of investments by input level as of February 28, 2023, as well as a roll forward of Level 3 investments, is included at the end of each Fund's Schedule of Investments.
Foreign Currency. Certain Funds may use foreign currency contracts to facilitate transactions in foreign-denominated securities. Gains and losses from these transactions may arise from changes in the value of the foreign currency or if the counterparties do not perform under the contracts' terms.
Foreign-denominated assets, including investment securities, and liabilities are translated into U.S. dollars at the exchange rates at period end. Purchases and sales of investment securities, income and dividends received, and expenses denominated in foreign currencies are translated into U.S. dollars at the exchange rate in effect on the transaction date.
The effects of exchange rate fluctuations on investments are included with the net realized and unrealized gain (loss) on investment securities. Other foreign currency transactions resulting in realized and unrealized gain (loss) are disclosed separately.
Investment Transactions and Income. For financial reporting purposes, the Funds' investment holdings and NAV include trades executed through the end of the last business day of the period. The NAV per share for processing shareholder transactions is calculated as of the close of business of the New York Stock Exchange (NYSE), normally 4:00 p.m. Eastern time and includes trades executed through the end of the prior business day. Gains and losses on securities sold are determined on the basis of identified cost and for certain Funds include proceeds received from litigation. Commissions paid to certain brokers with whom the investment adviser, or its affiliates, places trades on behalf of a fund include an amount in addition to trade execution, which may be rebated back to a fund. Any such rebates are included in net realized gain (loss) on investments in the Statement of Operations. Dividend income is recorded on the ex-dividend date, except for certain dividends from foreign securities where the ex-dividend date may have passed, which are recorded as soon as the Funds are informed of the ex-dividend date. Non-cash dividends included in dividend income, if any, are recorded at the fair market value of the securities received. Income and capital gain distributions from Fidelity Central Funds, if any, are recorded on the ex-dividend date. Interest income is accrued as earned and includes coupon interest and amortization of premium and accretion of discount on debt securities as applicable. Investment income is recorded net of foreign taxes withheld where recovery of such taxes is uncertain. Funds may file withholding tax reclaims in certain jurisdictions to recover a portion of amounts previously withheld. Any withholding tax reclaims income is included in the Statement of Operations in dividends or foreign tax reclaims. Any receivables for withholding tax reclaims are included in the Statement of Assets and Liabilities in dividends receivable or reclaims receivable.
Expenses. Expenses directly attributable to a fund are charged to that fund. Expenses attributable to more than one fund are allocated among the respective funds on the basis of relative net assets or other appropriate methods. Expenses included in the accompanying financial statements reflect the expenses of that fund and do not include any expenses associated with any underlying mutual funds or exchange-traded funds. Although not included in a fund's expenses, a fund indirectly bears its proportionate share of these expenses through the net asset value of each underlying mutual fund or exchange-traded fund. Expense estimates are accrued in the period to which they relate and adjustments are made when actual amounts are known.
Deferred Trustee Compensation. Under a Deferred Compensation Plan (the Plan) for certain Funds, certain independent Trustees have elected to defer receipt of a portion of their annual compensation. Deferred amounts are invested in affiliated mutual funds, are marked-to-market and remain in a fund until distributed in accordance with the Plan. The investment of deferred amounts and the offsetting payable to the Trustees presented below are included in the accompanying Statement of Assets and Liabilities in other receivables and other payables and accrued expenses, as applicable.
| Biotechnology Portfolio | $1,065,322 |
| Health Care Portfolio | 702,098 |
| Health Care Services Portfolio | 79,036 |
| Medical Technology and Devices Portfolio | 230,636 |
| Pharmaceuticals Portfolio | 144,281 |
Income Tax Information and Distributions to Shareholders. Each year, each Fund intends to qualify as a regulated investment company under Subchapter M of the Internal Revenue Code, including distributing substantially all of its taxable income and realized gains. As a result, no provision for U.S. Federal income taxes is required. As of February 28, 2023, each Fund did not have any unrecognized tax benefits in the financial statements; nor is each Fund aware of any tax positions for which it is reasonably possible that the total amounts of unrecognized tax benefits will significantly change in the next twelve months. Each Fund files a U.S. federal tax return, in addition to state and local tax returns as required. Each Fund's federal income tax returns are subject to examination by the Internal Revenue Service (IRS) for a period of three fiscal years after they are filed. State and local tax returns may be subject to examination for an additional fiscal year depending on the jurisdiction. Foreign taxes are provided for based on each Fund's understanding of the tax rules and rates that exist in the foreign markets in which it invests.
Distributions are declared and recorded on the ex-dividend date. Income and capital gain distributions are determined in accordance with income tax regulations, which may differ from GAAP. These differences resulted in distribution reclassifications. In addition, certain Funds claimed a portion of the payment made to redeeming shareholders as a distribution for income tax purposes.
Capital accounts within the financial statements are adjusted for permanent book-tax differences. These adjustments have no impact on net assets or the results of operations. Capital accounts are not adjusted for temporary book-tax differences which will reverse in a subsequent period.
Book-tax differences are primarily due to foreign currency transactions, passive foreign investment companies (PFIC), deferred Trustee compensation, capital loss carryforwards, partnerships, net operating losses and losses deferred due to wash sales and excise tax regulations.
As of period end, the cost and unrealized appreciation (depreciation) in securities, and derivatives if applicable, for federal income tax purposes were as follows for each Fund:
| | Tax cost | Gross unrealized appreciation | Gross unrealized depreciation | Net unrealized appreciation (depreciation) |
| Biotechnology Portfolio | $4,168,288,756 | $1,702,606,798 | $(546,308,089) | $1,156,298,709) |
| Health Care Portfolio | 5,843,402,990 | 2,997,884,694 | (506,308,202) | 2,491,576,492 |
| Health Care Services Portfolio | 1,188,870,647 | 654,128,922 | (76,772,117) | 577,356,805 |
Medical Technology and Devices Portfolio | 4,456,431,098 | 2,844,407,593 | (260,762,102) | 2,583,645,491 |
| Pharmaceuticals Portfolio | 608,145,883 | 208,618,302 | (51,073,399) | 157,544,903 |
The tax-based components of distributable earnings as of period end were as follows for each Fund:
| | Undistributed long-term capital gain | Capital loss carryforward | Net unrealized appreciation (depreciation) on securities and other investments |
| Biotechnology Portfolio | $- | $(648,368,714) | $1,156,284,868 |
| Health Care Portfolio | - | (82,842,812) | 2,491,637,226 |
| Health Care Services Portfolio | - | - | 577,354,880 |
Medical Technology and Devices Portfolio | - | (330,894,459) | 2,583,640,172 |
| Pharmaceuticals Portfolio | 35,641,716 | - | 157,539,749 |
Capital loss carryforwards are only available to offset future capital gains of the Funds to the extent provided by regulations and may be limited. The capital loss carryforward information presented below, including any applicable limitation, is estimated as of fiscal period end and is subject to adjustment.
| | Short-term | Long-term | Total capital loss carryforward |
| Biotechnology Portfolio | $(486,419,734) | $(161,948,980) | $(648,368,714) |
| Health Care Portfolio | (82,842,812) | - | (82,842,812) |
Medical Technology and Devices Portfolio | (323,788,266) | (7,106,193) | (330,894,459) |
Certain of the Funds intend to elect to defer to the next fiscal year capital losses recognized during the period November 1, 2022 to February 28, 2023 and ordinary losses recognized during the period of January 1, 2023 to February 28, 2023. Loss deferrals were as follows:
| | Capital Losses | Ordinary Losses |
| Biotechnology Portfolio | $- | $(2,587,831) |
| Health Care Portfolio | - | (12,417,992) |
| Health Care Services Portfolio | (23,317,441) | (854,077) |
Medical Technology and Devices Portfolio | - | (5,653,348) |
| Pharmaceuticals Portfolio | - | (529,772) |
The tax character of distributions paid was as follows:
| February 28, 2023 | | | |
| | Ordinary Income | Long-term Capital Gains | Total |
| Health Care Portfolio | - | 185,553,756 | 185,553,756 |
| Health Care Services Portfolio | 6,851,701 | 63,741,020 | 70,592,721 |
Medical Technology and Devices Portfolio | - | 137,786,409 | 137,786,409 |
| Pharmaceuticals Portfolio | 10,747,779 | 31,243,161 | 41,990,940 |
| February 28, 2022 | | | |
| | Ordinary Income | Long-term Capital Gains | Total |
| Biotechnology Portfolio | $44,710,367 | $906,920,364 | $951,630,731 |
| Health Care Portfolio | 30,213,050 | 899,646,185 | 929,859,235 |
| Health Care Services Portfolio | 2,649,600 | 84,975,790 | 87,625,390 |
Medical Technology and Devices Portfolio | 80,106,652 | 728,218,712 | 808,325,364 |
| Pharmaceuticals Portfolio | 14,327,993 | 73,364,905 | 87,692,898 |
Restricted Securities (including Private Placements). Funds may invest in securities that are subject to legal or contractual restrictions on resale. These securities generally may be resold in transactions exempt from registration or to the public if the securities are registered. Disposal of these securities may involve time-consuming negotiations and expense, and prompt sale at an acceptable price may be difficult. Information regarding restricted securities held at period end is included at the end of the Schedule of Investments, if applicable.
Consolidated Subsidiary. The Funds included in the table below hold certain investments through a wholly-owned subsidiary ("Subsidiary"), which may be subject to federal and state taxes upon disposition.
As of period end, investments in Subsidiaries were as follows:
| | $ Amount | % of Net Assets |
| Biotechnology Portfolio | 79,959,659 | 1.61 |
| Health Care Portfolio | 7,794,757 | .10 |
| Health Care Services Portfolio | 1,146,954 | .07 |
The financial statements have been consolidated to include the Subsidiary accounts where applicable. Accordingly, all inter-company transactions and balances have been eliminated.
At period end, any estimated tax liability for these investments is presented as "Deferred taxes" in the Statement of Assets and Liabilities and included in "Change in net unrealized appreciation (depreciation) on investment securities" in the Statement of Operations. The tax liability incurred may differ materially depending on conditions when these investments are disposed. Any cash held by a Subsidiary is restricted as to its use and is presented as "Restricted cash" in the Statement of Assets and Liabilities, if applicable.
New Accounting Pronouncement. In June 2022, the Financial Accounting Standards Board (FASB) issued Accounting Standards Update (ASU) 2022-03 Fair Value Measurement (Topic 820): Fair Value Measurement of Equity Securities Subject to Contractual Sale Restrictions. The amendments in this ASU clarify that a contractual restriction on the sale of an equity security is not considered part of the unit of account of the equity security and, therefore, is not considered in measuring fair value. They also clarify that an entity cannot, as a separate unit of account, recognize and measure a contractual sale restriction. They also require additional disclosures for equity securities subject to contractual sale restrictions. ASU 2022-03 will be effective for fiscal years, including interim periods within those fiscal years, beginning after December 15, 2023, and allows for early adoption. ASU 2022-03 will only be applicable to an equity security in which the contractual arrangement that restricts its sale is executed or modified on or after the adoption date. Management is currently evaluating the potential impact of ASU 2022-03 to the financial statements.
4. Purchases and Sales of Investments.
Purchases and sales of securities, other than short-term securities and in-kind transactions, as applicable, are noted in the table below.
| | Purchases ($) | Sales ($) |
| Biotechnology Portfolio | 2,560,920,434 | 2,902,731,897 |
| Health Care Portfolio | 3,354,725,863 | 3,936,409,570 |
| Health Care Services Portfolio | 990,960,891 | 452,917,413 |
| Medical Technology and Devices Portfolio | 2,735,274,233 | 3,629,714,765 |
| Pharmaceuticals Portfolio | 372,188,874 | 556,621,213 |
5. Fees and Other Transactions with Affiliates.
Management Fee. Fidelity Management & Research Company LLC (the investment adviser) and its affiliates provide the Funds with investment management related services for which the Funds pay a monthly management fee. The management fee is the sum of an individual fund fee rate and an annualized group fee rate. The individual fund fee rate is applied to each Fund's average net assets. The group fee rate is based upon the monthly average net assets of a group of registered investment companies with which the investment adviser has management contracts. The group fee rate decreases as assets under management increase and increases as assets under management decrease. For the reporting period, each Fund's annual management fee rate expressed as a percentage of each Fund's average net assets was as follows:
| | Individual Rate | Group Rate | Total |
| Biotechnology Portfolio | .30% | .23% | .53% |
| Health Care Portfolio | .30% | .23% | .53% |
| Health Care Services Portfolio | .30% | .23% | .53% |
| Medical Technology and Devices Portfolio | .30% | .23% | .53% |
| Pharmaceuticals Portfolio | .30% | .23% | .53% |
Transfer Agent Fees. Fidelity Investments Institutional Operations Company LLC (FIIOC), an affiliate of the investment adviser, is the Funds' transfer, dividend disbursing and shareholder servicing agent. FIIOC receives account fees and asset-based fees that vary according to account size and type of account. FIIOC pays for typesetting, printing and mailing of shareholder reports, except proxy statements. For the period, transfer agent fees were equivalent to the following annual rates expressed as a percentage of average net assets:
| Biotechnology Portfolio | .16% |
| Health Care Portfolio | .14% |
| Health Care Services Portfolio | .16% |
| Medical Technology and Devices Portfolio | .16% |
| Pharmaceuticals Portfolio | .18% |
Accounting Fees. Fidelity Service Company, Inc. (FSC), an affiliate of the investment adviser, maintains each Fund's accounting records. The accounting fee is based on the level of average net assets for each month. For the period, the fees were equivalent to the following annual rates:
| | % of Average Net Assets |
| Biotechnology Portfolio | .02 |
| Health Care Portfolio | .01 |
| Health Care Services Portfolio | .03 |
| Medical Technology and Devices Portfolio | .01 |
| Pharmaceuticals Portfolio | .03 |
Brokerage Commissions. A portion of portfolio transactions were placed with brokerage firms which are affiliates of the investment adviser. Brokerage commissions are included in net realized gain (loss) and change in net unrealized appreciation (depreciation) in the Statement of Operations. The commissions paid to these affiliated firms were as follows:
| | Amount |
| Biotechnology Portfolio | $181,009 |
| Health Care Portfolio | 71,796 |
| Health Care Services Portfolio | 17,269 |
| Medical Technology and Devices Portfolio | 54,685 |
| Pharmaceuticals Portfolio | 10,984 |
Interfund Lending Program. Pursuant to an Exemptive Order issued by the Securities and Exchange Commission (the SEC), each Fund, along with other registered investment companies having management contracts with Fidelity Management & Research Company LLC (FMR), or other affiliated entities of FMR, may participate in an interfund lending program. This program provides an alternative credit facility allowing each Fund to borrow from, or lend money to, other participating affiliated funds. At period end, there were no interfund loans outstanding. Activity in this program during the period for which loans were outstanding was as follows:
| | Borrower or Lender | Average Loan Balance | Weighted Average Interest Rate | Interest Expense |
| Health Care Portfolio | Borrower | $6,682,938 | 1.56% | $4,620 |
Medical Technology and Devices Portfolio | Borrower | $8,557,857 | 1.27% | $2,108 |
| Pharmaceuticals Portfolio | Borrower | $13,288,500 | 2.28% | $3,363 |
Interfund Trades. Funds may purchase from or sell securities to other Fidelity Funds under procedures adopted by the Board. The procedures have been designed to ensure these interfund trades are executed in accordance with Rule 17a-7 of the 1940 Act. Any interfund trades are included within the respective purchases and sales amounts shown in the Purchases and Sales of Investments note. Interfund trades during the period are noted in the table below.
| | Purchases ($) | Sales ($) | Realized Gain (Loss) ($) |
| Biotechnology Portfolio | 133,000,609 | 166,195,767 | (10,338,109) |
| Health Care Portfolio | 225,043,889 | 352,657,619 | 61,499,881 |
| Health Care Services Portfolio | 101,703,304 | 75,854,331 | 16,713,553 |
| Medical Technology and Devices Portfolio | 124,184,811 | 173,350,227 | 47,346 |
| Pharmaceuticals Portfolio | 41,271,572 | 51,407,690 | 5,208,222 |
6. Committed Line of Credit.
Certain Funds participate with other funds managed by the investment adviser or an affiliate in a $4.25 billion credit facility (the "line of credit") to be utilized for temporary or emergency purposes to fund shareholder redemptions or for other short-term liquidity purposes. The participating funds have agreed to pay commitment fees on their pro-rata portion of the line of credit, which are reflected in Miscellaneous expenses on the Statement of Operations, and are listed below. During the period, there were no borrowings on this line of credit.
| | Amount |
| Biotechnology Portfolio | $9,236 |
| Health Care Portfolio | 15,190 |
| Health Care Services Portfolio | 2,581 |
| Medical Technology and Devices Portfolio | 13,710 |
| Pharmaceuticals Portfolio | 1,500 |
7. Security Lending.
Funds lend portfolio securities from time to time in order to earn additional income. Lending agents are used, including National Financial Services (NFS), an affiliate of the investment adviser. Pursuant to a securities lending agreement, NFS will receive a fee, which is capped at 9.9% of a fund's daily lending revenue, for its services as lending agent. A fund may lend securities to certain qualified borrowers, including NFS. On the settlement date of the loan, a fund receives collateral (in the form of U.S. Treasury obligations, letters of credit and/or cash) against the loaned securities and maintains collateral in an amount not less than 100% of the market value of the loaned securities during the period of the loan. The market value of the loaned securities is determined at the close of business of a fund and any additional required collateral is delivered to a fund on the next business day. A fund or borrower may terminate the loan at any time, and if the borrower defaults on its obligation to return the securities loaned because of insolvency or other reasons, a fund may apply collateral received from the borrower against the obligation. A fund may experience delays and costs in recovering the securities loaned. Any cash collateral received is invested in the Fidelity Securities Lending Cash Central Fund. Any loaned securities are identified as such in the Schedule of Investments, and the value of loaned securities and cash collateral at period end, as applicable, are presented in the Statement of Assets and Liabilities. Security lending income represents the income earned on investing cash collateral, less rebates paid to borrowers and any lending agent fees associated with the loan, plus any premium payments received for lending certain types of securities. Security lending income is presented in the Statement of Operations as a component of income from Fidelity Central Funds. Affiliated security lending activity, if any, was as follows:
| | Total Security Lending Fees Paid to NFS | Security Lending Income From Securities Loaned to NFS | Value of Securities Loaned to NFS at Period End |
| Biotechnology Portfolio | $739,889 | $101,109 | $492,191 |
| Health Care Portfolio | $183,363 | $50,233 | $- |
| Health Care Services Portfolio | $24,291 | $8,760 | $- |
| Medical Technology and Devices Portfolio | $222,443 | $13,812 | $- |
| Pharmaceuticals Portfolio | $7,328 | $6,855 | $821,408 |
8. Expense Reductions.
Through arrangements with each applicable Fund's custodian, credits realized as a result of certain uninvested cash balances were used to reduce each applicable Fund's expenses. All of the applicable expense reductions are noted in the table below.
| | Custodian credits |
| Biotechnology Portfolio | $4,661 |
| Health Care Portfolio | 2,216 |
| Health Care Services Portfolio | 909 |
Medical Technology and Devices Portfolio | 1,917 |
In addition, during the period the investment adviser or an affiliate reimbursed and/or waived a portion of operating expenses as follows:
| | Amount |
| Biotechnology Portfolio | $181,190 |
| Health Care Portfolio | 297,816 |
| Health Care Services Portfolio | 53,611 |
| Medical Technology and Devices Portfolio | 264,499 |
| Pharmaceuticals Portfolio | 29,167 |
9. Other.
A fund's organizational documents provide former and current trustees and officers with a limited indemnification against liabilities arising in connection with the performance of their duties to the fund. In the normal course of business, a fund may also enter into contracts that provide general indemnifications. A fund's maximum exposure under these arrangements is unknown as this would be dependent on future claims that may be made against a fund. The risk of material loss from such claims is considered remote.
10. Risk and Uncertainties.
Many factors affect a fund's performance. Developments that disrupt global economies and financial markets, such as pandemics, epidemics, outbreaks of infectious diseases, war, terrorism, and environmental disasters, may significantly affect a fund's investment performance. The effects of these developments to a fund will be impacted by the types of securities in which a fund invests, the financial condition, industry, economic sector, and geographic location of an issuer, and a fund's level of investment in the securities of that issuer. Significant concentrations in security types, issuers, industries, sectors, and geographic locations may magnify the factors that affect a fund's performance.
To the Board of Trustees of Fidelity Select Portfolios and Shareholders of Biotechnology Portfolio, Health Care Portfolio, Health Care Services Portfolio, Medical Technology and Devices Portfolio and Pharmaceuticals Portfolio
Opinions on the Financial Statements
We have audited the accompanying statements of assets and liabilities, including the schedules of investments, of Biotechnology Portfolio, Health Care Portfolio, Health Care Services Portfolio, Medical Technology and Devices Portfolio, and Pharmaceuticals Portfolio (five of the funds constituting Fidelity Select Portfolios, hereafter collectively referred to as the "Funds") as of February 28, 2023, the related statements of operations for the year ended February 28, 2023, the statements of changes in net assets for each of the two years in the period ended February 28, 2023, including the related notes, and the financial highlights for each of the five years in the period ended February 28, 2023 (collectively referred to as the "financial statements"). In our opinion, the financial statements present fairly, in all material respects, the financial position of each of the Funds as of February 28, 2023, the results of each of their operations for the year then ended, the changes in each of their net assets for each of the two years in the period ended February 28, 2023 and each of the financial highlights for each of the five years in the period ended February 28, 2023 in conformity with accounting principles generally accepted in the United States of America.
Basis for Opinions
These financial statements are the responsibility of the Funds' management. Our responsibility is to express an opinion on the Funds' financial statements based on our audits. We are a public accounting firm registered with the Public Company Accounting Oversight Board (United States) (PCAOB) and are required to be independent with respect to the Funds in accordance with the U.S. federal securities laws and the applicable rules and regulations of the Securities and Exchange Commission and the PCAOB.
We conducted our audits of these financial statements in accordance with the standards of the PCAOB. Those standards require that we plan and perform the audit to obtain reasonable assurance about whether the financial statements are free of material misstatement, whether due to error or fraud.
Our audits included performing procedures to assess the risks of material misstatement of the financial statements, whether due to error or fraud, and performing procedures that respond to those risks. Such procedures included examining, on a test basis, evidence regarding the amounts and disclosures in the financial statements. Our audits also included evaluating the accounting principles used and significant estimates made by management, as well as evaluating the overall presentation of the financial statements. Our procedures included confirmation of securities owned as of February 28, 2023 by correspondence with the custodians, issuers of privately offered securities and brokers; when replies were not received from brokers, we performed other auditing procedures. We believe that our audits provide a reasonable basis for our opinions.
/s/ PricewaterhouseCoopers LLP
Boston, Massachusetts
April 12, 2023
We have served as the auditor of one or more investment companies in the Fidelity group of funds since 1932.
The Trustees, Members of the Advisory Board (if any), and officers of the trust and funds, as applicable, are listed below. The Board of Trustees governs each fund and is responsible for protecting the interests of shareholders. The Trustees are experienced executives who meet periodically throughout the year to oversee each fund's activities, review contractual arrangements with companies that provide services to each fund, oversee management of the risks associated with such activities and contractual arrangements, and review each fund's performance. Each of the Trustees oversees 318 funds.
The Trustees hold office without limit in time except that (a) any Trustee may resign; (b) any Trustee may be removed by written instrument, signed by at least two-thirds of the number of Trustees prior to such removal; (c) any Trustee who requests to be retired or who has become incapacitated by illness or injury may be retired by written instrument signed by a majority of the other Trustees; and (d) any Trustee may be removed at any special meeting of shareholders by a two-thirds vote of the outstanding voting securities of the trust. Each Trustee who is not an interested person (as defined in the 1940 Act) of the trust and the funds is referred to herein as an Independent Trustee. Each Independent Trustee shall retire not later than the last day of the calendar year in which his or her 75th birthday occurs. The Independent Trustees may waive this mandatory retirement age policy with respect to individual Trustees. Officers and Advisory Board Members hold office without limit in time, except that any officer or Advisory Board Member may resign or may be removed by a vote of a majority of the Trustees at any regular meeting or any special meeting of the Trustees. Except as indicated, each individual has held the office shown or other offices in the same company for the past five years.
The funds' Statement of Additional Information (SAI) includes more information about the Trustees. To request a free copy, call Fidelity at 1-800-544-8544.
Experience, Skills, Attributes, and Qualifications of the Trustees. The Governance and Nominating Committee has adopted a statement of policy that describes the experience, qualifications, attributes, and skills that are necessary and desirable for potential Independent Trustee candidates (Statement of Policy). The Board believes that each Trustee satisfied at the time he or she was initially elected or appointed a Trustee, and continues to satisfy, the standards contemplated by the Statement of Policy. The Governance and Nominating Committee also engages professional search firms to help identify potential Independent Trustee candidates who have the experience, qualifications, attributes, and skills consistent with the Statement of Policy. From time to time, additional criteria based on the composition and skills of the current Independent Trustees, as well as experience or skills that may be appropriate in light of future changes to board composition, business conditions, and regulatory or other developments, have also been considered by the professional search firms and the Governance and Nominating Committee. In addition, the Board takes into account the Trustees' commitment and participation in Board and committee meetings, as well as their leadership of standing and ad hoc committees throughout their tenure.
In determining that a particular Trustee was and continues to be qualified to serve as a Trustee, the Board has considered a variety of criteria, none of which, in isolation, was controlling. The Board believes that, collectively, the Trustees have balanced and diverse experience, qualifications, attributes, and skills, which allow the Board to operate effectively in governing each fund and protecting the interests of shareholders. Information about the specific experience, skills, attributes, and qualifications of each Trustee, which in each case led to the Board's conclusion that the Trustee should serve (or continue to serve) as a trustee of the funds, is provided below.
Board Structure and Oversight Function. Robert A. Lawrence is an interested person and currently serves as Chair. The Trustees have determined that an interested Chair is appropriate and benefits shareholders because an interested Chair has a personal and professional stake in the quality and continuity of services provided to the funds. Independent Trustees exercise their informed business judgment to appoint an individual of their choosing to serve as Chair, regardless of whether the Trustee happens to be independent or a member of management. The Independent Trustees have determined that they can act independently and effectively without having an Independent Trustee serve as Chair and that a key structural component for assuring that they are in a position to do so is for the Independent Trustees to constitute a substantial majority for the Board. The Independent Trustees also regularly meet in executive session. David M. Thomas serves as Lead Independent Trustee and as such (i) acts as a liaison between the Independent Trustees and management with respect to matters important to the Independent Trustees and (ii) with management prepares agendas for Board meetings.
Fidelity ® funds are overseen by different Boards of Trustees. The funds' Board oversees Fidelity's high income and certain equity funds, and other Boards oversee Fidelity's alternative investment, investment-grade bond, money market, asset allocation, and other equity funds. The asset allocation funds may invest in Fidelity ® funds overseen by the funds' Board. The use of separate Boards, each with its own committee structure, allows the Trustees of each group of Fidelity ® funds to focus on the unique issues of the funds they oversee, including common research, investment, and operational issues. On occasion, the separate Boards establish joint committees to address issues of overlapping consequences for the Fidelity ® funds overseen by each Board.
The Trustees operate using a system of committees to facilitate the timely and efficient consideration of all matters of importance to the Trustees, each fund, and fund shareholders and to facilitate compliance with legal and regulatory requirements and oversight of the funds' activities and associated risks. The Board, acting through its committees, has charged FMR and its affiliates with (i) identifying events or circumstances the occurrence of which could have demonstrably adverse effects on the funds' business and/or reputation; (ii) implementing processes and controls to lessen the possibility that such events or circumstances occur or to mitigate the effects of such events or circumstances if they do occur; and (iii) creating and maintaining a system designed to evaluate continuously business and market conditions in order to facilitate the identification and implementation processes described in (i) and (ii) above. Because the day-to-day operations and activities of the funds are carried out by or through FMR, its affiliates, and other service providers, the funds' exposure to risks is mitigated but not eliminated by the processes overseen by the Trustees. While each of the Board's committees has responsibility for overseeing different aspects of the funds' activities, oversight is exercised primarily through the Operations, Audit, and Compliance Committees. Appropriate personnel, including but not limited to the funds' Chief Compliance Officer (CCO), FMR's internal auditor, the independent accountants, the funds' Treasurer and portfolio management personnel, make periodic reports to the Board's committees, as appropriate, including an annual review of Fidelity's risk management program for the Fidelity ® funds. The responsibilities of each standing committee, including their oversight responsibilities, are described further under "Standing Committees of the Trustees."
Interested Trustees*:
Correspondence intended for a Trustee who is an interested person may be sent to Fidelity Investments, 245 Summer Street, Boston, Massachusetts 02210.
Name, Year of Birth; Principal Occupations and Other Relevant Experience+
Bettina Doulton (1964)
Year of Election or Appointment: 2020
Trustee
Ms. Doulton also serves as Trustee of other Fidelity ® funds. Prior to her retirement, Ms. Doulton served in a variety of positions at Fidelity Investments, including as a managing director of research (2006-2007), portfolio manager to certain Fidelity ® funds (1993-2005), equity analyst and portfolio assistant (1990-1993), and research assistant (1987-1990). Ms. Doulton currently owns and operates Phi Builders + Architects and Cellardoor Winery. Previously, Ms. Doulton served as a member of the Board of Brown Capital Management, LLC (2014-2018).
Robert A. Lawrence (1952)
Year of Election or Appointment: 2020
Trustee
Chair of the Board of Trustees
Mr. Lawrence also serves as Trustee of other funds. Previously, Mr. Lawrence served as a Trustee and Member of the Advisory Board of certain funds. Prior to his retirement in 2008, Mr. Lawrence served as Vice President of certain Fidelity ® funds (2006-2008), Senior Vice President, Head of High Income Division of Fidelity Management & Research Company (investment adviser firm, 2006-2008), and President of Fidelity Strategic Investments (investment adviser firm, 2002-2005).
* Determined to be an "Interested Trustee" by virtue of, among other things, his or her affiliation with the trust or various entities under common control with FMR.
+ The information includes the Trustee's principal occupation during the last five years and other information relating to the experience, attributes, and skills relevant to the Trustee's qualifications to serve as a Trustee, which led to the conclusion that the Trustee should serve as a Trustee for each fund.
Independent Trustees:
Correspondence intended for an Independent Trustee may be sent to Fidelity Investments, P.O. Box 55235, Boston, Massachusetts 02205-5235.
Name, Year of Birth; Principal Occupations and Other Relevant Experience+
Thomas P. Bostick (1956)
Year of Election or Appointment: 2021
Trustee
Lieutenant General Bostick also serves as Trustee of other Fidelity ® funds. Prior to his retirement, General Bostick (United States Army, Retired) held a variety of positions within the U.S. Army, including Commanding General and Chief of Engineers, U.S. Army Corps of Engineers (2012-2016) and Deputy Chief of Staff and Director of Human Resources, U.S. Army (2009-2012). General Bostick currently serves as a member of the Board and Finance and Governance & Sustainability Committees of CSX Corporation (transportation, 2020-present) and a member of the Board and Corporate Governance and Nominating Committee of Perma-Fix Environmental Services, Inc. (nuclear waste management, 2020-present). General Bostick serves as Chief Executive Officer of Bostick Global Strategies, LLC (consulting, 2016-present), as a member of the Board of HireVue, Inc. (video interview and assessment, 2020-present), as a member of the Board of Allonnia (biotechnology and engineering solutions, 2022-present) and on the Advisory Board of Solugen, Inc. (specialty bio-based chemicals manufacturer, 2022-present). Previously, General Bostick served as a Member of the Advisory Board of certain Fidelity ® funds (2021), President, Intrexon Bioengineering (2018-2020) and Chief Operating Officer (2017-2020) and Senior Vice President of the Environment Sector (2016-2017) of Intrexon Corporation (biopharmaceutical company).
Dennis J. Dirks (1948)
Year of Election or Appointment: 2018
Trustee
Mr. Dirks also serves as Trustee of other Fidelity ® funds. Prior to his retirement in May 2003, Mr. Dirks served as Chief Operating Officer and as a member of the Board of The Depository Trust & Clearing Corporation (financial markets infrastructure), President, Chief Operating Officer and a member of the Board of The Depository Trust Company (DTC), President and a member of the Board of the National Securities Clearing Corporation (NSCC), Chief Executive Officer and a member of the Board of the Government Securities Clearing Corporation and Chief Executive Officer and a member of the Board of the Mortgage-Backed Securities Clearing Corporation. Mr. Dirks currently serves as a member of the Finance Committee (2016-present) and Board (2017-present) and is Treasurer (2018-present) of the Asolo Repertory Theatre.
Donald F. Donahue (1950)
Year of Election or Appointment: 2018
Trustee
Mr. Donahue also serves as Trustee of other Fidelity ® funds. Mr. Donahue serves as President and Chief Executive Officer of Miranda Partners, LLC (risk consulting for the financial services industry, 2012-present). Previously, Mr. Donahue served as Chief Executive Officer (2006-2012), Chief Operating Officer (2003-2006) and Managing Director, Customer Marketing and Development (1999-2003) of The Depository Trust & Clearing Corporation (financial markets infrastructure). Mr. Donahue currently serves as a member (2007-present) and Co-Chairman (2016-present) of the Board of United Way of New York. Mr. Donahue previously served as a member of the Advisory Board of certain Fidelity ® funds (2015-2018) and as a member of the Board of The Leadership Academy (previously NYC Leadership Academy) (2012-2022).
Vicki L. Fuller (1957)
Year of Election or Appointment: 2020
Trustee
Ms. Fuller also serves as Trustee of other Fidelity ® funds. Previously, Ms. Fuller served as a member of the Advisory Board of certain Fidelity ® funds (2018-2020), Chief Investment Officer of the New York State Common Retirement Fund (2012-2018) and held a variety of positions at AllianceBernstein L.P. (global asset management, 1985-2012), including Managing Director (2006-2012) and Senior Vice President and Senior Portfolio Manager (2001-2006). Ms. Fuller currently serves as a member of the Board, Audit Committee and Nominating and Governance Committee of two Blackstone business development companies (2020-present), as a member of the Board of Treliant, LLC (consulting, 2019-present), as a member of the Board of Ariel Alternatives, LLC (private equity, 2022-present) and as a member of the Board and Chair of the Audit Committee of Gusto, Inc. (software, 2021-present). In addition, Ms. Fuller currently serves as a member of the Board of Roosevelt University (2019-present) and as a member of the Executive Board of New York University's Stern School of Business. Ms. Fuller previously served as a member of the Board, Audit Committee and Nominating and Governance Committee of The Williams Companies, Inc. (natural gas infrastructure, 2018-2021).
Patricia L. Kampling (1959)
Year of Election or Appointment: 2020
Trustee
Ms. Kampling also serves as Trustee of other Fidelity ® funds. Prior to her retirement, Ms. Kampling served as Chairman of the Board and Chief Executive Officer (2012-2019), President and Chief Operating Officer (2011-2012) and Executive Vice President and Chief Financial Officer (2010-2011) of Alliant Energy Corporation. Ms. Kampling currently serves as a member of the Board, Finance Committee and Governance, Compensation and Nominating Committee of Xcel Energy Inc. (utilities company, 2020-present) and as a member of the Board, Audit, Finance and Risk Committee and Safety, Environmental, Technology and Operations Committee and Chair of the Executive Development and Compensation Committee of American Water Works Company, Inc. (utilities company, 2019-present). In addition, Ms. Kampling currently serves as a member of the Board of the Nature Conservancy, Wisconsin Chapter (2019-present). Previously, Ms. Kampling served as a Member of the Advisory Board of certain Fidelity® funds (2020), a member of the Board, Compensation Committee and Executive Committee and Chair of the Audit Committee of Briggs & Stratton Corporation (manufacturing, 2011-2021), a member of the Board of Interstate Power and Light Company (2012-2019) and Wisconsin Power and Light Company (2012-2019) (each a subsidiary of Alliant Energy Corporation) and as a member of the Board and Workforce Development Committee of the Business Roundtable (2018-2019).
Thomas A. Kennedy (1955)
Year of Election or Appointment: 2021
Trustee
Mr. Kennedy also serves as Trustee of other Fidelity ® funds. Previously, Mr. Kennedy served as a Member of the Advisory Board of certain Fidelity ® funds (2020) and held a variety of positions at Raytheon Company (aerospace and defense, 1983-2020), including Chairman and Chief Executive Officer (2014-2020) and Executive Vice President and Chief Operating Officer (2013-2014). Mr. Kennedy served as Executive Chairman of the Board of Directors of Raytheon Technologies Corporation (aerospace and defense, 2020-2021). Mr. Kennedy serves as a Director of the Board of Directors of Textron Inc. (aerospace and defense, 2023-present).
Oscar Munoz (1959)
Year of Election or Appointment: 2021
Trustee
Mr. Munoz also serves as Trustee of other Fidelity ® funds. Prior to his retirement, Mr. Munoz served as Executive Chairman (2020-2021), Chief Executive Officer (2015-2020), President (2015-2016) and a member of the Board (2010-2021) of United Airlines Holdings, Inc. Mr. Munoz currently serves as a member of the Board of CBRE Group, Inc. (commercial real estate, 2020-present), a member of the Board of Univision Communications, Inc. (Hispanic media, 2020-present), a member of the Board of Archer Aviation Inc. (2021-present), a member of the Defense Business Board of the United States Department of Defense (2021-present) and a member of the Board of Salesforce.com, Inc. (cloud-based software, 2022-present). Previously, Mr. Munoz served as a Member of the Advisory Board of certain Fidelity ® funds (2021).
David M. Thomas (1949)
Year of Election or Appointment: 2018
Trustee
Lead Independent Trustee
Mr. Thomas also serves as Trustee of other Fidelity ® funds. Previously, Mr. Thomas served as Executive Chairman (2005-2006) and Chairman and Chief Executive Officer (2000-2005) of IMS Health, Inc. (pharmaceutical and healthcare information solutions). Mr. Thomas currently serves as a member of the Board of Fortune Brands Home and Security (home and security products, 2004-present) and as Director (2013-present) and Non-Executive Chairman of the Board (2022-present) of Interpublic Group of Companies, Inc. (marketing communication).
Susan Tomasky (1953)
Year of Election or Appointment: 2020
Trustee
Ms. Tomasky also serves as Trustee of other Fidelity ® funds. Prior to her retirement, Ms. Tomasky served in various executive officer positions at American Electric Power Company, Inc. (1998-2011), including most recently as President of AEP Transmission (2007-2011). Ms. Tomasky currently serves as a member of the Board and Sustainability Committee and as Chair of the Audit Committee of Marathon Petroleum Corporation (2018-present) and as a member of the Board, Executive Committee, Corporate Governance Committee and Organization and Compensation Committee and as Lead Director of the Board of Public Service Enterprise Group, Inc. (utilities company, 2012-present) and as a member of the Board of its subsidiary company, Public Service Electric and Gas Co. (2021-present). In addition, Ms. Tomasky currently serves as a member (2009-present) and President (2020-present) of the Board of the Royal Shakespeare Company - America (2009-present), as a member of the Board of the Columbus Association for the Performing Arts (2011-present) and as a member of the Board and Kenyon in the World Committee of Kenyon College (2016-present). Previously, Ms. Tomasky served as a Member of the Advisory Board of certain Fidelity ® funds (2020), as a member of the Board of the Columbus Regional Airport Authority (2007-2020), as a member of the Board (2011-2018) and Lead Independent Director (2015-2018) of Andeavor Corporation (previously Tesoro Corporation) (independent oil refiner and marketer) and as a member of the Board of Summit Midstream Partners LP (energy, 2012-2018).
Michael E. Wiley (1950)
Year of Election or Appointment: 2008
Trustee
Mr. Wiley also serves as Trustee of other Fidelity ® funds. Previously, Mr. Wiley served as a member of the Advisory Board of certain Fidelity ® funds (2018-2020), Chairman, President and CEO of Baker Hughes, Inc. (oilfield services, 2000-2004). Mr. Wiley also previously served as a member of the Board of Andeavor Corporation (independent oil refiner and marketer, 2005-2018), a member of the Board of Andeavor Logistics LP (natural resources logistics, 2015-2018) and a member of the Board of High Point Resources (exploration and production, 2005-2020).
+ The information includes the Trustee's principal occupation during the last five years and other information relating to the experience, attributes, and skills relevant to the Trustee's qualifications to serve as a Trustee, which led to the conclusion that the Trustee should serve as a Trustee for each fund.
Advisory Board Members and Officers:
Correspondence intended for a Member of the Advisory Board (if any) may be sent to Fidelity Investments, P.O. Box 55235, Boston, Massachusetts 02205-5235. Correspondence intended for an officer or Peter S. Lynch may be sent to Fidelity Investments, 245 Summer Street, Boston, Massachusetts 02210. Officers appear below in alphabetical order.
Name, Year of Birth; Principal Occupation
Peter S. Lynch (1944)
Year of Election or Appointment: 2018
Member of the Advisory Board
Mr. Lynch also serves as a Member of the Advisory Board of other Fidelity ® funds. Mr. Lynch is Vice Chairman and a Director of Fidelity Management & Research Company LLC (investment adviser firm). In addition, Mr. Lynch serves as a Trustee of Boston College and as the Chairman of the Inner-City Scholarship Fund. Previously, Mr. Lynch served as Vice Chairman and a Director of FMR Co., Inc. (investment adviser firm) and on the Special Olympics International Board of Directors (1997-2006).
Heather Bonner (1977)
Year of Election or Appointment: 2023
Assistant Treasurer
Ms. Bonner also serves as an officer of other funds. Ms. Bonner serves as Senior Vice President (2022-present), and is an employee of Fidelity Investments. Ms. Bonner serves as Assistant Treasurer of Fidelity CRET Trustee LLC (2022-present). Prior to joining Fidelity, Ms. Bonner served as Managing Director at AQR Capital Management (2013-2022) and was the Treasurer and Principal Financial Officer of the AQR Funds (2013-2022).
Craig S. Brown (1977)
Year of Election or Appointment: 2022
Deputy Treasurer
Mr. Brown also serves as an officer of other funds. Mr. Brown serves as Assistant Treasurer of FIMM, LLC (2021-present) and is an employee of Fidelity Investments (2013-present). Previously, Mr. Brown served as Assistant Treasurer of certain Fidelity ® funds (2019-2022).
John J. Burke III (1964)
Year of Election or Appointment: 2018
Chief Financial Officer
Mr. Burke also serves as Chief Financial Officer of other funds. Mr. Burke serves as Head of Investment Operations for Fidelity Fund and Investment Operations (2018-present) and is an employee of Fidelity Investments (1998-present). Previously Mr. Burke served as head of Asset Management Investment Operations (2012-2018).
Margaret Carey (1973)
Year of Election or Appointment: 2023
Secretary and Chief Legal Officer (CLO)
Ms. Carey also serves as an officer of other funds and as CLO of certain other Fidelity entities. She is a Senior Vice President and Deputy General Counsel of FMR LLC (diversified financial services company, 2019-present), and is an employee of Fidelity Investments.
William C. Coffey (1969)
Year of Election or Appointment: 2019
Assistant Secretary
Mr. Coffey also serves as Assistant Secretary of other funds. He is Senior Vice President and Deputy General Counsel of FMR LLC (diversified financial services company, 2010-present), and is an employee of Fidelity Investments. Previously, Mr. Coffey served as Secretary and CLO of certain funds (2018-2019); CLO, Secretary, and Senior Vice President of Fidelity Management & Research Company and FMR Co., Inc. (investment adviser firms, 2018-2019); Secretary of Fidelity SelectCo, LLC and Fidelity Investments Money Management, Inc. (investment adviser firms, 2018-2019); CLO of Fidelity Management & Research (Hong Kong) Limited, FMR Investment Management (UK) Limited, and Fidelity Management & Research (Japan) Limited (investment adviser firms, 2018-2019); and Assistant Secretary of certain funds (2009-2018).
Timothy M. Cohen (1969)
Year of Election or Appointment: 2018
Vice President
Mr. Cohen also serves as Vice President of other funds. Mr. Cohen serves as Co-Head of Equity (2018-present), a Director of Fidelity Management & Research (Japan) Limited (investment adviser firm, 2016-present), and is an employee of Fidelity Investments. Previously, Mr. Cohen served as Executive Vice President of Fidelity SelectCo, LLC (2019), Head of Global Equity Research (2016-2018), Chief Investment Officer - Equity and a Director of Fidelity Management & Research (U.K.) Inc. (investment adviser firm, 2013-2015) and as a Director of Fidelity Management & Research (Hong Kong) Limited (investment adviser firm, 2017).
Jonathan Davis (1968)
Year of Election or Appointment: 2010
Assistant Treasurer
Mr. Davis also serves as an officer of other funds. Mr. Davis serves as Assistant Treasurer of FIMM, LLC (2021-present), FMR Capital, Inc. (2017-present), FD Funds GP LLC (2021-present), FD Funds Holding LLC (2021-present), and FD Funds Management LLC (2021-present); and is an employee of Fidelity Investments. Previously, Mr. Davis served as Vice President and Associate General Counsel of FMR LLC (diversified financial services company, 2003-2010).
Laura M. Del Prato (1964)
Year of Election or Appointment: 2018
Assistant Treasurer
Ms. Del Prato also serves as an officer of other funds. Ms. Del Prato serves as Assistant Treasurer of FIMM, LLC (2021-present) and is an employee of Fidelity Investments (2017-present). Previously, Ms. Del Prato served as President and Treasurer of The North Carolina Capital Management Trust: Cash Portfolio and Term Portfolio (2018-2020). Prior to joining Fidelity Investments, Ms. Del Prato served as a Managing Director and Treasurer of the JPMorgan Mutual Funds (2014-2017). Prior to JPMorgan, Ms. Del Prato served as a partner at Cohen Fund Audit Services (accounting firm, 2012-2013) and KPMG LLP (accounting firm, 2004-2012).
Colm A. Hogan (1973)
Year of Election or Appointment: 2020
Assistant Treasurer
Mr. Hogan also serves as an officer of other funds. Mr. Hogan serves as Assistant Treasurer of FIMM, LLC (2021-present) and FMR Capital, Inc. (2017-present) and is an employee of Fidelity Investments (2005-present). Previously, Mr. Hogan served as Deputy Treasurer of certain Fidelity ® funds (2016-2020) and Assistant Treasurer of certain Fidelity ® funds (2016-2018).
Pamela R. Holding (1964)
Year of Election or Appointment: 2018
Vice President
Ms. Holding also serves as Vice President of other funds. Ms. Holding serves as Co-Head of Equity (2018-present) and is an employee of Fidelity Investments (2013-present). Previously, Ms. Holding served as Executive Vice President of Fidelity SelectCo, LLC (2019) and as Chief Investment Officer of Fidelity Institutional Asset Management (2013-2018).
Chris Maher (1972)
Year of Election or Appointment: 2020
Deputy Treasurer
Mr. Maher also serves as an officer of other funds. Mr. Maher serves as Assistant Treasurer of FIMM, LLC (2021-present) and FMR Capital, Inc. (2017-present), and is an employee of Fidelity Investments (2008-present). Previously, Mr. Maher served as Assistant Treasurer of certain funds (2013-2020); Vice President of Asset Management Compliance (2013), Vice President of the Program Management Group of FMR (investment adviser firm, 2010-2013), and Vice President of Valuation Oversight (2008-2010).
Jason P. Pogorelec (1975)
Year of Election or Appointment: 2020
Chief Compliance Officer
Mr. Pogorelec also serves as Chief Compliance Officer of other funds. Mr. Pogorelec is a Senior Vice President of Asset Management Compliance for Fidelity Investments and is an employee of Fidelity Investments. Mr. Pogorelec serves as Compliance Officer of Fidelity Management & Research Company LLC (investment adviser firm, 2023-present). Previously, Mr. Pogorelec served as Vice President, Associate General Counsel for Fidelity Investments (2010-2020) and Assistant Secretary of certain Fidelity ® funds (2015-2020).
Brett Segaloff (1972)
Year of Election or Appointment: 2021
Anti-Money Laundering (AML) Officer
Mr. Segaloff also serves as an AML Officer of other funds and other related entities. He is Director, Anti-Money Laundering (2007-present) of FMR LLC (diversified financial services company) and is an employee of Fidelity Investments (1996-present).
Stacie M. Smith (1974)
Year of Election or Appointment: 2018
President and Treasurer
Ms. Smith also serves as an officer of other funds. Ms. Smith serves as Assistant Treasurer of FIMM, LLC (2021-present) and FMR Capital, Inc. (2017-present), is an employee of Fidelity Investments (2009-present), and has served in other fund officer roles. Prior to joining Fidelity Investments, Ms. Smith served as Senior Audit Manager of Ernst & Young LLP (accounting firm, 1996-2009). Previously, Ms. Smith served as Assistant Treasurer (2013-2019) and Deputy Treasurer (2013-2016) of certain Fidelity ® funds.
Jim Wegmann (1979)
Year of Election or Appointment: 2019
Assistant Treasurer
Mr. Wegmann also serves as an officer of other funds. Mr. Wegmann serves as Assistant Treasurer of FIMM, LLC (2021-present) and is an employee of Fidelity Investments (2011-present). Previously, Mr. Wegmann served as Assistant Treasurer of certain Fidelity ® funds (2019-2021).
As a shareholder, you incur two types of costs: (1) transaction costs, which may include sales charges (loads) on purchase payments or redemption proceeds, as applicable and (2) ongoing costs, which generally include management fees, distribution and/or service (12b-1) fees and other Fund expenses. This Example is intended to help you understand your ongoing costs (in dollars) of investing in a fund and to compare these costs with the ongoing costs of investing in other mutual funds.
| The Example is based on an investment of $1,000 invested at the beginning of the period and held for the entire period (September 1, 2022 to February 28, 2023). |
Actual Expenses
The first line of the accompanying table provides information about actual account values and actual expenses. You may use the information in this line, together with the amount you invested, to estimate the expenses that you paid over the period. Simply divide your account value by $1,000.00 (for example, an $8,600 account value divided by $1,000.00 = 8.6), then multiply the result by the number in the first line for a class/Fund under the heading entitled "Expenses Paid During Period" to estimate the expenses you paid on your account during this period. If any fund is a shareholder of any underlying mutual funds or exchange-traded funds (ETFs) (the Underlying Funds), such fund indirectly bears its proportional share of the expenses of the Underlying Funds in addition to the direct expenses incurred presented in the table. These fees and expenses are not included in the annualized expense ratio used to calculate the expense estimate in the table below.
Hypothetical Example for Comparison Purposes
The second line of the accompanying table provides information about hypothetical account values and hypothetical expenses based on the actual expense ratio and an assumed rate of return of 5% per year before expenses, which is not the actual return. The hypothetical account values and expenses may not be used to estimate the actual ending account balance or expenses you paid for the period. You may use this information to compare the ongoing costs of investing in the Fund and other funds. To do so, compare this 5% hypothetical example with the 5% hypothetical examples that appear in the shareholder reports of the other funds. If any fund is a shareholder of any Underlying Funds, such fund indirectly bears its proportional share of the expenses of the Underlying Funds in addition to the direct expenses as presented in the table. These fees and expenses are not included in the annualized expense ratio used to calculate the expense estimate in the table below.
Please note that the expenses shown in the table are meant to highlight your ongoing costs only and do not reflect any transaction costs. Therefore, the second line of the table is useful in comparing ongoing costs only, and will not help you determine the relative total costs of owning different funds. In addition, if these transactional costs were included, your costs would have been higher.
| | | | | Annualized Expense Ratio- A | | Beginning Account Value September 1, 2022 | | Ending Account Value February 28, 2023 | | Expenses Paid During Period- C September 1, 2022 to February 28, 2023 |
| | | | | | | | | | |
| Biotechnology Portfolio | | | | .71% | | | | | | |
| Actual | | | | | | $ 1,000 | | $ 1,008.20 | | $ 3.54 |
Hypothetical- B | | | | | | $ 1,000 | | $ 1,021.27 | | $ 3.56 |
| | | | | | | | | | |
| Health Care Portfolio | | | | .69% | | | | | | |
| Actual | | | | | | $ 1,000 | | $ 1,019.90 | | $ 3.46 |
Hypothetical- B | | | | | | $ 1,000 | | $ 1,021.37 | | $ 3.46 |
| | | | | | | | | | |
| Health Care Services Portfolio | | | | .73% | | | | | | |
| Actual | | | | | | $ 1,000 | | $ 945.70 | | $ 3.52 |
Hypothetical- B | | | | | | $ 1,000 | | $ 1,021.17 | | $ 3.66 |
| | | | | | | | | | |
| Medical Technology and Devices Portfolio | | | | .70% | | | | | | |
| Actual | | | | | | $ 1,000 | | $ 1,038.90 | | $ 3.54 |
Hypothetical- B | | | | | | $ 1,000 | | $ 1,021.32 | | $ 3.51 |
| | | | | | | | | | |
| Pharmaceuticals Portfolio | | | | .77% | | | | | | |
| Actual | | | | | | $ 1,000 | | $ 1,027.50 | | $ 3.87 |
Hypothetical- B | | | | | | $ 1,000 | | $ 1,020.98 | | $ 3.86 |
| |
A Annualized expense ratio reflects expenses net of applicable fee waivers.
B 5% return per year before expenses
C Expenses are equal to the annualized expense ratio, multiplied by the average account value over the period, multiplied by 181/ 365 (to reflect the one-half year period). The fees and expenses of any Underlying Funds are not included in each annualized expense ratio.
The dividend and capital gains distributions for the fund(s) are available on Fidelity.com or Institutional.Fidelity.com.
The funds hereby designate as capital gain dividend the amounts noted below for the taxable year ended February 28, 2023, or, if subsequently determined to be different, the net capital gain of such year.
| Health Care Services Portfolio | $8,714,096 |
Pharmaceuticals Portfolio | $66,573,883 |
A percentage of the dividends distributed during the fiscal year for the following funds qualify for the dividends-received deduction for corporate shareholders:
| Health Care Services Portfolio | |
April 2022 December 2022 | 100% 100% |
| Pharmaceuticals Portfolio | |
April 2022 December 2022 | 62% 54% |
A percentage of the dividends distributed during the fiscal year for the following funds may be taken into account as a dividend for purposes of the maximum rate under section 1(h)(11) of the Internal Revenue Code.
| Health Care Services Portfolio | |
April 2022 December 2022 | 100% 100% |
| Pharmaceuticals Portfolio | |
April 2022 December 2022 | 100% 100% |
The funds hereby designate the percentages noted below of the short-term capital gain dividends distributed during the fiscal year as qualifying to be taxed as short-term capital gain dividends for nonresident alien shareholders:
| | April, 2022 |
| Health Care Services Portfolio | 100% |
The funds hereby designate the amounts noted below as distributions paid during the fiscal year ended 2023 as qualifying to be taxed as section 163(j) interest dividends:
| Pharmaceuticals Portfolio | $81,637 |
The funds will notify shareholders in January 2024 of amounts for use in preparing 2023 income tax returns.
The Securities and Exchange Commission adopted Rule 22e-4 under the Investment Company Act of 1940 (the Liquidity Rule) to promote effective liquidity risk management throughout the open-end investment company industry, thereby reducing the risk that funds will be unable to meet their redemption obligations and mitigating dilution of the interests of fund shareholders.
The Funds have adopted and implemented a liquidity risk management program (the Program) reasonably designed to assess and manage each Fund's liquidity risk and to comply with the requirements of the Liquidity Rule. Each Fund's Board of Trustees (the Board) has designated each Fund's investment adviser as administrator of the Program. The Fidelity advisers have established a Liquidity Risk Management Committee (the LRM Committee) to manage the Program for each of the Fidelity Funds. The LRM Committee monitors the adequacy and effectiveness of implementation of the Program and on a periodic basis assesses each Fund's liquidity risk based on a variety of factors including (1) the Fund's investment strategy, (2) portfolio liquidity and cash flow projections during normal and reasonably foreseeable stressed conditions, (3) shareholder redemptions, (4) borrowings and other funding sources and (5) certain factor specific to ETFs including the effect of the Fund's prices and spreads, market participants, and basket compositions on the overall liquidity of the Fund's portfolio, as applicable.
In accordance with the Program, each of the Fund's portfolio investments is classified into one of four defined liquidity categories based on a determination of a reasonable expectation for how long it would take to convert the investment to cash (or sell or dispose of the investment) without significantly changing its market value.
- Highly liquid investments - cash or convertible to cash within three business days or less
- Moderately liquid investments - convertible to cash in three to seven calendar days
- Less liquid investments - can be sold or disposed of, but not settled, within seven calendar days
- Illiquid investments - cannot be sold or disposed of within seven calendar days
Liquidity classification determinations take into account a variety of factors including various market, trading and investment-specific considerations, as well as market depth, and generally utilize analysis from a third-party liquidity metrics service.
The Liquidity Rule places a 15% limit on a fund's illiquid investments and requires funds that do not primarily hold assets that are highly liquid investments to determine and maintain a minimum percentage of the fund's net assets to be invested in highly liquid investments (highly liquid investment minimum or HLIM). The Program includes provisions reasonably designed to comply with the 15% limit on illiquid investments and for determining, periodically reviewing and complying with the HLIM requirement as applicable.
At a recent meeting of the Fund's Board of Trustees, the LRM Committee provided a written report to the Board pertaining to the operation, adequacy, and effectiveness of the Program for the period December 1, 2021 through November 30, 2022. The report concluded that the Program is operating effectively and is reasonably designed to assess and manage the Fund's liquidity risk.
1.813640.118
SELHC-ANN-0423
Fidelity® Select Portfolios®
Financials Sector
Banking Portfolio
Brokerage and Investment Management Portfolio
Financial Services Portfolio
FinTech Portfolio
Insurance Portfolio
(Financial Services Portfolio to be renamed Financials Portfolio effective April 28, 2023)
Annual Report
February 28, 2023
Contents
To view a fund's proxy voting guidelines and proxy voting record for the 12-month period ended June 30, visit http://www.fidelity.com/proxyvotingresults or visit the Securities and Exchange Commission's (SEC) web site at http://www.sec.gov.
You may also call 1-800-544-8544 to request a free copy of the proxy voting guidelines.
Standard & Poor's, S&P and S&P 500 are registered service marks of The McGraw-Hill Companies, Inc. and have been licensed for use by Fidelity Distributors Corporation.
Other third-party marks appearing herein are the property of their respective owners.
All other marks appearing herein are registered or unregistered trademarks or service marks of FMR LLC or an affiliated company. © 2023 FMR LLC. All rights reserved.
This report and the financial statements contained herein are submitted for the general information of the shareholders of the Funds. This report is not authorized for distribution to prospective investors in the Funds unless preceded or accompanied by an effective prospectus.
A fund files its complete schedule of portfolio holdings with the SEC for the first and third quarters of each fiscal year on Form N-PORT. Forms N-PORT are available on the SEC's web site at http://www.sec.gov. A fund's Forms N-PORT may be reviewed and copied at the SEC's Public Reference Room in Washington, DC. Information regarding the operation of the SEC's Public Reference Room may be obtained by calling 1-800-SEC-0330.
For a complete list of a fund's portfolio holdings, view the most recent holdings listing, semiannual report, or annual report on Fidelity's web site at http://www.fidelity.com, http://www.institutional.fidelity.com, or http://www.401k.com, as applicable.
NOT FDIC INSURED •MAY LOSE VALUE •NO BANK GUARANTEE
Neither the Funds nor Fidelity Distributors Corporation is a bank.
Average annual total return reflects the change in the value of an investment, assuming reinvestment of distributions from dividend income and capital gains (the profits earned upon the sale of securities that have grown in value, if any) and assuming a constant rate of performance each year. The hypothetical investment and the average annual total returns do not reflect the deduction of taxes that a shareholder would pay on fund distributions or the redemption of fund shares. During periods of reimbursement by Fidelity, a fund's total return will be greater than it would be had the reimbursement not occurred. How a fund did yesterday is no guarantee of how it will do tomorrow.
| Average Annual Total Returns |
| | | | |
Periods ended February 28, 2023 | Past 1 year | Past 5 years | Past 10 years |
| Banking Portfolio | -11.27% | 3.88% | 9.81% |
| $10,000 Over 10 Years |
| |
Let's say hypothetically that $10,000 was invested in Banking Portfolio on February 28, 2013. The chart shows how the value of your investment would have changed, and also shows how the S&P 500® Index performed over the same period. |
|
|
Banking Portfolio
Market Recap:
U.S. equities returned -7.69% for the 12 months ending February 28, 2023, according to the S&P 500 ® index. The new year began with an encouraging upturn in January (+6.28%), but stocks lost momentum in February (-2.44%) amid higher-than-expected inflation and strong jobs data. Investors took these as signs that the economy continued to run hot, even after a year of historic policy adjustment by the Federal Reserve aimed at cooling economic growth. Record inflation in 2022 prompted the Fed to aggressively tighten monetary policy, and market interest rates eclipsed their highest level in a decade, stoking recession fears and sending stocks into bear market territory. Since March 2022, the central bank has hiked its benchmark rate eight times, by 4.5 percentage points - the fastest-ever pace of monetary tightening - while also shrinking its massive asset portfolio. The latest bump came on February 2, along with a signal that the Fed plans to lift rates in March while it considers whether and when to pause increases. Against this dynamic backdrop, stocks struggled to gain traction until a strong rally ignited heading into the summer. But in September, the index returned -9.21%, one of its worst monthly results ever, before advancing 7.56% in Q4, as risky assets regained favor. For the full 12 months, value stocks handily outpaced growth. The headwind for the latter was most pronounced in the growth-oriented communication services (-25%) and consumer discretionary (-18%) sectors. In sharp contrast, energy gained 24%.
Comments from Portfolio Manager Matthew Reed:
For the fiscal year, the fund returned -11.27%, outperforming the -12.37% result of the MSCI US IMI Banks 5% Capped Linked Index, but underperforming the broad-based S&P 500 ® index. The top contributor to performance versus the industry index was an overweighting in diversified banks. Stock selection and an underweighting in regional banks and stock picks in thrifts & mortgage finance also helped. Not owning SVB Financial Group, an index component that returned roughly -52%, was the largest individual relative contributor. The fund's non-index position in State Street gained approximately 7% and helped. Another notable relative contributor was an outsized stake in M&T Bank (-13%), which was one of our largest holdings. Conversely, the primary detractor from performance versus the industry index was stock picks in diversified banks. The fund's biggest individual relative detractor was an overweighting in Signature Bank, which returned -66% the past year. Also holding back performance was our outsized stake in PacWest Bancorp, which returned -42%. Avoiding Regions Financial, an index component that returned about 0%, also hurt relative performance. Notable changes in positioning include increased exposure to the diversified banks subindustry and a lower allocation to thrifts & mortgage finance.
The views expressed above reflect those of the portfolio manager(s) only through the end of the period as stated on the cover of this report and do not necessarily represent the views of Fidelity or any other person in the Fidelity organization. Any such views are subject to change at any time based upon market or other conditions and Fidelity disclaims any responsibility to update such views. These views may not be relied on as investment advice and, because investment decisions for a Fidelity fund are based on numerous factors, may not be relied on as an indication of trading intent on behalf of any Fidelity fund.
Banking Portfolio
Top Holdings (% of Fund's net assets) |
| |
| Wells Fargo & Co. | 9.0 | |
| Bank of America Corp. | 6.9 | |
| U.S. Bancorp | 6.7 | |
| JPMorgan Chase & Co. | 5.4 | |
| Citigroup, Inc. | 5.1 | |
| Truist Financial Corp. | 4.4 | |
| M&T Bank Corp. | 4.1 | |
| KeyCorp | 3.4 | |
| East West Bancorp, Inc. | 3.1 | |
| Essent Group Ltd. | 3.1 | |
| | 51.2 | |
| |
| Industries (% of Fund's net assets) |
| |
| Banks | 87.9 | |
| Thrifts & Mortgage Finance | 6.3 | |
| Consumer Finance | 2.8 | |
| Capital Markets | 1.9 | |
| IT Services | 0.6 | |
| Diversified Financial Services | 0.0 | |
| |
Percentages shown as 0.0% may reflect amounts less than 0.05%.
Banking Portfolio
Showing Percentage of Net Assets
| Common Stocks - 98.9% |
| | | Shares | Value ($) |
| Banks - 87.9% | | | |
| Diversified Banks - 33.1% | | | |
| Bank of America Corp. | | 863,376 | 29,613,797 |
| Citigroup, Inc. | | 434,000 | 21,999,460 |
| JPMorgan Chase & Co. | | 160,500 | 23,007,675 |
| U.S. Bancorp | | 606,800 | 28,962,564 |
| Wells Fargo & Co. | | 821,992 | 38,444,566 |
| | | | 142,028,062 |
| Regional Banks - 54.8% | | | |
| 1st Source Corp. | | 102,881 | 5,125,531 |
| American National Bankshares, Inc. | | 131,886 | 4,437,964 |
| Associated Banc-Corp. | | 489,100 | 11,322,665 |
| BankUnited, Inc. | | 97,369 | 3,448,810 |
| Cadence Bank | | 375,539 | 9,974,316 |
| Comerica, Inc. | | 155,900 | 10,928,590 |
| Community Trust Bancorp, Inc. | | 112,676 | 4,816,899 |
| ConnectOne Bancorp, Inc. | | 103,300 | 2,505,025 |
| East West Bancorp, Inc. | | 175,300 | 13,359,613 |
| Eastern Bankshares, Inc. | | 127,200 | 1,994,496 |
| First Citizens Bancshares, Inc. | | 14,000 | 10,272,640 |
| First Hawaiian, Inc. | | 246,800 | 6,749,980 |
| First Interstate Bancsystem, Inc. | | 286,234 | 10,172,756 |
| Heartland Financial U.S.A., Inc. | | 179,100 | 8,854,704 |
| Independent Bank Group, Inc. | | 47,000 | 2,766,420 |
| KeyCorp | | 789,700 | 14,443,613 |
| M&T Bank Corp. | | 112,560 | 17,479,442 |
| Old National Bancorp, Indiana | | 203,454 | 3,595,032 |
| PacWest Bancorp | | 275,336 | 7,640,574 |
| PNC Financial Services Group, Inc. | | 19,800 | 3,126,816 |
| Popular, Inc. | | 169,900 | 12,130,860 |
| Preferred Bank, Los Angeles (a) | | 69,295 | 4,878,368 |
| Sierra Bancorp | | 135,100 | 2,730,371 |
| Signature Bank | | 63,590 | 7,316,030 |
| Trico Bancshares | | 96,087 | 4,853,354 |
| Truist Financial Corp. | | 406,200 | 19,071,090 |
| UMB Financial Corp. | | 103,466 | 9,380,228 |
| Univest Corp. of Pennsylvania | | 194,500 | 5,484,900 |
| Wintrust Financial Corp. | | 95,300 | 8,779,989 |
| Zions Bancorp NA | | 159,450 | 8,071,359 |
| | | | 235,712,435 |
TOTAL BANKS | | | 377,740,497 |
| Capital Markets - 1.9% | | | |
| Asset Management & Custody Banks - 1.9% | | | |
| Phoenix Vega Mezz PLC | | 330,200 | 16,415 |
| State Street Corp. | | 95,300 | 8,451,204 |
| | | | 8,467,619 |
| Consumer Finance - 2.8% | | | |
| Consumer Finance - 2.8% | | | |
| Capital One Financial Corp. | | 55,200 | 6,021,216 |
| OneMain Holdings, Inc. (a) | | 143,900 | 6,200,651 |
| | | | 12,221,867 |
| Diversified Financial Services - 0.0% | | | |
| Other Diversified Financial Services - 0.0% | | | |
| Sunrisemezz Ltd. (b) | | 47,171 | 6,421 |
| Thrifts & Mortgage Finance - 6.3% | | | |
| Thrifts & Mortgage Finance - 6.3% | | | |
| Essent Group Ltd. | | 308,229 | 13,238,436 |
| NMI Holdings, Inc. (b) | | 394,502 | 9,207,677 |
| Radian Group, Inc. | | 162,236 | 3,463,739 |
| Southern Missouri Bancorp, Inc. (a) | | 23,700 | 1,096,836 |
| | | | 27,006,688 |
| TOTAL COMMON STOCKS (Cost $350,739,427) | | | 425,443,092 |
| | | | |
| Convertible Bonds - 0.6% |
| | | Principal Amount (c) | Value ($) |
| IT Services - 0.6% | | | |
| Data Processing & Outsourced Services - 0.6% | | | |
Affirm Holdings, Inc. 0% 11/15/26 (Cost $2,291,212) | | 3,658,000 | 2,439,520 |
| | | | |
| Money Market Funds - 1.3% |
| | | Shares | Value ($) |
| Fidelity Cash Central Fund 4.63% (d) | | 1,486,764 | 1,487,061 |
| Fidelity Securities Lending Cash Central Fund 4.63% (d)(e) | | 4,036,789 | 4,037,193 |
| TOTAL MONEY MARKET FUNDS (Cost $5,524,254) | | | 5,524,254 |
| | | | |
| TOTAL INVESTMENT IN SECURITIES - 100.8% (Cost $358,554,893) | 433,406,866 |
NET OTHER ASSETS (LIABILITIES) - (0.8)% | (3,522,827) |
| NET ASSETS - 100.0% | 429,884,039 |
| | |
Legend
| (a) | Security or a portion of the security is on loan at period end. |
| (c) | Amount is stated in United States dollars unless otherwise noted. |
| (d) | Affiliated fund that is generally available only to investment companies and other accounts managed by Fidelity Investments. The rate quoted is the annualized seven-day yield of the fund at period end. A complete unaudited listing of the fund's holdings as of its most recent quarter end is available upon request. In addition, each Fidelity Central Fund's financial statements, which are not covered by the Fund's Report of Independent Registered Public Accounting Firm, are available on the SEC's website or upon request. |
| (e) | Investment made with cash collateral received from securities on loan. |
Affiliated Central Funds
Fiscal year to date information regarding the Fund's investments in Fidelity Central Funds, including the ownership percentage, is presented below.
| Affiliate | Value, beginning of period ($) | Purchases ($) | Sales Proceeds ($) | Dividend Income ($) | Realized Gain (loss) ($) | Change in Unrealized appreciation (depreciation) ($) | Value, end of period ($) | % ownership, end of period |
| Fidelity Cash Central Fund 4.63% | 70,784 | 65,907,156 | 64,490,879 | 11,824 | - | - | 1,487,061 | 0.0% |
| Fidelity Securities Lending Cash Central Fund 4.63% | 39,878,125 | 291,681,674 | 327,522,606 | 14,953 | - | - | 4,037,193 | 0.0% |
| Total | 39,948,909 | 357,588,830 | 392,013,485 | 26,777 | - | - | 5,524,254 | |
| | | | | | | | | |
Amounts in the dividend income column in the above table include any capital gain distributions from underlying funds, which are presented in the corresponding line item in the Statement of Operations, if applicable.
Amount for Fidelity Securities Lending Cash Central Fund represents the income earned on investing cash collateral, less rebates paid to borrowers and any lending agent fees associated with the loan, plus any premium payments received for lending certain types of securities.
Amounts included in the purchases and sales proceeds columns may include in-kind transactions, if applicable.
Investment Valuation
The following is a summary of the inputs used, as of February 28, 2023, involving the Fund's assets and liabilities carried at fair value. The inputs or methodology used for valuing securities may not be an indication of the risk associated with investing in those securities. For more information on valuation inputs, and their aggregation into the levels used below, please refer to the Investment Valuation section in the accompanying Notes to Financial Statements.
| Valuation Inputs at Reporting Date: |
| Description | Total ($) | Level 1 ($) | Level 2 ($) | Level 3 ($) |
Investments in Securities: | | | | |
|
| Common Stocks | 425,443,092 | 425,443,092 | - | - |
|
| Convertible Bonds | 2,439,520 | - | 2,439,520 | - |
|
| Money Market Funds | 5,524,254 | 5,524,254 | - | - |
| Total Investments in Securities: | 433,406,866 | 430,967,346 | 2,439,520 | - |
Banking Portfolio
| Statement of Assets and Liabilities |
| | | | February 28, 2023 |
| | | | | |
| Assets | | | | |
| Investment in securities, at value (including securities loaned of $3,913,304) - See accompanying schedule: | | | | |
Unaffiliated issuers (cost $353,030,639) | $ | 427,882,612 | | |
Fidelity Central Funds (cost $5,524,254) | | 5,524,254 | | |
| | | | | |
| | | | | |
| Total Investment in Securities (cost $358,554,893) | | | $ | 433,406,866 |
| Receivable for investments sold | | | | 40,282 |
| Receivable for fund shares sold | | | | 27,710 |
| Dividends receivable | | | | 881,831 |
| Distributions receivable from Fidelity Central Funds | | | | 1,081 |
| Prepaid expenses | | | | 2,436 |
Total assets | | | | 434,360,206 |
| Liabilities | | | | |
| Payable for fund shares redeemed | $ | 138,213 | | |
| Accrued management fee | | 193,670 | | |
| Other affiliated payables | | 72,244 | | |
| Other payables and accrued expenses | | 34,847 | | |
| Collateral on securities loaned | | 4,037,193 | | |
| Total Liabilities | | | | 4,476,167 |
| Net Assets | | | $ | 429,884,039 |
| Net Assets consist of: | | | | |
| Paid in capital | | | $ | 345,505,777 |
| Total accumulated earnings (loss) | | | | 84,378,262 |
| Net Assets | | | $ | 429,884,039 |
Net Asset Value , offering price and redemption price per share ($429,884,039 ÷ 16,383,289 shares) | | | $ | 26.24 |
| Statement of Operations |
| | | | Year ended February 28, 2023 |
| Investment Income | | | | |
| Dividends | | | $ | 14,770,963 |
| Interest | | | | 200,713 |
| Income from Fidelity Central Funds (including $14,953 from security lending) | | | | 26,777 |
| Total Income | | | | 14,998,453 |
| Expenses | | | | |
| Management fee | $ | 2,593,092 | | |
| Transfer agent fees | | 804,025 | | |
| Accounting fees | | 176,905 | | |
| Custodian fees and expenses | | 18,106 | | |
| Independent trustees' fees and expenses | | 1,734 | | |
| Registration fees | | 43,908 | | |
| Audit | | 42,588 | | |
| Legal | | 878 | | |
| Interest | | 3,052 | | |
| Miscellaneous | | 3,585 | | |
| Total expenses before reductions | | 3,687,873 | | |
| Expense reductions | | (17,651) | | |
| Total expenses after reductions | | | | 3,670,222 |
| Net Investment income (loss) | | | | 11,328,231 |
| Realized and Unrealized Gain (Loss) | | | | |
| Net realized gain (loss) on: | | | | |
| Investment Securities: | | | | |
| Unaffiliated issuers | | 20,549,485 | | |
| Foreign currency transactions | | 481 | | |
| Total net realized gain (loss) | | | | 20,549,966 |
| Change in net unrealized appreciation (depreciation) on investment securities | | | | (115,880,770) |
| Net gain (loss) | | | | (95,330,804) |
| Net increase (decrease) in net assets resulting from operations | | | $ | (84,002,573) |
| Statement of Changes in Net Assets |
| |
| | Year ended February 28, 2023 | | Year ended February 28, 2022 |
| Increase (Decrease) in Net Assets | | | | |
| Operations | | | | |
| Net investment income (loss) | $ | 11,328,231 | $ | 12,596,370 |
| Net realized gain (loss) | | 20,549,966 | | 29,218,859 |
| Change in net unrealized appreciation (depreciation) | | (115,880,770) | | 75,273,957 |
| Net increase (decrease) in net assets resulting from operations | | (84,002,573) | | 117,089,186 |
| Distributions to shareholders | | (27,365,238) | | (20,298,948) |
| Share transactions | | | | |
| Proceeds from sales of shares | | 86,486,325 | | 519,785,682 |
| Reinvestment of distributions | | 25,505,449 | | 19,052,468 |
| Cost of shares redeemed | | (287,573,573) | | (456,654,461) |
Net increase (decrease) in net assets resulting from share transactions | | (175,581,799) | | 82,183,689 |
| Total increase (decrease) in net assets | | (286,949,610) | | 178,973,927 |
| | | | | |
| Net Assets | | | | |
| Beginning of period | | 716,833,649 | | 537,859,722 |
| End of period | $ | 429,884,039 | $ | 716,833,649 |
| | | | | |
| Other Information | | | | |
| Shares | | | | |
| Sold | | 3,179,002 | | 17,252,319 |
| Issued in reinvestment of distributions | | 1,010,981 | | 659,756 |
| Redeemed | | (10,660,796) | | (15,503,674) |
| Net increase (decrease) | | (6,470,813) | | 2,408,401 |
| | | | | |
Financial Highlights
| Years ended February 28, | | 2023 | | 2022 | | 2021 | | 2020 A | | 2019 |
Selected Per-Share Data | | | | | | | | | | |
| Net asset value, beginning of period | $ | 31.37 | $ | 26.31 | $ | 23.37 | $ | 26.42 | $ | 36.82 |
| Income from Investment Operations | | | | | | | | | | |
Net investment income (loss) B,C | | .61 | | .58 | | .54 | | .58 | | .49 |
| Net realized and unrealized gain (loss) | | (4.24) | | 5.48 | | 4.32 | | (1.96) | | (3.62) |
| Total from investment operations | | (3.63) | | 6.06 | | 4.86 | | (1.38) | | (3.13) |
| Distributions from net investment income | | (.67) | | (.54) | | (.55) | | (.53) | | (.54) |
| Distributions from net realized gain | | (.83) | | (.46) | | (1.37) | | (1.14) | | (6.73) |
| Total distributions | | (1.50) | | (1.00) | | (1.92) | | (1.67) | | (7.27) |
| Net asset value, end of period | $ | 26.24 | $ | 31.37 | $ | 26.31 | $ | 23.37 | $ | 26.42 |
Total Return D | | (11.27)% | | 23.37% | | 25.90% | | (6.05)% | | (6.57)% |
Ratios to Average Net Assets C,E,F | | | | | | | | | | |
| Expenses before reductions | | .75% | | .73% | | .79% | | .77% | | .77% |
| Expenses net of fee waivers, if any | | .74% | | .73% | | .79% | | .77% | | .77% |
| Expenses net of all reductions | | .74% | | .73% | | .79% | | .77% | | .76% |
| Net investment income (loss) | | 2.29% | | 1.93% | | 2.84% | | 2.21% | | 1.54% |
| Supplemental Data | | | | | | | | | | |
| Net assets, end of period (000 omitted) | $ | 429,884 | $ | 716,834 | $ | 537,860 | $ | 361,696 | $ | 514,650 |
Portfolio turnover rate G | | 21% | | 34% | | 32% | | 31% | | 44% |
A For the year ended February 29.
B Calculated based on average shares outstanding during the period.
C Net investment income (loss) is affected by the timing of the declaration of dividends by any underlying mutual funds or exchange-traded funds (ETFs). Net investment income (loss) of any mutual funds or ETFs is not included in the Fund's net investment income (loss) ratio.
D Total returns would have been lower if certain expenses had not been reduced during the applicable periods shown.
E Fees and expenses of any underlying mutual funds or exchange-traded funds (ETFs) are not included in the Fund's expense ratio. The Fund indirectly bears its proportionate share of these expenses. For additional expense information related to investments in Fidelity Central Funds, please refer to the "Investments in Fidelity Central Funds" note found in the Notes to Financial Statements section of the most recent Annual or Semi-Annual report.
F Expense ratios reflect operating expenses of the class. Expenses before reductions do not reflect amounts reimbursed, waived, or reduced through arrangements with the investment adviser, brokerage services, or other offset arrangements, if applicable, and do not represent the amount paid by the class during periods when reimbursements, waivers or reductions occur.
G Amount does not include the portfolio activity of any underlying mutual funds or exchange-traded funds (ETFs).
Average annual total return reflects the change in the value of an investment, assuming reinvestment of distributions from dividend income and capital gains (the profits earned upon the sale of securities that have grown in value, if any) and assuming a constant rate of performance each year. The hypothetical investment and the average annual total returns do not reflect the deduction of taxes that a shareholder would pay on fund distributions or the redemption of fund shares. During periods of reimbursement by Fidelity, a fund's total return will be greater than it would be had the reimbursement not occurred. How a fund did yesterday is no guarantee of how it will do tomorrow.
| Average Annual Total Returns |
| | | | |
Periods ended February 28, 2023 | Past 1 year | Past 5 years | Past 10 years |
| Brokerage and Investment Management Portfolio | -2.98% | 10.64% | 11.64% |
| $10,000 Over 10 Years |
| |
Let's say hypothetically that $10,000 was invested in Brokerage and Investment Management Portfolio on February 28, 2013. The chart shows how the value of your investment would have changed, and also shows how the S&P 500® Index performed over the same period. |
|
|
Brokerage and Investment Management Portfolio
Market Recap:
U.S. equities returned -7.69% for the 12 months ending February 28, 2023, according to the S&P 500 ® index. The new year began with an encouraging upturn in January (+6.28%), but stocks lost momentum in February (-2.44%) amid higher-than-expected inflation and strong jobs data. Investors took these as signs that the economy continued to run hot, even after a year of historic policy adjustment by the Federal Reserve aimed at cooling economic growth. Record inflation in 2022 prompted the Fed to aggressively tighten monetary policy, and market interest rates eclipsed their highest level in a decade, stoking recession fears and sending stocks into bear market territory. Since March 2022, the central bank has hiked its benchmark rate eight times, by 4.5 percentage points - the fastest-ever pace of monetary tightening - while also shrinking its massive asset portfolio. The latest bump came on February 2, along with a signal that the Fed plans to lift rates in March while it considers whether and when to pause increases. Against this dynamic backdrop, stocks struggled to gain traction until a strong rally ignited heading into the summer. But in September, the index returned -9.21%, one of its worst monthly results ever, before advancing 7.56% in Q4, as risky assets regained favor. For the full 12 months, value stocks handily outpaced growth. The headwind for the latter was most pronounced in the growth-oriented communication services (-25%) and consumer discretionary (-18%) sectors. In sharp contrast, energy gained 24%.
Comments from Portfolio Manager Charles Ackerman:
For the fiscal year ending February 28, 2023, the fund returned -2.98%, outperforming the -4.33% result of the MSCI US IMI Capital Markets 5% Capped Linked Index, as well as the broad-based S&P 500 ® index. Versus the industry index, security selection was the primary contributor, led by the investment banking & brokerage sector. The fund's largest individual relative contributor was an overweighting in LPL Financial Holdings, which gained 38% the past 12 months. We decreased our investment in this company. Also adding value was our outsized stake in Ameriprise Financial, which gained 16%. Ameriprise Financial was among the fund's biggest holdings. Another key contributor was our out-of-index position in Apollo Global Management (+11%). We trimmed our stake. In contrast, the biggest detractor from performance versus the industry index was security selection in data processing & outsourced services. An underweighting in the outperforming investment banking & brokerage group and stock selection in diversified banks also modestly hindered the fund's relative performance. An underweighting in Jefferies Financial Group was the fund's largest individual relative detractor given the stock's 51% gain the past year. Also holding back performance was an underweighting in Federated Hermes, which gained about 24%. Federated Hermes was not held at period end. Also hampering performance was an underweighting in Goldman Sachs Group, which gained 6%.
The views expressed above reflect those of the portfolio manager(s) only through the end of the period as stated on the cover of this report and do not necessarily represent the views of Fidelity or any other person in the Fidelity organization. Any such views are subject to change at any time based upon market or other conditions and Fidelity disclaims any responsibility to update such views. These views may not be relied on as investment advice and, because investment decisions for a Fidelity fund are based on numerous factors, may not be relied on as an indication of trading intent on behalf of any Fidelity fund.
Brokerage and Investment Management Portfolio
Top Holdings (% of Fund's net assets) |
| |
| Ameriprise Financial, Inc. | 6.1 | |
| Morgan Stanley | 5.9 | |
| BlackRock, Inc. Class A | 5.4 | |
| S&P Global, Inc. | 5.3 | |
| Charles Schwab Corp. | 5.3 | |
| LPL Financial | 5.0 | |
| Intercontinental Exchange, Inc. | 4.7 | |
| Bank of New York Mellon Corp. | 4.4 | |
| KKR & Co. LP | 4.1 | |
| MSCI, Inc. | 3.5 | |
| | 49.7 | |
| |
| Industries (% of Fund's net assets) |
| |
| Capital Markets | 94.3 | |
| Diversified Financial Services | 2.9 | |
| Banks | 0.6 | |
| IT Services | 0.2 | |
| |
Brokerage and Investment Management Portfolio
Showing Percentage of Net Assets
| Common Stocks - 98.0% |
| | | Shares | Value ($) |
| Banks - 0.6% | | | |
| Diversified Banks - 0.6% | | | |
| Wells Fargo & Co. | | 98,300 | 4,597,491 |
| Capital Markets - 94.3% | | | |
| Asset Management & Custody Banks - 40.7% | | | |
| Affiliated Managers Group, Inc. | | 40,400 | 6,440,164 |
| Ameriprise Financial, Inc. | | 144,100 | 49,407,567 |
| Ares Management Corp. | | 347,400 | 28,010,862 |
| Artisan Partners Asset Management, Inc. | | 46,500 | 1,533,105 |
| Avantax, Inc. (a) | | 18,600 | 531,774 |
| Bank of New York Mellon Corp. | | 710,600 | 36,155,328 |
| BlackRock, Inc. Class A | | 63,600 | 43,847,748 |
| Blackstone, Inc. (b) | | 211,500 | 19,204,200 |
| Blue Owl Capital, Inc. Class A (b) | | 806,100 | 9,947,274 |
| Bridge Investment Group Holdings, Inc. | | 93,500 | 1,270,665 |
| Carlyle Group LP | | 353,900 | 12,174,160 |
| Cohen & Steers, Inc. | | 16,128 | 1,167,022 |
| Focus Financial Partners, Inc. Class A (a) | | 9,000 | 466,740 |
| Franklin Resources, Inc. (b) | | 275,300 | 8,113,091 |
| Invesco Ltd. (b) | | 345,100 | 6,094,466 |
| Janus Henderson Group PLC (b) | | 135,600 | 3,723,576 |
| KKR & Co. LP | | 591,800 | 33,347,930 |
| Northern Trust Corp. | | 104,200 | 9,927,134 |
| P10, Inc. | | 143,400 | 1,544,418 |
| Patria Investments Ltd. | | 432,372 | 6,857,420 |
| Petershill Partners PLC (c) | | 425,200 | 855,147 |
| State Street Corp. | | 299,200 | 26,533,056 |
| T. Rowe Price Group, Inc. | | 150,700 | 16,920,596 |
| Virtus Investment Partners, Inc. | | 32,300 | 6,796,889 |
| | | | 330,870,332 |
| Financial Exchanges & Data - 26.7% | | | |
| Cboe Global Markets, Inc. | | 88,938 | 11,221,307 |
| CME Group, Inc. | | 139,800 | 25,913,328 |
| Coinbase Global, Inc. (a)(b) | | 79,000 | 5,121,570 |
| FactSet Research Systems, Inc. | | 1,500 | 621,825 |
| Intercontinental Exchange, Inc. | | 379,400 | 38,622,920 |
| MarketAxess Holdings, Inc. | | 23,800 | 8,126,510 |
| Moody's Corp. | | 77,200 | 22,399,580 |
| MSCI, Inc. | | 54,100 | 28,248,315 |
| NASDAQ, Inc. | | 463,100 | 25,961,386 |
| Open Lending Corp. (a) | | 208,400 | 1,475,472 |
| S&P Global, Inc. | | 127,300 | 43,434,760 |
| Tradeweb Markets, Inc. Class A | | 86,800 | 6,153,252 |
| | | | 217,300,225 |
| Investment Banking & Brokerage - 26.9% | | | |
| BGC Partners, Inc. Class A | | 386,500 | 1,878,390 |
| Charles Schwab Corp. | | 555,061 | 43,250,353 |
| Goldman Sachs Group, Inc. | | 79,600 | 27,991,340 |
| Interactive Brokers Group, Inc. | | 100,000 | 8,611,000 |
| Jefferies Financial Group, Inc. | | 11,100 | 419,469 |
| LPL Financial | | 164,300 | 41,002,708 |
| Moelis & Co. Class A (b) | | 95,500 | 4,090,265 |
| Morgan Stanley | | 492,516 | 47,527,794 |
| Piper Jaffray Companies (b) | | 3,300 | 498,267 |
| PJT Partners, Inc. | | 145,412 | 11,470,099 |
| Raymond James Financial, Inc. (b) | | 216,000 | 23,427,360 |
| Robinhood Markets, Inc. (a)(b) | | 322,700 | 3,249,589 |
| Virtu Financial, Inc. Class A | | 270,400 | 4,969,952 |
| | | | 218,386,586 |
TOTAL CAPITAL MARKETS | | | 766,557,143 |
| Diversified Financial Services - 2.9% | | | |
| Other Diversified Financial Services - 2.9% | | | |
| Apollo Global Management, Inc. | | 333,900 | 23,673,510 |
| IT Services - 0.2% | | | |
| Data Processing & Outsourced Services - 0.2% | | | |
| PayPal Holdings, Inc. (a) | | 21,900 | 1,611,840 |
| TOTAL COMMON STOCKS (Cost $584,224,005) | | | 796,439,984 |
| | | | |
| Money Market Funds - 6.8% |
| | | Shares | Value ($) |
| Fidelity Cash Central Fund 4.63% (d) | | 16,323,202 | 16,326,467 |
| Fidelity Securities Lending Cash Central Fund 4.63% (d)(e) | | 38,915,333 | 38,919,225 |
| TOTAL MONEY MARKET FUNDS (Cost $55,245,692) | | | 55,245,692 |
| | | | |
| TOTAL INVESTMENT IN SECURITIES - 104.8% (Cost $639,469,697) | 851,685,676 |
NET OTHER ASSETS (LIABILITIES) - (4.8)% | (38,712,731) |
| NET ASSETS - 100.0% | 812,972,945 |
| | |
Legend
| (b) | Security or a portion of the security is on loan at period end. |
| (c) | Security exempt from registration under Rule 144A of the Securities Act of 1933. These securities may be resold in transactions exempt from registration, normally to qualified institutional buyers. At the end of the period, the value of these securities amounted to $855,147 or 0.1% of net assets. |
| (d) | Affiliated fund that is generally available only to investment companies and other accounts managed by Fidelity Investments. The rate quoted is the annualized seven-day yield of the fund at period end. A complete unaudited listing of the fund's holdings as of its most recent quarter end is available upon request. In addition, each Fidelity Central Fund's financial statements, which are not covered by the Fund's Report of Independent Registered Public Accounting Firm, are available on the SEC's website or upon request. |
| (e) | Investment made with cash collateral received from securities on loan. |
Affiliated Central Funds
Fiscal year to date information regarding the Fund's investments in Fidelity Central Funds, including the ownership percentage, is presented below.
| Affiliate | Value, beginning of period ($) | Purchases ($) | Sales Proceeds ($) | Dividend Income ($) | Realized Gain (loss) ($) | Change in Unrealized appreciation (depreciation) ($) | Value, end of period ($) | % ownership, end of period |
| Fidelity Cash Central Fund 4.63% | 8,617,943 | 90,194,816 | 82,486,292 | 130,279 | - | - | 16,326,467 | 0.0% |
| Fidelity Securities Lending Cash Central Fund 4.63% | 47,542,900 | 621,049,140 | 629,672,815 | 129,568 | - | - | 38,919,225 | 0.1% |
| Total | 56,160,843 | 711,243,956 | 712,159,107 | 259,847 | - | - | 55,245,692 | |
| | | | | | | | | |
Amounts in the dividend income column in the above table include any capital gain distributions from underlying funds, which are presented in the corresponding line item in the Statement of Operations, if applicable.
Amount for Fidelity Securities Lending Cash Central Fund represents the income earned on investing cash collateral, less rebates paid to borrowers and any lending agent fees associated with the loan, plus any premium payments received for lending certain types of securities.
Amounts included in the purchases and sales proceeds columns may include in-kind transactions, if applicable.
Investment Valuation
The following is a summary of the inputs used, as of February 28, 2023, involving the Fund's assets and liabilities carried at fair value. The inputs or methodology used for valuing securities may not be an indication of the risk associated with investing in those securities. For more information on valuation inputs, and their aggregation into the levels used below, please refer to the Investment Valuation section in the accompanying Notes to Financial Statements.
| Valuation Inputs at Reporting Date: |
| Description | Total ($) | Level 1 ($) | Level 2 ($) | Level 3 ($) |
Investments in Securities: | | | | |
|
| Common Stocks | 796,439,984 | 796,439,984 | - | - |
|
| Money Market Funds | 55,245,692 | 55,245,692 | - | - |
| Total Investments in Securities: | 851,685,676 | 851,685,676 | - | - |
Brokerage and Investment Management Portfolio
| Statement of Assets and Liabilities |
| | | | February 28, 2023 |
| | | | | |
| Assets | | | | |
| Investment in securities, at value (including securities loaned of $38,510,858) - See accompanying schedule: | | | | |
Unaffiliated issuers (cost $584,224,005) | $ | 796,439,984 | | |
Fidelity Central Funds (cost $55,245,692) | | 55,245,692 | | |
| | | | | |
| | | | | |
| Total Investment in Securities (cost $639,469,697) | | | $ | 851,685,676 |
| Receivable for fund shares sold | | | | 392,250 |
| Dividends receivable | | | | 918,328 |
| Distributions receivable from Fidelity Central Funds | | | | 72,094 |
| Prepaid expenses | | | | 1,821 |
| Other receivables | | | | 50,189 |
Total assets | | | | 853,120,358 |
| Liabilities | | | | |
| Payable for fund shares redeemed | $ | 636,515 | | |
| Accrued management fee | | 365,831 | | |
| Other affiliated payables | | 141,350 | | |
| Other payables and accrued expenses | | 84,492 | | |
| Collateral on securities loaned | | 38,919,225 | | |
| Total Liabilities | | | | 40,147,413 |
| Net Assets | | | $ | 812,972,945 |
| Net Assets consist of: | | | | |
| Paid in capital | | | $ | 676,147,635 |
| Total accumulated earnings (loss) | | | | 136,825,310 |
| Net Assets | | | $ | 812,972,945 |
Net Asset Value , offering price and redemption price per share ($812,972,945 ÷ 7,067,000 shares) | | | $ | 115.04 |
| Statement of Operations |
| | | | Year ended February 28, 2023 |
| Investment Income | | | | |
| Dividends | | | $ | 18,398,630 |
| Income from Fidelity Central Funds (including $129,568 from security lending) | | | | 259,847 |
| Total Income | | | | 18,658,477 |
| Expenses | | | | |
| Management fee | $ | 4,728,555 | | |
| Transfer agent fees | | 1,580,638 | | |
| Accounting fees | | 281,702 | | |
| Custodian fees and expenses | | 13,961 | | |
| Independent trustees' fees and expenses | | 3,140 | | |
| Registration fees | | 57,329 | | |
| Audit | | 40,842 | | |
| Legal | | 729 | | |
| Interest | | 18,216 | | |
| Miscellaneous | | 4,499 | | |
| Total expenses before reductions | | 6,729,611 | | |
| Expense reductions | | (32,083) | | |
| Total expenses after reductions | | | | 6,697,528 |
| Net Investment income (loss) | | | | 11,960,949 |
| Realized and Unrealized Gain (Loss) | | | | |
| Net realized gain (loss) on: | | | | |
| Investment Securities: | | | | |
| Unaffiliated issuers | | (74,755,629) | | |
| Foreign currency transactions | | 1,000 | | |
| Total net realized gain (loss) | | | | (74,754,629) |
| Change in net unrealized appreciation (depreciation) on: | | | | |
| Investment Securities: | | | | |
| Unaffiliated issuers | | (8,919,201) | | |
| Assets and liabilities in foreign currencies | | (1,534) | | |
| Total change in net unrealized appreciation (depreciation) | | | | (8,920,735) |
| Net gain (loss) | | | | (83,675,364) |
| Net increase (decrease) in net assets resulting from operations | | | $ | (71,714,415) |
| Statement of Changes in Net Assets |
| |
| | Year ended February 28, 2023 | | Year ended February 28, 2022 |
| Increase (Decrease) in Net Assets | | | | |
| Operations | | | | |
| Net investment income (loss) | $ | 11,960,949 | $ | 8,497,410 |
| Net realized gain (loss) | | (74,754,629) | | 5,615,492 |
| Change in net unrealized appreciation (depreciation) | | (8,920,735) | | 42,391,470 |
| Net increase (decrease) in net assets resulting from operations | | (71,714,415) | | 56,504,372 |
| Distributions to shareholders | | (17,226,958) | | (11,958,952) |
| Share transactions | | | | |
| Proceeds from sales of shares | | 189,388,454 | | 1,076,173,907 |
| Reinvestment of distributions | | 15,606,994 | | 11,131,114 |
| Cost of shares redeemed | | (512,802,938) | | (351,448,797) |
Net increase (decrease) in net assets resulting from share transactions | | (307,807,490) | | 735,856,224 |
| Total increase (decrease) in net assets | | (396,748,863) | | 780,401,644 |
| | | | | |
| Net Assets | | | | |
| Beginning of period | | 1,209,721,808 | | 429,320,164 |
| End of period | $ | 812,972,945 | $ | 1,209,721,808 |
| | | | | |
| Other Information | | | | |
| Shares | | | | |
| Sold | | 1,678,022 | | 8,446,490 |
| Issued in reinvestment of distributions | | 142,147 | | 92,249 |
| Redeemed | | (4,750,290) | | (2,792,832) |
| Net increase (decrease) | | (2,930,121) | | 5,745,907 |
| | | | | |
Financial Highlights
| Brokerage and Investment Management Portfolio |
| |
| Years ended February 28, | | 2023 | | 2022 | | 2021 | | 2020 A | | 2019 |
Selected Per-Share Data | | | | | | | | | | |
| Net asset value, beginning of period | $ | 121.01 | $ | 100.99 | $ | 74.99 | $ | 71.71 | $ | 84.47 |
| Income from Investment Operations | | | | | | | | | | |
Net investment income (loss) B,C | | 1.45 | | 1.31 | | .93 | | 1.01 | | .77 |
| Net realized and unrealized gain (loss) | | (5.19) | | 20.54 | | 28.01 | | 5.70 | | (7.60) |
| Total from investment operations | | (3.74) | | 21.85 | | 28.94 | | 6.71 | | (6.83) |
| Distributions from net investment income | | (1.83) | | (.83) | | (1.06) | | (.98) | | (.96) |
| Distributions from net realized gain | | (.41) | | (1.01) | | (1.88) | | (2.45) | | (4.96) |
| Total distributions | | (2.23) D | | (1.83) D | | (2.94) | | (3.43) | | (5.93) D |
| Net asset value, end of period | $ | 115.04 | $ | 121.01 | $ | 100.99 | $ | 74.99 | $ | 71.71 |
Total Return E | | (2.98)% | | 21.70% | | 39.69% | | 9.28% | | (8.04)% |
Ratios to Average Net Assets C,F,G | | | | | | | | | | |
| Expenses before reductions | | .75% | | .74% | | .76% | | .77% | | .78% |
| Expenses net of fee waivers, if any | | .74% | | .74% | | .76% | | .77% | | .77% |
| Expenses net of all reductions | | .74% | | .74% | | .76% | | .77% | | .77% |
| Net investment income (loss) | | 1.33% | | 1.06% | | 1.14% | | 1.33% | | 1.01% |
| Supplemental Data | | | | | | | | | | |
| Net assets, end of period (000 omitted) | $ | 812,973 | $ | 1,209,722 | $ | 429,320 | $ | 309,088 | $ | 327,128 |
Portfolio turnover rate H | | 4% | | 3% | | 11% | | 9% | | 30% |
A For the year ended February 29.
B Calculated based on average shares outstanding during the period.
C Net investment income (loss) is affected by the timing of the declaration of dividends by any underlying mutual funds or exchange-traded funds (ETFs). Net investment income (loss) of any mutual funds or ETFs is not included in the Fund's net investment income (loss) ratio.
D Total distributions per share do not sum due to rounding.
E Total returns would have been lower if certain expenses had not been reduced during the applicable periods shown.
F Fees and expenses of any underlying mutual funds or exchange-traded funds (ETFs) are not included in the Fund's expense ratio. The Fund indirectly bears its proportionate share of these expenses. For additional expense information related to investments in Fidelity Central Funds, please refer to the "Investments in Fidelity Central Funds" note found in the Notes to Financial Statements section of the most recent Annual or Semi-Annual report.
G Expense ratios reflect operating expenses of the class. Expenses before reductions do not reflect amounts reimbursed, waived, or reduced through arrangements with the investment adviser, brokerage services, or other offset arrangements, if applicable, and do not represent the amount paid by the class during periods when reimbursements, waivers or reductions occur.
H Amount does not include the portfolio activity of any underlying mutual funds or exchange-traded funds (ETFs).
Average annual total return reflects the change in the value of an investment, assuming reinvestment of distributions from dividend income and capital gains (the profits earned upon the sale of securities that have grown in value, if any) and assuming a constant rate of performance each year. The hypothetical investment and the average annual total returns do not reflect the deduction of taxes that a shareholder would pay on fund distributions or the redemption of fund shares. During periods of reimbursement by Fidelity, a fund's total return will be greater than it would be had the reimbursement not occurred. How a fund did yesterday is no guarantee of how it will do tomorrow.
| Average Annual Total Returns |
| | | | |
Periods ended February 28, 2023 | Past 1 year | Past 5 years | Past 10 years |
| Financial Services Portfolio | -3.30% | 7.92% | 11.14% |
| $10,000 Over 10 Years |
| |
Let's say hypothetically that $10,000 was invested in Financial Services Portfolio on February 28, 2013. The chart shows how the value of your investment would have changed, and also shows how the S&P 500® Index performed over the same period. |
|
|
Financial Services Portfolio
Market Recap:
U.S. equities returned -7.69% for the 12 months ending February 28, 2023, according to the S&P 500 ® index. The new year began with an encouraging upturn in January (+6.28%), but stocks lost momentum in February (-2.44%) amid higher-than-expected inflation and strong jobs data. Investors took these as signs that the economy continued to run hot, even after a year of historic policy adjustment by the Federal Reserve aimed at cooling economic growth. Record inflation in 2022 prompted the Fed to aggressively tighten monetary policy, and market interest rates eclipsed their highest level in a decade, stoking recession fears and sending stocks into bear market territory. Since March 2022, the central bank has hiked its benchmark rate eight times, by 4.5 percentage points - the fastest-ever pace of monetary tightening - while also shrinking its massive asset portfolio. The latest bump came on February 2, along with a signal that the Fed plans to lift rates in March while it considers whether and when to pause increases. Against this dynamic backdrop, stocks struggled to gain traction until a strong rally ignited heading into the summer. But in September, the index returned -9.21%, one of its worst monthly results ever, before advancing 7.56% in Q4, as risky assets regained favor. For the full 12 months, value stocks handily outpaced growth. The headwind for the latter was most pronounced in the growth-oriented communication services (-25%) and consumer discretionary (-18%) sectors. In sharp contrast, energy gained 24%.
Comments from Portfolio Manager Matthew Reed:
For the fiscal year ending February 28, 2023, the fund returned -3.30%, outperforming the -4.87% result of the MSCI US IMI Financials 5% Capped Linked Index, as well as the broad-based S&P 500 ® index. The primary contributor to performance versus the sector index was an overweighting among reinsurance firms. Stock picks and an underweighting in the financial exchanges & data industry, as well as security selection in the life & health insurance category, also helped. The biggest individual relative contributor was an overweight position in Reinsurance Group of America (+33%), one of the fund's largest holdings on February 28. Also boosting value was the portfolio's outsized stake in Arthur J. Gallaghar, which gained 20%. Another notable relative contributor was an overweighting in Primerica (+50%). In contrast, the largest detractor from performance versus the sector index was investment choices among property & casualty insurance providers. Security selection and an underweighting in the investment banking & brokerage group, in addition to an underweighting in the life & health insurance industry, further hampered relative performance. The biggest individual relative detractor was an overweight position in Signature Bank (-66%). Our second-largest relative detractor this period was the decision to avoid Progressive, an index component that gained 36%. An outsized stake in Virtu Financial (-45%) proved detrimental as well. Notable changes in positioning include decreased exposure to the consumer finance industry and a higher allocation to property & casualty insurance stocks.
Notes to shareholders:
On April 28, 2023, the fund's name will change to Fidelity Select Financials Portfolio, in alignment with an update to the Global Industry Classification Standard (GICS).
The views expressed above reflect those of the portfolio manager(s) only through the end of the period as stated on the cover of this report and do not necessarily represent the views of Fidelity or any other person in the Fidelity organization. Any such views are subject to change at any time based upon market or other conditions and Fidelity disclaims any responsibility to update such views. These views may not be relied on as investment advice and, because investment decisions for a Fidelity fund are based on numerous factors, may not be relied on as an indication of trading intent on behalf of any Fidelity fund.
Financial Services Portfolio
Top Holdings (% of Fund's net assets) |
| |
| Wells Fargo & Co. | 6.4 | |
| Bank of America Corp. | 5.2 | |
| JPMorgan Chase & Co. | 4.7 | |
| Morgan Stanley | 3.6 | |
| Chubb Ltd. | 3.3 | |
| Citigroup, Inc. | 3.2 | |
| State Street Corp. | 3.2 | |
| U.S. Bancorp | 2.9 | |
| Reinsurance Group of America, Inc. | 2.7 | |
| Marsh & McLennan Companies, Inc. | 2.6 | |
| | 37.8 | |
| |
| Industries (% of Fund's net assets) |
| |
| Banks | 39.2 | |
| Insurance | 26.1 | |
| Capital Markets | 18.9 | |
| Consumer Finance | 4.3 | |
| Thrifts & Mortgage Finance | 3.8 | |
| IT Services | 3.3 | |
| Diversified Financial Services | 2.9 | |
| Professional Services | 0.7 | |
| Software | 0.4 | |
| |
Geographic Diversification (% of Fund's net assets) |
|
* Includes Short-Term investments and Net Other Assets (Liabilities). Percentages are based on country or territory of incorporation and are adjusted for the effect of derivatives, if applicable. |
| |
Financial Services Portfolio
Showing Percentage of Net Assets
| Common Stocks - 99.0% |
| | | Shares | Value ($) |
| Banks - 39.2% | | | |
| Diversified Banks - 22.4% | | | |
| Bank of America Corp. | | 1,105,600 | 37,922,080 |
| Citigroup, Inc. | | 457,900 | 23,210,951 |
| JPMorgan Chase & Co. | | 241,300 | 34,590,355 |
| U.S. Bancorp | | 443,600 | 21,173,028 |
| Wells Fargo & Co. | | 1,009,090 | 47,195,141 |
| | | | 164,091,555 |
| Regional Banks - 16.8% | | | |
| Associated Banc-Corp. (a) | | 261,100 | 6,044,465 |
| BankUnited, Inc. | | 98,200 | 3,478,244 |
| Cadence Bank | | 202,530 | 5,379,197 |
| Comerica, Inc. | | 68,700 | 4,815,870 |
| East West Bancorp, Inc. | | 105,500 | 8,040,155 |
| First Citizens Bancshares, Inc. (a) | | 12,600 | 9,245,376 |
| First Interstate Bancsystem, Inc. | | 162,221 | 5,765,334 |
| Heartland Financial U.S.A., Inc. | | 105,700 | 5,225,808 |
| KeyCorp | | 570,200 | 10,428,958 |
| M&T Bank Corp. | | 100,937 | 15,674,507 |
| PacWest Bancorp | | 136,300 | 3,782,325 |
| Popular, Inc. | | 125,100 | 8,932,140 |
| Signature Bank | | 64,400 | 7,409,220 |
| Truist Financial Corp. | | 278,700 | 13,084,965 |
| UMB Financial Corp. (a) | | 49,800 | 4,514,868 |
| Wintrust Financial Corp. | | 62,900 | 5,794,977 |
| Zions Bancorp NA | | 100,600 | 5,092,372 |
| | | | 122,708,781 |
TOTAL BANKS | | | 286,800,336 |
| Capital Markets - 18.9% | | | |
| Asset Management & Custody Banks - 9.1% | | | |
| Affiliated Managers Group, Inc. | | 32,800 | 5,228,648 |
| Bank of New York Mellon Corp. | | 222,200 | 11,305,536 |
| Brookfield Asset Management Ltd. Class A (a) | | 31,628 | 1,063,333 |
| Brookfield Corp. Class A | | 131,515 | 4,372,874 |
| Carlyle Group LP | | 313,400 | 10,780,960 |
| Northern Trust Corp. | | 50,100 | 4,773,027 |
| Patria Investments Ltd. | | 391,600 | 6,210,776 |
| State Street Corp. | | 261,600 | 23,198,688 |
| | | | 66,933,842 |
| Financial Exchanges & Data - 3.5% | | | |
| Bolsa Mexicana de Valores S.A.B. de CV | | 2,208,400 | 4,294,530 |
| Cboe Global Markets, Inc. | | 29,300 | 3,696,781 |
| CME Group, Inc. | | 94,600 | 17,535,056 |
| | | | 25,526,367 |
| Investment Banking & Brokerage - 6.3% | | | |
| Lazard Ltd. Class A | | 147,292 | 5,502,829 |
| Morgan Stanley | | 271,300 | 26,180,450 |
| Raymond James Financial, Inc. | | 91,100 | 9,880,706 |
| Virtu Financial, Inc. Class A | | 229,300 | 4,214,534 |
| | | | 45,778,519 |
TOTAL CAPITAL MARKETS | | | 138,238,728 |
| Consumer Finance - 4.3% | | | |
| Consumer Finance - 4.3% | | | |
| Capital One Financial Corp. | | 158,200 | 17,256,456 |
| FirstCash Holdings, Inc. | | 86,311 | 7,616,946 |
| OneMain Holdings, Inc. (a) | | 157,300 | 6,778,057 |
| | | | 31,651,459 |
| Diversified Financial Services - 2.9% | | | |
| Multi-Sector Holdings - 0.8% | | | |
| Cannae Holdings, Inc. (b) | | 253,890 | 5,732,836 |
| Other Diversified Financial Services - 2.1% | | | |
| Apollo Global Management, Inc. | | 219,500 | 15,562,550 |
TOTAL DIVERSIFIED FINANCIAL SERVICES | | | 21,295,386 |
| Insurance - 26.1% | | | |
| Insurance Brokers - 4.4% | | | |
| Arthur J. Gallagher & Co. | | 72,300 | 13,545,405 |
| Marsh & McLennan Companies, Inc. | | 115,500 | 18,727,170 |
| | | | 32,272,575 |
| Life & Health Insurance - 3.1% | | | |
| Globe Life, Inc. | | 114,700 | 13,957,843 |
| Primerica, Inc. | | 44,500 | 8,541,330 |
| | | | 22,499,173 |
| Multi-Line Insurance - 1.9% | | | |
| Hartford Financial Services Group, Inc. | | 179,200 | 14,027,776 |
| Property & Casualty Insurance - 14.0% | | | |
| American Financial Group, Inc. | | 59,700 | 8,006,367 |
| Beazley PLC | | 908,100 | 7,460,464 |
| Chubb Ltd. | | 112,900 | 23,824,158 |
| Direct Line Insurance Group PLC | | 3,895,600 | 8,450,881 |
| Fidelity National Financial, Inc. | | 216,600 | 8,633,676 |
| First American Financial Corp. | | 192,100 | 10,907,438 |
| Hiscox Ltd. | | 573,700 | 7,866,855 |
| Lancashire Holdings Ltd. | | 882,400 | 6,506,350 |
| Selective Insurance Group, Inc. | | 55,100 | 5,594,303 |
| The Travelers Companies, Inc. | | 80,300 | 14,865,136 |
| | | | 102,115,628 |
| Reinsurance - 2.7% | | | |
| Reinsurance Group of America, Inc. | | 138,500 | 20,009,095 |
TOTAL INSURANCE | | | 190,924,247 |
| IT Services - 2.7% | | | |
| Data Processing & Outsourced Services - 2.7% | | | |
| Global Payments, Inc. | | 78,300 | 8,785,260 |
| MasterCard, Inc. Class A | | 29,600 | 10,516,584 |
| | | | 19,301,844 |
| Professional Services - 0.7% | | | |
| Research & Consulting Services - 0.7% | | | |
| Dun & Bradstreet Holdings, Inc. | | 431,300 | 5,179,913 |
| Software - 0.4% | | | |
| Application Software - 0.4% | | | |
| Black Knight, Inc. (b) | | 49,600 | 2,956,160 |
| Thrifts & Mortgage Finance - 3.8% | | | |
| Thrifts & Mortgage Finance - 3.8% | | | |
| Essent Group Ltd. | | 315,138 | 13,535,177 |
| NMI Holdings, Inc. (b) | | 422,743 | 9,866,822 |
| Walker & Dunlop, Inc. | | 46,800 | 4,082,364 |
| | | | 27,484,363 |
| TOTAL COMMON STOCKS (Cost $605,283,373) | | | 723,832,436 |
| | | | |
| Convertible Bonds - 0.6% |
| | | Principal Amount (c) | Value ($) |
| IT Services - 0.6% | | | |
| Data Processing & Outsourced Services - 0.6% | | | |
Affirm Holdings, Inc. 0% 11/15/26 (Cost $3,952,686) | | 6,166,000 | 4,112,105 |
| | | | |
| Money Market Funds - 1.4% |
| | | Shares | Value ($) |
| Fidelity Cash Central Fund 4.63% (d) | | 2,743,120 | 2,743,668 |
| Fidelity Securities Lending Cash Central Fund 4.63% (d)(e) | | 7,671,008 | 7,671,775 |
| TOTAL MONEY MARKET FUNDS (Cost $10,415,443) | | | 10,415,443 |
| | | | |
| TOTAL INVESTMENT IN SECURITIES - 101.0% (Cost $619,651,502) | 738,359,984 |
NET OTHER ASSETS (LIABILITIES) - (1.0)% | (7,200,545) |
| NET ASSETS - 100.0% | 731,159,439 |
| | |
Legend
| (a) | Security or a portion of the security is on loan at period end. |
| (c) | Amount is stated in United States dollars unless otherwise noted. |
| (d) | Affiliated fund that is generally available only to investment companies and other accounts managed by Fidelity Investments. The rate quoted is the annualized seven-day yield of the fund at period end. A complete unaudited listing of the fund's holdings as of its most recent quarter end is available upon request. In addition, each Fidelity Central Fund's financial statements, which are not covered by the Fund's Report of Independent Registered Public Accounting Firm, are available on the SEC's website or upon request. |
| (e) | Investment made with cash collateral received from securities on loan. |
Affiliated Central Funds
Fiscal year to date information regarding the Fund's investments in Fidelity Central Funds, including the ownership percentage, is presented below.
| Affiliate | Value, beginning of period ($) | Purchases ($) | Sales Proceeds ($) | Dividend Income ($) | Realized Gain (loss) ($) | Change in Unrealized appreciation (depreciation) ($) | Value, end of period ($) | % ownership, end of period |
| Fidelity Cash Central Fund 4.63% | 3,554,184 | 182,834,592 | 183,645,108 | 73,718 | - | - | 2,743,668 | 0.0% |
| Fidelity Securities Lending Cash Central Fund 4.63% | 19,553,600 | 222,511,087 | 234,392,912 | 17,171 | - | - | 7,671,775 | 0.0% |
| Total | 23,107,784 | 405,345,679 | 418,038,020 | 90,889 | - | - | 10,415,443 | |
| | | | | | | | | |
Amounts in the dividend income column in the above table include any capital gain distributions from underlying funds, which are presented in the corresponding line item in the Statement of Operations, if applicable.
Amount for Fidelity Securities Lending Cash Central Fund represents the income earned on investing cash collateral, less rebates paid to borrowers and any lending agent fees associated with the loan, plus any premium payments received for lending certain types of securities.
Amounts included in the purchases and sales proceeds columns may include in-kind transactions, if applicable.
Investment Valuation
The following is a summary of the inputs used, as of February 28, 2023, involving the Fund's assets and liabilities carried at fair value. The inputs or methodology used for valuing securities may not be an indication of the risk associated with investing in those securities. For more information on valuation inputs, and their aggregation into the levels used below, please refer to the Investment Valuation section in the accompanying Notes to Financial Statements.
| Valuation Inputs at Reporting Date: |
| Description | Total ($) | Level 1 ($) | Level 2 ($) | Level 3 ($) |
Investments in Securities: | | | | |
|
| Common Stocks | 723,832,436 | 723,832,436 | - | - |
|
| Convertible Bonds | 4,112,105 | - | 4,112,105 | - |
|
| Money Market Funds | 10,415,443 | 10,415,443 | - | - |
| Total Investments in Securities: | 738,359,984 | 734,247,879 | 4,112,105 | - |
Financial Services Portfolio
| Statement of Assets and Liabilities |
| | | | February 28, 2023 |
| | | | | |
| Assets | | | | |
| Investment in securities, at value (including securities loaned of $7,430,650) - See accompanying schedule: | | | | |
Unaffiliated issuers (cost $609,236,059) | $ | 727,944,541 | | |
Fidelity Central Funds (cost $10,415,443) | | 10,415,443 | | |
| | | | | |
| | | | | |
| Total Investment in Securities (cost $619,651,502) | | | $ | 738,359,984 |
| Cash | | | | 13,608 |
| Receivable for fund shares sold | | | | 660,519 |
| Dividends receivable | | | | 983,178 |
| Distributions receivable from Fidelity Central Funds | | | | 12,254 |
| Prepaid expenses | | | | 3,713 |
| Other receivables | | | | 1,374 |
Total assets | | | | 740,034,630 |
| Liabilities | | | | |
| Payable for fund shares redeemed | $ | 721,512 | | |
| Accrued management fee | | 326,857 | | |
| Other affiliated payables | | 119,444 | | |
| Other payables and accrued expenses | | 35,603 | | |
| Collateral on securities loaned | | 7,671,775 | | |
| Total Liabilities | | | | 8,875,191 |
| Net Assets | | | $ | 731,159,439 |
| Net Assets consist of: | | | | |
| Paid in capital | | | $ | 606,732,787 |
| Total accumulated earnings (loss) | | | | 124,426,652 |
| Net Assets | | | $ | 731,159,439 |
Net Asset Value , offering price and redemption price per share ($731,159,439 ÷ 63,512,865 shares) | | | $ | 11.51 |
| Statement of Operations |
| | | | Year ended February 28, 2023 |
| Investment Income | | | | |
| Dividends | | | $ | 18,804,473 |
| Interest | | | | 296,712 |
| Income from Fidelity Central Funds (including $17,171 from security lending) | | | | 90,889 |
| Total Income | | | | 19,192,074 |
| Expenses | | | | |
| Management fee | $ | 3,524,239 | | |
| Transfer agent fees | | 1,141,925 | | |
| Accounting fees | | 223,748 | | |
| Custodian fees and expenses | | 16,347 | | |
| Independent trustees' fees and expenses | | 2,292 | | |
| Registration fees | | 59,205 | | |
| Audit | | 41,388 | | |
| Legal | | 558 | | |
| Interest | | 2,103 | | |
| Miscellaneous | | 4,936 | | |
| Total expenses before reductions | | 5,016,741 | | |
| Expense reductions | | (23,514) | | |
| Total expenses after reductions | | | | 4,993,227 |
| Net Investment income (loss) | | | | 14,198,847 |
| Realized and Unrealized Gain (Loss) | | | | |
| Net realized gain (loss) on: | | | | |
| Investment Securities: | | | | |
| Unaffiliated issuers | | 36,726,142 | | |
| Foreign currency transactions | | 2,635 | | |
| Total net realized gain (loss) | | | | 36,728,777 |
| Change in net unrealized appreciation (depreciation) on: | | | | |
| Investment Securities: | | | | |
| Unaffiliated issuers | | (79,393,122) | | |
| Assets and liabilities in foreign currencies | | (130) | | |
| Total change in net unrealized appreciation (depreciation) | | | | (79,393,252) |
| Net gain (loss) | | | | (42,664,475) |
| Net increase (decrease) in net assets resulting from operations | | | $ | (28,465,628) |
| Statement of Changes in Net Assets |
| |
| | Year ended February 28, 2023 | | Year ended February 28, 2022 |
| Increase (Decrease) in Net Assets | | | | |
| Operations | | | | |
| Net investment income (loss) | $ | 14,198,847 | $ | 15,691,678 |
| Net realized gain (loss) | | 36,728,777 | | 64,214,173 |
| Change in net unrealized appreciation (depreciation) | | (79,393,252) | | 59,571,315 |
| Net increase (decrease) in net assets resulting from operations | | (28,465,628) | | 139,477,166 |
| Distributions to shareholders | | (73,318,860) | | (29,541,664) |
| Share transactions | | | | |
| Proceeds from sales of shares | | 247,678,669 | | 634,993,625 |
| Reinvestment of distributions | | 67,840,973 | | 27,204,727 |
| Cost of shares redeemed | | (302,485,447) | | (558,271,824) |
Net increase (decrease) in net assets resulting from share transactions | | 13,034,195 | | 103,926,528 |
| Total increase (decrease) in net assets | | (88,750,293) | | 213,862,030 |
| | | | | |
| Net Assets | | | | |
| Beginning of period | | 819,909,732 | | 606,047,702 |
| End of period | $ | 731,159,439 | $ | 819,909,732 |
| | | | | |
| Other Information | | | | |
| Shares | | | | |
| Sold | | 21,744,109 | | 48,475,233 |
| Issued in reinvestment of distributions | | 6,070,885 | | 2,146,844 |
| Redeemed | | (26,254,915) | | (42,497,145) |
| Net increase (decrease) | | 1,560,079 | | 8,124,932 |
| | | | | |
Financial Highlights
| Financial Services Portfolio |
| |
| Years ended February 28, | | 2023 | | 2022 | | 2021 | | 2020 A | | 2019 B |
Selected Per-Share Data | | | | | | | | | | |
| Net asset value, beginning of period | $ | 13.23 | $ | 11.26 | $ | 9.49 | $ | 9.65 | $ | 11.67 |
| Income from Investment Operations | | | | | | | | | | |
Net investment income (loss) C,D | | .24 | | .25 | | .20 | | .19 | | .14 |
| Net realized and unrealized gain (loss) | | (.74) | | 2.26 | | 2.17 | | .26 | | (1.04) |
| Total from investment operations | | (.50) | | 2.51 | | 2.37 | | .45 | | (.90) |
| Distributions from net investment income | | (.23) | | (.26) | | (.21) | | (.16) | | (.14) |
| Distributions from net realized gain | | (.98) | | (.28) | | (.39) | | (.45) | | (.98) |
| Total distributions | | (1.22) E | | (.54) | | (.60) | | (.61) | | (1.12) |
| Net asset value, end of period | $ | 11.51 | $ | 13.23 | $ | 11.26 | $ | 9.49 | $ | 9.65 |
Total Return F | | (3.30)% | | 22.47% | | 27.89% | | 3.81% | | (6.91)% |
Ratios to Average Net Assets D,G,H | | | | | | | | | | |
| Expenses before reductions | | .75% | | .73% | | .77% | | .77% | | .76% |
| Expenses net of fee waivers, if any | | .75% | | .72% | | .77% | | .77% | | .76% |
| Expenses net of all reductions | | .75% | | .72% | | .77% | | .76% | | .75% |
| Net investment income (loss) | | 2.12% | | 1.89% | | 2.36% | | 1.81% | | 1.28% |
| Supplemental Data | | | | | | | | | | |
| Net assets, end of period (000 omitted) | $ | 731,159 | $ | 819,910 | $ | 606,048 | $ | 483,337 | $ | 558,429 |
Portfolio turnover rate I | | 46% | | 53% | | 63% | | 61% J | | 49% J |
A For the year ended February 29.
B Per share amounts have been adjusted to reflect the impact of the 10 for 1 share split that occurred on August 10, 2018.
C Calculated based on average shares outstanding during the period.
D Net investment income (loss) is affected by the timing of the declaration of dividends by any underlying mutual funds or exchange-traded funds (ETFs). Net investment income (loss) of any mutual funds or ETFs is not included in the Fund's net investment income (loss) ratio.
E Total distributions per share do not sum due to rounding.
F Total returns would have been lower if certain expenses had not been reduced during the applicable periods shown.
G Fees and expenses of any underlying mutual funds or exchange-traded funds (ETFs) are not included in the Fund's expense ratio. The Fund indirectly bears its proportionate share of these expenses. For additional expense information related to investments in Fidelity Central Funds, please refer to the "Investments in Fidelity Central Funds" note found in the Notes to Financial Statements section of the most recent Annual or Semi-Annual report.
H Expense ratios reflect operating expenses of the class. Expenses before reductions do not reflect amounts reimbursed, waived, or reduced through arrangements with the investment adviser, brokerage services, or other offset arrangements, if applicable, and do not represent the amount paid by the class during periods when reimbursements, waivers or reductions occur.
I Amount does not include the portfolio activity of any underlying mutual funds or exchange-traded funds (ETFs).
J Portfolio turnover rate excludes securities received or delivered in-kind.
Average annual total return reflects the change in the value of an investment, assuming reinvestment of distributions from dividend income and capital gains (the profits earned upon the sale of securities that have grown in value, if any) and assuming a constant rate of performance each year. The hypothetical investment and the average annual total returns do not reflect the deduction of taxes that a shareholder would pay on fund distributions or the redemption of fund shares. During periods of reimbursement by Fidelity, a fund's total return will be greater than it would be had the reimbursement not occurred. How a fund did yesterday is no guarantee of how it will do tomorrow.
| Average Annual Total Returns |
| | | | |
Periods ended February 28, 2023 | Past 1 year | Past 5 years | Past 10 years |
| FinTech Portfolio | -14.51% | 2.54% | 7.49% |
| $10,000 Over 10 Years |
| |
Let's say hypothetically that $10,000 was invested in FinTech Portfolio on February 28, 2013. The chart shows how the value of your investment would have changed, and also shows how the S&P 500® Index performed over the same period. |
|
|
FinTech Portfolio
Market Recap:
U.S. equities returned -7.69% for the 12 months ending February 28, 2023, according to the S&P 500 ® index. The new year began with an encouraging upturn in January (+6.28%), but stocks lost momentum in February (-2.44%) amid higher-than-expected inflation and strong jobs data. Investors took these as signs that the economy continued to run hot, even after a year of historic policy adjustment by the Federal Reserve aimed at cooling economic growth. Record inflation in 2022 prompted the Fed to aggressively tighten monetary policy, and market interest rates eclipsed their highest level in a decade, stoking recession fears and sending stocks into bear market territory. Since March 2022, the central bank has hiked its benchmark rate eight times, by 4.5 percentage points - the fastest-ever pace of monetary tightening - while also shrinking its massive asset portfolio. The latest bump came on February 2, along with a signal that the Fed plans to lift rates in March while it considers whether and when to pause increases. Against this dynamic backdrop, stocks struggled to gain traction until a strong rally ignited heading into the summer. But in September, the index returned -9.21%, one of its worst monthly results ever, before advancing 7.56% in Q4, as risky assets regained favor. For the full 12 months, value stocks handily outpaced growth. The headwind for the latter was most pronounced in the growth-oriented communication services (-25%) and consumer discretionary (-18%) sectors. In sharp contrast, energy gained 24%.
Comments from Portfolio Manager Ruth Nagle:
For the fiscal year ending February 28, 2023, the fund returned -14.51%, outperforming the -15.60% return of the FactSet Financial Technologies Linked Index, but underperforming the broad-based S&P 500 ® index. Versus the industry index, security selection was the primary contributor, led by the data processing & outsourced services group. Security selection in consumer finance also boosted the fund's relative result. The biggest individual relative contributor was an overweight position in MasterCard (-1%). MasterCard was the fund's biggest holding, on average, during the period. Also adding value was our lighter-than-index investment in Upstart Holdings, which returned about -88%. Upstart Holdings was not held at period end. Another notable relative contributor was an underweighting in Fidelity National Information Services (-32%). This period we decreased our stake. Conversely, the largest detractor from performance versus the industry index was an overweight in application software. Stock selection in regional banks and an underweight in asset management & custody banks also modestly hurt relative performance. The biggest individual relative detractor was an underweight position in Fiserv (+18%), which was among the fund's largest holdings. Our second-largest relative detractor this period was avoiding Wex, an index component that gained roughly 14%. Our out-of-index position in Nuvei (-45%) was a key detractor. We reduced our position the past year.
The views expressed above reflect those of the portfolio manager(s) only through the end of the period as stated on the cover of this report and do not necessarily represent the views of Fidelity or any other person in the Fidelity organization. Any such views are subject to change at any time based upon market or other conditions and Fidelity disclaims any responsibility to update such views. These views may not be relied on as investment advice and, because investment decisions for a Fidelity fund are based on numerous factors, may not be relied on as an indication of trading intent on behalf of any Fidelity fund.
FinTech Portfolio
Top Holdings (% of Fund's net assets) |
| |
| Visa, Inc. Class A | 14.4 | |
| MasterCard, Inc. Class A | 14.2 | |
| Intuit, Inc. | 10.8 | |
| American Express Co. | 8.0 | |
| Fiserv, Inc. | 5.0 | |
| Block, Inc. Class A | 4.9 | |
| Discover Financial Services | 4.8 | |
| Capital One Financial Corp. | 4.7 | |
| Global Payments, Inc. | 4.3 | |
| Adyen BV | 4.2 | |
| | 75.3 | |
| |
| Industries (% of Fund's net assets) |
| |
| IT Services | 63.9 | |
| Consumer Finance | 18.6 | |
| Software | 16.5 | |
| Banks | 0.5 | |
| |
FinTech Portfolio
Showing Percentage of Net Assets
| Common Stocks - 99.5% |
| | | Shares | Value ($) |
| Banks - 0.5% | | | |
| Diversified Banks - 0.5% | | | |
| Wells Fargo & Co. | | 12,037 | 562,970 |
| Consumer Finance - 18.6% | | | |
| Consumer Finance - 18.6% | | | |
| American Express Co. | | 49,303 | 8,578,229 |
| Capital One Financial Corp. | | 46,171 | 5,036,333 |
| Discover Financial Services | | 46,698 | 5,230,176 |
| OneMain Holdings, Inc. | | 26,874 | 1,158,001 |
| | | | 20,002,739 |
| IT Services - 63.9% | | | |
| Data Processing & Outsourced Services - 63.9% | | | |
| Adyen BV (a)(b) | | 3,219 | 4,562,708 |
| Affirm Holdings, Inc. (a)(c) | | 12,234 | 166,627 |
| AvidXchange Holdings, Inc. (a) | | 10,800 | 107,460 |
| Block, Inc. Class A (a) | | 69,008 | 5,294,984 |
| Dlocal Ltd. (a) | | 31,523 | 470,954 |
| Edenred SA | | 43,585 | 2,458,044 |
| Fidelity National Information Services, Inc. | | 26,430 | 1,674,869 |
| Fiserv, Inc. (a) | | 46,422 | 5,342,708 |
| FleetCor Technologies, Inc. (a) | | 15,140 | 3,251,921 |
| Flywire Corp. (a) | | 58,576 | 1,448,584 |
| Global Payments, Inc. | | 40,744 | 4,571,477 |
| MasterCard, Inc. Class A | | 43,086 | 15,308,025 |
| Nuvei Corp. (Canada) (a)(b) | | 10,046 | 307,601 |
| PagSeguro Digital Ltd. (a) | | 59,646 | 517,131 |
| PayPal Holdings, Inc. (a) | | 60,050 | 4,419,680 |
| Repay Holdings Corp. (a) | | 45,774 | 388,164 |
| Shift4 Payments, Inc. (a)(c) | | 16,547 | 1,067,282 |
| Visa, Inc. Class A | | 70,660 | 15,540,958 |
| Worldline SA (a)(b) | | 44,111 | 1,837,333 |
| | | | 68,736,510 |
| Software - 16.5% | | | |
| Application Software - 16.5% | | | |
| Bill Holdings, Inc. (a) | | 14,899 | 1,260,902 |
| Black Knight, Inc. (a) | | 43,031 | 2,564,648 |
| EngageSmart, Inc. (a) | | 42,588 | 896,052 |
| Guidewire Software, Inc. (a) | | 5,385 | 378,081 |
| Intuit, Inc. | | 28,565 | 11,631,097 |
| Lightspeed Commerce, Inc. (Canada) (a) | | 10,056 | 153,733 |
| Workiva, Inc. (a) | | 10,182 | 908,234 |
| | | | 17,792,747 |
| TOTAL COMMON STOCKS (Cost $120,895,764) | | | 107,094,966 |
| | | | |
| Money Market Funds - 0.7% |
| | | Shares | Value ($) |
| Fidelity Cash Central Fund 4.63% (d) | | 355,472 | 355,543 |
| Fidelity Securities Lending Cash Central Fund 4.63% (d)(e) | | 376,955 | 376,993 |
| TOTAL MONEY MARKET FUNDS (Cost $732,536) | | | 732,536 |
| | | | |
| TOTAL INVESTMENT IN SECURITIES - 100.2% (Cost $121,628,300) | 107,827,502 |
NET OTHER ASSETS (LIABILITIES) - (0.2)% | (249,170) |
| NET ASSETS - 100.0% | 107,578,332 |
| | |
Legend
| (b) | Security exempt from registration under Rule 144A of the Securities Act of 1933. These securities may be resold in transactions exempt from registration, normally to qualified institutional buyers. At the end of the period, the value of these securities amounted to $6,707,642 or 6.2% of net assets. |
| (c) | Security or a portion of the security is on loan at period end. |
| (d) | Affiliated fund that is generally available only to investment companies and other accounts managed by Fidelity Investments. The rate quoted is the annualized seven-day yield of the fund at period end. A complete unaudited listing of the fund's holdings as of its most recent quarter end is available upon request. In addition, each Fidelity Central Fund's financial statements, which are not covered by the Fund's Report of Independent Registered Public Accounting Firm, are available on the SEC's website or upon request. |
| (e) | Investment made with cash collateral received from securities on loan. |
Affiliated Central Funds
Fiscal year to date information regarding the Fund's investments in Fidelity Central Funds, including the ownership percentage, is presented below.
| Affiliate | Value, beginning of period ($) | Purchases ($) | Sales Proceeds ($) | Dividend Income ($) | Realized Gain (loss) ($) | Change in Unrealized appreciation (depreciation) ($) | Value, end of period ($) | % ownership, end of period |
| Fidelity Cash Central Fund 4.63% | 870,270 | 20,075,742 | 20,590,469 | 9,259 | - | - | 355,543 | 0.0% |
| Fidelity Securities Lending Cash Central Fund 4.63% | 8,602,318 | 28,499,830 | 36,725,155 | 5,831 | - | - | 376,993 | 0.0% |
| Total | 9,472,588 | 48,575,572 | 57,315,624 | 15,090 | - | - | 732,536 | |
| | | | | | | | | |
Amounts in the dividend income column in the above table include any capital gain distributions from underlying funds, which are presented in the corresponding line item in the Statement of Operations, if applicable.
Amount for Fidelity Securities Lending Cash Central Fund represents the income earned on investing cash collateral, less rebates paid to borrowers and any lending agent fees associated with the loan, plus any premium payments received for lending certain types of securities.
Amounts included in the purchases and sales proceeds columns may include in-kind transactions, if applicable.
Investment Valuation
The following is a summary of the inputs used, as of February 28, 2023, involving the Fund's assets and liabilities carried at fair value. The inputs or methodology used for valuing securities may not be an indication of the risk associated with investing in those securities. For more information on valuation inputs, and their aggregation into the levels used below, please refer to the Investment Valuation section in the accompanying Notes to Financial Statements.
| Valuation Inputs at Reporting Date: |
| Description | Total ($) | Level 1 ($) | Level 2 ($) | Level 3 ($) |
Investments in Securities: | | | | |
|
| Common Stocks | 107,094,966 | 100,694,925 | 6,400,041 | - |
|
| Money Market Funds | 732,536 | 732,536 | - | - |
| Total Investments in Securities: | 107,827,502 | 101,427,461 | 6,400,041 | - |
FinTech Portfolio
| Statement of Assets and Liabilities |
| | | | February 28, 2023 |
| | | | | |
| Assets | | | | |
| Investment in securities, at value (including securities loaned of $405,018) - See accompanying schedule: | | | | |
Unaffiliated issuers (cost $120,895,764) | $ | 107,094,966 | | |
Fidelity Central Funds (cost $732,536) | | 732,536 | | |
| | | | | |
| | | | | |
| Total Investment in Securities (cost $121,628,300) | | | $ | 107,827,502 |
| Receivable for investments sold | | | | 619,770 |
| Receivable for fund shares sold | | | | 16,352 |
| Dividends receivable | | | | 64,217 |
| Distributions receivable from Fidelity Central Funds | | | | 708 |
| Prepaid expenses | | | | 355 |
Total assets | | | | 108,528,904 |
| Liabilities | | | | |
| Payable for investments purchased | $ | 427,483 | | |
| Payable for fund shares redeemed | | 37,437 | | |
| Accrued management fee | | 49,080 | | |
| Other affiliated payables | | 26,734 | | |
| Other payables and accrued expenses | | 33,688 | | |
| Collateral on securities loaned | | 376,150 | | |
| Total Liabilities | | | | 950,572 |
| Net Assets | | | $ | 107,578,332 |
| Net Assets consist of: | | | | |
| Paid in capital | | | $ | 143,812,487 |
| Total accumulated earnings (loss) | | | | (36,234,155) |
| Net Assets | | | $ | 107,578,332 |
Net Asset Value , offering price and redemption price per share ($107,578,332 ÷ 7,836,303 shares) | | | $ | 13.73 |
| Statement of Operations |
| | | | Year ended February 28, 2023 |
| Investment Income | | | | |
| Dividends | | | $ | 1,016,352 |
| Income from Fidelity Central Funds (including $5,831 from security lending) | | | | 15,090 |
| Total Income | | | | 1,031,442 |
| Expenses | | | | |
| Management fee | $ | 647,241 | | |
| Transfer agent fees | | 311,131 | | |
| Accounting fees | | 44,771 | | |
| Custodian fees and expenses | | 3,757 | | |
| Independent trustees' fees and expenses | | 430 | | |
| Registration fees | | 30,932 | | |
| Audit | | 40,048 | | |
| Legal | | 952 | | |
| Miscellaneous | | (1,299) | | |
| Total expenses before reductions | | 1,077,963 | | |
| Expense reductions | | (4,444) | | |
| Total expenses after reductions | | | | 1,073,519 |
| Net Investment income (loss) | | | | (42,077) |
| Realized and Unrealized Gain (Loss) | | | | |
| Net realized gain (loss) on: | | | | |
| Investment Securities: | | | | |
| Unaffiliated issuers | | (16,199,835) | | |
| Foreign currency transactions | | 6,292 | | |
| Total net realized gain (loss) | | | | (16,193,543) |
| Change in net unrealized appreciation (depreciation) on: | | | | |
| Investment Securities: | | | | |
| Unaffiliated issuers | | (7,892,700) | | |
| Assets and liabilities in foreign currencies | | (380) | | |
| Total change in net unrealized appreciation (depreciation) | | | | (7,893,080) |
| Net gain (loss) | | | | (24,086,623) |
| Net increase (decrease) in net assets resulting from operations | | | $ | (24,128,700) |
| Statement of Changes in Net Assets |
| |
| | Year ended February 28, 2023 | | Year ended February 28, 2022 |
| Increase (Decrease) in Net Assets | | | | |
| Operations | | | | |
| Net investment income (loss) | $ | (42,077) | $ | 1,580,188 |
| Net realized gain (loss) | | (16,193,543) | | 42,675,935 |
| Change in net unrealized appreciation (depreciation) | | (7,893,080) | | (51,830,285) |
| Net increase (decrease) in net assets resulting from operations | | (24,128,700) | | (7,574,162) |
| Distributions to shareholders | | - | | (37,026,602) |
| Share transactions | | | | |
| Proceeds from sales of shares | | 14,085,599 | | 281,706,628 |
| Reinvestment of distributions | | - | | 33,727,405 |
| Cost of shares redeemed | | (44,229,846) | | (253,862,105) |
Net increase (decrease) in net assets resulting from share transactions | | (30,144,247) | | 61,571,928 |
| Total increase (decrease) in net assets | | (54,272,947) | | 16,971,164 |
| | | | | |
| Net Assets | | | | |
| Beginning of period | | 161,851,279 | | 144,880,115 |
| End of period | $ | 107,578,332 | $ | 161,851,279 |
| | | | | |
| Other Information | | | | |
| Shares | | | | |
| Sold | | 980,123 | | 12,489,588 |
| Issued in reinvestment of distributions | | - | | 1,901,219 |
| Redeemed | | (3,218,612) | | (11,797,499) |
| Net increase (decrease) | | (2,238,489) | | 2,593,308 |
| | | | | |
Financial Highlights
| Years ended February 28, | | 2023 | | 2022 | | 2021 | | 2020 A | | 2019 |
Selected Per-Share Data | | | | | | | | | | |
| Net asset value, beginning of period | $ | 16.06 | $ | 19.37 | $ | 16.23 | $ | 15.80 | $ | 16.29 |
| Income from Investment Operations | | | | | | | | | | |
Net investment income (loss) B,C | | - D | | .14 E | | .34 F | | .39 | | .24 |
| Net realized and unrealized gain (loss) | | (2.33) | | .04 G,H | | 3.14 | | .35 | | .43 |
| Total from investment operations | | (2.33) | | .18 | | 3.48 | | .74 | | .67 |
| Distributions from net investment income | | - | | (.25) | | (.34) | | (.31) | | (.20) |
| Distributions from net realized gain | | - | | (3.24) | | - | | (.01) | | (.95) |
| Total distributions | | - | | (3.49) | | (.34) | | (.31) I | | (1.16) I |
| Net asset value, end of period | $ | 13.73 | $ | 16.06 | $ | 19.37 | $ | 16.23 | $ | 15.80 |
Total Return J | | (14.51)% | | (.75)% G | | 21.94% | | 4.54% | | 4.83% |
Ratios to Average Net Assets C,K,L | | | | | | | | | | |
| Expenses before reductions | | .87% | | .81% | | .89% | | .86% | | .87% |
| Expenses net of fee waivers, if any | | .87% | | .81% | | .89% | | .86% | | .87% |
| Expenses net of all reductions | | .87% | | .81% | | .89% | | .85% | | .86% |
| Net investment income (loss) | | (.03)% | | .63% E | | 2.35% F | | 2.29% | | 1.57% |
| Supplemental Data | | | | | | | | | | |
| Net assets, end of period (000 omitted) | $ | 107,578 | $ | 161,851 | $ | 144,880 | $ | 148,247 | $ | 102,334 |
Portfolio turnover rate M | | 15% | | 164% | | 25% | | 20% | | 32% |
A For the year ended February 29.
B Calculated based on average shares outstanding during the period.
C Net investment income (loss) is affected by the timing of the declaration of dividends by any underlying mutual funds or exchange-traded funds (ETFs). Net investment income (loss) of any mutual funds or ETFs is not included in the Fund's net investment income (loss) ratio.
D Amount represents less than $.005 per share.
E Net investment income per share reflects one or more large, non-recurring dividend(s) which amounted to $.05 per share. Excluding such non-recurring dividend(s), the ratio of net investment income (loss) to average net assets would have been .40%.
F Net investment income per share reflects one or more large, non-recurring dividend(s) which amounted to $.07 per share. Excluding such non-recurring dividend(s), the ratio of net investment income (loss) to average net assets would have been 1.89%.
G Net realized and unrealized gain (loss) per share reflects proceeds received from litigation which amounted to $.01 per share. Excluding these litigation proceeds, the total return would have been (.78)%.
H The amount shown for a share outstanding does not correspond with the aggregate net gain (loss) on investments for the period due to the timing of sales and repurchases of shares in relation to fluctuating market values of the investments of the Fund.
I Total distributions per share do not sum due to rounding.
J Total returns would have been lower if certain expenses had not been reduced during the applicable periods shown.
K Fees and expenses of any underlying mutual funds or exchange-traded funds (ETFs) are not included in the Fund's expense ratio. The Fund indirectly bears its proportionate share of these expenses. For additional expense information related to investments in Fidelity Central Funds, please refer to the "Investments in Fidelity Central Funds" note found in the Notes to Financial Statements section of the most recent Annual or Semi-Annual report.
L Expense ratios reflect operating expenses of the class. Expenses before reductions do not reflect amounts reimbursed, waived, or reduced through arrangements with the investment adviser, brokerage services, or other offset arrangements, if applicable, and do not represent the amount paid by the class during periods when reimbursements, waivers or reductions occur.
M Amount does not include the portfolio activity of any underlying mutual funds or exchange-traded funds (ETFs).
Average annual total return reflects the change in the value of an investment, assuming reinvestment of distributions from dividend income and capital gains (the profits earned upon the sale of securities that have grown in value, if any) and assuming a constant rate of performance each year. The hypothetical investment and the average annual total returns do not reflect the deduction of taxes that a shareholder would pay on fund distributions or the redemption of fund shares. During periods of reimbursement by Fidelity, a fund's total return will be greater than it would be had the reimbursement not occurred. How a fund did yesterday is no guarantee of how it will do tomorrow.
| Average Annual Total Returns |
| | | | |
Periods ended February 28, 2023 | Past 1 year | Past 5 years | Past 10 years |
| Insurance Portfolio | 8.75% | 10.60% | 12.71% |
| $10,000 Over 10 Years |
| |
Let's say hypothetically that $10,000 was invested in Insurance Portfolio on February 28, 2013. The chart shows how the value of your investment would have changed, and also shows how the S&P 500® Index performed over the same period. |
|
|
Insurance Portfolio
Market Recap:
U.S. equities returned -7.69% for the 12 months ending February 28, 2023, according to the S&P 500 ® index. The new year began with an encouraging upturn in January (+6.28%), but stocks lost momentum in February (-2.44%) amid higher-than-expected inflation and strong jobs data. Investors took these as signs that the economy continued to run hot, even after a year of historic policy adjustment by the Federal Reserve aimed at cooling economic growth. Record inflation in 2022 prompted the Fed to aggressively tighten monetary policy, and market interest rates eclipsed their highest level in a decade, stoking recession fears and sending stocks into bear market territory. Since March 2022, the central bank has hiked its benchmark rate eight times, by 4.5 percentage points - the fastest-ever pace of monetary tightening - while also shrinking its massive asset portfolio. The latest bump came on February 2, along with a signal that the Fed plans to lift rates in March while it considers whether and when to pause increases. Against this dynamic backdrop, stocks struggled to gain traction until a strong rally ignited heading into the summer. But in September, the index returned -9.21%, one of its worst monthly results ever, before advancing 7.56% in Q4, as risky assets regained favor. For the full 12 months, value stocks handily outpaced growth. The headwind for the latter was most pronounced in the growth-oriented communication services (-25%) and consumer discretionary (-18%) sectors. In sharp contrast, energy gained 24%.
Comments from Portfolio Manager Fahim Razzaque:
For the fiscal year ending February 28, 2023, the fund gained 8.75%, trailing the 10.25% advance of the MSCI US IMI Insurance 25/50 Index, but handily outperforming the broad-based S&P 500 ® index. Versus the industry index, market selection was the primary detractor, especially an overweighting within multi-line insurance. Weak stock picks in asset management & custody banks also hindered the fund's relative result. Our non-index position in Berkshire Hathaway (-5%) was the fund's largest individual relative detractor. The fund's non-index investment in Ares Management, a position not held at period end, returned approximately -11%. Also hurting performance was our outsized stake in Brown & Brown (-16%). We increased our position the past 12 months. Conversely, by sector, the biggest contributor to performance versus the industry index was stock selection in life & health insurance. Security selection in multi-line insurance and insurance brokers also bolstered the fund's relative result. Not owning Lincoln National, an index component that returned -51%, was the biggest individual relative contributor. Also boosting value was our overweight in Primerica, which gained 50%. We added to our stake the past year. Another notable relative contributor was an underweighting in Prudential Financial (-6%), a position not held at period end. Notable changes in positioning include reduced exposure to the multi-line insurance subindustry.
The views expressed above reflect those of the portfolio manager(s) only through the end of the period as stated on the cover of this report and do not necessarily represent the views of Fidelity or any other person in the Fidelity organization. Any such views are subject to change at any time based upon market or other conditions and Fidelity disclaims any responsibility to update such views. These views may not be relied on as investment advice and, because investment decisions for a Fidelity fund are based on numerous factors, may not be relied on as an indication of trading intent on behalf of any Fidelity fund.
Insurance Portfolio
Top Holdings (% of Fund's net assets) |
| |
| Chubb Ltd. | 10.8 | |
| Marsh & McLennan Companies, Inc. | 10.6 | |
| Progressive Corp. | 8.5 | |
| The Travelers Companies, Inc. | 6.5 | |
| Arthur J. Gallagher & Co. | 5.9 | |
| Hartford Financial Services Group, Inc. | 5.0 | |
| American International Group, Inc. | 4.9 | |
| Aon PLC | 4.7 | |
| Globe Life, Inc. | 4.4 | |
| Unum Group | 4.2 | |
| | 65.5 | |
| |
| Industries (% of Fund's net assets) |
| |
| Insurance | 97.3 | |
| Diversified Financial Services | 1.9 | |
| |
Geographic Diversification (% of Fund's net assets) |
|
* Includes Short-Term investments and Net Other Assets (Liabilities). Percentages are based on country or territory of incorporation and are adjusted for the effect of derivatives, if applicable. |
| |
Insurance Portfolio
Showing Percentage of Net Assets
| Common Stocks - 99.2% |
| | | Shares | Value ($) |
| Diversified Financial Services - 1.9% | | | |
| Multi-Sector Holdings - 1.9% | | | |
| Berkshire Hathaway, Inc. Class B (a) | | 28,900 | 8,819,702 |
| Insurance - 97.3% | | | |
| Insurance Brokers - 25.7% | | | |
| Aon PLC | | 73,200 | 22,256,460 |
| Arthur J. Gallagher & Co. | | 150,800 | 28,252,380 |
| Brown & Brown, Inc. | | 220,900 | 12,385,863 |
| Marsh & McLennan Companies, Inc. | | 309,200 | 50,133,688 |
| Willis Towers Watson PLC | | 37,628 | 8,818,498 |
| | | | 121,846,889 |
| Life & Health Insurance - 15.2% | | | |
| CNO Financial Group, Inc. | | 283,500 | 7,263,270 |
| Globe Life, Inc. | | 171,600 | 20,882,004 |
| Primerica, Inc. | | 56,700 | 10,882,998 |
| Principal Financial Group, Inc. | | 146,000 | 13,075,760 |
| Unum Group | | 450,100 | 20,051,955 |
| | | | 72,155,987 |
| Multi-Line Insurance - 11.0% | | | |
| American International Group, Inc. | | 377,950 | 23,096,525 |
| Assurant, Inc. | | 41,700 | 5,312,163 |
| Hartford Financial Services Group, Inc. | | 301,500 | 23,601,420 |
| | | | 52,010,108 |
| Property & Casualty Insurance - 40.7% | | | |
| Allstate Corp. | | 149,800 | 19,291,244 |
| American Financial Group, Inc. | | 200 | 26,822 |
| Arch Capital Group Ltd. (a) | | 240,000 | 16,800,000 |
| Assured Guaranty Ltd. | | 57,600 | 3,594,816 |
| Chubb Ltd. | | 242,105 | 51,088,997 |
| Cincinnati Financial Corp. (b) | | 26,100 | 3,150,270 |
| Fidelity National Financial, Inc. | | 106,700 | 4,253,062 |
| First American Financial Corp. | | 89,200 | 5,064,776 |
| Loews Corp. | | 143,100 | 8,741,979 |
| Markel Corp. (a) | | 3,620 | 4,814,093 |
| Mercury General Corp. | | 200 | 6,810 |
| Progressive Corp. | | 279,900 | 40,171,248 |
| Selective Insurance Group, Inc. | | 51,500 | 5,228,795 |
| The Travelers Companies, Inc. | | 167,800 | 31,063,136 |
| | | | 193,296,048 |
| Reinsurance - 4.7% | | | |
| Everest Re Group Ltd. | | 16,000 | 6,143,520 |
| Reinsurance Group of America, Inc. | | 86,900 | 12,554,443 |
| RenaissanceRe Holdings Ltd. | | 17,800 | 3,825,220 |
| | | | 22,523,183 |
TOTAL INSURANCE | | | 461,832,215 |
| TOTAL COMMON STOCKS (Cost $342,466,535) | | | 470,651,917 |
| | | | |
| Money Market Funds - 1.6% |
| | | Shares | Value ($) |
| Fidelity Cash Central Fund 4.63% (c) | | 4,179,419 | 4,180,255 |
| Fidelity Securities Lending Cash Central Fund 4.63% (c)(d) | | 3,210,679 | 3,211,000 |
| TOTAL MONEY MARKET FUNDS (Cost $7,391,255) | | | 7,391,255 |
| | | | |
| TOTAL INVESTMENT IN SECURITIES - 100.8% (Cost $349,857,790) | 478,043,172 |
NET OTHER ASSETS (LIABILITIES) - (0.8)% | (3,581,801) |
| NET ASSETS - 100.0% | 474,461,371 |
| | |
Legend
| (b) | Security or a portion of the security is on loan at period end. |
| (c) | Affiliated fund that is generally available only to investment companies and other accounts managed by Fidelity Investments. The rate quoted is the annualized seven-day yield of the fund at period end. A complete unaudited listing of the fund's holdings as of its most recent quarter end is available upon request. In addition, each Fidelity Central Fund's financial statements, which are not covered by the Fund's Report of Independent Registered Public Accounting Firm, are available on the SEC's website or upon request. |
| (d) | Investment made with cash collateral received from securities on loan. |
Affiliated Central Funds
Fiscal year to date information regarding the Fund's investments in Fidelity Central Funds, including the ownership percentage, is presented below.
| Affiliate | Value, beginning of period ($) | Purchases ($) | Sales Proceeds ($) | Dividend Income ($) | Realized Gain (loss) ($) | Change in Unrealized appreciation (depreciation) ($) | Value, end of period ($) | % ownership, end of period |
| Fidelity Cash Central Fund 4.63% | 1,824,492 | 219,013,538 | 216,657,775 | 107,289 | - | - | 4,180,255 | 0.0% |
| Fidelity Securities Lending Cash Central Fund 4.63% | 550 | 15,439,439 | 12,228,989 | 723 | - | - | 3,211,000 | 0.0% |
| Total | 1,825,042 | 234,452,977 | 228,886,764 | 108,012 | - | - | 7,391,255 | |
| | | | | | | | | |
Amounts in the dividend income column in the above table include any capital gain distributions from underlying funds, which are presented in the corresponding line item in the Statement of Operations, if applicable.
Amount for Fidelity Securities Lending Cash Central Fund represents the income earned on investing cash collateral, less rebates paid to borrowers and any lending agent fees associated with the loan, plus any premium payments received for lending certain types of securities.
Amounts included in the purchases and sales proceeds columns may include in-kind transactions, if applicable.
Investment Valuation
The following is a summary of the inputs used, as of February 28, 2023, involving the Fund's assets and liabilities carried at fair value. The inputs or methodology used for valuing securities may not be an indication of the risk associated with investing in those securities. For more information on valuation inputs, and their aggregation into the levels used below, please refer to the Investment Valuation section in the accompanying Notes to Financial Statements.
| Valuation Inputs at Reporting Date: |
| Description | Total ($) | Level 1 ($) | Level 2 ($) | Level 3 ($) |
Investments in Securities: | | | | |
|
| Common Stocks | 470,651,917 | 470,651,917 | - | - |
|
| Money Market Funds | 7,391,255 | 7,391,255 | - | - |
| Total Investments in Securities: | 478,043,172 | 478,043,172 | - | - |
Insurance Portfolio
| Statement of Assets and Liabilities |
| | | | February 28, 2023 |
| | | | | |
| Assets | | | | |
| Investment in securities, at value (including securities loaned of $3,138,200) - See accompanying schedule: | | | | |
Unaffiliated issuers (cost $342,466,535) | $ | 470,651,917 | | |
Fidelity Central Funds (cost $7,391,255) | | 7,391,255 | | |
| | | | | |
| | | | | |
| Total Investment in Securities (cost $349,857,790) | | | $ | 478,043,172 |
| Foreign currency held at value (cost $3) | | | | 3 |
| Receivable for fund shares sold | | | | 575,128 |
| Dividends receivable | | | | 337,602 |
| Distributions receivable from Fidelity Central Funds | | | | 9,069 |
| Prepaid expenses | | | | 1,074 |
Total assets | | | | 478,966,048 |
| Liabilities | | | | |
| Payable for fund shares redeemed | $ | 959,148 | | |
| Accrued management fee | | 208,801 | | |
| Other affiliated payables | | 90,434 | | |
| Other payables and accrued expenses | | 35,294 | | |
| Collateral on securities loaned | | 3,211,000 | | |
| Total Liabilities | | | | 4,504,677 |
| Net Assets | | | $ | 474,461,371 |
| Net Assets consist of: | | | | |
| Paid in capital | | | $ | 332,981,780 |
| Total accumulated earnings (loss) | | | | 141,479,591 |
| Net Assets | | | $ | 474,461,371 |
Net Asset Value , offering price and redemption price per share ($474,461,371 ÷ 6,292,242 shares) | | | $ | 75.40 |
| Statement of Operations |
| | | | Year ended February 28, 2023 |
| Investment Income | | | | |
| Dividends | | | $ | 5,549,633 |
| Income from Fidelity Central Funds (including $723 from security lending) | | | | 108,012 |
| Total Income | | | | 5,657,645 |
| Expenses | | | | |
| Management fee | $ | 1,758,172 | | |
| Transfer agent fees | | 660,418 | | |
| Accounting fees | | 120,715 | | |
| Custodian fees and expenses | | 10,429 | | |
| Independent trustees' fees and expenses | | 1,083 | | |
| Registration fees | | 105,027 | | |
| Audit | | 40,049 | | |
| Legal | | 156 | | |
| Interest | | 2,321 | | |
| Miscellaneous | | 1,614 | | |
| Total expenses before reductions | | 2,699,984 | | |
| Expense reductions | | (11,132) | | |
| Total expenses after reductions | | | | 2,688,852 |
| Net Investment income (loss) | | | | 2,968,793 |
| Realized and Unrealized Gain (Loss) | | | | |
| Net realized gain (loss) on: | | | | |
| Investment Securities: | | | | |
| Unaffiliated issuers | | 14,737,111 | | |
| Foreign currency transactions | | (753) | | |
| Total net realized gain (loss) | | | | 14,736,358 |
| Change in net unrealized appreciation (depreciation) on: | | | | |
| Investment Securities: | | | | |
| Unaffiliated issuers | | 5,173,256 | | |
| Assets and liabilities in foreign currencies | | (2,745) | | |
| Total change in net unrealized appreciation (depreciation) | | | | 5,170,511 |
| Net gain (loss) | | | | 19,906,869 |
| Net increase (decrease) in net assets resulting from operations | | | $ | 22,875,662 |
| Statement of Changes in Net Assets |
| |
| | Year ended February 28, 2023 | | Year ended February 28, 2022 |
| Increase (Decrease) in Net Assets | | | | |
| Operations | | | | |
| Net investment income (loss) | $ | 2,968,793 | $ | 2,475,589 |
| Net realized gain (loss) | | 14,736,358 | | 6,591,336 |
| Change in net unrealized appreciation (depreciation) | | 5,170,511 | | 35,822,023 |
| Net increase (decrease) in net assets resulting from operations | | 22,875,662 | | 44,888,948 |
| Distributions to shareholders | | (2,977,551) | | (17,750,181) |
| Share transactions | | | | |
| Proceeds from sales of shares | | 393,392,705 | | 71,913,727 |
| Reinvestment of distributions | | 2,747,103 | | 16,623,368 |
| Cost of shares redeemed | | (187,507,051) | | (54,446,500) |
Net increase (decrease) in net assets resulting from share transactions | | 208,632,757 | | 34,090,595 |
| Total increase (decrease) in net assets | | 228,530,868 | | 61,229,362 |
| | | | | |
| Net Assets | | | | |
| Beginning of period | | 245,930,503 | | 184,701,141 |
| End of period | $ | 474,461,371 | $ | 245,930,503 |
| | | | | |
| Other Information | | | | |
| Shares | | | | |
| Sold | | 5,401,580 | | 1,054,727 |
| Issued in reinvestment of distributions | | 37,851 | | 256,213 |
| Redeemed | | (2,667,446) | | (810,083) |
| Net increase (decrease) | | 2,771,985 | | 500,857 |
| | | | | |
Financial Highlights
| Years ended February 28, | | 2023 | | 2022 | | 2021 | | 2020 A | | 2019 |
Selected Per-Share Data | | | | | | | | | | |
| Net asset value, beginning of period | $ | 69.86 | $ | 61.17 | $ | 58.44 | $ | 59.27 | $ | 78.49 |
| Income from Investment Operations | | | | | | | | | | |
Net investment income (loss) B,C | | .63 | | .78 | | .88 | | .87 | | .98 |
| Net realized and unrealized gain (loss) | | 5.46 | | 13.73 | | 6.99 | | 2.77 | | (2.40) |
| Total from investment operations | | 6.09 | | 14.51 | | 7.87 | | 3.64 | | (1.42) |
| Distributions from net investment income | | (.55) | | (.89) | | (.94) | | (.91) | | (1.16) |
| Distributions from net realized gain | | - | | (4.93) | | (4.20) | | (3.56) | | (16.63) |
| Total distributions | | (.55) | | (5.82) | | (5.14) | | (4.47) | | (17.80) D |
| Net asset value, end of period | $ | 75.40 | $ | 69.86 | $ | 61.17 | $ | 58.44 | $ | 59.27 |
Total Return E | | 8.75% | | 24.68% | | 15.54% | | 5.95% | | (.29)% |
Ratios to Average Net Assets C,F,G | | | | | | | | | | |
| Expenses before reductions | | .81% | | .78% | | .83% | | .81% | | .82% |
| Expenses net of fee waivers, if any | | .81% | | .78% | | .83% | | .81% | | .81% |
| Expenses net of all reductions | | .81% | | .78% | | .83% | | .80% | | .81% |
| Net investment income (loss) | | .90% | | 1.16% | | 1.68% | | 1.37% | | 1.48% |
| Supplemental Data | | | | | | | | | | |
| Net assets, end of period (000 omitted) | $ | 474,461 | $ | 245,931 | $ | 184,701 | $ | 219,539 | $ | 223,081 |
Portfolio turnover rate H | | 48% | | 15% | | 18% | | 28% | | 9% |
A For the year ended February 29.
B Calculated based on average shares outstanding during the period.
C Net investment income (loss) is affected by the timing of the declaration of dividends by any underlying mutual funds or exchange-traded funds (ETFs). Net investment income (loss) of any mutual funds or ETFs is not included in the Fund's net investment income (loss) ratio.
D Total distributions per share do not sum due to rounding.
E Total returns would have been lower if certain expenses had not been reduced during the applicable periods shown.
F Fees and expenses of any underlying mutual funds or exchange-traded funds (ETFs) are not included in the Fund's expense ratio. The Fund indirectly bears its proportionate share of these expenses. For additional expense information related to investments in Fidelity Central Funds, please refer to the "Investments in Fidelity Central Funds" note found in the Notes to Financial Statements section of the most recent Annual or Semi-Annual report.
G Expense ratios reflect operating expenses of the class. Expenses before reductions do not reflect amounts reimbursed, waived, or reduced through arrangements with the investment adviser, brokerage services, or other offset arrangements, if applicable, and do not represent the amount paid by the class during periods when reimbursements, waivers or reductions occur.
H Amount does not include the portfolio activity of any underlying mutual funds or exchange-traded funds (ETFs).
For the period ended February 28, 2023
1. Organization.
Banking Portfolio, Brokerage and Investment Management Portfolio, Financial Services Portfolio, FinTech Portfolio and Insurance Portfolio (the Funds) are non-diversified funds of Fidelity Select Portfolios (the Trust). The Trust is registered under the Investment Company Act of 1940, as amended (the 1940 Act), as an open-end management investment company organized as a Massachusetts business trust. The Funds invest primarily in securities of companies whose principal business activities fall within specific industries. Each Fund is authorized to issue an unlimited number of shares. Share transactions on the Statement of Changes in Net Assets may contain exchanges between affiliated funds.
In January 2023 the Board of Trustees approved a change in the name of Financial Services Portfolio to Financials Portfolio effective April 28, 2023.
2. Investments in Fidelity Central Funds.
Funds may invest in Fidelity Central Funds, which are open-end investment companies generally available only to other investment companies and accounts managed by the investment adviser and its affiliates. The Schedule of Investments lists any Fidelity Central Funds held as an investment as of period end, but does not include the underlying holdings of each Fidelity Central Fund. An investing fund indirectly bears its proportionate share of the expenses of the underlying Fidelity Central Funds.
Based on its investment objective, each Fidelity Central Fund may invest or participate in various investment vehicles or strategies that are similar to those of the investing fund. These strategies are consistent with the investment objectives of the investing fund and may involve certain economic risks which may cause a decline in value of each of the Fidelity Central Funds and thus a decline in the value of the investing fund.
| Fidelity Central Fund | Investment Manager | Investment Objective | Investment Practices | Expense Ratio A |
| Fidelity Money Market Central Funds | Fidelity Management & Research Company LLC (FMR) | Each fund seeks to obtain a high level of current income consistent with the preservation of capital and liquidity. | Short-term Investments | Less than .005% |
A Expenses expressed as a percentage of average net assets and are as of each underlying Central Fund's most recent annual or semi-annual shareholder report.
A complete unaudited list of holdings for each Fidelity Central Fund is available upon request or at the Securities and Exchange Commission website at www.sec.gov. In addition, the financial statements of the Fidelity Central Funds which contain the significant accounting policies (including investment valuation policies) of those funds, and are not covered by the Report of Independent Registered Public Accounting Firm, are available on the Securities and Exchange Commission website or upon request.
3. Significant Accounting Policies.
Each Fund is an investment company and applies the accounting and reporting guidance of the Financial Accounting Standards Board (FASB) Accounting Standards Codification Topic 946 Financial Services - Investment Companies . The financial statements have been prepared in conformity with accounting principles generally accepted in the United States of America (GAAP), which require management to make certain estimates and assumptions at the date of the financial statements. Actual results could differ from those estimates. Subsequent events, if any, through the date that the financial statements were issued have been evaluated in the preparation of the financial statements. Each Fund's Schedule of Investments lists any underlying mutual funds or exchange-traded funds (ETFs) but does not include the underlying holdings of these funds. The following summarizes the significant accounting policies of each Fund:
Investment Valuation. Investments are valued as of 4:00 p.m. Eastern time on the last calendar day of the period. The Board of Trustees (the Board) has designated each Fund's investment adviser as the valuation designee responsible for the fair valuation function and performing fair value determinations as needed. The investment adviser has established a Fair Value Committee (the Committee) to carry out the day-to-day fair valuation responsibilities and has adopted policies and procedures to govern the fair valuation process and the activities of the Committee. In accordance with these fair valuation policies and procedures, which have been approved by the Board, each Fund attempts to obtain prices from one or more third party pricing services or brokers to value its investments. When current market prices, quotations or currency exchange rates are not readily available or reliable, investments will be fair valued in good faith by the Committee, in accordance with the policies and procedures. Factors used in determining fair value vary by investment type and may include market or investment specific events, transaction data, estimated cash flows, and market observations of comparable investments. The frequency that the fair valuation procedures are used cannot be predicted and they may be utilized to a significant extent. The Committee manages each Fund's fair valuation practices and maintains the fair valuation policies and procedures. Each Fund's investment adviser reports to the Board information regarding the fair valuation process and related material matters.
Each Fund categorizes the inputs to valuation techniques used to value its investments into a disclosure hierarchy consisting of three levels as shown below:
Level 1 - unadjusted quoted prices in active markets for identical investments
Level 2 - other significant observable inputs (including quoted prices for similar investments, interest rates, prepayment speeds, etc.)
Level 3 - unobservable inputs (including the Fund's own assumptions based on the best information available)
Valuation techniques used to value each Fund's investments by major category are as follows:
Equity securities, including restricted securities, for which market quotations are readily available, are valued at the last reported sale price or official closing price as reported by a third party pricing service on the primary market or exchange on which they are traded and are categorized as Level 1 in the hierarchy. In the event there were no sales during the day or closing prices are not available, securities are valued at the last quoted bid price or may be valued using the last available price and are generally categorized as Level 2 in the hierarchy. For foreign equity securities, when market or security specific events arise, comparisons to the valuation of American Depositary Receipts (ADRs), futures contracts, ETFs and certain indexes as well as quoted prices for similar securities may be used and would be categorized as Level 2 in the hierarchy. For equity securities, including restricted securities, where observable inputs are limited, assumptions about market activity and risk are used and these securities may be categorized as Level 3 in the hierarchy.
Debt securities, including restricted securities, are valued based on evaluated prices received from third party pricing services or from brokers who make markets in such securities. Corporate bonds are valued by pricing services who utilize matrix pricing which considers yield or price of bonds of comparable quality, coupon, maturity and type or by broker-supplied prices. When independent prices are unavailable or unreliable, debt securities may be valued utilizing pricing methodologies which consider similar factors that would be used by third party pricing services. Debt securities are generally categorized as Level 2 in the hierarchy but may be Level 3 depending on the circumstances.
Investments in open-end mutual funds, including the Fidelity Central Funds, are valued at their closing net asset value (NAV) each business day and are categorized as Level 1 in the hierarchy.
Changes in valuation techniques may result in transfers in or out of an assigned level within the disclosure hierarchy. The aggregate value of investments by input level as of February 28, 2023 is included at the end of the Fund's Schedule of Investments.
Foreign Currency. Certain Funds may use foreign currency contracts to facilitate transactions in foreign-denominated securities. Gains and losses from these transactions may arise from changes in the value of the foreign currency or if the counterparties do not perform under the contracts' terms.
Foreign-denominated assets, including investment securities, and liabilities are translated into U.S. dollars at the exchange rates at period end. Purchases and sales of investment securities, income and dividends received, and expenses denominated in foreign currencies are translated into U.S. dollars at the exchange rate in effect on the transaction date.
The effects of exchange rate fluctuations on investments are included with the net realized and unrealized gain (loss) on investment securities. Other foreign currency transactions resulting in realized and unrealized gain (loss) are disclosed separately.
Investment Transactions and Income. For financial reporting purposes, the Funds' investment holdings and NAV include trades executed through the end of the last business day of the period. The NAV per share for processing shareholder transactions is calculated as of the close of business of the New York Stock Exchange (NYSE), normally 4:00 p.m. Eastern time and includes trades executed through the end of the prior business day. Gains and losses on securities sold are determined on the basis of identified cost and for certain Funds include proceeds received from litigation. Commissions paid to certain brokers with whom the investment adviser, or its affiliates, places trades on behalf of a fund include an amount in addition to trade execution, which may be rebated back to a fund. Any such rebates are included in net realized gain (loss) on investments in the Statement of Operations. Dividend income is recorded on the ex-dividend date, except for certain dividends from foreign securities where the ex-dividend date may have passed, which are recorded as soon as the Funds are informed of the ex-dividend date. Non-cash dividends included in dividend income, if any, are recorded at the fair market value of the securities received. Income and capital gain distributions from Fidelity Central Funds, if any, are recorded on the ex-dividend date. Certain distributions received by the Funds represent a return of capital or capital gain. The Funds determine the components of these distributions subsequent to the ex-dividend date, based upon receipt of tax filings or other correspondence relating to the underlying investment. These distributions are recorded as a reduction of cost of investments and/or as a realized gain. Interest income is accrued as earned and includes coupon interest and amortization of premium and accretion of discount on debt securities as applicable. Investment income is recorded net of foreign taxes withheld where recovery of such taxes is uncertain. Funds may file withholding tax reclaims in certain jurisdictions to recover a portion of amounts previously withheld. Any withholding tax reclaims income is included in the Statement of Operations in dividends. Any receivables for withholding tax reclaims are included in the Statement of Assets and Liabilities in dividends receivable.
Expenses. Expenses directly attributable to a fund are charged to that fund. Expenses attributable to more than one fund are allocated among the respective funds on the basis of relative net assets or other appropriate methods. Expenses included in the accompanying financial statements reflect the expenses of that fund and do not include any expenses associated with any underlying mutual funds or exchange-traded funds. Although not included in a fund's expenses, a fund indirectly bears its proportionate share of these expenses through the net asset value of each underlying mutual fund or exchange-traded fund. Expense estimates are accrued in the period to which they relate and adjustments are made when actual amounts are known.
Deferred Trustee Compensation. Under a Deferred Compensation Plan (the Plan) for certain Funds, certain independent Trustees have elected to defer receipt of a portion of their annual compensation. Deferred amounts are invested in affiliated mutual funds, are marked-to-market and remain in a fund until distributed in accordance with the Plan. The investment of deferred amounts and the offsetting payable to the Trustees presented below are included in the accompanying Statement of Assets and Liabilities in other receivables and other payables and accrued expenses, as applicable.
| Brokerage and Investment Management Portfolio | $50,189 |
Income Tax Information and Distributions to Shareholders. Each year, each Fund intends to qualify as a regulated investment company under Subchapter M of the Internal Revenue Code, including distributing substantially all of its taxable income and realized gains. As a result, no provision for U.S. Federal income taxes is required. As of February 28, 2023, each Fund did not have any unrecognized tax benefits in the financial statements; nor is each Fund aware of any tax positions for which it is reasonably possible that the total amounts of unrecognized tax benefits will significantly change in the next twelve months. Each Fund files a U.S. federal tax return, in addition to state and local tax returns as required. Each Fund's federal income tax returns are subject to examination by the Internal Revenue Service (IRS) for a period of three fiscal years after they are filed. State and local tax returns may be subject to examination for an additional fiscal year depending on the jurisdiction. Foreign taxes are provided for based on each Fund's understanding of the tax rules and rates that exist in the foreign markets in which it invests.
Distributions are declared and recorded on the ex-dividend date. Income and capital gain distributions are determined in accordance with income tax regulations, which may differ from GAAP. In addition, certain Funds claimed a portion of the payment made to redeeming shareholders as a distribution for income tax purposes.
Capital accounts within the financial statements are adjusted for permanent book-tax differences. These adjustments have no impact on net assets or the results of operations. Capital accounts are not adjusted for temporary book-tax differences which will reverse in a subsequent period.
Book-tax differences are primarily due to foreign currency transactions, passive foreign investment companies (PFIC), deferred Trustee compensation, net operating losses, partnerships, capital loss carryforwards and losses deferred due to wash sales and excise tax regulations.
As of period end, the cost and unrealized appreciation (depreciation) in securities, and derivatives if applicable, for federal income tax purposes were as follows for each Fund:
| | Tax cost | Gross unrealized appreciation | Gross unrealized depreciation | Net unrealized appreciation (depreciation) |
| Banking Portfolio | $360,943,658 | $88,065,024 | $(15,601,816) | $72,463,208 |
Brokerage and Investment Management Portfolio | 640,361,716 | 261,687,029 | (50,363,069) | 211,323,960 |
| Financial Services Portfolio | 622,803,456 | 141,240,830 | (25,684,302) | 115,556,528 |
| FinTech Portfolio | 122,064,043 | 24,169,564 | (38,406,105) | (14,236,541) |
| Insurance Portfolio | 351,792,227 | 133,103,830 | (6,852,885) | 126,250,945 |
The tax-based components of distributable earnings as of period end were as follows for each Fund:
| | Undistributed ordinary income | Undistributed long-term capital gain | Capital loss carryforward | Net unrealized appreciation (depreciation) on securities and other investments |
| Banking Portfolio | $1,684,994 | $10,230,061 | $- | $72,463,208 |
Brokerage and Investment Management Portfolio | - | - | (74,446,146) | 211,322,364 |
| Financial Services Portfolio | 2,197,325 | 6,673,975 | - | 115,555,352 |
| FinTech Portfolio | - | - | (21,997,614) | (14,236,541) |
| Insurance Portfolio | - | 15,230,446 | - | 126,249,144 |
Capital loss carryforwards are only available to offset future capital gains of the Funds to the extent provided by regulations and may be limited. The capital loss carryforward information presented below, including any applicable limitation, is estimated as of fiscal period end and is subject to adjustment.
| | Short-term | Long-term | Total capital loss carryforward |
Brokerage and Investment Management Portfolio | (74,446,146) | (-) | (74,446,146) |
| FinTech Portfolio | (21,997,614) | (-) | (21,997,614) |
The tax character of distributions paid was as follows:
| February 28, 2023 | | | |
| | Ordinary Income | Long-term Capital Gains | Total |
| Banking Portfolio | $11,563,840 | $15,801,398 | $27,365,238 |
Brokerage and Investment Management Portfolio | 13,893,658 | 3,333,300 | 17,226,958 |
| Financial Services Portfolio | 14,414,547 | 58,904,313 | 73,318,860 |
| FinTech Portfolio | - | - | - |
| Insurance Portfolio | 2,977,551 | - | 2,977,551 |
| February 28, 2022 | | | |
| | Ordinary Income | Long-term Capital Gains | Total |
| Banking Portfolio | $10,967,463 | $9,331,485 | $20,298,948 |
| Brokerage and Investment Management Portfolio | 7,406,134 | 4,552,818 | 11,958,952 |
| Financial Services Portfolio | 15,183,491 | 14,358,173 | 29,541,664 |
| FinTech Portfolio | 3,215,617 | 33,810,985 | 37,026,602 |
| Insurance Portfolio | 2,910,816 | 14,839,365 | 17,750,181 |
Restricted Securities (including Private Placements). Funds may invest in securities that are subject to legal or contractual restrictions on resale. These securities generally may be resold in transactions exempt from registration or to the public if the securities are registered. Disposal of these securities may involve time-consuming negotiations and expense, and prompt sale at an acceptable price may be difficult. Information regarding restricted securities held at period end is included at the end of the Schedule of Investments, if applicable.
4. Purchases and Sales of Investments.
Purchases and sales of securities, other than short-term securities and in-kind transactions, as applicable, are noted in the table below.
| | Purchases ($) | Sales ($) |
| Banking Portfolio | 105,972,044 | 293,602,359 |
| Brokerage and Investment Management Portfolio | 37,829,108 | 359,862,620 |
| Financial Services Portfolio | 308,990,905 | 353,640,986 |
| FinTech Portfolio | 18,324,727 | 46,555,622 |
| Insurance Portfolio | 369,184,926 | 161,478,550 |
5. Fees and Other Transactions with Affiliates.
Management Fee. Fidelity Management & Research Company LLC (the investment adviser) and its affiliates provide the Funds with investment management related services for which the Funds pay a monthly management fee. The management fee is the sum of an individual fund fee rate and an annualized group fee rate. The individual fund fee rate is applied to each Fund's average net assets. The group fee rate is based upon the monthly average net assets of a group of registered investment companies with which the investment adviser has management contracts. The group fee rate decreases as assets under management increase and increases as assets under management decrease. For the reporting period, each Fund's annual management fee rate expressed as a percentage of each Fund's average net assets was as follows:
| | Individual Rate | Group Rate | Total |
| Banking Portfolio | .30% | .23% | .52% |
| Brokerage and Investment Management Portfolio | .30% | .23% | .53% |
| Financial Services Portfolio | .30% | .23% | .53% |
| FinTech Portfolio | .30% | .23% | .53% |
| Insurance Portfolio | .30% | .23% | .53% |
Transfer Agent Fees. Fidelity Investments Institutional Operations Company LLC (FIIOC), an affiliate of the investment adviser, is the Funds' transfer, dividend disbursing and shareholder servicing agent. FIIOC receives account fees and asset-based fees that vary according to account size and type of account. FIIOC pays for typesetting, printing and mailing of shareholder reports, except proxy statements. For the period, transfer agent fees were equivalent to the following annual rates expressed as a percentage of average net assets:
| Banking Portfolio | .16% |
| Brokerage and Investment Management Portfolio | .18% |
| Financial Services Portfolio | .17% |
| FinTech Portfolio | .25% |
| Insurance Portfolio | .20% |
Accounting Fees. Fidelity Service Company, Inc. (FSC), an affiliate of the investment adviser, maintains each Fund's accounting records. The accounting fee is based on the level of average net assets for each month. For the period, the fees were equivalent to the following annual rates:
| | % of Average Net Assets |
| Banking Portfolio | .04 |
| Brokerage and Investment Management Portfolio | .03 |
| Financial Services Portfolio | .03 |
| FinTech Portfolio | .04 |
| Insurance Portfolio | .04 |
Brokerage Commissions. A portion of portfolio transactions were placed with brokerage firms which are affiliates of the investment adviser. Brokerage commissions are included in net realized gain (loss) and change in net unrealized appreciation (depreciation) in the Statement of Operations. The commissions paid to these affiliated firms were as follows:
| | Amount |
| Banking Portfolio | $3,948 |
| Brokerage and Investment Management Portfolio | 1,770 |
| Financial Services Portfolio | 5,032 |
| FinTech Portfolio | 190 |
| Insurance Portfolio | 2,281 |
Interfund Lending Program. Pursuant to an Exemptive Order issued by the Securities and Exchange Commission (the SEC), each Fund, along with other registered investment companies having management contracts with Fidelity Management & Research Company LLC (FMR), or other affiliated entities of FMR, may participate in an interfund lending program. This program provides an alternative credit facility allowing each Fund to borrow from, or lend money to, other participating affiliated funds. At period end, there were no interfund loans outstanding. Activity in this program during the period for which loans were outstanding was as follows:
| | Borrower or Lender | Average Loan Balance | Weighted Average Interest Rate | Interest Expense |
| Banking Portfolio | Borrower | $4,813,400 | 4.57% | $3,052 |
| Brokerage and Investment Management Portfolio | Borrower | $4,922,128 | 3.01% | $16,040 |
| Financial Services Portfolio | Borrower | $8,406,400 | 1.80% | $2,103 |
| Insurance Portfolio | Borrower | $9,918,000 | 3.12% | $1,721 |
Interfund Trades. Funds may purchase from or sell securities to other Fidelity Funds under procedures adopted by the Board. The procedures have been designed to ensure these interfund trades are executed in accordance with Rule 17a-7 of the 1940 Act. Any interfund trades are included within the respective purchases and sales amounts shown in the Purchases and Sales of Investments note. Interfund trades during the period are noted in the table below.
| | Purchases ($) | Sales ($) | Realized Gain (Loss) ($) |
| Banking Portfolio | 2,195,220 | 10,254,750 | (686,955) |
| Brokerage and Investment Management Portfolio | 521,795 | 11,761,351 | (494,769) |
| Financial Services Portfolio | 13,519,173 | 19,425,362 | 3,728,865 |
| FinTech Portfolio | 1,207,696 | 46,801 | 14,984 |
| Insurance Portfolio | 28,784,056 | 13,945,703 | 3,832,914 |
6. Committed Line of Credit.
Certain Funds participate with other funds managed by the investment adviser or an affiliate in a $4.25 billion credit facility (the "line of credit") to be utilized for temporary or emergency purposes to fund shareholder redemptions or for other short-term liquidity purposes. The participating funds have agreed to pay commitment fees on their pro-rata portion of the line of credit, which are reflected in Miscellaneous expenses on the Statement of Operations, and are listed below. During the period, there were no borrowings on this line of credit.
| | Amount |
| Banking Portfolio | $956 |
| Brokerage and Investment Management Portfolio | 1,720 |
| Financial Services Portfolio | 1,210 |
| FinTech Portfolio | 239 |
| Insurance Portfolio | 519 |
7. Security Lending.
Funds lend portfolio securities from time to time in order to earn additional income. Lending agents are used, including National Financial Services (NFS), an affiliate of the investment adviser. Pursuant to a securities lending agreement, NFS will receive a fee, which is capped at 9.9% of a fund's daily lending revenue, for its services as lending agent. A fund may lend securities to certain qualified borrowers, including NFS. On the settlement date of the loan, a fund receives collateral (in the form of U.S. Treasury obligations, letters of credit and/or cash) against the loaned securities and maintains collateral in an amount not less than 100% of the market value of the loaned securities during the period of the loan. The market value of the loaned securities is determined at the close of business of a fund and any additional required collateral is delivered to a fund on the next business day. A fund or borrower may terminate the loan at any time, and if the borrower defaults on its obligation to return the securities loaned because of insolvency or other reasons, a fund may apply collateral received from the borrower against the obligation. A fund may experience delays and costs in recovering the securities loaned. Any cash collateral received is invested in the Fidelity Securities Lending Cash Central Fund. Any loaned securities are identified as such in the Schedule of Investments, and the value of loaned securities and cash collateral at period end, as applicable, are presented in the Statement of Assets and Liabilities. Security lending income represents the income earned on investing cash collateral, less rebates paid to borrowers and any lending agent fees associated with the loan, plus any premium payments received for lending certain types of securities. Security lending income is presented in the Statement of Operations as a component of income from Fidelity Central Funds. Affiliated security lending activity, if any, was as follows:
| | Total Security Lending Fees Paid to NFS | Security Lending Income From Securities Loaned to NFS | Value of Securities Loaned to NFS at Period End |
| Banking Portfolio | $1,488 | $11 | $- |
| Brokerage and Investment Management Portfolio | $13,416 | $1,587 | $- |
| Financial Services Portfolio | $1,721 | $- | $- |
| FinTech Portfolio | $581 | $- | $- |
| Insurance Portfolio | $76 | $- | $- |
8. Bank Borrowings.
Each Fund is permitted to have bank borrowings for temporary or emergency purposes to fund shareholder redemptions or for other short-term liquidity requirements. Each Fund has established borrowing arrangements with certain banks. The interest rate on the borrowings is the bank's base rate, as revised from time to time. Any open loans, including accrued interest, at period end are presented under the caption "Notes payable" in the Statement of Assets and Liabilities, if applicable. Activity in this program during the period for which loans were outstanding was as follows:
| | Average Loan Balance | Weighted Average Interest Rate | Interest Expense |
| Brokerage and Investment Management Portfolio | $944,406 | 2.59% | $2,176 |
| Insurance Portfolio | $10,389,000 | 2.08% | $600 |
9. Expense Reductions.
During the period the investment adviser or an affiliate reimbursed and/or waived a portion of operating expenses as follows:
| | Amount |
| Banking Portfolio | $17,651 |
| Brokerage and Investment Management Portfolio | 32,083 |
| Financial Services Portfolio | 23,514 |
| FinTech Portfolio | 4,444 |
| Insurance Portfolio | 11,132 |
10. Other.
A fund's organizational documents provide former and current trustees and officers with a limited indemnification against liabilities arising in connection with the performance of their duties to the fund. In the normal course of business, a fund may also enter into contracts that provide general indemnifications. A fund's maximum exposure under these arrangements is unknown as this would be dependent on future claims that may be made against a fund. The risk of material loss from such claims is considered remote.
11. Risk and Uncertainties.
Many factors affect a fund's performance. Developments that disrupt global economies and financial markets, such as pandemics, epidemics, outbreaks of infectious diseases, war, terrorism, and environmental disasters, may significantly affect a fund's investment performance. The effects of these developments to a fund will be impacted by the types of securities in which a fund invests, the financial condition, industry, economic sector, and geographic location of an issuer, and a fund's level of investment in the securities of that issuer. Significant concentrations in security types, issuers, industries, sectors, and geographic locations may magnify the factors that affect a fund's performance.
To the Board of Trustees of Fidelity Select Portfolios and the Shareholders of Banking Portfolio, Brokerage and Investment Management Portfolio, Financial Services Portfolio, FinTech Portfolio and Insurance Portfolio
Opinions on the Financial Statements
We have audited the accompanying statements of assets and liabilities, including the schedules of investments, of Banking Portfolio, Brokerage and Investment Management Portfolio, Financial Services Portfolio, FinTech Portfolio and Insurance Portfolio (five of the funds constituting Fidelity Select Portfolios, hereafter collectively referred to as the "Funds") as of February 28, 2023, the related statements of operations for the year ended February 28, 2023, the statements of changes in net assets for each of the two years in the period ended February 28, 2023, including the related notes, and the financial highlights for each of the five years in the period ended February 28, 2023 (collectively referred to as the "financial statements"). In our opinion, the financial statements present fairly, in all material respects, the financial position of each of the Funds as of February 28, 2023, the results of each of their operations for the year then ended, the changes in each of their net assets for each of the two years in the period ended February 28, 2023 and each of the financial highlights for each of the five years in the period ended February 28, 2023 in conformity with accounting principles generally accepted in the United States of America.
Basis for Opinions
These financial statements are the responsibility of the Funds' management. Our responsibility is to express an opinion on the Funds' financial statements based on our audits. We are a public accounting firm registered with the Public Company Accounting Oversight Board (United States) (PCAOB) and are required to be independent with respect to the Funds in accordance with the U.S. federal securities laws and the applicable rules and regulations of the Securities and Exchange Commission and the PCAOB.
We conducted our audits of these financial statements in accordance with the standards of the PCAOB. Those standards require that we plan and perform the audit to obtain reasonable assurance about whether the financial statements are free of material misstatement, whether due to error or fraud.
Our audits included performing procedures to assess the risks of material misstatement of the financial statements, whether due to error or fraud, and performing procedures that respond to those risks. Such procedures included examining, on a test basis, evidence regarding the amounts and disclosures in the financial statements. Our audits also included evaluating the accounting principles used and significant estimates made by management, as well as evaluating the overall presentation of the financial statements. Our procedures included confirmation of securities owned as of February 28, 2023 by correspondence with the custodian and brokers; when replies were not received from brokers, we performed other auditing procedures. We believe that our audits provide a reasonable basis for our opinions.
/s/ PricewaterhouseCoopers LLP
Boston, Massachusetts
April 12, 2023
We have served as the auditor of one or more investment companies in the Fidelity group of funds since 1932.
The Trustees, Members of the Advisory Board (if any), and officers of the trust and funds, as applicable, are listed below. The Board of Trustees governs each fund and is responsible for protecting the interests of shareholders. The Trustees are experienced executives who meet periodically throughout the year to oversee each fund's activities, review contractual arrangements with companies that provide services to each fund, oversee management of the risks associated with such activities and contractual arrangements, and review each fund's performance. Each of the Trustees oversees 318 funds.
The Trustees hold office without limit in time except that (a) any Trustee may resign; (b) any Trustee may be removed by written instrument, signed by at least two-thirds of the number of Trustees prior to such removal; (c) any Trustee who requests to be retired or who has become incapacitated by illness or injury may be retired by written instrument signed by a majority of the other Trustees; and (d) any Trustee may be removed at any special meeting of shareholders by a two-thirds vote of the outstanding voting securities of the trust. Each Trustee who is not an interested person (as defined in the 1940 Act) of the trust and the funds is referred to herein as an Independent Trustee. Each Independent Trustee shall retire not later than the last day of the calendar year in which his or her 75th birthday occurs. The Independent Trustees may waive this mandatory retirement age policy with respect to individual Trustees. Officers and Advisory Board Members hold office without limit in time, except that any officer or Advisory Board Member may resign or may be removed by a vote of a majority of the Trustees at any regular meeting or any special meeting of the Trustees. Except as indicated, each individual has held the office shown or other offices in the same company for the past five years.
The funds' Statement of Additional Information (SAI) includes more information about the Trustees. To request a free copy, call Fidelity at 1-800-544-8544.
Experience, Skills, Attributes, and Qualifications of the Trustees. The Governance and Nominating Committee has adopted a statement of policy that describes the experience, qualifications, attributes, and skills that are necessary and desirable for potential Independent Trustee candidates (Statement of Policy). The Board believes that each Trustee satisfied at the time he or she was initially elected or appointed a Trustee, and continues to satisfy, the standards contemplated by the Statement of Policy. The Governance and Nominating Committee also engages professional search firms to help identify potential Independent Trustee candidates who have the experience, qualifications, attributes, and skills consistent with the Statement of Policy. From time to time, additional criteria based on the composition and skills of the current Independent Trustees, as well as experience or skills that may be appropriate in light of future changes to board composition, business conditions, and regulatory or other developments, have also been considered by the professional search firms and the Governance and Nominating Committee. In addition, the Board takes into account the Trustees' commitment and participation in Board and committee meetings, as well as their leadership of standing and ad hoc committees throughout their tenure.
In determining that a particular Trustee was and continues to be qualified to serve as a Trustee, the Board has considered a variety of criteria, none of which, in isolation, was controlling. The Board believes that, collectively, the Trustees have balanced and diverse experience, qualifications, attributes, and skills, which allow the Board to operate effectively in governing each fund and protecting the interests of shareholders. Information about the specific experience, skills, attributes, and qualifications of each Trustee, which in each case led to the Board's conclusion that the Trustee should serve (or continue to serve) as a trustee of the funds, is provided below.
Board Structure and Oversight Function. Robert A. Lawrence is an interested person and currently serves as Chair. The Trustees have determined that an interested Chair is appropriate and benefits shareholders because an interested Chair has a personal and professional stake in the quality and continuity of services provided to the funds. Independent Trustees exercise their informed business judgment to appoint an individual of their choosing to serve as Chair, regardless of whether the Trustee happens to be independent or a member of management. The Independent Trustees have determined that they can act independently and effectively without having an Independent Trustee serve as Chair and that a key structural component for assuring that they are in a position to do so is for the Independent Trustees to constitute a substantial majority for the Board. The Independent Trustees also regularly meet in executive session. David M. Thomas serves as Lead Independent Trustee and as such (i) acts as a liaison between the Independent Trustees and management with respect to matters important to the Independent Trustees and (ii) with management prepares agendas for Board meetings.
Fidelity ® funds are overseen by different Boards of Trustees. The funds' Board oversees Fidelity's high income and certain equity funds, and other Boards oversee Fidelity's alternative investment, investment-grade bond, money market, asset allocation, and other equity funds. The asset allocation funds may invest in Fidelity ® funds overseen by the funds' Board. The use of separate Boards, each with its own committee structure, allows the Trustees of each group of Fidelity ® funds to focus on the unique issues of the funds they oversee, including common research, investment, and operational issues. On occasion, the separate Boards establish joint committees to address issues of overlapping consequences for the Fidelity ® funds overseen by each Board.
The Trustees operate using a system of committees to facilitate the timely and efficient consideration of all matters of importance to the Trustees, each fund, and fund shareholders and to facilitate compliance with legal and regulatory requirements and oversight of the funds' activities and associated risks. The Board, acting through its committees, has charged FMR and its affiliates with (i) identifying events or circumstances the occurrence of which could have demonstrably adverse effects on the funds' business and/or reputation; (ii) implementing processes and controls to lessen the possibility that such events or circumstances occur or to mitigate the effects of such events or circumstances if they do occur; and (iii) creating and maintaining a system designed to evaluate continuously business and market conditions in order to facilitate the identification and implementation processes described in (i) and (ii) above. Because the day-to-day operations and activities of the funds are carried out by or through FMR, its affiliates, and other service providers, the funds' exposure to risks is mitigated but not eliminated by the processes overseen by the Trustees. While each of the Board's committees has responsibility for overseeing different aspects of the funds' activities, oversight is exercised primarily through the Operations, Audit, and Compliance Committees. Appropriate personnel, including but not limited to the funds' Chief Compliance Officer (CCO), FMR's internal auditor, the independent accountants, the funds' Treasurer and portfolio management personnel, make periodic reports to the Board's committees, as appropriate, including an annual review of Fidelity's risk management program for the Fidelity ® funds. The responsibilities of each standing committee, including their oversight responsibilities, are described further under "Standing Committees of the Trustees."
Interested Trustees*:
Correspondence intended for a Trustee who is an interested person may be sent to Fidelity Investments, 245 Summer Street, Boston, Massachusetts 02210.
Name, Year of Birth; Principal Occupations and Other Relevant Experience+
Bettina Doulton (1964)
Year of Election or Appointment: 2020
Trustee
Ms. Doulton also serves as Trustee of other Fidelity ® funds. Prior to her retirement, Ms. Doulton served in a variety of positions at Fidelity Investments, including as a managing director of research (2006-2007), portfolio manager to certain Fidelity ® funds (1993-2005), equity analyst and portfolio assistant (1990-1993), and research assistant (1987-1990). Ms. Doulton currently owns and operates Phi Builders + Architects and Cellardoor Winery. Previously, Ms. Doulton served as a member of the Board of Brown Capital Management, LLC (2014-2018).
Robert A. Lawrence (1952)
Year of Election or Appointment: 2020
Trustee
Chair of the Board of Trustees
Mr. Lawrence also serves as Trustee of other funds. Previously, Mr. Lawrence served as a Trustee and Member of the Advisory Board of certain funds. Prior to his retirement in 2008, Mr. Lawrence served as Vice President of certain Fidelity ® funds (2006-2008), Senior Vice President, Head of High Income Division of Fidelity Management & Research Company (investment adviser firm, 2006-2008), and President of Fidelity Strategic Investments (investment adviser firm, 2002-2005).
* Determined to be an "Interested Trustee" by virtue of, among other things, his or her affiliation with the trust or various entities under common control with FMR.
+ The information includes the Trustee's principal occupation during the last five years and other information relating to the experience, attributes, and skills relevant to the Trustee's qualifications to serve as a Trustee, which led to the conclusion that the Trustee should serve as a Trustee for each fund.
Independent Trustees:
Correspondence intended for an Independent Trustee may be sent to Fidelity Investments, P.O. Box 55235, Boston, Massachusetts 02205-5235.
Name, Year of Birth; Principal Occupations and Other Relevant Experience+
Thomas P. Bostick (1956)
Year of Election or Appointment: 2021
Trustee
Lieutenant General Bostick also serves as Trustee of other Fidelity ® funds. Prior to his retirement, General Bostick (United States Army, Retired) held a variety of positions within the U.S. Army, including Commanding General and Chief of Engineers, U.S. Army Corps of Engineers (2012-2016) and Deputy Chief of Staff and Director of Human Resources, U.S. Army (2009-2012). General Bostick currently serves as a member of the Board and Finance and Governance & Sustainability Committees of CSX Corporation (transportation, 2020-present) and a member of the Board and Corporate Governance and Nominating Committee of Perma-Fix Environmental Services, Inc. (nuclear waste management, 2020-present). General Bostick serves as Chief Executive Officer of Bostick Global Strategies, LLC (consulting, 2016-present), as a member of the Board of HireVue, Inc. (video interview and assessment, 2020-present), as a member of the Board of Allonnia (biotechnology and engineering solutions, 2022-present) and on the Advisory Board of Solugen, Inc. (specialty bio-based chemicals manufacturer, 2022-present). Previously, General Bostick served as a Member of the Advisory Board of certain Fidelity ® funds (2021), President, Intrexon Bioengineering (2018-2020) and Chief Operating Officer (2017-2020) and Senior Vice President of the Environment Sector (2016-2017) of Intrexon Corporation (biopharmaceutical company).
Dennis J. Dirks (1948)
Year of Election or Appointment: 2018
Trustee
Mr. Dirks also serves as Trustee of other Fidelity ® funds. Prior to his retirement in May 2003, Mr. Dirks served as Chief Operating Officer and as a member of the Board of The Depository Trust & Clearing Corporation (financial markets infrastructure), President, Chief Operating Officer and a member of the Board of The Depository Trust Company (DTC), President and a member of the Board of the National Securities Clearing Corporation (NSCC), Chief Executive Officer and a member of the Board of the Government Securities Clearing Corporation and Chief Executive Officer and a member of the Board of the Mortgage-Backed Securities Clearing Corporation. Mr. Dirks currently serves as a member of the Finance Committee (2016-present) and Board (2017-present) and is Treasurer (2018-present) of the Asolo Repertory Theatre.
Donald F. Donahue (1950)
Year of Election or Appointment: 2018
Trustee
Mr. Donahue also serves as Trustee of other Fidelity ® funds. Mr. Donahue serves as President and Chief Executive Officer of Miranda Partners, LLC (risk consulting for the financial services industry, 2012-present). Previously, Mr. Donahue served as Chief Executive Officer (2006-2012), Chief Operating Officer (2003-2006) and Managing Director, Customer Marketing and Development (1999-2003) of The Depository Trust & Clearing Corporation (financial markets infrastructure). Mr. Donahue currently serves as a member (2007-present) and Co-Chairman (2016-present) of the Board of United Way of New York. Mr. Donahue previously served as a member of the Advisory Board of certain Fidelity ® funds (2015-2018) and as a member of the Board of The Leadership Academy (previously NYC Leadership Academy) (2012-2022).
Vicki L. Fuller (1957)
Year of Election or Appointment: 2020
Trustee
Ms. Fuller also serves as Trustee of other Fidelity ® funds. Previously, Ms. Fuller served as a member of the Advisory Board of certain Fidelity ® funds (2018-2020), Chief Investment Officer of the New York State Common Retirement Fund (2012-2018) and held a variety of positions at AllianceBernstein L.P. (global asset management, 1985-2012), including Managing Director (2006-2012) and Senior Vice President and Senior Portfolio Manager (2001-2006). Ms. Fuller currently serves as a member of the Board, Audit Committee and Nominating and Governance Committee of two Blackstone business development companies (2020-present), as a member of the Board of Treliant, LLC (consulting, 2019-present), as a member of the Board of Ariel Alternatives, LLC (private equity, 2022-present) and as a member of the Board and Chair of the Audit Committee of Gusto, Inc. (software, 2021-present). In addition, Ms. Fuller currently serves as a member of the Board of Roosevelt University (2019-present) and as a member of the Executive Board of New York University's Stern School of Business. Ms. Fuller previously served as a member of the Board, Audit Committee and Nominating and Governance Committee of The Williams Companies, Inc. (natural gas infrastructure, 2018-2021).
Patricia L. Kampling (1959)
Year of Election or Appointment: 2020
Trustee
Ms. Kampling also serves as Trustee of other Fidelity ® funds. Prior to her retirement, Ms. Kampling served as Chairman of the Board and Chief Executive Officer (2012-2019), President and Chief Operating Officer (2011-2012) and Executive Vice President and Chief Financial Officer (2010-2011) of Alliant Energy Corporation. Ms. Kampling currently serves as a member of the Board, Finance Committee and Governance, Compensation and Nominating Committee of Xcel Energy Inc. (utilities company, 2020-present) and as a member of the Board, Audit, Finance and Risk Committee and Safety, Environmental, Technology and Operations Committee and Chair of the Executive Development and Compensation Committee of American Water Works Company, Inc. (utilities company, 2019-present). In addition, Ms. Kampling currently serves as a member of the Board of the Nature Conservancy, Wisconsin Chapter (2019-present). Previously, Ms. Kampling served as a Member of the Advisory Board of certain Fidelity® funds (2020), a member of the Board, Compensation Committee and Executive Committee and Chair of the Audit Committee of Briggs & Stratton Corporation (manufacturing, 2011-2021), a member of the Board of Interstate Power and Light Company (2012-2019) and Wisconsin Power and Light Company (2012-2019) (each a subsidiary of Alliant Energy Corporation) and as a member of the Board and Workforce Development Committee of the Business Roundtable (2018-2019).
Thomas A. Kennedy (1955)
Year of Election or Appointment: 2021
Trustee
Mr. Kennedy also serves as Trustee of other Fidelity ® funds. Previously, Mr. Kennedy served as a Member of the Advisory Board of certain Fidelity ® funds (2020) and held a variety of positions at Raytheon Company (aerospace and defense, 1983-2020), including Chairman and Chief Executive Officer (2014-2020) and Executive Vice President and Chief Operating Officer (2013-2014). Mr. Kennedy served as Executive Chairman of the Board of Directors of Raytheon Technologies Corporation (aerospace and defense, 2020-2021). Mr. Kennedy serves as a Director of the Board of Directors of Textron Inc. (aerospace and defense, 2023-present).
Oscar Munoz (1959)
Year of Election or Appointment: 2021
Trustee
Mr. Munoz also serves as Trustee of other Fidelity ® funds. Prior to his retirement, Mr. Munoz served as Executive Chairman (2020-2021), Chief Executive Officer (2015-2020), President (2015-2016) and a member of the Board (2010-2021) of United Airlines Holdings, Inc. Mr. Munoz currently serves as a member of the Board of CBRE Group, Inc. (commercial real estate, 2020-present), a member of the Board of Univision Communications, Inc. (Hispanic media, 2020-present), a member of the Board of Archer Aviation Inc. (2021-present), a member of the Defense Business Board of the United States Department of Defense (2021-present) and a member of the Board of Salesforce.com, Inc. (cloud-based software, 2022-present). Previously, Mr. Munoz served as a Member of the Advisory Board of certain Fidelity ® funds (2021).
David M. Thomas (1949)
Year of Election or Appointment: 2018
Trustee
Lead Independent Trustee
Mr. Thomas also serves as Trustee of other Fidelity ® funds. Previously, Mr. Thomas served as Executive Chairman (2005-2006) and Chairman and Chief Executive Officer (2000-2005) of IMS Health, Inc. (pharmaceutical and healthcare information solutions). Mr. Thomas currently serves as a member of the Board of Fortune Brands Home and Security (home and security products, 2004-present) and as Director (2013-present) and Non-Executive Chairman of the Board (2022-present) of Interpublic Group of Companies, Inc. (marketing communication).
Susan Tomasky (1953)
Year of Election or Appointment: 2020
Trustee
Ms. Tomasky also serves as Trustee of other Fidelity ® funds. Prior to her retirement, Ms. Tomasky served in various executive officer positions at American Electric Power Company, Inc. (1998-2011), including most recently as President of AEP Transmission (2007-2011). Ms. Tomasky currently serves as a member of the Board and Sustainability Committee and as Chair of the Audit Committee of Marathon Petroleum Corporation (2018-present) and as a member of the Board, Executive Committee, Corporate Governance Committee and Organization and Compensation Committee and as Lead Director of the Board of Public Service Enterprise Group, Inc. (utilities company, 2012-present) and as a member of the Board of its subsidiary company, Public Service Electric and Gas Co. (2021-present). In addition, Ms. Tomasky currently serves as a member (2009-present) and President (2020-present) of the Board of the Royal Shakespeare Company - America (2009-present), as a member of the Board of the Columbus Association for the Performing Arts (2011-present) and as a member of the Board and Kenyon in the World Committee of Kenyon College (2016-present). Previously, Ms. Tomasky served as a Member of the Advisory Board of certain Fidelity ® funds (2020), as a member of the Board of the Columbus Regional Airport Authority (2007-2020), as a member of the Board (2011-2018) and Lead Independent Director (2015-2018) of Andeavor Corporation (previously Tesoro Corporation) (independent oil refiner and marketer) and as a member of the Board of Summit Midstream Partners LP (energy, 2012-2018).
Michael E. Wiley (1950)
Year of Election or Appointment: 2008
Trustee
Mr. Wiley also serves as Trustee of other Fidelity ® funds. Previously, Mr. Wiley served as a member of the Advisory Board of certain Fidelity ® funds (2018-2020), Chairman, President and CEO of Baker Hughes, Inc. (oilfield services, 2000-2004). Mr. Wiley also previously served as a member of the Board of Andeavor Corporation (independent oil refiner and marketer, 2005-2018), a member of the Board of Andeavor Logistics LP (natural resources logistics, 2015-2018) and a member of the Board of High Point Resources (exploration and production, 2005-2020).
+ The information includes the Trustee's principal occupation during the last five years and other information relating to the experience, attributes, and skills relevant to the Trustee's qualifications to serve as a Trustee, which led to the conclusion that the Trustee should serve as a Trustee for each fund.
Advisory Board Members and Officers:
Correspondence intended for a Member of the Advisory Board (if any) may be sent to Fidelity Investments, P.O. Box 55235, Boston, Massachusetts 02205-5235. Correspondence intended for an officer or Peter S. Lynch may be sent to Fidelity Investments, 245 Summer Street, Boston, Massachusetts 02210. Officers appear below in alphabetical order.
Name, Year of Birth; Principal Occupation
Peter S. Lynch (1944)
Year of Election or Appointment: 2018
Member of the Advisory Board
Mr. Lynch also serves as a Member of the Advisory Board of other Fidelity ® funds. Mr. Lynch is Vice Chairman and a Director of Fidelity Management & Research Company LLC (investment adviser firm). In addition, Mr. Lynch serves as a Trustee of Boston College and as the Chairman of the Inner-City Scholarship Fund. Previously, Mr. Lynch served as Vice Chairman and a Director of FMR Co., Inc. (investment adviser firm) and on the Special Olympics International Board of Directors (1997-2006).
Heather Bonner (1977)
Year of Election or Appointment: 2023
Assistant Treasurer
Ms. Bonner also serves as an officer of other funds. Ms. Bonner serves as Senior Vice President (2022-present), and is an employee of Fidelity Investments. Ms. Bonner serves as Assistant Treasurer of Fidelity CRET Trustee LLC (2022-present). Prior to joining Fidelity, Ms. Bonner served as Managing Director at AQR Capital Management (2013-2022) and was the Treasurer and Principal Financial Officer of the AQR Funds (2013-2022).
Craig S. Brown (1977)
Year of Election or Appointment: 2022
Deputy Treasurer
Mr. Brown also serves as an officer of other funds. Mr. Brown serves as Assistant Treasurer of FIMM, LLC (2021-present) and is an employee of Fidelity Investments (2013-present). Previously, Mr. Brown served as Assistant Treasurer of certain Fidelity ® funds (2019-2022).
John J. Burke III (1964)
Year of Election or Appointment: 2018
Chief Financial Officer
Mr. Burke also serves as Chief Financial Officer of other funds. Mr. Burke serves as Head of Investment Operations for Fidelity Fund and Investment Operations (2018-present) and is an employee of Fidelity Investments (1998-present). Previously Mr. Burke served as head of Asset Management Investment Operations (2012-2018).
Margaret Carey (1973)
Year of Election or Appointment: 2023
Secretary and Chief Legal Officer (CLO)
Ms. Carey also serves as an officer of other funds and as CLO of certain other Fidelity entities. She is a Senior Vice President and Deputy General Counsel of FMR LLC (diversified financial services company, 2019-present), and is an employee of Fidelity Investments.
William C. Coffey (1969)
Year of Election or Appointment: 2019
Assistant Secretary
Mr. Coffey also serves as Assistant Secretary of other funds. He is Senior Vice President and Deputy General Counsel of FMR LLC (diversified financial services company, 2010-present), and is an employee of Fidelity Investments. Previously, Mr. Coffey served as Secretary and CLO of certain funds (2018-2019); CLO, Secretary, and Senior Vice President of Fidelity Management & Research Company and FMR Co., Inc. (investment adviser firms, 2018-2019); Secretary of Fidelity SelectCo, LLC and Fidelity Investments Money Management, Inc. (investment adviser firms, 2018-2019); CLO of Fidelity Management & Research (Hong Kong) Limited, FMR Investment Management (UK) Limited, and Fidelity Management & Research (Japan) Limited (investment adviser firms, 2018-2019); and Assistant Secretary of certain funds (2009-2018).
Timothy M. Cohen (1969)
Year of Election or Appointment: 2018
Vice President
Mr. Cohen also serves as Vice President of other funds. Mr. Cohen serves as Co-Head of Equity (2018-present), a Director of Fidelity Management & Research (Japan) Limited (investment adviser firm, 2016-present), and is an employee of Fidelity Investments. Previously, Mr. Cohen served as Executive Vice President of Fidelity SelectCo, LLC (2019), Head of Global Equity Research (2016-2018), Chief Investment Officer - Equity and a Director of Fidelity Management & Research (U.K.) Inc. (investment adviser firm, 2013-2015) and as a Director of Fidelity Management & Research (Hong Kong) Limited (investment adviser firm, 2017).
Jonathan Davis (1968)
Year of Election or Appointment: 2010
Assistant Treasurer
Mr. Davis also serves as an officer of other funds. Mr. Davis serves as Assistant Treasurer of FIMM, LLC (2021-present), FMR Capital, Inc. (2017-present), FD Funds GP LLC (2021-present), FD Funds Holding LLC (2021-present), and FD Funds Management LLC (2021-present); and is an employee of Fidelity Investments. Previously, Mr. Davis served as Vice President and Associate General Counsel of FMR LLC (diversified financial services company, 2003-2010).
Laura M. Del Prato (1964)
Year of Election or Appointment: 2018
Assistant Treasurer
Ms. Del Prato also serves as an officer of other funds. Ms. Del Prato serves as Assistant Treasurer of FIMM, LLC (2021-present) and is an employee of Fidelity Investments (2017-present). Previously, Ms. Del Prato served as President and Treasurer of The North Carolina Capital Management Trust: Cash Portfolio and Term Portfolio (2018-2020). Prior to joining Fidelity Investments, Ms. Del Prato served as a Managing Director and Treasurer of the JPMorgan Mutual Funds (2014-2017). Prior to JPMorgan, Ms. Del Prato served as a partner at Cohen Fund Audit Services (accounting firm, 2012-2013) and KPMG LLP (accounting firm, 2004-2012).
Colm A. Hogan (1973)
Year of Election or Appointment: 2020
Assistant Treasurer
Mr. Hogan also serves as an officer of other funds. Mr. Hogan serves as Assistant Treasurer of FIMM, LLC (2021-present) and FMR Capital, Inc. (2017-present) and is an employee of Fidelity Investments (2005-present). Previously, Mr. Hogan served as Deputy Treasurer of certain Fidelity ® funds (2016-2020) and Assistant Treasurer of certain Fidelity ® funds (2016-2018).
Pamela R. Holding (1964)
Year of Election or Appointment: 2018
Vice President
Ms. Holding also serves as Vice President of other funds. Ms. Holding serves as Co-Head of Equity (2018-present) and is an employee of Fidelity Investments (2013-present). Previously, Ms. Holding served as Executive Vice President of Fidelity SelectCo, LLC (2019) and as Chief Investment Officer of Fidelity Institutional Asset Management (2013-2018).
Chris Maher (1972)
Year of Election or Appointment: 2020
Deputy Treasurer
Mr. Maher also serves as an officer of other funds. Mr. Maher serves as Assistant Treasurer of FIMM, LLC (2021-present) and FMR Capital, Inc. (2017-present), and is an employee of Fidelity Investments (2008-present). Previously, Mr. Maher served as Assistant Treasurer of certain funds (2013-2020); Vice President of Asset Management Compliance (2013), Vice President of the Program Management Group of FMR (investment adviser firm, 2010-2013), and Vice President of Valuation Oversight (2008-2010).
Jason P. Pogorelec (1975)
Year of Election or Appointment: 2020
Chief Compliance Officer
Mr. Pogorelec also serves as Chief Compliance Officer of other funds. Mr. Pogorelec is a Senior Vice President of Asset Management Compliance for Fidelity Investments and is an employee of Fidelity Investments. Mr. Pogorelec serves as Compliance Officer of Fidelity Management & Research Company LLC (investment adviser firm, 2023-present). Previously, Mr. Pogorelec served as Vice President, Associate General Counsel for Fidelity Investments (2010-2020) and Assistant Secretary of certain Fidelity ® funds (2015-2020).
Brett Segaloff (1972)
Year of Election or Appointment: 2021
Anti-Money Laundering (AML) Officer
Mr. Segaloff also serves as an AML Officer of other funds and other related entities. He is Director, Anti-Money Laundering (2007-present) of FMR LLC (diversified financial services company) and is an employee of Fidelity Investments (1996-present).
Stacie M. Smith (1974)
Year of Election or Appointment: 2018
President and Treasurer
Ms. Smith also serves as an officer of other funds. Ms. Smith serves as Assistant Treasurer of FIMM, LLC (2021-present) and FMR Capital, Inc. (2017-present), is an employee of Fidelity Investments (2009-present), and has served in other fund officer roles. Prior to joining Fidelity Investments, Ms. Smith served as Senior Audit Manager of Ernst & Young LLP (accounting firm, 1996-2009). Previously, Ms. Smith served as Assistant Treasurer (2013-2019) and Deputy Treasurer (2013-2016) of certain Fidelity ® funds.
Jim Wegmann (1979)
Year of Election or Appointment: 2019
Assistant Treasurer
Mr. Wegmann also serves as an officer of other funds. Mr. Wegmann serves as Assistant Treasurer of FIMM, LLC (2021-present) and is an employee of Fidelity Investments (2011-present). Previously, Mr. Wegmann served as Assistant Treasurer of certain Fidelity ® funds (2019-2021).
As a shareholder, you incur two types of costs: (1) transaction costs, which may include sales charges (loads) on purchase payments or redemption proceeds, as applicable and (2) ongoing costs, which generally include management fees, distribution and/or service (12b-1) fees and other Fund expenses. This Example is intended to help you understand your ongoing costs (in dollars) of investing in a fund and to compare these costs with the ongoing costs of investing in other mutual funds.
| The Example is based on an investment of $1,000 invested at the beginning of the period and held for the entire period (September 1, 2022 to February 28, 2023). |
Actual Expenses
The first line of the accompanying table provides information about actual account values and actual expenses. You may use the information in this line, together with the amount you invested, to estimate the expenses that you paid over the period. Simply divide your account value by $1,000.00 (for example, an $8,600 account value divided by $1,000.00 = 8.6), then multiply the result by the number in the first line for a class/Fund under the heading entitled "Expenses Paid During Period" to estimate the expenses you paid on your account during this period. If any fund is a shareholder of any underlying mutual funds or exchange-traded funds (ETFs) (the Underlying Funds), such fund indirectly bears its proportional share of the expenses of the Underlying Funds in addition to the direct expenses incurred presented in the table. These fees and expenses are not included in the annualized expense ratio used to calculate the expense estimate in the table below.
Hypothetical Example for Comparison Purposes
The second line of the accompanying table provides information about hypothetical account values and hypothetical expenses based on the actual expense ratio and an assumed rate of return of 5% per year before expenses, which is not the actual return. The hypothetical account values and expenses may not be used to estimate the actual ending account balance or expenses you paid for the period. You may use this information to compare the ongoing costs of investing in the Fund and other funds. To do so, compare this 5% hypothetical example with the 5% hypothetical examples that appear in the shareholder reports of the other funds. If any fund is a shareholder of any Underlying Funds, such fund indirectly bears its proportional share of the expenses of the Underlying Funds in addition to the direct expenses as presented in the table. These fees and expenses are not included in the annualized expense ratio used to calculate the expense estimate in the table below.
Please note that the expenses shown in the table are meant to highlight your ongoing costs only and do not reflect any transaction costs. Therefore, the second line of the table is useful in comparing ongoing costs only, and will not help you determine the relative total costs of owning different funds. In addition, if these transactional costs were included, your costs would have been higher.
| | | | | Annualized Expense Ratio- A | | Beginning Account Value September 1, 2022 | | Ending Account Value February 28, 2023 | | Expenses Paid During Period- C September 1, 2022 to February 28, 2023 |
| | | | | | | | | | |
| Banking Portfolio | | | | .75% | | | | | | |
| Actual | | | | | | $ 1,000 | | $ 1,048.80 | | $ 3.81 |
Hypothetical- B | | | | | | $ 1,000 | | $ 1,021.08 | | $ 3.76 |
| | | | | | | | | | |
| Brokerage and Investment Management Portfolio | | | | .75% | | | | | | |
| Actual | | | | | | $ 1,000 | | $ 1,096.10 | | $ 3.90 |
Hypothetical- B | | | | | | $ 1,000 | | $ 1,021.08 | | $ 3.76 |
| | | | | | | | | | |
| Financial Services Portfolio | | | | .74% | | | | | | |
| Actual | | | | | | $ 1,000 | | $ 1,093.40 | | $ 3.84 |
Hypothetical- B | | | | | | $ 1,000 | | $ 1,021.12 | | $ 3.71 |
| | | | | | | | | | |
| FinTech Portfolio | | | | .88% | | | | | | |
| Actual | | | | | | $ 1,000 | | $ 1,001.50 | | $ 4.37 |
Hypothetical- B | | | | | | $ 1,000 | | $ 1,020.43 | | $ 4.41 |
| | | | | | | | | | |
| Insurance Portfolio | | | | .81% | | | | | | |
| Actual | | | | | | $ 1,000 | | $ 1,133.40 | | $ 4.28 |
Hypothetical- B | | | | | | $ 1,000 | | $ 1,020.78 | | $ 4.06 |
| |
A Annualized expense ratio reflects expenses net of applicable fee waivers.
B 5% return per year before expenses
C Expenses are equal to the annualized expense ratio, multiplied by the average account value over the period, multiplied by 181/ 365 (to reflect the one-half year period). The fees and expenses of any Underlying Funds are not included in each annualized expense ratio.
The dividend and capital gains distributions for the fund(s) are available on Fidelity.com or Institutional.Fidelity.com.
The funds hereby designate as capital gain dividend the amounts noted below for the taxable year ended February 28, 2023, or, if subsequently determined to be different, the net capital gain of such year.
| Banking Portfolio | $21,316,509 |
| Financial Services Portfolio | $37,414,936 |
| Insurance Portfolio | $16,255,082 |
A percentage of the dividends distributed during the fiscal year for the following funds qualify for the dividends-received deduction for corporate shareholders:
| Banking Portfolio | |
| April 2022 | 100% |
| December 2022 | 100% |
| Brokerage and Investment Management Portfolio | |
| April 2022 | 100% |
| December 2022 | 100% |
| Financial Services Portfolio | |
| April 2022 | 100% |
| December 2022 | 100% |
| FinTech Portfolio | |
| April 2022 | - |
| December 2022 | - |
| Insurance Portfolio | |
| April 2022 | - |
| December 2022 | 100% |
A percentage of the dividends distributed during the fiscal year for the following funds may be taken into account as a dividend for purposes of the maximum rate under section 1(h)(11) of the Internal Revenue Code.
| Banking Portfolio | |
| April 2022 | 100% |
| December 2022 | 100% |
| Brokerage and Investment Management Portfolio | |
| April 2022 | 100% |
| December 2022 | 100% |
| Financial Services Portfolio | |
| April 2022 | 100% |
| December 2022 | 100% |
| FinTech Portfolio | |
| April 2022 | - |
| December 2022 | - |
| Insurance Portfolio | |
April 2022 December 2022 | - 100% |
| | |
The funds hereby designate the percentages noted below of the short-term capital gain dividends distributed during the fiscal year as qualifying to be taxed as short-term capital gain dividends for nonresident alien shareholders:
| | April, 2022 | December, 2022 |
| Banking Portfolio | - | - |
| Brokerage and Investment Management Portfolio | 100% | - |
| Financial Services Portfolio | - | - |
| FinTech Portfolio | - | - |
| Insurance Portfolio | - | - |
The funds will notify shareholders in January 2024 of amounts for use in preparing 2023 income tax returns.
The Securities and Exchange Commission adopted Rule 22e-4 under the Investment Company Act of 1940 (the Liquidity Rule) to promote effective liquidity risk management throughout the open-end investment company industry, thereby reducing the risk that funds will be unable to meet their redemption obligations and mitigating dilution of the interests of fund shareholders.
The Funds have adopted and implemented a liquidity risk management program (the Program) reasonably designed to assess and manage each Fund's liquidity risk and to comply with the requirements of the Liquidity Rule. Each Fund's Board of Trustees (the Board) has designated each Fund's investment adviser as administrator of the Program. The Fidelity advisers have established a Liquidity Risk Management Committee (the LRM Committee) to manage the Program for each of the Fidelity Funds. The LRM Committee monitors the adequacy and effectiveness of implementation of the Program and on a periodic basis assesses each Fund's liquidity risk based on a variety of factors including (1) the Fund's investment strategy, (2) portfolio liquidity and cash flow projections during normal and reasonably foreseeable stressed conditions, (3) shareholder redemptions, (4) borrowings and other funding sources and (5) certain factor specific to ETFs including the effect of the Fund's prices and spreads, market participants, and basket compositions on the overall liquidity of the Fund's portfolio, as applicable.
In accordance with the Program, each of the Fund's portfolio investments is classified into one of four defined liquidity categories based on a determination of a reasonable expectation for how long it would take to convert the investment to cash (or sell or dispose of the investment) without significantly changing its market value.
- Highly liquid investments - cash or convertible to cash within three business days or less
- Moderately liquid investments - convertible to cash in three to seven calendar days
- Less liquid investments - can be sold or disposed of, but not settled, within seven calendar days
- Illiquid investments - cannot be sold or disposed of within seven calendar days
Liquidity classification determinations take into account a variety of factors including various market, trading and investment-specific considerations, as well as market depth, and generally utilize analysis from a third-party liquidity metrics service.
The Liquidity Rule places a 15% limit on a fund's illiquid investments and requires funds that do not primarily hold assets that are highly liquid investments to determine and maintain a minimum percentage of the fund's net assets to be invested in highly liquid investments (highly liquid investment minimum or HLIM). The Program includes provisions reasonably designed to comply with the 15% limit on illiquid investments and for determining, periodically reviewing and complying with the HLIM requirement as applicable.
At a recent meeting of the Fund's Board of Trustees, the LRM Committee provided a written report to the Board pertaining to the operation, adequacy, and effectiveness of the Program for the period December 1, 2021 through November 30, 2022. The report concluded that the Program is operating effectively and is reasonably designed to assess and manage the Fund's liquidity risk.
1.813663.118
SELFIN-ANN-0423
Fidelity® Select Portfolios®
Energy Sector
Energy Portfolio
Annual Report
February 28, 2023
Contents
To view a fund's proxy voting guidelines and proxy voting record for the 12-month period ended June 30, visit http://www.fidelity.com/proxyvotingresults or visit the Securities and Exchange Commission's (SEC) web site at http://www.sec.gov.
You may also call 1-800-544-8544 to request a free copy of the proxy voting guidelines.
Standard & Poor's, S&P and S&P 500 are registered service marks of The McGraw-Hill Companies, Inc. and have been licensed for use by Fidelity Distributors Corporation.
Other third-party marks appearing herein are the property of their respective owners.
All other marks appearing herein are registered or unregistered trademarks or service marks of FMR LLC or an affiliated company. © 2023 FMR LLC. All rights reserved.
This report and the financial statements contained herein are submitted for the general information of the shareholders of the Fund. This report is not authorized for distribution to prospective investors in the Fund unless preceded or accompanied by an effective prospectus.
A fund files its complete schedule of portfolio holdings with the SEC for the first and third quarters of each fiscal year on Form N-PORT. Forms N-PORT are available on the SEC's web site at http://www.sec.gov. A fund's Forms N-PORT may be reviewed and copied at the SEC's Public Reference Room in Washington, DC. Information regarding the operation of the SEC's Public Reference Room may be obtained by calling 1-800-SEC-0330.
For a complete list of a fund's portfolio holdings, view the most recent holdings listing, semiannual report, or annual report on Fidelity's web site at http://www.fidelity.com, http://www.institutional.fidelity.com, or http://www.401k.com, as applicable.
NOT FDIC INSURED •MAY LOSE VALUE •NO BANK GUARANTEE
Neither the Fund nor Fidelity Distributors Corporation is a bank.
Average annual total return reflects the change in the value of an investment, assuming reinvestment of distributions from dividend income and capital gains (the profits earned upon the sale of securities that have grown in value, if any) and assuming a constant rate of performance each year. The hypothetical investment and the average annual total returns do not reflect the deduction of taxes that a shareholder would pay on fund distributions or the redemption of fund shares. During periods of reimbursement by Fidelity, a fund's total return will be greater than it would be had the reimbursement not occurred. How a fund did yesterday is no guarantee of how it will do tomorrow.
| Average Annual Total Returns |
| | | | |
Periods ended February 28, 2023 | Past 1 year | Past 5 years | Past 10 years |
| Energy Portfolio | 24.63% | 8.51% | 3.70% |
| $10,000 Over 10 Years |
| |
Let's say hypothetically that $10,000 was invested in Energy Portfolio on February 28, 2013. The chart shows how the value of your investment would have changed, and also shows how the S&P 500® Index performed over the same period. |
|
|
Market Recap:
U.S. equities returned -7.69% for the 12 months ending February 28, 2023, according to the S&P 500 ® index. The new year began with an encouraging upturn in January (+6.28%), but stocks lost momentum in February (-2.44%) amid higher-than-expected inflation and strong jobs data. Investors took these as signs that the economy continued to run hot, even after a year of historic policy adjustment by the Federal Reserve aimed at cooling economic growth. Record inflation in 2022 prompted the Fed to aggressively tighten monetary policy, and market interest rates eclipsed their highest level in a decade, stoking recession fears and sending stocks into bear market territory. Since March 2022, the central bank has hiked its benchmark rate eight times, by 4.5 percentage points - the fastest-ever pace of monetary tightening - while also shrinking its massive asset portfolio. The latest bump came on February 2, along with a signal that the Fed plans to lift rates in March while it considers whether and when to pause increases. Against this dynamic backdrop, stocks struggled to gain traction until a strong rally ignited heading into the summer. But in September, the index returned -9.21%, one of its worst monthly results ever, before advancing 7.56% in Q4, as risky assets regained favor. For the full 12 months, value stocks handily outpaced growth. The headwind for the latter was most pronounced in the growth-oriented communication services (-25%) and consumer discretionary (-18%) sectors. In sharp contrast, energy gained 24%.
Comments from Portfolio Manager Maurice FitzMaurice:
For the fiscal year ending February 28, 2023, the fund gained 24.63%, outperforming the 24.10% advance of the MSCI US IMI Energy 25/50 Index, as well as the broad-based S&P 500 ® index. The top contributors to performance versus the sector index were stock selection and an underweighting in oil & gas storage & transportation. Security selection in integrated oil & gas and an overweighting in oil & gas equipment & services also helped. The fund's biggest individual relative contributor was an overweighting in TechnipFMC, which gained 124% the past 12 months. We increased the position the past year. Also boosting value was an underweighting in Chevron, which gained roughly 15%. Despite an underweighting, the company was among the fund's largest holdings. Avoiding Williams Companies, an index component that gained about 1%, also helped relative performance. In contrast, the largest detractor from performance versus the sector index were stock picks in oil & gas exploration & production. Weak stock selection in oil & gas equipment & services and independent power producers & energy traders also hurt relative performance. Our non-index investment in Canadian National Resources was the fund's biggest individual relative detractor this period, due to its approximate 6% gain. This was among our largest holdings this period. Also hindering performance was untimely positioning in EQT, which gained roughly 46%. This was a stake we established during the period. Also hurting performance was our outsized stake in PDC Energy, which gained 7%. Notable changes in positioning include a higher allocation to the oil & gas equipment & services and oil & gas refining & marketing subindustries.
The views expressed above reflect those of the portfolio manager(s) only through the end of the period as stated on the cover of this report and do not necessarily represent the views of Fidelity or any other person in the Fidelity organization. Any such views are subject to change at any time based upon market or other conditions and Fidelity disclaims any responsibility to update such views. These views may not be relied on as investment advice and, because investment decisions for a Fidelity fund are based on numerous factors, may not be relied on as an indication of trading intent on behalf of any Fidelity fund.
Top Holdings (% of Fund's net assets) |
| |
| Exxon Mobil Corp. | 24.6 | |
| Chevron Corp. | 6.6 | |
| Valero Energy Corp. | 5.2 | |
| ConocoPhillips Co. | 4.6 | |
| Schlumberger Ltd. | 4.5 | |
| Halliburton Co. | 4.4 | |
| Marathon Petroleum Corp. | 4.3 | |
| Hess Corp. | 3.6 | |
| Occidental Petroleum Corp. | 3.5 | |
| Cheniere Energy, Inc. | 3.5 | |
| | 64.8 | |
| |
| Industries (% of Fund's net assets) |
| |
| Oil, Gas & Consumable Fuels | 83.8 | |
| Energy Equipment & Services | 15.7 | |
| Independent Power and Renewable Electricity Producers | 0.4 | |
| |
Geographic Diversification (% of Fund's net assets) |
|
* Includes Short-Term investments and Net Other Assets (Liabilities). Percentages are based on country or territory of incorporation and are adjusted for the effect of derivatives, if applicable. |
| |
Showing Percentage of Net Assets
| Common Stocks - 99.9% |
| | | Shares | Value ($) |
| Energy Equipment & Services - 15.7% | | | |
| Oil & Gas Drilling - 1.6% | | | |
| Nabors Industries Ltd. (a) | | 8,999 | 1,352,640 |
| Nabors Industries Ltd. warrants 6/11/26 (a) | | 36,999 | 1,032,272 |
| Noble Corp. PLC (a) | | 210,700 | 8,784,083 |
| Odfjell Drilling Ltd. (a) | | 1,535,318 | 3,969,579 |
| Shelf Drilling Ltd. (a)(b) | | 1,347,589 | 4,009,755 |
| Valaris Ltd. (a) | | 410,300 | 27,592,675 |
| | | | 46,741,004 |
| Oil & Gas Equipment & Services - 14.1% | | | |
| Cactus, Inc. | | 48,586 | 2,232,527 |
| Halliburton Co. | | 3,420,700 | 123,931,961 |
| Nextier Oilfield Solutions, Inc. (a) | | 4,239,500 | 38,706,635 |
| NOV, Inc. | | 787,200 | 17,223,936 |
| Oceaneering International, Inc. (a) | | 897,530 | 18,749,402 |
| ProPetro Holding Corp. (a) | | 1,333,701 | 11,749,906 |
| Schlumberger Ltd. | | 2,429,569 | 129,277,366 |
| TechnipFMC PLC (a) | | 3,765,172 | 57,569,480 |
| | | | 399,441,213 |
TOTAL ENERGY EQUIPMENT & SERVICES | | | 446,182,217 |
| Independent Power and Renewable Electricity Producers - 0.4% | | | |
| Independent Power Producers & Energy Traders - 0.4% | | | |
| Vistra Corp. | | 421,300 | 9,264,387 |
| Oil, Gas & Consumable Fuels - 83.8% | | | |
| Coal & Consumable Fuels - 0.3% | | | |
| Arch Resources, Inc. | | 49,000 | 7,710,150 |
| Integrated Oil & Gas - 40.2% | | | |
| Cenovus Energy, Inc.: | | | |
| warrants (a) | | 97,500 | 1,326,000 |
| (Canada) | | 4,627,106 | 85,319,155 |
| Chevron Corp. | | 1,168,303 | 187,828,073 |
| Exxon Mobil Corp. | | 6,356,746 | 698,669,955 |
| Imperial Oil Ltd. | | 484,100 | 23,944,235 |
| Occidental Petroleum Corp. | | 1,701,815 | 99,658,286 |
| Occidental Petroleum Corp. warrants 8/3/27 (a) | | 99,550 | 3,669,413 |
| Suncor Energy, Inc. (c) | | 1,203,200 | 40,438,807 |
| | | | 1,140,853,924 |
| Oil & Gas Exploration & Production - 26.9% | | | |
| Antero Resources Corp. (a) | | 1,134,300 | 29,718,660 |
| APA Corp. | | 1,012,500 | 38,859,750 |
| Callon Petroleum Co. (a) | | 108,100 | 4,189,956 |
| Canadian Natural Resources Ltd. | | 1,688,900 | 95,442,344 |
| Canadian Natural Resources Ltd. | | 25,780 | 1,456,828 |
| Chord Energy Corp. | | 74,152 | 9,982,342 |
| Civitas Resources, Inc. | | 221,054 | 15,511,359 |
| ConocoPhillips Co. | | 1,274,166 | 131,685,056 |
| Coterra Energy, Inc. (c) | | 468,098 | 11,688,407 |
| Devon Energy Corp. | | 815,800 | 43,987,936 |
| Diamondback Energy, Inc. | | 169,500 | 23,828,310 |
| EOG Resources, Inc. | | 294,464 | 33,280,321 |
| EQT Corp. | | 278,700 | 9,247,266 |
| Hess Corp. | | 764,000 | 102,910,800 |
| Magnolia Oil & Gas Corp. Class A | | 460,900 | 10,070,665 |
| National Energy Services Reunited Corp. (a) | | 1,711,418 | 11,055,760 |
| Northern Oil & Gas, Inc. | | 140,560 | 4,362,982 |
| Ovintiv, Inc. | | 729,400 | 31,196,438 |
| PDC Energy, Inc. | | 1,011,107 | 67,855,391 |
| Pioneer Natural Resources Co. | | 226,666 | 45,426,133 |
| Range Resources Corp. | | 1,318,000 | 35,506,920 |
| SM Energy Co. | | 258,900 | 7,640,139 |
| | | | 764,903,763 |
| Oil & Gas Refining & Marketing - 11.3% | | | |
| Marathon Petroleum Corp. | | 992,392 | 122,659,651 |
| Phillips 66 Co. | | 514,273 | 52,743,839 |
| Valero Energy Corp. | | 1,116,700 | 147,102,891 |
| | | | 322,506,381 |
| Oil & Gas Storage & Transport - 5.1% | | | |
| Cheniere Energy, Inc. | | 622,612 | 97,961,772 |
| Energy Transfer LP | | 2,990,200 | 37,855,932 |
| Golar LNG Ltd. (a) | | 382,733 | 8,737,794 |
| | | �� | 144,555,498 |
TOTAL OIL, GAS & CONSUMABLE FUELS | | | 2,380,529,716 |
| TOTAL COMMON STOCKS (Cost $1,717,013,668) | | | 2,835,976,320 |
| | | | |
| Money Market Funds - 1.6% |
| | | Shares | Value ($) |
| Fidelity Cash Central Fund 4.63% (d) | | 613 | 613 |
| Fidelity Securities Lending Cash Central Fund 4.63% (d)(e) | | 46,143,793 | 46,148,408 |
| TOTAL MONEY MARKET FUNDS (Cost $46,149,021) | | | 46,149,021 |
| | | | |
| TOTAL INVESTMENT IN SECURITIES - 101.5% (Cost $1,763,162,689) | 2,882,125,341 |
NET OTHER ASSETS (LIABILITIES) - (1.5)% | (41,415,579) |
| NET ASSETS - 100.0% | 2,840,709,762 |
| | |
Legend
| (b) | Security exempt from registration under Rule 144A of the Securities Act of 1933. These securities may be resold in transactions exempt from registration, normally to qualified institutional buyers. At the end of the period, the value of these securities amounted to $4,009,755 or 0.1% of net assets. |
| (c) | Security or a portion of the security is on loan at period end. |
| (d) | Affiliated fund that is generally available only to investment companies and other accounts managed by Fidelity Investments. The rate quoted is the annualized seven-day yield of the fund at period end. A complete unaudited listing of the fund's holdings as of its most recent quarter end is available upon request. In addition, each Fidelity Central Fund's financial statements, which are not covered by the Fund's Report of Independent Registered Public Accounting Firm, are available on the SEC's website or upon request. |
| (e) | Investment made with cash collateral received from securities on loan. |
Affiliated Central Funds
Fiscal year to date information regarding the Fund's investments in Fidelity Central Funds, including the ownership percentage, is presented below.
| Affiliate | Value, beginning of period ($) | Purchases ($) | Sales Proceeds ($) | Dividend Income ($) | Realized Gain (loss) ($) | Change in Unrealized appreciation (depreciation) ($) | Value, end of period ($) | % ownership, end of period |
| Fidelity Cash Central Fund 4.63% | 7,528,525 | 437,616,346 | 445,144,258 | 143,542 | - | - | 613 | 0.0% |
| Fidelity Securities Lending Cash Central Fund 4.63% | 23,406,482 | 1,096,817,177 | 1,074,075,251 | 134,767 | - | - | 46,148,408 | 0.1% |
| Total | 30,935,007 | 1,534,433,523 | 1,519,219,509 | 278,309 | - | - | 46,149,021 | |
| | | | | | | | | |
Amounts in the dividend income column in the above table include any capital gain distributions from underlying funds, which are presented in the corresponding line item in the Statement of Operations, if applicable.
Amount for Fidelity Securities Lending Cash Central Fund represents the income earned on investing cash collateral, less rebates paid to borrowers and any lending agent fees associated with the loan, plus any premium payments received for lending certain types of securities.
Amounts included in the purchases and sales proceeds columns may include in-kind transactions, if applicable.
Investment Valuation
The following is a summary of the inputs used, as of February 28, 2023, involving the Fund's assets and liabilities carried at fair value. The inputs or methodology used for valuing securities may not be an indication of the risk associated with investing in those securities. For more information on valuation inputs, and their aggregation into the levels used below, please refer to the Investment Valuation section in the accompanying Notes to Financial Statements.
| Valuation Inputs at Reporting Date: |
| Description | Total ($) | Level 1 ($) | Level 2 ($) | Level 3 ($) |
Investments in Securities: | | | | |
|
| Common Stocks | 2,835,976,320 | 2,835,976,320 | - | - |
|
| Money Market Funds | 46,149,021 | 46,149,021 | - | - |
| Total Investments in Securities: | 2,882,125,341 | 2,882,125,341 | - | - |
| Statement of Assets and Liabilities |
| | | | February 28, 2023 |
| | | | | |
| Assets | | | | |
| Investment in securities, at value (including securities loaned of $43,430,465) - See accompanying schedule: | | | | |
Unaffiliated issuers (cost $1,717,013,668) | $ | 2,835,976,320 | | |
Fidelity Central Funds (cost $46,149,021) | | 46,149,021 | | |
| | | | | |
| | | | | |
| Total Investment in Securities (cost $1,763,162,689) | | | $ | 2,882,125,341 |
| Receivable for investments sold | | | | 7,007,336 |
| Receivable for fund shares sold | | | | 1,948,241 |
| Dividends receivable | | | | 12,230,628 |
| Distributions receivable from Fidelity Central Funds | | | | 3,155 |
| Prepaid expenses | | | | 6,356 |
| Other receivables | | | | 390,326 |
Total assets | | | | 2,903,711,383 |
| Liabilities | | | | |
| Payable for fund shares redeemed | $ | 7,827,551 | | |
| Accrued management fee | | 1,307,883 | | |
| Notes payable to affiliates | | 6,854,000 | | |
| Other affiliated payables | | 488,686 | | |
| Other payables and accrued expenses | | 375,701 | | |
| Collateral on securities loaned | | 46,147,800 | | |
| Total Liabilities | | | | 63,001,621 |
| Net Assets | | | $ | 2,840,709,762 |
| Net Assets consist of: | | | | |
| Paid in capital | | | $ | 2,937,158,169 |
| Total accumulated earnings (loss) | | | | (96,448,407) |
| Net Assets | | | $ | 2,840,709,762 |
Net Asset Value , offering price and redemption price per share ($2,840,709,762 ÷ 51,706,133 shares) | | | $ | 54.94 |
| Statement of Operations |
| | | | Year ended February 28, 2023 |
| Investment Income | | | | |
| Dividends | | | $ | 100,859,156 |
| Income from Fidelity Central Funds (including $134,767 from security lending) | | | | 278,309 |
| Total Income | | | | 101,137,465 |
| Expenses | | | | |
| Management fee | $ | 15,345,560 | | |
| Transfer agent fees | | 4,730,354 | | |
| Accounting fees | | 780,816 | | |
| Custodian fees and expenses | | 41,315 | | |
| Independent trustees' fees and expenses | | 9,769 | | |
| Registration fees | | 228,445 | | |
| Audit | | 60,663 | | |
| Legal | | 2,943 | | |
| Interest | | 132,773 | | |
| Miscellaneous | | 8,769 | | |
| Total expenses before reductions | | 21,341,407 | | |
| Expense reductions | | (100,733) | | |
| Total expenses after reductions | | | | 21,240,674 |
| Net Investment income (loss) | | | | 79,896,791 |
| Realized and Unrealized Gain (Loss) | | | | |
| Net realized gain (loss) on: | | | | |
| Investment Securities: | | | | |
| Unaffiliated issuers | | 62,610,001 | | |
| Foreign currency transactions | | (59,395) | | |
| Total net realized gain (loss) | | | | 62,550,606 |
| Change in net unrealized appreciation (depreciation) on: | | | | |
| Investment Securities: | | | | |
| Unaffiliated issuers | | 379,247,000 | | |
| Assets and liabilities in foreign currencies | | (4,963) | | |
| Total change in net unrealized appreciation (depreciation) | | | | 379,242,037 |
| Net gain (loss) | | | | 441,792,643 |
| Net increase (decrease) in net assets resulting from operations | | | $ | 521,689,434 |
| Statement of Changes in Net Assets |
| |
| | Year ended February 28, 2023 | | Year ended February 28, 2022 |
| Increase (Decrease) in Net Assets | | | | |
| Operations | | | | |
| Net investment income (loss) | $ | 79,896,791 | $ | 37,737,303 |
| Net realized gain (loss) | | 62,550,606 | | (5,935,534) |
| Change in net unrealized appreciation (depreciation) | | 379,242,037 | | 661,757,391 |
| Net increase (decrease) in net assets resulting from operations | | 521,689,434 | | 693,559,160 |
| Distributions to shareholders | | (76,651,144) | | (31,460,812) |
| Share transactions | | | | |
| Proceeds from sales of shares | | 2,107,751,018 | | 1,435,953,793 |
| Net asset value of shares issued in exchange for the net assets of the Target Fund(s) (see Merger Information note) | | - | | 388,960,944 |
| Reinvestment of distributions | | 71,674,644 | | 29,620,722 |
| Cost of shares redeemed | | (2,191,394,921) | | (1,089,636,722) |
Net increase (decrease) in net assets resulting from share transactions | | (11,969,259) | | 764,898,737 |
| Total increase (decrease) in net assets | | 433,069,031 | | 1,426,997,085 |
| | | | | |
| Net Assets | | | | |
| Beginning of period | | 2,407,640,731 | | 980,643,646 |
| End of period | $ | 2,840,709,762 | $ | 2,407,640,731 |
| | | | | |
| Other Information | | | | |
| Shares | | | | |
| Sold | | 39,822,947 | | 39,603,793 |
| Issued in exchange for the shares of the Target Fund(s) (see Merger Information note) | | - | | 11,161,009 |
| Issued in reinvestment of distributions | | 1,340,218 | | 884,794 |
| Redeemed | | (42,677,565) | | (31,953,761) |
| Net increase (decrease) | | (1,514,400) | | 19,695,835 |
| | | | | |
Financial Highlights
| Years ended February 28, | | 2023 | | 2022 | | 2021 | | 2020 A | | 2019 |
Selected Per-Share Data | | | | | | | | | | |
| Net asset value, beginning of period | $ | 45.24 | $ | 29.25 | $ | 26.79 | $ | 37.50 | $ | 41.01 |
| Income from Investment Operations | | | | | | | | | | |
Net investment income (loss) B,C | | 1.46 | | .96 | | .99 D | | .71 | | .49 |
| Net realized and unrealized gain (loss) | | 9.64 | | 15.82 | | 2.27 | | (10.76) | | (3.51) |
| Total from investment operations | | 11.10 | | 16.78 | | 3.26 | | (10.05) | | (3.02) |
| Distributions from net investment income | | (1.40) | | (.79) | | (.80) | | (.64) | | (.48) |
| Distributions from net realized gain | | - | | - | | - | | (.02) | | (.01) |
| Total distributions | | (1.40) | | (.79) | | (.80) | | (.66) | | (.49) |
| Net asset value, end of period | $ | 54.94 | $ | 45.24 | $ | 29.25 | $ | 26.79 | $ | 37.50 |
Total Return E | | 24.63% | | 58.37% | | 13.03% | | (27.24)% | | (7.30)% |
Ratios to Average Net Assets C,F,G | | | | | | | | | | |
| Expenses before reductions | | .73% | | .77% | | .85% | | .81% | | .78% |
| Expenses net of fee waivers, if any | | .73% | | .77% | | .85% | | .81% | | .78% |
| Expenses net of all reductions | | .73% | | .77% | | .84% | | .80% | | .77% |
| Net investment income (loss) | | 2.75% | | 2.79% | | 4.50% D | | 2.00% | | 1.12% |
| Supplemental Data | | | | | | | | | | |
| Net assets, end of period (000 omitted) | $ | 2,840,710 | $ | 2,407,641 | $ | 980,644 | $ | 676,312 | $ | 1,152,173 |
Portfolio turnover rate H | | 43% | | 56% I | | 31% | | 79% | | 59% |
A For the year ended February 29.
B Calculated based on average shares outstanding during the period.
C Net investment income (loss) is affected by the timing of the declaration of dividends by any underlying mutual funds or exchange-traded funds (ETFs). Net investment income (loss) of any mutual funds or ETFs is not included in the Fund's net investment income (loss) ratio.
D Net investment income per share reflects one or more large, non-recurring dividend(s) which amounted to $.15 per share. Excluding such non-recurring dividend(s), the ratio of net investment income (loss) to average net assets would have been 3.82%.
E Total returns would have been lower if certain expenses had not been reduced during the applicable periods shown.
F Fees and expenses of any underlying mutual funds or exchange-traded funds (ETFs) are not included in the Fund's expense ratio. The Fund indirectly bears its proportionate share of these expenses. For additional expense information related to investments in Fidelity Central Funds, please refer to the "Investments in Fidelity Central Funds" note found in the Notes to Financial Statements section of the most recent Annual or Semi-Annual report.
G Expense ratios reflect operating expenses of the class. Expenses before reductions do not reflect amounts reimbursed, waived, or reduced through arrangements with the investment adviser, brokerage services, or other offset arrangements, if applicable, and do not represent the amount paid by the class during periods when reimbursements, waivers or reductions occur.
H Amount does not include the portfolio activity of any underlying mutual funds or exchange-traded funds (ETFs).
I The portfolio turnover rate does not include the assets acquired in the merger.
For the period ended February 28, 2023
1. Organization.
Energy Portfolio (the Fund) is a non-diversified fund of Fidelity Select Portfolios (the Trust) and is authorized to issue an unlimited number of shares. Share transactions on the Statement of Changes in Net Assets may contain exchanges between affiliated funds. The Trust is registered under the Investment Company Act of 1940, as amended (the 1940 Act), as an open-end management investment company organized as a Massachusetts business trust. The Fund invests primarily in securities of companies whose principal business activities fall within specific industries.
2. Investments in Fidelity Central Funds.
Funds may invest in Fidelity Central Funds, which are open-end investment companies generally available only to other investment companies and accounts managed by the investment adviser and its affiliates. The Schedule of Investments lists any Fidelity Central Funds held as an investment as of period end, but does not include the underlying holdings of each Fidelity Central Fund. An investing fund indirectly bears its proportionate share of the expenses of the underlying Fidelity Central Funds.
Based on its investment objective, each Fidelity Central Fund may invest or participate in various investment vehicles or strategies that are similar to those of the investing fund. These strategies are consistent with the investment objectives of the investing fund and may involve certain economic risks which may cause a decline in value of each of the Fidelity Central Funds and thus a decline in the value of the investing fund.
| Fidelity Central Fund | Investment Manager | Investment Objective | Investment Practices | Expense Ratio A |
| Fidelity Money Market Central Funds | Fidelity Management & Research Company LLC (FMR) | Each fund seeks to obtain a high level of current income consistent with the preservation of capital and liquidity. | Short-term Investments | Less than .005% |
A Expenses expressed as a percentage of average net assets and are as of each underlying Central Fund's most recent annual or semi-annual shareholder report.
A complete unaudited list of holdings for each Fidelity Central Fund is available upon request or at the Securities and Exchange Commission website at www.sec.gov. In addition, the financial statements of the Fidelity Central Funds which contain the significant accounting policies (including investment valuation policies) of those funds, and are not covered by the Report of Independent Registered Public Accounting Firm, are available on the Securities and Exchange Commission website or upon request.
3. Significant Accounting Policies.
The Fund is an investment company and applies the accounting and reporting guidance of the Financial Accounting Standards Board (FASB) Accounting Standards Codification Topic 946 Financial Services - Investment Companies . The financial statements have been prepared in conformity with accounting principles generally accepted in the United States of America (GAAP), which require management to make certain estimates and assumptions at the date of the financial statements. Actual results could differ from those estimates. Subsequent events, if any, through the date that the financial statements were issued have been evaluated in the preparation of the financial statements. The Fund's Schedule of Investments lists any underlying mutual funds or exchange-traded funds (ETFs) but does not include the underlying holdings of these funds. The following summarizes the significant accounting policies of the Fund:
Investment Valuation. Investments are valued as of 4:00 p.m. Eastern time on the last calendar day of the period. The Board of Trustees (the Board) has designated the Fund's investment adviser as the valuation designee responsible for the fair valuation function and performing fair value determinations as needed. The investment adviser has established a Fair Value Committee (the Committee) to carry out the day-to-day fair valuation responsibilities and has adopted policies and procedures to govern the fair valuation process and the activities of the Committee. In accordance with these fair valuation policies and procedures, which have been approved by the Board, the Fund attempts to obtain prices from one or more third party pricing services or brokers to value its investments. When current market prices, quotations or currency exchange rates are not readily available or reliable, investments will be fair valued in good faith by the Committee, in accordance with the policies and procedures. Factors used in determining fair value vary by investment type and may include market or investment specific events, transaction data, estimated cash flows, and market observations of comparable investments. The frequency that the fair valuation procedures are used cannot be predicted and they may be utilized to a significant extent. The Committee manages the Fund's fair valuation practices and maintains the fair valuation policies and procedures. The Fund's investment adviser reports to the Board information regarding the fair valuation process and related material matters.
The Fund categorizes the inputs to valuation techniques used to value its investments into a disclosure hierarchy consisting of three levels as shown below:
Level 1 - unadjusted quoted prices in active markets for identical investments
Level 2 - other significant observable inputs (including quoted prices for similar investments, interest rates, prepayment speeds, etc.)
Level 3 - unobservable inputs (including the Fund's own assumptions based on the best information available)
Valuation techniques used to value the Fund's investments by major category are as follows:
Equity securities, including restricted securities, for which market quotations are readily available, are valued at the last reported sale price or official closing price as reported by a third party pricing service on the primary market or exchange on which they are traded and are categorized as Level 1 in the hierarchy. In the event there were no sales during the day or closing prices are not available, securities are valued at the last quoted bid price or may be valued using the last available price and are generally categorized as Level 2 in the hierarchy. For foreign equity securities, when market or security specific events arise, comparisons to the valuation of American Depositary Receipts (ADRs), futures contracts, ETFs and certain indexes as well as quoted prices for similar securities may be used and would be categorized as Level 2 in the hierarchy. For equity securities, including restricted securities, where observable inputs are limited, assumptions about market activity and risk are used and these securities may be categorized as Level 3 in the hierarchy.
Investments in open-end mutual funds, including the Fidelity Central Funds, are valued at their closing net asset value (NAV) each business day and are categorized as Level 1 in the hierarchy.
Changes in valuation techniques may result in transfers in or out of an assigned level within the disclosure hierarchy. The aggregate value of investments by input level as of February 28, 2023 is included at the end of the Fund's Schedule of Investments.
Foreign Currency. Certain Funds may use foreign currency contracts to facilitate transactions in foreign-denominated securities. Gains and losses from these transactions may arise from changes in the value of the foreign currency or if the counterparties do not perform under the contracts' terms.
Foreign-denominated assets, including investment securities, and liabilities are translated into U.S. dollars at the exchange rates at period end. Purchases and sales of investment securities, income and dividends received, and expenses denominated in foreign currencies are translated into U.S. dollars at the exchange rate in effect on the transaction date.
The effects of exchange rate fluctuations on investments are included with the net realized and unrealized gain (loss) on investment securities. Other foreign currency transactions resulting in realized and unrealized gain (loss) are disclosed separately.
Investment Transactions and Income. For financial reporting purposes, the Fund's investment holdings and NAV include trades executed through the end of the last business day of the period. The NAV per share for processing shareholder transactions is calculated as of the close of business of the New York Stock Exchange (NYSE), normally 4:00 p.m. Eastern time and includes trades executed through the end of the prior business day. Gains and losses on securities sold are determined on the basis of identified cost and include proceeds received from litigation. Commissions paid to certain brokers with whom the investment adviser, or its affiliates, places trades on behalf of a fund include an amount in addition to trade execution, which may be rebated back to a fund. Any such rebates are included in net realized gain (loss) on investments in the Statement of Operations. Dividend income is recorded on the ex-dividend date, except for certain dividends from foreign securities where the ex-dividend date may have passed, which are recorded as soon as the Fund is informed of the ex-dividend date. Non-cash dividends included in dividend income, if any, are recorded at the fair market value of the securities received. Income and capital gain distributions from Fidelity Central Funds, if any, are recorded on the ex-dividend date. Certain distributions received by the Fund represent a return of capital or capital gain. The Fund determines the components of these distributions subsequent to the ex-dividend date, based upon receipt of tax filings or other correspondence relating to the underlying investment. These distributions are recorded as a reduction of cost of investments and/or as a realized gain. Investment income is recorded net of foreign taxes withheld where recovery of such taxes is uncertain. Funds may file withholding tax reclaims in certain jurisdictions to recover a portion of amounts previously withheld. Any withholding tax reclaims income is included in the Statement of Operations in dividends. Any receivables for withholding tax reclaims are included in the Statement of Assets and Liabilities in dividends receivable.
Expenses. Expenses directly attributable to a fund are charged to that fund. Expenses attributable to more than one fund are allocated among the respective funds on the basis of relative net assets or other appropriate methods. Expenses included in the accompanying financial statements reflect the expenses of that fund and do not include any expenses associated with any underlying mutual funds or exchange-traded funds. Although not included in a fund's expenses, a fund indirectly bears its proportionate share of these expenses through the net asset value of each underlying mutual fund or exchange-traded fund. Expense estimates are accrued in the period to which they relate and adjustments are made when actual amounts are known.
Deferred Trustee Compensation. Under a Deferred Compensation Plan (the Plan) for certain Funds, certain independent Trustees have elected to defer receipt of a portion of their annual compensation. Deferred amounts are invested in affiliated mutual funds, are marked-to-market and remain in a fund until distributed in accordance with the Plan. The investment of deferred amounts and the offsetting payable to the Trustees presented below are included in the accompanying Statement of Assets and Liabilities in other receivables and other payables and accrued expenses, as applicable.
Income Tax Information and Distributions to Shareholders. Each year, the Fund intends to qualify as a regulated investment company under Subchapter M of the Internal Revenue Code, including distributing substantially all of its taxable income and realized gains. As a result, no provision for U.S. Federal income taxes is required. As of February 28, 2023, the Fund did not have any unrecognized tax benefits in the financial statements; nor is the Fund aware of any tax positions for which it is reasonably possible that the total amounts of unrecognized tax benefits will significantly change in the next twelve months. The Fund files a U.S. federal tax return, in addition to state and local tax returns as required. The Fund's federal income tax returns are subject to examination by the Internal Revenue Service (IRS) for a period of three fiscal years after they are filed. State and local tax returns may be subject to examination for an additional fiscal year depending on the jurisdiction. Foreign taxes are provided for based on the Fund's understanding of the tax rules and rates that exist in the foreign markets in which it invests.
Distributions are declared and recorded on the ex-dividend date. Income and capital gain distributions are determined in accordance with income tax regulations, which may differ from GAAP. In addition, the Fund claimed a portion of the payment made to redeeming shareholders as a distribution for income tax purposes.
Capital accounts within the financial statements are adjusted for permanent book-tax differences. These adjustments have no impact on net assets or the results of operations. Capital accounts are not adjusted for temporary book-tax differences which will reverse in a subsequent period.
Book-tax differences are primarily due to foreign currency transactions, passive foreign investments companies (PFIC), partnerships, deferred Trustee compensation, capital loss carryforwards and losses deferred due to wash sales.
As of period end, the cost and unrealized appreciation (depreciation) in securities, and derivatives if applicable, for federal income tax purposes were as follows:
| Gross unrealized appreciation | $1,131,819,264 |
| Gross unrealized depreciation | (25,206,828) |
| Net unrealized appreciation (depreciation) | $1,106,612,436) |
| Tax Cost | $1,775,512,905 |
The tax-based components of distributable earnings as of period end were as follows:
| Capital loss carryforward | $(1,200,162,975) |
| Net unrealized appreciation (depreciation) on securities and other investments | $1,104,063,112 |
Due to a merger in a prior period, approximately $390,759,990 of the Fund's realized losses are subject to limitation. Due to this limitation, the Fund will only be permitted to use approximately $2,077,904 of those capital losses per year to offset gains. These realized losses were acquired from Select Natural Gas Portfolio when it merged into the Fund on November 19, 2021.
Due to a merger in a prior period, approximately $320,127,296 of the Fund's realized losses and a portion of the Fund's unrealized losses are subject to limitation. Due to this limitation, the Fund will only be permitted to use approximately $3,367,549 of those capital losses per year to offset gains. These realized and unrealized losses were acquired from Select Energy Service Portfolio when it merged into the Fund on November 19, 2021.
Capital loss carryforwards are only available to offset future capital gains of the Fund to the extent provided by regulations and may be limited. The capital loss carryforward information presented below, including any applicable limitation, is estimated as of fiscal period end and is subject to adjustment.
Short-term | $(463,978,664) |
Long-term | (736,184,311) |
| Total capital loss carryforward | $(1,200,162,975) |
The tax character of distributions paid was as follows:
| | February 28, 2023 | February 28, 2022 |
| Ordinary Income | $76,651,144 | $ 31,460,812 |
Restricted Securities (including Private Placements). Funds may invest in securities that are subject to legal or contractual restrictions on resale. These securities generally may be resold in transactions exempt from registration or to the public if the securities are registered. Disposal of these securities may involve time-consuming negotiations and expense, and prompt sale at an acceptable price may be difficult. Information regarding restricted securities held at period end is included at the end of the Schedule of Investments, if applicable.
Purchases and Sales of Investments.
Purchases and sales of securities, other than short-term securities and in-kind transactions, as applicable, are noted in the table below.
| | Purchases ($) | Sales ($) |
| Energy Portfolio | 1,245,039,230 | 1,236,016,778 |
4. Fees and Other Transactions with Affiliates.
Management Fee. Fidelity Management & Research Company LLC (the investment adviser) and its affiliates provide the Fund with investment management related services for which the Fund pays a monthly management fee. The management fee is the sum of an individual fund fee rate that is based on an annual rate of .30% of the Fund's average net assets and an annualized group fee rate that averaged .23% during the period. The group fee rate is based upon the monthly average net assets of a group of registered investment companies with which the investment adviser has management contracts. The group fee rate decreases as assets under management increase and increases as assets under management decrease. For the reporting period, the total annual management fee rate was .53% of the Fund's average net assets.
Transfer Agent Fees. Fidelity Investments Institutional Operations Company LLC (FIIOC), an affiliate of the investment adviser, is the Fund's transfer, dividend disbursing and shareholder servicing agent. FIIOC receives account fees and asset-based fees that vary according to account size and type of account. FIIOC pays for typesetting, printing and mailing of shareholder reports, except proxy statements. For the period, the transfer agent fees were equivalent to an annual rate of .16% of average net assets.
Accounting Fees. Fidelity Service Company, Inc. (FSC), an affiliate of the investment adviser, maintains the Fund's accounting records. The accounting fee is based on the level of average net assets for each month. For the period, the fees were equivalent to the following annual rates:
| | % of Average Net Assets |
| Energy Portfolio | .03 |
Brokerage Commissions. A portion of portfolio transactions were placed with brokerage firms which are affiliates of the investment adviser. Brokerage commissions are included in net realized gain (loss) and change in net unrealized appreciation (depreciation) in the Statement of Operations. The commissions paid to these affiliated firms were as follows:
| | Amount |
| Energy Portfolio | $33,462 |
Interfund Lending Program. Pursuant to an Exemptive Order issued by the Securities and Exchange Commission (the SEC), the Fund, along with other registered investment companies having management contracts with Fidelity Management & Research Company LLC (FMR), or other affiliated entities of FMR, may participate in an interfund lending program. This program provides an alternative credit facility allowing the Fund to borrow from, or lend money to, other participating affiliated funds. Any open loans, including accrued interest, at period end are presented as Notes payable to affiliates in the Statement of Assets and Liabilities. Activity in this program during the period for which loans were outstanding was as follows:
| | Borrower or Lender | Average Loan Balance | Weighted Average Interest Rate | Interest Expense |
| Energy Portfolio | Borrower | $11,772,827 | 2.86% | $130,182 |
Interfund Trades. Funds may purchase from or sell securities to other Fidelity Funds under procedures adopted by the Board. The procedures have been designed to ensure these interfund trades are executed in accordance with Rule 17a-7 of the 1940 Act. Any interfund trades are included within the respective purchases and sales amounts shown in the Purchases and Sales of Investments note. Interfund trades during the period are noted in the table below.
| | Purchases ($) | Sales ($) | Realized Gain (Loss) ($) |
| Energy Portfolio | 67,861,814 | 145,361,073 | 2,659,746 |
5. Committed Line of Credit.
Certain Funds participate with other funds managed by the investment adviser or an affiliate in a $4.25 billion credit facility (the "line of credit") to be utilized for temporary or emergency purposes to fund shareholder redemptions or for other short-term liquidity purposes. The participating funds have agreed to pay commitment fees on their pro-rata portion of the line of credit, which are reflected in Miscellaneous expenses on the Statement of Operations, and are listed below. During the period, there were no borrowings on this line of credit.
| | Amount |
| Energy Portfolio | $4,852 |
6. Security Lending.
Funds lend portfolio securities from time to time in order to earn additional income. Lending agents are used, including National Financial Services (NFS), an affiliate of the investment adviser. Pursuant to a securities lending agreement, NFS will receive a fee, which is capped at 9.9% of a fund's daily lending revenue, for its services as lending agent. A fund may lend securities to certain qualified borrowers, including NFS. On the settlement date of the loan, a fund receives collateral (in the form of U.S. Treasury obligations, letters of credit and/or cash) against the loaned securities and maintains collateral in an amount not less than 100% of the market value of the loaned securities during the period of the loan. The market value of the loaned securities is determined at the close of business of a fund and any additional required collateral is delivered to a fund on the next business day. A fund or borrower may terminate the loan at any time, and if the borrower defaults on its obligation to return the securities loaned because of insolvency or other reasons, a fund may apply collateral received from the borrower against the obligation. A fund may experience delays and costs in recovering the securities loaned. Any cash collateral received is invested in the Fidelity Securities Lending Cash Central Fund. Any loaned securities are identified as such in the Schedule of Investments, and the value of loaned securities and cash collateral at period end, as applicable, are presented in the Statement of Assets and Liabilities. Security lending income represents the income earned on investing cash collateral, less rebates paid to borrowers and any lending agent fees associated with the loan, plus any premium payments received for lending certain types of securities. Security lending income is presented in the Statement of Operations as a component of income from Fidelity Central Funds. Affiliated security lending activity, if any, was as follows:
| | Total Security Lending Fees Paid to NFS | Security Lending Income From Securities Loaned to NFS | Value of Securities Loaned to NFS at Period End |
| Energy Portfolio | $13,861 | $- | $- |
7. Bank Borrowings.
The Fund is permitted to have bank borrowings for temporary or emergency purposes to fund shareholder redemptions or for other short-term liquidity requirements. The Fund has established borrowing arrangements with certain banks. The interest rate on the borrowings is the bank's base rate, as revised from time to time. Any open loans, including accrued interest, at period end are presented under the caption "Notes payable" in the Statement of Assets and Liabilities, if applicable. Activity in this program during the period for which loans were outstanding was as follows:
| | Average Loan Balance | Weighted Average Interest Rate | Interest Expense |
| Energy Portfolio | $4,316,125 | 2.70% | $2,591 |
8. Expense Reductions.
During the period the investment adviser or an affiliate reimbursed and/or waived a portion of operating expenses in the amount of $100,733.
9. Other.
A fund's organizational documents provide former and current trustees and officers with a limited indemnification against liabilities arising in connection with the performance of their duties to the fund. In the normal course of business, a fund may also enter into contracts that provide general indemnifications. A fund's maximum exposure under these arrangements is unknown as this would be dependent on future claims that may be made against a fund. The risk of material loss from such claims is considered remote.
10. Risk and Uncertainties.
Many factors affect a fund's performance. Developments that disrupt global economies and financial markets, such as pandemics, epidemics, outbreaks of infectious diseases, war, terrorism, and environmental disasters, may significantly affect a fund's investment performance. The effects of these developments to a fund will be impacted by the types of securities in which a fund invests, the financial condition, industry, economic sector, and geographic location of an issuer, and a fund's level of investment in the securities of that issuer. Significant concentrations in security types, issuers, industries, sectors, and geographic locations may magnify the factors that affect a fund's performance.
11. Prior Fiscal Year Merger Information.
On November 19, 2021, the Fund acquired all of the assets and assumed all of the liabilities of each Target Fund listed in the below table pursuant to an Agreement and Plan of Reorganization approved by the Board of Trustees ("The Board"). The securities held by each Target Fund were the primary assets acquired by the Fund. The acquisition was accomplished by an exchange of shares of the Fund for shares then outstanding of each Target Fund at their respective net asset value on the acquisition date. The reorganization provides shareholders of each Target Fund access to a larger portfolio with a similar investment objective and lower projected expenses. For financial reporting purposes, the assets and liabilities of each Target Fund and shares issued by the Fund were recorded at fair value; however, the cost basis of the investments received from each Target Fund were carried forward and will be utilized for purposes of the Fund's ongoing reporting of realized and unrealized gains and losses to more closely align subsequent reporting of realized gains with amounts distributable to shareholders for tax purposes. The reorganization qualified as a tax-free reorganization for federal income tax purposes with no gain or loss recognized to the funds or their shareholders.
| Target Fund | Investments $ | Unrealized appreciation (depreciation) $ | Net Assets $ | Shares Exchanged | Shares Exchanged Ratio |
| Energy Service Portfolio | 239,225,585 | (29,042,821) | 240,539,236 | 6,902,147 | .5578794835 |
| Natural Gas Portfolio | 148,458,051 | 3,907,464 | 148,421,708 | 4,258,862 | .4453142037 |
| Surviving Fund | Net Assets $ | Total net assets after the acquisition $ |
| Energy Portfolio | 1,269,646,810 | 1,658,607,754 |
Pro forma results of operations of the combined entity for the entire period ended February 28, 2022, as though the acquisition had occurred as of the beginning of the year (rather than on the actual acquisition date), are as follows:
| Net investment income (loss) | $41,213,855 |
| Total net realized gain (loss) | 31,547,962 |
| Total change in net unrealized appreciation (depreciation) | 637,928,213 |
| Net increase (decrease) in net assets resulting from operations | $710,690,030 |
Because the combined investment portfolios have been managed as a single portfolio since the acquisitions were completed, it is not practicable to separate the amounts of revenue and earnings of the acquired funds that have been included in the Fund's Statement of Operations since November 19, 2021.
To the Board of Trustees of Fidelity Select Portfolios and Shareholders of Energy Portfolio
Opinion on the Financial Statements
We have audited the accompanying statement of assets and liabilities, including the schedule of investments, of Energy Portfolio (one of the funds constituting Fidelity Select Portfolios, referred to hereafter as the "Fund") as of February 28, 2023, the related statement of operations for the year ended February 28, 2023, the statement of changes in net assets for each of the two years in the period ended February 28, 2023, including the related notes, and the financial highlights for each of the five years in the period ended February 28, 2023 (collectively referred to as the "financial statements"). In our opinion, the financial statements present fairly, in all material respects, the financial position of the Fund as of February 28, 2023, the results of its operations for the year then ended, the changes in its net assets for each of the two years in the period ended February 28, 2023 and the financial highlights for each of the five years in the period ended February 28, 2023 in conformity with accounting principles generally accepted in the United States of America.
Basis for Opinion
These financial statements are the responsibility of the Fund's management. Our responsibility is to express an opinion on the Fund's financial statements based on our audits. We are a public accounting firm registered with the Public Company Accounting Oversight Board (United States) (PCAOB) and are required to be independent with respect to the Fund in accordance with the U.S. federal securities laws and the applicable rules and regulations of the Securities and Exchange Commission and the PCAOB.
We conducted our audits of these financial statements in accordance with the standards of the PCAOB. Those standards require that we plan and perform the audit to obtain reasonable assurance about whether the financial statements are free of material misstatement, whether due to error or fraud.
Our audits included performing procedures to assess the risks of material misstatement of the financial statements, whether due to error or fraud, and performing procedures that respond to those risks. Such procedures included examining, on a test basis, evidence regarding the amounts and disclosures in the financial statements. Our audits also included evaluating the accounting principles used and significant estimates made by management, as well as evaluating the overall presentation of the financial statements. Our procedures included confirmation of securities owned as of February 28, 2023 by correspondence with the custodian and brokers. We believe that our audits provide a reasonable basis for our opinion.
/s/ PricewaterhouseCoopers LLP
Boston, Massachusetts
April 13, 2023
We have served as the auditor of one or more investment companies in the Fidelity group of funds since 1932.
The Trustees, Members of the Advisory Board (if any), and officers of the trust and fund, as applicable, are listed below. The Board of Trustees governs the fund and is responsible for protecting the interests of shareholders. The Trustees are experienced executives who meet periodically throughout the year to oversee the fund's activities, review contractual arrangements with companies that provide services to the fund, oversee management of the risks associated with such activities and contractual arrangements, and review the fund's performance. Each of the Trustees oversees 318 funds.
The Trustees hold office without limit in time except that (a) any Trustee may resign; (b) any Trustee may be removed by written instrument, signed by at least two-thirds of the number of Trustees prior to such removal; (c) any Trustee who requests to be retired or who has become incapacitated by illness or injury may be retired by written instrument signed by a majority of the other Trustees; and (d) any Trustee may be removed at any special meeting of shareholders by a two-thirds vote of the outstanding voting securities of the trust. Each Trustee who is not an interested person (as defined in the 1940 Act) of the trust and the fund is referred to herein as an Independent Trustee. Each Independent Trustee shall retire not later than the last day of the calendar year in which his or her 75th birthday occurs. The Independent Trustees may waive this mandatory retirement age policy with respect to individual Trustees. Officers and Advisory Board Members hold office without limit in time, except that any officer or Advisory Board Member may resign or may be removed by a vote of a majority of the Trustees at any regular meeting or any special meeting of the Trustees. Except as indicated, each individual has held the office shown or other offices in the same company for the past five years.
The fund's Statement of Additional Information (SAI) includes more information about the Trustees. To request a free copy, call Fidelity at 1-800-544-8544.
Experience, Skills, Attributes, and Qualifications of the Trustees. The Governance and Nominating Committee has adopted a statement of policy that describes the experience, qualifications, attributes, and skills that are necessary and desirable for potential Independent Trustee candidates (Statement of Policy). The Board believes that each Trustee satisfied at the time he or she was initially elected or appointed a Trustee, and continues to satisfy, the standards contemplated by the Statement of Policy. The Governance and Nominating Committee also engages professional search firms to help identify potential Independent Trustee candidates who have the experience, qualifications, attributes, and skills consistent with the Statement of Policy. From time to time, additional criteria based on the composition and skills of the current Independent Trustees, as well as experience or skills that may be appropriate in light of future changes to board composition, business conditions, and regulatory or other developments, have also been considered by the professional search firms and the Governance and Nominating Committee. In addition, the Board takes into account the Trustees' commitment and participation in Board and committee meetings, as well as their leadership of standing and ad hoc committees throughout their tenure.
In determining that a particular Trustee was and continues to be qualified to serve as a Trustee, the Board has considered a variety of criteria, none of which, in isolation, was controlling. The Board believes that, collectively, the Trustees have balanced and diverse experience, qualifications, attributes, and skills, which allow the Board to operate effectively in governing the fund and protecting the interests of shareholders. Information about the specific experience, skills, attributes, and qualifications of each Trustee, which in each case led to the Board's conclusion that the Trustee should serve (or continue to serve) as a trustee of the fund, is provided below.
Board Structure and Oversight Function. Robert A. Lawrence is an interested person and currently serves as Chair. The Trustees have determined that an interested Chair is appropriate and benefits shareholders because an interested Chair has a personal and professional stake in the quality and continuity of services provided to the fund. Independent Trustees exercise their informed business judgment to appoint an individual of their choosing to serve as Chair, regardless of whether the Trustee happens to be independent or a member of management. The Independent Trustees have determined that they can act independently and effectively without having an Independent Trustee serve as Chair and that a key structural component for assuring that they are in a position to do so is for the Independent Trustees to constitute a substantial majority for the Board. The Independent Trustees also regularly meet in executive session. David M. Thomas serves as Lead Independent Trustee and as such (i) acts as a liaison between the Independent Trustees and management with respect to matters important to the Independent Trustees and (ii) with management prepares agendas for Board meetings.
Fidelity ® funds are overseen by different Boards of Trustees. The fund's Board oversees Fidelity's high income and certain equity funds, and other Boards oversee Fidelity's alternative investment, investment-grade bond, money market, asset allocation, and other equity funds. The asset allocation funds may invest in Fidelity ® funds overseen by the fund's Board. The use of separate Boards, each with its own committee structure, allows the Trustees of each group of Fidelity ® funds to focus on the unique issues of the funds they oversee, including common research, investment, and operational issues. On occasion, the separate Boards establish joint committees to address issues of overlapping consequences for the Fidelity ® funds overseen by each Board.
The Trustees operate using a system of committees to facilitate the timely and efficient consideration of all matters of importance to the Trustees, the fund, and fund shareholders and to facilitate compliance with legal and regulatory requirements and oversight of the fund's activities and associated risks. The Board, acting through its committees, has charged FMR and its affiliates with (i) identifying events or circumstances the occurrence of which could have demonstrably adverse effects on the fund's business and/or reputation; (ii) implementing processes and controls to lessen the possibility that such events or circumstances occur or to mitigate the effects of such events or circumstances if they do occur; and (iii) creating and maintaining a system designed to evaluate continuously business and market conditions in order to facilitate the identification and implementation processes described in (i) and (ii) above. Because the day-to-day operations and activities of the fund are carried out by or through FMR, its affiliates, and other service providers, the fund's exposure to risks is mitigated but not eliminated by the processes overseen by the Trustees. While each of the Board's committees has responsibility for overseeing different aspects of the fund's activities, oversight is exercised primarily through the Operations, Audit, and Compliance Committees. Appropriate personnel, including but not limited to the fund's Chief Compliance Officer (CCO), FMR's internal auditor, the independent accountants, the fund's Treasurer and portfolio management personnel, make periodic reports to the Board's committees, as appropriate, including an annual review of Fidelity's risk management program for the Fidelity ® funds. The responsibilities of each standing committee, including their oversight responsibilities, are described further under "Standing Committees of the Trustees."
Interested Trustees*:
Correspondence intended for a Trustee who is an interested person may be sent to Fidelity Investments, 245 Summer Street, Boston, Massachusetts 02210.
Name, Year of Birth; Principal Occupations and Other Relevant Experience+
Bettina Doulton (1964)
Year of Election or Appointment: 2020
Trustee
Ms. Doulton also serves as Trustee of other Fidelity ® funds. Prior to her retirement, Ms. Doulton served in a variety of positions at Fidelity Investments, including as a managing director of research (2006-2007), portfolio manager to certain Fidelity ® funds (1993-2005), equity analyst and portfolio assistant (1990-1993), and research assistant (1987-1990). Ms. Doulton currently owns and operates Phi Builders + Architects and Cellardoor Winery. Previously, Ms. Doulton served as a member of the Board of Brown Capital Management, LLC (2014-2018).
Robert A. Lawrence (1952)
Year of Election or Appointment: 2020
Trustee
Chair of the Board of Trustees
Mr. Lawrence also serves as Trustee of other funds. Previously, Mr. Lawrence served as a Trustee and Member of the Advisory Board of certain funds. Prior to his retirement in 2008, Mr. Lawrence served as Vice President of certain Fidelity ® funds (2006-2008), Senior Vice President, Head of High Income Division of Fidelity Management & Research Company (investment adviser firm, 2006-2008), and President of Fidelity Strategic Investments (investment adviser firm, 2002-2005).
* Determined to be an "Interested Trustee" by virtue of, among other things, his or her affiliation with the trust or various entities under common control with FMR.
+ The information includes the Trustee's principal occupation during the last five years and other information relating to the experience, attributes, and skills relevant to the Trustee's qualifications to serve as a Trustee, which led to the conclusion that the Trustee should serve as a Trustee for the fund.
Independent Trustees:
Correspondence intended for an Independent Trustee may be sent to Fidelity Investments, P.O. Box 55235, Boston, Massachusetts 02205-5235.
Name, Year of Birth; Principal Occupations and Other Relevant Experience+
Thomas P. Bostick (1956)
Year of Election or Appointment: 2021
Trustee
Lieutenant General Bostick also serves as Trustee of other Fidelity ® funds. Prior to his retirement, General Bostick (United States Army, Retired) held a variety of positions within the U.S. Army, including Commanding General and Chief of Engineers, U.S. Army Corps of Engineers (2012-2016) and Deputy Chief of Staff and Director of Human Resources, U.S. Army (2009-2012). General Bostick currently serves as a member of the Board and Finance and Governance & Sustainability Committees of CSX Corporation (transportation, 2020-present) and a member of the Board and Corporate Governance and Nominating Committee of Perma-Fix Environmental Services, Inc. (nuclear waste management, 2020-present). General Bostick serves as Chief Executive Officer of Bostick Global Strategies, LLC (consulting, 2016-present), as a member of the Board of HireVue, Inc. (video interview and assessment, 2020-present), as a member of the Board of Allonnia (biotechnology and engineering solutions, 2022-present) and on the Advisory Board of Solugen, Inc. (specialty bio-based chemicals manufacturer, 2022-present). Previously, General Bostick served as a Member of the Advisory Board of certain Fidelity ® funds (2021), President, Intrexon Bioengineering (2018-2020) and Chief Operating Officer (2017-2020) and Senior Vice President of the Environment Sector (2016-2017) of Intrexon Corporation (biopharmaceutical company).
Dennis J. Dirks (1948)
Year of Election or Appointment: 2018
Trustee
Mr. Dirks also serves as Trustee of other Fidelity ® funds. Prior to his retirement in May 2003, Mr. Dirks served as Chief Operating Officer and as a member of the Board of The Depository Trust & Clearing Corporation (financial markets infrastructure), President, Chief Operating Officer and a member of the Board of The Depository Trust Company (DTC), President and a member of the Board of the National Securities Clearing Corporation (NSCC), Chief Executive Officer and a member of the Board of the Government Securities Clearing Corporation and Chief Executive Officer and a member of the Board of the Mortgage-Backed Securities Clearing Corporation. Mr. Dirks currently serves as a member of the Finance Committee (2016-present) and Board (2017-present) and is Treasurer (2018-present) of the Asolo Repertory Theatre.
Donald F. Donahue (1950)
Year of Election or Appointment: 2018
Trustee
Mr. Donahue also serves as Trustee of other Fidelity ® funds. Mr. Donahue serves as President and Chief Executive Officer of Miranda Partners, LLC (risk consulting for the financial services industry, 2012-present). Previously, Mr. Donahue served as Chief Executive Officer (2006-2012), Chief Operating Officer (2003-2006) and Managing Director, Customer Marketing and Development (1999-2003) of The Depository Trust & Clearing Corporation (financial markets infrastructure). Mr. Donahue currently serves as a member (2007-present) and Co-Chairman (2016-present) of the Board of United Way of New York. Mr. Donahue previously served as a member of the Advisory Board of certain Fidelity ® funds (2015-2018) and as a member of the Board of The Leadership Academy (previously NYC Leadership Academy) (2012-2022).
Vicki L. Fuller (1957)
Year of Election or Appointment: 2020
Trustee
Ms. Fuller also serves as Trustee of other Fidelity ® funds. Previously, Ms. Fuller served as a member of the Advisory Board of certain Fidelity ® funds (2018-2020), Chief Investment Officer of the New York State Common Retirement Fund (2012-2018) and held a variety of positions at AllianceBernstein L.P. (global asset management, 1985-2012), including Managing Director (2006-2012) and Senior Vice President and Senior Portfolio Manager (2001-2006). Ms. Fuller currently serves as a member of the Board, Audit Committee and Nominating and Governance Committee of two Blackstone business development companies (2020-present), as a member of the Board of Treliant, LLC (consulting, 2019-present), as a member of the Board of Ariel Alternatives, LLC (private equity, 2022-present) and as a member of the Board and Chair of the Audit Committee of Gusto, Inc. (software, 2021-present). In addition, Ms. Fuller currently serves as a member of the Board of Roosevelt University (2019-present) and as a member of the Executive Board of New York University's Stern School of Business. Ms. Fuller previously served as a member of the Board, Audit Committee and Nominating and Governance Committee of The Williams Companies, Inc. (natural gas infrastructure, 2018-2021).
Patricia L. Kampling (1959)
Year of Election or Appointment: 2020
Trustee
Ms. Kampling also serves as Trustee of other Fidelity ® funds. Prior to her retirement, Ms. Kampling served as Chairman of the Board and Chief Executive Officer (2012-2019), President and Chief Operating Officer (2011-2012) and Executive Vice President and Chief Financial Officer (2010-2011) of Alliant Energy Corporation. Ms. Kampling currently serves as a member of the Board, Finance Committee and Governance, Compensation and Nominating Committee of Xcel Energy Inc. (utilities company, 2020-present) and as a member of the Board, Audit, Finance and Risk Committee and Safety, Environmental, Technology and Operations Committee and Chair of the Executive Development and Compensation Committee of American Water Works Company, Inc. (utilities company, 2019-present). In addition, Ms. Kampling currently serves as a member of the Board of the Nature Conservancy, Wisconsin Chapter (2019-present). Previously, Ms. Kampling served as a Member of the Advisory Board of certain Fidelity® funds (2020), a member of the Board, Compensation Committee and Executive Committee and Chair of the Audit Committee of Briggs & Stratton Corporation (manufacturing, 2011-2021), a member of the Board of Interstate Power and Light Company (2012-2019) and Wisconsin Power and Light Company (2012-2019) (each a subsidiary of Alliant Energy Corporation) and as a member of the Board and Workforce Development Committee of the Business Roundtable (2018-2019).
Thomas A. Kennedy (1955)
Year of Election or Appointment: 2021
Trustee
Mr. Kennedy also serves as Trustee of other Fidelity ® funds. Previously, Mr. Kennedy served as a Member of the Advisory Board of certain Fidelity ® funds (2020) and held a variety of positions at Raytheon Company (aerospace and defense, 1983-2020), including Chairman and Chief Executive Officer (2014-2020) and Executive Vice President and Chief Operating Officer (2013-2014). Mr. Kennedy served as Executive Chairman of the Board of Directors of Raytheon Technologies Corporation (aerospace and defense, 2020-2021). Mr. Kennedy serves as a Director of the Board of Directors of Textron Inc. (aerospace and defense, 2023-present).
Oscar Munoz (1959)
Year of Election or Appointment: 2021
Trustee
Mr. Munoz also serves as Trustee of other Fidelity ® funds. Prior to his retirement, Mr. Munoz served as Executive Chairman (2020-2021), Chief Executive Officer (2015-2020), President (2015-2016) and a member of the Board (2010-2021) of United Airlines Holdings, Inc. Mr. Munoz currently serves as a member of the Board of CBRE Group, Inc. (commercial real estate, 2020-present), a member of the Board of Univision Communications, Inc. (Hispanic media, 2020-present), a member of the Board of Archer Aviation Inc. (2021-present), a member of the Defense Business Board of the United States Department of Defense (2021-present) and a member of the Board of Salesforce.com, Inc. (cloud-based software, 2022-present). Previously, Mr. Munoz served as a Member of the Advisory Board of certain Fidelity ® funds (2021).
David M. Thomas (1949)
Year of Election or Appointment: 2018
Trustee
Lead Independent Trustee
Mr. Thomas also serves as Trustee of other Fidelity ® funds. Previously, Mr. Thomas served as Executive Chairman (2005-2006) and Chairman and Chief Executive Officer (2000-2005) of IMS Health, Inc. (pharmaceutical and healthcare information solutions). Mr. Thomas currently serves as a member of the Board of Fortune Brands Home and Security (home and security products, 2004-present) and as Director (2013-present) and Non-Executive Chairman of the Board (2022-present) of Interpublic Group of Companies, Inc. (marketing communication).
Susan Tomasky (1953)
Year of Election or Appointment: 2020
Trustee
Ms. Tomasky also serves as Trustee of other Fidelity ® funds. Prior to her retirement, Ms. Tomasky served in various executive officer positions at American Electric Power Company, Inc. (1998-2011), including most recently as President of AEP Transmission (2007-2011). Ms. Tomasky currently serves as a member of the Board and Sustainability Committee and as Chair of the Audit Committee of Marathon Petroleum Corporation (2018-present) and as a member of the Board, Executive Committee, Corporate Governance Committee and Organization and Compensation Committee and as Lead Director of the Board of Public Service Enterprise Group, Inc. (utilities company, 2012-present) and as a member of the Board of its subsidiary company, Public Service Electric and Gas Co. (2021-present). In addition, Ms. Tomasky currently serves as a member (2009-present) and President (2020-present) of the Board of the Royal Shakespeare Company - America (2009-present), as a member of the Board of the Columbus Association for the Performing Arts (2011-present) and as a member of the Board and Kenyon in the World Committee of Kenyon College (2016-present). Previously, Ms. Tomasky served as a Member of the Advisory Board of certain Fidelity ® funds (2020), as a member of the Board of the Columbus Regional Airport Authority (2007-2020), as a member of the Board (2011-2018) and Lead Independent Director (2015-2018) of Andeavor Corporation (previously Tesoro Corporation) (independent oil refiner and marketer) and as a member of the Board of Summit Midstream Partners LP (energy, 2012-2018).
Michael E. Wiley (1950)
Year of Election or Appointment: 2008
Trustee
Mr. Wiley also serves as Trustee of other Fidelity ® funds. Previously, Mr. Wiley served as a member of the Advisory Board of certain Fidelity ® funds (2018-2020), Chairman, President and CEO of Baker Hughes, Inc. (oilfield services, 2000-2004). Mr. Wiley also previously served as a member of the Board of Andeavor Corporation (independent oil refiner and marketer, 2005-2018), a member of the Board of Andeavor Logistics LP (natural resources logistics, 2015-2018) and a member of the Board of High Point Resources (exploration and production, 2005-2020).
+ The information includes the Trustee's principal occupation during the last five years and other information relating to the experience, attributes, and skills relevant to the Trustee's qualifications to serve as a Trustee, which led to the conclusion that the Trustee should serve as a Trustee for the fund.
Advisory Board Members and Officers:
Correspondence intended for a Member of the Advisory Board (if any) may be sent to Fidelity Investments, P.O. Box 55235, Boston, Massachusetts 02205-5235. Correspondence intended for an officer or Peter S. Lynch may be sent to Fidelity Investments, 245 Summer Street, Boston, Massachusetts 02210. Officers appear below in alphabetical order.
Name, Year of Birth; Principal Occupation
Peter S. Lynch (1944)
Year of Election or Appointment: 2018
Member of the Advisory Board
Mr. Lynch also serves as a Member of the Advisory Board of other Fidelity ® funds. Mr. Lynch is Vice Chairman and a Director of Fidelity Management & Research Company LLC (investment adviser firm). In addition, Mr. Lynch serves as a Trustee of Boston College and as the Chairman of the Inner-City Scholarship Fund. Previously, Mr. Lynch served as Vice Chairman and a Director of FMR Co., Inc. (investment adviser firm) and on the Special Olympics International Board of Directors (1997-2006).
Heather Bonner (1977)
Year of Election or Appointment: 2023
Assistant Treasurer
Ms. Bonner also serves as an officer of other funds. Ms. Bonner serves as Senior Vice President (2022-present), and is an employee of Fidelity Investments. Ms. Bonner serves as Assistant Treasurer of Fidelity CRET Trustee LLC (2022-present). Prior to joining Fidelity, Ms. Bonner served as Managing Director at AQR Capital Management (2013-2022) and was the Treasurer and Principal Financial Officer of the AQR Funds (2013-2022).
Craig S. Brown (1977)
Year of Election or Appointment: 2022
Deputy Treasurer
Mr. Brown also serves as an officer of other funds. Mr. Brown serves as Assistant Treasurer of FIMM, LLC (2021-present) and is an employee of Fidelity Investments (2013-present). Previously, Mr. Brown served as Assistant Treasurer of certain Fidelity ® funds (2019-2022).
John J. Burke III (1964)
Year of Election or Appointment: 2018
Chief Financial Officer
Mr. Burke also serves as Chief Financial Officer of other funds. Mr. Burke serves as Head of Investment Operations for Fidelity Fund and Investment Operations (2018-present) and is an employee of Fidelity Investments (1998-present). Previously Mr. Burke served as head of Asset Management Investment Operations (2012-2018).
Margaret Carey (1973)
Year of Election or Appointment: 2023
Secretary and Chief Legal Officer (CLO)
Ms. Carey also serves as an officer of other funds and as CLO of certain other Fidelity entities. She is a Senior Vice President and Deputy General Counsel of FMR LLC (diversified financial services company, 2019-present), and is an employee of Fidelity Investments.
William C. Coffey (1969)
Year of Election or Appointment: 2019
Assistant Secretary
Mr. Coffey also serves as Assistant Secretary of other funds. He is Senior Vice President and Deputy General Counsel of FMR LLC (diversified financial services company, 2010-present), and is an employee of Fidelity Investments. Previously, Mr. Coffey served as Secretary and CLO of certain funds (2018-2019); CLO, Secretary, and Senior Vice President of Fidelity Management & Research Company and FMR Co., Inc. (investment adviser firms, 2018-2019); Secretary of Fidelity SelectCo, LLC and Fidelity Investments Money Management, Inc. (investment adviser firms, 2018-2019); CLO of Fidelity Management & Research (Hong Kong) Limited, FMR Investment Management (UK) Limited, and Fidelity Management & Research (Japan) Limited (investment adviser firms, 2018-2019); and Assistant Secretary of certain funds (2009-2018).
Timothy M. Cohen (1969)
Year of Election or Appointment: 2018
Vice President
Mr. Cohen also serves as Vice President of other funds. Mr. Cohen serves as Co-Head of Equity (2018-present), a Director of Fidelity Management & Research (Japan) Limited (investment adviser firm, 2016-present), and is an employee of Fidelity Investments. Previously, Mr. Cohen served as Executive Vice President of Fidelity SelectCo, LLC (2019), Head of Global Equity Research (2016-2018), Chief Investment Officer - Equity and a Director of Fidelity Management & Research (U.K.) Inc. (investment adviser firm, 2013-2015) and as a Director of Fidelity Management & Research (Hong Kong) Limited (investment adviser firm, 2017).
Jonathan Davis (1968)
Year of Election or Appointment: 2010
Assistant Treasurer
Mr. Davis also serves as an officer of other funds. Mr. Davis serves as Assistant Treasurer of FIMM, LLC (2021-present), FMR Capital, Inc. (2017-present), FD Funds GP LLC (2021-present), FD Funds Holding LLC (2021-present), and FD Funds Management LLC (2021-present); and is an employee of Fidelity Investments. Previously, Mr. Davis served as Vice President and Associate General Counsel of FMR LLC (diversified financial services company, 2003-2010).
Laura M. Del Prato (1964)
Year of Election or Appointment: 2018
Assistant Treasurer
Ms. Del Prato also serves as an officer of other funds. Ms. Del Prato serves as Assistant Treasurer of FIMM, LLC (2021-present) and is an employee of Fidelity Investments (2017-present). Previously, Ms. Del Prato served as President and Treasurer of The North Carolina Capital Management Trust: Cash Portfolio and Term Portfolio (2018-2020). Prior to joining Fidelity Investments, Ms. Del Prato served as a Managing Director and Treasurer of the JPMorgan Mutual Funds (2014-2017). Prior to JPMorgan, Ms. Del Prato served as a partner at Cohen Fund Audit Services (accounting firm, 2012-2013) and KPMG LLP (accounting firm, 2004-2012).
Colm A. Hogan (1973)
Year of Election or Appointment: 2020
Assistant Treasurer
Mr. Hogan also serves as an officer of other funds. Mr. Hogan serves as Assistant Treasurer of FIMM, LLC (2021-present) and FMR Capital, Inc. (2017-present) and is an employee of Fidelity Investments (2005-present). Previously, Mr. Hogan served as Deputy Treasurer of certain Fidelity ® funds (2016-2020) and Assistant Treasurer of certain Fidelity ® funds (2016-2018).
Pamela R. Holding (1964)
Year of Election or Appointment: 2018
Vice President
Ms. Holding also serves as Vice President of other funds. Ms. Holding serves as Co-Head of Equity (2018-present) and is an employee of Fidelity Investments (2013-present). Previously, Ms. Holding served as Executive Vice President of Fidelity SelectCo, LLC (2019) and as Chief Investment Officer of Fidelity Institutional Asset Management (2013-2018).
Chris Maher (1972)
Year of Election or Appointment: 2020
Deputy Treasurer
Mr. Maher also serves as an officer of other funds. Mr. Maher serves as Assistant Treasurer of FIMM, LLC (2021-present) and FMR Capital, Inc. (2017-present), and is an employee of Fidelity Investments (2008-present). Previously, Mr. Maher served as Assistant Treasurer of certain funds (2013-2020); Vice President of Asset Management Compliance (2013), Vice President of the Program Management Group of FMR (investment adviser firm, 2010-2013), and Vice President of Valuation Oversight (2008-2010).
Jason P. Pogorelec (1975)
Year of Election or Appointment: 2020
Chief Compliance Officer
Mr. Pogorelec also serves as Chief Compliance Officer of other funds. Mr. Pogorelec is a Senior Vice President of Asset Management Compliance for Fidelity Investments and is an employee of Fidelity Investments. Mr. Pogorelec serves as Compliance Officer of Fidelity Management & Research Company LLC (investment adviser firm, 2023-present). Previously, Mr. Pogorelec served as Vice President, Associate General Counsel for Fidelity Investments (2010-2020) and Assistant Secretary of certain Fidelity ® funds (2015-2020).
Brett Segaloff (1972)
Year of Election or Appointment: 2021
Anti-Money Laundering (AML) Officer
Mr. Segaloff also serves as an AML Officer of other funds and other related entities. He is Director, Anti-Money Laundering (2007-present) of FMR LLC (diversified financial services company) and is an employee of Fidelity Investments (1996-present).
Stacie M. Smith (1974)
Year of Election or Appointment: 2018
President and Treasurer
Ms. Smith also serves as an officer of other funds. Ms. Smith serves as Assistant Treasurer of FIMM, LLC (2021-present) and FMR Capital, Inc. (2017-present), is an employee of Fidelity Investments (2009-present), and has served in other fund officer roles. Prior to joining Fidelity Investments, Ms. Smith served as Senior Audit Manager of Ernst & Young LLP (accounting firm, 1996-2009). Previously, Ms. Smith served as Assistant Treasurer (2013-2019) and Deputy Treasurer (2013-2016) of certain Fidelity ® funds.
Jim Wegmann (1979)
Year of Election or Appointment: 2019
Assistant Treasurer
Mr. Wegmann also serves as an officer of other funds. Mr. Wegmann serves as Assistant Treasurer of FIMM, LLC (2021-present) and is an employee of Fidelity Investments (2011-present). Previously, Mr. Wegmann served as Assistant Treasurer of certain Fidelity ® funds (2019-2021).
As a shareholder, you incur two types of costs: (1) transaction costs, which may include sales charges (loads) on purchase payments or redemption proceeds, as applicable and (2) ongoing costs, which generally include management fees, distribution and/or service (12b-1) fees and other Fund expenses. This Example is intended to help you understand your ongoing costs (in dollars) of investing in a fund and to compare these costs with the ongoing costs of investing in other mutual funds.
| The Example is based on an investment of $1,000 invested at the beginning of the period and held for the entire period (September 1, 2022 to February 28, 2023). |
Actual Expenses
The first line of the accompanying table provides information about actual account values and actual expenses. You may use the information in this line, together with the amount you invested, to estimate the expenses that you paid over the period. Simply divide your account value by $1,000.00 (for example, an $8,600 account value divided by $1,000.00 = 8.6), then multiply the result by the number in the first line for a class/Fund under the heading entitled "Expenses Paid During Period" to estimate the expenses you paid on your account during this period. If any fund is a shareholder of any underlying mutual funds or exchange-traded funds (ETFs) (the Underlying Funds), such fund indirectly bears its proportional share of the expenses of the Underlying Funds in addition to the direct expenses incurred presented in the table. These fees and expenses are not included in the annualized expense ratio used to calculate the expense estimate in the table below.
Hypothetical Example for Comparison Purposes
The second line of the accompanying table provides information about hypothetical account values and hypothetical expenses based on the actual expense ratio and an assumed rate of return of 5% per year before expenses, which is not the actual return. The hypothetical account values and expenses may not be used to estimate the actual ending account balance or expenses you paid for the period. You may use this information to compare the ongoing costs of investing in the Fund and other funds. To do so, compare this 5% hypothetical example with the 5% hypothetical examples that appear in the shareholder reports of the other funds. If any fund is a shareholder of any Underlying Funds, such fund indirectly bears its proportional share of the expenses of the Underlying Funds in addition to the direct expenses as presented in the table. These fees and expenses are not included in the annualized expense ratio used to calculate the expense estimate in the table below.
Please note that the expenses shown in the table are meant to highlight your ongoing costs only and do not reflect any transaction costs. Therefore, the second line of the table is useful in comparing ongoing costs only, and will not help you determine the relative total costs of owning different funds. In addition, if these transactional costs were included, your costs would have been higher.
| | | | | Annualized Expense Ratio- A | | Beginning Account Value September 1, 2022 | | Ending Account Value February 28, 2023 | | Expenses Paid During Period- C September 1, 2022 to February 28, 2023 |
| | | | | | | | | | |
| Energy Portfolio | | | | .73% | | | | | | |
| Actual | | | | | | $ 1,000 | | $ 1,062.50 | | $ 3.73 |
Hypothetical- B | | | | | | $ 1,000 | | $ 1,021.17 | | $ 3.66 |
| |
A Annualized expense ratio reflects expenses net of applicable fee waivers.
B 5% return per year before expenses
C Expenses are equal to the annualized expense ratio, multiplied by the average account value over the period, multiplied by 181/ 365 (to reflect the one-half year period). The fees and expenses of any Underlying Funds are not included in each annualized expense ratio.
The dividend and capital gains distributions for the fund(s) are available on Fidelity.com or Institutional.Fidelity.com .
The fund designates 100% of the dividends distributed during the fiscal year as qualifying for the dividends-received deduction for corporate shareholders.
The fund designates 100% of the dividends distributed during the fiscal year as amounts which may be taken into account as a dividend for the purposes of the maximum rate under section 1(h)(11) of the Internal Revenue Code.
The fund will notify shareholders in January 2024 of amounts for use in preparing 2023 income tax returns.
The Securities and Exchange Commission adopted Rule 22e-4 under the Investment Company Act of 1940 (the Liquidity Rule) to promote effective liquidity risk management throughout the open-end investment company industry, thereby reducing the risk that funds will be unable to meet their redemption obligations and mitigating dilution of the interests of fund shareholders.
The Fund has adopted and implemented a liquidity risk management program (the Program) reasonably designed to assess and manage the Fund's liquidity risk and to comply with the requirements of the Liquidity Rule. The Fund's Board of Trustees (the Board) has designated the Fund's investment adviser as administrator of the Program. The Fidelity advisers have established a Liquidity Risk Management Committee (the LRM Committee) to manage the Program for each of the Fidelity Funds. The LRM Committee monitors the adequacy and effectiveness of implementation of the Program and on a periodic basis assesses each Fund's liquidity risk based on a variety of factors including (1) the Fund's investment strategy, (2) portfolio liquidity and cash flow projections during normal and reasonably foreseeable stressed conditions, (3) shareholder redemptions, (4) borrowings and other funding sources and (5) certain factors specific to ETFs including the effect of the Fund's prices and spreads, market participants, and basket compositions on the overall liquidity of the Fund's portfolio, as applicable.
In accordance with the Program, each of the Fund's portfolio investments is classified into one of four defined liquidity categories based on a determination of a reasonable expectation for how long it would take to convert the investment to cash (or sell or dispose of the investment) without significantly changing its market value.
- Highly liquid investments - cash or convertible to cash within three business days or less
- Moderately liquid investments - convertible to cash in three to seven calendar days
- Less liquid investments - can be sold or disposed of, but not settled, within seven calendar days
- Illiquid investments - cannot be sold or disposed of within seven calendar days
Liquidity classification determinations take into account a variety of factors including various market, trading and investment-specific considerations, as well as market depth, and generally utilize analysis from a third-party liquidity metrics service.
The Liquidity Rule places a 15% limit on a fund's illiquid investments and requires funds that do not primarily hold assets that are highly liquid investments to determine and maintain a minimum percentage of the fund's net assets to be invested in highly liquid investments (highly liquid investment minimum or HLIM). The Program includes provisions reasonably designed to comply with the 15% limit on illiquid investments and for determining, periodically reviewing and complying with the HLIM requirement as applicable.
At a recent meeting of the Fund's Board of Trustees, the LRM Committee provided a written report to the Board pertaining to the operation, adequacy, and effectiveness of the Program for the period December 1, 2021 through November 30, 2022. The report concluded that the Program is operating effectively and is reasonably designed to assess and manage the Fund's liquidity risk.
1.813649.118
SELNR-ANN-0423
Fidelity® Environment and Alternative Energy Fund
Fidelity® Natural Resources Fund
Annual Report
February 28, 2023
Contents
To view a fund's proxy voting guidelines and proxy voting record for the 12-month period ended June 30, visit http://www.fidelity.com/proxyvotingresults or visit the Securities and Exchange Commission's (SEC) web site at http://www.sec.gov.
You may also call 1-800-544-8544 to request a free copy of the proxy voting guidelines.
Standard & Poor's, S&P and S&P 500 are registered service marks of The McGraw-Hill Companies, Inc. and have been licensed for use by Fidelity Distributors Corporation.
Other third-party marks appearing herein are the property of their respective owners.
All other marks appearing herein are registered or unregistered trademarks or service marks of FMR LLC or an affiliated company. © 2023 FMR LLC. All rights reserved.
This report and the financial statements contained herein are submitted for the general information of the shareholders of the Funds. This report is not authorized for distribution to prospective investors in the Funds unless preceded or accompanied by an effective prospectus.
A fund files its complete schedule of portfolio holdings with the SEC for the first and third quarters of each fiscal year on Form N-PORT. Forms N-PORT are available on the SEC's web site at http://www.sec.gov. A fund's Forms N-PORT may be reviewed and copied at the SEC's Public Reference Room in Washington, DC. Information regarding the operation of the SEC's Public Reference Room may be obtained by calling 1-800-SEC-0330.
For a complete list of a fund's portfolio holdings, view the most recent holdings listing, semiannual report, or annual report on Fidelity's web site at http://www.fidelity.com, http://www.institutional.fidelity.com, or http://www.401k.com, as applicable.
NOT FDIC INSURED •MAY LOSE VALUE •NO BANK GUARANTEE
Neither the Funds nor Fidelity Distributors Corporation is a bank.
Average annual total return reflects the change in the value of an investment, assuming reinvestment of distributions from dividend income and capital gains (the profits earned upon the sale of securities that have grown in value, if any) and assuming a constant rate of performance each year. The hypothetical investment and the average annual total returns do not reflect the deduction of taxes that a shareholder would pay on fund distributions or the redemption of fund shares. During periods of reimbursement by Fidelity, a fund's total return will be greater than it would be had the reimbursement not occurred. How a fund did yesterday is no guarantee of how it will do tomorrow.
| Average Annual Total Returns |
| | | | |
Periods ended February 28, 2023 | Past 1 year | Past 5 years | Past 10 years |
| Fidelity® Environment and Alternative Energy Fund | -9.46% | 6.49% | 9.79% |
| $10,000 Over 10 Years |
| |
Let's say hypothetically that $10,000 was invested in Fidelity® Environment and Alternative Energy Fund on February 28, 2013. The chart shows how the value of your investment would have changed, and also shows how the S&P 500® Index performed over the same period. |
|
|
Fidelity® Environment and Alternative Energy Fund
Market Recap:
U.S. equities returned -7.69% for the 12 months ending February 28, 2023, according to the S&P 500 ® index. The new year began with an encouraging upturn in January (+6.28%), but stocks lost momentum in February (-2.44%) amid higher-than-expected inflation and strong jobs data. Investors took these as signs that the economy continued to run hot, even after a year of historic policy adjustment by the Federal Reserve aimed at cooling economic growth. Record inflation in 2022 prompted the Fed to aggressively tighten monetary policy, and market interest rates eclipsed their highest level in a decade, stoking recession fears and sending stocks into bear market territory. Since March 2022, the central bank has hiked its benchmark rate eight times, by 4.5 percentage points - the fastest-ever pace of monetary tightening - while also shrinking its massive asset portfolio. The latest bump came on February 2, along with a signal that the Fed plans to lift rates in March while it considers whether and when to pause increases. Against this dynamic backdrop, stocks struggled to gain traction until a strong rally ignited heading into the summer. But in September, the index returned -9.21%, one of its worst monthly results ever, before advancing 7.56% in Q4, as risky assets regained favor. For the full 12 months, value stocks handily outpaced growth. The headwind for the latter was most pronounced in the growth-oriented communication services (-25%) and consumer discretionary (-18%) sectors. In sharp contrast, energy gained 24%.
Comments from Portfolio Manager Julia Pei:
For the fiscal year ending February 28, 2023, the fund returned -9.46%, trailing the -3.95% result of the FTSE EO & Alternative Energy Index, as well as the broad-based S&P 500 ® index. The largest detractor from performance versus the industry index was stock selection in specialty chemicals. Also hindering performance was positioning in automobile manufacturers and environmental & facilities services. The fund's largest individual relative detractor was untimely positioning in Tesla, which returned -29% the past year. The company was among our biggest holdings. Another notable relative detractor was our outsized stake in Waste Management (-11%), a position we established this period. Also hampering performance was untimely positioning in IBM, which gained roughly 10%. We added to our position the past 12 months. The fund's foreign holdings also detracted overall, partly due to a broadly strong U.S. dollar. In contrast, the biggest contributor to performance versus the industry index were stock picks in semiconductors. An overweighting in industrial gases and stock picks in building products also boosted the fund's relative result. The fund's largest individual relative contributor was an overweighting in Linde, which gained 20% the past year. The company was among the fund's largest holdings. Another key contributor was our out-of-index position in onsemi (+23%). We reduced our stake this period. The fund's non-index investment in Deere gained roughly 18%. We decreased our position in the company the past 12 months. Notable changes in positioning include a higher allocation to the industrial gases and semiconductors subindustries.
Note to shareholders: On January 30, 2023, Asher Anolic came off the fund, leaving Julie Pei as sole manager.
Application of FMR's environmental, social, and governance (ESG) ratings process and/or its sustainable investing exclusion criteria may affect the Fund's exposure to certain issuers, sectors, regions, and countries and may affect the Fund's performance.
The views expressed above reflect those of the portfolio manager(s) only through the end of the period as stated on the cover of this report and do not necessarily represent the views of Fidelity or any other person in the Fidelity organization. Any such views are subject to change at any time based upon market or other conditions and Fidelity disclaims any responsibility to update such views. These views may not be relied on as investment advice and, because investment decisions for a Fidelity fund are based on numerous factors, may not be relied on as an indication of trading intent on behalf of any Fidelity fund.
Fidelity® Environment and Alternative Energy Fund
Top Holdings (% of Fund's net assets) |
| |
| Microsoft Corp. | 13.2 | |
| Tesla, Inc. | 9.3 | |
| Linde PLC | 8.0 | |
| Danaher Corp. | 7.2 | |
| Analog Devices, Inc. | 4.9 | |
| IBM Corp. | 4.9 | |
| Prologis (REIT), Inc. | 4.7 | |
| Eaton Corp. PLC | 4.3 | |
| Waste Management, Inc. | 3.7 | |
| Cummins, Inc. | 2.8 | |
| | 63.0 | |
| |
| Industries (% of Fund's net assets) |
| |
| Software | 13.5 | |
| Semiconductors & Semiconductor Equipment | 12.3 | |
| Automobiles | 9.3 | |
| Chemicals | 8.4 | |
| Life Sciences Tools & Services | 8.4 | |
| Electrical Equipment | 6.8 | |
| Commercial Services & Supplies | 5.2 | |
| Independent Power and Renewable Electricity Producers | 5.1 | |
| IT Services | 4.9 | |
| Equity Real Estate Investment Trusts (Reits) | 4.7 | |
| Building Products | 4.5 | |
| Machinery | 4.2 | |
| Electric Utilities | 3.4 | |
| Construction & Engineering | 2.6 | |
| Containers & Packaging | 1.8 | |
| Oil, Gas & Consumable Fuels | 1.7 | |
| Energy Equipment & Services | 0.9 | |
| Electronic Equipment & Components | 0.7 | |
| Metals & Mining | 0.6 | |
| Aerospace & Defense | 0.3 | |
| Professional Services | 0.1 | |
| |
Geographic Diversification (% of Fund's net assets) |
|
* Includes Short-Term investments and Net Other Assets (Liabilities). Percentages are based on country or territory of incorporation and are adjusted for the effect of derivatives, if applicable. |
| |
Fidelity® Environment and Alternative Energy Fund
Showing Percentage of Net Assets
| Common Stocks - 99.4% |
| | | Shares | Value ($) |
| Aerospace & Defense - 0.3% | | | |
| Aerospace & Defense - 0.3% | | | |
| BWX Technologies, Inc. | | 22,600 | 1,381,086 |
| Woodward, Inc. | | 1,900 | 188,100 |
| | | | 1,569,186 |
| Automobiles - 9.3% | | | |
| Automobile Manufacturers - 9.3% | | | |
| Tesla, Inc. (a) | | 214,280 | 44,079,539 |
| Building Products - 4.5% | | | |
| Building Products - 4.5% | | | |
| Owens Corning | | 54,020 | 5,282,616 |
| The AZEK Co., Inc. (a)(b) | | 134,380 | 3,237,214 |
| Trane Technologies PLC | | 69,800 | 12,910,906 |
| | | | 21,430,736 |
| Chemicals - 8.4% | | | |
| Industrial Gases - 8.0% | | | |
| Linde PLC | | 108,440 | 37,777,243 |
| Specialty Chemicals - 0.4% | | | |
| Aspen Aerogels, Inc. (a) | | 197,880 | 2,146,998 |
TOTAL CHEMICALS | | | 39,924,241 |
| Commercial Services & Supplies - 5.2% | | | |
| Environmental & Facility Services - 5.2% | | | |
| Clean Harbors, Inc. (a) | | 29,590 | 3,907,951 |
| Tetra Tech, Inc. | | 23,140 | 3,167,635 |
| Waste Management, Inc. | | 117,870 | 17,652,211 |
| | | | 24,727,797 |
| Construction & Engineering - 2.6% | | | |
| Construction & Engineering - 2.6% | | | |
| AECOM | | 98,300 | 8,489,188 |
| Quanta Services, Inc. | | 23,210 | 3,746,094 |
| | | | 12,235,282 |
| Containers & Packaging - 1.8% | | | |
| Metal & Glass Containers - 1.8% | | | |
| Ball Corp. | | 148,390 | 8,341,002 |
| Electric Utilities - 3.4% | | | |
| Electric Utilities - 3.4% | | | |
| ORSTED A/S (c) | | 68,040 | 5,922,410 |
| PG&E Corp. (a) | | 647,250 | 10,110,045 |
| | | | 16,032,455 |
| Electrical Equipment - 6.8% | | | |
| Electrical Components & Equipment - 6.1% | | | |
| Acuity Brands, Inc. | | 5,320 | 1,031,867 |
| Eaton Corp. PLC | | 115,880 | 20,270,888 |
| Fluence Energy, Inc. (a)(b) | | 123,670 | 2,308,919 |
| Hubbell, Inc. Class B | | 8,230 | 2,070,174 |
| Plug Power, Inc. (a)(b) | | 63,690 | 947,070 |
| Sunrun, Inc. (a) | | 87,510 | 2,103,740 |
| | | | 28,732,658 |
| Heavy Electrical Equipment - 0.7% | | | |
| Bloom Energy Corp. Class A (a)(b) | | 96,400 | 2,090,916 |
| NuScale Power Corp. (a)(b) | | 129,300 | 1,338,255 |
| | | | 3,429,171 |
TOTAL ELECTRICAL EQUIPMENT | | | 32,161,829 |
| Electronic Equipment & Components - 0.7% | | | |
| Electronic Equipment & Instruments - 0.7% | | | |
| Badger Meter, Inc. | | 1,120 | 136,214 |
| Itron, Inc. (a) | | 53,600 | 2,989,272 |
| | | | 3,125,486 |
| Energy Equipment & Services - 0.9% | | | |
| Oil & Gas Equipment & Services - 0.9% | | | |
| Baker Hughes Co. Class A | | 137,030 | 4,193,118 |
| Equity Real Estate Investment Trusts (REITs) - 4.7% | | | |
| Industrial REITs - 4.7% | | | |
| Prologis (REIT), Inc. | | 180,820 | 22,313,188 |
| Independent Power and Renewable Electricity Producers - 5.1% | | | |
| Independent Power Producers & Energy Traders - 3.6% | | | |
| RWE AG | | 214,500 | 9,129,516 |
| The AES Corp. | | 312,980 | 7,724,346 |
| | | | 16,853,862 |
| Renewable Electricity - 1.5% | | | |
| Brookfield Renewable Corp. | | 195,320 | 5,439,662 |
| Energy Absolute PCL NVDR | | 742,250 | 1,648,976 |
| | | | 7,088,638 |
TOTAL INDEPENDENT POWER AND RENEWABLE ELECTRICITY PRODUCERS | | | 23,942,500 |
| IT Services - 4.9% | | | |
| IT Consulting & Other Services - 4.9% | | | |
| IBM Corp. | | 179,030 | 23,148,579 |
| Life Sciences Tools & Services - 8.4% | | | |
| Life Sciences Tools & Services - 8.4% | | | |
| Agilent Technologies, Inc. | | 39,740 | 5,641,888 |
| Danaher Corp. | | 137,210 | 33,963,591 |
| | | | 39,605,479 |
| Machinery - 4.2% | | | |
| Agricultural & Farm Machinery - 0.8% | | | |
| Deere & Co. | | 9,290 | 3,894,740 |
| Construction Machinery & Heavy Trucks - 2.8% | | | |
| Cummins, Inc. | | 53,622 | 13,034,436 |
| Industrial Machinery - 0.6% | | | |
| Timken Co. | | 36,100 | 3,084,745 |
TOTAL MACHINERY | | | 20,013,921 |
| Metals & Mining - 0.6% | | | |
| Diversified Metals & Mining - 0.6% | | | |
| Lynas Rare Earths Ltd. (a) | | 500,804 | 2,750,417 |
| Oil, Gas & Consumable Fuels - 1.7% | | | |
| Oil & Gas Exploration & Production - 0.9% | | | |
| Denbury, Inc. (a) | | 49,510 | 4,127,649 |
| Oil & Gas Refining & Marketing - 0.8% | | | |
| Neste OYJ | | 80,000 | 3,866,105 |
TOTAL OIL, GAS & CONSUMABLE FUELS | | | 7,993,754 |
| Professional Services - 0.1% | | | |
| Research & Consulting Services - 0.1% | | | |
| KBR, Inc. | | 4,260 | 234,769 |
| Semiconductors & Semiconductor Equipment - 12.3% | | | |
| Semiconductor Equipment - 3.3% | | | |
| AEHR Test Systems (a) | | 8,890 | 296,482 |
| Enphase Energy, Inc. (a) | | 36,100 | 7,600,133 |
| Entegris, Inc. | | 6,100 | 519,903 |
| SolarEdge Technologies, Inc. (a) | | 22,310 | 7,092,795 |
| | | | 15,509,313 |
| Semiconductors - 9.0% | | | |
| Allegro MicroSystems LLC (a) | | 93,470 | 4,082,770 |
| Analog Devices, Inc. | | 126,910 | 23,284,178 |
| NXP Semiconductors NV | | 20,220 | 3,608,866 |
| onsemi (a) | | 150,350 | 11,638,594 |
| | | | 42,614,408 |
TOTAL SEMICONDUCTORS & SEMICONDUCTOR EQUIPMENT | | | 58,123,721 |
| Software - 13.5% | | | |
| Application Software - 0.3% | | | |
| Aspen Technology, Inc. (a) | | 6,230 | 1,320,822 |
| Systems Software - 13.2% | | | |
| Microsoft Corp. | | 250,920 | 62,584,466 |
TOTAL SOFTWARE | | | 63,905,288 |
| TOTAL COMMON STOCKS (Cost $414,381,496) | | | 469,852,287 |
| | | | |
| Convertible Preferred Stocks - 0.0% |
| | | Shares | Value ($) |
| Electronic Equipment & Components - 0.0% | | | |
| Electronic Components - 0.0% | | | |
CelLink Corp. Series D (a)(d)(e) (Cost $295,699) | | 14,200 | 184,884 |
| | | | |
| Money Market Funds - 1.2% |
| | | Shares | Value ($) |
| Fidelity Cash Central Fund 4.63% (f) | | 480,542 | 480,638 |
| Fidelity Securities Lending Cash Central Fund 4.63% (f)(g) | | 5,109,814 | 5,110,325 |
| TOTAL MONEY MARKET FUNDS (Cost $5,590,963) | | | 5,590,963 |
| | | | |
| TOTAL INVESTMENT IN SECURITIES - 100.6% (Cost $420,268,158) | 475,628,134 |
NET OTHER ASSETS (LIABILITIES) - (0.6)% | (3,024,304) |
| NET ASSETS - 100.0% | 472,603,830 |
| | |
Legend
| (b) | Security or a portion of the security is on loan at period end. |
| (c) | Security exempt from registration under Rule 144A of the Securities Act of 1933. These securities may be resold in transactions exempt from registration, normally to qualified institutional buyers. At the end of the period, the value of these securities amounted to $5,922,410 or 1.3% of net assets. |
| (d) | Restricted securities (including private placements) - Investment in securities not registered under the Securities Act of 1933 (excluding 144A issues). At the end of the period, the value of restricted securities (excluding 144A issues) amounted to $184,884 or 0.0% of net assets. |
| (f) | Affiliated fund that is generally available only to investment companies and other accounts managed by Fidelity Investments. The rate quoted is the annualized seven-day yield of the fund at period end. A complete unaudited listing of the fund's holdings as of its most recent quarter end is available upon request. In addition, each Fidelity Central Fund's financial statements, which are not covered by the Fund's Report of Independent Registered Public Accounting Firm, are available on the SEC's website or upon request. |
| (g) | Investment made with cash collateral received from securities on loan. |
| Additional information on each restricted holding is as follows: |
| Security | Acquisition Date | Acquisition Cost ($) |
| CelLink Corp. Series D | 1/20/22 | 295,699 |
| | | |
Affiliated Central Funds
Fiscal year to date information regarding the Fund's investments in Fidelity Central Funds, including the ownership percentage, is presented below.
| Affiliate | Value, beginning of period ($) | Purchases ($) | Sales Proceeds ($) | Dividend Income ($) | Realized Gain (loss) ($) | Change in Unrealized appreciation (depreciation) ($) | Value, end of period ($) | % ownership, end of period |
| Fidelity Cash Central Fund 4.63% | 620,575 | 67,251,993 | 67,391,930 | 39,672 | - | - | 480,638 | 0.0% |
| Fidelity Securities Lending Cash Central Fund 4.63% | 1,297,050 | 85,681,854 | 81,868,579 | 90,570 | - | - | 5,110,325 | 0.0% |
| Total | 1,917,625 | 152,933,847 | 149,260,509 | 130,242 | - | - | 5,590,963 | |
| | | | | | | | | |
Amounts in the dividend income column in the above table include any capital gain distributions from underlying funds, which are presented in the corresponding line item in the Statement of Operations, if applicable.
Amount for Fidelity Securities Lending Cash Central Fund represents the income earned on investing cash collateral, less rebates paid to borrowers and any lending agent fees associated with the loan, plus any premium payments received for lending certain types of securities.
Amounts included in the purchases and sales proceeds columns may include in-kind transactions, if applicable.
Investment Valuation
The following is a summary of the inputs used, as of February 28, 2023, involving the Fund's assets and liabilities carried at fair value. The inputs or methodology used for valuing securities may not be an indication of the risk associated with investing in those securities. For more information on valuation inputs, and their aggregation into the levels used below, please refer to the Investment Valuation section in the accompanying Notes to Financial Statements.
| Valuation Inputs at Reporting Date: |
| Description | Total ($) | Level 1 ($) | Level 2 ($) | Level 3 ($) |
Investments in Securities: | | | | |
|
| Common Stocks | 469,852,287 | 461,179,460 | 8,672,827 | - |
|
| Convertible Preferred Stocks | 184,884 | - | - | 184,884 |
|
| Money Market Funds | 5,590,963 | 5,590,963 | - | - |
| Total Investments in Securities: | 475,628,134 | 466,770,423 | 8,672,827 | 184,884 |
Fidelity® Environment and Alternative Energy Fund
| Statement of Assets and Liabilities |
| | | | February 28, 2023 |
| | | | | |
| Assets | | | | |
| Investment in securities, at value (including securities loaned of $4,979,104) - See accompanying schedule: | | | | |
Unaffiliated issuers (cost $414,677,195) | $ | 470,037,171 | | |
Fidelity Central Funds (cost $5,590,963) | | 5,590,963 | | |
| | | | | |
| | | | | |
| Total Investment in Securities (cost $420,268,158) | | | $ | 475,628,134 |
| Foreign currency held at value (cost $5) | | | | 5 |
| Receivable for investments sold | | | | 2,534,870 |
| Receivable for fund shares sold | | | | 392,830 |
| Dividends receivable | | | | 862,834 |
| Distributions receivable from Fidelity Central Funds | | | | 14,280 |
| Prepaid expenses | | | | 971 |
Total assets | | | | 479,433,924 |
| Liabilities | | | | |
| Payable for investments purchased | $ | 938,726 | | |
| Payable for fund shares redeemed | | 431,903 | | |
| Accrued management fee | | 211,529 | | |
| Other affiliated payables | | 109,366 | | |
| Other payables and accrued expenses | | 28,245 | | |
| Collateral on securities loaned | | 5,110,325 | | |
| Total Liabilities | | | | 6,830,094 |
| Net Assets | | | $ | 472,603,830 |
| Net Assets consist of: | | | | |
| Paid in capital | | | $ | 546,618,489 |
| Total accumulated earnings (loss) | | | | (74,014,659) |
| Net Assets | | | $ | 472,603,830 |
Net Asset Value , offering price and redemption price per share ($472,603,830 ÷ 16,968,880 shares) | | | $ | 27.85 |
| Statement of Operations |
| | | | Year ended February 28, 2023 |
| Investment Income | | | | |
| Dividends | | | $ | 7,913,482 |
| Income from Fidelity Central Funds (including $90,570 from security lending) | | | | 130,242 |
| Total Income | | | | 8,043,724 |
| Expenses | | | | |
| Management fee | $ | 3,228,120 | | |
| Transfer agent fees | | 1,318,834 | | |
| Accounting fees | | 209,780 | | |
| Custodian fees and expenses | | 19,239 | | |
| Independent trustees' fees and expenses | | 2,143 | | |
| Registration fees | | 35,306 | | |
| Audit | | 47,712 | | |
| Legal | | 2,510 | | |
| Interest | | 6,784 | | |
| Miscellaneous | | 3,135 | | |
| Total expenses before reductions | | 4,873,563 | | |
| Expense reductions | | (22,188) | | |
| Total expenses after reductions | | | | 4,851,375 |
| Net Investment income (loss) | | | | 3,192,349 |
| Realized and Unrealized Gain (Loss) | | | | |
| Net realized gain (loss) on: | | | | |
| Investment Securities: | | | | |
| Unaffiliated issuers (net of foreign taxes of $24,438) | | (103,176,826) | | |
| Foreign currency transactions | | (9,970) | | |
| Total net realized gain (loss) | | | | (103,186,796) |
| Change in net unrealized appreciation (depreciation) on: | | | | |
| Investment Securities: | | | | |
| Unaffiliated issuers (net of decrease in deferred foreign taxes of $15,075) | | 14,332,944 | | |
| Assets and liabilities in foreign currencies | | (5,090) | | |
| Total change in net unrealized appreciation (depreciation) | | | | 14,327,854 |
| Net gain (loss) | | | | (88,858,942) |
| Net increase (decrease) in net assets resulting from operations | | | $ | (85,666,593) |
| Statement of Changes in Net Assets |
| |
| | Year ended February 28, 2023 | | Year ended February 28, 2022 |
| Increase (Decrease) in Net Assets | | | | |
| Operations | | | | |
| Net investment income (loss) | $ | 3,192,349 | $ | 2,066,511 |
| Net realized gain (loss) | | (103,186,796) | | 45,207,872 |
| Change in net unrealized appreciation (depreciation) | | 14,327,854 | | (30,454,510) |
| Net increase (decrease) in net assets resulting from operations | | (85,666,593) | | 16,819,873 |
| Distributions to shareholders | | (3,228,177) | | (64,644,758) |
| Share transactions | | | | |
| Proceeds from sales of shares | | 106,568,582 | | 631,087,095 |
| Reinvestment of distributions | | 3,006,815 | | 61,338,201 |
| Cost of shares redeemed | | (303,818,497) | | (262,840,215) |
Net increase (decrease) in net assets resulting from share transactions | | (194,243,100) | | 429,585,081 |
| Total increase (decrease) in net assets | | (283,137,870) | | 381,760,196 |
| | | | | |
| Net Assets | | | | |
| Beginning of period | | 755,741,700 | | 373,981,504 |
| End of period | $ | 472,603,830 | $ | 755,741,700 |
| | | | | |
| Other Information | | | | |
| Shares | | | | |
| Sold | | 3,656,658 | | 18,010,951 |
| Issued in reinvestment of distributions | | 111,940 | | 1,802,725 |
| Redeemed | | (11,200,238) | | (7,814,961) |
| Net increase (decrease) | | (7,431,640) | | 11,998,715 |
| | | | | |
Financial Highlights
| Fidelity® Environment and Alternative Energy Fund |
| |
| Years ended February 28, | | 2023 | | 2022 | | 2021 | | 2020 A | | 2019 |
Selected Per-Share Data | | | | | | | | | | |
| Net asset value, beginning of period | $ | 30.97 | $ | 30.16 | $ | 23.80 | $ | 24.92 | $ | 26.31 |
| Income from Investment Operations | | | | | | | | | | |
Net investment income (loss) B,C | | .15 | | .11 | | .24 | | .27 | | .24 |
| Net realized and unrealized gain (loss) | | (3.09) | | 3.46 | | 8.02 | | (.81) | | (.25) |
| Total from investment operations | | (2.94) | | 3.57 | | 8.26 | | (.54) | | (.01) |
| Distributions from net investment income | | (.18) | | (.10) | | (.26) | | (.23) | | (.22) |
| Distributions from net realized gain | | - | | (2.66) | | (1.64) | | (.35) | | (1.16) |
| Total distributions | | (.18) | | (2.76) | | (1.90) | | (.58) | | (1.38) |
| Net asset value, end of period | $ | 27.85 | $ | 30.97 | $ | 30.16 | $ | 23.80 | $ | 24.92 |
Total Return D | | (9.46)% | | 11.02% | | 38.97% | | (2.35)% | | .39% |
Ratios to Average Net Assets C,E,F | | | | | | | | | | |
| Expenses before reductions | | .79% | | .79% | | .85% | | .85% | | .87% |
| Expenses net of fee waivers, if any | | .79% | | .79% | | .85% | | .85% | | .87% |
| Expenses net of all reductions | | .79% | | .79% | | .85% | | .85% | | .87% |
| Net investment income (loss) | | .52% | | .33% | | .95% | | 1.08% | | .96% |
| Supplemental Data | | | | | | | | | | |
| Net assets, end of period (000 omitted) | $ | 472,604 | $ | 755,742 | $ | 373,982 | $ | 181,456 | $ | 160,960 |
Portfolio turnover rate G | | 34% | | 89% | | 28% | | 49% | | 62% |
A For the year ended February 29.
B Calculated based on average shares outstanding during the period.
C Net investment income (loss) is affected by the timing of the declaration of dividends by any underlying mutual funds or exchange-traded funds (ETFs). Net investment income (loss) of any mutual funds or ETFs is not included in the Fund's net investment income (loss) ratio.
D Total returns would have been lower if certain expenses had not been reduced during the applicable periods shown.
E Fees and expenses of any underlying mutual funds or exchange-traded funds (ETFs) are not included in the Fund's expense ratio. The Fund indirectly bears its proportionate share of these expenses. For additional expense information related to investments in Fidelity Central Funds, please refer to the "Investments in Fidelity Central Funds" note found in the Notes to Financial Statements section of the most recent Annual or Semi-Annual report.
F Expense ratios reflect operating expenses of the class. Expenses before reductions do not reflect amounts reimbursed, waived, or reduced through arrangements with the investment adviser, brokerage services, or other offset arrangements, if applicable, and do not represent the amount paid by the class during periods when reimbursements, waivers or reductions occur.
G Amount does not include the portfolio activity of any underlying mutual funds or exchange-traded funds (ETFs).
Average annual total return reflects the change in the value of an investment, assuming reinvestment of distributions from dividend income and capital gains (the profits earned upon the sale of securities that have grown in value, if any) and assuming a constant rate of performance each year. The hypothetical investment and the average annual total returns do not reflect the deduction of taxes that a shareholder would pay on fund distributions or the redemption of fund shares. During periods of reimbursement by Fidelity, a fund's total return will be greater than it would be had the reimbursement not occurred. How a fund did yesterday is no guarantee of how it will do tomorrow.
| Average Annual Total Returns |
| | | | |
Periods ended February 28, 2023 | Past 1 year | Past 5 years | Past 10 years |
| Fidelity® Natural Resources Fund | 19.78% | 9.58% | 3.68% |
| $10,000 Over 10 Years |
| |
Let's say hypothetically that $10,000 was invested in Fidelity® Natural Resources Fund on February 28, 2013. The chart shows how the value of your investment would have changed, and also shows how the S&P 500® Index performed over the same period. |
|
|
Fidelity® Natural Resources Fund
Market Recap:
U.S. equities returned -7.69% for the 12 months ending February 28, 2023, according to the S&P 500 ® index. The new year began with an encouraging upturn in January (+6.28%), but stocks lost momentum in February (-2.44%) amid higher-than-expected inflation and strong jobs data. Investors took these as signs that the economy continued to run hot, even after a year of historic policy adjustment by the Federal Reserve aimed at cooling economic growth. Record inflation in 2022 prompted the Fed to aggressively tighten monetary policy, and market interest rates eclipsed their highest level in a decade, stoking recession fears and sending stocks into bear market territory. Since March 2022, the central bank has hiked its benchmark rate eight times, by 4.5 percentage points - the fastest-ever pace of monetary tightening - while also shrinking its massive asset portfolio. The latest bump came on February 2, along with a signal that the Fed plans to lift rates in March while it considers whether and when to pause increases. Against this dynamic backdrop, stocks struggled to gain traction until a strong rally ignited heading into the summer. But in September, the index returned -9.21%, one of its worst monthly results ever, before advancing 7.56% in Q4, as risky assets regained favor. For the full 12 months, value stocks handily outpaced growth. The headwind for the latter was most pronounced in the growth-oriented communication services (-25%) and consumer discretionary (-18%) sectors. In sharp contrast, energy gained 24%.
Comments from Portfolio Manager Ashley Fernandes:
For the fiscal year ending February 28, 2023, the fund gained 19.78%, notably outpacing the 10.19% advance of the S&P North American Natural Resources Sector Index and outperforming the broad-based S&P 500 ® index by a wide margin. The top contributors to performance versus the industry index were stock picks and an overweighting in oil & gas exploration & production. Stock picks and an overweighting in oil & gas equipment & services and an underweighting in gold also bolstered the fund's relative result. The fund's biggest individual relative contributor was an outsized stake in Exxon Mobil, which gained 45% the past year and was the fund's largest holding. Also boosting value was our overweight in Hess, which gained 35% and was another of our biggest holdings. An outsized stake in Weatherford International (+133%) also added notable value. This period we increased our stake in the company. In contrast, the largest detractors from performance versus the industry index were an overweighting and stock selection in copper. An overweighting and stock picks in diversified metals & mining also hampered the fund's relative performance. The fund's largest individual relative detractor was an overweighting in Freeport-McMoRan, which returned -12% the past 12 months. The company was among our biggest holdings. Our second-largest relative detractor was avoiding Marathon Petroleum, an index component that gained roughly 63%. An out-of-index investment in First Quantum Minerals (-25%) also hurt. Notable changes in positioning include a higher allocation to the oil & gas equipment & services and oil & gas refining & marketing subindustries.
The views expressed above reflect those of the portfolio manager(s) only through the end of the period as stated on the cover of this report and do not necessarily represent the views of Fidelity or any other person in the Fidelity organization. Any such views are subject to change at any time based upon market or other conditions and Fidelity disclaims any responsibility to update such views. These views may not be relied on as investment advice and, because investment decisions for a Fidelity fund are based on numerous factors, may not be relied on as an indication of trading intent on behalf of any Fidelity fund.
Fidelity® Natural Resources Fund
Top Holdings (% of Fund's net assets) |
| |
| Exxon Mobil Corp. | 19.0 | |
| Hess Corp. | 8.4 | |
| Canadian Natural Resources Ltd. | 7.9 | |
| Imperial Oil Ltd. | 6.3 | |
| Freeport-McMoRan, Inc. | 4.7 | |
| Phillips 66 Co. | 4.6 | |
| Schlumberger Ltd. | 4.6 | |
| Valero Energy Corp. | 4.5 | |
| MEG Energy Corp. | 4.3 | |
| Kosmos Energy Ltd. | 3.3 | |
| | 67.6 | |
| |
| Industries (% of Fund's net assets) |
| |
| Oil, Gas & Consumable Fuels | 64.7 | |
| Energy Equipment & Services | 12.9 | |
| Metals & Mining | 11.7 | |
| Chemicals | 4.2 | |
| Containers & Packaging | 4.1 | |
| |
Geographic Diversification (% of Fund's net assets) |
|
* Includes Short-Term investments and Net Other Assets (Liabilities). Percentages are based on country or territory of incorporation and are adjusted for the effect of derivatives, if applicable. |
| |
Fidelity® Natural Resources Fund
Showing Percentage of Net Assets
| Common Stocks - 97.6% |
| | | Shares | Value ($) |
| Chemicals - 4.2% | | | |
| Commodity Chemicals - 1.7% | | | |
| Chemtrade Logistics Income Fund | | 828,800 | 5,575,950 |
| LyondellBasell Industries NV Class A | | 89,600 | 8,600,704 |
| | | | 14,176,654 |
| Diversified Chemicals - 0.5% | | | |
| The Chemours Co. LLC | | 109,800 | 3,752,964 |
| Fertilizers & Agricultural Chemicals - 0.5% | | | |
| CF Industries Holdings, Inc. | | 48,900 | 4,200,021 |
| Industrial Gases - 1.1% | | | |
| Linde PLC | | 24,900 | 8,674,413 |
| Specialty Chemicals - 0.4% | | | |
| Celanese Corp. Class A | | 30,600 | 3,556,638 |
TOTAL CHEMICALS | | | 34,360,690 |
| Containers & Packaging - 4.1% | | | |
| Metal & Glass Containers - 2.3% | | | |
| Aptargroup, Inc. | | 85,400 | 9,967,888 |
| Crown Holdings, Inc. | | 9,600 | 830,496 |
| Greif, Inc. Class A | | 107,200 | 7,616,560 |
| | | | 18,414,944 |
| Paper Packaging - 1.8% | | | |
| Avery Dennison Corp. | | 55,200 | 10,056,888 |
| Sealed Air Corp. | | 94,100 | 4,575,142 |
| | | | 14,632,030 |
TOTAL CONTAINERS & PACKAGING | | | 33,046,974 |
| Energy Equipment & Services - 12.9% | | | |
| Oil & Gas Drilling - 0.7% | | | |
| Diamond Offshore Drilling, Inc. (a) | | 100,900 | 1,198,692 |
| Valaris Ltd. (a) | | 58,800 | 3,954,300 |
| | | | 5,152,992 |
| Oil & Gas Equipment & Services - 12.2% | | | |
| Expro Group Holdings NV (a) | | 1,083,300 | 24,623,409 |
| Schlumberger Ltd. | | 701,000 | 37,300,210 |
| TechnipFMC PLC (a) | | 902,500 | 13,799,225 |
| Weatherford International PLC (a) | | 355,164 | 23,661,026 |
| | | | 99,383,870 |
TOTAL ENERGY EQUIPMENT & SERVICES | | | 104,536,862 |
| Metals & Mining - 11.7% | | | |
| Copper - 7.1% | | | |
| First Quantum Minerals Ltd. | | 880,500 | 19,236,134 |
| Freeport-McMoRan, Inc. | | 934,700 | 38,294,659 |
| | | | 57,530,793 |
| Diversified Metals & Mining - 3.4% | | | |
| Glencore PLC | | 3,422,800 | 20,406,274 |
| Horizonte Minerals PLC (a) | | 1,579,600 | 2,764,532 |
| Ivanhoe Mines Ltd. (a) | | 551,000 | 4,603,444 |
| | | | 27,774,250 |
| Gold - 1.2% | | | |
| Franco-Nevada Corp. | | 77,900 | 9,943,454 |
TOTAL METALS & MINING | | | 95,248,497 |
| Oil, Gas & Consumable Fuels - 64.7% | | | |
| Coal & Consumable Fuels - 0.6% | | | |
| Cameco Corp. (b) | | 180,553 | 4,936,319 |
| Integrated Oil & Gas - 27.3% | | | |
| Equinor ASA sponsored ADR | | 536,600 | 16,371,666 |
| Exxon Mobil Corp. | | 1,402,800 | 154,181,747 |
| Imperial Oil Ltd. | | 1,032,400 | 51,063,889 |
| | | | 221,617,302 |
| Oil & Gas Exploration & Production - 27.1% | | | |
| Africa Oil Corp. | | 5,977,121 | 12,221,449 |
| Canadian Natural Resources Ltd. | | 1,131,200 | 63,924,112 |
| Deltic Energy PLC (a) | | 24,667,915 | 697,287 |
| Eco Atlantic Oil & Gas Ltd. (a) | | 3,803,000 | 1,031,228 |
| Hess Corp. | | 505,800 | 68,131,260 |
| Kosmos Energy Ltd. (a) | | 3,452,500 | 27,171,175 |
| MEG Energy Corp. (a) | | 2,194,012 | 34,666,837 |
| Talos Energy, Inc. (a) | | 103,900 | 1,850,459 |
| Tourmaline Oil Corp. | | 242,100 | 10,610,172 |
| | | | 220,303,979 |
| Oil & Gas Refining & Marketing - 9.7% | | | |
| Delek U.S. Holdings, Inc. | | 65,200 | 1,641,084 |
| PBF Energy, Inc. Class A | | 82,900 | 3,623,559 |
| Phillips 66 Co. | | 366,616 | 37,600,137 |
| Valero Energy Corp. | | 276,100 | 36,370,653 |
| | | | 79,235,433 |
TOTAL OIL, GAS & CONSUMABLE FUELS | | | 526,093,033 |
| TOTAL COMMON STOCKS (Cost $561,836,770) | | | 793,286,056 |
| | | | |
| Money Market Funds - 1.7% |
| | | Shares | Value ($) |
| Fidelity Cash Central Fund 4.63% (c) | | 8,696,194 | 8,697,934 |
| Fidelity Securities Lending Cash Central Fund 4.63% (c)(d) | | 5,143,736 | 5,144,250 |
| TOTAL MONEY MARKET FUNDS (Cost $13,842,184) | | | 13,842,184 |
| | | | |
| TOTAL INVESTMENT IN SECURITIES - 99.3% (Cost $575,678,954) | 807,128,240 |
NET OTHER ASSETS (LIABILITIES) - 0.7% | 5,300,840 |
| NET ASSETS - 100.0% | 812,429,080 |
| | |
Legend
| (b) | Security or a portion of the security is on loan at period end. |
| (c) | Affiliated fund that is generally available only to investment companies and other accounts managed by Fidelity Investments. The rate quoted is the annualized seven-day yield of the fund at period end. A complete unaudited listing of the fund's holdings as of its most recent quarter end is available upon request. In addition, each Fidelity Central Fund's financial statements, which are not covered by the Fund's Report of Independent Registered Public Accounting Firm, are available on the SEC's website or upon request. |
| (d) | Investment made with cash collateral received from securities on loan. |
Affiliated Central Funds
Fiscal year to date information regarding the Fund's investments in Fidelity Central Funds, including the ownership percentage, is presented below.
| Affiliate | Value, beginning of period ($) | Purchases ($) | Sales Proceeds ($) | Dividend Income ($) | Realized Gain (loss) ($) | Change in Unrealized appreciation (depreciation) ($) | Value, end of period ($) | % ownership, end of period |
| Fidelity Cash Central Fund 4.63% | 5,185,303 | 220,931,359 | 217,418,728 | 197,425 | - | - | 8,697,934 | 0.0% |
| Fidelity Securities Lending Cash Central Fund 4.63% | 18,439,385 | 152,215,332 | 165,510,467 | 39,015 | - | - | 5,144,250 | 0.0% |
| Total | 23,624,688 | 373,146,691 | 382,929,195 | 236,440 | - | - | 13,842,184 | |
| | | | | | | | | |
Amounts in the dividend income column in the above table include any capital gain distributions from underlying funds, which are presented in the corresponding line item in the Statement of Operations, if applicable.
Amount for Fidelity Securities Lending Cash Central Fund represents the income earned on investing cash collateral, less rebates paid to borrowers and any lending agent fees associated with the loan, plus any premium payments received for lending certain types of securities.
Amounts included in the purchases and sales proceeds columns may include in-kind transactions, if applicable.
Investment Valuation
The following is a summary of the inputs used, as of February 28, 2023, involving the Fund's assets and liabilities carried at fair value. The inputs or methodology used for valuing securities may not be an indication of the risk associated with investing in those securities. For more information on valuation inputs, and their aggregation into the levels used below, please refer to the Investment Valuation section in the accompanying Notes to Financial Statements.
| Valuation Inputs at Reporting Date: |
| Description | Total ($) | Level 1 ($) | Level 2 ($) | Level 3 ($) |
Investments in Securities: | | | | |
|
| Common Stocks | 793,286,056 | 772,879,782 | 20,406,274 | - |
|
| Money Market Funds | 13,842,184 | 13,842,184 | - | - |
| Total Investments in Securities: | 807,128,240 | 786,721,966 | 20,406,274 | - |
Fidelity® Natural Resources Fund
| Statement of Assets and Liabilities |
| | | | February 28, 2023 |
| | | | | |
| Assets | | | | |
| Investment in securities, at value (including securities loaned of $4,934,870) - See accompanying schedule: | | | | |
Unaffiliated issuers (cost $561,836,770) | $ | 793,286,056 | | |
Fidelity Central Funds (cost $13,842,184) | | 13,842,184 | | |
| | | | | |
| | | | | |
| Total Investment in Securities (cost $575,678,954) | | | $ | 807,128,240 |
| Foreign currency held at value (cost $19) | | | | 24 |
| Receivable for investments sold | | | | 7,205,808 |
| Receivable for fund shares sold | | | | 5,706,694 |
| Dividends receivable | | | | 2,250,622 |
| Distributions receivable from Fidelity Central Funds | | | | 55,230 |
| Prepaid expenses | | | | 2,774 |
| Other receivables | | | | 82,424 |
Total assets | | | | 822,431,816 |
| Liabilities | | | | |
| Payable for investments purchased | $ | 3,485,880 | | |
| Payable for fund shares redeemed | | 749,305 | | |
| Accrued management fee | | 362,016 | | |
| Other affiliated payables | | 143,227 | | |
| Other payables and accrued expenses | | 118,058 | | |
| Collateral on securities loaned | | 5,144,250 | | |
| Total Liabilities | | | | 10,002,736 |
| Net Assets | | | $ | 812,429,080 |
| Net Assets consist of: | | | | |
| Paid in capital | | | $ | 853,225,602 |
| Total accumulated earnings (loss) | | | | (40,796,522) |
| Net Assets | | | $ | 812,429,080 |
Net Asset Value , offering price and redemption price per share ($812,429,080 ÷ 20,321,529 shares) | | | $ | 39.98 |
| Statement of Operations |
| | | | Year ended February 28, 2023 |
| Investment Income | | | | |
| Dividends | | | $ | 22,061,786 |
| Income from Fidelity Central Funds (including $39,015 from security lending) | | | | 236,440 |
| Total Income | | | | 22,298,226 |
| Expenses | | | | |
| Management fee | $ | 3,952,551 | | |
| Transfer agent fees | | 1,371,619 | | |
| Accounting fees | | 243,740 | | |
| Custodian fees and expenses | | 32,889 | | |
| Independent trustees' fees and expenses | | 2,488 | | |
| Registration fees | | 93,794 | | |
| Audit | | 50,627 | | |
| Legal | | 788 | | |
| Interest | | 10,132 | | |
| Miscellaneous | | 3,735 | | |
| Total expenses before reductions | | 5,762,363 | | |
| Expense reductions | | (25,812) | | |
| Total expenses after reductions | | | | 5,736,551 |
| Net Investment income (loss) | | | | 16,561,675 |
| Realized and Unrealized Gain (Loss) | | | | |
| Net realized gain (loss) on: | | | | |
| Investment Securities: | | | | |
| Unaffiliated issuers | | 16,006,711 | | |
| Foreign currency transactions | | (73,780) | | |
| Total net realized gain (loss) | | | | 15,932,931 |
| Change in net unrealized appreciation (depreciation) on: | | | | |
| Investment Securities: | | | | |
| Unaffiliated issuers | | 64,591,935 | | |
| Assets and liabilities in foreign currencies | | (1,683) | | |
| Total change in net unrealized appreciation (depreciation) | | | | 64,590,252 |
| Net gain (loss) | | | | 80,523,183 |
| Net increase (decrease) in net assets resulting from operations | | | $ | 97,084,858 |
| Statement of Changes in Net Assets |
| |
| | Year ended February 28, 2023 | | Year ended February 28, 2022 |
| Increase (Decrease) in Net Assets | | | | |
| Operations | | | | |
| Net investment income (loss) | $ | 16,561,675 | $ | 7,161,576 |
| Net realized gain (loss) | | 15,932,931 | | 22,873,313 |
| Change in net unrealized appreciation (depreciation) | | 64,590,252 | | 124,171,738 |
| Net increase (decrease) in net assets resulting from operations | | 97,084,858 | | 154,206,627 |
| Distributions to shareholders | | (18,584,123) | | (5,734,164) |
| Share transactions | | | | |
| Proceeds from sales of shares | | 634,417,680 | | 383,163,467 |
| Reinvestment of distributions | | 17,432,108 | | 5,352,192 |
| Cost of shares redeemed | | (515,954,973) | | (231,841,612) |
Net increase (decrease) in net assets resulting from share transactions | | 135,894,815 | | 156,674,047 |
| Total increase (decrease) in net assets | | 214,395,550 | | 305,146,510 |
| | | | | |
| Net Assets | | | | |
| Beginning of period | | 598,033,530 | | 292,887,020 |
| End of period | $ | 812,429,080 | $ | 598,033,530 |
| | | | | |
| Other Information | | | | |
| Shares | | | | |
| Sold | | 16,884,073 | | 13,086,738 |
| Issued in reinvestment of distributions | | 466,676 | | 199,634 |
| Redeemed | | (14,503,991) | | (8,430,799) |
| Net increase (decrease) | | 2,846,758 | | 4,855,573 |
| | | | | |
Financial Highlights
| Fidelity® Natural Resources Fund |
| |
| Years ended February 28, | | 2023 | | 2022 | | 2021 | | 2020 A | | 2019 |
Selected Per-Share Data | | | | | | | | | | |
| Net asset value, beginning of period | $ | 34.22 | $ | 23.21 | $ | 20.59 | $ | 25.55 | $ | 27.51 |
| Income from Investment Operations | | | | | | | | | | |
Net investment income (loss) B,C | | .83 | | .51 | | .30 | | .30 | | .29 |
| Net realized and unrealized gain (loss) | | 5.87 | | 10.91 | | 2.69 | | (4.88) | | (1.97) |
| Total from investment operations | | 6.70 | | 11.42 | | 2.99 | | (4.58) | | (1.68) |
| Distributions from net investment income | | (.94) | | (.41) | | (.37) | | (.30) | | (.28) |
| Distributions from net realized gain | | - | | - | | - | | (.08) | | - D |
| Total distributions | | (.94) | | (.41) | | (.37) | | (.38) | | (.28) |
| Net asset value, end of period | $ | 39.98 | $ | 34.22 | $ | 23.21 | $ | 20.59 | $ | 25.55 |
Total Return E | | 19.78% | | 49.71% | | 14.76% | | (18.25)% | | (6.06)% |
Ratios to Average Net Assets C,F,G | | | | | | | | | | |
| Expenses before reductions | | .77% | | .82% | | .89% | | .84% | | .81% |
| Expenses net of fee waivers, if any | | .77% | | .81% | | .89% | | .84% | | .81% |
| Expenses net of all reductions | | .77% | | .81% | | .88% | | .84% | | .80% |
| Net investment income (loss) | | 2.21% | | 1.84% | | 1.62% | | 1.18% | | 1.02% |
| Supplemental Data | | | | | | | | | | |
| Net assets, end of period (000 omitted) | $ | 812,429 | $ | 598,034 | $ | 292,887 | $ | 315,533 | $ | 424,167 |
Portfolio turnover rate H | | 74% | | 98% | | 90% | | 8% | | 26% |
A For the year ended February 29.
B Calculated based on average shares outstanding during the period.
C Net investment income (loss) is affected by the timing of the declaration of dividends by any underlying mutual funds or exchange-traded funds (ETFs). Net investment income (loss) of any mutual funds or ETFs is not included in the Fund's net investment income (loss) ratio.
D Amount represents less than $.005 per share.
E Total returns would have been lower if certain expenses had not been reduced during the applicable periods shown.
F Fees and expenses of any underlying mutual funds or exchange-traded funds (ETFs) are not included in the Fund's expense ratio. The Fund indirectly bears its proportionate share of these expenses. For additional expense information related to investments in Fidelity Central Funds, please refer to the "Investments in Fidelity Central Funds" note found in the Notes to Financial Statements section of the most recent Annual or Semi-Annual report.
G Expense ratios reflect operating expenses of the class. Expenses before reductions do not reflect amounts reimbursed, waived, or reduced through arrangements with the investment adviser, brokerage services, or other offset arrangements, if applicable, and do not represent the amount paid by the class during periods when reimbursements, waivers or reductions occur.
H Amount does not include the portfolio activity of any underlying mutual funds or exchange-traded funds (ETFs).
For the period ended February 28, 2023
1. Organization.
Fidelity Environment and Alternative Energy Fund and Fidelity Natural Resources Fund (the Funds) are non-diversified funds of Fidelity Select Portfolios (the Trust). Each Fund is authorized to issue an unlimited number of shares. Share transactions on the Statement of Changes in Net Assets may contain exchanges between affiliated funds. The Trust is registered under the Investment Company Act of 1940, as amended (the 1940 Act), as an open-end management investment company organized as a Massachusetts business trust. The Funds invest primarily in securities of companies whose principal business activities fall within specific industries. Fidelity Natural Resources Fund may also invest in certain precious metals.
2. Investments in Fidelity Central Funds.
Funds may invest in Fidelity Central Funds, which are open-end investment companies generally available only to other investment companies and accounts managed by the investment adviser and its affiliates. The Schedule of Investments lists any Fidelity Central Funds held as an investment as of period end, but does not include the underlying holdings of each Fidelity Central Fund. An investing fund indirectly bears its proportionate share of the expenses of the underlying Fidelity Central Funds.
Based on its investment objective, each Fidelity Central Fund may invest or participate in various investment vehicles or strategies that are similar to those of the investing fund. These strategies are consistent with the investment objectives of the investing fund and may involve certain economic risks which may cause a decline in value of each of the Fidelity Central Funds and thus a decline in the value of the investing fund.
| Fidelity Central Fund | Investment Manager | Investment Objective | Investment Practices | Expense Ratio A |
| Fidelity Money Market Central Funds | Fidelity Management & Research Company LLC (FMR) | Each fund seeks to obtain a high level of current income consistent with the preservation of capital and liquidity. | Short-term Investments | Less than .005% |
A Expenses expressed as a percentage of average net assets and are as of each underlying Central Fund's most recent annual or semi-annual shareholder report.
A complete unaudited list of holdings for each Fidelity Central Fund is available upon request or at the Securities and Exchange Commission website at www.sec.gov. In addition, the financial statements of the Fidelity Central Funds which contain the significant accounting policies (including investment valuation policies) of those funds, and are not covered by the Report of Independent Registered Public Accounting Firm, are available on the Securities and Exchange Commission website or upon request.
3. Significant Accounting Policies.
Each Fund is an investment company and applies the accounting and reporting guidance of the Financial Accounting Standards Board (FASB) Accounting Standards Codification Topic 946 Financial Services - Investment Companies . The financial statements have been prepared in conformity with accounting principles generally accepted in the United States of America (GAAP), which require management to make certain estimates and assumptions at the date of the financial statements. Actual results could differ from those estimates. Subsequent events, if any, through the date that the financial statements were issued have been evaluated in the preparation of the financial statements. Each Fund's Schedule of Investments lists any underlying mutual funds or exchange-traded funds (ETFs) but does not include the underlying holdings of these funds. The following summarizes the significant accounting policies of each Fund:
Investment Valuation. Investments are valued as of 4:00 p.m. Eastern time on the last calendar day of the period. The Board of Trustees (the Board) has designated each Fund's investment adviser as the valuation designee responsible for the fair valuation function and performing fair value determinations as needed. The investment adviser has established a Fair Value Committee (the Committee) to carry out the day-to-day fair valuation responsibilities and has adopted policies and procedures to govern the fair valuation process and the activities of the Committee. In accordance with these fair valuation policies and procedures, which have been approved by the Board, each Fund attempts to obtain prices from one or more third party pricing services or brokers to value its investments. When current market prices, quotations or currency exchange rates are not readily available or reliable, investments will be fair valued in good faith by the Committee, in accordance with the policies and procedures. Factors used in determining fair value vary by investment type and may include market or investment specific events, transaction data, estimated cash flows, and market observations of comparable investments. The frequency that the fair valuation procedures are used cannot be predicted and they may be utilized to a significant extent. The Committee manages each Fund's fair valuation practices and maintains the fair valuation policies and procedures. Each Fund's investment adviser reports to the Board information regarding the fair valuation process and related material matters.
Each Fund categorizes the inputs to valuation techniques used to value its investments into a disclosure hierarchy consisting of three levels as shown below:
Level 1 - unadjusted quoted prices in active markets for identical investments
Level 2 - other significant observable inputs (including quoted prices for similar investments, interest rates, prepayment speeds, etc.)
Level 3 - unobservable inputs (including the Fund's own assumptions based on the best information available)
Valuation techniques used to value each Fund's investments by major category are as follows:
Equity securities, including restricted securities, for which market quotations are readily available, are valued at the last reported sale price or official closing price as reported by a third party pricing service on the primary market or exchange on which they are traded and are categorized as Level 1 in the hierarchy. In the event there were no sales during the day or closing prices are not available, securities are valued at the last quoted bid price or may be valued using the last available price and are generally categorized as Level 2 in the hierarchy. For foreign equity securities, when market or security specific events arise, comparisons to the valuation of American Depositary Receipts (ADRs), futures contracts, ETFs and certain indexes as well as quoted prices for similar securities may be used and would be categorized as Level 2 in the hierarchy. For equity securities, including restricted securities, where observable inputs are limited, assumptions about market activity and risk are used and these securities may be categorized as Level 3 in the hierarchy.
Investments in open-end mutual funds ,including the Fidelity Central Funds, are valued at their closing net asset value (NAV) each business day and are categorized as Level 1 in the hierarchy.
Changes in valuation techniques may result in transfers in or out of an assigned level within the disclosure hierarchy. The aggregate value of investments by input level as of February 28, 2023 is included at the end of each Fund's Schedule of Investments.
Foreign Currency. Certain Funds may use foreign currency contracts to facilitate transactions in foreign-denominated securities. Gains and losses from these transactions may arise from changes in the value of the foreign currency or if the counterparties do not perform under the contracts' terms.
Foreign-denominated assets, including investment securities, and liabilities are translated into U.S. dollars at the exchange rates at period end. Purchases and sales of investment securities, income and dividends received, and expenses denominated in foreign currencies are translated into U.S. dollars at the exchange rate in effect on the transaction date.
The effects of exchange rate fluctuations on investments are included with the net realized and unrealized gain (loss) on investment securities. Other foreign currency transactions resulting in realized and unrealized gain (loss) are disclosed separately.
Investment Transactions and Income. For financial reporting purposes, the Funds' investment holdings and NAV include trades executed through the end of the last business day of the period. The NAV per share for processing shareholder transactions is calculated as of the close of business of the New York Stock Exchange (NYSE), normally 4:00 p.m. Eastern time and includes trades executed through the end of the prior business day. Gains and losses on securities sold are determined on the basis of identified cost and for certain Funds include proceeds received from litigation. Commissions paid to certain brokers with whom the investment adviser, or its affiliates, places trades on behalf of a fund include an amount in addition to trade execution, which may be rebated back to a fund. Any such rebates are included in net realized gain (loss) on investments in the Statement of Operations. Dividend income is recorded on the ex-dividend date, except for certain dividends from foreign securities where the ex-dividend date may have passed, which are recorded as soon as the Funds are informed of the ex-dividend date. Non-cash dividends included in dividend income, if any, are recorded at the fair market value of the securities received. Income and capital gain distributions from Fidelity Central Funds, if any, are recorded on the ex-dividend date. Certain distributions received by the Funds represent a return of capital or capital gain. The Funds determine the components of these distributions subsequent to the ex-dividend date, based upon receipt of tax filings or other correspondence relating to the underlying investment. These distributions are recorded as a reduction of cost of investments and/or as a realized gain. Interest income is accrued as earned and includes coupon interest and amortization of premium and accretion of discount on debt securities as applicable. Investment income is recorded net of foreign taxes withheld where recovery of such taxes is uncertain. Funds may file withholding tax reclaims in certain jurisdictions to recover a portion of amounts previously withheld. Any withholding tax reclaims income is included in the Statement of Operations in dividends. Any receivables for withholding tax reclaims are included in the Statement of Assets and Liabilities in dividends receivable.
Expenses. Expenses directly attributable to a fund are charged to that fund. Expenses attributable to more than one fund are allocated among the respective funds on the basis of relative net assets or other appropriate methods. Expenses included in the accompanying financial statements reflect the expenses of that fund and do not include any expenses associated with any underlying mutual funds or exchange-traded funds. Although not included in a fund's expenses, a fund indirectly bears its proportionate share of these expenses through the net asset value of each underlying mutual fund or exchange-traded fund. Expense estimates are accrued in the period to which they relate and adjustments are made when actual amounts are known.
Deferred Trustee Compensation. Under a Deferred Compensation Plan (the Plan) for certain Funds, certain independent Trustees have elected to defer receipt of a portion of their annual compensation. Deferred amounts are invested in affiliated mutual funds, are marked-to-market and remain in a fund until distributed in accordance with the Plan. The investment of deferred amounts and the offsetting payable to the Trustees presented below are included in the accompanying Statement of Assets and Liabilities in other receivables and other payables and accrued expenses, as applicable.
| Fidelity Natural Resources Fund | $ 82,424 |
Income Tax Information and Distributions to Shareholders. Each year, each Fund intends to qualify as a regulated investment company under Subchapter M of the Internal Revenue Code, including distributing substantially all of its taxable income and realized gains. As a result, no provision for U.S. Federal income taxes is required. As of February 28, 2023, each Fund did not have any unrecognized tax benefits in the financial statements; nor is each Fund aware of any tax positions for which it is reasonably possible that the total amounts of unrecognized tax benefits will significantly change in the next twelve months. Each Fund files a U.S. federal tax return, in addition to state and local tax returns as required. Each Fund's federal income tax returns are subject to examination by the Internal Revenue Service (IRS) for a period of three fiscal years after they are filed. State and local tax returns may be subject to examination for an additional fiscal year depending on the jurisdiction. Foreign taxes are provided for based on each Fund's understanding of the tax rules and rates that exist in the foreign markets in which it invests. Fidelity Environment and Alternative Energy Fund is subject to a tax imposed on capital gains by certain countries in which it invests. An estimated deferred tax liability for net unrealized appreciation on the applicable securities is included in Other payables and accrued expenses on the Statement of Assets & Liabilities.
Distributions are declared and recorded on the ex-dividend date. Income and capital gain distributions are determined in accordance with income tax regulations, which may differ from GAAP. In addition, certain Funds claimed a portion of the payment made to redeeming shareholders as a distribution for income tax purposes.
Capital accounts within the financial statements are adjusted for permanent book-tax differences. These adjustments have no impact on net assets or the results of operations. Capital accounts are not adjusted for temporary book-tax differences which will reverse in a subsequent period.
Book-tax differences are primarily due to foreign currency transactions, partnerships, certain foreign taxes, passive foreign investment companies (PFIC), deferred Trustee compensation and capital loss carryforwards and losses deferred due to wash sales and excise tax regulations.
As of period end, the cost and unrealized appreciation (depreciation) in securities, and derivatives if applicable, for federal income tax purposes were as follows for each Fund:
| | Tax cost | Gross unrealized appreciation | Gross unrealized depreciation | Net unrealized appreciation (depreciation) |
Fidelity Environment and Alternative Energy Fund | $423,925,811 | $75,132,570 | $(23,430,247) | $51,702,323 |
| Fidelity Natural Resources Fund | 581,345,367 | 238,158,794 | (12,375,921) | 225,782,873 |
The tax-based components of distributable earnings as of period end were as follows for each Fund:
| | Undistributed ordinary income | Capital loss carryforward | Net unrealized appreciation (depreciation) on securities and other investments |
Fidelity Environment and Alternative Energy Fund | $- | $(125,059,440) | $51,696,755 |
| Fidelity Natural Resources Fund | 1,175,087 | (267,670,186) | 225,782,763 |
Capital loss carryforwards are only available to offset future capital gains of the Funds to the extent provided by regulations and may be limited. The capital loss carryforward information presented below, including any applicable limitation, is estimated as of fiscal period end and is subject to adjustment.
| | Short-term | Long-term | Total capital loss carryforward |
Fidelity Environment and Alternative Energy Fund | $(90,583,038) | $(34,476,402) | $(125,059,440) |
| Fidelity Natural Resources Fund | (93,181,409) | (174,488,777) | (267,670,186) |
Certain of the Funds intend to elect to defer to the next fiscal year ordinary losses recognized during the period January 1, 2023 to February 28, 2023. Loss deferrals were as follows:
| | Ordinary Losses |
Fidelity Environment and Alternative Energy Fund | $(657,360) |
The tax character of distributions paid was as follows:
| February 28, 2023 | | | |
| | Ordinary Income | Long-term Capital Gains | Total |
Fidelity Environment and Alternative Energy Fund | $3,228,177 | $ - | $3,228,177 |
| Fidelity Natural Resources Fund | 18,584,123 | - | 18,584,123 |
| February 28, 2022 | | | |
| | Ordinary Income | Long-term Capital Gains | Total |
Fidelity Environment and Alternative Energy Fund | $6,756,801 | $57,887,957 | $64,644,758 |
| Fidelity Natural Resources Fund | 5,734,164 | - | 5,734,164 |
Restricted Securities (including Private Placements). Funds may invest in securities that are subject to legal or contractual restrictions on resale. These securities generally may be resold in transactions exempt from registration or to the public if the securities are registered. Disposal of these securities may involve time-consuming negotiations and expense, and prompt sale at an acceptable price may be difficult. Information regarding restricted securities held at period end is included at the end of the Schedule of Investments, if applicable.
4. Purchases and Sales of Investments.
Purchases and sales of securities, other than short-term securities, and in-kind transactions, as applicable, are noted in the table below.
| | Purchases ($) | Sales ($) |
| Fidelity Environment and Alternative Energy Fund | 210,397,570 | 404,970,986 |
| Fidelity Natural Resources Fund | 665,954,799 | 545,714,598 |
5. Fees and Other Transactions with Affiliates.
Management Fee. Fidelity Management & Research Company LLC (the investment adviser) and its affiliates provide the Funds with investment management related services for which the Funds pay a monthly management fee. The management fee is the sum of an individual fund fee rate and an annualized group fee rate. The individual fund fee rate is applied to each Fund's average net assets. The group fee rate is based upon the monthly average net assets of a group of registered investment companies with which the investment adviser has management contracts. The group fee rate decreases as assets under management increase and increases as assets under management decrease. For the reporting period, each Fund's annual management fee rate expressed as a percentage of each Fund's average net assets was as follows:
| | Individual Rate | Group Rate | Total |
| Fidelity Environment and Alternative Energy Fund | .30% | .23% | .52% |
| Fidelity Natural Resources Fund | .30% | .23% | .53% |
Transfer Agent Fees. Fidelity Investments Institutional Operations Company LLC (FIIOC), an affiliate of the investment adviser, is the Funds' transfer, dividend disbursing and shareholder servicing agent. FIIOC receives account fees and asset-based fees that vary according to account size and type of account. FIIOC pays for typesetting, printing and mailing of shareholder reports, except proxy statements. For the period, transfer agent fees were equivalent to the following annual rates expressed as a percentage of average net assets:
| Fidelity Environment and Alternative Energy Fund | .21% |
| Fidelity Natural Resources Fund | .18% |
Accounting Fees. Fidelity Service Company, Inc. (FSC), an affiliate of the investment adviser, maintains each Fund's accounting records. The accounting fee is based on the level of average net assets for each month. For the period, the fees were equivalent to the following annual rates:
| | % of Average Net Assets |
| Fidelity Environment and Alternative Energy Fund | .03 |
| Fidelity Natural Resources Fund | .03 |
Brokerage Commissions. A portion of portfolio transactions were placed with brokerage firms which are affiliates of the investment adviser. Brokerage commissions are included in net realized gain (loss) and change in net unrealized appreciation (depreciation) in the Statement of Operations. The commissions paid to these affiliated firms were as follows:
| | Amount |
| Fidelity Environment and Alternative Energy Fund | $ 5,887 |
| Fidelity Natural Resources Fund | 20,032 |
Interfund Lending Program. Pursuant to an Exemptive Order issued by the Securities and Exchange Commission (the SEC), each Fund, along with other registered investment companies having management contracts with Fidelity Management & Research Company LLC (FMR), or other affiliated entities of FMR, may participate in an interfund lending program. This program provides an alternative credit facility allowing each Fund to borrow from, or lend money to, other participating affiliated funds. At period end, there were no interfund loans outstanding. Activity in this program during the period for which loans were outstanding was as follows:
| | Borrower or Lender | Average Loan Balance | Weighted Average Interest Rate | Interest Expense |
Fidelity Environment and Alternative Energy Fund | Borrower | $ 10,524,286 | 3.32% | $ 6,784 |
| Fidelity Natural Resources Fund | Borrower | $ 5,503,371 | 1.74% | $ 9,289 |
Interfund Trades. Funds may purchase from or sell securities to other Fidelity Funds under procedures adopted by the Board. The procedures have been designed to ensure these interfund trades are executed in accordance with Rule 17a-7 of the 1940 Act. Any interfund trades are included within the respective purchases and sales amounts shown in the Purchases and Sales of Investments note. Interfund trades during the period are noted in the table below.
| | Purchases ($) | Sales ($) | Realized Gain (Loss) ($) |
| Fidelity Environment and Alternative Energy Fund | 3,320,455 | 14,369,538 | (3,803,443) |
| Fidelity Natural Resources Fund | 51,481,080 | 50,979,009 | (689,613) |
6. Committed Line of Credit.
Certain Funds participate with other funds managed by the investment adviser or an affiliate in a $4.25 billion credit facility (the "line of credit") to be utilized for temporary or emergency purposes to fund shareholder redemptions or for other short-term liquidity purposes. The participating funds have agreed to pay commitment fees on their pro-rata portion of the line of credit, which are reflected in Miscellaneous expenses on the Statement of Operations, and are listed below. During the period, there were no borrowings on this line of credit.
| | Amount |
| Fidelity Environment and Alternative Energy Fund | $ 1,182 |
| Fidelity Natural Resources Fund | 1,230 |
7. Security Lending.
Funds lend portfolio securities from time to time in order to earn additional income. Lending agents are used, including National Financial Services (NFS), an affiliate of the investment adviser. Pursuant to a securities lending agreement, NFS will receive a fee, which is capped at 9.9% of a fund's daily lending revenue, for its services as lending agent. A fund may lend securities to certain qualified borrowers, including NFS. On the settlement date of the loan, a fund receives collateral (in the form of U.S. Treasury obligations, letters of credit and/or cash) against the loaned securities and maintains collateral in an amount not less than 100% of the market value of the loaned securities during the period of the loan. The market value of the loaned securities is determined at the close of business of a fund and any additional required collateral is delivered to a fund on the next business day. A fund or borrower may terminate the loan at any time, and if the borrower defaults on its obligation to return the securities loaned because of insolvency or other reasons, a fund may apply collateral received from the borrower against the obligation. A fund may experience delays and costs in recovering the securities loaned. Any cash collateral received is invested in the Fidelity Securities Lending Cash Central Fund. Any loaned securities are identified as such in the Schedule of Investments, and the value of loaned securities and cash collateral at period end, as applicable, are presented in the Statement of Assets and Liabilities. Security lending income represents the income earned on investing cash collateral, less rebates paid to borrowers and any lending agent fees associated with the loan, plus any premium payments received for lending certain types of securities. Security lending income is presented in the Statement of Operations as a component of income from Fidelity Central Funds. Affiliated security lending activity, if any, was as follows:
| | Total Security Lending Fees Paid to NFS | Security Lending Income From Securities Loaned to NFS | Value of Securities Loaned to NFS at Period End |
| Fidelity Environment and Alternative Energy Fund | $ 9,625 | $ 436 | $257,715 |
| Fidelity Natural Resources Fund | $ 4,006 | $ - | $- |
8. Bank Borrowings.
Each Fund is permitted to have bank borrowings for temporary or emergency purposes to fund shareholder redemptions or for other short-term liquidity requirements. Each Fund has established borrowing arrangements with certain banks. The interest rate on the borrowings is the bank's base rate, as revised from time to time. Any open loans, including accrued interest, at period end are presented under the caption "Notes payable" in the Statement of Assets and Liabilities, if applicable. Activity in this program during the period for which loans were outstanding was as follows:
| | Average Loan Balance | Weighted Average Interest Rate | Interest Expense |
| Fidelity Natural Resources Fund | $ 1,824,000 | 2.08% | $ 843 |
9. Expense Reductions.
Through arrangements with each applicable Fund's custodian, credits realized as a result of certain uninvested cash balances were used to reduce each applicable Fund's expenses. All of the applicable expense reductions are noted in the table below.
| | Custodian credits |
| Fidelity Natural Resources Fund | 43 |
In addition, during the period the investment adviser or an affiliate reimbursed and/or waived a portion of operating expenses as follows:
| | Amount |
| Fidelity Environment and Alternative Energy Fund | $ 22,188 |
| Fidelity Natural Resources Fund | 25,769 |
10. Other.
A fund's organizational documents provide former and current trustees and officers with a limited indemnification against liabilities arising in connection with the performance of their duties to the fund. In the normal course of business, a fund may also enter into contracts that provide general indemnifications. A fund's maximum exposure under these arrangements is unknown as this would be dependent on future claims that may be made against a fund. The risk of material loss from such claims is considered remote.
11. Risk and Uncertainties.
Many factors affect a fund's performance. Developments that disrupt global economies and financial markets, such as pandemics, epidemics, outbreaks of infectious diseases, war, terrorism, and environmental disasters, may significantly affect a fund's investment performance. The effects of these developments to a fund will be impacted by the types of securities in which a fund invests, the financial condition, industry, economic sector, and geographic location of an issuer, and a fund's level of investment in the securities of that issuer. Significant concentrations in security types, issuers, industries, sectors, and geographic locations may magnify the factors that affect a fund's performance.
To the Board of Trustees of Fidelity Select Portfolios and Shareholders of Fidelity Environment and Alternative Energy Fund and Fidelity Natural Resources Fund
Opinions on the Financial Statements
We have audited the accompanying statements of assets and liabilities, including the schedules of investments, of Fidelity Environment and Alternative Energy Fund and Fidelity Natural Resources Fund (two of the funds constituting Fidelity Select Portfolios, hereafter collectively referred to as the "Funds") as of February 28, 2023, the related statements of operations for the year ended February 28, 2023, the statements of changes in net assets for each of the two years in the period ended February 28, 2023, including the related notes, and the financial highlights for each of the five years in the period ended February 28, 2023 (collectively referred to as the "financial statements"). In our opinion, the financial statements present fairly, in all material respects, the financial position of each of the Funds as of February 28, 2023, the results of each of their operations for the year then ended, the changes in each of their net assets for each of the two years in the period ended February 28, 2023 and each of the financial highlights for each of the five years in the period ended February 28, 2023 in conformity with accounting principles generally accepted in the United States of America.
Basis for Opinions
These financial statements are the responsibility of the Funds' management. Our responsibility is to express an opinion on the Funds' financial statements based on our audits. We are a public accounting firm registered with the Public Company Accounting Oversight Board (United States) (PCAOB) and are required to be independent with respect to the Funds in accordance with the U.S. federal securities laws and the applicable rules and regulations of the Securities and Exchange Commission and the PCAOB.
We conducted our audits of these financial statements in accordance with the standards of the PCAOB. Those standards require that we plan and perform the audit to obtain reasonable assurance about whether the financial statements are free of material misstatement, whether due to error or fraud.
Our audits included performing procedures to assess the risks of material misstatement of the financial statements, whether due to error or fraud, and performing procedures that respond to those risks. Such procedures included examining, on a test basis, evidence regarding the amounts and disclosures in the financial statements. Our audits also included evaluating the accounting principles used and significant estimates made by management, as well as evaluating the overall presentation of the financial statements. Our procedures included confirmation of securities owned as of February 28, 2023 by correspondence with the custodian, issuer of privately offered securities and brokers; when replies were not received from brokers, we performed other auditing procedures. We believe that our audits provide a reasonable basis for our opinions.
/s/ PricewaterhouseCoopers LLP
Boston, Massachusetts
April 13, 2023
We have served as the auditor of one or more investment companies in the Fidelity group of funds since 1932.
The Trustees, Members of the Advisory Board (if any), and officers of the trust and funds, as applicable, are listed below. The Board of Trustees governs each fund and is responsible for protecting the interests of shareholders. The Trustees are experienced executives who meet periodically throughout the year to oversee each fund's activities, review contractual arrangements with companies that provide services to each fund, oversee management of the risks associated with such activities and contractual arrangements, and review each fund's performance. Each of the Trustees oversees 318 funds.
The Trustees hold office without limit in time except that (a) any Trustee may resign; (b) any Trustee may be removed by written instrument, signed by at least two-thirds of the number of Trustees prior to such removal; (c) any Trustee who requests to be retired or who has become incapacitated by illness or injury may be retired by written instrument signed by a majority of the other Trustees; and (d) any Trustee may be removed at any special meeting of shareholders by a two-thirds vote of the outstanding voting securities of the trust. Each Trustee who is not an interested person (as defined in the 1940 Act) of the trust and the funds is referred to herein as an Independent Trustee. Each Independent Trustee shall retire not later than the last day of the calendar year in which his or her 75th birthday occurs. The Independent Trustees may waive this mandatory retirement age policy with respect to individual Trustees. Officers and Advisory Board Members hold office without limit in time, except that any officer or Advisory Board Member may resign or may be removed by a vote of a majority of the Trustees at any regular meeting or any special meeting of the Trustees. Except as indicated, each individual has held the office shown or other offices in the same company for the past five years.
The funds' Statement of Additional Information (SAI) includes more information about the Trustees. To request a free copy, call Fidelity at 1-800-544-8544.
Experience, Skills, Attributes, and Qualifications of the Trustees. The Governance and Nominating Committee has adopted a statement of policy that describes the experience, qualifications, attributes, and skills that are necessary and desirable for potential Independent Trustee candidates (Statement of Policy). The Board believes that each Trustee satisfied at the time he or she was initially elected or appointed a Trustee, and continues to satisfy, the standards contemplated by the Statement of Policy. The Governance and Nominating Committee also engages professional search firms to help identify potential Independent Trustee candidates who have the experience, qualifications, attributes, and skills consistent with the Statement of Policy. From time to time, additional criteria based on the composition and skills of the current Independent Trustees, as well as experience or skills that may be appropriate in light of future changes to board composition, business conditions, and regulatory or other developments, have also been considered by the professional search firms and the Governance and Nominating Committee. In addition, the Board takes into account the Trustees' commitment and participation in Board and committee meetings, as well as their leadership of standing and ad hoc committees throughout their tenure.
In determining that a particular Trustee was and continues to be qualified to serve as a Trustee, the Board has considered a variety of criteria, none of which, in isolation, was controlling. The Board believes that, collectively, the Trustees have balanced and diverse experience, qualifications, attributes, and skills, which allow the Board to operate effectively in governing each fund and protecting the interests of shareholders. Information about the specific experience, skills, attributes, and qualifications of each Trustee, which in each case led to the Board's conclusion that the Trustee should serve (or continue to serve) as a trustee of the funds, is provided below.
Board Structure and Oversight Function. Robert A. Lawrence is an interested person and currently serves as Chair. The Trustees have determined that an interested Chair is appropriate and benefits shareholders because an interested Chair has a personal and professional stake in the quality and continuity of services provided to the funds. Independent Trustees exercise their informed business judgment to appoint an individual of their choosing to serve as Chair, regardless of whether the Trustee happens to be independent or a member of management. The Independent Trustees have determined that they can act independently and effectively without having an Independent Trustee serve as Chair and that a key structural component for assuring that they are in a position to do so is for the Independent Trustees to constitute a substantial majority for the Board. The Independent Trustees also regularly meet in executive session. David M. Thomas serves as Lead Independent Trustee and as such (i) acts as a liaison between the Independent Trustees and management with respect to matters important to the Independent Trustees and (ii) with management prepares agendas for Board meetings.
Fidelity ® funds are overseen by different Boards of Trustees. The funds' Board oversees Fidelity's high income and certain equity funds, and other Boards oversee Fidelity's alternative investment, investment-grade bond, money market, asset allocation, and other equity funds. The asset allocation funds may invest in Fidelity ® funds overseen by the funds' Board. The use of separate Boards, each with its own committee structure, allows the Trustees of each group of Fidelity ® funds to focus on the unique issues of the funds they oversee, including common research, investment, and operational issues. On occasion, the separate Boards establish joint committees to address issues of overlapping consequences for the Fidelity ® funds overseen by each Board.
The Trustees operate using a system of committees to facilitate the timely and efficient consideration of all matters of importance to the Trustees, each fund, and fund shareholders and to facilitate compliance with legal and regulatory requirements and oversight of the funds' activities and associated risks. The Board, acting through its committees, has charged FMR and its affiliates with (i) identifying events or circumstances the occurrence of which could have demonstrably adverse effects on the funds' business and/or reputation; (ii) implementing processes and controls to lessen the possibility that such events or circumstances occur or to mitigate the effects of such events or circumstances if they do occur; and (iii) creating and maintaining a system designed to evaluate continuously business and market conditions in order to facilitate the identification and implementation processes described in (i) and (ii) above. Because the day-to-day operations and activities of the funds are carried out by or through FMR, its affiliates, and other service providers, the funds' exposure to risks is mitigated but not eliminated by the processes overseen by the Trustees. While each of the Board's committees has responsibility for overseeing different aspects of the funds' activities, oversight is exercised primarily through the Operations, Audit, and Compliance Committees. Appropriate personnel, including but not limited to the funds' Chief Compliance Officer (CCO), FMR's internal auditor, the independent accountants, the funds' Treasurer and portfolio management personnel, make periodic reports to the Board's committees, as appropriate, including an annual review of Fidelity's risk management program for the Fidelity ® funds. The responsibilities of each standing committee, including their oversight responsibilities, are described further under "Standing Committees of the Trustees."
Interested Trustees*:
Correspondence intended for a Trustee who is an interested person may be sent to Fidelity Investments, 245 Summer Street, Boston, Massachusetts 02210.
Name, Year of Birth; Principal Occupations and Other Relevant Experience+
Bettina Doulton (1964)
Year of Election or Appointment: 2020
Trustee
Ms. Doulton also serves as Trustee of other Fidelity ® funds. Prior to her retirement, Ms. Doulton served in a variety of positions at Fidelity Investments, including as a managing director of research (2006-2007), portfolio manager to certain Fidelity ® funds (1993-2005), equity analyst and portfolio assistant (1990-1993), and research assistant (1987-1990). Ms. Doulton currently owns and operates Phi Builders + Architects and Cellardoor Winery. Previously, Ms. Doulton served as a member of the Board of Brown Capital Management, LLC (2014-2018).
Robert A. Lawrence (1952)
Year of Election or Appointment: 2020
Trustee
Chair of the Board of Trustees
Mr. Lawrence also serves as Trustee of other funds. Previously, Mr. Lawrence served as a Trustee and Member of the Advisory Board of certain funds. Prior to his retirement in 2008, Mr. Lawrence served as Vice President of certain Fidelity ® funds (2006-2008), Senior Vice President, Head of High Income Division of Fidelity Management & Research Company (investment adviser firm, 2006-2008), and President of Fidelity Strategic Investments (investment adviser firm, 2002-2005).
* Determined to be an "Interested Trustee" by virtue of, among other things, his or her affiliation with the trust or various entities under common control with FMR.
+ The information includes the Trustee's principal occupation during the last five years and other information relating to the experience, attributes, and skills relevant to the Trustee's qualifications to serve as a Trustee, which led to the conclusion that the Trustee should serve as a Trustee for each fund.
Independent Trustees:
Correspondence intended for an Independent Trustee may be sent to Fidelity Investments, P.O. Box 55235, Boston, Massachusetts 02205-5235.
Name, Year of Birth; Principal Occupations and Other Relevant Experience+
Thomas P. Bostick (1956)
Year of Election or Appointment: 2021
Trustee
Lieutenant General Bostick also serves as Trustee of other Fidelity ® funds. Prior to his retirement, General Bostick (United States Army, Retired) held a variety of positions within the U.S. Army, including Commanding General and Chief of Engineers, U.S. Army Corps of Engineers (2012-2016) and Deputy Chief of Staff and Director of Human Resources, U.S. Army (2009-2012). General Bostick currently serves as a member of the Board and Finance and Governance & Sustainability Committees of CSX Corporation (transportation, 2020-present) and a member of the Board and Corporate Governance and Nominating Committee of Perma-Fix Environmental Services, Inc. (nuclear waste management, 2020-present). General Bostick serves as Chief Executive Officer of Bostick Global Strategies, LLC (consulting, 2016-present), as a member of the Board of HireVue, Inc. (video interview and assessment, 2020-present), as a member of the Board of Allonnia (biotechnology and engineering solutions, 2022-present) and on the Advisory Board of Solugen, Inc. (specialty bio-based chemicals manufacturer, 2022-present). Previously, General Bostick served as a Member of the Advisory Board of certain Fidelity ® funds (2021), President, Intrexon Bioengineering (2018-2020) and Chief Operating Officer (2017-2020) and Senior Vice President of the Environment Sector (2016-2017) of Intrexon Corporation (biopharmaceutical company).
Dennis J. Dirks (1948)
Year of Election or Appointment: 2018
Trustee
Mr. Dirks also serves as Trustee of other Fidelity ® funds. Prior to his retirement in May 2003, Mr. Dirks served as Chief Operating Officer and as a member of the Board of The Depository Trust & Clearing Corporation (financial markets infrastructure), President, Chief Operating Officer and a member of the Board of The Depository Trust Company (DTC), President and a member of the Board of the National Securities Clearing Corporation (NSCC), Chief Executive Officer and a member of the Board of the Government Securities Clearing Corporation and Chief Executive Officer and a member of the Board of the Mortgage-Backed Securities Clearing Corporation. Mr. Dirks currently serves as a member of the Finance Committee (2016-present) and Board (2017-present) and is Treasurer (2018-present) of the Asolo Repertory Theatre.
Donald F. Donahue (1950)
Year of Election or Appointment: 2018
Trustee
Mr. Donahue also serves as Trustee of other Fidelity ® funds. Mr. Donahue serves as President and Chief Executive Officer of Miranda Partners, LLC (risk consulting for the financial services industry, 2012-present). Previously, Mr. Donahue served as Chief Executive Officer (2006-2012), Chief Operating Officer (2003-2006) and Managing Director, Customer Marketing and Development (1999-2003) of The Depository Trust & Clearing Corporation (financial markets infrastructure). Mr. Donahue currently serves as a member (2007-present) and Co-Chairman (2016-present) of the Board of United Way of New York. Mr. Donahue previously served as a member of the Advisory Board of certain Fidelity ® funds (2015-2018) and as a member of the Board of The Leadership Academy (previously NYC Leadership Academy) (2012-2022).
Vicki L. Fuller (1957)
Year of Election or Appointment: 2020
Trustee
Ms. Fuller also serves as Trustee of other Fidelity ® funds. Previously, Ms. Fuller served as a member of the Advisory Board of certain Fidelity ® funds (2018-2020), Chief Investment Officer of the New York State Common Retirement Fund (2012-2018) and held a variety of positions at AllianceBernstein L.P. (global asset management, 1985-2012), including Managing Director (2006-2012) and Senior Vice President and Senior Portfolio Manager (2001-2006). Ms. Fuller currently serves as a member of the Board, Audit Committee and Nominating and Governance Committee of two Blackstone business development companies (2020-present), as a member of the Board of Treliant, LLC (consulting, 2019-present), as a member of the Board of Ariel Alternatives, LLC (private equity, 2022-present) and as a member of the Board and Chair of the Audit Committee of Gusto, Inc. (software, 2021-present). In addition, Ms. Fuller currently serves as a member of the Board of Roosevelt University (2019-present) and as a member of the Executive Board of New York University's Stern School of Business. Ms. Fuller previously served as a member of the Board, Audit Committee and Nominating and Governance Committee of The Williams Companies, Inc. (natural gas infrastructure, 2018-2021).
Patricia L. Kampling (1959)
Year of Election or Appointment: 2020
Trustee
Ms. Kampling also serves as Trustee of other Fidelity ® funds. Prior to her retirement, Ms. Kampling served as Chairman of the Board and Chief Executive Officer (2012-2019), President and Chief Operating Officer (2011-2012) and Executive Vice President and Chief Financial Officer (2010-2011) of Alliant Energy Corporation. Ms. Kampling currently serves as a member of the Board, Finance Committee and Governance, Compensation and Nominating Committee of Xcel Energy Inc. (utilities company, 2020-present) and as a member of the Board, Audit, Finance and Risk Committee and Safety, Environmental, Technology and Operations Committee and Chair of the Executive Development and Compensation Committee of American Water Works Company, Inc. (utilities company, 2019-present). In addition, Ms. Kampling currently serves as a member of the Board of the Nature Conservancy, Wisconsin Chapter (2019-present). Previously, Ms. Kampling served as a Member of the Advisory Board of certain Fidelity® funds (2020), a member of the Board, Compensation Committee and Executive Committee and Chair of the Audit Committee of Briggs & Stratton Corporation (manufacturing, 2011-2021), a member of the Board of Interstate Power and Light Company (2012-2019) and Wisconsin Power and Light Company (2012-2019) (each a subsidiary of Alliant Energy Corporation) and as a member of the Board and Workforce Development Committee of the Business Roundtable (2018-2019).
Thomas A. Kennedy (1955)
Year of Election or Appointment: 2021
Trustee
Mr. Kennedy also serves as Trustee of other Fidelity ® funds. Previously, Mr. Kennedy served as a Member of the Advisory Board of certain Fidelity ® funds (2020) and held a variety of positions at Raytheon Company (aerospace and defense, 1983-2020), including Chairman and Chief Executive Officer (2014-2020) and Executive Vice President and Chief Operating Officer (2013-2014). Mr. Kennedy served as Executive Chairman of the Board of Directors of Raytheon Technologies Corporation (aerospace and defense, 2020-2021). Mr. Kennedy serves as a Director of the Board of Directors of Textron Inc. (aerospace and defense, 2023-present).
Oscar Munoz (1959)
Year of Election or Appointment: 2021
Trustee
Mr. Munoz also serves as Trustee of other Fidelity ® funds. Prior to his retirement, Mr. Munoz served as Executive Chairman (2020-2021), Chief Executive Officer (2015-2020), President (2015-2016) and a member of the Board (2010-2021) of United Airlines Holdings, Inc. Mr. Munoz currently serves as a member of the Board of CBRE Group, Inc. (commercial real estate, 2020-present), a member of the Board of Univision Communications, Inc. (Hispanic media, 2020-present), a member of the Board of Archer Aviation Inc. (2021-present), a member of the Defense Business Board of the United States Department of Defense (2021-present) and a member of the Board of Salesforce.com, Inc. (cloud-based software, 2022-present). Previously, Mr. Munoz served as a Member of the Advisory Board of certain Fidelity ® funds (2021).
David M. Thomas (1949)
Year of Election or Appointment: 2018
Trustee
Lead Independent Trustee
Mr. Thomas also serves as Trustee of other Fidelity ® funds. Previously, Mr. Thomas served as Executive Chairman (2005-2006) and Chairman and Chief Executive Officer (2000-2005) of IMS Health, Inc. (pharmaceutical and healthcare information solutions). Mr. Thomas currently serves as a member of the Board of Fortune Brands Home and Security (home and security products, 2004-present) and as Director (2013-present) and Non-Executive Chairman of the Board (2022-present) of Interpublic Group of Companies, Inc. (marketing communication).
Susan Tomasky (1953)
Year of Election or Appointment: 2020
Trustee
Ms. Tomasky also serves as Trustee of other Fidelity ® funds. Prior to her retirement, Ms. Tomasky served in various executive officer positions at American Electric Power Company, Inc. (1998-2011), including most recently as President of AEP Transmission (2007-2011). Ms. Tomasky currently serves as a member of the Board and Sustainability Committee and as Chair of the Audit Committee of Marathon Petroleum Corporation (2018-present) and as a member of the Board, Executive Committee, Corporate Governance Committee and Organization and Compensation Committee and as Lead Director of the Board of Public Service Enterprise Group, Inc. (utilities company, 2012-present) and as a member of the Board of its subsidiary company, Public Service Electric and Gas Co. (2021-present). In addition, Ms. Tomasky currently serves as a member (2009-present) and President (2020-present) of the Board of the Royal Shakespeare Company - America (2009-present), as a member of the Board of the Columbus Association for the Performing Arts (2011-present) and as a member of the Board and Kenyon in the World Committee of Kenyon College (2016-present). Previously, Ms. Tomasky served as a Member of the Advisory Board of certain Fidelity ® funds (2020), as a member of the Board of the Columbus Regional Airport Authority (2007-2020), as a member of the Board (2011-2018) and Lead Independent Director (2015-2018) of Andeavor Corporation (previously Tesoro Corporation) (independent oil refiner and marketer) and as a member of the Board of Summit Midstream Partners LP (energy, 2012-2018).
Michael E. Wiley (1950)
Year of Election or Appointment: 2008
Trustee
Mr. Wiley also serves as Trustee of other Fidelity ® funds. Previously, Mr. Wiley served as a member of the Advisory Board of certain Fidelity ® funds (2018-2020), Chairman, President and CEO of Baker Hughes, Inc. (oilfield services, 2000-2004). Mr. Wiley also previously served as a member of the Board of Andeavor Corporation (independent oil refiner and marketer, 2005-2018), a member of the Board of Andeavor Logistics LP (natural resources logistics, 2015-2018) and a member of the Board of High Point Resources (exploration and production, 2005-2020).
+ The information includes the Trustee's principal occupation during the last five years and other information relating to the experience, attributes, and skills relevant to the Trustee's qualifications to serve as a Trustee, which led to the conclusion that the Trustee should serve as a Trustee for each fund.
Advisory Board Members and Officers:
Correspondence intended for a Member of the Advisory Board (if any) may be sent to Fidelity Investments, P.O. Box 55235, Boston, Massachusetts 02205-5235. Correspondence intended for an officer or Peter S. Lynch may be sent to Fidelity Investments, 245 Summer Street, Boston, Massachusetts 02210. Officers appear below in alphabetical order.
Name, Year of Birth; Principal Occupation
Peter S. Lynch (1944)
Year of Election or Appointment: 2018
Member of the Advisory Board
Mr. Lynch also serves as a Member of the Advisory Board of other Fidelity ® funds. Mr. Lynch is Vice Chairman and a Director of Fidelity Management & Research Company LLC (investment adviser firm). In addition, Mr. Lynch serves as a Trustee of Boston College and as the Chairman of the Inner-City Scholarship Fund. Previously, Mr. Lynch served as Vice Chairman and a Director of FMR Co., Inc. (investment adviser firm) and on the Special Olympics International Board of Directors (1997-2006).
Heather Bonner (1977)
Year of Election or Appointment: 2023
Assistant Treasurer
Ms. Bonner also serves as an officer of other funds. Ms. Bonner serves as Senior Vice President (2022-present), and is an employee of Fidelity Investments. Ms. Bonner serves as Assistant Treasurer of Fidelity CRET Trustee LLC (2022-present). Prior to joining Fidelity, Ms. Bonner served as Managing Director at AQR Capital Management (2013-2022) and was the Treasurer and Principal Financial Officer of the AQR Funds (2013-2022).
Craig S. Brown (1977)
Year of Election or Appointment: 2022
Deputy Treasurer
Mr. Brown also serves as an officer of other funds. Mr. Brown serves as Assistant Treasurer of FIMM, LLC (2021-present) and is an employee of Fidelity Investments (2013-present). Previously, Mr. Brown served as Assistant Treasurer of certain Fidelity ® funds (2019-2022).
John J. Burke III (1964)
Year of Election or Appointment: 2018
Chief Financial Officer
Mr. Burke also serves as Chief Financial Officer of other funds. Mr. Burke serves as Head of Investment Operations for Fidelity Fund and Investment Operations (2018-present) and is an employee of Fidelity Investments (1998-present). Previously Mr. Burke served as head of Asset Management Investment Operations (2012-2018).
Margaret Carey (1973)
Year of Election or Appointment: 2023
Secretary and Chief Legal Officer (CLO)
Ms. Carey also serves as an officer of other funds and as CLO of certain other Fidelity entities. She is a Senior Vice President and Deputy General Counsel of FMR LLC (diversified financial services company, 2019-present), and is an employee of Fidelity Investments.
William C. Coffey (1969)
Year of Election or Appointment: 2019
Assistant Secretary
Mr. Coffey also serves as Assistant Secretary of other funds. He is Senior Vice President and Deputy General Counsel of FMR LLC (diversified financial services company, 2010-present), and is an employee of Fidelity Investments. Previously, Mr. Coffey served as Secretary and CLO of certain funds (2018-2019); CLO, Secretary, and Senior Vice President of Fidelity Management & Research Company and FMR Co., Inc. (investment adviser firms, 2018-2019); Secretary of Fidelity SelectCo, LLC and Fidelity Investments Money Management, Inc. (investment adviser firms, 2018-2019); CLO of Fidelity Management & Research (Hong Kong) Limited, FMR Investment Management (UK) Limited, and Fidelity Management & Research (Japan) Limited (investment adviser firms, 2018-2019); and Assistant Secretary of certain funds (2009-2018).
Timothy M. Cohen (1969)
Year of Election or Appointment: 2018
Vice President
Mr. Cohen also serves as Vice President of other funds. Mr. Cohen serves as Co-Head of Equity (2018-present), a Director of Fidelity Management & Research (Japan) Limited (investment adviser firm, 2016-present), and is an employee of Fidelity Investments. Previously, Mr. Cohen served as Executive Vice President of Fidelity SelectCo, LLC (2019), Head of Global Equity Research (2016-2018), Chief Investment Officer - Equity and a Director of Fidelity Management & Research (U.K.) Inc. (investment adviser firm, 2013-2015) and as a Director of Fidelity Management & Research (Hong Kong) Limited (investment adviser firm, 2017).
Jonathan Davis (1968)
Year of Election or Appointment: 2010
Assistant Treasurer
Mr. Davis also serves as an officer of other funds. Mr. Davis serves as Assistant Treasurer of FIMM, LLC (2021-present), FMR Capital, Inc. (2017-present), FD Funds GP LLC (2021-present), FD Funds Holding LLC (2021-present), and FD Funds Management LLC (2021-present); and is an employee of Fidelity Investments. Previously, Mr. Davis served as Vice President and Associate General Counsel of FMR LLC (diversified financial services company, 2003-2010).
Laura M. Del Prato (1964)
Year of Election or Appointment: 2018
Assistant Treasurer
Ms. Del Prato also serves as an officer of other funds. Ms. Del Prato serves as Assistant Treasurer of FIMM, LLC (2021-present) and is an employee of Fidelity Investments (2017-present). Previously, Ms. Del Prato served as President and Treasurer of The North Carolina Capital Management Trust: Cash Portfolio and Term Portfolio (2018-2020). Prior to joining Fidelity Investments, Ms. Del Prato served as a Managing Director and Treasurer of the JPMorgan Mutual Funds (2014-2017). Prior to JPMorgan, Ms. Del Prato served as a partner at Cohen Fund Audit Services (accounting firm, 2012-2013) and KPMG LLP (accounting firm, 2004-2012).
Colm A. Hogan (1973)
Year of Election or Appointment: 2020
Assistant Treasurer
Mr. Hogan also serves as an officer of other funds. Mr. Hogan serves as Assistant Treasurer of FIMM, LLC (2021-present) and FMR Capital, Inc. (2017-present) and is an employee of Fidelity Investments (2005-present). Previously, Mr. Hogan served as Deputy Treasurer of certain Fidelity ® funds (2016-2020) and Assistant Treasurer of certain Fidelity ® funds (2016-2018).
Pamela R. Holding (1964)
Year of Election or Appointment: 2018
Vice President
Ms. Holding also serves as Vice President of other funds. Ms. Holding serves as Co-Head of Equity (2018-present) and is an employee of Fidelity Investments (2013-present). Previously, Ms. Holding served as Executive Vice President of Fidelity SelectCo, LLC (2019) and as Chief Investment Officer of Fidelity Institutional Asset Management (2013-2018).
Chris Maher (1972)
Year of Election or Appointment: 2020
Deputy Treasurer
Mr. Maher also serves as an officer of other funds. Mr. Maher serves as Assistant Treasurer of FIMM, LLC (2021-present) and FMR Capital, Inc. (2017-present), and is an employee of Fidelity Investments (2008-present). Previously, Mr. Maher served as Assistant Treasurer of certain funds (2013-2020); Vice President of Asset Management Compliance (2013), Vice President of the Program Management Group of FMR (investment adviser firm, 2010-2013), and Vice President of Valuation Oversight (2008-2010).
Jason P. Pogorelec (1975)
Year of Election or Appointment: 2020
Chief Compliance Officer
Mr. Pogorelec also serves as Chief Compliance Officer of other funds. Mr. Pogorelec is a Senior Vice President of Asset Management Compliance for Fidelity Investments and is an employee of Fidelity Investments. Mr. Pogorelec serves as Compliance Officer of Fidelity Management & Research Company LLC (investment adviser firm, 2023-present). Previously, Mr. Pogorelec served as Vice President, Associate General Counsel for Fidelity Investments (2010-2020) and Assistant Secretary of certain Fidelity ® funds (2015-2020).
Brett Segaloff (1972)
Year of Election or Appointment: 2021
Anti-Money Laundering (AML) Officer
Mr. Segaloff also serves as an AML Officer of other funds and other related entities. He is Director, Anti-Money Laundering (2007-present) of FMR LLC (diversified financial services company) and is an employee of Fidelity Investments (1996-present).
Stacie M. Smith (1974)
Year of Election or Appointment: 2018
President and Treasurer
Ms. Smith also serves as an officer of other funds. Ms. Smith serves as Assistant Treasurer of FIMM, LLC (2021-present) and FMR Capital, Inc. (2017-present), is an employee of Fidelity Investments (2009-present), and has served in other fund officer roles. Prior to joining Fidelity Investments, Ms. Smith served as Senior Audit Manager of Ernst & Young LLP (accounting firm, 1996-2009). Previously, Ms. Smith served as Assistant Treasurer (2013-2019) and Deputy Treasurer (2013-2016) of certain Fidelity ® funds.
Jim Wegmann (1979)
Year of Election or Appointment: 2019
Assistant Treasurer
Mr. Wegmann also serves as an officer of other funds. Mr. Wegmann serves as Assistant Treasurer of FIMM, LLC (2021-present) and is an employee of Fidelity Investments (2011-present). Previously, Mr. Wegmann served as Assistant Treasurer of certain Fidelity ® funds (2019-2021).
As a shareholder, you incur two types of costs: (1) transaction costs, which may include sales charges (loads) on purchase payments or redemption proceeds, as applicable and (2) ongoing costs, which generally include management fees, distribution and/or service (12b-1) fees and other Fund expenses. This Example is intended to help you understand your ongoing costs (in dollars) of investing in a fund and to compare these costs with the ongoing costs of investing in other mutual funds.
| The Example is based on an investment of $1,000 invested at the beginning of the period and held for the entire period (September 1, 2022 to February 28, 2023). |
Actual Expenses
The first line of the accompanying table provides information about actual account values and actual expenses. You may use the information in this line, together with the amount you invested, to estimate the expenses that you paid over the period. Simply divide your account value by $1,000.00 (for example, an $8,600 account value divided by $1,000.00 = 8.6), then multiply the result by the number in the first line for a class/Fund under the heading entitled "Expenses Paid During Period" to estimate the expenses you paid on your account during this period. If any fund is a shareholder of any underlying mutual funds or exchange-traded funds (ETFs) (the Underlying Funds), such fund indirectly bears its proportional share of the expenses of the Underlying Funds in addition to the direct expenses incurred presented in the table. These fees and expenses are not included in the annualized expense ratio used to calculate the expense estimate in the table below.
Hypothetical Example for Comparison Purposes
The second line of the accompanying table provides information about hypothetical account values and hypothetical expenses based on the actual expense ratio and an assumed rate of return of 5% per year before expenses, which is not the actual return. The hypothetical account values and expenses may not be used to estimate the actual ending account balance or expenses you paid for the period. You may use this information to compare the ongoing costs of investing in the Fund and other funds. To do so, compare this 5% hypothetical example with the 5% hypothetical examples that appear in the shareholder reports of the other funds. If any fund is a shareholder of any Underlying Funds, such fund indirectly bears its proportional share of the expenses of the Underlying Funds in addition to the direct expenses as presented in the table. These fees and expenses are not included in the annualized expense ratio used to calculate the expense estimate in the table below.
Please note that the expenses shown in the table are meant to highlight your ongoing costs only and do not reflect any transaction costs. Therefore, the second line of the table is useful in comparing ongoing costs only, and will not help you determine the relative total costs of owning different funds. In addition, if these transactional costs were included, your costs would have been higher.
| | | | | Annualized Expense Ratio- A | | Beginning Account Value September 1, 2022 | | Ending Account Value February 28, 2023 | | Expenses Paid During Period- C September 1, 2022 to February 28, 2023 |
| | | | | | | | | | |
| Fidelity® Environment and Alternative Energy Fund | | | | .81% | | | | | | |
| Actual | | | | | | $ 1,000 | | $ 993.60 | | $ 4.00 |
Hypothetical- B | | | | | | $ 1,000 | | $ 1,020.78 | | $ 4.06 |
| | | | | | | | | | |
| Fidelity® Natural Resources Fund | | | | .76% | | | | | | |
| Actual | | | | | | $ 1,000 | | $ 1,136.40 | | $ 4.03 |
Hypothetical- B | | | | | | $ 1,000 | | $ 1,021.03 | | $ 3.81 |
| |
A Annualized expense ratio reflects expenses net of applicable fee waivers.
B 5% return per year before expenses
C Expenses are equal to the annualized expense ratio, multiplied by the average account value over the period, multiplied by 181/ 365 (to reflect the one-half year period). The fees and expenses of any Underlying Funds are not included in each annualized expense ratio.
The dividend and capital gains distributions for the fund(s) are available on Fidelity.com or Institutional.Fidelity.com.
A percentage of the dividends distributed during the fiscal year for the following funds qualify for the dividends-received deduction for corporate shareholders:
| | |
| Fidelity Environment and Alternative Energy Fund | |
| December 2022 | 100% |
| Fidelity Natural Resources Fund | |
| April 2022 | 40% |
| December 2022 | 54% |
A percentage of the dividends distributed during the fiscal year for the following funds may be taken into account as a dividend for purposes of the maximum rate under section 1(h)(11) of the Internal Revenue Code.
| | |
| Fidelity Environment and Alternative Energy Fund | |
| December 2022 | 100% |
| Fidelity Natural Resources Fund | |
| April 2022 | 100% |
| December 2022 | 100% |
The funds will notify shareholders in January 2024 of amounts for use in preparing 2023 income tax returns.
The Securities and Exchange Commission adopted Rule 22e-4 under the Investment Company Act of 1940 (the Liquidity Rule) to promote effective liquidity risk management throughout the open-end investment company industry, thereby reducing the risk that funds will be unable to meet their redemption obligations and mitigating dilution of the interests of fund shareholders.
The Funds have adopted and implemented a liquidity risk management program (the Program) reasonably designed to assess and manage each Fund's liquidity risk and to comply with the requirements of the Liquidity Rule. Each Fund's Board of Trustees (the Board) has designated each Fund's investment adviser as administrator of the Program. The Fidelity advisers have established a Liquidity Risk Management Committee (the LRM Committee) to manage the Program for each of the Fidelity Funds. The LRM Committee monitors the adequacy and effectiveness of implementation of the Program and on a periodic basis assesses each Fund's liquidity risk based on a variety of factors including (1) the Fund's investment strategy, (2) portfolio liquidity and cash flow projections during normal and reasonably foreseeable stressed conditions, (3) shareholder redemptions, (4) borrowings and other funding sources and (5) certain factor specific to ETFs including the effect of the Fund's prices and spreads, market participants, and basket compositions on the overall liquidity of the Fund's portfolio, as applicable.
In accordance with the Program, each of the Fund's portfolio investments is classified into one of four defined liquidity categories based on a determination of a reasonable expectation for how long it would take to convert the investment to cash (or sell or dispose of the investment) without significantly changing its market value.
- Highly liquid investments - cash or convertible to cash within three business days or less
- Moderately liquid investments - convertible to cash in three to seven calendar days
- Less liquid investments - can be sold or disposed of, but not settled, within seven calendar days
- Illiquid investments - cannot be sold or disposed of within seven calendar days
Liquidity classification determinations take into account a variety of factors including various market, trading and investment-specific considerations, as well as market depth, and generally utilize analysis from a third-party liquidity metrics service.
The Liquidity Rule places a 15% limit on a fund's illiquid investments and requires funds that do not primarily hold assets that are highly liquid investments to determine and maintain a minimum percentage of the fund's net assets to be invested in highly liquid investments (highly liquid investment minimum or HLIM). The Program includes provisions reasonably designed to comply with the 15% limit on illiquid investments and for determining, periodically reviewing and complying with the HLIM requirement as applicable.
At a recent meeting of the Fund's Board of Trustees, the LRM Committee provided a written report to the Board pertaining to the operation, adequacy, and effectiveness of the Program for the period December 1, 2021 through November 30, 2022. The report concluded that the Program is operating effectively and is reasonably designed to assess and manage the Fund's liquidity risk.
1.9901475.101
EAE-NRF-ANN-0423
Fidelity® Select Portfolios®
Consumer Staples Sector
Consumer Staples Portfolio
Annual Report
February 28, 2023
Includes Fidelity and Fidelity Advisor share classes
Contents
To view a fund's proxy voting guidelines and proxy voting record for the 12-month period ended June 30, visit http://www.fidelity.com/proxyvotingresults or visit the Securities and Exchange Commission's (SEC) web site at http://www.sec.gov.
You may also call 1-800-544-8544 if you're an individual investing directly with Fidelity, call 1-800-835-5092 if you're a plan sponsor or participant with Fidelity as your recordkeeper or call 1-877-208-0098 on institutional accounts or if you're an advisor or invest through one to request a free copy of the proxy voting guidelines.
Standard & Poor's, S&P and S&P 500 are registered service marks of The McGraw-Hill Companies, Inc. and have been licensed for use by Fidelity Distributors Corporation.
Other third-party marks appearing herein are the property of their respective owners.
All other marks appearing herein are registered or unregistered trademarks or service marks of FMR LLC or an affiliated company. © 2023 FMR LLC. All rights reserved.
This report and the financial statements contained herein are submitted for the general information of the shareholders of the Fund. This report is not authorized for distribution to prospective investors in the Fund unless preceded or accompanied by an effective prospectus.
A fund files its complete schedule of portfolio holdings with the SEC for the first and third quarters of each fiscal year on Form N-PORT. Forms N-PORT are available on the SEC's web site at http://www.sec.gov. A fund's Forms N-PORT may be reviewed and copied at the SEC's Public Reference Room in Washington, DC. Information regarding the operation of the SEC's Public Reference Room may be obtained by calling 1-800-SEC-0330.
For a complete list of a fund's portfolio holdings, view the most recent holdings listing, semiannual report, or annual report on Fidelity's web site at http://www.fidelity.com, http://www.institutional.fidelity.com, or http://www.401k.com, as applicable.
NOT FDIC INSURED •MAY LOSE VALUE •NO BANK GUARANTEE
Neither the Fund nor Fidelity Distributors Corporation is a bank.
Average annual total return reflects the change in the value of an investment, assuming reinvestment of distributions from dividend income and capital gains (the profits earned upon the sale of securities that have grown in value, if any) and assuming a constant rate of performance each year. The hypothetical investment and the average annual total returns do not reflect the deduction of taxes that a shareholder would pay on fund distributions or the redemption of fund shares. During periods of reimbursement by Fidelity, a fund's total return will be greater than it would be had the reimbursement not occurred. How a fund did yesterday is no guarantee of how it will do tomorrow.
| Average Annual Total Returns |
| | | | |
Periods ended February 28, 2023 | Past 1 year | Past 5 years | Past 10 years |
| Class A (incl.5.75% sales charge) | -7.15% | 6.26% | 6.84% |
| Class M (incl.3.50% sales charge) | -5.18% | 6.47% | 6.80% |
Class C (incl. contingent deferred sales charge) | -3.18% | 6.72% | 6.84% |
| Consumer Staples Portfolio | -1.21% | 7.83% | 7.78% |
| Class I | -1.22% | 7.82% | 7.76% |
| Class Z | -1.09% | 7.94% | 7.83% |
Class C shares' contingent deferred sales charges included in the past one year, past five years and past ten years total return figures are 1%, 0% and 0%, respectively.
The initial offering of Class Z shares took place on October 2, 2018. Returns prior to October 2, 2018, are those of Class I.
| $10,000 Over 10 Years |
| |
Let's say hypothetically that $10,000 was invested in Consumer Staples Portfolio, a class of the fund, on February 28, 2013. The chart shows how the value of your investment would have changed, and also shows how the S&P 500® Index performed over the same period. |
|
|
Market Recap:
U.S. equities returned -7.69% for the 12 months ending February 28, 2023, according to the S&P 500® index. The new year began with an encouraging upturn in January (+6.28%), but stocks lost momentum in February (-2.44%) amid higher-than-expected inflation and strong jobs data. Investors took these as signs that the economy continued to run hot, even after a year of historic policy adjustment by the Federal Reserve aimed at cooling economic growth. Record inflation in 2022 prompted the Fed to aggressively tighten monetary policy, and market interest rates eclipsed their highest level in a decade, stoking recession fears and sending stocks into bear market territory. Since March 2022, the central bank has hiked its benchmark rate eight times, by 4.5 percentage points - the fastest-ever pace of monetary tightening - while also shrinking its massive asset portfolio. The latest bump came on February 2, along with a signal that the Fed plans to lift rates in March while it considers whether and when to pause increases. Against this dynamic backdrop, stocks struggled to gain traction until a strong rally ignited heading into the summer. But in September, the index returned -9.21%, one of its worst monthly results ever, before advancing 7.56% in Q4, as risky assets regained favor. For the full 12 months, value stocks handily outpaced growth. The headwind for the latter was most pronounced in the growth-oriented communication services (-25%) and consumer discretionary (-18%) sectors. In sharp contrast, energy gained 24%.
Comments from Portfolio Manager Ben Shuleva:
For the fiscal year ending February 28, 2023, the fund's share classes (excluding sales charges, if applicable) returned about -2% to -1%, versus the -1.01% result of the MSCI U.S. IMI Consumer Staples 25/50 Index, and well ahead of the broad-based S&P 500® index. The largest detractor from performance relative to the sector index was security selection in the personal products category. Stock picks in advertising also notably hindered the fund's relative result. The fund's biggest individual relative detractor was an overweight in Herbalife Nutrition, which returned -46% the past 12 months. We pared our stake. Another notable relative detractor was an out-of-index investment in Advantage Solutions (-72%). The fund's non-index position in Olaplex Holdings, which we established this period, returned roughly -63%. In contrast, stock picks in the packaged foods & meats segment gave the biggest boost to the fund's performance versus the sector index. Security selection in the hypermarkets & super centers group and household products category also bolstered the fund's relative result. The fund's biggest individual relative contributor was an outsized stake in Monster Beverage, which gained 20% the past 12 months. Though we reduced our shares in the company, it was among our largest holdings at period end. Also lifting the fund's performance was our overweight in Lamb Weston Holdings, which gained approximately 51%. Lamb Weston was not held at period end. Another notable relative contributor was an underweight in Costco Wholesale (-4%), a stake we established the past year. Notable changes in positioning include reduced exposure to the tobacco group and an increased weight in distillers & vintners.
The views expressed above reflect those of the portfolio manager(s) only through the end of the period as stated on the cover of this report and do not necessarily represent the views of Fidelity or any other person in the Fidelity organization. Any such views are subject to change at any time based upon market or other conditions and Fidelity disclaims any responsibility to update such views. These views may not be relied on as investment advice and, because investment decisions for a Fidelity fund are based on numerous factors, may not be relied on as an indication of trading intent on behalf of any Fidelity fund.
Top Holdings (% of Fund's net assets) |
| |
| Procter & Gamble Co. | 14.2 | |
| The Coca-Cola Co. | 14.2 | |
| Walmart, Inc. | 6.5 | |
| Mondelez International, Inc. | 5.9 | |
| Altria Group, Inc. | 5.5 | |
| Constellation Brands, Inc. Class A (sub. vtg.) | 4.4 | |
| Monster Beverage Corp. | 4.3 | |
| Philip Morris International, Inc. | 4.3 | |
| PepsiCo, Inc. | 4.2 | |
| Keurig Dr. Pepper, Inc. | 4.1 | |
| | 67.6 | |
| |
| Industries (% of Fund's net assets) |
| |
| Beverages | 35.8 | |
| Household Products | 21.6 | |
| Food Products | 17.2 | |
| Food & Staples Retailing | 11.7 | |
| Tobacco | 9.8 | |
| Personal Products | 2.4 | |
| Internet & Direct Marketing Retail | 0.8 | |
| Household Durables | 0.4 | |
| Media | 0.3 | |
| Hotels, Restaurants & Leisure | 0.0 | |
| |
Showing Percentage of Net Assets
| Common Stocks - 100.0% |
| | | Shares | Value ($) |
| Beverages - 35.8% | | | |
| Brewers - 2.9% | | | |
| Boston Beer Co., Inc. Class A (a) | | 139,100 | 45,040,580 |
| Distillers & Vintners - 5.5% | | | |
| Brown-Forman Corp. Class B (non-vtg.) | | 27,400 | 1,777,438 |
| Constellation Brands, Inc. Class A (sub. vtg.) | | 304,384 | 68,090,701 |
| Diageo PLC | | 372,624 | 15,812,847 |
| Pernod Ricard SA | | 1,600 | 334,572 |
| | | | 86,015,558 |
| Soft Drinks - 27.4% | | | |
| Celsius Holdings, Inc. (a) | | 15,000 | 1,362,000 |
| Keurig Dr. Pepper, Inc. | | 1,841,827 | 63,635,123 |
| Monster Beverage Corp. (a) | | 657,013 | 66,857,643 |
| PepsiCo, Inc. | | 375,604 | 65,178,562 |
| Primo Water Corp. | | 433,500 | 6,710,580 |
| The Coca-Cola Co. | | 3,698,018 | 220,069,051 |
| The Vita Coco Co., Inc. (a) | | 8,800 | 148,808 |
| | | | 423,961,767 |
TOTAL BEVERAGES | | | 555,017,905 |
| Food & Staples Retailing - 11.7% | | | |
| Drug Retail - 0.2% | | | |
| Walgreens Boots Alliance, Inc. | | 59,100 | 2,099,823 |
| Food Distributors - 2.9% | | | |
| Performance Food Group Co. (a) | | 144,800 | 8,194,232 |
| Sysco Corp. | | 276,956 | 20,652,609 |
| U.S. Foods Holding Corp. (a) | | 441,674 | 16,576,025 |
| | | | 45,422,866 |
| Food Retail - 1.3% | | | |
| Albertsons Companies, Inc. | | 557,100 | 11,075,148 |
| Alimentation Couche-Tard, Inc. Class A (multi-vtg.) | | 14,400 | 675,518 |
| Grocery Outlet Holding Corp. (a) | | 74,050 | 2,003,053 |
| Kroger Co. | | 144,600 | 6,238,044 |
| | | | 19,991,763 |
| Hypermarkets & Super Centers - 7.3% | | | |
| Costco Wholesale Corp. | | 26,900 | 13,024,442 |
| Walmart, Inc. | | 705,900 | 100,329,567 |
| | | | 113,354,009 |
TOTAL FOOD & STAPLES RETAILING | | | 180,868,461 |
| Food Products - 17.2% | | | |
| Agricultural Products - 3.4% | | | |
| Archer Daniels Midland Co. | | 113,600 | 9,042,560 |
| Bunge Ltd. | | 303,993 | 29,031,332 |
| Darling Ingredients, Inc. (a) | | 197,961 | 12,524,992 |
| Ingredion, Inc. | | 16,000 | 1,590,400 |
| | | | 52,189,284 |
| Packaged Foods & Meats - 13.8% | | | |
| Conagra Brands, Inc. | | 354,541 | 12,908,838 |
| Freshpet, Inc. (a)(b) | | 269,600 | 16,763,728 |
| Laird Superfood, Inc. (a)(b) | | 220,582 | 247,052 |
| McCormick & Co., Inc. (non-vtg.) | | 119,900 | 8,910,968 |
| Mondelez International, Inc. | | 1,409,497 | 91,871,014 |
| Nomad Foods Ltd. (a) | | 1,876,159 | 33,620,769 |
| Pilgrim's Pride Corp. (a) | | 32,200 | 753,158 |
| Sovos Brands, Inc. (a) | | 292,298 | 3,820,335 |
| The Hain Celestial Group, Inc. (a) | | 125,700 | 2,241,231 |
| The Kraft Heinz Co. | | 27,000 | 1,051,380 |
| The Real Good Food Co. LLC: | | | |
| Class B (c) | | 58,667 | 1 |
| Class B unit (d) | | 58,667 | 226,455 |
| The Simply Good Foods Co. (a) | | 113,800 | 4,357,402 |
| TreeHouse Foods, Inc. (a) | | 402,708 | 19,648,123 |
| Tyson Foods, Inc. Class A | | 286,166 | 16,952,474 |
| | | | 213,372,928 |
TOTAL FOOD PRODUCTS | | | 265,562,212 |
| Hotels, Restaurants & Leisure - 0.0% | | | |
| Restaurants - 0.0% | | | |
| Compass Group PLC | | 4 | 92 |
| Household Durables - 0.4% | | | |
| Household Appliances - 0.3% | | | |
| Helen of Troy Ltd. (a) | | 41,500 | 4,676,635 |
| Housewares & Specialties - 0.1% | | | |
| Tupperware Brands Corp. (a) | | 276,662 | 1,134,314 |
TOTAL HOUSEHOLD DURABLES | | | 5,810,949 |
| Household Products - 21.6% | | | |
| Household Products - 21.6% | | | |
| Church & Dwight Co., Inc. | | 30,300 | 2,538,534 |
| Colgate-Palmolive Co. | | 124,700 | 9,140,510 |
| Energizer Holdings, Inc. (b) | | 913,144 | 33,083,207 |
| Kimberly-Clark Corp. | | 164,533 | 20,574,852 |
| Procter & Gamble Co. | | 1,600,282 | 220,134,790 |
| Reckitt Benckiser Group PLC | | 82,200 | 5,703,448 |
| Reynolds Consumer Products, Inc. (b) | | 412,339 | 11,314,582 |
| Spectrum Brands Holdings, Inc. | | 275,000 | 17,605,500 |
| The Clorox Co. | | 94,174 | 14,638,407 |
| | | | 334,733,830 |
| Internet & Direct Marketing Retail - 0.8% | | | |
| Internet & Direct Marketing Retail - 0.8% | | | |
| Amazon.com, Inc. (a) | | 128,800 | 12,136,824 |
| Media - 0.3% | | | |
| Advertising - 0.3% | | | |
| Advantage Solutions, Inc. Class A (a)(b) | | 2,060,867 | 4,533,907 |
| Personal Products - 2.4% | | | |
| Personal Products - 2.4% | | | |
| BellRing Brands, Inc. (a) | | 151,700 | 4,684,496 |
| Edgewell Personal Care Co. (b) | | 26,100 | 1,114,470 |
| Estee Lauder Companies, Inc. Class A | | 27,155 | 6,600,023 |
| Herbalife Nutrition Ltd. (a)(b) | | 749,050 | 14,494,118 |
| Olaplex Holdings, Inc. (a)(b) | | 2,198,100 | 10,814,652 |
| | | | 37,707,759 |
| Tobacco - 9.8% | | | |
| Tobacco - 9.8% | | | |
| Altria Group, Inc. | | 1,847,617 | 85,784,857 |
| Philip Morris International, Inc. | | 685,182 | 66,668,209 |
| | | | 152,453,066 |
| TOTAL COMMON STOCKS (Cost $1,234,376,846) | | | 1,548,825,005 |
| | | | |
| Money Market Funds - 2.4% |
| | | Shares | Value ($) |
| Fidelity Cash Central Fund 4.63% (e) | | 691,479 | 691,618 |
| Fidelity Securities Lending Cash Central Fund 4.63% (e)(f) | | 36,894,714 | 36,898,404 |
| TOTAL MONEY MARKET FUNDS (Cost $37,590,022) | | | 37,590,022 |
| | | | |
| TOTAL INVESTMENT IN SECURITIES - 102.4% (Cost $1,271,966,868) | 1,586,415,027 |
NET OTHER ASSETS (LIABILITIES) - (2.4)% | (37,601,127) |
| NET ASSETS - 100.0% | 1,548,813,900 |
| | |
Legend
| (b) | Security or a portion of the security is on loan at period end. |
| (d) | Security exempt from registration under Rule 144A of the Securities Act of 1933. These securities may be resold in transactions exempt from registration, normally to qualified institutional buyers. At the end of the period, the value of these securities amounted to $226,455 or 0.0% of net assets. |
| (e) | Affiliated fund that is generally available only to investment companies and other accounts managed by Fidelity Investments. The rate quoted is the annualized seven-day yield of the fund at period end. A complete unaudited listing of the fund's holdings as of its most recent quarter end is available upon request. In addition, each Fidelity Central Fund's financial statements, which are not covered by the Fund's Report of Independent Registered Public Accounting Firm, are available on the SEC's website or upon request. |
| (f) | Investment made with cash collateral received from securities on loan. |
Affiliated Central Funds
Fiscal year to date information regarding the Fund's investments in Fidelity Central Funds, including the ownership percentage, is presented below.
| Affiliate | Value, beginning of period ($) | Purchases ($) | Sales Proceeds ($) | Dividend Income ($) | Realized Gain (loss) ($) | Change in Unrealized appreciation (depreciation) ($) | Value, end of period ($) | % ownership, end of period |
| Fidelity Cash Central Fund 4.63% | 14,588,277 | 206,081,384 | 219,978,043 | 87,644 | - | - | 691,618 | 0.0% |
| Fidelity Securities Lending Cash Central Fund 4.63% | 13,163,424 | 344,789,252 | 321,054,272 | 39,959 | - | - | 36,898,404 | 0.1% |
| Total | 27,751,701 | 550,870,636 | 541,032,315 | 127,603 | - | - | 37,590,022 | |
| | | | | | | | | |
Amounts in the dividend income column in the above table include any capital gain distributions from underlying funds, which are presented in the corresponding line item in the Statement of Operations, if applicable.
Amount for Fidelity Securities Lending Cash Central Fund represents the income earned on investing cash collateral, less rebates paid to borrowers and any lending agent fees associated with the loan, plus any premium payments received for lending certain types of securities.
Amounts included in the purchases and sales proceeds columns may include in-kind transactions, if applicable.
Investment Valuation
The following is a summary of the inputs used, as of February 28, 2023, involving the Fund's assets and liabilities carried at fair value. The inputs or methodology used for valuing securities may not be an indication of the risk associated with investing in those securities. For more information on valuation inputs, and their aggregation into the levels used below, please refer to the Investment Valuation section in the accompanying Notes to Financial Statements.
| Valuation Inputs at Reporting Date: |
| Description | Total ($) | Level 1 ($) | Level 2 ($) | Level 3 ($) |
Investments in Securities: | | | | |
|
| Common Stocks | 1,548,825,005 | 1,527,308,617 | 21,516,387 | 1 |
|
| Money Market Funds | 37,590,022 | 37,590,022 | - | - |
| Total Investments in Securities: | 1,586,415,027 | 1,564,898,639 | 21,516,387 | 1 |
| Statement of Assets and Liabilities |
| | | | February 28, 2023 |
| | | | | |
| Assets | | | | |
| Investment in securities, at value (including securities loaned of $35,485,524) - See accompanying schedule: | | | | |
Unaffiliated issuers (cost $1,234,376,846) | $ | 1,548,825,005 | | |
Fidelity Central Funds (cost $37,590,022) | | 37,590,022 | | |
| | | | | |
| | | | | |
| Total Investment in Securities (cost $1,271,966,868) | | | $ | 1,586,415,027 |
| Receivable for investments sold | | | | 470,148 |
| Receivable for fund shares sold | | | | 432,262 |
| Dividends receivable | | | | 1,120,560 |
| Distributions receivable from Fidelity Central Funds | | | | 2,412 |
| Prepaid expenses | | | | 6,674 |
| Other receivables | | | | 272,512 |
Total assets | | | | 1,588,719,595 |
| Liabilities | | | | |
| Payable for investments purchased | $ | 564,298 | | |
| Payable for fund shares redeemed | | 1,021,497 | | |
| Accrued management fee | | 696,239 | | |
| Distribution and service plan fees payable | | 157,714 | | |
| Other affiliated payables | | 255,154 | | |
| Other payables and accrued expenses | | 312,618 | | |
| Collateral on securities loaned | | 36,898,175 | | |
| Total Liabilities | | | | 39,905,695 |
| Net Assets | | | $ | 1,548,813,900 |
| Net Assets consist of: | | | | |
| Paid in capital | | | $ | 1,240,880,615 |
| Total accumulated earnings (loss) | | | | 307,933,285 |
| Net Assets | | | $ | 1,548,813,900 |
| | | | | |
| Net Asset Value and Maximum Offering Price | | | | |
| Class A : | | | | |
Net Asset Value and redemption price per share ($297,850,131 ÷ 3,264,269 shares) (a) | | | $ | 91.25 |
| Maximum offering price per share (100/94.25 of $91.25) | | | $ | 96.82 |
| Class M : | | | | |
Net Asset Value and redemption price per share ($62,869,916 ÷ 697,735 shares) (a) | | | $ | 90.11 |
| Maximum offering price per share (100/96.50 of $90.11) | | | $ | 93.38 |
| Class C : | | | | |
Net Asset Value and offering price per share ($78,496,964 ÷ 889,750 shares) (a) | | | $ | 88.22 |
| Consumer Staples : | | | | |
Net Asset Value , offering price and redemption price per share ($862,837,178 ÷ 9,334,961 shares) | | | $ | 92.43 |
| Class I : | | | | |
Net Asset Value , offering price and redemption price per share ($158,018,769 ÷ 1,714,573 shares) | | | $ | 92.16 |
| Class Z : | | | | |
Net Asset Value , offering price and redemption price per share ($88,740,942 ÷ 964,084 shares) | | | $ | 92.05 |
(a)Redemption price per share is equal to net asset value less any applicable contingent deferred sales charge. |
| Statement of Operations |
| | | | Year ended February 28, 2023 |
| Investment Income | | | | |
| Dividends | | | $ | 40,213,248 |
| Income from Fidelity Central Funds (including $39,959 from security lending) | | | | 127,603 |
| Total Income | | | | 40,340,851 |
| Expenses | | | | |
| Management fee | $ | 8,428,642 | | |
| Transfer agent fees | | 2,631,292 | | |
| Distribution and service plan fees | | 1,872,304 | | |
| Accounting fees | | 455,820 | | |
| Custodian fees and expenses | | 24,854 | | |
| Independent trustees' fees and expenses | | 5,474 | | |
| Registration fees | | 138,871 | | |
| Audit | | 49,914 | | |
| Legal | | 4,059 | | |
| Interest | | 13,604 | | |
| Miscellaneous | | 9,878 | | |
| Total expenses before reductions | | 13,634,712 | | |
| Expense reductions | | (55,573) | | |
| Total expenses after reductions | | | | 13,579,139 |
| Net Investment income (loss) | | | | 26,761,712 |
| Realized and Unrealized Gain (Loss) | | | | |
| Net realized gain (loss) on: | | | | |
| Investment Securities: | | | | |
| Unaffiliated issuers | | 557,787 | | |
| Foreign currency transactions | | (48,065) | | |
| Total net realized gain (loss) | | | | 509,722 |
| Change in net unrealized appreciation (depreciation) on: | | | | |
| Investment Securities: | | | | |
| Unaffiliated issuers | | (58,457,249) | | |
| Assets and liabilities in foreign currencies | | (4,462) | | |
| Total change in net unrealized appreciation (depreciation) | | | | (58,461,711) |
| Net gain (loss) | | | | (57,951,989) |
| Net increase (decrease) in net assets resulting from operations | | | $ | (31,190,277) |
| Statement of Changes in Net Assets |
| |
| | Year ended February 28, 2023 | | Year ended February 28, 2022 |
| Increase (Decrease) in Net Assets | | | | |
| Operations | | | | |
| Net investment income (loss) | $ | 26,761,712 | $ | 23,869,410 |
| Net realized gain (loss) | | 509,722 | | 117,808,690 |
| Change in net unrealized appreciation (depreciation) | | (58,461,711) | | 106,519,256 |
| Net increase (decrease) in net assets resulting from operations | | (31,190,277) | | 248,197,356 |
| Distributions to shareholders | | (52,925,514) | | (153,414,832) |
| Share transactions - net increase (decrease) | | (73,640,667) | | 254,802,169 |
| Total increase (decrease) in net assets | | (157,756,458) | | 349,584,693 |
| | | | | |
| Net Assets | | | | |
| Beginning of period | | 1,706,570,358 | | 1,356,985,665 |
| End of period | $ | 1,548,813,900 | $ | 1,706,570,358 |
| | | | | |
| | | | | |
Financial Highlights
| Fidelity Advisor® Consumer Staples Fund Class A |
| |
| Years ended February 28, | | 2023 | | 2022 | | 2021 | | 2020 A | | 2019 |
Selected Per-Share Data | | | | | | | | | | |
| Net asset value, beginning of period | $ | 95.55 | $ | 89.40 | $ | 79.57 | $ | 76.88 | $ | 87.07 |
| Income from Investment Operations | | | | | | | | | | |
Net investment income (loss) B,C | | 1.38 | | 1.40 | | 1.34 | | 1.40 | | 2.08 D |
| Net realized and unrealized gain (loss) | | (2.79) | | 14.98 | | 11.24 | | 3.54 | | (2.64) |
| Total from investment operations | | (1.41) | | 16.38 | | 12.58 | | 4.94 | | (.56) |
| Distributions from net investment income | | (1.36) | | (1.55) | | (1.42) | | (1.35) | | (2.11) |
| Distributions from net realized gain | | (1.53) | | (8.68) | | (1.33) | | (.90) | | (7.53) |
| Total distributions | | (2.89) | | (10.23) | | (2.75) | | (2.25) | | (9.63) E |
| Net asset value, end of period | $ | 91.25 | $ | 95.55 | $ | 89.40 | $ | 79.57 | $ | 76.88 |
Total Return F,G | | (1.49)% | | 18.83% | | 16.00% | | 6.17% | | (.32)% |
Ratios to Average Net Assets C,H,I | | | | | | | | | | |
| Expenses before reductions | | 1.01% | | 1.01% | | 1.04% | | 1.04% | | 1.05% |
| Expenses net of fee waivers, if any | | 1.01% | | 1.01% | | 1.04% | | 1.04% | | 1.05% |
| Expenses net of all reductions | | 1.01% | | 1.01% | | 1.03% | | 1.04% | | 1.04% |
| Net investment income (loss) | | 1.51% | | 1.45% | | 1.57% | | 1.67% | | 2.65% D |
| Supplemental Data | | | | | | | | | | |
| Net assets, end of period (000 omitted) | $ | 297,850 | $ | 293,276 | $ | 248,234 | $ | 239,067 | $ | 232,020 |
Portfolio turnover rate J | | 46% | | 61% | | 51% | | 40% | | 41% K |
A For the year ended February 29.
B Calculated based on average shares outstanding during the period.
C Net investment income (loss) is affected by the timing of the declaration of dividends by any underlying mutual funds or exchange-traded funds (ETFs). Net investment income (loss) of any mutual funds or ETFs is not included in the Fund's net investment income (loss) ratio.
D Net investment income per share reflects one or more large, non-recurring dividend(s) which amounted to $.69 per share. Excluding such non-recurring dividend(s), the ratio of net investment income (loss) to average net assets would have been 1.78%.
E Total distributions per share do not sum due to rounding.
F Total returns would have been lower if certain expenses had not been reduced during the applicable periods shown.
G Total returns do not include the effect of the sales charges.
H Fees and expenses of any underlying mutual funds or exchange-traded funds (ETFs) are not included in the Fund's expense ratio. The Fund indirectly bears its proportionate share of these expenses. For additional expense information related to investments in Fidelity Central Funds, please refer to the "Investments in Fidelity Central Funds" note found in the Notes to Financial Statements section of the most recent Annual or Semi-Annual report.
I Expense ratios reflect operating expenses of the class. Expenses before reductions do not reflect amounts reimbursed, waived, or reduced through arrangements with the investment adviser, brokerage services, or other offset arrangements, if applicable, and do not represent the amount paid by the class during periods when reimbursements, waivers or reductions occur.
J Amount does not include the portfolio activity of any underlying mutual funds or exchange-traded funds (ETFs).
K Portfolio turnover rate excludes securities received or delivered in-kind.
| Fidelity Advisor® Consumer Staples Fund Class M |
| |
| Years ended February 28, | | 2023 | | 2022 | | 2021 | | 2020 A | | 2019 |
Selected Per-Share Data | | | | | | | | | | |
| Net asset value, beginning of period | $ | 94.39 | $ | 88.43 | $ | 78.74 | $ | 76.13 | $ | 86.30 |
| Income from Investment Operations | | | | | | | | | | |
Net investment income (loss) B,C | | 1.13 | | 1.13 | | 1.10 | | 1.16 | | 1.85 D |
| Net realized and unrealized gain (loss) | | (2.76) | | 14.81 | | 11.11 | | 3.50 | | (2.61) |
| Total from investment operations | | (1.63) | | 15.94 | | 12.21 | | 4.66 | | (.76) |
| Distributions from net investment income | | (1.12) | | (1.30) | | (1.19) | | (1.15) | | (1.88) |
| Distributions from net realized gain | | (1.53) | | (8.68) | | (1.33) | | (.90) | | (7.53) |
| Total distributions | | (2.65) | | (9.98) | | (2.52) | | (2.05) | | (9.41) |
| Net asset value, end of period | $ | 90.11 | $ | 94.39 | $ | 88.43 | $ | 78.74 | $ | 76.13 |
Total Return E,F | | (1.74)% | | 18.51% | | 15.69% | | 5.88% | | (.59)% |
Ratios to Average Net Assets C,G,H | | | | | | | | | | |
| Expenses before reductions | | 1.27% | | 1.28% | | 1.31% | | 1.31% | | 1.33% |
| Expenses net of fee waivers, if any | | 1.27% | | 1.28% | | 1.31% | | 1.31% | | 1.32% |
| Expenses net of all reductions | | 1.27% | | 1.28% | | 1.30% | | 1.31% | | 1.31% |
| Net investment income (loss) | | 1.25% | | 1.18% | | 1.30% | | 1.40% | | 2.37% D |
| Supplemental Data | | | | | | | | | | |
| Net assets, end of period (000 omitted) | $ | 62,870 | $ | 64,707 | $ | 56,664 | $ | 55,954 | $ | 60,069 |
Portfolio turnover rate I | | 46% | | 61% | | 51% | | 40% | | 41% J |
A For the year ended February 29.
B Calculated based on average shares outstanding during the period.
C Net investment income (loss) is affected by the timing of the declaration of dividends by any underlying mutual funds or exchange-traded funds (ETFs). Net investment income (loss) of any mutual funds or ETFs is not included in the Fund's net investment income (loss) ratio.
D Net investment income per share reflects one or more large, non-recurring dividend(s) which amounted to $.68 per share. Excluding such non-recurring dividend(s), the ratio of net investment income (loss) to average net assets would have been 1.50%.
E Total returns would have been lower if certain expenses had not been reduced during the applicable periods shown.
F Total returns do not include the effect of the sales charges.
G Fees and expenses of any underlying mutual funds or exchange-traded funds (ETFs) are not included in the Fund's expense ratio. The Fund indirectly bears its proportionate share of these expenses. For additional expense information related to investments in Fidelity Central Funds, please refer to the "Investments in Fidelity Central Funds" note found in the Notes to Financial Statements section of the most recent Annual or Semi-Annual report.
H Expense ratios reflect operating expenses of the class. Expenses before reductions do not reflect amounts reimbursed, waived, or reduced through arrangements with the investment adviser, brokerage services, or other offset arrangements, if applicable, and do not represent the amount paid by the class during periods when reimbursements, waivers or reductions occur.
I Amount does not include the portfolio activity of any underlying mutual funds or exchange-traded funds (ETFs).
J Portfolio turnover rate excludes securities received or delivered in-kind.
| Fidelity Advisor® Consumer Staples Fund Class C |
| |
| Years ended February 28, | | 2023 | | 2022 | | 2021 | | 2020 A | | 2019 |
Selected Per-Share Data | | | | | | | | | | |
| Net asset value, beginning of period | $ | 92.48 | $ | 86.73 | $ | 77.27 | $ | 74.79 | $ | 84.85 |
| Income from Investment Operations | | | | | | | | | | |
Net investment income (loss) B,C | | .67 | | .65 | | .68 | | .75 | | 1.46 D |
| Net realized and unrealized gain (loss) | | (2.69) | | 14.51 | | 10.87 | | 3.44 | | (2.57) |
| Total from investment operations | | (2.02) | | 15.16 | | 11.55 | | 4.19 | | (1.11) |
| Distributions from net investment income | | (.71) | | (.79) | | (.80) | | (.81) | | (1.43) |
| Distributions from net realized gain | | (1.53) | | (8.62) | | (1.30) | | (.90) | | (7.53) |
| Total distributions | | (2.24) | | (9.41) | | (2.09) E | | (1.71) | | (8.95) E |
| Net asset value, end of period | $ | 88.22 | $ | 92.48 | $ | 86.73 | $ | 77.27 | $ | 74.79 |
Total Return F,G | | (2.23)% | | 17.92% | | 15.14% | | 5.39% | | (1.05)% |
Ratios to Average Net Assets B,H,I | | | | | | | | | | |
| Expenses before reductions | | 1.77% | | 1.77% | | 1.79% | | 1.79% | | 1.79% |
| Expenses net of fee waivers, if any | | 1.76% | | 1.76% | | 1.79% | | 1.79% | | 1.79% |
| Expenses net of all reductions | | 1.76% | | 1.76% | | 1.78% | | 1.79% | | 1.78% |
| Net investment income (loss) | | .76% | | .70% | | .83% | | .92% | | 1.91% D |
| Supplemental Data | | | | | | | | | | |
| Net assets, end of period (000 omitted) | $ | 78,497 | $ | 88,645 | $ | 104,955 | $ | 117,328 | $ | 150,822 |
Portfolio turnover rate J | | 46% | | 61% | | 51% | | 40% | | 41% K |
A For the year ended February 29.
B Net investment income (loss) is affected by the timing of the declaration of dividends by any underlying mutual funds or exchange-traded funds (ETFs). Net investment income (loss) of any mutual funds or ETFs is not included in the Fund's net investment income (loss) ratio.
C Calculated based on average shares outstanding during the period.
D Net investment income per share reflects one or more large, non-recurring dividend(s) which amounted to $.67 per share. Excluding such non-recurring dividend(s), the ratio of net investment income (loss) to average net assets would have been 1.04%.
E Total distributions per share do not sum due to rounding.
F Total returns would have been lower if certain expenses had not been reduced during the applicable periods shown.
G Total returns do not include the effect of the contingent deferred sales charge.
H Expense ratios reflect operating expenses of the class. Expenses before reductions do not reflect amounts reimbursed, waived, or reduced through arrangements with the investment adviser, brokerage services, or other offset arrangements, if applicable, and do not represent the amount paid by the class during periods when reimbursements, waivers or reductions occur.
I Fees and expenses of any underlying mutual funds or exchange-traded funds (ETFs) are not included in the Fund's expense ratio. The Fund indirectly bears its proportionate share of these expenses. For additional expense information related to investments in Fidelity Central Funds, please refer to the "Investments in Fidelity Central Funds" note found in the Notes to Financial Statements section of the most recent Annual or Semi-Annual report.
J Amount does not include the portfolio activity of any underlying mutual funds or exchange-traded funds (ETFs).
K Portfolio turnover rate excludes securities received or delivered in-kind.
| Consumer Staples Portfolio |
| |
| Years ended February 28, | | 2023 | | 2022 | | 2021 | | 2020 A | | 2019 |
Selected Per-Share Data | | | | | | | | | | |
| Net asset value, beginning of period | $ | 96.75 | $ | 90.40 | $ | 80.42 | $ | 77.63 | $ | 87.85 |
| Income from Investment Operations | | | | | | | | | | |
Net investment income (loss) B,C | | 1.66 | | 1.69 | | 1.60 | | 1.66 | | 2.34 D |
| Net realized and unrealized gain (loss) | | (2.84) | | 15.16 | | 11.39 | | 3.59 | | (2.67) |
| Total from investment operations | | (1.18) | | 16.85 | | 12.99 | | 5.25 | | (.33) |
| Distributions from net investment income | | (1.61) | | (1.81) | | (1.68) | | (1.55) | | (2.36) |
| Distributions from net realized gain | | (1.53) | | (8.68) | | (1.33) | | (.90) | | (7.53) |
| Total distributions | | (3.14) | | (10.50) E | | (3.01) | | (2.46) E | | (9.89) |
| Net asset value, end of period | $ | 92.43 | $ | 96.75 | $ | 90.40 | $ | 80.42 | $ | 77.63 |
Total Return F | | (1.21)% | | 19.16% | | 16.34% | | 6.48% | | (.03)% |
Ratios to Average Net Assets C,G,H | | | | | | | | | | |
| Expenses before reductions | | .73% | | .73% | | .75% | | .75% | | .77% |
| Expenses net of fee waivers, if any | | .73% | | .73% | | .75% | | .75% | | .76% |
| Expenses net of all reductions | | .73% | | .73% | | .74% | | .75% | | .75% |
| Net investment income (loss) | | 1.79% | | 1.74% | | 1.86% | | 1.96% | | 2.94% D |
| Supplemental Data | | | | | | | | | | |
| Net assets, end of period (000 omitted) | $ | 862,837 | $ | 1,032,956 | $ | 770,644 | $ | 773,437 | $ | 814,350 |
Portfolio turnover rate I | | 46% | | 61% | | 51% | | 40% | | 41% J |
A For the year ended February 29.
B Calculated based on average shares outstanding during the period.
C Net investment income (loss) is affected by the timing of the declaration of dividends by any underlying mutual funds or exchange-traded funds (ETFs). Net investment income (loss) of any mutual funds or ETFs is not included in the Fund's net investment income (loss) ratio.
D Net investment income per share reflects one or more large, non-recurring dividend(s) which amounted to $.69 per share. Excluding such non-recurring dividend(s), the ratio of net investment income (loss) to average net assets would have been 2.07%.
E Total distributions per share do not sum due to rounding.
F Total returns would have been lower if certain expenses had not been reduced during the applicable periods shown.
G Fees and expenses of any underlying mutual funds or exchange-traded funds (ETFs) are not included in the Fund's expense ratio. The Fund indirectly bears its proportionate share of these expenses. For additional expense information related to investments in Fidelity Central Funds, please refer to the "Investments in Fidelity Central Funds" note found in the Notes to Financial Statements section of the most recent Annual or Semi-Annual report.
H Expense ratios reflect operating expenses of the class. Expenses before reductions do not reflect amounts reimbursed, waived, or reduced through arrangements with the investment adviser, brokerage services, or other offset arrangements, if applicable, and do not represent the amount paid by the class during periods when reimbursements, waivers or reductions occur.
I Amount does not include the portfolio activity of any underlying mutual funds or exchange-traded funds (ETFs).
J Portfolio turnover rate excludes securities received or delivered in-kind.
| Fidelity Advisor® Consumer Staples Fund Class I |
| |
| Years ended February 28, | | 2023 | | 2022 | | 2021 | | 2020 A | | 2019 |
Selected Per-Share Data | | | | | | | | | | |
| Net asset value, beginning of period | $ | 96.48 | $ | 90.17 | $ | 80.23 | $ | 77.45 | $ | 87.68 |
| Income from Investment Operations | | | | | | | | | | |
Net investment income (loss) B,C | | 1.65 | | 1.67 | | 1.60 | | 1.65 | | 2.33 D |
| Net realized and unrealized gain (loss) | | (2.83) | | 15.13 | | 11.34 | | 3.58 | | (2.68) |
| Total from investment operations | | (1.18) | | 16.80 | | 12.94 | | 5.23 | | (.35) |
| Distributions from net investment income | | (1.61) | | (1.80) | | (1.67) | | (1.55) | | (2.36) |
| Distributions from net realized gain | | (1.53) | | (8.68) | | (1.33) | | (.90) | | (7.53) |
| Total distributions | | (3.14) | | (10.49) E | | (3.00) | | (2.45) | | (9.88) E |
| Net asset value, end of period | $ | 92.16 | $ | 96.48 | $ | 90.17 | $ | 80.23 | $ | 77.45 |
Total Return F | | (1.22)% | | 19.15% | | 16.32% | | 6.48% | | (.04)% |
Ratios to Average Net Assets C,G,H | | | | | | | | | | |
| Expenses before reductions | | .74% | | .74% | | .76% | | .76% | | .77% |
| Expenses net of fee waivers, if any | | .74% | | .74% | | .75% | | .76% | | .77% |
| Expenses net of all reductions | | .74% | | .74% | | .75% | | .76% | | .76% |
| Net investment income (loss) | | 1.78% | | 1.72% | | 1.86% | | 1.95% | | 2.93% D |
| Supplemental Data | | | | | | | | | | |
| Net assets, end of period (000 omitted) | $ | 158,019 | $ | 149,160 | $ | 132,898 | $ | 149,514 | $ | 159,614 |
Portfolio turnover rate I | | 46% | | 61% | | 51% | | 40% | | 41% J |
A For the year ended February 29.
B Calculated based on average shares outstanding during the period.
C Net investment income (loss) is affected by the timing of the declaration of dividends by any underlying mutual funds or exchange-traded funds (ETFs). Net investment income (loss) of any mutual funds or ETFs is not included in the Fund's net investment income (loss) ratio.
D Net investment income per share reflects one or more large, non-recurring dividend(s) which amounted to $.69 per share. Excluding such non-recurring dividend(s), the ratio of net investment income (loss) to average net assets would have been 2.06%.
E Total distributions per share do not sum due to rounding.
F Total returns would have been lower if certain expenses had not been reduced during the applicable periods shown.
G Fees and expenses of any underlying mutual funds or exchange-traded funds (ETFs) are not included in the Fund's expense ratio. The Fund indirectly bears its proportionate share of these expenses. For additional expense information related to investments in Fidelity Central Funds, please refer to the "Investments in Fidelity Central Funds" note found in the Notes to Financial Statements section of the most recent Annual or Semi-Annual report.
H Expense ratios reflect operating expenses of the class. Expenses before reductions do not reflect amounts reimbursed, waived, or reduced through arrangements with the investment adviser, brokerage services, or other offset arrangements, if applicable, and do not represent the amount paid by the class during periods when reimbursements, waivers or reductions occur.
I Amount does not include the portfolio activity of any underlying mutual funds or exchange-traded funds (ETFs).
J Portfolio turnover rate excludes securities received or delivered in-kind.
| Fidelity Advisor® Consumer Staples Fund Class Z |
| |
| Years ended February 28, | | 2023 | | 2022 | | 2021 | | 2020 A | | 2019 B |
Selected Per-Share Data | | | | | | | | | | |
| Net asset value, beginning of period | $ | 96.36 | $ | 90.08 | $ | 80.14 | $ | 77.36 | $ | 81.61 |
| Income from Investment Operations | | | | | | | | | | |
Net investment income (loss) C,D | | 1.76 | | 1.79 | | 1.71 | | 1.78 | | .05 E |
| Net realized and unrealized gain (loss) | | (2.82) | | 15.10 | | 11.35 | | 3.56 | | .33 |
| Total from investment operations | | (1.06) | | 16.89 | | 13.06 | | 5.34 | | .38 |
| Distributions from net investment income | | (1.73) | | (1.93) | | (1.79) | | (1.66) | | (2.23) |
| Distributions from net realized gain | | (1.53) | | (8.68) | | (1.33) | | (.90) | | (2.40) |
| Total distributions | | (3.25) F | | (10.61) | | (3.12) | | (2.56) | | (4.63) |
| Net asset value, end of period | $ | 92.05 | $ | 96.36 | $ | 90.08 | $ | 80.14 | $ | 77.36 |
Total Return G,H | | (1.09)% | | 19.29% | | 16.49% | | 6.61% | | .79% |
Ratios to Average Net Assets D,I,J | | | | | | | | | | |
| Expenses before reductions | | .61% | | .61% | | .62% | | .63% | | .63% K |
| Expenses net of fee waivers, if any | | .61% | | .61% | | .62% | | .63% | | .62% K |
| Expenses net of all reductions | | .61% | | .61% | | .62% | | .62% | | .61% K |
| Net investment income (loss) | | 1.91% | | 1.85% | | 1.99% | | 2.08% | | .16% E,K |
| Supplemental Data | | | | | | | | | | |
| Net assets, end of period (000 omitted) | $ | 88,741 | $ | 77,826 | $ | 43,591 | $ | 41,629 | $ | 8,052 |
Portfolio turnover rate L | | 46% | | 61% | | 51% | | 40% | | 41% M |
A For the year ended February 29.
B For the period October 2, 2018 (commencement of sale of shares) through February 28, 2019.
C Calculated based on average shares outstanding during the period.
D Net investment income (loss) is affected by the timing of the declaration of dividends by any underlying mutual funds or exchange-traded funds (ETFs). Net investment income (loss) of any mutual funds or ETFs is not included in the Fund's net investment income (loss) ratio.
E Net investment income per share reflects one or more large, non-recurring dividend(s) which amounted to $.26 per share. Excluding such non-recurring dividend(s), the ratio of net investment income (loss) to average net assets would have been (.69)%.
F Total distributions per share do not sum due to rounding.
G Total returns for periods of less than one year are not annualized.
H Total returns would have been lower if certain expenses had not been reduced during the applicable periods shown.
I Fees and expenses of any underlying mutual funds or exchange-traded funds (ETFs) are not included in the Fund's expense ratio. The Fund indirectly bears its proportionate share of these expenses. For additional expense information related to investments in Fidelity Central Funds, please refer to the "Investments in Fidelity Central Funds" note found in the Notes to Financial Statements section of the most recent Annual or Semi-Annual report.
J Expense ratios reflect operating expenses of the class. Expenses before reductions do not reflect amounts reimbursed, waived, or reduced through arrangements with the investment adviser, brokerage services, or other offset arrangements, if applicable, and do not represent the amount paid by the class during periods when reimbursements, waivers or reductions occur.
K Annualized.
L Amount does not include the portfolio activity of any underlying mutual funds or exchange-traded funds (ETFs).
M Portfolio turnover rate excludes securities received or delivered in-kind.
For the period ended February 28, 2023
1 . Organization.
Consumer Staples Portfolio (the Fund) is a non-diversified fund of Fidelity Select Portfolios (the Trust) and is authorized to issue an unlimited number of shares. The Trust is registered under the Investment Company Act of 1940, as amended (the 1940 Act), as an open-end management investment company organized as a Massachusetts business trust. The Fund invests primarily in securities of companies whose principal business activities fall within specific industries. The Fund offers Fidelity Advisor Consumer Staples Fund Class A (Class A), Fidelity Advisor Consumer Staples Fund Class M (Class M), Fidelity Advisor Consumer Staples Fund Class C (Class C), Consumer Staples Portfolio (Consumer Staples), Fidelity Advisor Consumer Staples Class I (Class I) and Fidelity Advisor Consumer Staples Fund Class Z (Class Z) shares, each of which has equal rights as to assets and voting privileges. Each class has exclusive voting rights with respect to matters that affect that class. Class C shares will automatically convert to Class A shares after a holding period of eight years from the initial date of purchase, with certain exceptions.
2. Investments in Fidelity Central Funds.
Funds may invest in Fidelity Central Funds, which are open-end investment companies generally available only to other investment companies and accounts managed by the investment adviser and its affiliates. The Schedule of Investments lists any Fidelity Central Funds held as an investment as of period end, but does not include the underlying holdings of each Fidelity Central Fund. An investing fund indirectly bears its proportionate share of the expenses of the underlying Fidelity Central Funds.
Based on its investment objective, each Fidelity Central Fund may invest or participate in various investment vehicles or strategies that are similar to those of the investing fund. These strategies are consistent with the investment objectives of the investing fund and may involve certain economic risks which may cause a decline in value of each of the Fidelity Central Funds and thus a decline in the value of the investing fund.
| Fidelity Central Fund | Investment Manager | Investment Objective | Investment Practices | Expense Ratio A |
| Fidelity Money Market Central Funds | Fidelity Management & Research Company LLC (FMR) | Each fund seeks to obtain a high level of current income consistent with the preservation of capital and liquidity. | Short-term Investments | Less than .005% |
A Expenses expressed as a percentage of average net assets and are as of each underlying Central Fund's most recent annual or semi-annual shareholder report.
A complete unaudited list of holdings for each Fidelity Central Fund is available upon request or at the Securities and Exchange Commission website at www.sec.gov. In addition, the financial statements of the Fidelity Central Funds which contain the significant accounting policies (including investment valuation policies) of those funds, and are not covered by the Report of Independent Registered Public Accounting Firm, are available on the Securities and Exchange Commission website or upon request.
3. Significant Accounting Policies.
The Fund is an investment company and applies the accounting and reporting guidance of the Financial Accounting Standards Board (FASB) Accounting Standards Codification Topic 946 Financial Services - Investment Companies . The financial statements have been prepared in conformity with accounting principles generally accepted in the United States of America (GAAP), which require management to make certain estimates and assumptions at the date of the financial statements. Actual results could differ from those estimates. Subsequent events, if any, through the date that the financial statements were issued have been evaluated in the preparation of the financial statements. The Fund's Schedule of Investments lists any underlying mutual funds or exchange-traded funds (ETFs) but does not include the underlying holdings of these funds. The following summarizes the significant accounting policies of the Fund:
Investment Valuation. Investments are valued as of 4:00 p.m. Eastern time on the last calendar day of the period. The Board of Trustees (the Board) has designated the Fund's investment adviser as the valuation designee responsible for the fair valuation function and performing fair value determinations as needed. The investment adviser has established a Fair Value Committee (the Committee) to carry out the day-to-day fair valuation responsibilities and has adopted policies and procedures to govern the fair valuation process and the activities of the Committee. In accordance with these fair valuation policies and procedures, which have been approved by the Board, the Fund attempts to obtain prices from one or more third party pricing services or brokers to value its investments. When current market prices, quotations or currency exchange rates are not readily available or reliable, investments will be fair valued in good faith by the Committee, in accordance with the policies and procedures. Factors used in determining fair value vary by investment type and may include market or investment specific events, transaction data, estimated cash flows, and market observations of comparable investments. The frequency that the fair valuation procedures are used cannot be predicted and they may be utilized to a significant extent. The Committee manages the Fund's fair valuation practices and maintains the fair valuation policies and procedures. The Fund's investment adviser reports to the Board information regarding the fair valuation process and related material matters.
The Fund categorizes the inputs to valuation techniques used to value its investments into a disclosure hierarchy consisting of three levels as shown below:
Level 1 - unadjusted quoted prices in active markets for identical investments
Level 2 - other significant observable inputs (including quoted prices for similar investments, interest rates, prepayment speeds, etc.)
Level 3 - unobservable inputs (including the Fund's own assumptions based on the best information available)
Valuation techniques used to value the Fund's investments by major category are as follows:
Equity securities, including restricted securities, for which market quotations are readily available, are valued at the last reported sale price or official closing price as reported by a third party pricing service on the primary market or exchange on which they are traded and are categorized as Level 1 in the hierarchy. In the event there were no sales during the day or closing prices are not available, securities are valued at the last quoted bid price or may be valued using the last available price and are generally categorized as Level 2 in the hierarchy. For foreign equity securities, when market or security specific events arise, comparisons to the valuation of American Depositary Receipts (ADRs), futures contracts, ETFs and certain indexes as well as quoted prices for similar securities may be used and would be categorized as Level 2 in the hierarchy. For equity securities, including restricted securities, where observable inputs are limited, assumptions about market activity and risk are used and these securities may be categorized as Level 3 in the hierarchy.
Investments in open-end mutual funds, including the Fidelity Central Funds, are valued at their closing net asset value (NAV) each business day and are categorized as Level 1 in the hierarchy.
Changes in valuation techniques may result in transfers in or out of an assigned level within the disclosure hierarchy. The aggregate value of investments by input level as of February 28, 2023 is included at the end of the Fund's Schedule of Investments.
Foreign Currency. Certain Funds may use foreign currency contracts to facilitate transactions in foreign-denominated securities. Gains and losses from these transactions may arise from changes in the value of the foreign currency or if the counterparties do not perform under the contracts' terms.
Foreign-denominated assets, including investment securities, and liabilities are translated into U.S. dollars at the exchange rates at period end. Purchases and sales of investment securities, income and dividends received, and expenses denominated in foreign currencies are translated into U.S. dollars at the exchange rate in effect on the transaction date.
The effects of exchange rate fluctuations on investments are included with the net realized and unrealized gain (loss) on investment securities. Other foreign currency transactions resulting in realized and unrealized gain (loss) are disclosed separately.
Investment Transactions and Income. For financial reporting purposes, the Fund's investment holdings and NAV include trades executed through the end of the last business day of the period. The NAV per share for processing shareholder transactions is calculated as of the close of business of the New York Stock Exchange (NYSE), normally 4:00 p.m. Eastern time and includes trades executed through the end of the prior business day. Gains and losses on securities sold are determined on the basis of identified cost and include proceeds received from litigation. Commissions paid to certain brokers with whom the investment adviser, or its affiliates, places trades on behalf of a fund include an amount in addition to trade execution, which may be rebated back to a fund. Any such rebates are included in net realized gain (loss) on investments in the Statement of Operations. Dividend income is recorded on the ex-dividend date, except for certain dividends from foreign securities where the ex-dividend date may have passed, which are recorded as soon as the Fund is informed of the ex-dividend date. Non-cash dividends included in dividend income, if any, are recorded at the fair market value of the securities received. Income and capital gain distributions from Fidelity Central Funds, if any, are recorded on the ex-dividend date. Certain distributions received by the Fund represent a return of capital or capital gain. The Fund determines the components of these distributions subsequent to the ex-dividend date, based upon receipt of tax filings or other correspondence relating to the underlying investment. These distributions are recorded as a reduction of cost of investments and/or as a realized gain. Investment income is recorded net of foreign taxes withheld where recovery of such taxes is uncertain. Funds may file withholding tax reclaims in certain jurisdictions to recover a portion of amounts previously withheld. Any withholding tax reclaims income is included in the Statement of Operations in dividends. Any receivables for withholding tax reclaims are included in the Statement of Assets and Liabilities in dividends receivable.
Class Allocations and Expenses. Investment income, realized and unrealized capital gains and losses, common expenses of a fund, and certain fund-level expense reductions, if any, are allocated daily on a pro-rata basis to each class based on the relative net assets of each class to the total net assets of a fund. Each class differs with respect to transfer agent and distribution and service plan fees incurred, as applicable. Certain expense reductions may also differ by class, if applicable. For the reporting period, the allocated portion of income and expenses to each class as a percent of its average net assets may vary due to the timing of recording these transactions in relation to fluctuating net assets of the classes. Expenses directly attributable to a fund are charged to that fund. Expenses attributable to more than one fund are allocated among the respective funds on the basis of relative net assets or other appropriate methods. Expenses included in the accompanying financial statements reflect the expenses of that fund and do not include any expenses associated with any underlying mutual funds or exchange-traded funds. Although not included in a fund's expenses, a fund indirectly bears its proportionate share of these expenses through the net asset value of each underlying mutual fund or exchange-traded fund. Expense estimates are accrued in the period to which they relate and adjustments are made when actual amounts are known.
Deferred Trustee Compensation. Under a Deferred Compensation Plan (the Plan) for certain Funds, certain independent Trustees have elected to defer receipt of a portion of their annual compensation. Deferred amounts are invested in affiliated mutual funds, are marked-to-market and remain in a fund until distributed in accordance with the Plan. The investment of deferred amounts and the offsetting payable to the Trustees presented below are included in the accompanying Statement of Assets and Liabilities in other receivables and other payables and accrued expenses, as applicable.
| Consumer Staples Portfolio | $270,166 |
Income Tax Information and Distributions to Shareholders. Each year, the Fund intends to qualify as a regulated investment company under Subchapter M of the Internal Revenue Code, including distributing substantially all of its taxable income and realized gains. As a result, no provision for U.S. Federal income taxes is required. As of February 28, 2023, the Fund did not have any unrecognized tax benefits in the financial statements; nor is the Fund aware of any tax positions for which it is reasonably possible that the total amounts of unrecognized tax benefits will significantly change in the next twelve months. The Fund files a U.S. federal tax return, in addition to state and local tax returns as required. The Fund's federal income tax returns are subject to examination by the Internal Revenue Service (IRS) for a period of three fiscal years after they are filed. State and local tax returns may be subject to examination for an additional fiscal year depending on the jurisdiction. Foreign taxes are provided for based on the Fund's understanding of the tax rules and rates that exist in the foreign markets in which it invests.
Distributions are declared and recorded on the ex-dividend date. Income and capital gain distributions are declared separately for each class. Income and capital gain distributions are determined in accordance with income tax regulations, which may differ from GAAP. In addition, the Fund claimed a portion of the payment made to redeeming shareholders as a distribution for income tax purposes.
Capital accounts within the financial statements are adjusted for permanent book-tax differences. These adjustments have no impact on net assets or the results of operations. Capital accounts are not adjusted for temporary book-tax differences which will reverse in a subsequent period.
Book-tax differences are primarily due to foreign currency transactions, partnerships, deferred Trustee compensation and losses deferred due to wash sales.
As of period end, the cost and unrealized appreciation (depreciation) in securities, and derivatives if applicable, for federal income tax purposes were as follows:
| Gross unrealized appreciation | $369,649,219 |
| Gross unrealized depreciation | (62,864,136) |
| Net unrealized appreciation (depreciation) | $306,785,083 |
| Tax Cost | $1,279,629,944 |
The tax-based components of distributable earnings as of period end were as follows:
| Undistributed ordinary income | $1,233,664 |
| Undistributed long-term capital gain | $200,332 |
| Net unrealized appreciation (depreciation) on securities and other investments | $306,777,388 |
The tax character of distributions paid was as follows:
| | February 28, 2023 | February 28, 2022 |
| Ordinary Income | $28,235,236 | $63,314,112 |
| Long-term Capital Gains | 24,690,278 | 90,100,720 |
| Total | $52,925,514 | $153,414,832 |
Restricted Securities (including Private Placements). Funds may invest in securities that are subject to legal or contractual restrictions on resale. These securities generally may be resold in transactions exempt from registration or to the public if the securities are registered. Disposal of these securities may involve time-consuming negotiations and expense, and prompt sale at an acceptable price may be difficult. Information regarding restricted securities held at period end is included at the end of the Schedule of Investments, if applicable.
4. Purchases and Sales of Investments.
Purchases and sales of securities, other than short-term securities and in-kind transactions, as applicable, are noted in the table below.
| | Purchases ($) | Sales ($) |
| Consumer Staples Portfolio | 729,718,522 | 807,132,287 |
5. Fees and Other Transactions with Affiliates.
Management Fee. Fidelity Management & Research Company LLC (the investment adviser) and its affiliates provide the Fund with investment management related services for which the Fund pays a monthly management fee. The management fee is the sum of an individual fund fee rate that is based on an annual rate of .30% of the Fund's average net assets and an annualized group fee rate that averaged .23% during the period. The group fee rate is based upon the monthly average net assets of a group of registered investment companies with which the investment adviser has management contracts. The group fee rate decreases as assets under management increase and increases as assets under management decrease. For the reporting period, the total annual management fee rate was .53% of the Fund's average net assets.
Distribution and Service Plan Fees. In accordance with Rule 12b-1 of the 1940 Act, the Fund has adopted separate Distribution and Service Plans for each class of shares. Certain classes pay Fidelity Distributors Company LLC (FDC), an affiliate of the investment adviser, separate Distribution and Service Fees, each of which is based on an annual percentage of each class' average net assets. In addition, FDC may pay financial intermediaries for selling shares of the Fund and providing shareholder support services. For the period, the Distribution and Service Fee rates, total fees and amounts retained by FDC were as follows:
| | Distribution Fee | Service Fee | Total Fees | Retained by FDC |
| Class A | - % | .25% | $732,627 | $10,901 |
| Class M | .25% | .25% | 316,344 | 794 |
| Class C | .75% | .25% | 823,333 | 64,385 |
| | | | $1,872,304 | $76,080 |
Sales Load. FDC may receive a front-end sales charge of up to 5.75% for selling Class A shares and 3.50% for selling Class M shares, some of which is paid to financial intermediaries for selling shares of the Fund. Depending on the holding period, FDC may receive contingent deferred sales charges levied on Class A, Class M and Class C redemptions. The deferred sales charges are 1.00% for Class C shares, 1.00% for certain purchases of Class A shares and .25% for certain purchases of Class M shares.
For the period, sales charge amounts retained by FDC were as follows:
| | Retained by FDC |
| Class A | $89,410 |
| Class M | 10,980 |
Class C A | 764 |
| | $101,154 |
A When Class C shares are initially sold, FDC pays commissions from its own resources to financial intermediaries through which the sales are made.
Transfer Agent Fees. Fidelity Investments Institutional Operations Company LLC (FIIOC), an affiliate of the investment adviser, is the transfer, dividend disbursing and shareholder servicing agent for each class of the Fund. FIIOC receives account fees and asset-based fees that vary according to the account size and type of account of the shareholders of the respective classes of the Fund, except for Class Z. FIIOC receives an asset-based fee of Class Z's average net assets. FIIOC pays for typesetting, printing and mailing of shareholder reports, except proxy statements.
For the period, transfer agent fees for each class were as follows:
| | Amount | % of Class-Level Average Net Assets |
| Class A | $562,332 | .19 |
| Class M | 129,078 | .20 |
| Class C | 160,479 | .19 |
| Consumer Staples | 1,475,084 | .16 |
| Class I | 269,609 | .17 |
| Class Z | 34,710 | .04 |
| | $2,631,292 | |
Accounting Fees. Fidelity Service Company, Inc. (FSC), an affiliate of the investment adviser, maintains the Fund's accounting records. The accounting fee is based on the level of average net assets for each month. For the period, the fees were equivalent to the following annual rates:
| | % of Average Net Assets |
| Consumer Staples Portfolio | .03 |
Brokerage Commissions. A portion of portfolio transactions were placed with brokerage firms which are affiliates of the investment adviser. Brokerage commissions are included in net realized gain (loss) and change in net unrealized appreciation (depreciation) in the Statement of Operations. The commissions paid to these affiliated firms were as follows:
| | Amount |
| Consumer Staples Portfolio | $23,098 |
Interfund Lending Program. Pursuant to an Exemptive Order issued by the Securities and Exchange Commission (the SEC), the Fund, along with other registered investment companies having management contracts with Fidelity Management & Research Company LLC (FMR), or other affiliated entities of FMR, may participate in an interfund lending program. This program provides an alternative credit facility allowing the Fund to borrow from, or lend money to, other participating affiliated funds. At period end, there were no interfund loans outstanding. Activity in this program during the period for which loans were outstanding was as follows:
| | Borrower or Lender | Average Loan Balance | Weighted Average Interest Rate | Interest Expense |
| Consumer Staples Portfolio | Borrower | $ 5,741,097 | 2.50% | $12,374 |
Interfund Trades. Funds may purchase from or sell securities to other Fidelity Funds under procedures adopted by the Board. The procedures have been designed to ensure these interfund trades are executed in accordance with Rule 17a-7 of the 1940 Act. Any interfund trades are included within the respective purchases and sales amounts shown in the Purchases and Sales of Investments note. Interfund trades during the period are noted in the table below.
| Purchases ($) | Sales ($) | Realized Gain (Loss) ($) |
| Consumer Staples Portfolio | 72,178,515 | 73,723,353 | (1,490,894) |
6. Committed Line of Credit.
Certain Funds participate with other funds managed by the investment adviser or an affiliate in a $4.25 billion credit facility (the "line of credit") to be utilized for temporary or emergency purposes to fund shareholder redemptions or for other short-term liquidity purposes. The participating funds have agreed to pay commitment fees on their pro-rata portion of the line of credit, which are reflected in Miscellaneous expenses on the Statement of Operations, and are listed below. During the period, there were no borrowings on this line of credit.
| | Amount |
| Consumer Staples Portfolio | $2,851 |
7. Security Lending.
Funds lend portfolio securities from time to time in order to earn additional income. Lending agents are used, including National Financial Services (NFS), an affiliate of the investment adviser. Pursuant to a securities lending agreement, NFS will receive a fee, which is capped at 9.9% of a fund's daily lending revenue, for its services as lending agent. A fund may lend securities to certain qualified borrowers, including NFS. On the settlement date of the loan, a fund receives collateral (in the form of U.S. Treasury obligations, letters of credit and/or cash) against the loaned securities and maintains collateral in an amount not less than 100% of the market value of the loaned securities during the period of the loan. The market value of the loaned securities is determined at the close of business of a fund and any additional required collateral is delivered to a fund on the next business day. A fund or borrower may terminate the loan at any time, and if the borrower defaults on its obligation to return the securities loaned because of insolvency or other reasons, a fund may apply collateral received from the borrower against the obligation. A fund may experience delays and costs in recovering the securities loaned. Any cash collateral received is invested in the Fidelity Securities Lending Cash Central Fund. Any loaned securities are identified as such in the Schedule of Investments, and the value of loaned securities and cash collateral at period end, as applicable, are presented in the Statement of Assets and Liabilities. Security lending income represents the income earned on investing cash collateral, less rebates paid to borrowers and any lending agent fees associated with the loan, plus any premium payments received for lending certain types of securities. Security lending income is presented in the Statement of Operations as a component of income from Fidelity Central Funds. Affiliated security lending activity, if any, was as follows:
| | Total Security Lending Fees Paid to NFS | Security Lending Income From Securities Loaned to NFS | Value of Securities Loaned to NFS at Period End |
| Consumer Staples Portfolio | $4,015 | $- | $- |
8. Bank Borrowings.
The Fund is permitted to have bank borrowings for temporary or emergency purposes to fund shareholder redemptions or for other short-term liquidity requirements. The Fund has established borrowing arrangements with certain banks. The interest rate on the borrowings is the bank's base rate, as revised from time to time. Any open loans, including accrued interest, at period end are presented under the caption "Notes payable" in the Statement of Assets and Liabilities, if applicable. Activity in this program during the period for which loans were outstanding was as follows:
| | Average Loan Balance | Weighted Average Interest Rate | Interest Expense |
| Consumer Staples Portfolio | $753,867 | 3.92% | $1,230 |
9. Expense Reductions.
During the period the investment adviser or an affiliate reimbursed and/or waived a portion of fund-level operating expenses in the amount of $55,573.
10. Distributions to Shareholders.
Distributions to shareholders of each class were as follows:
| | Year ended February 28, 2023 | Year ended February 28, 2022 |
| Consumer Staples Portfolio | | |
| Distributions to shareholders | | |
| Class A | $ 9,061,460 | $28,728,133 |
| Class M | 1,830,918 | 6,378,016 |
| Class C | 2,098,957 | 9,724,881 |
| Consumer Staples | 32,004,733 | 88,326,666 |
| Class I | 5,160,204 | 14,778,169 |
| Class Z | 2,769,242 | 5,478,967 |
Total | $52,925,514 | $153,414,832 |
11. Share Transactions.
Share transactions for each class were as follows and may contain in-kind transactions, automatic conversions between classes or exchanges between affiliated funds:
| | Shares | Shares | Dollars | Dollars |
| | Year ended February 28, 2023 | Year ended February 28, 2022 | Year ended February 28, 2023 | Year ended February 28, 2022 |
| Consumer Staples Portfolio | | | | |
| Class A | | | | |
| Shares sold | 565,130 | 512,430 | $51,861,919 | $49,258,142 |
| Reinvestment of distributions | 95,040 | 295,095 | 8,776,247 | 27,710,518 |
| Shares redeemed | (465,315) | (514,641) | (42,475,640) | (49,392,846) |
| Net increase (decrease) | 194,855 | 292,884 | $18,162,526 | $27,575,814 |
| Class M | | | | |
| Shares sold | 86,908 | 69,762 | $7,782,299 | $6,632,101 |
| Reinvestment of distributions | 19,900 | 68,289 | 1,820,900 | 6,339,502 |
| Shares redeemed | (94,625) | (93,262) | (8,558,414) | (8,856,119) |
| Net increase (decrease) | 12,183 | 44,789 | $1,044,785 | $4,115,484 |
| Class C | | | | |
| Shares sold | 167,163 | 80,488 | $14,879,754 | $7,503,197 |
| Reinvestment of distributions | 22,978 | 105,499 | 2,076,666 | 9,608,492 |
| Shares redeemed | (258,894) | (437,630) | (22,861,871) | (40,618,649) |
| Net increase (decrease) | (68,753) | (251,643) | $(5,905,451) | $(23,506,960) |
| Consumer Staples | | | | |
| Shares sold | 2,183,669 | 3,003,388 | $203,864,179 | $293,188,867 |
| Reinvestment of distributions | 316,888 | 851,019 | 29,626,850 | 80,858,070 |
| Shares redeemed | (3,842,578) | (1,702,337) | (351,826,884) | (165,649,882) |
| Net increase (decrease) | (1,342,021) | 2,152,070 | $(118,335,855) | $208,397,055 |
| Class I | | | | |
| Shares sold | 795,767 | 366,907 | $73,693,384 | $35,605,195 |
| Reinvestment of distributions | 52,268 | 144,626 | 4,854,356 | 13,704,710 |
| Shares redeemed | (679,428) | (439,361) | (62,277,443) | (42,622,622) |
| Net increase (decrease) | 168,607 | 72,172 | $16,270,297 | $6,687,283 |
| Class Z | | | | |
| Shares sold | 568,677 | 567,361 | $52,889,407 | $55,256,648 |
| Reinvestment of distributions | 27,861 | 53,280 | 2,580,426 | 5,041,341 |
| Shares redeemed | (440,111) | (296,902) | (40,346,802) | (28,764,496) |
| Net increase (decrease) | 156,427 | 323,739 | $15,123,031 | $31,533,493 |
12. Other.
A fund's organizational documents provide former and current trustees and officers with a limited indemnification against liabilities arising in connection with the performance of their duties to the fund. In the normal course of business, a fund may also enter into contracts that provide general indemnifications. A fund's maximum exposure under these arrangements is unknown as this would be dependent on future claims that may be made against a fund. The risk of material loss from such claims is considered remote.
13. Risk and Uncertainties.
Many factors affect a fund's performance. Developments that disrupt global economies and financial markets, such as pandemics, epidemics, outbreaks of infectious diseases, war, terrorism, and environmental disasters, may significantly affect a fund's investment performance. The effects of these developments to a fund will be impacted by the types of securities in which a fund invests, the financial condition, industry, economic sector, and geographic location of an issuer, and a fund's level of investment in the securities of that issuer. Significant concentrations in security types, issuers, industries, sectors, and geographic locations may magnify the factors that affect a fund's performance.
To the Board of Trustees of Fidelity Select Portfolios and Shareholders of Consumer Staples Portfolio
Opinion on the Financial Statements
We have audited the accompanying statement of assets and liabilities, including the schedule of investments, of Consumer Staples Portfolio (one of the funds constituting Fidelity Select Portfolios, referred to hereafter as the "Fund") as of February 28, 2023, the related statement of operations for the year ended February 28, 2023, the statement of changes in net assets for each of the two years in the period ended February 28, 2023, including the related notes, and the financial highlights for each of the periods indicated therein (collectively referred to as the "financial statements"). In our opinion, the financial statements present fairly, in all material respects, the financial position of the Fund as of February 28, 2023, the results of its operations for the year then ended, the changes in its net assets for each of the two years in the period ended February 28, 2023 and the financial highlights for each of the periods indicated therein in conformity with accounting principles generally accepted in the United States of America.
Basis for Opinion
These financial statements are the responsibility of the Fund's management. Our responsibility is to express an opinion on the Fund's financial statements based on our audits. We are a public accounting firm registered with the Public Company Accounting Oversight Board (United States) (PCAOB) and are required to be independent with respect to the Fund in accordance with the U.S. federal securities laws and the applicable rules and regulations of the Securities and Exchange Commission and the PCAOB.
We conducted our audits of these financial statements in accordance with the standards of the PCAOB. Those standards require that we plan and perform the audit to obtain reasonable assurance about whether the financial statements are free of material misstatement, whether due to error or fraud.
Our audits included performing procedures to assess the risks of material misstatement of the financial statements, whether due to error or fraud, and performing procedures that respond to those risks. Such procedures included examining, on a test basis, evidence regarding the amounts and disclosures in the financial statements. Our audits also included evaluating the accounting principles used and significant estimates made by management, as well as evaluating the overall presentation of the financial statements. Our procedures included confirmation of securities owned as of February 28, 2023 by correspondence with the custodian and brokers; when replies were not received from brokers, we performed other auditing procedures. We believe that our audits provide a reasonable basis for our opinion.
/s/ PricewaterhouseCoopers LLP
Boston, Massachusetts
April 13, 2023
We have served as the auditor of one or more investment companies in the Fidelity group of funds since 1932.
The Trustees, Members of the Advisory Board (if any), and officers of the trust and fund, as applicable, are listed below. The Board of Trustees governs the fund and is responsible for protecting the interests of shareholders. The Trustees are experienced executives who meet periodically throughout the year to oversee the fund's activities, review contractual arrangements with companies that provide services to the fund, oversee management of the risks associated with such activities and contractual arrangements, and review the fund's performance. Each of the Trustees oversees 318 funds.
The Trustees hold office without limit in time except that (a) any Trustee may resign; (b) any Trustee may be removed by written instrument, signed by at least two-thirds of the number of Trustees prior to such removal; (c) any Trustee who requests to be retired or who has become incapacitated by illness or injury may be retired by written instrument signed by a majority of the other Trustees; and (d) any Trustee may be removed at any special meeting of shareholders by a two-thirds vote of the outstanding voting securities of the trust. Each Trustee who is not an interested person (as defined in the 1940 Act) of the trust and the fund is referred to herein as an Independent Trustee. Each Independent Trustee shall retire not later than the last day of the calendar year in which his or her 75th birthday occurs. The Independent Trustees may waive this mandatory retirement age policy with respect to individual Trustees. Officers and Advisory Board Members hold office without limit in time, except that any officer or Advisory Board Member may resign or may be removed by a vote of a majority of the Trustees at any regular meeting or any special meeting of the Trustees. Except as indicated, each individual has held the office shown or other offices in the same company for the past five years.
The fund's Statement of Additional Information (SAI) includes more information about the Trustees. To request a free copy, call Fidelity at 1-800-544-8544 if you're an individual investing directly with Fidelity, call 1-800-835-5092 if you're a plan sponsor or participant with Fidelity as your recordkeeper or call 1-877-208-0098 on institutional accounts or if you're an advisor or invest through one.
Experience, Skills, Attributes, and Qualifications of the Trustees. The Governance and Nominating Committee has adopted a statement of policy that describes the experience, qualifications, attributes, and skills that are necessary and desirable for potential Independent Trustee candidates (Statement of Policy). The Board believes that each Trustee satisfied at the time he or she was initially elected or appointed a Trustee, and continues to satisfy, the standards contemplated by the Statement of Policy. The Governance and Nominating Committee also engages professional search firms to help identify potential Independent Trustee candidates who have the experience, qualifications, attributes, and skills consistent with the Statement of Policy. From time to time, additional criteria based on the composition and skills of the current Independent Trustees, as well as experience or skills that may be appropriate in light of future changes to board composition, business conditions, and regulatory or other developments, have also been considered by the professional search firms and the Governance and Nominating Committee. In addition, the Board takes into account the Trustees' commitment and participation in Board and committee meetings, as well as their leadership of standing and ad hoc committees throughout their tenure.
In determining that a particular Trustee was and continues to be qualified to serve as a Trustee, the Board has considered a variety of criteria, none of which, in isolation, was controlling. The Board believes that, collectively, the Trustees have balanced and diverse experience, qualifications, attributes, and skills, which allow the Board to operate effectively in governing the fund and protecting the interests of shareholders. Information about the specific experience, skills, attributes, and qualifications of each Trustee, which in each case led to the Board's conclusion that the Trustee should serve (or continue to serve) as a trustee of the fund, is provided below.
Board Structure and Oversight Function. Robert A. Lawrence is an interested person and currently serves as Chair. The Trustees have determined that an interested Chair is appropriate and benefits shareholders because an interested Chair has a personal and professional stake in the quality and continuity of services provided to the fund. Independent Trustees exercise their informed business judgment to appoint an individual of their choosing to serve as Chair, regardless of whether the Trustee happens to be independent or a member of management. The Independent Trustees have determined that they can act independently and effectively without having an Independent Trustee serve as Chair and that a key structural component for assuring that they are in a position to do so is for the Independent Trustees to constitute a substantial majority for the Board. The Independent Trustees also regularly meet in executive session. David M. Thomas serves as Lead Independent Trustee and as such (i) acts as a liaison between the Independent Trustees and management with respect to matters important to the Independent Trustees and (ii) with management prepares agendas for Board meetings.
Fidelity ® funds are overseen by different Boards of Trustees. The fund's Board oversees Fidelity's high income and certain equity funds, and other Boards oversee Fidelity's alternative investment, investment-grade bond, money market, asset allocation, and other equity funds. The asset allocation funds may invest in Fidelity ® funds overseen by the fund's Board. The use of separate Boards, each with its own committee structure, allows the Trustees of each group of Fidelity ® funds to focus on the unique issues of the funds they oversee, including common research, investment, and operational issues. On occasion, the separate Boards establish joint committees to address issues of overlapping consequences for the Fidelity ® funds overseen by each Board.
The Trustees operate using a system of committees to facilitate the timely and efficient consideration of all matters of importance to the Trustees, the fund, and fund shareholders and to facilitate compliance with legal and regulatory requirements and oversight of the fund's activities and associated risks. The Board, acting through its committees, has charged FMR and its affiliates with (i) identifying events or circumstances the occurrence of which could have demonstrably adverse effects on the fund's business and/or reputation; (ii) implementing processes and controls to lessen the possibility that such events or circumstances occur or to mitigate the effects of such events or circumstances if they do occur; and (iii) creating and maintaining a system designed to evaluate continuously business and market conditions in order to facilitate the identification and implementation processes described in (i) and (ii) above. Because the day-to-day operations and activities of the fund are carried out by or through FMR, its affiliates, and other service providers, the fund's exposure to risks is mitigated but not eliminated by the processes overseen by the Trustees. While each of the Board's committees has responsibility for overseeing different aspects of the fund's activities, oversight is exercised primarily through the Operations, Audit, and Compliance Committees. Appropriate personnel, including but not limited to the fund's Chief Compliance Officer (CCO), FMR's internal auditor, the independent accountants, the fund's Treasurer and portfolio management personnel, make periodic reports to the Board's committees, as appropriate, including an annual review of Fidelity's risk management program for the Fidelity ® funds. The responsibilities of each standing committee, including their oversight responsibilities, are described further under "Standing Committees of the Trustees."
Interested Trustees*:
Correspondence intended for a Trustee who is an interested person may be sent to Fidelity Investments, 245 Summer Street, Boston, Massachusetts 02210.
Name, Year of Birth; Principal Occupations and Other Relevant Experience+
Bettina Doulton (1964)
Year of Election or Appointment: 2020
Trustee
Ms. Doulton also serves as Trustee of other Fidelity ® funds. Prior to her retirement, Ms. Doulton served in a variety of positions at Fidelity Investments, including as a managing director of research (2006-2007), portfolio manager to certain Fidelity ® funds (1993-2005), equity analyst and portfolio assistant (1990-1993), and research assistant (1987-1990). Ms. Doulton currently owns and operates Phi Builders + Architects and Cellardoor Winery. Previously, Ms. Doulton served as a member of the Board of Brown Capital Management, LLC (2014-2018).
Robert A. Lawrence (1952)
Year of Election or Appointment: 2020
Trustee
Chair of the Board of Trustees
Mr. Lawrence also serves as Trustee of other funds. Previously, Mr. Lawrence served as a Trustee and Member of the Advisory Board of certain funds. Prior to his retirement in 2008, Mr. Lawrence served as Vice President of certain Fidelity ® funds (2006-2008), Senior Vice President, Head of High Income Division of Fidelity Management & Research Company (investment adviser firm, 2006-2008), and President of Fidelity Strategic Investments (investment adviser firm, 2002-2005).
* Determined to be an "Interested Trustee" by virtue of, among other things, his or her affiliation with the trust or various entities under common control with FMR.
+ The information includes the Trustee's principal occupation during the last five years and other information relating to the experience, attributes, and skills relevant to the Trustee's qualifications to serve as a Trustee, which led to the conclusion that the Trustee should serve as a Trustee for the fund.
Independent Trustees:
Correspondence intended for an Independent Trustee may be sent to Fidelity Investments, P.O. Box 55235, Boston, Massachusetts 02205-5235.
Name, Year of Birth; Principal Occupations and Other Relevant Experience+
Thomas P. Bostick (1956)
Year of Election or Appointment: 2021
Trustee
Lieutenant General Bostick also serves as Trustee of other Fidelity ® funds. Prior to his retirement, General Bostick (United States Army, Retired) held a variety of positions within the U.S. Army, including Commanding General and Chief of Engineers, U.S. Army Corps of Engineers (2012-2016) and Deputy Chief of Staff and Director of Human Resources, U.S. Army (2009-2012). General Bostick currently serves as a member of the Board and Finance and Governance & Sustainability Committees of CSX Corporation (transportation, 2020-present) and a member of the Board and Corporate Governance and Nominating Committee of Perma-Fix Environmental Services, Inc. (nuclear waste management, 2020-present). General Bostick serves as Chief Executive Officer of Bostick Global Strategies, LLC (consulting, 2016-present), as a member of the Board of HireVue, Inc. (video interview and assessment, 2020-present), as a member of the Board of Allonnia (biotechnology and engineering solutions, 2022-present) and on the Advisory Board of Solugen, Inc. (specialty bio-based chemicals manufacturer, 2022-present). Previously, General Bostick served as a Member of the Advisory Board of certain Fidelity ® funds (2021), President, Intrexon Bioengineering (2018-2020) and Chief Operating Officer (2017-2020) and Senior Vice President of the Environment Sector (2016-2017) of Intrexon Corporation (biopharmaceutical company).
Dennis J. Dirks (1948)
Year of Election or Appointment: 2018
Trustee
Mr. Dirks also serves as Trustee of other Fidelity ® funds. Prior to his retirement in May 2003, Mr. Dirks served as Chief Operating Officer and as a member of the Board of The Depository Trust & Clearing Corporation (financial markets infrastructure), President, Chief Operating Officer and a member of the Board of The Depository Trust Company (DTC), President and a member of the Board of the National Securities Clearing Corporation (NSCC), Chief Executive Officer and a member of the Board of the Government Securities Clearing Corporation and Chief Executive Officer and a member of the Board of the Mortgage-Backed Securities Clearing Corporation. Mr. Dirks currently serves as a member of the Finance Committee (2016-present) and Board (2017-present) and is Treasurer (2018-present) of the Asolo Repertory Theatre.
Donald F. Donahue (1950)
Year of Election or Appointment: 2018
Trustee
Mr. Donahue also serves as Trustee of other Fidelity ® funds. Mr. Donahue serves as President and Chief Executive Officer of Miranda Partners, LLC (risk consulting for the financial services industry, 2012-present). Previously, Mr. Donahue served as Chief Executive Officer (2006-2012), Chief Operating Officer (2003-2006) and Managing Director, Customer Marketing and Development (1999-2003) of The Depository Trust & Clearing Corporation (financial markets infrastructure). Mr. Donahue currently serves as a member (2007-present) and Co-Chairman (2016-present) of the Board of United Way of New York. Mr. Donahue previously served as a member of the Advisory Board of certain Fidelity ® funds (2015-2018) and as a member of the Board of The Leadership Academy (previously NYC Leadership Academy) (2012-2022).
Vicki L. Fuller (1957)
Year of Election or Appointment: 2020
Trustee
Ms. Fuller also serves as Trustee of other Fidelity ® funds. Previously, Ms. Fuller served as a member of the Advisory Board of certain Fidelity ® funds (2018-2020), Chief Investment Officer of the New York State Common Retirement Fund (2012-2018) and held a variety of positions at AllianceBernstein L.P. (global asset management, 1985-2012), including Managing Director (2006-2012) and Senior Vice President and Senior Portfolio Manager (2001-2006). Ms. Fuller currently serves as a member of the Board, Audit Committee and Nominating and Governance Committee of two Blackstone business development companies (2020-present), as a member of the Board of Treliant, LLC (consulting, 2019-present), as a member of the Board of Ariel Alternatives, LLC (private equity, 2022-present) and as a member of the Board and Chair of the Audit Committee of Gusto, Inc. (software, 2021-present). In addition, Ms. Fuller currently serves as a member of the Board of Roosevelt University (2019-present) and as a member of the Executive Board of New York University's Stern School of Business. Ms. Fuller previously served as a member of the Board, Audit Committee and Nominating and Governance Committee of The Williams Companies, Inc. (natural gas infrastructure, 2018-2021).
Patricia L. Kampling (1959)
Year of Election or Appointment: 2020
Trustee
Ms. Kampling also serves as Trustee of other Fidelity ® funds. Prior to her retirement, Ms. Kampling served as Chairman of the Board and Chief Executive Officer (2012-2019), President and Chief Operating Officer (2011-2012) and Executive Vice President and Chief Financial Officer (2010-2011) of Alliant Energy Corporation. Ms. Kampling currently serves as a member of the Board, Finance Committee and Governance, Compensation and Nominating Committee of Xcel Energy Inc. (utilities company, 2020-present) and as a member of the Board, Audit, Finance and Risk Committee and Safety, Environmental, Technology and Operations Committee and Chair of the Executive Development and Compensation Committee of American Water Works Company, Inc. (utilities company, 2019-present). In addition, Ms. Kampling currently serves as a member of the Board of the Nature Conservancy, Wisconsin Chapter (2019-present). Previously, Ms. Kampling served as a Member of the Advisory Board of certain Fidelity® funds (2020), a member of the Board, Compensation Committee and Executive Committee and Chair of the Audit Committee of Briggs & Stratton Corporation (manufacturing, 2011-2021), a member of the Board of Interstate Power and Light Company (2012-2019) and Wisconsin Power and Light Company (2012-2019) (each a subsidiary of Alliant Energy Corporation) and as a member of the Board and Workforce Development Committee of the Business Roundtable (2018-2019).
Thomas A. Kennedy (1955)
Year of Election or Appointment: 2021
Trustee
Mr. Kennedy also serves as Trustee of other Fidelity ® funds. Previously, Mr. Kennedy served as a Member of the Advisory Board of certain Fidelity ® funds (2020) and held a variety of positions at Raytheon Company (aerospace and defense, 1983-2020), including Chairman and Chief Executive Officer (2014-2020) and Executive Vice President and Chief Operating Officer (2013-2014). Mr. Kennedy served as Executive Chairman of the Board of Directors of Raytheon Technologies Corporation (aerospace and defense, 2020-2021). Mr. Kennedy serves as a Director of the Board of Directors of Textron Inc. (aerospace and defense, 2023-present).
Oscar Munoz (1959)
Year of Election or Appointment: 2021
Trustee
Mr. Munoz also serves as Trustee of other Fidelity ® funds. Prior to his retirement, Mr. Munoz served as Executive Chairman (2020-2021), Chief Executive Officer (2015-2020), President (2015-2016) and a member of the Board (2010-2021) of United Airlines Holdings, Inc. Mr. Munoz currently serves as a member of the Board of CBRE Group, Inc. (commercial real estate, 2020-present), a member of the Board of Univision Communications, Inc. (Hispanic media, 2020-present), a member of the Board of Archer Aviation Inc. (2021-present), a member of the Defense Business Board of the United States Department of Defense (2021-present) and a member of the Board of Salesforce.com, Inc. (cloud-based software, 2022-present). Previously, Mr. Munoz served as a Member of the Advisory Board of certain Fidelity ® funds (2021).
David M. Thomas (1949)
Year of Election or Appointment: 2018
Trustee
Lead Independent Trustee
Mr. Thomas also serves as Trustee of other Fidelity ® funds. Previously, Mr. Thomas served as Executive Chairman (2005-2006) and Chairman and Chief Executive Officer (2000-2005) of IMS Health, Inc. (pharmaceutical and healthcare information solutions). Mr. Thomas currently serves as a member of the Board of Fortune Brands Home and Security (home and security products, 2004-present) and as Director (2013-present) and Non-Executive Chairman of the Board (2022-present) of Interpublic Group of Companies, Inc. (marketing communication).
Susan Tomasky (1953)
Year of Election or Appointment: 2020
Trustee
Ms. Tomasky also serves as Trustee of other Fidelity ® funds. Prior to her retirement, Ms. Tomasky served in various executive officer positions at American Electric Power Company, Inc. (1998-2011), including most recently as President of AEP Transmission (2007-2011). Ms. Tomasky currently serves as a member of the Board and Sustainability Committee and as Chair of the Audit Committee of Marathon Petroleum Corporation (2018-present) and as a member of the Board, Executive Committee, Corporate Governance Committee and Organization and Compensation Committee and as Lead Director of the Board of Public Service Enterprise Group, Inc. (utilities company, 2012-present) and as a member of the Board of its subsidiary company, Public Service Electric and Gas Co. (2021-present). In addition, Ms. Tomasky currently serves as a member (2009-present) and President (2020-present) of the Board of the Royal Shakespeare Company - America (2009-present), as a member of the Board of the Columbus Association for the Performing Arts (2011-present) and as a member of the Board and Kenyon in the World Committee of Kenyon College (2016-present). Previously, Ms. Tomasky served as a Member of the Advisory Board of certain Fidelity ® funds (2020), as a member of the Board of the Columbus Regional Airport Authority (2007-2020), as a member of the Board (2011-2018) and Lead Independent Director (2015-2018) of Andeavor Corporation (previously Tesoro Corporation) (independent oil refiner and marketer) and as a member of the Board of Summit Midstream Partners LP (energy, 2012-2018).
Michael E. Wiley (1950)
Year of Election or Appointment: 2008
Trustee
Mr. Wiley also serves as Trustee of other Fidelity ® funds. Previously, Mr. Wiley served as a member of the Advisory Board of certain Fidelity ® funds (2018-2020), Chairman, President and CEO of Baker Hughes, Inc. (oilfield services, 2000-2004). Mr. Wiley also previously served as a member of the Board of Andeavor Corporation (independent oil refiner and marketer, 2005-2018), a member of the Board of Andeavor Logistics LP (natural resources logistics, 2015-2018) and a member of the Board of High Point Resources (exploration and production, 2005-2020).
+ The information includes the Trustee's principal occupation during the last five years and other information relating to the experience, attributes, and skills relevant to the Trustee's qualifications to serve as a Trustee, which led to the conclusion that the Trustee should serve as a Trustee for the fund.
Advisory Board Members and Officers:
Correspondence intended for a Member of the Advisory Board (if any) may be sent to Fidelity Investments, P.O. Box 55235, Boston, Massachusetts 02205-5235. Correspondence intended for an officer or Peter S. Lynch may be sent to Fidelity Investments, 245 Summer Street, Boston, Massachusetts 02210. Officers appear below in alphabetical order.
Name, Year of Birth; Principal Occupation
Peter S. Lynch (1944)
Year of Election or Appointment: 2018
Member of the Advisory Board
Mr. Lynch also serves as a Member of the Advisory Board of other Fidelity ® funds. Mr. Lynch is Vice Chairman and a Director of Fidelity Management & Research Company LLC (investment adviser firm). In addition, Mr. Lynch serves as a Trustee of Boston College and as the Chairman of the Inner-City Scholarship Fund. Previously, Mr. Lynch served as Vice Chairman and a Director of FMR Co., Inc. (investment adviser firm) and on the Special Olympics International Board of Directors (1997-2006).
Heather Bonner (1977)
Year of Election or Appointment: 2023
Assistant Treasurer
Ms. Bonner also serves as an officer of other funds. Ms. Bonner serves as Senior Vice President (2022-present), and is an employee of Fidelity Investments. Ms. Bonner serves as Assistant Treasurer of Fidelity CRET Trustee LLC (2022-present). Prior to joining Fidelity, Ms. Bonner served as Managing Director at AQR Capital Management (2013-2022) and was the Treasurer and Principal Financial Officer of the AQR Funds (2013-2022).
Craig S. Brown (1977)
Year of Election or Appointment: 2022
Deputy Treasurer
Mr. Brown also serves as an officer of other funds. Mr. Brown serves as Assistant Treasurer of FIMM, LLC (2021-present) and is an employee of Fidelity Investments (2013-present). Previously, Mr. Brown served as Assistant Treasurer of certain Fidelity ® funds (2019-2022).
John J. Burke III (1964)
Year of Election or Appointment: 2018
Chief Financial Officer
Mr. Burke also serves as Chief Financial Officer of other funds. Mr. Burke serves as Head of Investment Operations for Fidelity Fund and Investment Operations (2018-present) and is an employee of Fidelity Investments (1998-present). Previously Mr. Burke served as head of Asset Management Investment Operations (2012-2018).
Margaret Carey (1973)
Year of Election or Appointment: 2023
Secretary and Chief Legal Officer (CLO)
Ms. Carey also serves as an officer of other funds and as CLO of certain other Fidelity entities. She is a Senior Vice President and Deputy General Counsel of FMR LLC (diversified financial services company, 2019-present), and is an employee of Fidelity Investments.
William C. Coffey (1969)
Year of Election or Appointment: 2019
Assistant Secretary
Mr. Coffey also serves as Assistant Secretary of other funds. He is Senior Vice President and Deputy General Counsel of FMR LLC (diversified financial services company, 2010-present), and is an employee of Fidelity Investments. Previously, Mr. Coffey served as Secretary and CLO of certain funds (2018-2019); CLO, Secretary, and Senior Vice President of Fidelity Management & Research Company and FMR Co., Inc. (investment adviser firms, 2018-2019); Secretary of Fidelity SelectCo, LLC and Fidelity Investments Money Management, Inc. (investment adviser firms, 2018-2019); CLO of Fidelity Management & Research (Hong Kong) Limited, FMR Investment Management (UK) Limited, and Fidelity Management & Research (Japan) Limited (investment adviser firms, 2018-2019); and Assistant Secretary of certain funds (2009-2018).
Timothy M. Cohen (1969)
Year of Election or Appointment: 2018
Vice President
Mr. Cohen also serves as Vice President of other funds. Mr. Cohen serves as Co-Head of Equity (2018-present), a Director of Fidelity Management & Research (Japan) Limited (investment adviser firm, 2016-present), and is an employee of Fidelity Investments. Previously, Mr. Cohen served as Executive Vice President of Fidelity SelectCo, LLC (2019), Head of Global Equity Research (2016-2018), Chief Investment Officer - Equity and a Director of Fidelity Management & Research (U.K.) Inc. (investment adviser firm, 2013-2015) and as a Director of Fidelity Management & Research (Hong Kong) Limited (investment adviser firm, 2017).
Jonathan Davis (1968)
Year of Election or Appointment: 2010
Assistant Treasurer
Mr. Davis also serves as an officer of other funds. Mr. Davis serves as Assistant Treasurer of FIMM, LLC (2021-present), FMR Capital, Inc. (2017-present), FD Funds GP LLC (2021-present), FD Funds Holding LLC (2021-present), and FD Funds Management LLC (2021-present); and is an employee of Fidelity Investments. Previously, Mr. Davis served as Vice President and Associate General Counsel of FMR LLC (diversified financial services company, 2003-2010).
Laura M. Del Prato (1964)
Year of Election or Appointment: 2018
Assistant Treasurer
Ms. Del Prato also serves as an officer of other funds. Ms. Del Prato serves as Assistant Treasurer of FIMM, LLC (2021-present) and is an employee of Fidelity Investments (2017-present). Previously, Ms. Del Prato served as President and Treasurer of The North Carolina Capital Management Trust: Cash Portfolio and Term Portfolio (2018-2020). Prior to joining Fidelity Investments, Ms. Del Prato served as a Managing Director and Treasurer of the JPMorgan Mutual Funds (2014-2017). Prior to JPMorgan, Ms. Del Prato served as a partner at Cohen Fund Audit Services (accounting firm, 2012-2013) and KPMG LLP (accounting firm, 2004-2012).
Colm A. Hogan (1973)
Year of Election or Appointment: 2020
Assistant Treasurer
Mr. Hogan also serves as an officer of other funds. Mr. Hogan serves as Assistant Treasurer of FIMM, LLC (2021-present) and FMR Capital, Inc. (2017-present) and is an employee of Fidelity Investments (2005-present). Previously, Mr. Hogan served as Deputy Treasurer of certain Fidelity ® funds (2016-2020) and Assistant Treasurer of certain Fidelity ® funds (2016-2018).
Pamela R. Holding (1964)
Year of Election or Appointment: 2018
Vice President
Ms. Holding also serves as Vice President of other funds. Ms. Holding serves as Co-Head of Equity (2018-present) and is an employee of Fidelity Investments (2013-present). Previously, Ms. Holding served as Executive Vice President of Fidelity SelectCo, LLC (2019) and as Chief Investment Officer of Fidelity Institutional Asset Management (2013-2018).
Chris Maher (1972)
Year of Election or Appointment: 2020
Deputy Treasurer
Mr. Maher also serves as an officer of other funds. Mr. Maher serves as Assistant Treasurer of FIMM, LLC (2021-present) and FMR Capital, Inc. (2017-present), and is an employee of Fidelity Investments (2008-present). Previously, Mr. Maher served as Assistant Treasurer of certain funds (2013-2020); Vice President of Asset Management Compliance (2013), Vice President of the Program Management Group of FMR (investment adviser firm, 2010-2013), and Vice President of Valuation Oversight (2008-2010).
Jason P. Pogorelec (1975)
Year of Election or Appointment: 2020
Chief Compliance Officer
Mr. Pogorelec also serves as Chief Compliance Officer of other funds. Mr. Pogorelec is a Senior Vice President of Asset Management Compliance for Fidelity Investments and is an employee of Fidelity Investments. Mr. Pogorelec serves as Compliance Officer of Fidelity Management & Research Company LLC (investment adviser firm, 2023-present). Previously, Mr. Pogorelec served as Vice President, Associate General Counsel for Fidelity Investments (2010-2020) and Assistant Secretary of certain Fidelity ® funds (2015-2020).
Brett Segaloff (1972)
Year of Election or Appointment: 2021
Anti-Money Laundering (AML) Officer
Mr. Segaloff also serves as an AML Officer of other funds and other related entities. He is Director, Anti-Money Laundering (2007-present) of FMR LLC (diversified financial services company) and is an employee of Fidelity Investments (1996-present).
Stacie M. Smith (1974)
Year of Election or Appointment: 2018
President and Treasurer
Ms. Smith also serves as an officer of other funds. Ms. Smith serves as Assistant Treasurer of FIMM, LLC (2021-present) and FMR Capital, Inc. (2017-present), is an employee of Fidelity Investments (2009-present), and has served in other fund officer roles. Prior to joining Fidelity Investments, Ms. Smith served as Senior Audit Manager of Ernst & Young LLP (accounting firm, 1996-2009). Previously, Ms. Smith served as Assistant Treasurer (2013-2019) and Deputy Treasurer (2013-2016) of certain Fidelity ® funds.
Jim Wegmann (1979)
Year of Election or Appointment: 2019
Assistant Treasurer
Mr. Wegmann also serves as an officer of other funds. Mr. Wegmann serves as Assistant Treasurer of FIMM, LLC (2021-present) and is an employee of Fidelity Investments (2011-present). Previously, Mr. Wegmann served as Assistant Treasurer of certain Fidelity ® funds (2019-2021).
As a shareholder, you incur two types of costs: (1) transaction costs, which may include sales charges (loads) on purchase payments or redemption proceeds, as applicable and (2) ongoing costs, which generally include management fees, distribution and/or service (12b-1) fees and other Fund expenses. This Example is intended to help you understand your ongoing costs (in dollars) of investing in a fund and to compare these costs with the ongoing costs of investing in other mutual funds.
| The Example is based on an investment of $1,000 invested at the beginning of the period and held for the entire period (September 1, 2022 to February 28, 2023). |
Actual Expenses
The first line of the accompanying table provides information about actual account values and actual expenses. You may use the information in this line, together with the amount you invested, to estimate the expenses that you paid over the period. Simply divide your account value by $1,000.00 (for example, an $8,600 account value divided by $1,000.00 = 8.6), then multiply the result by the number in the first line for a class/Fund under the heading entitled "Expenses Paid During Period" to estimate the expenses you paid on your account during this period. If any fund is a shareholder of any underlying mutual funds or exchange-traded funds (ETFs) (the Underlying Funds), such fund indirectly bears its proportional share of the expenses of the Underlying Funds in addition to the direct expenses incurred presented in the table. These fees and expenses are not included in the annualized expense ratio used to calculate the expense estimate in the table below.
Hypothetical Example for Comparison Purposes
The second line of the accompanying table provides information about hypothetical account values and hypothetical expenses based on the actual expense ratio and an assumed rate of return of 5% per year before expenses, which is not the actual return. The hypothetical account values and expenses may not be used to estimate the actual ending account balance or expenses you paid for the period. You may use this information to compare the ongoing costs of investing in the Fund and other funds. To do so, compare this 5% hypothetical example with the 5% hypothetical examples that appear in the shareholder reports of the other funds. If any fund is a shareholder of any Underlying Funds, such fund indirectly bears its proportional share of the expenses of the Underlying Funds in addition to the direct expenses as presented in the table. These fees and expenses are not included in the annualized expense ratio used to calculate the expense estimate in the table below.
Please note that the expenses shown in the table are meant to highlight your ongoing costs only and do not reflect any transaction costs. Therefore, the second line of the table is useful in comparing ongoing costs only, and will not help you determine the relative total costs of owning different funds. In addition, if these transactional costs were included, your costs would have been higher.
| | | | | Annualized Expense Ratio- A | | Beginning Account Value September 1, 2022 | | Ending Account Value February 28, 2023 | | Expenses Paid During Period- C September 1, 2022 to February 28, 2023 |
| Consumer Staples Portfolio | | | | | | | | | | |
| Class A | | | | 1.01% | | | | | | |
| Actual | | | | | | $ 1,000 | | $ 1,024.50 | | $ 5.07 |
Hypothetical- B | | | | | | $ 1,000 | | $ 1,019.79 | | $ 5.06 |
| Class M | | | | 1.27% | | | | | | |
| Actual | | | | | | $ 1,000 | | $ 1,023.20 | | $ 6.37 |
Hypothetical- B | | | | | | $ 1,000 | | $ 1,018.50 | | $ 6.36 |
| Class C | | | | 1.76% | | | | | | |
| Actual | | | | | | $ 1,000 | | $ 1,020.50 | | $ 8.82 |
Hypothetical- B | | | | | | $ 1,000 | | $ 1,016.07 | | $ 8.80 |
| Consumer Staples Portfolio | | | | .73% | | | | | | |
| Actual | | | | | | $ 1,000 | | $ 1,025.90 | | $ 3.67 |
Hypothetical- B | | | | | | $ 1,000 | | $ 1,021.17 | | $ 3.66 |
| Class I | | | | .74% | | | | | | |
| Actual | | | | | | $ 1,000 | | $ 1,025.80 | | $ 3.72 |
Hypothetical- B | | | | | | $ 1,000 | | $ 1,021.12 | | $ 3.71 |
| Class Z | | | | .61% | | | | | | |
| Actual | | | | | | $ 1,000 | | $ 1,026.60 | | $ 3.07 |
Hypothetical- B | | | | | | $ 1,000 | | $ 1,021.77 | | $ 3.06 |
| |
A Annualized expense ratio reflects expenses net of applicable fee waivers.
B 5% return per year before expenses
C Expenses are equal to the annualized expense ratio, multiplied by the average account value over the period, multiplied by 181/ 365 (to reflect the one-half year period). The fees and expenses of any Underlying Funds are not included in each annualized expense ratio.
The dividend and capital gains distributions for the fund(s) are available on Fidelity.com or Institutional.Fidelity.com.
The fund hereby designates as a capital gain dividend with respect to the taxable year ended February 28, 2023, $1,899,535 or, if subsequently determined to be different, the net capital gain of such year.
The fund designates 100% of the short-term capital gain dividends distributed in April during the fiscal year as qualifying to be taxed as short-term capital gain dividends for nonresident alien shareholders.
Class A designates 100%, 100%, 100%, and 100%; Class M designates 100%, 100%, 100%, and 100%; Class C designates 100%, 100%, 100%, and 100%; Consumer Staples Portfolio designates 95%, 100%, 100%, and 100%; Class I designates 97%, 100%, 100%, and 100%, and Class Z designates 89%, 100%, 100%, and 100%; of the dividends distributed in April, July, October, and December, respectively during the fiscal year as qualifying for the dividends-received deduction for corporate shareholders.
Class A designates 100%, 100%, 100%, and 100%; Class M designates 100%, 100%, 100%, and 100%; Class C designates 100%, 100%, 100%, and 100%; Consumer Staples Portfolio designates 99.11%, 100%, 100%, and 100%; Class I designates 100%, 100%, 100%, and 100%, and Class Z designates 92.85%, 100%, 100%, and 100%; of the dividends distributed in April, July, October, and December, respectively during the fiscal year as amounts which may be taken into account as a dividend for purposes of the maximum rate under section 1(h)(11) of the Internal Revenue Code.
The fund will notify shareholders in January 2024 of amounts for use in preparing 2023 income tax returns.
The Securities and Exchange Commission adopted Rule 22e-4 under the Investment Company Act of 1940 (the Liquidity Rule) to promote effective liquidity risk management throughout the open-end investment company industry, thereby reducing the risk that funds will be unable to meet their redemption obligations and mitigating dilution of the interests of fund shareholders.
The Fund has adopted and implemented a liquidity risk management program (the Program) reasonably designed to assess and manage the Fund's liquidity risk and to comply with the requirements of the Liquidity Rule. The Fund's Board of Trustees (the Board) has designated the Fund's investment adviser as administrator of the Program. The Fidelity advisers have established a Liquidity Risk Management Committee (the LRM Committee) to manage the Program for each of the Fidelity Funds. The LRM Committee monitors the adequacy and effectiveness of implementation of the Program and on a periodic basis assesses each Fund's liquidity risk based on a variety of factors including (1) the Fund's investment strategy, (2) portfolio liquidity and cash flow projections during normal and reasonably foreseeable stressed conditions, (3) shareholder redemptions, (4) borrowings and other funding sources and (5) certain factors specific to ETFs including the effect of the Fund's prices and spreads, market participants, and basket compositions on the overall liquidity of the Fund's portfolio, as applicable.
In accordance with the Program, each of the Fund's portfolio investments is classified into one of four defined liquidity categories based on a determination of a reasonable expectation for how long it would take to convert the investment to cash (or sell or dispose of the investment) without significantly changing its market value.
- Highly liquid investments - cash or convertible to cash within three business days or less
- Moderately liquid investments - convertible to cash in three to seven calendar days
- Less liquid investments - can be sold or disposed of, but not settled, within seven calendar days
- Illiquid investments - cannot be sold or disposed of within seven calendar days
Liquidity classification determinations take into account a variety of factors including various market, trading and investment-specific considerations, as well as market depth, and generally utilize analysis from a third-party liquidity metrics service.
The Liquidity Rule places a 15% limit on a fund's illiquid investments and requires funds that do not primarily hold assets that are highly liquid investments to determine and maintain a minimum percentage of the fund's net assets to be invested in highly liquid investments (highly liquid investment minimum or HLIM). The Program includes provisions reasonably designed to comply with the 15% limit on illiquid investments and for determining, periodically reviewing and complying with the HLIM requirement as applicable.
At a recent meeting of the Fund's Board of Trustees, the LRM Committee provided a written report to the Board pertaining to the operation, adequacy, and effectiveness of the Program for the period December 1, 2021 through November 30, 2022. The report concluded that the Program is operating effectively and is reasonably designed to assess and manage the Fund's liquidity risk.
1.846042.116
SELCS-ANN-0423
Fidelity® Select Portfolios®
Industrials Sector
Defense and Aerospace Portfolio
Industrials Portfolio
Transportation Portfolio
Annual Report
February 28, 2023
Contents
To view a fund's proxy voting guidelines and proxy voting record for the 12-month period ended June 30, visit http://www.fidelity.com/proxyvotingresults or visit the Securities and Exchange Commission's (SEC) web site at http://www.sec.gov.
You may also call 1-800-544-8544 to request a free copy of the proxy voting guidelines.
Standard & Poor's, S&P and S&P 500 are registered service marks of The McGraw-Hill Companies, Inc. and have been licensed for use by Fidelity Distributors Corporation.
Other third-party marks appearing herein are the property of their respective owners.
All other marks appearing herein are registered or unregistered trademarks or service marks of FMR LLC or an affiliated company. © 2023 FMR LLC. All rights reserved.
This report and the financial statements contained herein are submitted for the general information of the shareholders of the Funds. This report is not authorized for distribution to prospective investors in the Funds unless preceded or accompanied by an effective prospectus.
A fund files its complete schedule of portfolio holdings with the SEC for the first and third quarters of each fiscal year on Form N-PORT. Forms N-PORT are available on the SEC's web site at http://www.sec.gov. A fund's Forms N-PORT may be reviewed and copied at the SEC's Public Reference Room in Washington, DC. Information regarding the operation of the SEC's Public Reference Room may be obtained by calling 1-800-SEC-0330.
For a complete list of a fund's portfolio holdings, view the most recent holdings listing, semiannual report, or annual report on Fidelity's web site at http://www.fidelity.com, http://www.institutional.fidelity.com, or http://www.401k.com, as applicable.
NOT FDIC INSURED •MAY LOSE VALUE •NO BANK GUARANTEE
Neither the Funds nor Fidelity Distributors Corporation is a bank.
Average annual total return reflects the change in the value of an investment, assuming reinvestment of distributions from dividend income and capital gains (the profits earned upon the sale of securities that have grown in value, if any) and assuming a constant rate of performance each year. The hypothetical investment and the average annual total returns do not reflect the deduction of taxes that a shareholder would pay on fund distributions or the redemption of fund shares. During periods of reimbursement by Fidelity, a fund's total return will be greater than it would be had the reimbursement not occurred. How a fund did yesterday is no guarantee of how it will do tomorrow.
| Average Annual Total Returns |
| | | | |
Periods ended February 28, 2023 | Past 1 year | Past 5 years | Past 10 years |
| Defense and Aerospace Portfolio | 1.54% | 3.57% | 12.07% |
| $10,000 Over 10 Years |
| |
Let's say hypothetically that $10,000 was invested in Defense and Aerospace Portfolio on February 28, 2013. The chart shows how the value of your investment would have changed, and also shows how the S&P 500® Index performed over the same period. |
|
|
Defense and Aerospace Portfolio
Market Recap:
U.S. equities returned -7.69% for the 12 months ending February 28, 2023, according to the S&P 500 ® index. The new year began with an encouraging upturn in January (+6.28%), but stocks lost momentum in February (-2.44%) amid higher-than-expected inflation and strong jobs data. Investors took these as signs that the economy continued to run hot, even after a year of historic policy adjustment by the Federal Reserve aimed at cooling economic growth. Record inflation in 2022 prompted the Fed to aggressively tighten monetary policy, and market interest rates eclipsed their highest level in a decade, stoking recession fears and sending stocks into bear market territory. Since March 2022, the central bank has hiked its benchmark rate eight times, by 4.5 percentage points - the fastest-ever pace of monetary tightening - while also shrinking its massive asset portfolio. The latest bump came on February 2, along with a signal that the Fed plans to lift rates in March while it considers whether and when to pause increases. Against this dynamic backdrop, stocks struggled to gain traction until a strong rally ignited heading into the summer. But in September, the index returned -9.21%, one of its worst monthly results ever, before advancing 7.56% in Q4, as risky assets regained favor. For the full 12 months, value stocks handily outpaced growth. The headwind for the latter was most pronounced in the growth-oriented communication services (-25%) and consumer discretionary (-18%) sectors. In sharp contrast, energy gained 24%.
Comments from Portfolio Manager Clayton Pfannenstiel:
For the fiscal year ending February 28, 2023, the fund gained 1.54%, trailing the 3.54% advance of the MSCI US IMI Aerospace & Defense 25/50 Linked Index, but outperforming the broad-based S&P 500 ® index. Versus the industry index, security selection was the primary detractor, especially within the core aerospace & defense category. Out-of-index exposure to electronic equipment & instruments firms hurt to a much lesser extent. The fund's largest individual relative detractor was an outsized stake in Triumph Group, which returned -49% the past year. Also hindering performance was the portfolio's smaller-than-index stake in Axon Enterprise, which gained 43%. An underweighting in Aerojet Rocketdyne Holdings (+45%) proved detrimental as well; the stock was no longer held at period end. In contrast, the largest contributor to performance versus the industry index was a non-index allocation to the research & consulting services segment. Not owning Virgin Galactic, an index component that returned about -41%, was the top individual relative contributor. Also adding value was an underweighting in Raytheon Technologies, which returned -2% and was among the fund's biggest holdings on February 28. Avoiding Kaman, an index component that returned approximately -38%, bolstered the portfolio's relative result as well.
Notes to shareholders:
On January 1, 2023, Chad Colman came off of the fund, leaving Clayton Pfannenstiel as sole manager.
The views expressed above reflect those of the portfolio manager(s) only through the end of the period as stated on the cover of this report and do not necessarily represent the views of Fidelity or any other person in the Fidelity organization. Any such views are subject to change at any time based upon market or other conditions and Fidelity disclaims any responsibility to update such views. These views may not be relied on as investment advice and, because investment decisions for a Fidelity fund are based on numerous factors, may not be relied on as an indication of trading intent on behalf of any Fidelity fund.
Defense and Aerospace Portfolio
Top Holdings (% of Fund's net assets) |
| |
| The Boeing Co. | 17.9 | |
| Lockheed Martin Corp. | 16.0 | |
| Raytheon Technologies Corp. | 13.0 | |
| Howmet Aerospace, Inc. | 5.0 | |
| TransDigm Group, Inc. | 5.0 | |
| Northrop Grumman Corp. | 4.7 | |
| HEICO Corp. Class A | 4.4 | |
| L3Harris Technologies, Inc. | 3.3 | |
| Textron, Inc. | 2.7 | |
| General Dynamics Corp. | 2.5 | |
| | 74.5 | |
| |
| Industries (% of Fund's net assets) |
| |
| Aerospace & Defense | 91.5 | |
| Professional Services | 3.9 | |
| Electronic Equipment & Components | 2.4 | |
| Metals & Mining | 0.7 | |
| |
Defense and Aerospace Portfolio
Showing Percentage of Net Assets
| Common Stocks - 98.5% |
| | | Shares | Value ($) |
| Aerospace & Defense - 91.5% | | | |
| Aerospace & Defense - 91.5% | | | |
| AerSale Corp. (a) | | 419,200 | 8,325,312 |
| Airbus Group NV | | 272,500 | 35,689,477 |
| Axon Enterprise, Inc. (a) | | 65,100 | 13,040,181 |
| BWX Technologies, Inc. | | 562,700 | 34,386,597 |
| Curtiss-Wright Corp. | | 108,400 | 18,947,236 |
| Elbit Systems Ltd. (b) | | 87,400 | 14,763,608 |
| General Dynamics Corp. | | 174,500 | 39,770,295 |
| HEICO Corp. Class A | | 533,800 | 69,474,070 |
| Howmet Aerospace, Inc. | | 1,858,100 | 78,374,658 |
| Huntington Ingalls Industries, Inc. | | 168,500 | 36,261,200 |
| Kratos Defense & Security Solutions, Inc. (a) | | 978,300 | 12,375,495 |
| L3Harris Technologies, Inc. | | 241,800 | 51,065,742 |
| Lockheed Martin Corp. | | 531,300 | 251,974,338 |
| Mercury Systems, Inc. (a) | | 426,300 | 22,312,542 |
| Northrop Grumman Corp. | | 159,300 | 73,932,723 |
| Raytheon Technologies Corp. | | 2,088,500 | 204,860,965 |
| Spirit AeroSystems Holdings, Inc. Class A | | 699,100 | 23,895,238 |
| Textron, Inc. | | 581,500 | 42,176,195 |
| The Boeing Co. (a) | | 1,394,200 | 281,001,011 |
| TransDigm Group, Inc. | | 105,300 | 78,329,511 |
| Triumph Group, Inc. (a) | | 1,489,200 | 18,793,704 |
| Triumph Group, Inc. warrants 12/19/23 (a) | | 415,950 | 316,122 |
| Woodward, Inc. | | 296,100 | 29,313,900 |
| | | | 1,439,380,120 |
| Electronic Equipment & Components - 2.4% | | | |
| Electronic Equipment & Instruments - 2.4% | | | |
| Teledyne Technologies, Inc. (a) | | 89,100 | 38,319,237 |
| Metals & Mining - 0.7% | | | |
| Steel - 0.7% | | | |
| ATI, Inc. (a) | | 275,900 | 11,215,335 |
| Professional Services - 3.9% | | | |
| Research & Consulting Services - 3.9% | | | |
| Booz Allen Hamilton Holding Corp. Class A | | 335,000 | 31,734,550 |
| CACI International, Inc. Class A (a) | | 103,300 | 30,266,900 |
| | | | 62,001,450 |
| TOTAL COMMON STOCKS (Cost $1,068,155,129) | | | 1,550,916,142 |
| | | | |
| Money Market Funds - 1.4% |
| | | Shares | Value ($) |
| Fidelity Cash Central Fund 4.63% (c) | | 20,586,689 | 20,590,806 |
| Fidelity Securities Lending Cash Central Fund 4.63% (c)(d) | | 1,136,595 | 1,136,708 |
| TOTAL MONEY MARKET FUNDS (Cost $21,727,514) | | | 21,727,514 |
| | | | |
| TOTAL INVESTMENT IN SECURITIES - 99.9% (Cost $1,089,882,643) | 1,572,643,656 |
NET OTHER ASSETS (LIABILITIES) - 0.1% | 1,130,716 |
| NET ASSETS - 100.0% | 1,573,774,372 |
| | |
Legend
| (b) | Security or a portion of the security is on loan at period end. |
| (c) | Affiliated fund that is generally available only to investment companies and other accounts managed by Fidelity Investments. The rate quoted is the annualized seven-day yield of the fund at period end. A complete unaudited listing of the fund's holdings as of its most recent quarter end is available upon request. In addition, each Fidelity Central Fund's financial statements, which are not covered by the Fund's Report of Independent Registered Public Accounting Firm, are available on the SEC's website or upon request. |
| (d) | Investment made with cash collateral received from securities on loan. |
Affiliated Central Funds
Fiscal year to date information regarding the Fund's investments in Fidelity Central Funds, including the ownership percentage, is presented below.
| Affiliate | Value, beginning of period ($) | Purchases ($) | Sales Proceeds ($) | Dividend Income ($) | Realized Gain (loss) ($) | Change in Unrealized appreciation (depreciation) ($) | Value, end of period ($) | % ownership, end of period |
| Fidelity Cash Central Fund 4.63% | 10,252,211 | 280,724,206 | 270,385,611 | 384,062 | - | - | 20,590,806 | 0.0% |
| Fidelity Securities Lending Cash Central Fund 4.63% | 19,275,358 | 168,180,131 | 186,318,781 | 20,637 | - | - | 1,136,708 | 0.0% |
| Total | 29,527,569 | 448,904,337 | 456,704,392 | 404,699 | - | - | 21,727,514 | |
| | | | | | | | | |
Amounts in the dividend income column in the above table include any capital gain distributions from underlying funds, which are presented in the corresponding line item in the Statement of Operations, if applicable.
Amount for Fidelity Securities Lending Cash Central Fund represents the income earned on investing cash collateral, less rebates paid to borrowers and any lending agent fees associated with the loan, plus any premium payments received for lending certain types of securities.
Amounts included in the purchases and sales proceeds columns may include in-kind transactions, if applicable.
Investment Valuation
The following is a summary of the inputs used, as of February 28, 2023, involving the Fund's assets and liabilities carried at fair value. The inputs or methodology used for valuing securities may not be an indication of the risk associated with investing in those securities. For more information on valuation inputs, and their aggregation into the levels used below, please refer to the Investment Valuation section in the accompanying Notes to Financial Statements.
| Valuation Inputs at Reporting Date: |
| Description | Total ($) | Level 1 ($) | Level 2 ($) | Level 3 ($) |
Investments in Securities: | | | | |
|
| Common Stocks | 1,550,916,142 | 1,515,226,665 | 35,689,477 | - |
|
| Money Market Funds | 21,727,514 | 21,727,514 | - | - |
| Total Investments in Securities: | 1,572,643,656 | 1,536,954,179 | 35,689,477 | - |
Defense and Aerospace Portfolio
| Statement of Assets and Liabilities |
| | | | February 28, 2023 |
| | | | | |
| Assets | | | | |
| Investment in securities, at value (including securities loaned of $1,114,872) - See accompanying schedule: | | | | |
Unaffiliated issuers (cost $1,068,155,129) | $ | 1,550,916,142 | | |
Fidelity Central Funds (cost $21,727,514) | | 21,727,514 | | |
| | | | | |
| | | | | |
| Total Investment in Securities (cost $1,089,882,643) | | | $ | 1,572,643,656 |
| Cash | | | | 16,971 |
| Receivable for investments sold | | | | 1,241,739 |
| Receivable for fund shares sold | | | | 921,238 |
| Dividends receivable | | | | 3,442,698 |
| Distributions receivable from Fidelity Central Funds | | | | 51,687 |
| Prepaid expenses | | | | 8,685 |
| Other receivables | | | | 112,362 |
Total assets | | | | 1,578,439,036 |
| Liabilities | | | | |
| Payable for investments purchased | $ | 1,610,263 | | |
| Payable for fund shares redeemed | | 806,576 | | |
| Accrued management fee | | 696,808 | | |
| Other affiliated payables | | 266,729 | | |
| Other payables and accrued expenses | | 147,438 | | |
| Collateral on securities loaned | | 1,136,850 | | |
| Total Liabilities | | | | 4,664,664 |
| Net Assets | | | $ | 1,573,774,372 |
| Net Assets consist of: | | | | |
| Paid in capital | | | $ | 1,083,508,000 |
| Total accumulated earnings (loss) | | | | 490,266,372 |
| Net Assets | | | $ | 1,573,774,372 |
Net Asset Value , offering price and redemption price per share ($1,573,774,372 ÷ 98,946,583 shares) | | | $ | 15.91 |
| Statement of Operations |
| | | | Year ended February 28, 2023 |
| Investment Income | | | | |
| Dividends | | | $ | 16,697,160 |
| Special dividends | | | | 2,072,000 |
| Income from Fidelity Central Funds (including $20,637 from security lending) | | | | 404,699 |
| Total Income | | | | 19,173,859 |
| Expenses | | | | |
| Management fee | $ | 7,610,119 | | |
| Transfer agent fees | | 2,645,479 | | |
| Accounting fees | | 416,979 | | |
| Custodian fees and expenses | | 11,859 | | |
| Independent trustees' fees and expenses | | 4,871 | | |
| Registration fees | | 58,189 | | |
| Audit | | 40,051 | | |
| Legal | | 772 | | |
| Miscellaneous | | 10,624 | | |
| Total expenses before reductions | | 10,798,943 | | |
| Expense reductions | | (50,343) | | |
| Total expenses after reductions | | | | 10,748,600 |
| Net Investment income (loss) | | | | 8,425,259 |
| Realized and Unrealized Gain (Loss) | | | | |
| Net realized gain (loss) on: | | | | |
| Investment Securities: | | | | |
| Unaffiliated issuers | | 8,872,934 | | |
| Foreign currency transactions | | 20,294 | | |
| Total net realized gain (loss) | | | | 8,893,228 |
| Change in net unrealized appreciation (depreciation) on investment securities | | | | (9,553,385) |
| Net gain (loss) | | | | (660,157) |
| Net increase (decrease) in net assets resulting from operations | | | $ | 7,765,102 |
| Statement of Changes in Net Assets |
| |
| | Year ended February 28, 2023 | | Year ended February 28, 2022 |
| Increase (Decrease) in Net Assets | | | | |
| Operations | | | | |
| Net investment income (loss) | $ | 8,425,259 | $ | 932,889 |
| Net realized gain (loss) | | 8,893,228 | | 353,125,938 |
| Change in net unrealized appreciation (depreciation) | | (9,553,385) | | (141,504,262) |
| Net increase (decrease) in net assets resulting from operations | | 7,765,102 | | 212,554,565 |
| Distributions to shareholders | | (131,285,966) | | (114,456,735) |
| Share transactions | | | | |
| Proceeds from sales of shares | | 374,622,368 | | 116,915,674 |
| Reinvestment of distributions | | 123,852,822 | | 107,992,135 |
| Cost of shares redeemed | | (337,711,083) | | (424,668,107) |
Net increase (decrease) in net assets resulting from share transactions | | 160,764,107 | | (199,760,298) |
| Total increase (decrease) in net assets | | 37,243,243 | | (101,662,468) |
| | | | | |
| Net Assets | | | | |
| Beginning of period | | 1,536,531,129 | | 1,638,193,597 |
| End of period | $ | 1,573,774,372 | $ | 1,536,531,129 |
| | | | | |
| Other Information | | | | |
| Shares | | | | |
| Sold | | 23,993,181 | | 6,800,815 |
| Issued in reinvestment of distributions | | 8,055,567 | | 7,086,098 |
| Redeemed | | (23,077,316) | | (24,520,122) |
| Net increase (decrease) | | 8,971,432 | | (10,633,209) |
| | | | | |
Financial Highlights
| Defense and Aerospace Portfolio |
| |
| Years ended February 28, | | 2023 | | 2022 | | 2021 | | 2020 A | | 2019 B |
Selected Per-Share Data | | | | | | | | | | |
| Net asset value, beginning of period | $ | 17.08 | $ | 16.28 | $ | 16.61 | $ | 17.27 | $ | 18.45 |
| Income from Investment Operations | | | | | | | | | | |
Net investment income (loss) C,D | | .09 E | | .01 | | (.04) | | .27 F | | .11 |
| Net realized and unrealized gain (loss) | | .12 G | | 2.12 | | .06 | | (.45) | | .33 |
| Total from investment operations | | .21 | | 2.13 | | .02 | | (.18) | | .44 |
| Distributions from net investment income | | (.07) | | - | | (.05) | | (.22) | | (.10) |
| Distributions from net realized gain | | (1.31) | | (1.33) | | (.30) | | (.26) | | (1.52) |
| Total distributions | | (1.38) | | (1.33) | | (.35) | | (.48) | | (1.62) |
| Net asset value, end of period | $ | 15.91 | $ | 17.08 | $ | 16.28 | $ | 16.61 | $ | 17.27 |
Total Return H | | 1.54% | | 14.06% | | .69% | | (1.32)% | | 3.57% |
Ratios to Average Net Assets D,I,J | | | | | | | | | | |
| Expenses before reductions | | .75% | | .74% | | .77% | | .75% | | .75% |
| Expenses net of fee waivers, if any | | .74% | | .74% | | .77% | | .74% | | .75% |
| Expenses net of all reductions | | .74% | | .74% | | .76% | | .74% | | .75% |
| Net investment income (loss) | | .58% E | | .06% | | (.29)% | | 1.49% F | | .66% |
| Supplemental Data | | | | | | | | | | |
| Net assets, end of period (000 omitted) | $ | 1,573,774 | $ | 1,536,531 | $ | 1,638,194 | $ | 2,728,959 | $ | 2,795,259 |
Portfolio turnover rate K | | 15% | | 52% | | 30% | | 40% | | 44% |
A For the year ended February 29.
B Per share amounts have been adjusted to reflect the impact of the 10 for 1 share split that occurred on August 10, 2018.
C Calculated based on average shares outstanding during the period.
D Net investment income (loss) is affected by the timing of the declaration of dividends by any underlying mutual funds or exchange-traded funds (ETFs). Net investment income (loss) of any mutual funds or ETFs is not included in the Fund's net investment income (loss) ratio.
E Net investment income per share reflects one or more large, non-recurring dividend(s) which amounted to $.02 per share. Excluding such non-recurring dividend(s), the ratio of net investment income (loss) to average net assets would have been .44%.
F Net investment income per share reflects one or more large, non-recurring dividend(s) which amounted to $.18 per share. Excluding such non-recurring dividend(s), the ratio of net investment income (loss) to average net assets would have been .48%.
G The amount shown for a share outstanding does not correspond with the aggregate net gain (loss) on investments for the period due to the timing of sales and repurchases of shares in relation to fluctuating market values of the investments of the Fund.
H Total returns would have been lower if certain expenses had not been reduced during the applicable periods shown.
I Fees and expenses of any underlying mutual funds or exchange-traded funds (ETFs) are not included in the Fund's expense ratio. The Fund indirectly bears its proportionate share of these expenses. For additional expense information related to investments in Fidelity Central Funds, please refer to the "Investments in Fidelity Central Funds" note found in the Notes to Financial Statements section of the most recent Annual or Semi-Annual report.
J Expense ratios reflect operating expenses of the class. Expenses before reductions do not reflect amounts reimbursed, waived, or reduced through arrangements with the investment adviser, brokerage services, or other offset arrangements, if applicable, and do not represent the amount paid by the class during periods when reimbursements, waivers or reductions occur.
K Amount does not include the portfolio activity of any underlying mutual funds or exchange-traded funds (ETFs).
Average annual total return reflects the change in the value of an investment, assuming reinvestment of distributions from dividend income and capital gains (the profits earned upon the sale of securities that have grown in value, if any) and assuming a constant rate of performance each year. The hypothetical investment and the average annual total returns do not reflect the deduction of taxes that a shareholder would pay on fund distributions or the redemption of fund shares. During periods of reimbursement by Fidelity, a fund's total return will be greater than it would be had the reimbursement not occurred. How a fund did yesterday is no guarantee of how it will do tomorrow.
| Average Annual Total Returns |
| | | | |
Periods ended February 28, 2023 | Past 1 year | Past 5 years | Past 10 years |
| Industrials Portfolio | 1.19% | 5.59% | 9.26% |
| $10,000 Over 10 Years |
| |
Let's say hypothetically that $10,000 was invested in Industrials Portfolio on February 28, 2013. The chart shows how the value of your investment would have changed, and also shows how the S&P 500® Index performed over the same period. |
|
|
Industrials Portfolio
Market Recap:
U.S. equities returned -7.69% for the 12 months ending February 28, 2023, according to the S&P 500 ® index. The new year began with an encouraging upturn in January (+6.28%), but stocks lost momentum in February (-2.44%) amid higher-than-expected inflation and strong jobs data. Investors took these as signs that the economy continued to run hot, even after a year of historic policy adjustment by the Federal Reserve aimed at cooling economic growth. Record inflation in 2022 prompted the Fed to aggressively tighten monetary policy, and market interest rates eclipsed their highest level in a decade, stoking recession fears and sending stocks into bear market territory. Since March 2022, the central bank has hiked its benchmark rate eight times, by 4.5 percentage points - the fastest-ever pace of monetary tightening - while also shrinking its massive asset portfolio. The latest bump came on February 2, along with a signal that the Fed plans to lift rates in March while it considers whether and when to pause increases. Against this dynamic backdrop, stocks struggled to gain traction until a strong rally ignited heading into the summer. But in September, the index returned -9.21%, one of its worst monthly results ever, before advancing 7.56% in Q4, as risky assets regained favor. For the full 12 months, value stocks handily outpaced growth. The headwind for the latter was most pronounced in the growth-oriented communication services (-25%) and consumer discretionary (-18%) sectors. In sharp contrast, energy gained 24%.
Comments from Portfolio Manager Janet Glazer:
For the fiscal year ending February 28, 2023, the fund gained 1.19%, underperforming the 2.97% advance of the MSCI US IMI Industrials 25/50 Linked Index, but outperforming the broad-based S&P 500 ® index. Versus the sector index, security selection was the primary detractor, especially within aerospace & defense. Security selection in application software and an underweighting in construction machinery & heavy trucks also hurt. The biggest individual relative detractor was an overweight position in Triumph (-58%), a stock that was not held at the end of this period. Also hurting performance was our large overweighting in Roper Technologies, which returned roughly -5%. Roper Technologies was not held at period end. Avoiding Caterpillar, an index component that gained about 31%, also hurt relative performance. In contrast, the largest contributors to performance versus the sector index were an overweighting and stock selection in construction & engineering. An underweighting and security selection in air freight & logistics and stock picks in electrical components & equipment also bolstered the fund's relative result. The biggest individual relative contributor was an overweight position in WillScot Mobile Mini (+45%). WillScot Mobile Mini was among the fund's biggest holdings. Also lifting performance was our outsized investment in Crane Holdings, which gained 29%. This was a position we established the past year, following the firm's spin-off from parent firm Crane Company. Avoiding 3M, an index component that returned -24%, also aided relative performance. Notable changes in positioning include increased exposure to the industrial machinery subindustry and a lower allocation to aerospace & defense.
The views expressed above reflect those of the portfolio manager(s) only through the end of the period as stated on the cover of this report and do not necessarily represent the views of Fidelity or any other person in the Fidelity organization. Any such views are subject to change at any time based upon market or other conditions and Fidelity disclaims any responsibility to update such views. These views may not be relied on as investment advice and, because investment decisions for a Fidelity fund are based on numerous factors, may not be relied on as an indication of trading intent on behalf of any Fidelity fund.
Industrials Portfolio
Top Holdings (% of Fund's net assets) |
| |
| Fortive Corp. | 7.2 | |
| Willscot Mobile Mini Holdings | 6.9 | |
| The Boeing Co. | 6.5 | |
| Saia, Inc. | 6.0 | |
| FedEx Corp. | 6.0 | |
| AMETEK, Inc. | 5.9 | |
| Parker Hannifin Corp. | 5.8 | |
| Pentair PLC | 5.3 | |
| TransDigm Group, Inc. | 4.4 | |
| Old Dominion Freight Lines, Inc. | 4.2 | |
| | 58.2 | |
| |
| Industries (% of Fund's net assets) |
| |
| Machinery | 36.1 | |
| Aerospace & Defense | 17.9 | |
| Road & Rail | 14.4 | |
| Electrical Equipment | 13.5 | |
| Construction & Engineering | 7.1 | |
| Air Freight & Logistics | 6.0 | |
| Industrial Conglomerates | 2.9 | |
| Internet & Direct Marketing Retail | 2.4 | |
| Commercial Services & Supplies | 0.0 | |
| |
Industrials Portfolio
Showing Percentage of Net Assets
| Common Stocks - 100.3% |
| | | Shares | Value ($) |
| Aerospace & Defense - 17.9% | | | |
| Aerospace & Defense - 17.9% | | | |
| HEICO Corp. | | 54,600 | 9,040,122 |
| HEICO Corp. Class A | | 35,300 | 4,594,295 |
| Hexcel Corp. (a) | | 24,100 | 1,758,095 |
| Howmet Aerospace, Inc. | | 385,700 | 16,268,826 |
| The Boeing Co. (b) | | 146,560 | 29,539,168 |
| TransDigm Group, Inc. | | 26,937 | 20,037,626 |
| | | | 81,238,132 |
| Air Freight & Logistics - 6.0% | | | |
| Air Freight & Logistics - 6.0% | | | |
| FedEx Corp. | | 133,800 | 27,190,836 |
| Commercial Services & Supplies - 0.0% | | | |
| Environmental & Facility Services - 0.0% | | | |
| Tetra Tech, Inc. | | 800 | 109,512 |
| Construction & Engineering - 7.1% | | | |
| Construction & Engineering - 7.1% | | | |
| AECOM | | 9,500 | 820,420 |
| Willscot Mobile Mini Holdings (b) | | 613,500 | 31,533,900 |
| | | | 32,354,320 |
| Electrical Equipment - 13.5% | | | |
| Electrical Components & Equipment - 13.5% | | | |
| Acuity Brands, Inc. | | 7,000 | 1,357,720 |
| AMETEK, Inc. | | 188,220 | 26,644,423 |
| nVent Electric PLC | | 379,552 | 17,398,664 |
| Regal Rexnord Corp. | | 94,770 | 14,939,543 |
| Vertiv Holdings Co. | | 52,300 | 849,875 |
| | | | 61,190,225 |
| Industrial Conglomerates - 2.9% | | | |
| Industrial Conglomerates - 2.9% | | | |
| General Electric Co. | | 54,400 | 4,608,224 |
| Honeywell International, Inc. | | 44,598 | 8,539,625 |
| | | | 13,147,849 |
| Internet & Direct Marketing Retail - 2.4% | | | |
| Internet & Direct Marketing Retail - 2.4% | | | |
| Uber Technologies, Inc. (b) | | 321,400 | 10,689,764 |
| Machinery - 36.1% | | | |
| Industrial Machinery - 36.1% | | | |
| Barnes Group, Inc. | | 184,718 | 7,784,017 |
| Crane Holdings Co. | | 140,411 | 16,818,430 |
| Flowserve Corp. | | 411,973 | 14,291,343 |
| Fortive Corp. | | 490,000 | 32,663,399 |
| Ingersoll Rand, Inc. | | 299,600 | 17,397,772 |
| Middleby Corp. (b) | | 108,300 | 16,839,567 |
| Parker Hannifin Corp. | | 74,600 | 26,248,010 |
| Pentair PLC | | 429,500 | 24,026,230 |
| RBC Bearings, Inc. (a)(b) | | 34,300 | 7,882,483 |
| | | | 163,951,251 |
| Road & Rail - 14.4% | | | |
| Trucking - 14.4% | | | |
| ArcBest Corp. (a) | | 54,600 | 5,252,520 |
| J.B. Hunt Transport Services, Inc. | | 11,252 | 2,034,249 |
| Knight-Swift Transportation Holdings, Inc. Class A | | 204,400 | 11,618,096 |
| Old Dominion Freight Lines, Inc. | | 55,723 | 18,904,585 |
| Saia, Inc. (b) | | 101,000 | 27,357,870 |
| | | | 65,167,320 |
| TOTAL COMMON STOCKS (Cost $394,687,054) | | | 455,039,209 |
| | | | |
| Money Market Funds - 1.0% |
| | | Shares | Value ($) |
Fidelity Securities Lending Cash Central Fund 4.63% (c)(d) (Cost $4,537,200) | | 4,536,746 | 4,537,200 |
| | | | |
| TOTAL INVESTMENT IN SECURITIES - 101.3% (Cost $399,224,254) | 459,576,409 |
NET OTHER ASSETS (LIABILITIES) - (1.3)% | (6,050,916) |
| NET ASSETS - 100.0% | 453,525,493 |
| | |
Legend
| (a) | Security or a portion of the security is on loan at period end. |
| (c) | Affiliated fund that is generally available only to investment companies and other accounts managed by Fidelity Investments. The rate quoted is the annualized seven-day yield of the fund at period end. A complete unaudited listing of the fund's holdings as of its most recent quarter end is available upon request. In addition, each Fidelity Central Fund's financial statements, which are not covered by the Fund's Report of Independent Registered Public Accounting Firm, are available on the SEC's website or upon request. |
| (d) | Investment made with cash collateral received from securities on loan. |
Affiliated Central Funds
Fiscal year to date information regarding the Fund's investments in Fidelity Central Funds, including the ownership percentage, is presented below.
| Affiliate | Value, beginning of period ($) | Purchases ($) | Sales Proceeds ($) | Dividend Income ($) | Realized Gain (loss) ($) | Change in Unrealized appreciation (depreciation) ($) | Value, end of period ($) | % ownership, end of period |
| Fidelity Cash Central Fund 4.63% | 1,945,359 | 196,769,883 | 198,715,242 | 98,564 | - | - | - | 0.0% |
| Fidelity Securities Lending Cash Central Fund 4.63% | 1,593,775 | 179,463,597 | 176,520,172 | 8,608 | - | - | 4,537,200 | 0.0% |
| Total | 3,539,134 | 376,233,480 | 375,235,414 | 107,172 | - | - | 4,537,200 | |
| | | | | | | | | |
Amounts in the dividend income column in the above table include any capital gain distributions from underlying funds, which are presented in the corresponding line item in the Statement of Operations, if applicable.
Amount for Fidelity Securities Lending Cash Central Fund represents the income earned on investing cash collateral, less rebates paid to borrowers and any lending agent fees associated with the loan, plus any premium payments received for lending certain types of securities.
Amounts included in the purchases and sales proceeds columns may include in-kind transactions, if applicable.
Investment Valuation
The following is a summary of the inputs used, as of February 28, 2023, involving the Fund's assets and liabilities carried at fair value. The inputs or methodology used for valuing securities may not be an indication of the risk associated with investing in those securities. For more information on valuation inputs, and their aggregation into the levels used below, please refer to the Investment Valuation section in the accompanying Notes to Financial Statements.
| Valuation Inputs at Reporting Date: |
| Description | Total ($) | Level 1 ($) | Level 2 ($) | Level 3 ($) |
Investments in Securities: | | | | |
|
| Common Stocks | 455,039,209 | 455,039,209 | - | - |
|
| Money Market Funds | 4,537,200 | 4,537,200 | - | - |
| Total Investments in Securities: | 459,576,409 | 459,576,409 | - | - |
Industrials Portfolio
| Statement of Assets and Liabilities |
| | | | February 28, 2023 |
| | | | | |
| Assets | | | | |
| Investment in securities, at value (including securities loaned of $4,420,884) - See accompanying schedule: | | | | |
Unaffiliated issuers (cost $394,687,054) | $ | 455,039,209 | | |
Fidelity Central Funds (cost $4,537,200) | | 4,537,200 | | |
| | | | | |
| | | | | |
| Total Investment in Securities (cost $399,224,254) | | | $ | 459,576,409 |
| Receivable for investments sold | | | | 2,351,194 |
| Receivable for fund shares sold | | | | 67,873 |
| Dividends receivable | | | | 294,304 |
| Distributions receivable from Fidelity Central Funds | | | | 22,926 |
| Prepaid expenses | | | | 2,907 |
| Other receivables | | | | 106,169 |
Total assets | | | | 462,421,782 |
| Liabilities | | | | |
| Payable to custodian bank | $ | 1,910,330 | | |
| Payable for investments purchased | | 1,349,653 | | |
| Payable for fund shares redeemed | | 684,373 | | |
| Accrued management fee | | 203,102 | | |
| Other affiliated payables | | 72,137 | | |
| Other payables and accrued expenses | | 139,494 | | |
| Collateral on securities loaned | | 4,537,200 | | |
| Total Liabilities | | | | 8,896,289 |
| Net Assets | | | $ | 453,525,493 |
| Net Assets consist of: | | | | |
| Paid in capital | | | $ | 390,407,023 |
| Total accumulated earnings (loss) | | | | 63,118,470 |
| Net Assets | | | $ | 453,525,493 |
Net Asset Value , offering price and redemption price per share ($453,525,493 ÷ 14,825,716 shares) | | | $ | 30.59 |
| Statement of Operations |
| | | | Year ended February 28, 2023 |
| Investment Income | | | | |
| Dividends | | | $ | 2,683,729 |
| Special dividends | | | | 411,385 |
| Income from Fidelity Central Funds (including $8,608 from security lending) | | | | 107,172 |
| Total Income | | | | 3,202,286 |
| Expenses | | | | |
| Management fee | $ | 1,875,889 | | |
| Transfer agent fees | | 595,224 | | |
| Accounting fees | | 129,010 | | |
| Custodian fees and expenses | | 7,349 | | |
| Independent trustees' fees and expenses | | 1,190 | | |
| Registration fees | | 52,099 | | |
| Audit | | 39,375 | | |
| Legal | | 3,178 | | |
| Interest | | 1,537 | | |
| Miscellaneous | | 2,795 | | |
| Total expenses before reductions | | 2,707,646 | | |
| Expense reductions | | (13,331) | | |
| Total expenses after reductions | | | | 2,694,315 |
| Net Investment income (loss) | | | | 507,971 |
| Realized and Unrealized Gain (Loss) | | | | |
| Net realized gain (loss) on: | | | | |
| Investment Securities: | | | | |
| Unaffiliated issuers | | 4,343,765 | | |
| Foreign currency transactions | | 2,899 | | |
| Total net realized gain (loss) | | | | 4,346,664 |
| Change in net unrealized appreciation (depreciation) on: | | | | |
| Investment Securities: | | | | |
| Unaffiliated issuers | | 7,992,006 | | |
| Assets and liabilities in foreign currencies | | (18) | | |
| Total change in net unrealized appreciation (depreciation) | | | | 7,991,988 |
| Net gain (loss) | | | | 12,338,652 |
| Net increase (decrease) in net assets resulting from operations | | | $ | 12,846,623 |
| Statement of Changes in Net Assets |
| |
| | Year ended February 28, 2023 | | Year ended February 28, 2022 |
| Increase (Decrease) in Net Assets | | | | |
| Operations | | | | |
| Net investment income (loss) | $ | 507,971 | $ | (443,437) |
| Net realized gain (loss) | | 4,346,664 | | 100,676,384 |
| Change in net unrealized appreciation (depreciation) | | 7,991,988 | | (46,229,650) |
| Net increase (decrease) in net assets resulting from operations | | 12,846,623 | | 54,003,297 |
| Distributions to shareholders | | (13,235,663) | | (115,424,416) |
| Share transactions | | | | |
| Proceeds from sales of shares | | 164,045,053 | | 116,900,003 |
| Reinvestment of distributions | | 12,491,921 | | 108,515,761 |
| Cost of shares redeemed | | (82,387,426) | | (368,438,524) |
Net increase (decrease) in net assets resulting from share transactions | | 94,149,548 | | (143,022,760) |
| Total increase (decrease) in net assets | | 93,760,508 | | (204,443,879) |
| | | | | |
| Net Assets | | | | |
| Beginning of period | | 359,764,985 | | 564,208,864 |
| End of period | $ | 453,525,493 | $ | 359,764,985 |
| | | | | |
| Other Information | | | | |
| Shares | | | | |
| Sold | | 5,797,934 | | 3,139,766 |
| Issued in reinvestment of distributions | | 419,387 | | 3,143,897 |
| Redeemed | | (2,846,988) | | (10,008,148) |
| Net increase (decrease) | | 3,370,333 | | (3,724,485) |
| | | | | |
Financial Highlights
| Years ended February 28, | | 2023 | | 2022 | | 2021 | | 2020 A | | 2019 |
Selected Per-Share Data | | | | | | | | | | |
| Net asset value, beginning of period | $ | 31.41 | $ | 37.17 | $ | 31.90 | $ | 33.84 | $ | 36.96 |
| Income from Investment Operations | | | | | | | | | | |
Net investment income (loss) B,C | | .04 D | | (.04) | | (.02) | | .28 E | | .32 |
| Net realized and unrealized gain (loss) | | .30 | | 3.70 | | 6.38 | | (.76) | | (.70) |
| Total from investment operations | | .34 | | 3.66 | | 6.36 | | (.48) | | (.38) |
| Distributions from net investment income | | (.04) | | - | | (.07) F | | (.24) | | (.25) |
| Distributions from net realized gain | | (1.13) | | (9.42) | | (1.02) F | | (1.23) | | (2.49) |
| Total distributions | | (1.16) G | | (9.42) | | (1.09) | | (1.46) G | | (2.74) |
| Net asset value, end of period | $ | 30.59 | $ | 31.41 | $ | 37.17 | $ | 31.90 | $ | 33.84 |
Total Return H | | 1.19% | | 9.33% | | 21.41% | | (1.82)% | | (.45)% |
Ratios to Average Net Assets C,I,J | | | | | | | | | | |
| Expenses before reductions | | .76% | | .74% | | .76% | | .76% | | .76% |
| Expenses net of fee waivers, if any | | .76% | | .74% | | .76% | | .76% | | .76% |
| Expenses net of all reductions | | .76% | | .74% | | .74% | | .75% | | .75% |
| Net investment income (loss) | | .14% D | | (.10)% | | (.05)% | | .81% E | | .92% |
| Supplemental Data | | | | | | | | | | |
| Net assets, end of period (000 omitted) | $ | 453,525 | $ | 359,765 | $ | 564,209 | $ | 529,023 | $ | 632,470 |
Portfolio turnover rate K | | 125% | | 151% | | 272% | | 143% L | | 88% L |
A For the year ended February 29.
B Calculated based on average shares outstanding during the period.
C Net investment income (loss) is affected by the timing of the declaration of dividends by any underlying mutual funds or exchange-traded funds (ETFs). Net investment income (loss) of any mutual funds or ETFs is not included in the Fund's net investment income (loss) ratio.
D Net investment income per share reflects one or more large, non-recurring dividend(s) which amounted to $.03 per share. Excluding such non-recurring dividend(s), the ratio of net investment income (loss) to average net assets would have been .03%.
E Net investment income per share reflects one or more large, non-recurring dividend(s) which amounted to $.06 per share. Excluding such non-recurring dividend(s), the ratio of net investment income (loss) to average net assets would have been .64%.
F The amount shown reflects reclassifications related to book to tax differences that were made in the year shown.
G Total distributions per share do not sum due to rounding.
H Total returns would have been lower if certain expenses had not been reduced during the applicable periods shown.
I Fees and expenses of any underlying mutual funds or exchange-traded funds (ETFs) are not included in the Fund's expense ratio. The Fund indirectly bears its proportionate share of these expenses. For additional expense information related to investments in Fidelity Central Funds, please refer to the "Investments in Fidelity Central Funds" note found in the Notes to Financial Statements section of the most recent Annual or Semi-Annual report.
J Expense ratios reflect operating expenses of the class. Expenses before reductions do not reflect amounts reimbursed, waived, or reduced through arrangements with the investment adviser, brokerage services, or other offset arrangements, if applicable, and do not represent the amount paid by the class during periods when reimbursements, waivers or reductions occur.
K Amount does not include the portfolio activity of any underlying mutual funds or exchange-traded funds (ETFs).
L Portfolio turnover rate excludes securities received or delivered in-kind.
Average annual total return reflects the change in the value of an investment, assuming reinvestment of distributions from dividend income and capital gains (the profits earned upon the sale of securities that have grown in value, if any) and assuming a constant rate of performance each year. The hypothetical investment and the average annual total returns do not reflect the deduction of taxes that a shareholder would pay on fund distributions or the redemption of fund shares. During periods of reimbursement by Fidelity, a fund's total return will be greater than it would be had the reimbursement not occurred. How a fund did yesterday is no guarantee of how it will do tomorrow.
| Average Annual Total Returns |
| | | | |
Periods ended February 28, 2023 | Past 1 year | Past 5 years | Past 10 years |
| Transportation Portfolio | -0.46% | 9.05% | 12.53% |
| $10,000 Over 10 Years |
| |
Let's say hypothetically that $10,000 was invested in Transportation Portfolio on February 28, 2013. The chart shows how the value of your investment would have changed, and also shows how the S&P 500® Index performed over the same period. |
|
|
Transportation Portfolio
Market Recap:
U.S. equities returned -7.69% for the 12 months ending February 28, 2023, according to the S&P 500 ® index. The new year began with an encouraging upturn in January (+6.28%), but stocks lost momentum in February (-2.44%) amid higher-than-expected inflation and strong jobs data. Investors took these as signs that the economy continued to run hot, even after a year of historic policy adjustment by the Federal Reserve aimed at cooling economic growth. Record inflation in 2022 prompted the Fed to aggressively tighten monetary policy, and market interest rates eclipsed their highest level in a decade, stoking recession fears and sending stocks into bear market territory. Since March 2022, the central bank has hiked its benchmark rate eight times, by 4.5 percentage points - the fastest-ever pace of monetary tightening - while also shrinking its massive asset portfolio. The latest bump came on February 2, along with a signal that the Fed plans to lift rates in March while it considers whether and when to pause increases. Against this dynamic backdrop, stocks struggled to gain traction until a strong rally ignited heading into the summer. But in September, the index returned -9.21%, one of its worst monthly results ever, before advancing 7.56% in Q4, as risky assets regained favor. For the full 12 months, value stocks handily outpaced growth. The headwind for the latter was most pronounced in the growth-oriented communication services (-25%) and consumer discretionary (-18%) sectors. In sharp contrast, energy gained 24%.
Comments from Portfolio Manager Matthew Moulis:
For the fiscal year ending February 28, 2023, the fund returned -0.46%, outperforming the -8.76% result of the MSCI US IMI Transportation 25/50 Linked Index, as well as the broad-based S&P 500 ® index. Versus the industry index, out-of-index exposure to the oil & gas storage & transportation group was the primary contributor, by far. Security selection in the marine subindustry also boosted the fund's relative result. Our non-index investment in Scorpio Tankers was the fund's largest individual relative contributor, driven by an increase of 194%. This was among our biggest holdings. Our second-largest contributor this period was Eagle Bulk Shipping, which gained about 49% and contributed to relative performance. We decreased our position in the past 12 months. Another key contributor was our out-of-index position in International Seaways (+193%). We reduced our stake this period. In contrast, the primary detractor from performance versus the industry index was stock selection in air freight & logistics. An underweighting in trucking and stock picks in aluminum also hindered the fund's relative result. The fund's largest individual relative detractor was an overweighting in Air Transport Services Group, which returned about -34% the past year. The company was among our biggest holdings. Our second-largest relative detractor this period was avoiding Old Dominion Freight Lines, an index component that gained roughly 9%. Also holding back performance was an underweighting in United Airlines Holdings, which gained approximately 17%. Notable changes in positioning include reduced exposure to the marine subindustry and a higher allocation to airlines.
The views expressed above reflect those of the portfolio manager(s) only through the end of the period as stated on the cover of this report and do not necessarily represent the views of Fidelity or any other person in the Fidelity organization. Any such views are subject to change at any time based upon market or other conditions and Fidelity disclaims any responsibility to update such views. These views may not be relied on as investment advice and, because investment decisions for a Fidelity fund are based on numerous factors, may not be relied on as an indication of trading intent on behalf of any Fidelity fund.
Transportation Portfolio
Top Holdings (% of Fund's net assets) |
| |
| United Parcel Service, Inc. Class B | 16.3 | |
| Union Pacific Corp. | 12.7 | |
| CSX Corp. | 8.2 | |
| Uber Technologies, Inc. | 5.2 | |
| Scorpio Tankers, Inc. | 4.8 | |
| Air Transport Services Group, Inc. | 4.5 | |
| FedEx Corp. | 4.3 | |
| Alaska Air Group, Inc. | 4.3 | |
| Kirby Corp. | 3.8 | |
| Copa Holdings SA Class A | 3.1 | |
| | 67.2 | |
| |
| Industries (% of Fund's net assets) |
| |
| Air Freight & Logistics | 32.2 | |
| Road & Rail | 29.5 | |
| Airlines | 13.6 | |
| Oil, Gas & Consumable Fuels | 11.9 | |
| Internet & Direct Marketing Retail | 5.6 | |
| Marine | 4.5 | |
| Energy Equipment & Services | 1.2 | |
| |
Geographic Diversification (% of Fund's net assets) |
|
* Includes Short-Term investments and Net Other Assets (Liabilities). Percentages are based on country or territory of incorporation and are adjusted for the effect of derivatives, if applicable. |
| |
Transportation Portfolio
Showing Percentage of Net Assets
| Common Stocks - 98.5% |
| | | Shares | Value ($) |
| Air Freight & Logistics - 32.2% | | | |
| Air Freight & Logistics - 32.2% | | | |
| Air Transport Services Group, Inc. (a) | | 1,279,523 | 26,780,416 |
| Atlas Air Worldwide Holdings, Inc. (a) | | 67,800 | 6,834,918 |
| C.H. Robinson Worldwide, Inc. | | 107,396 | 10,735,304 |
| Expeditors International of Washington, Inc. (b) | | 127,538 | 13,335,373 |
| FedEx Corp. | | 123,741 | 25,146,646 |
| Forward Air Corp. | | 44,400 | 4,582,524 |
| GXO Logistics, Inc. (a) | | 21,522 | 1,066,846 |
| Hub Group, Inc. Class A (a) | | 55,649 | 5,104,683 |
| United Parcel Service, Inc. Class B | | 523,441 | 95,522,750 |
| | | | 189,109,460 |
| Airlines - 13.6% | | | |
| Airlines - 13.6% | | | |
| Alaska Air Group, Inc. (a) | | 524,700 | 25,096,401 |
| Allegiant Travel Co. (a) | | 16,200 | 1,661,310 |
| Canada Jetlines Ltd. (a) | | 1,250 | 220 |
| Copa Holdings SA Class A (a)(b) | | 198,700 | 18,349,945 |
| Delta Air Lines, Inc. (a) | | 456,561 | 17,504,549 |
| Frontier Group Holdings, Inc. (a) | | 409,699 | 4,818,060 |
| Spirit Airlines, Inc. | | 72,200 | 1,322,704 |
| Sun Country Airlines Holdings, Inc. (a) | | 432,410 | 8,669,821 |
| United Airlines Holdings, Inc. (a) | | 50,679 | 2,633,281 |
| | | | 80,056,291 |
| Energy Equipment & Services - 1.2% | | | |
| Oil & Gas Drilling - 1.2% | | | |
| Noble Corp. PLC (a) | | 138,100 | 5,757,389 |
| Valaris Ltd. (a) | | 15,000 | 1,008,750 |
| | | | 6,766,139 |
| Internet & Direct Marketing Retail - 5.6% | | | |
| Internet & Direct Marketing Retail - 5.6% | | | |
| Lyft, Inc. (a) | | 272,000 | 2,720,000 |
| Uber Technologies, Inc. (a) | | 914,304 | 30,409,751 |
| | | | 33,129,751 |
| Marine - 4.5% | | | |
| Marine - 4.5% | | | |
| Eagle Bulk Shipping, Inc. (b) | | 20,230 | 1,320,412 |
| Kirby Corp. (a)(b) | | 308,885 | 22,403,429 |
| Matson, Inc. | | 36,795 | 2,447,235 |
| | | | 26,171,076 |
| Oil, Gas & Consumable Fuels - 11.9% | | | |
| Oil & Gas Exploration & Production - 0.3% | | | |
| Canadian Natural Resources Ltd. | | 33,000 | 1,864,830 |
| Oil & Gas Storage & Transport - 11.6% | | | |
| Ardmore Shipping Corp. | | 119,700 | 2,172,555 |
| Cool Co. Ltd. | | 218,860 | 2,835,856 |
| DHT Holdings, Inc. | | 380,000 | 4,396,600 |
| Frontline PLC (NY Shares) | | 492,000 | 9,288,960 |
| Hafnia Ltd. | | 1,950,447 | 11,832,501 |
| International Seaways, Inc. | | 178,800 | 9,197,472 |
| Scorpio Tankers, Inc. | | 468,600 | 28,284,696 |
| | | | 68,008,640 |
TOTAL OIL, GAS & CONSUMABLE FUELS | | | 69,873,470 |
| Road & Rail - 29.5% | | | |
| Railroads - 23.0% | | | |
| CSX Corp. | | 1,578,501 | 48,128,495 |
| Norfolk Southern Corp. | | 53,336 | 11,991,000 |
| Union Pacific Corp. | | 360,137 | 74,649,197 |
| | | | 134,768,692 |
| Trucking - 6.5% | | | |
| ArcBest Corp. | | 30,800 | 2,962,960 |
| Hertz Global Holdings, Inc. (a) | | 81,700 | 1,512,267 |
| J.B. Hunt Transport Services, Inc. | | 3,361 | 607,635 |
| Knight-Swift Transportation Holdings, Inc. Class A | | 118,000 | 6,707,120 |
| RXO, Inc. (a) | | 64,622 | 1,329,275 |
| Ryder System, Inc. | | 77,007 | 7,539,755 |
| Saia, Inc. (a)(b) | | 10,374 | 2,810,005 |
| TFI International, Inc. | | 37,577 | 4,585,897 |
| TFI International, Inc. (Canada) | | 27,700 | 3,380,232 |
| U-Haul Holding Co. (non-vtg.) | | 102,821 | 5,719,932 |
| Werner Enterprises, Inc. | | 23,783 | 1,104,720 |
| | | | 38,259,798 |
TOTAL ROAD & RAIL | | | 173,028,490 |
| TOTAL COMMON STOCKS (Cost $406,686,070) | | | 578,134,677 |
| | | | |
| Money Market Funds - 5.0% |
| | | Shares | Value ($) |
| Fidelity Cash Central Fund 4.63% (c) | | 7,754,056 | 7,755,607 |
| Fidelity Securities Lending Cash Central Fund 4.63% (c)(d) | | 21,903,985 | 21,906,175 |
| TOTAL MONEY MARKET FUNDS (Cost $29,661,782) | | | 29,661,782 |
| | | | |
| TOTAL INVESTMENT IN SECURITIES - 103.5% (Cost $436,347,852) | 607,796,459 |
NET OTHER ASSETS (LIABILITIES) - (3.5)% | (20,689,437) |
| NET ASSETS - 100.0% | 587,107,022 |
| | |
Legend
| (b) | Security or a portion of the security is on loan at period end. |
| (c) | Affiliated fund that is generally available only to investment companies and other accounts managed by Fidelity Investments. The rate quoted is the annualized seven-day yield of the fund at period end. A complete unaudited listing of the fund's holdings as of its most recent quarter end is available upon request. In addition, each Fidelity Central Fund's financial statements, which are not covered by the Fund's Report of Independent Registered Public Accounting Firm, are available on the SEC's website or upon request. |
| (d) | Investment made with cash collateral received from securities on loan. |
Affiliated Central Funds
Fiscal year to date information regarding the Fund's investments in Fidelity Central Funds, including the ownership percentage, is presented below.
| Affiliate | Value, beginning of period ($) | Purchases ($) | Sales Proceeds ($) | Dividend Income ($) | Realized Gain (loss) ($) | Change in Unrealized appreciation (depreciation) ($) | Value, end of period ($) | % ownership, end of period |
| Fidelity Cash Central Fund 4.63% | 10,409,172 | 142,116,426 | 144,769,991 | 252,434 | - | - | 7,755,607 | 0.0% |
| Fidelity Securities Lending Cash Central Fund 4.63% | 71,035,353 | 367,895,168 | 417,024,346 | 40,575 | - | - | 21,906,175 | 0.1% |
| Total | 81,444,525 | 510,011,594 | 561,794,337 | 293,009 | - | - | 29,661,782 | |
| | | | | | | | | |
Amounts in the dividend income column in the above table include any capital gain distributions from underlying funds, which are presented in the corresponding line item in the Statement of Operations, if applicable.
Amount for Fidelity Securities Lending Cash Central Fund represents the income earned on investing cash collateral, less rebates paid to borrowers and any lending agent fees associated with the loan, plus any premium payments received for lending certain types of securities.
Amounts included in the purchases and sales proceeds columns may include in-kind transactions, if applicable.
Investment Valuation
The following is a summary of the inputs used, as of February 28, 2023, involving the Fund's assets and liabilities carried at fair value. The inputs or methodology used for valuing securities may not be an indication of the risk associated with investing in those securities. For more information on valuation inputs, and their aggregation into the levels used below, please refer to the Investment Valuation section in the accompanying Notes to Financial Statements.
| Valuation Inputs at Reporting Date: |
| Description | Total ($) | Level 1 ($) | Level 2 ($) | Level 3 ($) |
Investments in Securities: | | | | |
|
| Common Stocks | 578,134,677 | 578,134,677 | - | - |
|
| Money Market Funds | 29,661,782 | 29,661,782 | - | - |
| Total Investments in Securities: | 607,796,459 | 607,796,459 | - | - |
Transportation Portfolio
| Statement of Assets and Liabilities |
| | | | February 28, 2023 |
| | | | | |
| Assets | | | | |
| Investment in securities, at value (including securities loaned of $21,662,832) - See accompanying schedule: | | | | |
Unaffiliated issuers (cost $406,686,070) | $ | 578,134,677 | | |
Fidelity Central Funds (cost $29,661,782) | | 29,661,782 | | |
| | | | | |
| | | | | |
| Total Investment in Securities (cost $436,347,852) | | | $ | 607,796,459 |
| Receivable for fund shares sold | | | | 226,439 |
| Dividends receivable | | | | 1,607,011 |
| Distributions receivable from Fidelity Central Funds | | | | 38,288 |
| Prepaid expenses | | | | 1,731 |
Total assets | | | | 609,669,928 |
| Liabilities | | | | |
| Payable for fund shares redeemed | $ | 253,535 | | |
| Accrued management fee | | 261,929 | | |
| Other affiliated payables | | 107,248 | | |
| Other payables and accrued expenses | | 34,019 | | |
| Collateral on securities loaned | | 21,906,175 | | |
| Total Liabilities | | | | 22,562,906 |
| Net Assets | | | $ | 587,107,022 |
| Net Assets consist of: | | | | |
| Paid in capital | | | $ | 416,733,559 |
| Total accumulated earnings (loss) | | | | 170,373,463 |
| Net Assets | | | $ | 587,107,022 |
Net Asset Value , offering price and redemption price per share ($587,107,022 ÷ 6,052,593 shares) | | | $ | 97.00 |
| Statement of Operations |
| | | | Year ended February 28, 2023 |
| Investment Income | | | | |
| Dividends | | | $ | 12,087,166 |
| Income from Fidelity Central Funds (including $40,575 from security lending) | | | | 293,009 |
| Total Income | | | | 12,380,175 |
| Expenses | | | | |
| Management fee | $ | 3,193,686 | | |
| Transfer agent fees | | 1,140,822 | | |
| Accounting fees | | 208,257 | | |
| Custodian fees and expenses | | 8,708 | | |
| Independent trustees' fees and expenses | | 2,080 | | |
| Registration fees | | 35,819 | | |
| Audit | | 48,008 | | |
| Legal | | 1,699 | | |
| Interest | | 670 | | |
| Miscellaneous | | 514 | | |
| Total expenses before reductions | | 4,640,263 | | |
| Expense reductions | | (21,756) | | |
| Total expenses after reductions | | | | 4,618,507 |
| Net Investment income (loss) | | | | 7,761,668 |
| Realized and Unrealized Gain (Loss) | | | | |
| Net realized gain (loss) on: | | | | |
| Investment Securities: | | | | |
| Unaffiliated issuers | | 28,252,642 | | |
| Foreign currency transactions | | (12,300) | | |
| Total net realized gain (loss) | | | | 28,240,342 |
| Change in net unrealized appreciation (depreciation) on: | | | | |
| Investment Securities: | | | | |
| Unaffiliated issuers | | (46,772,094) | | |
| Assets and liabilities in foreign currencies | | (156) | | |
| Total change in net unrealized appreciation (depreciation) | | | | (46,772,250) |
| Net gain (loss) | | | | (18,531,908) |
| Net increase (decrease) in net assets resulting from operations | | | $ | (10,770,240) |
| Statement of Changes in Net Assets |
| |
| | Year ended February 28, 2023 | | Year ended February 28, 2022 |
| Increase (Decrease) in Net Assets | | | | |
| Operations | | | | |
| Net investment income (loss) | $ | 7,761,668 | $ | 2,903,332 |
| Net realized gain (loss) | | 28,240,342 | | 53,873,633 |
| Change in net unrealized appreciation (depreciation) | | (46,772,250) | | 9,800,484 |
| Net increase (decrease) in net assets resulting from operations | | (10,770,240) | | 66,577,449 |
| Distributions to shareholders | | (48,641,050) | | (47,428,580) |
| Share transactions | | | | |
| Proceeds from sales of shares | | 81,246,776 | | 148,678,513 |
| Net asset value of shares issued in exchange for the net assets of the Target Fund(s) (see Merger Information note) | | - | | 322,796,887 |
| Reinvestment of distributions | | 46,145,200 | | 44,843,850 |
| Cost of shares redeemed | | (160,176,373) | | (191,945,005) |
Net increase (decrease) in net assets resulting from share transactions | | (32,784,397) | | 324,374,245 |
| Total increase (decrease) in net assets | | (92,195,687) | | 343,523,114 |
| | | | | |
| Net Assets | | | | |
| Beginning of period | | 679,302,709 | | 335,779,595 |
| End of period | $ | 587,107,022 | $ | 679,302,709 |
| | | | | |
| Other Information | | | | |
| Shares | | | | |
| Sold | | 813,431 | | 1,386,810 |
| Issued in exchange for the shares of the Target Fund(s) (see Merger Information note) | | - | | 3,028,967 |
| Issued in reinvestment of distributions | | 489,169 | | 421,380 |
| Redeemed | | (1,669,220) | | (1,810,854) |
| Net increase (decrease) | | (366,620) | | 3,026,303 |
| | | | | |
Financial Highlights
| Years ended February 28, | | 2023 | | 2022 | | 2021 | | 2020 A | | 2019 |
Selected Per-Share Data | | | | | | | | | | |
| Net asset value, beginning of period | $ | 105.82 | $ | 98.97 | $ | 82.12 | $ | 95.41 | $ | 99.07 |
| Income from Investment Operations | | | | | | | | | | |
Net investment income (loss) B,C | | 1.24 | | .64 | | 1.06 D | | .93 | | .85 |
| Net realized and unrealized gain (loss) | | (2.12) | | 19.26 | | 23.43 | | (10.43) | | 5.05 |
| Total from investment operations | | (.88) | | 19.90 | | 24.49 | | (9.50) | | 5.90 |
| Distributions from net investment income | | (1.16) | | (1.03) | | (.76) | | (1.10) | | (.78) |
| Distributions from net realized gain | | (6.78) | | (12.03) | | (6.88) | | (2.70) | | (8.78) |
| Total distributions | | (7.94) | | (13.05) E | | (7.64) | | (3.79) E | | (9.56) |
| Net asset value, end of period | $ | 97.00 | $ | 105.82 | $ | 98.97 | $ | 82.12 | $ | 95.41 |
Total Return F | | (.46)% | | 20.35% | | 34.62% | | (10.49)% | | 6.85% |
Ratios to Average Net Assets C,G,H | | | | | | | | | | |
| Expenses before reductions | | .76% | | .77% | | .80% | | .79% | | .79% |
| Expenses net of fee waivers, if any | | .76% | | .77% | | .80% | | .79% | | .79% |
| Expenses net of all reductions | | .76% | | .77% | | .80% | | .79% | | .78% |
| Net investment income (loss) | | 1.28% | | .60% | | 1.29% D | | 1.00% | | .87% |
| Supplemental Data | | | | | | | | | | |
| Net assets, end of period (000 omitted) | $ | 587,107 | $ | 679,303 | $ | 335,780 | $ | 310,441 | $ | 451,192 |
Portfolio turnover rate I | | 23% | | 66% J | | 52% | | 78% | | 58% |
A For the year ended February 29.
B Calculated based on average shares outstanding during the period.
C Net investment income (loss) is affected by the timing of the declaration of dividends by any underlying mutual funds or exchange-traded funds (ETFs). Net investment income (loss) of any mutual funds or ETFs is not included in the Fund's net investment income (loss) ratio.
D Net investment income per share reflects one or more large, non-recurring dividend(s) which amounted to $.34 per share. Excluding such non-recurring dividend(s), the ratio of net investment income (loss) to average net assets would have been .88%.
E Total distributions per share do not sum due to rounding.
F Total returns would have been lower if certain expenses had not been reduced during the applicable periods shown.
G Fees and expenses of any underlying mutual funds or exchange-traded funds (ETFs) are not included in the Fund's expense ratio. The Fund indirectly bears its proportionate share of these expenses. For additional expense information related to investments in Fidelity Central Funds, please refer to the "Investments in Fidelity Central Funds" note found in the Notes to Financial Statements section of the most recent Annual or Semi-Annual report.
H Expense ratios reflect operating expenses of the class. Expenses before reductions do not reflect amounts reimbursed, waived, or reduced through arrangements with the investment adviser, brokerage services, or other offset arrangements, if applicable, and do not represent the amount paid by the class during periods when reimbursements, waivers or reductions occur.
I Amount does not include the portfolio activity of any underlying mutual funds or exchange-traded funds (ETFs).
J The portfolio turnover rate does not include the assets acquired in the merger.
For the period ended February 28, 2023
1. Organization.
Defense and Aerospace Portfolio, Industrials Portfolio and Transportation Portfolio (the Funds) are non-diversified funds of Fidelity Select Portfolios (the Trust). The Trust is registered under the Investment Company Act of 1940, as amended (the 1940 Act), as an open-end management investment company organized as a Massachusetts business trust. The Funds invest primarily in securities of companies whose principal business activities fall within specific industries. Each Fund is authorized to issue an unlimited number of shares. Share transactions on the Statement of Changes in Net Assets may contain exchanges between affiliated funds.
2. Investments in Fidelity Central Funds.
Funds may invest in Fidelity Central Funds, which are open-end investment companies generally available only to other investment companies and accounts managed by the investment adviser and its affiliates. The Schedule of Investments lists any Fidelity Central Funds held as an investment as of period end, but does not include the underlying holdings of each Fidelity Central Fund. An investing fund indirectly bears its proportionate share of the expenses of the underlying Fidelity Central Funds.
Based on its investment objective, each Fidelity Central Fund may invest or participate in various investment vehicles or strategies that are similar to those of the investing fund. These strategies are consistent with the investment objectives of the investing fund and may involve certain economic risks which may cause a decline in value of each of the Fidelity Central Funds and thus a decline in the value of the investing fund.
| Fidelity Central Fund | Investment Manager | Investment Objective | Investment Practices | Expense Ratio A |
| Fidelity Money Market Central Funds | Fidelity Management & Research Company LLC (FMR) | Each fund seeks to obtain a high level of current income consistent with the preservation of capital and liquidity. | Short-term Investments | Less than .005% |
A Expenses expressed as a percentage of average net assets and are as of each underlying Central Fund's most recent annual or semi-annual shareholder report.
A complete unaudited list of holdings for each Fidelity Central Fund is available upon request or at the Securities and Exchange Commission website at www.sec.gov. In addition, the financial statements of the Fidelity Central Funds which contain the significant accounting policies (including investment valuation policies) of those funds, and are not covered by the Report of Independent Registered Public Accounting Firm, are available on the Securities and Exchange Commission website or upon request.
3. Significant Accounting Policies.
Each Fund is an investment company and applies the accounting and reporting guidance of the Financial Accounting Standards Board (FASB) Accounting Standards Codification Topic 946 Financial Services - Investment Companies . The financial statements have been prepared in conformity with accounting principles generally accepted in the United States of America (GAAP), which require management to make certain estimates and assumptions at the date of the financial statements. Actual results could differ from those estimates. Subsequent events, if any, through the date that the financial statements were issued have been evaluated in the preparation of the financial statements. Each Fund's Schedule of Investments lists any underlying mutual funds or exchange-traded funds (ETFs) but does not include the underlying holdings of these funds. The following summarizes the significant accounting policies of each Fund:
Investment Valuation. Investments are valued as of 4:00 p.m. Eastern time on the last calendar day of the period. The Board of Trustees (the Board) has designated each Fund's investment adviser as the valuation designee responsible for the fair valuation function and performing fair value determinations as needed. The investment adviser has established a Fair Value Committee (the Committee) to carry out the day-to-day fair valuation responsibilities and has adopted policies and procedures to govern the fair valuation process and the activities of the Committee. In accordance with these fair valuation policies and procedures, which have been approved by the Board, each Fund attempts to obtain prices from one or more third party pricing services or brokers to value its investments. When current market prices, quotations or currency exchange rates are not readily available or reliable, investments will be fair valued in good faith by the Committee, in accordance with the policies and procedures. Factors used in determining fair value vary by investment type and may include market or investment specific events, transaction data, estimated cash flows, and market observations of comparable investments. The frequency that the fair valuation procedures are used cannot be predicted and they may be utilized to a significant extent. The Committee manages each Fund's fair valuation practices and maintains the fair valuation policies and procedures. Each Fund's investment adviser reports to the Board information regarding the fair valuation process and related material matters.
Each Fund categorizes the inputs to valuation techniques used to value its investments into a disclosure hierarchy consisting of three levels as shown below:
Level 1 - unadjusted quoted prices in active markets for identical investments
Level 2 - other significant observable inputs (including quoted prices for similar investments, interest rates, prepayment speeds, etc.)
Level 3 - unobservable inputs (including the Fund's own assumptions based on the best information available)
Valuation techniques used to value each Fund's investments by major category are as follows:
Equity securities, including restricted securities, for which market quotations are readily available, are valued at the last reported sale price or official closing price as reported by a third party pricing service on the primary market or exchange on which they are traded and are categorized as Level 1 in the hierarchy. In the event there were no sales during the day or closing prices are not available, securities are valued at the last quoted bid price or may be valued using the last available price and are generally categorized as Level 2 in the hierarchy. For foreign equity securities, when market or security specific events arise, comparisons to the valuation of American Depositary Receipts (ADRs), futures contracts, ETFs and certain indexes as well as quoted prices for similar securities may be used and would be categorized as Level 2 in the hierarchy. For equity securities, including restricted securities, where observable inputs are limited, assumptions about market activity and risk are used and these securities may be categorized as Level 3 in the hierarchy.
Investments in open-end mutual funds, including the Fidelity Central Funds, are valued at their closing net asset value (NAV) each business day and are categorized as Level 1 in the hierarchy.
Changes in valuation techniques may result in transfers in or out of an assigned level within the disclosure hierarchy. The aggregate value of investments by input level as of February 28, 2023, is included at the end of each Fund's Schedule of Investments.
Foreign Currency. Certain Funds may use foreign currency contracts to facilitate transactions in foreign-denominated securities. Gains and losses from these transactions may arise from changes in the value of the foreign currency or if the counterparties do not perform under the contracts' terms.
Foreign-denominated assets, including investment securities, and liabilities are translated into U.S. dollars at the exchange rates at period end. Purchases and sales of investment securities, income and dividends received, and expenses denominated in foreign currencies are translated into U.S. dollars at the exchange rate in effect on the transaction date.
The effects of exchange rate fluctuations on investments are included with the net realized and unrealized gain (loss) on investment securities. Other foreign currency transactions resulting in realized and unrealized gain (loss) are disclosed separately.
Investment Transactions and Income. For financial reporting purposes, the Funds' investment holdings and NAV include trades executed through the end of the last business day of the period. The NAV per share for processing shareholder transactions is calculated as of the close of business of the New York Stock Exchange (NYSE), normally 4:00 p.m. Eastern time and includes trades executed through the end of the prior business day. Gains and losses on securities sold are determined on the basis of identified cost and for certain Funds include proceeds received from litigation. Commissions paid to certain brokers with whom the investment adviser, or its affiliates, places trades on behalf of a fund include an amount in addition to trade execution, which may be rebated back to a fund. Any such rebates are included in net realized gain (loss) on investments in the Statement of Operations. Dividend income is recorded on the ex-dividend date, except for certain dividends from foreign securities where the ex-dividend date may have passed, which are recorded as soon as the Funds are informed of the ex-dividend date. Non-cash dividends included in dividend income, if any, are recorded at the fair market value of the securities received. Income and capital gain distributions from Fidelity Central Funds, if any, are recorded on the ex-dividend date. Certain distributions received by the Funds represent a return of capital or capital gain. The Funds determine the components of these distributions subsequent to the ex-dividend date, based upon receipt of tax filings or other correspondence relating to the underlying investment. These distributions are recorded as a reduction of cost of investments and/or as a realized gain. Large, non-recurring dividends recognized by the Funds are presented separately on the Statement of Operations as "Special Dividends" and the impact of these dividends is presented in the Financial Highlights. Investment income is recorded net of foreign taxes withheld where recovery of such taxes is uncertain. Funds may file withholding tax reclaims in certain jurisdictions to recover a portion of amounts previously withheld. Any withholding tax reclaims income is included in the Statement of Operations in dividends. Any receivables for withholding tax reclaims are included in the Statement of Assets and Liabilities in dividends receivable.
Expenses. Expenses directly attributable to a fund are charged to that fund. Expenses attributable to more than one fund are allocated among the respective funds on the basis of relative net assets or other appropriate methods. Expenses included in the accompanying financial statements reflect the expenses of that fund and do not include any expenses associated with any underlying mutual funds or exchange-traded funds. Although not included in a fund's expenses, a fund indirectly bears its proportionate share of these expenses through the net asset value of each underlying mutual fund or exchange-traded fund. Expense estimates are accrued in the period to which they relate and adjustments are made when actual amounts are known.
Deferred Trustee Compensation. Under a Deferred Compensation Plan (the Plan) for certain Funds, certain independent Trustees have elected to defer receipt of a portion of their annual compensation. Deferred amounts are invested in affiliated mutual funds, are marked-to-market and remain in a fund until distributed in accordance with the Plan. The investment of deferred amounts and the offsetting payable to the Trustees presented below are included in the accompanying Statement of Assets and Liabilities in other receivables and other payables and accrued expenses, as applicable.
| Defense and Aerospace Portfolio | $112,362 |
| Industrials Portfolio | 105,971 |
Income Tax Information and Distributions to Shareholders. Each year, each Fund intends to qualify as a regulated investment company under Subchapter M of the Internal Revenue Code, including distributing substantially all of its taxable income and realized gains. As a result, no provision for U.S. Federal income taxes is required. As of February 28, 2023, each Fund did not have any unrecognized tax benefits in the financial statements; nor is each Fund aware of any tax positions for which it is reasonably possible that the total amounts of unrecognized tax benefits will significantly change in the next twelve months. Each Fund files a U.S. federal tax return, in addition to state and local tax returns as required. Each Fund's federal income tax returns are subject to examination by the Internal Revenue Service (IRS) for a period of three fiscal years after they are filed. State and local tax returns may be subject to examination for an additional fiscal year depending on the jurisdiction. Foreign taxes are provided for based on each Fund's understanding of the tax rules and rates that exist in the foreign markets in which it invests.
Distributions are declared and recorded on the ex-dividend date. Income and capital gain distributions are determined in accordance with income tax regulations, which may differ from GAAP. In addition, the Funds claimed a portion of the payment made to redeeming shareholders as a distribution for income tax purposes.
Capital accounts within the financial statements are adjusted for permanent book-tax differences. These adjustments have no impact on net assets or the results of operations. Capital accounts are not adjusted for temporary book-tax differences which will reverse in a subsequent period.
Book-tax differences are primarily due to foreign currency transactions, passive foreign investment companies (PFIC), deferred Trustee compensation, and losses deferred due to wash sales and excise tax regulations.
As of period end, the cost and unrealized appreciation (depreciation) in securities, and derivatives if applicable, for federal income tax purposes were as follows for each Fund:
| | Tax cost | Gross unrealized appreciation | Gross unrealized depreciation | Net unrealized appreciation (depreciation) |
| Defense and Aerospace Portfolio | $1,094,818,344 | $505,132,320 | $(27,307,008) | $477,825,312 |
| Industrials Portfolio | 400,076,088 | 65,680,712 | (6,180,391) | 59,500,321 |
| Transportation Portfolio | 440,112,118 | 205,561,824 | (37,877,483) | 167,684,341 |
The tax-based components of distributable earnings as of period end were as follows for each Fund:
| | Undistributed tax-exempt income | Undistributed ordinary income | Undistributed long-term capital gain | Capital loss carryforward | Net unrealized appreciation (depreciation) on securities and other investments |
| Defense and Aerospace Portfolio | $- | $2,207,681 | $10,349,148 | $- | $ 477,825,312 |
| Industrials Portfolio | - | 1,143 | 3,725,343 | - | 59,500,262 |
| Transportation Portfolio | - | 2,118,786 | 570,443 | - | 167,684,234 |
The tax character of distributions paid was as follows:
| February 28, 2023 | | | |
| | Ordinary Income | Long-term Capital Gains | Total |
| Defense and Aerospace Portfolio | $6,194,533 | $125,091,433 | $131,285,966 |
| Industrials Portfolio | 1,806,461 | 11,429,202 | 13,235,663 |
| Transportation Portfolio | 12,102,302 | 36,538,748 | 48,641,050 |
| February 28, 2022 | | | |
| | Ordinary Income | Long-term Capital Gains | Total |
| Defense and Aerospace Portfolio | $- | $114,456,735 | $114,456,735 |
| Industrials Portfolio | 26,589,200 | 88,835,216 | 115,424,416 |
| Transportation Portfolio | 8,956,782 | 38,471,798 | 47,428,580 |
4. Purchases and Sales of Investments.
Purchases and sales of securities, other than short-term securities and in-kind transactions, as applicable, are noted in the table below.
| | Purchases ($) | Sales ($) |
| Defense and Aerospace Portfolio | 249,295,898 | 213,166,353 |
| Industrials Portfolio | 536,497,256 | 451,250,507 |
| Transportation Portfolio | 139,763,617 | 217,369,687 |
5. Fees and Other Transactions with Affiliates.
Management Fee. Fidelity Management & Research Company LLC (the investment adviser) and its affiliates provide the Funds with investment management related services for which the Funds pay a monthly management fee. The management fee is the sum of an individual fund fee rate and an annualized group fee rate. The individual fund fee rate is applied to each Fund's average net assets. The group fee rate is based upon the monthly average net assets of a group of registered investment companies with which the investment adviser has management contracts. The group fee rate decreases as assets under management increase and increases as assets under management decrease. For the reporting period, each Fund's annual management fee rate expressed as a percentage of each Fund's average net assets was as follows:
| | Individual Rate | Group Rate | Total |
| Defense and Aerospace Portfolio | .30% | .23% | .53% |
| Industrials Portfolio | .30% | .23% | .53% |
| Transportation Portfolio | .30% | .23% | .53% |
Transfer Agent Fees. Fidelity Investments Institutional Operations Company LLC (FIIOC), an affiliate of the investment adviser, is the Funds' transfer, dividend disbursing and shareholder servicing agent. FIIOC receives account fees and asset-based fees that vary according to account size and type of account. FIIOC pays for typesetting, printing and mailing of shareholder reports, except proxy statements. For the period, transfer agent fees were equivalent to the following annual rates expressed as a percentage of average net assets:
| Defense and Aerospace Portfolio | .18% |
| Industrials Portfolio | .17% |
| Transportation Portfolio | .19% |
Accounting Fees. Fidelity Service Company, Inc. (FSC), an affiliate of the investment adviser, maintains each Fund's accounting records. The accounting fee is based on the level of average net assets for each month. For the period, the fees were equivalent to the following annual rates:
| | % of Average Net Assets |
| Defense and Aerospace Portfolio | .03 |
| Industrials Portfolio | .04 |
| Transportation Portfolio | .03 |
Brokerage Commissions. A portion of portfolio transactions were placed with brokerage firms which are affiliates of the investment adviser. Brokerage commissions are included in net
realized gain (loss) and change in net unrealized appreciation (depreciation) in the Statement of Operations. The commissions paid to these affiliated firms were as follows:
| | Amount |
| Defense and Aerospace Portfolio | $3,038 |
| Industrials Portfolio | 8,326 |
| Transportation Portfolio | 4,059 |
Interfund Lending Program. Pursuant to an Exemptive Order issued by the Securities and Exchange Commission (the SEC), each Fund, along with other registered investment companies having management contracts with Fidelity Management & Research Company LLC (FMR), or other affiliated entities of FMR, may participate in an interfund lending program. This program provides an alternative credit facility allowing each Fund to borrow from, or lend money to, other participating affiliated funds. At period end, there were no interfund loans outstanding. Activity in this program during the period for which loans were outstanding was as follows:
| | Borrower or Lender | Average Loan Balance | Weighted Average Interest Rate | Interest Expense |
| Industrials Portfolio | Borrower | $4,029,000 | 4.58% | $1,537 |
| Transportation Portfolio | Borrower | $7,277,000 | 3.32% | $670 |
Interfund Trades. Funds may purchase from or sell securities to other Fidelity Funds under procedures adopted by the Board. The procedures have been designed to ensure these interfund trades are executed in accordance with Rule 17a-7 of the 1940 Act. Any interfund trades are included within the respective purchases and sales amounts shown in the Purchases and Sales of Investments note. Interfund trades during the period are noted in the table below.
| | Purchases ($) | Sales ($) | Realized Gain (Loss) ($) |
| Defense and Aerospace Portfolio | 13,651,830 | 13,902,776 | 1,401,133 |
| Industrials Portfolio | 10,961,464 | 13,973,650 | 543,241 |
| Transportation Portfolio | 5,578,387 | 7,973,622 | (795,661) |
6. Committed Line of Credit.
Certain Funds participate with other funds managed by the investment adviser or an affiliate in a $4.25 billion credit facility (the "line of credit") to be utilized for temporary or emergency purposes to fund shareholder redemptions or for other short-term liquidity purposes. The participating funds have agreed to pay commitment fees on their pro-rata portion of the line of credit, which are reflected in Miscellaneous expenses on the Statement of Operations, and are listed below. During the period, there were no borrowings on this line of credit.
| | Amount |
| Defense and Aerospace Portfolio | $2,528 |
| Industrials Portfolio | 610 |
| Transportation Portfolio | 1,106 |
7. Security Lending.
Funds lend portfolio securities from time to time in order to earn additional income. Lending agents are used, including National Financial Services (NFS), an affiliate of the investment adviser. Pursuant to a securities lending agreement, NFS will receive a fee, which is capped at 9.9% of a fund's daily lending revenue, for its services as lending agent. A fund may lend securities to certain qualified borrowers, including NFS. On the settlement date of the loan, a fund receives collateral (in the form of U.S. Treasury obligations, letters of credit and/or cash) against the loaned securities and maintains collateral in an amount not less than 100% of the market value of the loaned securities during the period of the loan. The market value of the loaned securities is determined at the close of business of a fund and any additional required collateral is delivered to a fund on the next business day. A fund or borrower may terminate the loan at any time, and if the borrower defaults on its obligation to return the securities loaned because of insolvency or other reasons, a fund may apply collateral received from the borrower against the obligation. A fund may experience delays and costs in recovering the securities loaned. Any cash collateral received is invested in the Fidelity Securities Lending Cash Central Fund. Any loaned securities are identified as such in the Schedule of Investments, and the value of loaned securities and cash collateral at period end, as applicable, are presented in the Statement of Assets and Liabilities. Security lending income represents the income earned on investing cash collateral, less rebates paid to borrowers and any lending agent fees associated with the loan, plus any premium payments received for lending certain types of securities. Security lending income is presented in the Statement of Operations as a component of income from Fidelity Central Funds. Affiliated security lending activity, if any, was as follows:
| | Total Security Lending Fees Paid to NFS | Security Lending Income From Securities Loaned to NFS | Value of Securities Loaned to NFS at Period End |
| Defense and Aerospace Portfolio | $2,092 | $- | $- |
| Industrials Portfolio | $867 | $1 | $- |
| Transportation Portfolio | $4,038 | $2,497 | $- |
8. Expense Reductions.
Through arrangements with each applicable Fund's custodian, credits realized as a result of certain uninvested cash balances were used to reduce each applicable Fund's expenses. All of the applicable expense reductions are noted in the table below.
| | Custodian credits |
| Defense and Aerospace Portfolio | $108 |
| Industrials Portfolio | 957 |
| Transportation Portfolio | 188 |
In addition, during the period the investment adviser or an affiliate reimbursed and/or waived a portion of operating expenses as follows:
| | Amount |
| Defense and Aerospace Portfolio | $50,235 |
| Industrials Portfolio | 12,374 |
| Transportation Portfolio | 21,568 |
9. Other.
A fund's organizational documents provide former and current trustees and officers with a limited indemnification against liabilities arising in connection with the performance of their duties to the fund. In the normal course of business, a fund may also enter into contracts that provide general indemnifications. A fund's maximum exposure under these arrangements is unknown as this would be dependent on future claims that may be made against a fund. The risk of material loss from such claims is considered remote.
10. Risk and Uncertainties.
Many factors affect a fund's performance. Developments that disrupt global economies and financial markets, such as pandemics, epidemics, outbreaks of infectious diseases, war, terrorism, and environmental disasters, may significantly affect a fund's investment performance. The effects of these developments to a fund will be impacted by the types of securities in which a fund invests, the financial condition, industry, economic sector, and geographic location of an issuer, and a fund's level of investment in the securities of that issuer. Significant concentrations in security types, issuers, industries, sectors, and geographic locations may magnify the factors that affect a fund's performance.
11 . Prior Fiscal Year Merger Information.
On November 12, 2021, Transportation Portfolio acquired all of the assets and assumed all of the liabilities of Air Transportation Portfolio ("Target Fund") pursuant to an Agreement and Plan of Reorganization approved by the Board of Trustees ("The Board"). The securities held by the Target Fund were the primary assets acquired by the Fund. The acquisition was accomplished by an exchange of shares of the Fund for shares then outstanding of the Target Fund at its respective net asset value on the acquisition date. The reorganization provides shareholders of the Target Fund access to a larger portfolio with a similar investment objective and lower projected expenses. For financial reporting purposes, the assets and liabilities of the Target Fund and shares issued by the Fund were recorded at fair value; however, the cost basis of the investments received from the Target Fund were carried forward and will be utilized for purposes of the Fund's ongoing reporting of realized and unrealized gains and losses to more closely align subsequent reporting of realized gains with amounts distributable to shareholders for tax purposes. The reorganization qualified as a tax-free reorganization for federal income tax purposes with no gain or loss recognized to the funds or their shareholders.
| Target Fund | Investments $ | Unrealized appreciation (depreciation) $ | Net Assets $ | Shares Exchanged | Shares Exchanged Ratio |
| Air Transportation Portfolio | 320,705,550 | 47,927,461 | 322,796,887 | 3,028,967 | .5404138125 |
| Surviving Fund | Net Assets $ | Total net assets after the acquisition $ |
| Transportation Portfolio | 411,872,847 | 734,669,734 |
Pro forma results of operations of the combined entity for the entire period ended February 28, 2022, as though the acquisition had occurred as of the beginning of the year (rather than on the actual acquisition date), are as follows:
| Net investment income (loss) | $2,600,527 |
| Total net realized gain (loss) | 134,920,339 |
| Total change in net unrealized appreciation (depreciation) | (53,851,879) |
| Net increase (decrease) in net assets resulting from operations | $83,668,987 |
Because the combined investment portfolios have been managed as a single portfolio since the acquisition was completed, it is not practicable to separate the amounts of revenue and earnings of the acquired fund that have been included in the Transportation Portfolio's Statement of Operations since November 12, 2021.
To the Board of Trustees of Fidelity Select Portfolios and Shareholders of Defense and Aerospace Portfolio, Industrials Portfolio and Transportation Portfolio
Opinions on the Financial Statements
We have audited the accompanying statements of assets and liabilities, including the schedules of investments, of Defense and Aerospace Portfolio, Industrials Portfolio and Transportation Portfolio (three of the funds constituting Fidelity Select Portfolios, hereafter collectively referred to as the "Funds") as of February 28, 2023, the related statements of operations for the year ended February 28, 2023, the statements of changes in net assets for each of the two years in the period ended February 28, 2023, including the related notes, and the financial highlights for each of the five years in the period ended February 28, 2023 (collectively referred to as the "financial statements"). In our opinion, the financial statements present fairly, in all material respects, the financial position of each of the Funds as of February 28, 2023, the results of each of their operations for the year then ended, the changes in each of their net assets for each of the two years in the period ended February 28, 2023 and each of the financial highlights for each of the five years in the period ended February 28, 2023 in conformity with accounting principles generally accepted in the United States of America.
Basis for Opinions
These financial statements are the responsibility of the Funds' management. Our responsibility is to express an opinion on the Funds' financial statements based on our audits. We are a public accounting firm registered with the Public Company Accounting Oversight Board (United States) (PCAOB) and are required to be independent with respect to the Funds in accordance with the U.S. federal securities laws and the applicable rules and regulations of the Securities and Exchange Commission and the PCAOB.
We conducted our audits of these financial statements in accordance with the standards of the PCAOB. Those standards require that we plan and perform the audit to obtain reasonable assurance about whether the financial statements are free of material misstatement, whether due to error or fraud.
Our audits included performing procedures to assess the risks of material misstatement of the financial statements, whether due to error or fraud, and performing procedures that respond to those risks. Such procedures included examining, on a test basis, evidence regarding the amounts and disclosures in the financial statements. Our audits also included evaluating the accounting principles used and significant estimates made by management, as well as evaluating the overall presentation of the financial statements. Our procedures included confirmation of securities owned as of February 28, 2023 by correspondence with the custodians and brokers; when replies were not received from brokers, we performed other auditing procedures. We believe that our audits provide a reasonable basis for our opinions.
/s/ PricewaterhouseCoopers LLP
Boston, Massachusetts
April 13, 2023
We have served as the auditor of one or more investment companies in the Fidelity group of funds since 1932.
The Trustees, Members of the Advisory Board (if any), and officers of the trust and funds, as applicable, are listed below. The Board of Trustees governs each fund and is responsible for protecting the interests of shareholders. The Trustees are experienced executives who meet periodically throughout the year to oversee each fund's activities, review contractual arrangements with companies that provide services to each fund, oversee management of the risks associated with such activities and contractual arrangements, and review each fund's performance. Each of the Trustees oversees 318 funds.
The Trustees hold office without limit in time except that (a) any Trustee may resign; (b) any Trustee may be removed by written instrument, signed by at least two-thirds of the number of Trustees prior to such removal; (c) any Trustee who requests to be retired or who has become incapacitated by illness or injury may be retired by written instrument signed by a majority of the other Trustees; and (d) any Trustee may be removed at any special meeting of shareholders by a two-thirds vote of the outstanding voting securities of the trust. Each Trustee who is not an interested person (as defined in the 1940 Act) of the trust and the funds is referred to herein as an Independent Trustee. Each Independent Trustee shall retire not later than the last day of the calendar year in which his or her 75th birthday occurs. The Independent Trustees may waive this mandatory retirement age policy with respect to individual Trustees. Officers and Advisory Board Members hold office without limit in time, except that any officer or Advisory Board Member may resign or may be removed by a vote of a majority of the Trustees at any regular meeting or any special meeting of the Trustees. Except as indicated, each individual has held the office shown or other offices in the same company for the past five years.
The funds' Statement of Additional Information (SAI) includes more information about the Trustees. To request a free copy, call Fidelity at 1-800-544-8544.
Experience, Skills, Attributes, and Qualifications of the Trustees. The Governance and Nominating Committee has adopted a statement of policy that describes the experience, qualifications, attributes, and skills that are necessary and desirable for potential Independent Trustee candidates (Statement of Policy). The Board believes that each Trustee satisfied at the time he or she was initially elected or appointed a Trustee, and continues to satisfy, the standards contemplated by the Statement of Policy. The Governance and Nominating Committee also engages professional search firms to help identify potential Independent Trustee candidates who have the experience, qualifications, attributes, and skills consistent with the Statement of Policy. From time to time, additional criteria based on the composition and skills of the current Independent Trustees, as well as experience or skills that may be appropriate in light of future changes to board composition, business conditions, and regulatory or other developments, have also been considered by the professional search firms and the Governance and Nominating Committee. In addition, the Board takes into account the Trustees' commitment and participation in Board and committee meetings, as well as their leadership of standing and ad hoc committees throughout their tenure.
In determining that a particular Trustee was and continues to be qualified to serve as a Trustee, the Board has considered a variety of criteria, none of which, in isolation, was controlling. The Board believes that, collectively, the Trustees have balanced and diverse experience, qualifications, attributes, and skills, which allow the Board to operate effectively in governing each fund and protecting the interests of shareholders. Information about the specific experience, skills, attributes, and qualifications of each Trustee, which in each case led to the Board's conclusion that the Trustee should serve (or continue to serve) as a trustee of the funds, is provided below.
Board Structure and Oversight Function. Robert A. Lawrence is an interested person and currently serves as Chair. The Trustees have determined that an interested Chair is appropriate and benefits shareholders because an interested Chair has a personal and professional stake in the quality and continuity of services provided to the funds. Independent Trustees exercise their informed business judgment to appoint an individual of their choosing to serve as Chair, regardless of whether the Trustee happens to be independent or a member of management. The Independent Trustees have determined that they can act independently and effectively without having an Independent Trustee serve as Chair and that a key structural component for assuring that they are in a position to do so is for the Independent Trustees to constitute a substantial majority for the Board. The Independent Trustees also regularly meet in executive session. David M. Thomas serves as Lead Independent Trustee and as such (i) acts as a liaison between the Independent Trustees and management with respect to matters important to the Independent Trustees and (ii) with management prepares agendas for Board meetings.
Fidelity ® funds are overseen by different Boards of Trustees. The funds' Board oversees Fidelity's high income and certain equity funds, and other Boards oversee Fidelity's alternative investment, investment-grade bond, money market, asset allocation, and other equity funds. The asset allocation funds may invest in Fidelity ® funds overseen by the funds' Board. The use of separate Boards, each with its own committee structure, allows the Trustees of each group of Fidelity ® funds to focus on the unique issues of the funds they oversee, including common research, investment, and operational issues. On occasion, the separate Boards establish joint committees to address issues of overlapping consequences for the Fidelity ® funds overseen by each Board.
The Trustees operate using a system of committees to facilitate the timely and efficient consideration of all matters of importance to the Trustees, each fund, and fund shareholders and to facilitate compliance with legal and regulatory requirements and oversight of the funds' activities and associated risks. The Board, acting through its committees, has charged FMR and its affiliates with (i) identifying events or circumstances the occurrence of which could have demonstrably adverse effects on the funds' business and/or reputation; (ii) implementing processes and controls to lessen the possibility that such events or circumstances occur or to mitigate the effects of such events or circumstances if they do occur; and (iii) creating and maintaining a system designed to evaluate continuously business and market conditions in order to facilitate the identification and implementation processes described in (i) and (ii) above. Because the day-to-day operations and activities of the funds are carried out by or through FMR, its affiliates, and other service providers, the funds' exposure to risks is mitigated but not eliminated by the processes overseen by the Trustees. While each of the Board's committees has responsibility for overseeing different aspects of the funds' activities, oversight is exercised primarily through the Operations, Audit, and Compliance Committees. Appropriate personnel, including but not limited to the funds' Chief Compliance Officer (CCO), FMR's internal auditor, the independent accountants, the funds' Treasurer and portfolio management personnel, make periodic reports to the Board's committees, as appropriate, including an annual review of Fidelity's risk management program for the Fidelity ® funds. The responsibilities of each standing committee, including their oversight responsibilities, are described further under "Standing Committees of the Trustees."
Interested Trustees*:
Correspondence intended for a Trustee who is an interested person may be sent to Fidelity Investments, 245 Summer Street, Boston, Massachusetts 02210.
Name, Year of Birth; Principal Occupations and Other Relevant Experience+
Bettina Doulton (1964)
Year of Election or Appointment: 2020
Trustee
Ms. Doulton also serves as Trustee of other Fidelity ® funds. Prior to her retirement, Ms. Doulton served in a variety of positions at Fidelity Investments, including as a managing director of research (2006-2007), portfolio manager to certain Fidelity ® funds (1993-2005), equity analyst and portfolio assistant (1990-1993), and research assistant (1987-1990). Ms. Doulton currently owns and operates Phi Builders + Architects and Cellardoor Winery. Previously, Ms. Doulton served as a member of the Board of Brown Capital Management, LLC (2014-2018).
Robert A. Lawrence (1952)
Year of Election or Appointment: 2020
Trustee
Chair of the Board of Trustees
Mr. Lawrence also serves as Trustee of other funds. Previously, Mr. Lawrence served as a Trustee and Member of the Advisory Board of certain funds. Prior to his retirement in 2008, Mr. Lawrence served as Vice President of certain Fidelity ® funds (2006-2008), Senior Vice President, Head of High Income Division of Fidelity Management & Research Company (investment adviser firm, 2006-2008), and President of Fidelity Strategic Investments (investment adviser firm, 2002-2005).
* Determined to be an "Interested Trustee" by virtue of, among other things, his or her affiliation with the trust or various entities under common control with FMR.
+ The information includes the Trustee's principal occupation during the last five years and other information relating to the experience, attributes, and skills relevant to the Trustee's qualifications to serve as a Trustee, which led to the conclusion that the Trustee should serve as a Trustee for each fund.
Independent Trustees:
Correspondence intended for an Independent Trustee may be sent to Fidelity Investments, P.O. Box 55235, Boston, Massachusetts 02205-5235.
Name, Year of Birth; Principal Occupations and Other Relevant Experience+
Thomas P. Bostick (1956)
Year of Election or Appointment: 2021
Trustee
Lieutenant General Bostick also serves as Trustee of other Fidelity ® funds. Prior to his retirement, General Bostick (United States Army, Retired) held a variety of positions within the U.S. Army, including Commanding General and Chief of Engineers, U.S. Army Corps of Engineers (2012-2016) and Deputy Chief of Staff and Director of Human Resources, U.S. Army (2009-2012). General Bostick currently serves as a member of the Board and Finance and Governance & Sustainability Committees of CSX Corporation (transportation, 2020-present) and a member of the Board and Corporate Governance and Nominating Committee of Perma-Fix Environmental Services, Inc. (nuclear waste management, 2020-present). General Bostick serves as Chief Executive Officer of Bostick Global Strategies, LLC (consulting, 2016-present), as a member of the Board of HireVue, Inc. (video interview and assessment, 2020-present), as a member of the Board of Allonnia (biotechnology and engineering solutions, 2022-present) and on the Advisory Board of Solugen, Inc. (specialty bio-based chemicals manufacturer, 2022-present). Previously, General Bostick served as a Member of the Advisory Board of certain Fidelity ® funds (2021), President, Intrexon Bioengineering (2018-2020) and Chief Operating Officer (2017-2020) and Senior Vice President of the Environment Sector (2016-2017) of Intrexon Corporation (biopharmaceutical company).
Dennis J. Dirks (1948)
Year of Election or Appointment: 2018
Trustee
Mr. Dirks also serves as Trustee of other Fidelity ® funds. Prior to his retirement in May 2003, Mr. Dirks served as Chief Operating Officer and as a member of the Board of The Depository Trust & Clearing Corporation (financial markets infrastructure), President, Chief Operating Officer and a member of the Board of The Depository Trust Company (DTC), President and a member of the Board of the National Securities Clearing Corporation (NSCC), Chief Executive Officer and a member of the Board of the Government Securities Clearing Corporation and Chief Executive Officer and a member of the Board of the Mortgage-Backed Securities Clearing Corporation. Mr. Dirks currently serves as a member of the Finance Committee (2016-present) and Board (2017-present) and is Treasurer (2018-present) of the Asolo Repertory Theatre.
Donald F. Donahue (1950)
Year of Election or Appointment: 2018
Trustee
Mr. Donahue also serves as Trustee of other Fidelity ® funds. Mr. Donahue serves as President and Chief Executive Officer of Miranda Partners, LLC (risk consulting for the financial services industry, 2012-present). Previously, Mr. Donahue served as Chief Executive Officer (2006-2012), Chief Operating Officer (2003-2006) and Managing Director, Customer Marketing and Development (1999-2003) of The Depository Trust & Clearing Corporation (financial markets infrastructure). Mr. Donahue currently serves as a member (2007-present) and Co-Chairman (2016-present) of the Board of United Way of New York. Mr. Donahue previously served as a member of the Advisory Board of certain Fidelity ® funds (2015-2018) and as a member of the Board of The Leadership Academy (previously NYC Leadership Academy) (2012-2022).
Vicki L. Fuller (1957)
Year of Election or Appointment: 2020
Trustee
Ms. Fuller also serves as Trustee of other Fidelity ® funds. Previously, Ms. Fuller served as a member of the Advisory Board of certain Fidelity ® funds (2018-2020), Chief Investment Officer of the New York State Common Retirement Fund (2012-2018) and held a variety of positions at AllianceBernstein L.P. (global asset management, 1985-2012), including Managing Director (2006-2012) and Senior Vice President and Senior Portfolio Manager (2001-2006). Ms. Fuller currently serves as a member of the Board, Audit Committee and Nominating and Governance Committee of two Blackstone business development companies (2020-present), as a member of the Board of Treliant, LLC (consulting, 2019-present), as a member of the Board of Ariel Alternatives, LLC (private equity, 2022-present) and as a member of the Board and Chair of the Audit Committee of Gusto, Inc. (software, 2021-present). In addition, Ms. Fuller currently serves as a member of the Board of Roosevelt University (2019-present) and as a member of the Executive Board of New York University's Stern School of Business. Ms. Fuller previously served as a member of the Board, Audit Committee and Nominating and Governance Committee of The Williams Companies, Inc. (natural gas infrastructure, 2018-2021).
Patricia L. Kampling (1959)
Year of Election or Appointment: 2020
Trustee
Ms. Kampling also serves as Trustee of other Fidelity ® funds. Prior to her retirement, Ms. Kampling served as Chairman of the Board and Chief Executive Officer (2012-2019), President and Chief Operating Officer (2011-2012) and Executive Vice President and Chief Financial Officer (2010-2011) of Alliant Energy Corporation. Ms. Kampling currently serves as a member of the Board, Finance Committee and Governance, Compensation and Nominating Committee of Xcel Energy Inc. (utilities company, 2020-present) and as a member of the Board, Audit, Finance and Risk Committee and Safety, Environmental, Technology and Operations Committee and Chair of the Executive Development and Compensation Committee of American Water Works Company, Inc. (utilities company, 2019-present). In addition, Ms. Kampling currently serves as a member of the Board of the Nature Conservancy, Wisconsin Chapter (2019-present). Previously, Ms. Kampling served as a Member of the Advisory Board of certain Fidelity® funds (2020), a member of the Board, Compensation Committee and Executive Committee and Chair of the Audit Committee of Briggs & Stratton Corporation (manufacturing, 2011-2021), a member of the Board of Interstate Power and Light Company (2012-2019) and Wisconsin Power and Light Company (2012-2019) (each a subsidiary of Alliant Energy Corporation) and as a member of the Board and Workforce Development Committee of the Business Roundtable (2018-2019).
Thomas A. Kennedy (1955)
Year of Election or Appointment: 2021
Trustee
Mr. Kennedy also serves as Trustee of other Fidelity ® funds. Previously, Mr. Kennedy served as a Member of the Advisory Board of certain Fidelity ® funds (2020) and held a variety of positions at Raytheon Company (aerospace and defense, 1983-2020), including Chairman and Chief Executive Officer (2014-2020) and Executive Vice President and Chief Operating Officer (2013-2014). Mr. Kennedy served as Executive Chairman of the Board of Directors of Raytheon Technologies Corporation (aerospace and defense, 2020-2021). Mr. Kennedy serves as a Director of the Board of Directors of Textron Inc. (aerospace and defense, 2023-present).
Oscar Munoz (1959)
Year of Election or Appointment: 2021
Trustee
Mr. Munoz also serves as Trustee of other Fidelity ® funds. Prior to his retirement, Mr. Munoz served as Executive Chairman (2020-2021), Chief Executive Officer (2015-2020), President (2015-2016) and a member of the Board (2010-2021) of United Airlines Holdings, Inc. Mr. Munoz currently serves as a member of the Board of CBRE Group, Inc. (commercial real estate, 2020-present), a member of the Board of Univision Communications, Inc. (Hispanic media, 2020-present), a member of the Board of Archer Aviation Inc. (2021-present), a member of the Defense Business Board of the United States Department of Defense (2021-present) and a member of the Board of Salesforce.com, Inc. (cloud-based software, 2022-present). Previously, Mr. Munoz served as a Member of the Advisory Board of certain Fidelity ® funds (2021).
David M. Thomas (1949)
Year of Election or Appointment: 2018
Trustee
Lead Independent Trustee
Mr. Thomas also serves as Trustee of other Fidelity ® funds. Previously, Mr. Thomas served as Executive Chairman (2005-2006) and Chairman and Chief Executive Officer (2000-2005) of IMS Health, Inc. (pharmaceutical and healthcare information solutions). Mr. Thomas currently serves as a member of the Board of Fortune Brands Home and Security (home and security products, 2004-present) and as Director (2013-present) and Non-Executive Chairman of the Board (2022-present) of Interpublic Group of Companies, Inc. (marketing communication).
Susan Tomasky (1953)
Year of Election or Appointment: 2020
Trustee
Ms. Tomasky also serves as Trustee of other Fidelity ® funds. Prior to her retirement, Ms. Tomasky served in various executive officer positions at American Electric Power Company, Inc. (1998-2011), including most recently as President of AEP Transmission (2007-2011). Ms. Tomasky currently serves as a member of the Board and Sustainability Committee and as Chair of the Audit Committee of Marathon Petroleum Corporation (2018-present) and as a member of the Board, Executive Committee, Corporate Governance Committee and Organization and Compensation Committee and as Lead Director of the Board of Public Service Enterprise Group, Inc. (utilities company, 2012-present) and as a member of the Board of its subsidiary company, Public Service Electric and Gas Co. (2021-present). In addition, Ms. Tomasky currently serves as a member (2009-present) and President (2020-present) of the Board of the Royal Shakespeare Company - America (2009-present), as a member of the Board of the Columbus Association for the Performing Arts (2011-present) and as a member of the Board and Kenyon in the World Committee of Kenyon College (2016-present). Previously, Ms. Tomasky served as a Member of the Advisory Board of certain Fidelity ® funds (2020), as a member of the Board of the Columbus Regional Airport Authority (2007-2020), as a member of the Board (2011-2018) and Lead Independent Director (2015-2018) of Andeavor Corporation (previously Tesoro Corporation) (independent oil refiner and marketer) and as a member of the Board of Summit Midstream Partners LP (energy, 2012-2018).
Michael E. Wiley (1950)
Year of Election or Appointment: 2008
Trustee
Mr. Wiley also serves as Trustee of other Fidelity ® funds. Previously, Mr. Wiley served as a member of the Advisory Board of certain Fidelity ® funds (2018-2020), Chairman, President and CEO of Baker Hughes, Inc. (oilfield services, 2000-2004). Mr. Wiley also previously served as a member of the Board of Andeavor Corporation (independent oil refiner and marketer, 2005-2018), a member of the Board of Andeavor Logistics LP (natural resources logistics, 2015-2018) and a member of the Board of High Point Resources (exploration and production, 2005-2020).
+ The information includes the Trustee's principal occupation during the last five years and other information relating to the experience, attributes, and skills relevant to the Trustee's qualifications to serve as a Trustee, which led to the conclusion that the Trustee should serve as a Trustee for each fund.
Advisory Board Members and Officers:
Correspondence intended for a Member of the Advisory Board (if any) may be sent to Fidelity Investments, P.O. Box 55235, Boston, Massachusetts 02205-5235. Correspondence intended for an officer or Peter S. Lynch may be sent to Fidelity Investments, 245 Summer Street, Boston, Massachusetts 02210. Officers appear below in alphabetical order.
Name, Year of Birth; Principal Occupation
Peter S. Lynch (1944)
Year of Election or Appointment: 2018
Member of the Advisory Board
Mr. Lynch also serves as a Member of the Advisory Board of other Fidelity ® funds. Mr. Lynch is Vice Chairman and a Director of Fidelity Management & Research Company LLC (investment adviser firm). In addition, Mr. Lynch serves as a Trustee of Boston College and as the Chairman of the Inner-City Scholarship Fund. Previously, Mr. Lynch served as Vice Chairman and a Director of FMR Co., Inc. (investment adviser firm) and on the Special Olympics International Board of Directors (1997-2006).
Heather Bonner (1977)
Year of Election or Appointment: 2023
Assistant Treasurer
Ms. Bonner also serves as an officer of other funds. Ms. Bonner serves as Senior Vice President (2022-present), and is an employee of Fidelity Investments. Ms. Bonner serves as Assistant Treasurer of Fidelity CRET Trustee LLC (2022-present). Prior to joining Fidelity, Ms. Bonner served as Managing Director at AQR Capital Management (2013-2022) and was the Treasurer and Principal Financial Officer of the AQR Funds (2013-2022).
Craig S. Brown (1977)
Year of Election or Appointment: 2022
Deputy Treasurer
Mr. Brown also serves as an officer of other funds. Mr. Brown serves as Assistant Treasurer of FIMM, LLC (2021-present) and is an employee of Fidelity Investments (2013-present). Previously, Mr. Brown served as Assistant Treasurer of certain Fidelity ® funds (2019-2022).
John J. Burke III (1964)
Year of Election or Appointment: 2018
Chief Financial Officer
Mr. Burke also serves as Chief Financial Officer of other funds. Mr. Burke serves as Head of Investment Operations for Fidelity Fund and Investment Operations (2018-present) and is an employee of Fidelity Investments (1998-present). Previously Mr. Burke served as head of Asset Management Investment Operations (2012-2018).
Margaret Carey (1973)
Year of Election or Appointment: 2023
Secretary and Chief Legal Officer (CLO)
Ms. Carey also serves as an officer of other funds and as CLO of certain other Fidelity entities. She is a Senior Vice President and Deputy General Counsel of FMR LLC (diversified financial services company, 2019-present), and is an employee of Fidelity Investments.
William C. Coffey (1969)
Year of Election or Appointment: 2019
Assistant Secretary
Mr. Coffey also serves as Assistant Secretary of other funds. He is Senior Vice President and Deputy General Counsel of FMR LLC (diversified financial services company, 2010-present), and is an employee of Fidelity Investments. Previously, Mr. Coffey served as Secretary and CLO of certain funds (2018-2019); CLO, Secretary, and Senior Vice President of Fidelity Management & Research Company and FMR Co., Inc. (investment adviser firms, 2018-2019); Secretary of Fidelity SelectCo, LLC and Fidelity Investments Money Management, Inc. (investment adviser firms, 2018-2019); CLO of Fidelity Management & Research (Hong Kong) Limited, FMR Investment Management (UK) Limited, and Fidelity Management & Research (Japan) Limited (investment adviser firms, 2018-2019); and Assistant Secretary of certain funds (2009-2018).
Timothy M. Cohen (1969)
Year of Election or Appointment: 2018
Vice President
Mr. Cohen also serves as Vice President of other funds. Mr. Cohen serves as Co-Head of Equity (2018-present), a Director of Fidelity Management & Research (Japan) Limited (investment adviser firm, 2016-present), and is an employee of Fidelity Investments. Previously, Mr. Cohen served as Executive Vice President of Fidelity SelectCo, LLC (2019), Head of Global Equity Research (2016-2018), Chief Investment Officer - Equity and a Director of Fidelity Management & Research (U.K.) Inc. (investment adviser firm, 2013-2015) and as a Director of Fidelity Management & Research (Hong Kong) Limited (investment adviser firm, 2017).
Jonathan Davis (1968)
Year of Election or Appointment: 2010
Assistant Treasurer
Mr. Davis also serves as an officer of other funds. Mr. Davis serves as Assistant Treasurer of FIMM, LLC (2021-present), FMR Capital, Inc. (2017-present), FD Funds GP LLC (2021-present), FD Funds Holding LLC (2021-present), and FD Funds Management LLC (2021-present); and is an employee of Fidelity Investments. Previously, Mr. Davis served as Vice President and Associate General Counsel of FMR LLC (diversified financial services company, 2003-2010).
Laura M. Del Prato (1964)
Year of Election or Appointment: 2018
Assistant Treasurer
Ms. Del Prato also serves as an officer of other funds. Ms. Del Prato serves as Assistant Treasurer of FIMM, LLC (2021-present) and is an employee of Fidelity Investments (2017-present). Previously, Ms. Del Prato served as President and Treasurer of The North Carolina Capital Management Trust: Cash Portfolio and Term Portfolio (2018-2020). Prior to joining Fidelity Investments, Ms. Del Prato served as a Managing Director and Treasurer of the JPMorgan Mutual Funds (2014-2017). Prior to JPMorgan, Ms. Del Prato served as a partner at Cohen Fund Audit Services (accounting firm, 2012-2013) and KPMG LLP (accounting firm, 2004-2012).
Colm A. Hogan (1973)
Year of Election or Appointment: 2020
Assistant Treasurer
Mr. Hogan also serves as an officer of other funds. Mr. Hogan serves as Assistant Treasurer of FIMM, LLC (2021-present) and FMR Capital, Inc. (2017-present) and is an employee of Fidelity Investments (2005-present). Previously, Mr. Hogan served as Deputy Treasurer of certain Fidelity ® funds (2016-2020) and Assistant Treasurer of certain Fidelity ® funds (2016-2018).
Pamela R. Holding (1964)
Year of Election or Appointment: 2018
Vice President
Ms. Holding also serves as Vice President of other funds. Ms. Holding serves as Co-Head of Equity (2018-present) and is an employee of Fidelity Investments (2013-present). Previously, Ms. Holding served as Executive Vice President of Fidelity SelectCo, LLC (2019) and as Chief Investment Officer of Fidelity Institutional Asset Management (2013-2018).
Chris Maher (1972)
Year of Election or Appointment: 2020
Deputy Treasurer
Mr. Maher also serves as an officer of other funds. Mr. Maher serves as Assistant Treasurer of FIMM, LLC (2021-present) and FMR Capital, Inc. (2017-present), and is an employee of Fidelity Investments (2008-present). Previously, Mr. Maher served as Assistant Treasurer of certain funds (2013-2020); Vice President of Asset Management Compliance (2013), Vice President of the Program Management Group of FMR (investment adviser firm, 2010-2013), and Vice President of Valuation Oversight (2008-2010).
Jason P. Pogorelec (1975)
Year of Election or Appointment: 2020
Chief Compliance Officer
Mr. Pogorelec also serves as Chief Compliance Officer of other funds. Mr. Pogorelec is a Senior Vice President of Asset Management Compliance for Fidelity Investments and is an employee of Fidelity Investments. Mr. Pogorelec serves as Compliance Officer of Fidelity Management & Research Company LLC (investment adviser firm, 2023-present). Previously, Mr. Pogorelec served as Vice President, Associate General Counsel for Fidelity Investments (2010-2020) and Assistant Secretary of certain Fidelity ® funds (2015-2020).
Brett Segaloff (1972)
Year of Election or Appointment: 2021
Anti-Money Laundering (AML) Officer
Mr. Segaloff also serves as an AML Officer of other funds and other related entities. He is Director, Anti-Money Laundering (2007-present) of FMR LLC (diversified financial services company) and is an employee of Fidelity Investments (1996-present).
Stacie M. Smith (1974)
Year of Election or Appointment: 2018
President and Treasurer
Ms. Smith also serves as an officer of other funds. Ms. Smith serves as Assistant Treasurer of FIMM, LLC (2021-present) and FMR Capital, Inc. (2017-present), is an employee of Fidelity Investments (2009-present), and has served in other fund officer roles. Prior to joining Fidelity Investments, Ms. Smith served as Senior Audit Manager of Ernst & Young LLP (accounting firm, 1996-2009). Previously, Ms. Smith served as Assistant Treasurer (2013-2019) and Deputy Treasurer (2013-2016) of certain Fidelity ® funds.
Jim Wegmann (1979)
Year of Election or Appointment: 2019
Assistant Treasurer
Mr. Wegmann also serves as an officer of other funds. Mr. Wegmann serves as Assistant Treasurer of FIMM, LLC (2021-present) and is an employee of Fidelity Investments (2011-present). Previously, Mr. Wegmann served as Assistant Treasurer of certain Fidelity ® funds (2019-2021).
As a shareholder, you incur two types of costs: (1) transaction costs, which may include sales charges (loads) on purchase payments or redemption proceeds, as applicable and (2) ongoing costs, which generally include management fees, distribution and/or service (12b-1) fees and other Fund expenses. This Example is intended to help you understand your ongoing costs (in dollars) of investing in a fund and to compare these costs with the ongoing costs of investing in other mutual funds.
| The Example is based on an investment of $1,000 invested at the beginning of the period and held for the entire period (September 1, 2022 to February 28, 2023). |
Actual Expenses
The first line of the accompanying table provides information about actual account values and actual expenses. You may use the information in this line, together with the amount you invested, to estimate the expenses that you paid over the period. Simply divide your account value by $1,000.00 (for example, an $8,600 account value divided by $1,000.00 = 8.6), then multiply the result by the number in the first line for a class/Fund under the heading entitled "Expenses Paid During Period" to estimate the expenses you paid on your account during this period. If any fund is a shareholder of any underlying mutual funds or exchange-traded funds (ETFs) (the Underlying Funds), such fund indirectly bears its proportional share of the expenses of the Underlying Funds in addition to the direct expenses incurred presented in the table. These fees and expenses are not included in the annualized expense ratio used to calculate the expense estimate in the table below.
Hypothetical Example for Comparison Purposes
The second line of the accompanying table provides information about hypothetical account values and hypothetical expenses based on the actual expense ratio and an assumed rate of return of 5% per year before expenses, which is not the actual return. The hypothetical account values and expenses may not be used to estimate the actual ending account balance or expenses you paid for the period. You may use this information to compare the ongoing costs of investing in the Fund and other funds. To do so, compare this 5% hypothetical example with the 5% hypothetical examples that appear in the shareholder reports of the other funds. If any fund is a shareholder of any Underlying Funds, such fund indirectly bears its proportional share of the expenses of the Underlying Funds in addition to the direct expenses as presented in the table. These fees and expenses are not included in the annualized expense ratio used to calculate the expense estimate in the table below.
Please note that the expenses shown in the table are meant to highlight your ongoing costs only and do not reflect any transaction costs. Therefore, the second line of the table is useful in comparing ongoing costs only, and will not help you determine the relative total costs of owning different funds. In addition, if these transactional costs were included, your costs would have been higher.
| | | | | Annualized Expense Ratio- A | | Beginning Account Value September 1, 2022 | | Ending Account Value February 28, 2023 | | Expenses Paid During Period- C September 1, 2022 to February 28, 2023 |
| | | | | | | | | | |
| Defense and Aerospace Portfolio | | | | .74% | | | | | | |
| Actual | | | | | | $ 1,000 | | $ 1,137.20 | | $ 3.92 |
Hypothetical- B | | | | | | $ 1,000 | | $ 1,021.12 | | $ 3.71 |
| | | | | | | | | | |
| Industrials Portfolio | | | | .76% | | | | | | |
| Actual | | | | | | $ 1,000 | | $ 1,102.50 | | $ 3.96 |
Hypothetical- B | | | | | | $ 1,000 | | $ 1,021.03 | | $ 3.81 |
| | | | | | | | | | |
| Transportation Portfolio | | | | .76% | | | | | | |
| Actual | | | | | | $ 1,000 | | $ 1,036.10 | | $ 3.84 |
Hypothetical- B | | | | | | $ 1,000 | | $ 1,021.03 | | $ 3.81 |
| |
A Annualized expense ratio reflects expenses net of applicable fee waivers.
B 5% return per year before expenses
C Expenses are equal to the annualized expense ratio, multiplied by the average account value over the period, multiplied by 181/ 365 (to reflect the one-half year period). The fees and expenses of any Underlying Funds are not included in each annualized expense ratio.
The dividend and capital gains distributions for the fund(s) are available on Fidelity.com or Institutional.Fidelity.com.
The funds hereby designate as capital gain dividend the amounts noted below for the taxable year ended February 28, 2023, or, if subsequently determined to be different, the net capital gain of such year.
| Defense and Aerospace Portfolio | $11,042,652 |
| Industrials Portfolio | $3,866,414 |
| Transportation Portfolio | $19,013,173 |
A percentage of the dividends distributed during the fiscal year for the following funds qualify for the dividends-received deduction for corporate shareholders:
| Defense and Aerospace Portfolio | |
| December 2022 | 100% |
| Industrials Portfolio | |
| April 2022 | 40% |
| December 2022 | 100% |
| Transportation Portfolio | |
| April 2022 | 98% |
| December 2022 | 49% |
A percentage of the dividends distributed during the fiscal year for the following funds may be taken into account as a dividend for purposes of the maximum rate under section 1(h)(11) of the Internal Revenue Code.
| Defense and Aerospace Portfolio | |
| December 2022 | 100% |
| Industrials Portfolio | |
| April 2022 | 43.62% |
| December 2022 | 100% |
| Transportation Portfolio | |
| April 2022 | 98.11% |
| December 2022 | 60.65% |
The funds hereby designate the percentages noted below of the short-term capital gain dividends distributed during the fiscal year as qualifying to be taxed as short-term capital gain dividends for nonresident alien shareholders:
| | April, 2022 | December, 2022 |
| Industrials Portfolio | 100% | - |
| Transportation Portfolio | - | 100% |
The funds hereby designate the amounts noted below as distributions paid during the fiscal year ended 2023 as qualifying to be taxed as section 163(j) interest dividends:
| Transportation Portfolio | $141,621 |
The funds will notify shareholders in January 2024 of amounts for use in preparing 2023 income tax returns.
The Securities and Exchange Commission adopted Rule 22e-4 under the Investment Company Act of 1940 (the Liquidity Rule) to promote effective liquidity risk management throughout the open-end investment company industry, thereby reducing the risk that funds will be unable to meet their redemption obligations and mitigating dilution of the interests of fund shareholders.
The Funds have adopted and implemented a liquidity risk management program (the Program) reasonably designed to assess and manage each Fund's liquidity risk and to comply with the requirements of the Liquidity Rule. Each Fund's Board of Trustees (the Board) has designated each Fund's investment adviser as administrator of the Program. The Fidelity advisers have established a Liquidity Risk Management Committee (the LRM Committee) to manage the Program for each of the Fidelity Funds. The LRM Committee monitors the adequacy and effectiveness of implementation of the Program and on a periodic basis assesses each Fund's liquidity risk based on a variety of factors including (1) the Fund's investment strategy, (2) portfolio liquidity and cash flow projections during normal and reasonably foreseeable stressed conditions, (3) shareholder redemptions, (4) borrowings and other funding sources and (5) certain factor specific to ETFs including the effect of the Fund's prices and spreads, market participants, and basket compositions on the overall liquidity of the Fund's portfolio, as applicable.
In accordance with the Program, each of the Fund's portfolio investments is classified into one of four defined liquidity categories based on a determination of a reasonable expectation for how long it would take to convert the investment to cash (or sell or dispose of the investment) without significantly changing its market value.
- Highly liquid investments - cash or convertible to cash within three business days or less
- Moderately liquid investments - convertible to cash in three to seven calendar days
- Less liquid investments - can be sold or disposed of, but not settled, within seven calendar days
- Illiquid investments - cannot be sold or disposed of within seven calendar days
Liquidity classification determinations take into account a variety of factors including various market, trading and investment-specific considerations, as well as market depth, and generally utilize analysis from a third-party liquidity metrics service.
The Liquidity Rule places a 15% limit on a fund's illiquid investments and requires funds that do not primarily hold assets that are highly liquid investments to determine and maintain a minimum percentage of the fund's net assets to be invested in highly liquid investments (highly liquid investment minimum or HLIM). The Program includes provisions reasonably designed to comply with the 15% limit on illiquid investments and for determining, periodically reviewing and complying with the HLIM requirement as applicable.
At a recent meeting of the Fund's Board of Trustees, the LRM Committee provided a written report to the Board pertaining to the operation, adequacy, and effectiveness of the Program for the period December 1, 2021 through November 30, 2022. The report concluded that the Program is operating effectively and is reasonably designed to assess and manage the Fund's liquidity risk.
1.813657.118
SELCI-ANN-0423
Fidelity® Select Portfolios®
Telecommunications Services Sector
Telecommunications Portfolio
Wireless Portfolio
Annual Report
February 28, 2023
Includes Fidelity and Fidelity Advisor share classes
Contents
To view a fund's proxy voting guidelines and proxy voting record for the 12-month period ended June 30, visit http://www.fidelity.com/proxyvotingresults or visit the Securities and Exchange Commission's (SEC) web site at http://www.sec.gov.
You may also call 1-800-544-8544 if you're an individual investing directly with Fidelity, call 1-800-835-5092 if you're a plan sponsor or participant with Fidelity as your recordkeeper or call 1-877-208-0098 on institutional accounts or if you're an advisor or invest through one to request a free copy of the proxy voting guidelines.
Standard & Poor's, S&P and S&P 500 are registered service marks of The McGraw-Hill Companies, Inc. and have been licensed for use by Fidelity Distributors Corporation.
Other third-party marks appearing herein are the property of their respective owners.
All other marks appearing herein are registered or unregistered trademarks or service marks of FMR LLC or an affiliated company. © 2023 FMR LLC. All rights reserved.
This report and the financial statements contained herein are submitted for the general information of the shareholders of the Funds. This report is not authorized for distribution to prospective investors in the Funds unless preceded or accompanied by an effective prospectus.
A fund files its complete schedule of portfolio holdings with the SEC for the first and third quarters of each fiscal year on Form N-PORT. Forms N-PORT are available on the SEC's web site at http://www.sec.gov. A fund's Forms N-PORT may be reviewed and copied at the SEC's Public Reference Room in Washington, DC. Information regarding the operation of the SEC's Public Reference Room may be obtained by calling 1-800-SEC-0330.
For a complete list of a fund's portfolio holdings, view the most recent holdings listing, semiannual report, or annual report on Fidelity's web site at http://www.fidelity.com, http://www.institutional.fidelity.com, or http://www.401k.com, as applicable.
NOT FDIC INSURED •MAY LOSE VALUE •NO BANK GUARANTEE
Neither the Funds nor Fidelity Distributors Corporation is a bank.
Average annual total return reflects the change in the value of an investment, assuming reinvestment of distributions from dividend income and capital gains (the profits earned upon the sale of securities that have grown in value, if any) and assuming a constant rate of performance each year. The hypothetical investment and the average annual total returns do not reflect the deduction of taxes that a shareholder would pay on fund distributions or the redemption of fund shares. During periods of reimbursement by Fidelity, a fund's total return will be greater than it would be had the reimbursement not occurred. How a fund did yesterday is no guarantee of how it will do tomorrow.
| Average Annual Total Returns |
| | | | |
Periods ended February 28, 2023 | Past 1 year | Past 5 years | Past 10 years |
| Class A (incl.5.75% sales charge) | -13.27% | 2.20% | 5.10% |
| Class M (incl.3.50% sales charge) | -11.42% | 2.39% | 5.03% |
Class C (incl. contingent deferred sales charge) | -9.52% | 2.67% | 5.12% |
| Telecommunications Portfolio | -7.71% | 3.76% | 6.07% |
| Class I | -7.67% | 3.75% | 6.06% |
| Class Z | -7.56% | 3.89% | 6.13% |
Class C shares' contingent deferred sales charges included in the past one year, past five years and past ten years total return figures are 1%, 0% and 0%, respectively.
The initial offering of Class Z shares took place on October 2, 2018. Returns prior to October 2, 2018, are those of Class I.
| $10,000 Over 10 Years |
| |
Let's say hypothetically that $10,000 was invested in Telecommunications Portfolio, a class of the fund, on February 28, 2013. The chart shows how the value of your investment would have changed, and also shows how the S&P 500® Index performed over the same period. |
|
|
Telecommunications Portfolio
Market Recap:
U.S. equities returned -7.69% for the 12 months ending February 28, 2023, according to the S&P 500 ® index. The new year began with an encouraging upturn in January (+6.28%), but stocks lost momentum in February (-2.44%) amid higher-than-expected inflation and strong jobs data. Investors took these as signs that the economy continued to run hot, even after a year of historic policy adjustment by the Federal Reserve aimed at cooling economic growth. Record inflation in 2022 prompted the Fed to aggressively tighten monetary policy, and market interest rates eclipsed their highest level in a decade, stoking recession fears and sending stocks into bear market territory. Since March 2022, the central bank has hiked its benchmark rate eight times, by 4.5 percentage points - the fastest-ever pace of monetary tightening - while also shrinking its massive asset portfolio. The latest bump came on February 2, along with a signal that the Fed plans to lift rates in March while it considers whether and when to pause increases. Against this dynamic backdrop, stocks struggled to gain traction until a strong rally ignited heading into the summer. But in September, the index returned -9.21%, one of its worst monthly results ever, before advancing 7.56% in Q4, as risky assets regained favor. For the full 12 months, value stocks handily outpaced growth. The headwind for the latter was most pronounced in the growth-oriented communication services (-25%) and consumer discretionary (-18%) sectors. In sharp contrast, energy gained 24%.
Comments from Portfolio Manager Nicole Abernethy:
For the fiscal year ending February 28, 2023, the fund's share classes (excluding sales charges, if applicable) returned roughly -9% to -8%, modestly underperforming the -7.85% return of the MSCI IMI Telecommunication Services 25/50 (IG) Index. Most share classes underperformed the broad-based S&P 500 ® index. The primary contributors to performance versus the industry index were stock picks and an underweighting in alternative carriers. Security selection in wireless telecommunication services and IT consulting & other services also lifted the fund's relative result. The biggest individual relative contributor was an underweight position in Lumen Technologies (-65%). Our second-largest relative contributor this period was avoiding Consolidated Communications Holdings, an index component that returned about -57%. Another notable relative contributor was an outsized stake in T-Mobile (+15%). This period we reduced our stake. Conversely, the fund's biggest detractor from performance versus the industry index was our security selection in the cable & satellite industry. Security selection in integrated telecommunication services and application software also hurt the fund's relative performance. Our largest individual detractor versus the industry index was an out-of-index stake in Liberty Broadband (-41%). We trimmed the position. Another notable relative detractor was our lighter-than-index stake in Globalstar (+8%). This period we increased our position. Another notable relative detractor was an underweight in AT&T (+11%). Despite the underweight, AT&T was among the fund's biggest holdings. Notable changes in positioning include a lower allocation to the cable & satellite and wireless telecommunication services subindustries.
The views expressed above reflect those of the portfolio manager(s) only through the end of the period as stated on the cover of this report and do not necessarily represent the views of Fidelity or any other person in the Fidelity organization. Any such views are subject to change at any time based upon market or other conditions and Fidelity disclaims any responsibility to update such views. These views may not be relied on as investment advice and, because investment decisions for a Fidelity fund are based on numerous factors, may not be relied on as an indication of trading intent on behalf of any Fidelity fund.
Telecommunications Portfolio
Top Holdings (% of Fund's net assets) |
| |
| Verizon Communications, Inc. | 24.4 | |
| AT&T, Inc. | 19.7 | |
| Cogent Communications Group, Inc. | 4.8 | |
| Iridium Communications, Inc. | 4.7 | |
| T-Mobile U.S., Inc. | 4.4 | |
| Liberty Global PLC Class C | 4.3 | |
| Telephone & Data Systems, Inc. | 3.7 | |
| Liberty Latin America Ltd. Class C | 3.7 | |
| Gogo, Inc. | 3.6 | |
| Radius Global Infrastructure, Inc. | 3.1 | |
| | 76.4 | |
| |
| Industries (% of Fund's net assets) |
| |
| Diversified Telecommunication Services | 77.0 | |
| Wireless Telecommunication Services | 13.1 | |
| Media | 5.7 | |
| IT Services | 0.5 | |
| Construction & Engineering | 0.1 | |
| Software | 0.1 | |
| |
Telecommunications Portfolio
Showing Percentage of Net Assets
| Common Stocks - 96.5% |
| | | Shares | Value ($) |
| Construction & Engineering - 0.1% | | | |
| Construction & Engineering - 0.1% | | | |
| Dycom Industries, Inc. (a) | | 2,600 | 218,946 |
| Diversified Telecommunication Services - 77.0% | | | |
| Alternative Carriers - 24.5% | | | |
| Anterix, Inc. (a) | | 145,700 | 4,400,140 |
| Bandwidth, Inc. (a) | | 77,900 | 1,238,610 |
| Cogent Communications Group, Inc. | | 171,039 | 11,073,065 |
| EchoStar Holding Corp. Class A (a)(b) | | 260,500 | 5,199,580 |
| Globalstar, Inc. (a)(b) | | 2,554,300 | 3,269,504 |
| Iridium Communications, Inc. | | 180,111 | 11,053,412 |
| Liberty Global PLC Class C (a) | | 470,736 | 10,003,140 |
| Liberty Latin America Ltd. Class C (a) | | 975,133 | 8,561,668 |
| Lumen Technologies, Inc. (b) | | 685,200 | 2,329,680 |
| | | | 57,128,799 |
| Integrated Telecommunication Services - 52.5% | | | |
| AT&T, Inc. | | 2,432,420 | 45,997,062 |
| ATN International, Inc. | | 52,400 | 2,203,420 |
| Deutsche Telekom AG | | 35,300 | 792,240 |
| Frontier Communications Parent, Inc. (a)(b) | | 175,200 | 4,793,472 |
| IDT Corp. Class B (a) | | 144,700 | 4,400,327 |
| Radius Global Infrastructure, Inc. (a)(b) | | 532,400 | 7,256,612 |
| Verizon Communications, Inc. | | 1,462,897 | 56,775,033 |
| | | | 122,218,166 |
TOTAL DIVERSIFIED TELECOMMUNICATION SERVICES | | | 179,346,965 |
| IT Services - 0.5% | | | |
| Internet Services & Infrastructure - 0.1% | | | |
| Twilio, Inc. Class A (a) | | 4,000 | 268,840 |
| IT Consulting & Other Services - 0.4% | | | |
| Amdocs Ltd. | | 9,800 | 897,778 |
TOTAL IT SERVICES | | | 1,166,618 |
| Media - 5.7% | | | |
| Cable & Satellite - 5.7% | | | |
| Charter Communications, Inc. Class A (a) | | 4,400 | 1,617,484 |
| Comcast Corp. Class A | | 190,600 | 7,084,602 |
| Liberty Broadband Corp. Class C (a) | | 52,424 | 4,543,588 |
| | | | 13,245,674 |
| Software - 0.1% | | | |
| Application Software - 0.1% | | | |
| RingCentral, Inc. (a) | | 7,400 | 244,496 |
| Wireless Telecommunication Services - 13.1% | | | |
| Wireless Telecommunication Services - 13.1% | | | |
| Gogo, Inc. (a) | | 507,700 | 8,356,742 |
| Millicom International Cellular SA (a) | | 70,110 | 1,387,477 |
| Shenandoah Telecommunications Co. | | 5,623 | 109,761 |
| T-Mobile U.S., Inc. (a) | | 72,324 | 10,283,026 |
| Telephone & Data Systems, Inc. | | 682,664 | 8,663,006 |
| U.S. Cellular Corp. (a)(b) | | 73,500 | 1,773,555 |
| | | | 30,573,567 |
| TOTAL COMMON STOCKS (Cost $234,849,854) | | | 224,796,266 |
| | | | |
| Money Market Funds - 8.6% |
| | | Shares | Value ($) |
| Fidelity Cash Central Fund 4.63% (c) | | 10,882,095 | 10,884,272 |
| Fidelity Securities Lending Cash Central Fund 4.63% (c)(d) | | 9,165,008 | 9,165,924 |
| TOTAL MONEY MARKET FUNDS (Cost $20,050,196) | | | 20,050,196 |
| | | | |
| TOTAL INVESTMENT IN SECURITIES - 105.1% (Cost $254,900,050) | 244,846,462 |
NET OTHER ASSETS (LIABILITIES) - (5.1)% | (11,868,026) |
| NET ASSETS - 100.0% | 232,978,436 |
| | |
Legend
| (b) | Security or a portion of the security is on loan at period end. |
| (c) | Affiliated fund that is generally available only to investment companies and other accounts managed by Fidelity Investments. The rate quoted is the annualized seven-day yield of the fund at period end. A complete unaudited listing of the fund's holdings as of its most recent quarter end is available upon request. In addition, each Fidelity Central Fund's financial statements, which are not covered by the Fund's Report of Independent Registered Public Accounting Firm, are available on the SEC's website or upon request. |
| (d) | Investment made with cash collateral received from securities on loan. |
Affiliated Central Funds
Fiscal year to date information regarding the Fund's investments in Fidelity Central Funds, including the ownership percentage, is presented below.
| Affiliate | Value, beginning of period ($) | Purchases ($) | Sales Proceeds ($) | Dividend Income ($) | Realized Gain (loss) ($) | Change in Unrealized appreciation (depreciation) ($) | Value, end of period ($) | % ownership, end of period |
| Fidelity Cash Central Fund 4.63% | 2,983,817 | 64,700,227 | 56,799,772 | 141,928 | - | - | 10,884,272 | 0.0% |
| Fidelity Securities Lending Cash Central Fund 4.63% | 27,079,836 | 127,589,611 | 145,503,523 | 22,823 | - | - | 9,165,924 | 0.0% |
| Total | 30,063,653 | 192,289,838 | 202,303,295 | 164,751 | - | - | 20,050,196 | |
| | | | | | | | | |
Amounts in the dividend income column in the above table include any capital gain distributions from underlying funds, which are presented in the corresponding line item in the Statement of Operations, if applicable.
Amount for Fidelity Securities Lending Cash Central Fund represents the income earned on investing cash collateral, less rebates paid to borrowers and any lending agent fees associated with the loan, plus any premium payments received for lending certain types of securities.
Amounts included in the purchases and sales proceeds columns may include in-kind transactions, if applicable.
Investment Valuation
The following is a summary of the inputs used, as of February 28, 2023, involving the Fund's assets and liabilities carried at fair value. The inputs or methodology used for valuing securities may not be an indication of the risk associated with investing in those securities. For more information on valuation inputs, and their aggregation into the levels used below, please refer to the Investment Valuation section in the accompanying Notes to Financial Statements.
| Valuation Inputs at Reporting Date: |
| Description | Total ($) | Level 1 ($) | Level 2 ($) | Level 3 ($) |
Investments in Securities: | | | | |
|
| Common Stocks | 224,796,266 | 224,004,026 | 792,240 | - |
|
| Money Market Funds | 20,050,196 | 20,050,196 | - | - |
| Total Investments in Securities: | 244,846,462 | 244,054,222 | 792,240 | - |
Telecommunications Portfolio
| Statement of Assets and Liabilities |
| | | | February 28, 2023 |
| | | | | |
| Assets | | | | |
| Investment in securities, at value (including securities loaned of $9,000,796) - See accompanying schedule: | | | | |
Unaffiliated issuers (cost $234,849,854) | $ | 224,796,266 | | |
Fidelity Central Funds (cost $20,050,196) | | 20,050,196 | | |
| | | | | |
| | | | | |
| Total Investment in Securities (cost $254,900,050) | | | $ | 244,846,462 |
| Receivable for fund shares sold | | | | 36,105 |
| Distributions receivable from Fidelity Central Funds | | | | 38,155 |
| Prepaid expenses | | | | 1,096 |
| Other receivables | | | | 4,615 |
Total assets | | | | 244,926,433 |
| Liabilities | | | | |
| Payable for investments purchased | $ | 2,527,967 | | |
| Payable for fund shares redeemed | | 60,427 | | |
| Accrued management fee | | 100,519 | | |
| Distribution and service plan fees payable | | 10,442 | | |
| Other affiliated payables | | 44,463 | | |
| Other payables and accrued expenses | | 38,731 | | |
| Collateral on securities loaned | | 9,165,448 | | |
| Total Liabilities | | | | 11,947,997 |
| Net Assets | | | $ | 232,978,436 |
| Net Assets consist of: | | | | |
| Paid in capital | | | $ | 240,723,192 |
| Total accumulated earnings (loss) | | | | (7,744,756) |
| Net Assets | | | $ | 232,978,436 |
| | | | | |
| Net Asset Value and Maximum Offering Price | | | | |
| Class A : | | | | |
Net Asset Value and redemption price per share ($18,744,402 ÷ 402,473 shares) (a) | | | $ | 46.57 |
| Maximum offering price per share (100/94.25 of $46.57) | | | $ | 49.41 |
| Class M : | | | | |
Net Asset Value and redemption price per share ($7,300,643 ÷ 157,988 shares) (a) | | | $ | 46.21 |
| Maximum offering price per share (100/96.50 of $46.21) | | | $ | 47.89 |
| Class C : | | | | |
Net Asset Value and offering price per share ($3,923,028 ÷ 84,581 shares) (a) | | | $ | 46.38 |
| Telecommunications : | | | | |
Net Asset Value , offering price and redemption price per share ($171,884,681 ÷ 3,659,330 shares) | | | $ | 46.97 |
| Class I : | | | | |
Net Asset Value , offering price and redemption price per share ($28,440,751 ÷ 607,163 shares) | | | $ | 46.84 |
| Class Z : | | | | |
Net Asset Value , offering price and redemption price per share ($2,684,931 ÷ 57,467 shares) | | | $ | 46.72 |
(a)Redemption price per share is equal to net asset value less any applicable contingent deferred sales charge. |
| Statement of Operations |
| | | | Year ended February 28, 2023 |
| Investment Income | | | | |
| Dividends | | | $ | 7,071,751 |
| Interest | | | | 31 |
| Income from Fidelity Central Funds (including $22,823 from security lending) | | | | 164,751 |
| Total Income | | | | 7,236,533 |
| Expenses | | | | |
| Management fee | $ | 1,259,693 | | |
| Transfer agent fees | | 477,431 | | |
| Distribution and service plan fees | | 130,220 | | |
| Accounting fees | | 86,966 | | |
| Custodian fees and expenses | | 3,432 | | |
| Independent trustees' fees and expenses | | 820 | | |
| Registration fees | | 84,674 | | |
| Audit | | 56,787 | | |
| Legal | | 1,458 | | |
| Interest | | 1,985 | | |
| Miscellaneous | | 1,590 | | |
| Total expenses before reductions | | 2,105,056 | | |
| Expense reductions | | (8,526) | | |
| Total expenses after reductions | | | | 2,096,530 |
| Net Investment income (loss) | | | | 5,140,003 |
| Realized and Unrealized Gain (Loss) | | | | |
| Net realized gain (loss) on: | | | | |
| Investment Securities: | | | | |
| Unaffiliated issuers (net of foreign taxes of $40,436) | | 7,523,922 | | |
| Foreign currency transactions | | 7,005 | | |
| Total net realized gain (loss) | | | | 7,530,927 |
| Change in net unrealized appreciation (depreciation) on: | | | | |
| Investment Securities: | | | | |
| Unaffiliated issuers (net of decrease in deferred foreign taxes of $33,773) | | (35,291,633) | | |
| Assets and liabilities in foreign currencies | | (435) | | |
| Total change in net unrealized appreciation (depreciation) | | | | (35,292,068) |
| Net gain (loss) | | | | (27,761,141) |
| Net increase (decrease) in net assets resulting from operations | | | $ | (22,621,138) |
| Statement of Changes in Net Assets |
| |
| | Year ended February 28, 2023 | | Year ended February 28, 2022 |
| Increase (Decrease) in Net Assets | | | | |
| Operations | | | | |
| Net investment income (loss) | $ | 5,140,003 | $ | 7,853,249 |
| Net realized gain (loss) | | 7,530,927 | | 30,387,100 |
| Change in net unrealized appreciation (depreciation) | | (35,292,068) | | (51,298,844) |
| Net increase (decrease) in net assets resulting from operations | | (22,621,138) | | (13,058,495) |
| Distributions to shareholders | | (16,991,172) | | (39,228,015) |
| Share transactions - net increase (decrease) | | 20,395,222 | | (46,334,121) |
| Total increase (decrease) in net assets | | (19,217,088) | | (98,620,631) |
| | | | | |
| Net Assets | | | | |
| Beginning of period | | 252,195,524 | | 350,816,155 |
| End of period | $ | 232,978,436 | $ | 252,195,524 |
| | | | | |
| | | | | |
Financial Highlights
| Fidelity Advisor® Telecommunications Fund Class A |
| |
| Years ended February 28, | | 2023 | | 2022 | | 2021 | | 2020 A | | 2019 |
Selected Per-Share Data | | | | | | | | | | |
| Net asset value, beginning of period | $ | 54.28 | $ | 66.52 | $ | 60.60 | $ | 55.68 | $ | 55.58 |
| Income from Investment Operations | | | | | | | | | | |
Net investment income (loss) B,C | | .93 | | 1.51 D | | .66 | | .87 | | 1.10 E |
| Net realized and unrealized gain (loss) | | (5.19) | | (5.14) | | 10.61 | | 5.86 | | .56 |
| Total from investment operations | | (4.26) | | (3.63) | | 11.27 | | 6.73 | | 1.66 |
| Distributions from net investment income | | (.99) | | (1.66) | | (.39) | | (.96) | | (.94) |
| Distributions from net realized gain | | (2.46) | | (6.95) | | (4.96) | | (.85) | | (.62) |
| Total distributions | | (3.45) | | (8.61) | | (5.35) | | (1.81) | | (1.56) |
| Net asset value, end of period | $ | 46.57 | $ | 54.28 | $ | 66.52 | $ | 60.60 | $ | 55.68 |
Total Return F,G | | (7.98)% | | (6.28)% | | 18.75% | | 12.12% | | 3.03% |
Ratios to Average Net Assets C,H,I | | | | | | | | | | |
| Expenses before reductions | | 1.13% | | 1.09% | | 1.11% | | 1.18% | | 1.18% |
| Expenses net of fee waivers, if any | | 1.13% | | 1.09% | | 1.11% | | 1.17% | | 1.17% |
| Expenses net of all reductions | | 1.13% | | 1.09% | | 1.10% | | 1.17% | | 1.16% |
| Net investment income (loss) | | 1.89% | | 2.27% D | | 1.01% | | 1.47% | | 1.96% E |
| Supplemental Data | | | | | | | | | | |
| Net assets, end of period (000 omitted) | $ | 18,744 | $ | 22,023 | $ | 29,800 | $ | 21,376 | $ | 20,589 |
Portfolio turnover rate J | | 24% | | 28% | | 58% | | 58% | | 64% K |
A For the year ended February 29.
B Calculated based on average shares outstanding during the period.
C Net investment income (loss) is affected by the timing of the declaration of dividends by any underlying mutual funds or exchange-traded funds (ETFs). Net investment income (loss) of any mutual funds or ETFs is not included in the Fund's net investment income (loss) ratio.
D Net investment income per share reflects one or more large, non-recurring dividend(s) which amounted to $.35 per share. Excluding such non-recurring dividend(s), the ratio of net investment income (loss) to average net assets would have been 1.74%.
E Net investment income per share reflects one or more large, non-recurring dividend(s) which amounted to $.25 per share. Excluding such non-recurring dividend(s), the ratio of net investment income (loss) to average net assets would have been 1.52%.
F Total returns would have been lower if certain expenses had not been reduced during the applicable periods shown.
G Total returns do not include the effect of the sales charges.
H Fees and expenses of any underlying mutual funds or exchange-traded funds (ETFs) are not included in the Fund's expense ratio. The Fund indirectly bears its proportionate share of these expenses. For additional expense information related to investments in Fidelity Central Funds, please refer to the "Investments in Fidelity Central Funds" note found in the Notes to Financial Statements section of the most recent Annual or Semi-Annual report.
I Expense ratios reflect operating expenses of the class. Expenses before reductions do not reflect amounts reimbursed, waived, or reduced through arrangements with the investment adviser, brokerage services, or other offset arrangements, if applicable, and do not represent the amount paid by the class during periods when reimbursements, waivers or reductions occur.
J Amount does not include the portfolio activity of any underlying mutual funds or exchange-traded funds (ETFs).
K Portfolio turnover rate excludes securities received or delivered in-kind.
| Fidelity Advisor® Telecommunications Fund Class M |
| |
| Years ended February 28, | | 2023 | | 2022 | | 2021 | | 2020 A | | 2019 |
Selected Per-Share Data | | | | | | | | | | |
| Net asset value, beginning of period | $ | 53.88 | $ | 66.09 | $ | 60.25 | $ | 55.40 | $ | 55.31 |
| Income from Investment Operations | | | | | | | | | | |
Net investment income (loss) B,C | | .80 | | 1.29 D | | .46 | | .70 | | .92 E |
| Net realized and unrealized gain (loss) | | (5.14) | | (5.08) | | 10.54 | | 5.83 | | .55 |
| Total from investment operations | | (4.34) | | (3.79) | | 11.00 | | 6.53 | | 1.47 |
| Distributions from net investment income | | (.86) | | (1.48) | | (.20) | | (.83) | | (.76) |
| Distributions from net realized gain | | (2.46) | | (6.95) | | (4.96) | | (.85) | | (.62) |
| Total distributions | | (3.33) F | | (8.42) F | | (5.16) | | (1.68) | | (1.38) |
| Net asset value, end of period | $ | 46.21 | $ | 53.88 | $ | 66.09 | $ | 60.25 | $ | 55.40 |
Total Return G,H | | (8.21)% | | (6.55)% | | 18.39% | | 11.81% | | 2.69% |
Ratios to Average Net Assets C,I,J | | | | | | | | | | |
| Expenses before reductions | | 1.39% | | 1.39% | | 1.41% | | 1.46% | | 1.50% |
| Expenses net of fee waivers, if any | | 1.38% | | 1.38% | | 1.41% | | 1.46% | | 1.49% |
| Expenses net of all reductions | | 1.38% | | 1.38% | | 1.40% | | 1.45% | | 1.48% |
| Net investment income (loss) | | 1.64% | | 1.97% D | | .71% | | 1.19% | | 1.64% E |
| Supplemental Data | | | | | | | | | | |
| Net assets, end of period (000 omitted) | $ | 7,301 | $ | 7,733 | $ | 9,038 | $ | 6,919 | $ | 6,018 |
Portfolio turnover rate K | | 24% | | 28% | | 58% | | 58% | | 64% L |
A For the year ended February 29.
B Calculated based on average shares outstanding during the period.
C Net investment income (loss) is affected by the timing of the declaration of dividends by any underlying mutual funds or exchange-traded funds (ETFs). Net investment income (loss) of any mutual funds or ETFs is not included in the Fund's net investment income (loss) ratio.
D Net investment income per share reflects one or more large, non-recurring dividend(s) which amounted to $.35 per share. Excluding such non-recurring dividend(s), the ratio of net investment income (loss) to average net assets would have been 1.44%.
E Net investment income per share reflects one or more large, non-recurring dividend(s) which amounted to $.25 per share. Excluding such non-recurring dividend(s), the ratio of net investment income (loss) to average net assets would have been 1.19%.
F Total distributions per share do not sum due to rounding.
G Total returns would have been lower if certain expenses had not been reduced during the applicable periods shown.
H Total returns do not include the effect of the sales charges.
I Fees and expenses of any underlying mutual funds or exchange-traded funds (ETFs) are not included in the Fund's expense ratio. The Fund indirectly bears its proportionate share of these expenses. For additional expense information related to investments in Fidelity Central Funds, please refer to the "Investments in Fidelity Central Funds" note found in the Notes to Financial Statements section of the most recent Annual or Semi-Annual report.
J Expense ratios reflect operating expenses of the class. Expenses before reductions do not reflect amounts reimbursed, waived, or reduced through arrangements with the investment adviser, brokerage services, or other offset arrangements, if applicable, and do not represent the amount paid by the class during periods when reimbursements, waivers or reductions occur.
K Amount does not include the portfolio activity of any underlying mutual funds or exchange-traded funds (ETFs).
L Portfolio turnover rate excludes securities received or delivered in-kind.
| Fidelity Advisor® Telecommunications Fund Class C |
| |
| Years ended February 28, | | 2023 | | 2022 | | 2021 | | 2020 A | | 2019 |
Selected Per-Share Data | | | | | | | | | | |
| Net asset value, beginning of period | $ | 54.04 | $ | 66.17 | $ | 60.32 | $ | 55.45 | $ | 55.29 |
| Income from Investment Operations | | | | | | | | | | |
Net investment income (loss) B,C | | .56 | | 1.01 D | | .17 | | .46 | | .70 E |
| Net realized and unrealized gain (loss) | | (5.15) | | (5.09) | | 10.54 | | 5.82 | | .56 |
| Total from investment operations | | (4.59) | | (4.08) | | 10.71 | | 6.28 | | 1.26 |
| Distributions from net investment income | | (.61) | | (1.10) | | (.07) | | (.56) | | (.48) |
| Distributions from net realized gain | | (2.46) | | (6.95) | | (4.79) | | (.85) | | (.62) |
| Total distributions | | (3.07) | | (8.05) | | (4.86) | | (1.41) | | (1.10) |
| Net asset value, end of period | $ | 46.38 | $ | 54.04 | $ | 66.17 | $ | 60.32 | $ | 55.45 |
Total Return F,G | | (8.66)% | | (6.97)% | | 17.88% | | 11.34% | | 2.30% |
Ratios to Average Net Assets C,H,I | | | | | | | | | | |
| Expenses before reductions | | 1.88% | | 1.83% | | 1.86% | | 1.88% | | 1.88% |
| Expenses net of fee waivers, if any | | 1.87% | | 1.83% | | 1.86% | | 1.87% | | 1.88% |
| Expenses net of all reductions | | 1.87% | | 1.83% | | 1.84% | | 1.87% | | 1.86% |
| Net investment income (loss) | | 1.15% | | 1.52% D | | .26% | | .77% | | 1.26% E |
| Supplemental Data | | | | | | | | | | |
| Net assets, end of period (000 omitted) | $ | 3,923 | $ | 5,254 | $ | 7,801 | $ | 6,491 | $ | 6,994 |
Portfolio turnover rate J | | 24% | | 28% | | 58% | | 58% | | 64% K |
A For the year ended February 29.
B Calculated based on average shares outstanding during the period.
C Net investment income (loss) is affected by the timing of the declaration of dividends by any underlying mutual funds or exchange-traded funds (ETFs). Net investment income (loss) of any mutual funds or ETFs is not included in the Fund's net investment income (loss) ratio.
D Net investment income per share reflects one or more large, non-recurring dividend(s) which amounted to $.35 per share. Excluding such non-recurring dividend(s), the ratio of net investment income (loss) to average net assets would have been .99%.
E Net investment income per share reflects one or more large, non-recurring dividend(s) which amounted to $.25 per share. Excluding such non-recurring dividend(s), the ratio of net investment income (loss) to average net assets would have been .81%.
F Total returns would have been lower if certain expenses had not been reduced during the applicable periods shown.
G Total returns do not include the effect of the contingent deferred sales charge.
H Fees and expenses of any underlying mutual funds or exchange-traded funds (ETFs) are not included in the Fund's expense ratio. The Fund indirectly bears its proportionate share of these expenses. For additional expense information related to investments in Fidelity Central Funds, please refer to the "Investments in Fidelity Central Funds" note found in the Notes to Financial Statements section of the most recent Annual or Semi-Annual report.
I Expense ratios reflect operating expenses of the class. Expenses before reductions do not reflect amounts reimbursed, waived, or reduced through arrangements with the investment adviser, brokerage services, or other offset arrangements, if applicable, and do not represent the amount paid by the class during periods when reimbursements, waivers or reductions occur.
J Amount does not include the portfolio activity of any underlying mutual funds or exchange-traded funds (ETFs).
K Portfolio turnover rate excludes securities received or delivered in-kind.
| Telecommunications Portfolio |
| |
| Years ended February 28, | | 2023 | | 2022 | | 2021 | | 2020 A | | 2019 |
Selected Per-Share Data | | | | | | | | | | |
| Net asset value, beginning of period | $ | 54.73 | $ | 67.04 | $ | 60.99 | $ | 56.04 | $ | 55.88 |
| Income from Investment Operations | | | | | | | | | | |
Net investment income (loss) B,C | | 1.09 | | 1.71 D | | .86 | | 1.09 | | 1.30 E |
| Net realized and unrealized gain (loss) | | (5.24) | | (5.18) | | 10.71 | | 5.90 | | .56 |
| Total from investment operations | | (4.15) | | (3.47) | | 11.57 | | 6.99 | | 1.86 |
| Distributions from net investment income | | (1.15) | | (1.89) | | (.57) | | (1.19) | | (1.08) |
| Distributions from net realized gain | | (2.46) | | (6.95) | | (4.96) | | (.85) | | (.62) |
| Total distributions | | (3.61) | | (8.84) | | (5.52) F | | (2.04) | | (1.70) |
| Net asset value, end of period | $ | 46.97 | $ | 54.73 | $ | 67.04 | $ | 60.99 | $ | 56.04 |
Total Return G | | (7.71)% | | (5.99)% | | 19.15% | | 12.50% | | 3.38% |
Ratios to Average Net Assets C,H,I | | | | | | | | | | |
| Expenses before reductions | | .82% | | .79% | | .81% | | .83% | | .84% |
| Expenses net of fee waivers, if any | | .82% | | .79% | | .81% | | .82% | | .83% |
| Expenses net of all reductions | | .82% | | .79% | | .79% | | .82% | | .82% |
| Net investment income (loss) | | 2.20% | | 2.57% D | | 1.31% | | 1.82% | | 2.30% E |
| Supplemental Data | | | | | | | | | | |
| Net assets, end of period (000 omitted) | $ | 171,885 | $ | 199,560 | $ | 242,284 | $ | 219,854 | $ | 227,438 |
Portfolio turnover rate J | | 24% | | 28% | | 58% | | 58% | | 64% K |
A For the year ended February 29.
B Calculated based on average shares outstanding during the period.
C Net investment income (loss) is affected by the timing of the declaration of dividends by any underlying mutual funds or exchange-traded funds (ETFs). Net investment income (loss) of any mutual funds or ETFs is not included in the Fund's net investment income (loss) ratio.
D Net investment income per share reflects one or more large, non-recurring dividend(s) which amounted to $.35 per share. Excluding such non-recurring dividend(s), the ratio of net investment income (loss) to average net assets would have been 2.04%.
E Net investment income per share reflects one or more large, non-recurring dividend(s) which amounted to $.25 per share. Excluding such non-recurring dividend(s), the ratio of net investment income (loss) to average net assets would have been 1.85%.
F Total distributions per share do not sum due to rounding.
G Total returns would have been lower if certain expenses had not been reduced during the applicable periods shown.
H Fees and expenses of any underlying mutual funds or exchange-traded funds (ETFs) are not included in the Fund's expense ratio. The Fund indirectly bears its proportionate share of these expenses. For additional expense information related to investments in Fidelity Central Funds, please refer to the "Investments in Fidelity Central Funds" note found in the Notes to Financial Statements section of the most recent Annual or Semi-Annual report.
I Expense ratios reflect operating expenses of the class. Expenses before reductions do not reflect amounts reimbursed, waived, or reduced through arrangements with the investment adviser, brokerage services, or other offset arrangements, if applicable, and do not represent the amount paid by the class during periods when reimbursements, waivers or reductions occur.
J Amount does not include the portfolio activity of any underlying mutual funds or exchange-traded funds (ETFs).
K Portfolio turnover rate excludes securities received or delivered in-kind.
| Fidelity Advisor® Telecommunications Fund Class I |
| |
| Years ended February 28, | | 2023 | | 2022 | | 2021 | | 2020 A | | 2019 |
Selected Per-Share Data | | | | | | | | | | |
| Net asset value, beginning of period | $ | 54.58 | $ | 66.84 | $ | 60.86 | $ | 55.84 | $ | 55.74 |
| Income from Investment Operations | | | | | | | | | | |
Net investment income (loss) B,C | | 1.10 | | 1.74 D | | .88 | | 1.04 | | 1.27 E |
| Net realized and unrealized gain (loss) | | (5.21) | | (5.18) | | 10.66 | | 5.91 | | .57 |
| Total from investment operations | | (4.11) | | (3.44) | | 11.54 | | 6.95 | | 1.84 |
| Distributions from net investment income | | (1.16) | | (1.87) | | (.60) | | (1.08) | | (1.12) |
| Distributions from net realized gain | | (2.46) | | (6.95) | | (4.96) | | (.85) | | (.62) |
| Total distributions | | (3.63) F | | (8.82) | | (5.56) | | (1.93) | | (1.74) |
| Net asset value, end of period | $ | 46.84 | $ | 54.58 | $ | 66.84 | $ | 60.86 | $ | 55.84 |
Total Return G | | (7.67)% | | (5.97)% | | 19.13% | | 12.47% | | 3.35% |
Ratios to Average Net Assets C,H,I | | | | | | | | | | |
| Expenses before reductions | | .78% | | .77% | | .79% | | .88% | | .91% |
| Expenses net of fee waivers, if any | | .78% | | .77% | | .79% | | .88% | | .90% |
| Expenses net of all reductions | | .78% | | .77% | | .78% | | .88% | | .88% |
| Net investment income (loss) | | 2.25% | | 2.59% D | | 1.33% | | 1.76% | | 2.23% E |
| Supplemental Data | | | | | | | | | | |
| Net assets, end of period (000 omitted) | $ | 28,441 | $ | 12,038 | $ | 30,622 | $ | 12,428 | $ | 25,181 |
Portfolio turnover rate J | | 24% | | 28% | | 58% | | 58% | | 64% K |
A For the year ended February 29.
B Calculated based on average shares outstanding during the period.
C Net investment income (loss) is affected by the timing of the declaration of dividends by any underlying mutual funds or exchange-traded funds (ETFs). Net investment income (loss) of any mutual funds or ETFs is not included in the Fund's net investment income (loss) ratio.
D Net investment income per share reflects one or more large, non-recurring dividend(s) which amounted to $.36 per share. Excluding such non-recurring dividend(s), the ratio of net investment income (loss) to average net assets would have been 2.06%.
E Net investment income per share reflects one or more large, non-recurring dividend(s) which amounted to $.25 per share. Excluding such non-recurring dividend(s), the ratio of net investment income (loss) to average net assets would have been 1.79%.
F Total distributions per share do not sum due to rounding.
G Total returns would have been lower if certain expenses had not been reduced during the applicable periods shown.
H Fees and expenses of any underlying mutual funds or exchange-traded funds (ETFs) are not included in the Fund's expense ratio. The Fund indirectly bears its proportionate share of these expenses. For additional expense information related to investments in Fidelity Central Funds, please refer to the "Investments in Fidelity Central Funds" note found in the Notes to Financial Statements section of the most recent Annual or Semi-Annual report.
I Expense ratios reflect operating expenses of the class. Expenses before reductions do not reflect amounts reimbursed, waived, or reduced through arrangements with the investment adviser, brokerage services, or other offset arrangements, if applicable, and do not represent the amount paid by the class during periods when reimbursements, waivers or reductions occur.
J Amount does not include the portfolio activity of any underlying mutual funds or exchange-traded funds (ETFs).
K Portfolio turnover rate excludes securities received or delivered in-kind.
| Fidelity Advisor® Telecommunications Fund Class Z |
| |
| Years ended February 28, | | 2023 | | 2022 | | 2021 | | 2020 A | | 2019 B |
Selected Per-Share Data | | | | | | | | | | |
| Net asset value, beginning of period | $ | 54.46 | $ | 66.75 | $ | 60.75 | $ | 55.84 | $ | 60.97 |
| Income from Investment Operations | | | | | | | | | | |
Net investment income (loss) C,D | | 1.18 | | 1.83 E | | .95 | | 1.20 | | .39 F |
| Net realized and unrealized gain (loss) | | (5.23) | | (5.20) | | 10.67 | | 5.86 | | (4.55) |
| Total from investment operations | | (4.05) | | (3.37) | | 11.62 | | 7.06 | | (4.16) |
| Distributions from net investment income | | (1.22) | | (1.98) | | (.67) | | (1.30) | | (.97) |
| Distributions from net realized gain | | (2.46) | | (6.95) | | (4.96) | | (.85) | | - |
| Total distributions | | (3.69) G | | (8.92) G | | (5.62) G | | (2.15) | | (.97) |
| Net asset value, end of period | $ | 46.72 | $ | 54.46 | $ | 66.75 | $ | 60.75 | $ | 55.84 |
Total Return H,I | | (7.56)% | | (5.87)% | | 19.31% | | 12.68% | | (6.80)% |
Ratios to Average Net Assets D,J,K | | | | | | | | | | |
| Expenses before reductions | | .67% | | .65% | | .67% | | .68% | | .68% L |
| Expenses net of fee waivers, if any | | .66% | | .65% | | .67% | | .67% | | .66% L |
| Expenses net of all reductions | | .66% | | .65% | | .65% | | .67% | | .64% L |
| Net investment income (loss) | | 2.36% | | 2.71% E | | 1.45% | | 1.97% | | 1.67% F,L |
| Supplemental Data | | | | | | | | | | |
| Net assets, end of period (000 omitted) | $ | 2,685 | $ | 5,587 | $ | 31,271 | $ | 25,223 | $ | 383 |
Portfolio turnover rate M | | 24% | | 28% | | 58% | | 58% | | 64% N |
A For the year ended February 29.
B For the period October 2, 2018 (commencement of sale of shares) through February 28, 2019.
C Calculated based on average shares outstanding during the period.
D Net investment income (loss) is affected by the timing of the declaration of dividends by any underlying mutual funds or exchange-traded funds (ETFs). Net investment income (loss) of any mutual funds or ETFs is not included in the Fund's net investment income (loss) ratio.
E Net investment income per share reflects one or more large, non-recurring dividend(s) which amounted to $.36 per share. Excluding such non-recurring dividend(s), the ratio of net investment income (loss) to average net assets would have been 2.17%.
F Net investment income per share reflects one or more large, non-recurring dividend(s) which amounted to $.10 per share. Excluding such non-recurring dividend(s), the ratio of net investment income (loss) to average net assets would have been 1.23%.
G Total distributions per share do not sum due to rounding.
H Total returns for periods of less than one year are not annualized.
I Total returns would have been lower if certain expenses had not been reduced during the applicable periods shown.
J Fees and expenses of any underlying mutual funds or exchange-traded funds (ETFs) are not included in the Fund's expense ratio. The Fund indirectly bears its proportionate share of these expenses. For additional expense information related to investments in Fidelity Central Funds, please refer to the "Investments in Fidelity Central Funds" note found in the Notes to Financial Statements section of the most recent Annual or Semi-Annual report.
K Expense ratios reflect operating expenses of the class. Expenses before reductions do not reflect amounts reimbursed, waived, or reduced through arrangements with the investment adviser, brokerage services, or other offset arrangements, if applicable, and do not represent the amount paid by the class during periods when reimbursements, waivers or reductions occur.
L Annualized.
M Amount does not include the portfolio activity of any underlying mutual funds or exchange-traded funds (ETFs).
N Portfolio turnover rate excludes securities received or delivered in-kind.
For the period ended February 28, 2023
1. Organization.
Telecommunications Portfolio (the Fund) is a non-diversified fund of Fidelity Select Portfolios (the Trust) and is authorized to issue an unlimited number of shares. The Trust is registered under the Investment Company Act of 1940, as amended (the 1940 Act), as an open-end management investment company organized as a Massachusetts business trust. The Fund invests primarily in securities of companies whose principal business activities fall within specific industries. The Fund offers Fidelity Advisor Telecommunications Fund Class A (Class A), Fidelity Advisor Telecommunications Fund Class M (Class M), Fidelity Advisor Telecommunications Fund Class C (Class C), Telecommunications Portfolio (Telecommunications), Fidelity Advisor Telecommunications Fund Class I (Class I) and Fidelity Advisor Telecommunications Fund Class Z (Class Z) shares, each of which has equal rights as to assets and voting privileges. Each class has exclusive voting rights with respect to matters that affect that class. Class C shares will automatically convert to Class A shares after a holding period of eight years from the initial date of purchase, with certain exceptions.
2. Investments in Fidelity Central Funds.
Funds may invest in Fidelity Central Funds, which are open-end investment companies generally available only to other investment companies and accounts managed by the investment adviser and its affiliates. The Schedule of Investments lists any Fidelity Central Funds held as an investment as of period end, but does not include the underlying holdings of each Fidelity Central Fund. An investing fund indirectly bears its proportionate share of the expenses of the underlying Fidelity Central Funds.
Based on its investment objective, each Fidelity Central Fund may invest or participate in various investment vehicles or strategies that are similar to those of the investing fund. These strategies are consistent with the investment objectives of the investing fund and may involve certain economic risks which may cause a decline in value of each of the Fidelity Central Funds and thus a decline in the value of the investing fund.
| Fidelity Central Fund | Investment Manager | Investment Objective | Investment Practices | Expense Ratio A |
| Fidelity Money Market Central Funds | Fidelity Management & Research Company LLC (FMR) | Each fund seeks to obtain a high level of current income consistent with the preservation of capital and liquidity. | Short-term Investments | Less than .005% |
A Expenses expressed as a percentage of average net assets and are as of each underlying Central Fund's most recent annual or semi-annual shareholder report.
A complete unaudited list of holdings for each Fidelity Central Fund is available upon request or at the Securities and Exchange Commission website at www.sec.gov. In addition, the financial statements of the Fidelity Central Funds which contain the significant accounting policies (including investment valuation policies) of those funds, and are not covered by the Report of Independent Registered Public Accounting Firm, are available on the Securities and Exchange Commission website or upon request.
3. Significant Accounting Policies.
The Fund is an investment company and applies the accounting and reporting guidance of the Financial Accounting Standards Board (FASB) Accounting Standards Codification Topic 946 Financial Services - Investment Companies . The financial statements have been prepared in conformity with accounting principles generally accepted in the United States of America (GAAP), which require management to make certain estimates and assumptions at the date of the financial statements. Actual results could differ from those estimates. Subsequent events, if any, through the date that the financial statements were issued have been evaluated in the preparation of the financial statements. The Fund's Schedule of Investments lists any underlying mutual funds or exchange-traded funds (ETFs) but does not include the underlying holdings of these funds. The following summarizes the significant accounting policies of the Fund:
Investment Valuation. Investments are valued as of 4:00 p.m. Eastern time on the last calendar day of the period. The Board of Trustees (the Board) has designated the Fund's investment adviser as the valuation designee responsible for the fair valuation function and performing fair value determinations as needed. The investment adviser has established a Fair Value Committee (the Committee) to carry out the day-to-day fair valuation responsibilities and has adopted policies and procedures to govern the fair valuation process and the activities of the Committee. In accordance with these fair valuation policies and procedures, which have been approved by the Board, the Fund attempts to obtain prices from one or more third party pricing services or brokers to value its investments. When current market prices, quotations or currency exchange rates are not readily available or reliable, investments will be fair valued in good faith by the Committee, in accordance with the policies and procedures. Factors used in determining fair value vary by investment type and may include market or investment specific events, transaction data, estimated cash flows, and market observations of comparable investments. The frequency that the fair valuation procedures are used cannot be predicted and they may be utilized to a significant extent. The Committee manages the Fund's fair valuation practices and maintains the fair valuation policies and procedures. The Fund's investment adviser reports to the Board information regarding the fair valuation process and related material matters.
The Fund categorizes the inputs to valuation techniques used to value its investments into a disclosure hierarchy consisting of three levels as shown below:
Level 1 - unadjusted quoted prices in active markets for identical investments
Level 2 - other significant observable inputs (including quoted prices for similar investments, interest rates, prepayment speeds, etc.)
Level 3 - unobservable inputs (including the Fund's own assumptions based on the best information available)
Valuation techniques used to value the Fund's investments by major category are as follows:
Equity securities, including restricted securities, for which market quotations are readily available, are valued at the last reported sale price or official closing price as reported by a third party pricing service on the primary market or exchange on which they are traded and are categorized as Level 1 in the hierarchy. In the event there were no sales during the day or closing prices are not available, securities are valued at the last quoted bid price or may be valued using the last available price and are generally categorized as Level 2 in the hierarchy. For foreign equity securities, when market or security specific events arise, comparisons to the valuation of American Depositary Receipts (ADRs), futures contracts, ETFs and certain indexes as well as quoted prices for similar securities may be used and would be categorized as Level 2 in the hierarchy. For equity securities, including restricted securities, where observable inputs are limited, assumptions about market activity and risk are used and these securities may be categorized as Level 3 in the hierarchy.
Investments in open-end mutual funds, including the Fidelity Central Funds, are valued at their closing net asset value (NAV) each business day and are categorized as Level 1 in the hierarchy.
Changes in valuation techniques may result in transfers in or out of an assigned level within the disclosure hierarchy. The aggregate value of investments by input level as of February 28, 2023 is included at the end of the Fund's Schedule of Investments.
Foreign Currency. Certain Funds may use foreign currency contracts to facilitate transactions in foreign-denominated securities. Gains and losses from these transactions may arise from changes in the value of the foreign currency or if the counterparties do not perform under the contracts' terms.
Foreign-denominated assets, including investment securities, and liabilities are translated into U.S. dollars at the exchange rates at period end. Purchases and sales of investment securities, income and dividends received, and expenses denominated in foreign currencies are translated into U.S. dollars at the exchange rate in effect on the transaction date.
The effects of exchange rate fluctuations on investments are included with the net realized and unrealized gain (loss) on investment securities. Other foreign currency transactions resulting in realized and unrealized gain (loss) are disclosed separately.
Investment Transactions and Income. For financial reporting purposes, the Fund's investment holdings and NAV include trades executed through the end of the last business day of the period. The NAV per share for processing shareholder transactions is calculated as of the close of business of the New York Stock Exchange (NYSE), normally 4:00 p.m. Eastern time and includes trades executed through the end of the prior business day. Gains and losses on securities sold are determined on the basis of identified cost and include proceeds received from litigation. Commissions paid to certain brokers with whom the investment adviser, or its affiliates, places trades on behalf of a fund include an amount in addition to trade execution, which may be rebated back to a fund. Any such rebates are included in net realized gain (loss) on investments in the Statement of Operations. Dividend income is recorded on the ex-dividend date, except for certain dividends from foreign securities where the ex-dividend date may have passed, which are recorded as soon as the Fund is informed of the ex-dividend date. Non-cash dividends included in dividend income, if any, are recorded at the fair market value of the securities received. Income and capital gain distributions from Fidelity Central Funds, if any, are recorded on the ex-dividend date. Certain distributions received by the Fund represent a return of capital or capital gain. The Fund determines the components of these distributions subsequent to the ex-dividend date, based upon receipt of tax filings or other correspondence relating to the underlying investment. These distributions are recorded as a reduction of cost of investments and/or as a realized gain. Interest income is accrued as earned and includes coupon interest and amortization of premium and accretion of discount on debt securities as applicable. Investment income is recorded net of foreign taxes withheld where recovery of such taxes is uncertain.
Class Allocations and Expenses. Investment income, realized and unrealized capital gains and losses, common expenses of a fund, and certain fund-level expense reductions, if any, are allocated daily on a pro-rata basis to each class based on the relative net assets of each class to the total net assets of a fund. Each class differs with respect to transfer agent and distribution and service plan fees incurred, as applicable. Certain expense reductions may also differ by class, if applicable. For the reporting period, the allocated portion of income and expenses to each class as a percent of its average net assets may vary due to the timing of recording these transactions in relation to fluctuating net assets of the classes. Expenses directly attributable to a fund are charged to that fund. Expenses attributable to more than one fund are allocated among the respective funds on the basis of relative net assets or other appropriate methods. Expenses included in the accompanying financial statements reflect the expenses of that fund and do not include any expenses associated with any underlying mutual funds or exchange-traded funds. Although not included in a fund's expenses, a fund indirectly bears its proportionate share of these expenses through the net asset value of each underlying mutual fund or exchange-traded fund. Expense estimates are accrued in the period to which they relate and adjustments are made when actual amounts are known.
Income Tax Information and Distributions to Shareholders. Each year, the Fund intends to qualify as a regulated investment company under Subchapter M of the Internal Revenue Code, including distributing substantially all of its taxable income and realized gains. As a result, no provision for U.S. Federal income taxes is required. As of February 28, 2023, the Fund did not have any unrecognized tax benefits in the financial statements; nor is the Fund aware of any tax positions for which it is reasonably possible that the total amounts of unrecognized tax benefits will significantly change in the next twelve months. The Fund files a U.S. federal tax return, in addition to state and local tax returns as required. The Fund's federal income tax returns are subject to examination by the Internal Revenue Service (IRS) for a period of three fiscal years after they are filed. State and local tax returns may be subject to examination for an additional fiscal year depending on the jurisdiction. Foreign taxes are provided for based on the Fund's understanding of the tax rules and rates that exist in the foreign markets in which it invests. The Fund is subject to a tax imposed on capital gains by certain countries in which it invests.
Distributions are declared and recorded on the ex-dividend date. Income and capital gain distributions are declared separately for each class. Income and capital gain distributions are determined in accordance with income tax regulations, which may differ from GAAP.
Capital accounts within the financial statements are adjusted for permanent book-tax differences. These adjustments have no impact on net assets or the results of operations. Capital accounts are not adjusted for temporary book-tax differences which will reverse in a subsequent period.
Book-tax differences are primarily due to foreign currency transactions, certain foreign taxes losses deferred due to wash sales and excise tax regulations.
As of period end, the cost and unrealized appreciation (depreciation) in securities, and derivatives if applicable, for federal income tax purposes were as follows:
| Gross unrealized appreciation | $31,772,801 |
| Gross unrealized depreciation | (42,588,672) |
| Net unrealized appreciation (depreciation) | $(10,815,871) |
| Tax Cost | $255,662,333 |
The tax-based components of distributable earnings as of period end were as follows:
| Undistributed ordinary income | $740,134 |
| Undistributed long-term capital gain | $2,335,513 |
| Net unrealized appreciation (depreciation) on securities and other investments | $(10,820,402) |
The tax character of distributions paid was as follows:
| | February 28, 2023 | February 28, 2022 |
| Ordinary Income | $5,364,741 | $ 10,889,499 |
| Long-term Capital Gains | 11,626,431 | 28,338,516 |
| Total | $16,991,172 | $ 39,228,015 |
4. Purchases and Sales of Investments.
Purchases and sales of securities, other than short-term securities and in-kind transactions, as applicable, are noted in the table below.
| | Purchases ($) | Sales ($) |
| Telecommunications Portfolio | 60,649,139 | 54,489,794 |
5. Fees and Other Transactions with Affiliates.
Management Fee. Fidelity Management & Research Company LLC (the investment adviser) and its affiliates provide the Fund with investment management related services for which the Fund pays a monthly management fee. The management fee is the sum of an individual fund fee rate that is based on an annual rate of .30% of the Fund's average net assets and an annualized group fee rate that averaged .23% during the period. The group fee rate is based upon the monthly average net assets of a group of registered investment companies with which the investment adviser has management contracts. The group fee rate decreases as assets under management increase and increases as assets under management decrease. For the reporting period, the total annual management fee rate was .53% of the Fund's average net assets.
Distribution and Service Plan Fees. In accordance with Rule 12b-1 of the 1940 Act, the Fund has adopted separate Distribution and Service Plans for each class of shares. Certain classes pay Fidelity Distributors Company LLC (FDC), an affiliate of the investment adviser, separate Distribution and Service Fees, each of which is based on an annual percentage of each class' average net assets. In addition, FDC may pay financial intermediaries for selling shares of the Fund and providing shareholder support services. For the period, the Distribution and Service Fee rates, total fees and amounts retained by FDC were as follows:
| | Distribution Fee | Service Fee | Total Fees | Retained by FDC |
| Class A | - % | .25% | $48,969 | $1,338 |
| Class M | .25% | .25% | 35,890 | 410 |
| Class C | .75% | .25% | 45,361 | 4,352 |
| | | | $130,220 | $6,100 |
Sales Load. FDC may receive a front-end sales charge of up to 5.75% for selling Class A shares and 3.50% for selling Class M shares, some of which is paid to financial intermediaries for selling shares of the Fund. Depending on the holding period, FDC may receive contingent deferred sales charges levied on Class A, Class M and Class C redemptions. The deferred sales charges are 1.00% for Class C shares, 1.00% for certain purchases of Class A shares and .25% for certain purchases of Class M shares.
For the period, sales charge amounts retained by FDC were as follows:
| | Retained by FDC |
| Class A | $5,475 |
| Class M | 762 |
Class C A | 80 |
| | $6,317 |
A When Class C shares are initially sold, FDC pays commissions from its own resources to financial intermediaries through which the sales are made.
Transfer Agent Fees. Fidelity Investments Institutional Operations Company LLC (FIIOC), an affiliate of the investment adviser, is the transfer, dividend disbursing and shareholder servicing agent for each class of the Fund. FIIOC receives account fees and asset-based fees that vary according to the account size and type of account of the shareholders of the respective classes of the Fund, except for Class Z. FIIOC receives an asset-based fee of Class Z's average net assets. FIIOC pays for typesetting, printing and mailing of shareholder reports, except proxy statements.
For the period, transfer agent fees for each class were as follows:
| | Amount | % of Class-Level Average Net Assets |
| Class A | $50,235 | .26 |
| Class M | 18,704 | .26 |
| Class C | 11,486 | .25 |
| Telecommunications | 359,749 | .20 |
| Class I | 35,504 | .15 |
| Class Z | 1,753 | .04 |
| | $477,431 | |
Accounting Fees. Fidelity Service Company, Inc. (FSC), an affiliate of the investment adviser, maintains the Fund's accounting records. The accounting fee is based on the level of average net assets for each month. For the period, the fees were equivalent to the following annual rates:
| | % of Average Net Assets |
| Telecommunications Portfolio | .04 |
Brokerage Commissions. A portion of portfolio transactions were placed with brokerage firms which are affiliates of the investment adviser. Brokerage commissions are included in net realized gain (loss) and change in net unrealized appreciation (depreciation) in the Statement of Operations. The commissions paid to these affiliated firms were as follows:
| | Amount |
| Telecommunications Portfolio | $2,152 |
Interfund Lending Program. Pursuant to an Exemptive Order issued by the Securities and Exchange Commission (the SEC), the Fund, along with other registered investment companies having management contracts with Fidelity Management & Research Company LLC (FMR), or other affiliated entities of FMR, may participate in an interfund lending program. This program provides an alternative credit facility allowing the Fund to borrow from, or lend money to, other participating affiliated funds. At period end, there were no interfund loans outstanding. Activity in this program during the period for which loans were outstanding was as follows:
| | Borrower or Lender | Average Loan Balance | Weighted Average Interest Rate | Interest Expense |
| Telecommunications Portfolio | Borrower | $8,789,000 | 4.07% | $1,985 |
Interfund Trades. Funds may purchase from or sell securities to other Fidelity Funds under procedures adopted by the Board. The procedures have been designed to ensure these interfund trades are executed in accordance with Rule 17a-7 of the 1940 Act. Any interfund trades are included within the respective purchases and sales amounts shown in the Purchases and Sales of Investments note. Interfund trades during the period are noted in the table below.
| | Purchases ($) | Sales ($) | Realized Gain (Loss) ($) |
| Telecommunications Portfolio | 3,251,984 | 2,319,024 | 1,153,501 |
6. Committed Line of Credit.
Certain Funds participate with other funds managed by the investment adviser or an affiliate in a $4.25 billion credit facility (the "line of credit") to be utilized for temporary or emergency purposes to fund shareholder redemptions or for other short-term liquidity purposes. The participating funds have agreed to pay commitment fees on their pro-rata portion of the line of credit, which are reflected in Miscellaneous expenses on the Statement of Operations, and are listed below. During the period, there were no borrowings on this line of credit.
| | Amount |
| Telecommunications Portfolio | $437 |
7. Security Lending.
Funds lend portfolio securities from time to time in order to earn additional income. Lending agents are used, including National Financial Services (NFS), an affiliate of the investment adviser. Pursuant to a securities lending agreement, NFS will receive a fee, which is capped at 9.9% of a fund's daily lending revenue, for its services as lending agent. A fund may lend securities to certain qualified borrowers, including NFS. On the settlement date of the loan, a fund receives collateral (in the form of U.S. Treasury obligations, letters of credit and/or cash) against the loaned securities and maintains collateral in an amount not less than 100% of the market value of the loaned securities during the period of the loan. The market value of the loaned securities is determined at the close of business of a fund and any additional required collateral is delivered to a fund on the next business day. A fund or borrower may terminate the loan at any time, and if the borrower defaults on its obligation to return the securities loaned because of insolvency or other reasons, a fund may apply collateral received from the borrower against the obligation. A fund may experience delays and costs in recovering the securities loaned. Any cash collateral received is invested in the Fidelity Securities Lending Cash Central Fund. Any loaned securities are identified as such in the Schedule of Investments, and the value of loaned securities and cash collateral at period end, as applicable, are presented in the Statement of Assets and Liabilities. Security lending income represents the income earned on investing cash collateral, less rebates paid to borrowers and any lending agent fees associated with the loan, plus any premium payments received for lending certain types of securities. Security lending income is presented in the Statement of Operations as a component of income from Fidelity Central Funds. Affiliated security lending activity, if any, was as follows:
| | Total Security Lending Fees Paid to NFS | Security Lending Income From Securities Loaned to NFS | Value of Securities Loaned to NFS at Period End |
| Telecommunications Portfolio | $2,247 | $- | $- |
8. Expense Reductions.
During the period, transfer agent credits reduced each class' expenses as noted in the table below.
| | Expense reduction |
| Class M | $179 |
In addition, during the period the investment adviser or an affiliate reimbursed and/or waived a portion of fund-level operating expenses in the amount of $8,347.
9. Distributions to Shareholders.
Distributions to shareholders of each class were as follows:
| | Year ended February 28, 2023 | Year ended February 28, 2022 |
| Telecommunications Portfolio | | |
| Distributions to shareholders | | |
| Class A | $1,371,752 | $3,450,435 |
| Class M | 479,499 | 1,137,728 |
| Class C | 286,410 | 810,598 |
| Telecommunications | 13,019,579 | 30,567,586 |
| Class I | 1,515,681 | 2,148,608 |
| Class Z | 318,251 | 1,113,060 |
| Total | $16,991,172 | $39,228,015 |
10. Share Transactions.
Share transactions for each class were as follows and may contain in-kind transactions, automatic conversions between classes or exchanges between affiliated funds:
| | Shares | Shares | Dollars | Dollars |
| | Year ended February 28, 2023 | Year ended February 28, 2022 | Year ended February 28, 2023 | Year ended February 28, 2022 |
| Telecommunications Portfolio | | | | |
| Class A | | | | |
| Shares sold | 78,714 | 90,188 | $3,917,123 | $6,068,619 |
| Reinvestment of distributions | 27,038 | 54,998 | 1,318,232 | 3,273,159 |
| Shares redeemed | (108,969) | (187,477) | (5,376,984) | (12,278,980) |
| Net increase (decrease) | (3,217) | (42,291) | $(141,629) | $(2,937,202) |
| Class M | | | | |
| Shares sold | 34,367 | 30,229 | $1,663,349 | $1,999,078 |
| Reinvestment of distributions | 9,903 | 19,272 | 478,658 | 1,135,663 |
| Shares redeemed | (29,810) | (42,731) | (1,403,232) | (2,753,637) |
| Net increase (decrease) | 14,460 | 6,770 | $738,775 | $381,104 |
| Class C | | | | |
| Shares sold | 10,310 | 11,499 | $526,650 | $770,363 |
| Reinvestment of distributions | 5,729 | 13,391 | 280,668 | 796,726 |
| Shares redeemed | (28,682) | (45,557) | (1,415,361) | (2,968,982) |
| Net increase (decrease) | (12,643) | (20,667) | $(608,043) | $(1,401,893) |
| Telecommunications | | | | |
| Shares sold | 538,813 | 360,254 | $26,964,598 | $23,554,030 |
| Reinvestment of distributions | 247,377 | 475,371 | 12,134,608 | 28,443,914 |
| Shares redeemed | (773,315) | (803,327) | (38,015,718) | (52,542,566) |
| Net increase (decrease) | 12,875 | 32,298 | $1,083,488 | $(544,622) |
| Class I | | | | |
| Shares sold | 817,391 | 96,788 | $41,395,131 | $6,174,851 |
| Reinvestment of distributions | 29,024 | 32,650 | 1,455,032 | 1,972,758 |
| Shares redeemed | (459,823) | (367,007) | (21,772,889) | (24,500,148) |
| Net increase (decrease) | 386,592 | (237,569) | $21,077,274 | $(16,352,539) |
| Class Z | | | | |
| Shares sold | 30,184 | 57,644 | $1,459,810 | $3,735,025 |
| Reinvestment of distributions | 4,499 | 12,790 | 231,168 | 768,028 |
| Shares redeemed | (79,794) | (436,350) | (3,445,621) | (29,982,022) |
| Net increase (decrease) | (45,111) | (365,916) | $(1,754,643) | $(25,478,969) |
11. Other.
A fund's organizational documents provide former and current trustees and officers with a limited indemnification against liabilities arising in connection with the performance of their duties to the fund. In the normal course of business, a fund may also enter into contracts that provide general indemnifications. A fund's maximum exposure under these arrangements is unknown as this would be dependent on future claims that may be made against a fund. The risk of material loss from such claims is considered remote.
12. Risk and Uncertainties.
Many factors affect a fund's performance. Developments that disrupt global economies and financial markets, such as pandemics, epidemics, outbreaks of infectious diseases, war, terrorism, and environmental disasters, may significantly affect a fund's investment performance. The effects of these developments to a fund will be impacted by the types of securities in which a fund invests, the financial condition, industry, economic sector, and geographic location of an issuer, and a fund's level of investment in the securities of that issuer. Significant concentrations in security types, issuers, industries, sectors, and geographic locations may magnify the factors that affect a fund's performance.
Average annual total return reflects the change in the value of an investment, assuming reinvestment of distributions from dividend income and capital gains (the profits earned upon the sale of securities that have grown in value, if any) and assuming a constant rate of performance each year. The hypothetical investment and the average annual total returns do not reflect the deduction of taxes that a shareholder would pay on fund distributions or the redemption of fund shares. During periods of reimbursement by Fidelity, a fund's total return will be greater than it would be had the reimbursement not occurred. How a fund did yesterday is no guarantee of how it will do tomorrow.
| Average Annual Total Returns |
| | | | |
Periods ended February 28, 2023 | Past 1 year | Past 5 years | Past 10 years |
| Wireless Portfolio | -14.79% | 8.34% | 9.93% |
| $10,000 Over 10 Years |
| |
Let's say hypothetically that $10,000 was invested in Wireless Portfolio on February 28, 2013. The chart shows how the value of your investment would have changed, and also shows how the S&P 500® Index performed over the same period. |
|
|
Wireless Portfolio
Market Recap:
U.S. equities returned -7.69% for the 12 months ending February 28, 2023, according to the S&P 500 ® index. The new year began with an encouraging upturn in January (+6.28%), but stocks lost momentum in February (-2.44%) amid higher-than-expected inflation and strong jobs data. Investors took these as signs that the economy continued to run hot, even after a year of historic policy adjustment by the Federal Reserve aimed at cooling economic growth. Record inflation in 2022 prompted the Fed to aggressively tighten monetary policy, and market interest rates eclipsed their highest level in a decade, stoking recession fears and sending stocks into bear market territory. Since March 2022, the central bank has hiked its benchmark rate eight times, by 4.5 percentage points - the fastest-ever pace of monetary tightening - while also shrinking its massive asset portfolio. The latest bump came on February 2, along with a signal that the Fed plans to lift rates in March while it considers whether and when to pause increases. Against this dynamic backdrop, stocks struggled to gain traction until a strong rally ignited heading into the summer. But in September, the index returned -9.21%, one of its worst monthly results ever, before advancing 7.56% in Q4, as risky assets regained favor. For the full 12 months, value stocks handily outpaced growth. The headwind for the latter was most pronounced in the growth-oriented communication services (-25%) and consumer discretionary (-18%) sectors. In sharp contrast, energy gained 24%.
Comments from Portfolio Manager Matthew Drukker:
For the fiscal year ending February 28, 2023, the fund returned -14.79%, underperforming the -11.88% result of the Fidelity Wireless Index, as well as the broad-based S&P 500 ® index. Versus the industry index, security selection was the primary detractor, especially within the interactive media & services category. Picks among semiconductors firms, along with the internet & direct marketing retail group, also hurt. The portfolio's largest individual detractor versus the industry index was an out-of-index stake in Snap (-75%). Non-index exposure to Amazon.com (-39%) proved detrimental as well. Avoiding STMicroelectronics, an index component that gained about 15%, further weighed on the fund's relative result. In contrast, the biggest contributors to performance versus the industry index were stock picks and an overweight in wireless telecommunication services companies. Investment choices in integrated telecommunication services and trucking stocks further lifted the portfolio's relative return. The biggest individual relative contributor was an overweight position in T-Mobile U.S. (+15%), one of the fund's biggest holdings at period end. Also bolstering performance was a smaller-than-index stake in Verizon Communications, which returned roughly -23%. The company was among the fund's largest positions this period. Adding further value was a non-index stake in Uber Technologies (-8%), another sizable portfolio holding as of February 28. Notable changes in positioning include a higher allocation to the wireless telecommunication services industry and alternative carriers.
The views expressed above reflect those of the portfolio manager(s) only through the end of the period as stated on the cover of this report and do not necessarily represent the views of Fidelity or any other person in the Fidelity organization. Any such views are subject to change at any time based upon market or other conditions and Fidelity disclaims any responsibility to update such views. These views may not be relied on as investment advice and, because investment decisions for a Fidelity fund are based on numerous factors, may not be relied on as an indication of trading intent on behalf of any Fidelity fund.
Wireless Portfolio
Top Holdings (% of Fund's net assets) |
| |
| Apple, Inc. | 13.0 | |
| T-Mobile U.S., Inc. | 11.4 | |
| American Tower Corp. | 9.2 | |
| AT&T, Inc. | 8.1 | |
| Qualcomm, Inc. | 5.7 | |
| Marvell Technology, Inc. | 4.9 | |
| Uber Technologies, Inc. | 3.2 | |
| Motorola Solutions, Inc. | 2.7 | |
| Orange SA ADR | 2.6 | |
| Liberty Global PLC Class A | 2.6 | |
| | 63.4 | |
| |
| Industries (% of Fund's net assets) |
| |
| Diversified Telecommunication Services | 19.7 | |
| Wireless Telecommunication Services | 16.5 | |
| Semiconductors & Semiconductor Equipment | 14.7 | |
| Technology Hardware, Storage & Peripherals | 14.4 | |
| Equity Real Estate Investment Trusts (Reits) | 12.0 | |
| Communications Equipment | 7.2 | |
| Internet & Direct Marketing Retail | 5.1 | |
| Entertainment | 3.9 | |
| Interactive Media & Services | 3.3 | |
| Oil, Gas & Consumable Fuels | 1.1 | |
| Software | 0.6 | |
| IT Services | 0.5 | |
| Media | 0.3 | |
| |
Geographic Diversification (% of Fund's net assets) |
|
* Includes Short-Term investments and Net Other Assets (Liabilities). Percentages are based on country or territory of incorporation and are adjusted for the effect of derivatives, if applicable. |
| |
Wireless Portfolio
Showing Percentage of Net Assets
| Common Stocks - 99.3% |
| | | Shares | Value ($) |
| Communications Equipment - 7.2% | | | |
| Communications Equipment - 7.2% | | | |
| CommScope Holding Co., Inc. (a) | | 246,400 | 1,783,936 |
| Ericsson: | | | |
| (B Shares) | | 163,600 | 905,952 |
| (B Shares) sponsored ADR | | 467,700 | 2,572,350 |
| Motorola Solutions, Inc. | | 30,768 | 8,086,138 |
| Nokia Corp. sponsored ADR | | 1,398,100 | 6,431,260 |
| ViaSat, Inc. (a)(b) | | 61,201 | 1,943,744 |
| | | | 21,723,380 |
| Diversified Telecommunication Services - 19.7% | | | |
| Alternative Carriers - 4.6% | | | |
| Iridium Communications, Inc. | | 64,800 | 3,976,776 |
| Liberty Global PLC Class A (a) | | 387,500 | 7,939,875 |
| Liberty Latin America Ltd. Class C (a) | | 219,900 | 1,930,722 |
| | | | 13,847,373 |
| Integrated Telecommunication Services - 15.1% | | | |
| AT&T, Inc. | | 1,292,700 | 24,444,957 |
| Cellnex Telecom SA (c) | | 79,015 | 2,964,548 |
| Orange SA ADR (b) | | 701,200 | 8,049,776 |
| Telefonica SA sponsored ADR (b) | | 653,249 | 2,671,788 |
| Verizon Communications, Inc. | | 194,501 | 7,548,584 |
| | | | 45,679,653 |
TOTAL DIVERSIFIED TELECOMMUNICATION SERVICES | | | 59,527,026 |
| Entertainment - 3.9% | | | |
| Interactive Home Entertainment - 2.3% | | | |
| Activision Blizzard, Inc. | | 90,900 | 6,931,125 |
| Movies & Entertainment - 1.6% | | | |
| Spotify Technology SA (a) | | 9,500 | 1,104,850 |
| Warner Bros Discovery, Inc. (a) | | 236,537 | 3,694,708 |
| | | | 4,799,558 |
TOTAL ENTERTAINMENT | | | 11,730,683 |
| Equity Real Estate Investment Trusts (REITs) - 12.0% | | | |
| Specialized REITs - 12.0% | | | |
| American Tower Corp. | | 139,792 | 27,680,214 |
| Crown Castle International Corp. | | 12,801 | 1,673,731 |
| SBA Communications Corp. Class A | | 26,200 | 6,794,970 |
| | | | 36,148,915 |
| Interactive Media & Services - 3.3% | | | |
| Interactive Media & Services - 3.3% | | | |
| Meta Platforms, Inc. Class A (a) | | 45,300 | 7,924,782 |
| Snap, Inc. Class A (a) | | 184,100 | 1,868,615 |
| | | | 9,793,397 |
| Internet & Direct Marketing Retail - 5.1% | | | |
| Internet & Direct Marketing Retail - 5.1% | | | |
| Amazon.com, Inc. (a) | | 60,900 | 5,738,607 |
| Uber Technologies, Inc. (a) | | 290,100 | 9,648,726 |
| | | | 15,387,333 |
| IT Services - 0.5% | | | |
| Internet Services & Infrastructure - 0.5% | | | |
| Twilio, Inc. Class A (a) | | 22,400 | 1,505,504 |
| Media - 0.3% | | | |
| Cable & Satellite - 0.3% | | | |
| DISH Network Corp. Class A (a) | | 71,349 | 814,092 |
| Oil, Gas & Consumable Fuels - 1.1% | | | |
| Oil & Gas Refining & Marketing - 1.1% | | | |
| Reliance Industries Ltd. | | 120,800 | 3,394,810 |
| Semiconductors & Semiconductor Equipment - 14.7% | | | |
| Semiconductor Equipment - 0.9% | | | |
| Teradyne, Inc. | | 27,500 | 2,781,350 |
| Semiconductors - 13.8% | | | |
| Marvell Technology, Inc. | | 329,000 | 14,854,350 |
| NXP Semiconductors NV | | 26,400 | 4,711,872 |
| Qorvo, Inc. (a) | | 47,200 | 4,762,008 |
| Qualcomm, Inc. | | 140,350 | 17,337,436 |
| | | | 41,665,666 |
TOTAL SEMICONDUCTORS & SEMICONDUCTOR EQUIPMENT | | | 44,447,016 |
| Software - 0.6% | | | |
| Application Software - 0.6% | | | |
| LivePerson, Inc. (a) | | 84,000 | 850,080 |
| RingCentral, Inc. (a) | | 31,400 | 1,037,456 |
| Zoom Video Communications, Inc. Class A (a) | | 300 | 22,377 |
| | | | 1,909,913 |
| Technology Hardware, Storage & Peripherals - 14.4% | | | |
| Technology Hardware, Storage & Peripherals - 14.4% | | | |
| Apple, Inc. | | 267,620 | 39,449,862 |
| Samsung Electronics Co. Ltd. | | 91,160 | 4,181,303 |
| | | | 43,631,165 |
| Wireless Telecommunication Services - 16.5% | | | |
| Wireless Telecommunication Services - 16.5% | | | |
| Bharti Airtel Ltd. | | 487,600 | 4,379,226 |
| Bharti Airtel Ltd. | | 47,900 | 209,724 |
| Millicom International Cellular SA (a)(b) | | 183,680 | 3,635,027 |
| Rogers Communications, Inc. Class B (non-vtg.) | | 82,400 | 3,936,117 |
| Shenandoah Telecommunications Co. | | 300 | 5,856 |
| Spok Holdings, Inc. | | 1 | 10 |
| T-Mobile U.S., Inc. (a) | | 242,516 | 34,480,925 |
| Vodafone Group PLC sponsored ADR | | 276,981 | 3,315,463 |
| | | | 49,962,348 |
| TOTAL COMMON STOCKS (Cost $244,332,132) | | | 299,975,582 |
| | | | |
| Money Market Funds - 4.5% |
| | | Shares | Value ($) |
| Fidelity Cash Central Fund 4.63% (d) | | 2,911,720 | 2,912,303 |
| Fidelity Securities Lending Cash Central Fund 4.63% (d)(e) | | 10,798,653 | 10,799,733 |
| TOTAL MONEY MARKET FUNDS (Cost $13,712,036) | | | 13,712,036 |
| | | | |
| TOTAL INVESTMENT IN SECURITIES - 103.8% (Cost $258,044,168) | 313,687,618 |
NET OTHER ASSETS (LIABILITIES) - (3.8)% | (11,481,583) |
| NET ASSETS - 100.0% | 302,206,035 |
| | |
Legend
| (b) | Security or a portion of the security is on loan at period end. |
| (c) | Security exempt from registration under Rule 144A of the Securities Act of 1933. These securities may be resold in transactions exempt from registration, normally to qualified institutional buyers. At the end of the period, the value of these securities amounted to $2,964,548 or 1.0% of net assets. |
| (d) | Affiliated fund that is generally available only to investment companies and other accounts managed by Fidelity Investments. The rate quoted is the annualized seven-day yield of the fund at period end. A complete unaudited listing of the fund's holdings as of its most recent quarter end is available upon request. In addition, each Fidelity Central Fund's financial statements, which are not covered by the Fund's Report of Independent Registered Public Accounting Firm, are available on the SEC's website or upon request. |
| (e) | Investment made with cash collateral received from securities on loan. |
Affiliated Central Funds
Fiscal year to date information regarding the Fund's investments in Fidelity Central Funds, including the ownership percentage, is presented below.
| Affiliate | Value, beginning of period ($) | Purchases ($) | Sales Proceeds ($) | Dividend Income ($) | Realized Gain (loss) ($) | Change in Unrealized appreciation (depreciation) ($) | Value, end of period ($) | % ownership, end of period |
| Fidelity Cash Central Fund 4.63% | 678,387 | 52,911,810 | 50,677,894 | 29,296 | - | - | 2,912,303 | 0.0% |
| Fidelity Securities Lending Cash Central Fund 4.63% | 11,173,355 | 132,164,749 | 132,538,371 | 196,298 | - | - | 10,799,733 | 0.0% |
| Total | 11,851,742 | 185,076,559 | 183,216,265 | 225,594 | - | - | 13,712,036 | |
| | | | | | | | | |
Amounts in the dividend income column in the above table include any capital gain distributions from underlying funds, which are presented in the corresponding line item in the Statement of Operations, if applicable.
Amount for Fidelity Securities Lending Cash Central Fund represents the income earned on investing cash collateral, less rebates paid to borrowers and any lending agent fees associated with the loan, plus any premium payments received for lending certain types of securities.
Amounts included in the purchases and sales proceeds columns may include in-kind transactions, if applicable.
Investment Valuation
The following is a summary of the inputs used, as of February 28, 2023, involving the Fund's assets and liabilities carried at fair value. The inputs or methodology used for valuing securities may not be an indication of the risk associated with investing in those securities. For more information on valuation inputs, and their aggregation into the levels used below, please refer to the Investment Valuation section in the accompanying Notes to Financial Statements.
| Valuation Inputs at Reporting Date: |
| Description | Total ($) | Level 1 ($) | Level 2 ($) | Level 3 ($) |
Investments in Securities: | | | | |
|
| Common Stocks | 299,975,582 | 296,105,082 | 3,870,500 | - |
|
| Money Market Funds | 13,712,036 | 13,712,036 | - | - |
| Total Investments in Securities: | 313,687,618 | 309,817,118 | 3,870,500 | - |
Wireless Portfolio
| Statement of Assets and Liabilities |
| | | | February 28, 2023 |
| | | | | |
| Assets | | | | |
| Investment in securities, at value (including securities loaned of $10,324,284) - See accompanying schedule: | | | | |
Unaffiliated issuers (cost $244,332,132) | $ | 299,975,582 | | |
Fidelity Central Funds (cost $13,712,036) | | 13,712,036 | | |
| | | | | |
| | | | | |
| Total Investment in Securities (cost $258,044,168) | | | $ | 313,687,618 |
| Foreign currency held at value (cost $16) | | | | 16 |
| Receivable for fund shares sold | | | | 30,194 |
| Dividends receivable | | | | 109,470 |
| Distributions receivable from Fidelity Central Funds | | | | 20,553 |
| Prepaid expenses | | | | 955 |
| Other receivables | | | | 11,722 |
Total assets | | | | 313,860,528 |
| Liabilities | | | | |
| Payable for fund shares redeemed | $ | 207,732 | | |
| Accrued management fee | | 137,941 | | |
| Other affiliated payables | | 62,860 | | |
| Other payables and accrued expenses | | 446,158 | | |
| Collateral on securities loaned | | 10,799,802 | | |
| Total Liabilities | | | | 11,654,493 |
| Net Assets | | | $ | 302,206,035 |
| Net Assets consist of: | | | | |
| Paid in capital | | | $ | 248,605,064 |
| Total accumulated earnings (loss) | | | | 53,600,971 |
| Net Assets | | | $ | 302,206,035 |
Net Asset Value , offering price and redemption price per share ($302,206,035 ÷ 29,714,321 shares) | | | $ | 10.17 |
| Statement of Operations |
| | | | Year ended February 28, 2023 |
| Investment Income | | | | |
| Dividends | | | $ | 5,304,399 |
| Income from Fidelity Central Funds (including $196,298 from security lending) | | | | 225,594 |
| Total Income | | | | 5,529,993 |
| Expenses | | | | |
| Management fee | $ | 1,782,936 | | |
| Transfer agent fees | | 678,545 | | |
| Accounting fees | | 123,187 | | |
| Custodian fees and expenses | | (1,760) | | |
| Independent trustees' fees and expenses | | 1,173 | | |
| Registration fees | | 28,699 | | |
| Audit | | 56,986 | | |
| Legal | | 2,541 | | |
| Interest | | 927 | | |
| Miscellaneous | | 1,916 | | |
| Total expenses before reductions | | 2,675,150 | | |
| Expense reductions | | (12,049) | | |
| Total expenses after reductions | | | | 2,663,101 |
| Net Investment income (loss) | | | | 2,866,892 |
| Realized and Unrealized Gain (Loss) | | | | |
| Net realized gain (loss) on: | | | | |
| Investment Securities: | | | | |
| Unaffiliated issuers (net of foreign taxes of $305,473) | | 10,209,051 | | |
| Foreign currency transactions | | (4,251) | | |
| Total net realized gain (loss) | | | | 10,204,800 |
| Change in net unrealized appreciation (depreciation) on: | | | | |
| Investment Securities: | | | | |
| Unaffiliated issuers (net of decrease in deferred foreign taxes of $315,365) | | (72,756,061) | | |
| Assets and liabilities in foreign currencies | | (4,105) | | |
| Total change in net unrealized appreciation (depreciation) | | | | (72,760,166) |
| Net gain (loss) | | | | (62,555,366) |
| Net increase (decrease) in net assets resulting from operations | | | $ | (59,688,474) |
| Statement of Changes in Net Assets |
| |
| | Year ended February 28, 2023 | | Year ended February 28, 2022 |
| Increase (Decrease) in Net Assets | | | | |
| Operations | | | | |
| Net investment income (loss) | $ | 2,866,892 | $ | 3,198,096 |
| Net realized gain (loss) | | 10,204,800 | | 34,525,197 |
| Change in net unrealized appreciation (depreciation) | | (72,760,166) | | (15,899,186) |
| Net increase (decrease) in net assets resulting from operations | | (59,688,474) | | 21,824,107 |
| Distributions to shareholders | | (26,743,653) | | (34,390,230) |
| Share transactions | | | | |
| Proceeds from sales of shares | | 36,656,737 | | 52,081,537 |
| Reinvestment of distributions | | 24,990,417 | | 32,470,195 |
| Cost of shares redeemed | | (76,575,168) | | (108,715,196) |
Net increase (decrease) in net assets resulting from share transactions | | (14,928,014) | | (24,163,464) |
| Total increase (decrease) in net assets | | (101,360,141) | | (36,729,587) |
| | | | | |
| Net Assets | | | | |
| Beginning of period | | 403,566,176 | | 440,295,763 |
| End of period | $ | 302,206,035 | $ | 403,566,176 |
| | | | | |
| Other Information | | | | |
| Shares | | | | |
| Sold | | 3,281,452 | | 3,719,197 |
| Issued in reinvestment of distributions | | 2,265,748 | | 2,345,099 |
| Redeemed | | (7,089,181) | | (7,824,819) |
| Net increase (decrease) | | (1,541,981) | | (1,760,523) |
| | | | | |
Financial Highlights
| Years ended February 28, | | 2023 | | 2022 | | 2021 | | 2020 A | | 2019 |
Selected Per-Share Data | | | | | | | | | | |
| Net asset value, beginning of period | $ | 12.91 | $ | 13.34 | $ | 10.69 | $ | 8.93 | $ | 10.29 |
| Income from Investment Operations | | | | | | | | | | |
Net investment income (loss) B,C | | .09 | | .10 | | .10 | | .14 | | .20 D |
| Net realized and unrealized gain (loss) | | (1.95) | | .54 | | 3.50 | | 1.93 | | (.24) E |
| Total from investment operations | | (1.86) | | .64 | | 3.60 | | 2.07 | | (.04) |
| Distributions from net investment income | | (.09) | | (.09) | | (.10) | | (.12) | | (.19) |
| Distributions from net realized gain | | (.79) | | (.98) | | (.86) | | (.19) | | (1.13) |
| Total distributions | | (.88) | | (1.07) | | (.95) F | | (.31) | | (1.32) |
| Net asset value, end of period | $ | 10.17 | $ | 12.91 | $ | 13.34 | $ | 10.69 | $ | 8.93 |
Total Return G | | (14.79)% | | 4.40% | | 36.09% | | 23.01% | | .21% |
Ratios to Average Net Assets C,H,I | | | | | | | | | | |
| Expenses before reductions | | .79% | | .77% | | .79% | | .81% | | .83% |
| Expenses net of fee waivers, if any | | .79% | | .77% | | .79% | | .81% | | .83% |
| Expenses net of all reductions | | .79% | | .77% | | .78% | | .81% | | .82% |
| Net investment income (loss) | | .85% | | .69% | | .80% | | 1.39% | | 2.07% D |
| Supplemental Data | | | | | | | | | | |
| Net assets, end of period (000 omitted) | $ | 302,206 | $ | 403,566 | $ | 440,296 | $ | 355,309 | $ | 237,907 |
Portfolio turnover rate J | | 11% | | 30% | | 55% | | 78% | | 54% |
A For the year ended February 29.
B Calculated based on average shares outstanding during the period.
C Net investment income (loss) is affected by the timing of the declaration of dividends by any underlying mutual funds or exchange-traded funds (ETFs). Net investment income (loss) of any mutual funds or ETFs is not included in the Fund's net investment income (loss) ratio.
D Net investment income per share reflects one or more large, non-recurring dividend(s) which amounted to $.03 per share. Excluding such non-recurring dividend(s), the ratio of net investment income (loss) to average net assets would have been 1.74%.
E Net realized and unrealized gain (loss) per share reflects proceeds received from litigation which amounted to $.01 per share. Excluding these litigation proceeds, the total return would have been .12%.
F Total distributions per share do not sum due to rounding.
G Total returns would have been lower if certain expenses had not been reduced during the applicable periods shown.
H Fees and expenses of any underlying mutual funds or exchange-traded funds (ETFs) are not included in the Fund's expense ratio. The Fund indirectly bears its proportionate share of these expenses. For additional expense information related to investments in Fidelity Central Funds, please refer to the "Investments in Fidelity Central Funds" note found in the Notes to Financial Statements section of the most recent Annual or Semi-Annual report.
I Expense ratios reflect operating expenses of the class. Expenses before reductions do not reflect amounts reimbursed, waived, or reduced through arrangements with the investment adviser, brokerage services, or other offset arrangements, if applicable, and do not represent the amount paid by the class during periods when reimbursements, waivers or reductions occur.
J Amount does not include the portfolio activity of any underlying mutual funds or exchange-traded funds (ETFs).
For the period ended February 28, 2023
1. Organization.
Wireless Portfolio (the Fund) is a non-diversified fund of Fidelity Select Portfolios (the Trust) and is authorized to issue an unlimited number of shares. Share transactions on the Statement of Changes in Net Assets may contain exchanges between affiliated funds. The Trust is registered under the Investment Company Act of 1940, as amended (the 1940 Act), as an open-end management investment company organized as a Massachusetts business trust. The Fund invests primarily in securities of companies whose principal business activities fall within specific industries.
2. Investments in Fidelity Central Funds.
Funds may invest in Fidelity Central Funds, which are open-end investment companies generally available only to other investment companies and accounts managed by the investment adviser and its affiliates. The Schedule of Investments lists any Fidelity Central Funds held as an investment as of period end, but does not include the underlying holdings of each Fidelity Central Fund. An investing fund indirectly bears its proportionate share of the expenses of the underlying Fidelity Central Funds.
Based on its investment objective, each Fidelity Central Fund may invest or participate in various investment vehicles or strategies that are similar to those of the investing fund. These strategies are consistent with the investment objectives of the investing fund and may involve certain economic risks which may cause a decline in value of each of the Fidelity Central Funds and thus a decline in the value of the investing fund.
| Fidelity Central Fund | Investment Manager | Investment Objective | Investment Practices | Expense Ratio A |
| Fidelity Money Market Central Funds | Fidelity Management & Research Company LLC (FMR) | Each fund seeks to obtain a high level of current income consistent with the preservation of capital and liquidity. | Short-term Investments | Less than .005% |
A Expenses expressed as a percentage of average net assets and are as of each underlying Central Fund's most recent annual or semi-annual shareholder report.
A complete unaudited list of holdings for each Fidelity Central Fund is available upon request or at the Securities and Exchange Commission website at www.sec.gov. In addition, the financial statements of the Fidelity Central Funds which contain the significant accounting policies (including investment valuation policies) of those funds, and are not covered by the Report of Independent Registered Public Accounting Firm, are available on the Securities and Exchange Commission website or upon request.
3. Significant Accounting Policies.
The Fund is an investment company and applies the accounting and reporting guidance of the Financial Accounting Standards Board (FASB) Accounting Standards Codification Topic 946 Financial Services - Investment Companies . The financial statements have been prepared in conformity with accounting principles generally accepted in the United States of America (GAAP), which require management to make certain estimates and assumptions at the date of the financial statements. Actual results could differ from those estimates. Subsequent events, if any, through the date that the financial statements were issued have been evaluated in the preparation of the financial statements. The Fund's Schedule of Investments lists any underlying mutual funds or exchange-traded funds (ETFs) but does not include the underlying holdings of these funds. The following summarizes the significant accounting policies of the Fund:
Investment Valuation. Investments are valued as of 4:00 p.m. Eastern time on the last calendar day of the period. The Board of Trustees (the Board) has designated the Fund's investment adviser as the valuation designee responsible for the fair valuation function and performing fair value determinations as needed. The investment adviser has established a Fair Value Committee (the Committee) to carry out the day-to-day fair valuation responsibilities and has adopted policies and procedures to govern the fair valuation process and the activities of the Committee. In accordance with these fair valuation policies and procedures, which have been approved by the Board, the Fund attempts to obtain prices from one or more third party pricing services or brokers to value its investments. When current market prices, quotations or currency exchange rates are not readily available or reliable, investments will be fair valued in good faith by the Committee, in accordance with the policies and procedures. Factors used in determining fair value vary by investment type and may include market or investment specific events, transaction data, estimated cash flows, and market observations of comparable investments. The frequency that the fair valuation procedures are used cannot be predicted and they may be utilized to a significant extent. The Committee manages the Fund's fair valuation practices and maintains the fair valuation policies and procedures. The Fund's investment adviser reports to the Board information regarding the fair valuation process and related material matters.
The Fund categorizes the inputs to valuation techniques used to value its investments into a disclosure hierarchy consisting of three levels as shown below:
Level 1 - unadjusted quoted prices in active markets for identical investments
Level 2 - other significant observable inputs (including quoted prices for similar investments, interest rates, prepayment speeds, etc.)
Level 3 - unobservable inputs (including the Fund's own assumptions based on the best information available)
Valuation techniques used to value the Fund's investments by major category are as follows:
Equity securities, including restricted securities, for which market quotations are readily available, are valued at the last reported sale price or official closing price as reported by a third party pricing service on the primary market or exchange on which they are traded and are categorized as Level 1 in the hierarchy. In the event there were no sales during the day or closing prices are not available, securities are valued at the last quoted bid price or may be valued using the last available price and are generally categorized as Level 2 in the hierarchy. For foreign equity securities, when market or security specific events arise, comparisons to the valuation of American Depositary Receipts (ADRs), futures contracts, ETFs and certain indexes as well as quoted prices for similar securities may be used and would be categorized as Level 2 in the hierarchy. For equity securities, including restricted securities, where observable inputs are limited, assumptions about market activity and risk are used and these securities may be categorized as Level 3 in the hierarchy.
Investments in open-end mutual funds, including the Fidelity Central Funds, are valued at their closing net asset value (NAV) each business day and are categorized as Level 1 in the hierarchy.
Changes in valuation techniques may result in transfers in or out of an assigned level within the disclosure hierarchy. The aggregate value of investments by input level as of February 28, 2023 is included at the end of the Fund's Schedule of Investments.
Foreign Currency. Certain Funds may use foreign currency contracts to facilitate transactions in foreign-denominated securities. Gains and losses from these transactions may arise from changes in the value of the foreign currency or if the counterparties do not perform under the contracts' terms.
Foreign-denominated assets, including investment securities, and liabilities are translated into U.S. dollars at the exchange rates at period end. Purchases and sales of investment securities, income and dividends received, and expenses denominated in foreign currencies are translated into U.S. dollars at the exchange rate in effect on the transaction date.
The effects of exchange rate fluctuations on investments are included with the net realized and unrealized gain (loss) on investment securities. Other foreign currency transactions resulting in realized and unrealized gain (loss) are disclosed separately.
Investment Transactions and Income. For financial reporting purposes, the Fund's investment holdings and NAV include trades executed through the end of the last business day of the period. The NAV per share for processing shareholder transactions is calculated as of the close of business of the New York Stock Exchange (NYSE), normally 4:00 p.m. Eastern time and includes trades executed through the end of the prior business day. Gains and losses on securities sold are determined on the basis of identified cost and include proceeds received from litigation. Commissions paid to certain brokers with whom the investment adviser, or its affiliates, places trades on behalf of a fund include an amount in addition to trade execution, which may be rebated back to a fund. Any such rebates are included in net realized gain (loss) on investments in the Statement of Operations. Dividend income is recorded on the ex-dividend date, except for certain dividends from foreign securities where the ex-dividend date may have passed, which are recorded as soon as the Fund is informed of the ex-dividend date. Non-cash dividends included in dividend income, if any, are recorded at the fair market value of the securities received. Income and capital gain distributions from Fidelity Central Funds, if any, are recorded on the ex-dividend date. Certain distributions received by the Fund represent a return of capital or capital gain. The Fund determines the components of these distributions subsequent to the ex-dividend date, based upon receipt of tax filings or other correspondence relating to the underlying investment. These distributions are recorded as a reduction of cost of investments and/or as a realized gain. Investment income is recorded net of foreign taxes withheld where recovery of such taxes is uncertain. Funds may file withholding tax reclaims in certain jurisdictions to recover a portion of amounts previously withheld. Any withholding tax reclaims income is included in the Statement of Operations in dividends. Any receivables for withholding tax reclaims are included in the Statement of Assets and Liabilities in dividends receivable.
Expenses. Expenses directly attributable to a fund are charged to that fund. Expenses attributable to more than one fund are allocated among the respective funds on the basis of relative net assets or other appropriate methods. Expenses included in the accompanying financial statements reflect the expenses of that fund and do not include any expenses associated with any underlying mutual funds or exchange-traded funds. Although not included in a fund's expenses, a fund indirectly bears its proportionate share of these expenses through the net asset value of each underlying mutual fund or exchange-traded fund. Expense estimates are accrued in the period to which they relate and adjustments are made when actual amounts are known.
Income Tax Information and Distributions to Shareholders. Each year, the Fund intends to qualify as a regulated investment company under Subchapter M of the Internal Revenue Code, including distributing substantially all of its taxable income and realized gains. As a result, no provision for U.S. Federal income taxes is required. As of February 28, 2023, the Fund did not have any unrecognized tax benefits in the financial statements; nor is the Fund aware of any tax positions for which it is reasonably possible that the total amounts of unrecognized tax benefits will significantly change in the next twelve months. The Fund files a U.S. federal tax return, in addition to state and local tax returns as required. The Fund's federal income tax returns are subject to examination by the Internal Revenue Service (IRS) for a period of three fiscal years after they are filed. State and local tax returns may be subject to examination for an additional fiscal year depending on the jurisdiction. Foreign taxes are provided for based on the Fund's understanding of the tax rules and rates that exist in the foreign markets in which it invests. The Fund is subject to a tax imposed on capital gains by certain countries in which it invests. An estimated deferred tax liability for net unrealized appreciation on the applicable securities is included in Other payables and accrued expenses on the Statement of Assets & Liabilities.
Distributions are declared and recorded on the ex-dividend date. Income and capital gain distributions are determined in accordance with income tax regulations, which may differ from GAAP. In addition, the Fund claimed a portion of the payment made to redeeming shareholders as a distribution for income tax purposes.
Capital accounts within the financial statements are adjusted for permanent book-tax differences. These adjustments have no impact on net assets or the results of operations. Capital accounts are not adjusted for temporary book-tax differences which will reverse in a subsequent period.
Book-tax differences are primarily due to foreign currency transactions, certain foreign taxes and losses deferred due to wash sales and excise tax regulations.
As of period end, the cost and unrealized appreciation (depreciation) in securities, and derivatives if applicable, for federal income tax purposes were as follows:
| Gross unrealized appreciation | $99,703,763 |
| Gross unrealized depreciation | (44,855,157) |
| Net unrealized appreciation (depreciation) | $54,848,606 |
| Tax Cost | $258,839,012 |
The tax-based components of distributable earnings as of period end were as follows:
| Net unrealized appreciation (depreciation) on securities and other investments | $54,840,219 |
The Fund intends to elect to defer to its next fiscal year $788,886 of capital losses recognized during the period November 1, 2022 to February 28, 2023 and $35,029 of ordinary losses recognized during the period January 1, 2023 to February 28, 2023.
The tax character of distributions paid was as follows:
| | February 28, 2023 | February 28, 2022 |
| Ordinary Income | $2,921,826 | $ 9,236,354 |
| Long-term Capital Gains | 23,821,827 | 25,153,876 |
| Total | $26,743,653 | $ 34,390,230 |
Restricted Securities (including Private Placements). Funds may invest in securities that are subject to legal or contractual restrictions on resale. These securities generally may be resold in transactions exempt from registration or to the public if the securities are registered. Disposal of these securities may involve time-consuming negotiations and expense, and prompt sale at an acceptable price may be difficult. Information regarding restricted securities held at period end is included at the end of the Schedule of Investments, if applicable.
4. Purchases and Sales of Investments.
Purchases and sales of securities, other than short-term securities in-kind transactions, as applicable, are noted in the table below.
| | Purchases ($) | Sales ($) |
| Wireless Portfolio | 37,017,603 | 75,921,965 |
5. Fees and Other Transactions with Affiliates.
Management Fee. Fidelity Management & Research Company LLC (the investment adviser) and its affiliates provide the Fund with investment management related services for which the Fund pays a monthly management fee. The management fee is the sum of an individual fund fee rate that is based on an annual rate of .30% of the Fund's average net assets and an annualized group fee rate that averaged .23% during the period. The group fee rate is based upon the monthly average net assets of a group of registered investment companies with which the investment adviser has management contracts. The group fee rate decreases as assets under management increase and increases as assets under management decrease. For the reporting period, the total annual management fee rate was .53% of the Fund's average net assets.
Transfer Agent Fees. Fidelity Investments Institutional Operations Company LLC (FIIOC), an affiliate of the investment adviser, is the Fund's transfer, dividend disbursing and shareholder servicing agent. FIIOC receives account fees and asset-based fees that vary according to account size and type of account. FIIOC pays for typesetting, printing and mailing of shareholder reports, except proxy statements. For the period, the transfer agent fees were equivalent to an annual rate of .20% of average net assets.
Accounting Fees. Fidelity Service Company, Inc. (FSC), an affiliate of the investment adviser, maintains the Fund's accounting records. The accounting fee is based on the level of average net assets for each month. For the period, the fees were equivalent to the following annual rates:
| | % of Average Net Assets |
| Wireless Portfolio | .04 |
Brokerage Commissions. A portion of portfolio transactions were placed with brokerage firms which are affiliates of the investment adviser. Brokerage commissions are included in net realized gain (loss) and change in net unrealized appreciation (depreciation) in the Statement of Operations. The commissions paid to these affiliated firms were as follows:
| | Amount |
| Wireless Portfolio | $2,253 |
Interfund Lending Program. Pursuant to an Exemptive Order issued by the Securities and Exchange Commission (the SEC), the Fund, along with other registered investment companies having management contracts with Fidelity Management & Research Company LLC (FMR), or other affiliated entities of FMR, may participate in an interfund lending program. This program provides an alternative credit facility allowing the Fund to borrow from, or lend money to, other participating affiliated funds. At period end, there were no interfund loans outstanding. Activity in this program during the period for which loans were outstanding was as follows:
| | Borrower or Lender | Average Loan Balance | Weighted Average Interest Rate | Interest Expense |
| Wireless Portfolio | Borrower | $6,244,000 | 1.78% | $927 |
Interfund Trades. Funds may purchase from or sell securities to other Fidelity Funds under procedures adopted by the Board. The procedures have been designed to ensure these interfund trades are executed in accordance with Rule 17a-7 of the 1940 Act. Any interfund trades are included within the respective purchases and sales amounts shown in the Purchases and Sales of Investments note. Interfund trades during the period are noted in the table below.
| | Purchases ($) | Sales ($) | Realized Gain (Loss) ($) |
| Wireless Portfolio | 6,308,469 | 1,044,026 | 264,127 |
6. Committed Line of Credit.
Certain Funds participate with other funds managed by the investment adviser or an affiliate in a $4.25 billion credit facility (the "line of credit") to be utilized for temporary or emergency purposes to fund shareholder redemptions or for other short-term liquidity purposes. The participating funds have agreed to pay commitment fees on their pro-rata portion of the line of credit, which are reflected in Miscellaneous expenses on the Statement of Operations, and are listed below. During the period, there were no borrowings on this line of credit.
| | Amount |
| Wireless Portfolio | $638 |
7. Security Lending.
Funds lend portfolio securities from time to time in order to earn additional income. Lending agents are used, including National Financial Services (NFS), an affiliate of the investment adviser. Pursuant to a securities lending agreement, NFS will receive a fee, which is capped at 9.9% of a fund's daily lending revenue, for its services as lending agent. A fund may lend securities to certain qualified borrowers, including NFS. On the settlement date of the loan, a fund receives collateral (in the form of U.S. Treasury obligations, letters of credit and/or cash) against the loaned securities and maintains collateral in an amount not less than 100% of the market value of the loaned securities during the period of the loan. The market value of the loaned securities is determined at the close of business of a fund and any additional required collateral is delivered to a fund on the next business day. A fund or borrower may terminate the loan at any time, and if the borrower defaults on its obligation to return the securities loaned because of insolvency or other reasons, a fund may apply collateral received from the borrower against the obligation. A fund may experience delays and costs in recovering the securities loaned. Any cash collateral received is invested in the Fidelity Securities Lending Cash Central Fund. Any loaned securities are identified as such in the Schedule of Investments, and the value of loaned securities and cash collateral at period end, as applicable, are presented in the Statement of Assets and Liabilities. Security lending income represents the income earned on investing cash collateral, less rebates paid to borrowers and any lending agent fees associated with the loan, plus any premium payments received for lending certain types of securities. Security lending income is presented in the Statement of Operations as a component of income from Fidelity Central Funds. Affiliated security lending activity, if any, was as follows:
| | Total Security Lending Fees Paid to NFS | Security Lending Income From Securities Loaned to NFS | Value of Securities Loaned to NFS at Period End |
| Wireless Portfolio | $20,543 | $170 | $- |
8. Expense Reductions.
During the period the investment adviser or an affiliate reimbursed and/or waived a portion of operating expenses in the amount of $12,049.
9. Other.
A fund's organizational documents provide former and current trustees and officers with a limited indemnification against liabilities arising in connection with the performance of their duties to the fund. In the normal course of business, a fund may also enter into contracts that provide general indemnifications. A fund's maximum exposure under these arrangements is unknown as this would be dependent on future claims that may be made against a fund. The risk of material loss from such claims is considered remote.
10. Risk and Uncertainties.
Many factors affect a fund's performance. Developments that disrupt global economies and financial markets, such as pandemics, epidemics, outbreaks of infectious diseases, war, terrorism, and environmental disasters, may significantly affect a fund's investment performance. The effects of these developments to a fund will be impacted by the types of securities in which a fund invests, the financial condition, industry, economic sector, and geographic location of an issuer, and a fund's level of investment in the securities of that issuer. Significant concentrations in security types, issuers, industries, sectors, and geographic locations may magnify the factors that affect a fund's performance.
To the Board of Trustees of Fidelity Select Portfolios and Shareholders of Telecommunications Portfolio and Wireless Portfolio
Opinions on the Financial Statements
We have audited the accompanying statements of assets and liabilities, including the schedules of investments, of Telecommunications Portfolio and Wireless Portfolio (two of the funds constituting Fidelity Select Portfolios, hereafter collectively referred to as the "Funds") as of February 28, 2023, the related statements of operations for the year ended February 28, 2023, the statements of changes in net assets for each of the two years in the period ended February 28, 2023, including the related notes, and the financial highlights for each of the periods indicated therein (collectively referred to as the "financial statements"). In our opinion, the financial statements present fairly, in all material respects, the financial position of each of the Funds as of February 28, 2023, the results of each of their operations for the year then ended, the changes in each of their net assets for each of the two years in the period ended February 28, 2023 and each of the financial highlights for each of the periods indicated therein in conformity with accounting principles generally accepted in the United States of America.
Basis for Opinions
These financial statements are the responsibility of the Funds' management. Our responsibility is to express an opinion on the Funds' financial statements based on our audits. We are a public accounting firm registered with the Public Company Accounting Oversight Board (United States) (PCAOB) and are required to be independent with respect to the Funds in accordance with the U.S. federal securities laws and the applicable rules and regulations of the Securities and Exchange Commission and the PCAOB.
We conducted our audits of these financial statements in accordance with the standards of the PCAOB. Those standards require that we plan and perform the audit to obtain reasonable assurance about whether the financial statements are free of material misstatement, whether due to error or fraud.
Our audits included performing procedures to assess the risks of material misstatement of the financial statements, whether due to error or fraud, and performing procedures that respond to those risks. Such procedures included examining, on a test basis, evidence regarding the amounts and disclosures in the financial statements. Our audits also included evaluating the accounting principles used and significant estimates made by management, as well as evaluating the overall presentation of the financial statements. Our procedures included confirmation of securities owned as of February 28, 2023 by correspondence with the custodian and brokers; when replies were not received from brokers, we performed other auditing procedures. We believe that our audits provide a reasonable basis for our opinions.
/s/ PricewaterhouseCoopers LLP
Boston, Massachusetts
April 12, 2023
We have served as the auditor of one or more investment companies in the Fidelity group of funds since 1932.
The Trustees, Members of the Advisory Board (if any), and officers of the trust and funds, as applicable, are listed below. The Board of Trustees governs each fund and is responsible for protecting the interests of shareholders. The Trustees are experienced executives who meet periodically throughout the year to oversee each fund's activities, review contractual arrangements with companies that provide services to each fund, oversee management of the risks associated with such activities and contractual arrangements, and review each fund's performance. Each of the Trustees oversees 318 funds.
The Trustees hold office without limit in time except that (a) any Trustee may resign; (b) any Trustee may be removed by written instrument, signed by at least two-thirds of the number of Trustees prior to such removal; (c) any Trustee who requests to be retired or who has become incapacitated by illness or injury may be retired by written instrument signed by a majority of the other Trustees; and (d) any Trustee may be removed at any special meeting of shareholders by a two-thirds vote of the outstanding voting securities of the trust. Each Trustee who is not an interested person (as defined in the 1940 Act) of the trust and the funds is referred to herein as an Independent Trustee. Each Independent Trustee shall retire not later than the last day of the calendar year in which his or her 75th birthday occurs. The Independent Trustees may waive this mandatory retirement age policy with respect to individual Trustees. Officers and Advisory Board Members hold office without limit in time, except that any officer or Advisory Board Member may resign or may be removed by a vote of a majority of the Trustees at any regular meeting or any special meeting of the Trustees. Except as indicated, each individual has held the office shown or other offices in the same company for the past five years.
The funds' Statement of Additional Information (SAI) includes more information about the Trustees. To request a free copy, call Fidelity at 1-800-544-8544 if you're an individual investing directly with Fidelity, call 1-800-835-5092 if you're a plan sponsor or participant with Fidelity as your recordkeeper or call 1-877-208-0098 on institutional accounts or if you're an advisor or invest through one.
Experience, Skills, Attributes, and Qualifications of the Trustees. The Governance and Nominating Committee has adopted a statement of policy that describes the experience, qualifications, attributes, and skills that are necessary and desirable for potential Independent Trustee candidates (Statement of Policy). The Board believes that each Trustee satisfied at the time he or she was initially elected or appointed a Trustee, and continues to satisfy, the standards contemplated by the Statement of Policy. The Governance and Nominating Committee also engages professional search firms to help identify potential Independent Trustee candidates who have the experience, qualifications, attributes, and skills consistent with the Statement of Policy. From time to time, additional criteria based on the composition and skills of the current Independent Trustees, as well as experience or skills that may be appropriate in light of future changes to board composition, business conditions, and regulatory or other developments, have also been considered by the professional search firms and the Governance and Nominating Committee. In addition, the Board takes into account the Trustees' commitment and participation in Board and committee meetings, as well as their leadership of standing and ad hoc committees throughout their tenure.
In determining that a particular Trustee was and continues to be qualified to serve as a Trustee, the Board has considered a variety of criteria, none of which, in isolation, was controlling. The Board believes that, collectively, the Trustees have balanced and diverse experience, qualifications, attributes, and skills, which allow the Board to operate effectively in governing each fund and protecting the interests of shareholders. Information about the specific experience, skills, attributes, and qualifications of each Trustee, which in each case led to the Board's conclusion that the Trustee should serve (or continue to serve) as a trustee of the funds, is provided below.
Board Structure and Oversight Function. Robert A. Lawrence is an interested person and currently serves as Chair. The Trustees have determined that an interested Chair is appropriate and benefits shareholders because an interested Chair has a personal and professional stake in the quality and continuity of services provided to the funds. Independent Trustees exercise their informed business judgment to appoint an individual of their choosing to serve as Chair, regardless of whether the Trustee happens to be independent or a member of management. The Independent Trustees have determined that they can act independently and effectively without having an Independent Trustee serve as Chair and that a key structural component for assuring that they are in a position to do so is for the Independent Trustees to constitute a substantial majority for the Board. The Independent Trustees also regularly meet in executive session. David M. Thomas serves as Lead Independent Trustee and as such (i) acts as a liaison between the Independent Trustees and management with respect to matters important to the Independent Trustees and (ii) with management prepares agendas for Board meetings.
Fidelity ® funds are overseen by different Boards of Trustees. The funds' Board oversees Fidelity's high income and certain equity funds, and other Boards oversee Fidelity's alternative investment, investment-grade bond, money market, asset allocation, and other equity funds. The asset allocation funds may invest in Fidelity ® funds overseen by the funds' Board. The use of separate Boards, each with its own committee structure, allows the Trustees of each group of Fidelity ® funds to focus on the unique issues of the funds they oversee, including common research, investment, and operational issues. On occasion, the separate Boards establish joint committees to address issues of overlapping consequences for the Fidelity ® funds overseen by each Board.
The Trustees operate using a system of committees to facilitate the timely and efficient consideration of all matters of importance to the Trustees, each fund, and fund shareholders and to facilitate compliance with legal and regulatory requirements and oversight of the funds' activities and associated risks. The Board, acting through its committees, has charged FMR and its affiliates with (i) identifying events or circumstances the occurrence of which could have demonstrably adverse effects on the funds' business and/or reputation; (ii) implementing processes and controls to lessen the possibility that such events or circumstances occur or to mitigate the effects of such events or circumstances if they do occur; and (iii) creating and maintaining a system designed to evaluate continuously business and market conditions in order to facilitate the identification and implementation processes described in (i) and (ii) above. Because the day-to-day operations and activities of the funds are carried out by or through FMR, its affiliates, and other service providers, the funds' exposure to risks is mitigated but not eliminated by the processes overseen by the Trustees. While each of the Board's committees has responsibility for overseeing different aspects of the funds' activities, oversight is exercised primarily through the Operations, Audit, and Compliance Committees. Appropriate personnel, including but not limited to the funds' Chief Compliance Officer (CCO), FMR's internal auditor, the independent accountants, the funds' Treasurer and portfolio management personnel, make periodic reports to the Board's committees, as appropriate, including an annual review of Fidelity's risk management program for the Fidelity ® funds. The responsibilities of each standing committee, including their oversight responsibilities, are described further under "Standing Committees of the Trustees."
Interested Trustees*:
Correspondence intended for a Trustee who is an interested person may be sent to Fidelity Investments, 245 Summer Street, Boston, Massachusetts 02210.
Name, Year of Birth; Principal Occupations and Other Relevant Experience+
Bettina Doulton (1964)
Year of Election or Appointment: 2020
Trustee
Ms. Doulton also serves as Trustee of other Fidelity ® funds. Prior to her retirement, Ms. Doulton served in a variety of positions at Fidelity Investments, including as a managing director of research (2006-2007), portfolio manager to certain Fidelity ® funds (1993-2005), equity analyst and portfolio assistant (1990-1993), and research assistant (1987-1990). Ms. Doulton currently owns and operates Phi Builders + Architects and Cellardoor Winery. Previously, Ms. Doulton served as a member of the Board of Brown Capital Management, LLC (2014-2018).
Robert A. Lawrence (1952)
Year of Election or Appointment: 2020
Trustee
Chair of the Board of Trustees
Mr. Lawrence also serves as Trustee of other funds. Previously, Mr. Lawrence served as a Trustee and Member of the Advisory Board of certain funds. Prior to his retirement in 2008, Mr. Lawrence served as Vice President of certain Fidelity ® funds (2006-2008), Senior Vice President, Head of High Income Division of Fidelity Management & Research Company (investment adviser firm, 2006-2008), and President of Fidelity Strategic Investments (investment adviser firm, 2002-2005).
* Determined to be an "Interested Trustee" by virtue of, among other things, his or her affiliation with the trust or various entities under common control with FMR.
+ The information includes the Trustee's principal occupation during the last five years and other information relating to the experience, attributes, and skills relevant to the Trustee's qualifications to serve as a Trustee, which led to the conclusion that the Trustee should serve as a Trustee for each fund.
Independent Trustees:
Correspondence intended for an Independent Trustee may be sent to Fidelity Investments, P.O. Box 55235, Boston, Massachusetts 02205-5235.
Name, Year of Birth; Principal Occupations and Other Relevant Experience+
Thomas P. Bostick (1956)
Year of Election or Appointment: 2021
Trustee
Lieutenant General Bostick also serves as Trustee of other Fidelity ® funds. Prior to his retirement, General Bostick (United States Army, Retired) held a variety of positions within the U.S. Army, including Commanding General and Chief of Engineers, U.S. Army Corps of Engineers (2012-2016) and Deputy Chief of Staff and Director of Human Resources, U.S. Army (2009-2012). General Bostick currently serves as a member of the Board and Finance and Governance & Sustainability Committees of CSX Corporation (transportation, 2020-present) and a member of the Board and Corporate Governance and Nominating Committee of Perma-Fix Environmental Services, Inc. (nuclear waste management, 2020-present). General Bostick serves as Chief Executive Officer of Bostick Global Strategies, LLC (consulting, 2016-present), as a member of the Board of HireVue, Inc. (video interview and assessment, 2020-present), as a member of the Board of Allonnia (biotechnology and engineering solutions, 2022-present) and on the Advisory Board of Solugen, Inc. (specialty bio-based chemicals manufacturer, 2022-present). Previously, General Bostick served as a Member of the Advisory Board of certain Fidelity ® funds (2021), President, Intrexon Bioengineering (2018-2020) and Chief Operating Officer (2017-2020) and Senior Vice President of the Environment Sector (2016-2017) of Intrexon Corporation (biopharmaceutical company).
Dennis J. Dirks (1948)
Year of Election or Appointment: 2018
Trustee
Mr. Dirks also serves as Trustee of other Fidelity ® funds. Prior to his retirement in May 2003, Mr. Dirks served as Chief Operating Officer and as a member of the Board of The Depository Trust & Clearing Corporation (financial markets infrastructure), President, Chief Operating Officer and a member of the Board of The Depository Trust Company (DTC), President and a member of the Board of the National Securities Clearing Corporation (NSCC), Chief Executive Officer and a member of the Board of the Government Securities Clearing Corporation and Chief Executive Officer and a member of the Board of the Mortgage-Backed Securities Clearing Corporation. Mr. Dirks currently serves as a member of the Finance Committee (2016-present) and Board (2017-present) and is Treasurer (2018-present) of the Asolo Repertory Theatre.
Donald F. Donahue (1950)
Year of Election or Appointment: 2018
Trustee
Mr. Donahue also serves as Trustee of other Fidelity ® funds. Mr. Donahue serves as President and Chief Executive Officer of Miranda Partners, LLC (risk consulting for the financial services industry, 2012-present). Previously, Mr. Donahue served as Chief Executive Officer (2006-2012), Chief Operating Officer (2003-2006) and Managing Director, Customer Marketing and Development (1999-2003) of The Depository Trust & Clearing Corporation (financial markets infrastructure). Mr. Donahue currently serves as a member (2007-present) and Co-Chairman (2016-present) of the Board of United Way of New York. Mr. Donahue previously served as a member of the Advisory Board of certain Fidelity ® funds (2015-2018) and as a member of the Board of The Leadership Academy (previously NYC Leadership Academy) (2012-2022).
Vicki L. Fuller (1957)
Year of Election or Appointment: 2020
Trustee
Ms. Fuller also serves as Trustee of other Fidelity ® funds. Previously, Ms. Fuller served as a member of the Advisory Board of certain Fidelity ® funds (2018-2020), Chief Investment Officer of the New York State Common Retirement Fund (2012-2018) and held a variety of positions at AllianceBernstein L.P. (global asset management, 1985-2012), including Managing Director (2006-2012) and Senior Vice President and Senior Portfolio Manager (2001-2006). Ms. Fuller currently serves as a member of the Board, Audit Committee and Nominating and Governance Committee of two Blackstone business development companies (2020-present), as a member of the Board of Treliant, LLC (consulting, 2019-present), as a member of the Board of Ariel Alternatives, LLC (private equity, 2022-present) and as a member of the Board and Chair of the Audit Committee of Gusto, Inc. (software, 2021-present). In addition, Ms. Fuller currently serves as a member of the Board of Roosevelt University (2019-present) and as a member of the Executive Board of New York University's Stern School of Business. Ms. Fuller previously served as a member of the Board, Audit Committee and Nominating and Governance Committee of The Williams Companies, Inc. (natural gas infrastructure, 2018-2021).
Patricia L. Kampling (1959)
Year of Election or Appointment: 2020
Trustee
Ms. Kampling also serves as Trustee of other Fidelity ® funds. Prior to her retirement, Ms. Kampling served as Chairman of the Board and Chief Executive Officer (2012-2019), President and Chief Operating Officer (2011-2012) and Executive Vice President and Chief Financial Officer (2010-2011) of Alliant Energy Corporation. Ms. Kampling currently serves as a member of the Board, Finance Committee and Governance, Compensation and Nominating Committee of Xcel Energy Inc. (utilities company, 2020-present) and as a member of the Board, Audit, Finance and Risk Committee and Safety, Environmental, Technology and Operations Committee and Chair of the Executive Development and Compensation Committee of American Water Works Company, Inc. (utilities company, 2019-present). In addition, Ms. Kampling currently serves as a member of the Board of the Nature Conservancy, Wisconsin Chapter (2019-present). Previously, Ms. Kampling served as a Member of the Advisory Board of certain Fidelity® funds (2020), a member of the Board, Compensation Committee and Executive Committee and Chair of the Audit Committee of Briggs & Stratton Corporation (manufacturing, 2011-2021), a member of the Board of Interstate Power and Light Company (2012-2019) and Wisconsin Power and Light Company (2012-2019) (each a subsidiary of Alliant Energy Corporation) and as a member of the Board and Workforce Development Committee of the Business Roundtable (2018-2019).
Thomas A. Kennedy (1955)
Year of Election or Appointment: 2021
Trustee
Mr. Kennedy also serves as Trustee of other Fidelity ® funds. Previously, Mr. Kennedy served as a Member of the Advisory Board of certain Fidelity ® funds (2020) and held a variety of positions at Raytheon Company (aerospace and defense, 1983-2020), including Chairman and Chief Executive Officer (2014-2020) and Executive Vice President and Chief Operating Officer (2013-2014). Mr. Kennedy served as Executive Chairman of the Board of Directors of Raytheon Technologies Corporation (aerospace and defense, 2020-2021). Mr. Kennedy serves as a Director of the Board of Directors of Textron Inc. (aerospace and defense, 2023-present).
Oscar Munoz (1959)
Year of Election or Appointment: 2021
Trustee
Mr. Munoz also serves as Trustee of other Fidelity ® funds. Prior to his retirement, Mr. Munoz served as Executive Chairman (2020-2021), Chief Executive Officer (2015-2020), President (2015-2016) and a member of the Board (2010-2021) of United Airlines Holdings, Inc. Mr. Munoz currently serves as a member of the Board of CBRE Group, Inc. (commercial real estate, 2020-present), a member of the Board of Univision Communications, Inc. (Hispanic media, 2020-present), a member of the Board of Archer Aviation Inc. (2021-present), a member of the Defense Business Board of the United States Department of Defense (2021-present) and a member of the Board of Salesforce.com, Inc. (cloud-based software, 2022-present). Previously, Mr. Munoz served as a Member of the Advisory Board of certain Fidelity ® funds (2021).
David M. Thomas (1949)
Year of Election or Appointment: 2018
Trustee
Lead Independent Trustee
Mr. Thomas also serves as Trustee of other Fidelity ® funds. Previously, Mr. Thomas served as Executive Chairman (2005-2006) and Chairman and Chief Executive Officer (2000-2005) of IMS Health, Inc. (pharmaceutical and healthcare information solutions). Mr. Thomas currently serves as a member of the Board of Fortune Brands Home and Security (home and security products, 2004-present) and as Director (2013-present) and Non-Executive Chairman of the Board (2022-present) of Interpublic Group of Companies, Inc. (marketing communication).
Susan Tomasky (1953)
Year of Election or Appointment: 2020
Trustee
Ms. Tomasky also serves as Trustee of other Fidelity ® funds. Prior to her retirement, Ms. Tomasky served in various executive officer positions at American Electric Power Company, Inc. (1998-2011), including most recently as President of AEP Transmission (2007-2011). Ms. Tomasky currently serves as a member of the Board and Sustainability Committee and as Chair of the Audit Committee of Marathon Petroleum Corporation (2018-present) and as a member of the Board, Executive Committee, Corporate Governance Committee and Organization and Compensation Committee and as Lead Director of the Board of Public Service Enterprise Group, Inc. (utilities company, 2012-present) and as a member of the Board of its subsidiary company, Public Service Electric and Gas Co. (2021-present). In addition, Ms. Tomasky currently serves as a member (2009-present) and President (2020-present) of the Board of the Royal Shakespeare Company - America (2009-present), as a member of the Board of the Columbus Association for the Performing Arts (2011-present) and as a member of the Board and Kenyon in the World Committee of Kenyon College (2016-present). Previously, Ms. Tomasky served as a Member of the Advisory Board of certain Fidelity ® funds (2020), as a member of the Board of the Columbus Regional Airport Authority (2007-2020), as a member of the Board (2011-2018) and Lead Independent Director (2015-2018) of Andeavor Corporation (previously Tesoro Corporation) (independent oil refiner and marketer) and as a member of the Board of Summit Midstream Partners LP (energy, 2012-2018).
Michael E. Wiley (1950)
Year of Election or Appointment: 2008
Trustee
Mr. Wiley also serves as Trustee of other Fidelity ® funds. Previously, Mr. Wiley served as a member of the Advisory Board of certain Fidelity ® funds (2018-2020), Chairman, President and CEO of Baker Hughes, Inc. (oilfield services, 2000-2004). Mr. Wiley also previously served as a member of the Board of Andeavor Corporation (independent oil refiner and marketer, 2005-2018), a member of the Board of Andeavor Logistics LP (natural resources logistics, 2015-2018) and a member of the Board of High Point Resources (exploration and production, 2005-2020).
+ The information includes the Trustee's principal occupation during the last five years and other information relating to the experience, attributes, and skills relevant to the Trustee's qualifications to serve as a Trustee, which led to the conclusion that the Trustee should serve as a Trustee for each fund.
Advisory Board Members and Officers:
Correspondence intended for a Member of the Advisory Board (if any) may be sent to Fidelity Investments, P.O. Box 55235, Boston, Massachusetts 02205-5235. Correspondence intended for an officer or Peter S. Lynch may be sent to Fidelity Investments, 245 Summer Street, Boston, Massachusetts 02210. Officers appear below in alphabetical order.
Name, Year of Birth; Principal Occupation
Peter S. Lynch (1944)
Year of Election or Appointment: 2018
Member of the Advisory Board
Mr. Lynch also serves as a Member of the Advisory Board of other Fidelity ® funds. Mr. Lynch is Vice Chairman and a Director of Fidelity Management & Research Company LLC (investment adviser firm). In addition, Mr. Lynch serves as a Trustee of Boston College and as the Chairman of the Inner-City Scholarship Fund. Previously, Mr. Lynch served as Vice Chairman and a Director of FMR Co., Inc. (investment adviser firm) and on the Special Olympics International Board of Directors (1997-2006).
Heather Bonner (1977)
Year of Election or Appointment: 2023
Assistant Treasurer
Ms. Bonner also serves as an officer of other funds. Ms. Bonner serves as Senior Vice President (2022-present), and is an employee of Fidelity Investments. Ms. Bonner serves as Assistant Treasurer of Fidelity CRET Trustee LLC (2022-present). Prior to joining Fidelity, Ms. Bonner served as Managing Director at AQR Capital Management (2013-2022) and was the Treasurer and Principal Financial Officer of the AQR Funds (2013-2022).
Craig S. Brown (1977)
Year of Election or Appointment: 2022
Deputy Treasurer
Mr. Brown also serves as an officer of other funds. Mr. Brown serves as Assistant Treasurer of FIMM, LLC (2021-present) and is an employee of Fidelity Investments (2013-present). Previously, Mr. Brown served as Assistant Treasurer of certain Fidelity ® funds (2019-2022).
John J. Burke III (1964)
Year of Election or Appointment: 2018
Chief Financial Officer
Mr. Burke also serves as Chief Financial Officer of other funds. Mr. Burke serves as Head of Investment Operations for Fidelity Fund and Investment Operations (2018-present) and is an employee of Fidelity Investments (1998-present). Previously Mr. Burke served as head of Asset Management Investment Operations (2012-2018).
Margaret Carey (1973)
Year of Election or Appointment: 2023
Secretary and Chief Legal Officer (CLO)
Ms. Carey also serves as an officer of other funds and as CLO of certain other Fidelity entities. She is a Senior Vice President and Deputy General Counsel of FMR LLC (diversified financial services company, 2019-present), and is an employee of Fidelity Investments.
William C. Coffey (1969)
Year of Election or Appointment: 2019
Assistant Secretary
Mr. Coffey also serves as Assistant Secretary of other funds. He is Senior Vice President and Deputy General Counsel of FMR LLC (diversified financial services company, 2010-present), and is an employee of Fidelity Investments. Previously, Mr. Coffey served as Secretary and CLO of certain funds (2018-2019); CLO, Secretary, and Senior Vice President of Fidelity Management & Research Company and FMR Co., Inc. (investment adviser firms, 2018-2019); Secretary of Fidelity SelectCo, LLC and Fidelity Investments Money Management, Inc. (investment adviser firms, 2018-2019); CLO of Fidelity Management & Research (Hong Kong) Limited, FMR Investment Management (UK) Limited, and Fidelity Management & Research (Japan) Limited (investment adviser firms, 2018-2019); and Assistant Secretary of certain funds (2009-2018).
Timothy M. Cohen (1969)
Year of Election or Appointment: 2018
Vice President
Mr. Cohen also serves as Vice President of other funds. Mr. Cohen serves as Co-Head of Equity (2018-present), a Director of Fidelity Management & Research (Japan) Limited (investment adviser firm, 2016-present), and is an employee of Fidelity Investments. Previously, Mr. Cohen served as Executive Vice President of Fidelity SelectCo, LLC (2019), Head of Global Equity Research (2016-2018), Chief Investment Officer - Equity and a Director of Fidelity Management & Research (U.K.) Inc. (investment adviser firm, 2013-2015) and as a Director of Fidelity Management & Research (Hong Kong) Limited (investment adviser firm, 2017).
Jonathan Davis (1968)
Year of Election or Appointment: 2010
Assistant Treasurer
Mr. Davis also serves as an officer of other funds. Mr. Davis serves as Assistant Treasurer of FIMM, LLC (2021-present), FMR Capital, Inc. (2017-present), FD Funds GP LLC (2021-present), FD Funds Holding LLC (2021-present), and FD Funds Management LLC (2021-present); and is an employee of Fidelity Investments. Previously, Mr. Davis served as Vice President and Associate General Counsel of FMR LLC (diversified financial services company, 2003-2010).
Laura M. Del Prato (1964)
Year of Election or Appointment: 2018
Assistant Treasurer
Ms. Del Prato also serves as an officer of other funds. Ms. Del Prato serves as Assistant Treasurer of FIMM, LLC (2021-present) and is an employee of Fidelity Investments (2017-present). Previously, Ms. Del Prato served as President and Treasurer of The North Carolina Capital Management Trust: Cash Portfolio and Term Portfolio (2018-2020). Prior to joining Fidelity Investments, Ms. Del Prato served as a Managing Director and Treasurer of the JPMorgan Mutual Funds (2014-2017). Prior to JPMorgan, Ms. Del Prato served as a partner at Cohen Fund Audit Services (accounting firm, 2012-2013) and KPMG LLP (accounting firm, 2004-2012).
Colm A. Hogan (1973)
Year of Election or Appointment: 2020
Assistant Treasurer
Mr. Hogan also serves as an officer of other funds. Mr. Hogan serves as Assistant Treasurer of FIMM, LLC (2021-present) and FMR Capital, Inc. (2017-present) and is an employee of Fidelity Investments (2005-present). Previously, Mr. Hogan served as Deputy Treasurer of certain Fidelity ® funds (2016-2020) and Assistant Treasurer of certain Fidelity ® funds (2016-2018).
Pamela R. Holding (1964)
Year of Election or Appointment: 2018
Vice President
Ms. Holding also serves as Vice President of other funds. Ms. Holding serves as Co-Head of Equity (2018-present) and is an employee of Fidelity Investments (2013-present). Previously, Ms. Holding served as Executive Vice President of Fidelity SelectCo, LLC (2019) and as Chief Investment Officer of Fidelity Institutional Asset Management (2013-2018).
Chris Maher (1972)
Year of Election or Appointment: 2020
Deputy Treasurer
Mr. Maher also serves as an officer of other funds. Mr. Maher serves as Assistant Treasurer of FIMM, LLC (2021-present) and FMR Capital, Inc. (2017-present), and is an employee of Fidelity Investments (2008-present). Previously, Mr. Maher served as Assistant Treasurer of certain funds (2013-2020); Vice President of Asset Management Compliance (2013), Vice President of the Program Management Group of FMR (investment adviser firm, 2010-2013), and Vice President of Valuation Oversight (2008-2010).
Jason P. Pogorelec (1975)
Year of Election or Appointment: 2020
Chief Compliance Officer
Mr. Pogorelec also serves as Chief Compliance Officer of other funds. Mr. Pogorelec is a Senior Vice President of Asset Management Compliance for Fidelity Investments and is an employee of Fidelity Investments. Mr. Pogorelec serves as Compliance Officer of Fidelity Management & Research Company LLC (investment adviser firm, 2023-present). Previously, Mr. Pogorelec served as Vice President, Associate General Counsel for Fidelity Investments (2010-2020) and Assistant Secretary of certain Fidelity ® funds (2015-2020).
Brett Segaloff (1972)
Year of Election or Appointment: 2021
Anti-Money Laundering (AML) Officer
Mr. Segaloff also serves as an AML Officer of other funds and other related entities. He is Director, Anti-Money Laundering (2007-present) of FMR LLC (diversified financial services company) and is an employee of Fidelity Investments (1996-present).
Stacie M. Smith (1974)
Year of Election or Appointment: 2018
President and Treasurer
Ms. Smith also serves as an officer of other funds. Ms. Smith serves as Assistant Treasurer of FIMM, LLC (2021-present) and FMR Capital, Inc. (2017-present), is an employee of Fidelity Investments (2009-present), and has served in other fund officer roles. Prior to joining Fidelity Investments, Ms. Smith served as Senior Audit Manager of Ernst & Young LLP (accounting firm, 1996-2009). Previously, Ms. Smith served as Assistant Treasurer (2013-2019) and Deputy Treasurer (2013-2016) of certain Fidelity ® funds.
Jim Wegmann (1979)
Year of Election or Appointment: 2019
Assistant Treasurer
Mr. Wegmann also serves as an officer of other funds. Mr. Wegmann serves as Assistant Treasurer of FIMM, LLC (2021-present) and is an employee of Fidelity Investments (2011-present). Previously, Mr. Wegmann served as Assistant Treasurer of certain Fidelity ® funds (2019-2021).
As a shareholder, you incur two types of costs: (1) transaction costs, which may include sales charges (loads) on purchase payments or redemption proceeds, as applicable and (2) ongoing costs, which generally include management fees, distribution and/or service (12b-1) fees and other Fund expenses. This Example is intended to help you understand your ongoing costs (in dollars) of investing in a fund and to compare these costs with the ongoing costs of investing in other mutual funds.
| The Example is based on an investment of $1,000 invested at the beginning of the period and held for the entire period (September 1, 2022 to February 28, 2023). |
Actual Expenses
The first line of the accompanying table provides information about actual account values and actual expenses. You may use the information in this line, together with the amount you invested, to estimate the expenses that you paid over the period. Simply divide your account value by $1,000.00 (for example, an $8,600 account value divided by $1,000.00 = 8.6), then multiply the result by the number in the first line for a class/Fund under the heading entitled "Expenses Paid During Period" to estimate the expenses you paid on your account during this period. If any fund is a shareholder of any underlying mutual funds or exchange-traded funds (ETFs) (the Underlying Funds), such fund indirectly bears its proportional share of the expenses of the Underlying Funds in addition to the direct expenses incurred presented in the table. These fees and expenses are not included in the annualized expense ratio used to calculate the expense estimate in the table below.
Hypothetical Example for Comparison Purposes
The second line of the accompanying table provides information about hypothetical account values and hypothetical expenses based on the actual expense ratio and an assumed rate of return of 5% per year before expenses, which is not the actual return. The hypothetical account values and expenses may not be used to estimate the actual ending account balance or expenses you paid for the period. You may use this information to compare the ongoing costs of investing in the Fund and other funds. To do so, compare this 5% hypothetical example with the 5% hypothetical examples that appear in the shareholder reports of the other funds. If any fund is a shareholder of any Underlying Funds, such fund indirectly bears its proportional share of the expenses of the Underlying Funds in addition to the direct expenses as presented in the table. These fees and expenses are not included in the annualized expense ratio used to calculate the expense estimate in the table below.
Please note that the expenses shown in the table are meant to highlight your ongoing costs only and do not reflect any transaction costs. Therefore, the second line of the table is useful in comparing ongoing costs only, and will not help you determine the relative total costs of owning different funds. In addition, if these transactional costs were included, your costs would have been higher.
| | | | | Annualized Expense Ratio- A | | Beginning Account Value September 1, 2022 | | Ending Account Value February 28, 2023 | | Expenses Paid During Period- C September 1, 2022 to February 28, 2023 |
| Telecommunications Portfolio | | | | | | | | | | |
| Class A | | | | 1.14% | | | | | | |
| Actual | | | | | | $ 1,000 | | $ 1,018.60 | | $ 5.71 |
Hypothetical- B | | | | | | $ 1,000 | | $ 1,019.14 | | $ 5.71 |
| Class M | | | | 1.38% | | | | | | |
| Actual | | | | | | $ 1,000 | | $ 1,017.50 | | $ 6.90 |
Hypothetical- B | | | | | | $ 1,000 | | $ 1,017.95 | | $ 6.90 |
| Class C | | | | 1.89% | | | | | | |
| Actual | | | | | | $ 1,000 | | $ 1,014.80 | | $ 9.44 |
Hypothetical- B | | | | | | $ 1,000 | | $ 1,015.42 | | $ 9.44 |
| Telecommunications Portfolio | | | | .84% | | | | | | |
| Actual | | | | | | $ 1,000 | | $ 1,020.20 | | $ 4.21 |
Hypothetical- B | | | | | | $ 1,000 | | $ 1,020.63 | | $ 4.21 |
| Class I | | | | .78% | | | | | | |
| Actual | | | | | | $ 1,000 | | $ 1,020.40 | | $ 3.91 |
Hypothetical- B | | | | | | $ 1,000 | | $ 1,020.93 | | $ 3.91 |
| Class Z | | | | .69% | | | | | | |
| Actual | | | | | | $ 1,000 | | $ 1,020.80 | | $ 3.46 |
Hypothetical- B | | | | | | $ 1,000 | | $ 1,021.37 | | $ 3.46 |
| | | | | | | | | | |
| Wireless Portfolio | | | | .81% | | | | | | |
| Actual | | | | | | $ 1,000 | | $ 958.30 | | $ 3.93 |
Hypothetical- B | | | | | | $ 1,000 | | $ 1,020.78 | | $ 4.06 |
| |
A Annualized expense ratio reflects expenses net of applicable fee waivers.
B 5% return per year before expenses
C Expenses are equal to the annualized expense ratio, multiplied by the average account value over the period, multiplied by 181/ 365 (to reflect the one-half year period). The fees and expenses of any Underlying Funds are not included in each annualized expense ratio.
The dividend and capital gains distributions for the fund(s) are available on Fidelity.com or Institutional.Fidelity.com.
The funds hereby designate as capital gain dividend the amounts noted below for the taxable year ended February 28, 2023, or, if subsequently determined to be different, the net capital gain of such year.
| Telecommunications Portfolio | $6,734,770 |
| Wireless Portfolio | $10,181,897 |
A percentage of the dividends distributed during the fiscal year for the following funds were derived from interest on U.S. Government securities which is generally exempt from state income tax.
| Telecommunications Portfolio | 0.01% |
The funds hereby designate the percentages noted below of the short-term capital gain dividends distributed during the fiscal year as qualifying to be taxed as short-term capital gain dividends for nonresident alien shareholders:
| | April, 2022 | |
| Wireless Portfolio | 100.00% | |
A percentage of the dividends distributed during the fiscal year for the following funds qualify for the dividends-received deduction for corporate shareholders:
| | April 2022 | July 2022 | October 2022 | December 2022 |
| Telecommunications Portfolio | | | | |
| Class A | 100% | 100% | 100% | 100% |
| Class M | 100% | 100% | 100% | 100% |
| Class C | 100% | 100% | 100% | 100% |
| Telecommunications | 100% | 100% | 100% | 100% |
| Class I | 100% | 100% | 100% | 100% |
| Class Z | 100% | 100% | 100% | 100% |
| Wireless Portfolio | | | | |
| Wireless | 98% | | | 82% |
A percentage of the dividends distributed during the fiscal year for the following funds may be taken into account as a dividend for purposes of the maximum rate under section 1(h)(11) of the Internal Revenue Code.
| | April 2022 | July 2022 | October 2022 | December 2022 |
| Telecommunications Portfolio | | | | |
| Class A | 100% | 100% | 100% | 100% |
| Class M | 100% | 100% | 100% | 100% |
| Class C | 100% | 100% | 100% | 100% |
| Telecommunications | 100% | 100% | 100% | 100% |
| Class I | 100% | 100% | 100% | 100% |
| Class Z | 100% | 100% | 100% | 100% |
| Wireless Portfolio | | | | |
| Wireless | 100% | | | 100% |
The funds will notify shareholders in January 2024 of amounts for use in preparing 2023 income tax returns.
The Securities and Exchange Commission adopted Rule 22e-4 under the Investment Company Act of 1940 (the Liquidity Rule) to promote effective liquidity risk management throughout the open-end investment company industry, thereby reducing the risk that funds will be unable to meet their redemption obligations and mitigating dilution of the interests of fund shareholders.
The Funds have adopted and implemented a liquidity risk management program (the Program) reasonably designed to assess and manage each Fund's liquidity risk and to comply with the requirements of the Liquidity Rule. Each Fund's Board of Trustees (the Board) has designated each Fund's investment adviser as administrator of the Program. The Fidelity advisers have established a Liquidity Risk Management Committee (the LRM Committee) to manage the Program for each of the Fidelity Funds. The LRM Committee monitors the adequacy and effectiveness of implementation of the Program and on a periodic basis assesses each Fund's liquidity risk based on a variety of factors including (1) the Fund's investment strategy, (2) portfolio liquidity and cash flow projections during normal and reasonably foreseeable stressed conditions, (3) shareholder redemptions, (4) borrowings and other funding sources and (5) certain factor specific to ETFs including the effect of the Fund's prices and spreads, market participants, and basket compositions on the overall liquidity of the Fund's portfolio, as applicable.
In accordance with the Program, each of the Fund's portfolio investments is classified into one of four defined liquidity categories based on a determination of a reasonable expectation for how long it would take to convert the investment to cash (or sell or dispose of the investment) without significantly changing its market value.
- Highly liquid investments - cash or convertible to cash within three business days or less
- Moderately liquid investments - convertible to cash in three to seven calendar days
- Less liquid investments - can be sold or disposed of, but not settled, within seven calendar days
- Illiquid investments - cannot be sold or disposed of within seven calendar days
Liquidity classification determinations take into account a variety of factors including various market, trading and investment-specific considerations, as well as market depth, and generally utilize analysis from a third-party liquidity metrics service.
The Liquidity Rule places a 15% limit on a fund's illiquid investments and requires funds that do not primarily hold assets that are highly liquid investments to determine and maintain a minimum percentage of the fund's net assets to be invested in highly liquid investments (highly liquid investment minimum or HLIM). The Program includes provisions reasonably designed to comply with the 15% limit on illiquid investments and for determining, periodically reviewing and complying with the HLIM requirement as applicable.
At a recent meeting of the Fund's Board of Trustees, the LRM Committee provided a written report to the Board pertaining to the operation, adequacy, and effectiveness of the Program for the period December 1, 2021 through November 30, 2022. The report concluded that the Program is operating effectively and is reasonably designed to assess and manage the Fund's liquidity risk.
1.846050.116
SELTS-ANN-0423
Fidelity® Select Portfolios®
Utilities Sector
Utilities Portfolio
Annual Report
February 28, 2023
Contents
To view a fund's proxy voting guidelines and proxy voting record for the 12-month period ended June 30, visit http://www.fidelity.com/proxyvotingresults or visit the Securities and Exchange Commission's (SEC) web site at http://www.sec.gov.
You may also call 1-800-544-8544 to request a free copy of the proxy voting guidelines.
Standard & Poor's, S&P and S&P 500 are registered service marks of The McGraw-Hill Companies, Inc. and have been licensed for use by Fidelity Distributors Corporation.
Other third-party marks appearing herein are the property of their respective owners.
All other marks appearing herein are registered or unregistered trademarks or service marks of FMR LLC or an affiliated company. © 2023 FMR LLC. All rights reserved.
This report and the financial statements contained herein are submitted for the general information of the shareholders of the Fund. This report is not authorized for distribution to prospective investors in the Fund unless preceded or accompanied by an effective prospectus.
A fund files its complete schedule of portfolio holdings with the SEC for the first and third quarters of each fiscal year on Form N-PORT. Forms N-PORT are available on the SEC's web site at http://www.sec.gov. A fund's Forms N-PORT may be reviewed and copied at the SEC's Public Reference Room in Washington, DC. Information regarding the operation of the SEC's Public Reference Room may be obtained by calling 1-800-SEC-0330.
For a complete list of a fund's portfolio holdings, view the most recent holdings listing, semiannual report, or annual report on Fidelity's web site at http://www.fidelity.com, http://www.institutional.fidelity.com, or http://www.401k.com, as applicable.
NOT FDIC INSURED •MAY LOSE VALUE •NO BANK GUARANTEE
Neither the Fund nor Fidelity Distributors Corporation is a bank.
Average annual total return reflects the change in the value of an investment, assuming reinvestment of distributions from dividend income and capital gains (the profits earned upon the sale of securities that have grown in value, if any) and assuming a constant rate of performance each year. The hypothetical investment and the average annual total returns do not reflect the deduction of taxes that a shareholder would pay on fund distributions or the redemption of fund shares. During periods of reimbursement by Fidelity, a fund's total return will be greater than it would be had the reimbursement not occurred. How a fund did yesterday is no guarantee of how it will do tomorrow.
| Average Annual Total Returns |
| | | | |
Periods ended February 28, 2023 | Past 1 year | Past 5 years | Past 10 years |
| Utilities Portfolio | 1.46% | 9.69% | 9.57% |
| $10,000 Over 10 Years |
| |
Let's say hypothetically that $10,000 was invested in Utilities Portfolio on February 28, 2013. The chart shows how the value of your investment would have changed, and also shows how the S&P 500® Index performed over the same period. |
|
|
Market Recap:
U.S. equities returned -7.69% for the 12 months ending February 28, 2023, according to the S&P 500 ® index. The new year began with an encouraging upturn in January (+6.28%), but stocks lost momentum in February (-2.44%) amid higher-than-expected inflation and strong jobs data. Investors took these as signs that the economy continued to run hot, even after a year of historic policy adjustment by the Federal Reserve aimed at cooling economic growth. Record inflation in 2022 prompted the Fed to aggressively tighten monetary policy, and market interest rates eclipsed their highest level in a decade, stoking recession fears and sending stocks into bear market territory. Since March 2022, the central bank has hiked its benchmark rate eight times, by 4.5 percentage points - the fastest-ever pace of monetary tightening - while also shrinking its massive asset portfolio. The latest bump came on February 2, along with a signal that the Fed plans to lift rates in March while it considers whether and when to pause increases. Against this dynamic backdrop, stocks struggled to gain traction until a strong rally ignited heading into the summer. But in September, the index returned -9.21%, one of its worst monthly results ever, before advancing 7.56% in Q4, as risky assets regained favor. For the full 12 months, value stocks handily outpaced growth. The headwind for the latter was most pronounced in the growth-oriented communication services (-25%) and consumer discretionary (-18%) sectors. In sharp contrast, energy gained 24%.
Comments from Portfolio Manager Douglas Simmons:
For the fiscal year ending February 28, 2023, the fund gained 1.46%, outperforming the -0.98% return of the MSCI US IMI Utilities 25/50 Index, and handily outpacing the broad-based S&P 500 ® index. The primary contributor to performance versus the sector index was our stock selection in electric utilities. An underweighting and stock picks in multi-utilities and an overweighting in independent power producers & energy traders also lifted the fund's relative result. The biggest individual relative contributor was an overweight position in Constellation Energy (+63%), which was among the fund's largest holdings. Also helping performance was our overweight in PG&E, which gained approximately 37%, and was another top-five holding. Another notable relative contributor was our lighter-than-index stake in Dominion Energy (-28%). Conversely, the primary detractor from performance versus the sector index was our stock selection in renewable electricity. An underweighting and security selection in gas utilities and stock picks in integrated telecommunication services also hurt relative performance. The fund's biggest individual relative detractor was our underweight stake in Consolidated Edison, which gained about 8% the past year. Consolidated Edison was not held at period end. An underweight and untimely positioning in Eversource Energy, which returned -5%, also held back performance. This was a stake we established the past 12 months. Further hindering performance was our lighter-than-index investment in American Electric Power. American Electric Power was not held at period end. Notable changes in positioning include increased exposure to the electric utilities subindustry.
The views expressed above reflect those of the portfolio manager(s) only through the end of the period as stated on the cover of this report and do not necessarily represent the views of Fidelity or any other person in the Fidelity organization. Any such views are subject to change at any time based upon market or other conditions and Fidelity disclaims any responsibility to update such views. These views may not be relied on as investment advice and, because investment decisions for a Fidelity fund are based on numerous factors, may not be relied on as an indication of trading intent on behalf of any Fidelity fund.
Top Holdings (% of Fund's net assets) |
| |
| NextEra Energy, Inc. | 16.3 | |
| Southern Co. | 12.1 | |
| Sempra Energy | 6.8 | |
| Constellation Energy Corp. | 6.6 | |
| PG&E Corp. | 5.9 | |
| Dominion Energy, Inc. | 5.0 | |
| Edison International | 4.9 | |
| FirstEnergy Corp. | 4.3 | |
| PPL Corp. | 4.1 | |
| Public Service Enterprise Group, Inc. | 4.0 | |
| | 70.0 | |
| |
| Industries (% of Fund's net assets) |
| |
| Electric Utilities | 71.9 | |
| Multi-Utilities | 19.7 | |
| Independent Power and Renewable Electricity Producers | 4.4 | |
| |
Showing Percentage of Net Assets
| Common Stocks - 96.0% |
| | | Shares | Value ($) |
| Electric Utilities - 71.9% | | | |
| Electric Utilities - 71.9% | | | |
| Constellation Energy Corp. | | 1,185,890 | 88,811,302 |
| Duke Energy Corp. | | 432,947 | 40,809,584 |
| Edison International | | 1,003,410 | 66,435,776 |
| Entergy Corp. | | 483,300 | 49,717,071 |
| Eversource Energy | | 567,784 | 42,788,202 |
| Exelon Corp. | | 1,161,489 | 46,912,541 |
| FirstEnergy Corp. (a) | | 1,486,202 | 58,764,427 |
| NextEra Energy, Inc. | | 3,107,206 | 220,704,844 |
| PG&E Corp. (b) | | 5,153,284 | 80,494,296 |
| Pinnacle West Capital Corp. | | 139,740 | 10,296,043 |
| PPL Corp. | | 2,048,900 | 55,463,723 |
| Southern Co. | | 2,596,494 | 163,734,912 |
| Xcel Energy, Inc. | | 738,300 | 47,672,031 |
| | | | 972,604,752 |
| Independent Power and Renewable Electricity Producers - 4.4% | | | |
| Independent Power Producers & Energy Traders - 2.5% | | | |
| Energy Harbor Corp. (b) | | 231,300 | 17,810,100 |
| Vistra Corp. | | 718,197 | 15,793,152 |
| | | | 33,603,252 |
| Renewable Electricity - 1.9% | | | |
| Clearway Energy, Inc. Class A | | 166,124 | 4,935,544 |
| NextEra Energy Partners LP | | 319,861 | 21,193,990 |
| | | | 26,129,534 |
TOTAL INDEPENDENT POWER AND RENEWABLE ELECTRICITY PRODUCERS | | | 59,732,786 |
| Multi-Utilities - 19.7% | | | |
| Multi-Utilities - 19.7% | | | |
| Dominion Energy, Inc. | | 1,207,860 | 67,181,173 |
| NiSource, Inc. | | 1,955,619 | 53,642,629 |
| Public Service Enterprise Group, Inc. | | 906,303 | 54,767,890 |
| Sempra Energy | | 611,071 | 91,636,207 |
| | | | 267,227,899 |
| TOTAL COMMON STOCKS (Cost $1,144,345,355) | | | 1,299,565,437 |
| | | | |
| Money Market Funds - 1.7% |
| | | Shares | Value ($) |
| Fidelity Cash Central Fund 4.63% (c) | | 13,604,136 | 13,606,856 |
| Fidelity Securities Lending Cash Central Fund 4.63% (c)(d) | | 9,118,938 | 9,119,850 |
| TOTAL MONEY MARKET FUNDS (Cost $22,726,706) | | | 22,726,706 |
| | | | |
| TOTAL INVESTMENT IN SECURITIES - 97.7% (Cost $1,167,072,061) | 1,322,292,143 |
NET OTHER ASSETS (LIABILITIES) - 2.3% | 30,473,804 |
| NET ASSETS - 100.0% | 1,352,765,947 |
| | |
Legend
| (a) | Security or a portion of the security is on loan at period end. |
| (c) | Affiliated fund that is generally available only to investment companies and other accounts managed by Fidelity Investments. The rate quoted is the annualized seven-day yield of the fund at period end. A complete unaudited listing of the fund's holdings as of its most recent quarter end is available upon request. In addition, each Fidelity Central Fund's financial statements, which are not covered by the Fund's Report of Independent Registered Public Accounting Firm, are available on the SEC's website or upon request. |
| (d) | Investment made with cash collateral received from securities on loan. |
Affiliated Central Funds
Fiscal year to date information regarding the Fund's investments in Fidelity Central Funds, including the ownership percentage, is presented below.
| Affiliate | Value, beginning of period ($) | Purchases ($) | Sales Proceeds ($) | Dividend Income ($) | Realized Gain (loss) ($) | Change in Unrealized appreciation (depreciation) ($) | Value, end of period ($) | % ownership, end of period |
| Fidelity Cash Central Fund 4.63% | 15,713,381 | 641,855,916 | 643,962,441 | 833,291 | - | - | 13,606,856 | 0.0% |
| Fidelity Securities Lending Cash Central Fund 4.63% | 21,483,975 | 579,066,127 | 591,430,252 | 38,654 | - | - | 9,119,850 | 0.0% |
| Total | 37,197,356 | 1,220,922,043 | 1,235,392,693 | 871,945 | - | - | 22,726,706 | |
| | | | | | | | | |
Amounts in the dividend income column in the above table include any capital gain distributions from underlying funds, which are presented in the corresponding line item in the Statement of Operations, if applicable.
Amount for Fidelity Securities Lending Cash Central Fund represents the income earned on investing cash collateral, less rebates paid to borrowers and any lending agent fees associated with the loan, plus any premium payments received for lending certain types of securities.
Amounts included in the purchases and sales proceeds columns may include in-kind transactions, if applicable.
Investment Valuation
The following is a summary of the inputs used, as of February 28, 2023, involving the Fund's assets and liabilities carried at fair value. The inputs or methodology used for valuing securities may not be an indication of the risk associated with investing in those securities. For more information on valuation inputs, and their aggregation into the levels used below, please refer to the Investment Valuation section in the accompanying Notes to Financial Statements.
| Valuation Inputs at Reporting Date: |
| Description | Total ($) | Level 1 ($) | Level 2 ($) | Level 3 ($) |
Investments in Securities: | | | | |
|
| Common Stocks | 1,299,565,437 | 1,299,565,437 | - | - |
|
| Money Market Funds | 22,726,706 | 22,726,706 | - | - |
| Total Investments in Securities: | 1,322,292,143 | 1,322,292,143 | - | - |
| Statement of Assets and Liabilities |
| | | | February 28, 2023 |
| | | | | |
| Assets | | | | |
| Investment in securities, at value (including securities loaned of $8,849,052) - See accompanying schedule: | | | | |
Unaffiliated issuers (cost $1,144,345,355) | $ | 1,299,565,437 | | |
Fidelity Central Funds (cost $22,726,706) | | 22,726,706 | | |
| | | | | |
| | | | | |
| Total Investment in Securities (cost $1,167,072,061) | | | $ | 1,322,292,143 |
| Receivable for investments sold | | | | 42,750,257 |
| Receivable for fund shares sold | | | | 649,677 |
| Dividends receivable | | | | 5,949,059 |
| Distributions receivable from Fidelity Central Funds | | | | 42,078 |
| Prepaid expenses | | | | 2,826 |
Total assets | | | | 1,371,686,040 |
| Liabilities | | | | |
| Payable for investments purchased | $ | 6,401,010 | | |
| Payable for fund shares redeemed | | 2,490,287 | | |
| Accrued management fee | | 625,311 | | |
| Other affiliated payables | | 249,268 | | |
| Other payables and accrued expenses | | 34,367 | | |
| Collateral on securities loaned | | 9,119,850 | | |
| Total Liabilities | | | | 18,920,093 |
| Net Assets | | | $ | 1,352,765,947 |
| Net Assets consist of: | | | | |
| Paid in capital | | | $ | 1,184,129,411 |
| Total accumulated earnings (loss) | | | | 168,636,536 |
| Net Assets | | | $ | 1,352,765,947 |
Net Asset Value , offering price and redemption price per share ($1,352,765,947 ÷ 13,901,981 shares) | | | $ | 97.31 |
| Statement of Operations |
| | | | Year ended February 28, 2023 |
| Investment Income | | | | |
| Dividends | | | $ | 33,697,774 |
| Income from Fidelity Central Funds (including $38,654 from security lending) | | | | 871,945 |
| Total Income | | | | 34,569,719 |
| Expenses | | | | |
| Management fee | $ | 7,367,347 | | |
| Transfer agent fees | | 2,365,300 | | |
| Accounting fees | | 403,573 | | |
| Custodian fees and expenses | | 9,000 | | |
| Independent trustees' fees and expenses | | 4,698 | | |
| Registration fees | | 117,313 | | |
| Audit | | 40,152 | | |
| Legal | | 923 | | |
| Interest | | 2,976 | | |
| Miscellaneous | | 6,669 | | |
| Total expenses before reductions | | 10,317,951 | | |
| Expense reductions | | (49,100) | | |
| Total expenses after reductions | | | | 10,268,851 |
| Net Investment income (loss) | | | | 24,300,868 |
| Realized and Unrealized Gain (Loss) | | | | |
| Net realized gain (loss) on: | | | | |
| Investment Securities: | | | | |
| Unaffiliated issuers | | 32,167,164 | | |
| Foreign currency transactions | | (69) | | |
| Total net realized gain (loss) | | | | 32,167,095 |
| Change in net unrealized appreciation (depreciation) on: | | | | |
| Investment Securities: | | | | |
| Unaffiliated issuers | | (78,849,482) | | |
| Assets and liabilities in foreign currencies | | (1,006) | | |
| Total change in net unrealized appreciation (depreciation) | | | | (78,850,488) |
| Net gain (loss) | | | | (46,683,393) |
| Net increase (decrease) in net assets resulting from operations | | | $ | (22,382,525) |
| Statement of Changes in Net Assets |
| |
| | Year ended February 28, 2023 | | Year ended February 28, 2022 |
| Increase (Decrease) in Net Assets | | | | |
| Operations | | | | |
| Net investment income (loss) | $ | 24,300,868 | $ | 19,728,195 |
| Net realized gain (loss) | | 32,167,095 | | 38,512,444 |
| Change in net unrealized appreciation (depreciation) | | (78,850,488) | | 110,781,817 |
| Net increase (decrease) in net assets resulting from operations | | (22,382,525) | | 169,022,456 |
| Distributions to shareholders | | (62,216,948) | | (28,337,938) |
| Share transactions | | | | |
| Proceeds from sales of shares | | 921,832,942 | | 248,500,596 |
| Reinvestment of distributions | | 57,299,028 | | 26,334,666 |
| Cost of shares redeemed | | (613,822,146) | | (239,748,839) |
Net increase (decrease) in net assets resulting from share transactions | | 365,309,824 | | 35,086,423 |
| Total increase (decrease) in net assets | | 280,710,351 | | 175,770,941 |
| | | | | |
| Net Assets | | | | |
| Beginning of period | | 1,072,055,596 | | 896,284,655 |
| End of period | $ | 1,352,765,947 | $ | 1,072,055,596 |
| | | | | |
| Other Information | | | | |
| Shares | | | | |
| Sold | | 8,651,956 | | 2,524,118 |
| Issued in reinvestment of distributions | | 535,973 | | 259,200 |
| Redeemed | | (5,965,477) | | (2,459,097) |
| Net increase (decrease) | | 3,222,452 | | 324,221 |
| | | | | |
Financial Highlights
| Years ended February 28, | | 2023 | | 2022 | | 2021 | | 2020 A | | 2019 |
Selected Per-Share Data | | | | | | | | | | |
| Net asset value, beginning of period | $ | 100.38 | $ | 86.55 | $ | 91.20 | $ | 85.32 | $ | 76.75 |
| Income from Investment Operations | | | | | | | | | | |
Net investment income (loss) B,C | | 1.82 | | 1.92 | | 1.61 | | 2.09 | | 2.06 |
| Net realized and unrealized gain (loss) | | .04 D | | 14.72 | | (1.81) | | 5.99 | | 13.35 |
| Total from investment operations | | 1.86 | | 16.64 | | (.20) | | 8.08 | | 15.41 |
| Distributions from net investment income | | (1.75) | | (1.71) | | (2.12) | | (1.94) | | (1.37) |
| Distributions from net realized gain | | (3.18) | | (1.10) | | (2.34) | | (.26) | | (5.46) |
| Total distributions | | (4.93) | | (2.81) | | (4.45) E | | (2.20) | | (6.84) E |
| Net asset value, end of period | $ | 97.31 | $ | 100.38 | $ | 86.55 | $ | 91.20 | $ | 85.32 |
Total Return F | | 1.46% | | 19.19% | | (.05)% | | 9.34% | | 20.17% |
Ratios to Average Net Assets C,G,H | | | | | | | | | | |
| Expenses before reductions | | .74% | | .74% | | .76% | | .75% | | .78% |
| Expenses net of fee waivers, if any | | .74% | | .73% | | .76% | | .75% | | .78% |
| Expenses net of all reductions | | .74% | | .73% | | .75% | | .74% | | .76% |
| Net investment income (loss) | | 1.74% | | 1.96% | | 1.88% | | 2.25% | | 2.45% |
| Supplemental Data | | | | | | | | | | |
| Net assets, end of period (000 omitted) | $ | 1,352,766 | $ | 1,072,056 | $ | 896,285 | $ | 1,247,009 | $ | 1,040,763 |
Portfolio turnover rate I | | 53% | | 37% | | 64% | | 65% J | | 97% J |
A For the year ended February 29.
B Calculated based on average shares outstanding during the period.
C Net investment income (loss) is affected by the timing of the declaration of dividends by any underlying mutual funds or exchange-traded funds (ETFs). Net investment income (loss) of any mutual funds or ETFs is not included in the Fund's net investment income (loss) ratio.
D The amount shown for a share outstanding does not correspond with the aggregate net gain (loss) on investments for the period due to the timing of sales and repurchases of shares in relation to fluctuating market values of the investments of the Fund.
E Total distributions per share do not sum due to rounding.
F Total returns would have been lower if certain expenses had not been reduced during the applicable periods shown.
G Fees and expenses of any underlying mutual funds or exchange-traded funds (ETFs) are not included in the Fund's expense ratio. The Fund indirectly bears its proportionate share of these expenses. For additional expense information related to investments in Fidelity Central Funds, please refer to the "Investments in Fidelity Central Funds" note found in the Notes to Financial Statements section of the most recent Annual or Semi-Annual report.
H Expense ratios reflect operating expenses of the class. Expenses before reductions do not reflect amounts reimbursed, waived, or reduced through arrangements with the investment adviser, brokerage services, or other offset arrangements, if applicable, and do not represent the amount paid by the class during periods when reimbursements, waivers or reductions occur.
I Amount does not include the portfolio activity of any underlying mutual funds or exchange-traded funds (ETFs).
J Portfolio turnover rate excludes securities received or delivered in-kind.
For the period ended February 28, 2023
1. Organization.
Utilities Portfolio (the Fund) is a non-diversified fund of Fidelity Select Portfolios (the Trust) and is authorized to issue an unlimited number of shares. Share transactions on the Statement of Changes in Net Assets may contain exchanges between affiliated funds. The Trust is registered under the Investment Company Act of 1940, as amended (the 1940 Act), as an open-end management investment company organized as a Massachusetts business trust. The Fund invests primarily in securities of companies whose principal business activities fall within specific industries.
2. Investments in Fidelity Central Funds.
Funds may invest in Fidelity Central Funds, which are open-end investment companies generally available only to other investment companies and accounts managed by the investment adviser and its affiliates. The Schedule of Investments lists any Fidelity Central Funds held as an investment as of period end, but does not include the underlying holdings of each Fidelity Central Fund. An investing fund indirectly bears its proportionate share of the expenses of the underlying Fidelity Central Funds.
Based on its investment objective, each Fidelity Central Fund may invest or participate in various investment vehicles or strategies that are similar to those of the investing fund. These strategies are consistent with the investment objectives of the investing fund and may involve certain economic risks which may cause a decline in value of each of the Fidelity Central Funds and thus a decline in the value of the investing fund.
| Fidelity Central Fund | Investment Manager | Investment Objective | Investment Practices | Expense Ratio A |
| Fidelity Money Market Central Funds | Fidelity Management & Research Company LLC (FMR) | Each fund seeks to obtain a high level of current income consistent with the preservation of capital and liquidity. | Short-term Investments | Less than .005% |
A Expenses expressed as a percentage of average net assets and are as of each underlying Central Fund's most recent annual or semi-annual shareholder report.
A complete unaudited list of holdings for each Fidelity Central Fund is available upon request or at the Securities and Exchange Commission website at www.sec.gov. In addition, the financial statements of the Fidelity Central Funds which contain the significant accounting policies (including investment valuation policies) of those funds, and are not covered by the Report of Independent Registered Public Accounting Firm, are available on the Securities and Exchange Commission website or upon request.
3. Significant Accounting Policies.
The Fund is an investment company and applies the accounting and reporting guidance of the Financial Accounting Standards Board (FASB) Accounting Standards Codification Topic 946 Financial Services - Investment Companies . The financial statements have been prepared in conformity with accounting principles generally accepted in the United States of America (GAAP), which require management to make certain estimates and assumptions at the date of the financial statements. Actual results could differ from those estimates. Subsequent events, if any, through the date that the financial statements were issued have been evaluated in the preparation of the financial statements. The Fund's Schedule of Investments lists any underlying mutual funds or exchange-traded funds (ETFs) but does not include the underlying holdings of these funds. The following summarizes the significant accounting policies of the Fund:
Investment Valuation. Investments are valued as of 4:00 p.m. Eastern time on the last calendar day of the period. The Board of Trustees (the Board) has designated the Fund's investment adviser as the valuation designee responsible for the fair valuation function and performing fair value determinations as needed. The investment adviser has established a Fair Value Committee (the Committee) to carry out the day-to-day fair valuation responsibilities and has adopted policies and procedures to govern the fair valuation process and the activities of the Committee. In accordance with these fair valuation policies and procedures, which have been approved by the Board, the Fund attempts to obtain prices from one or more third party pricing services or brokers to value its investments. When current market prices, quotations or currency exchange rates are not readily available or reliable, investments will be fair valued in good faith by the Committee, in accordance with the policies and procedures. Factors used in determining fair value vary by investment type and may include market or investment specific events, transaction data, estimated cash flows, and market observations of comparable investments. The frequency that the fair valuation procedures are used cannot be predicted and they may be utilized to a significant extent. The Committee manages the Fund's fair valuation practices and maintains the fair valuation policies and procedures. The Fund's investment adviser reports to the Board information regarding the fair valuation process and related material matters.
The Fund categorizes the inputs to valuation techniques used to value its investments into a disclosure hierarchy consisting of three levels as shown below:
Level 1 - unadjusted quoted prices in active markets for identical investments
Level 2 - other significant observable inputs (including quoted prices for similar investments, interest rates, prepayment speeds, etc.)
Level 3 - unobservable inputs (including the Fund's own assumptions based on the best information available)
Valuation techniques used to value the Fund's investments by major category are as follows:
Equity securities, including restricted securities, for which market quotations are readily available, are valued at the last reported sale price or official closing price as reported by a third party pricing service on the primary market or exchange on which they are traded and are categorized as Level 1 in the hierarchy. In the event there were no sales during the day or closing prices are not available, securities are valued at the last quoted bid price or may be valued using the last available price and are generally categorized as Level 2 in the hierarchy. For foreign equity securities, when market or security specific events arise, comparisons to the valuation of American Depositary Receipts (ADRs), futures contracts, ETFs and certain indexes as well as quoted prices for similar securities may be used and would be categorized as Level 2 in the hierarchy. For equity securities, including restricted securities, where observable inputs are limited, assumptions about market activity and risk are used and these securities may be categorized as Level 3 in the hierarchy.
Investments in open-end mutual funds, including the Fidelity Central Funds, are valued at their closing net asset value (NAV) each business day and are categorized as Level 1 in the hierarchy.
Changes in valuation techniques may result in transfers in or out of an assigned level within the disclosure hierarchy. The aggregate value of investments by input level as of February 28, 2023 is included at the end of the Fund's Schedule of Investments.
Foreign Currency. Certain Funds may use foreign currency contracts to facilitate transactions in foreign-denominated securities. Gains and losses from these transactions may arise from changes in the value of the foreign currency or if the counterparties do not perform under the contracts' terms.
Foreign-denominated assets, including investment securities, and liabilities are translated into U.S. dollars at the exchange rates at period end. Purchases and sales of investment securities, income and dividends received, and expenses denominated in foreign currencies are translated into U.S. dollars at the exchange rate in effect on the transaction date.
The effects of exchange rate fluctuations on investments are included with the net realized and unrealized gain (loss) on investment securities. Other foreign currency transactions resulting in realized and unrealized gain (loss) are disclosed separately.
Investment Transactions and Income. For financial reporting purposes, the Fund's investment holdings and NAV include trades executed through the end of the last business day of the period. The NAV per share for processing shareholder transactions is calculated as of the close of business of the New York Stock Exchange (NYSE), normally 4:00 p.m. Eastern time and includes trades executed through the end of the prior business day. Gains and losses on securities sold are determined on the basis of identified cost and include proceeds received from litigation. Commissions paid to certain brokers with whom the investment adviser, or its affiliates, places trades on behalf of a fund include an amount in addition to trade execution, which may be rebated back to a fund. Any such rebates are included in net realized gain (loss) on investments in the Statement of Operations. Dividend income is recorded on the ex-dividend date, except for certain dividends from foreign securities where the ex-dividend date may have passed, which are recorded as soon as the Fund is informed of the ex-dividend date. Non-cash dividends included in dividend income, if any, are recorded at the fair market value of the securities received. Income and capital gain distributions from Fidelity Central Funds, if any, are recorded on the ex-dividend date. Certain distributions received by the Fund represent a return of capital or capital gain. The Fund determines the components of these distributions subsequent to the ex-dividend date, based upon receipt of tax filings or other correspondence relating to the underlying investment. These distributions are recorded as a reduction of cost of investments and/or as a realized gain. Investment income is recorded net of foreign taxes withheld where recovery of such taxes is uncertain. Funds may file withholding tax reclaims in certain jurisdictions to recover a portion of amounts previously withheld. Any withholding tax reclaims income is included in the Statement of Operations in dividends. Any receivables for withholding tax reclaims are included in the Statement of Assets and Liabilities in dividends receivable.
Expenses. Expenses directly attributable to a fund are charged to that fund. Expenses attributable to more than one fund are allocated among the respective funds on the basis of relative net assets or other appropriate methods. Expenses included in the accompanying financial statements reflect the expenses of that fund and do not include any expenses associated with any underlying mutual funds or exchange-traded funds. Although not included in a fund's expenses, a fund indirectly bears its proportionate share of these expenses through the net asset value of each underlying mutual fund or exchange-traded fund. Expense estimates are accrued in the period to which they relate and adjustments are made when actual amounts are known.
Income Tax Information and Distributions to Shareholders. Each year, the Fund intends to qualify as a regulated investment company under Subchapter M of the Internal Revenue Code, including distributing substantially all of its taxable income and realized gains. As a result, no provision for U.S. Federal income taxes is required. As of February 28, 2023, the Fund did not have any unrecognized tax benefits in the financial statements; nor is the Fund aware of any tax positions for which it is reasonably possible that the total amounts of unrecognized tax benefits will significantly change in the next twelve months. The Fund files a U.S. federal tax return, in addition to state and local tax returns as required. The Fund's federal income tax returns are subject to examination by the Internal Revenue Service (IRS) for a period of three fiscal years after they are filed. State and local tax returns may be subject to examination for an additional fiscal year depending on the jurisdiction. Foreign taxes are provided for based on the Fund's understanding of the tax rules and rates that exist in the foreign markets in which it invests.
Distributions are declared and recorded on the ex-dividend date. Income and capital gain distributions are determined in accordance with income tax regulations, which may differ from GAAP. In addition, the Fund claimed a portion of the payment made to redeeming shareholders as a distribution for income tax purposes.
Capital accounts within the financial statements are adjusted for permanent book-tax differences. These adjustments have no impact on net assets or the results of operations. Capital accounts are not adjusted for temporary book-tax differences which will reverse in a subsequent period.
Book-tax differences are primarily due to foreign currency transactions, partnerships and losses deferred due to wash sales.
As of period end, the cost and unrealized appreciation (depreciation) in securities, and derivatives if applicable, for federal income tax purposes were as follows:
| Gross unrealized appreciation | $205,091,487 |
| Gross unrealized depreciation | (56,923,405) |
| Net unrealized appreciation (depreciation) | $148,168,082 |
| Tax Cost | $1,174,124,061 |
The tax-based components of distributable earnings as of period end were as follows:
| Undistributed ordinary income | $1,301,853 |
| Undistributed long-term capital gain | $19,167,575 |
| Net unrealized appreciation (depreciation) on securities and other investments | $148,167,108 |
The tax character of distributions paid was as follows:
| | February 28, 2023 | February 28, 2022 |
| Ordinary Income | $23,713,330 | $17,236,478 |
| Long-term Capital Gains | 38,503,618 | 11,101,460 |
| Total | $62,216,948 | $28,337,938 |
4. Purchases and Sales of Investments.
Purchases and sales of securities, other than short-term securities and in-kind transactions, as applicable, are noted in the table below.
| | Purchases ($) | Sales ($) |
| Utilities Portfolio | 1,021,841,389 | 715,703,064 |
5. Fees and Other Transactions with Affiliates.
Management Fee. Fidelity Management & Research Company LLC (the investment adviser) and its affiliates provide the Fund with investment management related services for which the Fund pays a monthly management fee. The management fee is the sum of an individual fund fee rate that is based on an annual rate of .30% of the Fund's average net assets and an annualized group fee rate that averaged .23% during the period. The group fee rate is based upon the monthly average net assets of a group of registered investment companies with which the investment adviser has management contracts. The group fee rate decreases as assets under management increase and increases as assets under management decrease. For the reporting period, the total annual management fee rate was .53% of the Fund's average net assets.
Transfer Agent Fees. Fidelity Investments Institutional Operations Company LLC (FIIOC), an affiliate of the investment adviser, is the Fund's transfer, dividend disbursing and shareholder servicing agent. FIIOC receives account fees and asset-based fees that vary according to account size and type of account. FIIOC pays for typesetting, printing and mailing of shareholder reports, except proxy statements. For the period, the transfer agent fees were equivalent to an annual rate of .17% of average net assets.
Accounting Fees. Fidelity Service Company, Inc. (FSC), an affiliate of the investment adviser, maintains the Fund's accounting records. The accounting fee is based on the level of average net assets for each month. For the period, the fees were equivalent to the following annual rates:
| | % of Average Net Assets |
| Utilities Portfolio | .03 |
Brokerage Commissions. A portion of portfolio transactions were placed with brokerage firms which are affiliates of the investment adviser. Brokerage commissions are included in net realized gain (loss) and change in net unrealized appreciation (depreciation) in the Statement of Operations. The commissions paid to these affiliated firms were as follows:
| | Amount |
| Utilities Portfolio | $17,947 |
Interfund Lending Program. Pursuant to an Exemptive Order issued by the Securities and Exchange Commission (the SEC), the Fund, along with other registered investment companies having management contracts with Fidelity Management & Research Company LLC (FMR), or other affiliated entities of FMR, may participate in an interfund lending program. This program provides an alternative credit facility allowing the Fund to borrow from, or lend money to, other participating affiliated funds. At period end, there were no interfund loans outstanding. Activity in this program during the period for which loans were outstanding was as follows:
| | Borrower or Lender | Average Loan Balance | Weighted Average Interest Rate | Interest Expense |
| Utilities Portfolio | Borrower | $16,158,500 | 3.32% | $2,976 |
Interfund Trades. Funds may purchase from or sell securities to other Fidelity Funds under procedures adopted by the Board. The procedures have been designed to ensure these interfund trades are executed in accordance with Rule 17a-7 of the 1940 Act. Any interfund trades are included within the respective purchases and sales amounts shown in the Purchases and Sales of Investments note. Interfund trades during the period are noted in the table below.
| | Purchases ($) | Sales ($) | Realized Gain (Loss) ($) |
| Utilities Portfolio | 20,325,476 | 5,559,057 | (584,045) |
6. Committed Line of Credit.
Certain Funds participate with other funds managed by the investment adviser or an affiliate in a $4.25 billion credit facility (the "line of credit") to be utilized for temporary or emergency purposes to fund shareholder redemptions or for other short-term liquidity purposes. The participating funds have agreed to pay commitment fees on their pro-rata portion of the line of credit, which are reflected in Miscellaneous expenses on the Statement of Operations, and are listed below. During the period, there were no borrowings on this line of credit.
| | Amount |
| Utilities Portfolio | $2,361 |
7. Security Lending.
Funds lend portfolio securities from time to time in order to earn additional income. Lending agents are used, including National Financial Services (NFS), an affiliate of the investment adviser. Pursuant to a securities lending agreement, NFS will receive a fee, which is capped at 9.9% of a fund's daily lending revenue, for its services as lending agent. A fund may lend securities to certain qualified borrowers, including NFS. On the settlement date of the loan, a fund receives collateral (in the form of U.S. Treasury obligations, letters of credit and/or cash) against the loaned securities and maintains collateral in an amount not less than 100% of the market value of the loaned securities during the period of the loan. The market value of the loaned securities is determined at the close of business of a fund and any additional required collateral is delivered to a fund on the next business day. A fund or borrower may terminate the loan at any time, and if the borrower defaults on its obligation to return the securities loaned because of insolvency or other reasons, a fund may apply collateral received from the borrower against the obligation. A fund may experience delays and costs in recovering the securities loaned. Any cash collateral received is invested in the Fidelity Securities Lending Cash Central Fund. Any loaned securities are identified as such in the Schedule of Investments, and the value of loaned securities and cash collateral at period end, as applicable, are presented in the Statement of Assets and Liabilities. Security lending income represents the income earned on investing cash collateral, less rebates paid to borrowers and any lending agent fees associated with the loan, plus any premium payments received for lending certain types of securities. Security lending income is presented in the Statement of Operations as a component of income from Fidelity Central Funds. Affiliated security lending activity, if any, was as follows:
| | Total Security Lending Fees Paid to NFS | Security Lending Income From Securities Loaned to NFS | Value of Securities Loaned to NFS at Period End |
| Utilities Portfolio | $3,889 | $- | $- |
8. Expense Reductions.
In addition, during the period the investment adviser or an affiliate reimbursed and/or waived a portion of operating expenses in the amount of $49,100.
9. Other.
A fund's organizational documents provide former and current trustees and officers with a limited indemnification against liabilities arising in connection with the performance of their duties to the fund. In the normal course of business, a fund may also enter into contracts that provide general indemnifications. A fund's maximum exposure under these arrangements is unknown as this would be dependent on future claims that may be made against a fund. The risk of material loss from such claims is considered remote.
10. Risk and Uncertainties.
Many factors affect a fund's performance. Developments that disrupt global economies and financial markets, such as pandemics, epidemics, outbreaks of infectious diseases, war, terrorism, and environmental disasters, may significantly affect a fund's investment performance. The effects of these developments to a fund will be impacted by the types of securities in which a fund invests, the financial condition, industry, economic sector, and geographic location of an issuer, and a fund's level of investment in the securities of that issuer. Significant concentrations in security types, issuers, industries, sectors, and geographic locations may magnify the factors that affect a fund's performance.
To the Board of Trustees of Fidelity Select Portfolios and Shareholders of Utilities Portfolio
Opinion on the Financial Statements
We have audited the accompanying statement of assets and liabilities, including the schedule of investments, of Utilities Portfolio (one of the funds constituting Fidelity Select Portfolios, referred to hereafter as the "Fund") as of February 28, 2023, the related statement of operations for the year ended February 28, 2023, the statement of changes in net assets for each of the two years in the period ended February 28, 2023, including the related notes, and the financial highlights for each of the five years in the period ended February 28, 2023 (collectively referred to as the "financial statements"). In our opinion, the financial statements present fairly, in all material respects, the financial position of the Fund as of February 28, 2023, the results of its operations for the year then ended, the changes in its net assets for each of the two years in the period ended February 28, 2023 and the financial highlights for each of the five years in the period ended February 28, 2023 in conformity with accounting principles generally accepted in the United States of America.
Basis for Opinion
These financial statements are the responsibility of the Fund's management. Our responsibility is to express an opinion on the Fund's financial statements based on our audits. We are a public accounting firm registered with the Public Company Accounting Oversight Board (United States) (PCAOB) and are required to be independent with respect to the Fund in accordance with the U.S. federal securities laws and the applicable rules and regulations of the Securities and Exchange Commission and the PCAOB.
We conducted our audits of these financial statements in accordance with the standards of the PCAOB. Those standards require that we plan and perform the audit to obtain reasonable assurance about whether the financial statements are free of material misstatement, whether due to error or fraud.
Our audits included performing procedures to assess the risks of material misstatement of the financial statements, whether due to error or fraud, and performing procedures that respond to those risks. Such procedures included examining, on a test basis, evidence regarding the amounts and disclosures in the financial statements. Our audits also included evaluating the accounting principles used and significant estimates made by management, as well as evaluating the overall presentation of the financial statements. Our procedures included confirmation of securities owned as of February 28, 2023 by correspondence with the custodian and brokers; when replies were not received from brokers, we performed other auditing procedures. We believe that our audits provide a reasonable basis for our opinion.
/s/ PricewaterhouseCoopers LLP
Boston, Massachusetts
April 11, 2023
We have served as the auditor of one or more investment companies in the Fidelity group of funds since 1932.
The Trustees, Members of the Advisory Board (if any), and officers of the trust and fund, as applicable, are listed below. The Board of Trustees governs the fund and is responsible for protecting the interests of shareholders. The Trustees are experienced executives who meet periodically throughout the year to oversee the fund's activities, review contractual arrangements with companies that provide services to the fund, oversee management of the risks associated with such activities and contractual arrangements, and review the fund's performance. Each of the Trustees oversees 318 funds.
The Trustees hold office without limit in time except that (a) any Trustee may resign; (b) any Trustee may be removed by written instrument, signed by at least two-thirds of the number of Trustees prior to such removal; (c) any Trustee who requests to be retired or who has become incapacitated by illness or injury may be retired by written instrument signed by a majority of the other Trustees; and (d) any Trustee may be removed at any special meeting of shareholders by a two-thirds vote of the outstanding voting securities of the trust. Each Trustee who is not an interested person (as defined in the 1940 Act) of the trust and the fund is referred to herein as an Independent Trustee. Each Independent Trustee shall retire not later than the last day of the calendar year in which his or her 75th birthday occurs. The Independent Trustees may waive this mandatory retirement age policy with respect to individual Trustees. Officers and Advisory Board Members hold office without limit in time, except that any officer or Advisory Board Member may resign or may be removed by a vote of a majority of the Trustees at any regular meeting or any special meeting of the Trustees. Except as indicated, each individual has held the office shown or other offices in the same company for the past five years.
The fund's Statement of Additional Information (SAI) includes more information about the Trustees. To request a free copy, call Fidelity at 1-800-544-8544.
Experience, Skills, Attributes, and Qualifications of the Trustees. The Governance and Nominating Committee has adopted a statement of policy that describes the experience, qualifications, attributes, and skills that are necessary and desirable for potential Independent Trustee candidates (Statement of Policy). The Board believes that each Trustee satisfied at the time he or she was initially elected or appointed a Trustee, and continues to satisfy, the standards contemplated by the Statement of Policy. The Governance and Nominating Committee also engages professional search firms to help identify potential Independent Trustee candidates who have the experience, qualifications, attributes, and skills consistent with the Statement of Policy. From time to time, additional criteria based on the composition and skills of the current Independent Trustees, as well as experience or skills that may be appropriate in light of future changes to board composition, business conditions, and regulatory or other developments, have also been considered by the professional search firms and the Governance and Nominating Committee. In addition, the Board takes into account the Trustees' commitment and participation in Board and committee meetings, as well as their leadership of standing and ad hoc committees throughout their tenure.
In determining that a particular Trustee was and continues to be qualified to serve as a Trustee, the Board has considered a variety of criteria, none of which, in isolation, was controlling. The Board believes that, collectively, the Trustees have balanced and diverse experience, qualifications, attributes, and skills, which allow the Board to operate effectively in governing the fund and protecting the interests of shareholders. Information about the specific experience, skills, attributes, and qualifications of each Trustee, which in each case led to the Board's conclusion that the Trustee should serve (or continue to serve) as a trustee of the fund, is provided below.
Board Structure and Oversight Function. Robert A. Lawrence is an interested person and currently serves as Chair. The Trustees have determined that an interested Chair is appropriate and benefits shareholders because an interested Chair has a personal and professional stake in the quality and continuity of services provided to the fund. Independent Trustees exercise their informed business judgment to appoint an individual of their choosing to serve as Chair, regardless of whether the Trustee happens to be independent or a member of management. The Independent Trustees have determined that they can act independently and effectively without having an Independent Trustee serve as Chair and that a key structural component for assuring that they are in a position to do so is for the Independent Trustees to constitute a substantial majority for the Board. The Independent Trustees also regularly meet in executive session. David M. Thomas serves as Lead Independent Trustee and as such (i) acts as a liaison between the Independent Trustees and management with respect to matters important to the Independent Trustees and (ii) with management prepares agendas for Board meetings.
Fidelity ® funds are overseen by different Boards of Trustees. The fund's Board oversees Fidelity's high income and certain equity funds, and other Boards oversee Fidelity's alternative investment, investment-grade bond, money market, asset allocation, and other equity funds. The asset allocation funds may invest in Fidelity ® funds overseen by the fund's Board. The use of separate Boards, each with its own committee structure, allows the Trustees of each group of Fidelity ® funds to focus on the unique issues of the funds they oversee, including common research, investment, and operational issues. On occasion, the separate Boards establish joint committees to address issues of overlapping consequences for the Fidelity ® funds overseen by each Board.
The Trustees operate using a system of committees to facilitate the timely and efficient consideration of all matters of importance to the Trustees, the fund, and fund shareholders and to facilitate compliance with legal and regulatory requirements and oversight of the fund's activities and associated risks. The Board, acting through its committees, has charged FMR and its affiliates with (i) identifying events or circumstances the occurrence of which could have demonstrably adverse effects on the fund's business and/or reputation; (ii) implementing processes and controls to lessen the possibility that such events or circumstances occur or to mitigate the effects of such events or circumstances if they do occur; and (iii) creating and maintaining a system designed to evaluate continuously business and market conditions in order to facilitate the identification and implementation processes described in (i) and (ii) above. Because the day-to-day operations and activities of the fund are carried out by or through FMR, its affiliates, and other service providers, the fund's exposure to risks is mitigated but not eliminated by the processes overseen by the Trustees. While each of the Board's committees has responsibility for overseeing different aspects of the fund's activities, oversight is exercised primarily through the Operations, Audit, and Compliance Committees. Appropriate personnel, including but not limited to the fund's Chief Compliance Officer (CCO), FMR's internal auditor, the independent accountants, the fund's Treasurer and portfolio management personnel, make periodic reports to the Board's committees, as appropriate, including an annual review of Fidelity's risk management program for the Fidelity ® funds. The responsibilities of each standing committee, including their oversight responsibilities, are described further under "Standing Committees of the Trustees."
Interested Trustees*:
Correspondence intended for a Trustee who is an interested person may be sent to Fidelity Investments, 245 Summer Street, Boston, Massachusetts 02210.
Name, Year of Birth; Principal Occupations and Other Relevant Experience+
Bettina Doulton (1964)
Year of Election or Appointment: 2020
Trustee
Ms. Doulton also serves as Trustee of other Fidelity ® funds. Prior to her retirement, Ms. Doulton served in a variety of positions at Fidelity Investments, including as a managing director of research (2006-2007), portfolio manager to certain Fidelity ® funds (1993-2005), equity analyst and portfolio assistant (1990-1993), and research assistant (1987-1990). Ms. Doulton currently owns and operates Phi Builders + Architects and Cellardoor Winery. Previously, Ms. Doulton served as a member of the Board of Brown Capital Management, LLC (2014-2018).
Robert A. Lawrence (1952)
Year of Election or Appointment: 2020
Trustee
Chair of the Board of Trustees
Mr. Lawrence also serves as Trustee of other funds. Previously, Mr. Lawrence served as a Trustee and Member of the Advisory Board of certain funds. Prior to his retirement in 2008, Mr. Lawrence served as Vice President of certain Fidelity ® funds (2006-2008), Senior Vice President, Head of High Income Division of Fidelity Management & Research Company (investment adviser firm, 2006-2008), and President of Fidelity Strategic Investments (investment adviser firm, 2002-2005).
* Determined to be an "Interested Trustee" by virtue of, among other things, his or her affiliation with the trust or various entities under common control with FMR.
+ The information includes the Trustee's principal occupation during the last five years and other information relating to the experience, attributes, and skills relevant to the Trustee's qualifications to serve as a Trustee, which led to the conclusion that the Trustee should serve as a Trustee for the fund.
Independent Trustees:
Correspondence intended for an Independent Trustee may be sent to Fidelity Investments, P.O. Box 55235, Boston, Massachusetts 02205-5235.
Name, Year of Birth; Principal Occupations and Other Relevant Experience+
Thomas P. Bostick (1956)
Year of Election or Appointment: 2021
Trustee
Lieutenant General Bostick also serves as Trustee of other Fidelity ® funds. Prior to his retirement, General Bostick (United States Army, Retired) held a variety of positions within the U.S. Army, including Commanding General and Chief of Engineers, U.S. Army Corps of Engineers (2012-2016) and Deputy Chief of Staff and Director of Human Resources, U.S. Army (2009-2012). General Bostick currently serves as a member of the Board and Finance and Governance & Sustainability Committees of CSX Corporation (transportation, 2020-present) and a member of the Board and Corporate Governance and Nominating Committee of Perma-Fix Environmental Services, Inc. (nuclear waste management, 2020-present). General Bostick serves as Chief Executive Officer of Bostick Global Strategies, LLC (consulting, 2016-present), as a member of the Board of HireVue, Inc. (video interview and assessment, 2020-present), as a member of the Board of Allonnia (biotechnology and engineering solutions, 2022-present) and on the Advisory Board of Solugen, Inc. (specialty bio-based chemicals manufacturer, 2022-present). Previously, General Bostick served as a Member of the Advisory Board of certain Fidelity ® funds (2021), President, Intrexon Bioengineering (2018-2020) and Chief Operating Officer (2017-2020) and Senior Vice President of the Environment Sector (2016-2017) of Intrexon Corporation (biopharmaceutical company).
Dennis J. Dirks (1948)
Year of Election or Appointment: 2018
Trustee
Mr. Dirks also serves as Trustee of other Fidelity ® funds. Prior to his retirement in May 2003, Mr. Dirks served as Chief Operating Officer and as a member of the Board of The Depository Trust & Clearing Corporation (financial markets infrastructure), President, Chief Operating Officer and a member of the Board of The Depository Trust Company (DTC), President and a member of the Board of the National Securities Clearing Corporation (NSCC), Chief Executive Officer and a member of the Board of the Government Securities Clearing Corporation and Chief Executive Officer and a member of the Board of the Mortgage-Backed Securities Clearing Corporation. Mr. Dirks currently serves as a member of the Finance Committee (2016-present) and Board (2017-present) and is Treasurer (2018-present) of the Asolo Repertory Theatre.
Donald F. Donahue (1950)
Year of Election or Appointment: 2018
Trustee
Mr. Donahue also serves as Trustee of other Fidelity ® funds. Mr. Donahue serves as President and Chief Executive Officer of Miranda Partners, LLC (risk consulting for the financial services industry, 2012-present). Previously, Mr. Donahue served as Chief Executive Officer (2006-2012), Chief Operating Officer (2003-2006) and Managing Director, Customer Marketing and Development (1999-2003) of The Depository Trust & Clearing Corporation (financial markets infrastructure). Mr. Donahue currently serves as a member (2007-present) and Co-Chairman (2016-present) of the Board of United Way of New York. Mr. Donahue previously served as a member of the Advisory Board of certain Fidelity ® funds (2015-2018) and as a member of the Board of The Leadership Academy (previously NYC Leadership Academy) (2012-2022).
Vicki L. Fuller (1957)
Year of Election or Appointment: 2020
Trustee
Ms. Fuller also serves as Trustee of other Fidelity ® funds. Previously, Ms. Fuller served as a member of the Advisory Board of certain Fidelity ® funds (2018-2020), Chief Investment Officer of the New York State Common Retirement Fund (2012-2018) and held a variety of positions at AllianceBernstein L.P. (global asset management, 1985-2012), including Managing Director (2006-2012) and Senior Vice President and Senior Portfolio Manager (2001-2006). Ms. Fuller currently serves as a member of the Board, Audit Committee and Nominating and Governance Committee of two Blackstone business development companies (2020-present), as a member of the Board of Treliant, LLC (consulting, 2019-present), as a member of the Board of Ariel Alternatives, LLC (private equity, 2022-present) and as a member of the Board and Chair of the Audit Committee of Gusto, Inc. (software, 2021-present). In addition, Ms. Fuller currently serves as a member of the Board of Roosevelt University (2019-present) and as a member of the Executive Board of New York University's Stern School of Business. Ms. Fuller previously served as a member of the Board, Audit Committee and Nominating and Governance Committee of The Williams Companies, Inc. (natural gas infrastructure, 2018-2021).
Patricia L. Kampling (1959)
Year of Election or Appointment: 2020
Trustee
Ms. Kampling also serves as Trustee of other Fidelity ® funds. Prior to her retirement, Ms. Kampling served as Chairman of the Board and Chief Executive Officer (2012-2019), President and Chief Operating Officer (2011-2012) and Executive Vice President and Chief Financial Officer (2010-2011) of Alliant Energy Corporation. Ms. Kampling currently serves as a member of the Board, Finance Committee and Governance, Compensation and Nominating Committee of Xcel Energy Inc. (utilities company, 2020-present) and as a member of the Board, Audit, Finance and Risk Committee and Safety, Environmental, Technology and Operations Committee and Chair of the Executive Development and Compensation Committee of American Water Works Company, Inc. (utilities company, 2019-present). In addition, Ms. Kampling currently serves as a member of the Board of the Nature Conservancy, Wisconsin Chapter (2019-present). Previously, Ms. Kampling served as a Member of the Advisory Board of certain Fidelity® funds (2020), a member of the Board, Compensation Committee and Executive Committee and Chair of the Audit Committee of Briggs & Stratton Corporation (manufacturing, 2011-2021), a member of the Board of Interstate Power and Light Company (2012-2019) and Wisconsin Power and Light Company (2012-2019) (each a subsidiary of Alliant Energy Corporation) and as a member of the Board and Workforce Development Committee of the Business Roundtable (2018-2019).
Thomas A. Kennedy (1955)
Year of Election or Appointment: 2021
Trustee
Mr. Kennedy also serves as Trustee of other Fidelity ® funds. Previously, Mr. Kennedy served as a Member of the Advisory Board of certain Fidelity ® funds (2020) and held a variety of positions at Raytheon Company (aerospace and defense, 1983-2020), including Chairman and Chief Executive Officer (2014-2020) and Executive Vice President and Chief Operating Officer (2013-2014). Mr. Kennedy served as Executive Chairman of the Board of Directors of Raytheon Technologies Corporation (aerospace and defense, 2020-2021). Mr. Kennedy serves as a Director of the Board of Directors of Textron Inc. (aerospace and defense, 2023-present).
Oscar Munoz (1959)
Year of Election or Appointment: 2021
Trustee
Mr. Munoz also serves as Trustee of other Fidelity ® funds. Prior to his retirement, Mr. Munoz served as Executive Chairman (2020-2021), Chief Executive Officer (2015-2020), President (2015-2016) and a member of the Board (2010-2021) of United Airlines Holdings, Inc. Mr. Munoz currently serves as a member of the Board of CBRE Group, Inc. (commercial real estate, 2020-present), a member of the Board of Univision Communications, Inc. (Hispanic media, 2020-present), a member of the Board of Archer Aviation Inc. (2021-present), a member of the Defense Business Board of the United States Department of Defense (2021-present) and a member of the Board of Salesforce.com, Inc. (cloud-based software, 2022-present). Previously, Mr. Munoz served as a Member of the Advisory Board of certain Fidelity ® funds (2021).
David M. Thomas (1949)
Year of Election or Appointment: 2018
Trustee
Lead Independent Trustee
Mr. Thomas also serves as Trustee of other Fidelity ® funds. Previously, Mr. Thomas served as Executive Chairman (2005-2006) and Chairman and Chief Executive Officer (2000-2005) of IMS Health, Inc. (pharmaceutical and healthcare information solutions). Mr. Thomas currently serves as a member of the Board of Fortune Brands Home and Security (home and security products, 2004-present) and as Director (2013-present) and Non-Executive Chairman of the Board (2022-present) of Interpublic Group of Companies, Inc. (marketing communication).
Susan Tomasky (1953)
Year of Election or Appointment: 2020
Trustee
Ms. Tomasky also serves as Trustee of other Fidelity ® funds. Prior to her retirement, Ms. Tomasky served in various executive officer positions at American Electric Power Company, Inc. (1998-2011), including most recently as President of AEP Transmission (2007-2011). Ms. Tomasky currently serves as a member of the Board and Sustainability Committee and as Chair of the Audit Committee of Marathon Petroleum Corporation (2018-present) and as a member of the Board, Executive Committee, Corporate Governance Committee and Organization and Compensation Committee and as Lead Director of the Board of Public Service Enterprise Group, Inc. (utilities company, 2012-present) and as a member of the Board of its subsidiary company, Public Service Electric and Gas Co. (2021-present). In addition, Ms. Tomasky currently serves as a member (2009-present) and President (2020-present) of the Board of the Royal Shakespeare Company - America (2009-present), as a member of the Board of the Columbus Association for the Performing Arts (2011-present) and as a member of the Board and Kenyon in the World Committee of Kenyon College (2016-present). Previously, Ms. Tomasky served as a Member of the Advisory Board of certain Fidelity ® funds (2020), as a member of the Board of the Columbus Regional Airport Authority (2007-2020), as a member of the Board (2011-2018) and Lead Independent Director (2015-2018) of Andeavor Corporation (previously Tesoro Corporation) (independent oil refiner and marketer) and as a member of the Board of Summit Midstream Partners LP (energy, 2012-2018).
Michael E. Wiley (1950)
Year of Election or Appointment: 2008
Trustee
Mr. Wiley also serves as Trustee of other Fidelity ® funds. Previously, Mr. Wiley served as a member of the Advisory Board of certain Fidelity ® funds (2018-2020), Chairman, President and CEO of Baker Hughes, Inc. (oilfield services, 2000-2004). Mr. Wiley also previously served as a member of the Board of Andeavor Corporation (independent oil refiner and marketer, 2005-2018), a member of the Board of Andeavor Logistics LP (natural resources logistics, 2015-2018) and a member of the Board of High Point Resources (exploration and production, 2005-2020).
+ The information includes the Trustee's principal occupation during the last five years and other information relating to the experience, attributes, and skills relevant to the Trustee's qualifications to serve as a Trustee, which led to the conclusion that the Trustee should serve as a Trustee for the fund.
Advisory Board Members and Officers:
Correspondence intended for a Member of the Advisory Board (if any) may be sent to Fidelity Investments, P.O. Box 55235, Boston, Massachusetts 02205-5235. Correspondence intended for an officer or Peter S. Lynch may be sent to Fidelity Investments, 245 Summer Street, Boston, Massachusetts 02210. Officers appear below in alphabetical order.
Name, Year of Birth; Principal Occupation
Peter S. Lynch (1944)
Year of Election or Appointment: 2018
Member of the Advisory Board
Mr. Lynch also serves as a Member of the Advisory Board of other Fidelity ® funds. Mr. Lynch is Vice Chairman and a Director of Fidelity Management & Research Company LLC (investment adviser firm). In addition, Mr. Lynch serves as a Trustee of Boston College and as the Chairman of the Inner-City Scholarship Fund. Previously, Mr. Lynch served as Vice Chairman and a Director of FMR Co., Inc. (investment adviser firm) and on the Special Olympics International Board of Directors (1997-2006).
Heather Bonner (1977)
Year of Election or Appointment: 2023
Assistant Treasurer
Ms. Bonner also serves as an officer of other funds. Ms. Bonner serves as Senior Vice President (2022-present), and is an employee of Fidelity Investments. Ms. Bonner serves as Assistant Treasurer of Fidelity CRET Trustee LLC (2022-present). Prior to joining Fidelity, Ms. Bonner served as Managing Director at AQR Capital Management (2013-2022) and was the Treasurer and Principal Financial Officer of the AQR Funds (2013-2022).
Craig S. Brown (1977)
Year of Election or Appointment: 2022
Deputy Treasurer
Mr. Brown also serves as an officer of other funds. Mr. Brown serves as Assistant Treasurer of FIMM, LLC (2021-present) and is an employee of Fidelity Investments (2013-present). Previously, Mr. Brown served as Assistant Treasurer of certain Fidelity ® funds (2019-2022).
John J. Burke III (1964)
Year of Election or Appointment: 2018
Chief Financial Officer
Mr. Burke also serves as Chief Financial Officer of other funds. Mr. Burke serves as Head of Investment Operations for Fidelity Fund and Investment Operations (2018-present) and is an employee of Fidelity Investments (1998-present). Previously Mr. Burke served as head of Asset Management Investment Operations (2012-2018).
Margaret Carey (1973)
Year of Election or Appointment: 2023
Secretary and Chief Legal Officer (CLO)
Ms. Carey also serves as an officer of other funds and as CLO of certain other Fidelity entities. She is a Senior Vice President and Deputy General Counsel of FMR LLC (diversified financial services company, 2019-present), and is an employee of Fidelity Investments.
William C. Coffey (1969)
Year of Election or Appointment: 2019
Assistant Secretary
Mr. Coffey also serves as Assistant Secretary of other funds. He is Senior Vice President and Deputy General Counsel of FMR LLC (diversified financial services company, 2010-present), and is an employee of Fidelity Investments. Previously, Mr. Coffey served as Secretary and CLO of certain funds (2018-2019); CLO, Secretary, and Senior Vice President of Fidelity Management & Research Company and FMR Co., Inc. (investment adviser firms, 2018-2019); Secretary of Fidelity SelectCo, LLC and Fidelity Investments Money Management, Inc. (investment adviser firms, 2018-2019); CLO of Fidelity Management & Research (Hong Kong) Limited, FMR Investment Management (UK) Limited, and Fidelity Management & Research (Japan) Limited (investment adviser firms, 2018-2019); and Assistant Secretary of certain funds (2009-2018).
Timothy M. Cohen (1969)
Year of Election or Appointment: 2018
Vice President
Mr. Cohen also serves as Vice President of other funds. Mr. Cohen serves as Co-Head of Equity (2018-present), a Director of Fidelity Management & Research (Japan) Limited (investment adviser firm, 2016-present), and is an employee of Fidelity Investments. Previously, Mr. Cohen served as Executive Vice President of Fidelity SelectCo, LLC (2019), Head of Global Equity Research (2016-2018), Chief Investment Officer - Equity and a Director of Fidelity Management & Research (U.K.) Inc. (investment adviser firm, 2013-2015) and as a Director of Fidelity Management & Research (Hong Kong) Limited (investment adviser firm, 2017).
Jonathan Davis (1968)
Year of Election or Appointment: 2010
Assistant Treasurer
Mr. Davis also serves as an officer of other funds. Mr. Davis serves as Assistant Treasurer of FIMM, LLC (2021-present), FMR Capital, Inc. (2017-present), FD Funds GP LLC (2021-present), FD Funds Holding LLC (2021-present), and FD Funds Management LLC (2021-present); and is an employee of Fidelity Investments. Previously, Mr. Davis served as Vice President and Associate General Counsel of FMR LLC (diversified financial services company, 2003-2010).
Laura M. Del Prato (1964)
Year of Election or Appointment: 2018
Assistant Treasurer
Ms. Del Prato also serves as an officer of other funds. Ms. Del Prato serves as Assistant Treasurer of FIMM, LLC (2021-present) and is an employee of Fidelity Investments (2017-present). Previously, Ms. Del Prato served as President and Treasurer of The North Carolina Capital Management Trust: Cash Portfolio and Term Portfolio (2018-2020). Prior to joining Fidelity Investments, Ms. Del Prato served as a Managing Director and Treasurer of the JPMorgan Mutual Funds (2014-2017). Prior to JPMorgan, Ms. Del Prato served as a partner at Cohen Fund Audit Services (accounting firm, 2012-2013) and KPMG LLP (accounting firm, 2004-2012).
Colm A. Hogan (1973)
Year of Election or Appointment: 2020
Assistant Treasurer
Mr. Hogan also serves as an officer of other funds. Mr. Hogan serves as Assistant Treasurer of FIMM, LLC (2021-present) and FMR Capital, Inc. (2017-present) and is an employee of Fidelity Investments (2005-present). Previously, Mr. Hogan served as Deputy Treasurer of certain Fidelity ® funds (2016-2020) and Assistant Treasurer of certain Fidelity ® funds (2016-2018).
Pamela R. Holding (1964)
Year of Election or Appointment: 2018
Vice President
Ms. Holding also serves as Vice President of other funds. Ms. Holding serves as Co-Head of Equity (2018-present) and is an employee of Fidelity Investments (2013-present). Previously, Ms. Holding served as Executive Vice President of Fidelity SelectCo, LLC (2019) and as Chief Investment Officer of Fidelity Institutional Asset Management (2013-2018).
Chris Maher (1972)
Year of Election or Appointment: 2020
Deputy Treasurer
Mr. Maher also serves as an officer of other funds. Mr. Maher serves as Assistant Treasurer of FIMM, LLC (2021-present) and FMR Capital, Inc. (2017-present), and is an employee of Fidelity Investments (2008-present). Previously, Mr. Maher served as Assistant Treasurer of certain funds (2013-2020); Vice President of Asset Management Compliance (2013), Vice President of the Program Management Group of FMR (investment adviser firm, 2010-2013), and Vice President of Valuation Oversight (2008-2010).
Jason P. Pogorelec (1975)
Year of Election or Appointment: 2020
Chief Compliance Officer
Mr. Pogorelec also serves as Chief Compliance Officer of other funds. Mr. Pogorelec is a Senior Vice President of Asset Management Compliance for Fidelity Investments and is an employee of Fidelity Investments. Mr. Pogorelec serves as Compliance Officer of Fidelity Management & Research Company LLC (investment adviser firm, 2023-present). Previously, Mr. Pogorelec served as Vice President, Associate General Counsel for Fidelity Investments (2010-2020) and Assistant Secretary of certain Fidelity ® funds (2015-2020).
Brett Segaloff (1972)
Year of Election or Appointment: 2021
Anti-Money Laundering (AML) Officer
Mr. Segaloff also serves as an AML Officer of other funds and other related entities. He is Director, Anti-Money Laundering (2007-present) of FMR LLC (diversified financial services company) and is an employee of Fidelity Investments (1996-present).
Stacie M. Smith (1974)
Year of Election or Appointment: 2018
President and Treasurer
Ms. Smith also serves as an officer of other funds. Ms. Smith serves as Assistant Treasurer of FIMM, LLC (2021-present) and FMR Capital, Inc. (2017-present), is an employee of Fidelity Investments (2009-present), and has served in other fund officer roles. Prior to joining Fidelity Investments, Ms. Smith served as Senior Audit Manager of Ernst & Young LLP (accounting firm, 1996-2009). Previously, Ms. Smith served as Assistant Treasurer (2013-2019) and Deputy Treasurer (2013-2016) of certain Fidelity ® funds.
Jim Wegmann (1979)
Year of Election or Appointment: 2019
Assistant Treasurer
Mr. Wegmann also serves as an officer of other funds. Mr. Wegmann serves as Assistant Treasurer of FIMM, LLC (2021-present) and is an employee of Fidelity Investments (2011-present). Previously, Mr. Wegmann served as Assistant Treasurer of certain Fidelity ® funds (2019-2021).
As a shareholder, you incur two types of costs: (1) transaction costs, which may include sales charges (loads) on purchase payments or redemption proceeds, as applicable and (2) ongoing costs, which generally include management fees, distribution and/or service (12b-1) fees and other Fund expenses. This Example is intended to help you understand your ongoing costs (in dollars) of investing in a fund and to compare these costs with the ongoing costs of investing in other mutual funds.
| The Example is based on an investment of $1,000 invested at the beginning of the period and held for the entire period (September 1, 2022 to February 28, 2023). |
Actual Expenses
The first line of the accompanying table provides information about actual account values and actual expenses. You may use the information in this line, together with the amount you invested, to estimate the expenses that you paid over the period. Simply divide your account value by $1,000.00 (for example, an $8,600 account value divided by $1,000.00 = 8.6), then multiply the result by the number in the first line for a class/Fund under the heading entitled "Expenses Paid During Period" to estimate the expenses you paid on your account during this period. If any fund is a shareholder of any underlying mutual funds or exchange-traded funds (ETFs) (the Underlying Funds), such fund indirectly bears its proportional share of the expenses of the Underlying Funds in addition to the direct expenses incurred presented in the table. These fees and expenses are not included in the annualized expense ratio used to calculate the expense estimate in the table below.
Hypothetical Example for Comparison Purposes
The second line of the accompanying table provides information about hypothetical account values and hypothetical expenses based on the actual expense ratio and an assumed rate of return of 5% per year before expenses, which is not the actual return. The hypothetical account values and expenses may not be used to estimate the actual ending account balance or expenses you paid for the period. You may use this information to compare the ongoing costs of investing in the Fund and other funds. To do so, compare this 5% hypothetical example with the 5% hypothetical examples that appear in the shareholder reports of the other funds. If any fund is a shareholder of any Underlying Funds, such fund indirectly bears its proportional share of the expenses of the Underlying Funds in addition to the direct expenses as presented in the table. These fees and expenses are not included in the annualized expense ratio used to calculate the expense estimate in the table below.
Please note that the expenses shown in the table are meant to highlight your ongoing costs only and do not reflect any transaction costs. Therefore, the second line of the table is useful in comparing ongoing costs only, and will not help you determine the relative total costs of owning different funds. In addition, if these transactional costs were included, your costs would have been higher.
| | | | | Annualized Expense Ratio- A | | Beginning Account Value September 1, 2022 | | Ending Account Value February 28, 2023 | | Expenses Paid During Period- C September 1, 2022 to February 28, 2023 |
| | | | | | | | | | |
| Utilities Portfolio | | | | .74% | | | | | | |
| Actual | | | | | | $ 1,000 | | $ 904.40 | | $ 3.49 |
Hypothetical- B | | | | | | $ 1,000 | | $ 1,021.12 | | $ 3.71 |
| |
A Annualized expense ratio reflects expenses net of applicable fee waivers.
B 5% return per year before expenses
C Expenses are equal to the annualized expense ratio, multiplied by the average account value over the period, multiplied by 181/ 365 (to reflect the one-half year period). The fees and expenses of any Underlying Funds are not included in each annualized expense ratio.
The dividend and capital gains distributions for the fund(s) are available on Fidelity.com or Institutional.Fidelity.com .
The fund hereby designates as a capital gain dividend with respect to the taxable year ended February 28, 2023, $35,895,447, or, if subsequently determined to be different, the net capital gain of such year.
A total of 0.01% of the dividends distributed during the fiscal year was derived from interest on U.S. Government securities which is generally exempt from state income tax.
The fund designates 100% of the dividends distributed during the fiscal year as qualifying for the dividends-received deduction for corporate shareholders.
The fund designates 100% of the dividends distributed during the fiscal year as amounts which may be taken into account as a dividend for the purposes of the maximum rate under section 1(h)(11) of the Internal Revenue Code.
The fund will notify shareholders in January 2024 of amounts for use in preparing 2023 income tax returns.
The Securities and Exchange Commission adopted Rule 22e-4 under the Investment Company Act of 1940 (the Liquidity Rule) to promote effective liquidity risk management throughout the open-end investment company industry, thereby reducing the risk that funds will be unable to meet their redemption obligations and mitigating dilution of the interests of fund shareholders.
The Fund has adopted and implemented a liquidity risk management program (the Program) reasonably designed to assess and manage the Fund's liquidity risk and to comply with the requirements of the Liquidity Rule. The Fund's Board of Trustees (the Board) has designated the Fund's investment adviser as administrator of the Program. The Fidelity advisers have established a Liquidity Risk Management Committee (the LRM Committee) to manage the Program for each of the Fidelity Funds. The LRM Committee monitors the adequacy and effectiveness of implementation of the Program and on a periodic basis assesses each Fund's liquidity risk based on a variety of factors including (1) the Fund's investment strategy, (2) portfolio liquidity and cash flow projections during normal and reasonably foreseeable stressed conditions, (3) shareholder redemptions, (4) borrowings and other funding sources and (5) certain factors specific to ETFs including the effect of the Fund's prices and spreads, market participants, and basket compositions on the overall liquidity of the Fund's portfolio, as applicable.
In accordance with the Program, each of the Fund's portfolio investments is classified into one of four defined liquidity categories based on a determination of a reasonable expectation for how long it would take to convert the investment to cash (or sell or dispose of the investment) without significantly changing its market value.
- Highly liquid investments - cash or convertible to cash within three business days or less
- Moderately liquid investments - convertible to cash in three to seven calendar days
- Less liquid investments - can be sold or disposed of, but not settled, within seven calendar days
- Illiquid investments - cannot be sold or disposed of within seven calendar days
Liquidity classification determinations take into account a variety of factors including various market, trading and investment-specific considerations, as well as market depth, and generally utilize analysis from a third-party liquidity metrics service.
The Liquidity Rule places a 15% limit on a fund's illiquid investments and requires funds that do not primarily hold assets that are highly liquid investments to determine and maintain a minimum percentage of the fund's net assets to be invested in highly liquid investments (highly liquid investment minimum or HLIM). The Program includes provisions reasonably designed to comply with the 15% limit on illiquid investments and for determining, periodically reviewing and complying with the HLIM requirement as applicable.
At a recent meeting of the Fund's Board of Trustees, the LRM Committee provided a written report to the Board pertaining to the operation, adequacy, and effectiveness of the Program for the period December 1, 2021 through November 30, 2022. The report concluded that the Program is operating effectively and is reasonably designed to assess and manage the Fund's liquidity risk.
1.813626.118
SELUTL-ANN-0423
Fidelity® Select Portfolios®
Information Technology Sector
IT Services Portfolio
Semiconductors Portfolio
Software and IT Services Portfolio
Tech Hardware Portfolio
Technology Portfolio
(IT Services Portfolio to be renamed Enterprise Technology Services Portfolio effective June 1, 2023)
Annual Report
February 28, 2023
Contents
To view a fund's proxy voting guidelines and proxy voting record for the 12-month period ended June 30, visit http://www.fidelity.com/proxyvotingresults or visit the Securities and Exchange Commission's (SEC) web site at http://www.sec.gov.
You may also call 1-800-544-8544 to request a free copy of the proxy voting guidelines.
Standard & Poor's, S&P and S&P 500 are registered service marks of The McGraw-Hill Companies, Inc. and have been licensed for use by Fidelity Distributors Corporation.
Other third-party marks appearing herein are the property of their respective owners.
All other marks appearing herein are registered or unregistered trademarks or service marks of FMR LLC or an affiliated company. © 2023 FMR LLC. All rights reserved.
This report and the financial statements contained herein are submitted for the general information of the shareholders of the Funds. This report is not authorized for distribution to prospective investors in the Funds unless preceded or accompanied by an effective prospectus.
A fund files its complete schedule of portfolio holdings with the SEC for the first and third quarters of each fiscal year on Form N-PORT. Forms N-PORT are available on the SEC's web site at http://www.sec.gov. A fund's Forms N-PORT may be reviewed and copied at the SEC's Public Reference Room in Washington, DC. Information regarding the operation of the SEC's Public Reference Room may be obtained by calling 1-800-SEC-0330.
For a complete list of a fund's portfolio holdings, view the most recent holdings listing, semiannual report, or annual report on Fidelity's web site at http://www.fidelity.com, http://www.institutional.fidelity.com, or http://www.401k.com, as applicable.
NOT FDIC INSURED •MAY LOSE VALUE •NO BANK GUARANTEE
Neither the Funds nor Fidelity Distributors Corporation is a bank.
Average annual total return reflects the change in the value of an investment, assuming reinvestment of distributions from dividend income and capital gains (the profits earned upon the sale of securities that have grown in value, if any) and assuming a constant rate of performance each year. The hypothetical investment and the average annual total returns do not reflect the deduction of taxes that a shareholder would pay on fund distributions or the redemption of fund shares. During periods of reimbursement by Fidelity, a fund's total return will be greater than it would be had the reimbursement not occurred. How a fund did yesterday is no guarantee of how it will do tomorrow.
| Average Annual Total Returns |
| | | | |
Periods ended February 28, 2023 | Past 1 year | Past 5 years | Past 10 years |
| IT Services Portfolio | -11.88% | 6.73% | 13.50% |
| $10,000 Over 10 Years |
| |
Let's say hypothetically that $10,000 was invested in IT Services Portfolio on February 28, 2013. The chart shows how the value of your investment would have changed, and also shows how the S&P 500® Index performed over the same period. |
|
|
IT Services Portfolio
Market Recap:
U.S. equities returned -7.69% for the 12 months ending February 28, 2023, according to the S&P 500 ® index. The new year began with an encouraging upturn in January (+6.28%), but stocks lost momentum in February (-2.44%) amid higher-than-expected inflation and strong jobs data. Investors took these as signs that the economy continued to run hot, even after a year of historic policy adjustment by the Federal Reserve aimed at cooling economic growth. Record inflation in 2022 prompted the Fed to aggressively tighten monetary policy, and market interest rates eclipsed their highest level in a decade, stoking recession fears and sending stocks into bear market territory. Since March 2022, the central bank has hiked its benchmark rate eight times, by 4.5 percentage points - the fastest-ever pace of monetary tightening - while also shrinking its massive asset portfolio. The latest bump came on February 2, along with a signal that the Fed plans to lift rates in March while it considers whether and when to pause increases. Against this dynamic backdrop, stocks struggled to gain traction until a strong rally ignited heading into the summer. But in September, the index returned -9.21%, one of its worst monthly results ever, before advancing 7.56% in Q4, as risky assets regained favor. For the full 12 months, value stocks handily outpaced growth. The headwind for the latter was most pronounced in the growth-oriented communication services (-25%) and consumer discretionary (-18%) sectors. In sharp contrast, energy gained 24%.
Comments from Portfolio Manager Becky Baker:
For the fiscal year, the fund returned -11.88%, trailing the -9.86% result of the MSCI US IMI IT Services 25/50 Index, as well as the broad-based S&P 500 ® index. Versus the industry index, security selection was the primary detractor, especially within IT consulting & other services. Stock selection in internet services & infrastructure and non-index exposure to advertising also hampered the fund's relative result. Not owning IBM, an index component that gained 11%, was the largest individual relative detractor. The fund's non-index stake in S4 Capital, a position not held at period end, returned roughly -47% and hurt. Also hampering performance was an underweighting in Automatic Data Processing, which gained about 10%. Conversely, the largest contributor to performance versus the industry index was out-of-index exposure to specialized consumer services. Security selection in data processing & outsourced services and non-index investment in consumer finance also helped. Our non-index investment in H&R Block was the fund's largest individual relative contributor, driven by a rise of 53%. This was among the biggest holdings at period end. Also bolstering performance was our overweighting in ExlService Holdings, which gained 36%. ExlService was among the fund's largest holdings. Another key contributor was our out-of-index position in NerdWallet (+82%). Notable changes in positioning include increased exposure to the application software subindustry and a lower allocation to internet services & infrastructure.
Note to shareholders:
On June 1, 2023, the fund's name will change to Fidelity ® Select Enterprise Technology Services Portfolio, in alignment with an update to the Global Industry Classification Standard (GICS). The fund's supplemental benchmark also will change, from the MSCI U.S. IMI IT Services 25/50 Index to the MSCI U.S. IMI Enterprise Technology Services 25/50 Index. These changes will better reflect the fund's investment mandate by capturing IT services providers across multiple industries.
The views expressed above reflect those of the portfolio manager(s) only through the end of the period as stated on the cover of this report and do not necessarily represent the views of Fidelity or any other person in the Fidelity organization. Any such views are subject to change at any time based upon market or other conditions and Fidelity disclaims any responsibility to update such views. These views may not be relied on as investment advice and, because investment decisions for a Fidelity fund are based on numerous factors, may not be relied on as an indication of trading intent on behalf of any Fidelity fund.
IT Services Portfolio
Top Holdings (% of Fund's net assets) |
| |
| Visa, Inc. Class A | 23.1 | |
| MasterCard, Inc. Class A | 16.5 | |
| Accenture PLC Class A | 9.1 | |
| Block, Inc. Class A | 5.1 | |
| Fiserv, Inc. | 5.1 | |
| EPAM Systems, Inc. | 4.7 | |
| Gartner, Inc. | 4.5 | |
| Intuit, Inc. | 3.1 | |
| H&R Block, Inc. | 3.0 | |
| ExlService Holdings, Inc. | 3.0 | |
| | 77.2 | |
| |
| Industries (% of Fund's net assets) |
| |
| IT Services | 88.4 | |
| Software | 5.4 | |
| Diversified Consumer Services | 3.0 | |
| Consumer Finance | 1.3 | |
| Internet & Direct Marketing Retail | 1.2 | |
| Interactive Media & Services | 0.3 | |
| |
Geographic Diversification (% of Fund's net assets) |
|
* Includes Short-Term investments and Net Other Assets (Liabilities). Percentages are based on country or territory of incorporation and are adjusted for the effect of derivatives, if applicable. |
| |
IT Services Portfolio
Showing Percentage of Net Assets
| Common Stocks - 99.6% |
| | | Shares | Value ($) |
| Consumer Finance - 1.3% | | | |
| Consumer Finance - 1.3% | | | |
| NerdWallet, Inc. (a)(b) | | 1,269,223 | 26,196,763 |
| Diversified Consumer Services - 3.0% | | | |
| Specialized Consumer Services - 3.0% | | | |
| H&R Block, Inc. (b) | | 1,719,300 | 63,270,240 |
| Interactive Media & Services - 0.3% | | | |
| Interactive Media & Services - 0.3% | | | |
| Meta Platforms, Inc. Class A (a) | | 34,600 | 6,052,924 |
| Internet & Direct Marketing Retail - 1.2% | | | |
| Internet & Direct Marketing Retail - 1.2% | | | |
| Global-e Online Ltd. (a)(b) | | 924,125 | 26,152,738 |
| IT Services - 88.4% | | | |
| Data Processing & Outsourced Services - 60.6% | | | |
| Automatic Data Processing, Inc. | | 143,875 | 31,626,603 |
| Block, Inc. Class A (a)(b) | | 1,387,900 | 106,493,567 |
| ExlService Holdings, Inc. (a) | | 384,300 | 63,221,193 |
| Fiserv, Inc. (a) | | 918,617 | 105,723,631 |
| Global Payments, Inc. (b) | | 387,023 | 43,423,981 |
| MasterCard, Inc. Class A | | 967,300 | 343,672,017 |
| Nuvei Corp. (a)(b)(c) | | 255,900 | 7,843,335 |
| Paychex, Inc. | | 129,200 | 14,263,680 |
| PayPal Holdings, Inc. (a) | | 69,640 | 5,125,504 |
| TaskUs, Inc. (a)(b) | | 415,437 | 7,147,594 |
| The Western Union Co. | | 4,800 | 62,208 |
| Visa, Inc. Class A (b) | | 2,191,348 | 481,965,076 |
| WEX, Inc. (a) | | 700 | 134,967 |
| WNS Holdings Ltd. sponsored ADR (a) | | 618,792 | 53,785,401 |
| | | | 1,264,488,757 |
| Internet Services & Infrastructure - 6.0% | | | |
| Cloudflare, Inc. (a)(b) | | 303,200 | 18,195,032 |
| GoDaddy, Inc. (a) | | 51,527 | 3,901,109 |
| MongoDB, Inc. Class A (a) | | 301,300 | 63,128,376 |
| Snowflake, Inc. (a) | | 192,500 | 29,718,150 |
| Twilio, Inc. Class A (a)(b) | | 136,600 | 9,180,886 |
| | | | 124,123,553 |
| IT Consulting & Other Services - 21.8% | | | |
| Accenture PLC Class A | | 717,680 | 190,579,924 |
| Amdocs Ltd. | | 628,400 | 57,567,724 |
| DXC Technology Co. (a) | | 152,900 | 4,241,446 |
| Endava PLC ADR (a) | | 147,900 | 11,763,966 |
| EPAM Systems, Inc. (a) | | 316,900 | 97,494,285 |
| Gartner, Inc. (a) | | 284,400 | 93,229,164 |
| | | | 454,876,509 |
TOTAL IT SERVICES | | | 1,843,488,819 |
| Software - 5.4% | | | |
| Application Software - 5.4% | | | |
| Intuit, Inc. | | 159,356 | 64,886,576 |
| Paycom Software, Inc. (a) | | 163,800 | 47,348,028 |
| | | | 112,234,604 |
| TOTAL COMMON STOCKS (Cost $1,182,213,785) | | | 2,077,396,088 |
| | | | |
| Money Market Funds - 26.3% |
| | | Shares | Value ($) |
| Fidelity Cash Central Fund 4.63% (d) | | 1,121,391 | 1,121,615 |
| Fidelity Securities Lending Cash Central Fund 4.63% (d)(e) | | 548,030,182 | 548,084,985 |
| TOTAL MONEY MARKET FUNDS (Cost $549,206,600) | | | 549,206,600 |
| | | | |
| TOTAL INVESTMENT IN SECURITIES - 125.9% (Cost $1,731,420,385) | 2,626,602,688 |
NET OTHER ASSETS (LIABILITIES) - (25.9)% | (540,134,794) |
| NET ASSETS - 100.0% | 2,086,467,894 |
| | |
Legend
| (b) | Security or a portion of the security is on loan at period end. |
| (c) | Security exempt from registration under Rule 144A of the Securities Act of 1933. These securities may be resold in transactions exempt from registration, normally to qualified institutional buyers. At the end of the period, the value of these securities amounted to $7,843,335 or 0.4% of net assets. |
| (d) | Affiliated fund that is generally available only to investment companies and other accounts managed by Fidelity Investments. The rate quoted is the annualized seven-day yield of the fund at period end. A complete unaudited listing of the fund's holdings as of its most recent quarter end is available upon request. In addition, each Fidelity Central Fund's financial statements, which are not covered by the Fund's Report of Independent Registered Public Accounting Firm, are available on the SEC's website or upon request. |
| (e) | Investment made with cash collateral received from securities on loan. |
Affiliated Central Funds
Fiscal year to date information regarding the Fund's investments in Fidelity Central Funds, including the ownership percentage, is presented below.
| Affiliate | Value, beginning of period ($) | Purchases ($) | Sales Proceeds ($) | Dividend Income ($) | Realized Gain (loss) ($) | Change in Unrealized appreciation (depreciation) ($) | Value, end of period ($) | % ownership, end of period |
| Fidelity Cash Central Fund 4.63% | 1,591,416 | 562,144,393 | 562,614,194 | 279,246 | - | - | 1,121,615 | 0.0% |
| Fidelity Securities Lending Cash Central Fund 4.63% | 84,129,800 | 1,849,469,642 | 1,385,514,457 | 402,883 | - | - | 548,084,985 | 1.7% |
| Total | 85,721,216 | 2,411,614,035 | 1,948,128,651 | 682,129 | - | - | 549,206,600 | |
| | | | | | | | | |
Amounts in the dividend income column in the above table include any capital gain distributions from underlying funds, which are presented in the corresponding line item in the Statement of Operations, if applicable.
Amount for Fidelity Securities Lending Cash Central Fund represents the income earned on investing cash collateral, less rebates paid to borrowers and any lending agent fees associated with the loan, plus any premium payments received for lending certain types of securities.
Amounts included in the purchases and sales proceeds columns may include in-kind transactions, if applicable.
Investment Valuation
The following is a summary of the inputs used, as of February 28, 2023, involving the Fund's assets and liabilities carried at fair value. The inputs or methodology used for valuing securities may not be an indication of the risk associated with investing in those securities. For more information on valuation inputs, and their aggregation into the levels used below, please refer to the Investment Valuation section in the accompanying Notes to Financial Statements.
| Valuation Inputs at Reporting Date: |
| Description | Total ($) | Level 1 ($) | Level 2 ($) | Level 3 ($) |
Investments in Securities: | | | | |
|
| Common Stocks | 2,077,396,088 | 2,077,396,088 | - | - |
|
| Money Market Funds | 549,206,600 | 549,206,600 | - | - |
| Total Investments in Securities: | 2,626,602,688 | 2,626,602,688 | - | - |
IT Services Portfolio
| Statement of Assets and Liabilities |
| | | | February 28, 2023 |
| | | | | |
| Assets | | | | |
| Investment in securities, at value (including securities loaned of $533,927,904) - See accompanying schedule: | | | | |
Unaffiliated issuers (cost $1,182,213,785) | $ | 2,077,396,088 | | |
Fidelity Central Funds (cost $549,206,600) | | 549,206,600 | | |
| | | | | |
| | | | | |
| Total Investment in Securities (cost $1,731,420,385) | | | $ | 2,626,602,688 |
| Receivable for investments sold | | | | 33,556,288 |
| Receivable for fund shares sold | | | | 147,484 |
| Dividends receivable | | | | 1,068,348 |
| Distributions receivable from Fidelity Central Funds | | | | 85,424 |
| Prepaid expenses | | | | 7,425 |
| Other receivables | | | | 15,141 |
Total assets | | | | 2,661,482,798 |
| Liabilities | | | | |
| Payable for investments purchased | $ | 24,705,819 | | |
| Payable for fund shares redeemed | | 869,777 | | |
| Accrued management fee | | 951,107 | | |
| Other affiliated payables | | 354,394 | | |
| Other payables and accrued expenses | | 64,912 | | |
| Collateral on securities loaned | | 548,068,895 | | |
| Total Liabilities | | | | 575,014,904 |
| Net Assets | | | $ | 2,086,467,894 |
| Net Assets consist of: | | | | |
| Paid in capital | | | $ | 1,201,485,177 |
| Total accumulated earnings (loss) | | | | 884,982,717 |
| Net Assets | | | $ | 2,086,467,894 |
Net Asset Value , offering price and redemption price per share ($2,086,467,894 ÷ 37,823,657 shares) | | | $ | 55.16 |
| Statement of Operations |
| | | | Year ended February 28, 2023 |
| Investment Income | | | | |
| Dividends | | | $ | 16,660,621 |
| Income from Fidelity Central Funds (including $402,883 from security lending) | | | | 682,129 |
| Total Income | | | | 17,342,750 |
| Expenses | | | | |
| Management fee | $ | 12,019,813 | | |
| Transfer agent fees | | 3,913,095 | | |
| Accounting fees | | 627,246 | | |
| Custodian fees and expenses | | 16,046 | | |
| Independent trustees' fees and expenses | | 7,950 | | |
| Registration fees | | 31,137 | | |
| Audit | | 44,972 | | |
| Legal | | 2,381 | | |
| Interest | | 57,048 | | |
| Miscellaneous | | 45,598 | | |
| Total expenses before reductions | | 16,765,286 | | |
| Expense reductions | | (82,130) | | |
| Total expenses after reductions | | | | 16,683,156 |
| Net Investment income (loss) | | | | 659,594 |
| Realized and Unrealized Gain (Loss) | | | | |
| Net realized gain (loss) on: | | | | |
| Investment Securities: | | | | |
| Unaffiliated issuers | | 1,431,105 | | |
| Foreign currency transactions | | (6,706) | | |
| Total net realized gain (loss) | | | | 1,424,399 |
| Change in net unrealized appreciation (depreciation) on: | | | | |
| Investment Securities: | | | | |
| Unaffiliated issuers | | (348,837,882) | | |
| Assets and liabilities in foreign currencies | | (1,441) | | |
| Total change in net unrealized appreciation (depreciation) | | | | (348,839,323) |
| Net gain (loss) | | | | (347,414,924) |
| Net increase (decrease) in net assets resulting from operations | | | $ | (346,755,330) |
| Statement of Changes in Net Assets |
| |
| | Year ended February 28, 2023 | | Year ended February 28, 2022 |
| Increase (Decrease) in Net Assets | | | | |
| Operations | | | | |
| Net investment income (loss) | $ | 659,594 | $ | (11,605,499) |
| Net realized gain (loss) | | 1,424,399 | | 758,484,744 |
| Change in net unrealized appreciation (depreciation) | | (348,839,323) | | (1,177,179,444) |
| Net increase (decrease) in net assets resulting from operations | | (346,755,330) | | (430,300,199) |
| Distributions to shareholders | | (302,562,844) | | (528,547,016) |
| Share transactions | | | | |
| Proceeds from sales of shares | | 102,221,072 | | 283,388,277 |
| Reinvestment of distributions | | 284,601,905 | | 495,301,813 |
| Cost of shares redeemed | | (524,875,862) | | (1,081,314,912) |
Net increase (decrease) in net assets resulting from share transactions | | (138,052,885) | | (302,624,822) |
| Total increase (decrease) in net assets | | (787,371,059) | | (1,261,472,037) |
| | | | | |
| Net Assets | | | | |
| Beginning of period | | 2,873,838,953 | | 4,135,310,990 |
| End of period | $ | 2,086,467,894 | $ | 2,873,838,953 |
| | | | | |
| Other Information | | | | |
| Shares | | | | |
| Sold | | 1,767,664 | | 3,049,821 |
| Issued in reinvestment of distributions | | 4,611,673 | | 5,895,522 |
| Redeemed | | (9,454,797) | | (12,068,264) |
| Net increase (decrease) | | (3,075,460) | | (3,122,921) |
| | | | | |
Financial Highlights
| Years ended February 28, | | 2023 | | 2022 | | 2021 | | 2020 A | | 2019 |
Selected Per-Share Data | | | | | | | | | | |
| Net asset value, beginning of period | $ | 70.27 | $ | 93.94 | $ | 73.62 | $ | 64.96 | $ | 58.69 |
| Income from Investment Operations | | | | | | | | | | |
Net investment income (loss) B,C | | .02 | | (.27) | | (.09) | | .03 | | .04 |
| Net realized and unrealized gain (loss) | | (7.56) | | (10.44) | | 25.34 | | 10.36 | | 8.92 |
| Total from investment operations | | (7.54) | | (10.71) | | 25.25 | | 10.39 | | 8.96 |
| Distributions from net investment income | | (.01) | | - | | (.01) | | (.03) | | (.03) |
| Distributions from net realized gain | | (7.55) | | (12.96) | | (4.93) | | (1.70) | | (2.66) |
| Total distributions | | (7.57) D | | (12.96) | | (4.93) D | | (1.73) | | (2.69) |
| Net asset value, end of period | $ | 55.16 | $ | 70.27 | $ | 93.94 | $ | 73.62 | $ | 64.96 |
Total Return E | | (11.88)% | | (13.31)% | | 34.67% | | 15.99% | | 16.04% |
Ratios to Average Net Assets C,F,G | | | | | | | | | | |
| Expenses before reductions | | .73% | | .70% | | .72% | | .73% | | .74% |
| Expenses net of fee waivers, if any | | .73% | | .70% | | .72% | | .73% | | .74% |
| Expenses net of all reductions | | .73% | | .70% | | .72% | | .73% | | .74% |
| Net investment income (loss) | | .03% | | (.29)% | | (.11)% | | .04% | | .06% |
| Supplemental Data | | | | | | | | | | |
| Net assets, end of period (000 omitted) | $ | 2,086,468 | $ | 2,873,839 | $ | 4,135,311 | $ | 4,099,114 | $ | 2,867,321 |
Portfolio turnover rate H | | 43% | | 41% | | 31% | | 24% | | 26% |
A For the year ended February 29.
B Calculated based on average shares outstanding during the period.
C Net investment income (loss) is affected by the timing of the declaration of dividends by any underlying mutual funds or exchange-traded funds (ETFs). Net investment income (loss) of any mutual funds or ETFs is not included in the Fund's net investment income (loss) ratio.
D Total distributions per share do not sum due to rounding.
E Total returns would have been lower if certain expenses had not been reduced during the applicable periods shown.
F Fees and expenses of any underlying mutual funds or exchange-traded funds (ETFs) are not included in the Fund's expense ratio. The Fund indirectly bears its proportionate share of these expenses. For additional expense information related to investments in Fidelity Central Funds, please refer to the "Investments in Fidelity Central Funds" note found in the Notes to Financial Statements section of the most recent Annual or Semi-Annual report.
G Expense ratios reflect operating expenses of the class. Expenses before reductions do not reflect amounts reimbursed, waived, or reduced through arrangements with the investment adviser, brokerage services, or other offset arrangements, if applicable, and do not represent the amount paid by the class during periods when reimbursements, waivers or reductions occur.
H Amount does not include the portfolio activity of any underlying mutual funds or exchange-traded funds (ETFs).
Average annual total return reflects the change in the value of an investment, assuming reinvestment of distributions from dividend income and capital gains (the profits earned upon the sale of securities that have grown in value, if any) and assuming a constant rate of performance each year. The hypothetical investment and the average annual total returns do not reflect the deduction of taxes that a shareholder would pay on fund distributions or the redemption of fund shares. During periods of reimbursement by Fidelity, a fund's total return will be greater than it would be had the reimbursement not occurred. How a fund did yesterday is no guarantee of how it will do tomorrow.
| Average Annual Total Returns |
| | | | |
Periods ended February 28, 2023 | Past 1 year | Past 5 years | Past 10 years |
| Semiconductors Portfolio | -2.91% | 21.09% | 24.35% |
| $10,000 Over 10 Years |
| |
Let's say hypothetically that $10,000 was invested in Semiconductors Portfolio on February 28, 2013. The chart shows how the value of your investment would have changed, and also shows how the S&P 500® Index performed over the same period. |
|
|
Semiconductors Portfolio
Market Recap:
U.S. equities returned -7.69% for the 12 months ending February 28, 2023, according to the S&P 500 ® index. The new year began with an encouraging upturn in January (+6.28%), but stocks lost momentum in February (-2.44%) amid higher-than-expected inflation and strong jobs data. Investors took these as signs that the economy continued to run hot, even after a year of historic policy adjustment by the Federal Reserve aimed at cooling economic growth. Record inflation in 2022 prompted the Fed to aggressively tighten monetary policy, and market interest rates eclipsed their highest level in a decade, stoking recession fears and sending stocks into bear market territory. Since March 2022, the central bank has hiked its benchmark rate eight times, by 4.5 percentage points - the fastest-ever pace of monetary tightening - while also shrinking its massive asset portfolio. The latest bump came on February 2, along with a signal that the Fed plans to lift rates in March while it considers whether and when to pause increases. Against this dynamic backdrop, stocks struggled to gain traction until a strong rally ignited heading into the summer. But in September, the index returned -9.21%, one of its worst monthly results ever, before advancing 7.56% in Q4, as risky assets regained favor. For the full 12 months, value stocks handily outpaced growth. The headwind for the latter was most pronounced in the growth-oriented communication services (-25%) and consumer discretionary (-18%) sectors. In sharp contrast, energy gained 24%.
Comments from Portfolio Manager Adam Benjamin:
For the fiscal year ending February 28, 2023, the fund returned -2.91%, outperforming the -9.01% result of the MSCI U.S. IMI Semiconductors & Semiconductor Equipment 25/50 Index, as well as the broad-based S&P 500 ® index. Versus the industry index, security selection was the primary contributor, led by choices in the fund's core semiconductors segment. The fund's top individual relative contributor was a large underweighting in Intel, which returned approximately -45% the past 12 months. Intel was not held at period end. Also helping performance was our overweighting in onsemi (formerly On Semiconductor), which gained about 23%. Onsemi was among the fund's largest holdings. Another notable relative contributor was our lighter-than-index stake in Qualcomm (-27%). Conversely, the primary detractors from performance versus the industry index were security selection and an underweighting in semiconductor equipment. A small non-index exposure to technology hardware, storage & peripherals also hindered the fund's relative result. The fund's biggest individual relative detractor was an outsized stake in Marvell Technology, which returned roughly -34% the past year. The company was among our largest holdings. Our second-largest relative detractor this period was avoiding First Solar, an index component that gained about 125%. Also hampering performance was an underweighting in Broadcom, which gained approximately 4%. The company was among our biggest holdings.
The views expressed above reflect those of the portfolio manager(s) only through the end of the period as stated on the cover of this report and do not necessarily represent the views of Fidelity or any other person in the Fidelity organization. Any such views are subject to change at any time based upon market or other conditions and Fidelity disclaims any responsibility to update such views. These views may not be relied on as investment advice and, because investment decisions for a Fidelity fund are based on numerous factors, may not be relied on as an indication of trading intent on behalf of any Fidelity fund.
Semiconductors Portfolio
Top Holdings (% of Fund's net assets) |
| |
| NVIDIA Corp. | 24.6 | |
| NXP Semiconductors NV | 9.1 | |
| onsemi | 8.2 | |
| Marvell Technology, Inc. | 7.6 | |
| GlobalFoundries, Inc. | 4.7 | |
| Taiwan Semiconductor Manufacturing Co. Ltd. sponsored ADR | 4.6 | |
| Microchip Technology, Inc. | 4.3 | |
| Broadcom, Inc. | 4.1 | |
| Lam Research Corp. | 3.8 | |
| Teradyne, Inc. | 3.6 | |
| | 74.6 | |
| |
| Industries (% of Fund's net assets) |
| |
| Semiconductors & Semiconductor Equipment | 95.0 | |
| Technology Hardware, Storage & Peripherals | 0.6 | |
| Electrical Equipment | 0.2 | |
| Metals & Mining | 0.1 | |
| Electronic Equipment & Components | 0.0 | |
| Software | 0.0 | |
| Auto Components | 0.0 | |
| |
Percentages shown as 0.0% may reflect amounts less than 0.05%.
Geographic Diversification (% of Fund's net assets) |
|
* Includes Short-Term investments and Net Other Assets (Liabilities). Percentages are based on country or territory of incorporation and are adjusted for the effect of derivatives, if applicable. |
| |
Semiconductors Portfolio
Showing Percentage of Net Assets
| Common Stocks - 95.1% |
| | | Shares | Value ($) |
| Auto Components - 0.0% | | | |
| Auto Parts & Equipment - 0.0% | | | |
| Mobileye Global, Inc. (a) | | 8,576 | 338,838 |
| Electrical Equipment - 0.2% | | | |
| Electrical Components & Equipment - 0.2% | | | |
| Array Technologies, Inc. (b) | | 983,600 | 18,432,664 |
| Electronic Equipment & Components - 0.0% | | | |
| Electronic Equipment & Instruments - 0.0% | | | |
| Aeva Technologies, Inc. (a)(b) | | 1,097,800 | 1,965,062 |
| Semiconductors & Semiconductor Equipment - 94.3% | | | |
| Semiconductor Equipment - 9.6% | | | |
| Enphase Energy, Inc. (b) | | 159,100 | 33,495,323 |
| KLA Corp. | | 95,613 | 36,273,660 |
| Lam Research Corp. | | 611,473 | 297,181,993 |
| Nova Ltd. (a)(b) | | 1,061,628 | 96,162,264 |
| Teradyne, Inc. | | 2,780,722 | 281,242,223 |
| | | | 744,355,463 |
| Semiconductors - 84.7% | | | |
| Advanced Micro Devices, Inc. (b) | | 1,736,018 | 136,416,294 |
| Allegro MicroSystems LLC (b) | | 2,709,700 | 118,359,696 |
| Alpha & Omega Semiconductor Ltd. (b) | | 513,296 | 13,710,136 |
| Analog Devices, Inc. | | 759,338 | 139,315,743 |
| Broadcom, Inc. | | 534,550 | 317,677,720 |
| Cirrus Logic, Inc. (b) | | 1,223,779 | 125,743,292 |
| GlobalFoundries, Inc. (a)(b) | | 5,562,993 | 363,485,963 |
| Impinj, Inc. (b) | | 67,077 | 8,895,752 |
| Lattice Semiconductor Corp. (b) | | 1,451,000 | 123,276,960 |
| MACOM Technology Solutions Holdings, Inc. (b) | | 1,978,700 | 135,620,098 |
| Marvell Technology, Inc. | | 12,992,376 | 586,605,776 |
| Microchip Technology, Inc. | | 4,149,861 | 336,263,237 |
| Monolithic Power Systems, Inc. | | 428,676 | 207,603,500 |
| NVIDIA Corp. | | 8,214,068 | 1,906,978,023 |
| NXP Semiconductors NV | | 3,978,614 | 710,103,027 |
| onsemi (b) | | 8,235,209 | 637,487,529 |
| Qualcomm, Inc. | | 811,888 | 100,292,525 |
| Skyworks Solutions, Inc. | | 1,422,586 | 158,717,920 |
| Taiwan Semiconductor Manufacturing Co. Ltd. sponsored ADR | | 4,141,400 | 360,591,698 |
| Texas Instruments, Inc. | | 426,135 | 73,060,846 |
| Wolfspeed, Inc. (a)(b) | | 195,200 | 14,440,896 |
| | | | 6,574,646,631 |
TOTAL SEMICONDUCTORS & SEMICONDUCTOR EQUIPMENT | | | 7,319,002,094 |
| Technology Hardware, Storage & Peripherals - 0.6% | | | |
| Technology Hardware, Storage & Peripherals - 0.6% | | | |
| IonQ, Inc. (b)(c) | | 155,600 | 737,544 |
| Western Digital Corp. (b) | | 1,157,800 | 44,552,144 |
| | | | 45,289,688 |
| TOTAL COMMON STOCKS (Cost $4,534,789,982) | | | 7,385,028,346 |
| | | | |
| Convertible Preferred Stocks - 0.6% |
| | | Shares | Value ($) |
| Electronic Equipment & Components - 0.0% | | | |
| Electronic Components - 0.0% | | | |
| Menlo Micro, Inc. Series C (c)(d) | | 739,500 | 687,735 |
| Metals & Mining - 0.1% | | | |
| Precious Metals & Minerals - 0.1% | | | |
| Diamond Foundry, Inc. Series C (b)(c)(d) | | 189,999 | 6,739,265 |
| Semiconductors & Semiconductor Equipment - 0.5% | | | |
| Semiconductor Equipment - 0.2% | | | |
| Astera Labs, Inc.: | | | |
| Series A (c)(d) | | 269,049 | 2,391,846 |
| Series B (c)(d) | | 45,810 | 407,251 |
| Series C (b)(c)(d) | | 185,800 | 1,651,762 |
| Series D (c)(d) | | 1,092,759 | 9,714,628 |
| | | | 14,165,487 |
| Semiconductors - 0.3% | | | |
| Alif Semiconductor Series C (c)(d) | | 444,283 | 7,930,452 |
| GaN Systems, Inc.: | | | |
| Series F1 (b)(c)(d) | | 496,628 | 5,582,099 |
| Series F2 (b)(c)(d) | | 262,241 | 2,947,589 |
| SiMa.ai: | | | |
| Series B (b)(c)(d) | | 309,900 | 1,998,855 |
| Series B1 (c)(d) | | 163,147 | 1,218,708 |
| | | | 19,677,703 |
TOTAL SEMICONDUCTORS & SEMICONDUCTOR EQUIPMENT | | | 33,843,190 |
| Software - 0.0% | | | |
| Systems Software - 0.0% | | | |
| Tenstorrent, Inc. Series C1 (b)(c)(d) | | 8,800 | 494,912 |
| TOTAL CONVERTIBLE PREFERRED STOCKS (Cost $39,202,120) | | | 41,765,102 |
| | | | |
| Preferred Securities - 0.2% |
| | | Principal Amount (e) | Value ($) |
| Semiconductors & Semiconductor Equipment - 0.2% | | | |
| Semiconductors - 0.2% | | | |
| GaN Systems, Inc. 0% (c)(d)(f) | | 11,640,267 | 14,468,852 |
| Software - 0.0% | | | |
| Systems Software - 0.0% | | | |
| Tenstorrent, Inc. 0% (c)(d)(f) | | 490,000 | 463,540 |
| TOTAL PREFERRED SECURITIES (Cost $12,130,267) | | | 14,932,392 |
| | | | |
| Money Market Funds - 2.7% |
| | | Shares | Value ($) |
| Fidelity Cash Central Fund 4.63% (g) | | 91,805,127 | 91,823,488 |
| Fidelity Securities Lending Cash Central Fund 4.63% (g)(h) | | 119,191,693 | 119,203,612 |
| TOTAL MONEY MARKET FUNDS (Cost $211,027,100) | | | 211,027,100 |
| | | | |
| TOTAL INVESTMENT IN SECURITIES - 98.6% (Cost $4,797,149,469) | 7,652,752,940 |
NET OTHER ASSETS (LIABILITIES) - 1.4% | 111,699,608 |
| NET ASSETS - 100.0% | 7,764,452,548 |
| | |
Legend
| (a) | Security or a portion of the security is on loan at period end. |
| (c) | Restricted securities (including private placements) - Investment in securities not registered under the Securities Act of 1933 (excluding 144A issues). At the end of the period, the value of restricted securities (excluding 144A issues) amounted to $57,435,038 or 0.7% of net assets. |
| (e) | Amount is stated in United States dollars unless otherwise noted. |
| (f) | Security is perpetual in nature with no stated maturity date. |
| (g) | Affiliated fund that is generally available only to investment companies and other accounts managed by Fidelity Investments. The rate quoted is the annualized seven-day yield of the fund at period end. A complete unaudited listing of the fund's holdings as of its most recent quarter end is available upon request. In addition, each Fidelity Central Fund's financial statements, which are not covered by the Fund's Report of Independent Registered Public Accounting Firm, are available on the SEC's website or upon request. |
| (h) | Investment made with cash collateral received from securities on loan. |
| Additional information on each restricted holding is as follows: |
| Security | Acquisition Date | Acquisition Cost ($) |
| Alif Semiconductor Series C | 3/08/22 | 9,018,296 |
| | | |
| Astera Labs, Inc. Series A | 5/17/22 | 2,736,094 |
| | | |
| Astera Labs, Inc. Series B | 5/17/22 | 465,865 |
| | | |
| Astera Labs, Inc. Series C | 8/24/21 | 624,622 |
| | | |
| Astera Labs, Inc. Series D | 5/17/22 - 5/27/22 | 11,112,812 |
| | | |
| Diamond Foundry, Inc. Series C | 3/15/21 | 4,559,976 |
| | | |
| GaN Systems, Inc. Series F1 | 11/30/21 | 4,211,405 |
| | | |
| GaN Systems, Inc. Series F2 | 11/30/21 | 2,223,804 |
| | | |
| GaN Systems, Inc. 0% | 11/30/21 | 11,640,267 |
| | | |
| IonQ, Inc. | 3/07/21 | 1,556,000 |
| | | |
| Menlo Micro, Inc. Series C | 2/09/22 | 980,207 |
| | | |
| SiMa.ai Series B | 5/10/21 | 1,588,981 |
| | | |
| SiMa.ai Series B1 | 4/25/22 - 10/17/22 | 1,156,859 |
| | | |
| Tenstorrent, Inc. Series C1 | 4/23/21 | 523,198 |
| | | |
| Tenstorrent, Inc. 0% | 4/23/21 | 490,000 |
| | | |
Affiliated Central Funds
Fiscal year to date information regarding the Fund's investments in Fidelity Central Funds, including the ownership percentage, is presented below.
| Affiliate | Value, beginning of period ($) | Purchases ($) | Sales Proceeds ($) | Dividend Income ($) | Realized Gain (loss) ($) | Change in Unrealized appreciation (depreciation) ($) | Value, end of period ($) | % ownership, end of period |
| Fidelity Cash Central Fund 4.63% | 56,307,633 | 1,644,135,620 | 1,608,619,765 | 2,392,797 | - | - | 91,823,488 | 0.2% |
| Fidelity Securities Lending Cash Central Fund 4.63% | 109,291,689 | 2,000,522,355 | 1,990,610,432 | 5,518,967 | - | - | 119,203,612 | 0.4% |
| Total | 165,599,322 | 3,644,657,975 | 3,599,230,197 | 7,911,764 | - | - | 211,027,100 | |
| | | | | | | | | |
Amounts in the dividend income column in the above table include any capital gain distributions from underlying funds, which are presented in the corresponding line item in the Statement of Operations, if applicable.
Amount for Fidelity Securities Lending Cash Central Fund represents the income earned on investing cash collateral, less rebates paid to borrowers and any lending agent fees associated with the loan, plus any premium payments received for lending certain types of securities.
Amounts included in the purchases and sales proceeds columns may include in-kind transactions, if applicable.
Investment Valuation
The following is a summary of the inputs used, as of February 28, 2023, involving the Fund's assets and liabilities carried at fair value. The inputs or methodology used for valuing securities may not be an indication of the risk associated with investing in those securities. For more information on valuation inputs, and their aggregation into the levels used below, please refer to the Investment Valuation section in the accompanying Notes to Financial Statements.
| Valuation Inputs at Reporting Date: |
| Description | Total ($) | Level 1 ($) | Level 2 ($) | Level 3 ($) |
Investments in Securities: | | | | |
|
| Common Stocks | 7,385,028,346 | 7,385,028,346 | - | - |
|
| Convertible Preferred Stocks | 41,765,102 | - | - | 41,765,102 |
|
| Preferred Securities | 14,932,392 | - | - | 14,932,392 |
|
| Money Market Funds | 211,027,100 | 211,027,100 | - | - |
| Total Investments in Securities: | 7,652,752,940 | 7,596,055,446 | - | 56,697,494 |
Semiconductors Portfolio
| Statement of Assets and Liabilities |
| | | | February 28, 2023 |
| | | | | |
| Assets | | | | |
| Investment in securities, at value (including securities loaned of $117,817,408) - See accompanying schedule: | | | | |
Unaffiliated issuers (cost $4,586,122,369) | $ | 7,441,725,840 | | |
Fidelity Central Funds (cost $211,027,100) | | 211,027,100 | | |
| | | | | |
| | | | | |
| Total Investment in Securities (cost $4,797,149,469) | | | $ | 7,652,752,940 |
| Receivable for investments sold | | | | 226,937,495 |
| Receivable for fund shares sold | | | | 10,520,174 |
| Dividends receivable | | | | 3,456,510 |
| Distributions receivable from Fidelity Central Funds | | | | 931,835 |
| Prepaid expenses | | | | 14,037 |
| Other receivables | | | | 196,560 |
Total assets | | | | 7,894,809,551 |
| Liabilities | | | | |
| Payable to custodian bank | $ | 3,293,715 | | |
| Payable for investments purchased | | 26,885 | | |
| Payable for fund shares redeemed | | 3,280,437 | | |
| Accrued management fee | | 3,395,584 | | |
| Other affiliated payables | | 922,129 | | |
| Other payables and accrued expenses | | 234,641 | | |
| Collateral on securities loaned | | 119,203,612 | | |
| Total Liabilities | | | | 130,357,003 |
| Net Assets | | | $ | 7,764,452,548 |
| Net Assets consist of: | | | | |
| Paid in capital | | | $ | 4,943,674,815 |
| Total accumulated earnings (loss) | | | | 2,820,777,733 |
| Net Assets | | | $ | 7,764,452,548 |
Net Asset Value , offering price and redemption price per share ($7,764,452,548 ÷ 418,151,068 shares) | | | $ | 18.57 |
| Statement of Operations |
| | | | Year ended February 28, 2023 |
| Investment Income | | | | |
| Dividends | | | $ | 50,974,849 |
| Income from Fidelity Central Funds (including $5,518,967 from security lending) | | | | 7,911,764 |
| Total Income | | | | 58,886,613 |
| Expenses | | | | |
| Management fee | $ | 35,905,087 | | |
| Transfer agent fees | | 10,000,117 | | |
| Accounting fees | | 1,063,585 | | |
| Custodian fees and expenses | | 42,104 | | |
| Independent trustees' fees and expenses | | 23,255 | | |
| Registration fees | | 88,695 | | |
| Audit | | 42,370 | | |
| Legal | | 5,697 | | |
| Interest | | 1,055 | | |
| Miscellaneous | | 35,093 | | |
| Total expenses before reductions | | 47,207,058 | | |
| Expense reductions | | (242,348) | | |
| Total expenses after reductions | | | | 46,964,710 |
| Net Investment income (loss) | | | | 11,921,903 |
| Realized and Unrealized Gain (Loss) | | | | |
| Net realized gain (loss) on: | | | | |
| Investment Securities: | | | | |
| Unaffiliated issuers | | 102,354,704 | | |
| Foreign currency transactions | | (128,159) | | |
| Total net realized gain (loss) | | | | 102,226,545 |
| Change in net unrealized appreciation (depreciation) on: | | | | |
| Investment Securities: | | | | |
| Unaffiliated issuers | | (478,504,613) | | |
| Assets and liabilities in foreign currencies | | 2,926 | | |
| Total change in net unrealized appreciation (depreciation) | | | | (478,501,687) |
| Net gain (loss) | | | | (376,275,142) |
| Net increase (decrease) in net assets resulting from operations | | | $ | (364,353,239) |
| Statement of Changes in Net Assets |
| |
| | Year ended February 28, 2023 | | Year ended February 28, 2022 |
| Increase (Decrease) in Net Assets | | | | |
| Operations | | | | |
| Net investment income (loss) | $ | 11,921,903 | $ | 2,075,831 |
| Net realized gain (loss) | | 102,226,545 | | 704,123,799 |
| Change in net unrealized appreciation (depreciation) | | (478,501,687) | | 616,660,274 |
| Net increase (decrease) in net assets resulting from operations | | (364,353,239) | | 1,322,859,904 |
| Distributions to shareholders | | (401,716,905) | | (613,939,297) |
| Share transactions | | | | |
| Proceeds from sales of shares | | 1,289,524,725 | | 3,146,391,881 |
| Reinvestment of distributions | | 378,004,092 | | 580,580,568 |
| Cost of shares redeemed | | (1,563,929,144) | | (1,726,756,170) |
Net increase (decrease) in net assets resulting from share transactions | | 103,599,673 | | 2,000,216,279 |
| Total increase (decrease) in net assets | | (662,470,471) | | 2,709,136,886 |
| | | | | |
| Net Assets | | | | |
| Beginning of period | | 8,426,923,019 | | 5,717,786,133 |
| End of period | $ | 7,764,452,548 | $ | 8,426,923,019 |
| | | | | |
| Other Information | | | | |
| Shares | | | | |
| Sold | | 74,773,935 | | 150,199,767 |
| Issued in reinvestment of distributions | | 22,013,643 | | 28,114,026 |
| Redeemed | | (95,214,839) | | (86,759,172) |
| Net increase (decrease) | | 1,572,739 | | 91,554,621 |
| | | | | |
Financial Highlights
| Years ended February 28, | | 2023 | | 2022 | | 2021 | | 2020 A | | 2019 B |
Selected Per-Share Data | | | | | | | | | | |
| Net asset value, beginning of period | $ | 20.23 | $ | 17.59 | $ | 11.47 | $ | 9.41 | $ | 11.77 |
| Income from Investment Operations | | | | | | | | | | |
Net investment income (loss) C,D | | .03 | | .01 | | .07 | | .09 | | .10 |
| Net realized and unrealized gain (loss) | | (.71) | | 4.30 | | 7.37 | | 2.39 | | (.35) |
| Total from investment operations | | (.68) | | 4.31 | | 7.44 | | 2.48 | | (.25) |
| Distributions from net investment income | | (.03) | | (.01) | | (.08) | | (.10) | | (.06) |
| Distributions from net realized gain | | (.95) | | (1.66) | | (1.24) | | (.33) | | (2.05) |
| Total distributions | | (.98) | | (1.67) | | (1.32) | | (.42) E | | (2.11) |
| Net asset value, end of period | $ | 18.57 | $ | 20.23 | $ | 17.59 | $ | 11.47 | $ | 9.41 |
Total Return F | | (2.91)% | | 24.57% | | 70.47% | | 26.01% | | .19% |
Ratios to Average Net Assets D,G,H | | | | | | | | | | |
| Expenses before reductions | | .69% | | .68% | | .70% | | .72% | | .73% |
| Expenses net of fee waivers, if any | | .69% | | .67% | | .70% | | .72% | | .73% |
| Expenses net of all reductions | | .69% | | .67% | | .69% | | .71% | | .72% |
| Net investment income (loss) | | .17% | | .03% | | .53% | | .85% | | .92% |
| Supplemental Data | | | | | | | | | | |
| Net assets, end of period (000 omitted) | $ | 7,764,453 | $ | 8,426,923 | $ | 5,717,786 | $ | 3,778,557 | $ | 3,052,506 |
Portfolio turnover rate I | | 35% | | 33% | | 87% | | 114% | | 130% |
A For the year ended February 29.
B Per share amounts have been adjusted to reflect the impact of the 10 for 1 share split that occurred on May 11, 2018.
C Calculated based on average shares outstanding during the period.
D Net investment income (loss) is affected by the timing of the declaration of dividends by any underlying mutual funds or exchange-traded funds (ETFs). Net investment income (loss) of any mutual funds or ETFs is not included in the Fund's net investment income (loss) ratio.
E Total distributions per share do not sum due to rounding.
F Total returns would have been lower if certain expenses had not been reduced during the applicable periods shown.
G Fees and expenses of any underlying mutual funds or exchange-traded funds (ETFs) are not included in the Fund's expense ratio. The Fund indirectly bears its proportionate share of these expenses. For additional expense information related to investments in Fidelity Central Funds, please refer to the "Investments in Fidelity Central Funds" note found in the Notes to Financial Statements section of the most recent Annual or Semi-Annual report.
H Expense ratios reflect operating expenses of the class. Expenses before reductions do not reflect amounts reimbursed, waived, or reduced through arrangements with the investment adviser, brokerage services, or other offset arrangements, if applicable, and do not represent the amount paid by the class during periods when reimbursements, waivers or reductions occur.
I Amount does not include the portfolio activity of any underlying mutual funds or exchange-traded funds (ETFs).
Average annual total return reflects the change in the value of an investment, assuming reinvestment of distributions from dividend income and capital gains (the profits earned upon the sale of securities that have grown in value, if any) and assuming a constant rate of performance each year. The hypothetical investment and the average annual total returns do not reflect the deduction of taxes that a shareholder would pay on fund distributions or the redemption of fund shares. During periods of reimbursement by Fidelity, a fund's total return will be greater than it would be had the reimbursement not occurred. How a fund did yesterday is no guarantee of how it will do tomorrow.
| Average Annual Total Returns |
| | | | |
Periods ended February 28, 2023 | Past 1 year | Past 5 years | Past 10 years |
| Software and IT Services Portfolio | -13.67% | 11.77% | 17.14% |
| $10,000 Over 10 Years |
| |
Let's say hypothetically that $10,000 was invested in Software and IT Services Portfolio on February 28, 2013. The chart shows how the value of your investment would have changed, and also shows how the S&P 500® Index performed over the same period. |
|
|
Software and IT Services Portfolio
Market Recap:
U.S. equities returned -7.69% for the 12 months ending February 28, 2023, according to the S&P 500 ® index. The new year began with an encouraging upturn in January (+6.28%), but stocks lost momentum in February (-2.44%) amid higher-than-expected inflation and strong jobs data. Investors took these as signs that the economy continued to run hot, even after a year of historic policy adjustment by the Federal Reserve aimed at cooling economic growth. Record inflation in 2022 prompted the Fed to aggressively tighten monetary policy, and market interest rates eclipsed their highest level in a decade, stoking recession fears and sending stocks into bear market territory. Since March 2022, the central bank has hiked its benchmark rate eight times, by 4.5 percentage points - the fastest-ever pace of monetary tightening - while also shrinking its massive asset portfolio. The latest bump came on February 2, along with a signal that the Fed plans to lift rates in March while it considers whether and when to pause increases. Against this dynamic backdrop, stocks struggled to gain traction until a strong rally ignited heading into the summer. But in September, the index returned -9.21%, one of its worst monthly results ever, before advancing 7.56% in Q4, as risky assets regained favor. For the full 12 months, value stocks handily outpaced growth. The headwind for the latter was most pronounced in the growth-oriented communication services (-25%) and consumer discretionary (-18%) sectors. In sharp contrast, energy gained 24%.
Comments from Portfolio Manager Ali Khan:
For the fiscal year ending February 28, 2023, the fund returned -13.67%, modestly outpacing the -13.83% result of the MSCI US IMI Software & Services 25/50 Index, but underperforming the broad-based S&P 500 ® index. Versus the industry index, security selection was the primary contributor, led by the application software sector. Our non-index stake in Twitter was the fund's biggest individual relative contributor, driven by a gain of about 52%. Twitter was not held at period end. Also lifting performance was our overweighting in Anaplan, which gained about 35%. Anaplan was not held at period end. Another notable relative contributor was our lighter-than-index position in Datadog (-53%), a stake we established the past 12 months. In contrast, the primary detractor from performance versus the industry index was an underweighting in data processing & outsourced services. Stock selection in IT consulting & other services and an overweighting in internet services & infrastructure also hurt relative performance. Our non-index investment in Alphabet was the fund's biggest individual relative detractor, due to its roughly -33% result. This was among the fund's largest holdings. Also holding back performance was an underweighting in Automatic Data Processing, which gained roughly 10%. Automatic Data Processing was not held at period end. Avoiding Cadence Design Systems, an index component that gained approximately 27%, also hurt relative performance.
The views expressed above reflect those of the portfolio manager(s) only through the end of the period as stated on the cover of this report and do not necessarily represent the views of Fidelity or any other person in the Fidelity organization. Any such views are subject to change at any time based upon market or other conditions and Fidelity disclaims any responsibility to update such views. These views may not be relied on as investment advice and, because investment decisions for a Fidelity fund are based on numerous factors, may not be relied on as an indication of trading intent on behalf of any Fidelity fund.
Software and IT Services Portfolio
Top Holdings (% of Fund's net assets) |
| |
| Microsoft Corp. | 24.8 | |
| Visa, Inc. Class A | 7.2 | |
| MasterCard, Inc. Class A | 6.1 | |
| Adobe, Inc. | 5.4 | |
| Salesforce.com, Inc. | 5.4 | |
| Palo Alto Networks, Inc. | 2.8 | |
| Autodesk, Inc. | 2.6 | |
| Alphabet, Inc. Class A | 2.6 | |
| Oracle Corp. | 2.4 | |
| Cognizant Technology Solutions Corp. Class A | 2.4 | |
| | 61.7 | |
| |
| Industries (% of Fund's net assets) |
| |
| Software | 57.8 | |
| IT Services | 34.4 | |
| Interactive Media & Services | 3.4 | |
| Entertainment | 1.6 | |
| Internet & Direct Marketing Retail | 0.2 | |
| Media | 0.2 | |
| Communications Equipment | 0.0 | |
| |
Percentages shown as 0.0% may reflect amounts less than 0.05%.
Software and IT Services Portfolio
Showing Percentage of Net Assets
| Common Stocks - 97.6% |
| | | Shares | Value ($) |
| Communications Equipment - 0.0% | | | |
| Communications Equipment - 0.0% | | | |
| Lumine Group, Inc. (a)(b) | | 75,609 | 774,000 |
| Entertainment - 1.6% | | | |
| Interactive Home Entertainment - 1.6% | | | |
| Activision Blizzard, Inc. | | 814,900 | 62,136,125 |
| Electronic Arts, Inc. | | 684,300 | 75,916,242 |
| | | | 138,052,367 |
| Interactive Media & Services - 3.4% | | | |
| Interactive Media & Services - 3.4% | | | |
| Alphabet, Inc. Class A (a) | | 2,434,900 | 219,287,094 |
| Meta Platforms, Inc. Class A (a) | | 408,000 | 71,375,520 |
| | | | 290,662,614 |
| Internet & Direct Marketing Retail - 0.2% | | | |
| Internet & Direct Marketing Retail - 0.2% | | | |
| Uber Technologies, Inc. (a) | | 632,100 | 21,023,646 |
| IT Services - 34.4% | | | |
| Data Processing & Outsourced Services - 20.0% | | | |
| AvidXchange Holdings, Inc. (a) | | 36,300 | 361,185 |
| Block, Inc. Class A (a) | | 1,350,700 | 103,639,211 |
| ExlService Holdings, Inc. (a) | | 153,900 | 25,318,089 |
| Fidelity National Information Services, Inc. | | 611,200 | 38,731,744 |
| Fiserv, Inc. (a) | | 272,400 | 31,350,516 |
| FleetCor Technologies, Inc. (a) | | 153,200 | 32,905,828 |
| Global Payments, Inc. | | 1,149,470 | 128,970,534 |
| MasterCard, Inc. Class A | | 1,488,500 | 528,849,165 |
| PayPal Holdings, Inc. (a) | | 2,706,500 | 199,198,400 |
| StoneCo Ltd. Class A (a) | | 88,700 | 754,837 |
| Visa, Inc. Class A | | 2,833,820 | 623,270,371 |
| WEX, Inc. (a) | | 90,600 | 17,468,586 |
| | | | 1,730,818,466 |
| Internet Services & Infrastructure - 5.7% | | | |
| Akamai Technologies, Inc. (a) | | 1,122,900 | 81,522,540 |
| Cloudflare, Inc. (a) | | 225,649 | 13,541,196 |
| GoDaddy, Inc. (a) | | 1,449,500 | 109,741,645 |
| MongoDB, Inc. Class A (a) | | 575,400 | 120,557,808 |
| Snowflake, Inc. (a) | | 339,900 | 52,473,762 |
| Twilio, Inc. Class A (a) | | 1,200,100 | 80,658,721 |
| Wix.com Ltd. (a) | | 415,700 | 37,633,321 |
| | | | 496,128,993 |
| IT Consulting & Other Services - 8.7% | | | |
| Accenture PLC Class A | | 655,900 | 174,174,245 |
| Capgemini SA | | 691,100 | 130,004,165 |
| Cognizant Technology Solutions Corp. Class A | | 3,294,200 | 206,315,746 |
| DXC Technology Co. (a) | | 707,800 | 19,634,372 |
| Gartner, Inc. (a) | | 197,300 | 64,676,913 |
| IBM Corp. | | 1,241,200 | 160,487,160 |
| Kyndryl Holdings, Inc. (a) | | 165,700 | 2,599,833 |
| Thoughtworks Holding, Inc. (a) | | 46,100 | 339,296 |
| | | | 758,231,730 |
TOTAL IT SERVICES | | | 2,985,179,189 |
| Media - 0.2% | | | |
| Publishing - 0.2% | | | |
| The New York Times Co. Class A | | 482,900 | 18,591,650 |
| Software - 57.8% | | | |
| Application Software - 25.7% | | | |
| Adobe, Inc. (a) | | 1,454,100 | 471,055,695 |
| Alteryx, Inc. Class A (a) | | 302,800 | 19,775,868 |
| Aspen Technology, Inc. (a) | | 180,862 | 38,344,553 |
| Atlassian Corp. PLC (a) | | 234,300 | 38,502,519 |
| Autodesk, Inc. (a) | | 1,125,000 | 223,526,250 |
| Blackbaud, Inc. (a) | | 646,300 | 35,992,447 |
| Braze, Inc. (a) | | 15,500 | 475,850 |
| Ceridian HCM Holding, Inc. (a) | | 952,542 | 69,468,888 |
| Confluent, Inc. (a) | | 497,344 | 12,130,220 |
| Constellation Software, Inc. | | 25,200 | 43,329,595 |
| Coupa Software, Inc. (a) | | 637,700 | 51,653,700 |
| Datadog, Inc. Class A (a) | | 111,932 | 8,565,037 |
| DocuSign, Inc. (a) | | 129,800 | 7,963,230 |
| Dropbox, Inc. Class A (a) | | 213,000 | 4,345,200 |
| Elastic NV (a) | | 1,007,600 | 59,468,552 |
| Everbridge, Inc. (a) | | 473,000 | 15,457,640 |
| Five9, Inc. (a) | | 596,000 | 39,336,000 |
| HashiCorp, Inc. (a) | | 16,900 | 493,480 |
| HubSpot, Inc. (a) | | 280,400 | 108,475,544 |
| Intuit, Inc. | | 281,600 | 114,661,888 |
| Momentive Global, Inc. (a) | | 850,700 | 5,869,830 |
| New Relic, Inc. (a) | | 402,500 | 29,370,425 |
| PTC, Inc. (a) | | 830,000 | 104,023,900 |
| Qualtrics International, Inc. (a) | | 1,579,815 | 26,730,470 |
| RingCentral, Inc. (a) | | 137,300 | 4,536,392 |
| Salesforce.com, Inc. (a) | | 2,856,084 | 467,283,903 |
| SAP SE | | 73,900 | 8,395,852 |
| Workday, Inc. Class A (a) | | 872,300 | 161,785,481 |
| Workiva, Inc. (a) | | 263,000 | 23,459,600 |
| Zoom Video Communications, Inc. Class A (a) | | 444,400 | 33,147,796 |
| | | | 2,227,625,805 |
| Systems Software - 32.1% | | | |
| Crowdstrike Holdings, Inc. (a) | | 137,486 | 16,593,185 |
| Gen Digital, Inc. | | 4,479,100 | 87,387,241 |
| GitLab, Inc. (a)(c) | | 11,200 | 493,248 |
| Microsoft Corp. | | 8,640,502 | 2,155,114,009 |
| Oracle Corp. | | 2,364,027 | 206,615,960 |
| Palo Alto Networks, Inc. (a) | | 1,270,600 | 239,342,922 |
| Tenable Holdings, Inc. (a) | | 1,623,500 | 71,807,405 |
| Zuora, Inc. (a) | | 1,207,700 | 10,229,219 |
| | | | 2,787,583,189 |
TOTAL SOFTWARE | | | 5,015,208,994 |
| TOTAL COMMON STOCKS (Cost $4,823,829,661) | | | 8,469,492,460 |
| | | | |
| Money Market Funds - 2.1% |
| | | Shares | Value ($) |
| Fidelity Cash Central Fund 4.63% (d) | | 182,319,759 | 182,356,223 |
| Fidelity Securities Lending Cash Central Fund 4.63% (d)(e) | | 102,915 | 102,925 |
| TOTAL MONEY MARKET FUNDS (Cost $182,459,148) | | | 182,459,148 |
| | | | |
| TOTAL INVESTMENT IN SECURITIES - 99.7% (Cost $5,006,288,809) | 8,651,951,608 |
NET OTHER ASSETS (LIABILITIES) - 0.3% | 23,087,734 |
| NET ASSETS - 100.0% | 8,675,039,342 |
| | |
Legend
| (c) | Security or a portion of the security is on loan at period end. |
| (d) | Affiliated fund that is generally available only to investment companies and other accounts managed by Fidelity Investments. The rate quoted is the annualized seven-day yield of the fund at period end. A complete unaudited listing of the fund's holdings as of its most recent quarter end is available upon request. In addition, each Fidelity Central Fund's financial statements, which are not covered by the Fund's Report of Independent Registered Public Accounting Firm, are available on the SEC's website or upon request. |
| (e) | Investment made with cash collateral received from securities on loan. |
Affiliated Central Funds
Fiscal year to date information regarding the Fund's investments in Fidelity Central Funds, including the ownership percentage, is presented below.
| Affiliate | Value, beginning of period ($) | Purchases ($) | Sales Proceeds ($) | Dividend Income ($) | Realized Gain (loss) ($) | Change in Unrealized appreciation (depreciation) ($) | Value, end of period ($) | % ownership, end of period |
| Fidelity Cash Central Fund 4.63% | 46,704,772 | 946,264,868 | 810,613,417 | 3,055,107 | - | - | 182,356,223 | 0.4% |
| Fidelity Securities Lending Cash Central Fund 4.63% | 582,500 | 185,535,472 | 186,015,047 | 26,300 | - | - | 102,925 | 0.0% |
| Total | 47,287,272 | 1,131,800,340 | 996,628,464 | 3,081,407 | - | - | 182,459,148 | |
| | | | | | | | | |
Amounts in the dividend income column in the above table include any capital gain distributions from underlying funds, which are presented in the corresponding line item in the Statement of Operations, if applicable.
Amount for Fidelity Securities Lending Cash Central Fund represents the income earned on investing cash collateral, less rebates paid to borrowers and any lending agent fees associated with the loan, plus any premium payments received for lending certain types of securities.
Amounts included in the purchases and sales proceeds columns may include in-kind transactions, if applicable.
Investment Valuation
The following is a summary of the inputs used, as of February 28, 2023, involving the Fund's assets and liabilities carried at fair value. The inputs or methodology used for valuing securities may not be an indication of the risk associated with investing in those securities. For more information on valuation inputs, and their aggregation into the levels used below, please refer to the Investment Valuation section in the accompanying Notes to Financial Statements.
| Valuation Inputs at Reporting Date: |
| Description | Total ($) | Level 1 ($) | Level 2 ($) | Level 3 ($) |
Investments in Securities: | | | | |
|
| Common Stocks | 8,469,492,460 | 8,460,322,608 | 8,395,852 | 774,000 |
|
| Money Market Funds | 182,459,148 | 182,459,148 | - | - |
| Total Investments in Securities: | 8,651,951,608 | 8,642,781,756 | 8,395,852 | 774,000 |
Software and IT Services Portfolio
| Statement of Assets and Liabilities |
| | | | February 28, 2023 |
| | | | | |
| Assets | | | | |
| Investment in securities, at value (including securities loaned of $101,292) - See accompanying schedule: | | | | |
Unaffiliated issuers (cost $4,823,829,661) | $ | 8,469,492,460 | | |
Fidelity Central Funds (cost $182,459,148) | | 182,459,148 | | |
| | | | | |
| | | | | |
| Total Investment in Securities (cost $5,006,288,809) | | | $ | 8,651,951,608 |
| Cash | | | | 51,653,699 |
| Receivable for investments sold | | | | 20,799,010 |
| Receivable for fund shares sold | | | | 1,105,911 |
| Dividends receivable | | | | 9,936,413 |
| Distributions receivable from Fidelity Central Funds | | | | 551,771 |
| Prepaid expenses | | | | 20,919 |
| Other receivables | | | | 437,798 |
Total assets | | | | 8,736,457,129 |
| Liabilities | | | | |
| Payable for fund shares redeemed | $ | 4,131,818 | | |
| Accrued management fee | | 3,965,092 | | |
| Other affiliated payables | | 1,185,438 | | |
| Deferred dividend income | | 51,653,699 | | |
| Other payables and accrued expenses | | 378,815 | | |
| Collateral on securities loaned | | 102,925 | | |
| Total Liabilities | | | | 61,417,787 |
| Net Assets | | | $ | 8,675,039,342 |
| Net Assets consist of: | | | | |
| Paid in capital | | | $ | 5,022,965,278 |
| Total accumulated earnings (loss) | | | | 3,652,074,064 |
| Net Assets | | | $ | 8,675,039,342 |
Net Asset Value , offering price and redemption price per share ($8,675,039,342 ÷ 412,800,411 shares) | | | $ | 21.02 |
| Statement of Operations |
| | | | Year ended February 28, 2023 |
| Investment Income | | | | |
| Dividends | | | $ | 59,442,879 |
| Income from Fidelity Central Funds (including $26,300 from security lending) | | | | 3,081,407 |
| Total Income | | | | 62,524,286 |
| Expenses | | | | |
| Management fee | $ | 48,800,201 | | |
| Transfer agent fees | | 13,850,537 | | |
| Accounting fees | | 1,163,937 | | |
| Custodian fees and expenses | | 53,984 | | |
| Independent trustees' fees and expenses | | 32,008 | | |
| Registration fees | | 40,342 | | |
| Audit | | 55,805 | | |
| Legal | | 8,126 | | |
| Interest | | 9,682 | | |
| Miscellaneous | | 53,859 | | |
| Total expenses before reductions | | 64,068,481 | | |
| Expense reductions | | (333,964) | | |
| Total expenses after reductions | | | | 63,734,517 |
| Net Investment income (loss) | | | | (1,210,231) |
| Realized and Unrealized Gain (Loss) | | | | |
| Net realized gain (loss) on: | | | | |
| Investment Securities: | | | | |
| Unaffiliated issuers | | 381,865,496 | | |
| Foreign currency transactions | | (133,777) | | |
| Total net realized gain (loss) | | | | 381,731,719 |
| Change in net unrealized appreciation (depreciation) on: | | | | |
| Investment Securities: | | | | |
| Unaffiliated issuers | | (1,924,472,417) | | |
| Assets and liabilities in foreign currencies | | (10,290) | | |
| Total change in net unrealized appreciation (depreciation) | | | | (1,924,482,707) |
| Net gain (loss) | | | | (1,542,750,988) |
| Net increase (decrease) in net assets resulting from operations | | | $ | (1,543,961,219) |
| Statement of Changes in Net Assets |
| |
| | Year ended February 28, 2023 | | Year ended February 28, 2022 |
| Increase (Decrease) in Net Assets | | | | |
| Operations | | | | |
| Net investment income (loss) | $ | (1,210,231) | $ | (21,892,746) |
| Net realized gain (loss) | | 381,731,719 | | 1,110,704,960 |
| Change in net unrealized appreciation (depreciation) | | (1,924,482,707) | | (688,232,505) |
| Net increase (decrease) in net assets resulting from operations | | (1,543,961,219) | | 400,579,709 |
| Distributions to shareholders | | (738,727,367) | | (831,854,738) |
| Share transactions | | | | |
| Proceeds from sales of shares | | 474,830,990 | | 1,277,423,928 |
| Reinvestment of distributions | | 691,638,248 | | 783,418,638 |
| Cost of shares redeemed | | (1,477,032,652) | | (2,255,819,953) |
Net increase (decrease) in net assets resulting from share transactions | | (310,563,414) | | (194,977,387) |
| Total increase (decrease) in net assets | | (2,593,252,000) | | (626,252,416) |
| | | | | |
| Net Assets | | | | |
| Beginning of period | | 11,268,291,342 | | 11,894,543,758 |
| End of period | $ | 8,675,039,342 | $ | 11,268,291,342 |
| | | | | |
| Other Information | | | | |
| Shares | | | | |
| Sold | | 21,172,412 | | 42,971,848 |
| Issued in reinvestment of distributions | | 30,858,073 | | 26,896,267 |
| Redeemed | | (67,265,870) | | (77,442,780) |
| Net increase (decrease) | | (15,235,385) | | (7,574,665) |
| | | | | |
Financial Highlights
| Software and IT Services Portfolio |
| |
| Years ended February 28, | | 2023 | | 2022 | | 2021 | | 2020 A | | 2019 B |
Selected Per-Share Data | | | | | | | | | | |
| Net asset value, beginning of period | $ | 26.33 | $ | 27.31 | $ | 19.90 | $ | 18.71 | $ | 17.89 |
| Income from Investment Operations | | | | | | | | | | |
Net investment income (loss) C,D | | - E | | (.05) | | (.03) | | .19 F | | .02 |
| Net realized and unrealized gain (loss) | | (3.53) | | 1.03 | | 8.82 | | 3.52 | | 1.81 |
| Total from investment operations | | (3.53) | | .98 | | 8.79 | | 3.71 | | 1.83 |
| Distributions from net investment income | | - | | - | | (.15) | | (.05) | | (.01) |
| Distributions from net realized gain | | (1.78) | | (1.96) | | (1.23) | | (2.47) | | (1.00) |
| Total distributions | | (1.78) | | (1.96) | | (1.38) | | (2.52) | | (1.01) |
| Net asset value, end of period | $ | 21.02 | $ | 26.33 | $ | 27.31 | $ | 19.90 | $ | 18.71 |
Total Return G | | (13.67)% | | 2.98% | | 45.80% | | 21.33% | | 10.90% |
Ratios to Average Net Assets D,H,I | | | | | | | | | | |
| Expenses before reductions | | .69% | | .67% | | .70% | | .70% | | .72% |
| Expenses net of fee waivers, if any | | .69% | | .67% | | .70% | | .70% | | .72% |
| Expenses net of all reductions | | .69% | | .67% | | .69% | | .70% | | .71% |
| Net investment income (loss) | | (.01)% | | (.17)% | | (.11)% | | .98% F | | .10% |
| Supplemental Data | | | | | | | | | | |
| Net assets, end of period (000 omitted) | $ | 8,675,039 | $ | 11,268,291 | $ | 11,894,544 | $ | 8,031,911 | $ | 6,540,896 |
Portfolio turnover rate J | | 4% | | 10% | | 22% | | 23% | | 48% |
A For the year ended February 29.
B Per share amounts have been adjusted to reflect the impact of the 10 for 1 share split that occurred on May 11, 2018.
C Calculated based on average shares outstanding during the period.
D Net investment income (loss) is affected by the timing of the declaration of dividends by any underlying mutual funds or exchange-traded funds (ETFs). Net investment income (loss) of any mutual funds or ETFs is not included in the Fund's net investment income (loss) ratio.
E Amount represents less than $.005 per share.
F Net investment income per share reflects one or more large, non-recurring dividend(s) which amounted to $.15 per share. Excluding such non-recurring dividend(s), the ratio of net investment income (loss) to average net assets would have been .22%.
G Total returns would have been lower if certain expenses had not been reduced during the applicable periods shown.
H Fees and expenses of any underlying mutual funds or exchange-traded funds (ETFs) are not included in the Fund's expense ratio. The Fund indirectly bears its proportionate share of these expenses. For additional expense information related to investments in Fidelity Central Funds, please refer to the "Investments in Fidelity Central Funds" note found in the Notes to Financial Statements section of the most recent Annual or Semi-Annual report.
I Expense ratios reflect operating expenses of the class. Expenses before reductions do not reflect amounts reimbursed, waived, or reduced through arrangements with the investment adviser, brokerage services, or other offset arrangements, if applicable, and do not represent the amount paid by the class during periods when reimbursements, waivers or reductions occur.
J Amount does not include the portfolio activity of any underlying mutual funds or exchange-traded funds (ETFs).
Average annual total return reflects the change in the value of an investment, assuming reinvestment of distributions from dividend income and capital gains (the profits earned upon the sale of securities that have grown in value, if any) and assuming a constant rate of performance each year. The hypothetical investment and the average annual total returns do not reflect the deduction of taxes that a shareholder would pay on fund distributions or the redemption of fund shares. During periods of reimbursement by Fidelity, a fund's total return will be greater than it would be had the reimbursement not occurred. How a fund did yesterday is no guarantee of how it will do tomorrow.
| Average Annual Total Returns |
| | | | |
Periods ended February 28, 2023 | Past 1 year | Past 5 years | Past 10 years |
| Tech Hardware Portfolio | -13.62% | 11.74% | 13.28% |
| $10,000 Over 10 Years |
| |
Let's say hypothetically that $10,000 was invested in Tech Hardware Portfolio on February 28, 2013. The chart shows how the value of your investment would have changed, and also shows how the S&P 500® Index performed over the same period. |
|
|
Tech Hardware Portfolio
Market Recap:
U.S. equities returned -7.69% for the 12 months ending February 28, 2023, according to the S&P 500 ® index. The new year began with an encouraging upturn in January (+6.28%), but stocks lost momentum in February (-2.44%) amid higher-than-expected inflation and strong jobs data. Investors took these as signs that the economy continued to run hot, even after a year of historic policy adjustment by the Federal Reserve aimed at cooling economic growth. Record inflation in 2022 prompted the Fed to aggressively tighten monetary policy, and market interest rates eclipsed their highest level in a decade, stoking recession fears and sending stocks into bear market territory. Since March 2022, the central bank has hiked its benchmark rate eight times, by 4.5 percentage points - the fastest-ever pace of monetary tightening - while also shrinking its massive asset portfolio. The latest bump came on February 2, along with a signal that the Fed plans to lift rates in March while it considers whether and when to pause increases. Against this dynamic backdrop, stocks struggled to gain traction until a strong rally ignited heading into the summer. But in September, the index returned -9.21%, one of its worst monthly results ever, before advancing 7.56% in Q4, as risky assets regained favor. For the full 12 months, value stocks handily outpaced growth. The headwind for the latter was most pronounced in the growth-oriented communication services (-25%) and consumer discretionary (-18%) sectors. In sharp contrast, energy gained 24%.
Comments from Portfolio Manager Elliot Mattingly:
For the fiscal year ending February 28, 2023, the fund returned -13.61%, trailing the -12.56% result of the FactSet Hardware Technology Linked Index, as well as the broad-based S&P 500 ® index. Versus the industry index, security selection was the primary detractor, especially among technology hardware, storage & peripherals firms. An underweighting and picks in the consumer electronics group, along with investment choices in industrial machinery, hampered the fund's relative result as well. The portfolio's biggest individual relative detractor was an overweighting in FUJIFILM Holdings, which returned -25% the past 12 months and was among our largest holdings on February 28. Further pressuring relative performance was a non-index stake in Kornit Digital, a position not held at period end that returned about -75%. Also hurting the fund's return compared with the index was an outsized investment in Sonos (-47%). The stock was no longer held as of period end. In contrast, the biggest contributor to performance versus the industry index was security selection in the communications equipment category, followed by stock picks and an overweighting among systems software and technology distributors. The fund's top individual relative contributor was an overweight in Extreme Networks, which gained 66% and was sold the past year. Further aiding performance was an outsized stake in Motorola Solutions, which rose 21% and was among our biggest holdings. Another notable relative contributor was a larger-than-index position in Insight Enterprises (+41%), an investment we established this period. Notable changes in positioning include reduced exposure to systems software companies.
The views expressed above reflect those of the portfolio manager(s) only through the end of the period as stated on the cover of this report and do not necessarily represent the views of Fidelity or any other person in the Fidelity organization. Any such views are subject to change at any time based upon market or other conditions and Fidelity disclaims any responsibility to update such views. These views may not be relied on as investment advice and, because investment decisions for a Fidelity fund are based on numerous factors, may not be relied on as an indication of trading intent on behalf of any Fidelity fund.
Tech Hardware Portfolio
Top Holdings (% of Fund's net assets) |
| |
| Cisco Systems, Inc. | 11.4 | |
| Sony Group Corp. | 11.4 | |
| Samsung Electronics Co. Ltd. | 11.0 | |
| Apple, Inc. | 10.7 | |
| Palo Alto Networks, Inc. | 5.5 | |
| Motorola Solutions, Inc. | 5.0 | |
| Arista Networks, Inc. | 4.4 | |
| FUJIFILM Holdings Corp. | 4.2 | |
| Keysight Technologies, Inc. | 3.7 | |
| CDW Corp. | 3.6 | |
| | 70.9 | |
| |
| Industries (% of Fund's net assets) |
| |
| Technology Hardware, Storage & Peripherals | 38.0 | |
| Communications Equipment | 26.5 | |
| Household Durables | 11.4 | |
| Electronic Equipment & Components | 10.9 | |
| Software | 7.3 | |
| Entertainment | 2.8 | |
| Semiconductors & Semiconductor Equipment | 1.5 | |
| IT Services | 0.6 | |
| |
Geographic Diversification (% of Fund's net assets) |
|
* Includes Short-Term investments and Net Other Assets (Liabilities). Percentages are based on country or territory of incorporation and are adjusted for the effect of derivatives, if applicable. |
| |
Tech Hardware Portfolio
Showing Percentage of Net Assets
| Common Stocks - 99.0% |
| | | Shares | Value ($) |
| Communications Equipment - 26.5% | | | |
| Communications Equipment - 26.5% | | | |
| Arista Networks, Inc. (a) | | 226,435 | 31,406,535 |
| Calix, Inc. (a) | | 51,885 | 2,653,918 |
| Ciena Corp. (a) | | 127,496 | 6,147,857 |
| Cisco Systems, Inc. | | 1,694,987 | 82,071,271 |
| Ericsson (B Shares) | | 679,865 | 3,764,823 |
| Infinera Corp. (a)(b) | | 560,032 | 3,959,426 |
| Juniper Networks, Inc. | | 460,073 | 14,161,047 |
| Motorola Solutions, Inc. | | 135,290 | 35,555,565 |
| Nokia Corp. | | 2,258,810 | 10,463,253 |
| | | | 190,183,695 |
| Electronic Equipment & Components - 10.9% | | | |
| Electronic Equipment & Instruments - 3.7% | | | |
| Keysight Technologies, Inc. (a) | | 167,482 | 26,790,421 |
| Technology Distributors - 7.2% | | | |
| CDW Corp. (b) | | 125,436 | 25,390,755 |
| Insight Enterprises, Inc. (a) | | 113,459 | 15,194,429 |
| TD SYNNEX Corp. | | 112,816 | 10,889,000 |
| | | | 51,474,184 |
TOTAL ELECTRONIC EQUIPMENT & COMPONENTS | | | 78,264,605 |
| Entertainment - 2.8% | | | |
| Interactive Home Entertainment - 2.8% | | | |
| Nintendo Co. Ltd. | | 543,428 | 20,344,357 |
| Household Durables - 11.4% | | | |
| Consumer Electronics - 11.4% | | | |
| Sony Group Corp. | | 976,129 | 81,620,475 |
| IT Services - 0.6% | | | |
| Internet Services & Infrastructure - 0.6% | | | |
| Cloudflare, Inc. (a)(b) | | 65,794 | 3,948,298 |
| Semiconductors & Semiconductor Equipment - 1.5% | | | |
| Semiconductors - 1.5% | | | |
| MACOM Technology Solutions Holdings, Inc. (a) | | 16,436 | 1,126,523 |
| Taiwan Semiconductor Manufacturing Co. Ltd. | | 575,638 | 9,439,494 |
| | | | 10,566,017 |
| Software - 7.3% | | | |
| Systems Software - 7.3% | | | |
| Fortinet, Inc. (a) | | 219,978 | 13,075,492 |
| Palo Alto Networks, Inc. (a) | | 208,257 | 39,229,371 |
| | | | 52,304,863 |
| Technology Hardware, Storage & Peripherals - 38.0% | | | |
| Technology Hardware, Storage & Peripherals - 38.0% | | | |
| Apple, Inc. | | 520,340 | 76,703,319 |
| Dell Technologies, Inc. | | 498,056 | 20,240,996 |
| FUJIFILM Holdings Corp. | | 641,207 | 29,923,464 |
| HP, Inc. | | 385,156 | 11,369,805 |
| NetApp, Inc. | | 194,824 | 12,575,889 |
| Pure Storage, Inc. Class A (a) | | 479,929 | 13,697,174 |
| Samsung Electronics Co. Ltd. | | 1,713,814 | 78,608,776 |
| Seagate Technology Holdings PLC | | 254,900 | 16,456,344 |
| Western Digital Corp. (a) | | 53,645 | 2,064,260 |
| Xiaomi Corp. Class B (a)(c) | | 7,172,333 | 10,836,990 |
| | | | 272,477,017 |
| TOTAL COMMON STOCKS (Cost $548,671,320) | | | 709,709,327 |
| | | | |
| Money Market Funds - 1.1% |
| | | Shares | Value ($) |
| Fidelity Cash Central Fund 4.63% (d) | | 1,156,807 | 1,157,038 |
| Fidelity Securities Lending Cash Central Fund 4.63% (d)(e) | | 7,105,547 | 7,106,258 |
| TOTAL MONEY MARKET FUNDS (Cost $8,263,296) | | | 8,263,296 |
| | | | |
| TOTAL INVESTMENT IN SECURITIES - 100.1% (Cost $556,934,616) | 717,972,623 |
NET OTHER ASSETS (LIABILITIES) - (0.1)% | (1,017,066) |
| NET ASSETS - 100.0% | 716,955,557 |
| | |
Legend
| (b) | Security or a portion of the security is on loan at period end. |
| (c) | Security exempt from registration under Rule 144A of the Securities Act of 1933. These securities may be resold in transactions exempt from registration, normally to qualified institutional buyers. At the end of the period, the value of these securities amounted to $10,836,990 or 1.5% of net assets. |
| (d) | Affiliated fund that is generally available only to investment companies and other accounts managed by Fidelity Investments. The rate quoted is the annualized seven-day yield of the fund at period end. A complete unaudited listing of the fund's holdings as of its most recent quarter end is available upon request. In addition, each Fidelity Central Fund's financial statements, which are not covered by the Fund's Report of Independent Registered Public Accounting Firm, are available on the SEC's website or upon request. |
| (e) | Investment made with cash collateral received from securities on loan. |
Affiliated Central Funds
Fiscal year to date information regarding the Fund's investments in Fidelity Central Funds, including the ownership percentage, is presented below.
| Affiliate | Value, beginning of period ($) | Purchases ($) | Sales Proceeds ($) | Dividend Income ($) | Realized Gain (loss) ($) | Change in Unrealized appreciation (depreciation) ($) | Value, end of period ($) | % ownership, end of period |
| Fidelity Cash Central Fund 4.63% | 2,163,365 | 92,787,582 | 93,793,909 | 32,376 | - | - | 1,157,038 | 0.0% |
| Fidelity Securities Lending Cash Central Fund 4.63% | 13,140,825 | 315,363,796 | 321,398,363 | 30,551 | - | - | 7,106,258 | 0.0% |
| Total | 15,304,190 | 408,151,378 | 415,192,272 | 62,927 | - | - | 8,263,296 | |
| | | | | | | | | |
Amounts in the dividend income column in the above table include any capital gain distributions from underlying funds, which are presented in the corresponding line item in the Statement of Operations, if applicable.
Amount for Fidelity Securities Lending Cash Central Fund represents the income earned on investing cash collateral, less rebates paid to borrowers and any lending agent fees associated with the loan, plus any premium payments received for lending certain types of securities.
Amounts included in the purchases and sales proceeds columns may include in-kind transactions, if applicable.
Investment Valuation
The following is a summary of the inputs used, as of February 28, 2023, involving the Fund's assets and liabilities carried at fair value. The inputs or methodology used for valuing securities may not be an indication of the risk associated with investing in those securities. For more information on valuation inputs, and their aggregation into the levels used below, please refer to the Investment Valuation section in the accompanying Notes to Financial Statements.
| Valuation Inputs at Reporting Date: |
| Description | Total ($) | Level 1 ($) | Level 2 ($) | Level 3 ($) |
Investments in Securities: | | | | |
|
| Common Stocks | 709,709,327 | 594,540,178 | 115,169,149 | - |
|
| Money Market Funds | 8,263,296 | 8,263,296 | - | - |
| Total Investments in Securities: | 717,972,623 | 602,803,474 | 115,169,149 | - |
Tech Hardware Portfolio
| Statement of Assets and Liabilities |
| | | | February 28, 2023 |
| | | | | |
| Assets | | | | |
| Investment in securities, at value (including securities loaned of $6,932,264) - See accompanying schedule: | | | | |
Unaffiliated issuers (cost $548,671,320) | $ | 709,709,327 | | |
Fidelity Central Funds (cost $8,263,296) | | 8,263,296 | | |
| | | | | |
| | | | | |
| Total Investment in Securities (cost $556,934,616) | | | $ | 717,972,623 |
| Receivable for investments sold | | | | 25,313,555 |
| Receivable for fund shares sold | | | | 89,325 |
| Dividends receivable | | | | 999,140 |
| Distributions receivable from Fidelity Central Funds | | | | 2,877 |
| Prepaid expenses | | | | 1,913 |
| Other receivables | | | | 164,687 |
Total assets | | | | 744,544,120 |
| Liabilities | | | | |
| Payable to custodian bank | $ | 8 | | |
| Payable for investments purchased | | 19,256,645 | | |
| Payable for fund shares redeemed | | 693,495 | | |
| Accrued management fee | | 323,532 | | |
| Other affiliated payables | | 114,945 | | |
| Other payables and accrued expenses | | 93,680 | | |
| Collateral on securities loaned | | 7,106,258 | | |
| Total Liabilities | | | | 27,588,563 |
| Net Assets | | | $ | 716,955,557 |
| Net Assets consist of: | | | | |
| Paid in capital | | | $ | 591,889,001 |
| Total accumulated earnings (loss) | | | | 125,066,556 |
| Net Assets | | | $ | 716,955,557 |
Net Asset Value , offering price and redemption price per share ($716,955,557 ÷ 9,382,753 shares) | | | $ | 76.41 |
| Statement of Operations |
| | | | Year ended February 28, 2023 |
| Investment Income | | | | |
| Dividends | | | $ | 10,933,240 |
| Income from Fidelity Central Funds (including $30,551 from security lending) | | | | 62,927 |
| Total Income | | | | 10,996,167 |
| Expenses | | | | |
| Management fee | $ | 3,947,513 | | |
| Transfer agent fees | | 1,185,743 | | |
| Accounting fees | | 244,223 | | |
| Custodian fees and expenses | | 32,436 | | |
| Independent trustees' fees and expenses | | 2,590 | | |
| Registration fees | | 27,625 | | |
| Audit | | 52,187 | | |
| Legal | | 3,971 | | |
| Interest | | 909 | | |
| Miscellaneous | | (7,289) | | |
| Total expenses before reductions | | 5,489,908 | | |
| Expense reductions | | (26,705) | | |
| Total expenses after reductions | | | | 5,463,203 |
| Net Investment income (loss) | | | | 5,532,964 |
| Realized and Unrealized Gain (Loss) | | | | |
| Net realized gain (loss) on: | | | | |
| Investment Securities: | | | | |
| Unaffiliated issuers | | (33,577,142) | | |
| Foreign currency transactions | | (26,861) | | |
| Total net realized gain (loss) | | | | (33,604,003) |
| Change in net unrealized appreciation (depreciation) on: | | | | |
| Investment Securities: | | | | |
| Unaffiliated issuers | | (97,749,286) | | |
| Assets and liabilities in foreign currencies | | (96,081) | | |
| Total change in net unrealized appreciation (depreciation) | | | | (97,845,367) |
| Net gain (loss) | | | | (131,449,370) |
| Net increase (decrease) in net assets resulting from operations | | | $ | (125,916,406) |
| Statement of Changes in Net Assets |
| |
| | Year ended February 28, 2023 | | Year ended February 28, 2022 |
| Increase (Decrease) in Net Assets | | | | |
| Operations | | | | |
| Net investment income (loss) | $ | 5,532,964 | $ | 3,223,590 |
| Net realized gain (loss) | | (33,604,003) | | 173,943,867 |
| Change in net unrealized appreciation (depreciation) | | (97,845,367) | | (149,735,648) |
| Net increase (decrease) in net assets resulting from operations | | (125,916,406) | | 27,431,809 |
| Distributions to shareholders | | (113,303,240) | | (131,911,413) |
| Share transactions | | | | |
| Proceeds from sales of shares | | 40,943,701 | | 125,851,574 |
| Net asset value of shares issued in exchange for the net assets of the Target Fund(s) (see Merger Information note) | | - | | 189,381,924 |
| Reinvestment of distributions | | 107,418,146 | | 125,862,871 |
| Cost of shares redeemed | | (105,835,572) | | (193,743,884) |
Net increase (decrease) in net assets resulting from share transactions | | 42,526,275 | | 247,352,485 |
| Total increase (decrease) in net assets | | (196,693,371) | | 142,872,881 |
| | | | | |
| Net Assets | | | | |
| Beginning of period | | 913,648,928 | | 770,776,047 |
| End of period | $ | 716,955,557 | $ | 913,648,928 |
| | | | | |
| Other Information | | | | |
| Shares | | | | |
| Sold | | 520,712 | | 1,206,665 |
| Issued in exchange for the shares of the Target Fund(s) (see Merger Information note) | | - | | 1,755,160 |
| Issued in reinvestment of distributions | | 1,242,912 | | 1,142,875 |
| Redeemed | | (1,384,081) | | (1,819,249) |
| Net increase (decrease) | | 379,543 | | 2,285,451 |
| | | | | |
Financial Highlights
| Years ended February 28, | | 2023 | | 2022 | | 2021 | | 2020 A | | 2019 |
Selected Per-Share Data | | | | | | | | | | |
| Net asset value, beginning of period | $ | 101.48 | $ | 114.74 | $ | 78.64 | $ | 75.84 | $ | 92.81 |
| Income from Investment Operations | | | | | | | | | | |
Net investment income (loss) B,C | | .57 | | .42 | | .93 D | | 1.51 E | | .81 |
| Net realized and unrealized gain (loss) | | (13.00) | | 5.73 | | 44.83 | | 11.48 | | (1.67) |
| Total from investment operations | | (12.43) | | 6.15 | | 45.76 | | 12.99 | | (.86) |
| Distributions from net investment income | | (.51) | | (.73) F | | (1.61) | | (.77) | | (.88) F |
| Distributions from net realized gain | | (12.13) | | (18.68) F | | (8.05) | | (9.42) | | (15.23) F |
| Total distributions | | (12.64) | | (19.41) | | (9.66) | | (10.19) | | (16.11) |
| Net asset value, end of period | $ | 76.41 | $ | 101.48 | $ | 114.74 | $ | 78.64 | $ | 75.84 |
Total Return G | | (13.62)% | | 4.72% | | 62.60% | | 17.80% | | .54% |
Ratios to Average Net Assets C,H,I | | | | | | | | | | |
| Expenses before reductions | | .73% | | .72% J | | .74% | | .76% | | .77% |
| Expenses net of fee waivers, if any | | .73% | | .72% J | | .74% | | .76% | | .77% |
| Expenses net of all reductions | | .73% | | .72% J | | .73% | | .75% | | .77% |
| Net investment income (loss) | | .74% | | .38% J | | 1.04% D | | 1.95% E | | .90% |
| Supplemental Data | | | | | | | | | | |
| Net assets, end of period (000 omitted) | $ | 716,956 | $ | 913,649 | $ | 770,776 | $ | 533,793 | $ | 491,780 |
Portfolio turnover rate K | | 30% | | 99% L | | 78% | | 116% | | 81% |
A For the year ended February 29.
B Calculated based on average shares outstanding during the period.
C Net investment income (loss) is affected by the timing of the declaration of dividends by any underlying mutual funds or exchange-traded funds (ETFs). Net investment income (loss) of any mutual funds or ETFs is not included in the Fund's net investment income (loss) ratio.
D Net investment income per share reflects one or more large, non-recurring dividend(s) which amounted to $.44 per share. Excluding such non-recurring dividend(s), the ratio of net investment income (loss) to average net assets would have been .55%.
E Net investment income per share reflects one or more large, non-recurring dividend(s) which amounted to $.78 per share. Excluding such non-recurring dividend(s), the ratio of net investment income (loss) to average net assets would have been .94%.
F The amount shown reflects reclassifications related to book to tax differences that were made in the year shown.
G Total returns would have been lower if certain expenses had not been reduced during the applicable periods shown.
H Fees and expenses of any underlying mutual funds or exchange-traded funds (ETFs) are not included in the Fund's expense ratio. The Fund indirectly bears its proportionate share of these expenses. For additional expense information related to investments in Fidelity Central Funds, please refer to the "Investments in Fidelity Central Funds" note found in the Notes to Financial Statements section of the most recent Annual or Semi-Annual report.
I Expense ratios reflect operating expenses of the class. Expenses before reductions do not reflect amounts reimbursed, waived, or reduced through arrangements with the investment adviser, brokerage services, or other offset arrangements, if applicable, and do not represent the amount paid by the class during periods when reimbursements, waivers or reductions occur.
J Proxy expenses are not annualized.
K Amount does not include the portfolio activity of any underlying mutual funds or exchange-traded funds (ETFs).
L The portfolio turnover rate does not include the assets acquired in the merger.
Average annual total return reflects the change in the value of an investment, assuming reinvestment of distributions from dividend income and capital gains (the profits earned upon the sale of securities that have grown in value, if any) and assuming a constant rate of performance each year. The hypothetical investment and the average annual total returns do not reflect the deduction of taxes that a shareholder would pay on fund distributions or the redemption of fund shares. During periods of reimbursement by Fidelity, a fund's total return will be greater than it would be had the reimbursement not occurred. How a fund did yesterday is no guarantee of how it will do tomorrow.
| Average Annual Total Returns |
| | | | |
Periods ended February 28, 2023 | Past 1 year | Past 5 years | Past 10 years |
| Technology Portfolio | -15.43% | 12.96% | 17.68% |
| $10,000 Over 10 Years |
| |
Let's say hypothetically that $10,000 was invested in Technology Portfolio on February 28, 2013. The chart shows how the value of your investment would have changed, and also shows how the S&P 500® Index performed over the same period. |
|
|
Technology Portfolio
Market Recap:
U.S. equities returned -7.69% for the 12 months ending February 28, 2023, according to the S&P 500 ® index. The new year began with an encouraging upturn in January (+6.28%), but stocks lost momentum in February (-2.44%) amid higher-than-expected inflation and strong jobs data. Investors took these as signs that the economy continued to run hot, even after a year of historic policy adjustment by the Federal Reserve aimed at cooling economic growth. Record inflation in 2022 prompted the Fed to aggressively tighten monetary policy, and market interest rates eclipsed their highest level in a decade, stoking recession fears and sending stocks into bear market territory. Since March 2022, the central bank has hiked its benchmark rate eight times, by 4.5 percentage points - the fastest-ever pace of monetary tightening - while also shrinking its massive asset portfolio. The latest bump came on February 2, along with a signal that the Fed plans to lift rates in March while it considers whether and when to pause increases. Against this dynamic backdrop, stocks struggled to gain traction until a strong rally ignited heading into the summer. But in September, the index returned -9.21%, one of its worst monthly results ever, before advancing 7.56% in Q4, as risky assets regained favor. For the full 12 months, value stocks handily outpaced growth. The headwind for the latter was most pronounced in the growth-oriented communication services (-25%) and consumer discretionary (-18%) sectors. In sharp contrast, energy gained 24%.
Comments from Portfolio Manager Adam Benjamin:
For the fiscal year ending February 28, 2023, the fund returned -15.43%, underperforming the -11.98% return of the MSCI U.S. IMI Information Technology 25/50 Index, as well as the broad-based S&P 500 ® index. The primary detractors from performance versus the sector index were an overweighting and stock selection in internet services & infrastructure. Non-index exposure to interactive media & services and security selection in application software also hindered the fund's relative result. The biggest individual relative detractor was an overweight position in Marvell Technology (-33%). Marvell Technology was among our largest holdings. Another notable relative detractor was an overweighting in Twilio (-61%), and we reduced our stake. The fund's non-index position in Snap returned about -75%, and we increased our holdings. Conversely, the largest contributors to performance versus the sector index were stock picks and an overweighting in semiconductors. Security selection and an overweighting in electronic manufacturing services and stock picks in data processing & outsourced services also boosted the fund's relative performance. The biggest individual relative contributor was an overweight position in onsemi (+24%). Onsemi was among the fund's biggest holdings. Also boosting value was our outsized stake in Nvidia, which returned -5%. Nvidia was among our largest holdings. Avoiding Intel, an index component that returned about -45%, also aided relative performance. Notable changes in positioning include increased exposure to the semiconductors subindustry and a lower allocation to communications equipment.
The views expressed above reflect those of the portfolio manager(s) only through the end of the period as stated on the cover of this report and do not necessarily represent the views of Fidelity or any other person in the Fidelity organization. Any such views are subject to change at any time based upon market or other conditions and Fidelity disclaims any responsibility to update such views. These views may not be relied on as investment advice and, because investment decisions for a Fidelity fund are based on numerous factors, may not be relied on as an indication of trading intent on behalf of any Fidelity fund.
Technology Portfolio
Top Holdings (% of Fund's net assets) |
| |
| Apple, Inc. | 19.4 | |
| Microsoft Corp. | 15.4 | |
| NVIDIA Corp. | 8.6 | |
| MasterCard, Inc. Class A | 5.5 | |
| Marvell Technology, Inc. | 4.4 | |
| NXP Semiconductors NV | 4.2 | |
| onsemi | 3.4 | |
| Cisco Systems, Inc. | 3.4 | |
| Salesforce.com, Inc. | 2.8 | |
| GlobalFoundries, Inc. | 2.6 | |
| | 69.7 | |
| |
| Industries (% of Fund's net assets) |
| |
| Software | 29.2 | |
| Semiconductors & Semiconductor Equipment | 28.7 | |
| Technology Hardware, Storage & Peripherals | 19.4 | |
| IT Services | 12.1 | |
| Communications Equipment | 3.5 | |
| Internet & Direct Marketing Retail | 1.8 | |
| Hotels, Restaurants & Leisure | 1.3 | |
| Interactive Media & Services | 1.1 | |
| Entertainment | 1.0 | |
| Electronic Equipment & Components | 0.4 | |
| Chemicals | 0.3 | |
| Aerospace & Defense | 0.1 | |
| Diversified Financial Services | 0.1 | |
| Air Freight & Logistics | 0.0 | |
| Construction & Engineering | 0.0 | |
| Electrical Equipment | 0.0 | |
| Food Products | 0.0 | |
| Life Sciences Tools & Services | 0.0 | |
| Pharmaceuticals | 0.0 | |
| |
Percentages shown as 0.0% may reflect amounts less than 0.05%.
Geographic Diversification (% of Fund's net assets) |
|
* Includes Short-Term investments and Net Other Assets (Liabilities). Percentages are based on country or territory of incorporation and are adjusted for the effect of derivatives, if applicable. |
| |
Technology Portfolio
Showing Percentage of Net Assets
| Common Stocks - 97.7% |
| | | Shares | Value ($) |
| Air Freight & Logistics - 0.0% | | | |
| Air Freight & Logistics - 0.0% | | | |
| Delhivery Private Ltd. | | 579,000 | 2,421,228 |
| Chemicals - 0.3% | | | |
| Commodity Chemicals - 0.3% | | | |
| LG Chemical Ltd. | | 40,787 | 20,992,560 |
| Communications Equipment - 3.4% | | | |
| Communications Equipment - 3.4% | | | |
| Cisco Systems, Inc. | | 6,086,073 | 294,687,655 |
| Diversified Financial Services - 0.1% | | | |
| Other Diversified Financial Services - 0.1% | | | |
| Ant International Co. Ltd. Class C (a)(b)(c) | | 6,426,931 | 9,704,666 |
| Electrical Equipment - 0.0% | | | |
| Electrical Components & Equipment - 0.0% | | | |
| ESS Tech, Inc. Class A (a) | | 787,286 | 1,432,861 |
| Electronic Equipment & Components - 0.4% | | | |
| Electronic Manufacturing Services - 0.4% | | | |
| Jabil, Inc. | | 420,525 | 34,916,191 |
| Entertainment - 1.0% | | | |
| Movies & Entertainment - 1.0% | | | |
| Netflix, Inc. (a) | | 255,230 | 82,217,240 |
| Food Products - 0.0% | | | |
| Agricultural Products - 0.0% | | | |
| Local Bounti Corp. (a) | | 1,546,921 | 1,061,343 |
| Hotels, Restaurants & Leisure - 1.3% | | | |
| Hotels, Resorts & Cruise Lines - 1.3% | | | |
| Airbnb, Inc. Class A (a) | | 917,709 | 113,135,166 |
| Interactive Media & Services - 0.8% | | | |
| Interactive Media & Services - 0.8% | | | |
| Epic Games, Inc. (a)(b)(c) | | 17,917 | 13,365,544 |
| Snap, Inc. Class A (a) | | 5,762,510 | 58,489,477 |
| | | | 71,855,021 |
| Internet & Direct Marketing Retail - 1.8% | | | |
| Internet & Direct Marketing Retail - 1.8% | | | |
| Cazoo Group Ltd. (a)(b) | | 144,100 | 16,211 |
| Deliveroo PLC Class A (a)(d) | | 6,252,898 | 6,220,114 |
| Lyft, Inc. (a) | | 1,718,528 | 17,185,280 |
| Uber Technologies, Inc. (a) | | 4,033,438 | 134,152,148 |
| | | | 157,573,753 |
| IT Services - 12.0% | | | |
| Data Processing & Outsourced Services - 7.7% | | | |
| Genpact Ltd. | | 343,176 | 16,379,790 |
| MasterCard, Inc. Class A | | 1,331,380 | 473,026,000 |
| Visa, Inc. Class A (e) | | 794,787 | 174,805,453 |
| | | | 664,211,243 |
| Internet Services & Infrastructure - 4.2% | | | |
| MongoDB, Inc. Class A (a) | | 189,014 | 39,602,213 |
| Okta, Inc. (a) | | 2,587,535 | 184,465,370 |
| Shopify, Inc. Class A (a)(e) | | 944,500 | 38,856,730 |
| Snowflake, Inc. (a) | | 291,590 | 45,015,664 |
| Twilio, Inc. Class A (a) | | 740,765 | 49,786,816 |
| | | | 357,726,793 |
| IT Consulting & Other Services - 0.1% | | | |
| Thoughtworks Holding, Inc. (a)(e) | | 1,329,904 | 9,788,093 |
TOTAL IT SERVICES | | | 1,031,726,129 |
| Life Sciences Tools & Services - 0.0% | | | |
| Life Sciences Tools & Services - 0.0% | | | |
| Eden Biologics, Inc. (a)(c) | | 1,015,442 | 0 |
| Pharmaceuticals - 0.0% | | | |
| Pharmaceuticals - 0.0% | | | |
| Chime Biologics Wuhan Co. Ltd. (a)(c) | | 1,015,442 | 528,873 |
| Semiconductors & Semiconductor Equipment - 28.3% | | | |
| Semiconductor Equipment - 2.2% | | | |
| ASML Holding NV (Netherlands) | | 104,750 | 64,563,352 |
| Teradyne, Inc. | | 1,244,228 | 125,841,220 |
| | | | 190,404,572 |
| Semiconductors - 26.1% | | | |
| GlobalFoundries, Inc. (a)(e) | | 3,434,107 | 224,384,551 |
| Marvell Technology, Inc. | | 8,421,514 | 380,231,357 |
| Microchip Technology, Inc. | | 1,126,240 | 91,259,227 |
| NVIDIA Corp. | | 3,193,657 | 741,439,409 |
| NXP Semiconductors NV | | 2,053,522 | 366,512,607 |
| onsemi (a) | | 3,814,447 | 295,276,342 |
| Renesas Electronics Corp. (a) | | 1 | 13 |
| Taiwan Semiconductor Manufacturing Co. Ltd. | | 9,441,488 | 154,824,502 |
| | | | 2,253,928,008 |
TOTAL SEMICONDUCTORS & SEMICONDUCTOR EQUIPMENT | | | 2,444,332,580 |
| Software - 28.9% | | | |
| Application Software - 9.9% | | | |
| Algolia, Inc. (a)(b)(c) | | 153,503 | 2,724,678 |
| Bill Holdings, Inc. (a) | | 566,500 | 47,942,895 |
| CCC Intelligent Solutions Holdings, Inc. (a)(b) | | 102,045 | 913,303 |
| Cvent Holding Corp. (a)(b) | | 1,099,667 | 7,983,582 |
| Dynatrace, Inc. (a) | | 1,209,000 | 51,418,770 |
| HubSpot, Inc. (a)(e) | | 181,476 | 70,205,805 |
| Intuit, Inc. | | 399,013 | 162,470,113 |
| Nutanix, Inc. Class B (a)(d) | | 72,872 | 2,058,634 |
| Otonomo Technologies Ltd. (a) | | 1,048,000 | 597,360 |
| Paycom Software, Inc. (a) | | 225,700 | 65,240,842 |
| Salesforce.com, Inc. (a) | | 1,489,452 | 243,689,242 |
| Splunk, Inc. (a) | | 1,894,900 | 194,227,250 |
| Stripe, Inc. Class B (a)(b)(c) | | 38,600 | 836,462 |
| Zoom Video Communications, Inc. Class A (a) | | 50,928 | 3,798,720 |
| | | | 854,107,656 |
| Systems Software - 19.0% | | | |
| Microsoft Corp. | | 5,344,986 | 1,333,146,408 |
| Palo Alto Networks, Inc. (a)(e) | | 342,900 | 64,592,073 |
| ServiceNow, Inc. (a) | | 448,100 | 193,655,377 |
| Tenable Holdings, Inc. (a) | | 1,161,072 | 51,354,215 |
| | | | 1,642,748,073 |
TOTAL SOFTWARE | | | 2,496,855,729 |
| Technology Hardware, Storage & Peripherals - 19.4% | | | |
| Technology Hardware, Storage & Peripherals - 19.4% | | | |
| Apple, Inc. | | 11,352,450 | 1,673,464,655 |
| IonQ, Inc. (a)(b) | | 8,400 | 39,816 |
| | | | 1,673,504,471 |
| TOTAL COMMON STOCKS (Cost $6,417,296,934) | | | 8,436,945,466 |
| | | | |
| Preferred Stocks - 1.2% |
| | | Shares | Value ($) |
| Convertible Preferred Stocks - 1.1% | | | |
| Aerospace & Defense - 0.1% | | | |
| Aerospace & Defense - 0.1% | | | |
| ABL Space Systems: | | | |
| Series B(a)(b)(c) | | 98,000 | 3,607,380 |
| Series B2(a)(b)(c) | | 74,989 | 2,723,600 |
| | | | 6,330,980 |
| Communications Equipment - 0.1% | | | |
| Communications Equipment - 0.1% | | | |
| Astranis Space Technologies Corp. Series C (a)(b)(c) | | 605,440 | 9,911,053 |
| | | | |
| Construction & Engineering - 0.0% | | | |
| Construction & Engineering - 0.0% | | | |
| Beta Technologies, Inc. Series A (a)(b)(c) | | 72,591 | 5,525,627 |
| | | | |
| Hotels, Restaurants & Leisure - 0.0% | | | |
| Casinos & Gaming - 0.0% | | | |
| Discord, Inc. Series I (a)(b)(c) | | 1,300 | 438,555 |
| | | | |
| Interactive Media & Services - 0.3% | | | |
| Interactive Media & Services - 0.3% | | | |
| ByteDance Ltd. Series E1 (a)(b)(c) | | 70,707 | 14,055,137 |
| Reddit, Inc.: | | | |
| Series D(a)(b)(c) | | 250,861 | 9,557,804 |
| Series E(a)(b)(c) | | 14,400 | 548,640 |
| | | | 24,161,581 |
| Semiconductors & Semiconductor Equipment - 0.3% | | | |
| Semiconductor Equipment - 0.2% | | | |
| Astera Labs, Inc.: | | | |
| Series A(b)(c) | | 351,532 | 3,125,119 |
| Series B(b)(c) | | 59,853 | 532,093 |
| Series C(a)(b)(c) | | 344,200 | 3,059,938 |
| Series D(b)(c) | | 1,443,456 | 12,832,324 |
| | | | 19,549,474 |
| Semiconductors - 0.1% | | | |
| GaN Systems, Inc.: | | | |
| Series F1(a)(b)(c) | | 133,634 | 1,502,046 |
| Series F2(a)(b)(c) | | 70,564 | 793,139 |
| Xsight Labs Ltd. Series D (a)(b)(c) | | 281,500 | 2,046,505 |
| | | | 4,341,690 |
TOTAL SEMICONDUCTORS & SEMICONDUCTOR EQUIPMENT | | | 23,891,164 |
| | | | |
| Software - 0.3% | | | |
| Application Software - 0.3% | | | |
| Algolia, Inc. Series D (a)(b)(c) | | 109,867 | 1,950,139 |
| Bolt Technology OU Series E (a)(b)(c) | | 40,842 | 5,109,528 |
| Convoy, Inc. Series D (a)(b)(c) | | 203,844 | 1,463,600 |
| Databricks, Inc.: | | | |
| Series G(a)(b)(c) | | 45,012 | 2,392,388 |
| Series H(a)(b)(c) | | 174,018 | 9,249,057 |
| Skyryse, Inc. Series B (a)(b)(c) | | 121,800 | 2,448,180 |
| Stripe, Inc. Series H (a)(b)(c) | | 17,100 | 370,557 |
| | | | 22,983,449 |
| TOTAL CONVERTIBLE PREFERRED STOCKS | | | 93,242,409 |
| Nonconvertible Preferred Stocks - 0.1% | | | |
| IT Services - 0.1% | | | |
| Data Processing & Outsourced Services - 0.1% | | | |
| Checkr, Inc. Series E (a)(c) | | 711,000 | 9,335,430 |
| | | | |
| Internet Services & Infrastructure - 0.0% | | | |
| Gupshup, Inc. (a)(b)(c) | | 257,284 | 4,263,196 |
| | | | |
TOTAL IT SERVICES | | | 13,598,626 |
| | | | |
| TOTAL PREFERRED STOCKS (Cost $121,026,281) | | | 106,841,035 |
| | | | |
| Preferred Securities - 0.1% |
| | | Principal Amount (f) | Value ($) |
| Semiconductors & Semiconductor Equipment - 0.1% | | | |
| Semiconductors - 0.1% | | | |
GaN Systems, Inc. 0% (b)(c)(g) (Cost $3,132,190) | | 3,132,190 | 3,893,312 |
| | | | |
| Money Market Funds - 3.4% |
| | | Shares | Value ($) |
| Fidelity Cash Central Fund 4.63% (h) | | 107,643,928 | 107,665,457 |
| Fidelity Securities Lending Cash Central Fund 4.63% (h)(i) | | 184,951,697 | 184,970,192 |
| TOTAL MONEY MARKET FUNDS (Cost $292,635,649) | | | 292,635,649 |
| | | | |
| TOTAL INVESTMENT IN SECURITIES - 102.4% (Cost $6,834,091,054) | 8,840,315,462 |
NET OTHER ASSETS (LIABILITIES) - (2.4)% | (204,169,127) |
| NET ASSETS - 100.0% | 8,636,146,335 |
| | |
Legend
| (b) | Restricted securities (including private placements) - Investment in securities not registered under the Securities Act of 1933 (excluding 144A issues). At the end of the period, the value of restricted securities (excluding 144A issues) amounted to $136,983,179 or 1.6% of net assets. |
| (d) | Security exempt from registration under Rule 144A of the Securities Act of 1933. These securities may be resold in transactions exempt from registration, normally to qualified institutional buyers. At the end of the period, the value of these securities amounted to $8,278,748 or 0.1% of net assets. |
| (e) | Security or a portion of the security is on loan at period end. |
| (f) | Amount is stated in United States dollars unless otherwise noted. |
| (g) | Security is perpetual in nature with no stated maturity date. |
| (h) | Affiliated fund that is generally available only to investment companies and other accounts managed by Fidelity Investments. The rate quoted is the annualized seven-day yield of the fund at period end. A complete unaudited listing of the fund's holdings as of its most recent quarter end is available upon request. In addition, each Fidelity Central Fund's financial statements, which are not covered by the Fund's Report of Independent Registered Public Accounting Firm, are available on the SEC's website or upon request. |
| (i) | Investment made with cash collateral received from securities on loan. |
| Additional information on each restricted holding is as follows: |
| Security | Acquisition Date | Acquisition Cost ($) |
| ABL Space Systems Series B | 3/24/21 | 4,413,489 |
| | | |
| ABL Space Systems Series B2 | 10/22/21 | 5,098,960 |
| | | |
| Algolia, Inc. | 10/27/21 | 4,489,203 |
| | | |
| Algolia, Inc. Series D | 7/23/21 | 3,213,066 |
| | | |
| Ant International Co. Ltd. Class C | 5/16/18 | 24,495,442 |
| | | |
| Astera Labs, Inc. Series A | 5/17/22 | 3,574,905 |
| | | |
| Astera Labs, Inc. Series B | 5/17/22 | 608,675 |
| | | |
| Astera Labs, Inc. Series C | 8/24/21 | 1,157,132 |
| | | |
| Astera Labs, Inc. Series D | 5/17/22 - 5/27/22 | 14,679,226 |
| | | |
| Astranis Space Technologies Corp. Series C | 3/19/21 | 13,271,808 |
| | | |
| Beta Technologies, Inc. Series A | 4/09/21 | 5,318,743 |
| | | |
| Bolt Technology OU Series E | 1/03/22 | 10,610,609 |
| | | |
| ByteDance Ltd. Series E1 | 11/18/20 | 7,747,662 |
| | | |
| Cazoo Group Ltd. | 3/28/21 | 1,441,000 |
| | | |
| CCC Intelligent Solutions Holdings, Inc. | 2/02/21 | 1,020,450 |
| | | |
| Convoy, Inc. Series D | 10/30/19 | 2,760,048 |
| | | |
| Cvent Holding Corp. | 7/23/21 | 10,996,670 |
| | | |
| Databricks, Inc. Series G | 2/01/21 | 2,661,228 |
| | | |
| Databricks, Inc. Series H | 8/31/21 | 12,787,562 |
| | | |
| Discord, Inc. Series I | 9/15/21 | 715,812 |
| | | |
| Epic Games, Inc. | 3/29/21 | 15,856,545 |
| | | |
| GaN Systems, Inc. Series F1 | 11/30/21 | 1,133,216 |
| | | |
| GaN Systems, Inc. Series F2 | 11/30/21 | 598,383 |
| | | |
| GaN Systems, Inc. 0% | 11/30/21 | 3,132,190 |
| | | |
| Gupshup, Inc. | 6/08/21 | 5,882,850 |
| | | |
| IonQ, Inc. | 3/07/21 | 84,000 |
| | | |
| Reddit, Inc. Series D | 2/04/19 | 5,440,247 |
| | | |
| Reddit, Inc. Series E | 5/18/21 | 611,628 |
| | | |
| Skyryse, Inc. Series B | 10/21/21 | 3,006,020 |
| | | |
| Stripe, Inc. Class B | 5/18/21 | 1,548,955 |
| | | |
| Stripe, Inc. Series H | 3/15/21 | 686,138 |
| | | |
| Xsight Labs Ltd. Series D | 2/16/21 | 2,250,874 |
| | | |
Affiliated Central Funds
Fiscal year to date information regarding the Fund's investments in Fidelity Central Funds, including the ownership percentage, is presented below.
| Affiliate | Value, beginning of period ($) | Purchases ($) | Sales Proceeds ($) | Dividend Income ($) | Realized Gain (loss) ($) | Change in Unrealized appreciation (depreciation) ($) | Value, end of period ($) | % ownership, end of period |
| Fidelity Cash Central Fund 4.63% | 49,633,884 | 1,733,087,737 | 1,675,056,164 | 2,658,057 | - | - | 107,665,457 | 0.2% |
| Fidelity Securities Lending Cash Central Fund 4.63% | 122,541,953 | 1,423,893,857 | 1,361,465,618 | 2,582,296 | - | - | 184,970,192 | 0.6% |
| Total | 172,175,837 | 3,156,981,594 | 3,036,521,782 | 5,240,353 | - | - | 292,635,649 | |
| | | | | | | | | |
Amounts in the dividend income column in the above table include any capital gain distributions from underlying funds, which are presented in the corresponding line item in the Statement of Operations, if applicable.
Amount for Fidelity Securities Lending Cash Central Fund represents the income earned on investing cash collateral, less rebates paid to borrowers and any lending agent fees associated with the loan, plus any premium payments received for lending certain types of securities.
Amounts included in the purchases and sales proceeds columns may include in-kind transactions, if applicable.
Investment Valuation
The following is a summary of the inputs used, as of February 28, 2023, involving the Fund's assets and liabilities carried at fair value. The inputs or methodology used for valuing securities may not be an indication of the risk associated with investing in those securities. For more information on valuation inputs, and their aggregation into the levels used below, please refer to the Investment Valuation section in the accompanying Notes to Financial Statements.
| Valuation Inputs at Reporting Date: |
| Description | Total ($) | Level 1 ($) | Level 2 ($) | Level 3 ($) |
Investments in Securities: | | | | |
|
| Common Stocks | 8,436,945,466 | 8,190,397,376 | 219,387,867 | 27,160,223 |
|
| Preferred Stocks | 106,841,035 | - | - | 106,841,035 |
|
| Preferred Securities | 3,893,312 | - | - | 3,893,312 |
|
| Money Market Funds | 292,635,649 | 292,635,649 | - | - |
| Total Investments in Securities: | 8,840,315,462 | 8,483,033,025 | 219,387,867 | 137,894,570 |
| | | | | |
|
| Net Unrealized Depreciation on Unfunded Commitments | (1,200,024) | - | - | (1,200,024) |
| Total | (1,200,024) | - | - | (1,200,024) |
The following is a reconciliation of Investments in Securities for which Level 3 inputs were used in determining value:
| |
| Investments in Securities: | |
| Preferred Stocks | | | |
| Beginning Balance | $ | 124,004,300 | |
| Net Realized Gain (Loss) on Investment Securities | | - | |
| Net Unrealized Gain (Loss) on Investment Securities | | (36,026,071) | |
| Cost of Purchases | | 18,862,806 | |
| Proceeds of Sales | | - | |
| Amortization/Accretion | | - | |
| Transfers into Level 3 | | - | |
| Transfers out of Level 3 | | - | |
| Ending Balance | $ | 106,841,035 | |
| The change in unrealized gain (loss) for the period attributable to Level 3 securities held at February 28, 2023 | $ | (36,026,071) | |
| Other Investments in Securities | | | |
| Beginning Balance | $ | 39,422,488 | |
| Net Realized Gain (Loss) on Investment Securities | | - | |
| Net Unrealized Gain (Loss) on Investment Securities | | (3,866,629) | |
| Cost of Purchases | | - | |
| Proceeds of Sales | | - | |
| Amortization/Accretion | | - | |
| Transfers into Level 3 | | - | |
| Transfers out of Level 3 | | (4,502,324) | |
| Ending Balance | $ | 31,053,535 | |
| The change in unrealized gain (loss) for the period attributable to Level 3 securities held at February 28, 2023 | $ | (3,866,629) | |
| The information used in the above reconciliation represents fiscal year to date activity for any Investments in Securities identified as using Level 3 inputs at either the beginning or the end of the current fiscal period. Cost of purchases and proceeds of sales may include securities received and/or delivered through in-kind transactions. Transfers into Level 3 were attributable to a lack of observable market data resulting from decreases in market activity, decreases in liquidity, security restructurings or corporate actions. Transfers out of Level 3 were attributable to observable market data becoming available for those securities. Transfers in or out of Level 3 represent the beginning value of any Security or Instrument where a change in the pricing level occurred from the beginning to the end of the period. The cost of purchases and the proceeds of sales may include securities received or delivered through corporate actions or exchanges. Realized and unrealized gains (losses) disclosed in the reconciliation are included in Net Gain (Loss) on the Fund's Statement of Operations. | |
Technology Portfolio
| Statement of Assets and Liabilities |
| | | | February 28, 2023 |
| | | | | |
| Assets | | | | |
| Investment in securities, at value (including securities loaned of $180,803,355) - See accompanying schedule: | | | | |
Unaffiliated issuers (cost $6,541,455,405) | $ | 8,547,679,813 | | |
Fidelity Central Funds (cost $292,635,649) | | 292,635,649 | | |
| | | | | |
| | | | | |
| Total Investment in Securities (cost $6,834,091,054) | | | $ | 8,840,315,462 |
| Receivable for fund shares sold | | | | 4,409,228 |
| Dividends receivable | | | | 4,879,928 |
| Distributions receivable from Fidelity Central Funds | | | | 938,786 |
| Prepaid expenses | | | | 24,655 |
| Other receivables | | | | 342,599 |
Total assets | | | | 8,850,910,658 |
| Liabilities | | | | |
| Payable for investments purchased | $ | 17,209,602 | | |
| Unrealized depreciation on unfunded commitments | | 1,200,024 | | |
| Payable for fund shares redeemed | | 5,992,480 | | |
| Accrued management fee | | 3,881,009 | | |
| Other affiliated payables | | 1,152,024 | | |
| Other payables and accrued expenses | | 374,184 | | |
| Collateral on securities loaned | | 184,955,000 | | |
| Total Liabilities | | | | 214,764,323 |
| Net Assets | | | $ | 8,636,146,335 |
| Net Assets consist of: | | | | |
| Paid in capital | | | $ | 7,328,418,467 |
| Total accumulated earnings (loss) | | | | 1,307,727,868 |
| Net Assets | | | $ | 8,636,146,335 |
Net Asset Value , offering price and redemption price per share ($8,636,146,335 ÷ 421,999,945 shares) | | | $ | 20.46 |
| Statement of Operations |
| | | | Year ended February 28, 2023 |
| Investment Income | | | | |
| Dividends | | | $ | 57,756,235 |
| Income from Fidelity Central Funds (including $2,582,296 from security lending) | | | | 5,240,353 |
| Total Income | | | | 62,996,588 |
| Expenses | | | | |
| Management fee | $ | 46,203,979 | | |
| Transfer agent fees | | 13,443,610 | | |
| Accounting fees | | 1,143,740 | | |
| Custodian fees and expenses | | 96,152 | | |
| Independent trustees' fees and expenses | | 30,287 | | |
| Registration fees | | 67,039 | | |
| Audit | | 63,544 | | |
| Legal | | 27,413 | | |
| Interest | | 9,648 | | |
| Miscellaneous | | 53,572 | | |
| Total expenses before reductions | | 61,138,984 | | |
| Expense reductions | | (312,630) | | |
| Total expenses after reductions | | | | 60,826,354 |
| Net Investment income (loss) | | | | 2,170,234 |
| Realized and Unrealized Gain (Loss) | | | | |
| Net realized gain (loss) on: | | | | |
| Investment Securities: | | | | |
| Unaffiliated issuers (net of foreign taxes of $768,639) | | (393,835,641) | | |
| Foreign currency transactions | | (256,128) | | |
| Total net realized gain (loss) | | | | (394,091,769) |
| Change in net unrealized appreciation (depreciation) on: | | | | |
| Investment Securities: | | | | |
| Unaffiliated issuers (net of decrease in deferred foreign taxes of $423,278) | | (1,343,016,204) | | |
| Unfunded commitments | | (1,200,024) | | |
| Assets and liabilities in foreign currencies | | (17,683) | | |
| Total change in net unrealized appreciation (depreciation) | | | | (1,344,233,911) |
| Net gain (loss) | | | | (1,738,325,680) |
| Net increase (decrease) in net assets resulting from operations | | | $ | (1,736,155,446) |
| Statement of Changes in Net Assets |
| |
| | Year ended February 28, 2023 | | Year ended February 28, 2022 |
| Increase (Decrease) in Net Assets | | | | |
| Operations | | | | |
| Net investment income (loss) | $ | 2,170,234 | $ | (28,034,349) |
| Net realized gain (loss) | | (394,091,769) | | 942,930,071 |
| Change in net unrealized appreciation (depreciation) | | (1,344,233,911) | | (674,451,714) |
| Net increase (decrease) in net assets resulting from operations | | (1,736,155,446) | | 240,444,008 |
| Distributions to shareholders | | (310,416,447) | | (1,453,950,149) |
| Share transactions | | | | |
| Proceeds from sales of shares | | 1,126,004,874 | | 2,156,919,710 |
| Reinvestment of distributions | | 291,925,397 | | 1,378,760,437 |
| Cost of shares redeemed | | (1,789,000,437) | | (3,254,727,729) |
Net increase (decrease) in net assets resulting from share transactions | | (371,070,166) | | 280,952,418 |
| Total increase (decrease) in net assets | | (2,417,642,059) | | (932,553,723) |
| | | | | |
| Net Assets | | | | |
| Beginning of period | | 11,053,788,394 | | 11,986,342,117 |
| End of period | $ | 8,636,146,335 | $ | 11,053,788,394 |
| | | | | |
| Other Information | | | | |
| Shares | | | | |
| Sold | | 54,722,947 | | 76,869,741 |
| Issued in reinvestment of distributions | | 12,438,232 | | 49,764,669 |
| Redeemed | | (88,698,413) | | (118,513,597) |
| Net increase (decrease) | | (21,537,234) | | 8,120,813 |
| | | | | |
Financial Highlights
| Years ended February 28, | | 2023 | | 2022 | | 2021 | | 2020 A | | 2019 B |
Selected Per-Share Data | | | | | | | | | | |
| Net asset value, beginning of period | $ | 24.92 | $ | 27.53 | $ | 19.65 | $ | 15.45 | $ | 19.36 |
| Income from Investment Operations | | | | | | | | | | |
Net investment income (loss) C,D | | .01 | | (.06) | | (.03) | | .05 | | .06 |
| Net realized and unrealized gain (loss) | | (3.76) | | .83 | | 12.98 | | 4.52 | | (.78) |
| Total from investment operations | | (3.75) | | .77 | | 12.95 | | 4.57 | | (.72) |
| Distributions from net investment income | | - | | - | | (.03) | | (.05) | | (.02) |
| Distributions from net realized gain | | (.71) | | (3.38) | | (5.04) | | (.32) | | (3.17) |
| Total distributions | | (.71) | | (3.38) | | (5.07) | | (.37) | | (3.19) |
| Net asset value, end of period | $ | 20.46 | $ | 24.92 | $ | 27.53 | $ | 19.65 | $ | 15.45 |
Total Return E | | (15.43)% | | 1.91% | | 69.87% | | 29.57% | | (3.03)% |
Ratios to Average Net Assets D,F,G | | | | | | | | | | |
| Expenses before reductions | | .70% | | .67% | | .69% | | .71% | | .72% |
| Expenses net of fee waivers, if any | | .69% | | .67% | | .69% | | .71% | | .72% |
| Expenses net of all reductions | | .69% | | .67% | | .68% | | .71% | | .71% |
| Net investment income (loss) | | .02% | | (.23)% | | (.13)% | | .30% | | .34% |
| Supplemental Data | | | | | | | | | | |
| Net assets, end of period (000 omitted) | $ | 8,636,146 | $ | 11,053,788 | $ | 11,986,342 | $ | 6,558,578 | $ | 5,124,121 |
Portfolio turnover rate H | | 24% | | 87% | | 107% | | 32% I | | 126% I |
A For the year ended February 29.
B Per share amounts have been adjusted to reflect the impact of the 10 for 1 share split that occurred on August 10, 2018.
C Calculated based on average shares outstanding during the period.
D Net investment income (loss) is affected by the timing of the declaration of dividends by any underlying mutual funds or exchange-traded funds (ETFs). Net investment income (loss) of any mutual funds or ETFs is not included in the Fund's net investment income (loss) ratio.
E Total returns would have been lower if certain expenses had not been reduced during the applicable periods shown.
F Fees and expenses of any underlying mutual funds or exchange-traded funds (ETFs) are not included in the Fund's expense ratio. The Fund indirectly bears its proportionate share of these expenses. For additional expense information related to investments in Fidelity Central Funds, please refer to the "Investments in Fidelity Central Funds" note found in the Notes to Financial Statements section of the most recent Annual or Semi-Annual report.
G Expense ratios reflect operating expenses of the class. Expenses before reductions do not reflect amounts reimbursed, waived, or reduced through arrangements with the investment adviser, brokerage services, or other offset arrangements, if applicable, and do not represent the amount paid by the class during periods when reimbursements, waivers or reductions occur.
H Amount does not include the portfolio activity of any underlying mutual funds or exchange-traded funds (ETFs).
I Portfolio turnover rate excludes securities received or delivered in-kind.
For the period ended February 28, 2023
1 . Organization.
IT Services Portfolio, Semiconductors Portfolio, Software and IT Services Portfolio, Tech Hardware Portfolio and Technology Portfolio (the Funds) are non-diversified funds of Fidelity Select Portfolios (the Trust). The Trust is registered under the Investment Company Act of 1940, as amended (the 1940 Act), as an open-end management investment company organized as a Massachusetts business trust. The Funds invest primarily in securities of companies whose principal business activities fall within specific industries. Each Fund is authorized to issue an unlimited number of shares. Share transactions on the Statement of Changes in Net Assets may contain exchanges between affiliated funds. Certain Funds' investments in emerging markets can be subject to social, economic, regulatory, and political uncertainties and can be extremely volatile.
In January 2023 the Board of Trustees approved a change in the name of IT Services Portfolio to Enterprise Technology Services Portfolio effective June 1, 2023.
2. Investments in Fidelity Central Funds.
Funds may invest in Fidelity Central Funds, which are open-end investment companies generally available only to other investment companies and accounts managed by the investment adviser and its affiliates. The Schedule of Investments lists any Fidelity Central Funds held as an investment as of period end, but does not include the underlying holdings of each Fidelity Central Fund. An investing fund indirectly bears its proportionate share of the expenses of the underlying Fidelity Central Funds.
Based on its investment objective, each Fidelity Central Fund may invest or participate in various investment vehicles or strategies that are similar to those of the investing fund. These strategies are consistent with the investment objectives of the investing fund and may involve certain economic risks which may cause a decline in value of each of the Fidelity Central Funds and thus a decline in the value of the investing fund.
| Fidelity Central Fund | Investment Manager | Investment Objective | Investment Practices | Expense Ratio A |
| Fidelity Money Market Central Funds | Fidelity Management & Research Company LLC (FMR) | Each fund seeks to obtain a high level of current income consistent with the preservation of capital and liquidity. | Short-term Investments | Less than .005% |
A Expenses expressed as a percentage of average net assets and are as of each underlying Central Fund's most recent annual or semi-annual shareholder report.
A complete unaudited list of holdings for each Fidelity Central Fund is available upon request or at the Securities and Exchange Commission website at www.sec.gov. In addition, the financial statements of the Fidelity Central Funds which contain the significant accounting policies (including investment valuation policies) of those funds, and are not covered by the Report of Independent Registered Public Accounting Firm, are available on the Securities and Exchange Commission website or upon request.
3. Significant Accounting Policies.
Each Fund is an investment company and applies the accounting and reporting guidance of the Financial Accounting Standards Board (FASB) Accounting Standards Codification Topic 946 Financial Services - Investment Companies . The financial statements have been prepared in conformity with accounting principles generally accepted in the United States of America (GAAP), which require management to make certain estimates and assumptions at the date of the financial statements. Actual results could differ from those estimates. Subsequent events, if any, through the date that the financial statements were issued have been evaluated in the preparation of the financial statements. Each Fund's Schedule of Investments lists any underlying mutual funds or exchange-traded funds (ETFs) but does not include the underlying holdings of these funds. The following summarizes the significant accounting policies of each Fund:
Investment Valuation. Investments are valued as of 4:00 p.m. Eastern time on the last calendar day of the period. The Board of Trustees (the Board) has designated each Fund's investment adviser as the valuation designee responsible for the fair valuation function and performing fair value determinations as needed. The investment adviser has established a Fair Value Committee (the Committee) to carry out the day-to-day fair valuation responsibilities and has adopted policies and procedures to govern the fair valuation process and the activities of the Committee. In accordance with these fair valuation policies and procedures, which have been approved by the Board, each Fund attempts to obtain prices from one or more third party pricing services or brokers to value its investments. When current market prices, quotations or currency exchange rates are not readily available or reliable, investments will be fair valued in good faith by the Committee, in accordance with the policies and procedures. Factors used in determining fair value vary by investment type and may include market or investment specific events, transaction data, estimated cash flows, and market observations of comparable investments. The frequency that the fair valuation procedures are used cannot be predicted and they may be utilized to a significant extent. The Committee manages each Fund's fair valuation practices and maintains the fair valuation policies and procedures. Each Fund's investment adviser reports to the Board information regarding the fair valuation process and related material matters.
Each Fund categorizes the inputs to valuation techniques used to value its investments into a disclosure hierarchy consisting of three levels as shown below:
Level 1 - unadjusted quoted prices in active markets for identical investments
Level 2 - other significant observable inputs (including quoted prices for similar investments, interest rates, prepayment speeds, etc.)
Level 3 - unobservable inputs (including the Fund's own assumptions based on the best information available)
Valuation techniques used to value each Fund's investments by major category are as follows:
Equity securities, including restricted securities, for which market quotations are readily available, are valued at the last reported sale price or official closing price as reported by a third party pricing service on the primary market or exchange on which they are traded and are categorized as Level 1 in the hierarchy. In the event there were no sales during the day or closing prices are not available, securities are valued at the last quoted bid price or may be valued using the last available price and are generally categorized as Level 2 in the hierarchy. For foreign equity securities, when market or security specific events arise, comparisons to the valuation of American Depositary Receipts (ADRs), futures contracts, ETFs and certain indexes as well as quoted prices for similar securities may be used and would be categorized as Level 2 in the hierarchy. For equity securities, including restricted securities, where observable inputs are limited, assumptions about market activity and risk are used and these securities may be categorized as Level 3 in the hierarchy. Securities, including private placements or other restricted securities, for which observable inputs are not available are valued using alternate valuation approaches, including the market approach, the income approach and cost approach, and are categorized as Level 3 in the hierarchy. The market approach considers factors including the price of recent investments in the same or a similar security or financial metrics of comparable securities. The income approach considers factors including expected future cash flows, security specific risks and corresponding discount rates. The cost approach considers factors including the value of the security's underlying assets and liabilities.
Debt securities, including restricted securities, are valued based on evaluated prices received from third party pricing services or from brokers who make markets in such securities. Preferred securities are valued by pricing services who utilize matrix pricing which considers yield or price of bonds of comparable quality, coupon, maturity and type or by broker-supplied prices. When independent prices are unavailable or unreliable, debt securities may be valued utilizing pricing methodologies which consider similar factors that would be used by third party pricing services. Debt securities are generally categorized as Level 2 in the hierarchy but may be Level 3 depending on the circumstances.
Investments in open-end mutual funds, including the Fidelity Central Funds, are valued at their closing net asset value (NAV) each business day and are categorized as Level 1 in the hierarchy.
The following provides information on Level 3 securities held by the Fund that were valued at period end based on unobservable inputs. These amounts exclude valuations provided by a broker.
Technology Portfolio:
| Asset Type | Fair Value | Valuation Techniques | Unobservable Input | Amount or Range / Weighted Average | Impact to Valuation from an Increase in Input* |
| Equities | $ 134,001,258 | Market comparable | Enterprise value/Revenue multiple (EV/R) | 2.0 - 27.0 / 7.8 | Increase |
| | | | Probability rate | 10.0% - 90.0% / 50.0% | Increase |
| | | Recovery value | Recovery value | $0.00 | Increase |
| | | Market approach | Transaction price | $8.00 | Increase |
| | | | Discount rate | 10.0% - 75.0% / 23.3% | Decrease |
| | | Book value | Book value multiple | 1.5 | Increase |
| | | Black scholes | Discount rate | 4.4% - 5.1% / 4.4% | Increase |
| | | | Volatility | 50.0% - 70.0% / 59.1% | Increase |
| | | | Term | 3.0 | Increase |
| Preferred Securities | $ 3,893,312 | Market comparable | Enterprise value/Revenue multiple (EV/R) | 4.8 | Increase |
| | | | Probability rate | 10.0% - 90.0% / 50.0% | Increase |
| | | Discounted cash flow | Discount rate | 20.0% | Decrease |
| | | | | | |
| | | | | | |
A Represents the directional change in the fair value of the Level 3 investments that could have resulted from an increase in the corresponding input as of period end. A decrease to the unobservable input would have had the opposite effect. Significant changes in these inputs may have resulted in a significantly higher or lower fair value measurement at period end.
Changes in valuation techniques may result in transfers in or out of an assigned level within the disclosure hierarchy. The aggregate value of investments by input level as of February 28, 2023, as well as a roll forward of Level 3 investments, is included at the end of each Fund's Schedule of Investments.
Foreign Currency. Certain Funds may use foreign currency contracts to facilitate transactions in foreign-denominated securities. Gains and losses from these transactions may arise from changes in the value of the foreign currency or if the counterparties do not perform under the contracts' terms.
Foreign-denominated assets, including investment securities, and liabilities are translated into U.S. dollars at the exchange rates at period end. Purchases and sales of investment securities, income and dividends received, and expenses denominated in foreign currencies are translated into U.S. dollars at the exchange rate in effect on the transaction date.
The effects of exchange rate fluctuations on investments are included with the net realized and unrealized gain (loss) on investment securities. Other foreign currency transactions resulting in realized and unrealized gain (loss) are disclosed separately.
Investment Transactions and Income. For financial reporting purposes, the Funds' investment holdings and NAV include trades executed through the end of the last business day of the period. The NAV per share for processing shareholder transactions is calculated as of the close of business of the New York Stock Exchange (NYSE), normally 4:00 p.m. Eastern time and includes trades executed through the end of the prior business day. Gains and losses on securities sold are determined on the basis of identified cost and for certain Funds include proceeds received from litigation. Commissions paid to certain brokers with whom the investment adviser, or its affiliates, places trades on behalf of a fund include an amount in addition to trade execution, which may be rebated back to a fund. Any such rebates are included in net realized gain (loss) on investments in the Statement of Operations. Dividend income is recorded on the ex-dividend date, except for certain dividends from foreign securities where the ex-dividend date may have passed, which are recorded as soon as the Funds are informed of the ex-dividend date. Non-cash dividends included in dividend income, if any, are recorded at the fair market value of the securities received. Income and capital gain distributions from Fidelity Central Funds, if any, are recorded on the ex-dividend date. Certain distributions received by the Funds represent a return of capital or capital gain. The Funds determine the components of these distributions subsequent to the ex-dividend date, based upon receipt of tax filings or other correspondence relating to the underlying investment. These distributions are recorded as a reduction of cost of investments and/or as a realized gain. A non-recurring dividend with a payable date of February 28, 2023 and an ex-date of March 1, 2023 is presented in the Statement of Assets and Liabilities as "Deferred dividend income". Investment income is recorded net of foreign taxes withheld where recovery of such taxes is uncertain. Funds may file withholding tax reclaims in certain jurisdictions to recover a portion of amounts previously withheld. Any withholding tax reclaims income is included in the Statement of Operations in dividends. Any receivables for withholding tax reclaims are included in the Statement of Assets and Liabilities in dividends receivable.
Expenses. Expenses directly attributable to a fund are charged to that fund. Expenses attributable to more than one fund are allocated among the respective funds on the basis of relative net assets or other appropriate methods. Expenses included in the accompanying financial statements reflect the expenses of that fund and do not include any expenses associated with any underlying mutual funds or exchange-traded funds. Although not included in a fund's expenses, a fund indirectly bears its proportionate share of these expenses through the net asset value of each underlying mutual fund or exchange-traded fund. Expense estimates are accrued in the period to which they relate and adjustments are made when actual amounts are known.
Deferred Trustee Compensation. Under a Deferred Compensation Plan (the Plan) for certain Funds, certain independent Trustees have elected to defer receipt of a portion of their annual compensation. Deferred amounts are invested in affiliated mutual funds, are marked-to-market and remain in a fund until distributed in accordance with the Plan. The investment of deferred amounts and the offsetting payable to the Trustees presented below are included in the accompanying Statement of Assets and Liabilities in other receivables and other payables and accrued expenses, as applicable.
| Semiconductors Portfolio | $196,560 |
| Software and IT Services Portfolio | 339,198 |
| Tech Hardware Portfolio | 55,276 |
| Technology Portfolio | 321,941 |
| | |
Income Tax Information and Distributions to Shareholders. Each year, each Fund intends to qualify as a regulated investment company under Subchapter M of the Internal Revenue Code, including distributing substantially all of its taxable income and realized gains. As a result, no provision for U.S. Federal income taxes is required. As of February 28, 2023, each Fund did not have any unrecognized tax benefits in the financial statements; nor is each Fund aware of any tax positions for which it is reasonably possible that the total amounts of unrecognized tax benefits will significantly change in the next twelve months. Each Fund files a U.S. federal tax return, in addition to state and local tax returns as required. Each Fund's federal income tax returns are subject to examination by the Internal Revenue Service (IRS) for a period of three fiscal years after they are filed. State and local tax returns may be subject to examination for an additional fiscal year depending on the jurisdiction. Foreign taxes are provided for based on each Fund's understanding of the tax rules and rates that exist in the foreign markets in which it invests.
Distributions are declared and recorded on the ex-dividend date. Income and capital gain distributions are determined in accordance with income tax regulations, which may differ from GAAP. In addition, certain Funds claimed a portion of the payment made to redeeming shareholders as a distribution for income tax purposes.
Capital accounts within the financial statements are adjusted for permanent book-tax differences. These adjustments have no impact on net assets or the results of operations. Capital accounts are not adjusted for temporary book-tax differences which will reverse in a subsequent period.
Book-tax differences are primarily due to foreign currency transactions, certain foreign taxes, passive foreign investment companies (PFIC), deferred Trustee compensation, net operating losses, capital loss carryforwards and losses deferred due to wash sales and excise tax regulations.
As of period end, the cost and unrealized appreciation (depreciation) in securities, and derivatives if applicable, for federal income tax purposes were as follows for each Fund:
| | Tax cost | Gross unrealized appreciation | Gross unrealized depreciation | Net unrealized appreciation (depreciation) |
| IT Services Portfolio | $1,738,302,243 | $973,338,499 | $(85,038,054) | $888,300,445 |
| Semiconductors Portfolio | 4,849,603,565 | 3,089,541,700 | (286,392,325) | 2,803,149,375 |
| Software and IT Services Portfolio | 5,008,527,304 | 4,366,734,373 | (723,310,069) | 3,643,424,304 |
| Tech Hardware Portfolio | 559,924,495 | 198,184,592 | (40,136,464) | 158,048,128 |
| Technology Portfolio | 6,846,325,356 | 2,946,928,650 | (954,138,568) | 1,992,790,082 |
The tax-based components of distributable earnings as of period end were as follows for each Fund:
| | Undistributed ordinary income | Undistributed long-term capital gain | Capital loss carryforward | Net unrealized appreciation (depreciation) on securities and other investments |
| IT Services Portfolio | $75,637 | $- | $(3,381,994) | $888,289,073 |
| Semiconductors Portfolio | - | 18,819,797 | - | 2,803,148,951 |
| Software and IT Services Portfolio | - | 8,753,117 | - | 3,643,320,946 |
| Tech Hardware Portfolio | 46,604 | - | (32,807,843) | 157,882,936 |
| Technology Portfolio | 457,501 | - | (685,498,878) | 1,992,769,245 |
Capital loss carryforwards are only available to offset future capital gains of the Funds to the extent provided by regulations and may be limited. The capital loss carryforward information presented below, including any applicable limitation, is estimated as of fiscal period end and is subject to adjustment.
| | Short-term | Long-term | Total capital loss carryforward |
| IT Services Portfolio | $ (3,381,994) | $- | $(3,381,994) |
| Tech Hardware Portfolio | (32,807,843) | - | (32,807,843) |
| Technology Portfolio | (685,498,878) | - | (685,498,878) |
Certain of the Funds intends to elect to defer to the next fiscal year ordinary losses recognized during the period January 1, 2023 to February 28, 2023. Loss deferrals were as follows:
| | Ordinary losses |
| Semiconductors Portfolio | $ (1,191,014) |
The tax character of distributions paid was as follows:
| February 28, 2023 | | | |
| | Ordinary Income | Long-term Capital Gains | Total |
| IT Services Portfolio | $469,696 | $302,093,148 | $302,562,844 |
| Semiconductors Portfolio | 10,523,254 | 391,193,651 | 401,716,905 |
| Software and IT Services Portfolio | - | 738,727,367 | 738,727,367 |
| Tech Hardware Portfolio | 20,911,542 | 92,391,698 | 113,303,240 |
| Technology Portfolio | - | 310,416,447 | 310,416,447 |
| February 28, 2022 | | | |
| | Ordinary Income | Long-term Capital Gains | Total |
| IT Services Portfolio | $89,426,516 | $439,120,500 | $528,547,016 |
| Semiconductors Portfolio | 136,166,549 | 477,772,748 | 613,939,297 |
| Software and IT Services Portfolio | 148,809,597 | 683,045,141 | 831,854,738 |
| Tech Hardware Portfolio | 37,057,085 | 94,854,328 | 131,911,413 |
| Technology Portfolio | 859,319,443 | 594,630,706 | 1,453,950,149 |
Restricted Securities (including Private Placements). Funds may invest in securities that are subject to legal or contractual restrictions on resale. These securities generally may be resold in transactions exempt from registration or to the public if the securities are registered. Disposal of these securities may involve time-consuming negotiations and expense, and prompt sale at an acceptable price may be difficult. Information regarding restricted securities held at period end is included at the end of the Schedule of Investments, if applicable.
Commitments. A commitment is an agreement to acquire an investment at a future date (subject to conditions) in connection with a potential public or non-public offering. Commitments outstanding at period end are presented in the table below. Unrealized appreciation (depreciation) on any commitments outstanding at period end is separately presented in the Statements of Assets and Liabilities as Unrealized appreciation (depreciation) on unfunded commitments, and any change in unrealized appreciation (depreciation) on unfunded commitments during the period is separately presented in the Statement of Operations, as applicable based on contractual conditions of each commitment.
| | Investment to be Acquired | Commitment Amount | Unrealized Appreciation (Depreciation) |
| Technology Portfolio | Stripe, Inc. | $5,314,677 | $(1,200,024) |
| | | | |
New Accounting Pronouncement. In June 2022, the Financial Accounting Standards Board (FASB) issued Accounting Standards Update (ASU) 2022-03 Fair Value Measurement (Topic 820): Fair Value Measurement of Equity Securities Subject to Contractual Sale Restrictions. The amendments in this ASU clarify that a contractual restriction on the sale of an equity security is not considered part of the unit of account of the equity security and, therefore, is not considered in measuring fair value. They also clarify that an entity cannot, as a separate unit of account, recognize and measure a contractual sale restriction. They also require additional disclosures for equity securities subject to contractual sale restrictions. ASU 2022-03 will be effective for fiscal years, including interim periods within those fiscal years, beginning after December 15, 2023, and allows for early adoption. ASU 2022-03 will only be applicable to an equity security in which the contractual arrangement that restricts its sale is executed or modified on or after the adoption date. Management is currently evaluating the potential impact of ASU 2022-03 to the financial statements.
4. Purchases and Sales of Investments.
Purchases and sales of securities, other than short-term and in-kind transactions, as applicable, are noted in the table below.
| | Purchases ($) | Sales ($) |
| IT Services Portfolio | 983,282,408 | 1,437,682,922 |
| Semiconductors Portfolio | 2,381,302,565 | 2,927,312,423 |
| Software and IT Services Portfolio | 341,353,392 | 1,132,149,141 |
| Tech Hardware Portfolio | 223,681,637 | 287,440,407 |
| Technology Portfolio | 2,115,636,482 | 2,859,365,864 |
5. Fees and Other Transactions with Affiliates.
Management Fee. Fidelity Management & Research Company LLC (the investment adviser) and its affiliates provide the Funds with investment management related services for which the Funds pay a monthly management fee. The management fee is the sum of an individual fund fee rate and an annualized group fee rate. The individual fund fee rate is applied to each Fund's average net assets. The group fee rate is based upon the monthly average net assets of a group of registered investment companies with which the investment adviser has management contracts. The group fee rate decreases as assets under management increase and increases as assets under management decrease. For the reporting period, each Fund's annual management fee rate expressed as a percentage of each Fund's average net assets was as follows:
| | Individual Rate | Group Rate | Total |
| IT Services Portfolio | .30% | .23% | .53% |
| Semiconductors Portfolio | .30% | .23% | .53% |
| Software and IT Services Portfolio | .30% | .23% | .53% |
| Tech Hardware Portfolio | .30% | .23% | .53% |
| Technology Portfolio | .30% | .23% | .53% |
Transfer Agent Fees. Fidelity Investments Institutional Operations Company LLC (FIIOC), an affiliate of the investment adviser, is the Funds' transfer, dividend disbursing and shareholder servicing agent. FIIOC receives account fees and asset-based fees that vary according to account size and type of account. FIIOC pays for typesetting, printing and mailing of shareholder reports, except proxy statements. For the period, transfer agent fees were equivalent to the following annual rates expressed as a percentage of average net assets:
| IT Services Portfolio | .17% |
| Semiconductors Portfolio | .15% |
| Software and IT Services Portfolio | .15% |
| Tech Hardware Portfolio | .16% |
| Technology Portfolio | .15% |
Accounting Fees. Fidelity Service Company, Inc. (FSC), an affiliate of the investment adviser, maintains each Fund's accounting records. The accounting fee is based on the level of average net assets for each month. For the period, the fees were equivalent to the following annual rates:
| | % of Average Net Assets |
| IT Services Portfolio | .03 |
| Semiconductors Portfolio | .02 |
| Software and IT Services Portfolio | .01 |
| Tech Hardware Portfolio | .03 |
| Technology Portfolio | .01 |
Brokerage Commissions. A portion of portfolio transactions were placed with brokerage firms which are affiliates of the investment adviser. Brokerage commissions are included in net realized gain (loss) and change in net unrealized appreciation (depreciation) in the Statement of Operations. The commissions paid to these affiliated firms were as follows:
| | Amount |
| IT Services Portfolio | $19,984 |
| Semiconductors Portfolio | 40,277 |
| Software and IT Services Portfolio | 3,703 |
| Tech Hardware Portfolio | 4,077 |
| Technology Portfolio | 36,136 |
Interfund Lending Program. Pursuant to an Exemptive Order issued by the Securities and Exchange Commission (the SEC), each Fund, along with other registered investment companies having management contracts with Fidelity Management & Research Company LLC (FMR), or other affiliated entities of FMR, may participate in an interfund lending program. This program provides an alternative credit facility allowing each Fund to borrow from, or lend money to, other participating affiliated funds. At period end, there were no interfund loans outstanding. Activity in this program during the period for which loans were outstanding was as follows:
| | Borrower or Lender | Average Loan Balance | Weighted Average Interest Rate | Interest Expense |
| IT Services Portfolio | Borrower | $ 17,631,241 | 2.92% | $41,435 |
| Semiconductors Portfolio | Borrower | $ 8,964,125 | .53% | $1,055 |
| Software and IT Services Portfolio | Borrower | $8,280,488 | 1.01% | $9,488 |
| Tech Hardware Portfolio | Borrower | $ 3,681,200 | 1.77% | $909 |
| Technology Portfolio | Borrower | $ 16,161,739 | .93% | $9,648 |
Interfund Trades. Funds may purchase from or sell securities to other Fidelity Funds under procedures adopted by the Board. The procedures have been designed to ensure these interfund trades are executed in accordance with Rule 17a-7 of the 1940 Act. Any interfund trades are included within the respective purchases and sales amounts shown in the Purchases and Sales of Investments note. Interfund trades during the period are noted in the table below.
| | Purchases ($) | Sales ($) | Realized Gain (Loss) ($) |
| IT Services Portfolio | 31,077,881 | 76,153,255 | (690,812) |
| Semiconductors Portfolio | 111,712,341 | 121,010,887 | 2,197,167 |
| Software and IT Services Portfolio | 23,280,151 | 44,367,174 | 7,835,662 |
| Tech Hardware Portfolio | 14,375,817 | 22,597,081 | (2,545,888) |
| Technology Portfolio | 114,426,024 | 176,817,279 | 9,071,230 |
6. Committed Line of Credit.
Certain Funds participate with other funds managed by the investment adviser or an affiliate in a $4.25 billion credit facility (the "line of credit") to be utilized for temporary or emergency purposes to fund shareholder redemptions or for other short-term liquidity purposes. The participating funds have agreed to pay commitment fees on their pro-rata portion of the line of credit, which are reflected in Miscellaneous expenses on the Statement of Operations, and are listed below. During the period, there were no borrowings on this line of credit.
| | Amount |
| IT Services Portfolio | $4,360 |
| Semiconductors Portfolio | 12,582 |
| Software and IT Services Portfolio | 17,368 |
| Tech Hardware Portfolio | 1,402 |
| Technology Portfolio | 16,563 |
7. Security Lending.
Funds lend portfolio securities from time to time in order to earn additional income. Lending agents are used, including National Financial Services (NFS), an affiliate of the investment adviser. Pursuant to a securities lending agreement, NFS will receive a fee, which is capped at 9.9% of a fund's daily lending revenue, for its services as lending agent. A fund may lend securities to certain qualified borrowers, including NFS. On the settlement date of the loan, a fund receives collateral (in the form of U.S. Treasury obligations, letters of credit and/or cash) against the loaned securities and maintains collateral in an amount not less than 100% of the market value of the loaned securities during the period of the loan. The market value of the loaned securities is determined at the close of business of a fund and any additional required collateral is delivered to a fund on the next business day. A fund or borrower may terminate the loan at any time, and if the borrower defaults on its obligation to return the securities loaned because of insolvency or other reasons, a fund may apply collateral received from the borrower against the obligation. A fund may experience delays and costs in recovering the securities loaned. Any cash collateral received is invested in the Fidelity Securities Lending Cash Central Fund. Any loaned securities are identified as such in the Schedule of Investments, and the value of loaned securities and cash collateral at period end, as applicable, are presented in the Statement of Assets and Liabilities. Security lending income represents the income earned on investing cash collateral, less rebates paid to borrowers and any lending agent fees associated with the loan, plus any premium payments received for lending certain types of securities. Security lending income is presented in the Statement of Operations as a component of income from Fidelity Central Funds. Affiliated security lending activity, if any, was as follows:
| | Total Security Lending Fees Paid to NFS | Security Lending Income From Securities Loaned to NFS | Value of Securities Loaned to NFS at Period End |
| IT Services Portfolio | $41,259 | $27,718 | $- |
| Semiconductors Portfolio | $583,078 | $31,408 | $19,595,466 |
| Software and IT Services Portfolio | $2,728 | $- | $- |
| Tech Hardware Portfolio | $3,108 | $- | $- |
| Technology Portfolio | $273,611 | $137,207 | $- |
8. Bank Borrowings.
Each Fund is permitted to have bank borrowings for temporary or emergency purposes to fund shareholder redemptions or for other short-term liquidity requirements. Each Fund has established borrowing arrangements with certain banks. The interest rate on the borrowings is the bank's base rate, as revised from time to time. Any open loans, including accrued interest, at period end are presented under the caption "Notes payable" in the Statement of Assets and Liabilities, if applicable. Activity in this program during the period for which loans were outstanding was as follows:
| | Average Loan Balance | Weighted Average Interest Rate | Interest Expense |
| IT Services Portfolio | $36,272,500 | 3.87% | $15,613 |
| Software and IT Services Portfolio | $ 2,098,500 | .83% | $194 |
| | | | |
9. Expense Reductions.
Through arrangements with each applicable Fund's custodian, credits realized as a result of certain uninvested cash balances were used to reduce each applicable Fund's expenses. All of the applicable expense reductions are noted in the table below.
| | Custodian credits |
| Semiconductors Portfolio | $627 |
| Software and IT Services Portfolio | 4,655 |
| Technology Portfolio | 18 |
In addition, during the period the investment adviser or an affiliate reimbursed and/or waived a portion of operating expenses as follows:
| | Amount |
| IT Services Portfolio | $82,130 |
| Semiconductors Portfolio | 241,721 |
| Software and IT Services Portfolio | 329,309 |
| Tech Hardware Portfolio | 26,705 |
| Technology Portfolio | 312,612 |
10. Other.
A fund's organizational documents provide former and current trustees and officers with a limited indemnification against liabilities arising in connection with the performance of their duties to the fund. In the normal course of business, a fund may also enter into contracts that provide general indemnifications. A fund's maximum exposure under these arrangements is unknown as this would be dependent on future claims that may be made against a fund. The risk of material loss from such claims is considered remote.
11. Risk and Uncertainties.
Many factors affect a fund's performance. Developments that disrupt global economies and financial markets, such as pandemics, epidemics, outbreaks of infectious diseases, war, terrorism, and environmental disasters, may significantly affect a fund's investment performance. The effects of these developments to a fund will be impacted by the types of securities in which a fund invests, the financial condition, industry, economic sector, and geographic location of an issuer, and a fund's level of investment in the securities of that issuer. Significant concentrations in security types, issuers, industries, sectors, and geographic locations may magnify the factors that affect a fund's performance.
12 . Prior Fiscal Year Merger Information.
On November 12, 2021, Tech Hardware Portfolio acquired all of the assets and assumed all of the liabilities of Communications Equipment Portfolio ("Target Fund") pursuant to an Agreement and Plan of Reorganization approved by the Board of Trustees ("The Board"). The securities held by the Target Fund were the primary assets acquired by the Fund. The acquisition was accomplished by an exchange of shares of the Fund for shares then outstanding of the Target Fund at its respective net asset value on the acquisition date. The reorganization provides shareholders of the Target Fund access to a larger portfolio with a similar investment objective and lower projected expenses. For financial reporting purposes, the assets and liabilities of the Target Fund and shares issued by the Fund were recorded at fair value; however, the cost basis of the investments received from the Target Fund were carried forward and will be utilized for purposes of the Fund's ongoing reporting of realized and unrealized gains and losses to more closely align subsequent reporting of realized gains with amounts distributable to shareholders for tax purposes. The reorganization qualified as a tax-free reorganization for federal income tax purposes with no gain or loss recognized to the funds or their shareholders.
| Target Fund | Investments $ | Unrealized appreciation (depreciation) $ | Net Assets $ | Shares Exchanged | Shares Exchanged Ratio |
| Communications Equipment Portfolio | 187,085,638 | 75,879,300 | 189,381,924 | 1,755,160 | .4176867470 |
| Surviving Fund | Net Assets $ | Total net assets after the acquisition $ |
| Tech Hardware Portfolio | 798,971,790 | 988,353,714 |
Pro forma results of operations of the combined entity for the entire period ended February 28, 2022, as though the acquisition had occurred as of the beginning of the year (rather than on the actual acquisition date), are as follows:
| Net investment income (loss) | $3,770,342 |
| Total net realized gain (loss) | 191,061,539 |
| Total change in net unrealized appreciation (depreciation) | (130,804,365) |
| Net increase (decrease) in net assets resulting from operations | $64,027,516 |
Because the combined investment portfolios have been managed as a single portfolio since the acquisition was completed, it is not practicable to separate the amounts of revenue and earnings of the acquired fund that have been included in the Tech Hardware Portfolio's Statement of Operations since November 12, 2021.
To the Board of Trustees of Fidelity Select Portfolios and Shareholders of IT Services Portfolio, Semiconductors Portfolio, Software and IT Services Portfolio, Tech Hardware Portfolio, and Technology Portfolio
Opinions on the Financial Statements
We have audited the accompanying statements of assets and liabilities, including the schedules of investments, of IT Services Portfolio, Semiconductors Portfolio, Software and IT Services Portfolio, Tech Hardware Portfolio, and Technology Portfolio (five of the funds constituting Fidelity Select Portfolios, hereafter collectively referred to as the "Funds") as of February 28, 2023, the related statements of operations for the year ended February 28, 2023, the statements of changes in net assets for each of the two years in the period ended February 28, 2023, including the related notes, and the financial highlights for each of the five years in the period ended February 28, 2023 (collectively referred to as the "financial statements"). In our opinion, the financial statements present fairly, in all material respects, the financial position of each of the Funds as of February 28, 2023, the results of each of their operations for the year then ended, the changes in each of their net assets for each of the two years in the period ended February 28, 2023 and each of the financial highlights for each of the five years in the period ended February 28, 2023 in conformity with accounting principles generally accepted in the United States of America.
Basis for Opinions
These financial statements are the responsibility of the Funds' management. Our responsibility is to express an opinion on the Funds' financial statements based on our audits. We are a public accounting firm registered with the Public Company Accounting Oversight Board (United States) (PCAOB) and are required to be independent with respect to the Funds in accordance with the U.S. federal securities laws and the applicable rules and regulations of the Securities and Exchange Commission and the PCAOB.
We conducted our audits of these financial statements in accordance with the standards of the PCAOB. Those standards require that we plan and perform the audit to obtain reasonable assurance about whether the financial statements are free of material misstatement, whether due to error or fraud.
Our audits included performing procedures to assess the risks of material misstatement of the financial statements, whether due to error or fraud, and performing procedures that respond to those risks. Such procedures included examining, on a test basis, evidence regarding the amounts and disclosures in the financial statements. Our audits also included evaluating the accounting principles used and significant estimates made by management, as well as evaluating the overall presentation of the financial statements. Our procedures included confirmation of securities owned as of February 28, 2023 by correspondence with the custodian, issuers of privately offered securities and brokers; when replies were not received from brokers, we performed other auditing procedures. We believe that our audits provide a reasonable basis for our opinions.
/s/ PricewaterhouseCoopers LLP
Boston, Massachusetts
April 12, 2023
We have served as the auditor of one or more investment companies in the Fidelity group of funds since 1932.
The Trustees, Members of the Advisory Board (if any), and officers of the trust and funds, as applicable, are listed below. The Board of Trustees governs each fund and is responsible for protecting the interests of shareholders. The Trustees are experienced executives who meet periodically throughout the year to oversee each fund's activities, review contractual arrangements with companies that provide services to each fund, oversee management of the risks associated with such activities and contractual arrangements, and review each fund's performance. Each of the Trustees oversees 318 funds.
The Trustees hold office without limit in time except that (a) any Trustee may resign; (b) any Trustee may be removed by written instrument, signed by at least two-thirds of the number of Trustees prior to such removal; (c) any Trustee who requests to be retired or who has become incapacitated by illness or injury may be retired by written instrument signed by a majority of the other Trustees; and (d) any Trustee may be removed at any special meeting of shareholders by a two-thirds vote of the outstanding voting securities of the trust. Each Trustee who is not an interested person (as defined in the 1940 Act) of the trust and the funds is referred to herein as an Independent Trustee. Each Independent Trustee shall retire not later than the last day of the calendar year in which his or her 75th birthday occurs. The Independent Trustees may waive this mandatory retirement age policy with respect to individual Trustees. Officers and Advisory Board Members hold office without limit in time, except that any officer or Advisory Board Member may resign or may be removed by a vote of a majority of the Trustees at any regular meeting or any special meeting of the Trustees. Except as indicated, each individual has held the office shown or other offices in the same company for the past five years.
The funds' Statement of Additional Information (SAI) includes more information about the Trustees. To request a free copy, call Fidelity at 1-800-544-8544.
Experience, Skills, Attributes, and Qualifications of the Trustees. The Governance and Nominating Committee has adopted a statement of policy that describes the experience, qualifications, attributes, and skills that are necessary and desirable for potential Independent Trustee candidates (Statement of Policy). The Board believes that each Trustee satisfied at the time he or she was initially elected or appointed a Trustee, and continues to satisfy, the standards contemplated by the Statement of Policy. The Governance and Nominating Committee also engages professional search firms to help identify potential Independent Trustee candidates who have the experience, qualifications, attributes, and skills consistent with the Statement of Policy. From time to time, additional criteria based on the composition and skills of the current Independent Trustees, as well as experience or skills that may be appropriate in light of future changes to board composition, business conditions, and regulatory or other developments, have also been considered by the professional search firms and the Governance and Nominating Committee. In addition, the Board takes into account the Trustees' commitment and participation in Board and committee meetings, as well as their leadership of standing and ad hoc committees throughout their tenure.
In determining that a particular Trustee was and continues to be qualified to serve as a Trustee, the Board has considered a variety of criteria, none of which, in isolation, was controlling. The Board believes that, collectively, the Trustees have balanced and diverse experience, qualifications, attributes, and skills, which allow the Board to operate effectively in governing each fund and protecting the interests of shareholders. Information about the specific experience, skills, attributes, and qualifications of each Trustee, which in each case led to the Board's conclusion that the Trustee should serve (or continue to serve) as a trustee of the funds, is provided below.
Board Structure and Oversight Function. Robert A. Lawrence is an interested person and currently serves as Chair. The Trustees have determined that an interested Chair is appropriate and benefits shareholders because an interested Chair has a personal and professional stake in the quality and continuity of services provided to the funds. Independent Trustees exercise their informed business judgment to appoint an individual of their choosing to serve as Chair, regardless of whether the Trustee happens to be independent or a member of management. The Independent Trustees have determined that they can act independently and effectively without having an Independent Trustee serve as Chair and that a key structural component for assuring that they are in a position to do so is for the Independent Trustees to constitute a substantial majority for the Board. The Independent Trustees also regularly meet in executive session. David M. Thomas serves as Lead Independent Trustee and as such (i) acts as a liaison between the Independent Trustees and management with respect to matters important to the Independent Trustees and (ii) with management prepares agendas for Board meetings.
Fidelity ® funds are overseen by different Boards of Trustees. The funds' Board oversees Fidelity's high income and certain equity funds, and other Boards oversee Fidelity's alternative investment, investment-grade bond, money market, asset allocation, and other equity funds. The asset allocation funds may invest in Fidelity ® funds overseen by the funds' Board. The use of separate Boards, each with its own committee structure, allows the Trustees of each group of Fidelity ® funds to focus on the unique issues of the funds they oversee, including common research, investment, and operational issues. On occasion, the separate Boards establish joint committees to address issues of overlapping consequences for the Fidelity ® funds overseen by each Board.
The Trustees operate using a system of committees to facilitate the timely and efficient consideration of all matters of importance to the Trustees, each fund, and fund shareholders and to facilitate compliance with legal and regulatory requirements and oversight of the funds' activities and associated risks. The Board, acting through its committees, has charged FMR and its affiliates with (i) identifying events or circumstances the occurrence of which could have demonstrably adverse effects on the funds' business and/or reputation; (ii) implementing processes and controls to lessen the possibility that such events or circumstances occur or to mitigate the effects of such events or circumstances if they do occur; and (iii) creating and maintaining a system designed to evaluate continuously business and market conditions in order to facilitate the identification and implementation processes described in (i) and (ii) above. Because the day-to-day operations and activities of the funds are carried out by or through FMR, its affiliates, and other service providers, the funds' exposure to risks is mitigated but not eliminated by the processes overseen by the Trustees. While each of the Board's committees has responsibility for overseeing different aspects of the funds' activities, oversight is exercised primarily through the Operations, Audit, and Compliance Committees. Appropriate personnel, including but not limited to the funds' Chief Compliance Officer (CCO), FMR's internal auditor, the independent accountants, the funds' Treasurer and portfolio management personnel, make periodic reports to the Board's committees, as appropriate, including an annual review of Fidelity's risk management program for the Fidelity ® funds. The responsibilities of each standing committee, including their oversight responsibilities, are described further under "Standing Committees of the Trustees."
Interested Trustees*:
Correspondence intended for a Trustee who is an interested person may be sent to Fidelity Investments, 245 Summer Street, Boston, Massachusetts 02210.
Name, Year of Birth; Principal Occupations and Other Relevant Experience+
Bettina Doulton (1964)
Year of Election or Appointment: 2020
Trustee
Ms. Doulton also serves as Trustee of other Fidelity ® funds. Prior to her retirement, Ms. Doulton served in a variety of positions at Fidelity Investments, including as a managing director of research (2006-2007), portfolio manager to certain Fidelity ® funds (1993-2005), equity analyst and portfolio assistant (1990-1993), and research assistant (1987-1990). Ms. Doulton currently owns and operates Phi Builders + Architects and Cellardoor Winery. Previously, Ms. Doulton served as a member of the Board of Brown Capital Management, LLC (2014-2018).
Robert A. Lawrence (1952)
Year of Election or Appointment: 2020
Trustee
Chair of the Board of Trustees
Mr. Lawrence also serves as Trustee of other funds. Previously, Mr. Lawrence served as a Trustee and Member of the Advisory Board of certain funds. Prior to his retirement in 2008, Mr. Lawrence served as Vice President of certain Fidelity ® funds (2006-2008), Senior Vice President, Head of High Income Division of Fidelity Management & Research Company (investment adviser firm, 2006-2008), and President of Fidelity Strategic Investments (investment adviser firm, 2002-2005).
* Determined to be an "Interested Trustee" by virtue of, among other things, his or her affiliation with the trust or various entities under common control with FMR.
+ The information includes the Trustee's principal occupation during the last five years and other information relating to the experience, attributes, and skills relevant to the Trustee's qualifications to serve as a Trustee, which led to the conclusion that the Trustee should serve as a Trustee for each fund.
Independent Trustees:
Correspondence intended for an Independent Trustee may be sent to Fidelity Investments, P.O. Box 55235, Boston, Massachusetts 02205-5235.
Name, Year of Birth; Principal Occupations and Other Relevant Experience+
Thomas P. Bostick (1956)
Year of Election or Appointment: 2021
Trustee
Lieutenant General Bostick also serves as Trustee of other Fidelity ® funds. Prior to his retirement, General Bostick (United States Army, Retired) held a variety of positions within the U.S. Army, including Commanding General and Chief of Engineers, U.S. Army Corps of Engineers (2012-2016) and Deputy Chief of Staff and Director of Human Resources, U.S. Army (2009-2012). General Bostick currently serves as a member of the Board and Finance and Governance & Sustainability Committees of CSX Corporation (transportation, 2020-present) and a member of the Board and Corporate Governance and Nominating Committee of Perma-Fix Environmental Services, Inc. (nuclear waste management, 2020-present). General Bostick serves as Chief Executive Officer of Bostick Global Strategies, LLC (consulting, 2016-present), as a member of the Board of HireVue, Inc. (video interview and assessment, 2020-present), as a member of the Board of Allonnia (biotechnology and engineering solutions, 2022-present) and on the Advisory Board of Solugen, Inc. (specialty bio-based chemicals manufacturer, 2022-present). Previously, General Bostick served as a Member of the Advisory Board of certain Fidelity ® funds (2021), President, Intrexon Bioengineering (2018-2020) and Chief Operating Officer (2017-2020) and Senior Vice President of the Environment Sector (2016-2017) of Intrexon Corporation (biopharmaceutical company).
Dennis J. Dirks (1948)
Year of Election or Appointment: 2018
Trustee
Mr. Dirks also serves as Trustee of other Fidelity ® funds. Prior to his retirement in May 2003, Mr. Dirks served as Chief Operating Officer and as a member of the Board of The Depository Trust & Clearing Corporation (financial markets infrastructure), President, Chief Operating Officer and a member of the Board of The Depository Trust Company (DTC), President and a member of the Board of the National Securities Clearing Corporation (NSCC), Chief Executive Officer and a member of the Board of the Government Securities Clearing Corporation and Chief Executive Officer and a member of the Board of the Mortgage-Backed Securities Clearing Corporation. Mr. Dirks currently serves as a member of the Finance Committee (2016-present) and Board (2017-present) and is Treasurer (2018-present) of the Asolo Repertory Theatre.
Donald F. Donahue (1950)
Year of Election or Appointment: 2018
Trustee
Mr. Donahue also serves as Trustee of other Fidelity ® funds. Mr. Donahue serves as President and Chief Executive Officer of Miranda Partners, LLC (risk consulting for the financial services industry, 2012-present). Previously, Mr. Donahue served as Chief Executive Officer (2006-2012), Chief Operating Officer (2003-2006) and Managing Director, Customer Marketing and Development (1999-2003) of The Depository Trust & Clearing Corporation (financial markets infrastructure). Mr. Donahue currently serves as a member (2007-present) and Co-Chairman (2016-present) of the Board of United Way of New York. Mr. Donahue previously served as a member of the Advisory Board of certain Fidelity ® funds (2015-2018) and as a member of the Board of The Leadership Academy (previously NYC Leadership Academy) (2012-2022).
Vicki L. Fuller (1957)
Year of Election or Appointment: 2020
Trustee
Ms. Fuller also serves as Trustee of other Fidelity ® funds. Previously, Ms. Fuller served as a member of the Advisory Board of certain Fidelity ® funds (2018-2020), Chief Investment Officer of the New York State Common Retirement Fund (2012-2018) and held a variety of positions at AllianceBernstein L.P. (global asset management, 1985-2012), including Managing Director (2006-2012) and Senior Vice President and Senior Portfolio Manager (2001-2006). Ms. Fuller currently serves as a member of the Board, Audit Committee and Nominating and Governance Committee of two Blackstone business development companies (2020-present), as a member of the Board of Treliant, LLC (consulting, 2019-present), as a member of the Board of Ariel Alternatives, LLC (private equity, 2022-present) and as a member of the Board and Chair of the Audit Committee of Gusto, Inc. (software, 2021-present). In addition, Ms. Fuller currently serves as a member of the Board of Roosevelt University (2019-present) and as a member of the Executive Board of New York University's Stern School of Business. Ms. Fuller previously served as a member of the Board, Audit Committee and Nominating and Governance Committee of The Williams Companies, Inc. (natural gas infrastructure, 2018-2021).
Patricia L. Kampling (1959)
Year of Election or Appointment: 2020
Trustee
Ms. Kampling also serves as Trustee of other Fidelity ® funds. Prior to her retirement, Ms. Kampling served as Chairman of the Board and Chief Executive Officer (2012-2019), President and Chief Operating Officer (2011-2012) and Executive Vice President and Chief Financial Officer (2010-2011) of Alliant Energy Corporation. Ms. Kampling currently serves as a member of the Board, Finance Committee and Governance, Compensation and Nominating Committee of Xcel Energy Inc. (utilities company, 2020-present) and as a member of the Board, Audit, Finance and Risk Committee and Safety, Environmental, Technology and Operations Committee and Chair of the Executive Development and Compensation Committee of American Water Works Company, Inc. (utilities company, 2019-present). In addition, Ms. Kampling currently serves as a member of the Board of the Nature Conservancy, Wisconsin Chapter (2019-present). Previously, Ms. Kampling served as a Member of the Advisory Board of certain Fidelity® funds (2020), a member of the Board, Compensation Committee and Executive Committee and Chair of the Audit Committee of Briggs & Stratton Corporation (manufacturing, 2011-2021), a member of the Board of Interstate Power and Light Company (2012-2019) and Wisconsin Power and Light Company (2012-2019) (each a subsidiary of Alliant Energy Corporation) and as a member of the Board and Workforce Development Committee of the Business Roundtable (2018-2019).
Thomas A. Kennedy (1955)
Year of Election or Appointment: 2021
Trustee
Mr. Kennedy also serves as Trustee of other Fidelity ® funds. Previously, Mr. Kennedy served as a Member of the Advisory Board of certain Fidelity ® funds (2020) and held a variety of positions at Raytheon Company (aerospace and defense, 1983-2020), including Chairman and Chief Executive Officer (2014-2020) and Executive Vice President and Chief Operating Officer (2013-2014). Mr. Kennedy served as Executive Chairman of the Board of Directors of Raytheon Technologies Corporation (aerospace and defense, 2020-2021). Mr. Kennedy serves as a Director of the Board of Directors of Textron Inc. (aerospace and defense, 2023-present).
Oscar Munoz (1959)
Year of Election or Appointment: 2021
Trustee
Mr. Munoz also serves as Trustee of other Fidelity ® funds. Prior to his retirement, Mr. Munoz served as Executive Chairman (2020-2021), Chief Executive Officer (2015-2020), President (2015-2016) and a member of the Board (2010-2021) of United Airlines Holdings, Inc. Mr. Munoz currently serves as a member of the Board of CBRE Group, Inc. (commercial real estate, 2020-present), a member of the Board of Univision Communications, Inc. (Hispanic media, 2020-present), a member of the Board of Archer Aviation Inc. (2021-present), a member of the Defense Business Board of the United States Department of Defense (2021-present) and a member of the Board of Salesforce.com, Inc. (cloud-based software, 2022-present). Previously, Mr. Munoz served as a Member of the Advisory Board of certain Fidelity ® funds (2021).
David M. Thomas (1949)
Year of Election or Appointment: 2018
Trustee
Lead Independent Trustee
Mr. Thomas also serves as Trustee of other Fidelity ® funds. Previously, Mr. Thomas served as Executive Chairman (2005-2006) and Chairman and Chief Executive Officer (2000-2005) of IMS Health, Inc. (pharmaceutical and healthcare information solutions). Mr. Thomas currently serves as a member of the Board of Fortune Brands Home and Security (home and security products, 2004-present) and as Director (2013-present) and Non-Executive Chairman of the Board (2022-present) of Interpublic Group of Companies, Inc. (marketing communication).
Susan Tomasky (1953)
Year of Election or Appointment: 2020
Trustee
Ms. Tomasky also serves as Trustee of other Fidelity ® funds. Prior to her retirement, Ms. Tomasky served in various executive officer positions at American Electric Power Company, Inc. (1998-2011), including most recently as President of AEP Transmission (2007-2011). Ms. Tomasky currently serves as a member of the Board and Sustainability Committee and as Chair of the Audit Committee of Marathon Petroleum Corporation (2018-present) and as a member of the Board, Executive Committee, Corporate Governance Committee and Organization and Compensation Committee and as Lead Director of the Board of Public Service Enterprise Group, Inc. (utilities company, 2012-present) and as a member of the Board of its subsidiary company, Public Service Electric and Gas Co. (2021-present). In addition, Ms. Tomasky currently serves as a member (2009-present) and President (2020-present) of the Board of the Royal Shakespeare Company - America (2009-present), as a member of the Board of the Columbus Association for the Performing Arts (2011-present) and as a member of the Board and Kenyon in the World Committee of Kenyon College (2016-present). Previously, Ms. Tomasky served as a Member of the Advisory Board of certain Fidelity ® funds (2020), as a member of the Board of the Columbus Regional Airport Authority (2007-2020), as a member of the Board (2011-2018) and Lead Independent Director (2015-2018) of Andeavor Corporation (previously Tesoro Corporation) (independent oil refiner and marketer) and as a member of the Board of Summit Midstream Partners LP (energy, 2012-2018).
Michael E. Wiley (1950)
Year of Election or Appointment: 2008
Trustee
Mr. Wiley also serves as Trustee of other Fidelity ® funds. Previously, Mr. Wiley served as a member of the Advisory Board of certain Fidelity ® funds (2018-2020), Chairman, President and CEO of Baker Hughes, Inc. (oilfield services, 2000-2004). Mr. Wiley also previously served as a member of the Board of Andeavor Corporation (independent oil refiner and marketer, 2005-2018), a member of the Board of Andeavor Logistics LP (natural resources logistics, 2015-2018) and a member of the Board of High Point Resources (exploration and production, 2005-2020).
+ The information includes the Trustee's principal occupation during the last five years and other information relating to the experience, attributes, and skills relevant to the Trustee's qualifications to serve as a Trustee, which led to the conclusion that the Trustee should serve as a Trustee for each fund.
Advisory Board Members and Officers:
Correspondence intended for a Member of the Advisory Board (if any) may be sent to Fidelity Investments, P.O. Box 55235, Boston, Massachusetts 02205-5235. Correspondence intended for an officer or Peter S. Lynch may be sent to Fidelity Investments, 245 Summer Street, Boston, Massachusetts 02210. Officers appear below in alphabetical order.
Name, Year of Birth; Principal Occupation
Peter S. Lynch (1944)
Year of Election or Appointment: 2018
Member of the Advisory Board
Mr. Lynch also serves as a Member of the Advisory Board of other Fidelity ® funds. Mr. Lynch is Vice Chairman and a Director of Fidelity Management & Research Company LLC (investment adviser firm). In addition, Mr. Lynch serves as a Trustee of Boston College and as the Chairman of the Inner-City Scholarship Fund. Previously, Mr. Lynch served as Vice Chairman and a Director of FMR Co., Inc. (investment adviser firm) and on the Special Olympics International Board of Directors (1997-2006).
Heather Bonner (1977)
Year of Election or Appointment: 2023
Assistant Treasurer
Ms. Bonner also serves as an officer of other funds. Ms. Bonner serves as Senior Vice President (2022-present), and is an employee of Fidelity Investments. Ms. Bonner serves as Assistant Treasurer of Fidelity CRET Trustee LLC (2022-present). Prior to joining Fidelity, Ms. Bonner served as Managing Director at AQR Capital Management (2013-2022) and was the Treasurer and Principal Financial Officer of the AQR Funds (2013-2022).
Craig S. Brown (1977)
Year of Election or Appointment: 2022
Deputy Treasurer
Mr. Brown also serves as an officer of other funds. Mr. Brown serves as Assistant Treasurer of FIMM, LLC (2021-present) and is an employee of Fidelity Investments (2013-present). Previously, Mr. Brown served as Assistant Treasurer of certain Fidelity ® funds (2019-2022).
John J. Burke III (1964)
Year of Election or Appointment: 2018
Chief Financial Officer
Mr. Burke also serves as Chief Financial Officer of other funds. Mr. Burke serves as Head of Investment Operations for Fidelity Fund and Investment Operations (2018-present) and is an employee of Fidelity Investments (1998-present). Previously Mr. Burke served as head of Asset Management Investment Operations (2012-2018).
Margaret Carey (1973)
Year of Election or Appointment: 2023
Secretary and Chief Legal Officer (CLO)
Ms. Carey also serves as an officer of other funds and as CLO of certain other Fidelity entities. She is a Senior Vice President and Deputy General Counsel of FMR LLC (diversified financial services company, 2019-present), and is an employee of Fidelity Investments.
William C. Coffey (1969)
Year of Election or Appointment: 2019
Assistant Secretary
Mr. Coffey also serves as Assistant Secretary of other funds. He is Senior Vice President and Deputy General Counsel of FMR LLC (diversified financial services company, 2010-present), and is an employee of Fidelity Investments. Previously, Mr. Coffey served as Secretary and CLO of certain funds (2018-2019); CLO, Secretary, and Senior Vice President of Fidelity Management & Research Company and FMR Co., Inc. (investment adviser firms, 2018-2019); Secretary of Fidelity SelectCo, LLC and Fidelity Investments Money Management, Inc. (investment adviser firms, 2018-2019); CLO of Fidelity Management & Research (Hong Kong) Limited, FMR Investment Management (UK) Limited, and Fidelity Management & Research (Japan) Limited (investment adviser firms, 2018-2019); and Assistant Secretary of certain funds (2009-2018).
Timothy M. Cohen (1969)
Year of Election or Appointment: 2018
Vice President
Mr. Cohen also serves as Vice President of other funds. Mr. Cohen serves as Co-Head of Equity (2018-present), a Director of Fidelity Management & Research (Japan) Limited (investment adviser firm, 2016-present), and is an employee of Fidelity Investments. Previously, Mr. Cohen served as Executive Vice President of Fidelity SelectCo, LLC (2019), Head of Global Equity Research (2016-2018), Chief Investment Officer - Equity and a Director of Fidelity Management & Research (U.K.) Inc. (investment adviser firm, 2013-2015) and as a Director of Fidelity Management & Research (Hong Kong) Limited (investment adviser firm, 2017).
Jonathan Davis (1968)
Year of Election or Appointment: 2010
Assistant Treasurer
Mr. Davis also serves as an officer of other funds. Mr. Davis serves as Assistant Treasurer of FIMM, LLC (2021-present), FMR Capital, Inc. (2017-present), FD Funds GP LLC (2021-present), FD Funds Holding LLC (2021-present), and FD Funds Management LLC (2021-present); and is an employee of Fidelity Investments. Previously, Mr. Davis served as Vice President and Associate General Counsel of FMR LLC (diversified financial services company, 2003-2010).
Laura M. Del Prato (1964)
Year of Election or Appointment: 2018
Assistant Treasurer
Ms. Del Prato also serves as an officer of other funds. Ms. Del Prato serves as Assistant Treasurer of FIMM, LLC (2021-present) and is an employee of Fidelity Investments (2017-present). Previously, Ms. Del Prato served as President and Treasurer of The North Carolina Capital Management Trust: Cash Portfolio and Term Portfolio (2018-2020). Prior to joining Fidelity Investments, Ms. Del Prato served as a Managing Director and Treasurer of the JPMorgan Mutual Funds (2014-2017). Prior to JPMorgan, Ms. Del Prato served as a partner at Cohen Fund Audit Services (accounting firm, 2012-2013) and KPMG LLP (accounting firm, 2004-2012).
Colm A. Hogan (1973)
Year of Election or Appointment: 2020
Assistant Treasurer
Mr. Hogan also serves as an officer of other funds. Mr. Hogan serves as Assistant Treasurer of FIMM, LLC (2021-present) and FMR Capital, Inc. (2017-present) and is an employee of Fidelity Investments (2005-present). Previously, Mr. Hogan served as Deputy Treasurer of certain Fidelity ® funds (2016-2020) and Assistant Treasurer of certain Fidelity ® funds (2016-2018).
Pamela R. Holding (1964)
Year of Election or Appointment: 2018
Vice President
Ms. Holding also serves as Vice President of other funds. Ms. Holding serves as Co-Head of Equity (2018-present) and is an employee of Fidelity Investments (2013-present). Previously, Ms. Holding served as Executive Vice President of Fidelity SelectCo, LLC (2019) and as Chief Investment Officer of Fidelity Institutional Asset Management (2013-2018).
Chris Maher (1972)
Year of Election or Appointment: 2020
Deputy Treasurer
Mr. Maher also serves as an officer of other funds. Mr. Maher serves as Assistant Treasurer of FIMM, LLC (2021-present) and FMR Capital, Inc. (2017-present), and is an employee of Fidelity Investments (2008-present). Previously, Mr. Maher served as Assistant Treasurer of certain funds (2013-2020); Vice President of Asset Management Compliance (2013), Vice President of the Program Management Group of FMR (investment adviser firm, 2010-2013), and Vice President of Valuation Oversight (2008-2010).
Jason P. Pogorelec (1975)
Year of Election or Appointment: 2020
Chief Compliance Officer
Mr. Pogorelec also serves as Chief Compliance Officer of other funds. Mr. Pogorelec is a Senior Vice President of Asset Management Compliance for Fidelity Investments and is an employee of Fidelity Investments. Mr. Pogorelec serves as Compliance Officer of Fidelity Management & Research Company LLC (investment adviser firm, 2023-present). Previously, Mr. Pogorelec served as Vice President, Associate General Counsel for Fidelity Investments (2010-2020) and Assistant Secretary of certain Fidelity ® funds (2015-2020).
Brett Segaloff (1972)
Year of Election or Appointment: 2021
Anti-Money Laundering (AML) Officer
Mr. Segaloff also serves as an AML Officer of other funds and other related entities. He is Director, Anti-Money Laundering (2007-present) of FMR LLC (diversified financial services company) and is an employee of Fidelity Investments (1996-present).
Stacie M. Smith (1974)
Year of Election or Appointment: 2018
President and Treasurer
Ms. Smith also serves as an officer of other funds. Ms. Smith serves as Assistant Treasurer of FIMM, LLC (2021-present) and FMR Capital, Inc. (2017-present), is an employee of Fidelity Investments (2009-present), and has served in other fund officer roles. Prior to joining Fidelity Investments, Ms. Smith served as Senior Audit Manager of Ernst & Young LLP (accounting firm, 1996-2009). Previously, Ms. Smith served as Assistant Treasurer (2013-2019) and Deputy Treasurer (2013-2016) of certain Fidelity ® funds.
Jim Wegmann (1979)
Year of Election or Appointment: 2019
Assistant Treasurer
Mr. Wegmann also serves as an officer of other funds. Mr. Wegmann serves as Assistant Treasurer of FIMM, LLC (2021-present) and is an employee of Fidelity Investments (2011-present). Previously, Mr. Wegmann served as Assistant Treasurer of certain Fidelity ® funds (2019-2021).
As a shareholder, you incur two types of costs: (1) transaction costs, which may include sales charges (loads) on purchase payments or redemption proceeds, as applicable and (2) ongoing costs, which generally include management fees, distribution and/or service (12b-1) fees and other Fund expenses. This Example is intended to help you understand your ongoing costs (in dollars) of investing in a fund and to compare these costs with the ongoing costs of investing in other mutual funds.
| The Example is based on an investment of $1,000 invested at the beginning of the period and held for the entire period (September 1, 2022 to February 28, 2023). |
Actual Expenses
The first line of the accompanying table provides information about actual account values and actual expenses. You may use the information in this line, together with the amount you invested, to estimate the expenses that you paid over the period. Simply divide your account value by $1,000.00 (for example, an $8,600 account value divided by $1,000.00 = 8.6), then multiply the result by the number in the first line for a class/Fund under the heading entitled "Expenses Paid During Period" to estimate the expenses you paid on your account during this period. If any fund is a shareholder of any underlying mutual funds or exchange-traded funds (ETFs) (the Underlying Funds), such fund indirectly bears its proportional share of the expenses of the Underlying Funds in addition to the direct expenses incurred presented in the table. These fees and expenses are not included in the annualized expense ratio used to calculate the expense estimate in the table below.
Hypothetical Example for Comparison Purposes
The second line of the accompanying table provides information about hypothetical account values and hypothetical expenses based on the actual expense ratio and an assumed rate of return of 5% per year before expenses, which is not the actual return. The hypothetical account values and expenses may not be used to estimate the actual ending account balance or expenses you paid for the period. You may use this information to compare the ongoing costs of investing in the Fund and other funds. To do so, compare this 5% hypothetical example with the 5% hypothetical examples that appear in the shareholder reports of the other funds. If any fund is a shareholder of any Underlying Funds, such fund indirectly bears its proportional share of the expenses of the Underlying Funds in addition to the direct expenses as presented in the table. These fees and expenses are not included in the annualized expense ratio used to calculate the expense estimate in the table below.
Please note that the expenses shown in the table are meant to highlight your ongoing costs only and do not reflect any transaction costs. Therefore, the second line of the table is useful in comparing ongoing costs only, and will not help you determine the relative total costs of owning different funds. In addition, if these transactional costs were included, your costs would have been higher.
| | | | | Annualized Expense Ratio- A | | Beginning Account Value September 1, 2022 | | Ending Account Value February 28, 2023 | | Expenses Paid During Period- C September 1, 2022 to February 28, 2023 |
| | | | | | | | | | |
| IT Services Portfolio | | | | .74% | | | | | | |
| Actual | | | | | | $ 1,000 | | $ 1,002.40 | | $ 3.67 |
Hypothetical- B | | | | | | $ 1,000 | | $ 1,021.12 | | $ 3.71 |
| | | | | | | | | | |
| Semiconductors Portfolio | | | | .70% | | | | | | |
| Actual | | | | | | $ 1,000 | | $ 1,204.40 | | $ 3.83 |
Hypothetical- B | | | | | | $ 1,000 | | $ 1,021.32 | | $ 3.51 |
| | | | | | | | | | |
| Software and IT Services Portfolio | | | | .69% | | | | | | |
| Actual | | | | | | $ 1,000 | | $ 1,002.60 | | $ 3.43 |
Hypothetical- B | | | | | | $ 1,000 | | $ 1,021.37 | | $ 3.46 |
| | | | | | | | | | |
| Tech Hardware Portfolio | | | | .74% | | | | | | |
| Actual | | | | | | $ 1,000 | | $ 1,028.20 | | $ 3.72 |
Hypothetical- B | | | | | | $ 1,000 | | $ 1,021.12 | | $ 3.71 |
| | | | | | | | | | |
| Technology Portfolio | | | | .70% | | | | | | |
| Actual | | | | | | $ 1,000 | | $ 1,031.30 | | $ 3.53 |
Hypothetical- B | | | | | | $ 1,000 | | $ 1,021.32 | | $ 3.51 |
| |
A Annualized expense ratio reflects expenses net of applicable fee waivers.
B 5% return per year before expenses
C Expenses are equal to the annualized expense ratio, multiplied by the average account value over the period, multiplied by 181/ 365 (to reflect the one-half year period). The fees and expenses of any Underlying Funds are not included in each annualized expense ratio.
The dividend and capital gains distributions for the fund(s) are available on Fidelity.com or Institutional.Fidelity.com.
The funds hereby designate as capital gain dividend the amounts noted below for the taxable year ended February 28, 2023, or, if subsequently determined to be different, the net capital gain of such year.
| Semiconductors Portfolio | $135,817,674 |
| Software and IT Services Portfolio | $378,238,151 |
A percentage of the dividends distributed during the fiscal year for the following funds qualify for the dividends-received deduction for corporate shareholders:
| | April 2022 | December 2022 |
| IT Services Portfolio | - | 100% |
| Semiconductors Portfolio | - | 100% |
| Tech Hardware Portfolio | 6% | 97% |
A percentage of the dividends distributed during the fiscal year for the following funds may be taken into account as a dividend for purposes of the maximum rate under section 1(h)(11) of the Internal Revenue Code.
| | April 2022 | December 2022 |
| IT Services Portfolio | - | 100% |
| Semiconductors Portfolio | - | 100% |
| Tech Hardware Portfolio | 4.13% | 100% |
The funds hereby designate the percentages noted below of the short-term capital gain dividends distributed during the fiscal year as qualifying to be taxed as short-term capital gain dividends for nonresident alien shareholders:
| | April 2022 | December 2022 |
| Tech Hardware Portfolio | 99.97% | - |
The funds will notify shareholders in January 2024 of amounts for use in preparing 2023 income tax returns.
The Securities and Exchange Commission adopted Rule 22e-4 under the Investment Company Act of 1940 (the Liquidity Rule) to promote effective liquidity risk management throughout the open-end investment company industry, thereby reducing the risk that funds will be unable to meet their redemption obligations and mitigating dilution of the interests of fund shareholders.
The Funds have adopted and implemented a liquidity risk management program (the Program) reasonably designed to assess and manage each Fund's liquidity risk and to comply with the requirements of the Liquidity Rule. Each Fund's Board of Trustees (the Board) has designated each Fund's investment adviser as administrator of the Program. The Fidelity advisers have established a Liquidity Risk Management Committee (the LRM Committee) to manage the Program for each of the Fidelity Funds. The LRM Committee monitors the adequacy and effectiveness of implementation of the Program and on a periodic basis assesses each Fund's liquidity risk based on a variety of factors including (1) the Fund's investment strategy, (2) portfolio liquidity and cash flow projections during normal and reasonably foreseeable stressed conditions, (3) shareholder redemptions, (4) borrowings and other funding sources and (5) certain factor specific to ETFs including the effect of the Fund's prices and spreads, market participants, and basket compositions on the overall liquidity of the Fund's portfolio, as applicable.
In accordance with the Program, each of the Fund's portfolio investments is classified into one of four defined liquidity categories based on a determination of a reasonable expectation for how long it would take to convert the investment to cash (or sell or dispose of the investment) without significantly changing its market value.
- Highly liquid investments - cash or convertible to cash within three business days or less
- Moderately liquid investments - convertible to cash in three to seven calendar days
- Less liquid investments - can be sold or disposed of, but not settled, within seven calendar days
- Illiquid investments - cannot be sold or disposed of within seven calendar days
Liquidity classification determinations take into account a variety of factors including various market, trading and investment-specific considerations, as well as market depth, and generally utilize analysis from a third-party liquidity metrics service.
The Liquidity Rule places a 15% limit on a fund's illiquid investments and requires funds that do not primarily hold assets that are highly liquid investments to determine and maintain a minimum percentage of the fund's net assets to be invested in highly liquid investments (highly liquid investment minimum or HLIM). The Program includes provisions reasonably designed to comply with the 15% limit on illiquid investments and for determining, periodically reviewing and complying with the HLIM requirement as applicable.
At a recent meeting of the Fund's Board of Trustees, the LRM Committee provided a written report to the Board pertaining to the operation, adequacy, and effectiveness of the Program for the period December 1, 2021 through November 30, 2022. The report concluded that the Program is operating effectively and is reasonably designed to assess and manage the Fund's liquidity risk.
1.813669.118
SELTEC-ANN-0423
Item 2.
Code of Ethics
As of the end of the period, February 28, 2023, Fidelity Select Portfolios (the trust) has adopted a code of ethics, as defined in Item 2 of Form N-CSR, that applies to its President and Treasurer and its Chief Financial Officer. A copy of the code of ethics is filed as an exhibit to this Form N-CSR.
Item 3.
Audit Committee Financial Expert
The Board of Trustees of the trust has determined that Donald F. Donahue is an audit committee financial expert, as defined in Item 3 of Form N-CSR. Mr. Donahue is independent for purposes of Item 3 of Form N-CSR.
Item 4.
Principal Accountant Fees and Services
Fees and Services
The following table presents fees billed by PricewaterhouseCoopers LLP (“PwC”) in each of the last two fiscal years for services rendered to Automotive Portfolio, Banking Portfolio, Biotechnology Portfolio, Brokerage and Investment Management Portfolio, Chemicals Portfolio, Communication Services Portfolio, Construction and Housing Portfolio, Consumer Discretionary Portfolio, Consumer Staples Portfolio, Defense and Aerospace Portfolio, Energy Portfolio, Fidelity Environment and Alternative Energy Fund, Fidelity Natural Resources Fund, Financial Services Portfolio, FinTech Portfolio, Gold Portfolio, Health Care Portfolio, Health Care Services Portfolio, Industrials Portfolio, Insurance Portfolio, IT Services Portfolio, Leisure Portfolio, Materials Portfolio, Medical Technology and Devices Portfolio, Pharmaceuticals Portfolio, Retailing Portfolio, Semiconductors Portfolio, Software and IT Services Portfolio, Tech Hardware Portfolio, Technology Portfolio, Telecommunications Portfolio, Transportation Portfolio, Utilities Portfolio and Wireless Portfolio (the “Funds”):
Services Billed by PwC
February 28, 2023 FeesA
| | | | |
| Audit Fees | Audit-Related Fees | Tax Fees | All Other Fees |
Automotive Portfolio | $28,900 | $2,600 | $6,800 | $900 |
Banking Portfolio | $29,100 | $2,600 | $6,800 | $900 |
Biotechnology Portfolio | $82,500 | $6,400 | $19,600 | $2,200 |
Brokerage and Investment Management Portfolio | $29,300 | $2,600 | $7,600 | $900 |
Chemicals Portfolio | $28,700 | $2,500 | $7,600 | $900 |
Communication Services Portfolio | $34,600 | $3,000 | $6,800 | $1,000 |
Construction and Housing Portfolio | $28,500 | $2,500 | $6,800 | $900 |
Consumer Discretionary Portfolio | $28,700 | $2,500 | $6,800 | $900 |
Consumer Staples Portfolio | $35,000 | $3,000 | $7,000 | $1,000 |
Defense and Aerospace Portfolio | $29,300 | $2,600 | $6,800 | $900 |
Energy Portfolio | $32,900 | $2,600 | $12,100 | $900 |
Fidelity Environment and Alternative Energy Fund | $28,700 | $2,500 | $6,800 | $900 |
Fidelity Natural Resources Fund | $28,200 | $2,500 | $7,600 | $900 |
Financial Services Portfolio | $29,800 | $2,600 | $7,600 | $900 |
FinTech Portfolio | $29,300 | $2,600 | $6,800 | $900 |
Gold Portfolio | $50,200 | $4,600 | $15,300 | $1,600 |
Health Care Portfolio | $41,500 | $3,500 | $7,400 | $1,200 |
Health Care Services Portfolio | $28,900 | $2,600 | $6,800 | $900 |
Industrials Portfolio | $28,700 | $2,500 | $6,800 | $900 |
Insurance Portfolio | $29,300 | $2,600 | $6,800 | $900 |
IT Services Portfolio | $29,500 | $2,600 | $8,200 | $900 |
Leisure Portfolio | $29,300 | $2,600 | $6,800 | $900 |
Materials Portfolio | $35,000 | $3,000 | $6,800 | $1,000 |
Medical Technology and Devices Portfolio | $28,900 | $2,600 | $6,800 | $900 |
Pharmaceuticals Portfolio | $28,700 | $2,500 | $6,800 | $900 |
Retailing Portfolio | $29,300 | $2,600 | $6,800 | $900 |
Semiconductors Portfolio | $29,500 | $2,600 | $8,900 | $900 |
Software and IT Services Portfolio | $28,500 | $2,500 | $7,600 | $900 |
Tech Hardware Portfolio | $32,800 | $2,600 | $8,900 | $900 |
Technology Portfolio | $33,300 | $2,900 | $8,200 | $1,000 |
Telecommunications Portfolio | $34,400 | $3,000 | $6,800 | $1,000 |
Transportation Portfolio | $31,900 | $2,600 | $8,900 | $900 |
Utilities Portfolio | $29,400 | $2,600 | $6,800 | $900 |
Wireless Portfolio | $28,200 | $2,500 | $6,800 | $900 |
| | | | |
Automotive Portfolio | $27,700 | $2,700 | $6,500 | $900 |
Banking Portfolio | $27,800 | $2,700 | $6,500 | $900 |
Biotechnology Portfolio | $78,600 | $5,400 | $18,700 | $1,800 |
Brokerage and Investment Management Portfolio | $28,100 | $2,800 | $7,300 | $900 |
Chemicals Portfolio | $27,500 | $2,700 | $6,500 | $900 |
Communication Services Portfolio | $33,200 | $3,200 | $6,500 | $1,000 |
Construction and Housing Portfolio | $27,300 | $2,700 | $6,500 | $900 |
Consumer Discretionary Portfolio | $27,500 | $2,700 | $6,500 | $900 |
Consumer Staples Portfolio | $33,500 | $3,200 | $7,400 | $1,000 |
Defense and Aerospace Portfolio | $28,100 | $2,800 | $7,200 | $900 |
Energy Portfolio | $34,600 | $2,800 | $7,600 | $900 |
Fidelity Environment and Alternative Energy Fund | $27,500 | $2,700 | $7,400 | $900 |
Fidelity Natural Resources Fund | $27,100 | $2,700 | $7,300 | $900 |
Financial Services Portfolio | $28,500 | $2,800 | $7,300 | $900 |
FinTech Portfolio | $28,100 | $2,800 | $6,500 | $900 |
Gold Portfolio | $47,900 | $4,900 | $13,400 | $1,600 |
Health Care Portfolio | $39,700 | $3,700 | $7,400 | $1,200 |
Health Care Services Portfolio | $27,700 | $2,700 | $6,500 | $900 |
Industrials Portfolio | $27,500 | $2,700 | $7,400 | $900 |
Insurance Portfolio | $28,100 | $2,800 | $6,500 | $900 |
IT Services Portfolio | $28,200 | $2,800 | $6,500 | $900 |
Leisure Portfolio | $28,100 | $2,800 | $7,400 | $900 |
Materials Portfolio | $33,500 | $3,200 | $6,500 | $1,000 |
Medical Technology and Devices Portfolio | $27,700 | $2,700 | $7,400 | $900 |
Pharmaceuticals Portfolio | $27,500 | $2,700 | $7,200 | $900 |
Retailing Portfolio | $28,100 | $2,800 | $6,500 | $900 |
Semiconductors Portfolio | $28,200 | $2,800 | $6,500 | $900 |
Software and IT Services Portfolio | $27,300 | $2,700 | $7,400 | $900 |
Tech Hardware Portfolio | $34,500 | $2,800 | $6,500 | $900 |
Technology Portfolio | $31,900 | $3,100 | $7,400 | $1,000 |
Telecommunications Portfolio | $33,000 | $3,100 | $6,500 | $1,000 |
Transportation Portfolio | $33,700 | $2,700 | $6,500 | $900 |
Utilities Portfolio | $28,100 | $2,800 | $7,300 | $900 |
Wireless Portfolio | $27,100 | $2,700 | $6,500 | $900 |
|
|
|
|
|
A Amounts may reflect rounding.
The following table(s) present(s) fees billed by PwC that were required to be approved by the Audit Committee for services that relate directly to the operations and financial reporting of the Fund(s) and that are rendered on behalf of Fidelity Management & Research Company LLC ("FMR") and entities controlling, controlled by, or under common control with FMR (not including any sub-adviser whose role is primarily
portfolio management and is subcontracted with or overseen by another investment adviser) that provide ongoing services to the Fund(s) (“Fund Service Providers”):
Services Billed by PwC
| | |
| February 28, 2023A | February 28, 2022A |
Audit-Related Fees | $7,914,600 | $8,239,800 |
Tax Fees | $1,000 | $354,200 |
All Other Fees | $- | $- |
A Amounts may reflect rounding.
“Audit-Related Fees” represent fees billed for assurance and related services that are reasonably related to the performance of the fund audit or the review of the fund's financial statements and that are not reported under Audit Fees.
“Tax Fees” represent fees billed for tax compliance, tax advice or tax planning that relate directly to the operations and financial reporting of the fund.
“All Other Fees” represent fees billed for services provided to the fund or Fund Service Provider, a significant portion of which are assurance related, that relate directly to the operations and financial reporting of the fund, excluding those services that are reported under Audit Fees, Audit-Related Fees or Tax Fees.
Assurance services must be performed by an independent public accountant.
* * *
The aggregate non-audit fees billed by PwC for services rendered to the Fund(s), FMR (not including any sub-adviser whose role is primarily portfolio management and is subcontracted with or overseen by another investment adviser), and any Fund Service Provider for each of the last two fiscal years of the Fund(s) are as follows:
| | |
Billed By | February 28, 2023A | February 28, 2022A |
PwC | $13,284,200 | $14,223,900 |
A Amounts may reflect rounding.
The trust's Audit Committee has considered non-audit services that were not pre-approved that were provided by PwC to Fund Service Providers to be compatible with maintaining the independence of PwC in its(their) audit of the Fund(s), taking into account representations from PwC, in accordance with Public Company Accounting
Oversight Board rules, regarding its independence from the Fund(s) and its(their) related entities and FMR’s review of the appropriateness and permissibility under applicable law of such non-audit services prior to their provision to the Fund(s) Service Providers.
Audit Committee Pre-Approval Policies and Procedures
The trust’s Audit Committee must pre-approve all audit and non-audit services provided by a fund’s independent registered public accounting firm relating to the operations or financial reporting of the fund. Prior to the commencement of any audit or non-audit services to a fund, the Audit Committee reviews the services to determine whether they are appropriate and permissible under applicable law.
The Audit Committee has adopted policies and procedures to, among other purposes, provide a framework for the Committee’s consideration of non-audit services by the audit firms that audit the Fidelity funds. The policies and procedures require that any non-audit service provided by a fund audit firm to a Fidelity fund and any non-audit service provided by a fund auditor to a Fund Service Provider that relates directly to the operations and financial reporting of a Fidelity fund (“Covered Service”) are subject to approval by the Audit Committee before such service is provided.
All Covered Services must be approved in advance of provision of the service either: (i) by formal resolution of the Audit Committee, or (ii) by oral or written approval of the service by the Chair of the Audit Committee (or if the Chair is unavailable, such other member of the Audit Committee as may be designated by the Chair to act in the Chair’s absence). The approval contemplated by (ii) above is permitted where the Treasurer determines that action on such an engagement is necessary before the next meeting of the Audit Committee.
Non-audit services provided by a fund audit firm to a Fund Service Provider that do not relate directly to the operations and financial reporting of a Fidelity fund are reported to the Audit Committee periodically.
Non-Audit Services Approved Pursuant to Rule 2-01(c)(7)(i)(C) and (ii) of Regulation S-X (“De Minimis Exception”)
There were no non-audit services approved or required to be approved by the Audit Committee pursuant to the De Minimis Exception during the Fund’s(s’) last two fiscal years relating to services provided to (i) the Fund(s) or (ii) any Fund Service Provider that relate directly to the operations and financial reporting of the Fund(s).
Item 5.
Audit Committee of Listed Registrants
Not applicable.
Item 6.
Investments
(a)
Not applicable.
(b)
Not applicable.
Item 7.
Disclosure of Proxy Voting Policies and Procedures for Closed-End Management Investment Companies
Not applicable.
Item 8.
Portfolio Managers of Closed-End Management Investment Companies
Not applicable.
Item 9.
Purchase of Equity Securities by Closed-End Management Investment Company and Affiliated Purchasers
Not applicable.
Item 10.
Submission of Matters to a Vote of Security Holders
There were no material changes to the procedures by which shareholders may recommend nominees to the trust’s Board of Trustees.
Item 11.
Controls and Procedures
(a)(i) The President and Treasurer and the Chief Financial Officer have concluded that the trust’s disclosure controls and procedures (as defined in Rule 30a-3(c) under the Investment Company Act) provide reasonable assurances that material information relating to the trust is made known to them by the appropriate persons, based on their evaluation of these controls and procedures as of a date within 90 days of the filing date of this report.
(a)(ii) There was no change in the trust’s internal control over financial reporting (as defined in Rule 30a-3(d) under the Investment Company Act) that occurred during the period covered by this report that has materially affected, or is reasonably likely to materially affect, the trust’s internal control over financial reporting.
Item 12.
Disclosure of Securities Lending Activities for Closed-End Management
Investment Companies
Not applicable.
Item 13.
Exhibits
SIGNATURES
Pursuant to the requirements of the Securities Exchange Act of 1934 and the Investment Company Act of 1940, the registrant has duly caused this report to be signed on its behalf by the undersigned, thereunto duly authorized.
Fidelity Select Portfolios
| |
By: | /s/Stacie M. Smith |
| Stacie M. Smith |
| President and Treasurer |
|
|
Date: | April 20, 2023 |
Pursuant to the requirements of the Securities Exchange Act of 1934 and the Investment Company Act of 1940, this report has been signed below by the following persons on behalf of the registrant and in the capacities and on the dates indicated.
| |
By: | /s/Stacie M. Smith |
| Stacie M. Smith |
| President and Treasurer |
|
|
Date: | April 20, 2023 |
| |
By: | /s/John J. Burke III |
| John J. Burke III |
| Chief Financial Officer |
|
|
Date: | April 20, 2023 |