UNITED STATES
SECURITIES AND EXCHANGE COMMISSION
Washington, D.C. 20549
FORM N-CSR
CERTIFIED SHAREHOLDER REPORT OF REGISTERED
MANAGEMENT INVESTMENT COMPANIES
Investment Company Act file number 811-03114
Fidelity Select Portfolios
(Exact name of registrant as specified in charter)
245 Summer St., Boston, MA 02210
(Address of principal executive offices) (Zip code)
Nicole Macarchuk, Secretary
245 Summer St.
Boston, Massachusetts 02210
(Name and address of agent for service)
Registrant's telephone number, including area code:
617-563-7000
Date of fiscal year end: | February 29 |
Date of reporting period: | August 31, 2024 |
Item 1.
Reports to Stockholders
SEMI-ANNUAL SHAREHOLDER REPORT | AS OF AUGUST 31, 2024 | ||
| | Fidelity® Natural Resources Fund Fidelity® Natural Resources Fund : FNARX | |
| Costs of a $10,000 investment | Costs paid as a percentage of a $10,000 investment | ||
| Fidelity® Natural Resources Fund | $ 37 | 0.70% |
KEY FACTS | ||
| Fund Size | $648,226,804 | |
| Number of Holdings | 38 | |
| Portfolio Turnover | 56% |
(as of August 31, 2024)
TOP INDUSTRIES (% of Fund's net assets) | ||
| Oil, Gas & Consumable Fuels | 70.1 | |
| Metals & Mining | 18.0 | |
| Containers & Packaging | 6.3 | |
| Energy Equipment & Services | 4.9 | |
| Common Stocks | 99.3 |
| Short-Term Investments and Net Other Assets (Liabilities) | 0.7 |
ASSET ALLOCATION (% of Fund's net assets) |
 |
| United States | 58.8 |
| Canada | 29.5 |
| Portugal | 4.8 |
| Zambia | 2.5 |
| United Kingdom | 1.8 |
| Brazil | 1.6 |
| Ghana | 1.0 |
GEOGRAPHIC DIVERSIFICATION (% of Fund's net assets) |
 |
TOP HOLDINGS (% of Fund's net assets) | ||
| Exxon Mobil Corp | 22.5 | |
| Imperial Oil Ltd | 8.9 | |
| Shell PLC ADR | 8.3 | |
| MEG Energy Corp | 5.6 | |
| Valero Energy Corp | 4.9 | |
| Galp Energia SGPS SA | 4.8 | |
| Phillips 66 | 3.4 | |
| Athabasca Oil Corp | 3.1 | |
| Agnico Eagle Mines Ltd (United States) | 2.8 | |
| Freeport-McMoRan Inc | 2.7 | |
| 67.0 |
| Fidelity, the Fidelity Investments Logo and all other Fidelity trademarks or service marks used herein are trademarks or service marks of FMR LLC. Any third-party marks that are used herein are trademarks or service marks of their respective owners. © 2024 FMR LLC. All rights reserved. | ||
 | For additional information about the Fund; including its prospectus, financial information, holdings and proxy information, scan the QR code or visit fundresearch.fidelity.com/prospectus/sec 1.9914555.100 514-TSRS-1024 | |
SEMI-ANNUAL SHAREHOLDER REPORT | AS OF AUGUST 31, 2024 | ||
| | Utilities Portfolio Utilities Portfolio : FSUTX | |
| Costs of a $10,000 investment | Costs paid as a percentage of a $10,000 investment | ||
| Utilities Portfolio | $ 38 | 0.67% |
KEY FACTS | ||
| Fund Size | $1,538,756,649 | |
| Number of Holdings | 31 | |
| Portfolio Turnover | 55% |
(as of August 31, 2024)
TOP INDUSTRIES (% of Fund's net assets) | ||
| Electric Utilities | 62.2 | |
| Multi-Utilities | 25.2 | |
| Independent Power and Renewable Electricity Producers | 9.5 | |
| Gas Utilities | 2.1 | |
| Common Stocks | 99.0 |
| Short-Term Investments and Net Other Assets (Liabilities) | 1.0 |
ASSET ALLOCATION (% of Fund's net assets) |
 |
| United States | 100.0 |
GEOGRAPHIC DIVERSIFICATION (% of Fund's net assets) |
 |
TOP HOLDINGS (% of Fund's net assets) | ||
| NextEra Energy Inc | 13.0 | |
| Sempra | 7.1 | |
| PG&E Corp | 6.3 | |
| Edison International | 6.0 | |
| American Electric Power Co Inc | 5.4 | |
| Public Service Enterprise Group Inc | 5.3 | |
| Entergy Corp | 4.8 | |
| Constellation Energy Corp | 4.8 | |
| Eversource Energy | 4.5 | |
| FirstEnergy Corp | 4.2 | |
| 61.4 |
| Fidelity, the Fidelity Investments Logo and all other Fidelity trademarks or service marks used herein are trademarks or service marks of FMR LLC. Any third-party marks that are used herein are trademarks or service marks of their respective owners. © 2024 FMR LLC. All rights reserved. | ||
 | For additional information about the Fund; including its prospectus, financial information, holdings and proxy information, scan the QR code or visit fundresearch.fidelity.com/prospectus/sec 1.9914501.100 65-TSRS-1024 | |
SEMI-ANNUAL SHAREHOLDER REPORT | AS OF AUGUST 31, 2024 | ||
| | Consumer Staples Portfolio Fidelity Advisor® Consumer Staples Fund Class Z : FIJCX | |
| Costs of a $10,000 investment | Costs paid as a percentage of a $10,000 investment | ||
| Class Z | $ 31 | 0.58% |
KEY FACTS | ||
| Fund Size | $1,405,206,341 | |
| Number of Holdings | 39 | |
| Portfolio Turnover | 39% |
(as of August 31, 2024)
TOP INDUSTRIES (% of Fund's net assets) | ||
| Beverages | 39.6 | |
| Household Products | 18.8 | |
| Food Products | 14.3 | |
| Consumer Staples Distribution & Retail | 10.8 | |
| Personal Care Products | 9.7 | |
| Tobacco | 6.4 | |
| Oil, Gas & Consumable Fuels | 0.1 | |
| Common Stocks | 99.7 |
| Short-Term Investments and Net Other Assets (Liabilities) | 0.3 |
ASSET ALLOCATION (% of Fund's net assets) |
 |
| United States | 95.1 |
| United Kingdom | 4.8 |
| Canada | 0.1 |
GEOGRAPHIC DIVERSIFICATION (% of Fund's net assets) |
 |
TOP HOLDINGS (% of Fund's net assets) | ||
| Coca-Cola Co/The | 14.2 | |
| Procter & Gamble Co/The | 14.2 | |
| Keurig Dr Pepper Inc | 9.8 | |
| Kenvue Inc | 6.3 | |
| Walmart Inc | 5.5 | |
| Philip Morris International Inc | 4.2 | |
| Monster Beverage Corp | 3.9 | |
| Energizer Holdings Inc | 3.8 | |
| PepsiCo Inc | 3.6 | |
| Estee Lauder Cos Inc/The Class A | 3.4 | |
| 68.9 |
| Fidelity, the Fidelity Investments Logo and all other Fidelity trademarks or service marks used herein are trademarks or service marks of FMR LLC. Any third-party marks that are used herein are trademarks or service marks of their respective owners. © 2024 FMR LLC. All rights reserved. | ||
 | For additional information about the Fund; including its prospectus, financial information, holdings and proxy information, scan the QR code or visit fundresearch.fidelity.com/prospectus/sec 1.9914494.100 3234-TSRS-1024 | |
SEMI-ANNUAL SHAREHOLDER REPORT | AS OF AUGUST 31, 2024 | ||
| | Consumer Staples Portfolio Fidelity Advisor® Consumer Staples Fund Class M : FDTGX | |
| Costs of a $10,000 investment | Costs paid as a percentage of a $10,000 investment | ||
| Class M | $ 64 | 1.22% |
KEY FACTS | ||
| Fund Size | $1,405,206,341 | |
| Number of Holdings | 39 | |
| Portfolio Turnover | 39% |
(as of August 31, 2024)
TOP INDUSTRIES (% of Fund's net assets) | ||
| Beverages | 39.6 | |
| Household Products | 18.8 | |
| Food Products | 14.3 | |
| Consumer Staples Distribution & Retail | 10.8 | |
| Personal Care Products | 9.7 | |
| Tobacco | 6.4 | |
| Oil, Gas & Consumable Fuels | 0.1 | |
| Common Stocks | 99.7 |
| Short-Term Investments and Net Other Assets (Liabilities) | 0.3 |
ASSET ALLOCATION (% of Fund's net assets) |
|
| United States | 95.1 |
| United Kingdom | 4.8 |
| Canada | 0.1 |
GEOGRAPHIC DIVERSIFICATION (% of Fund's net assets) |
|
TOP HOLDINGS (% of Fund's net assets) | ||
| Coca-Cola Co/The | 14.2 | |
| Procter & Gamble Co/The | 14.2 | |
| Keurig Dr Pepper Inc | 9.8 | |
| Kenvue Inc | 6.3 | |
| Walmart Inc | 5.5 | |
| Philip Morris International Inc | 4.2 | |
| Monster Beverage Corp | 3.9 | |
| Energizer Holdings Inc | 3.8 | |
| PepsiCo Inc | 3.6 | |
| Estee Lauder Cos Inc/The Class A | 3.4 | |
| 68.9 |
| Fidelity, the Fidelity Investments Logo and all other Fidelity trademarks or service marks used herein are trademarks or service marks of FMR LLC. Any third-party marks that are used herein are trademarks or service marks of their respective owners. © 2024 FMR LLC. All rights reserved. | ||
 | For additional information about the Fund; including its prospectus, financial information, holdings and proxy information, scan the QR code or visit fundresearch.fidelity.com/prospectus/sec 1.9914492.100 1782-TSRS-1024 | |
SEMI-ANNUAL SHAREHOLDER REPORT | AS OF AUGUST 31, 2024 | ||
| | Gold Portfolio Fidelity Advisor® Gold Fund Class Z : FIJDX | |
| Costs of a $10,000 investment | Costs paid as a percentage of a $10,000 investment | ||
| Class Z | $ 37 | 0.60% |
KEY FACTS | ||
| Fund Size | $1,501,574,716 | |
| Number of Holdings | 65 | |
| Portfolio Turnover | 13% |
(as of August 31, 2024)
TOP INDUSTRIES (% of Fund's net assets) | ||
| Metals & Mining* | 98.4 | |
| Financial Services | 0.0 | |
| Common Stocks | 98.4 |
| Other Investments | 0.9 |
| Short-Term Investments and Net Other Assets (Liabilities) | 0.7 |
ASSET ALLOCATION (% of Fund's net assets) |
 |
| Canada | 60.3 |
| United States | 15.8 |
| Brazil | 10.3 |
| Australia | 6.3 |
| United Kingdom | 2.3 |
| South Africa | 1.9 |
| China | 1.5 |
| Burkina Faso | 1.3 |
| Egypt | 0.3 |
GEOGRAPHIC DIVERSIFICATION (% of Fund's net assets) |
 |
TOP HOLDINGS (% of Fund's net assets) | ||
| Agnico Eagle Mines Ltd | 14.8 | |
| Newmont Corp | 11.6 | |
| Wheaton Precious Metals Corp | 10.3 | |
| Franco-Nevada Corp | 9.3 | |
| Barrick Gold Corp | 4.9 | |
| Alamos Gold Inc Class A | 4.1 | |
| Northern Star Resources Ltd | 3.8 | |
| Osisko Gold Royalties Ltd | 2.7 | |
| Anglogold Ashanti Plc | 2.3 | |
| Lundin Gold Inc | 2.3 | |
| 66.1 |
| Fidelity, the Fidelity Investments Logo and all other Fidelity trademarks or service marks used herein are trademarks or service marks of FMR LLC. Any third-party marks that are used herein are trademarks or service marks of their respective owners. © 2024 FMR LLC. All rights reserved. | ||
 | For additional information about the Fund; including its prospectus, financial information, holdings and proxy information, scan the QR code or visit fundresearch.fidelity.com/prospectus/sec 1.9914522.100 3235-TSRS-1024 | |
SEMI-ANNUAL SHAREHOLDER REPORT | AS OF AUGUST 31, 2024 | ||
| | Gold Portfolio Fidelity Advisor® Gold Fund Class I : FGDIX | |
| Costs of a $10,000 investment | Costs paid as a percentage of a $10,000 investment | ||
| Class I | $ 45 | 0.72% |
KEY FACTS | ||
| Fund Size | $1,501,574,716 | |
| Number of Holdings | 65 | |
| Portfolio Turnover | 13% |
(as of August 31, 2024)
TOP INDUSTRIES (% of Fund's net assets) | ||
| Metals & Mining* | 98.4 | |
| Financial Services | 0.0 | |
| Common Stocks | 98.4 |
| Other Investments | 0.9 |
| Short-Term Investments and Net Other Assets (Liabilities) | 0.7 |
ASSET ALLOCATION (% of Fund's net assets) |
|
| Canada | 60.3 |
| United States | 15.8 |
| Brazil | 10.3 |
| Australia | 6.3 |
| United Kingdom | 2.3 |
| South Africa | 1.9 |
| China | 1.5 |
| Burkina Faso | 1.3 |
| Egypt | 0.3 |
GEOGRAPHIC DIVERSIFICATION (% of Fund's net assets) |
|
TOP HOLDINGS (% of Fund's net assets) | ||
| Agnico Eagle Mines Ltd | 14.8 | |
| Newmont Corp | 11.6 | |
| Wheaton Precious Metals Corp | 10.3 | |
| Franco-Nevada Corp | 9.3 | |
| Barrick Gold Corp | 4.9 | |
| Alamos Gold Inc Class A | 4.1 | |
| Northern Star Resources Ltd | 3.8 | |
| Osisko Gold Royalties Ltd | 2.7 | |
| Anglogold Ashanti Plc | 2.3 | |
| Lundin Gold Inc | 2.3 | |
| 66.1 |
| Fidelity, the Fidelity Investments Logo and all other Fidelity trademarks or service marks used herein are trademarks or service marks of FMR LLC. Any third-party marks that are used herein are trademarks or service marks of their respective owners. © 2024 FMR LLC. All rights reserved. | ||
 | For additional information about the Fund; including its prospectus, financial information, holdings and proxy information, scan the QR code or visit fundresearch.fidelity.com/prospectus/sec 1.9914521.100 1788-TSRS-1024 | |
SEMI-ANNUAL SHAREHOLDER REPORT | AS OF AUGUST 31, 2024 | ||
| | Consumer Staples Portfolio Fidelity Advisor® Consumer Staples Fund Class C : FDCGX | |
| Costs of a $10,000 investment | Costs paid as a percentage of a $10,000 investment | ||
| Class C | $ 91 | 1.72% |
KEY FACTS | ||
| Fund Size | $1,405,206,341 | |
| Number of Holdings | 39 | |
| Portfolio Turnover | 39% |
(as of August 31, 2024)
TOP INDUSTRIES (% of Fund's net assets) | ||
| Beverages | 39.6 | |
| Household Products | 18.8 | |
| Food Products | 14.3 | |
| Consumer Staples Distribution & Retail | 10.8 | |
| Personal Care Products | 9.7 | |
| Tobacco | 6.4 | |
| Oil, Gas & Consumable Fuels | 0.1 | |
| Common Stocks | 99.7 |
| Short-Term Investments and Net Other Assets (Liabilities) | 0.3 |
ASSET ALLOCATION (% of Fund's net assets) |
|
| United States | 95.1 |
| United Kingdom | 4.8 |
| Canada | 0.1 |
GEOGRAPHIC DIVERSIFICATION (% of Fund's net assets) |
|
TOP HOLDINGS (% of Fund's net assets) | ||
| Coca-Cola Co/The | 14.2 | |
| Procter & Gamble Co/The | 14.2 | |
| Keurig Dr Pepper Inc | 9.8 | |
| Kenvue Inc | 6.3 | |
| Walmart Inc | 5.5 | |
| Philip Morris International Inc | 4.2 | |
| Monster Beverage Corp | 3.9 | |
| Energizer Holdings Inc | 3.8 | |
| PepsiCo Inc | 3.6 | |
| Estee Lauder Cos Inc/The Class A | 3.4 | |
| 68.9 |
| Fidelity, the Fidelity Investments Logo and all other Fidelity trademarks or service marks used herein are trademarks or service marks of FMR LLC. Any third-party marks that are used herein are trademarks or service marks of their respective owners. © 2024 FMR LLC. All rights reserved. | ||
 | For additional information about the Fund; including its prospectus, financial information, holdings and proxy information, scan the QR code or visit fundresearch.fidelity.com/prospectus/sec 1.9914491.100 1781-TSRS-1024 | |
SEMI-ANNUAL SHAREHOLDER REPORT | AS OF AUGUST 31, 2024 | ||
| | Software and IT Services Portfolio Software and IT Services Portfolio : FSCSX | |
| Costs of a $10,000 investment | Costs paid as a percentage of a $10,000 investment | ||
| Software and IT Services Portfolio | $ 31 | 0.62% |
KEY FACTS | ||
| Fund Size | $10,347,141,434 | |
| Number of Holdings | 50 | |
| Portfolio Turnover | 14% |
(as of August 31, 2024)
TOP INDUSTRIES (% of Fund's net assets) | ||
| Software | 71.9 | |
| IT Services | 15.5 | |
| Financial Services | 5.2 | |
| Interactive Media & Services | 3.6 | |
| Professional Services | 1.1 | |
| Common Stocks | 97.3 |
| Short-Term Investments and Net Other Assets (Liabilities) | 2.7 |
ASSET ALLOCATION (% of Fund's net assets) |
 |
| United States | 95.1 |
| Ireland | 2.7 |
| France | 1.4 |
| Canada | 0.5 |
| Netherlands | 0.3 |
GEOGRAPHIC DIVERSIFICATION (% of Fund's net assets) |
 |
TOP HOLDINGS (% of Fund's net assets) | ||
| Microsoft Corp | 25.0 | |
| Adobe Inc | 8.1 | |
| Salesforce Inc | 7.3 | |
| Autodesk Inc | 3.1 | |
| Workday Inc Class A | 2.9 | |
| Palo Alto Networks Inc | 2.8 | |
| Accenture PLC Class A | 2.7 | |
| Oracle Corp | 2.4 | |
| Alphabet Inc Class A | 2.2 | |
| Atlassian Corp Class A | 2.1 | |
| 58.6 |
| Fidelity, the Fidelity Investments Logo and all other Fidelity trademarks or service marks used herein are trademarks or service marks of FMR LLC. Any third-party marks that are used herein are trademarks or service marks of their respective owners. © 2024 FMR LLC. All rights reserved. | ||
 | For additional information about the Fund; including its prospectus, financial information, holdings and proxy information, scan the QR code or visit fundresearch.fidelity.com/prospectus/sec 1.9914496.100 28-TSRS-1024 | |
SEMI-ANNUAL SHAREHOLDER REPORT | AS OF AUGUST 31, 2024 | ||
| | Materials Portfolio Fidelity Advisor® Materials Fund Class M : FMFTX | |
| Costs of a $10,000 investment | Costs paid as a percentage of a $10,000 investment | ||
| Class M | $ 64 | 1.24% |
KEY FACTS | ||
| Fund Size | $849,835,612 | |
| Number of Holdings | 39 | |
| Portfolio Turnover | 59% |
(as of August 31, 2024)
TOP INDUSTRIES (% of Fund's net assets) | ||
| Chemicals | 61.6 | |
| Metals & Mining | 25.3 | |
| Containers & Packaging | 7.9 | |
| Construction Materials | 4.4 | |
| Common Stocks | 99.2 |
| Short-Term Investments and Net Other Assets (Liabilities) | 0.8 |
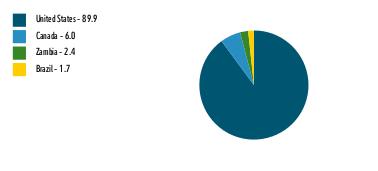
ASSET ALLOCATION (% of Fund's net assets) |
 |
| United States | 89.9 |
| Canada | 6.0 |
| Zambia | 2.4 |
| Brazil | 1.7 |
GEOGRAPHIC DIVERSIFICATION (% of Fund's net assets) |
 |
TOP HOLDINGS (% of Fund's net assets) | ||
| Linde PLC | 19.1 | |
| Ecolab Inc | 10.2 | |
| Dow Inc | 6.9 | |
| Air Products and Chemicals Inc | 5.4 | |
| Freeport-McMoRan Inc | 5.0 | |
| Corteva Inc | 3.9 | |
| Nucor Corp | 3.9 | |
| Axalta Coating Systems Ltd | 3.6 | |
| Chemours Co/The | 3.3 | |
| First Quantum Minerals Ltd | 2.4 | |
| 63.7 |
| Fidelity, the Fidelity Investments Logo and all other Fidelity trademarks or service marks used herein are trademarks or service marks of FMR LLC. Any third-party marks that are used herein are trademarks or service marks of their respective owners. © 2024 FMR LLC. All rights reserved. | ||
 | For additional information about the Fund; including its prospectus, financial information, holdings and proxy information, scan the QR code or visit fundresearch.fidelity.com/prospectus/sec 1.9914549.100 1792-TSRS-1024 | |
SEMI-ANNUAL SHAREHOLDER REPORT | AS OF AUGUST 31, 2024 | ||
| | Telecommunications Portfolio Telecommunications Portfolio : FSTCX | |
| Costs of a $10,000 investment | Costs paid as a percentage of a $10,000 investment | ||
| Telecommunications Portfolio | $ 41 | 0.76% |
KEY FACTS | ||
| Fund Size | $196,158,282 | |
| Number of Holdings | 27 | |
| Portfolio Turnover | 29% |
(as of August 31, 2024)
TOP INDUSTRIES (% of Fund's net assets) | ||
| Diversified Telecommunication Services | 75.8 | |
| Wireless Telecommunication Services | 12.7 | |
| Media | 4.1 | |
| IT Services | 0.6 | |
| Construction & Engineering | 0.2 | |
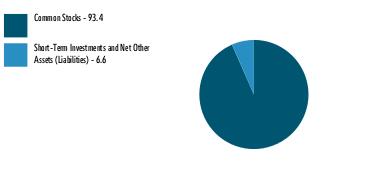
| Common Stocks | 93.4 |
| Short-Term Investments and Net Other Assets (Liabilities) | 6.6 |
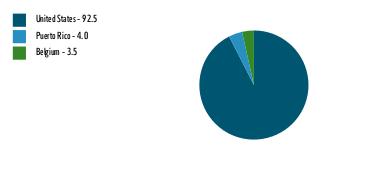
ASSET ALLOCATION (% of Fund's net assets) |
 |
| United States | 92.5 |
| Puerto Rico | 4.0 |
| Belgium | 3.5 |
GEOGRAPHIC DIVERSIFICATION (% of Fund's net assets) |
 |
TOP HOLDINGS (% of Fund's net assets) | ||
| AT&T Inc | 23.3 | |
| Verizon Communications Inc | 19.7 | |
| Lumen Technologies Inc | 6.2 | |
| Cogent Communications Holdings Inc | 4.9 | |
| T-Mobile US Inc | 4.8 | |
| Iridium Communications Inc | 4.8 | |
| Liberty Latin America Ltd Class C | 4.0 | |
| Liberty Global Ltd Class C | 3.5 | |
| Telephone and Data Systems Inc | 3.4 | |
| Gogo Inc | 2.9 | |
| 77.5 |
| Fidelity, the Fidelity Investments Logo and all other Fidelity trademarks or service marks used herein are trademarks or service marks of FMR LLC. Any third-party marks that are used herein are trademarks or service marks of their respective owners. © 2024 FMR LLC. All rights reserved. | ||
 | For additional information about the Fund; including its prospectus, financial information, holdings and proxy information, scan the QR code or visit fundresearch.fidelity.com/prospectus/sec 1.9914517.100 96-TSRS-1024 | |
SEMI-ANNUAL SHAREHOLDER REPORT | AS OF AUGUST 31, 2024 | ||
| | Communication Services Portfolio Fidelity Advisor® Communication Services Fund Class M : FGEMX | |
| Costs of a $10,000 investment | Costs paid as a percentage of a $10,000 investment | ||
| Class M | $ 63 | 1.21% |
KEY FACTS | ||
| Fund Size | $1,564,235,226 | |
| Number of Holdings | 49 | |
| Portfolio Turnover | 39% |
(as of August 31, 2024)
TOP INDUSTRIES (% of Fund's net assets) | ||
| Interactive Media & Services | 52.6 | |
| Entertainment | 22.6 | |
| Media | 8.0 | |
| Diversified Telecommunication Services | 7.9 | |
| Broadline Retail | 5.3 | |
| Ground Transportation | 2.5 | |
| IT Services | 0.0 | |
| Consumer Staples Distribution & Retail | 0.0 | |
| Software | 0.0 | |
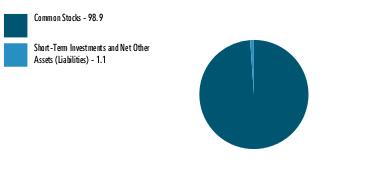
| Common Stocks | 98.9 |
| Short-Term Investments and Net Other Assets (Liabilities) | 1.1 |
ASSET ALLOCATION (% of Fund's net assets) |
 |
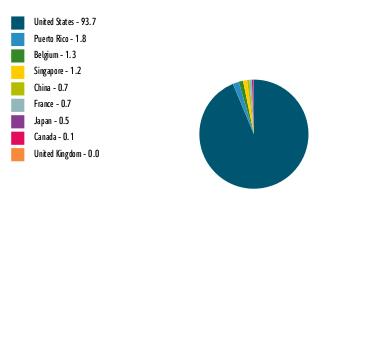
| United States | 93.7 |
| Puerto Rico | 1.8 |
| Belgium | 1.3 |
| Singapore | 1.2 |
| China | 0.7 |
| France | 0.7 |
| Japan | 0.5 |
| Canada | 0.1 |
| United Kingdom | 0.0 |
GEOGRAPHIC DIVERSIFICATION (% of Fund's net assets) |
 |
TOP HOLDINGS (% of Fund's net assets) | ||
| Meta Platforms Inc Class A | 24.9 | |
| Alphabet Inc Class A | 22.6 | |
| AT&T Inc | 4.8 | |
| Walt Disney Co/The | 4.6 | |
| Amazon.com Inc | 4.6 | |
| Netflix Inc | 4.6 | |
| Charter Communications Inc Class A | 2.6 | |
| Uber Technologies Inc | 2.5 | |
| Liberty Media Corp-Liberty Formula One Class A | 2.3 | |
| Comcast Corp Class A | 2.3 | |
| 75.8 |
| Fidelity, the Fidelity Investments Logo and all other Fidelity trademarks or service marks used herein are trademarks or service marks of FMR LLC. Any third-party marks that are used herein are trademarks or service marks of their respective owners. © 2024 FMR LLC. All rights reserved. | ||
 | For additional information about the Fund; including its prospectus, financial information, holdings and proxy information, scan the QR code or visit fundresearch.fidelity.com/prospectus/sec 1.9914540.100 3325-TSRS-1024 | |
SEMI-ANNUAL SHAREHOLDER REPORT | AS OF AUGUST 31, 2024 | ||
| | Materials Portfolio Fidelity Advisor® Materials Fund Class Z : FIJFX | |
| Costs of a $10,000 investment | Costs paid as a percentage of a $10,000 investment | ||
| Class Z | $ 30 | 0.58% |
KEY FACTS | ||
| Fund Size | $849,835,612 | |
| Number of Holdings | 39 | |
| Portfolio Turnover | 59% |
(as of August 31, 2024)
TOP INDUSTRIES (% of Fund's net assets) | ||
| Chemicals | 61.6 | |
| Metals & Mining | 25.3 | |
| Containers & Packaging | 7.9 | |
| Construction Materials | 4.4 | |
| Common Stocks | 99.2 |
| Short-Term Investments and Net Other Assets (Liabilities) | 0.8 |
ASSET ALLOCATION (% of Fund's net assets) |
|
| United States | 89.9 |
| Canada | 6.0 |
| Zambia | 2.4 |
| Brazil | 1.7 |
GEOGRAPHIC DIVERSIFICATION (% of Fund's net assets) |
|
TOP HOLDINGS (% of Fund's net assets) | ||
| Linde PLC | 19.1 | |
| Ecolab Inc | 10.2 | |
| Dow Inc | 6.9 | |
| Air Products and Chemicals Inc | 5.4 | |
| Freeport-McMoRan Inc | 5.0 | |
| Corteva Inc | 3.9 | |
| Nucor Corp | 3.9 | |
| Axalta Coating Systems Ltd | 3.6 | |
| Chemours Co/The | 3.3 | |
| First Quantum Minerals Ltd | 2.4 | |
| 63.7 |
| Fidelity, the Fidelity Investments Logo and all other Fidelity trademarks or service marks used herein are trademarks or service marks of FMR LLC. Any third-party marks that are used herein are trademarks or service marks of their respective owners. © 2024 FMR LLC. All rights reserved. | ||
 | For additional information about the Fund; including its prospectus, financial information, holdings and proxy information, scan the QR code or visit fundresearch.fidelity.com/prospectus/sec 1.9914551.100 3236-TSRS-1024 | |
SEMI-ANNUAL SHAREHOLDER REPORT | AS OF AUGUST 31, 2024 | ||
| | Communication Services Portfolio Fidelity Advisor® Communication Services Fund Class Z : FGKMX | |
| Costs of a $10,000 investment | Costs paid as a percentage of a $10,000 investment | ||
| Class Z | $ 30 | 0.58% |
KEY FACTS | ||
| Fund Size | $1,564,235,226 | |
| Number of Holdings | 49 | |
| Portfolio Turnover | 39% |
(as of August 31, 2024)
TOP INDUSTRIES (% of Fund's net assets) | ||
| Interactive Media & Services | 52.6 | |
| Entertainment | 22.6 | |
| Media | 8.0 | |
| Diversified Telecommunication Services | 7.9 | |
| Broadline Retail | 5.3 | |
| Ground Transportation | 2.5 | |
| IT Services | 0.0 | |
| Consumer Staples Distribution & Retail | 0.0 | |
| Software | 0.0 | |
| Common Stocks | 98.9 |
| Short-Term Investments and Net Other Assets (Liabilities) | 1.1 |
ASSET ALLOCATION (% of Fund's net assets) |
|
| United States | 93.7 |
| Puerto Rico | 1.8 |
| Belgium | 1.3 |
| Singapore | 1.2 |
| China | 0.7 |
| France | 0.7 |
| Japan | 0.5 |
| Canada | 0.1 |
| United Kingdom | 0.0 |
GEOGRAPHIC DIVERSIFICATION (% of Fund's net assets) |
|
TOP HOLDINGS (% of Fund's net assets) | ||
| Meta Platforms Inc Class A | 24.9 | |
| Alphabet Inc Class A | 22.6 | |
| AT&T Inc | 4.8 | |
| Walt Disney Co/The | 4.6 | |
| Amazon.com Inc | 4.6 | |
| Netflix Inc | 4.6 | |
| Charter Communications Inc Class A | 2.6 | |
| Uber Technologies Inc | 2.5 | |
| Liberty Media Corp-Liberty Formula One Class A | 2.3 | |
| Comcast Corp Class A | 2.3 | |
| 75.8 |
| Fidelity, the Fidelity Investments Logo and all other Fidelity trademarks or service marks used herein are trademarks or service marks of FMR LLC. Any third-party marks that are used herein are trademarks or service marks of their respective owners. © 2024 FMR LLC. All rights reserved. | ||
 | For additional information about the Fund; including its prospectus, financial information, holdings and proxy information, scan the QR code or visit fundresearch.fidelity.com/prospectus/sec 1.9914543.100 3328-TSRS-1024 | |
SEMI-ANNUAL SHAREHOLDER REPORT | AS OF AUGUST 31, 2024 | ||
| | Industrials Portfolio Industrials Portfolio : FCYIX | |
| Costs of a $10,000 investment | Costs paid as a percentage of a $10,000 investment | ||
| Industrials Portfolio | $ 36 | 0.69% |
KEY FACTS | ||
| Fund Size | $591,125,639 | |
| Number of Holdings | 51 | |
| Portfolio Turnover | 37% |
(as of August 31, 2024)
TOP INDUSTRIES (% of Fund's net assets) | ||
| Aerospace & Defense | 22.7 | |
| Machinery | 19.6 | |
| Ground Transportation | 13.2 | |
| Electrical Equipment | 12.8 | |
| Building Products | 11.5 | |
| Trading Companies & Distributors | 5.7 | |
| Construction & Engineering | 3.8 | |
| Professional Services | 3.4 | |
| Commercial Services & Supplies | 3.2 | |
| Others | 3.7 | |
| Common Stocks | 99.6 |
| Short-Term Investments and Net Other Assets (Liabilities) | 0.4 |
ASSET ALLOCATION (% of Fund's net assets) |
 |
| United States | 100.0 |
GEOGRAPHIC DIVERSIFICATION (% of Fund's net assets) |
 |
TOP HOLDINGS (% of Fund's net assets) | ||
| General Electric Co | 6.4 | |
| Union Pacific Corp | 5.1 | |
| Howmet Aerospace Inc | 4.7 | |
| Parker-Hannifin Corp | 4.3 | |
| Ingersoll Rand Inc | 4.3 | |
| Trane Technologies PLC | 4.1 | |
| TransDigm Group Inc | 3.9 | |
| Boeing Co | 3.8 | |
| GE Vernova Inc | 3.4 | |
| Eaton Corp PLC | 3.3 | |
| 43.3 |
| Fidelity, the Fidelity Investments Logo and all other Fidelity trademarks or service marks used herein are trademarks or service marks of FMR LLC. Any third-party marks that are used herein are trademarks or service marks of their respective owners. © 2024 FMR LLC. All rights reserved. | ||
 | For additional information about the Fund; including its prospectus, financial information, holdings and proxy information, scan the QR code or visit fundresearch.fidelity.com/prospectus/sec 1.9914556.100 515-TSRS-1024 | |
SEMI-ANNUAL SHAREHOLDER REPORT | AS OF AUGUST 31, 2024 | ||
| | Banking Portfolio Banking Portfolio : FSRBX | |
| Costs of a $10,000 investment | Costs paid as a percentage of a $10,000 investment | ||
| Banking Portfolio | $ 40 | 0.71% |
KEY FACTS | ||
| Fund Size | $439,247,104 | |
| Number of Holdings | 37 | |
| Portfolio Turnover | 29% |
(as of August 31, 2024)
TOP INDUSTRIES (% of Fund's net assets) | ||
| Banks | 97.6 | |
| Capital Markets | 2.5 | |
| Financial Services | 0.0 | |
| Consumer Finance | 0.0 | |
| Common Stocks | 100.1 |
ASSET ALLOCATION (% of Fund's net assets) |
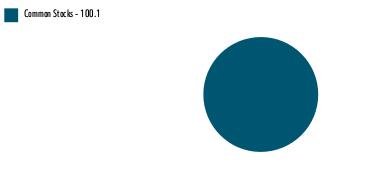 |
| Short-Term Investments and Net Other Assets (Liabilities) - (0.1)% |
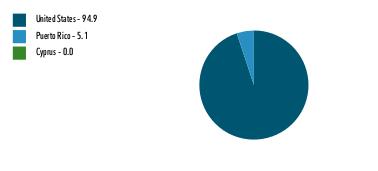
| United States | 94.9 |
| Puerto Rico | 5.1 |
| Cyprus | 0.0 |
GEOGRAPHIC DIVERSIFICATION (% of Fund's net assets) |
 |
TOP HOLDINGS (% of Fund's net assets) | ||
| Wells Fargo & Co | 7.5 | |
| Bank of America Corp | 6.8 | |
| M&T Bank Corp | 6.2 | |
| Citigroup Inc | 5.6 | |
| US Bancorp | 5.4 | |
| PNC Financial Services Group Inc/The | 5.3 | |
| Popular Inc | 5.1 | |
| KeyCorp | 4.0 | |
| Heartland Financial USA Inc | 3.5 | |
| Huntington Bancshares Inc/OH | 3.4 | |
| 52.8 |
| Fidelity, the Fidelity Investments Logo and all other Fidelity trademarks or service marks used herein are trademarks or service marks of FMR LLC. Any third-party marks that are used herein are trademarks or service marks of their respective owners. © 2024 FMR LLC. All rights reserved. | ||
 | For additional information about the Fund; including its prospectus, financial information, holdings and proxy information, scan the QR code or visit fundresearch.fidelity.com/prospectus/sec 1.9914546.100 507-TSRS-1024 | |
SEMI-ANNUAL SHAREHOLDER REPORT | AS OF AUGUST 31, 2024 | ||
| | Telecommunications Portfolio Fidelity Advisor® Telecommunications Fund Class Z : FIJGX | |
| Costs of a $10,000 investment | Costs paid as a percentage of a $10,000 investment | ||
| Class Z | $ 35 | 0.65% |
KEY FACTS | ||
| Fund Size | $196,158,282 | |
| Number of Holdings | 27 | |
| Portfolio Turnover | 29% |
(as of August 31, 2024)
TOP INDUSTRIES (% of Fund's net assets) | ||
| Diversified Telecommunication Services | 75.8 | |
| Wireless Telecommunication Services | 12.7 | |
| Media | 4.1 | |
| IT Services | 0.6 | |
| Construction & Engineering | 0.2 | |
| Common Stocks | 93.4 |
| Short-Term Investments and Net Other Assets (Liabilities) | 6.6 |
ASSET ALLOCATION (% of Fund's net assets) |
|
| United States | 92.5 |
| Puerto Rico | 4.0 |
| Belgium | 3.5 |
GEOGRAPHIC DIVERSIFICATION (% of Fund's net assets) |
|
TOP HOLDINGS (% of Fund's net assets) | ||
| AT&T Inc | 23.3 | |
| Verizon Communications Inc | 19.7 | |
| Lumen Technologies Inc | 6.2 | |
| Cogent Communications Holdings Inc | 4.9 | |
| T-Mobile US Inc | 4.8 | |
| Iridium Communications Inc | 4.8 | |
| Liberty Latin America Ltd Class C | 4.0 | |
| Liberty Global Ltd Class C | 3.5 | |
| Telephone and Data Systems Inc | 3.4 | |
| Gogo Inc | 2.9 | |
| 77.5 |
| Fidelity, the Fidelity Investments Logo and all other Fidelity trademarks or service marks used herein are trademarks or service marks of FMR LLC. Any third-party marks that are used herein are trademarks or service marks of their respective owners. © 2024 FMR LLC. All rights reserved. | ||
 | For additional information about the Fund; including its prospectus, financial information, holdings and proxy information, scan the QR code or visit fundresearch.fidelity.com/prospectus/sec 1.9914516.100 3237-TSRS-1024 | |
SEMI-ANNUAL SHAREHOLDER REPORT | AS OF AUGUST 31, 2024 | ||
| | Gold Portfolio Fidelity Advisor® Gold Fund Class M : FGDTX | |
| Costs of a $10,000 investment | Costs paid as a percentage of a $10,000 investment | ||
| Class M | $ 75 | 1.22% |
KEY FACTS | ||
| Fund Size | $1,501,574,716 | |
| Number of Holdings | 65 | |
| Portfolio Turnover | 13% |
(as of August 31, 2024)
TOP INDUSTRIES (% of Fund's net assets) | ||
| Metals & Mining* | 98.4 | |
| Financial Services | 0.0 | |
| Common Stocks | 98.4 |
| Other Investments | 0.9 |
| Short-Term Investments and Net Other Assets (Liabilities) | 0.7 |
ASSET ALLOCATION (% of Fund's net assets) |
|
| Canada | 60.3 |
| United States | 15.8 |
| Brazil | 10.3 |
| Australia | 6.3 |
| United Kingdom | 2.3 |
| South Africa | 1.9 |
| China | 1.5 |
| Burkina Faso | 1.3 |
| Egypt | 0.3 |
GEOGRAPHIC DIVERSIFICATION (% of Fund's net assets) |
|
TOP HOLDINGS (% of Fund's net assets) | ||
| Agnico Eagle Mines Ltd | 14.8 | |
| Newmont Corp | 11.6 | |
| Wheaton Precious Metals Corp | 10.3 | |
| Franco-Nevada Corp | 9.3 | |
| Barrick Gold Corp | 4.9 | |
| Alamos Gold Inc Class A | 4.1 | |
| Northern Star Resources Ltd | 3.8 | |
| Osisko Gold Royalties Ltd | 2.7 | |
| Anglogold Ashanti Plc | 2.3 | |
| Lundin Gold Inc | 2.3 | |
| 66.1 |
| Fidelity, the Fidelity Investments Logo and all other Fidelity trademarks or service marks used herein are trademarks or service marks of FMR LLC. Any third-party marks that are used herein are trademarks or service marks of their respective owners. © 2024 FMR LLC. All rights reserved. | ||
 | For additional information about the Fund; including its prospectus, financial information, holdings and proxy information, scan the QR code or visit fundresearch.fidelity.com/prospectus/sec 1.9914520.100 1787-TSRS-1024 | |
SEMI-ANNUAL SHAREHOLDER REPORT | AS OF AUGUST 31, 2024 | ||
| | FinTech Portfolio FinTech Portfolio : FSVLX | |
| Costs of a $10,000 investment | Costs paid as a percentage of a $10,000 investment | ||
| FinTech Portfolio | $ 39 | 0.76% |
KEY FACTS | ||
| Fund Size | $98,348,487 | |
| Number of Holdings | 25 | |
| Portfolio Turnover | 31% |
(as of August 31, 2024)
TOP INDUSTRIES (% of Fund's net assets) | ||
| Financial Services | 61.9 | |
| Consumer Finance | 20.9 | |
| Software | 12.3 | |
| IT Services | 4.8 | |
| Common Stocks | 99.9 |
| Short-Term Investments and Net Other Assets (Liabilities) | 0.1 |
ASSET ALLOCATION (% of Fund's net assets) |
 |
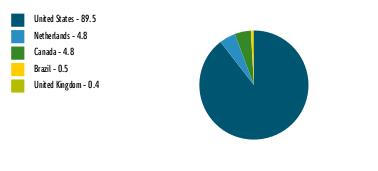
| United States | 89.5 |
| Netherlands | 4.8 |
| Canada | 4.8 |
| Brazil | 0.5 |
| United Kingdom | 0.4 |
GEOGRAPHIC DIVERSIFICATION (% of Fund's net assets) |
 |
TOP HOLDINGS (% of Fund's net assets) | ||
| Mastercard Inc Class A | 12.7 | |
| American Express Co | 12.1 | |
| Visa Inc Class A | 11.7 | |
| Intuit Inc | 11.1 | |
| Discover Financial Services | 4.9 | |
| Fidelity National Information Services Inc | 4.9 | |
| Fiserv Inc | 4.9 | |
| Adyen NV | 4.8 | |
| Shopify Inc Class A (United States) | 4.8 | |
| Corpay Inc | 4.8 | |
| 76.7 |
| Fidelity, the Fidelity Investments Logo and all other Fidelity trademarks or service marks used herein are trademarks or service marks of FMR LLC. Any third-party marks that are used herein are trademarks or service marks of their respective owners. © 2024 FMR LLC. All rights reserved. | ||
 | For additional information about the Fund; including its prospectus, financial information, holdings and proxy information, scan the QR code or visit fundresearch.fidelity.com/prospectus/sec 1.9914528.100 98-TSRS-1024 | |
SEMI-ANNUAL SHAREHOLDER REPORT | AS OF AUGUST 31, 2024 | ||
| | Gold Portfolio Gold Portfolio : FSAGX | |
| Costs of a $10,000 investment | Costs paid as a percentage of a $10,000 investment | ||
| Gold Portfolio | $ 42 | 0.68% |
KEY FACTS | ||
| Fund Size | $1,501,574,716 | |
| Number of Holdings | 65 | |
| Portfolio Turnover | 13% |
(as of August 31, 2024)
TOP INDUSTRIES (% of Fund's net assets) | ||
| Metals & Mining* | 98.4 | |
| Financial Services | 0.0 | |
| Common Stocks | 98.4 |
| Other Investments | 0.9 |
| Short-Term Investments and Net Other Assets (Liabilities) | 0.7 |
ASSET ALLOCATION (% of Fund's net assets) |
|
| Canada | 60.3 |
| United States | 15.8 |
| Brazil | 10.3 |
| Australia | 6.3 |
| United Kingdom | 2.3 |
| South Africa | 1.9 |
| China | 1.5 |
| Burkina Faso | 1.3 |
| Egypt | 0.3 |
GEOGRAPHIC DIVERSIFICATION (% of Fund's net assets) |
|
TOP HOLDINGS (% of Fund's net assets) | ||
| Agnico Eagle Mines Ltd | 14.8 | |
| Newmont Corp | 11.6 | |
| Wheaton Precious Metals Corp | 10.3 | |
| Franco-Nevada Corp | 9.3 | |
| Barrick Gold Corp | 4.9 | |
| Alamos Gold Inc Class A | 4.1 | |
| Northern Star Resources Ltd | 3.8 | |
| Osisko Gold Royalties Ltd | 2.7 | |
| Anglogold Ashanti Plc | 2.3 | |
| Lundin Gold Inc | 2.3 | |
| 66.1 |
| Fidelity, the Fidelity Investments Logo and all other Fidelity trademarks or service marks used herein are trademarks or service marks of FMR LLC. Any third-party marks that are used herein are trademarks or service marks of their respective owners. © 2024 FMR LLC. All rights reserved. | ||
 | For additional information about the Fund; including its prospectus, financial information, holdings and proxy information, scan the QR code or visit fundresearch.fidelity.com/prospectus/sec 1.9914523.100 41-TSRS-1024 | |
SEMI-ANNUAL SHAREHOLDER REPORT | AS OF AUGUST 31, 2024 | ||
| | Materials Portfolio Fidelity Advisor® Materials Fund Class I : FMFEX | |
| Costs of a $10,000 investment | Costs paid as a percentage of a $10,000 investment | ||
| Class I | $ 37 | 0.72% |
KEY FACTS | ||
| Fund Size | $849,835,612 | |
| Number of Holdings | 39 | |
| Portfolio Turnover | 59% |
(as of August 31, 2024)
TOP INDUSTRIES (% of Fund's net assets) | ||
| Chemicals | 61.6 | |
| Metals & Mining | 25.3 | |
| Containers & Packaging | 7.9 | |
| Construction Materials | 4.4 | |
| Common Stocks | 99.2 |
| Short-Term Investments and Net Other Assets (Liabilities) | 0.8 |
ASSET ALLOCATION (% of Fund's net assets) |
|
| United States | 89.9 |
| Canada | 6.0 |
| Zambia | 2.4 |
| Brazil | 1.7 |
GEOGRAPHIC DIVERSIFICATION (% of Fund's net assets) |
|
TOP HOLDINGS (% of Fund's net assets) | ||
| Linde PLC | 19.1 | |
| Ecolab Inc | 10.2 | |
| Dow Inc | 6.9 | |
| Air Products and Chemicals Inc | 5.4 | |
| Freeport-McMoRan Inc | 5.0 | |
| Corteva Inc | 3.9 | |
| Nucor Corp | 3.9 | |
| Axalta Coating Systems Ltd | 3.6 | |
| Chemours Co/The | 3.3 | |
| First Quantum Minerals Ltd | 2.4 | |
| 63.7 |
| Fidelity, the Fidelity Investments Logo and all other Fidelity trademarks or service marks used herein are trademarks or service marks of FMR LLC. Any third-party marks that are used herein are trademarks or service marks of their respective owners. © 2024 FMR LLC. All rights reserved. | ||
 | For additional information about the Fund; including its prospectus, financial information, holdings and proxy information, scan the QR code or visit fundresearch.fidelity.com/prospectus/sec 1.9914550.100 1793-TSRS-1024 | |
SEMI-ANNUAL SHAREHOLDER REPORT | AS OF AUGUST 31, 2024 | ||
| | Communication Services Portfolio Communication Services Portfolio : FBMPX | |
| Costs of a $10,000 investment | Costs paid as a percentage of a $10,000 investment | ||
| Communication Services Portfolio | $ 35 | 0.67% |
KEY FACTS | ||
| Fund Size | $1,564,235,226 | |
| Number of Holdings | 49 | |
| Portfolio Turnover | 39% |
(as of August 31, 2024)
TOP INDUSTRIES (% of Fund's net assets) | ||
| Interactive Media & Services | 52.6 | |
| Entertainment | 22.6 | |
| Media | 8.0 | |
| Diversified Telecommunication Services | 7.9 | |
| Broadline Retail | 5.3 | |
| Ground Transportation | 2.5 | |
| IT Services | 0.0 | |
| Consumer Staples Distribution & Retail | 0.0 | |
| Software | 0.0 | |
| Common Stocks | 98.9 |
| Short-Term Investments and Net Other Assets (Liabilities) | 1.1 |
ASSET ALLOCATION (% of Fund's net assets) |
|
| United States | 93.7 |
| Puerto Rico | 1.8 |
| Belgium | 1.3 |
| Singapore | 1.2 |
| China | 0.7 |
| France | 0.7 |
| Japan | 0.5 |
| Canada | 0.1 |
| United Kingdom | 0.0 |
GEOGRAPHIC DIVERSIFICATION (% of Fund's net assets) |
|
TOP HOLDINGS (% of Fund's net assets) | ||
| Meta Platforms Inc Class A | 24.9 | |
| Alphabet Inc Class A | 22.6 | |
| AT&T Inc | 4.8 | |
| Walt Disney Co/The | 4.6 | |
| Amazon.com Inc | 4.6 | |
| Netflix Inc | 4.6 | |
| Charter Communications Inc Class A | 2.6 | |
| Uber Technologies Inc | 2.5 | |
| Liberty Media Corp-Liberty Formula One Class A | 2.3 | |
| Comcast Corp Class A | 2.3 | |
| 75.8 |
| Fidelity, the Fidelity Investments Logo and all other Fidelity trademarks or service marks used herein are trademarks or service marks of FMR LLC. Any third-party marks that are used herein are trademarks or service marks of their respective owners. © 2024 FMR LLC. All rights reserved. | ||
 | For additional information about the Fund; including its prospectus, financial information, holdings and proxy information, scan the QR code or visit fundresearch.fidelity.com/prospectus/sec 1.9914544.100 503-TSRS-1024 | |
SEMI-ANNUAL SHAREHOLDER REPORT | AS OF AUGUST 31, 2024 | ||
| | Materials Portfolio Fidelity Advisor® Materials Fund Class C : FMFCX | |
| Costs of a $10,000 investment | Costs paid as a percentage of a $10,000 investment | ||
| Class C | $ 90 | 1.74% |
KEY FACTS | ||
| Fund Size | $849,835,612 | |
| Number of Holdings | 39 | |
| Portfolio Turnover | 59% |
(as of August 31, 2024)
TOP INDUSTRIES (% of Fund's net assets) | ||
| Chemicals | 61.6 | |
| Metals & Mining | 25.3 | |
| Containers & Packaging | 7.9 | |
| Construction Materials | 4.4 | |
| Common Stocks | 99.2 |
| Short-Term Investments and Net Other Assets (Liabilities) | 0.8 |
ASSET ALLOCATION (% of Fund's net assets) |
|
| United States | 89.9 |
| Canada | 6.0 |
| Zambia | 2.4 |
| Brazil | 1.7 |
GEOGRAPHIC DIVERSIFICATION (% of Fund's net assets) |
|
TOP HOLDINGS (% of Fund's net assets) | ||
| Linde PLC | 19.1 | |
| Ecolab Inc | 10.2 | |
| Dow Inc | 6.9 | |
| Air Products and Chemicals Inc | 5.4 | |
| Freeport-McMoRan Inc | 5.0 | |
| Corteva Inc | 3.9 | |
| Nucor Corp | 3.9 | |
| Axalta Coating Systems Ltd | 3.6 | |
| Chemours Co/The | 3.3 | |
| First Quantum Minerals Ltd | 2.4 | |
| 63.7 |
| Fidelity, the Fidelity Investments Logo and all other Fidelity trademarks or service marks used herein are trademarks or service marks of FMR LLC. Any third-party marks that are used herein are trademarks or service marks of their respective owners. © 2024 FMR LLC. All rights reserved. | ||
 | For additional information about the Fund; including its prospectus, financial information, holdings and proxy information, scan the QR code or visit fundresearch.fidelity.com/prospectus/sec 1.9914548.100 1791-TSRS-1024 | |
SEMI-ANNUAL SHAREHOLDER REPORT | AS OF AUGUST 31, 2024 | ||
| | Biotechnology Portfolio Biotechnology Portfolio : FBIOX | |
| Costs of a $10,000 investment | Costs paid as a percentage of a $10,000 investment | ||
| Biotechnology Portfolio | $ 34 | 0.64% |
KEY FACTS | ||
| Fund Size | $5,008,216,225 | |
| Number of Holdings | 200 | |
| Portfolio Turnover | 31% |
(as of August 31, 2024)
TOP INDUSTRIES (% of Fund's net assets) | ||
| Biotechnology | 92.2 | |
| Pharmaceuticals | 7.1 | |
| Health Care Providers & Services | 0.2 | |
| Health Care Technology | 0.2 | |
| Life Sciences Tools & Services | 0.1 | |
| Health Care Equipment & Supplies | 0.0 | |
| Consumer Staples Distribution & Retail | 0.0 | |
| Common Stocks | 98.8 |
| Preferred Stocks | 1.0 |
| Short-Term Investments and Net Other Assets (Liabilities) | 0.2 |
ASSET ALLOCATION (% of Fund's net assets) |
 |
| United States | 88.7 |
| Denmark | 3.9 |
| Netherlands | 3.2 |
| Belgium | 2.0 |
| United Kingdom | 0.6 |
| Switzerland | 0.5 |
| Canada | 0.4 |
| Ireland | 0.4 |
| France | 0.3 |
GEOGRAPHIC DIVERSIFICATION (% of Fund's net assets) |
 |
TOP HOLDINGS (% of Fund's net assets) | ||
| Abbvie Inc | 11.0 | |
| Amgen Inc | 9.7 | |
| Krystal Biotech Inc | 7.4 | |
| Regeneron Pharmaceuticals Inc | 5.3 | |
| Vertex Pharmaceuticals Inc | 4.4 | |
| Alnylam Pharmaceuticals Inc | 3.4 | |
| Gilead Sciences Inc | 2.6 | |
| UCB SA | 2.0 | |
| Zealand Pharma A/S | 2.0 | |
| Ascendis Pharma A/S ADR | 1.8 | |
| 49.6 |
| Fidelity, the Fidelity Investments Logo and all other Fidelity trademarks or service marks used herein are trademarks or service marks of FMR LLC. Any third-party marks that are used herein are trademarks or service marks of their respective owners. © 2024 FMR LLC. All rights reserved. | ||
 | For additional information about the Fund; including its prospectus, financial information, holdings and proxy information, scan the QR code or visit fundresearch.fidelity.com/prospectus/sec 1.9914524.100 42-TSRS-1024 | |
SEMI-ANNUAL SHAREHOLDER REPORT | AS OF AUGUST 31, 2024 | ||
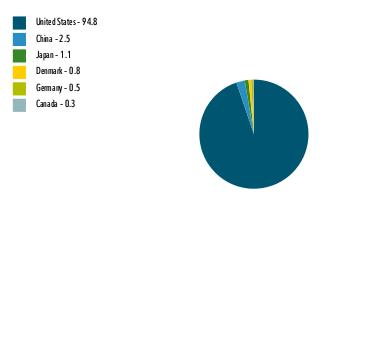
| | Fidelity® Environment and Alternative Energy Fund Fidelity® Environment and Alternative Energy Fund : FSLEX | |
| Costs of a $10,000 investment | Costs paid as a percentage of a $10,000 investment | ||
| Fidelity® Environment and Alternative Energy Fund | $ 37 | 0.70% |
KEY FACTS | ||
| Fund Size | $556,919,674 | |
| Number of Holdings | 70 | |
| Portfolio Turnover | 36% |
(as of August 31, 2024)
TOP INDUSTRIES (% of Fund's net assets) | ||
| Software | 10.8 | |
| Automobiles | 9.4 | |
| Chemicals | 9.1 | |
| Electrical Equipment | 8.0 | |
| Semiconductors & Semiconductor Equipment | 7.9 | |
| IT Services | 6.8 | |
| Building Products | 6.0 | |
| Commercial Services & Supplies | 5.1 | |
| Ground Transportation | 4.7 | |
| Others | 32.1 | |
| Common Stocks | 99.9 |
| Preferred Stocks | 0.0 |
| Short-Term Investments and Net Other Assets (Liabilities) | 0.1 |
ASSET ALLOCATION (% of Fund's net assets) |
 |
| United States | 94.8 |
| China | 2.5 |
| Japan | 1.1 |
| Denmark | 0.8 |
| Germany | 0.5 |
| Canada | 0.3 |
GEOGRAPHIC DIVERSIFICATION (% of Fund's net assets) |
 |
TOP HOLDINGS (% of Fund's net assets) | ||
| Microsoft Corp | 10.8 | |
| Tesla Inc | 8.8 | |
| Linde PLC | 7.2 | |
| International Business Machines Corp | 5.9 | |
| Union Pacific Corp | 4.7 | |
| Prologis Inc | 4.3 | |
| Eaton Corp PLC | 3.8 | |
| Republic Services Inc | 3.2 | |
| Trane Technologies PLC | 3.1 | |
| Arista Networks Inc | 2.8 | |
| 54.6 |
| Fidelity, the Fidelity Investments Logo and all other Fidelity trademarks or service marks used herein are trademarks or service marks of FMR LLC. Any third-party marks that are used herein are trademarks or service marks of their respective owners. © 2024 FMR LLC. All rights reserved. | ||
 | For additional information about the Fund; including its prospectus, financial information, holdings and proxy information, scan the QR code or visit fundresearch.fidelity.com/prospectus/sec 1.9914557.100 516-TSRS-1024 | |
SEMI-ANNUAL SHAREHOLDER REPORT | AS OF AUGUST 31, 2024 | ||
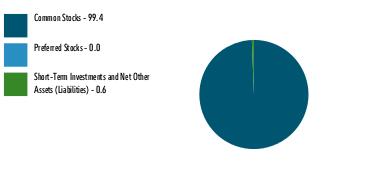
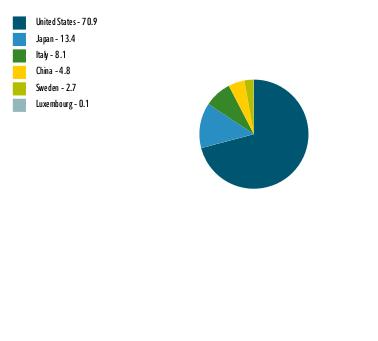
| | Automotive Portfolio Automotive Portfolio : FSAVX | |
| Costs of a $10,000 investment | Costs paid as a percentage of a $10,000 investment | ||
| Automotive Portfolio | $ 39 | 0.81% |
KEY FACTS | ||
| Fund Size | $75,054,295 | |
| Number of Holdings | 34 | |
| Portfolio Turnover | 64% |
(as of August 31, 2024)
TOP INDUSTRIES (% of Fund's net assets) | ||
| Automobiles | 53.6 | |
| Specialty Retail | 21.1 | |
| Automobile Components | 11.0 | |
| Commercial Services & Supplies | 6.3 | |
| Distributors | 4.5 | |
| Ground Transportation | 1.9 | |
| Trading Companies & Distributors | 0.7 | |
| Consumer Staples Distribution & Retail | 0.3 | |
| Electronic Equipment, Instruments & Components | 0.0 | |
| Common Stocks | 99.4 |
| Preferred Stocks | 0.0 |
| Short-Term Investments and Net Other Assets (Liabilities) | 0.6 |
ASSET ALLOCATION (% of Fund's net assets) |
 |
| United States | 70.9 |
| Japan | 13.4 |
| Italy | 8.1 |
| China | 4.8 |
| Sweden | 2.7 |
| Luxembourg | 0.1 |
GEOGRAPHIC DIVERSIFICATION (% of Fund's net assets) |
 |
TOP HOLDINGS (% of Fund's net assets) | ||
| Tesla Inc | 11.3 | |
| O'Reilly Automotive Inc | 9.0 | |
| Toyota Motor Corp ADR | 9.0 | |
| General Motors Co | 8.2 | |
| Ferrari NV | 8.1 | |
| Aptiv PLC | 4.8 | |
| AutoZone Inc | 4.6 | |
| Copart Inc | 4.5 | |
| Honda Motor Co Ltd ADR | 4.4 | |
| Li Auto Inc ADR | 4.2 | |
| 68.1 |
| Fidelity, the Fidelity Investments Logo and all other Fidelity trademarks or service marks used herein are trademarks or service marks of FMR LLC. Any third-party marks that are used herein are trademarks or service marks of their respective owners. © 2024 FMR LLC. All rights reserved. | ||
 | For additional information about the Fund; including its prospectus, financial information, holdings and proxy information, scan the QR code or visit fundresearch.fidelity.com/prospectus/sec 1.9914538.100 502-TSRS-1024 | |
SEMI-ANNUAL SHAREHOLDER REPORT | AS OF AUGUST 31, 2024 | ||
| | Consumer Discretionary Portfolio Consumer Discretionary Portfolio : FSCPX | |
| Costs of a $10,000 investment | Costs paid as a percentage of a $10,000 investment | ||
| Consumer Discretionary Portfolio | $ 35 | 0.70% |
KEY FACTS | ||
| Fund Size | $471,659,584 | |
| Number of Holdings | 60 | |
| Portfolio Turnover | 23% |
(as of August 31, 2024)
TOP INDUSTRIES (% of Fund's net assets) | ||
| Broadline Retail | 26.0 | |
| Specialty Retail | 23.9 | |
| Hotels, Restaurants & Leisure | 19.3 | |
| Automobiles | 11.7 | |
| Textiles, Apparel & Luxury Goods | 8.3 | |
| Household Durables | 5.4 | |
| Automobile Components | 2.7 | |
| Consumer Staples Distribution & Retail | 1.0 | |
| Building Products | 0.8 | |
| Others | 0.6 | |
| Common Stocks | 99.7 |
| Short-Term Investments and Net Other Assets (Liabilities) | 0.3 |
ASSET ALLOCATION (% of Fund's net assets) |
 |
| United States | 95.8 |
| Canada | 2.1 |
| Brazil | 1.0 |
| United Kingdom | 0.4 |
| France | 0.4 |
| Switzerland | 0.3 |
GEOGRAPHIC DIVERSIFICATION (% of Fund's net assets) |
 |
TOP HOLDINGS (% of Fund's net assets) | ||
| Amazon.com Inc | 23.9 | |
| Tesla Inc | 10.0 | |
| Home Depot Inc/The | 4.8 | |
| Lowe's Cos Inc | 4.7 | |
| TJX Cos Inc/The | 3.7 | |
| Hilton Worldwide Holdings Inc | 3.1 | |
| McDonald's Corp | 2.6 | |
| Dick's Sporting Goods Inc | 2.3 | |
| NIKE Inc Class B | 2.3 | |
| Aptiv PLC | 2.2 | |
| 59.6 |
| Fidelity, the Fidelity Investments Logo and all other Fidelity trademarks or service marks used herein are trademarks or service marks of FMR LLC. Any third-party marks that are used herein are trademarks or service marks of their respective owners. © 2024 FMR LLC. All rights reserved. | ||
 | For additional information about the Fund; including its prospectus, financial information, holdings and proxy information, scan the QR code or visit fundresearch.fidelity.com/prospectus/sec 1.9914558.100 517-TSRS-1024 | |
SEMI-ANNUAL SHAREHOLDER REPORT | AS OF AUGUST 31, 2024 | ||
| | Gold Portfolio Fidelity Advisor® Gold Fund Class A : FGDAX | |
| Costs of a $10,000 investment | Costs paid as a percentage of a $10,000 investment | ||
| Class A | $ 60 | 0.97% |
KEY FACTS | ||
| Fund Size | $1,501,574,716 | |
| Number of Holdings | 65 | |
| Portfolio Turnover | 13% |
(as of August 31, 2024)
TOP INDUSTRIES (% of Fund's net assets) | ||
| Metals & Mining* | 98.4 | |
| Financial Services | 0.0 | |
| Common Stocks | 98.4 |
| Other Investments | 0.9 |
| Short-Term Investments and Net Other Assets (Liabilities) | 0.7 |
ASSET ALLOCATION (% of Fund's net assets) |
|
| Canada | 60.3 |
| United States | 15.8 |
| Brazil | 10.3 |
| Australia | 6.3 |
| United Kingdom | 2.3 |
| South Africa | 1.9 |
| China | 1.5 |
| Burkina Faso | 1.3 |
| Egypt | 0.3 |
GEOGRAPHIC DIVERSIFICATION (% of Fund's net assets) |
|
TOP HOLDINGS (% of Fund's net assets) | ||
| Agnico Eagle Mines Ltd | 14.8 | |
| Newmont Corp | 11.6 | |
| Wheaton Precious Metals Corp | 10.3 | |
| Franco-Nevada Corp | 9.3 | |
| Barrick Gold Corp | 4.9 | |
| Alamos Gold Inc Class A | 4.1 | |
| Northern Star Resources Ltd | 3.8 | |
| Osisko Gold Royalties Ltd | 2.7 | |
| Anglogold Ashanti Plc | 2.3 | |
| Lundin Gold Inc | 2.3 | |
| 66.1 |
| Fidelity, the Fidelity Investments Logo and all other Fidelity trademarks or service marks used herein are trademarks or service marks of FMR LLC. Any third-party marks that are used herein are trademarks or service marks of their respective owners. © 2024 FMR LLC. All rights reserved. | ||
 | For additional information about the Fund; including its prospectus, financial information, holdings and proxy information, scan the QR code or visit fundresearch.fidelity.com/prospectus/sec 1.9914518.100 1784-TSRS-1024 | |
SEMI-ANNUAL SHAREHOLDER REPORT | AS OF AUGUST 31, 2024 | ||
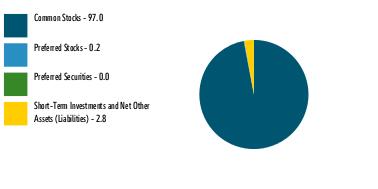
| | Semiconductors Portfolio Semiconductors Portfolio : FSELX | |
| Costs of a $10,000 investment | Costs paid as a percentage of a $10,000 investment | ||
| Semiconductors Portfolio | $ 34 | 0.63% |
KEY FACTS | ||
| Fund Size | $19,711,434,026 | |
| Number of Holdings | 42 | |
| Portfolio Turnover | 42% |
(as of August 31, 2024)
TOP INDUSTRIES (% of Fund's net assets) | ||
| Semiconductors & Semiconductor Equipment | 94.3 | |
| Technology Hardware, Storage & Peripherals | 2.8 | |
| Electronic Equipment, Instruments & Components | 0.1 | |
| Financial Services | 0.0 | |
| Metals & Mining | 0.0 | |
| Software | 0.0 | |
| Common Stocks | 97.0 |
| Preferred Stocks | 0.2 |
| Preferred Securities | 0.0 |
| Short-Term Investments and Net Other Assets (Liabilities) | 2.8 |
ASSET ALLOCATION (% of Fund's net assets) |
 |
| United States | 78.1 |
| Taiwan | 8.1 |
| China | 6.3 |
| Netherlands | 4.9 |
| Israel | 1.6 |
| Japan | 1.0 |
GEOGRAPHIC DIVERSIFICATION (% of Fund's net assets) |
 |
TOP HOLDINGS (% of Fund's net assets) | ||
| NVIDIA Corp | 24.8 | |
| Taiwan Semiconductor Manufacturing Co Ltd ADR | 7.7 | |
| ON Semiconductor Corp | 7.2 | |
| NXP Semiconductors NV | 6.3 | |
| Marvell Technology Inc | 5.0 | |
| Broadcom Inc | 4.9 | |
| ASML Holding NV depository receipt | 4.9 | |
| Micron Technology Inc | 4.9 | |
| GlobalFoundries Inc | 4.8 | |
| Monolithic Power Systems Inc | 4.3 | |
| 74.8 |
| Fidelity, the Fidelity Investments Logo and all other Fidelity trademarks or service marks used herein are trademarks or service marks of FMR LLC. Any third-party marks that are used herein are trademarks or service marks of their respective owners. © 2024 FMR LLC. All rights reserved. | ||
 | For additional information about the Fund; including its prospectus, financial information, holdings and proxy information, scan the QR code or visit fundresearch.fidelity.com/prospectus/sec 1.9914489.100 8-TSRS-1024 | |
SEMI-ANNUAL SHAREHOLDER REPORT | AS OF AUGUST 31, 2024 | ||
| | Brokerage and Investment Management Portfolio Brokerage and Investment Management Portfolio : FSLBX | |
| Costs of a $10,000 investment | Costs paid as a percentage of a $10,000 investment | ||
| Brokerage and Investment Management Portfolio | $ 37 | 0.69% |
KEY FACTS | ||
| Fund Size | $917,253,584 | |
| Number of Holdings | 41 | |
| Portfolio Turnover | 21% |
(as of August 31, 2024)
TOP INDUSTRIES (% of Fund's net assets) | ||
| Capital Markets | 95.8 | |
| Financial Services | 3.9 | |
| Common Stocks | 99.7 |
| Short-Term Investments and Net Other Assets (Liabilities) | 0.3 |
ASSET ALLOCATION (% of Fund's net assets) |
 |
| United States | 97.0 |
| United Kingdom | 1.1 |
| Luxembourg | 0.7 |
| Grand Cayman (UK Overseas Ter) | 0.6 |
| Canada | 0.5 |
| Sweden | 0.1 |
GEOGRAPHIC DIVERSIFICATION (% of Fund's net assets) |
 |
TOP HOLDINGS (% of Fund's net assets) | ||
| Moody's Corp | 9.3 | |
| KKR & Co Inc Class A | 6.4 | |
| S&P Global Inc | 5.4 | |
| Blackstone Inc | 5.2 | |
| Ares Management Corp Class A | 5.1 | |
| Intercontinental Exchange Inc | 5.1 | |
| Blue Owl Capital Inc Class A | 5.0 | |
| BlackRock Inc | 4.6 | |
| Ameriprise Financial Inc | 4.4 | |
| Apollo Global Management Inc | 3.9 | |
| 54.4 |
| Fidelity, the Fidelity Investments Logo and all other Fidelity trademarks or service marks used herein are trademarks or service marks of FMR LLC. Any third-party marks that are used herein are trademarks or service marks of their respective owners. © 2024 FMR LLC. All rights reserved. | ||
 | For additional information about the Fund; including its prospectus, financial information, holdings and proxy information, scan the QR code or visit fundresearch.fidelity.com/prospectus/sec 1.9914504.100 68-TSRS-1024 | |
SEMI-ANNUAL SHAREHOLDER REPORT | AS OF AUGUST 31, 2024 | ||
| | Chemicals Portfolio Chemicals Portfolio : FSCHX | |
| Costs of a $10,000 investment | Costs paid as a percentage of a $10,000 investment | ||
| Chemicals Portfolio | $ 36 | 0.69% |
KEY FACTS | ||
| Fund Size | $610,081,738 | |
| Number of Holdings | 26 | |
| Portfolio Turnover | 2% |
(as of August 31, 2024)
TOP INDUSTRIES (% of Fund's net assets) | ||
| Chemicals | 99.1 | |
| Common Stocks | 99.1 |
| Short-Term Investments and Net Other Assets (Liabilities) | 0.9 |
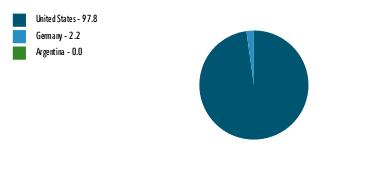
ASSET ALLOCATION (% of Fund's net assets) |
 |
| United States | 97.8 |
| Germany | 2.2 |
| Argentina | 0.0 |
GEOGRAPHIC DIVERSIFICATION (% of Fund's net assets) |
 |
TOP HOLDINGS (% of Fund's net assets) | ||
| Linde PLC | 23.4 | |
| Sherwin-Williams Co/The | 11.3 | |
| Air Products and Chemicals Inc | 8.9 | |
| Ecolab Inc | 5.9 | |
| Axalta Coating Systems Ltd | 4.9 | |
| Element Solutions Inc | 4.5 | |
| DuPont de Nemours Inc | 4.3 | |
| Corteva Inc | 4.1 | |
| Celanese Corp | 3.8 | |
| Westlake Corp | 3.5 | |
| 74.6 |
| Fidelity, the Fidelity Investments Logo and all other Fidelity trademarks or service marks used herein are trademarks or service marks of FMR LLC. Any third-party marks that are used herein are trademarks or service marks of their respective owners. © 2024 FMR LLC. All rights reserved. | ||
 | For additional information about the Fund; including its prospectus, financial information, holdings and proxy information, scan the QR code or visit fundresearch.fidelity.com/prospectus/sec 1.9914505.100 69-TSRS-1024 | |
SEMI-ANNUAL SHAREHOLDER REPORT | AS OF AUGUST 31, 2024 | ||
| | Communication Services Portfolio Fidelity Advisor® Communication Services Fund Class I : FGJMX | |
| Costs of a $10,000 investment | Costs paid as a percentage of a $10,000 investment | ||
| Class I | $ 37 | 0.71% |
KEY FACTS | ||
| Fund Size | $1,564,235,226 | |
| Number of Holdings | 49 | |
| Portfolio Turnover | 39% |
(as of August 31, 2024)
TOP INDUSTRIES (% of Fund's net assets) | ||
| Interactive Media & Services | 52.6 | |
| Entertainment | 22.6 | |
| Media | 8.0 | |
| Diversified Telecommunication Services | 7.9 | |
| Broadline Retail | 5.3 | |
| Ground Transportation | 2.5 | |
| IT Services | 0.0 | |
| Consumer Staples Distribution & Retail | 0.0 | |
| Software | 0.0 | |
| Common Stocks | 98.9 |
| Short-Term Investments and Net Other Assets (Liabilities) | 1.1 |
ASSET ALLOCATION (% of Fund's net assets) |
|
| United States | 93.7 |
| Puerto Rico | 1.8 |
| Belgium | 1.3 |
| Singapore | 1.2 |
| China | 0.7 |
| France | 0.7 |
| Japan | 0.5 |
| Canada | 0.1 |
| United Kingdom | 0.0 |
GEOGRAPHIC DIVERSIFICATION (% of Fund's net assets) |
|
TOP HOLDINGS (% of Fund's net assets) | ||
| Meta Platforms Inc Class A | 24.9 | |
| Alphabet Inc Class A | 22.6 | |
| AT&T Inc | 4.8 | |
| Walt Disney Co/The | 4.6 | |
| Amazon.com Inc | 4.6 | |
| Netflix Inc | 4.6 | |
| Charter Communications Inc Class A | 2.6 | |
| Uber Technologies Inc | 2.5 | |
| Liberty Media Corp-Liberty Formula One Class A | 2.3 | |
| Comcast Corp Class A | 2.3 | |
| 75.8 |
| Fidelity, the Fidelity Investments Logo and all other Fidelity trademarks or service marks used herein are trademarks or service marks of FMR LLC. Any third-party marks that are used herein are trademarks or service marks of their respective owners. © 2024 FMR LLC. All rights reserved. | ||
 | For additional information about the Fund; including its prospectus, financial information, holdings and proxy information, scan the QR code or visit fundresearch.fidelity.com/prospectus/sec 1.9914542.100 3327-TSRS-1024 | |
SEMI-ANNUAL SHAREHOLDER REPORT | AS OF AUGUST 31, 2024 | ||
| | Tech Hardware Portfolio Tech Hardware Portfolio : FDCPX | |
| Costs of a $10,000 investment | Costs paid as a percentage of a $10,000 investment | ||
| Tech Hardware Portfolio | $ 37 | 0.69% |
KEY FACTS | ||
| Fund Size | $1,022,851,445 | |
| Number of Holdings | 34 | |
| Portfolio Turnover | 47% |
(as of August 31, 2024)
TOP INDUSTRIES (% of Fund's net assets) | ||
| Technology Hardware, Storage & Peripherals | 38.5 | |
| Communications Equipment | 28.7 | |
| Software | 7.9 | |
| Electronic Equipment, Instruments & Components | 7.5 | |
| Entertainment | 4.9 | |
| Household Durables | 4.6 | |
| Semiconductors & Semiconductor Equipment | 4.5 | |
| Interactive Media & Services | 1.2 | |
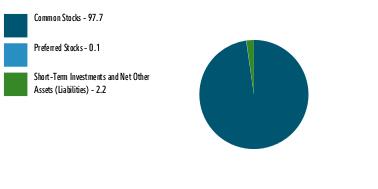
| Common Stocks | 97.7 |
| Preferred Stocks | 0.1 |
| Short-Term Investments and Net Other Assets (Liabilities) | 2.2 |
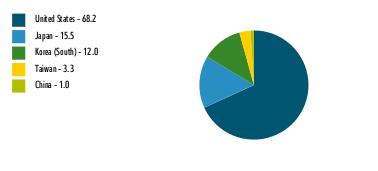
ASSET ALLOCATION (% of Fund's net assets) |
 |
| United States | 68.2 |
| Japan | 15.5 |
| Korea (South) | 12.0 |
| Taiwan | 3.3 |
| China | 1.0 |
GEOGRAPHIC DIVERSIFICATION (% of Fund's net assets) |
 |
TOP HOLDINGS (% of Fund's net assets) | ||
| Cisco Systems Inc | 12.9 | |
| Samsung Electronics Co Ltd | 12.0 | |
| Apple Inc | 11.0 | |
| Motorola Solutions Inc | 6.9 | |
| Arista Networks Inc | 6.7 | |
| Nintendo Co Ltd | 4.9 | |
| Palo Alto Networks Inc | 4.7 | |
| Sony Group Corp | 4.6 | |
| CDW Corp/DE | 4.5 | |
| FUJIFILM Holdings Corp | 4.0 | |
| 72.2 |
| Fidelity, the Fidelity Investments Logo and all other Fidelity trademarks or service marks used herein are trademarks or service marks of FMR LLC. Any third-party marks that are used herein are trademarks or service marks of their respective owners. © 2024 FMR LLC. All rights reserved. | ||
 | For additional information about the Fund; including its prospectus, financial information, holdings and proxy information, scan the QR code or visit fundresearch.fidelity.com/prospectus/sec 1.9914488.100 7-TSRS-1024 | |
SEMI-ANNUAL SHAREHOLDER REPORT | AS OF AUGUST 31, 2024 | ||
| | Gold Portfolio Fidelity Advisor® Gold Fund Class C : FGDCX | |
| Costs of a $10,000 investment | Costs paid as a percentage of a $10,000 investment | ||
| Class C | $ 106 | 1.72% |
KEY FACTS | ||
| Fund Size | $1,501,574,716 | |
| Number of Holdings | 65 | |
| Portfolio Turnover | 13% |
(as of August 31, 2024)
TOP INDUSTRIES (% of Fund's net assets) | ||
| Metals & Mining* | 98.4 | |
| Financial Services | 0.0 | |
| Common Stocks | 98.4 |
| Other Investments | 0.9 |
| Short-Term Investments and Net Other Assets (Liabilities) | 0.7 |
ASSET ALLOCATION (% of Fund's net assets) |
|
| Canada | 60.3 |
| United States | 15.8 |
| Brazil | 10.3 |
| Australia | 6.3 |
| United Kingdom | 2.3 |
| South Africa | 1.9 |
| China | 1.5 |
| Burkina Faso | 1.3 |
| Egypt | 0.3 |
GEOGRAPHIC DIVERSIFICATION (% of Fund's net assets) |
|
TOP HOLDINGS (% of Fund's net assets) | ||
| Agnico Eagle Mines Ltd | 14.8 | |
| Newmont Corp | 11.6 | |
| Wheaton Precious Metals Corp | 10.3 | |
| Franco-Nevada Corp | 9.3 | |
| Barrick Gold Corp | 4.9 | |
| Alamos Gold Inc Class A | 4.1 | |
| Northern Star Resources Ltd | 3.8 | |
| Osisko Gold Royalties Ltd | 2.7 | |
| Anglogold Ashanti Plc | 2.3 | |
| Lundin Gold Inc | 2.3 | |
| 66.1 |
| Fidelity, the Fidelity Investments Logo and all other Fidelity trademarks or service marks used herein are trademarks or service marks of FMR LLC. Any third-party marks that are used herein are trademarks or service marks of their respective owners. © 2024 FMR LLC. All rights reserved. | ||
 | For additional information about the Fund; including its prospectus, financial information, holdings and proxy information, scan the QR code or visit fundresearch.fidelity.com/prospectus/sec 1.9914519.100 1786-TSRS-1024 | |
SEMI-ANNUAL SHAREHOLDER REPORT | AS OF AUGUST 31, 2024 | ||
| | Materials Portfolio Fidelity Advisor® Materials Fund Class A : FMFAX | |
| Costs of a $10,000 investment | Costs paid as a percentage of a $10,000 investment | ||
| Class A | $ 51 | 0.99% |
KEY FACTS | ||
| Fund Size | $849,835,612 | |
| Number of Holdings | 39 | |
| Portfolio Turnover | 59% |
(as of August 31, 2024)
TOP INDUSTRIES (% of Fund's net assets) | ||
| Chemicals | 61.6 | |
| Metals & Mining | 25.3 | |
| Containers & Packaging | 7.9 | |
| Construction Materials | 4.4 | |
| Common Stocks | 99.2 |
| Short-Term Investments and Net Other Assets (Liabilities) | 0.8 |
ASSET ALLOCATION (% of Fund's net assets) |
|
| United States | 89.9 |
| Canada | 6.0 |
| Zambia | 2.4 |
| Brazil | 1.7 |
GEOGRAPHIC DIVERSIFICATION (% of Fund's net assets) |
|
TOP HOLDINGS (% of Fund's net assets) | ||
| Linde PLC | 19.1 | |
| Ecolab Inc | 10.2 | |
| Dow Inc | 6.9 | |
| Air Products and Chemicals Inc | 5.4 | |
| Freeport-McMoRan Inc | 5.0 | |
| Corteva Inc | 3.9 | |
| Nucor Corp | 3.9 | |
| Axalta Coating Systems Ltd | 3.6 | |
| Chemours Co/The | 3.3 | |
| First Quantum Minerals Ltd | 2.4 | |
| 63.7 |
| Fidelity, the Fidelity Investments Logo and all other Fidelity trademarks or service marks used herein are trademarks or service marks of FMR LLC. Any third-party marks that are used herein are trademarks or service marks of their respective owners. © 2024 FMR LLC. All rights reserved. | ||
 | For additional information about the Fund; including its prospectus, financial information, holdings and proxy information, scan the QR code or visit fundresearch.fidelity.com/prospectus/sec 1.9914547.100 1789-TSRS-1024 | |
SEMI-ANNUAL SHAREHOLDER REPORT | AS OF AUGUST 31, 2024 | ||
| | Telecommunications Portfolio Fidelity Advisor® Telecommunications Fund Class M : FTUTX | |
| Costs of a $10,000 investment | Costs paid as a percentage of a $10,000 investment | ||
| Class M | $ 71 | 1.31% |
KEY FACTS | ||
| Fund Size | $196,158,282 | |
| Number of Holdings | 27 | |
| Portfolio Turnover | 29% |
(as of August 31, 2024)
TOP INDUSTRIES (% of Fund's net assets) | ||
| Diversified Telecommunication Services | 75.8 | |
| Wireless Telecommunication Services | 12.7 | |
| Media | 4.1 | |
| IT Services | 0.6 | |
| Construction & Engineering | 0.2 | |
| Common Stocks | 93.4 |
| Short-Term Investments and Net Other Assets (Liabilities) | 6.6 |
ASSET ALLOCATION (% of Fund's net assets) |
|
| United States | 92.5 |
| Puerto Rico | 4.0 |
| Belgium | 3.5 |
GEOGRAPHIC DIVERSIFICATION (% of Fund's net assets) |
|
TOP HOLDINGS (% of Fund's net assets) | ||
| AT&T Inc | 23.3 | |
| Verizon Communications Inc | 19.7 | |
| Lumen Technologies Inc | 6.2 | |
| Cogent Communications Holdings Inc | 4.9 | |
| T-Mobile US Inc | 4.8 | |
| Iridium Communications Inc | 4.8 | |
| Liberty Latin America Ltd Class C | 4.0 | |
| Liberty Global Ltd Class C | 3.5 | |
| Telephone and Data Systems Inc | 3.4 | |
| Gogo Inc | 2.9 | |
| 77.5 |
| Fidelity, the Fidelity Investments Logo and all other Fidelity trademarks or service marks used herein are trademarks or service marks of FMR LLC. Any third-party marks that are used herein are trademarks or service marks of their respective owners. © 2024 FMR LLC. All rights reserved. | ||
 | For additional information about the Fund; including its prospectus, financial information, holdings and proxy information, scan the QR code or visit fundresearch.fidelity.com/prospectus/sec 1.9914514.100 1797-TSRS-1024 | |
SEMI-ANNUAL SHAREHOLDER REPORT | AS OF AUGUST 31, 2024 | ||
| | Telecommunications Portfolio Fidelity Advisor® Telecommunications Fund Class A : FTUAX | |
| Costs of a $10,000 investment | Costs paid as a percentage of a $10,000 investment | ||
| Class A | $ 57 | 1.06% |
KEY FACTS | ||
| Fund Size | $196,158,282 | |
| Number of Holdings | 27 | |
| Portfolio Turnover | 29% |
(as of August 31, 2024)
TOP INDUSTRIES (% of Fund's net assets) | ||
| Diversified Telecommunication Services | 75.8 | |
| Wireless Telecommunication Services | 12.7 | |
| Media | 4.1 | |
| IT Services | 0.6 | |
| Construction & Engineering | 0.2 | |
| Common Stocks | 93.4 |
| Short-Term Investments and Net Other Assets (Liabilities) | 6.6 |
ASSET ALLOCATION (% of Fund's net assets) |
|
| United States | 92.5 |
| Puerto Rico | 4.0 |
| Belgium | 3.5 |
GEOGRAPHIC DIVERSIFICATION (% of Fund's net assets) |
|
TOP HOLDINGS (% of Fund's net assets) | ||
| AT&T Inc | 23.3 | |
| Verizon Communications Inc | 19.7 | |
| Lumen Technologies Inc | 6.2 | |
| Cogent Communications Holdings Inc | 4.9 | |
| T-Mobile US Inc | 4.8 | |
| Iridium Communications Inc | 4.8 | |
| Liberty Latin America Ltd Class C | 4.0 | |
| Liberty Global Ltd Class C | 3.5 | |
| Telephone and Data Systems Inc | 3.4 | |
| Gogo Inc | 2.9 | |
| 77.5 |
| Fidelity, the Fidelity Investments Logo and all other Fidelity trademarks or service marks used herein are trademarks or service marks of FMR LLC. Any third-party marks that are used herein are trademarks or service marks of their respective owners. © 2024 FMR LLC. All rights reserved. | ||
 | For additional information about the Fund; including its prospectus, financial information, holdings and proxy information, scan the QR code or visit fundresearch.fidelity.com/prospectus/sec 1.9914512.100 1794-TSRS-1024 | |
SEMI-ANNUAL SHAREHOLDER REPORT | AS OF AUGUST 31, 2024 | ||
| | Communication Services Portfolio Fidelity Advisor® Communication Services Fund Class A : FGDMX | |
| Costs of a $10,000 investment | Costs paid as a percentage of a $10,000 investment | ||
| Class A | $ 50 | 0.96% |
KEY FACTS | ||
| Fund Size | $1,564,235,226 | |
| Number of Holdings | 49 | |
| Portfolio Turnover | 39% |
(as of August 31, 2024)
TOP INDUSTRIES (% of Fund's net assets) | ||
| Interactive Media & Services | 52.6 | |
| Entertainment | 22.6 | |
| Media | 8.0 | |
| Diversified Telecommunication Services | 7.9 | |
| Broadline Retail | 5.3 | |
| Ground Transportation | 2.5 | |
| IT Services | 0.0 | |
| Consumer Staples Distribution & Retail | 0.0 | |
| Software | 0.0 | |
| Common Stocks | 98.9 |
| Short-Term Investments and Net Other Assets (Liabilities) | 1.1 |
ASSET ALLOCATION (% of Fund's net assets) |
|
| United States | 93.7 |
| Puerto Rico | 1.8 |
| Belgium | 1.3 |
| Singapore | 1.2 |
| China | 0.7 |
| France | 0.7 |
| Japan | 0.5 |
| Canada | 0.1 |
| United Kingdom | 0.0 |
GEOGRAPHIC DIVERSIFICATION (% of Fund's net assets) |
|
TOP HOLDINGS (% of Fund's net assets) | ||
| Meta Platforms Inc Class A | 24.9 | |
| Alphabet Inc Class A | 22.6 | |
| AT&T Inc | 4.8 | |
| Walt Disney Co/The | 4.6 | |
| Amazon.com Inc | 4.6 | |
| Netflix Inc | 4.6 | |
| Charter Communications Inc Class A | 2.6 | |
| Uber Technologies Inc | 2.5 | |
| Liberty Media Corp-Liberty Formula One Class A | 2.3 | |
| Comcast Corp Class A | 2.3 | |
| 75.8 |
| Fidelity, the Fidelity Investments Logo and all other Fidelity trademarks or service marks used herein are trademarks or service marks of FMR LLC. Any third-party marks that are used herein are trademarks or service marks of their respective owners. © 2024 FMR LLC. All rights reserved. | ||
 | For additional information about the Fund; including its prospectus, financial information, holdings and proxy information, scan the QR code or visit fundresearch.fidelity.com/prospectus/sec 1.9914539.100 3324-TSRS-1024 | |
SEMI-ANNUAL SHAREHOLDER REPORT | AS OF AUGUST 31, 2024 | ||
| | Pharmaceuticals Portfolio Pharmaceuticals Portfolio : FPHAX | |
| Costs of a $10,000 investment | Costs paid as a percentage of a $10,000 investment | ||
| Pharmaceuticals Portfolio | $ 37 | 0.68% |
KEY FACTS | ||
| Fund Size | $1,914,838,050 | |
| Number of Holdings | 73 | |
| Portfolio Turnover | 14% |
(as of August 31, 2024)
TOP INDUSTRIES (% of Fund's net assets) | ||
| Pharmaceuticals | 74.0 | |
| Biotechnology | 20.4 | |
| Life Sciences Tools & Services | 1.0 | |
| Health Care Equipment & Supplies | 0.8 | |
| Health Care Providers & Services | 0.2 | |
| Financial Services | 0.1 | |
| Software | 0.1 | |
| Consumer Staples Distribution & Retail | 0.0 | |
| Common Stocks | 96.2 |
| Preferred Stocks | 0.4 |
| Bonds | 0.0 |
| Short-Term Investments and Net Other Assets (Liabilities) | 3.4 |
ASSET ALLOCATION (% of Fund's net assets) |
 |
| United States | 66.8 |
| Denmark | 13.6 |
| United Kingdom | 8.8 |
| Belgium | 5.9 |
| Germany | 3.2 |
| Switzerland | 0.6 |
| Netherlands | 0.6 |
| Canada | 0.5 |
| Ireland | 0.0 |
GEOGRAPHIC DIVERSIFICATION (% of Fund's net assets) |
 |
TOP HOLDINGS (% of Fund's net assets) | ||
| Eli Lilly & Co | 24.0 | |
| Novo Nordisk A/S Class B ADR | 13.3 | |
| Astrazeneca PLC ADR | 8.8 | |
| Bristol-Myers Squibb Co | 5.1 | |
| UCB SA | 4.7 | |
| GSK PLC ADR | 4.5 | |
| Merck & Co Inc | 4.2 | |
| Gilead Sciences Inc | 3.2 | |
| Legend Biotech Corp ADR | 2.5 | |
| Dyne Therapeutics Inc | 2.2 | |
| 72.5 |
| Fidelity, the Fidelity Investments Logo and all other Fidelity trademarks or service marks used herein are trademarks or service marks of FMR LLC. Any third-party marks that are used herein are trademarks or service marks of their respective owners. © 2024 FMR LLC. All rights reserved. | ||
 | For additional information about the Fund; including its prospectus, financial information, holdings and proxy information, scan the QR code or visit fundresearch.fidelity.com/prospectus/sec 1.9914527.100 580-TSRS-1024 | |
SEMI-ANNUAL SHAREHOLDER REPORT | AS OF AUGUST 31, 2024 | ||
| | Consumer Staples Portfolio Consumer Staples Portfolio : FDFAX | |
| Costs of a $10,000 investment | Costs paid as a percentage of a $10,000 investment | ||
| Consumer Staples Portfolio | $ 36 | 0.68% |
KEY FACTS | ||
| Fund Size | $1,405,206,341 | |
| Number of Holdings | 39 | |
| Portfolio Turnover | 39% |
(as of August 31, 2024)
TOP INDUSTRIES (% of Fund's net assets) | ||
| Beverages | 39.6 | |
| Household Products | 18.8 | |
| Food Products | 14.3 | |
| Consumer Staples Distribution & Retail | 10.8 | |
| Personal Care Products | 9.7 | |
| Tobacco | 6.4 | |
| Oil, Gas & Consumable Fuels | 0.1 | |
| Common Stocks | 99.7 |
| Short-Term Investments and Net Other Assets (Liabilities) | 0.3 |
ASSET ALLOCATION (% of Fund's net assets) |
|
| United States | 95.1 |
| United Kingdom | 4.8 |
| Canada | 0.1 |
GEOGRAPHIC DIVERSIFICATION (% of Fund's net assets) |
|
TOP HOLDINGS (% of Fund's net assets) | ||
| Coca-Cola Co/The | 14.2 | |
| Procter & Gamble Co/The | 14.2 | |
| Keurig Dr Pepper Inc | 9.8 | |
| Kenvue Inc | 6.3 | |
| Walmart Inc | 5.5 | |
| Philip Morris International Inc | 4.2 | |
| Monster Beverage Corp | 3.9 | |
| Energizer Holdings Inc | 3.8 | |
| PepsiCo Inc | 3.6 | |
| Estee Lauder Cos Inc/The Class A | 3.4 | |
| 68.9 |
| Fidelity, the Fidelity Investments Logo and all other Fidelity trademarks or service marks used herein are trademarks or service marks of FMR LLC. Any third-party marks that are used herein are trademarks or service marks of their respective owners. © 2024 FMR LLC. All rights reserved. | ||
 | For additional information about the Fund; including its prospectus, financial information, holdings and proxy information, scan the QR code or visit fundresearch.fidelity.com/prospectus/sec 1.9914495.100 9-TSRS-1024 | |
SEMI-ANNUAL SHAREHOLDER REPORT | AS OF AUGUST 31, 2024 | ||
| | Medical Technology and Devices Portfolio Medical Technology and Devices Portfolio : FSMEX | |
| Costs of a $10,000 investment | Costs paid as a percentage of a $10,000 investment | ||
| Medical Technology and Devices Portfolio | $ 32 | 0.63% |
KEY FACTS | ||
| Fund Size | $5,352,945,554 | |
| Number of Holdings | 64 | |
| Portfolio Turnover | 34% |
(as of August 31, 2024)
TOP INDUSTRIES (% of Fund's net assets) | ||
| Health Care Equipment & Supplies | 55.0 | |
| Life Sciences Tools & Services | 32.6 | |
| Health Care Technology | 5.3 | |
| Biotechnology | 3.5 | |
| Health Care Providers & Services | 1.8 | |
| Textiles, Apparel & Luxury Goods | 0.4 | |
| Financial Services | 0.3 | |
| Pharmaceuticals | 0.1 | |
| Common Stocks | 96.6 |
| Preferred Stocks | 2.4 |
| Preferred Securities | 0.3 |
| Bonds | 0.0 |
| Short-Term Investments and Net Other Assets (Liabilities) | 0.7 |
ASSET ALLOCATION (% of Fund's net assets) |
 |
| United States | 98.5 |
| France | 0.7 |
| Canada | 0.5 |
| Japan | 0.3 |
| China | 0.0 |
GEOGRAPHIC DIVERSIFICATION (% of Fund's net assets) |
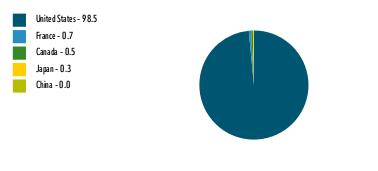 |
TOP HOLDINGS (% of Fund's net assets) | ||
| Boston Scientific Corp | 13.1 | |
| Danaher Corp | 12.7 | |
| Thermo Fisher Scientific Inc | 9.4 | |
| Intuitive Surgical Inc | 8.4 | |
| Stryker Corp | 6.7 | |
| Abbott Laboratories | 4.8 | |
| Penumbra Inc | 4.6 | |
| Insulet Corp | 4.2 | |
| Veeva Systems Inc Class A | 3.1 | |
| IQVIA Holdings Inc | 3.1 | |
| 70.1 |
| Fidelity, the Fidelity Investments Logo and all other Fidelity trademarks or service marks used herein are trademarks or service marks of FMR LLC. Any third-party marks that are used herein are trademarks or service marks of their respective owners. © 2024 FMR LLC. All rights reserved. | ||
 | For additional information about the Fund; including its prospectus, financial information, holdings and proxy information, scan the QR code or visit fundresearch.fidelity.com/prospectus/sec 1.9914530.100 354-TSRS-1024 | |
SEMI-ANNUAL SHAREHOLDER REPORT | AS OF AUGUST 31, 2024 | ||
| | Telecommunications Portfolio Fidelity Advisor® Telecommunications Fund Class I : FTUIX | |
| Costs of a $10,000 investment | Costs paid as a percentage of a $10,000 investment | ||
| Class I | $ 41 | 0.76% |
KEY FACTS | ||
| Fund Size | $196,158,282 | |
| Number of Holdings | 27 | |
| Portfolio Turnover | 29% |
(as of August 31, 2024)
TOP INDUSTRIES (% of Fund's net assets) | ||
| Diversified Telecommunication Services | 75.8 | |
| Wireless Telecommunication Services | 12.7 | |
| Media | 4.1 | |
| IT Services | 0.6 | |
| Construction & Engineering | 0.2 | |
| Common Stocks | 93.4 |
| Short-Term Investments and Net Other Assets (Liabilities) | 6.6 |
ASSET ALLOCATION (% of Fund's net assets) |
|
| United States | 92.5 |
| Puerto Rico | 4.0 |
| Belgium | 3.5 |
GEOGRAPHIC DIVERSIFICATION (% of Fund's net assets) |
|
TOP HOLDINGS (% of Fund's net assets) | ||
| AT&T Inc | 23.3 | |
| Verizon Communications Inc | 19.7 | |
| Lumen Technologies Inc | 6.2 | |
| Cogent Communications Holdings Inc | 4.9 | |
| T-Mobile US Inc | 4.8 | |
| Iridium Communications Inc | 4.8 | |
| Liberty Latin America Ltd Class C | 4.0 | |
| Liberty Global Ltd Class C | 3.5 | |
| Telephone and Data Systems Inc | 3.4 | |
| Gogo Inc | 2.9 | |
| 77.5 |
| Fidelity, the Fidelity Investments Logo and all other Fidelity trademarks or service marks used herein are trademarks or service marks of FMR LLC. Any third-party marks that are used herein are trademarks or service marks of their respective owners. © 2024 FMR LLC. All rights reserved. | ||
 | For additional information about the Fund; including its prospectus, financial information, holdings and proxy information, scan the QR code or visit fundresearch.fidelity.com/prospectus/sec 1.9914515.100 1798-TSRS-1024 | |
SEMI-ANNUAL SHAREHOLDER REPORT | AS OF AUGUST 31, 2024 | ||
| | Enterprise Technology Services Portfolio Enterprise Technology Services Portfolio : FBSOX | |
| Costs of a $10,000 investment | Costs paid as a percentage of a $10,000 investment | ||
| Enterprise Technology Services Portfolio | $ 33 | 0.66% |
KEY FACTS | ||
| Fund Size | $1,702,201,601 | |
| Number of Holdings | 34 | |
| Portfolio Turnover | 65% |
(as of August 31, 2024)
TOP INDUSTRIES (% of Fund's net assets) | ||
| Financial Services | 59.5 | |
| IT Services | 24.0 | |
| Professional Services | 8.2 | |
| Software | 4.7 | |
| Broadline Retail | 1.8 | |
| Interactive Media & Services | 1.6 | |
| Common Stocks | 99.8 |
| Short-Term Investments and Net Other Assets (Liabilities) | 0.2 |
ASSET ALLOCATION (% of Fund's net assets) |
 |
| United States | 90.8 |
| Ireland | 7.4 |
| Germany | 1.8 |
GEOGRAPHIC DIVERSIFICATION (% of Fund's net assets) |
 |
TOP HOLDINGS (% of Fund's net assets) | ||
| Visa Inc Class A | 21.6 | |
| Mastercard Inc Class A | 20.4 | |
| Accenture PLC Class A | 7.4 | |
| Fiserv Inc | 4.9 | |
| International Business Machines Corp | 3.9 | |
| Automatic Data Processing Inc | 3.7 | |
| Fidelity National Information Services Inc | 3.7 | |
| Gartner Inc | 3.6 | |
| Block Inc Class A | 3.4 | |
| Corpay Inc | 3.2 | |
| 75.8 |
| Fidelity, the Fidelity Investments Logo and all other Fidelity trademarks or service marks used herein are trademarks or service marks of FMR LLC. Any third-party marks that are used herein are trademarks or service marks of their respective owners. © 2024 FMR LLC. All rights reserved. | ||
 | For additional information about the Fund; including its prospectus, financial information, holdings and proxy information, scan the QR code or visit fundresearch.fidelity.com/prospectus/sec 1.9914529.100 353-TSRS-1024 | |
SEMI-ANNUAL SHAREHOLDER REPORT | AS OF AUGUST 31, 2024 | ||
| | Wireless Portfolio Wireless Portfolio : FWRLX | |
| Costs of a $10,000 investment | Costs paid as a percentage of a $10,000 investment | ||
| Wireless Portfolio | $ 39 | 0.73% |
KEY FACTS | ||
| Fund Size | $339,625,936 | |
| Number of Holdings | 41 | |
| Portfolio Turnover | 38% |
(as of August 31, 2024)
TOP INDUSTRIES (% of Fund's net assets) | ||
| Technology Hardware, Storage & Peripherals | 22.0 | |
| Diversified Telecommunication Services | 18.4 | |
| Semiconductors & Semiconductor Equipment | 18.2 | |
| Wireless Telecommunication Services | 10.6 | |
| Specialized REITs | 10.6 | |
| Communications Equipment | 6.2 | |
| Interactive Media & Services | 4.6 | |
| Broadline Retail | 2.9 | |
| Entertainment | 2.8 | |
| Others | 2.8 | |
| Common Stocks | 99.1 |
| Short-Term Investments and Net Other Assets (Liabilities) | 0.9 |
ASSET ALLOCATION (% of Fund's net assets) |
 |
| United States | 83.7 |
| Canada | 2.7 |
| Korea (South) | 2.3 |
| China | 2.0 |
| Belgium | 2.0 |
| Spain | 1.9 |
| Singapore | 1.6 |
| India | 1.3 |
| Finland | 1.1 |
| Others | 1.4 |
GEOGRAPHIC DIVERSIFICATION (% of Fund's net assets) |
 |
TOP HOLDINGS (% of Fund's net assets) | ||
| Apple Inc | 19.7 | |
| AT&T Inc | 10.9 | |
| American Tower Corp | 8.7 | |
| Marvell Technology Inc | 7.4 | |
| QUALCOMM Inc | 4.8 | |
| Motorola Solutions Inc | 4.8 | |
| T-Mobile US Inc | 4.6 | |
| United States Cellular Corp | 3.0 | |
| Amazon.com Inc | 2.9 | |
| Spotify Technology SA | 2.8 | |
| 69.6 |
| Fidelity, the Fidelity Investments Logo and all other Fidelity trademarks or service marks used herein are trademarks or service marks of FMR LLC. Any third-party marks that are used herein are trademarks or service marks of their respective owners. © 2024 FMR LLC. All rights reserved. | ||
 | For additional information about the Fund; including its prospectus, financial information, holdings and proxy information, scan the QR code or visit fundresearch.fidelity.com/prospectus/sec 1.9914560.100 963-TSRS-1024 | |
SEMI-ANNUAL SHAREHOLDER REPORT | AS OF AUGUST 31, 2024 | ||
| | Telecommunications Portfolio Fidelity Advisor® Telecommunications Fund Class C : FTUCX | |
| Costs of a $10,000 investment | Costs paid as a percentage of a $10,000 investment | ||
| Class C | $ 98 | 1.81% |
KEY FACTS | ||
| Fund Size | $196,158,282 | |
| Number of Holdings | 27 | |
| Portfolio Turnover | 29% |
(as of August 31, 2024)
TOP INDUSTRIES (% of Fund's net assets) | ||
| Diversified Telecommunication Services | 75.8 | |
| Wireless Telecommunication Services | 12.7 | |
| Media | 4.1 | |
| IT Services | 0.6 | |
| Construction & Engineering | 0.2 | |
| Common Stocks | 93.4 |
| Short-Term Investments and Net Other Assets (Liabilities) | 6.6 |
ASSET ALLOCATION (% of Fund's net assets) |
|
| United States | 92.5 |
| Puerto Rico | 4.0 |
| Belgium | 3.5 |
GEOGRAPHIC DIVERSIFICATION (% of Fund's net assets) |
|
TOP HOLDINGS (% of Fund's net assets) | ||
| AT&T Inc | 23.3 | |
| Verizon Communications Inc | 19.7 | |
| Lumen Technologies Inc | 6.2 | |
| Cogent Communications Holdings Inc | 4.9 | |
| T-Mobile US Inc | 4.8 | |
| Iridium Communications Inc | 4.8 | |
| Liberty Latin America Ltd Class C | 4.0 | |
| Liberty Global Ltd Class C | 3.5 | |
| Telephone and Data Systems Inc | 3.4 | |
| Gogo Inc | 2.9 | |
| 77.5 |
| Fidelity, the Fidelity Investments Logo and all other Fidelity trademarks or service marks used herein are trademarks or service marks of FMR LLC. Any third-party marks that are used herein are trademarks or service marks of their respective owners. © 2024 FMR LLC. All rights reserved. | ||
 | For additional information about the Fund; including its prospectus, financial information, holdings and proxy information, scan the QR code or visit fundresearch.fidelity.com/prospectus/sec 1.9914513.100 1796-TSRS-1024 | |
SEMI-ANNUAL SHAREHOLDER REPORT | AS OF AUGUST 31, 2024 | ||
| | Leisure Portfolio Leisure Portfolio : FDLSX | |
| Costs of a $10,000 investment | Costs paid as a percentage of a $10,000 investment | ||
| Leisure Portfolio | $ 35 | 0.69% |
KEY FACTS | ||
| Fund Size | $630,585,620 | |
| Number of Holdings | 40 | |
| Portfolio Turnover | 42% |
(as of August 31, 2024)
TOP INDUSTRIES (% of Fund's net assets) | ||
| Hotels, Restaurants & Leisure | 94.8 | |
| Consumer Staples Distribution & Retail | 1.4 | |
| Diversified Consumer Services | 1.2 | |
| Leisure Products | 1.1 | |
| Entertainment | 0.6 | |
| Food Products | 0.5 | |
| Financial Services | 0.2 | |
| Common Stocks | 99.8 |
| Short-Term Investments and Net Other Assets (Liabilities) | 0.2 |
ASSET ALLOCATION (% of Fund's net assets) |
 |
| United States | 95.2 |
| Canada | 2.8 |
| United Kingdom | 2.0 |
GEOGRAPHIC DIVERSIFICATION (% of Fund's net assets) |
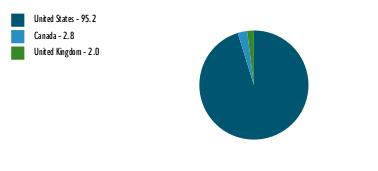 |
TOP HOLDINGS (% of Fund's net assets) | ||
| McDonald's Corp | 16.2 | |
| Booking Holdings Inc | 10.9 | |
| Starbucks Corp | 8.9 | |
| Hilton Worldwide Holdings Inc | 8.1 | |
| Marriott International Inc/MD Class A1 | 5.8 | |
| Chipotle Mexican Grill Inc | 4.8 | |
| Airbnb Inc Class A | 4.8 | |
| Royal Caribbean Cruises Ltd | 4.3 | |
| Yum! Brands Inc | 3.8 | |
| Restaurant Brands International Inc | 2.8 | |
| 70.4 |
| Fidelity, the Fidelity Investments Logo and all other Fidelity trademarks or service marks used herein are trademarks or service marks of FMR LLC. Any third-party marks that are used herein are trademarks or service marks of their respective owners. © 2024 FMR LLC. All rights reserved. | ||
 | For additional information about the Fund; including its prospectus, financial information, holdings and proxy information, scan the QR code or visit fundresearch.fidelity.com/prospectus/sec 1.9914498.100 62-TSRS-1024 | |
SEMI-ANNUAL SHAREHOLDER REPORT | AS OF AUGUST 31, 2024 | ||
| | Consumer Staples Portfolio Fidelity Advisor® Consumer Staples Fund Class A : FDAGX | |
| Costs of a $10,000 investment | Costs paid as a percentage of a $10,000 investment | ||
| Class A | $ 51 | 0.97% |
KEY FACTS | ||
| Fund Size | $1,405,206,341 | |
| Number of Holdings | 39 | |
| Portfolio Turnover | 39% |
(as of August 31, 2024)
TOP INDUSTRIES (% of Fund's net assets) | ||
| Beverages | 39.6 | |
| Household Products | 18.8 | |
| Food Products | 14.3 | |
| Consumer Staples Distribution & Retail | 10.8 | |
| Personal Care Products | 9.7 | |
| Tobacco | 6.4 | |
| Oil, Gas & Consumable Fuels | 0.1 | |
| Common Stocks | 99.7 |
| Short-Term Investments and Net Other Assets (Liabilities) | 0.3 |
ASSET ALLOCATION (% of Fund's net assets) |
|
| United States | 95.1 |
| United Kingdom | 4.8 |
| Canada | 0.1 |
GEOGRAPHIC DIVERSIFICATION (% of Fund's net assets) |
|
TOP HOLDINGS (% of Fund's net assets) | ||
| Coca-Cola Co/The | 14.2 | |
| Procter & Gamble Co/The | 14.2 | |
| Keurig Dr Pepper Inc | 9.8 | |
| Kenvue Inc | 6.3 | |
| Walmart Inc | 5.5 | |
| Philip Morris International Inc | 4.2 | |
| Monster Beverage Corp | 3.9 | |
| Energizer Holdings Inc | 3.8 | |
| PepsiCo Inc | 3.6 | |
| Estee Lauder Cos Inc/The Class A | 3.4 | |
| 68.9 |
| Fidelity, the Fidelity Investments Logo and all other Fidelity trademarks or service marks used herein are trademarks or service marks of FMR LLC. Any third-party marks that are used herein are trademarks or service marks of their respective owners. © 2024 FMR LLC. All rights reserved. | ||
 | For additional information about the Fund; including its prospectus, financial information, holdings and proxy information, scan the QR code or visit fundresearch.fidelity.com/prospectus/sec 1.9914490.100 1779-TSRS-1024 | |
SEMI-ANNUAL SHAREHOLDER REPORT | AS OF AUGUST 31, 2024 | ||
| | Communication Services Portfolio Fidelity Advisor® Communication Services Fund Class C : FGHMX | |
| Costs of a $10,000 investment | Costs paid as a percentage of a $10,000 investment | ||
| Class C | $ 90 | 1.71% |
KEY FACTS | ||
| Fund Size | $1,564,235,226 | |
| Number of Holdings | 49 | |
| Portfolio Turnover | 39% |
(as of August 31, 2024)
TOP INDUSTRIES (% of Fund's net assets) | ||
| Interactive Media & Services | 52.6 | |
| Entertainment | 22.6 | |
| Media | 8.0 | |
| Diversified Telecommunication Services | 7.9 | |
| Broadline Retail | 5.3 | |
| Ground Transportation | 2.5 | |
| IT Services | 0.0 | |
| Consumer Staples Distribution & Retail | 0.0 | |
| Software | 0.0 | |
| Common Stocks | 98.9 |
| Short-Term Investments and Net Other Assets (Liabilities) | 1.1 |
ASSET ALLOCATION (% of Fund's net assets) |
|
| United States | 93.7 |
| Puerto Rico | 1.8 |
| Belgium | 1.3 |
| Singapore | 1.2 |
| China | 0.7 |
| France | 0.7 |
| Japan | 0.5 |
| Canada | 0.1 |
| United Kingdom | 0.0 |
GEOGRAPHIC DIVERSIFICATION (% of Fund's net assets) |
|
TOP HOLDINGS (% of Fund's net assets) | ||
| Meta Platforms Inc Class A | 24.9 | |
| Alphabet Inc Class A | 22.6 | |
| AT&T Inc | 4.8 | |
| Walt Disney Co/The | 4.6 | |
| Amazon.com Inc | 4.6 | |
| Netflix Inc | 4.6 | |
| Charter Communications Inc Class A | 2.6 | |
| Uber Technologies Inc | 2.5 | |
| Liberty Media Corp-Liberty Formula One Class A | 2.3 | |
| Comcast Corp Class A | 2.3 | |
| 75.8 |
| Fidelity, the Fidelity Investments Logo and all other Fidelity trademarks or service marks used herein are trademarks or service marks of FMR LLC. Any third-party marks that are used herein are trademarks or service marks of their respective owners. © 2024 FMR LLC. All rights reserved. | ||
 | For additional information about the Fund; including its prospectus, financial information, holdings and proxy information, scan the QR code or visit fundresearch.fidelity.com/prospectus/sec 1.9914541.100 3326-TSRS-1024 | |
SEMI-ANNUAL SHAREHOLDER REPORT | AS OF AUGUST 31, 2024 | ||
| | Defense and Aerospace Portfolio Defense and Aerospace Portfolio : FSDAX | |
| Costs of a $10,000 investment | Costs paid as a percentage of a $10,000 investment | ||
| Defense and Aerospace Portfolio | $ 36 | 0.66% |
KEY FACTS | ||
| Fund Size | $1,763,712,595 | |
| Number of Holdings | 31 | |
| Portfolio Turnover | 42% |
(as of August 31, 2024)
TOP INDUSTRIES (% of Fund's net assets) | ||
| Aerospace & Defense | 96.0 | |
| Metals & Mining | 1.8 | |
| Professional Services | 0.8 | |
| Trading Companies & Distributors | 0.5 | |
| Common Stocks | 99.1 |
| Short-Term Investments and Net Other Assets (Liabilities) | 0.9 |
ASSET ALLOCATION (% of Fund's net assets) |
 |
| United States | 95.3 |
| United Kingdom | 2.2 |
| Canada | 1.0 |
| Germany | 0.8 |
| France | 0.7 |
GEOGRAPHIC DIVERSIFICATION (% of Fund's net assets) |
 |
TOP HOLDINGS (% of Fund's net assets) | ||
| General Electric Co | 16.0 | |
| Boeing Co | 10.1 | |
| RTX Corp | 9.8 | |
| Lockheed Martin Corp | 8.5 | |
| General Dynamics Corp | 5.7 | |
| HEICO Corp Class A | 4.9 | |
| Howmet Aerospace Inc | 4.9 | |
| TransDigm Group Inc | 4.7 | |
| Northrop Grumman Corp | 4.5 | |
| Axon Enterprise Inc | 3.8 | |
| 72.9 |
| Fidelity, the Fidelity Investments Logo and all other Fidelity trademarks or service marks used herein are trademarks or service marks of FMR LLC. Any third-party marks that are used herein are trademarks or service marks of their respective owners. © 2024 FMR LLC. All rights reserved. | ||
 | For additional information about the Fund; including its prospectus, financial information, holdings and proxy information, scan the QR code or visit fundresearch.fidelity.com/prospectus/sec 1.9914503.100 67-TSRS-1024 | |
SEMI-ANNUAL SHAREHOLDER REPORT | AS OF AUGUST 31, 2024 | ||
| | Transportation Portfolio Transportation Portfolio : FSRFX | |
| Costs of a $10,000 investment | Costs paid as a percentage of a $10,000 investment | ||
| Transportation Portfolio | $ 35 | 0.69% |
KEY FACTS | ||
| Fund Size | $541,061,408 | |
| Number of Holdings | 40 | |
| Portfolio Turnover | 24% |
(as of August 31, 2024)
TOP INDUSTRIES (% of Fund's net assets) | ||
| Ground Transportation | 53.8 | |
| Air Freight & Logistics | 20.7 | |
| Passenger Airlines | 14.2 | |
| Marine Transportation | 6.9 | |
| Oil, Gas & Consumable Fuels | 1.5 | |
| Energy Equipment & Services | 0.7 | |
| Common Stocks | 97.8 |
| Short-Term Investments and Net Other Assets (Liabilities) | 2.2 |
ASSET ALLOCATION (% of Fund's net assets) |
 |
| United States | 93.8 |
| Panama | 2.1 |
| Greece | 1.6 |
| Canada | 0.8 |
| Italy | 0.7 |
| Brazil | 0.7 |
| Monaco | 0.3 |
| Bermuda | 0.0 |
GEOGRAPHIC DIVERSIFICATION (% of Fund's net assets) |
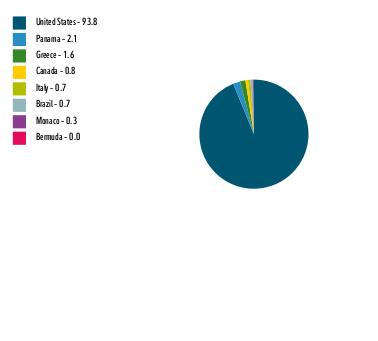 |
TOP HOLDINGS (% of Fund's net assets) | ||
| Union Pacific Corp | 18.5 | |
| Uber Technologies Inc | 15.3 | |
| United Parcel Service Inc Class B | 10.9 | |
| Norfolk Southern Corp | 5.3 | |
| CSX Corp | 4.9 | |
| FedEx Corp | 4.9 | |
| Kirby Corp | 4.3 | |
| Delta Air Lines Inc | 3.9 | |
| Alaska Air Group Inc | 2.6 | |
| SkyWest Inc | 2.5 | |
| 73.1 |
| Fidelity, the Fidelity Investments Logo and all other Fidelity trademarks or service marks used herein are trademarks or service marks of FMR LLC. Any third-party marks that are used herein are trademarks or service marks of their respective owners. © 2024 FMR LLC. All rights reserved. | ||
 | For additional information about the Fund; including its prospectus, financial information, holdings and proxy information, scan the QR code or visit fundresearch.fidelity.com/prospectus/sec 1.9914554.100 512-TSRS-1024 | |
SEMI-ANNUAL SHAREHOLDER REPORT | AS OF AUGUST 31, 2024 | ||
| | Health Care Services Portfolio Health Care Services Portfolio : FSHCX | |
| Costs of a $10,000 investment | Costs paid as a percentage of a $10,000 investment | ||
| Health Care Services Portfolio | $ 34 | 0.67% |
KEY FACTS | ||
| Fund Size | $1,395,684,497 | |
| Number of Holdings | 30 | |
| Portfolio Turnover | 66% |
(as of August 31, 2024)
TOP INDUSTRIES (% of Fund's net assets) | ||
| Health Care Providers & Services | 99.6 | |
| Health Care Technology | 0.4 | |
| Common Stocks | 99.6 |
| Preferred Stocks | 0.4 |
| Short-Term Investments and Net Other Assets (Liabilities) | 0.0 |
ASSET ALLOCATION (% of Fund's net assets) |
 |
| United States | 100.0 |
GEOGRAPHIC DIVERSIFICATION (% of Fund's net assets) |
 |
TOP HOLDINGS (% of Fund's net assets) | ||
| UnitedHealth Group Inc | 24.7 | |
| Cigna Group/The | 9.4 | |
| CVS Health Corp | 8.3 | |
| McKesson Corp | 5.4 | |
| Humana Inc | 4.4 | |
| Elevance Health Inc | 4.4 | |
| Cencora Inc | 4.4 | |
| Molina Healthcare Inc | 3.7 | |
| Centene Corp | 3.5 | |
| HCA Healthcare Inc | 3.3 | |
| 71.5 |
| Fidelity, the Fidelity Investments Logo and all other Fidelity trademarks or service marks used herein are trademarks or service marks of FMR LLC. Any third-party marks that are used herein are trademarks or service marks of their respective owners. © 2024 FMR LLC. All rights reserved. | ||
 | For additional information about the Fund; including its prospectus, financial information, holdings and proxy information, scan the QR code or visit fundresearch.fidelity.com/prospectus/sec 1.9914545.100 505-TSRS-1024 | |
SEMI-ANNUAL SHAREHOLDER REPORT | AS OF AUGUST 31, 2024 | ||
| | Materials Portfolio Materials Portfolio : FSDPX | |
| Costs of a $10,000 investment | Costs paid as a percentage of a $10,000 investment | ||
| Materials Portfolio | $ 36 | 0.70% |
KEY FACTS | ||
| Fund Size | $849,835,612 | |
| Number of Holdings | 39 | |
| Portfolio Turnover | 59% |
(as of August 31, 2024)
TOP INDUSTRIES (% of Fund's net assets) | ||
| Chemicals | 61.6 | |
| Metals & Mining | 25.3 | |
| Containers & Packaging | 7.9 | |
| Construction Materials | 4.4 | |
| Common Stocks | 99.2 |
| Short-Term Investments and Net Other Assets (Liabilities) | 0.8 |
ASSET ALLOCATION (% of Fund's net assets) |
|
| United States | 89.9 |
| Canada | 6.0 |
| Zambia | 2.4 |
| Brazil | 1.7 |
GEOGRAPHIC DIVERSIFICATION (% of Fund's net assets) |
|
TOP HOLDINGS (% of Fund's net assets) | ||
| Linde PLC | 19.1 | |
| Ecolab Inc | 10.2 | |
| Dow Inc | 6.9 | |
| Air Products and Chemicals Inc | 5.4 | |
| Freeport-McMoRan Inc | 5.0 | |
| Corteva Inc | 3.9 | |
| Nucor Corp | 3.9 | |
| Axalta Coating Systems Ltd | 3.6 | |
| Chemours Co/The | 3.3 | |
| First Quantum Minerals Ltd | 2.4 | |
| 63.7 |
| Fidelity, the Fidelity Investments Logo and all other Fidelity trademarks or service marks used herein are trademarks or service marks of FMR LLC. Any third-party marks that are used herein are trademarks or service marks of their respective owners. © 2024 FMR LLC. All rights reserved. | ||
 | For additional information about the Fund; including its prospectus, financial information, holdings and proxy information, scan the QR code or visit fundresearch.fidelity.com/prospectus/sec 1.9914552.100 509-TSRS-1024 | |
SEMI-ANNUAL SHAREHOLDER REPORT | AS OF AUGUST 31, 2024 | ||
| | Insurance Portfolio Insurance Portfolio : FSPCX | |
| Costs of a $10,000 investment | Costs paid as a percentage of a $10,000 investment | ||
| Insurance Portfolio | $ 38 | 0.70% |
KEY FACTS | ||
| Fund Size | $847,602,456 | |
| Number of Holdings | 24 | |
| Portfolio Turnover | 46% |
(as of August 31, 2024)
TOP INDUSTRIES (% of Fund's net assets) | ||
| Insurance | 92.9 | |
| Financial Services | 4.9 | |
| Common Stocks | 97.8 |
| Short-Term Investments and Net Other Assets (Liabilities) | 2.2 |
ASSET ALLOCATION (% of Fund's net assets) |
 |
| United States | 98.0 |
| Australia | 2.0 |
GEOGRAPHIC DIVERSIFICATION (% of Fund's net assets) |
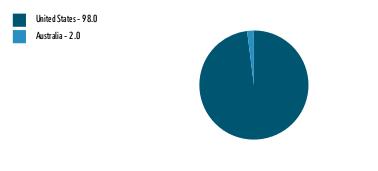 |
TOP HOLDINGS (% of Fund's net assets) | ||
| Chubb Ltd | 9.9 | |
| Marsh & McLennan Cos Inc | 9.7 | |
| Arthur J Gallagher & Co | 9.2 | |
| Hartford Financial Services Group Inc/The | 8.8 | |
| Travelers Cos Inc/The | 7.7 | |
| Progressive Corp/The | 4.8 | |
| Reinsurance Group of America Inc | 4.8 | |
| MetLife Inc | 4.7 | |
| Arch Capital Group Ltd | 4.7 | |
| Brown & Brown Inc | 4.6 | |
| 68.9 |
| Fidelity, the Fidelity Investments Logo and all other Fidelity trademarks or service marks used herein are trademarks or service marks of FMR LLC. Any third-party marks that are used herein are trademarks or service marks of their respective owners. © 2024 FMR LLC. All rights reserved. | ||
 | For additional information about the Fund; including its prospectus, financial information, holdings and proxy information, scan the QR code or visit fundresearch.fidelity.com/prospectus/sec 1.9914525.100 45-TSRS-1024 | |
SEMI-ANNUAL SHAREHOLDER REPORT | AS OF AUGUST 31, 2024 | ||
| | Health Care Portfolio Health Care Portfolio : FSPHX | |
| Costs of a $10,000 investment | Costs paid as a percentage of a $10,000 investment | ||
| Health Care Portfolio | $ 33 | 0.63% |
KEY FACTS | ||
| Fund Size | $7,810,818,412 | |
| Number of Holdings | 105 | |
| Portfolio Turnover | 35% |
(as of August 31, 2024)
TOP INDUSTRIES (% of Fund's net assets) | ||
| Health Care Equipment & Supplies | 24.3 | |
| Biotechnology | 23.5 | |
| Health Care Providers & Services | 22.5 | |
| Pharmaceuticals | 16.6 | |
| Life Sciences Tools & Services | 10.5 | |
| Health Care Technology | 2.1 | |
| Financial Services | 0.1 | |
| Common Stocks | 98.1 |
| Preferred Stocks | 1.5 |
| Preferred Securities | 0.2 |
| Bonds | 0.1 |
| Short-Term Investments and Net Other Assets (Liabilities) | 0.1 |
ASSET ALLOCATION (% of Fund's net assets) |
 |
| United States | 91.9 |
| Netherlands | 2.7 |
| United Kingdom | 1.7 |
| Denmark | 1.5 |
| Belgium | 1.4 |
| Canada | 0.7 |
| Israel | 0.1 |
| China | 0.0 |
GEOGRAPHIC DIVERSIFICATION (% of Fund's net assets) |
 |
TOP HOLDINGS (% of Fund's net assets) | ||
| UnitedHealth Group Inc | 10.8 | |
| Boston Scientific Corp | 9.4 | |
| Eli Lilly & Co | 8.4 | |
| Danaher Corp | 5.9 | |
| Regeneron Pharmaceuticals Inc | 4.2 | |
| Merck & Co Inc | 3.8 | |
| Penumbra Inc | 3.5 | |
| Cigna Group/The | 3.2 | |
| Stryker Corp | 2.6 | |
| Insulet Corp | 2.5 | |
| 54.3 |
| Fidelity, the Fidelity Investments Logo and all other Fidelity trademarks or service marks used herein are trademarks or service marks of FMR LLC. Any third-party marks that are used herein are trademarks or service marks of their respective owners. © 2024 FMR LLC. All rights reserved. | ||
 | For additional information about the Fund; including its prospectus, financial information, holdings and proxy information, scan the QR code or visit fundresearch.fidelity.com/prospectus/sec 1.9914499.100 63-TSRS-1024 | |
SEMI-ANNUAL SHAREHOLDER REPORT | AS OF AUGUST 31, 2024 | ||
| | Construction and Housing Portfolio Construction and Housing Portfolio : FSHOX | |
| Costs of a $10,000 investment | Costs paid as a percentage of a $10,000 investment | ||
| Construction and Housing Portfolio | $ 36 | 0.69% |
KEY FACTS | ||
| Fund Size | $815,270,742 | |
| Number of Holdings | 52 | |
| Portfolio Turnover | 31% |
(as of August 31, 2024)
TOP INDUSTRIES (% of Fund's net assets) | ||
| Specialty Retail | 33.3 | |
| Building Products | 22.3 | |
| Household Durables | 14.4 | |
| Residential REITs | 10.8 | |
| Construction & Engineering | 9.0 | |
| Construction Materials | 8.7 | |
| Trading Companies & Distributors | 0.4 | |
| Chemicals | 0.3 | |
| Real Estate Management & Development | 0.2 | |
| Ground Transportation | 0.2 | |
| Common Stocks | 99.6 |
| Short-Term Investments and Net Other Assets (Liabilities) | 0.4 |
ASSET ALLOCATION (% of Fund's net assets) |
 |
| United States | 100.0 |
GEOGRAPHIC DIVERSIFICATION (% of Fund's net assets) |
 |
TOP HOLDINGS (% of Fund's net assets) | ||
| Home Depot Inc/The | 17.2 | |
| Lowe's Cos Inc | 13.2 | |
| Trane Technologies PLC | 4.9 | |
| Johnson Controls International plc | 4.6 | |
| CRH PLC | 3.9 | |
| Martin Marietta Materials Inc | 3.1 | |
| PulteGroup Inc | 2.9 | |
| Invitation Homes Inc | 2.9 | |
| Quanta Services Inc | 2.7 | |
| Carrier Global Corp | 2.6 | |
| 58.0 |
| Fidelity, the Fidelity Investments Logo and all other Fidelity trademarks or service marks used herein are trademarks or service marks of FMR LLC. Any third-party marks that are used herein are trademarks or service marks of their respective owners. © 2024 FMR LLC. All rights reserved. | ||
 | For additional information about the Fund; including its prospectus, financial information, holdings and proxy information, scan the QR code or visit fundresearch.fidelity.com/prospectus/sec 1.9914553.100 511-TSRS-1024 | |
SEMI-ANNUAL SHAREHOLDER REPORT | AS OF AUGUST 31, 2024 | ||
| | Financials Portfolio Financials Portfolio : FIDSX | |
| Costs of a $10,000 investment | Costs paid as a percentage of a $10,000 investment | ||
| Financials Portfolio | $ 38 | 0.70% |
KEY FACTS | ||
| Fund Size | $783,287,308 | |
| Number of Holdings | 65 | |
| Portfolio Turnover | 31% |
(as of August 31, 2024)
TOP INDUSTRIES (% of Fund's net assets) | ||
| Banks | 34.5 | |
| Financial Services | 21.0 | |
| Capital Markets | 20.5 | |
| Insurance | 18.8 | |
| Consumer Finance | 3.9 | |
| Professional Services | 1.0 | |
| Common Stocks | 99.7 |
| Short-Term Investments and Net Other Assets (Liabilities) | 0.3 |
ASSET ALLOCATION (% of Fund's net assets) |
 |
| United States | 93.2 |
| United Kingdom | 4.0 |
| Puerto Rico | 1.8 |
| Grand Cayman (UK Overseas Ter) | 0.6 |
| Mexico | 0.4 |
GEOGRAPHIC DIVERSIFICATION (% of Fund's net assets) |
 |
TOP HOLDINGS (% of Fund's net assets) | ||
| Mastercard Inc Class A | 10.0 | |
| Wells Fargo & Co | 6.5 | |
| Bank of America Corp | 5.3 | |
| Citigroup Inc | 2.9 | |
| Morgan Stanley | 2.5 | |
| M&T Bank Corp | 2.4 | |
| Apollo Global Management Inc | 2.3 | |
| Chubb Ltd | 2.3 | |
| Reinsurance Group of America Inc | 2.2 | |
| Marsh & McLennan Cos Inc | 2.1 | |
| 38.5 |
| Fidelity, the Fidelity Investments Logo and all other Fidelity trademarks or service marks used herein are trademarks or service marks of FMR LLC. Any third-party marks that are used herein are trademarks or service marks of their respective owners. © 2024 FMR LLC. All rights reserved. | ||
 | For additional information about the Fund; including its prospectus, financial information, holdings and proxy information, scan the QR code or visit fundresearch.fidelity.com/prospectus/sec 1.9914502.100 66-TSRS-1024 | |
SEMI-ANNUAL SHAREHOLDER REPORT | AS OF AUGUST 31, 2024 | ||
| | Energy Portfolio Energy Portfolio : FSENX | |
| Costs of a $10,000 investment | Costs paid as a percentage of a $10,000 investment | ||
| Energy Portfolio | $ 34 | 0.66% |
KEY FACTS | ||
| Fund Size | $2,159,619,676 | |
| Number of Holdings | 45 | |
| Portfolio Turnover | 19% |
(as of August 31, 2024)
TOP INDUSTRIES (% of Fund's net assets) | ||
| Oil, Gas & Consumable Fuels | 80.6 | |
| Energy Equipment & Services | 15.5 | |
| Independent Power and Renewable Electricity Producers | 1.7 | |
| Machinery | 0.8 | |
| Common Stocks | 98.6 |
| Short-Term Investments and Net Other Assets (Liabilities) | 1.4 |
ASSET ALLOCATION (% of Fund's net assets) |
 |
| United States | 82.8 |
| Canada | 13.5 |
| United Kingdom | 3.1 |
| Norway | 0.3 |
| France | 0.1 |
| Cameroon | 0.1 |
| United Arab Emirates | 0.1 |
GEOGRAPHIC DIVERSIFICATION (% of Fund's net assets) |
 |
TOP HOLDINGS (% of Fund's net assets) | ||
| Exxon Mobil Corp | 24.9 | |
| Cenovus Energy Inc | 5.9 | |
| Schlumberger NV | 5.0 | |
| Chevron Corp | 5.0 | |
| Marathon Petroleum Corp | 4.9 | |
| Canadian Natural Resources Ltd | 4.8 | |
| Cheniere Energy Inc | 4.4 | |
| Occidental Petroleum Corp | 3.6 | |
| Valero Energy Corp | 3.6 | |
| Diamondback Energy Inc | 3.3 | |
| 65.4 |
| Fidelity, the Fidelity Investments Logo and all other Fidelity trademarks or service marks used herein are trademarks or service marks of FMR LLC. Any third-party marks that are used herein are trademarks or service marks of their respective owners. © 2024 FMR LLC. All rights reserved. | ||
 | For additional information about the Fund; including its prospectus, financial information, holdings and proxy information, scan the QR code or visit fundresearch.fidelity.com/prospectus/sec 1.9914497.100 60-TSRS-1024 | |
SEMI-ANNUAL SHAREHOLDER REPORT | AS OF AUGUST 31, 2024 | ||
| | Retailing Portfolio Retailing Portfolio : FSRPX | |
| Costs of a $10,000 investment | Costs paid as a percentage of a $10,000 investment | ||
| Retailing Portfolio | $ 33 | 0.64% |
KEY FACTS | ||
| Fund Size | $2,883,461,931 | |
| Number of Holdings | 45 | |
| Portfolio Turnover | 29% |
(as of August 31, 2024)
TOP INDUSTRIES (% of Fund's net assets) | ||
| Specialty Retail | 36.6 | |
| Broadline Retail | 30.0 | |
| Consumer Staples Distribution & Retail | 17.7 | |
| Textiles, Apparel & Luxury Goods | 12.5 | |
| Interactive Media & Services | 1.3 | |
| Household Durables | 0.9 | |
| Hotels, Restaurants & Leisure | 0.5 | |
| Automobile Components | 0.3 | |
| Common Stocks | 99.8 |
| Short-Term Investments and Net Other Assets (Liabilities) | 0.2 |
ASSET ALLOCATION (% of Fund's net assets) |
 |
| United States | 91.0 |
| Canada | 4.6 |
| Brazil | 1.6 |
| France | 1.0 |
| United Kingdom | 1.0 |
| Germany | 0.8 |
GEOGRAPHIC DIVERSIFICATION (% of Fund's net assets) |
 |
TOP HOLDINGS (% of Fund's net assets) | ||
| Amazon.com Inc | 25.3 | |
| Home Depot Inc/The | 7.5 | |
| Walmart Inc | 6.9 | |
| Lowe's Cos Inc | 6.6 | |
| TJX Cos Inc/The | 4.7 | |
| NIKE Inc Class B | 4.2 | |
| O'Reilly Automotive Inc | 3.7 | |
| Costco Wholesale Corp | 2.8 | |
| Deckers Outdoor Corp | 2.7 | |
| BJ's Wholesale Club Holdings Inc | 2.6 | |
| 67.0 |
| Fidelity, the Fidelity Investments Logo and all other Fidelity trademarks or service marks used herein are trademarks or service marks of FMR LLC. Any third-party marks that are used herein are trademarks or service marks of their respective owners. © 2024 FMR LLC. All rights reserved. | ||
 | For additional information about the Fund; including its prospectus, financial information, holdings and proxy information, scan the QR code or visit fundresearch.fidelity.com/prospectus/sec 1.9914526.100 46-TSRS-1024 | |
SEMI-ANNUAL SHAREHOLDER REPORT | AS OF AUGUST 31, 2024 | ||
| | Consumer Staples Portfolio Fidelity Advisor® Consumer Staples Fund Class I : FDIGX | |
| Costs of a $10,000 investment | Costs paid as a percentage of a $10,000 investment | ||
| Class I | $ 37 | 0.71% |
KEY FACTS | ||
| Fund Size | $1,405,206,341 | |
| Number of Holdings | 39 | |
| Portfolio Turnover | 39% |
(as of August 31, 2024)
TOP INDUSTRIES (% of Fund's net assets) | ||
| Beverages | 39.6 | |
| Household Products | 18.8 | |
| Food Products | 14.3 | |
| Consumer Staples Distribution & Retail | 10.8 | |
| Personal Care Products | 9.7 | |
| Tobacco | 6.4 | |
| Oil, Gas & Consumable Fuels | 0.1 | |
| Common Stocks | 99.7 |
| Short-Term Investments and Net Other Assets (Liabilities) | 0.3 |
ASSET ALLOCATION (% of Fund's net assets) |
|
| United States | 95.1 |
| United Kingdom | 4.8 |
| Canada | 0.1 |
GEOGRAPHIC DIVERSIFICATION (% of Fund's net assets) |
|
TOP HOLDINGS (% of Fund's net assets) | ||
| Coca-Cola Co/The | 14.2 | |
| Procter & Gamble Co/The | 14.2 | |
| Keurig Dr Pepper Inc | 9.8 | |
| Kenvue Inc | 6.3 | |
| Walmart Inc | 5.5 | |
| Philip Morris International Inc | 4.2 | |
| Monster Beverage Corp | 3.9 | |
| Energizer Holdings Inc | 3.8 | |
| PepsiCo Inc | 3.6 | |
| Estee Lauder Cos Inc/The Class A | 3.4 | |
| 68.9 |
| Fidelity, the Fidelity Investments Logo and all other Fidelity trademarks or service marks used herein are trademarks or service marks of FMR LLC. Any third-party marks that are used herein are trademarks or service marks of their respective owners. © 2024 FMR LLC. All rights reserved. | ||
 | For additional information about the Fund; including its prospectus, financial information, holdings and proxy information, scan the QR code or visit fundresearch.fidelity.com/prospectus/sec 1.9914493.100 1783-TSRS-1024 | |
SEMI-ANNUAL SHAREHOLDER REPORT | AS OF AUGUST 31, 2024 | ||
| | Technology Portfolio Technology Portfolio : FSPTX | |
| Costs of a $10,000 investment | Costs paid as a percentage of a $10,000 investment | ||
| Technology Portfolio | $ 33 | 0.62% |
KEY FACTS | ||
| Fund Size | $15,833,587,650 | |
| Number of Holdings | 92 | |
| Portfolio Turnover | 43% |
(as of August 31, 2024)
TOP INDUSTRIES (% of Fund's net assets) | ||
| Semiconductors & Semiconductor Equipment | 42.0 | |
| Software | 21.1 | |
| Technology Hardware, Storage & Peripherals | 20.4 | |
| IT Services | 4.0 | |
| Communications Equipment | 2.3 | |
| Ground Transportation | 2.3 | |
| Broadline Retail | 1.6 | |
| Electronic Equipment, Instruments & Components | 0.8 | |
| Entertainment | 0.6 | |
| Others | 0.6 | |
| Common Stocks | 94.8 |
| Preferred Stocks | 0.9 |
| Bonds | 0.0 |
| Short-Term Investments and Net Other Assets (Liabilities) | 4.3 |
ASSET ALLOCATION (% of Fund's net assets) |
 |
| United States | 91.4 |
| China | 4.0 |
| Taiwan | 2.0 |
| Canada | 1.3 |
| Netherlands | 1.2 |
| United Kingdom | 0.1 |
| Estonia | 0.0 |
| Korea (South) | 0.0 |
| Israel | 0.0 |
GEOGRAPHIC DIVERSIFICATION (% of Fund's net assets) |
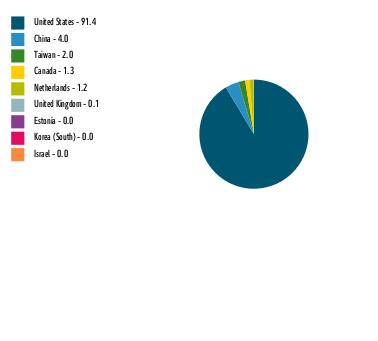 |
TOP HOLDINGS (% of Fund's net assets) | ||
| NVIDIA Corp | 20.4 | |
| Apple Inc | 18.7 | |
| Microsoft Corp | 10.7 | |
| Marvell Technology Inc | 4.3 | |
| ON Semiconductor Corp | 4.3 | |
| Servicenow Inc | 4.1 | |
| NXP Semiconductors NV | 3.9 | |
| Salesforce Inc | 2.8 | |
| GlobalFoundries Inc | 2.6 | |
| Okta Inc Class A | 2.6 | |
| 74.4 |
| Fidelity, the Fidelity Investments Logo and all other Fidelity trademarks or service marks used herein are trademarks or service marks of FMR LLC. Any third-party marks that are used herein are trademarks or service marks of their respective owners. © 2024 FMR LLC. All rights reserved. | ||
 | For additional information about the Fund; including its prospectus, financial information, holdings and proxy information, scan the QR code or visit fundresearch.fidelity.com/prospectus/sec 1.9914500.100 64-TSRS-1024 | |
Item 2.
Code of Ethics
Not applicable.
Item 3.
Audit Committee Financial Expert
Not applicable.
Item 4.
Principal Accountant Fees and Services
Not applicable.
Item 5.
Audit Committee of Listed Registrants
Not applicable.
Item 6.
Investments
(a)
Not applicable.
(b)
Not applicable
Item 7.
Financial Statements and Financial Highlights for Open-End Management Investment Companies


Contents
| Common Stocks - 99.0% | |||
| Shares | Value ($) | ||
| Chemicals - 99.0% | |||
| Commodity Chemicals - 16.5% | |||
| Cabot Corp. (a) | 202,700 | 21,305,797 | |
| Koppers Holdings, Inc. | 65,400 | 2,588,532 | |
| LyondellBasell Industries NV Class A | 186,700 | 18,427,290 | |
| Olin Corp. | 279,600 | 12,210,132 | |
| Orion SA | 724,326 | 13,508,680 | |
| Tronox Holdings PLC | 797,369 | 11,107,350 | |
| Westlake Corp. | 146,556 | 21,315,105 | |
| 100,462,886 | |||
| Diversified Chemicals - 2.6% | |||
| The Chemours Co. LLC | 813,359 | 15,811,699 | |
| Fertilizers & Agricultural Chemicals - 6.7% | |||
| CF Industries Holdings, Inc. | 106,417 | 8,842,189 | |
| Corteva, Inc. | 437,793 | 25,085,539 | |
| FMC Corp. | 112,500 | 7,265,250 | |
| 41,192,978 | |||
| Industrial Gases - 32.2% | |||
| Air Products & Chemicals, Inc. | 193,811 | 54,044,197 | |
| Linde PLC | 297,516 | 142,287,025 | |
| 196,331,222 | |||
| Specialty Chemicals - 41.0% | |||
| Albemarle Corp. (a) | 116,800 | 10,541,200 | |
| Arcadium Lithium PLC (a) | 480 | 1,301 | |
| Axalta Coating Systems Ltd. (b) | 813,000 | 29,674,500 | |
| Celanese Corp. | 179,300 | 23,416,580 | |
| DuPont de Nemours, Inc. | 312,194 | 26,302,345 | |
| Ecolab, Inc. | 141,000 | 35,698,380 | |
| Element Solutions, Inc. | 1,022,643 | 27,345,474 | |
| International Flavors & Fragrances, Inc. | 111,616 | 11,606,948 | |
| PPG Industries, Inc. | 111,600 | 14,477,868 | |
| Quaker Chemical Corp. | 16,000 | 2,708,320 | |
| Sherwin-Williams Co. | 185,399 | 68,480,829 | |
| 250,253,745 | |||
| TOTAL COMMON STOCKS (Cost $358,610,126) | 604,052,530 | ||
| Money Market Funds - 6.0% | |||
| Shares | Value ($) | ||
| Fidelity Cash Central Fund 5.39% (c) | 5,015,047 | 5,016,050 | |
| Fidelity Securities Lending Cash Central Fund 5.39% (c)(d) | 31,270,823 | 31,273,950 | |
| TOTAL MONEY MARKET FUNDS (Cost $36,290,000) | 36,290,000 | ||
| TOTAL INVESTMENT IN SECURITIES - 105.0% (Cost $394,900,126) | 640,342,530 |
NET OTHER ASSETS (LIABILITIES) - (5.0)% | (30,260,792) |
| NET ASSETS - 100.0% | 610,081,738 |
| (a) | Security or a portion of the security is on loan at period end. |
| (b) | Non-income producing |
| (c) | Affiliated fund that is generally available only to investment companies and other accounts managed by Fidelity Investments. The rate quoted is the annualized seven-day yield of the fund at period end. A complete unaudited listing of the fund's holdings as of its most recent quarter end is available upon request. In addition, each Fidelity Central Fund's financial statements are available on the SEC's website or upon request. |
| (d) | Investment made with cash collateral received from securities on loan. |
| Affiliate | Value, beginning of period ($) | Purchases ($) | Sales Proceeds ($) | Dividend Income ($) | Realized Gain (loss) ($) | Change in Unrealized appreciation (depreciation) ($) | Value, end of period ($) | % ownership, end of period |
| Fidelity Cash Central Fund 5.39% | 4,115,801 | 36,771,848 | 35,871,555 | 56,240 | (44) | - | 5,016,050 | 0.0% |
| Fidelity Securities Lending Cash Central Fund 5.39% | 49,130,675 | 92,550,219 | 110,406,944 | 13,673 | - | - | 31,273,950 | 0.1% |
| Total | 53,246,476 | 129,322,067 | 146,278,499 | 69,913 | (44) | - | 36,290,000 | |
| Valuation Inputs at Reporting Date: | ||||
| Description | Total ($) | Level 1 ($) | Level 2 ($) | Level 3 ($) |
Investments in Securities: | ||||
| Common Stocks | 604,052,530 | 604,052,530 | - | - |
| Money Market Funds | 36,290,000 | 36,290,000 | - | - |
| Total Investments in Securities: | 640,342,530 | 640,342,530 | - | - |
| Statement of Assets and Liabilities | ||||
| As of August 31, 2024 (Unaudited) | ||||
| Assets | ||||
| Investment in securities, at value (including securities loaned of $30,655,295) - See accompanying schedule: | ||||
Unaffiliated issuers (cost $358,610,126) | $ | 604,052,530 | ||
Fidelity Central Funds (cost $36,290,000) | 36,290,000 | |||
| Total Investment in Securities (cost $394,900,126) | $ | 640,342,530 | ||
| Receivable for fund shares sold | 33,559 | |||
| Dividends receivable | 1,210,219 | |||
| Reclaims receivable | 340,005 | |||
| Distributions receivable from Fidelity Central Funds | 11,616 | |||
| Prepaid expenses | 2,012 | |||
| Other receivables | 182,065 | |||
Total assets | 642,122,006 | |||
| Liabilities | ||||
| Payable for fund shares redeemed | $ | 219,218 | ||
| Accrued management fee | 329,304 | |||
| Other payables and accrued expenses | 217,796 | |||
| Collateral on securities loaned | 31,273,950 | |||
| Total liabilities | 32,040,268 | |||
| Net Assets | $ | 610,081,738 | ||
| Net Assets consist of: | ||||
| Paid in capital | $ | 357,271,810 | ||
| Total accumulated earnings (loss) | 252,809,928 | |||
| Net Assets | $ | 610,081,738 | ||
Net Asset Value, offering price and redemption price per share ($610,081,738 ÷ 39,446,242 shares) | $ | 15.47 | ||
| Statement of Operations | ||||
Six months ended August 31, 2024 (Unaudited) | ||||
| Investment Income | ||||
| Dividends | $ | 5,460,354 | ||
| Income from Fidelity Central Funds (including $13,673 from security lending) | 69,913 | |||
| Total income | 5,530,267 | |||
| Expenses | ||||
| Management fee | $ | 2,069,060 | ||
| Custodian fees and expenses | 3,355 | |||
| Independent trustees' fees and expenses | 1,312 | |||
| Registration fees | 16,310 | |||
| Audit fees | 32,314 | |||
| Legal | 153 | |||
| Miscellaneous | 14,912 | |||
| Total expenses before reductions | 2,137,416 | |||
| Expense reductions | (12,575) | |||
| Total expenses after reductions | 2,124,841 | |||
| Net Investment income (loss) | 3,405,426 | |||
| Realized and Unrealized Gain (Loss) | ||||
| Net realized gain (loss) on: | ||||
| Investment Securities: | ||||
| Unaffiliated issuers | 5,313,119 | |||
| Fidelity Central Funds | (44) | |||
| Total net realized gain (loss) | 5,313,075 | |||
| Change in net unrealized appreciation (depreciation) on: | ||||
| Investment Securities: | ||||
| Unaffiliated issuers | 27,701,331 | |||
| Assets and liabilities in foreign currencies | 7,566 | |||
| Total change in net unrealized appreciation (depreciation) | 27,708,897 | |||
| Net gain (loss) | 33,021,972 | |||
| Net increase (decrease) in net assets resulting from operations | $ | 36,427,398 | ||
| Statement of Changes in Net Assets | ||||
Six months ended August 31, 2024 (Unaudited) | Year ended February 29, 2024 | |||
| Increase (Decrease) in Net Assets | ||||
| Operations | ||||
| Net investment income (loss) | $ | 3,405,426 | $ | 7,036,674 |
| Net realized gain (loss) | 5,313,075 | 60,376,339 | ||
| Change in net unrealized appreciation (depreciation) | 27,708,897 | (34,221,599) | ||
| Net increase (decrease) in net assets resulting from operations | 36,427,398 | 33,191,414 | ||
| Distributions to shareholders | (30,918,067) | (39,559,398) | ||
| Share transactions | ||||
| Proceeds from sales of shares | 8,418,364 | 16,937,515 | ||
| Reinvestment of distributions | 28,901,530 | 36,948,117 | ||
| Cost of shares redeemed | (53,929,275) | (104,444,954) | ||
Net increase (decrease) in net assets resulting from share transactions | (16,609,381) | (50,559,322) | ||
| Total increase (decrease) in net assets | (11,100,050) | (56,927,306) | ||
| Net Assets | ||||
| Beginning of period | 621,181,788 | 678,109,094 | ||
| End of period | $ | 610,081,738 | $ | 621,181,788 |
| Other Information | ||||
| Shares | ||||
| Sold | 551,376 | 1,129,005 | ||
| Issued in reinvestment of distributions | 1,951,488 | 2,420,166 | ||
| Redeemed | (3,569,212) | (6,985,170) | ||
| Net increase (decrease) | (1,066,348) | (3,435,999) | ||
Chemicals Portfolio |
Six months ended (Unaudited) August 31, 2024 | Years ended February 28, 2024 A | 2023 | 2022 | 2021 | 2020 A | |||||||
Selected Per-Share Data | ||||||||||||
| Net asset value, beginning of period | $ | 15.33 | $ | 15.43 | $ | 16.94 | $ | 14.67 | $ | 10.47 | $ | 13.57 |
| Income from Investment Operations | ||||||||||||
Net investment income (loss) B,C | .08 | .17 | .15 | .15 | .15 | .15 | ||||||
| Net realized and unrealized gain (loss) | .83 | .71 | .01 | 2.34 | 4.21 | (2.39) | ||||||
| Total from investment operations | .91 | .88 | .16 | 2.49 | 4.36 | (2.24) | ||||||
| Distributions from net investment income | (.01) | (.18) | (.16) | (.14) | (.16) | (.20) | ||||||
| Distributions from net realized gain | (.76) | (.80) | (1.51) | (.08) | - | (.66) | ||||||
| Total distributions | (.77) | (.98) | (1.67) | (.22) | (.16) | (.86) | ||||||
| Net asset value, end of period | $ | 15.47 | $ | 15.33 | $ | 15.43 | $ | 16.94 | $ | 14.67 | $ | 10.47 |
Total Return D,E | 6.19 % | 5.75% | 1.09% | 16.90% | 41.65% | (17.63)% | ||||||
Ratios to Average Net Assets C,F,G | ||||||||||||
| Expenses before reductions | .70% H | .75% | .75% | .74% | .79% | .78% | ||||||
| Expenses net of fee waivers, if any | .69 % H | .74% | .75% | .74% | .79% | .78% | ||||||
| Expenses net of all reductions | .69% H | .74% | .75% | .74% | .78% | .77% | ||||||
| Net investment income (loss) | 1.11% H | 1.12% | .96% | .85% | 1.28% | 1.21% | ||||||
| Supplemental Data | ||||||||||||
| Net assets, end of period (000 omitted) | $ | 610,082 | $ | 621,182 | $ | 678,109 | $ | 758,900 | $ | 700,680 | $ | 656,441 |
Portfolio turnover rate I | 2 % H | 19% | 54% | 15% | 50% | 77% |
| Fidelity Central Fund | Investment Manager | Investment Objective | Investment Practices | Expense RatioA |
| Fidelity Money Market Central Funds | Fidelity Management & Research Company LLC (FMR) | Each fund seeks to obtain a high level of current income consistent with the preservation of capital and liquidity. | Short-term Investments | Less than .005% |
| Chemicals Portfolio | $182,065 |
| Gross unrealized appreciation | $269,580,091 |
| Gross unrealized depreciation | (24,606,655) |
| Net unrealized appreciation (depreciation) | $244,973,436 |
| Tax cost | $395,369,094 |
| Purchases ($) | Sales ($) | |
| Chemicals Portfolio | 4,765,514 | 50,048,365 |
| Maximum Management Fee Rate % | |
| Chemicals Portfolio | .69 |
| Total Management Fee Rate % | |
| Chemicals Portfolio | .67 |
| Amount ($) | |
| Chemicals Portfolio | 395 |
| Purchases ($) | Sales ($) | Realized Gain (Loss)($) | |
| Chemicals Portfolio | 114,930 | 3,959,393 | 1,123,357 |
| Amount ($) | |
| Chemicals Portfolio | 549 |
| Total Security Lending Fees Paid to NFS ($) | Security Lending Income From Securities Loaned to NFS ($) | Value of Securities Loaned to NFS at Period End ($) | |
| Chemicals Portfolio | 1,447 | 1 | - |
| Common Stocks - 98.4% | |||
| Shares | Value ($) | ||
| Australia - 6.3% | |||
| Metals & Mining - 6.3% | |||
| Gold - 6.3% | |||
| Gold Road Resources Ltd. | 10,679,830 | 11,746,545 | |
| Northern Star Resources Ltd. | 5,560,700 | 57,434,975 | |
| OceanaGold Corp. | 9,705,800 | 25,279,084 | |
| 94,460,604 | |||
| Brazil - 10.3% | |||
| Metals & Mining - 10.3% | |||
| Gold - 10.3% | |||
| Wheaton Precious Metals Corp. | 2,491,182 | 153,964,715 | |
| Burkina Faso - 1.3% | |||
| Metals & Mining - 1.3% | |||
| Gold - 1.3% | |||
| IAMGOLD Corp. (a) | 3,948,600 | 19,513,728 | |
| Canada - 60.4% | |||
| Financial Services - 0.0% | |||
| Diversified Financial Services - 0.0% | |||
| Vizsla Royalties Corp. (b) | 116,813 | 143,020 | |
| Vizsla Royalties Corp. warrants (a)(c) | 1,168,133 | 433,396 | |
| 576,416 | |||
| Metals & Mining - 60.4% | |||
| Copper - 0.4% | |||
| Faraday Copper Corp. (a) | 9,251,880 | 5,080,244 | |
| Diversified Metals & Mining - 1.2% | |||
| Solaris Resources, Inc. (a)(b) | 766,031 | 1,818,943 | |
| Vizsla Silver Corp. (a) | 3,156,000 | 6,533,774 | |
| Western Copper & Gold Corp. (TSX) (a)(b) | 8,841,773 | 10,234,976 | |
| 18,587,693 | |||
| Gold - 57.0% | |||
| Agnico Eagle Mines Ltd. (Canada) (b) | 2,712,002 | 220,960,801 | |
| Alamos Gold, Inc. | 3,182,300 | 61,348,387 | |
| Artemis Gold, Inc. (a) | 2,669,928 | 24,249,559 | |
| Ascot Resources Ltd. (a)(b) | 18,933,000 | 7,305,428 | |
| Ascot Resources Ltd. (d) | 800,000 | 308,685 | |
| Ascot Resources Ltd. warrants (a) | 800,000 | 90,233 | |
| B2Gold Corp. | 7,148,900 | 20,104,872 | |
| Banyan Gold Corp. (a)(e) | 23,500,000 | 3,138,797 | |
| Barrick Gold Corp. (Canada) | 3,638,500 | 73,463,870 | |
| Bonterra Resources, Inc. (a) | 7,387,297 | 1,562,260 | |
| Calibre Mining Corp. (a) | 10,052,406 | 17,007,002 | |
| Dundee Precious Metals, Inc. | 1,403,500 | 13,674,140 | |
| Franco-Nevada Corp. | 1,141,378 | 139,372,362 | |
| Fury Gold Mines Ltd. (a)(e) | 800,000 | 314,622 | |
| Fury Gold Mines Ltd. (a)(e) | 10,000,000 | 3,932,772 | |
| G Mining Ventures Corp. | 296,700 | 1,886,780 | |
| i-80 Gold Corp. (a)(b) | 8,324,358 | 8,709,490 | |
| Kinross Gold Corp. | 2,729,600 | 24,670,002 | |
| Lundin Gold, Inc. | 1,682,700 | 33,800,088 | |
| Maple Gold Mines Ltd. (a) | 18,373,019 | 1,022,503 | |
| Marathon Gold Corp. warrants 9/20/24 (a)(c) | 5,000,000 | 87,882 | |
| Novagold Resources, Inc. (a)(b) | 3,142,400 | 13,314,365 | |
| Orla Mining Ltd. (a)(b) | 7,209,198 | 30,384,925 | |
| Osisko Development Corp. (a) | 3,505,547 | 7,361,480 | |
| Osisko Development Corp.: | |||
| rights(a) | 666,666 | 7,521 | |
| warrants 3/2/2026(a) | 1,144,505 | 41,815 | |
| Osisko Gold Royalties Ltd. | 2,316,600 | 40,018,141 | |
| Osisko Mining, Inc. (a) | 1,350,000 | 4,818,388 | |
| Rupert Resources Ltd. (a)(b) | 2,481,200 | 7,677,516 | |
| Seabridge Gold, Inc. (a) | 712,900 | 12,525,653 | |
| Skeena Resources Ltd. (a)(b) | 1,373,400 | 10,557,952 | |
| SSR Mining, Inc. | 2,024,500 | 10,507,150 | |
| Torex Gold Resources, Inc. (a) | 1,227,300 | 23,678,106 | |
| Triple Flag Precious Metals Corp. | 1,036,600 | 17,022,193 | |
| Victoria Gold Corp. (a)(c) | 2,329,800 | 829,818 | |
| Wesdome Gold Mines, Inc. (a) | 2,097,876 | 20,065,760 | |
| 855,821,318 | |||
| Precious Metals & Minerals - 1.1% | |||
| Dolly Varden Silver Corp. (a)(e) | 15,039,500 | 11,382,993 | |
| Guanajuato Silver Co. Ltd. (a)(e) | 31,097,000 | 5,191,871 | |
| Guanajuato Silver Co. Ltd. warrants 2/10/25 (a)(e) | 7,396,381 | 885 | |
| 16,575,749 | |||
| Silver - 0.7% | |||
| Aya Gold & Silver, Inc. (a)(b) | 737,434 | 8,191,583 | |
| GoGold Resources, Inc. (a) | 3,196,300 | 2,822,392 | |
| 11,013,975 | |||
TOTAL METALS & MINING | 907,078,979 | ||
| TOTAL CANADA | 907,655,395 | ||
| China - 1.5% | |||
| Metals & Mining - 1.5% | |||
| Gold - 1.5% | |||
| Zijin Mining Group Co. Ltd. (H Shares) | 11,094,000 | 22,507,256 | |
| Egypt - 0.3% | |||
| Metals & Mining - 0.3% | |||
| Gold - 0.3% | |||
| Centamin PLC | 2,988,500 | 4,886,372 | |
| South Africa - 1.9% | |||
| Metals & Mining - 1.9% | |||
| Gold - 1.9% | |||
| Gold Fields Ltd. | 2,007,700 | 27,831,309 | |
| United Kingdom - 2.3% | |||
| Metals & Mining - 2.3% | |||
| Gold - 2.3% | |||
| AngloGold Ashanti PLC (b) | 1,180,400 | 35,022,468 | |
| United States of America - 14.1% | |||
| Metals & Mining - 14.1% | |||
| Diversified Metals & Mining - 0.2% | |||
| Ivanhoe Electric, Inc. (a) | 441,100 | 3,114,166 | |
| Gold - 12.2% | |||
| Dakota Gold Corp. (a) | 2,599,100 | 6,029,912 | |
| Newmont Corp. | 3,228,148 | 172,350,822 | |
| Royal Gold, Inc. | 33,700 | 4,723,729 | |
| 183,104,463 | |||
| Silver - 1.7% | |||
| Gatos Silver, Inc. (a)(b) | 1,541,500 | 19,392,070 | |
| Hecla Mining Co. | 949,300 | 5,629,349 | |
| 25,021,419 | |||
TOTAL METALS & MINING | 211,240,048 | ||
| TOTAL COMMON STOCKS (Cost $859,402,952) | 1,477,081,895 | ||
| Commodities - 0.9% | |||
| Troy Ounces | Value ($) | ||
Gold Bullion (a) (Cost $4,575,085) | 5,582 | 13,970,295 | |
| Money Market Funds - 14.0% | |||
| Shares | Value ($) | ||
| Fidelity Cash Central Fund 5.39% (f) | 1,941,607 | 1,941,995 | |
| Fidelity Securities Lending Cash Central Fund 5.39% (f)(g) | 208,429,285 | 208,450,128 | |
| TOTAL MONEY MARKET FUNDS (Cost $210,392,123) | 210,392,123 | ||
| TOTAL INVESTMENT IN SECURITIES - 113.3% (Cost $1,074,370,160) | 1,701,444,313 |
NET OTHER ASSETS (LIABILITIES) - (13.3)% | (199,869,597) |
| NET ASSETS - 100.0% | 1,501,574,716 |
| (a) | Non-income producing |
| (b) | Security or a portion of the security is on loan at period end. |
| (c) | Level 3 security |
| (d) | Restricted securities (including private placements) - Investment in securities not registered under the Securities Act of 1933 (excluding 144A issues). At the end of the period, the value of restricted securities (excluding 144A issues) amounted to $308,685 or 0.0% of net assets. |
| (e) | Affiliated company |
| (f) | Affiliated fund that is generally available only to investment companies and other accounts managed by Fidelity Investments. The rate quoted is the annualized seven-day yield of the fund at period end. A complete unaudited listing of the fund's holdings as of its most recent quarter end is available upon request. In addition, each Fidelity Central Fund's financial statements are available on the SEC's website or upon request. |
| (g) | Investment made with cash collateral received from securities on loan. |
| Additional information on each restricted holding is as follows: | ||
| Security | Acquisition Date | Acquisition Cost ($) |
| Ascot Resources Ltd. | 7/12/24 | 200,689 |
| Affiliate | Value, beginning of period ($) | Purchases ($) | Sales Proceeds ($) | Dividend Income ($) | Realized Gain (loss) ($) | Change in Unrealized appreciation (depreciation) ($) | Value, end of period ($) | % ownership, end of period |
| Fidelity Cash Central Fund 5.39% | 3,342,881 | 83,312,706 | 84,713,688 | 144,054 | 96 | - | 1,941,995 | 0.0% |
| Fidelity Securities Lending Cash Central Fund 5.39% | 188,869,339 | 304,428,894 | 284,848,105 | 272,704 | - | - | 208,450,128 | 0.9% |
| Total | 192,212,220 | 387,741,600 | 369,561,793 | 416,758 | 96 | - | 210,392,123 | |
| Affiliate | Value, beginning of period ($) | Purchases ($) | Sales Proceeds ($) | Dividend Income ($) | Realized Gain (loss) ($) | Change in Unrealized appreciation (depreciation) ($) | Value, end of period ($) |
| Banyan Gold Corp. | 4,564,713 | 491,355 | - | - | - | (1,917,271) | 3,138,797 |
| Bonterra Resources, Inc. | 1,115,865 | - | - | - | - | 446,395 | - |
| Dolly Varden Silver Corp. | 8,517,850 | - | 1,572,624 | - | 997,191 | 3,440,576 | 11,382,993 |
| Faraday Copper Corp. | 3,476,741 | - | - | - | - | 1,603,503 | - |
| Fury Gold Mines Ltd. | 274,104 | - | - | - | - | 40,518 | 314,622 |
| Fury Gold Mines Ltd. | 3,426,298 | - | - | - | - | 506,474 | 3,932,772 |
| Guanajuato Silver Co. Ltd. | 3,895,288 | - | - | - | - | 1,296,583 | 5,191,871 |
| Guanajuato Silver Co. Ltd. warrants 2/10/25 | 2,739 | - | - | - | - | (1,854) | 885 |
| Maple Gold Mines Ltd. | 609,207 | - | - | - | - | 413,296 | - |
| Western Copper & Gold Corp. (TSX) | 11,970,022 | - | 673,606 | - | (205,471) | (855,969) | - |
| Total | 37,852,827 | 491,355 | 2,246,230 | - | 791,720 | 4,972,251 | 23,961,940 |
| Valuation Inputs at Reporting Date: | ||||
| Description | Total ($) | Level 1 ($) | Level 2 ($) | Level 3 ($) |
Investments in Securities: | ||||
| Common Stocks | 1,477,081,895 | 1,447,759,036 | 27,971,763 | 1,351,096 |
| Commodities | 13,970,295 | 13,970,295 | - | - |
| Money Market Funds | 210,392,123 | 210,392,123 | - | - |
| Total Investments in Securities: | 1,701,444,313 | 1,672,121,454 | 27,971,763 | 1,351,096 |
| Consolidated Statement of Assets and Liabilities | ||||
| As of August 31, 2024 (Unaudited) | ||||
| Assets | ||||
| Investment in securities, at value (including securities loaned of $197,023,115) - See accompanying schedule: | ||||
Unaffiliated issuers (cost $833,586,791) | $ | 1,453,119,955 | ||
Fidelity Central Funds (cost $210,392,123) | 210,392,123 | |||
Commodities (cost $4,575,085) | 13,970,295 | |||
Other affiliated issuers (cost $25,816,161) | 23,961,940 | |||
| Total Investment in Securities (cost $1,074,370,160) | $ | 1,701,444,313 | ||
| Cash | 19,429 | |||
| Foreign currency held at value (cost $117,268) | 117,247 | |||
| Receivable for investments sold | 2,240,472 | |||
| Receivable for fund shares sold | 9,263,622 | |||
| Dividends receivable | 2,141,616 | |||
| Distributions receivable from Fidelity Central Funds | 51,292 | |||
| Prepaid expenses | 2,802 | |||
| Other receivables | 168,742 | |||
Total assets | 1,715,449,535 | |||
| Liabilities | ||||
| Payable for investments purchased | $ | 2,859,247 | ||
| Payable for fund shares redeemed | 1,460,079 | |||
| Accrued management fee | 794,572 | |||
| Distribution and service plan fees payable | 44,413 | |||
| Other payables and accrued expenses | 265,674 | |||
| Collateral on securities loaned | 208,450,834 | |||
| Total liabilities | 213,874,819 | |||
| Net Assets | $ | 1,501,574,716 | ||
| Net Assets consist of: | ||||
| Paid in capital | $ | 2,456,623,954 | ||
| Total accumulated earnings (loss) | (955,049,238) | |||
| Net Assets | $ | 1,501,574,716 | ||
| Net Asset Value and Maximum Offering Price | ||||
| Class A : | ||||
Net Asset Value and redemption price per share ($91,568,563 ÷ 3,423,958 shares)(a) | $ | 26.74 | ||
| Maximum offering price per share (100/94.25 of $26.74) | $ | 28.37 | ||
| Class M : | ||||
Net Asset Value and redemption price per share ($25,151,122 ÷ 965,738 shares)(a) | $ | 26.04 | ||
| Maximum offering price per share (100/96.50 of $26.04) | $ | 26.98 | ||
| Class C : | ||||
Net Asset Value and offering price per share ($19,229,501 ÷ 788,840 shares)(a) | $ | 24.38 | ||
| Gold : | ||||
Net Asset Value, offering price and redemption price per share ($1,206,055,620 ÷ 43,555,509 shares) | $ | 27.69 | ||
| Class I : | ||||
Net Asset Value, offering price and redemption price per share ($104,010,354 ÷ 3,755,321 shares) | $ | 27.70 | ||
| Class Z : | ||||
Net Asset Value, offering price and redemption price per share ($55,559,556 ÷ 2,002,317 shares) | $ | 27.75 | ||
(a)Redemption price per share is equal to net asset value less any applicable contingent deferred sales charge. | ||||
| Consolidated Statement of Operations | ||||
Six months ended August 31, 2024 (Unaudited) | ||||
| Investment Income | ||||
| Dividends | $ | 10,649,329 | ||
| Interest | 457 | |||
| Income from Fidelity Central Funds (including $272,704 from security lending) | 416,758 | |||
| Income before foreign taxes withheld | $ | 11,066,544 | ||
| Less foreign taxes withheld | (1,217,037) | |||
| Total income | 9,849,507 | |||
| Expenses | ||||
| Management fee | $ | 4,447,196 | ||
| Distribution and service plan fees | 252,455 | |||
| Custodian fees and expenses | 33,638 | |||
| Independent trustees' fees and expenses | 2,660 | |||
| Registration fees | 62,842 | |||
| Audit fees | 37,044 | |||
| Legal | 2,600 | |||
| Miscellaneous | 31,714 | |||
| Total expenses before reductions | 4,870,149 | |||
| Expense reductions | (22,559) | |||
| Total expenses after reductions | 4,847,590 | |||
| Net Investment income (loss) | 5,001,917 | |||
| Realized and Unrealized Gain (Loss) | ||||
| Net realized gain (loss) on: | ||||
| Investments: | ||||
| Unaffiliated issuers | 13,713,780 | |||
| Fidelity Central Funds | 96 | |||
| Other affiliated issuers | 791,720 | |||
| Foreign currency transactions | (20,126) | |||
| Total net realized gain (loss) | 14,485,470 | |||
| Change in net unrealized appreciation (depreciation) on: | ||||
| Investments: | ||||
| Unaffiliated issuers | 443,665,805 | |||
| Affiliated issuers | 4,972,251 | |||
| Assets and liabilities in foreign currencies | 15 | |||
| Commodities | 2,561,468 | |||
| Total change in net unrealized appreciation (depreciation) | 451,199,539 | |||
| Net gain (loss) | 465,685,009 | |||
| Net increase (decrease) in net assets resulting from operations | $ | 470,686,926 | ||
| Consolidated Statement of Changes in Net Assets | ||||
Six months ended August 31, 2024 (Unaudited) | Year ended February 29, 2024 | |||
| Increase (Decrease) in Net Assets | ||||
| Operations | ||||
| Net investment income (loss) | $ | 5,001,917 | $ | 8,711,752 |
| Net realized gain (loss) | 14,485,470 | (25,554,377) | ||
| Change in net unrealized appreciation (depreciation) | 451,199,539 | (140,637,513) | ||
| Net increase (decrease) in net assets resulting from operations | 470,686,926 | (157,480,138) | ||
| Distributions to shareholders | (2,352,100) | (13,979,739) | ||
| Share transactions - net increase (decrease) | (25,036,662) | (327,044,874) | ||
| Total increase (decrease) in net assets | 443,298,164 | (498,504,751) | ||
| Net Assets | ||||
| Beginning of period | 1,058,276,552 | 1,556,781,303 | ||
| End of period | $ | 1,501,574,716 | $ | 1,058,276,552 |
Fidelity Advisor® Gold Fund Class A |
Six months ended (Unaudited) August 31, 2024 | Years ended February 28, 2024 A | 2023 | 2022 | 2021 | 2020 A | |||||||
Selected Per-Share Data | ||||||||||||
| Net asset value, beginning of period | $ | 18.49 | $ | 21.12 | $ | 26.27 | $ | 24.15 | $ | 21.67 | $ | 18.52 |
| Income from Investment Operations | ||||||||||||
Net investment income (loss) B,C | .06 | .07 | .15 | .27 D | (.04) | (.01) E | ||||||
| Net realized and unrealized gain (loss) | 8.23 | (2.60) | (5.23) | 2.20 | 3.74 | 3.20 | ||||||
| Total from investment operations | 8.29 | (2.53) | (5.08) | 2.47 | 3.70 | 3.19 | ||||||
| Distributions from net investment income | (.04) | (.10) | (.07) | (.35) | (1.22) | (.01) | ||||||
| Distributions from net realized gain | - | - | - | - | - | (.03) | ||||||
| Total distributions | (.04) | (.10) | (.07) | (.35) | (1.22) | (.04) | ||||||
| Net asset value, end of period | $ | 26.74 | $ | 18.49 | $ | 21.12 | $ | 26.27 | $ | 24.15 | $ | 21.67 |
Total Return F,G,H | 44.84 % | (12.09)% | (19.42)% | 10.37% | 16.59% | 17.23% | ||||||
Ratios to Average Net Assets C,I,J | ||||||||||||
| Expenses before reductions | .98% K | 1.07% | 1.09% | 1.07% | 1.08% | 1.13% | ||||||
| Expenses net of fee waivers, if any | .97 % K | 1.06% | 1.08% | 1.07% | 1.08% | 1.13% | ||||||
| Expenses net of all reductions | .97% K | 1.06% | 1.08% | 1.07% | 1.07% | 1.12% | ||||||
| Net investment income (loss) | .49% K | .34% | .67% | 1.02% D | (.12)% | (.05)% E | ||||||
| Supplemental Data | ||||||||||||
| Net assets, end of period (000 omitted) | $ | 91,569 | $ | 66,421 | $ | 73,943 | $ | 86,977 | $ | 82,989 | $ | 64,971 |
Portfolio turnover rate L | 13 % K | 46% | 46% | 38% | 46% | 56% |
Fidelity Advisor® Gold Fund Class M |
Six months ended (Unaudited) August 31, 2024 | Years ended February 28, 2024 A | 2023 | 2022 | 2021 | 2020 A | |||||||
Selected Per-Share Data | ||||||||||||
| Net asset value, beginning of period | $ | 18.03 | $ | 20.55 | $ | 25.63 | $ | 23.57 | $ | 21.16 | $ | 18.11 |
| Income from Investment Operations | ||||||||||||
Net investment income (loss) B,C | .03 | .02 | .09 | .19 D | (.12) | (.07) E | ||||||
| Net realized and unrealized gain (loss) | 8.01 | (2.54) | (5.11) | 2.16 | 3.67 | 3.12 | ||||||
| Total from investment operations | 8.04 | (2.52) | (5.02) | 2.35 | 3.55 | 3.05 | ||||||
| Distributions from net investment income | (.03) | - F | (.06) | (.29) | (1.14) | - | ||||||
| Total distributions | (.03) | - F | (.06) | (.29) | (1.14) | - | ||||||
| Net asset value, end of period | $ | 26.04 | $ | 18.03 | $ | 20.55 | $ | 25.63 | $ | 23.57 | $ | 21.16 |
Total Return G,H,I | 44.60 % | (12.25)% | (19.66)% | 10.08% | 16.28% | 16.84% | ||||||
Ratios to Average Net Assets C,J,K | ||||||||||||
| Expenses before reductions | 1.22% L | 1.33% | 1.35% | 1.36% | 1.37% | 1.42% | ||||||
| Expenses net of fee waivers, if any | 1.22 % L | 1.32% | 1.35% | 1.35% | 1.37% | 1.42% | ||||||
| Expenses net of all reductions | 1.22% L | 1.31% | 1.35% | 1.35% | 1.36% | 1.41% | ||||||
| Net investment income (loss) | .25% L | .09% | .40% | .74% D | (.42)% | (.34)% E | ||||||
| Supplemental Data | ||||||||||||
| Net assets, end of period (000 omitted) | $ | 25,151 | $ | 17,185 | $ | 21,586 | $ | 26,201 | $ | 24,535 | $ | 19,620 |
Portfolio turnover rate M | 13 % L | 46% | 46% | 38% | 46% | 56% |
Fidelity Advisor® Gold Fund Class C |
Six months ended (Unaudited) August 31, 2024 | Years ended February 28, 2024 A | 2023 | 2022 | 2021 | 2020 A | |||||||
Selected Per-Share Data | ||||||||||||
| Net asset value, beginning of period | $ | 16.90 | $ | 19.36 | $ | 24.24 | $ | 22.30 | $ | 20.07 | $ | 17.24 |
| Income from Investment Operations | ||||||||||||
Net investment income (loss) B,C | (.03) | (.07) | (.01) | .08 D | (.22) | (.14) E | ||||||
| Net realized and unrealized gain (loss) | 7.52 | (2.39) | (4.82) | 2.05 | 3.49 | 2.97 | ||||||
| Total from investment operations | 7.49 | (2.46) | (4.83) | 2.13 | 3.27 | 2.83 | ||||||
| Distributions from net investment income | (.01) | - | (.05) | (.19) | (1.04) | - | ||||||
| Total distributions | (.01) | - | (.05) | (.19) | (1.04) | - | ||||||
| Net asset value, end of period | $ | 24.38 | $ | 16.90 | $ | 19.36 | $ | 24.24 | $ | 22.30 | $ | 20.07 |
Total Return F,G,H | 44.32 % | (12.71)% | (20.00)% | 9.62% | 15.81% | 16.42% | ||||||
Ratios to Average Net Assets C,I,J | ||||||||||||
| Expenses before reductions | 1.73% K | 1.79% | 1.79% | 1.77% | 1.78% | 1.80% | ||||||
| Expenses net of fee waivers, if any | 1.72 % K | 1.78% | 1.78% | 1.77% | 1.78% | 1.80% | ||||||
| Expenses net of all reductions | 1.72% K | 1.78% | 1.78% | 1.77% | 1.77% | 1.79% | ||||||
| Net investment income (loss) | (.26)% K | (.38)% | (.03)% | .32% D | (.83)% | (.72)% E | ||||||
| Supplemental Data | ||||||||||||
| Net assets, end of period (000 omitted) | $ | 19,230 | $ | 17,177 | $ | 27,978 | $ | 43,031 | $ | 51,195 | $ | 52,375 |
Portfolio turnover rate L | 13 % K | 46% | 46% | 38% | 46% | 56% |
Gold Portfolio |
Six months ended (Unaudited) August 31, 2024 | Years ended February 28, 2024 A | 2023 | 2022 | 2021 | 2020 A | |||||||
Selected Per-Share Data | ||||||||||||
| Net asset value, beginning of period | $ | 19.13 | $ | 21.88 | $ | 27.14 | $ | 24.93 | $ | 22.33 | $ | 19.07 |
| Income from Investment Operations | ||||||||||||
Net investment income (loss) B,C | .10 | .14 | .23 | .36 D | .06 | .06 E | ||||||
| Net realized and unrealized gain (loss) | 8.50 | (2.67) | (5.41) | 2.27 | 3.84 | 3.30 | ||||||
| Total from investment operations | 8.60 | (2.53) | (5.18) | 2.63 | 3.90 | 3.36 | ||||||
| Distributions from net investment income | (.04) | (.22) | (.08) | (.42) | (1.30) | (.06) | ||||||
| Distributions from net realized gain | - | - | - | - | - | (.03) | ||||||
| Total distributions | (.04) | (.22) | (.08) | (.42) | (1.30) | (.10) F | ||||||
| Net asset value, end of period | $ | 27.69 | $ | 19.13 | $ | 21.88 | $ | 27.14 | $ | 24.93 | $ | 22.33 |
Total Return G,H | 45.01 % | (11.78)% | (19.17)% | 10.71% | 16.96% | 17.60% | ||||||
Ratios to Average Net Assets C,I,J | ||||||||||||
| Expenses before reductions | .68% K | .77% | .78% | .76% | .76% | .79% | ||||||
| Expenses net of fee waivers, if any | .68 % K | .76% | .78% | .76% | .76% | .79% | ||||||
| Expenses net of all reductions | .68% K | .76% | .77% | .76% | .75% | .78% | ||||||
| Net investment income (loss) | .79% K | .64% | .97% | 1.33% D | .19% | .29% E | ||||||
| Supplemental Data | ||||||||||||
| Net assets, end of period (000 omitted) | $ | 1,206,056 | $ | 858,204 | $ | 1,229,416 | $ | 1,330,602 | $ | 1,319,440 | $ | 1,292,204 |
Portfolio turnover rate L | 13 % K | 46% | 46% | 38% | 46% | 56% |
Fidelity Advisor® Gold Fund Class I |
Six months ended (Unaudited) August 31, 2024 | Years ended February 28, 2024 A | 2023 | 2022 | 2021 | 2020 A | |||||||
Selected Per-Share Data | ||||||||||||
| Net asset value, beginning of period | $ | 19.14 | $ | 21.88 | $ | 27.15 | $ | 24.93 | $ | 22.33 | $ | 19.07 |
| Income from Investment Operations | ||||||||||||
Net investment income (loss) B,C | .09 | .14 | .23 | .36 D | .05 | .06 E | ||||||
| Net realized and unrealized gain (loss) | 8.52 | (2.67) | (5.42) | 2.27 | 3.85 | 3.30 | ||||||
| Total from investment operations | 8.61 | (2.53) | (5.19) | 2.63 | 3.90 | 3.36 | ||||||
| Distributions from net investment income | (.05) | (.21) | (.08) | (.41) | (1.30) | (.07) | ||||||
| Distributions from net realized gain | - | - | - | - | - | (.03) | ||||||
| Total distributions | (.05) | (.21) | (.08) | (.41) | (1.30) | (.10) | ||||||
| Net asset value, end of period | $ | 27.70 | $ | 19.14 | $ | 21.88 | $ | 27.15 | $ | 24.93 | $ | 22.33 |
Total Return F,G | 45.00 % | (11.75)% | (19.20)% | 10.74% | 16.96% | 17.60% | ||||||
Ratios to Average Net Assets C,H,I | ||||||||||||
| Expenses before reductions | .73% J | .76% | .77% | .76% | .77% | .79% | ||||||
| Expenses net of fee waivers, if any | .72 % J | .76% | .77% | .76% | .77% | .79% | ||||||
| Expenses net of all reductions | .72% J | .76% | .77% | .76% | .76% | .77% | ||||||
| Net investment income (loss) | .74% J | .64% | .98% | 1.33% D | .18% | .30% E | ||||||
| Supplemental Data | ||||||||||||
| Net assets, end of period (000 omitted) | $ | 104,010 | $ | 77,125 | $ | 110,224 | $ | 152,799 | $ | 137,617 | $ | 115,699 |
Portfolio turnover rate K | 13 % J | 46% | 46% | 38% | 46% | 56% |
Fidelity Advisor® Gold Fund Class Z |
Six months ended (Unaudited) August 31, 2024 | Years ended February 28, 2024 A | 2023 | 2022 | 2021 | 2020 A | |||||||
Selected Per-Share Data | ||||||||||||
| Net asset value, beginning of period | $ | 19.16 | $ | 21.92 | $ | 27.16 | $ | 24.94 | $ | 22.34 | $ | 19.08 |
| Income from Investment Operations | ||||||||||||
Net investment income (loss) B,C | .11 | .18 | .26 | .40 D | .09 | .10 E | ||||||
| Net realized and unrealized gain (loss) | 8.53 | (2.68) | (5.41) | 2.27 | 3.85 | 3.29 | ||||||
| Total from investment operations | 8.64 | (2.50) | (5.15) | 2.67 | 3.94 | 3.39 | ||||||
| Distributions from net investment income | (.05) | (.26) | (.09) | (.45) | (1.34) | (.10) | ||||||
| Distributions from net realized gain | - | - | - | - | - | (.03) | ||||||
| Total distributions | (.05) | (.26) | (.09) | (.45) | (1.34) | (.13) | ||||||
| Net asset value, end of period | $ | 27.75 | $ | 19.16 | $ | 21.92 | $ | 27.16 | $ | 24.94 | $ | 22.34 |
Total Return F,G | 45.13 % | (11.67)% | (19.07)% | 10.88% | 17.12% | 17.75% | ||||||
Ratios to Average Net Assets B,H,I | ||||||||||||
| Expenses before reductions | .60% J | .63% | .63% | .63% | .64% | .65% | ||||||
| Expenses net of fee waivers, if any | .60 % J | .62% | .63% | .62% | .64% | .64% | ||||||
| Expenses net of all reductions | .60% J | .62% | .63% | .62% | .62% | .63% | ||||||
| Net investment income (loss) | .87% J | .78% | 1.12% | 1.47% D | .32% | .44% E | ||||||
| Supplemental Data | ||||||||||||
| Net assets, end of period (000 omitted) | $ | 55,560 | $ | 22,164 | $ | 93,634 | $ | 109,842 | $ | 105,293 | $ | 95,076 |
Portfolio turnover rate K | 13 % J | 46% | 46% | 38% | 46% | 56% |
| Subsidiary Name | Net Assets of Subsidiary | % of Fund's Net Assets | |
| Gold Portfolio | Fidelity Select Gold Cayman Ltd. | 13,988,892 | .9 |
| Fidelity Central Fund | Investment Manager | Investment Objective | Investment Practices | Expense RatioA |
| Fidelity Money Market Central Funds | Fidelity Management & Research Company LLC (FMR) | Each fund seeks to obtain a high level of current income consistent with the preservation of capital and liquidity. | Short-term Investments | Less than .005% |
| Gold Portfolio | $168,741 |
| Gross unrealized appreciation | $687,009,791 |
| Gross unrealized depreciation | (105,217,004) |
| Net unrealized appreciation (depreciation) | $581,792,787 |
| Tax cost | $1,119,651,526 |
Short-term | $(336,479,589) |
Long-term | (1,181,238,221) |
| Total capital loss carryforward | $(1,517,717,810) |
| Purchases ($) | Sales ($) | |
| Gold Portfolio | 83,645,595 | 111,468,718 |
| Maximum Management Fee Rate % | |
| Class A | .74 |
| Class M | .74 |
| Class C | .74 |
| Gold | .72 |
| Class I | .71 |
| Class Z | .58 |
| Total Management Fee Rate % | |
| Class A | .70 |
| Class M | .70 |
| Class C | .70 |
| Gold | .66 |
| Class I | .70 |
| Class Z | .58 |
| Distribution Fee | Service Fee | Total Fees ($) | Retained by FDC ($) | |
| Class A | - % | .25% | 103,167 | 1,190 |
| Class M | .25% | .25% | 54,934 | - |
| Class C | .75% | .25% | 94,354 | 5,332 |
| 252,455 | 6,522 |
| Retained by FDC ($) | |
| Class A | 10,040 |
| Class M | 1,611 |
Class CA | 88 |
11,739 |
| Amount ($) | |
| Gold Portfolio | 1,427 |
| Purchases ($) | Sales ($) | Realized Gain (Loss)($) | |
| Gold Portfolio | 2,411,774 | 1,739,065 | 560,837 |
| Amount ($) | |
| Gold Portfolio | 1,080 |
| Total Security Lending Fees Paid to NFS ($) | Security Lending Income From Securities Loaned to NFS ($) | Value of Securities Loaned to NFS at Period End ($) | |
| Gold Portfolio | 28,252 | 7 | 26,703 |
Six months ended August 31, 2024 | Year ended February 29, 2024 | |
| Gold Portfolio | ||
| Distributions to shareholders | ||
| Class A | $126,072 | $350,874 |
| Class M | 24,885 | 2,042 |
| Class C | 8,313 | - |
| Gold | 1,956,082 | 11,696,291 |
| Class I | 178,840 | 1,092,039 |
| Class Z | 57,908 | 838,493 |
Total | $2,352,100 | $13,979,739 |
| Shares | Shares | Dollars | Dollars | |
Six months ended August 31, 2024 | Year ended February 29, 2024 | Six months ended August 31, 2024 | Year ended February 29, 2024 | |
| Gold Portfolio | ||||
| Class A | ||||
| Shares sold | 363,410 | 975,413 | $8,677,314 | $21,270,418 |
| Reinvestment of distributions | 5,412 | 14,774 | 124,701 | 345,409 |
| Shares redeemed | (536,300) | (900,260) | (12,588,400) | (19,061,868) |
| Net increase (decrease) | (167,478) | 89,927 | $(3,786,385) | $2,553,959 |
| Class M | ||||
| Shares sold | 123,115 | 186,583 | $2,827,634 | $3,870,128 |
| Reinvestment of distributions | 1,108 | 99 | 24,864 | 2,034 |
| Shares redeemed | (111,817) | (283,784) | (2,526,292) | (5,830,363) |
| Net increase (decrease) | 12,406 | (97,102) | $326,206 | $(1,958,201) |
| Class C | ||||
| Shares sold | 50,220 | 121,024 | $1,054,434 | $2,515,286 |
| Reinvestment of distributions | 393 | - | 8,281 | - |
| Shares redeemed | (278,036) | (550,115) | (5,816,868) | (10,787,787) |
| Net increase (decrease) | (227,423) | (429,091) | $(4,754,153) | $(8,272,501) |
| Gold | ||||
| Shares sold | 7,812,932 | 13,886,737 | $191,174,733 | $315,217,274 |
| Reinvestment of distributions | 77,769 | 452,013 | 1,853,238 | 11,091,354 |
| Shares redeemed | (9,205,653) | (25,659,509) | (224,463,603) | (564,940,285) |
| Net increase (decrease) | (1,314,952) | (11,320,759) | $(31,435,632) | $(238,631,657) |
| Class I | ||||
| Shares sold | 439,564 | 1,671,333 | $10,626,270 | $39,208,906 |
| Reinvestment of distributions | 7,326 | 42,594 | 174,589 | 1,051,737 |
| Shares redeemed | (721,962) | (2,720,371) | (17,561,133) | (58,902,034) |
| Net increase (decrease) | (275,072) | (1,006,444) | $(6,760,274) | $(18,641,391) |
| Class Z | ||||
| Shares sold | 1,180,909 | 1,871,519 | $29,609,874 | $43,357,574 |
| Reinvestment of distributions | 2,314 | 31,765 | 55,225 | 823,981 |
| Shares redeemed | (337,595) | (5,017,920) | (8,291,523) | (106,276,638) |
| Net increase (decrease) | 845,628 | (3,114,636) | $21,373,576 | $(62,095,083) |
| Common Stocks - 99.2% | |||
| Shares | Value ($) | ||
| Chemicals - 61.5% | |||
| Commodity Chemicals - 11.0% | |||
| Cabot Corp. (a) | 90,000 | 9,459,900 | |
| Dow, Inc. | 1,090,400 | 58,423,632 | |
| Tronox Holdings PLC | 1,312,503 | 18,283,167 | |
| Westlake Corp. | 50,400 | 7,330,176 | |
| 93,496,875 | |||
| Diversified Chemicals - 3.3% | |||
| The Chemours Co. LLC | 1,421,900 | 27,641,736 | |
| Fertilizers & Agricultural Chemicals - 3.9% | |||
| Corteva, Inc. | 584,411 | 33,486,750 | |
| Industrial Gases - 24.5% | |||
| Air Products & Chemicals, Inc. | 165,800 | 46,233,330 | |
| Linde PLC | 338,086 | 161,689,629 | |
| 207,922,959 | |||
| Specialty Chemicals - 18.8% | |||
| Axalta Coating Systems Ltd. (b) | 849,700 | 31,014,050 | |
| Balchem Corp. | 115,300 | 20,411,559 | |
| Ecolab, Inc. | 342,700 | 86,764,786 | |
| Element Solutions, Inc. | 724,100 | 19,362,434 | |
| Perimeter Solutions SA (b) | 195,100 | 2,284,621 | |
| 159,837,450 | |||
TOTAL CHEMICALS | 522,385,770 | ||
| Construction Materials - 4.4% | |||
| Construction Materials - 4.4% | |||
| CRH PLC | 77,600 | 7,043,752 | |
| Martin Marietta Materials, Inc. | 28,900 | 15,437,224 | |
| Vulcan Materials Co. | 61,500 | 15,080,415 | |
| 37,561,391 | |||
| Containers & Packaging - 7.9% | |||
| Metal, Glass & Plastic Containers - 5.1% | |||
| Aptargroup, Inc. | 132,100 | 20,236,399 | |
| Crown Holdings, Inc. | 142,459 | 12,879,718 | |
| Greif, Inc. Class A | 155,600 | 9,728,112 | |
| 42,844,229 | |||
| Paper & Plastic Packaging Products & Materials - 2.8% | |||
| Avery Dennison Corp. | 77,800 | 17,259,930 | |
| International Paper Co. | 140,200 | 6,788,484 | |
| 24,048,414 | |||
TOTAL CONTAINERS & PACKAGING | 66,892,643 | ||
| Metals & Mining - 25.4% | |||
| Aluminum - 0.3% | |||
| Alcoa Corp. | 85,900 | 2,757,390 | |
| Copper - 7.8% | |||
| Capstone Copper Corp. (b) | 485,000 | 3,480,095 | |
| First Quantum Minerals Ltd. | 1,650,300 | 20,781,057 | |
| Freeport-McMoRan, Inc. | 953,600 | 42,225,408 | |
| 66,486,560 | |||
| Diversified Metals & Mining - 3.3% | |||
| Altius Minerals Corp. (a) | 171,100 | 3,085,170 | |
| Ivanhoe Mines Ltd. (a)(b) | 1,411,800 | 18,825,397 | |
| Teck Resources Ltd. Class B | 129,500 | 6,203,050 | |
| 28,113,617 | |||
| Gold - 4.0% | |||
| Agnico Eagle Mines Ltd. (Canada) | 102,500 | 8,351,204 | |
| Alamos Gold, Inc. | 105,100 | 2,026,118 | |
| Franco-Nevada Corp. | 75,600 | 9,231,430 | |
| Wheaton Precious Metals Corp. | 235,300 | 14,542,453 | |
| 34,151,205 | |||
| Silver - 1.0% | |||
| Hecla Mining Co. | 1,420,700 | 8,424,751 | |
| Steel - 9.0% | |||
| ATI, Inc. (b) | 303,600 | 19,393,968 | |
| Commercial Metals Co. | 148,300 | 7,947,397 | |
| Nucor Corp. | 217,600 | 33,055,616 | |
| Steel Dynamics, Inc. | 130,200 | 15,560,202 | |
| 75,957,183 | |||
TOTAL METALS & MINING | 215,890,706 | ||
| TOTAL COMMON STOCKS (Cost $611,310,576) | 842,730,510 | ||
| Money Market Funds - 3.5% | |||
| Shares | Value ($) | ||
| Fidelity Cash Central Fund 5.39% (c) | 7,656,407 | 7,657,938 | |
| Fidelity Securities Lending Cash Central Fund 5.39% (c)(d) | 22,069,693 | 22,071,900 | |
| TOTAL MONEY MARKET FUNDS (Cost $29,729,838) | 29,729,838 | ||
| TOTAL INVESTMENT IN SECURITIES - 102.7% (Cost $641,040,414) | 872,460,348 |
NET OTHER ASSETS (LIABILITIES) - (2.7)% | (22,624,736) |
| NET ASSETS - 100.0% | 849,835,612 |
| (a) | Security or a portion of the security is on loan at period end. |
| (b) | Non-income producing |
| (c) | Affiliated fund that is generally available only to investment companies and other accounts managed by Fidelity Investments. The rate quoted is the annualized seven-day yield of the fund at period end. A complete unaudited listing of the fund's holdings as of its most recent quarter end is available upon request. In addition, each Fidelity Central Fund's financial statements are available on the SEC's website or upon request. |
| (d) | Investment made with cash collateral received from securities on loan. |
| Affiliate | Value, beginning of period ($) | Purchases ($) | Sales Proceeds ($) | Dividend Income ($) | Realized Gain (loss) ($) | Change in Unrealized appreciation (depreciation) ($) | Value, end of period ($) | % ownership, end of period |
| Fidelity Cash Central Fund 5.39% | 2,497,375 | 87,463,047 | 82,302,602 | 91,560 | 118 | - | 7,657,938 | 0.0% |
| Fidelity Securities Lending Cash Central Fund 5.39% | 36,952,370 | 62,065,047 | 76,945,517 | 15,539 | - | - | 22,071,900 | 0.1% |
| Total | 39,449,745 | 149,528,094 | 159,248,119 | 107,099 | 118 | - | 29,729,838 | |
| Valuation Inputs at Reporting Date: | ||||
| Description | Total ($) | Level 1 ($) | Level 2 ($) | Level 3 ($) |
Investments in Securities: | ||||
| Common Stocks | 842,730,510 | 842,730,510 | - | - |
| Money Market Funds | 29,729,838 | 29,729,838 | - | - |
| Total Investments in Securities: | 872,460,348 | 872,460,348 | - | - |
| Statement of Assets and Liabilities | ||||
| As of August 31, 2024 (Unaudited) | ||||
| Assets | ||||
| Investment in securities, at value (including securities loaned of $21,149,766) - See accompanying schedule: | ||||
Unaffiliated issuers (cost $611,310,576) | $ | 842,730,510 | ||
Fidelity Central Funds (cost $29,729,838) | 29,729,838 | |||
| Total Investment in Securities (cost $641,040,414) | $ | 872,460,348 | ||
| Foreign currency held at value (cost $19,094) | 19,108 | |||
| Receivable for investments sold | 334,761 | |||
| Receivable for fund shares sold | 163,446 | |||
| Dividends receivable | 1,846,386 | |||
| Distributions receivable from Fidelity Central Funds | 24,092 | |||
| Prepaid expenses | 2,455 | |||
| Other receivables | 221,712 | |||
Total assets | 875,072,308 | |||
| Liabilities | ||||
| Payable for investments purchased | $ | 1,698,425 | ||
| Payable for fund shares redeemed | 687,757 | |||
| Accrued management fee | 464,930 | |||
| Distribution and service plan fees payable | 44,798 | |||
| Other payables and accrued expenses | 268,886 | |||
| Collateral on securities loaned | 22,071,900 | |||
| Total liabilities | 25,236,696 | |||
| Net Assets | $ | 849,835,612 | ||
| Net Assets consist of: | ||||
| Paid in capital | $ | 565,700,541 | ||
| Total accumulated earnings (loss) | 284,135,071 | |||
| Net Assets | $ | 849,835,612 | ||
| Net Asset Value and Maximum Offering Price | ||||
| Class A : | ||||
Net Asset Value and redemption price per share ($106,825,339 ÷ 1,083,933 shares)(a) | $ | 98.55 | ||
| Maximum offering price per share (100/94.25 of $98.55) | $ | 104.56 | ||
| Class M : | ||||
Net Asset Value and redemption price per share ($32,533,025 ÷ 334,922 shares)(a) | $ | 97.14 | ||
| Maximum offering price per share (100/96.50 of $97.14) | $ | 100.66 | ||
| Class C : | ||||
Net Asset Value and offering price per share ($12,347,543 ÷ 131,717 shares)(a) | $ | 93.74 | ||
| Materials : | ||||
Net Asset Value, offering price and redemption price per share ($504,528,662 ÷ 5,078,115 shares) | $ | 99.35 | ||
| Class I : | ||||
Net Asset Value, offering price and redemption price per share ($138,677,593 ÷ 1,399,063 shares) | $ | 99.12 | ||
| Class Z : | ||||
Net Asset Value, offering price and redemption price per share ($54,923,450 ÷ 554,673 shares) | $ | 99.02 | ||
(a)Redemption price per share is equal to net asset value less any applicable contingent deferred sales charge. | ||||
| Statement of Operations | ||||
Six months ended August 31, 2024 (Unaudited) | ||||
| Investment Income | ||||
| Dividends | $ | 7,769,927 | ||
| Income from Fidelity Central Funds (including $15,539 from security lending) | 107,099 | |||
| Total income | 7,877,026 | |||
| Expenses | ||||
| Management fee | $ | 2,977,114 | ||
| Distribution and service plan fees | 286,050 | |||
| Custodian fees and expenses | 11,159 | |||
| Independent trustees' fees and expenses | 1,868 | |||
| Registration fees | 47,451 | |||
| Audit fees | 34,046 | |||
| Legal | 218 | |||
| Interest | 7,693 | |||
| Miscellaneous | 19,728 | |||
| Total expenses before reductions | 3,385,327 | |||
| Expense reductions | (17,701) | |||
| Total expenses after reductions | 3,367,626 | |||
| Net Investment income (loss) | 4,509,400 | |||
| Realized and Unrealized Gain (Loss) | ||||
| Net realized gain (loss) on: | ||||
| Investment Securities: | ||||
| Unaffiliated issuers | 49,232,383 | |||
| Fidelity Central Funds | 118 | |||
| Foreign currency transactions | (1,099) | |||
| Total net realized gain (loss) | 49,231,402 | |||
| Change in net unrealized appreciation (depreciation) on: | ||||
| Investment Securities: | ||||
| Unaffiliated issuers | (16,628,367) | |||
| Assets and liabilities in foreign currencies | 6,321 | |||
| Total change in net unrealized appreciation (depreciation) | (16,622,046) | |||
| Net gain (loss) | 32,609,356 | |||
| Net increase (decrease) in net assets resulting from operations | $ | 37,118,756 | ||
| Statement of Changes in Net Assets | ||||
Six months ended August 31, 2024 (Unaudited) | Year ended February 29, 2024 | |||
| Increase (Decrease) in Net Assets | ||||
| Operations | ||||
| Net investment income (loss) | $ | 4,509,400 | $ | 12,276,339 |
| Net realized gain (loss) | 49,231,402 | 42,035,066 | ||
| Change in net unrealized appreciation (depreciation) | (16,622,046) | (35,678,203) | ||
| Net increase (decrease) in net assets resulting from operations | 37,118,756 | 18,633,202 | ||
| Distributions to shareholders | (28,824,681) | (53,638,131) | ||
| Share transactions - net increase (decrease) | (28,049,495) | (192,704,225) | ||
| Total increase (decrease) in net assets | (19,755,420) | (227,709,154) | ||
| Net Assets | ||||
| Beginning of period | 869,591,032 | 1,097,300,186 | ||
| End of period | $ | 849,835,612 | $ | 869,591,032 |
Fidelity Advisor® Materials Fund Class A |
Six months ended (Unaudited) August 31, 2024 | Years ended February 28, 2024 A | 2023 | 2022 | 2021 | 2020 A | |||||||
Selected Per-Share Data | ||||||||||||
| Net asset value, beginning of period | $ | 97.67 | $ | 99.98 | $ | 102.68 | $ | 87.03 | $ | 59.39 | $ | 69.57 |
| Income from Investment Operations | ||||||||||||
Net investment income (loss) B,C | .40 | 1.01 | .79 | .46 | .33 | .58 | ||||||
| Net realized and unrealized gain (loss) | 3.73 | 1.70 | (.54) | 15.77 | 27.72 | (10.10) | ||||||
| Total from investment operations | 4.13 | 2.71 | .25 | 16.23 | 28.05 | (9.52) | ||||||
| Distributions from net investment income | (.07) | (1.06) | (.80) | (.58) | (.41) | (.66) | ||||||
| Distributions from net realized gain | (3.19) | (3.96) | (2.15) | - | - | - | ||||||
| Total distributions | (3.25) D | (5.02) | (2.95) | (.58) | (.41) | (.66) | ||||||
| Net asset value, end of period | $ | 98.55 | $ | 97.67 | $ | 99.98 | $ | 102.68 | $ | 87.03 | $ | 59.39 |
Total Return E,F,G | 4.21 % | 2.88% | .39% | 18.64% | 47.27% | (13.81)% | ||||||
Ratios to Average Net Assets C,H,I | ||||||||||||
| Expenses before reductions | 1.00% J | 1.03% | 1.03% | 1.03% | 1.08% | 1.08% | ||||||
| Expenses net of fee waivers, if any | .99 % J | 1.02% | 1.03% | 1.03% | 1.08% | 1.08% | ||||||
| Expenses net of all reductions | .99% J | 1.02% | 1.03% | 1.03% | 1.08% | 1.07% | ||||||
| Net investment income (loss) | .80% J | 1.07% | .81% | .46% | .48% | .87% | ||||||
| Supplemental Data | ||||||||||||
| Net assets, end of period (000 omitted) | $ | 106,825 | $ | 109,696 | $ | 124,777 | $ | 138,219 | $ | 101,238 | $ | 76,869 |
Portfolio turnover rate K | 59 % J | 51% L | 47% | 43% | 36% | 69% |
Fidelity Advisor® Materials Fund Class M |
Six months ended (Unaudited) August 31, 2024 | Years ended February 28, 2024 A | 2023 | 2022 | 2021 | 2020 A | |||||||
Selected Per-Share Data | ||||||||||||
| Net asset value, beginning of period | $ | 96.39 | $ | 98.77 | $ | 101.52 | $ | 86.14 | $ | 58.84 | $ | 68.98 |
| Income from Investment Operations | ||||||||||||
Net investment income (loss) B,C | .27 | .77 | .54 | .20 | .14 | .39 | ||||||
| Net realized and unrealized gain (loss) | 3.69 | 1.67 | (.53) | 15.59 | 27.42 | (10.01) | ||||||
| Total from investment operations | 3.96 | 2.44 | .01 | 15.79 | 27.56 | (9.62) | ||||||
| Distributions from net investment income | (.02) | (.86) | (.61) | (.41) | (.26) | (.52) | ||||||
| Distributions from net realized gain | (3.19) | (3.96) | (2.15) | - | - | - | ||||||
| Total distributions | (3.21) | (4.82) | (2.76) | (.41) | (.26) | (.52) | ||||||
| Net asset value, end of period | $ | 97.14 | $ | 96.39 | $ | 98.77 | $ | 101.52 | $ | 86.14 | $ | 58.84 |
Total Return D,E,F | 4.09 % | 2.63% | .15% | 18.32% | 46.86% | (14.05)% | ||||||
Ratios to Average Net Assets C,G,H | ||||||||||||
| Expenses before reductions | 1.25% I | 1.27% | 1.28% | 1.29% | 1.36% | 1.37% | ||||||
| Expenses net of fee waivers, if any | 1.24 % I | 1.27% | 1.28% | 1.29% | 1.36% | 1.36% | ||||||
| Expenses net of all reductions | 1.24% I | 1.27% | 1.28% | 1.29% | 1.36% | 1.36% | ||||||
| Net investment income (loss) | .55% I | .82% | .56% | .20% | .21% | .58% | ||||||
| Supplemental Data | ||||||||||||
| Net assets, end of period (000 omitted) | $ | 32,533 | $ | 33,182 | $ | 38,570 | $ | 37,100 | $ | 24,768 | $ | 19,423 |
Portfolio turnover rate J | 59 % I | 51% K | 47% | 43% | 36% | 69% |
Fidelity Advisor® Materials Fund Class C |
Six months ended (Unaudited) August 31, 2024 | Years ended February 28, 2024 A | 2023 | 2022 | 2021 | 2020 A | |||||||
Selected Per-Share Data | ||||||||||||
| Net asset value, beginning of period | $ | 93.33 | $ | 95.85 | $ | 98.63 | $ | 83.76 | $ | 57.30 | $ | 67.13 |
| Income from Investment Operations | ||||||||||||
Net investment income (loss) B,C | .03 | .29 | .06 | (.28) | (.18) | .08 | ||||||
| Net realized and unrealized gain (loss) | 3.57 | 1.60 | (.53) | 15.15 | 26.64 | (9.76) | ||||||
| Total from investment operations | 3.60 | 1.89 | (.47) | 14.87 | 26.46 | (9.68) | ||||||
| Distributions from net investment income | - | (.45) | (.16) | - | - | (.15) | ||||||
| Distributions from net realized gain | (3.19) | (3.96) | (2.15) | - | - | - | ||||||
| Total distributions | (3.19) | (4.41) | (2.31) | - | - | (.15) | ||||||
| Net asset value, end of period | $ | 93.74 | $ | 93.33 | $ | 95.85 | $ | 98.63 | $ | 83.76 | $ | 57.30 |
Total Return D,E,F | 3.83 % | 2.11% | (.36)% | 17.75% | 46.18% | (14.46)% | ||||||
Ratios to Average Net Assets C,G,H | ||||||||||||
| Expenses before reductions | 1.75% I | 1.78% | 1.78% | 1.78% | 1.83% | 1.82% | ||||||
| Expenses net of fee waivers, if any | 1.74 % I | 1.77% | 1.78% | 1.78% | 1.83% | 1.82% | ||||||
| Expenses net of all reductions | 1.74% I | 1.77% | 1.78% | 1.78% | 1.83% | 1.81% | ||||||
| Net investment income (loss) | .05% I | .32% | .06% | (.29)% | (.27)% | .12% | ||||||
| Supplemental Data | ||||||||||||
| Net assets, end of period (000 omitted) | $ | 12,348 | $ | 13,269 | $ | 17,053 | $ | 21,261 | $ | 23,296 | $ | 24,239 |
Portfolio turnover rate J | 59 % I | 51% K | 47% | 43% | 36% | 69% |
Materials Portfolio |
Six months ended (Unaudited) August 31, 2024 | Years ended February 28, 2024 A | 2023 | 2022 | 2021 | 2020 A | |||||||
Selected Per-Share Data | ||||||||||||
| Net asset value, beginning of period | $ | 98.34 | $ | 100.63 | $ | 103.29 | $ | 87.46 | $ | 59.63 | $ | 69.84 |
| Income from Investment Operations | ||||||||||||
Net investment income (loss) B,C | .55 | 1.28 | 1.07 | .75 | .53 | .77 | ||||||
| Net realized and unrealized gain (loss) | 3.76 | 1.72 | (.55) | 15.86 | 27.87 | (10.14) | ||||||
| Total from investment operations | 4.31 | 3.00 | .52 | 16.61 | 28.40 | (9.37) | ||||||
| Distributions from net investment income | (.11) | (1.33) | (1.03) | (.78) | (.57) | (.84) | ||||||
| Distributions from net realized gain | (3.19) | (3.96) | (2.15) | - | - | - | ||||||
| Total distributions | (3.30) | (5.29) | (3.18) | (.78) | (.57) | (.84) | ||||||
| Net asset value, end of period | $ | 99.35 | $ | 98.34 | $ | 100.63 | $ | 103.29 | $ | 87.46 | $ | 59.63 |
Total Return D,E | 4.37 % | 3.17% | .67% | 18.98% | 47.68% | (13.57)% | ||||||
Ratios to Average Net Assets C,F,G | ||||||||||||
| Expenses before reductions | .70% H | .76% | .76% | .75% | .80% | .80% | ||||||
| Expenses net of fee waivers, if any | .70 % H | .75% | .75% | .74% | .80% | .80% | ||||||
| Expenses net of all reductions | .70% H | .75% | .75% | .74% | .80% | .79% | ||||||
| Net investment income (loss) | 1.10% H | 1.34% | 1.09% | .75% | .76% | 1.14% | ||||||
| Supplemental Data | ||||||||||||
| Net assets, end of period (000 omitted) | $ | 504,529 | $ | 516,428 | $ | 603,330 | $ | 645,773 | $ | 533,073 | $ | 405,668 |
Portfolio turnover rate I | 59 % H | 51% J | 47% | 43% | 36% | 69% |
Fidelity Advisor® Materials Fund Class I |
Six months ended (Unaudited) August 31, 2024 | Years ended February 28, 2024 A | 2023 | 2022 | 2021 | 2020 A | |||||||
Selected Per-Share Data | ||||||||||||
| Net asset value, beginning of period | $ | 98.13 | $ | 100.42 | $ | 103.07 | $ | 87.29 | $ | 59.52 | $ | 69.70 |
| Income from Investment Operations | ||||||||||||
Net investment income (loss) B,C | .53 | 1.28 | 1.06 | .74 | .55 | .78 | ||||||
| Net realized and unrealized gain (loss) | 3.75 | 1.71 | (.54) | 15.83 | 27.80 | (10.12) | ||||||
| Total from investment operations | 4.28 | 2.99 | .52 | 16.57 | 28.35 | (9.34) | ||||||
| Distributions from net investment income | (.11) | (1.32) | (1.02) | (.79) | (.58) | (.84) | ||||||
| Distributions from net realized gain | (3.19) | (3.96) | (2.15) | - | - | - | ||||||
| Total distributions | (3.29) D | (5.28) | (3.17) | (.79) | (.58) | (.84) | ||||||
| Net asset value, end of period | $ | 99.12 | $ | 98.13 | $ | 100.42 | $ | 103.07 | $ | 87.29 | $ | 59.52 |
Total Return E,F | 4.35 % | 3.16% | .66% | 18.97% | 47.70% | (13.55)% | ||||||
Ratios to Average Net Assets C,G,H | ||||||||||||
| Expenses before reductions | .73% I | .75% | .76% | .75% | .78% | .79% | ||||||
| Expenses net of fee waivers, if any | .72 % I | .75% | .76% | .75% | .78% | .79% | ||||||
| Expenses net of all reductions | .72% I | .75% | .76% | .75% | .78% | .78% | ||||||
| Net investment income (loss) | 1.07% I | 1.34% | 1.08% | .74% | .78% | 1.16% | ||||||
| Supplemental Data | ||||||||||||
| Net assets, end of period (000 omitted) | $ | 138,678 | $ | 144,811 | $ | 208,630 | $ | 238,282 | $ | 190,132 | $ | 137,887 |
Portfolio turnover rate J | 59 % I | 51% K | 47% | 43% | 36% | 69% |
Fidelity Advisor® Materials Fund Class Z |
Six months ended (Unaudited) August 31, 2024 | Years ended February 28, 2024 A | 2023 | 2022 | 2021 | 2020 A | |||||||
Selected Per-Share Data | ||||||||||||
| Net asset value, beginning of period | $ | 97.99 | $ | 100.27 | $ | 102.92 | $ | 87.14 | $ | 59.40 | $ | 69.58 |
| Income from Investment Operations | ||||||||||||
Net investment income (loss) B,C | .60 | 1.41 | 1.20 | .88 | .67 | .88 | ||||||
| Net realized and unrealized gain (loss) | 3.75 | 1.72 | (.54) | 15.81 | 27.75 | (10.10) | ||||||
| Total from investment operations | 4.35 | 3.13 | .66 | 16.69 | 28.42 | (9.22) | ||||||
| Distributions from net investment income | (.13) | (1.45) | (1.16) | (.91) | (.68) | (.96) | ||||||
| Distributions from net realized gain | (3.19) | (3.96) | (2.15) | - | - | - | ||||||
| Total distributions | (3.32) | (5.41) | (3.31) | (.91) | (.68) | (.96) | ||||||
| Net asset value, end of period | $ | 99.02 | $ | 97.99 | $ | 100.27 | $ | 102.92 | $ | 87.14 | $ | 59.40 |
Total Return D,E | 4.43 % | 3.32% | .81% | 19.14% | 47.92% | (13.43)% | ||||||
Ratios to Average Net Assets C,F,G | ||||||||||||
| Expenses before reductions | .59% H | .61% | .62% | .62% | .64% | .63% | ||||||
| Expenses net of fee waivers, if any | .58 % H | .61% | .61% | .62% | .64% | .63% | ||||||
| Expenses net of all reductions | .58% H | .61% | .61% | .62% | .63% | .62% | ||||||
| Net investment income (loss) | 1.21% H | 1.48% | 1.23% | .88% | .93% | 1.31% | ||||||
| Supplemental Data | ||||||||||||
| Net assets, end of period (000 omitted) | $ | 54,923 | $ | 52,204 | $ | 104,940 | $ | 73,790 | $ | 47,051 | $ | 13,267 |
Portfolio turnover rate I | 59 % H | 51% J | 47% | 43% | 36% | 69% |
| Fidelity Central Fund | Investment Manager | Investment Objective | Investment Practices | Expense RatioA |
| Fidelity Money Market Central Funds | Fidelity Management & Research Company LLC (FMR) | Each fund seeks to obtain a high level of current income consistent with the preservation of capital and liquidity. | Short-term Investments | Less than .005% |
| Materials Portfolio | $221,712 |
| Gross unrealized appreciation | $249,155,997 |
| Gross unrealized depreciation | (18,973,843) |
| Net unrealized appreciation (depreciation) | $230,182,154 |
| Tax cost | $642,278,194 |
| Purchases ($) | Sales ($) | |
| Materials Portfolio | 258,070,531 | 314,875,742 |
| Shares | Total net realized gain or loss ($) | Total Proceeds ($) | |
| Materials Portfolio | 266,164 | 9,995,666 | 23,661,972 |
| Maximum Management Fee Rate % | |
| Class A | .72 |
| Class M | .72 |
| Class C | .72 |
| Materials | .70 |
| Class I | .70 |
| Class Z | .56 |
| Total Management Fee Rate % | |
| Class A | .72 |
| Class M | .72 |
| Class C | .72 |
| Materials | .67 |
| Class I | .70 |
| Class Z | .56 |
| Distribution Fee | Service Fee | Total Fees ($) | Retained by FDC ($) | |
| Class A | - % | .25% | 137,235 | - |
| Class M | .25% | .25% | 83,534 | - |
| Class C | .75% | .25% | 65,281 | 6,206 |
| 286,050 | 6,206 |
| Retained by FDC ($) | |
| Class A | 8,422 |
| Class M | 262 |
Class CA | 15 |
8,699 |
| Amount ($) | |
| Materials Portfolio | 6,855 |
| Borrower or Lender | Average Loan Balance ($) | Weighted Average Interest Rate | Interest Expense ($) | |
| Materials Portfolio | Borrower | 8,286,833 | 5.57% | 7,693 |
| Purchases ($) | Sales ($) | Realized Gain (Loss)($) | |
| Materials Portfolio | 5,240,956 | 16,041,510 | 3,281,092 |
| Amount ($) | |
| Materials Portfolio | 779 |
| Total Security Lending Fees Paid to NFS ($) | Security Lending Income From Securities Loaned to NFS ($) | Value of Securities Loaned to NFS at Period End ($) | |
| Materials Portfolio | 1,651 | - | - |
Six months ended August 31, 2024 | Year ended February 29, 2024 | |
| Materials Portfolio | ||
| Distributions to shareholders | ||
| Class A | $3,579,319 | $6,113,236 |
| Class M | 1,079,870 | 1,841,666 |
| Class C | 444,048 | 748,040 |
| Materials | 17,186,132 | 30,248,242 |
| Class I | 4,774,582 | 9,849,219 |
| Class Z | 1,760,730 | 4,837,728 |
Total | $28,824,681 | $53,638,131 |
| Shares | Shares | Dollars | Dollars | |
Six months ended August 31, 2024 | Year ended February 29, 2024 | Six months ended August 31, 2024 | Year ended February 29, 2024 | |
| Materials Portfolio | ||||
| Class A | ||||
| Shares sold | 48,627 | 109,222 | $4,823,469 | $10,391,547 |
| Reinvestment of distributions | 35,286 | 62,625 | 3,493,996 | 5,968,808 |
| Shares redeemed | (123,131) | (296,695) | (12,216,318) | (28,079,632) |
| Net increase (decrease) | (39,218) | (124,848) | $(3,898,853) | $(11,719,277) |
| Class M | ||||
| Shares sold | 14,910 | 42,686 | $1,471,373 | $3,968,671 |
| Reinvestment of distributions | 10,994 | 19,481 | 1,074,021 | 1,832,253 |
| Shares redeemed | (35,240) | (108,417) | (3,468,938) | (10,095,432) |
| Net increase (decrease) | (9,336) | (46,250) | $(923,544) | $(4,294,508) |
| Class C | ||||
| Shares sold | 7,481 | 23,244 | $713,695 | $2,141,150 |
| Reinvestment of distributions | 4,567 | 7,991 | 431,381 | 727,510 |
| Shares redeemed | (22,499) | (66,984) | (2,117,786) | (6,019,699) |
| Net increase (decrease) | (10,451) | (35,749) | $(972,710) | $(3,151,039) |
| Materials | ||||
| Shares sold | 196,307 | 742,033 | $19,911,838 | $69,648,451 |
| Reinvestment of distributions | 158,184 | 289,938 | 15,774,078 | 27,823,736 |
| Shares redeemed | (527,948) | (1,775,766) | (52,535,013) | (167,547,083) |
| Net increase (decrease) | (173,457) | (743,795) | $(16,849,097) | $(70,074,896) |
| Class I | ||||
| Shares sold | 103,677 | 271,740 | $10,345,269 | $26,082,202 |
| Reinvestment of distributions | 45,523 | 98,208 | 4,529,070 | 9,401,322 |
| Shares redeemed | (225,884) | (971,845) | (22,442,157) | (92,337,262) |
| Net increase (decrease) | (76,684) | (601,897) | $(7,567,818) | $(56,853,738) |
| Class Z | ||||
| Shares sold | 52,713 | 234,755 | $5,227,290 | $22,426,173 |
| Reinvestment of distributions | 15,989 | 47,702 | 1,588,325 | 4,557,247 |
| Shares redeemed | (46,805) | (796,220) | (4,653,088) | (73,594,187) |
| Net increase (decrease) | 21,897 | (513,763) | $2,162,527 | $(46,610,767) |
| A special meeting of shareholders was held on July 16, 2024. The results of votes taken among shareholders on the proposal before them are reported below. Each vote reported represents one dollar of net asset value held on the record date for the meeting. | ||
| Proposal 1 | ||
| To elect a Board of Trustees. | ||
# of Votes | % of Votes | |
| Bettina Doulton | ||
| Affirmative | 50,178,154,296.75 | 92.38 |
| Withheld | 4,136,551,415.53 | 7.62 |
| TOTAL | 54,314,705,712.27 | 100.00 |
| Robert A. Lawrence | ||
| Affirmative | 50,131,321,830.27 | 92.30 |
| Withheld | 4,183,383,882.00 | 7.70 |
| TOTAL | 54,314,705,712.27 | 100.00 |
| Vijay C. Advani | ||
| Affirmative | 50,021,870,319.77 | 92.10 |
| Withheld | 4,292,835,392.50 | 7.90 |
| TOTAL | 54,314,705,712.27 | 100.00 |
| Thomas P. Bostick | ||
| Affirmative | 50,057,248,681.17 | 92.16 |
| Withheld | 4,257,457,031.10 | 7.84 |
| TOTAL | 54,314,705,712.27 | 100.00 |
| Donald F. Donahue | ||
| Affirmative | 49,998,023,290.27 | 92.05 |
| Withheld | 4,316,682,422.00 | 7.95 |
| TOTAL | 54,314,705,712.27 | 100.00 |
| Vicki L. Fuller | ||
| Affirmative | 50,146,578,363.15 | 92.33 |
| Withheld | 4,168,127,349.12 | 7.67 |
| TOTAL | 54,314,705,712.27 | 100.00 |
| Patricia L. Kampling | ||
| Affirmative | 50,227,895,949.71 | 92.48 |
| Withheld | 4,086,809,762.56 | 7.52 |
| TOTAL | 54,314,705,712.27 | 100.00 |
| Thomas A. Kennedy | ||
| Affirmative | 50,080,160,698.34 | 92.20 |
| Withheld | 4,234,545,013.93 | 7.80 |
| TOTAL | 54,314,705,712.27 | 100.00 |
| Oscar Munoz | ||
| Affirmative | 49,879,616,445.58 | 91.83 |
| Withheld | 4,435,089,266.69 | 8.17 |
| TOTAL | 54,314,705,712.27 | 100.00 |
| Karen B. Peetz | ||
| Affirmative | 50,078,105,799.58 | 92.20 |
| Withheld | 4,236,599,912.69 | 7.80 |
| TOTAL | 54,314,705,712.27 | 100.00 |
| David M. Thomas | ||
| Affirmative | 50,013,939,190.36 | 92.08 |
| Withheld | 4,300,766,521.91 | 7.92 |
| TOTAL | 54,314,705,712.27 | 100.00 |
| Susan Tomasky | ||
| Affirmative | 50,109,134,188.50 | 92.26 |
| Withheld | 4,205,571,523.77 | 7.74 |
| TOTAL | 54,314,705,712.27 | 100.00 |
| Michael E. Wiley | ||
| Affirmative | 50,016,526,096.47 | 92.09 |
| Withheld | 4,298,179,615.80 | 7.91 |
| TOTAL | 54,314,705,712.27 | 100.00 |
| Proposal 1 reflects trust-wide proposal and voting results. | ||
 |


Contents
| Common Stocks - 100.1% | |||
| Shares | Value ($) | ||
| Banks - 97.6% | |||
| Diversified Banks - 34.5% | |||
| Bank of America Corp. | 729,376 | 29,722,072 | |
| Citigroup, Inc. | 390,900 | 24,485,976 | |
| KeyCorp | 1,034,300 | 17,645,158 | |
| PNC Financial Services Group, Inc. | 124,900 | 23,117,741 | |
| U.S. Bancorp | 499,700 | 23,600,831 | |
| Wells Fargo & Co. | 563,592 | 32,953,223 | |
| 151,525,001 | |||
| Regional Banks - 63.1% | |||
| 1st Source Corp. | 86,781 | 5,332,259 | |
| Associated Banc-Corp. | 525,700 | 12,028,016 | |
| Banner Corp. | 110,800 | 6,600,356 | |
| BOK Financial Corp. | 139,000 | 14,588,050 | |
| Cadence Bank (a) | 325,239 | 10,498,715 | |
| Citizens Financial Group, Inc. | 309,200 | 13,311,060 | |
| Community Trust Bancorp, Inc. | 96,376 | 4,866,988 | |
| East West Bancorp, Inc. | 161,200 | 13,552,084 | |
| Eastern Bankshares, Inc. | 851,500 | 14,449,955 | |
| First Hawaiian, Inc. | 373,000 | 9,075,090 | |
| First Interstate Bancsystem, Inc. Class A | 456,634 | 14,178,486 | |
| Heartland Financial U.S.A., Inc. | 277,600 | 15,478,976 | |
| Huntington Bancshares, Inc. | 1,001,100 | 14,986,467 | |
| Independent Bank Group, Inc. | 175,600 | 10,223,432 | |
| M&T Bank Corp. | 158,260 | 27,238,129 | |
| Old National Bancorp, Indiana (a) | 623,554 | 12,377,547 | |
| Popular, Inc. | 219,300 | 22,478,250 | |
| Sierra Bancorp | 156,900 | 4,727,397 | |
| Southern Missouri Bancorp, Inc. | 30,800 | 1,781,164 | |
| Trico Bancshares | 179,087 | 8,141,295 | |
| UMB Financial Corp. | 117,470 | 12,168,717 | |
| Univest Corp. of Pennsylvania | 261,100 | 7,430,906 | |
| WesBanco, Inc. (a) | 320,500 | 10,323,305 | |
| Wintrust Financial Corp. | 105,800 | 11,511,040 | |
| 277,347,684 | |||
TOTAL BANKS | 428,872,685 | ||
| Capital Markets - 2.5% | |||
| Asset Management & Custody Banks - 2.5% | |||
| Northern Trust Corp. | 59,500 | 5,426,995 | |
| Phoenix Vega Mezz PLC | 330,200 | 31,573 | |
| State Street Corp. | 61,300 | 5,339,230 | |
| 10,797,798 | |||
| Consumer Finance - 0.0% | |||
| Consumer Finance - 0.0% | |||
| OneMain Holdings, Inc. | 200 | 9,882 | |
| Financial Services - 0.0% | |||
| Diversified Financial Services - 0.0% | |||
| Sunrisemezz Ltd. | 47,171 | 16,790 | |
| TOTAL COMMON STOCKS (Cost $314,350,106) | 439,697,155 | ||
| Money Market Funds - 1.6% | |||
| Shares | Value ($) | ||
| Fidelity Cash Central Fund 5.39% (b) | 932,755 | 932,942 | |
| Fidelity Securities Lending Cash Central Fund 5.39% (b)(c) | 6,267,698 | 6,268,325 | |
| TOTAL MONEY MARKET FUNDS (Cost $7,201,267) | 7,201,267 | ||
| TOTAL INVESTMENT IN SECURITIES - 101.7% (Cost $321,551,373) | 446,898,422 |
NET OTHER ASSETS (LIABILITIES) - (1.7)% | (7,651,318) |
| NET ASSETS - 100.0% | 439,247,104 |
| (a) | Security or a portion of the security is on loan at period end. |
| (b) | Affiliated fund that is generally available only to investment companies and other accounts managed by Fidelity Investments. The rate quoted is the annualized seven-day yield of the fund at period end. A complete unaudited listing of the fund's holdings as of its most recent quarter end is available upon request. In addition, each Fidelity Central Fund's financial statements are available on the SEC's website or upon request. |
| (c) | Investment made with cash collateral received from securities on loan. |
| Affiliate | Value, beginning of period ($) | Purchases ($) | Sales Proceeds ($) | Dividend Income ($) | Realized Gain (loss) ($) | Change in Unrealized appreciation (depreciation) ($) | Value, end of period ($) | % ownership, end of period |
| Fidelity Cash Central Fund 5.39% | 198,310 | 47,028,603 | 46,293,999 | 20,042 | 28 | - | 932,942 | 0.0% |
| Fidelity Securities Lending Cash Central Fund 5.39% | 1,115,400 | 93,205,556 | 88,052,631 | 1,959 | - | - | 6,268,325 | 0.0% |
| Total | 1,313,710 | 140,234,159 | 134,346,630 | 22,001 | 28 | - | 7,201,267 | |
| Valuation Inputs at Reporting Date: | ||||
| Description | Total ($) | Level 1 ($) | Level 2 ($) | Level 3 ($) |
Investments in Securities: | ||||
| Common Stocks | 439,697,155 | 439,697,155 | - | - |
| Money Market Funds | 7,201,267 | 7,201,267 | - | - |
| Total Investments in Securities: | 446,898,422 | 446,898,422 | - | - |
| Statement of Assets and Liabilities | ||||
| As of August 31, 2024 (Unaudited) | ||||
| Assets | ||||
| Investment in securities, at value (including securities loaned of $6,144,255) - See accompanying schedule: | ||||
Unaffiliated issuers (cost $314,350,106) | $ | 439,697,155 | ||
Fidelity Central Funds (cost $7,201,267) | 7,201,267 | |||
| Total Investment in Securities (cost $321,551,373) | $ | 446,898,422 | ||
| Receivable for investments sold | 8,984 | |||
| Receivable for fund shares sold | 352,027 | |||
| Dividends receivable | 458,419 | |||
| Distributions receivable from Fidelity Central Funds | 3,709 | |||
| Prepaid expenses | 1,097 | |||
Total assets | 447,722,658 | |||
| Liabilities | ||||
| Payable for investments purchased | $ | 1,254,403 | ||
| Payable for fund shares redeemed | 690,939 | |||
| Accrued management fee | 231,737 | |||
| Other payables and accrued expenses | 30,150 | |||
| Collateral on securities loaned | 6,268,325 | |||
| Total liabilities | 8,475,554 | |||
| Net Assets | $ | 439,247,104 | ||
| Net Assets consist of: | ||||
| Paid in capital | $ | 304,254,375 | ||
| Total accumulated earnings (loss) | 134,992,729 | |||
| Net Assets | $ | 439,247,104 | ||
Net Asset Value, offering price and redemption price per share ($439,247,104 ÷ 14,602,009 shares) | $ | 30.08 | ||
| Statement of Operations | ||||
Six months ended August 31, 2024 (Unaudited) | ||||
| Investment Income | ||||
| Dividends | $ | 6,370,339 | ||
| Income from Fidelity Central Funds (including $1,959 from security lending) | 22,001 | |||
| Total income | 6,392,340 | |||
| Expenses | ||||
| Management fee | $ | 1,320,932 | ||
| Custodian fees and expenses | 16,234 | |||
| Independent trustees' fees and expenses | 827 | |||
| Registration fees | 29,076 | |||
| Audit fees | 20,484 | |||
| Legal | 95 | |||
| Interest | 6,425 | |||
| Miscellaneous | 7,868 | |||
| Total expenses before reductions | 1,401,941 | |||
| Expense reductions | (8,068) | |||
| Total expenses after reductions | 1,393,873 | |||
| Net Investment income (loss) | 4,998,467 | |||
| Realized and Unrealized Gain (Loss) | ||||
| Net realized gain (loss) on: | ||||
| Investment Securities: | ||||
| Unaffiliated issuers | 7,500,476 | |||
| Fidelity Central Funds | 28 | |||
| Total net realized gain (loss) | 7,500,504 | |||
| Change in net unrealized appreciation (depreciation) on investment securities | 65,872,247 | |||
| Net gain (loss) | 73,372,751 | |||
| Net increase (decrease) in net assets resulting from operations | $ | 78,371,218 | ||
| Statement of Changes in Net Assets | ||||
Six months ended August 31, 2024 (Unaudited) | Year ended February 29, 2024 | |||
| Increase (Decrease) in Net Assets | ||||
| Operations | ||||
| Net investment income (loss) | $ | 4,998,467 | $ | 12,594,461 |
| Net realized gain (loss) | 7,500,504 | 107,308 | ||
| Change in net unrealized appreciation (depreciation) | 65,872,247 | (15,377,171) | ||
| Net increase (decrease) in net assets resulting from operations | 78,371,218 | (2,675,402) | ||
| Distributions to shareholders | (2,336,283) | (22,547,625) | ||
| Share transactions | ||||
| Proceeds from sales of shares | 81,222,235 | 158,041,706 | ||
| Reinvestment of distributions | 2,127,231 | 20,768,717 | ||
| Cost of shares redeemed | (106,562,397) | (197,046,335) | ||
Net increase (decrease) in net assets resulting from share transactions | (23,212,931) | (18,235,912) | ||
| Total increase (decrease) in net assets | 52,822,004 | (43,458,939) | ||
| Net Assets | ||||
| Beginning of period | 386,425,100 | 429,884,039 | ||
| End of period | $ | 439,247,104 | $ | 386,425,100 |
| Other Information | ||||
| Shares | ||||
| Sold | 2,926,178 | 7,256,556 | ||
| Issued in reinvestment of distributions | 85,949 | 935,405 | ||
| Redeemed | (3,979,257) | (9,006,111) | ||
| Net increase (decrease) | (967,130) | (814,150) | ||
Banking Portfolio |
Six months ended (Unaudited) August 31, 2024 | Years ended February 28, 2024 A | 2023 | 2022 | 2021 | 2020 A | |||||||
Selected Per-Share Data | ||||||||||||
| Net asset value, beginning of period | $ | 24.82 | $ | 26.24 | $ | 31.37 | $ | 26.31 | $ | 23.37 | $ | 26.42 |
| Income from Investment Operations | ||||||||||||
Net investment income (loss) B,C | .34 | .75 | .61 | .58 | .54 | .58 | ||||||
| Net realized and unrealized gain (loss) | 5.08 | (.83) D | (4.24) | 5.48 | 4.32 | (1.96) | ||||||
| Total from investment operations | 5.42 | (.08) | (3.63) | 6.06 | 4.86 | (1.38) | ||||||
| Distributions from net investment income | (.14) | (.74) | (.67) | (.54) | (.55) | (.53) | ||||||
| Distributions from net realized gain | (.02) | (.60) | (.83) | (.46) | (1.37) | (1.14) | ||||||
| Total distributions | (.16) | (1.34) | (1.50) | (1.00) | (1.92) | (1.67) | ||||||
| Net asset value, end of period | $ | 30.08 | $ | 24.82 | $ | 26.24 | $ | 31.37 | $ | 26.31 | $ | 23.37 |
Total Return E,F | 21.97 % | .38% D | (11.27)% | 23.37% | 25.90% | (6.05)% | ||||||
Ratios to Average Net Assets C,G,H | ||||||||||||
| Expenses before reductions | .71% I | .77% | .75% | .73% | .79% | .77% | ||||||
| Expenses net of fee waivers, if any | .71 % I | .76% | .74% | .73% | .79% | .77% | ||||||
| Expenses net of all reductions | .71% I | .76% | .74% | .73% | .79% | .77% | ||||||
| Net investment income (loss) | 2.54% I | 3.46% | 2.29% | 1.93% | 2.84% | 2.21% | ||||||
| Supplemental Data | ||||||||||||
| Net assets, end of period (000 omitted) | $ | 439,247 | $ | 386,425 | $ | 429,884 | $ | 716,834 | $ | 537,860 | $ | 361,696 |
Portfolio turnover rate J | 29 % I | 48% | 21% | 34% | 32% | 31% |
| Common Stocks - 99.7% | |||
| Shares | Value ($) | ||
| Capital Markets - 95.8% | |||
| Asset Management & Custody Banks - 39.2% | |||
| Ameriprise Financial, Inc. | 90,600 | 40,719,264 | |
| Ares Management Corp. Class A, (a) | 321,500 | 47,067,600 | |
| BlackRock, Inc. | 46,500 | 41,934,165 | |
| Blackstone, Inc. | 335,800 | 47,804,488 | |
| Blue Owl Capital, Inc. Class A (a) | 2,599,300 | 45,851,652 | |
| Bridge Investment Group Holdings, Inc. | 3,700 | 30,377 | |
| Brookfield Asset Management Ltd. Class A (a) | 116,500 | 4,748,540 | |
| Carlyle Group LP | 543,200 | 21,798,616 | |
| CVC Capital Partners PLC (b) | 313,200 | 6,626,484 | |
| EQT AB | 29,400 | 981,508 | |
| Intermediate Capital Group PLC | 365,800 | 10,213,413 | |
| KKR & Co., Inc. Class A | 465,500 | 57,614,935 | |
| P10, Inc. Class A | 94,200 | 946,710 | |
| Patria Investments Ltd. (a) | 486,172 | 5,600,701 | |
| StepStone Group, Inc. Class A (a) | 174,200 | 9,528,740 | |
| TPG, Inc. Class A | 361,600 | 18,242,720 | |
| 359,709,913 | |||
| Financial Exchanges & Data - 36.2% | |||
| Cboe Global Markets, Inc. | 89,938 | 18,473,265 | |
| CME Group, Inc. | 152,200 | 32,835,628 | |
| Coinbase Global, Inc. Class A (c) | 136,900 | 25,101,984 | |
| Intercontinental Exchange, Inc. | 288,200 | 46,558,710 | |
| MarketAxess Holdings, Inc. | 53,600 | 12,992,104 | |
| Moody's Corp. | 173,600 | 84,671,664 | |
| MSCI, Inc. | 41,100 | 23,862,249 | |
| NASDAQ, Inc. | 264,300 | 19,050,744 | |
| Open Lending Corp. (a)(c) | 171,300 | 986,688 | |
| S&P Global, Inc. | 96,900 | 49,732,956 | |
| Tradeweb Markets, Inc. Class A (a) | 147,600 | 17,452,224 | |
| 331,718,216 | |||
| Investment Banking & Brokerage - 20.4% | |||
| BGC Group, Inc. Class A (a) | 1,642,900 | 16,231,852 | |
| Charles Schwab Corp. | 491,161 | 31,974,581 | |
| Evercore, Inc. Class A | 64,200 | 15,776,508 | |
| Houlihan Lokey Class A (a) | 109,200 | 17,102,904 | |
| Interactive Brokers Group, Inc. | 134,600 | 17,348,594 | |
| Jefferies Financial Group, Inc. | 245,800 | 14,735,710 | |
| LPL Financial | 94,700 | 21,244,998 | |
| Moelis & Co. Class A (a) | 88,400 | 5,904,236 | |
| PJT Partners, Inc. Class A (a) | 97,412 | 12,030,382 | |
| Raymond James Financial, Inc. | 211,200 | 25,253,184 | |
| Robinhood Markets, Inc. (c) | 459,300 | 9,241,116 | |
| 186,844,065 | |||
TOTAL CAPITAL MARKETS | 878,272,194 | ||
| Financial Services - 3.9% | |||
| Diversified Financial Services - 3.9% | |||
| Apollo Global Management, Inc. | 309,700 | 35,841,581 | |
| TOTAL COMMON STOCKS (Cost $495,035,822) | 914,113,775 | ||
| Money Market Funds - 7.4% | |||
| Shares | Value ($) | ||
| Fidelity Cash Central Fund 5.39% (d) | 2,240,795 | 2,241,243 | |
| Fidelity Securities Lending Cash Central Fund 5.39% (d)(e) | 66,126,225 | 66,132,838 | |
| TOTAL MONEY MARKET FUNDS (Cost $68,374,081) | 68,374,081 | ||
| TOTAL INVESTMENT IN SECURITIES - 107.1% (Cost $563,409,903) | 982,487,856 |
NET OTHER ASSETS (LIABILITIES) - (7.1)% | (65,234,272) |
| NET ASSETS - 100.0% | 917,253,584 |
| (a) | Security or a portion of the security is on loan at period end. |
| (b) | Security exempt from registration under Rule 144A of the Securities Act of 1933. These securities may be resold in transactions exempt from registration, normally to qualified institutional buyers. At the end of the period, the value of these securities amounted to $6,626,484 or 0.7% of net assets. |
| (c) | Non-income producing |
| (d) | Affiliated fund that is generally available only to investment companies and other accounts managed by Fidelity Investments. The rate quoted is the annualized seven-day yield of the fund at period end. A complete unaudited listing of the fund's holdings as of its most recent quarter end is available upon request. In addition, each Fidelity Central Fund's financial statements are available on the SEC's website or upon request. |
| (e) | Investment made with cash collateral received from securities on loan. |
| Affiliate | Value, beginning of period ($) | Purchases ($) | Sales Proceeds ($) | Dividend Income ($) | Realized Gain (loss) ($) | Change in Unrealized appreciation (depreciation) ($) | Value, end of period ($) | % ownership, end of period |
| Fidelity Cash Central Fund 5.39% | 1,131,795 | 53,745,149 | 52,635,571 | 64,204 | (130) | - | 2,241,243 | 0.0% |
| Fidelity Securities Lending Cash Central Fund 5.39% | 44,905,725 | 318,218,510 | 296,991,397 | 15,180 | - | - | 66,132,838 | 0.3% |
| Total | 46,037,520 | 371,963,659 | 349,626,968 | 79,384 | (130) | - | 68,374,081 | |
| Valuation Inputs at Reporting Date: | ||||
| Description | Total ($) | Level 1 ($) | Level 2 ($) | Level 3 ($) |
Investments in Securities: | ||||
| Common Stocks | 914,113,775 | 914,113,775 | - | - |
| Money Market Funds | 68,374,081 | 68,374,081 | - | - |
| Total Investments in Securities: | 982,487,856 | 982,487,856 | - | - |
| Statement of Assets and Liabilities | ||||
| As of August 31, 2024 (Unaudited) | ||||
| Assets | ||||
| Investment in securities, at value (including securities loaned of $64,282,268) - See accompanying schedule: | ||||
Unaffiliated issuers (cost $495,035,822) | $ | 914,113,775 | ||
Fidelity Central Funds (cost $68,374,081) | 68,374,081 | |||
| Total Investment in Securities (cost $563,409,903) | $ | 982,487,856 | ||
| Foreign currency held at value (cost $1) | 1 | |||
| Receivable for investments sold | 970,692 | |||
| Receivable for fund shares sold | 129,217 | |||
| Dividends receivable | 692,695 | |||
| Distributions receivable from Fidelity Central Funds | 11,026 | |||
| Prepaid expenses | 1,601 | |||
| Other receivables | 65,539 | |||
Total assets | 984,358,627 | |||
| Liabilities | ||||
| Payable for fund shares redeemed | $ | 371,367 | ||
| Accrued management fee | 493,631 | |||
| Other payables and accrued expenses | 107,207 | |||
| Collateral on securities loaned | 66,132,838 | |||
| Total liabilities | 67,105,043 | |||
| Net Assets | $ | 917,253,584 | ||
| Net Assets consist of: | ||||
| Paid in capital | $ | 534,597,575 | ||
| Total accumulated earnings (loss) | 382,656,009 | |||
| Net Assets | $ | 917,253,584 | ||
Net Asset Value, offering price and redemption price per share ($917,253,584 ÷ 5,791,460 shares) | $ | 158.38 | ||
| Statement of Operations | ||||
Six months ended August 31, 2024 (Unaudited) | ||||
| Investment Income | ||||
| Dividends | $ | 7,146,348 | ||
| Income from Fidelity Central Funds (including $15,180 from security lending) | 79,384 | |||
| Total income | 7,225,732 | |||
| Expenses | ||||
| Management fee | $ | 2,942,392 | ||
| Custodian fees and expenses | 4,489 | |||
| Independent trustees' fees and expenses | 1,797 | |||
| Registration fees | 29,840 | |||
| Audit fees | 23,202 | |||
| Legal | 208 | |||
| Interest | 953 | |||
| Miscellaneous | 18,688 | |||
| Total expenses before reductions | 3,021,569 | |||
| Expense reductions | (16,637) | |||
| Total expenses after reductions | 3,004,932 | |||
| Net Investment income (loss) | 4,220,800 | |||
| Realized and Unrealized Gain (Loss) | ||||
| Net realized gain (loss) on: | ||||
| Investment Securities: | ||||
| Unaffiliated issuers | 23,514,925 | |||
| Fidelity Central Funds | (130) | |||
| Foreign currency transactions | 5,001 | |||
| Total net realized gain (loss) | 23,519,796 | |||
| Change in net unrealized appreciation (depreciation) on: | ||||
| Investment Securities: | ||||
| Unaffiliated issuers | 68,868,711 | |||
| Assets and liabilities in foreign currencies | 594 | |||
| Total change in net unrealized appreciation (depreciation) | 68,869,305 | |||
| Net gain (loss) | 92,389,101 | |||
| Net increase (decrease) in net assets resulting from operations | $ | 96,609,901 | ||
| Statement of Changes in Net Assets | ||||
Six months ended August 31, 2024 (Unaudited) | Year ended February 29, 2024 | |||
| Increase (Decrease) in Net Assets | ||||
| Operations | ||||
| Net investment income (loss) | $ | 4,220,800 | $ | 9,288,914 |
| Net realized gain (loss) | 23,519,796 | 12,456,058 | ||
| Change in net unrealized appreciation (depreciation) | 68,869,305 | 137,993,821 | ||
| Net increase (decrease) in net assets resulting from operations | 96,609,901 | 159,738,793 | ||
| Distributions to shareholders | (253,911) | (9,651,970) | ||
| Share transactions | ||||
| Proceeds from sales of shares | 88,993,454 | 125,688,073 | ||
| Reinvestment of distributions | 226,199 | 8,580,838 | ||
| Cost of shares redeemed | (104,746,840) | (260,903,898) | ||
Net increase (decrease) in net assets resulting from share transactions | (15,527,187) | (126,634,987) | ||
| Total increase (decrease) in net assets | 80,828,803 | 23,451,836 | ||
| Net Assets | ||||
| Beginning of period | 836,424,781 | 812,972,945 | ||
| End of period | $ | 917,253,584 | $ | 836,424,781 |
| Other Information | ||||
| Shares | ||||
| Sold | 609,348 | 1,029,633 | ||
| Issued in reinvestment of distributions | 1,595 | 64,659 | ||
| Redeemed | (710,696) | (2,270,079) | ||
| Net increase (decrease) | (99,753) | (1,175,787) | ||
Brokerage and Investment Management Portfolio |
Six months ended (Unaudited) August 31, 2024 | Years ended February 28, 2024 A | 2023 | 2022 | 2021 | 2020 A | |||||||
Selected Per-Share Data | ||||||||||||
| Net asset value, beginning of period | $ | 141.98 | $ | 115.04 | $ | 121.01 | $ | 100.99 | $ | 74.99 | $ | 71.71 |
| Income from Investment Operations | ||||||||||||
Net investment income (loss) B,C | .71 | 1.50 | 1.45 | 1.31 | .93 | 1.01 | ||||||
| Net realized and unrealized gain (loss) | 15.73 | 27.09 | (5.19) | 20.54 | 28.01 | 5.70 | ||||||
| Total from investment operations | 16.44 | 28.59 | (3.74) | 21.85 | 28.94 | 6.71 | ||||||
| Distributions from net investment income | (.04) | (1.65) | (1.83) | (.83) | (1.06) | (.98) | ||||||
| Distributions from net realized gain | - | - | (.41) | (1.01) | (1.88) | (2.45) | ||||||
| Total distributions | (.04) | (1.65) | (2.23) D | (1.83) D | (2.94) | (3.43) | ||||||
| Net asset value, end of period | $ | 158.38 | $ | 141.98 | $ | 115.04 | $ | 121.01 | $ | 100.99 | $ | 74.99 |
Total Return E,F | 11.58 % | 24.95% | (2.98)% | 21.70% | 39.69% | 9.28% | ||||||
Ratios to Average Net Assets C,G,H | ||||||||||||
| Expenses before reductions | .69% I | .76% | .75% | .74% | .76% | .77% | ||||||
| Expenses net of fee waivers, if any | .69 % I | .75% | .74% | .74% | .76% | .77% | ||||||
| Expenses net of all reductions | .69% I | .75% | .74% | .74% | .76% | .77% | ||||||
| Net investment income (loss) | .97% I | 1.28% | 1.33% | 1.06% | 1.14% | 1.33% | ||||||
| Supplemental Data | ||||||||||||
| Net assets, end of period (000 omitted) | $ | 917,254 | $ | 836,425 | $ | 812,973 | $ | 1,209,722 | $ | 429,320 | $ | 309,088 |
Portfolio turnover rate J | 21 % I | 36% | 4% | 3% | 11% | 9% |
| Common Stocks - 99.7% | |||
| Shares | Value ($) | ||
| Banks - 34.4% | |||
| Diversified Banks - 19.9% | |||
| Bank of America Corp. | 1,011,300 | 41,210,475 | |
| Citigroup, Inc. | 358,800 | 22,475,232 | |
| KeyCorp | 682,300 | 11,640,038 | |
| PNC Financial Services Group, Inc. | 75,700 | 14,011,313 | |
| U.S. Bancorp | 329,200 | 15,548,116 | |
| Wells Fargo & Co. | 866,790 | 50,681,211 | |
| 155,566,385 | |||
| Regional Banks - 14.5% | |||
| Associated Banc-Corp. | 335,200 | 7,669,376 | |
| BOK Financial Corp. | 79,000 | 8,291,050 | |
| Cadence Bank | 139,230 | 4,494,344 | |
| East West Bancorp, Inc. | 108,800 | 9,146,816 | |
| Eastern Bankshares, Inc. | 462,500 | 7,848,625 | |
| First Hawaiian, Inc. | 174,200 | 4,238,286 | |
| First Interstate Bancsystem, Inc. Class A | 254,821 | 7,912,192 | |
| Heartland Financial U.S.A., Inc. | 123,200 | 6,869,632 | |
| M&T Bank Corp. | 111,437 | 19,179,422 | |
| Popular, Inc. | 135,800 | 13,919,500 | |
| Trico Bancshares | 112,200 | 5,100,612 | |
| UMB Financial Corp. (a) | 90,888 | 9,415,088 | |
| WesBanco, Inc. | 178,400 | 5,746,264 | |
| Wintrust Financial Corp. | 37,700 | 4,101,760 | |
| 113,932,967 | |||
TOTAL BANKS | 269,499,352 | ||
| Capital Markets - 20.6% | |||
| Asset Management & Custody Banks - 6.8% | |||
| AllianceBernstein Holding LP | 236,100 | 8,131,284 | |
| Blue Owl Capital, Inc. Class A (a) | 270,100 | 4,764,564 | |
| Carlyle Group LP (a) | 190,800 | 7,656,804 | |
| Northern Trust Corp. (a) | 145,600 | 13,280,176 | |
| Patria Investments Ltd. | 391,600 | 4,511,232 | |
| State Street Corp. | 165,500 | 14,415,050 | |
| 52,759,110 | |||
| Financial Exchanges & Data - 4.0% | |||
| Bolsa Mexicana de Valores S.A.B. de CV | 2,249,700 | 3,461,209 | |
| MarketAxess Holdings, Inc. | 57,300 | 13,888,947 | |
| Moody's Corp. | 28,700 | 13,998,138 | |
| 31,348,294 | |||
| Investment Banking & Brokerage - 9.8% | |||
| Lazard, Inc. Class A (a) | 207,692 | 10,407,446 | |
| LPL Financial | 55,800 | 12,518,172 | |
| Morgan Stanley | 185,500 | 19,219,655 | |
| Perella Weinberg Partners Class A | 436,297 | 8,529,606 | |
| Raymond James Financial, Inc. | 69,000 | 8,250,330 | |
| Stifel Financial Corp. | 90,400 | 7,967,856 | |
| Virtu Financial, Inc. Class A | 326,400 | 10,023,744 | |
| 76,916,809 | |||
TOTAL CAPITAL MARKETS | 161,024,213 | ||
| Consumer Finance - 3.9% | |||
| Consumer Finance - 3.9% | |||
| Discover Financial Services | 100,300 | 13,912,613 | |
| FirstCash Holdings, Inc. | 75,311 | 9,044,098 | |
| OneMain Holdings, Inc. | 155,300 | 7,673,373 | |
| 30,630,084 | |||
| Financial Services - 21.0% | |||
| Commercial & Residential Mortgage Finance - 1.9% | |||
| Essent Group Ltd. | 108,938 | 7,003,624 | |
| NMI Holdings, Inc. (b) | 191,600 | 7,869,012 | |
| 14,872,636 | |||
| Diversified Financial Services - 4.7% | |||
| Apollo Global Management, Inc. | 158,800 | 18,377,924 | |
| Corebridge Financial, Inc. (a) | 263,900 | 7,800,884 | |
| Voya Financial, Inc. | 151,300 | 10,716,579 | |
| 36,895,387 | |||
| Multi-Sector Holdings - 0.5% | |||
| Cannae Holdings, Inc. (a) | 197,690 | 3,957,754 | |
| Transaction & Payment Processing Services - 13.9% | |||
| Corpay, Inc. (b) | 28,200 | 8,898,510 | |
| Fiserv, Inc. (b) | 68,100 | 11,890,260 | |
| Global Payments, Inc. | 88,400 | 9,813,284 | |
| MasterCard, Inc. Class A | 162,400 | 78,494,416 | |
| 109,096,470 | |||
TOTAL FINANCIAL SERVICES | 164,822,247 | ||
| Insurance - 18.8% | |||
| Insurance Brokers - 5.9% | |||
| Arthur J. Gallagher & Co. | 52,400 | 15,330,668 | |
| Marsh & McLennan Companies, Inc. | 72,200 | 16,426,222 | |
| The Baldwin Insurance Group, Inc. Class A, (b) | 314,911 | 14,766,177 | |
| 46,523,067 | |||
| Property & Casualty Insurance - 10.7% | |||
| American Financial Group, Inc. | 86,100 | 11,504,682 | |
| Beazley PLC | 741,400 | 7,302,605 | |
| Chubb Ltd. | 64,100 | 18,215,938 | |
| Direct Line Insurance Group PLC | 2,187,900 | 5,465,148 | |
| Fidelity National Financial, Inc. | 129,100 | 7,611,736 | |
| First American Financial Corp. | 56,300 | 3,591,940 | |
| Hartford Financial Services Group, Inc. | 100,300 | 11,644,830 | |
| Hiscox Ltd. | 654,500 | 10,116,961 | |
| Lancashire Holdings Ltd. | 942,092 | 8,314,316 | |
| 83,768,156 | |||
| Reinsurance - 2.2% | |||
| Reinsurance Group of America, Inc. | 76,400 | 16,866,064 | |
TOTAL INSURANCE | 147,157,287 | ||
| Professional Services - 1.0% | |||
| Research & Consulting Services - 1.0% | |||
| Dun & Bradstreet Holdings, Inc. (a) | 632,300 | 7,587,600 | |
| TOTAL COMMON STOCKS (Cost $558,352,634) | 780,720,783 | ||
| Money Market Funds - 4.4% | |||
| Shares | Value ($) | ||
| Fidelity Cash Central Fund 5.39% (c) | 7,106,373 | 7,107,794 | |
| Fidelity Securities Lending Cash Central Fund 5.39% (c)(d) | 27,374,038 | 27,376,775 | |
| TOTAL MONEY MARKET FUNDS (Cost $34,484,569) | 34,484,569 | ||
| TOTAL INVESTMENT IN SECURITIES - 104.1% (Cost $592,837,203) | 815,205,352 |
NET OTHER ASSETS (LIABILITIES) - (4.1)% | (31,918,044) |
| NET ASSETS - 100.0% | 783,287,308 |
| (a) | Security or a portion of the security is on loan at period end. |
| (b) | Non-income producing |
| (c) | Affiliated fund that is generally available only to investment companies and other accounts managed by Fidelity Investments. The rate quoted is the annualized seven-day yield of the fund at period end. A complete unaudited listing of the fund's holdings as of its most recent quarter end is available upon request. In addition, each Fidelity Central Fund's financial statements are available on the SEC's website or upon request. |
| (d) | Investment made with cash collateral received from securities on loan. |
| Affiliate | Value, beginning of period ($) | Purchases ($) | Sales Proceeds ($) | Dividend Income ($) | Realized Gain (loss) ($) | Change in Unrealized appreciation (depreciation) ($) | Value, end of period ($) | % ownership, end of period |
| Fidelity Cash Central Fund 5.39% | 2,842,322 | 37,853,704 | 33,588,232 | 35,005 | - | - | 7,107,794 | 0.0% |
| Fidelity Securities Lending Cash Central Fund 5.39% | 14,222,525 | 120,436,907 | 107,282,657 | 10,442 | - | - | 27,376,775 | 0.1% |
| Total | 17,064,847 | 158,290,611 | 140,870,889 | 45,447 | - | - | 34,484,569 | |
| Valuation Inputs at Reporting Date: | ||||
| Description | Total ($) | Level 1 ($) | Level 2 ($) | Level 3 ($) |
Investments in Securities: | ||||
| Common Stocks | 780,720,783 | 780,720,783 | - | - |
| Money Market Funds | 34,484,569 | 34,484,569 | - | - |
| Total Investments in Securities: | 815,205,352 | 815,205,352 | - | - |
| Statement of Assets and Liabilities | ||||
| As of August 31, 2024 (Unaudited) | ||||
| Assets | ||||
| Investment in securities, at value (including securities loaned of $26,945,765) - See accompanying schedule: | ||||
Unaffiliated issuers (cost $558,352,634) | $ | 780,720,783 | ||
Fidelity Central Funds (cost $34,484,569) | 34,484,569 | |||
| Total Investment in Securities (cost $592,837,203) | $ | 815,205,352 | ||
| Receivable for investments sold | 49,317 | |||
| Receivable for fund shares sold | 820,473 | |||
| Dividends receivable | 1,002,424 | |||
| Distributions receivable from Fidelity Central Funds | 16,800 | |||
| Prepaid expenses | 1,873 | |||
| Other receivables | 1,355 | |||
Total assets | 817,097,594 | |||
| Liabilities | ||||
| Payable for investments purchased | $ | 5,591,256 | ||
| Payable for fund shares redeemed | 392,897 | |||
| Accrued management fee | 411,162 | |||
| Other payables and accrued expenses | 38,196 | |||
| Collateral on securities loaned | 27,376,775 | |||
| Total liabilities | 33,810,286 | |||
| Net Assets | $ | 783,287,308 | ||
| Net Assets consist of: | ||||
| Paid in capital | $ | 539,013,323 | ||
| Total accumulated earnings (loss) | 244,273,985 | |||
| Net Assets | $ | 783,287,308 | ||
Net Asset Value, offering price and redemption price per share ($783,287,308 ÷ 54,794,501 shares) | $ | 14.29 | ||
| Statement of Operations | ||||
Six months ended August 31, 2024 (Unaudited) | ||||
| Investment Income | ||||
| Dividends | $ | 9,133,928 | ||
| Income from Fidelity Central Funds (including $10,442 from security lending) | 45,447 | |||
| Total income | 9,179,375 | |||
| Expenses | ||||
| Management fee | $ | 2,405,740 | ||
| Custodian fees and expenses | 13,930 | |||
| Independent trustees' fees and expenses | 1,477 | |||
| Registration fees | 29,069 | |||
| Audit fees | 23,479 | |||
| Legal | 876 | |||
| Interest | 10,777 | |||
| Miscellaneous | 14,471 | |||
| Total expenses before reductions | 2,499,819 | |||
| Expense reductions | (13,899) | |||
| Total expenses after reductions | 2,485,920 | |||
| Net Investment income (loss) | 6,693,455 | |||
| Realized and Unrealized Gain (Loss) | ||||
| Net realized gain (loss) on: | ||||
| Investment Securities: | ||||
| Unaffiliated issuers | 18,213,787 | |||
| Foreign currency transactions | (8,472) | |||
| Total net realized gain (loss) | 18,205,315 | |||
| Change in net unrealized appreciation (depreciation) on: | ||||
| Investment Securities: | ||||
| Unaffiliated issuers | 76,992,362 | |||
| Assets and liabilities in foreign currencies | 3,082 | |||
| Total change in net unrealized appreciation (depreciation) | 76,995,444 | |||
| Net gain (loss) | 95,200,759 | |||
| Net increase (decrease) in net assets resulting from operations | $ | 101,894,214 | ||
| Statement of Changes in Net Assets | ||||
Six months ended August 31, 2024 (Unaudited) | Year ended February 29, 2024 | |||
| Increase (Decrease) in Net Assets | ||||
| Operations | ||||
| Net investment income (loss) | $ | 6,693,455 | $ | 13,710,762 |
| Net realized gain (loss) | 18,205,315 | 2,618,029 | ||
| Change in net unrealized appreciation (depreciation) | 76,995,444 | 26,667,301 | ||
| Net increase (decrease) in net assets resulting from operations | 101,894,214 | 42,996,092 | ||
| Distributions to shareholders | (4,346,544) | (20,240,392) | ||
| Share transactions | ||||
| Proceeds from sales of shares | 76,768,334 | 238,771,101 | ||
| Reinvestment of distributions | 4,025,202 | 18,627,765 | ||
| Cost of shares redeemed | (93,364,431) | (313,003,472) | ||
Net increase (decrease) in net assets resulting from share transactions | (12,570,895) | (55,604,606) | ||
| Total increase (decrease) in net assets | 84,976,775 | (32,848,906) | ||
| Net Assets | ||||
| Beginning of period | 698,310,533 | 731,159,439 | ||
| End of period | $ | 783,287,308 | $ | 698,310,533 |
| Other Information | ||||
| Shares | ||||
| Sold | 5,797,118 | 20,764,508 | ||
| Issued in reinvestment of distributions | 323,830 | 1,693,153 | ||
| Redeemed | (7,202,421) | (30,094,552) | ||
| Net increase (decrease) | (1,081,473) | (7,636,891) | ||
Financials Portfolio |
Six months ended (Unaudited) August 31, 2024 | Years ended February 28, 2024 A | 2023 | 2022 | 2021 | 2020 A | |||||||
Selected Per-Share Data | ||||||||||||
| Net asset value, beginning of period | $ | 12.50 | $ | 11.51 | $ | 13.23 | $ | 11.26 | $ | 9.49 | $ | 9.65 |
| Income from Investment Operations | ||||||||||||
Net investment income (loss) B,C | .12 | .26 | .24 | .25 | .20 | .19 | ||||||
| Net realized and unrealized gain (loss) | 1.75 | 1.09 | (.74) | 2.26 | 2.17 | .26 | ||||||
| Total from investment operations | 1.87 | 1.35 | (.50) | 2.51 | 2.37 | .45 | ||||||
| Distributions from net investment income | (.04) | (.25) | (.23) | (.26) | (.21) | (.16) | ||||||
| Distributions from net realized gain | (.04) | (.11) | (.98) | (.28) | (.39) | (.45) | ||||||
| Total distributions | (.08) | (.36) | (1.22) D | (.54) | (.60) | (.61) | ||||||
| Net asset value, end of period | $ | 14.29 | $ | 12.50 | $ | 11.51 | $ | 13.23 | $ | 11.26 | $ | 9.49 |
Total Return E,F | 15.05 % | 12.15% | (3.30)% | 22.47% | 27.89% | 3.81% | ||||||
Ratios to Average Net Assets C,G,H | ||||||||||||
| Expenses before reductions | .70% I | .76% | .75% | .73% | .77% | .77% | ||||||
| Expenses net of fee waivers, if any | .70 % I | .76% | .75% | .72% | .77% | .77% | ||||||
| Expenses net of all reductions | .70% I | .76% | .75% | .72% | .77% | .76% | ||||||
| Net investment income (loss) | 1.87% I | 2.43% | 2.12% | 1.89% | 2.36% | 1.81% | ||||||
| Supplemental Data | ||||||||||||
| Net assets, end of period (000 omitted) | $ | 783,287 | $ | 698,311 | $ | 731,159 | $ | 819,910 | $ | 606,048 | $ | 483,337 |
Portfolio turnover rate J | 31 % I | 66% | 46% | 53% | 63% | 61% K |
| Common Stocks - 99.9% | |||
| Shares | Value ($) | ||
| Consumer Finance - 20.9% | |||
| Consumer Finance - 20.9% | |||
| American Express Co. | 45,859 | 11,861,430 | |
| Capital One Financial Corp. | 15,790 | 2,320,025 | |
| Discover Financial Services | 34,847 | 4,833,627 | |
| OneMain Holdings, Inc. | 6,091 | 300,956 | |
| Synchrony Financial | 25,466 | 1,279,921 | |
| 20,595,959 | |||
| Financial Services - 61.9% | |||
| Transaction & Payment Processing Services - 61.9% | |||
| Adyen BV (a)(b) | 3,229 | 4,765,370 | |
| Block, Inc. Class A (a) | 69,227 | 4,574,520 | |
| Corpay, Inc. (a) | 14,913 | 4,705,797 | |
| Fidelity National Information Services, Inc. | 58,519 | 4,824,892 | |
| Fiserv, Inc. (a) | 27,604 | 4,819,658 | |
| Flywire Corp. (a)(c) | 80,087 | 1,450,376 | |
| Global Payments, Inc. | 34,645 | 3,845,941 | |
| Marqeta, Inc. Class A (a) | 98,981 | 527,569 | |
| MasterCard, Inc. Class A | 25,675 | 12,409,757 | |
| PagSeguro Digital Ltd. (a) | 44,275 | 490,124 | |
| PayPal Holdings, Inc. (a) | 38,522 | 2,790,148 | |
| Shift4 Payments, Inc. Class A (a)(c) | 17,929 | 1,489,900 | |
| Visa, Inc. Class A | 41,438 | 11,452,220 | |
| WEX, Inc. (a) | 12,014 | 2,294,914 | |
| Wise PLC (a) | 44,900 | 415,424 | |
| 60,856,610 | |||
| IT Services - 4.8% | |||
| Internet Services & Infrastructure - 4.8% | |||
| Shopify, Inc. Class A (a) | 63,897 | 4,732,851 | |
| Software - 12.3% | |||
| Application Software - 12.3% | |||
| Intapp, Inc. (a) | 26,627 | 1,230,167 | |
| Intuit, Inc. | 17,244 | 10,868,203 | |
| 12,098,370 | |||
| TOTAL COMMON STOCKS (Cost $67,215,097) | 98,283,790 | ||
| Money Market Funds - 1.9% | |||
| Shares | Value ($) | ||
| Fidelity Cash Central Fund 5.39% (d) | 146,974 | 147,004 | |
| Fidelity Securities Lending Cash Central Fund 5.39% (d)(e) | 1,720,088 | 1,720,260 | |
| TOTAL MONEY MARKET FUNDS (Cost $1,867,264) | 1,867,264 | ||
| TOTAL INVESTMENT IN SECURITIES - 101.8% (Cost $69,082,361) | 100,151,054 |
NET OTHER ASSETS (LIABILITIES) - (1.8)% | (1,802,567) |
| NET ASSETS - 100.0% | 98,348,487 |
| (a) | Non-income producing |
| (b) | Security exempt from registration under Rule 144A of the Securities Act of 1933. These securities may be resold in transactions exempt from registration, normally to qualified institutional buyers. At the end of the period, the value of these securities amounted to $4,765,370 or 4.8% of net assets. |
| (c) | Security or a portion of the security is on loan at period end. |
| (d) | Affiliated fund that is generally available only to investment companies and other accounts managed by Fidelity Investments. The rate quoted is the annualized seven-day yield of the fund at period end. A complete unaudited listing of the fund's holdings as of its most recent quarter end is available upon request. In addition, each Fidelity Central Fund's financial statements are available on the SEC's website or upon request. |
| (e) | Investment made with cash collateral received from securities on loan. |
| Affiliate | Value, beginning of period ($) | Purchases ($) | Sales Proceeds ($) | Dividend Income ($) | Realized Gain (loss) ($) | Change in Unrealized appreciation (depreciation) ($) | Value, end of period ($) | % ownership, end of period |
| Fidelity Cash Central Fund 5.39% | 1,815,560 | 10,708,511 | 12,377,132 | 9,199 | 65 | - | 147,004 | 0.0% |
| Fidelity Securities Lending Cash Central Fund 5.39% | 1,886,625 | 6,951,250 | 7,117,615 | 870 | - | - | 1,720,260 | 0.0% |
| Total | 3,702,185 | 17,659,761 | 19,494,747 | 10,069 | 65 | - | 1,867,264 | |
| Valuation Inputs at Reporting Date: | ||||
| Description | Total ($) | Level 1 ($) | Level 2 ($) | Level 3 ($) |
Investments in Securities: | ||||
| Common Stocks | 98,283,790 | 93,518,420 | 4,765,370 | - |
| Money Market Funds | 1,867,264 | 1,867,264 | - | - |
| Total Investments in Securities: | 100,151,054 | 95,385,684 | 4,765,370 | - |
| Statement of Assets and Liabilities | ||||
| As of August 31, 2024 (Unaudited) | ||||
| Assets | ||||
| Investment in securities, at value (including securities loaned of $1,696,735) - See accompanying schedule: | ||||
Unaffiliated issuers (cost $67,215,097) | $ | 98,283,790 | ||
Fidelity Central Funds (cost $1,867,264) | 1,867,264 | |||
| Total Investment in Securities (cost $69,082,361) | $ | 100,151,054 | ||
| Receivable for fund shares sold | 17,104 | |||
| Dividends receivable | 52,932 | |||
| Distributions receivable from Fidelity Central Funds | 1,734 | |||
| Prepaid expenses | 208 | |||
Total assets | 100,223,032 | |||
| Liabilities | ||||
| Payable for fund shares redeemed | $ | 73,628 | ||
| Accrued management fee | 53,079 | |||
| Other payables and accrued expenses | 27,578 | |||
| Collateral on securities loaned | 1,720,260 | |||
| Total liabilities | 1,874,545 | |||
| Net Assets | $ | 98,348,487 | ||
| Net Assets consist of: | ||||
| Paid in capital | $ | 111,083,871 | ||
| Total accumulated earnings (loss) | (12,735,384) | |||
| Net Assets | $ | 98,348,487 | ||
Net Asset Value, offering price and redemption price per share ($98,348,487 ÷ 5,686,821 shares) | $ | 17.29 | ||
| Statement of Operations | ||||
Six months ended August 31, 2024 (Unaudited) | ||||
| Investment Income | ||||
| Dividends | $ | 365,629 | ||
| Income from Fidelity Central Funds (including $870 from security lending) | 10,069 | |||
| Total income | 375,698 | |||
| Expenses | ||||
| Management fee | $ | 341,213 | ||
| Custodian fees and expenses | 2,992 | |||
| Independent trustees' fees and expenses | 222 | |||
| Registration fees | 15,668 | |||
| Audit fees | 23,074 | |||
| Legal | 26 | |||
| Miscellaneous | 4,131 | |||
| Total expenses before reductions | 387,326 | |||
| Expense reductions | (2,254) | |||
| Total expenses after reductions | 385,072 | |||
| Net Investment income (loss) | (9,374) | |||
| Realized and Unrealized Gain (Loss) | ||||
| Net realized gain (loss) on: | ||||
| Investment Securities: | ||||
| Unaffiliated issuers | 1,318,491 | |||
| Fidelity Central Funds | 65 | |||
| Foreign currency transactions | (75) | |||
| Total net realized gain (loss) | 1,318,481 | |||
| Change in net unrealized appreciation (depreciation) on: | ||||
| Investment Securities: | ||||
| Unaffiliated issuers | (431,468) | |||
| Assets and liabilities in foreign currencies | 114 | |||
| Total change in net unrealized appreciation (depreciation) | (431,354) | |||
| Net gain (loss) | 887,127 | |||
| Net increase (decrease) in net assets resulting from operations | $ | 877,753 | ||
| Statement of Changes in Net Assets | ||||
Six months ended August 31, 2024 (Unaudited) | Year ended February 29, 2024 | |||
| Increase (Decrease) in Net Assets | ||||
| Operations | ||||
| Net investment income (loss) | $ | (9,374) | $ | (35,601) |
| Net realized gain (loss) | 1,318,481 | (22,667,293) | ||
| Change in net unrealized appreciation (depreciation) | (431,354) | 45,301,050 | ||
| Net increase (decrease) in net assets resulting from operations | 877,753 | 22,598,156 | ||
| Share transactions | ||||
| Proceeds from sales of shares | 5,870,027 | 14,051,673 | ||
| Cost of shares redeemed | (20,136,760) | (32,490,694) | ||
Net increase (decrease) in net assets resulting from share transactions | (14,266,733) | (18,439,021) | ||
| Total increase (decrease) in net assets | (13,388,980) | 4,159,135 | ||
| Net Assets | ||||
| Beginning of period | 111,737,467 | 107,578,332 | ||
| End of period | $ | 98,348,487 | $ | 111,737,467 |
| Other Information | ||||
| Shares | ||||
| Sold | 354,818 | 949,620 | ||
| Redeemed | (1,228,041) | (2,225,879) | ||
| Net increase (decrease) | (873,223) | (1,276,259) | ||
FinTech Portfolio |
Six months ended (Unaudited) August 31, 2024 | Years ended February 28, 2024 A | 2023 | 2022 | 2021 | 2020 A | |||||||
Selected Per-Share Data | ||||||||||||
| Net asset value, beginning of period | $ | 17.03 | $ | 13.73 | $ | 16.06 | $ | 19.37 | $ | 16.23 | $ | 15.80 |
| Income from Investment Operations | ||||||||||||
Net investment income (loss) B,C | - D | - D | - D | .14 E | .34 F | .39 | ||||||
| Net realized and unrealized gain (loss) | .26 | 3.30 | (2.33) | .04 G,H | 3.14 | .35 | ||||||
| Total from investment operations | .26 | 3.30 | (2.33) | .18 | 3.48 | .74 | ||||||
| Distributions from net investment income | - | - | - | (.25) | (.34) | (.31) | ||||||
| Distributions from net realized gain | - | - | - | (3.24) | - | (.01) | ||||||
| Total distributions | - | - | - | (3.49) | (.34) | (.31) I | ||||||
| Net asset value, end of period | $ | 17.29 | $ | 17.03 | $ | 13.73 | $ | 16.06 | $ | 19.37 | $ | 16.23 |
Total Return J,K | 1.53 % | 24.03% | (14.51)% | (.75)% H | 21.94% | 4.54% | ||||||
Ratios to Average Net Assets B,L,M | ||||||||||||
| Expenses before reductions | .76% N | .87% | .87% | .81% | .89% | .86% | ||||||
| Expenses net of fee waivers, if any | .76 % N | .86% | .87% | .81% | .89% | .86% | ||||||
| Expenses net of all reductions | .76% N | .86% | .87% | .81% | .89% | .85% | ||||||
| Net investment income (loss) | (.02)% N | (.03)% | (.03)% | .63% E | 2.35% F | 2.29% | ||||||
| Supplemental Data | ||||||||||||
| Net assets, end of period (000 omitted) | $ | 98,348 | $ | 111,737 | $ | 107,578 | $ | 161,851 | $ | 144,880 | $ | 148,247 |
Portfolio turnover rate O | 31 % N | 43% | 15% | 164% | 25% | 20% |
| Common Stocks - 97.8% | |||
| Shares | Value ($) | ||
| Financial Services - 4.9% | |||
| Diversified Financial Services - 4.9% | |||
| Corebridge Financial, Inc. | 701,800 | 20,745,208 | |
| Voya Financial, Inc. | 295,700 | 20,944,431 | |
| 41,689,639 | |||
| Insurance - 92.9% | |||
| Insurance Brokers - 29.2% | |||
| Aon PLC | 88,855 | 30,541,241 | |
| Arthur J. Gallagher & Co. | 265,300 | 77,618,821 | |
| Brown & Brown, Inc. | 374,300 | 39,350,159 | |
| Marsh & McLennan Companies, Inc. | 362,300 | 82,426,873 | |
| Steadfast Group Ltd. | 3,874,228 | 16,966,095 | |
| TWFG, Inc. Class A | 4,300 | 123,281 | |
| 247,026,470 | |||
| Life & Health Insurance - 9.8% | |||
| MetLife, Inc. | 515,700 | 39,956,436 | |
| Primerica, Inc. | 82,900 | 21,821,767 | |
| Unum Group | 390,200 | 21,652,198 | |
| 83,430,401 | |||
| Property & Casualty Insurance - 49.1% | |||
| Allstate Corp. | 167,000 | 31,552,980 | |
| American Financial Group, Inc. | 255,000 | 34,073,100 | |
| Arch Capital Group Ltd. (a) | 352,100 | 39,818,989 | |
| Bowhead Specialty Holdings, Inc. (b) | 276,300 | 8,559,774 | |
| Chubb Ltd. | 292,305 | 83,067,234 | |
| Hanover Insurance Group, Inc. | 146,700 | 21,563,433 | |
| Hartford Financial Services Group, Inc. | 645,200 | 74,907,720 | |
| Progressive Corp. | 161,000 | 40,604,200 | |
| Selective Insurance Group, Inc. | 188,111 | 17,114,339 | |
| The Travelers Companies, Inc. | 284,600 | 64,908,722 | |
| 416,170,491 | |||
| Reinsurance - 4.8% | |||
| Reinsurance Group of America, Inc. | 183,300 | 40,465,308 | |
TOTAL INSURANCE | 787,092,670 | ||
| TOTAL COMMON STOCKS (Cost $569,122,414) | 828,782,309 | ||
| Money Market Funds - 1.8% | |||
| Shares | Value ($) | ||
| Fidelity Cash Central Fund 5.39% (c) | 14,859,586 | 14,862,558 | |
| Fidelity Securities Lending Cash Central Fund 5.39% (c)(d) | 655,934 | 656,000 | |
| TOTAL MONEY MARKET FUNDS (Cost $15,518,558) | 15,518,558 | ||
| TOTAL INVESTMENT IN SECURITIES - 99.6% (Cost $584,640,972) | 844,300,867 |
NET OTHER ASSETS (LIABILITIES) - 0.4% | 3,301,589 |
| NET ASSETS - 100.0% | 847,602,456 |
| (a) | Non-income producing |
| (b) | Security or a portion of the security is on loan at period end. |
| (c) | Affiliated fund that is generally available only to investment companies and other accounts managed by Fidelity Investments. The rate quoted is the annualized seven-day yield of the fund at period end. A complete unaudited listing of the fund's holdings as of its most recent quarter end is available upon request. In addition, each Fidelity Central Fund's financial statements are available on the SEC's website or upon request. |
| (d) | Investment made with cash collateral received from securities on loan. |
| Affiliate | Value, beginning of period ($) | Purchases ($) | Sales Proceeds ($) | Dividend Income ($) | Realized Gain (loss) ($) | Change in Unrealized appreciation (depreciation) ($) | Value, end of period ($) | % ownership, end of period |
| Fidelity Cash Central Fund 5.39% | 8,182,208 | 181,114,567 | 174,433,854 | 181,196 | (363) | - | 14,862,558 | 0.0% |
| Fidelity Securities Lending Cash Central Fund 5.39% | - | 36,053,902 | 35,397,902 | 5,053 | - | - | 656,000 | 0.0% |
| Total | 8,182,208 | 217,168,469 | 209,831,756 | 186,249 | (363) | - | 15,518,558 | |
| Valuation Inputs at Reporting Date: | ||||
| Description | Total ($) | Level 1 ($) | Level 2 ($) | Level 3 ($) |
Investments in Securities: | ||||
| Common Stocks | 828,782,309 | 828,782,309 | - | - |
| Money Market Funds | 15,518,558 | 15,518,558 | - | - |
| Total Investments in Securities: | 844,300,867 | 844,300,867 | - | - |
| Statement of Assets and Liabilities | ||||
| As of August 31, 2024 (Unaudited) | ||||
| Assets | ||||
| Investment in securities, at value (including securities loaned of $635,090) - See accompanying schedule: | ||||
Unaffiliated issuers (cost $569,122,414) | $ | 828,782,309 | ||
Fidelity Central Funds (cost $15,518,558) | 15,518,558 | |||
| Total Investment in Securities (cost $584,640,972) | $ | 844,300,867 | ||
| Foreign currency held at value (cost $3) | 3 | |||
| Receivable for investments sold | 2,052,900 | |||
| Receivable for fund shares sold | 3,412,649 | |||
| Dividends receivable | 681,457 | |||
| Distributions receivable from Fidelity Central Funds | 37,526 | |||
| Prepaid expenses | 1,269 | |||
Total assets | 850,486,671 | |||
| Liabilities | ||||
| Payable for investments purchased | $ | 1,300,760 | ||
| Payable for fund shares redeemed | 449,391 | |||
| Accrued management fee | 435,573 | |||
| Other payables and accrued expenses | 42,491 | |||
| Collateral on securities loaned | 656,000 | |||
| Total liabilities | 2,884,215 | |||
| Net Assets | $ | 847,602,456 | ||
| Net Assets consist of: | ||||
| Paid in capital | $ | 571,990,239 | ||
| Total accumulated earnings (loss) | 275,612,217 | |||
| Net Assets | $ | 847,602,456 | ||
Net Asset Value, offering price and redemption price per share ($847,602,456 ÷ 8,890,440 shares) | $ | 95.34 | ||
| Statement of Operations | ||||
Six months ended August 31, 2024 (Unaudited) | ||||
| Investment Income | ||||
| Dividends | $ | 5,432,758 | ||
| Income from Fidelity Central Funds (including $5,053 from security lending) | 186,249 | |||
| Total income | 5,619,007 | |||
| Expenses | ||||
| Management fee | $ | 2,342,160 | ||
| Custodian fees and expenses | 5,850 | |||
| Independent trustees' fees and expenses | 1,342 | |||
| Registration fees | 58,429 | |||
| Audit fees | 22,398 | |||
| Legal | 860 | |||
| Miscellaneous | 18,524 | |||
| Total expenses before reductions | 2,449,563 | |||
| Expense reductions | (11,650) | |||
| Total expenses after reductions | 2,437,913 | |||
| Net Investment income (loss) | 3,181,094 | |||
| Realized and Unrealized Gain (Loss) | ||||
| Net realized gain (loss) on: | ||||
| Investment Securities: | ||||
| Unaffiliated issuers | 13,856,016 | |||
| Fidelity Central Funds | (363) | |||
| Foreign currency transactions | 1,148 | |||
| Total net realized gain (loss) | 13,856,801 | |||
| Change in net unrealized appreciation (depreciation) on: | ||||
| Investment Securities: | ||||
| Unaffiliated issuers | 89,859,811 | |||
| Assets and liabilities in foreign currencies | 1,432 | |||
| Total change in net unrealized appreciation (depreciation) | 89,861,243 | |||
| Net gain (loss) | 103,718,044 | |||
| Net increase (decrease) in net assets resulting from operations | $ | 106,899,138 | ||
| Statement of Changes in Net Assets | ||||
Six months ended August 31, 2024 (Unaudited) | Year ended February 29, 2024 | |||
| Increase (Decrease) in Net Assets | ||||
| Operations | ||||
| Net investment income (loss) | $ | 3,181,094 | $ | 5,522,392 |
| Net realized gain (loss) | 13,856,801 | 44,743,943 | ||
| Change in net unrealized appreciation (depreciation) | 89,861,243 | 41,616,096 | ||
| Net increase (decrease) in net assets resulting from operations | 106,899,138 | 91,882,431 | ||
| Distributions to shareholders | (21,060,959) | (37,245,784) | ||
| Share transactions | ||||
| Proceeds from sales of shares | 284,001,225 | 312,809,090 | ||
| Reinvestment of distributions | 19,110,578 | 33,544,278 | ||
| Cost of shares redeemed | (141,241,228) | (275,557,684) | ||
Net increase (decrease) in net assets resulting from share transactions | 161,870,575 | 70,795,684 | ||
| Total increase (decrease) in net assets | 247,708,754 | 125,432,331 | ||
| Net Assets | ||||
| Beginning of period | 599,893,702 | 474,461,371 | ||
| End of period | $ | 847,602,456 | $ | 599,893,702 |
| Other Information | ||||
| Shares | ||||
| Sold | 3,259,249 | 4,027,541 | ||
| Issued in reinvestment of distributions | 235,091 | 459,706 | ||
| Redeemed | (1,647,460) | (3,735,929) | ||
| Net increase (decrease) | 1,846,880 | 751,318 | ||
Insurance Portfolio |
Six months ended (Unaudited) August 31, 2024 | Years ended February 28, 2024 A | 2023 | 2022 | 2021 | 2020 A | |||||||
Selected Per-Share Data | ||||||||||||
| Net asset value, beginning of period | $ | 85.17 | $ | 75.40 | $ | 69.86 | $ | 61.17 | $ | 58.44 | $ | 59.27 |
| Income from Investment Operations | ||||||||||||
Net investment income (loss) B,C | .40 | .99 | .63 | .78 | .88 | .87 | ||||||
| Net realized and unrealized gain (loss) | 12.49 | 15.28 | 5.46 | 13.73 | 6.99 | 2.77 | ||||||
| Total from investment operations | 12.89 | 16.27 | 6.09 | 14.51 | 7.87 | 3.64 | ||||||
| Distributions from net investment income | (.07) | (.85) | (.55) | (.89) | (.94) | (.91) | ||||||
| Distributions from net realized gain | (2.65) | (5.66) | - | (4.93) | (4.20) | (3.56) | ||||||
| Total distributions | (2.72) | (6.50) D | (.55) | (5.82) | (5.14) | (4.47) | ||||||
| Net asset value, end of period | $ | 95.34 | $ | 85.17 | $ | 75.40 | $ | 69.86 | $ | 61.17 | $ | 58.44 |
Total Return E,F | 15.69 % | 23.26% | 8.75% | 24.68% | 15.54% | 5.95% | ||||||
Ratios to Average Net Assets C,G,H | ||||||||||||
| Expenses before reductions | .70% I | .80% | .81% | .78% | .83% | .81% | ||||||
| Expenses net of fee waivers, if any | .70 % I | .79% | .81% | .78% | .83% | .81% | ||||||
| Expenses net of all reductions | .70% I | .79% | .81% | .78% | .83% | .80% | ||||||
| Net investment income (loss) | .91% I | 1.32% | .90% | 1.16% | 1.68% | 1.37% | ||||||
| Supplemental Data | ||||||||||||
| Net assets, end of period (000 omitted) | $ | 847,602 | $ | 599,894 | $ | 474,461 | $ | 245,931 | $ | 184,701 | $ | 219,539 |
Portfolio turnover rate J | 46 % I | 80% | 48% | 15% | 18% | 28% |
| Fidelity Central Fund | Investment Manager | Investment Objective | Investment Practices | Expense RatioA |
| Fidelity Money Market Central Funds | Fidelity Management & Research Company LLC (FMR) | Each fund seeks to obtain a high level of current income consistent with the preservation of capital and liquidity. | Short-term Investments | Less than .005% |
| Brokerage and Investment Management Portfolio | $65,539 |
| Tax cost ($) | Gross unrealized appreciation ($) | Gross unrealized depreciation ($) | Net unrealized appreciation (depreciation)($) | |
| Banking Portfolio | 323,357,736 | 126,153,176 | (2,612,490) | 123,540,686 |
Brokerage and Investment Management Portfolio | 563,699,581 | 427,022,822 | (8,234,547) | 418,788,275 |
| Financials Portfolio | 594,854,916 | 228,473,988 | (8,123,552) | 220,350,436 |
| FinTech Portfolio | 69,676,561 | 37,558,940 | (7,084,447) | 30,474,493 |
| Insurance Portfolio | 585,830,669 | 260,050,948 | (1,580,750) | 258,470,198 |
| Short-term ($) | Long-term ($) | Total capital loss carryforward ($) | |
Brokerage and Investment Management Portfolio | (62,213,439) | (-) | (62,213,439) |
| FinTech Portfolio | (21,141,600) | (23,432,074) | (44,573,674) |
| Purchases ($) | Sales ($) | |
| Banking Portfolio | 58,440,249 | 78,888,490 |
| Brokerage and Investment Management Portfolio | 92,624,605 | 105,269,471 |
| Financials Portfolio | 113,370,356 | 123,286,349 |
| FinTech Portfolio | 15,793,412 | 28,289,603 |
| Insurance Portfolio | 291,207,345 | 160,308,848 |
| Maximum Management Fee Rate % | |
| Banking Portfolio | .69 |
| Brokerage and Investment Management Portfolio | .70 |
| Financials Portfolio | .69 |
| FinTech Portfolio | .72 |
| Insurance Portfolio | .72 |
| Total Management Fee Rate % | |
| Banking Portfolio | .67 |
| Brokerage and Investment Management Portfolio | .67 |
| Financials Portfolio | .67 |
| FinTech Portfolio | .67 |
| Insurance Portfolio | .67 |
| Amount ($) | |
| Banking Portfolio | 2,267 |
| Brokerage and Investment Management Portfolio | 2,075 |
| Financials Portfolio | 2,746 |
| FinTech Portfolio | 341 |
| Insurance Portfolio | 1,882 |
| Borrower or Lender | Average Loan Balance ($) | Weighted Average Interest Rate | Interest Expense ($) | |
| Banking Portfolio | Borrower | 6,202,800 | 5.58% | 6,293 |
Brokerage and Investment Management Portfolio | Borrower | 6,147,000 | 5.58% | 953 |
| Financials Portfolio | Borrower | 5,543,000 | 5.57% | 6,005 |
| Purchases ($) | Sales ($) | Realized Gain (Loss)($) | |
| Banking Portfolio | 2,720,713 | 8,395,044 | 1,980,134 |
| Brokerage and Investment Management Portfolio | 6,225,781 | 5,101,852 | 1,023,740 |
| Financials Portfolio | 4,250,972 | 6,343,954 | 866,607 |
| FinTech Portfolio | 710,803 | 597,613 | (8,129) |
| Insurance Portfolio | 9,254,323 | 11,505,113 | 4,812,579 |
| Amount ($) | |
| Banking Portfolio | 344 |
| Brokerage and Investment Management Portfolio | 737 |
| Financials Portfolio | 610 |
| FinTech Portfolio | 94 |
| Insurance Portfolio | 537 |
| Total Security Lending Fees Paid to NFS ($) | Security Lending Income From Securities Loaned to NFS ($) | Value of Securities Loaned to NFS at Period End ($) | |
| Banking Portfolio | 206 | - | - |
| Brokerage and Investment Management Portfolio | 1,593 | 1 | - |
| Financials Portfolio | 1,098 | 1 | - |
| FinTech Portfolio | 85 | - | - |
| Insurance Portfolio | 533 | - | - |
| Average Loan Balance ($) | Weighted Average Interest Rate | Interest Expense ($) | |
| Banking Portfolio | 43,000 | 5.83% | 132 |
| Financials Portfolio | 4,209,714 | 5.83% | 4,772 |
| Custodian credits ($) | |
| Insurance Portfolio | 356 |
| Amount ($) | |
| Banking Portfolio | 8,068 |
| Brokerage and Investment Management Portfolio | 16,637 |
| Financials Portfolio | 13,899 |
| FinTech Portfolio | 2,254 |
| Insurance Portfolio | 11,294 |
| A special meeting of shareholders was held on July 16, 2024. The results of votes taken among shareholders on the proposal before them are reported below. Each vote reported represents one dollar of net asset value held on the record date for the meeting. | ||
| Proposal 1 | ||
| To elect a Board of Trustees. | ||
# of Votes | % of Votes | |
| Bettina Doulton | ||
| Affirmative | 50,178,154,296.75 | 92.38 |
| Withheld | 4,136,551,415.53 | 7.62 |
| TOTAL | 54,314,705,712.27 | 100.00 |
| Robert A. Lawrence | ||
| Affirmative | 50,131,321,830.27 | 92.30 |
| Withheld | 4,183,383,882.00 | 7.70 |
| TOTAL | 54,314,705,712.27 | 100.00 |
| Vijay C. Advani | ||
| Affirmative | 50,021,870,319.77 | 92.10 |
| Withheld | 4,292,835,392.50 | 7.90 |
| TOTAL | 54,314,705,712.27 | 100.00 |
| Thomas P. Bostick | ||
| Affirmative | 50,057,248,681.17 | 92.16 |
| Withheld | 4,257,457,031.10 | 7.84 |
| TOTAL | 54,314,705,712.27 | 100.00 |
| Donald F. Donahue | ||
| Affirmative | 49,998,023,290.27 | 92.05 |
| Withheld | 4,316,682,422.00 | 7.95 |
| TOTAL | 54,314,705,712.27 | 100.00 |
| Vicki L. Fuller | ||
| Affirmative | 50,146,578,363.15 | 92.33 |
| Withheld | 4,168,127,349.12 | 7.67 |
| TOTAL | 54,314,705,712.27 | 100.00 |
| Patricia L. Kampling | ||
| Affirmative | 50,227,895,949.71 | 92.48 |
| Withheld | 4,086,809,762.56 | 7.52 |
| TOTAL | 54,314,705,712.27 | 100.00 |
| Thomas A. Kennedy | ||
| Affirmative | 50,080,160,698.34 | 92.20 |
| Withheld | 4,234,545,013.93 | 7.80 |
| TOTAL | 54,314,705,712.27 | 100.00 |
| Oscar Munoz | ||
| Affirmative | 49,879,616,445.58 | 91.83 |
| Withheld | 4,435,089,266.69 | 8.17 |
| TOTAL | 54,314,705,712.27 | 100.00 |
| Karen B. Peetz | ||
| Affirmative | 50,078,105,799.58 | 92.20 |
| Withheld | 4,236,599,912.69 | 7.80 |
| TOTAL | 54,314,705,712.27 | 100.00 |
| David M. Thomas | ||
| Affirmative | 50,013,939,190.36 | 92.08 |
| Withheld | 4,300,766,521.91 | 7.92 |
| TOTAL | 54,314,705,712.27 | 100.00 |
| Susan Tomasky | ||
| Affirmative | 50,109,134,188.50 | 92.26 |
| Withheld | 4,205,571,523.77 | 7.74 |
| TOTAL | 54,314,705,712.27 | 100.00 |
| Michael E. Wiley | ||
| Affirmative | 50,016,526,096.47 | 92.09 |
| Withheld | 4,298,179,615.80 | 7.91 |
| TOTAL | 54,314,705,712.27 | 100.00 |
| Proposal 1 reflects trust-wide proposal and voting results. | ||
 |


Contents
| Common Stocks - 99.8% | |||
| Shares | Value ($) | ||
| Broadline Retail - 1.8% | |||
| Broadline Retail - 1.8% | |||
| Amazon.com, Inc. (a) | 167,500 | 29,898,750 | |
| Financial Services - 59.5% | |||
| Transaction & Payment Processing Services - 59.5% | |||
| Block, Inc. Class A (a) | 876,200 | 57,899,296 | |
| Corpay, Inc. (a) | 170,200 | 53,706,610 | |
| Fidelity National Information Services, Inc. | 757,000 | 62,414,650 | |
| Fiserv, Inc. (a) | 480,717 | 83,933,188 | |
| Flywire Corp. (a) | 20,681 | 374,533 | |
| MasterCard, Inc. Class A | 720,000 | 348,004,800 | |
| Paymentus Holdings, Inc. Class A (a) | 226,900 | 5,157,437 | |
| PayPal Holdings, Inc. (a) | 465,440 | 33,711,819 | |
| The Western Union Co. | 4,800 | 58,560 | |
| Visa, Inc. Class A (b) | 1,327,048 | 366,756,256 | |
| 1,012,017,149 | |||
| Interactive Media & Services - 1.6% | |||
| Interactive Media & Services - 1.6% | |||
| Meta Platforms, Inc. Class A | 53,800 | 28,046,478 | |
| IT Services - 23.9% | |||
| Internet Services & Infrastructure - 3.0% | |||
| Cloudflare, Inc. Class A (a) | 43,500 | 3,573,090 | |
| GoDaddy, Inc. Class A (a) | 162,000 | 27,120,420 | |
| MongoDB, Inc. Class A (a) | 23,700 | 6,891,723 | |
| Okta, Inc. Class A (a) | 37,500 | 2,952,375 | |
| Snowflake, Inc. Class A (a) | 99,800 | 11,400,154 | |
| 51,937,762 | |||
| IT Consulting & Other Services - 20.9% | |||
| Accenture PLC Class A | 368,480 | 126,001,736 | |
| Amdocs Ltd. | 280,700 | 24,412,479 | |
| Cognizant Technology Solutions Corp. Class A | 131,800 | 10,250,086 | |
| EPAM Systems, Inc. (a) | 86,500 | 17,365,740 | |
| Gartner, Inc. (a) | 124,000 | 61,003,040 | |
| Globant SA (a)(b) | 104,500 | 21,134,080 | |
| IBM Corp. | 317,000 | 64,075,210 | |
| Kyndryl Holdings, Inc. (a) | 1,299,800 | 30,792,262 | |
| 355,034,633 | |||
TOTAL IT SERVICES | 406,972,395 | ||
| Professional Services - 8.2% | |||
| Data Processing & Outsourced Services - 4.4% | |||
| ExlService Holdings, Inc. (a) | 810,793 | 29,626,376 | |
| Genpact Ltd. | 695,341 | 27,278,227 | |
| Maximus, Inc. | 206,412 | 19,043,571 | |
| 75,948,174 | |||
| Human Resource & Employment Services - 3.8% | |||
| Automatic Data Processing, Inc. | 227,475 | 62,762,627 | |
| Robert Half, Inc. (b) | 25,700 | 1,610,619 | |
| 64,373,246 | |||
TOTAL PROFESSIONAL SERVICES | 140,321,420 | ||
| Software - 4.8% | |||
| Application Software - 3.3% | |||
| Intuit, Inc. | 38,356 | 24,174,253 | |
| SAP SE sponsored ADR (b) | 144,500 | 31,748,095 | |
| 55,922,348 | |||
| Systems Software - 1.5% | |||
| Microsoft Corp. | 62,400 | 26,029,536 | |
TOTAL SOFTWARE | 81,951,884 | ||
| TOTAL COMMON STOCKS (Cost $822,111,239) | 1,699,208,076 | ||
| Money Market Funds - 1.6% | |||
| Shares | Value ($) | ||
Fidelity Securities Lending Cash Central Fund 5.39% (c)(d) (Cost $27,646,115) | 27,643,350 | 27,646,115 | |
| TOTAL INVESTMENT IN SECURITIES - 101.4% (Cost $849,757,354) | 1,726,854,191 |
NET OTHER ASSETS (LIABILITIES) - (1.4)% | (24,652,590) |
| NET ASSETS - 100.0% | 1,702,201,601 |
| (a) | Non-income producing |
| (b) | Security or a portion of the security is on loan at period end. |
| (c) | Affiliated fund that is generally available only to investment companies and other accounts managed by Fidelity Investments. The rate quoted is the annualized seven-day yield of the fund at period end. A complete unaudited listing of the fund's holdings as of its most recent quarter end is available upon request. In addition, each Fidelity Central Fund's financial statements are available on the SEC's website or upon request. |
| (d) | Investment made with cash collateral received from securities on loan. |
| Affiliate | Value, beginning of period ($) | Purchases ($) | Sales Proceeds ($) | Dividend Income ($) | Realized Gain (loss) ($) | Change in Unrealized appreciation (depreciation) ($) | Value, end of period ($) | % ownership, end of period |
| Fidelity Cash Central Fund 5.39% | 2,207,948 | 178,766,140 | 180,974,326 | 101,361 | 238 | - | - | 0.0% |
| Fidelity Securities Lending Cash Central Fund 5.39% | 447,422,090 | 301,984,958 | 721,760,933 | 94,101 | - | - | 27,646,115 | 0.1% |
| Total | 449,630,038 | 480,751,098 | 902,735,259 | 195,462 | 238 | - | 27,646,115 | |
| Valuation Inputs at Reporting Date: | ||||
| Description | Total ($) | Level 1 ($) | Level 2 ($) | Level 3 ($) |
Investments in Securities: | ||||
| Common Stocks | 1,699,208,076 | 1,699,208,076 | - | - |
| Money Market Funds | 27,646,115 | 27,646,115 | - | - |
| Total Investments in Securities: | 1,726,854,191 | 1,726,854,191 | - | - |
| Statement of Assets and Liabilities | ||||
| As of August 31, 2024 (Unaudited) | ||||
| Assets | ||||
| Investment in securities, at value (including securities loaned of $27,278,211) - See accompanying schedule: | ||||
Unaffiliated issuers (cost $822,111,239) | $ | 1,699,208,076 | ||
Fidelity Central Funds (cost $27,646,115) | 27,646,115 | |||
| Total Investment in Securities (cost $849,757,354) | $ | 1,726,854,191 | ||
| Receivable for investments sold | 5,069,864 | |||
| Receivable for fund shares sold | 58,340 | |||
| Dividends receivable | 1,472,500 | |||
| Distributions receivable from Fidelity Central Funds | 26,407 | |||
| Prepaid expenses | 3,916 | |||
| Other receivables | 14,926 | |||
Total assets | 1,733,500,144 | |||
| Liabilities | ||||
| Payable to custodian bank | $ | 1,369,760 | ||
| Payable for fund shares redeemed | 1,347,547 | |||
| Accrued management fee | 890,533 | |||
| Other payables and accrued expenses | 60,678 | |||
| Collateral on securities loaned | 27,630,025 | |||
| Total liabilities | 31,298,543 | |||
| Net Assets | $ | 1,702,201,601 | ||
| Net Assets consist of: | ||||
| Paid in capital | $ | 639,286,816 | ||
| Total accumulated earnings (loss) | 1,062,914,785 | |||
| Net Assets | $ | 1,702,201,601 | ||
Net Asset Value, offering price and redemption price per share ($1,702,201,601 ÷ 27,947,129 shares) | $ | 60.91 | ||
| Statement of Operations | ||||
Six months ended August 31, 2024 (Unaudited) | ||||
| Investment Income | ||||
| Dividends | $ | 6,360,877 | ||
| Income from Fidelity Central Funds (including $94,101 from security lending) | 195,462 | |||
| Total income | 6,556,339 | |||
| Expenses | ||||
| Management fee | $ | 5,806,143 | ||
| Custodian fees and expenses | 22,333 | |||
| Independent trustees' fees and expenses | 3,999 | |||
| Registration fees | 18,495 | |||
| Audit fees | 24,542 | |||
| Legal | 464 | |||
| Interest | 32,524 | |||
| Miscellaneous | 40,031 | |||
| Total expenses before reductions | 5,948,531 | |||
| Expense reductions | (42,136) | |||
| Total expenses after reductions | 5,906,395 | |||
| Net Investment income (loss) | 649,944 | |||
| Realized and Unrealized Gain (Loss) | ||||
| Net realized gain (loss) on: | ||||
| Investment Securities: | ||||
| Unaffiliated issuers | 186,237,095 | |||
| Fidelity Central Funds | 238 | |||
| Foreign currency transactions | (2,868) | |||
| Total net realized gain (loss) | 186,234,465 | |||
| Change in net unrealized appreciation (depreciation) on: | ||||
| Investment Securities: | ||||
| Unaffiliated issuers | (265,724,221) | |||
| Assets and liabilities in foreign currencies | (170) | |||
| Total change in net unrealized appreciation (depreciation) | (265,724,391) | |||
| Net gain (loss) | (79,489,926) | |||
| Net increase (decrease) in net assets resulting from operations | $ | (78,839,982) | ||
| Statement of Changes in Net Assets | ||||
Six months ended August 31, 2024 (Unaudited) | Year ended February 29, 2024 | |||
| Increase (Decrease) in Net Assets | ||||
| Operations | ||||
| Net investment income (loss) | $ | 649,944 | $ | 167,692 |
| Net realized gain (loss) | 186,234,465 | 210,708,471 | ||
| Change in net unrealized appreciation (depreciation) | (265,724,391) | 247,638,699 | ||
| Net increase (decrease) in net assets resulting from operations | (78,839,982) | 458,514,862 | ||
| Distributions to shareholders | (113,002,039) | (74,933,727) | ||
| Share transactions | ||||
| Proceeds from sales of shares | 21,231,929 | 55,557,176 | ||
| Reinvestment of distributions | 105,691,558 | 69,939,298 | ||
| Cost of shares redeemed | (304,176,274) | (524,249,094) | ||
Net increase (decrease) in net assets resulting from share transactions | (177,252,787) | (398,752,620) | ||
| Total increase (decrease) in net assets | (369,094,808) | (15,171,485) | ||
| Net Assets | ||||
| Beginning of period | 2,071,296,409 | 2,086,467,894 | ||
| End of period | $ | 1,702,201,601 | $ | 2,071,296,409 |
| Other Information | ||||
| Shares | ||||
| Sold | 354,376 | 936,909 | ||
| Issued in reinvestment of distributions | 1,777,525 | 1,127,919 | ||
| Redeemed | (5,165,439) | (8,907,818) | ||
| Net increase (decrease) | (3,033,538) | (6,842,990) | ||
Enterprise Technology Services Portfolio |
Six months ended (Unaudited) August 31, 2024 | Years ended February 28, 2024 A | 2023 | 2022 | 2021 | 2020 A | |||||||
Selected Per-Share Data | ||||||||||||
| Net asset value, beginning of period | $ | 66.86 | $ | 55.16 | $ | 70.27 | $ | 93.94 | $ | 73.62 | $ | 64.96 |
| Income from Investment Operations | ||||||||||||
Net investment income (loss) B,C | .02 | - D | .02 | (.27) | (.09) | .03 | ||||||
| Net realized and unrealized gain (loss) | (2.22) | 14.08 | (7.56) | (10.44) | 25.34 | 10.36 | ||||||
| Total from investment operations | (2.20) | 14.08 | (7.54) | (10.71) | 25.25 | 10.39 | ||||||
| Distributions from net investment income | - D | - D | (.01) | - | (.01) | (.03) | ||||||
| Distributions from net realized gain | (3.75) | (2.37) | (7.55) | (12.96) | (4.93) | (1.70) | ||||||
| Total distributions | (3.75) | (2.38) E | (7.57) E | (12.96) | (4.93) E | (1.73) | ||||||
| Net asset value, end of period | $ | 60.91 | $ | 66.86 | $ | 55.16 | $ | 70.27 | $ | 93.94 | $ | 73.62 |
Total Return F,G | (3.15) % | 25.85% | (11.88)% | (13.31)% | 34.67% | 15.99% | ||||||
Ratios to Average Net Assets C,H,I | ||||||||||||
| Expenses before reductions | .67% J,K | .73% | .73% | .70% | .72% | .73% | ||||||
| Expenses net of fee waivers, if any | .66 % J,K | .72% | .73% | .70% | .72% | .73% | ||||||
| Expenses net of all reductions | .66% J,K | .72% | .73% | .70% | .72% | .73% | ||||||
| Net investment income (loss) | .07% J,K | .01% | .03% | (.29)% | (.11)% | .04% | ||||||
| Supplemental Data | ||||||||||||
| Net assets, end of period (000 omitted) | $ | 1,702,202 | $ | 2,071,296 | $ | 2,086,468 | $ | 2,873,839 | $ | 4,135,311 | $ | 4,099,114 |
Portfolio turnover rate L | 65 % J | 35% | 43% | 41% | 31% | 24% |
| Common Stocks - 96.9% | |||
| Shares | Value ($) | ||
| Electronic Equipment, Instruments & Components - 0.0% | |||
| Electronic Equipment & Instruments - 0.0% | |||
| Aeva Technologies, Inc. (a)(b) | 219,560 | 724,548 | |
| Semiconductors & Semiconductor Equipment - 94.2% | |||
| Semiconductor Materials & Equipment - 13.6% | |||
| ASML Holding NV (depository receipt) | 1,072,462 | 969,366,228 | |
| Lam Research Corp. | 1,003,923 | 824,230,822 | |
| Nova Ltd. (a)(b) | 1,394,252 | 311,685,035 | |
| Teradyne, Inc. | 4,220,622 | 577,085,646 | |
| 2,682,367,731 | |||
| Semiconductors - 80.6% | |||
| Advanced Micro Devices, Inc. (a) | 5,152,972 | 765,525,520 | |
| Allegro MicroSystems LLC (a)(b) | 7,898,842 | 193,758,594 | |
| Alpha & Omega Semiconductor Ltd. (a) | 513,296 | 21,460,906 | |
| Astera Labs, Inc. (b) | 7,093,743 | 305,456,574 | |
| Broadcom, Inc. | 5,977,470 | 973,251,665 | |
| GlobalFoundries, Inc. (a)(b) | 20,369,680 | 950,856,662 | |
| Impinj, Inc. (a)(c) | 1,959,592 | 329,407,415 | |
| Lattice Semiconductor Corp. (a) | 1,124,882 | 53,274,412 | |
| MACOM Technology Solutions Holdings, Inc. (a) | 2,378,064 | 259,755,931 | |
| Marvell Technology, Inc. | 12,830,969 | 978,233,077 | |
| Micron Technology, Inc. | 10,001,986 | 962,591,133 | |
| Monolithic Power Systems, Inc. | 905,573 | 846,420,972 | |
| NVIDIA Corp. | 40,965,580 | 4,890,061,281 | |
| NXP Semiconductors NV | 4,849,714 | 1,243,272,681 | |
| ON Semiconductor Corp. (a) | 18,168,593 | 1,414,788,337 | |
| Silicon Motion Tech Corp. sponsored ADR | 1,220,400 | 77,580,828 | |
| Synaptics, Inc. (a) | 1,259,328 | 102,534,486 | |
| Taiwan Semiconductor Manufacturing Co. Ltd. sponsored ADR | 8,796,137 | 1,510,296,723 | |
| Wolfspeed, Inc. (a)(b) | 418,400 | 4,079,400 | |
| 15,882,606,597 | |||
TOTAL SEMICONDUCTORS & SEMICONDUCTOR EQUIPMENT | 18,564,974,328 | ||
| Technology Hardware, Storage & Peripherals - 2.7% | |||
| Technology Hardware, Storage & Peripherals - 2.7% | |||
| Western Digital Corp. (a) | 8,354,643 | 547,981,034 | |
| TOTAL COMMON STOCKS (Cost $10,524,811,533) | 19,113,679,910 | ||
| Convertible Preferred Stocks - 0.3% | |||
| Shares | Value ($) | ||
| Electronic Equipment, Instruments & Components - 0.1% | |||
| Electronic Components - 0.1% | |||
| Frore Systems, Inc. Series C (d)(e) | 1,078,255 | 17,500,079 | |
| Menlo Micro, Inc. Series C (a)(d)(e) | 739,500 | 517,650 | |
| 18,017,729 | |||
| Financial Services - 0.0% | |||
| Diversified Financial Services - 0.0% | |||
| Akeana Series C (d)(e) | 85,500 | 1,102,095 | |
| Tenstorrent Holdings, Inc.: | |||
| Series C1 (d)(e) | 17,041 | 1,266,317 | |
| Series D1 (d)(e) | 32,400 | 2,556,360 | |
| Series D2 (d)(e) | 8,522 | 647,928 | |
| 5,572,700 | |||
| Metals & Mining - 0.0% | |||
| Precious Metals & Minerals - 0.0% | |||
| Diamond Foundry, Inc. Series C (a)(d)(e) | 189,999 | 5,243,972 | |
| Semiconductors & Semiconductor Equipment - 0.1% | |||
| Semiconductor Materials & Equipment - 0.0% | |||
| Sima Technologies, Inc.: | |||
| Series B (a)(d)(e) | 309,900 | 2,020,548 | |
| Series B1 (a)(d)(e) | 163,147 | 1,235,023 | |
| 3,255,571 | |||
| Semiconductors - 0.1% | |||
| Alif Semiconductor Series C (a)(d)(e) | 444,283 | 8,285,878 | |
| Retym, Inc. Series C (a)(d)(e) | 458,946 | 3,969,883 | |
| 12,255,761 | |||
TOTAL SEMICONDUCTORS & SEMICONDUCTOR EQUIPMENT | 15,511,332 | ||
| Software - 0.0% | |||
| Application Software - 0.0% | |||
| Lyte AI, Inc. Series B (d)(e) | 246,000 | 3,120,781 | |
| Technology Hardware, Storage & Peripherals - 0.1% | |||
| Technology Hardware, Storage & Peripherals - 0.1% | |||
| Lightmatter, Inc.: | |||
| Series C (a)(d)(e) | 271,273 | 6,825,229 | |
| Series C2 (d)(e) | 42,610 | 1,247,621 | |
| 8,072,850 | |||
| TOTAL CONVERTIBLE PREFERRED STOCKS (Cost $52,202,463) | 55,539,364 | ||
| Preferred Securities - 0.0% | |||
Principal Amount (f) | Value ($) | ||
| Semiconductors & Semiconductor Equipment - 0.0% | |||
| Semiconductor Materials & Equipment - 0.0% | |||
Sima Technologies, Inc. 10% 12/31/27 (d)(e) (Cost $440,003) | 440,003 | 450,368 | |
| Money Market Funds - 2.0% | |||
| Shares | Value ($) | ||
| Fidelity Cash Central Fund 5.39% (g) | 10,109,418 | 10,111,440 | |
| Fidelity Securities Lending Cash Central Fund 5.39% (g)(h) | 378,603,250 | 378,641,110 | |
| TOTAL MONEY MARKET FUNDS (Cost $388,752,550) | 388,752,550 | ||
| TOTAL INVESTMENT IN SECURITIES - 99.2% (Cost $10,966,206,549) | 19,558,422,192 |
NET OTHER ASSETS (LIABILITIES) - 0.8% | 153,011,834 |
| NET ASSETS - 100.0% | 19,711,434,026 |
| (a) | Non-income producing |
| (b) | Security or a portion of the security is on loan at period end. |
| (c) | Affiliated company |
| (d) | Restricted securities (including private placements) - Investment in securities not registered under the Securities Act of 1933 (excluding 144A issues). At the end of the period, the value of restricted securities (excluding 144A issues) amounted to $55,989,732 or 0.3% of net assets. |
| (e) | Level 3 security |
| (f) | Amount is stated in United States dollars unless otherwise noted. |
| (g) | Affiliated fund that is generally available only to investment companies and other accounts managed by Fidelity Investments. The rate quoted is the annualized seven-day yield of the fund at period end. A complete unaudited listing of the fund's holdings as of its most recent quarter end is available upon request. In addition, each Fidelity Central Fund's financial statements are available on the SEC's website or upon request. |
| (h) | Investment made with cash collateral received from securities on loan. |
| Additional information on each restricted holding is as follows: | ||
| Security | Acquisition Date | Acquisition Cost ($) |
| Akeana Series C | 1/23/24 | 1,091,048 |
| Alif Semiconductor Series C | 3/08/22 | 9,018,296 |
| Diamond Foundry, Inc. Series C | 3/15/21 | 4,559,976 |
| Frore Systems, Inc. Series C | 5/10/24 | 17,327,989 |
| Lightmatter, Inc. Series C | 5/19/23 | 4,464,286 |
| Lightmatter, Inc. Series C2 | 12/18/23 | 1,107,937 |
| Lyte AI, Inc. Series B | 8/13/24 | 3,120,781 |
| Menlo Micro, Inc. Series C | 2/09/22 | 980,207 |
| Retym, Inc. Series C | 5/17/23 - 6/20/23 | 3,571,426 |
| Sima Technologies, Inc. Series B | 5/10/21 | 1,588,981 |
| Sima Technologies, Inc. Series B1 | 4/25/22 - 10/17/22 | 1,156,859 |
| Sima Technologies, Inc. 10% 12/31/27 | 4/08/24 - 7/05/24 | 440,003 |
| Tenstorrent Holdings, Inc. Series C1 | 4/23/21 | 1,013,198 |
| Tenstorrent Holdings, Inc. Series D1 | 7/16/24 | 2,553,977 |
| Tenstorrent Holdings, Inc. Series D2 | 7/17/24 | 647,501 |
| Affiliate | Value, beginning of period ($) | Purchases ($) | Sales Proceeds ($) | Dividend Income ($) | Realized Gain (loss) ($) | Change in Unrealized appreciation (depreciation) ($) | Value, end of period ($) | % ownership, end of period |
| Fidelity Cash Central Fund 5.39% | 920,435,879 | 2,628,066,466 | 3,538,409,580 | 10,209,111 | 18,675 | - | 10,111,440 | 0.0% |
| Fidelity Securities Lending Cash Central Fund 5.39% | 342,913,600 | 2,396,739,357 | 2,361,011,847 | 2,944,434 | - | - | 378,641,110 | 1.6% |
| Total | 1,263,349,479 | 5,024,805,823 | 5,899,421,427 | 13,153,545 | 18,675 | - | 388,752,550 | |
| Affiliate | Value, beginning of period ($) | Purchases ($) | Sales Proceeds ($) | Dividend Income ($) | Realized Gain (loss) ($) | Change in Unrealized appreciation (depreciation) ($) | Value, end of period ($) |
| Impinj, Inc. | 206,118,673 | 9,350,786 | - | - | - | 113,937,956 | 329,407,415 |
| Total | 206,118,673 | 9,350,786 | - | - | - | 113,937,956 | 329,407,415 |
| Valuation Inputs at Reporting Date: | ||||
| Description | Total ($) | Level 1 ($) | Level 2 ($) | Level 3 ($) |
Investments in Securities: | ||||
| Common Stocks | 19,113,679,910 | 19,113,679,910 | - | - |
| Convertible Preferred Stocks | 55,539,364 | - | - | 55,539,364 |
| Preferred Securities | 450,368 | - | - | 450,368 |
| Money Market Funds | 388,752,550 | 388,752,550 | - | - |
| Total Investments in Securities: | 19,558,422,192 | 19,502,432,460 | - | 55,989,732 |
| Statement of Assets and Liabilities | ||||
| As of August 31, 2024 (Unaudited) | ||||
| Assets | ||||
| Investment in securities, at value (including securities loaned of $361,502,457) - See accompanying schedule: | ||||
Unaffiliated issuers (cost $10,382,649,116) | $ | 18,840,262,227 | ||
Fidelity Central Funds (cost $388,752,550) | 388,752,550 | |||
Other affiliated issuers (cost $194,804,883) | 329,407,415 | |||
| Total Investment in Securities (cost $10,966,206,549) | $ | 19,558,422,192 | ||
| Cash | 167 | |||
| Receivable for investments sold | 550,599,371 | |||
| Receivable for fund shares sold | 13,137,122 | |||
| Dividends receivable | 5,633 | |||
| Distributions receivable from Fidelity Central Funds | 1,221,374 | |||
| Prepaid expenses | 32,809 | |||
| Other receivables | 246,308 | |||
Total assets | 20,123,664,976 | |||
| Liabilities | ||||
| Payable for investments purchased | $ | 9,858,309 | ||
| Payable for fund shares redeemed | 13,615,538 | |||
| Accrued management fee | 9,650,683 | |||
| Other payables and accrued expenses | 465,310 | |||
| Collateral on securities loaned | 378,641,110 | |||
| Total liabilities | 412,230,950 | |||
| Net Assets | $ | 19,711,434,026 | ||
| Net Assets consist of: | ||||
| Paid in capital | $ | 10,392,101,829 | ||
| Total accumulated earnings (loss) | 9,319,332,197 | |||
| Net Assets | $ | 19,711,434,026 | ||
Net Asset Value, offering price and redemption price per share ($19,711,434,026 ÷ 589,671,019 shares) | $ | 33.43 | ||
| Statement of Operations | ||||
Six months ended August 31, 2024 (Unaudited) | ||||
| Investment Income | ||||
| Dividends | $ | 35,613,099 | ||
| Income from Fidelity Central Funds (including $2,944,434 from security lending) | 13,153,545 | |||
| Total income | 48,766,644 | |||
| Expenses | ||||
| Management fee | $ | 57,568,284 | ||
| Custodian fees and expenses | 39,130 | |||
| Independent trustees' fees and expenses | 35,995 | |||
| Registration fees | 351,113 | |||
| Audit fees | 28,817 | |||
| Legal | 5,631 | |||
| Interest | 46,222 | |||
| Miscellaneous | 213,468 | |||
| Total expenses before reductions | 58,288,660 | |||
| Expense reductions | (301,154) | |||
| Total expenses after reductions | 57,987,506 | |||
| Net Investment income (loss) | (9,220,862) | |||
| Realized and Unrealized Gain (Loss) | ||||
| Net realized gain (loss) on: | ||||
| Investment Securities: | ||||
| Unaffiliated issuers | 793,659,731 | |||
| Fidelity Central Funds | 18,675 | |||
| Foreign currency transactions | (277) | |||
| Total net realized gain (loss) | 793,678,129 | |||
| Change in net unrealized appreciation (depreciation) on: | ||||
| Investment Securities: | ||||
| Unaffiliated issuers | 1,324,602,791 | |||
| Affiliated issuers | 113,937,956 | |||
| Assets and liabilities in foreign currencies | 413 | |||
| Total change in net unrealized appreciation (depreciation) | 1,438,541,160 | |||
| Net gain (loss) | 2,232,219,289 | |||
| Net increase (decrease) in net assets resulting from operations | $ | 2,222,998,427 | ||
| Statement of Changes in Net Assets | ||||
Six months ended August 31, 2024 (Unaudited) | Year ended February 29, 2024 | |||
| Increase (Decrease) in Net Assets | ||||
| Operations | ||||
| Net investment income (loss) | $ | (9,220,862) | $ | 4,632,908 |
| Net realized gain (loss) | 793,678,129 | 1,588,066,751 | ||
| Change in net unrealized appreciation (depreciation) | 1,438,541,160 | 4,298,071,324 | ||
| Net increase (decrease) in net assets resulting from operations | 2,222,998,427 | 5,890,770,983 | ||
| Distributions to shareholders | - | (818,861,039) | ||
| Share transactions | ||||
| Proceeds from sales of shares | 4,067,991,542 | 5,210,253,621 | ||
| Reinvestment of distributions | - | 757,212,266 | ||
| Cost of shares redeemed | (2,305,772,848) | (3,077,611,474) | ||
Net increase (decrease) in net assets resulting from share transactions | 1,762,218,694 | 2,889,854,413 | ||
| Total increase (decrease) in net assets | 3,985,217,121 | 7,961,764,357 | ||
| Net Assets | ||||
| Beginning of period | 15,726,216,905 | 7,764,452,548 | ||
| End of period | $ | 19,711,434,026 | $ | 15,726,216,905 |
| Other Information | ||||
| Shares | ||||
| Sold | 124,766,314 | 214,100,253 | ||
| Issued in reinvestment of distributions | - | 31,650,582 | ||
| Redeemed | (71,884,438) | (127,112,760) | ||
| Net increase (decrease) | 52,881,876 | 118,638,075 | ||
Semiconductors Portfolio |
Six months ended (Unaudited) August 31, 2024 | Years ended February 28, 2024 A | 2023 | 2022 | 2021 | 2020 A | |||||||
Selected Per-Share Data | ||||||||||||
| Net asset value, beginning of period | $ | 29.30 | $ | 18.57 | $ | 20.23 | $ | 17.59 | $ | 11.47 | $ | 9.41 |
| Income from Investment Operations | ||||||||||||
Net investment income (loss) B,C | (.02) | .01 | .03 | .01 | .07 | .09 | ||||||
| Net realized and unrealized gain (loss) | 4.15 | 12.47 | (.71) | 4.30 | 7.37 | 2.39 | ||||||
| Total from investment operations | 4.13 | 12.48 | (.68) | 4.31 | 7.44 | 2.48 | ||||||
| Distributions from net investment income | - | (.02) | (.03) | (.01) | (.08) | (.10) | ||||||
| Distributions from net realized gain | - | (1.72) | (.95) | (1.66) | (1.24) | (.33) | ||||||
| Total distributions | - | (1.75) D | (.98) | (1.67) | (1.32) | (.42) D | ||||||
| Net asset value, end of period | $ | 33.43 | $ | 29.30 | $ | 18.57 | $ | 20.23 | $ | 17.59 | $ | 11.47 |
Total Return E,F | 14.10 % | 69.34% | (2.91)% | 24.57% | 70.47% | 26.01% | ||||||
Ratios to Average Net Assets C,G,H | ||||||||||||
| Expenses before reductions | .63% I | .68% | .69% | .68% | .70% | .72% | ||||||
| Expenses net of fee waivers, if any | .63 % I | .67% | .69% | .67% | .70% | .72% | ||||||
| Expenses net of all reductions | .63% I | .67% | .69% | .67% | .69% | .71% | ||||||
| Net investment income (loss) | (.10)% I | .04% | .17% | .03% | .53% | .85% | ||||||
| Supplemental Data | ||||||||||||
| Net assets, end of period (000 omitted) | $ | 19,711,434 | $ | 15,726,217 | $ | 7,764,453 | $ | 8,426,923 | $ | 5,717,786 | $ | 3,778,557 |
Portfolio turnover rate J | 42 % I | 32% K | 35% | 33% | 87% | 114% |
| Common Stocks - 97.3% | |||
| Shares | Value ($) | ||
| Financial Services - 5.3% | |||
| Transaction & Payment Processing Services - 5.3% | |||
| Adyen BV (a)(b) | 22,500 | 33,205,585 | |
| Block, Inc. Class A (a) | 2,117,227 | 139,906,360 | |
| MasterCard, Inc. Class A | 286,400 | 138,428,576 | |
| Toast, Inc. (a) | 4,103,296 | 102,007,939 | |
| Visa, Inc. Class A | 472,320 | 130,535,078 | |
| 544,083,538 | |||
| Interactive Media & Services - 3.6% | |||
| Interactive Media & Services - 3.6% | |||
| Alphabet, Inc. Class A | 1,423,000 | 232,489,740 | |
| Meta Platforms, Inc. Class A | 136,300 | 71,054,553 | |
| Zoominfo Technologies, Inc. (a) | 6,970,900 | 68,942,201 | |
| 372,486,494 | |||
| IT Services - 15.5% | |||
| Internet Services & Infrastructure - 8.3% | |||
| Cloudflare, Inc. Class A (a) | 1,743,349 | 143,198,687 | |
| MongoDB, Inc. Class A (a) | 653,600 | 190,060,344 | |
| Okta, Inc. Class A (a) | 1,861,691 | 146,570,932 | |
| Shopify, Inc. Class A (a) | 760,700 | 56,345,049 | |
| Snowflake, Inc. Class A (a) | 1,191,000 | 136,047,930 | |
| Twilio, Inc. Class A (a) | 2,901,229 | 182,081,132 | |
| 854,304,074 | |||
| IT Consulting & Other Services - 7.2% | |||
| Accenture PLC Class A | 801,600 | 274,107,120 | |
| Capgemini SA | 723,900 | 149,965,771 | |
| Cognizant Technology Solutions Corp. Class A | 2,332,700 | 181,414,079 | |
| EPAM Systems, Inc. (a) | 721,325 | 144,813,207 | |
| 750,300,177 | |||
TOTAL IT SERVICES | 1,604,604,251 | ||
| Professional Services - 1.1% | |||
| Data Processing & Outsourced Services - 0.2% | |||
| ExlService Holdings, Inc. (a) | 509,341 | 18,611,320 | |
| Human Resource & Employment Services - 0.9% | |||
| Dayforce, Inc. (a)(c) | 870,742 | 49,780,320 | |
| Paycom Software, Inc. | 304,400 | 49,550,232 | |
| 99,330,552 | |||
TOTAL PROFESSIONAL SERVICES | 117,941,872 | ||
| Software - 71.8% | |||
| Application Software - 38.5% | |||
| Adobe, Inc. (a) | 1,435,700 | 824,680,437 | |
| Amplitude, Inc. Class A, (a) | 8,054,550 | 70,960,586 | |
| Atlassian Corp. PLC Class A, (a) | 1,324,550 | 219,345,480 | |
| Autodesk, Inc. (a) | 1,229,600 | 317,728,640 | |
| Bill Holdings, Inc. (a) | 1,966,100 | 107,270,416 | |
| BlackLine, Inc. (a) | 2,542,900 | 126,000,695 | |
| Confluent, Inc. Class A (a) | 5,075,985 | 107,712,402 | |
| Constellation Software, Inc. warrants 3/31/40 (a)(d) | 25,200 | 2 | |
| Datadog, Inc. Class A (a) | 1,251,432 | 145,491,484 | |
| Dynatrace, Inc. (a) | 841,807 | 42,612,270 | |
| Elastic NV (a) | 1,175,034 | 89,525,840 | |
| Five9, Inc. (a) | 3,301,455 | 106,471,924 | |
| HubSpot, Inc. (a) | 385,600 | 192,441,392 | |
| Intuit, Inc. | 308,958 | 194,723,869 | |
| PTC, Inc. (a) | 417,489 | 74,768,105 | |
| RingCentral, Inc. Class A (a) | 1,155,534 | 38,513,948 | |
| Salesforce, Inc. | 2,993,084 | 756,950,944 | |
| Unity Software, Inc. (a)(c) | 5,256,585 | 86,050,296 | |
| Workday, Inc. Class A (a) | 1,146,300 | 301,694,697 | |
| Workiva, Inc. Class A (a) | 1,846,842 | 144,367,639 | |
| Zoom Video Communications, Inc. Class A (a) | 515,600 | 35,617,648 | |
| 3,982,928,714 | |||
| Systems Software - 33.3% | |||
| Crowdstrike Holdings, Inc. Class A (a) | 245,186 | 67,985,174 | |
| Gen Digital, Inc. | 4,074,018 | 107,798,516 | |
| Microsoft Corp. | 6,181,002 | 2,578,343,176 | |
| Oracle Corp. | 1,754,227 | 247,854,733 | |
| Palo Alto Networks, Inc. (a) | 804,200 | 291,699,424 | |
| Tenable Holdings, Inc. (a) | 3,671,828 | 151,573,060 | |
| 3,445,254,083 | |||
TOTAL SOFTWARE | 7,428,182,797 | ||
| TOTAL COMMON STOCKS (Cost $4,987,088,940) | 10,067,298,952 | ||
| Money Market Funds - 3.3% | |||
| Shares | Value ($) | ||
| Fidelity Cash Central Fund 5.39% (e) | 248,793,022 | 248,842,781 | |
| Fidelity Securities Lending Cash Central Fund 5.39% (e)(f) | 95,988,976 | 95,998,575 | |
| TOTAL MONEY MARKET FUNDS (Cost $344,841,356) | 344,841,356 | ||
| TOTAL INVESTMENT IN SECURITIES - 100.6% (Cost $5,331,930,296) | 10,412,140,308 |
NET OTHER ASSETS (LIABILITIES) - (0.6)% | (64,998,874) |
| NET ASSETS - 100.0% | 10,347,141,434 |
| (a) | Non-income producing |
| (b) | Security exempt from registration under Rule 144A of the Securities Act of 1933. These securities may be resold in transactions exempt from registration, normally to qualified institutional buyers. At the end of the period, the value of these securities amounted to $33,205,585 or 0.3% of net assets. |
| (c) | Security or a portion of the security is on loan at period end. |
| (d) | Level 3 security |
| (e) | Affiliated fund that is generally available only to investment companies and other accounts managed by Fidelity Investments. The rate quoted is the annualized seven-day yield of the fund at period end. A complete unaudited listing of the fund's holdings as of its most recent quarter end is available upon request. In addition, each Fidelity Central Fund's financial statements are available on the SEC's website or upon request. |
| (f) | Investment made with cash collateral received from securities on loan. |
| Affiliate | Value, beginning of period ($) | Purchases ($) | Sales Proceeds ($) | Dividend Income ($) | Realized Gain (loss) ($) | Change in Unrealized appreciation (depreciation) ($) | Value, end of period ($) | % ownership, end of period |
| Fidelity Cash Central Fund 5.39% | 480,172,960 | 680,962,163 | 912,297,392 | 5,686,569 | 5,050 | - | 248,842,781 | 0.6% |
| Fidelity Securities Lending Cash Central Fund 5.39% | 143,218,575 | 508,504,629 | 555,724,629 | 28,739 | - | - | 95,998,575 | 0.4% |
| Total | 623,391,535 | 1,189,466,792 | 1,468,022,021 | 5,715,308 | 5,050 | - | 344,841,356 | |
| Affiliate | Value, beginning of period ($) | Purchases ($) | Sales Proceeds ($) | Dividend Income ($) | Realized Gain (loss) ($) | Change in Unrealized appreciation (depreciation) ($) | Value, end of period ($) |
| Everbridge, Inc. | 58,877,929 | - | - | - | (8,608,927) | 22,625,498 | - |
| Total | 58,877,929 | - | - | - | (8,608,927) | 22,625,498 | - |
| Valuation Inputs at Reporting Date: | ||||
| Description | Total ($) | Level 1 ($) | Level 2 ($) | Level 3 ($) |
Investments in Securities: | ||||
| Common Stocks | 10,067,298,952 | 9,884,127,594 | 183,171,356 | 2 |
| Money Market Funds | 344,841,356 | 344,841,356 | - | - |
| Total Investments in Securities: | 10,412,140,308 | 10,228,968,950 | 183,171,356 | 2 |
| Statement of Assets and Liabilities | ||||
| As of August 31, 2024 (Unaudited) | ||||
| Assets | ||||
| Investment in securities, at value (including securities loaned of $91,876,175) - See accompanying schedule: | ||||
Unaffiliated issuers (cost $4,987,088,940) | $ | 10,067,298,952 | ||
Fidelity Central Funds (cost $344,841,356) | 344,841,356 | |||
| Total Investment in Securities (cost $5,331,930,296) | $ | 10,412,140,308 | ||
| Receivable for investments sold | 43,128,744 | |||
| Receivable for fund shares sold | 911,984 | |||
| Dividends receivable | 6,009,827 | |||
| Distributions receivable from Fidelity Central Funds | 660,708 | |||
| Prepaid expenses | 19,386 | |||
| Other receivables | 530,219 | |||
Total assets | 10,463,401,176 | |||
| Liabilities | ||||
| Payable for investments purchased | $ | 5,199,146 | ||
| Payable for fund shares redeemed | 9,228,841 | |||
| Accrued management fee | 5,231,862 | |||
| Other payables and accrued expenses | 601,318 | |||
| Collateral on securities loaned | 95,998,575 | |||
| Total liabilities | 116,259,742 | |||
| Net Assets | $ | 10,347,141,434 | ||
| Net Assets consist of: | ||||
| Paid in capital | $ | 4,373,660,334 | ||
| Total accumulated earnings (loss) | 5,973,481,100 | |||
| Net Assets | $ | 10,347,141,434 | ||
Net Asset Value, offering price and redemption price per share ($10,347,141,434 ÷ 384,167,925 shares) | $ | 26.93 | ||
| Statement of Operations | ||||
Six months ended August 31, 2024 (Unaudited) | ||||
| Investment Income | ||||
| Dividends | $ | 24,489,001 | ||
| Interest | 29,510 | |||
| Income from Fidelity Central Funds (including $28,739 from security lending) | 5,715,308 | |||
| Total income | 30,233,819 | |||
| Expenses | ||||
| Management fee | $ | 34,535,474 | ||
| Custodian fees and expenses | 33,464 | |||
| Independent trustees' fees and expenses | 24,436 | |||
| Registration fees | 49,752 | |||
| Audit fees | 33,901 | |||
| Legal | 3,591 | |||
| Miscellaneous | 151,524 | |||
| Total expenses before reductions | 34,832,142 | |||
| Expense reductions | (253,533) | |||
| Total expenses after reductions | 34,578,609 | |||
| Net Investment income (loss) | (4,344,790) | |||
| Realized and Unrealized Gain (Loss) | ||||
| Net realized gain (loss) on: | ||||
| Investment Securities: | ||||
| Unaffiliated issuers | 912,819,456 | |||
| Fidelity Central Funds | 5,050 | |||
| Other affiliated issuers | (8,608,927) | |||
| Foreign currency transactions | 14,433 | |||
| Total net realized gain (loss) | 904,230,012 | |||
| Change in net unrealized appreciation (depreciation) on: | ||||
| Investment Securities: | ||||
| Unaffiliated issuers | (1,654,003,670) | |||
| Affiliated issuers | 22,625,498 | |||
| Assets and liabilities in foreign currencies | 5,361 | |||
| Total change in net unrealized appreciation (depreciation) | (1,631,372,811) | |||
| Net gain (loss) | (727,142,799) | |||
| Net increase (decrease) in net assets resulting from operations | $ | (731,487,589) | ||
| Statement of Changes in Net Assets | ||||
Six months ended August 31, 2024 (Unaudited) | Year ended February 29, 2024 | |||
| Increase (Decrease) in Net Assets | ||||
| Operations | ||||
| Net investment income (loss) | $ | (4,344,790) | $ | (1,675,616) |
| Net realized gain (loss) | 904,230,012 | 1,115,912,605 | ||
| Change in net unrealized appreciation (depreciation) | (1,631,372,811) | 3,065,925,447 | ||
| Net increase (decrease) in net assets resulting from operations | (731,487,589) | 4,180,162,436 | ||
| Distributions to shareholders | (218,066,123) | (853,130,530) | ||
| Share transactions | ||||
| Proceeds from sales of shares | 276,498,229 | 1,044,476,423 | ||
| Reinvestment of distributions | 202,703,558 | 789,532,155 | ||
| Cost of shares redeemed | (1,577,520,977) | (1,441,065,490) | ||
Net increase (decrease) in net assets resulting from share transactions | (1,098,319,190) | 392,943,088 | ||
| Total increase (decrease) in net assets | (2,047,872,902) | 3,719,974,994 | ||
| Net Assets | ||||
| Beginning of period | 12,395,014,336 | 8,675,039,342 | ||
| End of period | $ | 10,347,141,434 | $ | 12,395,014,336 |
| Other Information | ||||
| Shares | ||||
| Sold | 10,120,241 | 39,764,499 | ||
| Issued in reinvestment of distributions | 7,363,007 | 28,583,318 | ||
| Redeemed | (58,314,152) | (56,149,399) | ||
| Net increase (decrease) | (40,830,904) | 12,198,418 | ||
Software and IT Services Portfolio |
Six months ended (Unaudited) August 31, 2024 | Years ended February 28, 2024 A | 2023 | 2022 | 2021 | 2020 A | |||||||
Selected Per-Share Data | ||||||||||||
| Net asset value, beginning of period | $ | 29.16 | $ | 21.02 | $ | 26.33 | $ | 27.31 | $ | 19.90 | $ | 18.71 |
| Income from Investment Operations | ||||||||||||
Net investment income (loss) B,C | (.01) | - D | - D | (.05) | (.03) | .19 E | ||||||
| Net realized and unrealized gain (loss) | (1.70) | 10.28 | (3.53) | 1.03 | 8.82 | 3.52 | ||||||
| Total from investment operations | (1.71) | 10.28 | (3.53) | .98 | 8.79 | 3.71 | ||||||
| Distributions from net investment income | - | - | - | - | (.15) | (.05) | ||||||
| Distributions from net realized gain | (.52) | (2.14) | (1.78) | (1.96) | (1.23) | (2.47) | ||||||
| Total distributions | (.52) | (2.14) | (1.78) | (1.96) | (1.38) | (2.52) | ||||||
| Net asset value, end of period | $ | 26.93 | $ | 29.16 | $ | 21.02 | $ | 26.33 | $ | 27.31 | $ | 19.90 |
Total Return F,G | (5.89) % | 49.47% | (13.67)% | 2.98% | 45.80% | 21.33% | ||||||
Ratios to Average Net Assets C,H,I | ||||||||||||
| Expenses before reductions | .63% J | .68% | .69% | .67% | .70% | .70% | ||||||
| Expenses net of fee waivers, if any | .62 % J | .67% | .69% | .67% | .70% | .70% | ||||||
| Expenses net of all reductions | .62% J | .67% | .69% | .67% | .69% | .70% | ||||||
| Net investment income (loss) | (.08)% J | (.02)% | (.01)% | (.17)% | (.11)% | .98% E | ||||||
| Supplemental Data | ||||||||||||
| Net assets, end of period (000 omitted) | $ | 10,347,141 | $ | 12,395,014 | $ | 8,675,039 | $ | 11,268,291 | $ | 11,894,544 | $ | 8,031,911 |
Portfolio turnover rate K | 14 % J | 31% | 4% | 10% | 22% | 23% |
| Common Stocks - 97.7% | |||
| Shares | Value ($) | ||
| Communications Equipment - 28.6% | |||
| Communications Equipment - 28.6% | |||
| Arista Networks, Inc. (a) | 193,584 | 68,408,714 | |
| Ciena Corp. (a) | 395,606 | 22,806,686 | |
| Cisco Systems, Inc. | 2,597,652 | 131,285,330 | |
| Motorola Solutions, Inc. | 157,527 | 69,633,235 | |
| 292,133,965 | |||
| Electronic Equipment, Instruments & Components - 7.4% | |||
| Electronic Components - 0.5% | |||
| Kyocera Corp. | 400,909 | 4,966,296 | |
| Electronic Manufacturing Services - 0.6% | |||
| Jabil, Inc. | 62,621 | 6,843,223 | |
| Technology Distributors - 6.3% | |||
| CDW Corp. | 203,573 | 45,934,212 | |
| Insight Enterprises, Inc. (a) | 83,957 | 18,224,546 | |
| 64,158,758 | |||
TOTAL ELECTRONIC EQUIPMENT, INSTRUMENTS & COMPONENTS | 75,968,277 | ||
| Entertainment - 4.9% | |||
| Interactive Home Entertainment - 4.9% | |||
| Nintendo Co. Ltd. | 924,087 | 50,255,760 | |
| Household Durables - 4.6% | |||
| Consumer Electronics - 4.6% | |||
| Sony Group Corp. | 485,430 | 47,278,050 | |
| Interactive Media & Services - 1.2% | |||
| Interactive Media & Services - 1.2% | |||
| Meta Platforms, Inc. Class A | 23,237 | 12,113,680 | |
| Semiconductors & Semiconductor Equipment - 4.5% | |||
| Semiconductors - 4.5% | |||
| Marvell Technology, Inc. | 97,238 | 7,413,425 | |
| Renesas Electronics Corp. | 856,830 | 14,916,965 | |
| Taiwan Semiconductor Manufacturing Co. Ltd. | 791,333 | 23,410,147 | |
| 45,740,537 | |||
| Software - 7.9% | |||
| Systems Software - 7.9% | |||
| Microsoft Corp. | 80,517 | 33,586,861 | |
| Palo Alto Networks, Inc. (a) | 131,220 | 47,596,118 | |
| 81,182,979 | |||
| Technology Hardware, Storage & Peripherals - 38.6% | |||
| Technology Hardware, Storage & Peripherals - 38.6% | |||
| Apple, Inc. | 493,518 | 113,015,622 | |
| Dell Technologies, Inc. Class C | 341,674 | 39,477,014 | |
| FUJIFILM Holdings Corp. | 1,522,227 | 41,053,831 | |
| HP, Inc. | 143,950 | 5,208,111 | |
| Pure Storage, Inc. Class A (a) | 446,297 | 22,890,573 | |
| Samsung Electronics Co. Ltd. | 2,201,287 | 122,287,322 | |
| Seagate Technology Holdings PLC | 275,558 | 27,431,799 | |
| Super Micro Computer, Inc. (a)(b) | 4,535 | 1,984,970 | |
| Wiwynn Corp. | 174,700 | 10,415,546 | |
| Xiaomi Corp. Class B (a)(c) | 4,364,746 | 10,760,922 | |
| 394,525,710 | |||
| TOTAL COMMON STOCKS (Cost $613,931,165) | 999,198,958 | ||
| Convertible Preferred Stocks - 0.1% | |||
| Shares | Value ($) | ||
| Electronic Equipment, Instruments & Components - 0.1% | |||
| Technology Distributors - 0.1% | |||
| VAST Data Ltd.: | |||
| Series A (d)(e) | 5,512 | 100,098 | |
| Series A1 (d)(e) | 13,567 | 246,377 | |
| Series A2 (d)(e) | 15,607 | 283,423 | |
| Series B (d)(e) | 12,418 | 225,511 | |
| Series C (d)(e) | 362 | 6,574 | |
| Series E (d)(e) | 11,867 | 215,505 | |
| (Cost $783,200) | 1,077,488 | ||
| Money Market Funds - 1.2% | |||
| Shares | Value ($) | ||
| Fidelity Cash Central Fund 5.39% (f) | 10,133,720 | 10,135,747 | |
| Fidelity Securities Lending Cash Central Fund 5.39% (f)(g) | 2,060,794 | 2,061,000 | |
| TOTAL MONEY MARKET FUNDS (Cost $12,196,747) | 12,196,747 | ||
| TOTAL INVESTMENT IN SECURITIES - 99.0% (Cost $626,911,112) | 1,012,473,193 |
NET OTHER ASSETS (LIABILITIES) - 1.0% | 10,378,252 |
| NET ASSETS - 100.0% | 1,022,851,445 |
| (a) | Non-income producing |
| (b) | Security or a portion of the security is on loan at period end. |
| (c) | Security exempt from registration under Rule 144A of the Securities Act of 1933. These securities may be resold in transactions exempt from registration, normally to qualified institutional buyers. At the end of the period, the value of these securities amounted to $10,760,922 or 1.1% of net assets. |
| (d) | Restricted securities (including private placements) - Investment in securities not registered under the Securities Act of 1933 (excluding 144A issues). At the end of the period, the value of restricted securities (excluding 144A issues) amounted to $1,077,488 or 0.1% of net assets. |
| (e) | Level 3 security |
| (f) | Affiliated fund that is generally available only to investment companies and other accounts managed by Fidelity Investments. The rate quoted is the annualized seven-day yield of the fund at period end. A complete unaudited listing of the fund's holdings as of its most recent quarter end is available upon request. In addition, each Fidelity Central Fund's financial statements are available on the SEC's website or upon request. |
| (g) | Investment made with cash collateral received from securities on loan. |
| Additional information on each restricted holding is as follows: | ||
| Security | Acquisition Date | Acquisition Cost ($) |
| VAST Data Ltd. Series A | 11/28/23 | 60,632 |
| VAST Data Ltd. Series A1 | 11/28/23 | 149,237 |
| VAST Data Ltd. Series A2 | 11/28/23 | 171,677 |
| VAST Data Ltd. Series B | 11/28/23 | 136,598 |
| VAST Data Ltd. Series C | 11/28/23 | 3,982 |
| VAST Data Ltd. Series E | 11/28/23 | 261,074 |
| Affiliate | Value, beginning of period ($) | Purchases ($) | Sales Proceeds ($) | Dividend Income ($) | Realized Gain (loss) ($) | Change in Unrealized appreciation (depreciation) ($) | Value, end of period ($) | % ownership, end of period |
| Fidelity Cash Central Fund 5.39% | 1,916,079 | 86,026,513 | 77,808,498 | 227,981 | 1,653 | - | 10,135,747 | 0.0% |
| Fidelity Securities Lending Cash Central Fund 5.39% | 3,339,525 | 125,400,727 | 126,679,252 | 3,012 | - | - | 2,061,000 | 0.0% |
| Total | 5,255,604 | 211,427,240 | 204,487,750 | 230,993 | 1,653 | - | 12,196,747 | |
| Valuation Inputs at Reporting Date: | ||||
| Description | Total ($) | Level 1 ($) | Level 2 ($) | Level 3 ($) |
Investments in Securities: | ||||
| Common Stocks | 999,198,958 | 796,141,441 | 203,057,517 | - |
| Convertible Preferred Stocks | 1,077,488 | - | - | 1,077,488 |
| Money Market Funds | 12,196,747 | 12,196,747 | - | - |
| Total Investments in Securities: | 1,012,473,193 | 808,338,188 | 203,057,517 | 1,077,488 |
| Statement of Assets and Liabilities | ||||
| As of August 31, 2024 (Unaudited) | ||||
| Assets | ||||
| Investment in securities, at value (including securities loaned of $1,969,650) - See accompanying schedule: | ||||
Unaffiliated issuers (cost $614,714,365) | $ | 1,000,276,446 | ||
Fidelity Central Funds (cost $12,196,747) | 12,196,747 | |||
| Total Investment in Securities (cost $626,911,112) | $ | 1,012,473,193 | ||
| Foreign currency held at value (cost $8) | 8 | |||
| Receivable for investments sold | 30,722,991 | |||
| Receivable for fund shares sold | 83,900 | |||
| Dividends receivable | 550,798 | |||
| Distributions receivable from Fidelity Central Funds | 37,998 | |||
| Prepaid expenses | 1,828 | |||
| Other receivables | 179,711 | |||
Total assets | 1,044,050,427 | |||
| Liabilities | ||||
| Payable for investments purchased | $ | 18,218,339 | ||
| Payable for fund shares redeemed | 238,264 | |||
| Accrued management fee | 551,148 | |||
| Other payables and accrued expenses | 130,231 | |||
| Collateral on securities loaned | 2,061,000 | |||
| Total liabilities | 21,198,982 | |||
| Net Assets | $ | 1,022,851,445 | ||
| Net Assets consist of: | ||||
| Paid in capital | $ | 563,659,948 | ||
| Total accumulated earnings (loss) | 459,191,497 | |||
| Net Assets | $ | 1,022,851,445 | ||
Net Asset Value, offering price and redemption price per share ($1,022,851,445 ÷ 9,115,711 shares) | $ | 112.21 | ||
| Statement of Operations | ||||
Six months ended August 31, 2024 (Unaudited) | ||||
| Investment Income | ||||
| Dividends | $ | 5,622,453 | ||
| Income from Fidelity Central Funds (including $3,012 from security lending) | 230,993 | |||
| Total income | 5,853,446 | |||
| Expenses | ||||
| Management fee | $ | 3,269,334 | ||
| Custodian fees and expenses | 28,663 | |||
| Independent trustees' fees and expenses | 2,006 | |||
| Registration fees | 27,137 | |||
| Audit fees | 20,911 | |||
| Legal | 1,752 | |||
| Interest | 5,820 | |||
| Miscellaneous | 15,552 | |||
| Total expenses before reductions | 3,371,175 | |||
| Expense reductions | (18,880) | |||
| Total expenses after reductions | 3,352,295 | |||
| Net Investment income (loss) | 2,501,151 | |||
| Realized and Unrealized Gain (Loss) | ||||
| Net realized gain (loss) on: | ||||
| Investment Securities: | ||||
| Unaffiliated issuers | 73,319,697 | |||
| Fidelity Central Funds | 1,653 | |||
| Foreign currency transactions | (193,930) | |||
| Total net realized gain (loss) | 73,127,420 | |||
| Change in net unrealized appreciation (depreciation) on: | ||||
| Investment Securities: | ||||
| Unaffiliated issuers | 43,923,405 | |||
| Assets and liabilities in foreign currencies | (3,225) | |||
| Total change in net unrealized appreciation (depreciation) | 43,920,180 | |||
| Net gain (loss) | 117,047,600 | |||
| Net increase (decrease) in net assets resulting from operations | $ | 119,548,751 | ||
| Statement of Changes in Net Assets | ||||
Six months ended August 31, 2024 (Unaudited) | Year ended February 29, 2024 | |||
| Increase (Decrease) in Net Assets | ||||
| Operations | ||||
| Net investment income (loss) | $ | 2,501,151 | $ | 4,730,408 |
| Net realized gain (loss) | 73,127,420 | 39,335,215 | ||
| Change in net unrealized appreciation (depreciation) | 43,920,180 | 180,630,046 | ||
| Net increase (decrease) in net assets resulting from operations | 119,548,751 | 224,695,669 | ||
| Distributions to shareholders | (5,547,194) | (4,572,286) | ||
| Share transactions | ||||
| Proceeds from sales of shares | 35,121,585 | 107,160,534 | ||
| Reinvestment of distributions | 5,170,110 | 4,269,833 | ||
| Cost of shares redeemed | (58,660,337) | (121,290,777) | ||
Net increase (decrease) in net assets resulting from share transactions | (18,368,642) | (9,860,410) | ||
| Total increase (decrease) in net assets | 95,632,915 | 210,262,973 | ||
| Net Assets | ||||
| Beginning of period | 927,218,530 | 716,955,557 | ||
| End of period | $ | 1,022,851,445 | $ | 927,218,530 |
| Other Information | ||||
| Shares | ||||
| Sold | 326,985 | 1,233,562 | ||
| Issued in reinvestment of distributions | 51,164 | 45,717 | ||
| Redeemed | (557,689) | (1,366,781) | ||
| Net increase (decrease) | (179,540) | (87,502) | ||
Tech Hardware Portfolio |
Six months ended (Unaudited) August 31, 2024 | Years ended February 28, 2024 A | 2023 | 2022 | 2021 | 2020 A | |||||||
Selected Per-Share Data | ||||||||||||
| Net asset value, beginning of period | $ | 99.75 | $ | 76.41 | $ | 101.48 | $ | 114.74 | $ | 78.64 | $ | 75.84 |
| Income from Investment Operations | ||||||||||||
Net investment income (loss) B,C | .27 | .50 | .57 | .42 | .93 D | 1.51 E | ||||||
| Net realized and unrealized gain (loss) | 12.79 | 23.33 | (13.00) | 5.73 | 44.83 | 11.48 | ||||||
| Total from investment operations | 13.06 | 23.83 | (12.43) | 6.15 | 45.76 | 12.99 | ||||||
| Distributions from net investment income | (.01) | (.49) | (.51) | (.73) F | (1.61) | (.77) | ||||||
| Distributions from net realized gain | (.59) | - | (12.13) | (18.68) F | (8.05) | (9.42) | ||||||
| Total distributions | (.60) | (.49) | (12.64) | (19.41) | (9.66) | (10.19) | ||||||
| Net asset value, end of period | $ | 112.21 | $ | 99.75 | $ | 76.41 | $ | 101.48 | $ | 114.74 | $ | 78.64 |
Total Return G,H | 13.16 % | 31.23% | (13.62)% | 4.72% | 62.60% | 17.80% | ||||||
Ratios to Average Net Assets C,I,J | ||||||||||||
| Expenses before reductions | .69% K | .73% | .73% | .72% L | .74% | .76% | ||||||
| Expenses net of fee waivers, if any | .69 % K | .72% | .73% | .72% L | .74% | .76% | ||||||
| Expenses net of all reductions | .69% K | .72% | .73% | .72% L | .73% | .75% | ||||||
| Net investment income (loss) | .51% K | .57% | .74% | .38% L | 1.04% D | 1.95% E | ||||||
| Supplemental Data | ||||||||||||
| Net assets, end of period (000 omitted) | $ | 1,022,851 | $ | 927,219 | $ | 716,956 | $ | 913,649 | $ | 770,776 | $ | 533,793 |
Portfolio turnover rate M | 47 % K | 39% | 30% | 99% N | 78% | 116% |
| Common Stocks - 94.8% | |||
| Shares | Value ($) | ||
| Aerospace & Defense - 0.0% | |||
| Aerospace & Defense - 0.0% | |||
| ABL Space Systems warrants 12/14/30 (a)(b)(c) | 19,797 | 133,630 | |
| Air Freight & Logistics - 0.0% | |||
| Air Freight & Logistics - 0.0% | |||
| Delhivery Private Ltd. (a) | 579,000 | 2,895,863 | |
| Broadline Retail - 1.6% | |||
| Broadline Retail - 1.6% | |||
| Amazon.com, Inc. (a) | 1,392,000 | 248,472,000 | |
| Chemicals - 0.0% | |||
| Commodity Chemicals - 0.0% | |||
| LG Chemical Ltd. | 24,257 | 5,830,879 | |
| Communications Equipment - 2.3% | |||
| Communications Equipment - 2.3% | |||
| Cisco Systems, Inc. | 7,203,173 | 364,048,363 | |
| Electrical Equipment - 0.0% | |||
| Electrical Components & Equipment - 0.0% | |||
| ESS Tech, Inc. Class A (a) | 52,485 | 393,113 | |
| Electronic Equipment, Instruments & Components - 0.6% | |||
| Electronic Components - 0.6% | |||
| Amphenol Corp. Class A | 1,357,176 | 91,541,521 | |
| Entertainment - 0.6% | |||
| Movies & Entertainment - 0.6% | |||
| Netflix, Inc. (a) | 127,730 | 89,583,436 | |
| Food Products - 0.0% | |||
| Agricultural Products & Services - 0.0% | |||
| Local Bounti Corp. (a) | 118,993 | 312,952 | |
| Ground Transportation - 2.3% | |||
| Passenger Ground Transportation - 2.3% | |||
| Lyft, Inc. (a) | 1,718,528 | 20,055,222 | |
| Uber Technologies, Inc. (a) | 4,606,538 | 336,876,124 | |
| 356,931,346 | |||
| Hotels, Restaurants & Leisure - 0.3% | |||
| Hotels, Resorts & Cruise Lines - 0.2% | |||
| Airbnb, Inc. Class A (a) | 301,509 | 35,370,021 | |
| Restaurants - 0.1% | |||
| Deliveroo PLC Class A (a)(d) | 6,252,898 | 12,531,407 | |
TOTAL HOTELS, RESTAURANTS & LEISURE | 47,901,428 | ||
| Interactive Media & Services - 0.2% | |||
| Interactive Media & Services - 0.2% | |||
| Epic Games, Inc. (a)(b)(c) | 17,917 | 10,750,200 | |
| Reddit, Inc.: | |||
| Class A | 38,400 | 2,305,152 | |
| Class B (a) | 265,261 | 15,923,618 | |
| 28,978,970 | |||
| IT Services - 4.0% | |||
| Internet Services & Infrastructure - 4.0% | |||
| Okta, Inc. Class A (a) | 5,104,947 | 401,912,477 | |
| Shopify, Inc. Class A (a)(e) | 2,860,300 | 211,862,421 | |
| Snowflake, Inc. Class A (a) | 111,800 | 12,770,914 | |
| 626,545,812 | |||
| IT Consulting & Other Services - 0.0% | |||
| Thoughtworks Holding, Inc. (a)(e) | 1,329,904 | 5,785,082 | |
TOTAL IT SERVICES | 632,330,894 | ||
| Life Sciences Tools & Services - 0.0% | |||
| Life Sciences Tools & Services - 0.0% | |||
| Eden Biologics, Inc. (a)(c) | 1,015,442 | 0 | |
| Pharmaceuticals - 0.0% | |||
| Pharmaceuticals - 0.0% | |||
| Chime Biologics Wuhan Co. Ltd. (a)(c) | 1,015,442 | 528,873 | |
| Semiconductors & Semiconductor Equipment - 41.9% | |||
| Semiconductor Materials & Equipment - 2.6% | |||
| ASML Holding NV (Netherlands) | 202,950 | 183,027,222 | |
| Teradyne, Inc. | 1,662,328 | 227,290,107 | |
| 410,317,329 | |||
| Semiconductors - 39.3% | |||
| Astera Labs, Inc. | 1,330,859 | 57,306,789 | |
| GlobalFoundries, Inc. (a) | 8,835,349 | 412,434,091 | |
| Marvell Technology, Inc. | 8,978,360 | 684,510,166 | |
| Micron Technology, Inc. | 2,422,923 | 233,182,110 | |
| NVIDIA Corp. | 27,050,740 | 3,229,046,835 | |
| NXP Semiconductors NV | 2,428,022 | 622,447,720 | |
| ON Semiconductor Corp. (a) | 8,693,538 | 676,965,804 | |
| Renesas Electronics Corp. | 1 | 17 | |
| Taiwan Semiconductor Manufacturing Co. Ltd. | 10,628,488 | 314,424,475 | |
| Xsight Labs Ltd. warrants 1/11/34 (a)(b)(c) | 71,863 | 148,756 | |
| 6,230,466,763 | |||
TOTAL SEMICONDUCTORS & SEMICONDUCTOR EQUIPMENT | 6,640,784,092 | ||
| Software - 20.6% | |||
| Application Software - 5.9% | |||
| Algolia, Inc. (a)(b)(c) | 153,503 | 2,670,952 | |
| CCC Intelligent Solutions Holdings, Inc. (a)(b) | 102,045 | 1,100,045 | |
| Convoy, Inc. warrants (a)(b)(c) | 13,357 | 0 | |
| CoreWeave, Inc. Class A (c) | 57,100 | 43,411,988 | |
| Datadog, Inc. Class A (a) | 1,835,947 | 213,447,198 | |
| HubSpot, Inc. (a) | 222,876 | 111,230,725 | |
| Manhattan Associates, Inc. (a) | 320,357 | 84,712,002 | |
| Nutanix, Inc. Class A (a) | 72,872 | 4,604,782 | |
| Palantir Technologies, Inc. Class A (a) | 1,160,000 | 36,516,800 | |
| Salesforce, Inc. | 1,744,852 | 441,273,071 | |
| Stripe, Inc. Class B (a)(b)(c) | 38,600 | 1,061,886 | |
| Urgent.ly, Inc. (e) | 36,161 | 33,977 | |
| 940,063,426 | |||
| Systems Software - 14.7% | |||
| Microsoft Corp. | 4,016,986 | 1,675,645,540 | |
| ServiceNow, Inc. (a) | 756,600 | 646,893,000 | |
| 2,322,538,540 | |||
TOTAL SOFTWARE | 3,262,601,966 | ||
| Specialty Retail - 0.0% | |||
| Automotive Retail - 0.0% | |||
| Cazoo Group Ltd. (a)(b) | 72 | 1 | |
| Cazoo Group Ltd.: | |||
| warrants (a) | 78 | 0 | |
| warrants (a) | 86 | 0 | |
| warrants (a) | 95 | 0 | |
| 1 | |||
| Technology Hardware, Storage & Peripherals - 20.4% | |||
| Technology Hardware, Storage & Peripherals - 20.4% | |||
| Apple, Inc. | 12,952,950 | 2,966,225,550 | |
| Seagate Technology Holdings PLC | 831,094 | 82,735,408 | |
| Western Digital Corp. (a) | 2,833,238 | 185,832,080 | |
| 3,234,793,038 | |||
| TOTAL COMMON STOCKS (Cost $7,706,902,521) | 15,008,062,365 | ||
| Preferred Stocks - 0.9% | |||
| Shares | Value ($) | ||
| Convertible Preferred Stocks - 0.9% | |||
| Aerospace & Defense - 0.0% | |||
| Aerospace & Defense - 0.0% | |||
| ABL Space Systems: | |||
| Series B(a)(b)(c) | 98,000 | 2,106,020 | |
| Series B2(a)(b)(c) | 74,989 | 1,973,710 | |
| Series C1(b)(c) | 26,396 | 434,214 | |
| 4,513,944 | |||
| Communications Equipment - 0.1% | |||
| Communications Equipment - 0.1% | |||
| Astranis Space Technologies Corp. Series C (a)(b)(c) | 605,440 | 7,773,850 | |
| Construction & Engineering - 0.1% | |||
| Construction & Engineering - 0.1% | |||
| Beta Technologies, Inc. Series A (a)(b)(c) | 72,591 | 7,994,447 | |
| Electronic Equipment, Instruments & Components - 0.1% | |||
| Technology Distributors - 0.1% | |||
| VAST Data Ltd.: | |||
| Series A(b)(c) | 74,785 | 1,358,096 | |
| Series A1(b)(c) | 184,071 | 3,342,729 | |
| Series A2(b)(c) | 211,741 | 3,845,217 | |
| Series B(b)(c) | 168,485 | 3,059,688 | |
| Series C(b)(c) | 4,912 | 89,202 | |
| Series E(b)(c) | 160,999 | 2,923,742 | |
| 14,618,674 | |||
| Financial Services - 0.0% | |||
| Diversified Financial Services - 0.0% | |||
| Akeana Series C (b)(c) | 88,100 | 1,135,609 | |
| Tenstorrent Holdings, Inc. Series D1 (b)(c) | 24,800 | 1,956,720 | |
| 3,092,329 | |||
| Hotels, Restaurants & Leisure - 0.0% | |||
| Casinos & Gaming - 0.0% | |||
| Discord, Inc. Series I (a)(b)(c) | 1,300 | 345,033 | |
| Interactive Media & Services - 0.1% | |||
| Interactive Media & Services - 0.1% | |||
| ByteDance Ltd. Series E1 (a)(b)(c) | 70,707 | 15,676,449 | |
| IT Services - 0.0% | |||
| Internet Services & Infrastructure - 0.0% | |||
| Gupshup, Inc. (a)(b)(c) | 257,284 | 2,199,778 | |
| Semiconductors & Semiconductor Equipment - 0.0% | |||
| Semiconductors - 0.0% | |||
| Retym, Inc. Series C (a)(b)(c) | 324,475 | 2,806,709 | |
| Xsight Labs Ltd.: | |||
| Series D(a)(b)(c) | 281,500 | 1,570,770 | |
| Series D1(b)(c) | 239,542 | 1,906,754 | |
| 6,284,233 | |||
| Software - 0.5% | |||
| Application Software - 0.5% | |||
| Algolia, Inc. Series D (a)(b)(c) | 109,867 | 1,911,686 | |
| Anthropic PBC: | |||
| Series B(b)(c) | 468,400 | 14,052,000 | |
| Series D(b)(c) | 477,478 | 14,324,340 | |
| Bolt Technology OU Series E (a)(b)(c) | 40,842 | 6,320,996 | |
| Convoy, Inc. Series D (a)(b)(c) | 203,844 | 2 | |
| CoreWeave, Inc. Series C (b)(c) | 3,663 | 2,942,341 | |
| Databricks, Inc.: | |||
| Series G(a)(b)(c) | 45,012 | 3,353,844 | |
| Series H(a)(b)(c) | 174,018 | 12,966,081 | |
| Series I(b)(c) | 2,969 | 221,220 | |
| Skyryse, Inc. Series B (a)(b)(c) | 121,800 | 2,591,904 | |
| Stripe, Inc.: | |||
| Series H(a)(b)(c) | 17,100 | 470,421 | |
| Series I(a)(b)(c) | 487,275 | 13,404,935 | |
| 72,559,770 | |||
| Technology Hardware, Storage & Peripherals - 0.0% | |||
| Technology Hardware, Storage & Peripherals - 0.0% | |||
| Lightmatter, Inc.: | |||
| Series C(a)(b)(c) | 191,790 | 4,825,436 | |
| Series C2(b)(c) | 30,125 | 882,060 | |
| 5,707,496 | |||
| TOTAL CONVERTIBLE PREFERRED STOCKS | 140,766,003 | ||
| Nonconvertible Preferred Stocks - 0.0% | |||
| Professional Services - 0.0% | |||
| Data Processing & Outsourced Services - 0.0% | |||
| Checkr, Inc. Series E (a)(c) | 711,000 | 5,126,310 | |
| TOTAL PREFERRED STOCKS (Cost $157,996,522) | 145,892,313 | ||
| Convertible Bonds - 0.0% | |||
Principal Amount (f) | Value ($) | ||
| Software - 0.0% | |||
| Application Software - 0.0% | |||
Convoy, Inc. 15% 9/30/26 (b)(c) (Cost $88,955) | 88,955 | 0 | |
| Money Market Funds - 1.6% | |||
| Shares | Value ($) | ||
| Fidelity Cash Central Fund 5.39% (g) | 231,501,423 | 231,547,723 | |
| Fidelity Securities Lending Cash Central Fund 5.39% (g)(h) | 17,782,419 | 17,784,197 | |
| TOTAL MONEY MARKET FUNDS (Cost $249,331,920) | 249,331,920 | ||
| TOTAL INVESTMENT IN SECURITIES - 97.3% (Cost $8,114,319,918) | 15,403,286,598 |
NET OTHER ASSETS (LIABILITIES) - 2.7% | 430,301,052 |
| NET ASSETS - 100.0% | 15,833,587,650 |
| (a) | Non-income producing |
| (b) | Restricted securities (including private placements) - Investment in securities not registered under the Securities Act of 1933 (excluding 144A issues). At the end of the period, the value of restricted securities (excluding 144A issues) amounted to $156,631,473 or 1.0% of net assets. |
| (c) | Level 3 security |
| (d) | Security exempt from registration under Rule 144A of the Securities Act of 1933. These securities may be resold in transactions exempt from registration, normally to qualified institutional buyers. At the end of the period, the value of these securities amounted to $12,531,407 or 0.1% of net assets. |
| (e) | Security or a portion of the security is on loan at period end. |
| (f) | Amount is stated in United States dollars unless otherwise noted. |
| (g) | Affiliated fund that is generally available only to investment companies and other accounts managed by Fidelity Investments. The rate quoted is the annualized seven-day yield of the fund at period end. A complete unaudited listing of the fund's holdings as of its most recent quarter end is available upon request. In addition, each Fidelity Central Fund's financial statements are available on the SEC's website or upon request. |
| (h) | Investment made with cash collateral received from securities on loan. |
| Additional information on each restricted holding is as follows: | ||
| Security | Acquisition Date | Acquisition Cost ($) |
| ABL Space Systems warrants 12/14/30 | 12/14/23 | 0 |
| ABL Space Systems Series B | 3/24/21 | 4,413,489 |
| ABL Space Systems Series B2 | 10/22/21 | 5,098,960 |
| ABL Space Systems Series C1 | 12/14/23 | 863,181 |
| Akeana Series C | 1/23/24 | 1,124,226 |
| Algolia, Inc. | 10/27/21 | 4,489,203 |
| Algolia, Inc. Series D | 7/23/21 | 3,213,066 |
| Anthropic PBC Series B | 3/22/24 | 14,616,272 |
| Anthropic PBC Series D | 5/31/24 | 14,326,489 |
| Astranis Space Technologies Corp. Series C | 3/19/21 | 13,271,808 |
| Beta Technologies, Inc. Series A | 4/09/21 | 5,318,743 |
| Bolt Technology OU Series E | 1/03/22 | 10,610,609 |
| ByteDance Ltd. Series E1 | 11/18/20 | 7,747,662 |
| Cazoo Group Ltd. | 3/28/21 | 1,164,734 |
| CCC Intelligent Solutions Holdings, Inc. | 2/02/21 | 1,020,450 |
| Convoy, Inc. Series D | 10/30/19 | 2,760,048 |
| Convoy, Inc. warrants | 3/24/23 | 0 |
| Convoy, Inc. 15% 9/30/26 | 3/24/23 | 88,955 |
| CoreWeave, Inc. Series C | 5/17/24 | 2,853,660 |
| Databricks, Inc. Series G | 2/01/21 | 2,661,228 |
| Databricks, Inc. Series H | 8/31/21 | 12,787,562 |
| Databricks, Inc. Series I | 9/14/23 | 218,222 |
| Discord, Inc. Series I | 9/15/21 | 715,812 |
| Epic Games, Inc. | 3/29/21 | 15,856,545 |
| Gupshup, Inc. | 6/08/21 | 5,882,850 |
| Lightmatter, Inc. Series C | 5/19/23 | 3,156,250 |
| Lightmatter, Inc. Series C2 | 12/18/23 | 783,304 |
| Retym, Inc. Series C | 5/17/23 - 6/20/23 | 2,525,000 |
| Skyryse, Inc. Series B | 10/21/21 | 3,006,020 |
| Stripe, Inc. Class B | 5/18/21 | 1,548,955 |
| Stripe, Inc. Series H | 3/15/21 | 686,138 |
| Stripe, Inc. Series I | 3/20/23 - 5/12/23 | 9,810,863 |
| Tenstorrent Holdings, Inc. Series D1 | 7/16/24 | 1,954,896 |
| VAST Data Ltd. Series A | 11/28/23 | 822,635 |
| VAST Data Ltd. Series A1 | 11/28/23 | 2,024,781 |
| VAST Data Ltd. Series A2 | 11/28/23 | 2,329,151 |
| VAST Data Ltd. Series B | 11/28/23 | 1,853,335 |
| VAST Data Ltd. Series C | 11/28/23 | 54,032 |
| VAST Data Ltd. Series E | 11/28/23 | 3,541,978 |
| Xsight Labs Ltd. warrants 1/11/34 | 1/11/24 | 0 |
| Xsight Labs Ltd. Series D | 2/16/21 | 2,250,874 |
| Xsight Labs Ltd. Series D1 | 1/11/24 | 1,915,378 |
| Affiliate | Value, beginning of period ($) | Purchases ($) | Sales Proceeds ($) | Dividend Income ($) | Realized Gain (loss) ($) | Change in Unrealized appreciation (depreciation) ($) | Value, end of period ($) | % ownership, end of period |
| Fidelity Cash Central Fund 5.39% | 508,046,789 | 1,984,736,380 | 2,261,270,330 | 6,714,510 | 34,884 | - | 231,547,723 | 0.5% |
| Fidelity Securities Lending Cash Central Fund 5.39% | 107,697,992 | 420,702,189 | 510,615,984 | 69,645 | - | - | 17,784,197 | 0.1% |
| Total | 615,744,781 | 2,405,438,569 | 2,771,886,314 | 6,784,155 | 34,884 | - | 249,331,920 | |
| Valuation Inputs at Reporting Date: | ||||
| Description | Total ($) | Level 1 ($) | Level 2 ($) | Level 3 ($) |
Investments in Securities: | ||||
| Common Stocks | 15,008,062,365 | 14,451,904,366 | 497,451,714 | 58,706,285 |
| Preferred Stocks | 145,892,313 | - | - | 145,892,313 |
| Convertible Bonds | - | - | - | - |
| Money Market Funds | 249,331,920 | 249,331,920 | - | - |
| Total Investments in Securities: | 15,403,286,598 | 14,701,236,286 | 497,451,714 | 204,598,598 |
| Investments in Securities: | |||
| Beginning Balance | $ | 187,908,807 | |
| Net Realized Gain (Loss) on Investment Securities | - | ||
| Net Unrealized Gain (Loss) on Investment Securities | 17,870,019 | ||
| Cost of Purchases | 33,751,317 | ||
| Proceeds of Sales | (34,931,545) | ||
| Amortization/Accretion | - | ||
| Transfers into Level 3 | - | ||
| Transfers out of Level 3 | - | ||
| Ending Balance | $ | 204,598,598 | |
| The change in unrealized gain (loss) for the period attributable to Level 3 securities held at August 31, 2024 | $ | 22,905,730 | |
| The information used in the above reconciliation represents fiscal year to date activity for any Investments in Securities identified as using Level 3 inputs at either the beginning or the end of the current fiscal period. Cost of purchases and proceeds of sales may include securities received and/or delivered through in-kind transactions, corporate actions or exchanges. Transfers into Level 3 were attributable to a lack of observable market data resulting from decreases in market activity, decreases in liquidity, security restructurings or corporate actions. Transfers out of Level 3 were attributable to observable market data becoming available for those securities. Transfers in or out of Level 3 represent the beginning value of any Security or Instrument where a change in the pricing level occurred from the beginning to the end of the period. Realized and unrealized gains (losses) disclosed in the reconciliation are included in Net Gain (Loss) on the Fund's Statement of Operations. | |||
| Statement of Assets and Liabilities | ||||
| As of August 31, 2024 (Unaudited) | ||||
| Assets | ||||
| Investment in securities, at value (including securities loaned of $17,564,196) - See accompanying schedule: | ||||
Unaffiliated issuers (cost $7,864,987,998) | $ | 15,153,954,678 | ||
Fidelity Central Funds (cost $249,331,920) | 249,331,920 | |||
| Total Investment in Securities (cost $8,114,319,918) | $ | 15,403,286,598 | ||
| Cash | 6 | |||
| Foreign currency held at value (cost $88,892) | 90,125 | |||
| Receivable for investments sold | 517,800,281 | |||
| Receivable for fund shares sold | 5,714,930 | |||
| Dividends receivable | 3,495,440 | |||
| Interest receivable | 19,199 | |||
| Distributions receivable from Fidelity Central Funds | 1,428,791 | |||
| Prepaid expenses | 28,249 | |||
| Other receivables | 426,403 | |||
Total assets | 15,932,290,022 | |||
| Liabilities | ||||
| Payable for investments purchased | $ | 59,827,743 | ||
| Payable for fund shares redeemed | 12,500,787 | |||
| Accrued management fee | 7,888,041 | |||
| Other payables and accrued expenses | 716,796 | |||
| Collateral on securities loaned | 17,769,005 | |||
| Total liabilities | 98,702,372 | |||
| Net Assets | $ | 15,833,587,650 | ||
| Net Assets consist of: | ||||
| Paid in capital | $ | 8,076,740,207 | ||
| Total accumulated earnings (loss) | 7,756,847,443 | |||
| Net Assets | $ | 15,833,587,650 | ||
Net Asset Value, offering price and redemption price per share ($15,833,587,650 ÷ 449,272,273 shares) | $ | 35.24 | ||
| Statement of Operations | ||||
Six months ended August 31, 2024 (Unaudited) | ||||
| Investment Income | ||||
| Dividends | $ | 32,056,820 | ||
| Interest | 139,235 | |||
| Income from Fidelity Central Funds (including $69,645 from security lending) | 6,784,155 | |||
| Total income | 38,980,210 | |||
| Expenses | ||||
| Management fee | $ | 46,914,644 | ||
| Custodian fees and expenses | 90,779 | |||
| Independent trustees' fees and expenses | 30,693 | |||
| Registration fees | 147,537 | |||
| Audit fees | 36,696 | |||
| Legal | 4,212 | |||
| Interest | 1,861 | |||
| Miscellaneous | 188,170 | |||
| Total expenses before reductions | 47,414,592 | |||
| Expense reductions | (282,741) | |||
| Total expenses after reductions | 47,131,851 | |||
| Net Investment income (loss) | (8,151,641) | |||
| Realized and Unrealized Gain (Loss) | ||||
| Net realized gain (loss) on: | ||||
| Investment Securities: | ||||
| Unaffiliated issuers | 593,707,629 | |||
| Fidelity Central Funds | 34,884 | |||
| Foreign currency transactions | (12,678) | |||
| Total net realized gain (loss) | 593,729,835 | |||
| Change in net unrealized appreciation (depreciation) on: | ||||
| Investment Securities: | ||||
| Unaffiliated issuers (net of decrease in deferred foreign taxes of $32,572) | 970,640,328 | |||
| Assets and liabilities in foreign currencies | 5,868 | |||
| Total change in net unrealized appreciation (depreciation) | 970,646,196 | |||
| Net gain (loss) | 1,564,376,031 | |||
| Net increase (decrease) in net assets resulting from operations | $ | 1,556,224,390 | ||
| Statement of Changes in Net Assets | ||||
Six months ended August 31, 2024 (Unaudited) | Year ended February 29, 2024 | |||
| Increase (Decrease) in Net Assets | ||||
| Operations | ||||
| Net investment income (loss) | $ | (8,151,641) | $ | (1,129,693) |
| Net realized gain (loss) | 593,729,835 | 580,108,027 | ||
| Change in net unrealized appreciation (depreciation) | 970,646,196 | 4,313,247,992 | ||
| Net increase (decrease) in net assets resulting from operations | 1,556,224,390 | 4,892,226,326 | ||
| Distributions to shareholders | - | (1,273,314) | ||
| Share transactions | ||||
| Proceeds from sales of shares | 1,431,530,922 | 2,741,241,000 | ||
| Reinvestment of distributions | - | 1,184,140 | ||
| Cost of shares redeemed | (1,464,181,317) | (1,959,510,832) | ||
Net increase (decrease) in net assets resulting from share transactions | (32,650,395) | 782,914,308 | ||
| Total increase (decrease) in net assets | 1,523,573,995 | 5,673,867,320 | ||
| Net Assets | ||||
| Beginning of period | 14,310,013,655 | 8,636,146,335 | ||
| End of period | $ | 15,833,587,650 | $ | 14,310,013,655 |
| Other Information | ||||
| Shares | ||||
| Sold | 42,512,805 | 104,004,472 | ||
| Issued in reinvestment of distributions | - | 54,192 | ||
| Redeemed | (44,033,425) | (75,265,716) | ||
| Net increase (decrease) | (1,520,620) | 28,792,948 | ||
Technology Portfolio |
Six months ended (Unaudited) August 31, 2024 | Years ended February 28, 2024 A | 2023 | 2022 | 2021 | 2020 A | |||||||
Selected Per-Share Data | ||||||||||||
| Net asset value, beginning of period | $ | 31.74 | $ | 20.46 | $ | 24.92 | $ | 27.53 | $ | 19.65 | $ | 15.45 |
| Income from Investment Operations | ||||||||||||
Net investment income (loss) B,C | (.02) | - D | .01 | (.06) | (.03) | .05 | ||||||
| Net realized and unrealized gain (loss) | 3.52 | 11.28 | (3.76) | .83 | 12.98 | 4.52 | ||||||
| Total from investment operations | 3.50 | 11.28 | (3.75) | .77 | 12.95 | 4.57 | ||||||
| Distributions from net investment income | - | - D | - | - | (.03) | (.05) | ||||||
| Distributions from net realized gain | - | - | (.71) | (3.38) | (5.04) | (.32) | ||||||
| Total distributions | - | - D | (.71) | (3.38) | (5.07) | (.37) | ||||||
| Net asset value, end of period | $ | 35.24 | $ | 31.74 | $ | 20.46 | $ | 24.92 | $ | 27.53 | $ | 19.65 |
Total Return E,F | 11.03 % | 55.15% | (15.43)% | 1.91% | 69.87% | 29.57% | ||||||
Ratios to Average Net Assets C,G,H | ||||||||||||
| Expenses before reductions | .63% I | .68% | .70% | .67% | .69% | .71% | ||||||
| Expenses net of fee waivers, if any | .62 % I | .68% | .69% | .67% | .69% | .71% | ||||||
| Expenses net of all reductions | .62% I | .68% | .69% | .67% | .68% | .71% | ||||||
| Net investment income (loss) | (.11)% I | (.01)% | .02% | (.23)% | (.13)% | .30% | ||||||
| Supplemental Data | ||||||||||||
| Net assets, end of period (000 omitted) | $ | 15,833,588 | $ | 14,310,014 | $ | 8,636,146 | $ | 11,053,788 | $ | 11,986,342 | $ | 6,558,578 |
Portfolio turnover rate J | 43 % I | 29% | 24% | 87% | 107% | 32% K |
| Fidelity Central Fund | Investment Manager | Investment Objective | Investment Practices | Expense RatioA |
| Fidelity Money Market Central Funds | Fidelity Management & Research Company LLC (FMR) | Each fund seeks to obtain a high level of current income consistent with the preservation of capital and liquidity. | Short-term Investments | Less than .005% |
| Asset Type | Fair Value | Valuation Technique(s) | Unobservable Input | Amount or Range/Weighted Average | Impact to Valuation from an Increase in InputA |
| Equities | $204,598,598 | Recovery value | Recovery value | $0.00 | Increase |
Market approach | Transaction price | $8.00 | Increase | ||
| Discount rate | 75.0% | Decrease | |||
| Premium rate | 10.0% | Increase | |||
Market comparable | Enterprise value/Revenue multiple (EV/R) | 1.6 - 20.0 / 10.8 | Increase | ||
Discounted cash flow | Yield | 33.0% | Decrease | ||
| Black scholes | Discount rate | 3.7% - 4.8% / 3.9% | Increase | ||
| Volatility | 40.0% - 80.0% / 66.9% | Increase | |||
| Term | 0.6 - 4.0 / 3.0 | Increase | |||
| Corporate Bonds | $0 | Recovery value | Recovery value | $0.00 | Increase |
| Semiconductors Portfolio | 246,308 |
| Software and IT Services Portfolio | 433,019 |
| Tech Hardware Portfolio | 71,853 |
| Technology Portfolio | 406,039 |
| Tax cost ($) | Gross unrealized appreciation ($) | Gross unrealized depreciation ($) | Net unrealized appreciation (depreciation)($) | |
| Enterprise Technology Services Portfolio | 850,414,578 | 883,436,527 | (6,996,914) | 876,439,613 |
| Semiconductors Portfolio | 11,084,934,148 | 9,128,182,205 | (654,701,006) | 8,473,481,199 |
| Software and IT Services Portfolio | 5,342,393,633 | 5,636,770,316 | (567,023,641) | 5,069,746,675 |
| Tech Hardware Portfolio | 627,740,387 | 396,841,780 | (12,108,974) | 384,732,806 |
| Technology Portfolio | 8,170,668,836 | 7,687,252,743 | (454,634,981) | 7,232,617,762 |
| Short-term ($) | Long-term ($) | Total capital loss carryforward ($) | |
| Technology Portfolio | (1,695,501) | - | (1,695,501) |
Capital losses ($) | Ordinary losses ($) | ||
| Semiconductors Portfolio | (8,798,655) | (6,539,492) |
| Purchases ($) | Sales ($) | |
| Enterprise Technology Services Portfolio | 586,319,452 | 876,432,714 |
| Semiconductors Portfolio | 5,933,010,296 | 3,744,522,079 |
| Software and IT Services Portfolio | 769,932,794 | 1,815,850,925 |
| Tech Hardware Portfolio | 225,432,223 | 258,722,016 |
| Technology Portfolio | 3,152,415,748 | 3,605,096,717 |
| Shares | Total net realized gain or loss ($) | Total Proceeds ($) | |
| Semiconductors Portfolio | 25,960,540 | 739,916,327 | 760,643,821 |
| Maximum Management Fee Rate % | |
| Enterprise Technology Services Portfolio | .69 |
| Semiconductors Portfolio | .64 |
| Software and IT Services Portfolio | .64 |
| Tech Hardware Portfolio | .68 |
| Technology Portfolio | .64 |
| Total Management Fee Rate % | |
| Enterprise Technology Services Portfolio | .65 |
| Semiconductors Portfolio | .62 |
| Software and IT Services Portfolio | .62 |
| Tech Hardware Portfolio | .67 |
| Technology Portfolio | .62 |
| Amount ($) | |
| Enterprise Technology Services Portfolio | 16,421 |
| Semiconductors Portfolio | 64,593 |
| Software and IT Services Portfolio | 4,641 |
| Tech Hardware Portfolio | 1,796 |
| Technology Portfolio | 31,462 |
| Borrower or Lender | Average Loan Balance ($) | Weighted Average Interest Rate | Interest Expense ($) | |
| Enterprise Technology Services Portfolio | Borrower | 6,851,700 | 5.57% | 31,808 |
| Semiconductors Portfolio | Borrower | 29,824,800 | 5.58% | 46,222 |
| Tech Hardware Portfolio | Borrower | 12,538,000 | 5.57% | 5,820 |
| Technology Portfolio | Borrower | 12,027,000 | 5.57% | 1,861 |
| Purchases ($) | Sales ($) | Realized Gain (Loss)($) | |
| Enterprise Technology Services Portfolio | 5,200,187 | 65,210,624 | 11,871,044 |
| Semiconductors Portfolio | 294,253,842 | 320,251,541 | 6,692,113 |
| Software and IT Services Portfolio | 59,616,473 | 214,585,480 | 112,775,685 |
| Tech Hardware Portfolio | 5,568,361 | 9,595,426 | 3,311,061 |
| Technology Portfolio | 438,790,942 | 237,922,041 | 38,207,176 |
| Amount ($) | |
| Enterprise Technology Services Portfolio | 1,710 |
| Semiconductors Portfolio | 14,300 |
| Software and IT Services Portfolio | 10,328 |
| Tech Hardware Portfolio | 823 |
| Technology Portfolio | 12,499 |
| Total Security Lending Fees Paid to NFS ($) | Security Lending Income From Securities Loaned to NFS ($) | Value of Securities Loaned to NFS at Period End ($) | |
| Enterprise Technology Services Portfolio | 9,900 | - | - |
| Semiconductors Portfolio | 313,486 | 90,048 | 8,612,000 |
| Software and IT Services Portfolio | 3,031 | - | - |
| Tech Hardware Portfolio | 312 | - | - |
| Technology Portfolio | 7,153 | 6,096 | - |
| Average Loan Balance ($) | Weighted Average Interest Rate | Interest Expense ($) | |
| Enterprise Technology Services Portfolio | 3,428,167 | 5.83% | 3,331 |
| Custodian credits ($) | |
| Semiconductors Portfolio | 3,303 |
| Software and IT Services Portfolio | 1,082 |
| Technology Portfolio | 415 |
| Amount ($) | |
| Enterprise Technology Services Portfolio | 42,136 |
| Semiconductors Portfolio | 297,851 |
| Software and IT Services Portfolio | 252,451 |
| Tech Hardware Portfolio | 18,880 |
| Technology Portfolio | 282,326 |
| A special meeting of shareholders was held on July 16, 2024. The results of votes taken among shareholders on the proposal before them are reported below. Each vote reported represents one dollar of net asset value held on the record date for the meeting. | ||
| Proposal 1 | ||
| To elect a Board of Trustees. | ||
# of Votes | % of Votes | |
| Bettina Doulton | ||
| Affirmative | 50,178,154,296.75 | 92.38 |
| Withheld | 4,136,551,415.53 | 7.62 |
| TOTAL | 54,314,705,712.27 | 100.00 |
| Robert A. Lawrence | ||
| Affirmative | 50,131,321,830.27 | 92.30 |
| Withheld | 4,183,383,882.00 | 7.70 |
| TOTAL | 54,314,705,712.27 | 100.00 |
| Vijay C. Advani | ||
| Affirmative | 50,021,870,319.77 | 92.10 |
| Withheld | 4,292,835,392.50 | 7.90 |
| TOTAL | 54,314,705,712.27 | 100.00 |
| Thomas P. Bostick | ||
| Affirmative | 50,057,248,681.17 | 92.16 |
| Withheld | 4,257,457,031.10 | 7.84 |
| TOTAL | 54,314,705,712.27 | 100.00 |
| Donald F. Donahue | ||
| Affirmative | 49,998,023,290.27 | 92.05 |
| Withheld | 4,316,682,422.00 | 7.95 |
| TOTAL | 54,314,705,712.27 | 100.00 |
| Vicki L. Fuller | ||
| Affirmative | 50,146,578,363.15 | 92.33 |
| Withheld | 4,168,127,349.12 | 7.67 |
| TOTAL | 54,314,705,712.27 | 100.00 |
| Patricia L. Kampling | ||
| Affirmative | 50,227,895,949.71 | 92.48 |
| Withheld | 4,086,809,762.56 | 7.52 |
| TOTAL | 54,314,705,712.27 | 100.00 |
| Thomas A. Kennedy | ||
| Affirmative | 50,080,160,698.34 | 92.20 |
| Withheld | 4,234,545,013.93 | 7.80 |
| TOTAL | 54,314,705,712.27 | 100.00 |
| Oscar Munoz | ||
| Affirmative | 49,879,616,445.58 | 91.83 |
| Withheld | 4,435,089,266.69 | 8.17 |
| TOTAL | 54,314,705,712.27 | 100.00 |
| Karen B. Peetz | ||
| Affirmative | 50,078,105,799.58 | 92.20 |
| Withheld | 4,236,599,912.69 | 7.80 |
| TOTAL | 54,314,705,712.27 | 100.00 |
| David M. Thomas | ||
| Affirmative | 50,013,939,190.36 | 92.08 |
| Withheld | 4,300,766,521.91 | 7.92 |
| TOTAL | 54,314,705,712.27 | 100.00 |
| Susan Tomasky | ||
| Affirmative | 50,109,134,188.50 | 92.26 |
| Withheld | 4,205,571,523.77 | 7.74 |
| TOTAL | 54,314,705,712.27 | 100.00 |
| Michael E. Wiley | ||
| Affirmative | 50,016,526,096.47 | 92.09 |
| Withheld | 4,298,179,615.80 | 7.91 |
| TOTAL | 54,314,705,712.27 | 100.00 |
| Proposal 1 reflects trust-wide proposal and voting results. | ||
 |


Contents
| Common Stocks - 93.4% | |||
| Shares | Value ($) | ||
| Construction & Engineering - 0.2% | |||
| Construction & Engineering - 0.2% | |||
| Dycom Industries, Inc. (a) | 1,900 | 334,324 | |
| Diversified Telecommunication Services - 75.8% | |||
| Alternative Carriers - 28.6% | |||
| Anterix, Inc. (a) | 145,600 | 5,164,432 | |
| Bandwidth, Inc. Class A, (a) | 28,900 | 495,924 | |
| Cogent Communications Group, Inc. (b) | 136,639 | 9,561,997 | |
| GCI Liberty, Inc. Class A (Escrow) (c)(f) | 182,800 | 2 | |
| Globalstar, Inc. (a)(b) | 3,602,165 | 4,502,706 | |
| Iridium Communications, Inc. | 363,411 | 9,376,004 | |
| Liberty Global Ltd. Class C (b) | 351,336 | 6,910,779 | |
| Liberty Latin America Ltd. Class C (a) | 833,333 | 7,891,664 | |
| Lumen Technologies, Inc. (a)(b) | 2,326,300 | 12,213,075 | |
| 56,116,583 | |||
| Integrated Telecommunication Services - 47.2% | |||
| AT&T, Inc. | 2,291,120 | 45,593,288 | |
| ATN International, Inc. | 2,100 | 56,196 | |
| Consolidated Communications Holdings, Inc. (a) | 410,600 | 1,876,442 | |
| Frontier Communications Parent, Inc. (a) | 150,000 | 4,320,000 | |
| IDT Corp. Class B | 52,300 | 2,006,228 | |
| Shenandoah Telecommunications Co. | 5,623 | 85,020 | |
| Verizon Communications, Inc. | 923,097 | 38,566,993 | |
| 92,504,167 | |||
TOTAL DIVERSIFIED TELECOMMUNICATION SERVICES | 148,620,750 | ||
| IT Services - 0.6% | |||
| IT Consulting & Other Services - 0.6% | |||
| Amdocs Ltd. | 14,000 | 1,217,580 | |
| Media - 4.1% | |||
| Cable & Satellite - 4.1% | |||
| Charter Communications, Inc. Class A (a) | 5,600 | 1,946,224 | |
| Comcast Corp. Class A | 93,500 | 3,699,795 | |
| Liberty Broadband Corp. Class C (a) | 39,024 | 2,434,317 | |
| 8,080,336 | |||
| Wireless Telecommunication Services - 12.7% | |||
| Wireless Telecommunication Services - 12.7% | |||
| Gogo, Inc. (a)(b) | 713,127 | 5,683,622 | |
| T-Mobile U.S., Inc. | 47,224 | 9,384,353 | |
| Telephone & Data Systems, Inc. (b) | 278,964 | 6,589,130 | |
| U.S. Cellular Corp. (a) | 59,100 | 3,287,142 | |
| 24,944,247 | |||
| TOTAL COMMON STOCKS (Cost $156,238,096) | 183,197,237 | ||
| Money Market Funds - 19.5% | |||
| Shares | Value ($) | ||
| Fidelity Cash Central Fund 5.39% (d) | 14,365,457 | 14,368,330 | |
| Fidelity Securities Lending Cash Central Fund 5.39% (d)(e) | 23,921,184 | 23,923,576 | |
| TOTAL MONEY MARKET FUNDS (Cost $38,291,906) | 38,291,906 | ||
| TOTAL INVESTMENT IN SECURITIES - 112.9% (Cost $194,530,002) | 221,489,143 |
NET OTHER ASSETS (LIABILITIES) - (12.9)% | (25,330,861) |
| NET ASSETS - 100.0% | 196,158,282 |
| (a) | Non-income producing |
| (b) | Security or a portion of the security is on loan at period end. |
| (c) | Level 3 security |
| (d) | Affiliated fund that is generally available only to investment companies and other accounts managed by Fidelity Investments. The rate quoted is the annualized seven-day yield of the fund at period end. A complete unaudited listing of the fund's holdings as of its most recent quarter end is available upon request. In addition, each Fidelity Central Fund's financial statements are available on the SEC's website or upon request. |
| (e) | Investment made with cash collateral received from securities on loan. |
| (f) | Restricted securities (including private placements) - Investment in securities not registered under the Securities Act of 1933 (excluding 144A issues). At the end of the period, the value of restricted securities (excluding 144A issues) amounted to $2 or 0.0% of net assets. |
| Additional information on each restricted holding is as follows: | ||
| Security | Acquisition Date | Acquisition Cost ($) |
| GCI Liberty, Inc. Class A (Escrow) | 5/23/23 | 0 |
| Affiliate | Value, beginning of period ($) | Purchases ($) | Sales Proceeds ($) | Dividend Income ($) | Realized Gain (loss) ($) | Change in Unrealized appreciation (depreciation) ($) | Value, end of period ($) | % ownership, end of period |
| Fidelity Cash Central Fund 5.39% | 2,487,272 | 27,207,911 | 15,326,807 | 32,484 | (46) | - | 14,368,330 | 0.0% |
| Fidelity Securities Lending Cash Central Fund 5.39% | 17,517,951 | 104,352,839 | 97,947,214 | 7,558 | - | - | 23,923,576 | 0.1% |
| Total | 20,005,223 | 131,560,750 | 113,274,021 | 40,042 | (46) | - | 38,291,906 | |
| Valuation Inputs at Reporting Date: | ||||
| Description | Total ($) | Level 1 ($) | Level 2 ($) | Level 3 ($) |
Investments in Securities: | ||||
| Common Stocks | 183,197,237 | 183,197,235 | - | 2 |
| Money Market Funds | 38,291,906 | 38,291,906 | - | - |
| Total Investments in Securities: | 221,489,143 | 221,489,141 | - | 2 |
| Statement of Assets and Liabilities | ||||
| As of August 31, 2024 (Unaudited) | ||||
| Assets | ||||
| Investment in securities, at value (including securities loaned of $23,135,198) - See accompanying schedule: | ||||
Unaffiliated issuers (cost $156,238,096) | $ | 183,197,237 | ||
Fidelity Central Funds (cost $38,291,906) | 38,291,906 | |||
| Total Investment in Securities (cost $194,530,002) | $ | 221,489,143 | ||
| Foreign currency held at value (cost $21,712) | 23,389 | |||
| Receivable for investments sold | 1,952,965 | |||
| Receivable for fund shares sold | 434,002 | |||
| Dividends receivable | 180,257 | |||
| Distributions receivable from Fidelity Central Funds | 16,832 | |||
| Prepaid expenses | 491 | |||
| Other receivables | 4,551 | |||
Total assets | 224,101,630 | |||
| Liabilities | ||||
| Payable for investments purchased | $ | 3,729,898 | ||
| Payable for fund shares redeemed | 142,646 | |||
| Accrued management fee | 108,924 | |||
| Distribution and service plan fees payable | 8,237 | |||
| Other payables and accrued expenses | 30,543 | |||
| Collateral on securities loaned | 23,923,100 | |||
| Total liabilities | 27,943,348 | |||
| Net Assets | $ | 196,158,282 | ||
| Net Assets consist of: | ||||
| Paid in capital | $ | 194,220,954 | ||
| Total accumulated earnings (loss) | 1,937,328 | |||
| Net Assets | $ | 196,158,282 | ||
| Net Asset Value and Maximum Offering Price | ||||
| Class A : | ||||
Net Asset Value and redemption price per share ($16,873,863 ÷ 334,568 shares)(a) | $ | 50.43 | ||
| Maximum offering price per share (100/94.25 of $50.43) | $ | 53.51 | ||
| Class M : | ||||
Net Asset Value and redemption price per share ($6,778,079 ÷ 135,534 shares)(a) | $ | 50.01 | ||
| Maximum offering price per share (100/96.50 of $50.01) | $ | 51.82 | ||
| Class C : | ||||
Net Asset Value and offering price per share ($2,203,072 ÷ 43,820 shares)(a) | $ | 50.28 | ||
| Telecommunications : | ||||
Net Asset Value, offering price and redemption price per share ($159,114,470 ÷ 3,126,886 shares) | $ | 50.89 | ||
| Class I : | ||||
Net Asset Value, offering price and redemption price per share ($9,066,048 ÷ 178,613 shares) | $ | 50.76 | ||
| Class Z : | ||||
Net Asset Value, offering price and redemption price per share ($2,122,750 ÷ 41,953 shares) | $ | 50.60 | ||
(a)Redemption price per share is equal to net asset value less any applicable contingent deferred sales charge. | ||||
| Statement of Operations | ||||
Six months ended August 31, 2024 (Unaudited) | ||||
| Investment Income | ||||
| Dividends | $ | 3,479,891 | ||
| Income from Fidelity Central Funds (including $7,558 from security lending) | 40,042 | |||
| Total income | 3,519,933 | |||
| Expenses | ||||
| Management fee | $ | 609,126 | ||
| Distribution and service plan fees | 47,756 | |||
| Custodian fees and expenses | 3,063 | |||
| Independent trustees' fees and expenses | 379 | |||
| Registration fees | 45,070 | |||
| Audit fees | 29,460 | |||
| Legal | 44 | |||
| Miscellaneous | 5,661 | |||
| Total expenses before reductions | 740,559 | |||
| Expense reductions | (3,793) | |||
| Total expenses after reductions | 736,766 | |||
| Net Investment income (loss) | 2,783,167 | |||
| Realized and Unrealized Gain (Loss) | ||||
| Net realized gain (loss) on: | ||||
| Investment Securities: | ||||
| Unaffiliated issuers | (578,887) | |||
| Fidelity Central Funds | (46) | |||
| Total net realized gain (loss) | (578,933) | |||
| Change in net unrealized appreciation (depreciation) on: | ||||
| Investment Securities: | ||||
| Unaffiliated issuers | 23,633,504 | |||
| Assets and liabilities in foreign currencies | (468) | |||
| Total change in net unrealized appreciation (depreciation) | 23,633,036 | |||
| Net gain (loss) | 23,054,103 | |||
| Net increase (decrease) in net assets resulting from operations | $ | 25,837,270 | ||
| Statement of Changes in Net Assets | ||||
Six months ended August 31, 2024 (Unaudited) | Year ended February 29, 2024 | |||
| Increase (Decrease) in Net Assets | ||||
| Operations | ||||
| Net investment income (loss) | $ | 2,783,167 | $ | 5,171,877 |
| Net realized gain (loss) | (578,933) | (25,062,084) | ||
| Change in net unrealized appreciation (depreciation) | 23,633,036 | 13,381,305 | ||
| Net increase (decrease) in net assets resulting from operations | 25,837,270 | (6,508,902) | ||
| Distributions to shareholders | (2,049,046) | (7,597,238) | ||
| Share transactions - net increase (decrease) | (8,932,476) | (37,569,762) | ||
| Total increase (decrease) in net assets | 14,855,748 | (51,675,902) | ||
| Net Assets | ||||
| Beginning of period | 181,302,534 | 232,978,436 | ||
| End of period | $ | 196,158,282 | $ | 181,302,534 |
Fidelity Advisor® Telecommunications Fund Class A |
Six months ended (Unaudited) August 31, 2024 | Years ended February 28, 2024 A | 2023 | 2022 | 2021 | 2020 A | |||||||
Selected Per-Share Data | ||||||||||||
| Net asset value, beginning of period | $ | 44.20 | $ | 46.57 | $ | 54.28 | $ | 66.52 | $ | 60.60 | $ | 55.68 |
| Income from Investment Operations | ||||||||||||
Net investment income (loss) B,C | .65 | 1.06 | .93 | 1.51 D | .66 | .87 | ||||||
| Net realized and unrealized gain (loss) | 6.05 | (1.85) E | (5.19) | (5.14) | 10.61 | 5.86 | ||||||
| Total from investment operations | 6.70 | (.79) | (4.26) | (3.63) | 11.27 | 6.73 | ||||||
| Distributions from net investment income | (.47) | (1.10) | (.99) | (1.66) | (.39) | (.96) | ||||||
| Distributions from net realized gain | - | (.48) | (2.46) | (6.95) | (4.96) | (.85) | ||||||
| Total distributions | (.47) | (1.58) | (3.45) | (8.61) | (5.35) | (1.81) | ||||||
| Net asset value, end of period | $ | 50.43 | $ | 44.20 | $ | 46.57 | $ | 54.28 | $ | 66.52 | $ | 60.60 |
Total Return F,G,H | 15.29 % | (1.60)% E | (7.98)% | (6.28)% | 18.75% | 12.12% | ||||||
Ratios to Average Net Assets C,I,J | ||||||||||||
| Expenses before reductions | 1.06% K | 1.13% | 1.13% | 1.09% | 1.11% | 1.18% | ||||||
| Expenses net of fee waivers, if any | 1.06 % K | 1.13% | 1.13% | 1.09% | 1.11% | 1.17% | ||||||
| Expenses net of all reductions | 1.06% K | 1.12% | 1.13% | 1.09% | 1.10% | 1.17% | ||||||
| Net investment income (loss) | 2.86% K | 2.48% | 1.89% | 2.27% D | 1.01% | 1.47% | ||||||
| Supplemental Data | ||||||||||||
| Net assets, end of period (000 omitted) | $ | 16,874 | $ | 16,323 | $ | 18,744 | $ | 22,023 | $ | 29,800 | $ | 21,376 |
Portfolio turnover rate L | 29 % K | 26% | 24% | 28% | 58% | 58% |
Fidelity Advisor® Telecommunications Fund Class M |
Six months ended (Unaudited) August 31, 2024 | Years ended February 28, 2024 A | 2023 | 2022 | 2021 | 2020 A | |||||||
Selected Per-Share Data | ||||||||||||
| Net asset value, beginning of period | $ | 43.84 | $ | 46.21 | $ | 53.88 | $ | 66.09 | $ | 60.25 | $ | 55.40 |
| Income from Investment Operations | ||||||||||||
Net investment income (loss) B,C | .59 | .95 | .80 | 1.29 D | .46 | .70 | ||||||
| Net realized and unrealized gain (loss) | 6.01 | (1.84) E | (5.14) | (5.08) | 10.54 | 5.83 | ||||||
| Total from investment operations | 6.60 | (.89) | (4.34) | (3.79) | 11.00 | 6.53 | ||||||
| Distributions from net investment income | (.43) | (1.00) | (.86) | (1.48) | (.20) | (.83) | ||||||
| Distributions from net realized gain | - | (.48) | (2.46) | (6.95) | (4.96) | (.85) | ||||||
| Total distributions | (.43) | (1.48) | (3.33) F | (8.42) F | (5.16) | (1.68) | ||||||
| Net asset value, end of period | $ | 50.01 | $ | 43.84 | $ | 46.21 | $ | 53.88 | $ | 66.09 | $ | 60.25 |
Total Return G,H,I | 15.16 % | (1.84)% E | (8.21)% | (6.55)% | 18.39% | 11.81% | ||||||
Ratios to Average Net Assets C,J,K | ||||||||||||
| Expenses before reductions | 1.31% L | 1.38% | 1.39% | 1.39% | 1.41% | 1.46% | ||||||
| Expenses net of fee waivers, if any | 1.31 % L | 1.38% | 1.38% | 1.38% | 1.41% | 1.46% | ||||||
| Expenses net of all reductions | 1.31% L | 1.37% | 1.38% | 1.38% | 1.40% | 1.45% | ||||||
| Net investment income (loss) | 2.61% L | 2.23% | 1.64% | 1.97% D | .71% | 1.19% | ||||||
| Supplemental Data | ||||||||||||
| Net assets, end of period (000 omitted) | $ | 6,778 | $ | 6,380 | $ | 7,301 | $ | 7,733 | $ | 9,038 | $ | 6,919 |
Portfolio turnover rate M | 29 % L | 26% | 24% | 28% | 58% | 58% |
Fidelity Advisor® Telecommunications Fund Class C |
Six months ended (Unaudited) August 31, 2024 | Years ended February 28, 2024 A | 2023 | 2022 | 2021 | 2020 A | |||||||
Selected Per-Share Data | ||||||||||||
| Net asset value, beginning of period | $ | 44.05 | $ | 46.38 | $ | 54.04 | $ | 66.17 | $ | 60.32 | $ | 55.45 |
| Income from Investment Operations | ||||||||||||
Net investment income (loss) B,C | .48 | .74 | .56 | 1.01 D | .17 | .46 | ||||||
| Net realized and unrealized gain (loss) | 6.04 | (1.85) E | (5.15) | (5.09) | 10.54 | 5.82 | ||||||
| Total from investment operations | 6.52 | (1.11) | (4.59) | (4.08) | 10.71 | 6.28 | ||||||
| Distributions from net investment income | (.29) | (.75) | (.61) | (1.10) | (.07) | (.56) | ||||||
| Distributions from net realized gain | - | (.48) | (2.46) | (6.95) | (4.79) | (.85) | ||||||
| Total distributions | (.29) | (1.22) F | (3.07) | (8.05) | (4.86) | (1.41) | ||||||
| Net asset value, end of period | $ | 50.28 | $ | 44.05 | $ | 46.38 | $ | 54.04 | $ | 66.17 | $ | 60.32 |
Total Return G,H,I | 14.88 % | (2.33)% E | (8.66)% | (6.97)% | 17.88% | 11.34% | ||||||
Ratios to Average Net Assets C,J,K | ||||||||||||
| Expenses before reductions | 1.81% L | 1.88% | 1.88% | 1.83% | 1.86% | 1.88% | ||||||
| Expenses net of fee waivers, if any | 1.81 % L | 1.88% | 1.87% | 1.83% | 1.86% | 1.87% | ||||||
| Expenses net of all reductions | 1.81% L | 1.87% | 1.87% | 1.83% | 1.84% | 1.87% | ||||||
| Net investment income (loss) | 2.11% L | 1.73% | 1.15% | 1.52% D | .26% | .77% | ||||||
| Supplemental Data | ||||||||||||
| Net assets, end of period (000 omitted) | $ | 2,203 | $ | 2,547 | $ | 3,923 | $ | 5,254 | $ | 7,801 | $ | 6,491 |
Portfolio turnover rate M | 29 % L | 26% | 24% | 28% | 58% | 58% |
Telecommunications Portfolio |
Six months ended (Unaudited) August 31, 2024 | Years ended February 28, 2024 A | 2023 | 2022 | 2021 | 2020 A | |||||||
Selected Per-Share Data | ||||||||||||
| Net asset value, beginning of period | $ | 44.59 | $ | 46.97 | $ | 54.73 | $ | 67.04 | $ | 60.99 | $ | 56.04 |
| Income from Investment Operations | ||||||||||||
Net investment income (loss) B,C | .73 | 1.20 | 1.09 | 1.71 D | .86 | 1.09 | ||||||
| Net realized and unrealized gain (loss) | 6.11 | (1.87) E | (5.24) | (5.18) | 10.71 | 5.90 | ||||||
| Total from investment operations | 6.84 | (.67) | (4.15) | (3.47) | 11.57 | 6.99 | ||||||
| Distributions from net investment income | (.54) | (1.23) | (1.15) | (1.89) | (.57) | (1.19) | ||||||
| Distributions from net realized gain | - | (.48) | (2.46) | (6.95) | (4.96) | (.85) | ||||||
| Total distributions | (.54) | (1.71) | (3.61) | (8.84) | (5.52) F | (2.04) | ||||||
| Net asset value, end of period | $ | 50.89 | $ | 44.59 | $ | 46.97 | $ | 54.73 | $ | 67.04 | $ | 60.99 |
Total Return G,H | 15.48 % | (1.33)% E | (7.71)% | (5.99)% | 19.15% | 12.50% | ||||||
Ratios to Average Net Assets B,I,J | ||||||||||||
| Expenses before reductions | .77% K | .85% | .82% | .79% | .81% | .83% | ||||||
| Expenses net of fee waivers, if any | .76 % K | .84% | .82% | .79% | .81% | .82% | ||||||
| Expenses net of all reductions | .76% K | .84% | .82% | .79% | .79% | .82% | ||||||
| Net investment income (loss) | 3.15% K | 2.75% | 2.20% | 2.57% D | 1.31% | 1.82% | ||||||
| Supplemental Data | ||||||||||||
| Net assets, end of period (000 omitted) | $ | 159,114 | $ | 147,413 | $ | 171,885 | $ | 199,560 | $ | 242,284 | $ | 219,854 |
Portfolio turnover rate L | 29 % K | 26% | 24% | 28% | 58% | 58% |
Fidelity Advisor® Telecommunications Fund Class I |
Six months ended (Unaudited) August 31, 2024 | Years ended February 28, 2024 A | 2023 | 2022 | 2021 | 2020 A | |||||||
Selected Per-Share Data | ||||||||||||
| Net asset value, beginning of period | $ | 44.49 | $ | 46.84 | $ | 54.58 | $ | 66.84 | $ | 60.86 | $ | 55.84 |
| Income from Investment Operations | ||||||||||||
Net investment income (loss) B,C | .73 | 1.23 | 1.10 | 1.74 D | .88 | 1.04 | ||||||
| Net realized and unrealized gain (loss) | 6.08 | (1.87) E | (5.21) | (5.18) | 10.66 | 5.91 | ||||||
| Total from investment operations | 6.81 | (.64) | (4.11) | (3.44) | 11.54 | 6.95 | ||||||
| Distributions from net investment income | (.54) | (1.23) | (1.16) | (1.87) | (.60) | (1.08) | ||||||
| Distributions from net realized gain | - | (.48) | (2.46) | (6.95) | (4.96) | (.85) | ||||||
| Total distributions | (.54) | (1.71) | (3.63) F | (8.82) | (5.56) | (1.93) | ||||||
| Net asset value, end of period | $ | 50.76 | $ | 44.49 | $ | 46.84 | $ | 54.58 | $ | 66.84 | $ | 60.86 |
Total Return G,H | 15.47 % | (1.25)% E | (7.67)% | (5.97)% | 19.13% | 12.47% | ||||||
Ratios to Average Net Assets C,I,J | ||||||||||||
| Expenses before reductions | .76% K | .80% | .78% | .77% | .79% | .88% | ||||||
| Expenses net of fee waivers, if any | .76 % K | .79% | .78% | .77% | .79% | .88% | ||||||
| Expenses net of all reductions | .76% K | .79% | .78% | .77% | .78% | .88% | ||||||
| Net investment income (loss) | 3.16% K | 2.81% | 2.25% | 2.59% D | 1.33% | 1.76% | ||||||
| Supplemental Data | ||||||||||||
| Net assets, end of period (000 omitted) | $ | 9,066 | $ | 6,344 | $ | 28,441 | $ | 12,038 | $ | 30,622 | $ | 12,428 |
Portfolio turnover rate L | 29 % K | 26% | 24% | 28% | 58% | 58% |
Fidelity Advisor® Telecommunications Fund Class Z |
Six months ended (Unaudited) August 31, 2024 | Years ended February 28, 2024 A | 2023 | 2022 | 2021 | 2020 A | |||||||
Selected Per-Share Data | ||||||||||||
| Net asset value, beginning of period | $ | 44.34 | $ | 46.72 | $ | 54.46 | $ | 66.75 | $ | 60.75 | $ | 55.84 |
| Income from Investment Operations | ||||||||||||
Net investment income (loss) B,C | .75 | 1.26 | 1.18 | 1.83 D | .95 | 1.20 | ||||||
| Net realized and unrealized gain (loss) | 6.07 | (1.86) E | (5.23) | (5.20) | 10.67 | 5.86 | ||||||
| Total from investment operations | 6.82 | (.60) | (4.05) | (3.37) | 11.62 | 7.06 | ||||||
| Distributions from net investment income | (.56) | (1.31) | (1.22) | (1.98) | (.67) | (1.30) | ||||||
| Distributions from net realized gain | - | (.48) | (2.46) | (6.95) | (4.96) | (.85) | ||||||
| Total distributions | (.56) | (1.78) | (3.69) F | (8.92) F | (5.62) F | (2.15) | ||||||
| Net asset value, end of period | $ | 50.60 | $ | 44.34 | $ | 46.72 | $ | 54.46 | $ | 66.75 | $ | 60.75 |
Total Return G,H | 15.54 % | (1.16)% E | (7.56)% | (5.87)% | 19.31% | 12.68% | ||||||
Ratios to Average Net Assets C,I,J | ||||||||||||
| Expenses before reductions | .65% K | .69% | .67% | .65% | .67% | .68% | ||||||
| Expenses net of fee waivers, if any | .65 % K | .68% | .66% | .65% | .67% | .67% | ||||||
| Expenses net of all reductions | .65% K | .68% | .66% | .65% | .65% | .67% | ||||||
| Net investment income (loss) | 3.27% K | 2.92% | 2.36% | 2.71% D | 1.45% | 1.97% | ||||||
| Supplemental Data | ||||||||||||
| Net assets, end of period (000 omitted) | $ | 2,123 | $ | 2,296 | $ | 2,685 | $ | 5,587 | $ | 31,271 | $ | 25,223 |
Portfolio turnover rate L | 29 % K | 26% | 24% | 28% | 58% | 58% |
| Fidelity Central Fund | Investment Manager | Investment Objective | Investment Practices | Expense RatioA |
| Fidelity Money Market Central Funds | Fidelity Management & Research Company LLC (FMR) | Each fund seeks to obtain a high level of current income consistent with the preservation of capital and liquidity. | Short-term Investments | Less than .005% |
| Gross unrealized appreciation | $37,453,999 |
| Gross unrealized depreciation | (11,289,002) |
| Net unrealized appreciation (depreciation) | $26,164,997 |
| Tax cost | $195,324,146 |
Short-term | $(2,815,930) |
Long-term | (21,567,501) |
| Total capital loss carryforward | $(24,383,431) |
| Purchases ($) | Sales ($) | |
| Telecommunications Portfolio | 25,861,504 | 43,321,301 |
| Maximum Management Fee Rate % | |
| Class A | .72 |
| Class M | .72 |
| Class C | .72 |
| Telecommunications | .72 |
| Class I | .67 |
| Class Z | .56 |
| Total Management Fee Rate % | |
| Class A | .72 |
| Class M | .72 |
| Class C | .72 |
| Telecommunications | .67 |
| Class I | .67 |
| Class Z | .56 |
| Distribution Fee | Service Fee | Total Fees ($) | Retained by FDC ($) | |
| Class A | - % | .25% | 20,169 | 177 |
| Class M | .25% | .25% | 16,196 | - |
| Class C | .75% | .25% | 11,391 | 640 |
| 47,756 | 817 |
| Retained by FDC ($) | |
| Class A | 1,691 |
| Class M | 163 |
Class CA | 16 |
1,870 |
| Amount ($) | |
| Telecommunications Portfolio | 12,560 |
| Purchases ($) | Sales ($) | Realized Gain (Loss)($) | |
| Telecommunications Portfolio | 4,876,756 | 2,329,964 | (1,170,846) |
| Amount ($) | |
| Telecommunications Portfolio | 158 |
| Total Security Lending Fees Paid to NFS ($) | Security Lending Income From Securities Loaned to NFS ($) | Value of Securities Loaned to NFS at Period End ($) | |
| Telecommunications Portfolio | 762 | - | - |
Six months ended August 31, 2024 | Year ended February 29, 2024 | |
| Telecommunications Portfolio | ||
| Distributions to shareholders | ||
| Class A | $166,472 | $608,617 |
| Class M | 61,713 | 226,115 |
| Class C | 14,496 | 88,039 |
| Telecommunications | 1,706,511 | 5,963,168 |
| Class I | 75,146 | 598,796 |
| Class Z | 24,708 | 112,503 |
Total | $2,049,046 | $7,597,238 |
| Shares | Shares | Dollars | Dollars | |
Six months ended August 31, 2024 | Year ended February 29, 2024 | Six months ended August 31, 2024 | Year ended February 29, 2024 | |
| Telecommunications Portfolio | ||||
| Class A | ||||
| Shares sold | 20,590 | 43,001 | $936,825 | $1,846,776 |
| Reinvestment of distributions | 3,550 | 13,440 | 160,072 | 586,014 |
| Shares redeemed | (58,832) | (89,654) | (2,693,871) | (3,795,896) |
| Net increase (decrease) | (34,692) | (33,213) | $(1,596,974) | $(1,363,106) |
| Class M | ||||
| Shares sold | 15,647 | 29,602 | $703,619 | $1,262,425 |
| Reinvestment of distributions | 1,373 | 5,207 | 61,458 | 225,496 |
| Shares redeemed | (27,012) | (47,271) | (1,218,751) | (2,010,396) |
| Net increase (decrease) | (9,992) | (12,462) | $(453,674) | $(522,475) |
| Class C | ||||
| Shares sold | 1,228 | 5,255 | $55,150 | $224,808 |
| Reinvestment of distributions | 313 | 1,964 | 14,120 | 86,122 |
| Shares redeemed | (15,535) | (33,986) | (701,362) | (1,431,291) |
| Net increase (decrease) | (13,994) | (26,767) | $(632,092) | $(1,120,361) |
| Telecommunications | ||||
| Shares sold | 277,138 | 643,117 | $13,143,732 | $27,478,363 |
| Reinvestment of distributions | 34,643 | 125,072 | 1,574,503 | 5,494,243 |
| Shares redeemed | (490,799) | (1,121,615) | (22,429,257) | (48,452,953) |
| Net increase (decrease) | (179,018) | (353,426) | $(7,711,022) | $(15,480,347) |
| Class I | ||||
| Shares sold | 78,665 | 92,263 | $3,838,670 | $3,962,229 |
| Reinvestment of distributions | 1,626 | 13,260 | 73,781 | 594,502 |
| Shares redeemed | (44,272) | (570,092) | (2,028,692) | (23,438,458) |
| Net increase (decrease) | 36,019 | (464,569) | $1,883,759 | $(18,881,727) |
| Class Z | ||||
| Shares sold | 5,919 | 45,276 | $274,983 | $1,933,594 |
| Reinvestment of distributions | 411 | 1,463 | 18,510 | 63,497 |
| Shares redeemed | (16,159) | (52,424) | (715,966) | (2,198,837) |
| Net increase (decrease) | (9,829) | (5,685) | $(422,473) | $(201,746) |
| Common Stocks - 99.1% | |||
| Shares | Value ($) | ||
| Broadline Retail - 2.9% | |||
| Broadline Retail - 2.9% | |||
| Amazon.com, Inc. (a) | 55,300 | 9,871,050 | |
| Communications Equipment - 6.2% | |||
| Communications Equipment - 6.2% | |||
| Motorola Solutions, Inc. | 36,668 | 16,208,723 | |
| Nokia Corp. sponsored ADR (b) | 850,100 | 3,791,446 | |
| ViaSat, Inc. (a)(b) | 63,901 | 1,003,246 | |
| 21,003,415 | |||
| Diversified Telecommunication Services - 18.4% | |||
| Alternative Carriers - 3.0% | |||
| GCI Liberty, Inc. Class A (Escrow) (c)(g) | 112,300 | 1 | |
| Iridium Communications, Inc. | 49,900 | 1,287,420 | |
| Liberty Global Ltd. Class A | 345,600 | 6,687,360 | |
| Liberty Latin America Ltd. Class C (a) | 228,600 | 2,164,842 | |
| 10,139,623 | |||
| Integrated Telecommunication Services - 15.4% | |||
| AT&T, Inc. | 1,856,500 | 36,944,350 | |
| Cellnex Telecom SA (d) | 85,915 | 3,317,615 | |
| Quebecor, Inc. Class A | 64,833 | 1,606,813 | |
| Shenandoah Telecommunications Co. | 300 | 4,536 | |
| Telefonica SA sponsored ADR (b) | 729,049 | 3,295,301 | |
| Verizon Communications, Inc. | 171,101 | 7,148,600 | |
| 52,317,215 | |||
TOTAL DIVERSIFIED TELECOMMUNICATION SERVICES | 62,456,838 | ||
| Entertainment - 2.8% | |||
| Movies & Entertainment - 2.8% | |||
| Spotify Technology SA (a) | 27,500 | 9,429,200 | |
| Equity Real Estate Investment Trusts (REITs) - 10.6% | |||
| Telecom Tower REITs - 10.6% | |||
| American Tower Corp. | 130,792 | 29,305,256 | |
| Crown Castle, Inc. | 12,901 | 1,445,170 | |
| SBA Communications Corp. Class A | 23,000 | 5,213,180 | |
| 35,963,606 | |||
| Ground Transportation - 1.5% | |||
| Passenger Ground Transportation - 1.5% | |||
| Uber Technologies, Inc. (a) | 71,600 | 5,236,108 | |
| Interactive Media & Services - 4.6% | |||
| Interactive Media & Services - 4.6% | |||
| Bumble, Inc. Class A (a) | 231,900 | 1,556,049 | |
| Match Group, Inc. (a) | 14,500 | 539,545 | |
| Meta Platforms, Inc. Class A | 16,600 | 8,653,746 | |
| Pinterest, Inc. Class A (a) | 54,500 | 1,746,180 | |
| Snap, Inc. Class A (a) | 325,800 | 3,042,972 | |
| 15,538,492 | |||
| Media - 0.0% | |||
| Advertising - 0.0% | |||
| Ibotta, Inc. | 100 | 5,719 | |
| Oil, Gas & Consumable Fuels - 1.3% | |||
| Oil & Gas Refining & Marketing - 1.3% | |||
| Reliance Industries Ltd. | 119,400 | 4,300,095 | |
| Semiconductors & Semiconductor Equipment - 18.2% | |||
| Semiconductors - 18.2% | |||
| Marvell Technology, Inc. | 325,200 | 24,793,248 | |
| NXP Semiconductors NV | 26,500 | 6,793,540 | |
| Qorvo, Inc. (a) | 71,200 | 8,251,368 | |
| Qualcomm, Inc. | 93,850 | 16,451,905 | |
| STMicroelectronics NV (depository receipt) | 173,200 | 5,533,740 | |
| 61,823,801 | |||
| Software - 0.0% | |||
| Application Software - 0.0% | |||
| LivePerson, Inc. (a) | 84,000 | 103,320 | |
| Technology Hardware, Storage & Peripherals - 22.0% | |||
| Technology Hardware, Storage & Peripherals - 22.0% | |||
| Apple, Inc. | 291,720 | 66,803,880 | |
| Samsung Electronics Co. Ltd. | 140,670 | 7,814,591 | |
| 74,618,471 | |||
| Wireless Telecommunication Services - 10.6% | |||
| Wireless Telecommunication Services - 10.6% | |||
| Rogers Communications, Inc. Class B (non-vtg.) | 183,000 | 7,418,313 | |
| Spok Holdings, Inc. | 1 | 15 | |
| T-Mobile U.S., Inc. | 78,816 | 15,662,316 | |
| U.S. Cellular Corp. (a) | 184,500 | 10,261,890 | |
| Vodafone Group PLC sponsored ADR | 285,981 | 2,794,034 | |
| 36,136,568 | |||
| TOTAL COMMON STOCKS (Cost $221,078,404) | 336,486,683 | ||
| Money Market Funds - 3.1% | |||
| Shares | Value ($) | ||
| Fidelity Cash Central Fund 5.39% (e) | 3,666,537 | 3,667,270 | |
| Fidelity Securities Lending Cash Central Fund 5.39% (e)(f) | 7,091,520 | 7,092,229 | |
| TOTAL MONEY MARKET FUNDS (Cost $10,759,499) | 10,759,499 | ||
| TOTAL INVESTMENT IN SECURITIES - 102.2% (Cost $231,837,903) | 347,246,182 |
NET OTHER ASSETS (LIABILITIES) - (2.2)% | (7,620,246) |
| NET ASSETS - 100.0% | 339,625,936 |
| (a) | Non-income producing |
| (b) | Security or a portion of the security is on loan at period end. |
| (c) | Level 3 security |
| (d) | Security exempt from registration under Rule 144A of the Securities Act of 1933. These securities may be resold in transactions exempt from registration, normally to qualified institutional buyers. At the end of the period, the value of these securities amounted to $3,317,615 or 1.0% of net assets. |
| (e) | Affiliated fund that is generally available only to investment companies and other accounts managed by Fidelity Investments. The rate quoted is the annualized seven-day yield of the fund at period end. A complete unaudited listing of the fund's holdings as of its most recent quarter end is available upon request. In addition, each Fidelity Central Fund's financial statements are available on the SEC's website or upon request. |
| (f) | Investment made with cash collateral received from securities on loan. |
| (g) | Restricted securities (including private placements) - Investment in securities not registered under the Securities Act of 1933 (excluding 144A issues). At the end of the period, the value of restricted securities (excluding 144A issues) amounted to $1 or 0.0% of net assets. |
| Additional information on each restricted holding is as follows: | ||
| Security | Acquisition Date | Acquisition Cost ($) |
| GCI Liberty, Inc. Class A (Escrow) | 5/23/23 | 0 |
| Affiliate | Value, beginning of period ($) | Purchases ($) | Sales Proceeds ($) | Dividend Income ($) | Realized Gain (loss) ($) | Change in Unrealized appreciation (depreciation) ($) | Value, end of period ($) | % ownership, end of period |
| Fidelity Cash Central Fund 5.39% | - | 52,322,641 | 48,655,429 | 90,278 | 58 | - | 3,667,270 | 0.0% |
| Fidelity Securities Lending Cash Central Fund 5.39% | 13,115,605 | 96,913,143 | 102,936,519 | 14,987 | - | - | 7,092,229 | 0.0% |
| Total | 13,115,605 | 149,235,784 | 151,591,948 | 105,265 | 58 | - | 10,759,499 | |
| Valuation Inputs at Reporting Date: | ||||
| Description | Total ($) | Level 1 ($) | Level 2 ($) | Level 3 ($) |
Investments in Securities: | ||||
| Common Stocks | 336,486,683 | 333,169,067 | 3,317,615 | 1 |
| Money Market Funds | 10,759,499 | 10,759,499 | - | - |
| Total Investments in Securities: | 347,246,182 | 343,928,566 | 3,317,615 | 1 |
| Statement of Assets and Liabilities | ||||
| As of August 31, 2024 (Unaudited) | ||||
| Assets | ||||
| Investment in securities, at value (including securities loaned of $6,717,754) - See accompanying schedule: | ||||
Unaffiliated issuers (cost $221,078,404) | $ | 336,486,683 | ||
Fidelity Central Funds (cost $10,759,499) | 10,759,499 | |||
| Total Investment in Securities (cost $231,837,903) | $ | 347,246,182 | ||
| Cash | 1 | |||
| Foreign currency held at value (cost $79,829) | 79,829 | |||
| Receivable for forward foreign currency contracts | 70,485 | |||
| Receivable for fund shares sold | 47,151 | |||
| Dividends receivable | 178,592 | |||
| Distributions receivable from Fidelity Central Funds | 12,751 | |||
| Prepaid expenses | 665 | |||
| Other receivables | 11,556 | |||
Total assets | 347,647,212 | |||
| Liabilities | ||||
| Payable for investments purchased | $ | 244,008 | ||
| Payable for forward foreign currency contracts | 70,666 | |||
| Payable for fund shares redeemed | 55,751 | |||
| Accrued management fee | 184,625 | |||
| Other payables and accrued expenses | 373,927 | |||
| Collateral on securities loaned | 7,092,299 | |||
| Total liabilities | 8,021,276 | |||
| Net Assets | $ | 339,625,936 | ||
| Net Assets consist of: | ||||
| Paid in capital | $ | 210,509,429 | ||
| Total accumulated earnings (loss) | 129,116,507 | |||
| Net Assets | $ | 339,625,936 | ||
Net Asset Value, offering price and redemption price per share ($339,625,936 ÷ 26,200,808 shares) | $ | 12.96 | ||
| Statement of Operations | ||||
Six months ended August 31, 2024 (Unaudited) | ||||
| Investment Income | ||||
| Dividends | $ | 2,995,350 | ||
| Income from Fidelity Central Funds (including $14,987 from security lending) | 105,265 | |||
| Total income | 3,100,615 | |||
| Expenses | ||||
| Management fee | $ | 1,088,223 | ||
| Custodian fees and expenses | 6,707 | |||
| Independent trustees' fees and expenses | 684 | |||
| Registration fees | 33,469 | |||
| Audit fees | 43,909 | |||
| Legal | 78 | |||
| Proxy fee | 7,916 | |||
| Miscellaneous | 709 | |||
| Total expenses before reductions | 1,181,695 | |||
| Expense reductions | (6,812) | |||
| Total expenses after reductions | 1,174,883 | |||
| Net Investment income (loss) | 1,925,732 | |||
| Realized and Unrealized Gain (Loss) | ||||
| Net realized gain (loss) on: | ||||
| Investment Securities: | ||||
| Unaffiliated issuers (net of foreign taxes of $529,862) | 15,710,073 | |||
| Fidelity Central Funds | 58 | |||
| Foreign currency transactions | (5,687) | |||
| Total net realized gain (loss) | 15,704,444 | |||
| Change in net unrealized appreciation (depreciation) on: | ||||
| Investment Securities: | ||||
| Unaffiliated issuers (net of decrease in deferred foreign taxes of $360,637) | 20,778,213 | |||
| Assets and liabilities in foreign currencies | 3,218 | |||
| Total change in net unrealized appreciation (depreciation) | 20,781,431 | |||
| Net gain (loss) | 36,485,875 | |||
| Net increase (decrease) in net assets resulting from operations | $ | 38,411,607 | ||
| Statement of Changes in Net Assets | ||||
Six months ended August 31, 2024 (Unaudited) | Year ended February 29, 2024 | |||
| Increase (Decrease) in Net Assets | ||||
| Operations | ||||
| Net investment income (loss) | $ | 1,925,732 | $ | 3,559,413 |
| Net realized gain (loss) | 15,704,444 | 13,398,132 | ||
| Change in net unrealized appreciation (depreciation) | 20,781,431 | 39,060,568 | ||
| Net increase (decrease) in net assets resulting from operations | 38,411,607 | 56,018,113 | ||
| Distributions to shareholders | (10,285,564) | (7,837,214) | ||
| Share transactions | ||||
| Proceeds from sales of shares | 15,060,193 | 39,969,785 | ||
| Reinvestment of distributions | 9,517,308 | 7,189,424 | ||
| Cost of shares redeemed | (37,184,228) | (73,439,523) | ||
Net increase (decrease) in net assets resulting from share transactions | (12,606,727) | (26,280,314) | ||
| Total increase (decrease) in net assets | 15,519,316 | 21,900,585 | ||
| Net Assets | ||||
| Beginning of period | 324,106,620 | 302,206,035 | ||
| End of period | $ | 339,625,936 | $ | 324,106,620 |
| Other Information | ||||
| Shares | ||||
| Sold | 1,216,195 | 3,580,709 | ||
| Issued in reinvestment of distributions | 840,010 | 622,461 | ||
| Redeemed | (3,084,722) | (6,688,166) | ||
| Net increase (decrease) | (1,028,517) | (2,484,996) | ||
Wireless Portfolio |
Six months ended (Unaudited) August 31, 2024 | Years ended February 28, 2024 A | 2023 | 2022 | 2021 | 2020 A | |||||||
Selected Per-Share Data | ||||||||||||
| Net asset value, beginning of period | $ | 11.90 | $ | 10.17 | $ | 12.91 | $ | 13.34 | $ | 10.69 | $ | 8.93 |
| Income from Investment Operations | ||||||||||||
Net investment income (loss) B,C | .07 | .12 | .09 | .10 | .10 | .14 | ||||||
| Net realized and unrealized gain (loss) | 1.38 | 1.89 | (1.95) | .54 | 3.50 | 1.93 | ||||||
| Total from investment operations | 1.45 | 2.01 | (1.86) | .64 | 3.60 | 2.07 | ||||||
| Distributions from net investment income | (.02) | (.11) | (.09) | (.09) | (.10) | (.12) | ||||||
| Distributions from net realized gain | (.37) | (.17) | (.79) | (.98) | (.86) | (.19) | ||||||
| Total distributions | (.39) | (.28) | (.88) | (1.07) | (.95) D | (.31) | ||||||
| Net asset value, end of period | $ | 12.96 | $ | 11.90 | $ | 10.17 | $ | 12.91 | $ | 13.34 | $ | 10.69 |
Total Return E,F | 12.67 % | 19.83% | (14.79)% | 4.40% | 36.09% | 23.01% | ||||||
Ratios to Average Net Assets C,G,H | ||||||||||||
| Expenses before reductions | .73% I | .81% | .79% | .77% | .79% | .81% | ||||||
| Expenses net of fee waivers, if any | .73 % I | .80% | .79% | .77% | .79% | .81% | ||||||
| Expenses net of all reductions | .73% I | .80% | .79% | .77% | .78% | .81% | ||||||
| Net investment income (loss) | 1.19% I | 1.16% | .85% | .69% | .80% | 1.39% | ||||||
| Supplemental Data | ||||||||||||
| Net assets, end of period (000 omitted) | $ | 339,626 | $ | 324,107 | $ | 302,206 | $ | 403,566 | $ | 440,296 | $ | 355,309 |
Portfolio turnover rate J | 38 % I | 22% | 11% | 30% | 55% | 78% |
| Fidelity Central Fund | Investment Manager | Investment Objective | Investment Practices | Expense RatioA |
| Fidelity Money Market Central Funds | Fidelity Management & Research Company LLC (FMR) | Each fund seeks to obtain a high level of current income consistent with the preservation of capital and liquidity. | Short-term Investments | Less than .005% |
| Gross unrealized appreciation | $143,926,454 |
| Gross unrealized depreciation | (30,209,181) |
| Net unrealized appreciation (depreciation) | $113,717,273 |
| Tax cost | $233,528,909 |
| Purchases ($) | Sales ($) | |
| Wireless Portfolio | 60,720,872 | 74,901,989 |
| Maximum Management Fee Rate % | |
| Wireless Portfolio | .72 |
| Total Management Fee Rate % | |
| Wireless Portfolio | .67 |
| Amount ($) | |
| Wireless Portfolio | 1,379 |
| Purchases ($) | Sales ($) | Realized Gain (Loss)($) | |
| Wireless Portfolio | 2,837,255 | 820,849 | (25,541) |
| Amount ($) | |
| Wireless Portfolio | 285 |
| Total Security Lending Fees Paid to NFS ($) | Security Lending Income From Securities Loaned to NFS ($) | Value of Securities Loaned to NFS at Period End ($) | |
| Wireless Portfolio | 1,560 | 11 | - |
| A special meeting of shareholders was held on July 16, 2024. The results of votes taken among shareholders on the proposal before them are reported below. Each vote reported represents one dollar of net asset value held on the record date for the meeting. | ||
| Proposal 1 | ||
| To elect a Board of Trustees. | ||
# of Votes | % of Votes | |
| Bettina Doulton | ||
| Affirmative | 50,178,154,296.75 | 92.38 |
| Withheld | 4,136,551,415.53 | 7.62 |
| TOTAL | 54,314,705,712.27 | 100.00 |
| Robert A. Lawrence | ||
| Affirmative | 50,131,321,830.27 | 92.30 |
| Withheld | 4,183,383,882.00 | 7.70 |
| TOTAL | 54,314,705,712.27 | 100.00 |
| Vijay C. Advani | ||
| Affirmative | 50,021,870,319.77 | 92.10 |
| Withheld | 4,292,835,392.50 | 7.90 |
| TOTAL | 54,314,705,712.27 | 100.00 |
| Thomas P. Bostick | ||
| Affirmative | 50,057,248,681.17 | 92.16 |
| Withheld | 4,257,457,031.10 | 7.84 |
| TOTAL | 54,314,705,712.27 | 100.00 |
| Donald F. Donahue | ||
| Affirmative | 49,998,023,290.27 | 92.05 |
| Withheld | 4,316,682,422.00 | 7.95 |
| TOTAL | 54,314,705,712.27 | 100.00 |
| Vicki L. Fuller | ||
| Affirmative | 50,146,578,363.15 | 92.33 |
| Withheld | 4,168,127,349.12 | 7.67 |
| TOTAL | 54,314,705,712.27 | 100.00 |
| Patricia L. Kampling | ||
| Affirmative | 50,227,895,949.71 | 92.48 |
| Withheld | 4,086,809,762.56 | 7.52 |
| TOTAL | 54,314,705,712.27 | 100.00 |
| Thomas A. Kennedy | ||
| Affirmative | 50,080,160,698.34 | 92.20 |
| Withheld | 4,234,545,013.93 | 7.80 |
| TOTAL | 54,314,705,712.27 | 100.00 |
| Oscar Munoz | ||
| Affirmative | 49,879,616,445.58 | 91.83 |
| Withheld | 4,435,089,266.69 | 8.17 |
| TOTAL | 54,314,705,712.27 | 100.00 |
| Karen B. Peetz | ||
| Affirmative | 50,078,105,799.58 | 92.20 |
| Withheld | 4,236,599,912.69 | 7.80 |
| TOTAL | 54,314,705,712.27 | 100.00 |
| David M. Thomas | ||
| Affirmative | 50,013,939,190.36 | 92.08 |
| Withheld | 4,300,766,521.91 | 7.92 |
| TOTAL | 54,314,705,712.27 | 100.00 |
| Susan Tomasky | ||
| Affirmative | 50,109,134,188.50 | 92.26 |
| Withheld | 4,205,571,523.77 | 7.74 |
| TOTAL | 54,314,705,712.27 | 100.00 |
| Michael E. Wiley | ||
| Affirmative | 50,016,526,096.47 | 92.09 |
| Withheld | 4,298,179,615.80 | 7.91 |
| TOTAL | 54,314,705,712.27 | 100.00 |
| Proposal 1 reflects trust-wide proposal and voting results. | ||
 |


Contents
| Common Stocks - 99.1% | |||
| Shares | Value ($) | ||
| Aerospace & Defense - 96.0% | |||
| Aerospace & Defense - 96.0% | |||
| Axon Enterprise, Inc. (a) | 181,900 | 66,388,043 | |
| BAE Systems PLC | 495,300 | 8,905,390 | |
| Bombardier, Inc. Class B (sub. vtg.) (a) | 265,700 | 18,248,946 | |
| BWX Technologies, Inc. | 248,100 | 25,554,300 | |
| Curtiss-Wright Corp. | 118,800 | 37,524,168 | |
| General Dynamics Corp. | 334,500 | 100,135,920 | |
| General Electric Co. | 1,608,100 | 280,806,422 | |
| HEICO Corp. Class A | 430,300 | 86,098,727 | |
| Howmet Aerospace, Inc. | 890,100 | 86,037,066 | |
| Huntington Ingalls Industries, Inc. | 174,200 | 49,258,534 | |
| Kratos Defense & Security Solutions, Inc. (a) | 1,200,978 | 27,550,435 | |
| L3Harris Technologies, Inc. | 114,400 | 27,075,048 | |
| Leonardo DRS, Inc. (a) | 377,700 | 10,779,558 | |
| Loar Holdings, Inc. (b) | 1,600 | 118,656 | |
| Lockheed Martin Corp. | 263,300 | 149,580,730 | |
| MTU Aero Engines AG | 49,500 | 14,773,671 | |
| Northrop Grumman Corp. | 152,900 | 79,998,809 | |
| Rolls-Royce Holdings PLC (a) | 4,490,800 | 29,443,468 | |
| RTX Corp. | 1,397,300 | 172,342,982 | |
| Spirit AeroSystems Holdings, Inc. Class A (a) | 1,458,500 | 51,353,785 | |
| Textron, Inc. | 460,100 | 41,961,120 | |
| Thales SA | 77,700 | 13,055,216 | |
| The Boeing Co. (a) | 1,024,900 | 178,066,126 | |
| TransDigm Group, Inc. | 60,500 | 83,079,205 | |
| Triumph Group, Inc. (a) | 1,554,000 | 21,647,220 | |
| Woodward, Inc. | 204,300 | 34,046,595 | |
| 1,693,830,140 | |||
| Metals & Mining - 1.8% | |||
| Steel - 1.8% | |||
| ATI, Inc. (a) | 481,500 | 30,758,220 | |
| Professional Services - 0.8% | |||
| Research & Consulting Services - 0.8% | |||
| Leidos Holdings, Inc. | 87,600 | 13,885,476 | |
| Trading Companies & Distributors - 0.5% | |||
| Trading Companies & Distributors - 0.5% | |||
| FTAI Aviation Ltd. | 66,400 | 8,486,584 | |
| TOTAL COMMON STOCKS (Cost $1,014,162,069) | 1,746,960,420 | ||
| Money Market Funds - 0.9% | |||
| Shares | Value ($) | ||
| Fidelity Cash Central Fund 5.39% (c) | 15,830,666 | 15,833,832 | |
| Fidelity Securities Lending Cash Central Fund 5.39% (c)(d) | 113,239 | 113,250 | |
| TOTAL MONEY MARKET FUNDS (Cost $15,947,082) | 15,947,082 | ||
| TOTAL INVESTMENT IN SECURITIES - 100.0% (Cost $1,030,109,151) | 1,762,907,502 |
NET OTHER ASSETS (LIABILITIES) - 0.0% | 805,093 |
| NET ASSETS - 100.0% | 1,763,712,595 |
| (a) | Non-income producing |
| (b) | Security or a portion of the security is on loan at period end. |
| (c) | Affiliated fund that is generally available only to investment companies and other accounts managed by Fidelity Investments. The rate quoted is the annualized seven-day yield of the fund at period end. A complete unaudited listing of the fund's holdings as of its most recent quarter end is available upon request. In addition, each Fidelity Central Fund's financial statements are available on the SEC's website or upon request. |
| (d) | Investment made with cash collateral received from securities on loan. |
| Affiliate | Value, beginning of period ($) | Purchases ($) | Sales Proceeds ($) | Dividend Income ($) | Realized Gain (loss) ($) | Change in Unrealized appreciation (depreciation) ($) | Value, end of period ($) | % ownership, end of period |
| Fidelity Cash Central Fund 5.39% | 12,049,482 | 109,167,614 | 105,383,420 | 165,332 | 156 | - | 15,833,832 | 0.0% |
| Fidelity Securities Lending Cash Central Fund 5.39% | 70,347,171 | 78,988,628 | 149,222,549 | 6,390 | - | - | 113,250 | 0.0% |
| Total | 82,396,653 | 188,156,242 | 254,605,969 | 171,722 | 156 | - | 15,947,082 | |
| Valuation Inputs at Reporting Date: | ||||
| Description | Total ($) | Level 1 ($) | Level 2 ($) | Level 3 ($) |
Investments in Securities: | ||||
| Common Stocks | 1,746,960,420 | 1,708,611,562 | 38,348,858 | - |
| Money Market Funds | 15,947,082 | 15,947,082 | - | - |
| Total Investments in Securities: | 1,762,907,502 | 1,724,558,644 | 38,348,858 | - |
| Statement of Assets and Liabilities | ||||
| As of August 31, 2024 (Unaudited) | ||||
| Assets | ||||
| Investment in securities, at value (including securities loaned of $111,240) - See accompanying schedule: | ||||
Unaffiliated issuers (cost $1,014,162,069) | $ | 1,746,960,420 | ||
Fidelity Central Funds (cost $15,947,082) | 15,947,082 | |||
| Total Investment in Securities (cost $1,030,109,151) | $ | 1,762,907,502 | ||
| Receivable for investments sold | 1,747,769 | |||
| Receivable for fund shares sold | 515,186 | |||
| Dividends receivable | 1,290,917 | |||
| Distributions receivable from Fidelity Central Funds | 30,037 | |||
| Prepaid expenses | 4,345 | |||
| Other receivables | 141,548 | |||
Total assets | 1,766,637,304 | |||
| Liabilities | ||||
| Payable for fund shares redeemed | $ | 1,697,441 | ||
| Accrued management fee | 917,738 | |||
| Other payables and accrued expenses | 196,280 | |||
| Collateral on securities loaned | 113,250 | |||
| Total liabilities | 2,924,709 | |||
| Net Assets | $ | 1,763,712,595 | ||
| Net Assets consist of: | ||||
| Paid in capital | $ | 956,494,011 | ||
| Total accumulated earnings (loss) | 807,218,584 | |||
| Net Assets | $ | 1,763,712,595 | ||
Net Asset Value, offering price and redemption price per share ($1,763,712,595 ÷ 90,597,743 shares) | $ | 19.47 | ||
| Statement of Operations | ||||
Six months ended August 31, 2024 (Unaudited) | ||||
| Investment Income | ||||
| Dividends | $ | 6,833,959 | ||
| Income from Fidelity Central Funds (including $6,390 from security lending) | 171,722 | |||
| Total income | 7,005,681 | |||
| Expenses | ||||
| Management fee | $ | 5,312,923 | ||
| Custodian fees and expenses | 6,061 | |||
| Independent trustees' fees and expenses | 3,365 | |||
| Registration fees | 25,973 | |||
| Audit fees | 20,660 | |||
| Legal | 389 | |||
| Interest | 10,438 | |||
| Miscellaneous | 34,190 | |||
| Total expenses before reductions | 5,413,999 | |||
| Expense reductions | (32,243) | |||
| Total expenses after reductions | 5,381,756 | |||
| Net Investment income (loss) | 1,623,925 | |||
| Realized and Unrealized Gain (Loss) | ||||
| Net realized gain (loss) on: | ||||
| Investment Securities: | ||||
| Unaffiliated issuers | 74,350,549 | |||
| Fidelity Central Funds | 156 | |||
| Foreign currency transactions | 7,529 | |||
| Total net realized gain (loss) | 74,358,234 | |||
| Change in net unrealized appreciation (depreciation) on: | ||||
| Investment Securities: | ||||
| Unaffiliated issuers | 190,878,663 | |||
| Assets and liabilities in foreign currencies | 1,002 | |||
| Total change in net unrealized appreciation (depreciation) | 190,879,665 | |||
| Net gain (loss) | 265,237,899 | |||
| Net increase (decrease) in net assets resulting from operations | $ | 266,861,824 | ||
| Statement of Changes in Net Assets | ||||
Six months ended August 31, 2024 (Unaudited) | Year ended February 29, 2024 | |||
| Increase (Decrease) in Net Assets | ||||
| Operations | ||||
| Net investment income (loss) | $ | 1,623,925 | $ | 9,524,259 |
| Net realized gain (loss) | 74,358,234 | 117,093,092 | ||
| Change in net unrealized appreciation (depreciation) | 190,879,665 | 59,158,675 | ||
| Net increase (decrease) in net assets resulting from operations | 266,861,824 | 185,776,026 | ||
| Distributions to shareholders | (29,425,929) | (100,225,505) | ||
| Share transactions | ||||
| Proceeds from sales of shares | 81,597,995 | 192,254,318 | ||
| Reinvestment of distributions | 27,383,784 | 93,056,332 | ||
| Cost of shares redeemed | (152,805,911) | (374,534,711) | ||
Net increase (decrease) in net assets resulting from share transactions | (43,824,132) | (89,224,061) | ||
| Total increase (decrease) in net assets | 193,611,763 | (3,673,540) | ||
| Net Assets | ||||
| Beginning of period | 1,570,100,832 | 1,573,774,372 | ||
| End of period | $ | 1,763,712,595 | $ | 1,570,100,832 |
| Other Information | ||||
| Shares | ||||
| Sold | 4,568,990 | 11,931,270 | ||
| Issued in reinvestment of distributions | 1,627,082 | 5,576,080 | ||
| Redeemed | (8,629,016) | (23,423,246) | ||
| Net increase (decrease) | (2,432,944) | (5,915,896) | ||
Defense and Aerospace Portfolio |
Six months ended (Unaudited) August 31, 2024 | Years ended February 28, 2024 A | 2023 | 2022 | 2021 | 2020 A | |||||||
Selected Per-Share Data | ||||||||||||
| Net asset value, beginning of period | $ | 16.88 | $ | 15.91 | $ | 17.08 | $ | 16.28 | $ | 16.61 | $ | 17.27 |
| Income from Investment Operations | ||||||||||||
Net investment income (loss) B,C | .02 | .10 D | .09 E | .01 | (.04) | .27 F | ||||||
| Net realized and unrealized gain (loss) | 2.89 | 1.97 | .12 G | 2.12 | .06 | (.45) | ||||||
| Total from investment operations | 2.91 | 2.07 | .21 | 2.13 | .02 | (.18) | ||||||
| Distributions from net investment income | (.02) | (.11) | (.07) | - | (.05) | (.22) | ||||||
| Distributions from net realized gain | (.30) | (.99) | (1.31) | (1.33) | (.30) | (.26) | ||||||
| Total distributions | (.32) | (1.10) | (1.38) | (1.33) | (.35) | (.48) | ||||||
| Net asset value, end of period | $ | 19.47 | $ | 16.88 | $ | 15.91 | $ | 17.08 | $ | 16.28 | $ | 16.61 |
Total Return H,I | 17.55 % | 13.11% | 1.54% | 14.06% | .69% | (1.32)% | ||||||
Ratios to Average Net Assets C,J,K | ||||||||||||
| Expenses before reductions | .66% L | .74% | .75% | .74% | .77% | .75% | ||||||
| Expenses net of fee waivers, if any | .66 % L | .73% | .74% | .74% | .77% | .74% | ||||||
| Expenses net of all reductions | .66% L | .73% | .74% | .74% | .76% | .74% | ||||||
| Net investment income (loss) | .20% L | .63% D | .58% E | .06% | (.29)% | 1.49% F | ||||||
| Supplemental Data | ||||||||||||
| Net assets, end of period (000 omitted) | $ | 1,763,713 | $ | 1,570,101 | $ | 1,573,774 | $ | 1,536,531 | $ | 1,638,194 | $ | 2,728,959 |
Portfolio turnover rate M | 42 % L | 16% | 15% | 52% | 30% | 40% |
| Common Stocks - 99.6% | |||
| Shares | Value ($) | ||
| Aerospace & Defense - 22.7% | |||
| Aerospace & Defense - 22.7% | |||
| Axon Enterprise, Inc. (a) | 4,800 | 1,751,856 | |
| General Dynamics Corp. | 42,200 | 12,632,992 | |
| General Electric Co. | 215,003 | 37,543,824 | |
| Howmet Aerospace, Inc. | 288,737 | 27,909,318 | |
| Huntington Ingalls Industries, Inc. | 14,300 | 4,043,611 | |
| Loar Holdings, Inc. (b) | 600 | 44,496 | |
| Lockheed Martin Corp. | 8,623 | 4,898,726 | |
| The Boeing Co. (a) | 128,048 | 22,247,060 | |
| TransDigm Group, Inc. | 16,637 | 22,846,095 | |
| 133,917,978 | |||
| Air Freight & Logistics - 2.7% | |||
| Air Freight & Logistics - 2.7% | |||
| C.H. Robinson Worldwide, Inc. | 13,000 | 1,345,630 | |
| FedEx Corp. | 48,500 | 14,490,345 | |
| 15,835,975 | |||
| Building Products - 11.5% | |||
| Building Products - 11.5% | |||
| Carlisle Companies, Inc. | 19,600 | 8,306,480 | |
| Fortune Brands Innovations, Inc. | 160,200 | 12,721,482 | |
| Johnson Controls International PLC | 104,800 | 7,634,680 | |
| Simpson Manufacturing Co. Ltd. | 32,680 | 5,982,401 | |
| The AZEK Co., Inc. Class A, (a) | 210,600 | 8,977,878 | |
| Trane Technologies PLC | 66,935 | 24,207,712 | |
| 67,830,633 | |||
| Commercial Services & Supplies - 3.2% | |||
| Diversified Support Services - 1.0% | |||
| Cintas Corp. | 7,300 | 5,877,376 | |
| Environmental & Facilities Services - 2.2% | |||
| Waste Connections, Inc. (United States) | 68,500 | 12,775,250 | |
TOTAL COMMERCIAL SERVICES & SUPPLIES | 18,652,626 | ||
| Construction & Engineering - 3.8% | |||
| Construction & Engineering - 3.8% | |||
| Comfort Systems U.S.A., Inc. | 8,900 | 3,146,328 | |
| Quanta Services, Inc. | 43,000 | 11,830,590 | |
| Willscot Holdings Corp. (a) | 189,500 | 7,303,330 | |
| 22,280,248 | |||
| Construction Materials - 1.1% | |||
| Construction Materials - 1.1% | |||
| Eagle Materials, Inc. | 25,674 | 6,617,474 | |
| Electrical Equipment - 12.8% | |||
| Electrical Components & Equipment - 9.4% | |||
| AMETEK, Inc. | 107,220 | 18,339,981 | |
| Eaton Corp. PLC | 63,400 | 19,459,362 | |
| Regal Rexnord Corp. | 88,170 | 14,795,808 | |
| Vertiv Holdings Co. | 36,400 | 3,022,292 | |
| 55,617,443 | |||
| Heavy Electrical Equipment - 3.4% | |||
| GE Vernova LLC | 100,550 | 20,210,550 | |
TOTAL ELECTRICAL EQUIPMENT | 75,827,993 | ||
| Ground Transportation - 13.2% | |||
| Cargo Ground Transportation - 5.1% | |||
| Knight-Swift Transportation Holdings, Inc. | 210,400 | 11,020,752 | |
| Old Dominion Freight Lines, Inc. | 55,800 | 10,758,240 | |
| XPO, Inc. (a) | 73,100 | 8,378,722 | |
| 30,157,714 | |||
| Passenger Ground Transportation - 2.6% | |||
| Uber Technologies, Inc. (a) | 212,400 | 15,532,812 | |
| Rail Transportation - 5.5% | |||
| CSX Corp. | 69,069 | 2,366,995 | |
| Union Pacific Corp. | 116,700 | 29,885,703 | |
| 32,252,698 | |||
TOTAL GROUND TRANSPORTATION | 77,943,224 | ||
| Machinery - 19.6% | |||
| Agricultural & Farm Machinery - 1.5% | |||
| Deere & Co. | 23,900 | 9,219,186 | |
| Construction Machinery & Heavy Transportation Equipment - 1.7% | |||
| Caterpillar, Inc. | 20,800 | 7,406,880 | |
| Westinghouse Air Brake Tech Co. | 14,400 | 2,441,808 | |
| 9,848,688 | |||
| Industrial Machinery & Supplies & Components - 16.4% | |||
| Chart Industries, Inc. (a)(b) | 65,300 | 7,992,720 | |
| Dover Corp. | 94,681 | 17,613,506 | |
| Fortive Corp. | 34,611 | 2,575,058 | |
| Ingersoll Rand, Inc. | 277,664 | 25,392,373 | |
| ITT, Inc. | 128,600 | 17,903,692 | |
| Parker Hannifin Corp. | 42,600 | 25,568,520 | |
| 97,045,869 | |||
TOTAL MACHINERY | 116,113,743 | ||
| Professional Services - 3.4% | |||
| Research & Consulting Services - 3.4% | |||
| KBR, Inc. | 127,500 | 8,843,400 | |
| Leidos Holdings, Inc. | 71,589 | 11,347,572 | |
| 20,190,972 | |||
| Trading Companies & Distributors - 5.6% | |||
| Trading Companies & Distributors - 5.6% | |||
| FTAI Aviation Ltd. | 39,900 | 5,099,619 | |
| United Rentals, Inc. | 19,600 | 14,528,696 | |
| W.W. Grainger, Inc. | 8,109 | 7,986,716 | |
| Watsco, Inc. | 12,200 | 5,800,124 | |
| 33,415,155 | |||
| TOTAL COMMON STOCKS (Cost $417,434,336) | 588,626,021 | ||
| Money Market Funds - 1.9% | |||
| Shares | Value ($) | ||
| Fidelity Cash Central Fund 5.39% (c) | 2,828,384 | 2,828,949 | |
| Fidelity Securities Lending Cash Central Fund 5.39% (c)(d) | 8,301,020 | 8,301,850 | |
| TOTAL MONEY MARKET FUNDS (Cost $11,130,799) | 11,130,799 | ||
| TOTAL INVESTMENT IN SECURITIES - 101.5% (Cost $428,565,135) | 599,756,820 |
NET OTHER ASSETS (LIABILITIES) - (1.5)% | (8,631,181) |
| NET ASSETS - 100.0% | 591,125,639 |
| (a) | Non-income producing |
| (b) | Security or a portion of the security is on loan at period end. |
| (c) | Affiliated fund that is generally available only to investment companies and other accounts managed by Fidelity Investments. The rate quoted is the annualized seven-day yield of the fund at period end. A complete unaudited listing of the fund's holdings as of its most recent quarter end is available upon request. In addition, each Fidelity Central Fund's financial statements are available on the SEC's website or upon request. |
| (d) | Investment made with cash collateral received from securities on loan. |
| Affiliate | Value, beginning of period ($) | Purchases ($) | Sales Proceeds ($) | Dividend Income ($) | Realized Gain (loss) ($) | Change in Unrealized appreciation (depreciation) ($) | Value, end of period ($) | % ownership, end of period |
| Fidelity Cash Central Fund 5.39% | 13,875,738 | 57,878,126 | 68,925,187 | 72,426 | 272 | - | 2,828,949 | 0.0% |
| Fidelity Securities Lending Cash Central Fund 5.39% | 437,175 | 45,171,379 | 37,306,704 | 3,826 | - | - | 8,301,850 | 0.0% |
| Total | 14,312,913 | 103,049,505 | 106,231,891 | 76,252 | 272 | - | 11,130,799 | |
| Valuation Inputs at Reporting Date: | ||||
| Description | Total ($) | Level 1 ($) | Level 2 ($) | Level 3 ($) |
Investments in Securities: | ||||
| Common Stocks | 588,626,021 | 588,626,021 | - | - |
| Money Market Funds | 11,130,799 | 11,130,799 | - | - |
| Total Investments in Securities: | 599,756,820 | 599,756,820 | - | - |
| Statement of Assets and Liabilities | ||||
| As of August 31, 2024 (Unaudited) | ||||
| Assets | ||||
| Investment in securities, at value (including securities loaned of $8,017,560) - See accompanying schedule: | ||||
Unaffiliated issuers (cost $417,434,336) | $ | 588,626,021 | ||
Fidelity Central Funds (cost $11,130,799) | 11,130,799 | |||
| Total Investment in Securities (cost $428,565,135) | $ | 599,756,820 | ||
| Cash | 25,010 | |||
| Receivable for fund shares sold | 321,082 | |||
| Dividends receivable | 395,577 | |||
| Distributions receivable from Fidelity Central Funds | 10,538 | |||
| Prepaid expenses | 1,527 | |||
| Other receivables | 137,809 | |||
Total assets | 600,648,363 | |||
| Liabilities | ||||
| Payable for investments purchased | $ | 587,595 | ||
| Payable for fund shares redeemed | 141,963 | |||
| Accrued management fee | 320,412 | |||
| Other payables and accrued expenses | 170,904 | |||
| Collateral on securities loaned | 8,301,850 | |||
| Total liabilities | 9,522,724 | |||
| Net Assets | $ | 591,125,639 | ||
| Net Assets consist of: | ||||
| Paid in capital | $ | 400,444,634 | ||
| Total accumulated earnings (loss) | 190,681,005 | |||
| Net Assets | $ | 591,125,639 | ||
Net Asset Value, offering price and redemption price per share ($591,125,639 ÷ 14,399,308 shares) | $ | 41.05 | ||
| Statement of Operations | ||||
Six months ended August 31, 2024 (Unaudited) | ||||
| Investment Income | ||||
| Dividends | $ | 2,406,191 | ||
| Income from Fidelity Central Funds (including $3,826 from security lending) | 76,252 | |||
| Total income | 2,482,443 | |||
| Expenses | ||||
| Management fee | $ | 1,951,745 | ||
| Custodian fees and expenses | 5,321 | |||
| Independent trustees' fees and expenses | 1,200 | |||
| Registration fees | 25,757 | |||
| Audit fees | 22,864 | |||
| Legal | 2,700 | |||
| Interest | 1,840 | |||
| Miscellaneous | 10,296 | |||
| Total expenses before reductions | 2,021,723 | |||
| Expense reductions | (10,823) | |||
| Total expenses after reductions | 2,010,900 | |||
| Net Investment income (loss) | 471,543 | |||
| Realized and Unrealized Gain (Loss) | ||||
| Net realized gain (loss) on: | ||||
| Investment Securities: | ||||
| Unaffiliated issuers | 20,387,250 | |||
| Fidelity Central Funds | 272 | |||
| Total net realized gain (loss) | 20,387,522 | |||
| Change in net unrealized appreciation (depreciation) on: | ||||
| Investment Securities: | ||||
| Unaffiliated issuers | 25,087,602 | |||
| Assets and liabilities in foreign currencies | (2) | |||
| Total change in net unrealized appreciation (depreciation) | 25,087,600 | |||
| Net gain (loss) | 45,475,122 | |||
| Net increase (decrease) in net assets resulting from operations | $ | 45,946,665 | ||
| Statement of Changes in Net Assets | ||||
Six months ended August 31, 2024 (Unaudited) | Year ended February 29, 2024 | |||
| Increase (Decrease) in Net Assets | ||||
| Operations | ||||
| Net investment income (loss) | $ | 471,543 | $ | 1,203,450 |
| Net realized gain (loss) | 20,387,522 | 46,886,649 | ||
| Change in net unrealized appreciation (depreciation) | 25,087,600 | 85,751,927 | ||
| Net increase (decrease) in net assets resulting from operations | 45,946,665 | 133,842,026 | ||
| Distributions to shareholders | (596,010) | (28,983,021) | ||
| Share transactions | ||||
| Proceeds from sales of shares | 85,401,778 | 135,270,017 | ||
| Reinvestment of distributions | 560,281 | 27,273,715 | ||
| Cost of shares redeemed | (102,938,283) | (158,177,022) | ||
Net increase (decrease) in net assets resulting from share transactions | (16,976,224) | 4,366,710 | ||
| Total increase (decrease) in net assets | 28,374,431 | 109,225,715 | ||
| Net Assets | ||||
| Beginning of period | 562,751,208 | 453,525,493 | ||
| End of period | $ | 591,125,639 | $ | 562,751,208 |
| Other Information | ||||
| Shares | ||||
| Sold | 2,205,968 | 4,078,523 | ||
| Issued in reinvestment of distributions | 14,583 | 819,732 | ||
| Redeemed | (2,660,111) | (4,885,103) | ||
| Net increase (decrease) | (439,560) | 13,152 | ||
Industrials Portfolio |
Six months ended (Unaudited) August 31, 2024 | Years ended February 28, 2024 A | 2023 | 2022 | 2021 | 2020 A | |||||||
Selected Per-Share Data | ||||||||||||
| Net asset value, beginning of period | $ | 37.92 | $ | 30.59 | $ | 31.41 | $ | 37.17 | $ | 31.90 | $ | 33.84 |
| Income from Investment Operations | ||||||||||||
Net investment income (loss) B,C | .03 | .08 D | .04 E | (.04) | (.02) | .28 F | ||||||
| Net realized and unrealized gain (loss) | 3.14 | 9.25 | .30 | 3.70 | 6.38 | (.76) | ||||||
| Total from investment operations | 3.17 | 9.33 | .34 | 3.66 | 6.36 | (.48) | ||||||
| Distributions from net investment income | - | (.09) | (.04) | - | (.07) G | (.24) | ||||||
| Distributions from net realized gain | (.04) | (1.92) | (1.13) | (9.42) | (1.02) G | (1.23) | ||||||
| Total distributions | (.04) | (2.00) H | (1.16) H | (9.42) | (1.09) | (1.46) H | ||||||
| Net asset value, end of period | $ | 41.05 | $ | 37.92 | $ | 30.59 | $ | 31.41 | $ | 37.17 | $ | 31.90 |
Total Return I,J | 8.36 % | 31.48% | 1.19% | 9.33% | 21.41% | (1.82)% | ||||||
Ratios to Average Net Assets B,K,L | ||||||||||||
| Expenses before reductions | .69% M | .74% | .76% | .74% | .76% | .76% | ||||||
| Expenses net of fee waivers, if any | .69 % M | .73% | .76% | .74% | .76% | .76% | ||||||
| Expenses net of all reductions | .69% M | .73% | .76% | .74% | .74% | .75% | ||||||
| Net investment income (loss) | .16% M | .26% D | .14% E | (.10)% | (.05)% | .81% F | ||||||
| Supplemental Data | ||||||||||||
| Net assets, end of period (000 omitted) | $ | 591,126 | $ | 562,751 | $ | 453,525 | $ | 359,765 | $ | 564,209 | $ | 529,023 |
Portfolio turnover rate N | 37 % M | 115% O | 125% | 151% | 272% | 143% O |
| Common Stocks - 97.8% | |||
| Shares | Value ($) | ||
| Air Freight & Logistics - 20.7% | |||
| Air Freight & Logistics - 20.7% | |||
| Air Transport Services Group, Inc. (a)(b) | 209,937 | 3,539,538 | |
| C.H. Robinson Worldwide, Inc. | 107,207 | 11,096,997 | |
| Expeditors International of Washington, Inc. | 65,381 | 8,068,669 | |
| FedEx Corp. | 88,721 | 26,507,173 | |
| GXO Logistics, Inc. (a) | 26,031 | 1,302,852 | |
| Hub Group, Inc. Class A | 50,876 | 2,397,786 | |
| United Parcel Service, Inc. Class B | 459,926 | 59,123,487 | |
| 112,036,502 | |||
| Energy Equipment & Services - 0.7% | |||
| Oil & Gas Equipment & Services - 0.7% | |||
| Tidewater, Inc. (a) | 41,200 | 3,654,440 | |
| Ground Transportation - 53.7% | |||
| Cargo Ground Transportation - 7.4% | |||
| Covenant Transport Group, Inc. Class A | 3,102 | 163,382 | |
| Knight-Swift Transportation Holdings, Inc. | 162,829 | 8,528,983 | |
| Ryder System, Inc. | 49,447 | 7,181,682 | |
| Saia, Inc. (a)(b) | 31,777 | 11,942,750 | |
| TFI International, Inc. (Canada) | 30,600 | 4,528,750 | |
| U-Haul Holding Co. Class N | 110,236 | 7,534,631 | |
| Universal Logistics Holdings, Inc. | 9,321 | 393,999 | |
| 40,274,177 | |||
| Passenger Ground Transportation - 17.0% | |||
| Avis Budget Group, Inc. (b) | 11,803 | 967,728 | |
| Localiza Rent a Car SA | 493,800 | 3,624,678 | |
| Lyft, Inc. (a) | 416,798 | 4,864,033 | |
| Uber Technologies, Inc. (a) | 1,126,566 | 82,385,772 | |
| 91,842,211 | |||
| Rail Transportation - 29.3% | |||
| CSX Corp. | 777,401 | 26,641,532 | |
| FTAI Infrastructure LLC | 347,962 | 3,458,742 | |
| Norfolk Southern Corp. | 110,810 | 28,385,090 | |
| Union Pacific Corp. | 389,485 | 99,743,214 | |
| 158,228,578 | |||
TOTAL GROUND TRANSPORTATION | 290,344,966 | ||
| Marine Transportation - 6.9% | |||
| Marine Transportation - 6.9% | |||
| Kirby Corp. (a) | 192,346 | 23,066,132 | |
| Matson, Inc. | 29,323 | 4,055,371 | |
| Navios Maritime Partners LP | 33,000 | 1,769,130 | |
| Star Bulk Carriers Corp. | 404,523 | 8,644,657 | |
| 37,535,290 | |||
| Oil, Gas & Consumable Fuels - 1.6% | |||
| Oil & Gas Storage & Transportation - 1.6% | |||
| Cool Co. Ltd. | 5,974 | 73,227 | |
| DHT Holdings, Inc. | 330,992 | 3,584,643 | |
| International Seaways, Inc. | 34,058 | 1,765,226 | |
| Navigator Holdings Ltd. | 175,600 | 2,951,836 | |
| 8,374,932 | |||
| Passenger Airlines - 14.2% | |||
| Passenger Airlines - 14.2% | |||
| Alaska Air Group, Inc. (a)(b) | 384,843 | 13,896,681 | |
| Copa Holdings SA Class A | 123,521 | 11,166,298 | |
| Delta Air Lines, Inc. | 499,765 | 21,235,015 | |
| Ryanair Holdings PLC sponsored ADR | 36,394 | 4,056,475 | |
| SkyWest, Inc. (a) | 176,724 | 13,703,179 | |
| Sun Country Airlines Holdings, Inc. (a)(b) | 724,694 | 7,957,140 | |
| United Airlines Holdings, Inc. (a) | 113,508 | 4,998,892 | |
| 77,013,680 | |||
| TOTAL COMMON STOCKS (Cost $321,221,328) | 528,959,810 | ||
| Money Market Funds - 3.6% | |||
| Shares | Value ($) | ||
| Fidelity Cash Central Fund 5.39% (c) | 10,006,540 | 10,008,541 | |
| Fidelity Securities Lending Cash Central Fund 5.39% (c)(d) | 9,714,354 | 9,715,325 | |
| TOTAL MONEY MARKET FUNDS (Cost $19,723,866) | 19,723,866 | ||
| TOTAL INVESTMENT IN SECURITIES - 101.4% (Cost $340,945,194) | 548,683,676 |
NET OTHER ASSETS (LIABILITIES) - (1.4)% | (7,622,268) |
| NET ASSETS - 100.0% | 541,061,408 |
| (a) | Non-income producing |
| (b) | Security or a portion of the security is on loan at period end. |
| (c) | Affiliated fund that is generally available only to investment companies and other accounts managed by Fidelity Investments. The rate quoted is the annualized seven-day yield of the fund at period end. A complete unaudited listing of the fund's holdings as of its most recent quarter end is available upon request. In addition, each Fidelity Central Fund's financial statements are available on the SEC's website or upon request. |
| (d) | Investment made with cash collateral received from securities on loan. |
| Affiliate | Value, beginning of period ($) | Purchases ($) | Sales Proceeds ($) | Dividend Income ($) | Realized Gain (loss) ($) | Change in Unrealized appreciation (depreciation) ($) | Value, end of period ($) | % ownership, end of period |
| Fidelity Cash Central Fund 5.39% | 3,380,863 | 55,599,625 | 48,971,949 | 153,446 | 2 | - | 10,008,541 | 0.0% |
| Fidelity Securities Lending Cash Central Fund 5.39% | 3,404,600 | 36,748,302 | 30,437,577 | 56,322 | - | - | 9,715,325 | 0.0% |
| Total | 6,785,463 | 92,347,927 | 79,409,526 | 209,768 | 2 | - | 19,723,866 | |
| Valuation Inputs at Reporting Date: | ||||
| Description | Total ($) | Level 1 ($) | Level 2 ($) | Level 3 ($) |
Investments in Securities: | ||||
| Common Stocks | 528,959,810 | 528,959,810 | - | - |
| Money Market Funds | 19,723,866 | 19,723,866 | - | - |
| Total Investments in Securities: | 548,683,676 | 548,683,676 | - | - |
| Statement of Assets and Liabilities | ||||
| As of August 31, 2024 (Unaudited) | ||||
| Assets | ||||
| Investment in securities, at value (including securities loaned of $9,476,358) - See accompanying schedule: | ||||
Unaffiliated issuers (cost $321,221,328) | $ | 528,959,810 | ||
Fidelity Central Funds (cost $19,723,866) | 19,723,866 | |||
| Total Investment in Securities (cost $340,945,194) | $ | 548,683,676 | ||
| Receivable for investments sold | 37,598,949 | |||
| Receivable for fund shares sold | 73,629 | |||
| Dividends receivable | 1,694,530 | |||
| Distributions receivable from Fidelity Central Funds | 40,173 | |||
| Prepaid expenses | 1,132 | |||
Total assets | 588,092,089 | |||
| Liabilities | ||||
| Payable for investments purchased | $ | 36,272,808 | ||
| Payable for fund shares redeemed | 711,231 | |||
| Accrued management fee | 292,974 | |||
| Other payables and accrued expenses | 38,343 | |||
| Collateral on securities loaned | 9,715,325 | |||
| Total liabilities | 47,030,681 | |||
| Net Assets | $ | 541,061,408 | ||
| Net Assets consist of: | ||||
| Paid in capital | $ | 304,631,210 | ||
| Total accumulated earnings (loss) | 236,430,198 | |||
| Net Assets | $ | 541,061,408 | ||
Net Asset Value, offering price and redemption price per share ($541,061,408 ÷ 4,943,571 shares) | $ | 109.45 | ||
| Statement of Operations | ||||
Six months ended August 31, 2024 (Unaudited) | ||||
| Investment Income | ||||
| Dividends | $ | 5,898,309 | ||
| Interest | 119 | |||
| Income from Fidelity Central Funds (including $56,322 from security lending) | 209,768 | |||
| Total income | 6,108,196 | |||
| Expenses | ||||
| Management fee | $ | 1,908,791 | ||
| Custodian fees and expenses | 5,873 | |||
| Independent trustees' fees and expenses | 1,229 | |||
| Registration fees | 20,535 | |||
| Audit fees | 24,131 | |||
| Legal | 143 | |||
| Interest | 3,253 | |||
| Miscellaneous | 14,063 | |||
| Total expenses before reductions | 1,978,018 | |||
| Expense reductions | (13,450) | |||
| Total expenses after reductions | 1,964,568 | |||
| Net Investment income (loss) | 4,143,628 | |||
| Realized and Unrealized Gain (Loss) | ||||
| Net realized gain (loss) on: | ||||
| Investment Securities: | ||||
| Unaffiliated issuers | 25,870,173 | |||
| Fidelity Central Funds | 2 | |||
| Foreign currency transactions | (13,295) | |||
| Total net realized gain (loss) | 25,856,880 | |||
| Change in net unrealized appreciation (depreciation) on: | ||||
| Investment Securities: | ||||
| Unaffiliated issuers | (34,942,563) | |||
| Assets and liabilities in foreign currencies | 586 | |||
| Total change in net unrealized appreciation (depreciation) | (34,941,977) | |||
| Net gain (loss) | (9,085,097) | |||
| Net increase (decrease) in net assets resulting from operations | $ | (4,941,469) | ||
| Statement of Changes in Net Assets | ||||
Six months ended August 31, 2024 (Unaudited) | Year ended February 29, 2024 | |||
| Increase (Decrease) in Net Assets | ||||
| Operations | ||||
| Net investment income (loss) | $ | 4,143,628 | $ | 10,430,731 |
| Net realized gain (loss) | 25,856,880 | 9,046,988 | ||
| Change in net unrealized appreciation (depreciation) | (34,941,977) | 71,232,396 | ||
| Net increase (decrease) in net assets resulting from operations | (4,941,469) | 90,710,115 | ||
| Distributions to shareholders | (2,936,556) | (15,708,100) | ||
| Share transactions | ||||
| Proceeds from sales of shares | 12,938,256 | 63,903,075 | ||
| Reinvestment of distributions | 2,732,891 | 14,720,687 | ||
| Cost of shares redeemed | (77,260,618) | (130,203,895) | ||
Net increase (decrease) in net assets resulting from share transactions | (61,589,471) | (51,580,133) | ||
| Total increase (decrease) in net assets | (69,467,496) | 23,421,882 | ||
| Net Assets | ||||
| Beginning of period | 610,528,904 | 587,107,022 | ||
| End of period | $ | 541,061,408 | $ | 610,528,904 |
| Other Information | ||||
| Shares | ||||
| Sold | 119,455 | 637,059 | ||
| Issued in reinvestment of distributions | 25,197 | 143,382 | ||
| Redeemed | (721,533) | (1,312,582) | ||
| Net increase (decrease) | (576,881) | (532,141) | ||
Transportation Portfolio |
Six months ended (Unaudited) August 31, 2024 | Years ended February 28, 2024 A | 2023 | 2022 | 2021 | 2020 A | |||||||
Selected Per-Share Data | ||||||||||||
| Net asset value, beginning of period | $ | 110.59 | $ | 97.00 | $ | 105.82 | $ | 98.97 | $ | 82.12 | $ | 95.41 |
| Income from Investment Operations | ||||||||||||
Net investment income (loss) B,C | .79 | 1.80 | 1.24 | .64 | 1.06 D | .93 | ||||||
| Net realized and unrealized gain (loss) | (1.39) | 14.59 | (2.12) | 19.26 | 23.43 | (10.43) | ||||||
| Total from investment operations | (.60) | 16.39 | (.88) | 19.90 | 24.49 | (9.50) | ||||||
| Distributions from net investment income | (.29) | (1.75) | (1.16) | (1.03) | (.76) | (1.10) | ||||||
| Distributions from net realized gain | (.25) | (1.05) | (6.78) | (12.03) | (6.88) | (2.70) | ||||||
| Total distributions | (.54) | (2.80) | (7.94) | (13.05) E | (7.64) | (3.79) E | ||||||
| Net asset value, end of period | $ | 109.45 | $ | 110.59 | $ | 97.00 | $ | 105.82 | $ | 98.97 | $ | 82.12 |
Total Return F,G | (.54) % | 17.13% | (.46)% | 20.35% | 34.62% | (10.49)% | ||||||
Ratios to Average Net Assets C,H,I | ||||||||||||
| Expenses before reductions | .70% J | .76% | .76% | .77% | .80% | .79% | ||||||
| Expenses net of fee waivers, if any | .69 % J | .75% | .76% | .77% | .80% | .79% | ||||||
| Expenses net of all reductions | .69% J | .75% | .76% | .77% | .80% | .79% | ||||||
| Net investment income (loss) | 1.46% J | 1.82% | 1.28% | .60% | 1.29% D | 1.00% | ||||||
| Supplemental Data | ||||||||||||
| Net assets, end of period (000 omitted) | $ | 541,061 | $ | 610,529 | $ | 587,107 | $ | 679,303 | $ | 335,780 | $ | 310,441 |
Portfolio turnover rate K | 24 % J | 33% | 23% | 66% L | 52% | 78% |
| Fidelity Central Fund | Investment Manager | Investment Objective | Investment Practices | Expense RatioA |
| Fidelity Money Market Central Funds | Fidelity Management & Research Company LLC (FMR) | Each fund seeks to obtain a high level of current income consistent with the preservation of capital and liquidity. | Short-term Investments | Less than .005% |
| Defense and Aerospace Portfolio | $141,548 |
| Industrials Portfolio | 137,613 |
| Tax cost ($) | Gross unrealized appreciation ($) | Gross unrealized depreciation ($) | Net unrealized appreciation (depreciation)($) | |
| Defense and Aerospace Portfolio | 1,031,553,210 | 741,042,929 | (9,688,637) | 731,354,292 |
| Industrials Portfolio | 429,347,806 | 176,719,308 | (6,310,294) | 170,409,014 |
| Transportation Portfolio | 341,400,139 | 224,842,501 | (17,558,964) | 207,283,537 |
| Purchases ($) | Sales ($) | |
| Defense and Aerospace Portfolio | 344,718,162 | 424,485,092 |
| Industrials Portfolio | 108,483,432 | 125,009,028 |
| Transportation Portfolio | 68,515,954 | 136,114,848 |
| Shares | Total net realized gain or loss ($) | Total Proceeds ($) | |
| Industrials Portfolio | 707,692 | 16,577,795 | 23,283,076 |
| Maximum Management Fee Rate % | |
| Defense and Aerospace Portfolio | .70 |
| Industrials Portfolio | .67 |
| Transportation Portfolio | .70 |
| Total Management Fee Rate % | |
| Defense and Aerospace Portfolio | .65 |
| Industrials Portfolio | .67 |
| Transportation Portfolio | .67 |
| Amount ($) | |
| Defense and Aerospace Portfolio | 4,640 |
| Industrials Portfolio | 934 |
| Transportation Portfolio | 3,643 |
| Borrower or Lender | Average Loan Balance ($) | Weighted Average Interest Rate | Interest Expense ($) | |
| Defense and Aerospace Portfolio | Borrower | 22,488,000 | 5.57% | 10,438 |
| Industrials Portfolio | Borrower | 5,936,500 | 5.58% | 1,840 |
| Transportation Portfolio | Borrower | 4,197,800 | 5.58% | 3,253 |
| Purchases ($) | Sales ($) | Realized Gain (Loss)($) | |
| Defense and Aerospace Portfolio | 25,044,384 | 16,184,272 | (2,248,312) |
| Industrials Portfolio | 6,978,451 | 2,843,486 | 663,847 |
| Transportation Portfolio | 3,157,922 | 4,493,413 | 1,983,310 |
| Amount ($) | |
| Defense and Aerospace Portfolio | 1,384 |
| Industrials Portfolio | 492 |
| Transportation Portfolio | 516 |
| Total Security Lending Fees Paid to NFS ($) | Security Lending Income From Securities Loaned to NFS ($) | Value of Securities Loaned to NFS at Period End ($) | |
| Defense and Aerospace Portfolio | 646 | 1 | - |
| Industrials Portfolio | 393 | - | - |
| Transportation Portfolio | 5,994 | 63 | - |
| Custodian credits ($) | |
| Defense and Aerospace Portfolio | 468 |
| Transportation Portfolio | 1,262 |
| Amount ($) | |
| Defense and Aerospace Portfolio | 31,775 |
| Industrials Portfolio | 10,823 |
| Transportation Portfolio | 12,188 |
| A special meeting of shareholders was held on July 16, 2024. The results of votes taken among shareholders on the proposal before them are reported below. Each vote reported represents one dollar of net asset value held on the record date for the meeting. | ||
| Proposal 1 | ||
| To elect a Board of Trustees. | ||
# of Votes | % of Votes | |
| Bettina Doulton | ||
| Affirmative | 50,178,154,296.75 | 92.38 |
| Withheld | 4,136,551,415.53 | 7.62 |
| TOTAL | 54,314,705,712.27 | 100.00 |
| Robert A. Lawrence | ||
| Affirmative | 50,131,321,830.27 | 92.30 |
| Withheld | 4,183,383,882.00 | 7.70 |
| TOTAL | 54,314,705,712.27 | 100.00 |
| Vijay C. Advani | ||
| Affirmative | 50,021,870,319.77 | 92.10 |
| Withheld | 4,292,835,392.50 | 7.90 |
| TOTAL | 54,314,705,712.27 | 100.00 |
| Thomas P. Bostick | ||
| Affirmative | 50,057,248,681.17 | 92.16 |
| Withheld | 4,257,457,031.10 | 7.84 |
| TOTAL | 54,314,705,712.27 | 100.00 |
| Donald F. Donahue | ||
| Affirmative | 49,998,023,290.27 | 92.05 |
| Withheld | 4,316,682,422.00 | 7.95 |
| TOTAL | 54,314,705,712.27 | 100.00 |
| Vicki L. Fuller | ||
| Affirmative | 50,146,578,363.15 | 92.33 |
| Withheld | 4,168,127,349.12 | 7.67 |
| TOTAL | 54,314,705,712.27 | 100.00 |
| Patricia L. Kampling | ||
| Affirmative | 50,227,895,949.71 | 92.48 |
| Withheld | 4,086,809,762.56 | 7.52 |
| TOTAL | 54,314,705,712.27 | 100.00 |
| Thomas A. Kennedy | ||
| Affirmative | 50,080,160,698.34 | 92.20 |
| Withheld | 4,234,545,013.93 | 7.80 |
| TOTAL | 54,314,705,712.27 | 100.00 |
| Oscar Munoz | ||
| Affirmative | 49,879,616,445.58 | 91.83 |
| Withheld | 4,435,089,266.69 | 8.17 |
| TOTAL | 54,314,705,712.27 | 100.00 |
| Karen B. Peetz | ||
| Affirmative | 50,078,105,799.58 | 92.20 |
| Withheld | 4,236,599,912.69 | 7.80 |
| TOTAL | 54,314,705,712.27 | 100.00 |
| David M. Thomas | ||
| Affirmative | 50,013,939,190.36 | 92.08 |
| Withheld | 4,300,766,521.91 | 7.92 |
| TOTAL | 54,314,705,712.27 | 100.00 |
| Susan Tomasky | ||
| Affirmative | 50,109,134,188.50 | 92.26 |
| Withheld | 4,205,571,523.77 | 7.74 |
| TOTAL | 54,314,705,712.27 | 100.00 |
| Michael E. Wiley | ||
| Affirmative | 50,016,526,096.47 | 92.09 |
| Withheld | 4,298,179,615.80 | 7.91 |
| TOTAL | 54,314,705,712.27 | 100.00 |
| Proposal 1 reflects trust-wide proposal and voting results. | ||
 |


Contents
| Common Stocks - 99.7% | |||
| Shares | Value ($) | ||
| Beverages - 39.5% | |||
| Brewers - 3.0% | |||
| Boston Beer Co., Inc. Class A (a) | 153,300 | 41,654,676 | |
| Distillers & Vintners - 5.1% | |||
| Brown-Forman Corp. Class B (non-vtg.) (b) | 330,100 | 15,049,259 | |
| Constellation Brands, Inc. Class A (sub. vtg.) | 151,084 | 36,367,430 | |
| Diageo PLC | 596,807 | 19,379,124 | |
| Duckhorn Portfolio, Inc. (a) | 97,900 | 619,707 | |
| 71,415,520 | |||
| Soft Drinks & Non-alcoholic Beverages - 31.4% | |||
| Keurig Dr. Pepper, Inc. | 3,751,727 | 137,350,725 | |
| Monster Beverage Corp. (a) | 1,153,626 | 54,370,393 | |
| PepsiCo, Inc. | 290,504 | 50,222,332 | |
| The Coca-Cola Co. | 2,761,418 | 200,119,964 | |
| 442,063,414 | |||
TOTAL BEVERAGES | 555,133,610 | ||
| Consumer Staples Distribution & Retail - 10.8% | |||
| Consumer Staples Merchandise Retail - 8.8% | |||
| BJ's Wholesale Club Holdings, Inc. (a) | 31,700 | 2,534,732 | |
| Target Corp. | 282,400 | 43,382,288 | |
| Walmart, Inc. | 1,000,500 | 77,268,615 | |
| 123,185,635 | |||
| Drug Retail - 0.2% | |||
| Walgreens Boots Alliance, Inc. | 383,700 | 3,549,225 | |
| Food Distributors - 0.6% | |||
| Sysco Corp. | 108,356 | 8,448,517 | |
| Food Retail - 1.2% | |||
| Albertsons Companies, Inc. | 864,500 | 16,961,490 | |
TOTAL CONSUMER STAPLES DISTRIBUTION & RETAIL | 152,144,867 | ||
| Food Products - 14.3% | |||
| Agricultural Products & Services - 2.5% | |||
| Archer Daniels Midland Co. | 493,100 | 30,074,169 | |
| Bunge Global SA | 54,793 | 5,554,914 | |
| 35,629,083 | |||
| Packaged Foods & Meats - 11.8% | |||
| General Mills, Inc. | 117,400 | 8,486,846 | |
| Lamb Weston Holdings, Inc. | 411,900 | 25,504,848 | |
| Mondelez International, Inc. | 590,597 | 42,410,771 | |
| Nomad Foods Ltd. | 781,459 | 14,691,429 | |
| The J.M. Smucker Co. | 357,400 | 40,986,632 | |
| The Real Good Food Co. LLC: | |||
| Class B (a)(c) | 54,867 | 1 | |
| Class B unit (a)(d) | 54,867 | 25,787 | |
| The Simply Good Foods Co. (a) | 79,800 | 2,520,882 | |
| TreeHouse Foods, Inc. (a) | 413,808 | 17,003,371 | |
| Tyson Foods, Inc. Class A | 220,366 | 14,171,737 | |
| 165,802,304 | |||
TOTAL FOOD PRODUCTS | 201,431,387 | ||
| Household Products - 18.7% | |||
| Household Products - 18.7% | |||
| Energizer Holdings, Inc. | 1,665,989 | 53,978,044 | |
| Procter & Gamble Co. | 1,159,382 | 198,880,388 | |
| Reckitt Benckiser Group PLC | 37,000 | 2,128,669 | |
| The Clorox Co. | 53,274 | 8,433,807 | |
| 263,420,908 | |||
| Oil, Gas & Consumable Fuels - 0.2% | |||
| Oil & Gas Refining & Marketing - 0.2% | |||
| Parkland Corp. | 81,700 | 2,210,959 | |
| Personal Care Products - 9.7% | |||
| Personal Care Products - 9.7% | |||
| Estee Lauder Companies, Inc. Class A | 524,355 | 48,062,379 | |
| Kenvue, Inc. | 4,025,700 | 88,364,115 | |
| 136,426,494 | |||
| Tobacco - 6.5% | |||
| Tobacco - 6.5% | |||
| British American Tobacco PLC sponsored ADR | 839,300 | 31,532,501 | |
| Philip Morris International, Inc. | 480,782 | 59,275,613 | |
| 90,808,114 | |||
| TOTAL COMMON STOCKS (Cost $1,063,242,826) | 1,401,576,339 | ||
| Money Market Funds - 1.2% | |||
| Shares | Value ($) | ||
| Fidelity Cash Central Fund 5.39% (e) | 1,447,576 | 1,447,865 | |
| Fidelity Securities Lending Cash Central Fund 5.39% (e)(f) | 15,343,466 | 15,345,000 | |
| TOTAL MONEY MARKET FUNDS (Cost $16,792,865) | 16,792,865 | ||
| TOTAL INVESTMENT IN SECURITIES - 100.9% (Cost $1,080,035,691) | 1,418,369,204 |
NET OTHER ASSETS (LIABILITIES) - (0.9)% | (13,162,863) |
| NET ASSETS - 100.0% | 1,405,206,341 |
| (a) | Non-income producing |
| (b) | Security or a portion of the security is on loan at period end. |
| (c) | Level 3 security |
| (d) | Security exempt from registration under Rule 144A of the Securities Act of 1933. These securities may be resold in transactions exempt from registration, normally to qualified institutional buyers. At the end of the period, the value of these securities amounted to $25,787 or 0.0% of net assets. |
| (e) | Affiliated fund that is generally available only to investment companies and other accounts managed by Fidelity Investments. The rate quoted is the annualized seven-day yield of the fund at period end. A complete unaudited listing of the fund's holdings as of its most recent quarter end is available upon request. In addition, each Fidelity Central Fund's financial statements are available on the SEC's website or upon request. |
| (f) | Investment made with cash collateral received from securities on loan. |
| Affiliate | Value, beginning of period ($) | Purchases ($) | Sales Proceeds ($) | Dividend Income ($) | Realized Gain (loss) ($) | Change in Unrealized appreciation (depreciation) ($) | Value, end of period ($) | % ownership, end of period |
| Fidelity Cash Central Fund 5.39% | 1,663,301 | 39,302,010 | 39,517,446 | 29,746 | - | - | 1,447,865 | 0.0% |
| Fidelity Securities Lending Cash Central Fund 5.39% | 7,105,725 | 143,734,128 | 135,494,853 | 4,462 | - | - | 15,345,000 | 0.1% |
| Total | 8,769,026 | 183,036,138 | 175,012,299 | 34,208 | - | - | 16,792,865 | |
| Valuation Inputs at Reporting Date: | ||||
| Description | Total ($) | Level 1 ($) | Level 2 ($) | Level 3 ($) |
Investments in Securities: | ||||
| Common Stocks | 1,401,576,339 | 1,399,447,669 | 2,128,669 | 1 |
| Money Market Funds | 16,792,865 | 16,792,865 | - | - |
| Total Investments in Securities: | 1,418,369,204 | 1,416,240,534 | 2,128,669 | 1 |
| Statement of Assets and Liabilities | ||||
| As of August 31, 2024 (Unaudited) | ||||
| Assets | ||||
| Investment in securities, at value (including securities loaned of $15,044,700) - See accompanying schedule: | ||||
Unaffiliated issuers (cost $1,063,242,826) | $ | 1,401,576,339 | ||
Fidelity Central Funds (cost $16,792,865) | 16,792,865 | |||
| Total Investment in Securities (cost $1,080,035,691) | $ | 1,418,369,204 | ||
| Receivable for investments sold | 1,394,752 | |||
| Receivable for fund shares sold | 1,820,995 | |||
| Dividends receivable | 2,661,439 | |||
| Distributions receivable from Fidelity Central Funds | 3,448 | |||
| Prepaid expenses | 3,371 | |||
| Other receivables | 347,902 | |||
Total assets | 1,424,601,111 | |||
| Liabilities | ||||
| Payable for investments purchased | $ | 2,367,979 | ||
| Payable for fund shares redeemed | 395,336 | |||
| Accrued management fee | 762,909 | |||
| Distribution and service plan fees payable | 122,429 | |||
| Other payables and accrued expenses | 401,117 | |||
| Collateral on securities loaned | 15,345,000 | |||
| Total liabilities | 19,394,770 | |||
| Commitments and contingent liabilities (see Significant Accounting Policies note) | ||||
| Net Assets | $ | 1,405,206,341 | ||
| Net Assets consist of: | ||||
| Paid in capital | $ | 1,019,041,297 | ||
| Total accumulated earnings (loss) | 386,165,044 | |||
| Net Assets | $ | 1,405,206,341 | ||
| Net Asset Value and Maximum Offering Price | ||||
| Class A : | ||||
Net Asset Value and redemption price per share ($306,320,472 ÷ 3,121,781 shares)(a) | $ | 98.12 | ||
| Maximum offering price per share (100/94.25 of $98.12) | $ | 104.11 | ||
| Class M : | ||||
Net Asset Value and redemption price per share ($59,715,878 ÷ 616,776 shares)(a) | $ | 96.82 | ||
| Maximum offering price per share (100/96.50 of $96.82) | $ | 100.33 | ||
| Class C : | ||||
Net Asset Value and offering price per share ($43,267,710 ÷ 456,598 shares)(a) | $ | 94.76 | ||
| Consumer Staples : | ||||
Net Asset Value, offering price and redemption price per share ($810,582,755 ÷ 8,146,629 shares) | $ | 99.50 | ||
| Class I : | ||||
Net Asset Value, offering price and redemption price per share ($139,400,188 ÷ 1,405,506 shares) | $ | 99.18 | ||
| Class Z : | ||||
Net Asset Value, offering price and redemption price per share ($45,919,338 ÷ 463,553 shares) | $ | 99.06 | ||
(a)Redemption price per share is equal to net asset value less any applicable contingent deferred sales charge. | ||||
| Statement of Operations | ||||
Six months ended August 31, 2024 (Unaudited) | ||||
| Investment Income | ||||
| Dividends | $ | 20,307,053 | ||
| Income from Fidelity Central Funds (including $4,462 from security lending) | 34,208 | |||
| Total income | 20,341,261 | |||
| Expenses | ||||
| Management fee | $ | 4,655,796 | ||
| Distribution and service plan fees | 748,869 | |||
| Custodian fees and expenses | 19,618 | |||
| Independent trustees' fees and expenses | 3,030 | |||
| Registration fees | 58,849 | |||
| Audit fees | 32,739 | |||
| Legal | 1,689 | |||
| Interest | 15,210 | |||
| Miscellaneous | 26,295 | |||
| Total expenses before reductions | 5,562,095 | |||
| Expense reductions | (31,204) | |||
| Total expenses after reductions | 5,530,891 | |||
| Net Investment income (loss) | 14,810,370 | |||
| Realized and Unrealized Gain (Loss) | ||||
| Net realized gain (loss) on: | ||||
| Investment Securities: | ||||
| Unaffiliated issuers | 53,541,430 | |||
| Foreign currency transactions | (5,383) | |||
| Total net realized gain (loss) | 53,536,047 | |||
| Change in net unrealized appreciation (depreciation) on: | ||||
| Investment Securities: | ||||
| Unaffiliated issuers | 57,502,581 | |||
| Unfunded commitments | (5,513) | |||
| Assets and liabilities in foreign currencies | 1,901 | |||
| Total change in net unrealized appreciation (depreciation) | 57,498,969 | |||
| Net gain (loss) | 111,035,016 | |||
| Net increase (decrease) in net assets resulting from operations | $ | 125,845,386 | ||
| Statement of Changes in Net Assets | ||||
Six months ended August 31, 2024 (Unaudited) | Year ended February 29, 2024 | |||
| Increase (Decrease) in Net Assets | ||||
| Operations | ||||
| Net investment income (loss) | $ | 14,810,370 | $ | 31,008,029 |
| Net realized gain (loss) | 53,536,047 | 74,735,039 | ||
| Change in net unrealized appreciation (depreciation) | 57,498,969 | (33,606,653) | ||
| Net increase (decrease) in net assets resulting from operations | 125,845,386 | 72,136,415 | ||
| Distributions to shareholders | (21,535,744) | (76,670,402) | ||
| Share transactions - net increase (decrease) | (197,219,936) | (46,163,278) | ||
| Total increase (decrease) in net assets | (92,910,294) | (50,697,265) | ||
| Net Assets | ||||
| Beginning of period | 1,498,116,635 | 1,548,813,900 | ||
| End of period | $ | 1,405,206,341 | $ | 1,498,116,635 |
Fidelity Advisor® Consumer Staples Fund Class A |
Six months ended (Unaudited) August 31, 2024 | Years ended February 28, 2024 A | 2023 | 2022 | 2021 | 2020 A | |||||||
Selected Per-Share Data | ||||||||||||
| Net asset value, beginning of period | $ | 91.15 | $ | 91.25 | $ | 95.55 | $ | 89.40 | $ | 79.57 | $ | 76.88 |
| Income from Investment Operations | ||||||||||||
Net investment income (loss) B,C | .91 | 1.68 | 1.38 | 1.40 | 1.34 | 1.40 | ||||||
| Net realized and unrealized gain (loss) | 7.45 | 2.68 | (2.79) | 14.98 | 11.24 | 3.54 | ||||||
| Total from investment operations | 8.36 | 4.36 | (1.41) | 16.38 | 12.58 | 4.94 | ||||||
| Distributions from net investment income | (.90) | (1.50) | (1.36) | (1.55) | (1.42) | (1.35) | ||||||
| Distributions from net realized gain | (.49) | (2.96) | (1.53) | (8.68) | (1.33) | (.90) | ||||||
| Total distributions | (1.39) | (4.46) | (2.89) | (10.23) | (2.75) | (2.25) | ||||||
| Net asset value, end of period | $ | 98.12 | $ | 91.15 | $ | 91.25 | $ | 95.55 | $ | 89.40 | $ | 79.57 |
Total Return D,E,F | 9.30 % | 4.90% | (1.49)% | 18.83% | 16.00% | 6.17% | ||||||
Ratios to Average Net Assets C,G,H | ||||||||||||
| Expenses before reductions | .97% I | 1.01% | 1.01% | 1.01% | 1.04% | 1.04% | ||||||
| Expenses net of fee waivers, if any | .97 % I | 1.00% | 1.01% | 1.01% | 1.04% | 1.04% | ||||||
| Expenses net of all reductions | .97% I | 1.00% | 1.01% | 1.01% | 1.03% | 1.04% | ||||||
| Net investment income (loss) | 1.96% I | 1.80% | 1.51% | 1.45% | 1.57% | 1.67% | ||||||
| Supplemental Data | ||||||||||||
| Net assets, end of period (000 omitted) | $ | 306,320 | $ | 290,687 | $ | 297,850 | $ | 293,276 | $ | 248,234 | $ | 239,067 |
Portfolio turnover rate J | 39 % I | 54% K | 46% | 61% | 51% | 40% |
Fidelity Advisor® Consumer Staples Fund Class M |
Six months ended (Unaudited) August 31, 2024 | Years ended February 28, 2024 A | 2023 | 2022 | 2021 | 2020 A | |||||||
Selected Per-Share Data | ||||||||||||
| Net asset value, beginning of period | $ | 89.96 | $ | 90.11 | $ | 94.39 | $ | 88.43 | $ | 78.74 | $ | 76.13 |
| Income from Investment Operations | ||||||||||||
Net investment income (loss) B,C | .79 | 1.42 | 1.13 | 1.13 | 1.10 | 1.16 | ||||||
| Net realized and unrealized gain (loss) | 7.35 | 2.66 | (2.76) | 14.81 | 11.11 | 3.50 | ||||||
| Total from investment operations | 8.14 | 4.08 | (1.63) | 15.94 | 12.21 | 4.66 | ||||||
| Distributions from net investment income | (.79) | (1.27) | (1.12) | (1.30) | (1.19) | (1.15) | ||||||
| Distributions from net realized gain | (.49) | (2.96) | (1.53) | (8.68) | (1.33) | (.90) | ||||||
| Total distributions | (1.28) | (4.23) | (2.65) | (9.98) | (2.52) | (2.05) | ||||||
| Net asset value, end of period | $ | 96.82 | $ | 89.96 | $ | 90.11 | $ | 94.39 | $ | 88.43 | $ | 78.74 |
Total Return D,E,F | 9.16 % | 4.63% | (1.74)% | 18.51% | 15.69% | 5.88% | ||||||
Ratios to Average Net Assets C,G,H | ||||||||||||
| Expenses before reductions | 1.22% I | 1.27% | 1.27% | 1.28% | 1.31% | 1.31% | ||||||
| Expenses net of fee waivers, if any | 1.22 % I | 1.26% | 1.27% | 1.28% | 1.31% | 1.31% | ||||||
| Expenses net of all reductions | 1.22% I | 1.26% | 1.27% | 1.28% | 1.30% | 1.31% | ||||||
| Net investment income (loss) | 1.71% I | 1.54% | 1.25% | 1.18% | 1.30% | 1.40% | ||||||
| Supplemental Data | ||||||||||||
| Net assets, end of period (000 omitted) | $ | 59,716 | $ | 58,373 | $ | 62,870 | $ | 64,707 | $ | 56,664 | $ | 55,954 |
Portfolio turnover rate J | 39 % I | 54% K | 46% | 61% | 51% | 40% |
Fidelity Advisor® Consumer Staples Fund Class C |
Six months ended (Unaudited) August 31, 2024 | Years ended February 28, 2024 A | 2023 | 2022 | 2021 | 2020 A | |||||||
Selected Per-Share Data | ||||||||||||
| Net asset value, beginning of period | $ | 88.04 | $ | 88.22 | $ | 92.48 | $ | 86.73 | $ | 77.27 | $ | 74.79 |
| Income from Investment Operations | ||||||||||||
Net investment income (loss) B,C | .54 | .95 | .67 | .65 | .68 | .75 | ||||||
| Net realized and unrealized gain (loss) | 7.21 | 2.61 | (2.69) | 14.51 | 10.87 | 3.44 | ||||||
| Total from investment operations | 7.75 | 3.56 | (2.02) | 15.16 | 11.55 | 4.19 | ||||||
| Distributions from net investment income | (.53) | (.78) | (.71) | (.79) | (.80) | (.81) | ||||||
| Distributions from net realized gain | (.49) | (2.96) | (1.53) | (8.62) | (1.30) | (.90) | ||||||
| Total distributions | (1.03) D | (3.74) | (2.24) | (9.41) | (2.09) D | (1.71) | ||||||
| Net asset value, end of period | $ | 94.76 | $ | 88.04 | $ | 88.22 | $ | 92.48 | $ | 86.73 | $ | 77.27 |
Total Return E,F,G | 8.89 % | 4.12% | (2.23)% | 17.92% | 15.14% | 5.39% | ||||||
Ratios to Average Net Assets C,H,I | ||||||||||||
| Expenses before reductions | 1.73% J | 1.76% | 1.77% | 1.77% | 1.79% | 1.79% | ||||||
| Expenses net of fee waivers, if any | 1.72 % J | 1.75% | 1.76% | 1.76% | 1.79% | 1.79% | ||||||
| Expenses net of all reductions | 1.72% J | 1.75% | 1.76% | 1.76% | 1.78% | 1.79% | ||||||
| Net investment income (loss) | 1.21% J | 1.05% | .76% | .70% | .83% | .92% | ||||||
| Supplemental Data | ||||||||||||
| Net assets, end of period (000 omitted) | $ | 43,268 | $ | 52,661 | $ | 78,497 | $ | 88,645 | $ | 104,955 | $ | 117,328 |
Portfolio turnover rate K | 39 % J | 54% L | 46% | 61% | 51% | 40% |
Consumer Staples Portfolio |
Six months ended (Unaudited) August 31, 2024 | Years ended February 28, 2024 A | 2023 | 2022 | 2021 | 2020 A | |||||||
Selected Per-Share Data | ||||||||||||
| Net asset value, beginning of period | $ | 92.39 | $ | 92.43 | $ | 96.75 | $ | 90.40 | $ | 80.42 | $ | 77.63 |
| Income from Investment Operations | ||||||||||||
Net investment income (loss) B,C | 1.07 | 1.96 | 1.66 | 1.69 | 1.60 | 1.66 | ||||||
| Net realized and unrealized gain (loss) | 7.55 | 2.73 | (2.84) | 15.16 | 11.39 | 3.59 | ||||||
| Total from investment operations | 8.62 | 4.69 | (1.18) | 16.85 | 12.99 | 5.25 | ||||||
| Distributions from net investment income | (1.01) | (1.77) | (1.61) | (1.81) | (1.68) | (1.55) | ||||||
| Distributions from net realized gain | (.49) | (2.96) | (1.53) | (8.68) | (1.33) | (.90) | ||||||
| Total distributions | (1.51) D | (4.73) | (3.14) | (10.50) D | (3.01) | (2.46) D | ||||||
| Net asset value, end of period | $ | 99.50 | $ | 92.39 | $ | 92.43 | $ | 96.75 | $ | 90.40 | $ | 80.42 |
Total Return E,F | 9.46 % | 5.20% | (1.21)% | 19.16% | 16.34% | 6.48% | ||||||
Ratios to Average Net Assets C,G,H | ||||||||||||
| Expenses before reductions | .68% I | .73% | .73% | .73% | .75% | .75% | ||||||
| Expenses net of fee waivers, if any | .68 % I | .72% | .73% | .73% | .75% | .75% | ||||||
| Expenses net of all reductions | .68% I | .72% | .73% | .73% | .74% | .75% | ||||||
| Net investment income (loss) | 2.25% I | 2.08% | 1.79% | 1.74% | 1.86% | 1.96% | ||||||
| Supplemental Data | ||||||||||||
| Net assets, end of period (000 omitted) | $ | 810,583 | $ | 895,019 | $ | 862,837 | $ | 1,032,956 | $ | 770,644 | $ | 773,437 |
Portfolio turnover rate J | 39 % I | 54% K | 46% | 61% | 51% | 40% |
Fidelity Advisor® Consumer Staples Fund Class I |
Six months ended (Unaudited) August 31, 2024 | Years ended February 28, 2024 A | 2023 | 2022 | 2021 | 2020 A | |||||||
Selected Per-Share Data | ||||||||||||
| Net asset value, beginning of period | $ | 92.11 | $ | 92.16 | $ | 96.48 | $ | 90.17 | $ | 80.23 | $ | 77.45 |
| Income from Investment Operations | ||||||||||||
Net investment income (loss) B,C | 1.05 | 1.95 | 1.65 | 1.67 | 1.60 | 1.65 | ||||||
| Net realized and unrealized gain (loss) | 7.52 | 2.72 | (2.83) | 15.13 | 11.34 | 3.58 | ||||||
| Total from investment operations | 8.57 | 4.67 | (1.18) | 16.80 | 12.94 | 5.23 | ||||||
| Distributions from net investment income | (1.01) | (1.76) | (1.61) | (1.80) | (1.67) | (1.55) | ||||||
| Distributions from net realized gain | (.49) | (2.96) | (1.53) | (8.68) | (1.33) | (.90) | ||||||
| Total distributions | (1.50) | (4.72) | (3.14) | (10.49) D | (3.00) | (2.45) | ||||||
| Net asset value, end of period | $ | 99.18 | $ | 92.11 | $ | 92.16 | $ | 96.48 | $ | 90.17 | $ | 80.23 |
Total Return E,F | 9.44 % | 5.19% | (1.22)% | 19.15% | 16.32% | 6.48% | ||||||
Ratios to Average Net Assets C,G,H | ||||||||||||
| Expenses before reductions | .71% I | .74% | .74% | .74% | .76% | .76% | ||||||
| Expenses net of fee waivers, if any | .71 % I | .73% | .74% | .74% | .75% | .76% | ||||||
| Expenses net of all reductions | .71% I | .73% | .74% | .74% | .75% | .76% | ||||||
| Net investment income (loss) | 2.22% I | 2.08% | 1.78% | 1.72% | 1.86% | 1.95% | ||||||
| Supplemental Data | ||||||||||||
| Net assets, end of period (000 omitted) | $ | 139,400 | $ | 143,350 | $ | 158,019 | $ | 149,160 | $ | 132,898 | $ | 149,514 |
Portfolio turnover rate J | 39 % I | 54% K | 46% | 61% | 51% | 40% |
Fidelity Advisor® Consumer Staples Fund Class Z |
Six months ended (Unaudited) August 31, 2024 | Years ended February 28, 2024 A | 2023 | 2022 | 2021 | 2020 A | |||||||
Selected Per-Share Data | ||||||||||||
| Net asset value, beginning of period | $ | 91.98 | $ | 92.05 | $ | 96.36 | $ | 90.08 | $ | 80.14 | $ | 77.36 |
| Income from Investment Operations | ||||||||||||
Net investment income (loss) B,C | 1.11 | 2.07 | 1.76 | 1.79 | 1.71 | 1.78 | ||||||
| Net realized and unrealized gain (loss) | 7.52 | 2.70 | (2.82) | 15.10 | 11.35 | 3.56 | ||||||
| Total from investment operations | 8.63 | 4.77 | (1.06) | 16.89 | 13.06 | 5.34 | ||||||
| Distributions from net investment income | (1.06) | (1.88) | (1.73) | (1.93) | (1.79) | (1.66) | ||||||
| Distributions from net realized gain | (.49) | (2.96) | (1.53) | (8.68) | (1.33) | (.90) | ||||||
| Total distributions | (1.55) | (4.84) | (3.25) D | (10.61) | (3.12) | (2.56) | ||||||
| Net asset value, end of period | $ | 99.06 | $ | 91.98 | $ | 92.05 | $ | 96.36 | $ | 90.08 | $ | 80.14 |
Total Return E,F | 9.52 % | 5.31% | (1.09)% | 19.29% | 16.49% | 6.61% | ||||||
Ratios to Average Net Assets C,G,H | ||||||||||||
| Expenses before reductions | .58% I | .61% | .61% | .61% | .62% | .63% | ||||||
| Expenses net of fee waivers, if any | .58 % I | .60% | .61% | .61% | .62% | .63% | ||||||
| Expenses net of all reductions | .58% I | .60% | .61% | .61% | .62% | .62% | ||||||
| Net investment income (loss) | 2.35% I | 2.20% | 1.91% | 1.85% | 1.99% | 2.08% | ||||||
| Supplemental Data | ||||||||||||
| Net assets, end of period (000 omitted) | $ | 45,919 | $ | 58,026 | $ | 88,741 | $ | 77,826 | $ | 43,591 | $ | 41,629 |
Portfolio turnover rate J | 39 % I | 54% K | 46% | 61% | 51% | 40% |
| Fidelity Central Fund | Investment Manager | Investment Objective | Investment Practices | Expense RatioA |
| Fidelity Money Market Central Funds | Fidelity Management & Research Company LLC (FMR) | Each fund seeks to obtain a high level of current income consistent with the preservation of capital and liquidity. | Short-term Investments | Less than .005% |
| Consumer Staples Portfolio | $347,902 |
| Gross unrealized appreciation | $399,612,274 |
| Gross unrealized depreciation | (73,331,292) |
| Net unrealized appreciation (depreciation) | $326,280,982 |
| Tax cost | $1,092,088,222 |
| Investment to be Acquired | Commitment Amount ($) | Unrealized Appreciation (Depreciation)($) | |
| Consumer Staples Portfolio | JUUL Labs, Inc. Class A | 3,749,468 | - |
| Purchases ($) | Sales ($) | |
| Consumer Staples Portfolio | 276,400,032 | 477,488,355 |
| Shares | Total net realized gain or loss ($) | Total Proceeds ($) | |
| Consumer Staples Portfolio | 341,222 | 11,902,627 | 31,040,947 |
| Maximum Management Fee Rate % | |
| Class A | .71 |
| Class M | .72 |
| Class C | .71 |
| Consumer Staples | .68 |
| Class I | .69 |
| Class Z | .56 |
| Total Management Fee Rate % | |
| Class A | .70 |
| Class M | .70 |
| Class C | .70 |
| Consumer Staples | .66 |
| Class I | .69 |
| Class Z | .56 |
| Distribution Fee | Service Fee | Total Fees ($) | Retained by FDC ($) | |
| Class A | - % | .25% | 368,001 | 1,761 |
| Class M | .25% | .25% | 145,782 | - |
| Class C | .75% | .25% | 235,086 | 14,378 |
| 748,869 | 16,139 |
| Retained by FDC ($) | |
| Class A | 23,910 |
| Class M | 2,002 |
Class CA | 424 |
26,336 |
| Amount ($) | |
| Consumer Staples Portfolio | 8,748 |
| Borrower or Lender | Average Loan Balance ($) | Weighted Average Interest Rate | Interest Expense ($) | |
| Consumer Staples Portfolio | Borrower | 14,034,571 | 5.57% | 15,210 |
| Purchases ($) | Sales ($) | Realized Gain (Loss)($) | |
| Consumer Staples Portfolio | 17,486,007 | 24,586,991 | 1,160,745 |
| Amount ($) | |
| Consumer Staples Portfolio | 1,286 |
| Total Security Lending Fees Paid to NFS ($) | Security Lending Income From Securities Loaned to NFS ($) | Value of Securities Loaned to NFS at Period End ($) | |
| Consumer Staples Portfolio | 475 | 7 | - |
Six months ended August 31, 2024 | Year ended February 29, 2024 | |
| Consumer Staples Portfolio | ||
| Distributions to shareholders | ||
| Class A | $4,402,446 | $14,193,435 |
| Class M | 816,741 | 2,755,073 |
| Class C | 567,025 | 2,447,301 |
| Consumer Staples | 12,822,602 | 45,433,753 |
| Class I | 2,236,167 | 8,441,151 |
| Class Z | 690,763 | 3,399,689 |
Total | $21,535,744 | $76,670,402 |
| Shares | Shares | Dollars | Dollars | |
Six months ended August 31, 2024 | Year ended February 29, 2024 | Six months ended August 31, 2024 | Year ended February 29, 2024 | |
| Consumer Staples Portfolio | ||||
| Class A | ||||
| Shares sold | 186,899 | 433,548 | $17,362,359 | $40,414,601 |
| Reinvestment of distributions | 46,596 | 152,629 | 4,248,143 | 13,731,692 |
| Shares redeemed | (300,844) | (661,316) | (27,996,610) | (61,286,921) |
| Net increase (decrease) | (67,349) | (75,139) | $(6,386,108) | $(7,140,628) |
| Class M | ||||
| Shares sold | 15,648 | 30,160 | $1,434,485 | $2,769,669 |
| Reinvestment of distributions | 8,948 | 30,823 | 805,202 | 2,736,825 |
| Shares redeemed | (56,712) | (109,826) | (5,211,794) | (10,088,961) |
| Net increase (decrease) | (32,116) | (48,843) | $(2,972,107) | $(4,582,467) |
| Class C | ||||
| Shares sold | 10,498 | 60,782 | $942,421 | $5,515,955 |
| Reinvestment of distributions | 6,366 | 27,847 | 560,532 | 2,419,449 |
| Shares redeemed | (158,421) | (380,224) | (14,174,451) | (34,216,372) |
| Net increase (decrease) | (141,557) | (291,595) | $(12,671,498) | $(26,280,968) |
| Consumer Staples | ||||
| Shares sold | 346,037 | 2,481,700 | $32,811,799 | $235,907,480 |
| Reinvestment of distributions | 126,884 | 456,661 | 11,725,350 | 41,615,033 |
| Shares redeemed | (2,014,023) | (2,585,591) | (189,695,510) | (241,614,760) |
| Net increase (decrease) | (1,541,102) | 352,770 | $(145,158,361) | $35,907,753 |
| Class I | ||||
| Shares sold | 145,797 | 708,067 | $13,655,333 | $66,730,554 |
| Reinvestment of distributions | 23,042 | 88,639 | 2,122,577 | 8,056,704 |
| Shares redeemed | (319,698) | (954,914) | (29,943,285) | (89,032,490) |
| Net increase (decrease) | (150,859) | (158,208) | $(14,165,375) | $(14,245,232) |
| Class Z | ||||
| Shares sold | 74,910 | 505,773 | $7,014,245 | $47,755,733 |
| Reinvestment of distributions | 6,073 | 33,052 | 558,700 | 3,005,014 |
| Shares redeemed | (248,261) | (872,078) | (23,439,432) | (80,582,483) |
| Net increase (decrease) | (167,278) | (333,253) | $(15,866,487) | $(29,821,736) |
| A special meeting of shareholders was held on July 16, 2024. The results of votes taken among shareholders on the proposal before them are reported below. Each vote reported represents one dollar of net asset value held on the record date for the meeting. | ||
| Proposal 1 | ||
| To elect a Board of Trustees. | ||
# of Votes | % of Votes | |
| Bettina Doulton | ||
| Affirmative | 50,178,154,296.75 | 92.38 |
| Withheld | 4,136,551,415.53 | 7.62 |
| TOTAL | 54,314,705,712.27 | 100.00 |
| Robert A. Lawrence | ||
| Affirmative | 50,131,321,830.27 | 92.30 |
| Withheld | 4,183,383,882.00 | 7.70 |
| TOTAL | 54,314,705,712.27 | 100.00 |
| Vijay C. Advani | ||
| Affirmative | 50,021,870,319.77 | 92.10 |
| Withheld | 4,292,835,392.50 | 7.90 |
| TOTAL | 54,314,705,712.27 | 100.00 |
| Thomas P. Bostick | ||
| Affirmative | 50,057,248,681.17 | 92.16 |
| Withheld | 4,257,457,031.10 | 7.84 |
| TOTAL | 54,314,705,712.27 | 100.00 |
| Donald F. Donahue | ||
| Affirmative | 49,998,023,290.27 | 92.05 |
| Withheld | 4,316,682,422.00 | 7.95 |
| TOTAL | 54,314,705,712.27 | 100.00 |
| Vicki L. Fuller | ||
| Affirmative | 50,146,578,363.15 | 92.33 |
| Withheld | 4,168,127,349.12 | 7.67 |
| TOTAL | 54,314,705,712.27 | 100.00 |
| Patricia L. Kampling | ||
| Affirmative | 50,227,895,949.71 | 92.48 |
| Withheld | 4,086,809,762.56 | 7.52 |
| TOTAL | 54,314,705,712.27 | 100.00 |
| Thomas A. Kennedy | ||
| Affirmative | 50,080,160,698.34 | 92.20 |
| Withheld | 4,234,545,013.93 | 7.80 |
| TOTAL | 54,314,705,712.27 | 100.00 |
| Oscar Munoz | ||
| Affirmative | 49,879,616,445.58 | 91.83 |
| Withheld | 4,435,089,266.69 | 8.17 |
| TOTAL | 54,314,705,712.27 | 100.00 |
| Karen B. Peetz | ||
| Affirmative | 50,078,105,799.58 | 92.20 |
| Withheld | 4,236,599,912.69 | 7.80 |
| TOTAL | 54,314,705,712.27 | 100.00 |
| David M. Thomas | ||
| Affirmative | 50,013,939,190.36 | 92.08 |
| Withheld | 4,300,766,521.91 | 7.92 |
| TOTAL | 54,314,705,712.27 | 100.00 |
| Susan Tomasky | ||
| Affirmative | 50,109,134,188.50 | 92.26 |
| Withheld | 4,205,571,523.77 | 7.74 |
| TOTAL | 54,314,705,712.27 | 100.00 |
| Michael E. Wiley | ||
| Affirmative | 50,016,526,096.47 | 92.09 |
| Withheld | 4,298,179,615.80 | 7.91 |
| TOTAL | 54,314,705,712.27 | 100.00 |
| Proposal 1 reflects trust-wide proposal and voting results. | ||
 |


Contents
| Common Stocks - 98.8% | |||
| Shares | Value ($) | ||
| Biotechnology - 91.3% | |||
| Biotechnology - 91.3% | |||
| AbbVie, Inc. | 2,788,499 | 547,410,236 | |
| Absci Corp. (a)(b) | 39,900 | 175,560 | |
| AC Immune SA (a)(b) | 27,202 | 87,862 | |
| Adverum Biotechnologies, Inc. (a) | 325,791 | 2,260,990 | |
| Alector, Inc. (a) | 3,535,753 | 18,668,776 | |
| Allena Pharmaceuticals, Inc. (a)(c) | 93,683 | 1 | |
| Allogene Therapeutics, Inc. (a)(b) | 2,685,377 | 7,062,542 | |
| Alnylam Pharmaceuticals, Inc. (a) | 657,270 | 172,658,256 | |
| ALX Oncology Holdings, Inc. (a) | 835,504 | 1,938,369 | |
| Amgen, Inc. | 1,433,850 | 478,662,146 | |
| Amicus Therapeutics, Inc. (a) | 167,229 | 1,941,529 | |
| AnaptysBio, Inc. (a) | 275,472 | 10,492,728 | |
| Annexon, Inc. (a) | 216,944 | 1,236,581 | |
| Apellis Pharmaceuticals, Inc. (a) | 956,079 | 37,191,473 | |
| Apogee Therapeutics, Inc. (a)(b) | 392,132 | 20,065,394 | |
| Arcellx, Inc. (a)(b) | 1,269,090 | 87,237,247 | |
| Arcturus Therapeutics Holdings, Inc. (a)(b) | 399,330 | 8,425,863 | |
| Arcus Biosciences, Inc. (a)(b) | 2,142,862 | 36,685,797 | |
| Argenx SE ADR (a) | 174,804 | 90,429,605 | |
| ArriVent Biopharma, Inc. (b)(d) | 1,798,400 | 48,071,232 | |
| Arrowhead Pharmaceuticals, Inc. (a) | 694,370 | 16,546,837 | |
| Ars Pharmaceuticals, Inc. (a)(b) | 1,082,956 | 14,056,769 | |
| Ascendis Pharma A/S sponsored ADR (a) | 659,409 | 91,295,176 | |
| Astria Therapeutics, Inc. (a) | 596,256 | 7,292,211 | |
| Astria Therapeutics, Inc. warrants (a) | 115,136 | 789,363 | |
| aTyr Pharma, Inc. (a)(b) | 2,524,394 | 4,720,617 | |
| Aura Biosciences, Inc. (a)(b) | 229,592 | 1,825,256 | |
| Autolus Therapeutics PLC ADR (a) | 1,242,833 | 4,884,334 | |
| Avidity Biosciences, Inc. (a) | 1,148,217 | 50,521,548 | |
| Axcella Health, Inc. (a)(c) | 66,454 | 1 | |
| Beam Therapeutics, Inc. (a)(b) | 39,350 | 1,049,858 | |
| BeiGene Ltd. ADR (a) | 9,198 | 1,763,992 | |
| BioCryst Pharmaceuticals, Inc. (a)(b) | 1,787,181 | 15,530,603 | |
| Biohaven Ltd. (a)(b) | 1,812,012 | 71,393,273 | |
| Biomea Fusion, Inc. (a)(b) | 392,129 | 2,874,306 | |
| Blueprint Medicines Corp. (a) | 610,252 | 58,303,476 | |
| Boundless Bio, Inc. (b) | 23,700 | 85,794 | |
| BridgeBio Pharma, Inc. (a) | 226,196 | 6,299,559 | |
| BridgeBio Pharma, Inc. (e) | 733,408 | 20,425,413 | |
| Cargo Therapeutics, Inc. | 213,400 | 4,024,724 | |
| Cartesian Therapeutics, Inc. (b) | 652,491 | 9,108,774 | |
| Cartesian Therapeutics, Inc. (e) | 375,000 | 5,235,000 | |
| Cartesian Therapeutics, Inc. rights (a)(c) | 5,385,728 | 2,315,863 | |
| Celldex Therapeutics, Inc. (a) | 635,264 | 26,255,461 | |
| Centessa Pharmaceuticals PLC ADR (a)(b) | 2,787,194 | 37,627,119 | |
| CG Oncology, Inc. (b) | 101,500 | 3,743,320 | |
| Chinook Therapeutics, Inc. rights (a)(c) | 115,821 | 1 | |
| Codiak Biosciences, Inc. (a)(b)(c) | 448,539 | 4 | |
| Codiak Biosciences, Inc. warrants 9/15/27 (a)(c) | 46,000 | 0 | |
| Cogent Biosciences, Inc. (a) | 1,357,394 | 14,578,412 | |
| Crinetics Pharmaceuticals, Inc. (a) | 1,053,750 | 55,911,975 | |
| CRISPR Therapeutics AG (a)(b) | 202,007 | 9,639,774 | |
| Cyclerion Therapeutics, Inc. (a) | 41,864 | 113,451 | |
| Cyclerion Therapeutics, Inc. (a)(e) | 4,740 | 12,845 | |
| Cytokinetics, Inc. (a) | 335,052 | 19,124,768 | |
| Day One Biopharmaceuticals, Inc. (a)(b) | 1,067,999 | 14,781,106 | |
| Denali Therapeutics, Inc. (a) | 1,054,292 | 25,766,896 | |
| Design Therapeutics, Inc. (a)(b) | 705,900 | 3,353,025 | |
| Dianthus Therapeutics, Inc. (a) | 153,693 | 4,430,969 | |
| Disc Medicine, Inc. (a)(b) | 403,920 | 20,527,214 | |
| Disc Medicine, Inc. rights (a)(c) | 1,555,907 | 16 | |
| Dyne Therapeutics, Inc. (a) | 995,018 | 45,860,380 | |
| Entrada Therapeutics, Inc. (a)(b) | 569,869 | 10,086,681 | |
| Exelixis, Inc. (a) | 179,454 | 4,671,188 | |
| Foghorn Therapeutics, Inc. (a)(b) | 907,441 | 7,513,611 | |
| Geron Corp. (a) | 6,269,312 | 29,779,232 | |
| Geron Corp. warrants 12/31/25 (a) | 2,100,000 | 3,822,000 | |
| Gilead Sciences, Inc. | 1,656,603 | 130,871,637 | |
| Gossamer Bio, Inc. (a)(b) | 7,914,394 | 6,947,255 | |
| Gritstone Bio, Inc. (a) | 852,288 | 406,371 | |
| Gritstone Bio, Inc. warrants (a)(c) | 1,333,333 | 13 | |
| Ideaya Biosciences, Inc. (a)(b) | 939,157 | 37,096,702 | |
| Idorsia Ltd. (a)(b) | 2,176,303 | 5,483,961 | |
| IGM Biosciences, Inc. (a)(b) | 809,982 | 8,253,717 | |
| Immunocore Holdings PLC ADR (a)(b) | 191,705 | 6,878,375 | |
| Immunome, Inc. (a)(b) | 394,182 | 5,983,683 | |
| Immunovant, Inc. (a) | 665,621 | 20,567,689 | |
| Inozyme Pharma, Inc. (a)(b) | 2,471,087 | 13,689,822 | |
| Insmed, Inc. (a) | 1,051,719 | 80,424,952 | |
| Intellia Therapeutics, Inc. (a)(b) | 925,311 | 20,763,979 | |
| IO Biotech, Inc. (a) | 314,600 | 471,900 | |
| Ionis Pharmaceuticals, Inc. (a) | 794,877 | 37,899,735 | |
| Janux Therapeutics, Inc. (a) | 366,399 | 17,213,425 | |
| Keros Therapeutics, Inc. (a) | 299,129 | 13,565,500 | |
| Korro Bio, Inc. (a)(b) | 51,138 | 2,440,305 | |
| Korro Bio, Inc. (a)(e) | 32,866 | 1,568,366 | |
| Krystal Biotech, Inc. (a)(b)(d) | 1,877,722 | 366,381,117 | |
| Kymera Therapeutics, Inc. (a) | 295,041 | 14,268,183 | |
| Legend Biotech Corp. ADR (a) | 372,310 | 21,426,441 | |
| Lexicon Pharmaceuticals, Inc. (a) | 4,314,500 | 7,464,085 | |
| Madrigal Pharmaceuticals, Inc. (a)(b) | 111,424 | 27,536,213 | |
| MannKind Corp. (a)(b) | 4,406,401 | 27,584,070 | |
| Merus BV (a)(b) | 1,264,364 | 64,469,920 | |
| Moderna, Inc. (a) | 775,151 | 59,996,687 | |
| Monte Rosa Therapeutics, Inc. (a) | 540,520 | 3,335,008 | |
| Moonlake Immunotherapeutics Class A (a) | 249,741 | 11,685,381 | |
| Natera, Inc. (a) | 357,132 | 42,234,430 | |
| Neurogene, Inc. (a) | 178,800 | 6,690,696 | |
| Nurix Therapeutics, Inc. (a) | 104,146 | 2,624,479 | |
| Nuvalent, Inc. Class A (a) | 249,799 | 21,265,389 | |
| Omega Therapeutics, Inc. (a)(b) | 245,003 | 360,154 | |
| ORIC Pharmaceuticals, Inc. (a)(b) | 117,400 | 1,217,438 | |
| PepGen, Inc. (a)(b) | 60,164 | 579,379 | |
| Perspective Therapeutics, Inc. (a) | 239,135 | 3,778,333 | |
| Poseida Therapeutics, Inc. (a) | 223,383 | 638,875 | |
| Praxis Precision Medicines, Inc. (a)(b) | 290,810 | 15,456,552 | |
| Protagonist Therapeutics, Inc. (a) | 423,913 | 18,181,629 | |
| Prothena Corp. PLC (a)(b) | 738,117 | 16,437,866 | |
| PTC Therapeutics, Inc. (a) | 595,011 | 21,015,789 | |
| Q32 Bio, Inc. (a)(b) | 99,900 | 4,343,652 | |
| Rallybio Corp. (a)(b) | 581,092 | 668,256 | |
| RAPT Therapeutics, Inc. (a)(b) | 802,700 | 1,649,549 | |
| Recursion Pharmaceuticals, Inc. Class A (a)(b) | 149,900 | 1,091,272 | |
| Regeneron Pharmaceuticals, Inc. (a) | 219,783 | 260,374,722 | |
| Regulus Therapeutics, Inc. (a)(b) | 641,817 | 1,078,253 | |
| Replimune Group, Inc. (a) | 532,215 | 5,412,627 | |
| Revolution Medicines, Inc. (a) | 673,198 | 28,698,431 | |
| Rhythm Pharmaceuticals, Inc. (a)(b) | 15,603 | 737,866 | |
| Rocket Pharmaceuticals, Inc. (a)(b) | 486,536 | 9,171,204 | |
| Roivant Sciences Ltd. (a) | 2,340,719 | 28,626,993 | |
| Sage Therapeutics, Inc. (a) | 342,487 | 2,887,165 | |
| Sana Biotechnology, Inc. (a)(b) | 338,094 | 2,045,469 | |
| Sarepta Therapeutics, Inc. (a) | 185,689 | 25,212,852 | |
| Scholar Rock Holding Corp. (a)(b) | 1,632,599 | 15,183,171 | |
| Scholar Rock Holding Corp. warrants 12/31/25 (a)(e) | 17,850 | 57,688 | |
| Sensorion SA (a)(d) | 20,279,025 | 15,243,175 | |
| Seres Therapeutics, Inc. (a)(b) | 854,347 | 683,990 | |
| Shattuck Labs, Inc. (a) | 481,542 | 1,728,736 | |
| SpringWorks Therapeutics, Inc. (a) | 373,409 | 15,574,889 | |
| Spyre Therapeutics, Inc. (a) | 261,553 | 7,519,649 | |
| Stoke Therapeutics, Inc. (a)(b) | 392,470 | 5,710,439 | |
| Summit Therapeutics, Inc. (a)(b) | 3,684,429 | 47,823,888 | |
| Tango Therapeutics, Inc. (a) | 176,588 | 2,089,036 | |
| Tango Therapeutics, Inc. (e) | 466,637 | 5,520,316 | |
| Taysha Gene Therapies, Inc. (a)(b) | 6,825,091 | 15,288,204 | |
| Tectonic Therapeutic, Inc. (e) | 215,508 | 4,137,754 | |
| Tenaya Therapeutics, Inc. (a) | 1,230,913 | 3,298,847 | |
| TG Therapeutics, Inc. (a)(b) | 1,139,220 | 26,760,278 | |
| Twist Bioscience Corp. (a) | 166,525 | 7,200,541 | |
| Tyra Biosciences, Inc. (a) | 191,396 | 4,356,173 | |
| Ultragenyx Pharmaceutical, Inc. (a) | 633,030 | 35,943,443 | |
| uniQure B.V. (a) | 520,081 | 3,042,474 | |
| United Therapeutics Corp. (a) | 163,393 | 59,401,525 | |
| Vaxcyte, Inc. (a) | 799,180 | 64,541,777 | |
| Vera Therapeutics, Inc. (a) | 309,178 | 11,693,112 | |
| Vertex Pharmaceuticals, Inc. (a) | 445,009 | 220,675,513 | |
| Viking Therapeutics, Inc. (a) | 445,557 | 28,569,115 | |
| Viridian Therapeutics, Inc. (a) | 1,005,738 | 14,764,234 | |
| Vor Biopharma, Inc. (a)(b) | 614,602 | 537,285 | |
| Xenon Pharmaceuticals, Inc. (a) | 539,634 | 21,768,836 | |
| Zealand Pharma A/S (a) | 752,230 | 98,820,690 | |
| Zentalis Pharmaceuticals, Inc. (a) | 370,433 | 1,285,403 | |
| 4,575,018,375 | |||
| Consumer Staples Distribution & Retail - 0.0% | |||
| Drug Retail - 0.0% | |||
| MedAvail Holdings, Inc. (a) | 55 | 0 | |
| Health Care Equipment & Supplies - 0.0% | |||
| Health Care Equipment - 0.0% | |||
| Aradigm Corp. (a)(c) | 148,009 | 1 | |
| Aradigm Corp. (a)(c) | 11,945 | 0 | |
| Glaukos Corp. (a) | 5,700 | 763,173 | |
| Novocure Ltd. (a) | 11,113 | 216,037 | |
| 979,211 | |||
| Health Care Technology - 0.2% | |||
| Health Care Technology - 0.2% | |||
| Schrodinger, Inc. (a)(b) | 374,501 | 7,875,756 | |
| Life Sciences Tools & Services - 0.1% | |||
| Life Sciences Tools & Services - 0.1% | |||
| 10X Genomics, Inc. Class A (a) | 112,400 | 2,624,540 | |
| Pharmaceuticals - 7.2% | |||
| Pharmaceuticals - 7.2% | |||
| Adimab LLC (a)(c)(e)(f) | 1,954,526 | 36,217,367 | |
| Adimab LLC (a)(c)(e)(f) | 1,954,526 | 10,300,352 | |
| Afferent Pharmaceuticals, Inc. rights 12/31/24 (a)(c) | 8,274,568 | 1,654,914 | |
| Alto Neuroscience, Inc. (b) | 168,700 | 2,161,047 | |
| Arvinas Holding Co. LLC (a) | 14,995 | 392,269 | |
| Atea Pharmaceuticals, Inc. (a) | 958,300 | 3,689,455 | |
| Axsome Therapeutics, Inc. (a)(b) | 95,903 | 8,521,941 | |
| Contineum Therapeutics, Inc. Class A | 58,800 | 1,146,012 | |
| Corcept Therapeutics, Inc. (a)(b) | 822,199 | 29,023,625 | |
| Edgewise Therapeutics, Inc. (a) | 476,985 | 8,943,469 | |
| Enliven Therapeutics, Inc. (a) | 479,038 | 10,481,351 | |
| Fulcrum Therapeutics, Inc. (a)(b) | 1,141,892 | 9,763,177 | |
| Galderma Group AG | 82,220 | 7,960,362 | |
| GH Research PLC (a)(b) | 174,461 | 1,831,841 | |
| Harmony Biosciences Holdings, Inc. (a) | 91,925 | 3,307,462 | |
| Intra-Cellular Therapies, Inc. (a) | 49,599 | 3,634,615 | |
| Longboard Pharmaceuticals, Inc. (a) | 1,711,289 | 61,743,307 | |
| Novo Nordisk A/S Series B sponsored ADR | 51,700 | 7,194,572 | |
| Nuvation Bio, Inc. Class A (a)(b) | 3,123,214 | 10,056,749 | |
| OptiNose, Inc. (a)(b) | 449,131 | 467,096 | |
| OptiNose, Inc. warrants 11/23/2027 (a) | 91,712 | 12,489 | |
| Pharvaris BV (a) | 112,407 | 2,023,326 | |
| Phathom Pharmaceuticals, Inc. (a) | 167,988 | 2,775,162 | |
| Pliant Therapeutics, Inc. (a) | 15,631 | 207,736 | |
| Rapport Therapeutics, Inc. (b) | 171,463 | 3,729,320 | |
| Structure Therapeutics, Inc. ADR (a)(b) | 259,176 | 9,882,381 | |
| UCB SA | 546,274 | 98,850,455 | |
| Ventyx Biosciences, Inc. (a)(b) | 81,600 | 181,968 | |
| Verona Pharma PLC ADR (a)(b) | 716,588 | 19,691,838 | |
| Verrica Pharmaceuticals, Inc. (a)(b) | 1,108,069 | 2,603,962 | |
| WAVE Life Sciences (a) | 333,211 | 1,912,631 | |
| 360,362,251 | |||
| TOTAL COMMON STOCKS (Cost $2,882,177,390) | 4,946,860,133 | ||
| Convertible Preferred Stocks - 1.0% | |||
| Shares | Value ($) | ||
| Biotechnology - 0.7% | |||
| Biotechnology - 0.7% | |||
| Cardurion Pharmaceuticals, Inc. Series B (c)(e) | 1,020,908 | 5,012,658 | |
| ElevateBio LLC Series C (a)(c)(e) | 216,600 | 710,448 | |
| National Resilience, Inc. Series B (a)(c)(e) | 732,064 | 24,992,665 | |
| SalioGen Therapeutics, Inc. Series B (a)(c)(e) | 94,461 | 6,625,495 | |
| 37,341,266 | |||
| Health Care Providers & Services - 0.3% | |||
| Health Care Services - 0.3% | |||
| Scorpion Therapeutics, Inc.: | |||
| Series B (a)(c)(e) | 3,099,905 | 7,501,770 | |
| Series C1 (c)(e) | 2,066,543 | 5,001,034 | |
| 12,502,804 | |||
| Health Care Technology - 0.0% | |||
| Health Care Technology - 0.0% | |||
| Candid Therapeutics Series B (c)(e) | 1,666,667 | 2,000,000 | |
| Pharmaceuticals - 0.0% | |||
| Pharmaceuticals - 0.0% | |||
| Afferent Pharmaceuticals, Inc. Series C (a)(c)(e) | 8,274,568 | 83 | |
| TOTAL CONVERTIBLE PREFERRED STOCKS (Cost $40,408,650) | 51,844,153 | ||
| Money Market Funds - 5.8% | |||
| Shares | Value ($) | ||
| Fidelity Cash Central Fund 5.39% (g) | 12,813,815 | 12,816,377 | |
| Fidelity Securities Lending Cash Central Fund 5.39% (g)(h) | 275,329,695 | 275,357,228 | |
| TOTAL MONEY MARKET FUNDS (Cost $288,152,754) | 288,173,605 | ||
| TOTAL INVESTMENT IN SECURITIES - 105.6% (Cost $3,210,738,794) | 5,286,877,891 |
NET OTHER ASSETS (LIABILITIES) - (5.6)% | (278,661,666) |
| NET ASSETS - 100.0% | 5,008,216,225 |
| (a) | Non-income producing |
| (b) | Security or a portion of the security is on loan at period end. |
| (c) | Level 3 security |
| (d) | Affiliated company |
| (e) | Restricted securities (including private placements) - Investment in securities not registered under the Securities Act of 1933 (excluding 144A issues). At the end of the period, the value of restricted securities (excluding 144A issues) amounted to $135,319,254 or 2.7% of net assets. |
| (f) | Investment is owned by a wholly-owned subsidiary (Subsidiary) that is treated as a corporation for U.S. tax purposes. |
| (g) | Affiliated fund that is generally available only to investment companies and other accounts managed by Fidelity Investments. The rate quoted is the annualized seven-day yield of the fund at period end. A complete unaudited listing of the fund's holdings as of its most recent quarter end is available upon request. In addition, each Fidelity Central Fund's financial statements are available on the SEC's website or upon request. |
| (h) | Investment made with cash collateral received from securities on loan. |
| Additional information on each restricted holding is as follows: | ||
| Security | Acquisition Date | Acquisition Cost ($) |
| Adimab LLC | 9/17/14 - 6/05/15 | 23,546,682 |
| Adimab LLC | 9/17/14 - 6/05/15 | 7,861,206 |
| Afferent Pharmaceuticals, Inc. Series C | 7/01/15 | 0 |
| BridgeBio Pharma, Inc. | 9/25/23 | 20,000,036 |
| Candid Therapeutics Series B | 8/27/24 | 2,000,000 |
| Cardurion Pharmaceuticals, Inc. Series B | 7/10/24 | 4,999,999 |
| Cartesian Therapeutics, Inc. | 7/02/24 | 7,500,000 |
| Cyclerion Therapeutics, Inc. | 4/02/19 | 1,404,026 |
| ElevateBio LLC Series C | 3/09/21 | 908,637 |
| Korro Bio, Inc. | 7/14/23 | 1,854,573 |
| National Resilience, Inc. Series B | 12/01/20 | 9,999,994 |
| SalioGen Therapeutics, Inc. Series B | 12/10/21 | 10,000,019 |
| Scholar Rock Holding Corp. warrants 12/31/25 | 6/17/22 | 0 |
| Scorpion Therapeutics, Inc. Series B | 1/08/21 | 7,500,000 |
| Scorpion Therapeutics, Inc. Series C1 | 7/01/24 | 5,000,001 |
| Tango Therapeutics, Inc. | 8/09/23 | 2,403,181 |
| Tectonic Therapeutic, Inc. | 1/30/24 | 5,000,003 |
| Affiliate | Value, beginning of period ($) | Purchases ($) | Sales Proceeds ($) | Dividend Income ($) | Realized Gain (loss) ($) | Change in Unrealized appreciation (depreciation) ($) | Value, end of period ($) | % ownership, end of period |
| Fidelity Cash Central Fund 5.39% | 17,016,519 | 343,029,707 | 347,229,667 | 223,703 | (182) | - | 12,816,377 | 0.0% |
| Fidelity Securities Lending Cash Central Fund 5.39% | 286,197,060 | 929,134,516 | 939,974,348 | 3,333,689 | 5,760 | (5,760) | 275,357,228 | 1.2% |
| Total | 303,213,579 | 1,272,164,223 | 1,287,204,015 | 3,557,392 | 5,578 | (5,760) | 288,173,605 | |
| Affiliate | Value, beginning of period ($) | Purchases ($) | Sales Proceeds ($) | Dividend Income ($) | Realized Gain (loss) ($) | Change in Unrealized appreciation (depreciation) ($) | Value, end of period ($) |
| ArriVent Biopharma, Inc. | 38,737,536 | - | - | - | - | 9,333,696 | 48,071,232 |
| Cartesian Therapeutics, Inc. | 8,198,668 | 4,944,511 | - | - | - | (4,034,405) | - |
| Cartesian Therapeutics, Inc. rights | 700,145 | - | - | - | - | 1,615,718 | - |
| Krystal Biotech, Inc. | 316,567,405 | - | 18,810,710 | - | 10,755,711 | 57,868,711 | 366,381,117 |
| Longboard Pharmaceuticals, Inc. | 39,446,886 | - | 2,343,042 | - | 770,085 | 23,869,379 | - |
| Regulus Therapeutics, Inc. | 4,296,222 | - | 4,022,121 | - | (744,438) | 1,548,589 | - |
| Sensorion SA | 5,544,514 | 10,014,758 | - | - | - | (316,097) | 15,243,175 |
| Taysha Gene Therapies, Inc. | 34,737,254 | 999,900 | 12,529,159 | - | 7,778,319 | (15,698,111) | - |
| Total | 448,228,630 | 15,959,169 | 37,705,032 | - | 18,559,677 | 74,187,480 | 429,695,524 |
The following is a summary of the inputs used, as of August 31, 2024, involving the Fund's assets and liabilities carried at fair value. The inputs or methodology used for valuing securities may not be an indication of the risk associated with investing in those securities. For more information on valuation inputs, and their aggregation into the levels used below, please refer to the Investment Valuation section in the accompanying Notes to Financial Statements.
| Valuation Inputs at Reporting Date: | ||||
| Description | Total ($) | Level 1 ($) | Level 2 ($) | Level 3 ($) |
Investments in Securities: | ||||
| Common Stocks | 4,946,860,133 | 4,895,512,060 | 859,540 | 50,488,533 |
| Convertible Preferred Stocks | 51,844,153 | - | - | 51,844,153 |
| Money Market Funds | 288,173,605 | 288,173,605 | - | - |
| Total Investments in Securities: | 5,286,877,891 | 5,183,685,665 | 859,540 | 102,332,686 |
| Investments in Securities: | |||
| Common Stocks | |||
| Beginning Balance | $ | 57,175,954 | |
| Net Realized Gain (Loss) on Investment Securities | 67,185 | ||
| Net Unrealized Gain (Loss) on Investment Securities | (1,725,515) | ||
| Cost of Purchases | 38,248 | ||
| Proceeds of Sales | (67,336) | ||
| Amortization/Accretion | - | ||
| Transfers into Level 3 | - | ||
| Transfers out of Level 3 | (5,000,003) | ||
| Ending Balance | $ | 50,488,533 | |
| The change in unrealized gain (loss) for the period attributable to Level 3 securities held at August 31, 2024 | $ | (1,725,515) | |
| Other Investments in Securities | |||
| Beginning Balance | $ | 47,066,704 | |
| Net Realized Gain (Loss) on Investment Securities | - | ||
| Net Unrealized Gain (Loss) on Investment Securities | (7,222,551) | ||
| Cost of Purchases | 12,000,000 | ||
| Proceeds of Sales | - | ||
| Amortization/Accretion | - | ||
| Transfers into Level 3 | - | ||
| Transfers out of Level 3 | - | ||
| Ending Balance | $ | 51,844,153 | |
| The change in unrealized gain (loss) for the period attributable to Level 3 securities held at August 31, 2024 | $ | (7,222,551) | |
| The information used in the above reconciliation represents fiscal year to date activity for any Investments in Securities identified as using Level 3 inputs at either the beginning or the end of the current fiscal period. Cost of purchases and proceeds of sales may include securities received and/or delivered through in-kind transactions, corporate actions or exchanges. Transfers into Level 3 were attributable to a lack of observable market data resulting from decreases in market activity, decreases in liquidity, security restructurings or corporate actions. Transfers out of Level 3 were attributable to observable market data becoming available for those securities. Transfers in or out of Level 3 represent the beginning value of any Security or Instrument where a change in the pricing level occurred from the beginning to the end of the period. Realized and unrealized gains (losses) disclosed in the reconciliation are included in Net Gain (Loss) on the Fund's consolidated Statement of Operations. | |||
| Consolidated Statement of Assets and Liabilities | ||||
| As of August 31, 2024 (Unaudited) | ||||
| Assets | ||||
| Investment in securities, at value (including securities loaned of $267,379,921) - See accompanying schedule: | ||||
Unaffiliated issuers (cost $2,804,844,965) | $ | 4,569,008,762 | ||
Fidelity Central Funds (cost $288,152,754) | 288,173,605 | |||
Other affiliated issuers (cost $117,741,075) | 429,695,524 | |||
| Total Investment in Securities (cost $3,210,738,794) | $ | 5,286,877,891 | ||
| Receivable for investments sold | 35,522,675 | |||
| Receivable for fund shares sold | 469,680 | |||
| Dividends receivable | 3,440,119 | |||
| Distributions receivable from Fidelity Central Funds | 574,821 | |||
| Prepaid expenses | 12,566 | |||
| Other receivables | 1,380,584 | |||
Total assets | 5,328,278,336 | |||
| Liabilities | ||||
| Payable to custodian bank | $ | 1,163,810 | ||
| Payable for investments purchased | 31,097,580 | |||
| Payable for fund shares redeemed | 1,813,921 | |||
| Accrued management fee | 2,534,478 | |||
| Deferred taxes | 6,695,874 | |||
| Other payables and accrued expenses | 1,560,288 | |||
| Collateral on securities loaned | 275,196,160 | |||
| Total liabilities | 320,062,111 | |||
| Net Assets | $ | 5,008,216,225 | ||
| Net Assets consist of: | ||||
| Paid in capital | $ | 3,271,815,543 | ||
| Total accumulated earnings (loss) | 1,736,400,682 | |||
| Net Assets | $ | 5,008,216,225 | ||
Net Asset Value, offering price and redemption price per share ($5,008,216,225 ÷ 235,117,070 shares) | $ | 21.30 | ||
| Consolidated Statement of Operations | ||||
Six months ended August 31, 2024 (Unaudited) | ||||
| Investment Income | ||||
| Dividends | $ | 19,356,245 | ||
| Income from Fidelity Central Funds (including $3,333,689 from security lending) | 3,557,392 | |||
| Total income | 22,913,637 | |||
| Expenses | ||||
| Management fee | $ | 14,775,519 | ||
| Custodian fees and expenses | 139,211 | |||
| Independent trustees' fees and expenses | 9,877 | |||
| Registration fees | 36,501 | |||
| Audit fees | 60,812 | |||
| Legal | 3,973 | |||
| Miscellaneous | 85,888 | |||
| Total expenses before reductions | 15,111,781 | |||
| Expense reductions | (100,209) | |||
| Total expenses after reductions | 15,011,572 | |||
| Net Investment income (loss) | 7,902,065 | |||
| Realized and Unrealized Gain (Loss) | ||||
| Net realized gain (loss) on: | ||||
| Investment Securities: | ||||
| Unaffiliated issuers | 100,645,783 | |||
| Fidelity Central Funds | 5,578 | |||
| Other affiliated issuers | 18,559,677 | |||
| Foreign currency transactions | (33,372) | |||
| Total net realized gain (loss) | 119,177,666 | |||
| Change in net unrealized appreciation (depreciation) on: | ||||
| Investment Securities: | ||||
| Unaffiliated issuers (net of decrease in deferred taxes of $440,333) | 223,951,417 | |||
| Fidelity Central Funds | (5,760) | |||
| Other affiliated issuers | 74,187,480 | |||
| Assets and liabilities in foreign currencies | 9,658 | |||
| Total change in net unrealized appreciation (depreciation) | 298,142,795 | |||
| Net gain (loss) | 417,320,461 | |||
| Net increase (decrease) in net assets resulting from operations | $ | 425,222,526 | ||
| Consolidated Statement of Changes in Net Assets | ||||
Six months ended August 31, 2024 (Unaudited) | Year ended February 29, 2024 | |||
| Increase (Decrease) in Net Assets | ||||
| Operations | ||||
| Net investment income (loss) | $ | 7,902,065 | $ | 7,038,061 |
| Net realized gain (loss) | 119,177,666 | 337,216,108 | ||
| Change in net unrealized appreciation (depreciation) | 298,142,795 | 586,430,769 | ||
| Net increase (decrease) in net assets resulting from operations | 425,222,526 | 930,684,938 | ||
| Distributions to shareholders | (15,560,050) | (20,921,962) | ||
| Share transactions | ||||
| Proceeds from sales of shares | 105,523,225 | 355,598,248 | ||
| Reinvestment of distributions | 14,463,937 | 19,492,812 | ||
| Cost of shares redeemed | (435,964,812) | (1,339,429,723) | ||
Net increase (decrease) in net assets resulting from share transactions | (315,977,650) | (964,338,663) | ||
| Total increase (decrease) in net assets | 93,684,826 | (54,575,687) | ||
| Net Assets | ||||
| Beginning of period | 4,914,531,399 | 4,969,107,086 | ||
| End of period | $ | 5,008,216,225 | $ | 4,914,531,399 |
| Other Information | ||||
| Shares | ||||
| Sold | 5,354,530 | 22,190,655 | ||
| Issued in reinvestment of distributions | 792,111 | 1,243,749 | ||
| Redeemed | (22,605,371) | (83,162,823) | ||
| Net increase (decrease) | (16,458,730) | (59,728,419) | ||
Biotechnology Portfolio |
Six months ended (Unaudited) August 31, 2024 | Years ended February 28, 2024 A | 2023 | 2022 | 2021 | 2020 A | |||||||
Selected Per-Share Data | ||||||||||||
| Net asset value, beginning of period | $ | 19.53 | $ | 15.96 | $ | 15.78 | $ | 25.52 | $ | 21.02 | $ | 21.14 |
| Income from Investment Operations | ||||||||||||
Net investment income (loss) B,C | .03 | .03 | (.01) | (.03) | (.01) | .05 | ||||||
| Net realized and unrealized gain (loss) | 1.80 | 3.62 | .19 | (6.91) | 9.41 | 1.79 | ||||||
| Total from investment operations | 1.83 | 3.65 | .18 | (6.94) | 9.40 | 1.84 | ||||||
| Distributions from net investment income | (.06) | (.08) | - | (.03) | (.07) | (.03) | ||||||
| Distributions from net realized gain | - | - | - | (2.77) | (4.84) | (1.93) | ||||||
| Total distributions | (.06) | (.08) | - | (2.80) | (4.90) D | (1.96) | ||||||
| Net asset value, end of period | $ | 21.30 | $ | 19.53 | $ | 15.96 | $ | 15.78 | $ | 25.52 | $ | 21.02 |
Total Return E,F | 9.44 % | 22.99% | 1.14% | (29.49)% | 47.35% | 8.57% | ||||||
Ratios to Average Net Assets C,G,H | ||||||||||||
| Expenses before reductions | .64% I | .71% | .72% | .69% | .70% | .72% | ||||||
| Expenses net of fee waivers, if any | .64 % I | .71% | .71% | .69% | .70% | .72% | ||||||
| Expenses net of all reductions | .64% I | .71% | .71% | .69% | .69% | .72% | ||||||
| Net investment income (loss) | .34% I | .15% | (.05)% | (.14)% | (.03)% | .22% | ||||||
| Supplemental Data | ||||||||||||
| Net assets, end of period (000 omitted) | $ | 5,008,216 | $ | 4,914,531 | $ | 4,969,107 | $ | 5,280,692 | $ | 8,873,624 | $ | 6,624,752 |
Portfolio turnover rate J | 31 % I | 52% K | 51% | 46% | 78% | 50% |
| Common Stocks - 98.1% | |||
| Shares | Value ($) | ||
| Biotechnology - 22.8% | |||
| Biotechnology - 22.8% | |||
| Acumen Pharmaceuticals, Inc. (a) | 1,140,000 | 3,123,600 | |
| Allogene Therapeutics, Inc. (a)(b) | 4,350,000 | 11,440,500 | |
| Alnylam Pharmaceuticals, Inc. (a) | 670,000 | 176,002,300 | |
| Apogee Therapeutics, Inc. (a) | 52,600 | 2,691,542 | |
| Arcellx, Inc. (a) | 400,000 | 27,496,000 | |
| Arcus Biosciences, Inc. (a) | 700,000 | 11,984,000 | |
| Argenx SE ADR (a) | 280,000 | 144,849,600 | |
| Ascendis Pharma A/S sponsored ADR (a) | 820,000 | 113,529,000 | |
| Avidity Biosciences, Inc. (a) | 500,000 | 22,000,000 | |
| Blueprint Medicines Corp. (a) | 650,000 | 62,101,000 | |
| Cargo Therapeutics, Inc. (b) | 995,805 | 18,780,882 | |
| Caris Life Sciences, Inc. (a)(c)(d) | 1,420,479 | 4,517,123 | |
| Cartesian Therapeutics, Inc. (c) | 368,992 | 5,151,128 | |
| Celldex Therapeutics, Inc. (a) | 550,000 | 22,731,500 | |
| Cytokinetics, Inc. (a)(b) | 1,240,000 | 70,779,200 | |
| Day One Biopharmaceuticals, Inc. (a)(b) | 370,652 | 5,129,824 | |
| Dyne Therapeutics, Inc. (a) | 241,766 | 11,142,995 | |
| Exact Sciences Corp. (a)(b) | 1,670,000 | 103,022,300 | |
| Immunocore Holdings PLC ADR (a)(b) | 411,288 | 14,757,013 | |
| Intellia Therapeutics, Inc. (a)(b) | 560,000 | 12,566,400 | |
| Janux Therapeutics, Inc. (a) | 650,000 | 30,537,000 | |
| Keros Therapeutics, Inc. (a) | 650,000 | 29,477,500 | |
| Legend Biotech Corp. ADR (a) | 2,500,000 | 143,875,000 | |
| Merus BV (a) | 1,000,000 | 50,990,000 | |
| Moonlake Immunotherapeutics Class A (a) | 500,000 | 23,395,000 | |
| Nuvalent, Inc. Class A (a) | 670,000 | 57,037,100 | |
| Oruka Therapeutics, Inc. (e) | 10,647,058 | 25,552,939 | |
| Perspective Therapeutics, Inc. (a)(b) | 434,289 | 6,861,766 | |
| Poseida Therapeutics, Inc. (a) | 2,387,521 | 6,828,310 | |
| Regeneron Pharmaceuticals, Inc. (a) | 280,000 | 331,713,200 | |
| Soleno Therapeutics, Inc. (a)(b) | 300,000 | 14,685,000 | |
| Spyre Therapeutics, Inc. (a) | 500,000 | 14,375,000 | |
| Summit Therapeutics, Inc. (a)(b) | 1,100,000 | 14,278,000 | |
| Vaxcyte, Inc. (a) | 1,400,000 | 113,064,000 | |
| Viking Therapeutics, Inc. (a) | 64,927 | 4,163,119 | |
| Viridian Therapeutics, Inc. (a) | 1,500,000 | 22,020,000 | |
| Xenon Pharmaceuticals, Inc. (a) | 1,200,000 | 48,408,000 | |
| Zealand Pharma A/S (a) | 14,600 | 1,918,007 | |
| 1,782,974,848 | |||
| Health Care Equipment & Supplies - 24.0% | |||
| Health Care Equipment - 24.0% | |||
| Boston Scientific Corp. (a) | 9,000,000 | 736,110,000 | |
| DexCom, Inc. (a) | 140,000 | 9,707,600 | |
| Glaukos Corp. (a) | 850,000 | 113,806,500 | |
| Inspire Medical Systems, Inc. (a)(b) | 445,000 | 80,019,900 | |
| Insulet Corp. (a) | 969,000 | 196,484,130 | |
| Intuitive Surgical, Inc. (a) | 215,000 | 105,915,450 | |
| Masimo Corp. (a) | 970,000 | 113,994,400 | |
| Medical Microinstruments, Inc. warrants 2/16/31 (a)(c)(d) | 15,815 | 192,152 | |
| Penumbra, Inc. (a) | 1,350,000 | 273,132,000 | |
| PROCEPT BioRobotics Corp. (a) | 600,000 | 47,400,000 | |
| Stryker Corp. | 555,000 | 200,033,100 | |
| 1,876,795,232 | |||
| Health Care Providers & Services - 22.4% | |||
| Health Care Distributors - 1.8% | |||
| McKesson Corp. | 254,000 | 142,514,320 | |
| Health Care Facilities - 1.5% | |||
| Surgery Partners, Inc. (a) | 3,600,000 | 115,020,000 | |
| Health Care Services - 6.2% | |||
| agilon health, Inc. (a)(b) | 5,000,000 | 20,400,000 | |
| BrightSpring Health Services, Inc. (b) | 2,850,000 | 35,767,500 | |
| Cigna Group | 690,000 | 249,648,900 | |
| CVS Health Corp. | 1,000,000 | 57,240,000 | |
| LifeStance Health Group, Inc. (a) | 6,700,000 | 42,277,000 | |
| Privia Health Group, Inc. (a) | 4,000,000 | 80,560,000 | |
| 485,893,400 | |||
| Managed Health Care - 12.9% | |||
| Alignment Healthcare, Inc. (a) | 5,600,000 | 50,456,000 | |
| Centene Corp. (a) | 1,000,000 | 78,830,000 | |
| Humana, Inc. | 100,000 | 35,447,000 | |
| UnitedHealth Group, Inc. | 1,420,000 | 838,084,000 | |
| 1,002,817,000 | |||
TOTAL HEALTH CARE PROVIDERS & SERVICES | 1,746,244,720 | ||
| Health Care Technology - 1.7% | |||
| Health Care Technology - 1.7% | |||
| Phreesia, Inc. (a) | 1,449,451 | 37,265,385 | |
| Veeva Systems, Inc. Class A (a) | 452,820 | 98,008,361 | |
| 135,273,746 | |||
| Life Sciences Tools & Services - 10.6% | |||
| Life Sciences Tools & Services - 10.6% | |||
| 10X Genomics, Inc.: | |||
| Class A (a) | 1,996,356 | 46,614,913 | |
| Class B (a)(f) | 500,000 | 11,675,000 | |
| Bruker Corp. | 1,180,000 | 79,284,200 | |
| Danaher Corp. | 1,700,000 | 457,827,000 | |
| IQVIA Holdings, Inc. (a) | 370,000 | 93,073,500 | |
| Thermo Fisher Scientific, Inc. | 165,000 | 101,486,550 | |
| West Pharmaceutical Services, Inc. | 108,000 | 33,872,040 | |
| 823,833,203 | |||
| Pharmaceuticals - 16.6% | |||
| Pharmaceuticals - 16.6% | |||
| AstraZeneca PLC (United Kingdom) | 690,000 | 120,933,289 | |
| Contineum Therapeutics, Inc. Class A | 200,000 | 3,898,000 | |
| Eli Lilly & Co. | 675,000 | 648,013,500 | |
| Enliven Therapeutics, Inc. (a) | 500,000 | 10,940,000 | |
| Merck & Co., Inc. | 2,500,000 | 296,125,000 | |
| Pharvaris BV (a) | 740,755 | 13,333,590 | |
| Rapport Therapeutics, Inc. (b) | 276,132 | 6,005,871 | |
| Royalty Pharma PLC Class A | 2,200,000 | 63,866,000 | |
| Structure Therapeutics, Inc. ADR (a) | 670,000 | 25,547,100 | |
| UCB SA | 590,000 | 106,762,848 | |
| 1,295,425,198 | |||
| TOTAL COMMON STOCKS (Cost $4,314,934,868) | 7,660,546,947 | ||
| Convertible Preferred Stocks - 1.5% | |||
| Shares | Value ($) | ||
| Biotechnology - 0.7% | |||
| Biotechnology - 0.7% | |||
| Asimov, Inc. Series B (a)(c)(d) | 101,438 | 4,289,813 | |
| Caris Life Sciences, Inc. Series D (a)(c)(d) | 3,206,021 | 10,195,147 | |
| Cleerly, Inc. Series C (a)(c)(d) | 1,285,367 | 13,959,086 | |
| Element Biosciences, Inc.: | |||
| Series C (a)(c)(d) | 572,265 | 6,134,681 | |
| Series D (c)(d) | 413,355 | 3,244,837 | |
| Series D1 (c)(d) | 413,355 | 3,244,837 | |
| ElevateBio LLC Series C (a)(c)(d) | 254,900 | 836,072 | |
| Endeavor BioMedicines, Inc. Series C (c)(d) | 1,366,212 | 9,809,402 | |
| Inscripta, Inc. Series E (a)(c)(d) | 1,282,228 | 3,859,506 | |
| 55,573,381 | |||
| Financial Services - 0.1% | |||
| Specialized Finance - 0.1% | |||
| Saluda Medical, Inc. Series E (a)(c)(d) | 1,155,359 | 8,122,174 | |
| Health Care Equipment & Supplies - 0.3% | |||
| Health Care Equipment - 0.3% | |||
| Insightec Ltd. Series G (c)(d) | 11,853,768 | 10,668,391 | |
| Medical Microinstruments, Inc. Series C (c)(d) | 316,310 | 10,501,492 | |
| 21,169,883 | |||
| Health Care Providers & Services - 0.1% | |||
| Health Care Services - 0.1% | |||
| dMed Biopharmaceutical Co. Ltd. Series C (a)(c)(d) | 380,451 | 1,906,060 | |
| Thriveworks TopCo LLC Series B (a)(c)(d)(g) | 473,270 | 4,249,965 | |
| 6,156,025 | |||
| Health Care Technology - 0.3% | |||
| Health Care Technology - 0.3% | |||
| Aledade, Inc.: | |||
| Series B1 (a)(c)(d) | 201,220 | 7,962,275 | |
| Series E1 (a)(c)(d) | 56,664 | 2,242,194 | |
| Candid Therapeutics Series B (c)(d) | 3,162,302 | 3,794,762 | |
| Omada Health, Inc. Series E (a)(c)(d) | 2,153,073 | 8,224,739 | |
| Wugen, Inc. Series B (a)(c)(d) | 454,342 | 1,890,063 | |
| 24,114,033 | |||
| Pharmaceuticals - 0.0% | |||
| Pharmaceuticals - 0.0% | |||
| Galvanize Therapeutics Series B (a)(c)(d) | 3,696,429 | 3,141,965 | |
| TOTAL CONVERTIBLE PREFERRED STOCKS (Cost $176,741,061) | 118,277,461 | ||
| Convertible Bonds - 0.1% | |||
Principal Amount (h) | Value ($) | ||
| Health Care Technology - 0.0% | |||
| Health Care Technology - 0.0% | |||
| Wugen, Inc. 10% 6/14/25 (c)(d) | 2,299,153 | 2,374,335 | |
| Pharmaceuticals - 0.1% | |||
| Pharmaceuticals - 0.1% | |||
| Galvanize Therapeutics 6% 2/28/27 (c)(d) | 3,306,100 | 3,494,217 | |
| TOTAL CONVERTIBLE BONDS (Cost $5,605,253) | 5,868,552 | ||
| Preferred Securities - 0.2% | |||
Principal Amount (h) | Value ($) | ||
| Health Care Equipment & Supplies - 0.2% | |||
| Health Care Supplies - 0.2% | |||
Kardium, Inc. 10% 12/31/26 (c)(d) (Cost $12,154,428) | 12,154,428 | 12,246,532 | |
| Money Market Funds - 0.8% | |||
| Shares | Value ($) | ||
| Fidelity Cash Central Fund 5.39% (i) | 9,411,029 | 9,412,911 | |
| Fidelity Securities Lending Cash Central Fund 5.39% (i)(j) | 56,968,270 | 56,973,967 | |
| TOTAL MONEY MARKET FUNDS (Cost $66,385,128) | 66,386,878 | ||
| TOTAL INVESTMENT IN SECURITIES - 100.7% (Cost $4,575,820,738) | 7,863,326,370 |
NET OTHER ASSETS (LIABILITIES) - (0.7)% | (52,507,958) |
| NET ASSETS - 100.0% | 7,810,818,412 |
| (a) | Non-income producing |
| (b) | Security or a portion of the security is on loan at period end. |
| (c) | Restricted securities (including private placements) - Investment in securities not registered under the Securities Act of 1933 (excluding 144A issues). At the end of the period, the value of restricted securities (excluding 144A issues) amounted to $146,252,948 or 1.9% of net assets. |
| (d) | Level 3 security |
| (e) | Affiliated company |
| (f) | Security exempt from registration under Rule 144A of the Securities Act of 1933. These securities may be resold in transactions exempt from registration, normally to qualified institutional buyers. At the end of the period, the value of these securities amounted to $11,675,000 or 0.1% of net assets. |
| (g) | Investment is owned by a wholly-owned subsidiary (Subsidiary) that is treated as a corporation for U.S. tax purposes. |
| (h) | Amount is stated in United States dollars unless otherwise noted. |
| (i) | Affiliated fund that is generally available only to investment companies and other accounts managed by Fidelity Investments. The rate quoted is the annualized seven-day yield of the fund at period end. A complete unaudited listing of the fund's holdings as of its most recent quarter end is available upon request. In addition, each Fidelity Central Fund's financial statements are available on the SEC's website or upon request. |
| (j) | Investment made with cash collateral received from securities on loan. |
| Additional information on each restricted holding is as follows: | ||
| Security | Acquisition Date | Acquisition Cost ($) |
| Aledade, Inc. Series B1 | 5/07/21 | 7,704,855 |
| Aledade, Inc. Series E1 | 5/20/22 | 2,822,683 |
| Asimov, Inc. Series B | 10/29/21 | 9,401,345 |
| Candid Therapeutics Series B | 8/27/24 | 3,794,762 |
| Caris Life Sciences, Inc. | 10/06/22 | 7,954,682 |
| Caris Life Sciences, Inc. Series D | 5/11/21 | 25,968,770 |
| Cartesian Therapeutics, Inc. | 7/02/24 | 7,379,840 |
| Cleerly, Inc. Series C | 7/08/22 | 15,142,394 |
| dMed Biopharmaceutical Co. Ltd. Series C | 12/01/20 | 5,403,602 |
| Element Biosciences, Inc. Series C | 6/21/21 | 11,763,880 |
| Element Biosciences, Inc. Series D | 6/28/24 | 3,242,067 |
| Element Biosciences, Inc. Series D1 | 6/28/24 | 3,242,067 |
| ElevateBio LLC Series C | 3/09/21 | 1,069,306 |
| Endeavor BioMedicines, Inc. Series C | 4/22/24 | 8,913,987 |
| Galvanize Therapeutics Series B | 3/29/22 | 6,399,572 |
| Galvanize Therapeutics 6% 2/28/27 | 2/28/24 | 3,306,100 |
| Inscripta, Inc. Series E | 3/30/21 | 11,322,073 |
| Insightec Ltd. Series G | 6/17/24 | 10,523,775 |
| Kardium, Inc. 10% 12/31/26 | 5/31/24 | 12,154,428 |
| Medical Microinstruments, Inc. warrants 2/16/31 | 2/16/24 | 0 |
| Medical Microinstruments, Inc. Series C | 2/16/24 | 10,543,783 |
| Omada Health, Inc. Series E | 12/22/21 | 12,908,103 |
| Saluda Medical, Inc. Series E | 4/06/23 | 9,328,137 |
| Thriveworks TopCo LLC Series B | 7/23/21 - 2/25/22 | 13,584,368 |
| Wugen, Inc. Series B | 7/09/21 | 3,523,377 |
| Wugen, Inc. 10% 6/14/25 | 6/14/24 | 2,299,153 |
| Affiliate | Value, beginning of period ($) | Purchases ($) | Sales Proceeds ($) | Dividend Income ($) | Realized Gain (loss) ($) | Change in Unrealized appreciation (depreciation) ($) | Value, end of period ($) | % ownership, end of period |
| Fidelity Cash Central Fund 5.39% | 3,213,126 | 374,884,977 | 368,685,864 | 206,141 | 672 | - | 9,412,911 | 0.0% |
| Fidelity Securities Lending Cash Central Fund 5.39% | 90,247,976 | 339,448,239 | 372,722,249 | 250,801 | - | 1 | 56,973,967 | 0.2% |
| Total | 93,461,102 | 714,333,216 | 741,408,113 | 456,942 | 672 | 1 | 66,386,878 | |
| Affiliate | Value, beginning of period ($) | Purchases ($) | Sales Proceeds ($) | Dividend Income ($) | Realized Gain (loss) ($) | Change in Unrealized appreciation (depreciation) ($) | Value, end of period ($) |
| Oruka Therapeutics, Inc. | - | - | - | - | - | 16,933,153 | 25,552,939 |
| Total | - | - | - | - | - | 16,933,153 | 25,552,939 |
The following is a summary of the inputs used, as of August 31, 2024, involving the Fund's assets and liabilities carried at fair value. The inputs or methodology used for valuing securities may not be an indication of the risk associated with investing in those securities. For more information on valuation inputs, and their aggregation into the levels used below, please refer to the Investment Valuation section in the accompanying Notes to Financial Statements.
| Valuation Inputs at Reporting Date: | ||||
| Description | Total ($) | Level 1 ($) | Level 2 ($) | Level 3 ($) |
Investments in Securities: | ||||
| Common Stocks | 7,660,546,947 | 7,534,904,383 | 120,933,289 | 4,709,275 |
| Convertible Preferred Stocks | 118,277,461 | - | - | 118,277,461 |
| Convertible Bonds | 5,868,552 | - | - | 5,868,552 |
| Preferred Securities | 12,246,532 | - | - | 12,246,532 |
| Money Market Funds | 66,386,878 | 66,386,878 | - | - |
| Total Investments in Securities: | 7,863,326,370 | 7,601,291,261 | 120,933,289 | 141,101,820 |
| Investments in Securities: | |||
| Convetible Preferred Stocks | |||
| Beginning Balance | $ | 94,829,920 | |
| Net Realized Gain (Loss) on Investment Securities | - | ||
| Net Unrealized Gain (Loss) on Investment Securities | (6,356,866) | ||
| Cost of Purchases | 29,804,407 | ||
| Proceeds of Sales | - | ||
| Amortization/Accretion | - | ||
| Transfers into Level 3 | - | ||
| Transfers out of Level 3 | - | ||
| Ending Balance | $ | 118,277,461 | |
| The change in unrealized gain (loss) for the period attributable to Level 3 securities held at August 31, 2024 | $ | (6,356,866) | |
| Other Investments in Securities | |||
| Beginning Balance | $ | 7,270,228 | |
| Net Realized Gain (Loss) on Investment Securities | - | ||
| Net Unrealized Gain (Loss) on Investment Securities | 1,100,550 | ||
| Cost of Purchases | 14,453,581 | ||
| Proceeds of Sales | - | ||
| Amortization/Accretion | - | ||
| Transfers into Level 3 | - | ||
| Transfers out of Level 3 | - | ||
| Ending Balance | $ | 22,824,359 | |
| The change in unrealized gain (loss) for the period attributable to Level 3 securities held at August 31, 2024 | $ | 1,100,550 | |
| The information used in the above reconciliation represents fiscal year to date activity for any Investments in Securities identified as using Level 3 inputs at either the beginning or the end of the current fiscal period. Cost of purchases and proceeds of sales may include securities received and/or delivered through in-kind transactions, corporate actions or exchanges. Transfers into Level 3 were attributable to a lack of observable market data resulting from decreases in market activity, decreases in liquidity, security restructurings or corporate actions. Transfers out of Level 3 were attributable to observable market data becoming available for those securities. Transfers in or out of Level 3 represent the beginning value of any Security or Instrument where a change in the pricing level occurred from the beginning to the end of the period. Realized and unrealized gains (losses) disclosed in the reconciliation are included in Net Gain (Loss) on the Fund's consolidated Statement of Operations. | |||
| Consolidated Statement of Assets and Liabilities | ||||
| As of August 31, 2024 (Unaudited) | ||||
| Assets | ||||
| Investment in securities, at value (including securities loaned of $56,106,301) - See accompanying schedule: | ||||
Unaffiliated issuers (cost $4,500,815,823) | $ | 7,771,386,553 | ||
Fidelity Central Funds (cost $66,385,128) | 66,386,878 | |||
Other affiliated issuers (cost $8,619,787) | 25,552,939 | |||
| Total Investment in Securities (cost $4,575,820,738) | $ | 7,863,326,370 | ||
| Receivable for investments sold | 9,601,889 | |||
| Receivable for fund shares sold | 1,362,035 | |||
| Dividends receivable | 5,715,545 | |||
| Interest receivable | 453,579 | |||
| Distributions receivable from Fidelity Central Funds | 71,972 | |||
| Prepaid expenses | 15,317 | |||
| Other receivables | 904,543 | |||
Total assets | 7,881,451,250 | |||
| Liabilities | ||||
| Payable for investments purchased | $ | 4,776,563 | ||
| Payable for fund shares redeemed | 3,921,072 | |||
| Accrued management fee | 3,892,747 | |||
| Other payables and accrued expenses | 1,090,314 | |||
| Collateral on securities loaned | 56,952,142 | |||
| Total liabilities | 70,632,838 | |||
| Net Assets | $ | 7,810,818,412 | ||
| Net Assets consist of: | ||||
| Paid in capital | $ | 4,247,616,085 | ||
| Total accumulated earnings (loss) | 3,563,202,327 | |||
| Net Assets | $ | 7,810,818,412 | ||
Net Asset Value, offering price and redemption price per share ($7,810,818,412 ÷ 246,843,391 shares) | $ | 31.64 | ||
| Consolidated Statement of Operations | ||||
Six months ended August 31, 2024 (Unaudited) | ||||
| Investment Income | ||||
| Dividends | $ | 21,208,217 | ||
| Interest | 149,565 | |||
| Income from Fidelity Central Funds (including $250,801 from security lending) | 456,942 | |||
| Total income | 21,814,724 | |||
| Expenses | ||||
| Management fee | $ | 23,517,028 | ||
| Custodian fees and expenses | 93,479 | |||
| Independent trustees' fees and expenses | 16,100 | |||
| Registration fees | 34,862 | |||
| Audit fees | 35,225 | |||
| Legal | 4,728 | |||
| Interest | 29,891 | |||
| Miscellaneous | 112,334 | |||
| Total expenses before reductions | 23,843,647 | |||
| Expense reductions | (162,450) | |||
| Total expenses after reductions | 23,681,197 | |||
| Net Investment income (loss) | (1,866,473) | |||
| Realized and Unrealized Gain (Loss) | ||||
| Net realized gain (loss) on: | ||||
| Investment Securities: | ||||
| Unaffiliated issuers | 306,802,750 | |||
| Fidelity Central Funds | 672 | |||
| Foreign currency transactions | 18,071 | |||
| Total net realized gain (loss) | 306,821,493 | |||
| Change in net unrealized appreciation (depreciation) on: | ||||
| Investment Securities: | ||||
| Unaffiliated issuers | 231,499,828 | |||
| Fidelity Central Funds | 1 | |||
| Other affiliated issuers | 16,933,152 | |||
| Assets and liabilities in foreign currencies | 125,110 | |||
| Total change in net unrealized appreciation (depreciation) | 248,558,091 | |||
| Net gain (loss) | 555,379,584 | |||
| Net increase (decrease) in net assets resulting from operations | $ | 553,513,111 | ||
| Consolidated Statement of Changes in Net Assets | ||||
Six months ended August 31, 2024 (Unaudited) | Year ended February 29, 2024 | |||
| Increase (Decrease) in Net Assets | ||||
| Operations | ||||
| Net investment income (loss) | $ | (1,866,473) | $ | (4,761,758) |
| Net realized gain (loss) | 306,821,493 | 321,000,314 | ||
| Change in net unrealized appreciation (depreciation) | 248,558,091 | 530,618,894 | ||
| Net increase (decrease) in net assets resulting from operations | 553,513,111 | 846,857,450 | ||
| Distributions to shareholders | (238,172,866) | - | ||
| Share transactions | ||||
| Proceeds from sales of shares | 117,931,118 | 489,323,946 | ||
| Reinvestment of distributions | 216,875,836 | - | ||
| Cost of shares redeemed | (752,271,119) | (1,576,703,467) | ||
Net increase (decrease) in net assets resulting from share transactions | (417,464,165) | (1,087,379,521) | ||
| Total increase (decrease) in net assets | (102,123,920) | (240,522,071) | ||
| Net Assets | ||||
| Beginning of period | 7,912,942,332 | 8,153,464,403 | ||
| End of period | $ | 7,810,818,412 | $ | 7,912,942,332 |
| Other Information | ||||
| Shares | ||||
| Sold | 4,001,410 | 17,502,505 | ||
| Issued in reinvestment of distributions | 7,660,750 | - | ||
| Redeemed | (25,620,006) | (56,642,005) | ||
| Net increase (decrease) | (13,957,846) | (39,139,500) | ||
Health Care Portfolio |
Six months ended (Unaudited) August 31, 2024 | Years ended February 28, 2024 A | 2023 | 2022 | 2021 | 2020 A | |||||||
Selected Per-Share Data | ||||||||||||
| Net asset value, beginning of period | $ | 30.34 | $ | 27.18 | $ | 28.30 | $ | 32.18 | $ | 26.53 | $ | 24.48 |
| Income from Investment Operations | ||||||||||||
Net investment income (loss) B,C | (.01) | (.02) | (.03) | (.03) | - D | .04 | ||||||
| Net realized and unrealized gain (loss) | 2.24 | 3.18 | (.50) | (.92) | 9.23 | 2.40 | ||||||
| Total from investment operations | 2.23 | 3.16 | (.53) | (.95) | 9.23 | 2.44 | ||||||
| Distributions from net investment income | - | - | - | (.04) E | (.18) | (.03) | ||||||
| Distributions from net realized gain | (.93) | - | (.59) | (2.89) E | (3.40) | (.36) | ||||||
| Total distributions | (.93) | - | (.59) | (2.93) | (3.58) | (.39) | ||||||
| Net asset value, end of period | $ | 31.64 | $ | 30.34 | $ | 27.18 | $ | 28.30 | $ | 32.18 | $ | 26.53 |
Total Return F,G | 7.71 % | 11.63% | (2.05)% | (3.67)% | 36.00% | 9.84% | ||||||
Ratios to Average Net Assets C,H,I | ||||||||||||
| Expenses before reductions | .63% J | .69% | .69% | .68% | .69% | .70% | ||||||
| Expenses net of fee waivers, if any | .63 % J | .68% | .68% | .67% | .69% | .70% | ||||||
| Expenses net of all reductions | .63% J | .68% | .68% | .67% | .69% | .70% | ||||||
| Net investment income (loss) | (.05)% J | (.06)% | (.10)% | (.10)% | (.01)% | .16% | ||||||
| Supplemental Data | ||||||||||||
| Net assets, end of period (000 omitted) | $ | 7,810,818 | $ | 7,912,942 | $ | 8,153,464 | $ | 8,999,209 | $ | 10,353,077 | $ | 7,220,187 |
Portfolio turnover rate K | 35 % J | 46% | 40% | 31% | 52% | 36% L |
| Common Stocks - 99.5% | |||
| Shares | Value ($) | ||
| Health Care Providers & Services - 99.5% | |||
| Health Care Distributors - 9.8% | |||
| Cencora, Inc. | 255,600 | 61,234,092 | |
| McKesson Corp. | 133,800 | 75,072,504 | |
| 136,306,596 | |||
| Health Care Facilities - 18.8% | |||
| Acadia Healthcare Co., Inc. (a) | 560,700 | 45,938,151 | |
| Encompass Health Corp. | 450,600 | 41,928,330 | |
| HCA Holdings, Inc. | 118,000 | 46,679,620 | |
| Surgery Partners, Inc. (a)(b) | 944,236 | 30,168,340 | |
| Tenet Healthcare Corp. (a) | 257,400 | 42,687,216 | |
| U.S. Physical Therapy, Inc. (b) | 163,300 | 13,978,480 | |
| Universal Health Services, Inc. Class B | 173,300 | 41,240,201 | |
| 262,620,338 | |||
| Health Care Services - 29.5% | |||
| agilon health, Inc. (a)(b) | 3,926,860 | 16,021,589 | |
| Astrana Health, Inc. (a) | 153,738 | 7,347,139 | |
| BrightSpring Health Services, Inc. (b) | 1,414,900 | 17,756,995 | |
| Chemed Corp. | 72,300 | 42,380,091 | |
| Cigna Group | 360,672 | 130,494,736 | |
| CVS Health Corp. | 2,025,870 | 115,960,799 | |
| LifeStance Health Group, Inc. (a)(b) | 4,179,459 | 26,372,386 | |
| Option Care Health, Inc. (a) | 770,400 | 24,668,208 | |
| Privia Health Group, Inc. (a)(b) | 1,502,363 | 30,257,591 | |
| 411,259,534 | |||
| Managed Health Care - 41.4% | |||
| Alignment Healthcare, Inc. (a) | 1,141,222 | 10,282,410 | |
| Centene Corp. (a) | 611,684 | 48,219,050 | |
| Elevance Health, Inc. | 110,302 | 61,426,081 | |
| Humana, Inc. | 175,000 | 62,032,250 | |
| Molina Healthcare, Inc. (a) | 149,500 | 52,293,605 | |
| UnitedHealth Group, Inc. | 582,650 | 343,880,030 | |
| 578,133,426 | |||
| TOTAL COMMON STOCKS (Cost $830,892,491) | 1,388,319,894 | ||
| Convertible Preferred Stocks - 0.5% | |||
| Shares | Value ($) | ||
| Health Care Providers & Services - 0.1% | |||
| Health Care Services - 0.1% | |||
| Thriveworks TopCo LLC Series B (a)(c)(d)(e) | 69,639 | 625,358 | |
| Health Care Technology - 0.4% | |||
| Health Care Technology - 0.4% | |||
| Aledade, Inc.: | |||
| Series B1 (a)(d)(e) | 52,232 | 2,066,820 | |
| Series E1 (a)(d)(e) | 40,149 | 1,588,696 | |
| Series F (a)(d)(e) | 59,859 | 2,368,621 | |
| 6,024,137 | |||
| TOTAL CONVERTIBLE PREFERRED STOCKS (Cost $9,136,999) | 6,649,495 | ||
| Money Market Funds - 4.6% | |||
| Shares | Value ($) | ||
| Fidelity Cash Central Fund 5.39% (f) | 3,985,426 | 3,986,223 | |
| Fidelity Securities Lending Cash Central Fund 5.39% (f)(g) | 60,510,501 | 60,516,552 | |
| TOTAL MONEY MARKET FUNDS (Cost $64,502,775) | 64,502,775 | ||
| TOTAL INVESTMENT IN SECURITIES - 104.6% (Cost $904,532,265) | 1,459,472,164 |
NET OTHER ASSETS (LIABILITIES) - (4.6)% | (63,787,667) |
| NET ASSETS - 100.0% | 1,395,684,497 |
| (a) | Non-income producing |
| (b) | Security or a portion of the security is on loan at period end. |
| (c) | Investment is owned by a wholly-owned subsidiary (Subsidiary) that is treated as a corporation for U.S. tax purposes. |
| (d) | Restricted securities (including private placements) - Investment in securities not registered under the Securities Act of 1933 (excluding 144A issues). At the end of the period, the value of restricted securities (excluding 144A issues) amounted to $6,649,495 or 0.5% of net assets. |
| (e) | Level 3 security |
| (f) | Affiliated fund that is generally available only to investment companies and other accounts managed by Fidelity Investments. The rate quoted is the annualized seven-day yield of the fund at period end. A complete unaudited listing of the fund's holdings as of its most recent quarter end is available upon request. In addition, each Fidelity Central Fund's financial statements are available on the SEC's website or upon request. |
| (g) | Investment made with cash collateral received from securities on loan. |
| Additional information on each restricted holding is as follows: | ||
| Security | Acquisition Date | Acquisition Cost ($) |
| Aledade, Inc. Series B1 | 5/07/21 | 2,000,000 |
| Aledade, Inc. Series E1 | 5/20/22 | 1,999,998 |
| Aledade, Inc. Series F | 6/07/23 | 2,999,983 |
| Thriveworks TopCo LLC Series B | 7/23/21 - 2/25/22 | 1,998,863 |
| Affiliate | Value, beginning of period ($) | Purchases ($) | Sales Proceeds ($) | Dividend Income ($) | Realized Gain (loss) ($) | Change in Unrealized appreciation (depreciation) ($) | Value, end of period ($) | % ownership, end of period |
| Fidelity Cash Central Fund 5.39% | 8,504,694 | 175,773,043 | 180,292,068 | 189,920 | 554 | - | 3,986,223 | 0.0% |
| Fidelity Securities Lending Cash Central Fund 5.39% | 87,877,224 | 402,904,470 | 430,265,142 | 75,348 | - | - | 60,516,552 | 0.3% |
| Total | 96,381,918 | 578,677,513 | 610,557,210 | 265,268 | 554 | - | 64,502,775 | |
The following is a summary of the inputs used, as of August 31, 2024, involving the Fund's assets and liabilities carried at fair value. The inputs or methodology used for valuing securities may not be an indication of the risk associated with investing in those securities. For more information on valuation inputs, and their aggregation into the levels used below, please refer to the Investment Valuation section in the accompanying Notes to Financial Statements.
| Valuation Inputs at Reporting Date: | ||||
| Description | Total ($) | Level 1 ($) | Level 2 ($) | Level 3 ($) |
Investments in Securities: | ||||
| Common Stocks | 1,388,319,894 | 1,388,319,894 | - | - |
| Convertible Preferred Stocks | 6,649,495 | - | - | 6,649,495 |
| Money Market Funds | 64,502,775 | 64,502,775 | - | - |
| Total Investments in Securities: | 1,459,472,164 | 1,452,822,669 | - | 6,649,495 |
| Consolidated Statement of Assets and Liabilities | ||||
| As of August 31, 2024 (Unaudited) | ||||
| Assets | ||||
| Investment in securities, at value (including securities loaned of $58,428,270) - See accompanying schedule: | ||||
Unaffiliated issuers (cost $840,029,490) | $ | 1,394,969,389 | ||
Fidelity Central Funds (cost $64,502,775) | 64,502,775 | |||
| Total Investment in Securities (cost $904,532,265) | $ | 1,459,472,164 | ||
| Receivable for investments sold | 6,938,913 | |||
| Receivable for fund shares sold | 184,478 | |||
| Dividends receivable | 167,020 | |||
| Distributions receivable from Fidelity Central Funds | 17,990 | |||
| Prepaid expenses | 2,510 | |||
| Other receivables | 104,307 | |||
Total assets | 1,466,887,382 | |||
| Liabilities | ||||
| Payable for investments purchased | $ | 8,793,500 | ||
| Payable for fund shares redeemed | 990,731 | |||
| Accrued management fee | 749,520 | |||
| Other payables and accrued expenses | 156,010 | |||
| Collateral on securities loaned | 60,513,124 | |||
| Total liabilities | 71,202,885 | |||
| Net Assets | $ | 1,395,684,497 | ||
| Net Assets consist of: | ||||
| Paid in capital | $ | 737,115,689 | ||
| Total accumulated earnings (loss) | 658,568,808 | |||
| Net Assets | $ | 1,395,684,497 | ||
Net Asset Value, offering price and redemption price per share ($1,395,684,497 ÷ 10,400,387 shares) | $ | 134.20 | ||
| Consolidated Statement of Operations | ||||
Six months ended August 31, 2024 (Unaudited) | ||||
| Investment Income | ||||
| Dividends | $ | 7,994,017 | ||
| Income from Fidelity Central Funds (including $75,348 from security lending) | 265,268 | |||
| Total income | 8,259,285 | |||
| Expenses | ||||
| Management fee | $ | 4,613,545 | ||
| Custodian fees and expenses | 5,726 | |||
| Independent trustees' fees and expenses | 3,083 | |||
| Registration fees | 29,120 | |||
| Audit fees | 20,004 | |||
| Legal | 1,423 | |||
| Miscellaneous | 32,405 | |||
| Total expenses before reductions | 4,705,306 | |||
| Expense reductions | (32,388) | |||
| Total expenses after reductions | 4,672,918 | |||
| Net Investment income (loss) | 3,586,367 | |||
| Realized and Unrealized Gain (Loss) | ||||
| Net realized gain (loss) on: | ||||
| Investment Securities: | ||||
| Unaffiliated issuers | 114,165,698 | |||
| Fidelity Central Funds | 554 | |||
| Foreign currency transactions | (51,562) | |||
| Total net realized gain (loss) | 114,114,690 | |||
| Change in net unrealized appreciation (depreciation) on: | ||||
| Investment Securities: | ||||
| Unaffiliated issuers | (75,672,206) | |||
| Assets and liabilities in foreign currencies | (25) | |||
| Total change in net unrealized appreciation (depreciation) | (75,672,231) | |||
| Net gain (loss) | 38,442,459 | |||
| Net increase (decrease) in net assets resulting from operations | $ | 42,028,826 | ||
| Consolidated Statement of Changes in Net Assets | ||||
Six months ended August 31, 2024 (Unaudited) | Year ended February 29, 2024 | |||
| Increase (Decrease) in Net Assets | ||||
| Operations | ||||
| Net investment income (loss) | $ | 3,586,367 | $ | 6,477,255 |
| Net realized gain (loss) | 114,114,690 | 81,216,159 | ||
| Change in net unrealized appreciation (depreciation) | (75,672,231) | 37,012,719 | ||
| Net increase (decrease) in net assets resulting from operations | 42,028,826 | 124,706,133 | ||
| Distributions to shareholders | (50,457,716) | (9,047,588) | ||
| Share transactions | ||||
| Proceeds from sales of shares | 62,871,888 | 267,755,314 | ||
| Reinvestment of distributions | 44,946,671 | 8,038,404 | ||
| Cost of shares redeemed | (248,721,904) | (555,137,698) | ||
Net increase (decrease) in net assets resulting from share transactions | (140,903,345) | (279,343,980) | ||
| Total increase (decrease) in net assets | (149,332,235) | (163,685,435) | ||
| Net Assets | ||||
| Beginning of period | 1,545,016,732 | 1,708,702,167 | ||
| End of period | $ | 1,395,684,497 | $ | 1,545,016,732 |
| Other Information | ||||
| Shares | ||||
| Sold | 494,624 | 2,082,554 | ||
| Issued in reinvestment of distributions | 367,662 | 60,870 | ||
| Redeemed | (1,959,814) | (4,340,224) | ||
| Net increase (decrease) | (1,097,528) | (2,196,800) | ||
Health Care Services Portfolio |
Six months ended (Unaudited) August 31, 2024 | Years ended February 28, 2024 A | 2023 | 2022 | 2021 | 2020 A | |||||||
Selected Per-Share Data | ||||||||||||
| Net asset value, beginning of period | $ | 134.37 | $ | 124.77 | $ | 131.98 | $ | 121.44 | $ | 94.72 | $ | 89.28 |
| Income from Investment Operations | ||||||||||||
Net investment income (loss) B,C | .33 | .52 | .28 | .29 | .06 | .23 | ||||||
| Net realized and unrealized gain (loss) | 4.05 | 9.84 | (.47) | 20.01 | 27.59 | 5.50 | ||||||
| Total from investment operations | 4.38 | 10.36 | (.19) | 20.30 | 27.65 | 5.73 | ||||||
| Distributions from net investment income | (.01) | (.46) | (.31) | (.22) D | (.93) | (.29) | ||||||
| Distributions from net realized gain | (4.54) | (.30) | (6.71) | (9.55) D | - | - | ||||||
| Total distributions | (4.55) | (.76) | (7.02) | (9.76) E | (.93) | (.29) | ||||||
| Net asset value, end of period | $ | 134.20 | $ | 134.37 | $ | 124.77 | $ | 131.98 | $ | 121.44 | $ | 94.72 |
Total Return F,G | 3.59 % | 8.32% | (.64)% | 16.85% | 29.43% | 6.39% | ||||||
Ratios to Average Net Assets C,H,I | ||||||||||||
| Expenses before reductions | .67% J | .73% | .73% | .71% | .73% | .75% | ||||||
| Expenses net of fee waivers, if any | .67 % J | .73% | .73% | .71% | .73% | .75% | ||||||
| Expenses net of all reductions | .67% J | .73% | .73% | .71% | .73% | .75% | ||||||
| Net investment income (loss) | .51% J | .41% | .21% | .22% | .05% | .25% | ||||||
| Supplemental Data | ||||||||||||
| Net assets, end of period (000 omitted) | $ | 1,395,684 | $ | 1,545,017 | $ | 1,708,702 | $ | 1,214,032 | $ | 1,100,913 | $ | 1,003,206 |
Portfolio turnover rate K | 66 % J | 32% | 30% | 35% | 34% | 37% |
| Common Stocks - 96.5% | |||
| Shares | Value ($) | ||
| Biotechnology - 3.2% | |||
| Biotechnology - 3.2% | |||
| Exact Sciences Corp. (a) | 1,400,000 | 86,366,000 | |
| Natera, Inc. (a) | 350,000 | 41,391,000 | |
| Repligen Corp. (a) | 180,000 | 27,167,400 | |
| Vericel Corp. (a) | 307,635 | 15,889,348 | |
| 170,813,748 | |||
| Financial Services - 0.0% | |||
| Specialized Finance - 0.0% | |||
| Saluda Medical, Inc. warrants 1/20/27 (a)(b)(c) | 235,185 | 376,296 | |
| Health Care Equipment & Supplies - 54.8% | |||
| Health Care Equipment - 52.2% | |||
| Abbott Laboratories | 2,280,000 | 258,255,600 | |
| Boston Scientific Corp. (a) | 8,500,000 | 695,215,001 | |
| DexCom, Inc. (a) | 1,120,000 | 77,660,800 | |
| Edwards Lifesciences Corp. (a) | 1,160,000 | 81,153,600 | |
| Glaukos Corp. (a) | 860,000 | 115,145,400 | |
| Inspire Medical Systems, Inc. (a) | 460,000 | 82,717,200 | |
| Insulet Corp. (a) | 1,120,000 | 227,102,400 | |
| Intuitive Surgical, Inc. (a) | 900,000 | 443,367,000 | |
| Masimo Corp. (a) | 1,150,000 | 135,148,000 | |
| Outset Medical, Inc. (a)(d)(e) | 3,300,000 | 1,749,000 | |
| Penumbra, Inc. (a) | 1,210,000 | 244,807,200 | |
| PROCEPT BioRobotics Corp. (a)(d) | 900,000 | 71,100,000 | |
| Stryker Corp. | 1,000,000 | 360,420,000 | |
| 2,793,841,201 | |||
| Health Care Supplies - 2.6% | |||
| Alcon, Inc. | 900,000 | 87,912,000 | |
| Align Technology, Inc. (a) | 75,000 | 17,791,500 | |
| ASAHI INTECC Co. Ltd. | 1,000,000 | 18,267,323 | |
| ICU Medical, Inc. (a) | 90,000 | 14,879,700 | |
| 138,850,523 | |||
TOTAL HEALTH CARE EQUIPMENT & SUPPLIES | 2,932,691,724 | ||
| Health Care Providers & Services - 1.6% | |||
| Health Care Services - 1.6% | |||
| agilon health, Inc. (a) | 2,000,000 | 8,160,000 | |
| LifeStance Health Group, Inc. (a)(d) | 6,000,000 | 37,860,000 | |
| Privia Health Group, Inc. (a) | 2,000,000 | 40,280,000 | |
| 86,300,000 | |||
| Health Care Technology - 4.9% | |||
| Health Care Technology - 4.9% | |||
| DNA Script (a)(b)(c) | 1,220 | 94,064 | |
| DNA Script (a)(b)(c) | 4,668 | 360,272 | |
| Doximity, Inc. Class A (a)(d) | 1,120,000 | 41,193,600 | |
| Phreesia, Inc. (a) | 2,269,933 | 58,359,977 | |
| PrognomiQ, Inc. (a)(c) | 445,258 | 111,315 | |
| Veeva Systems, Inc. Class A (a) | 762,343 | 165,001,519 | |
| 265,120,747 | |||
| Life Sciences Tools & Services - 32.0% | |||
| Life Sciences Tools & Services - 32.0% | |||
| 10X Genomics, Inc.: | |||
| Class A (a) | 2,001,065 | 46,724,868 | |
| Class B (a)(f) | 392,772 | 9,171,226 | |
| Agilent Technologies, Inc. | 280,000 | 40,017,600 | |
| Bio-Techne Corp. | 280,000 | 20,717,200 | |
| Bruker Corp. | 1,600,000 | 107,504,000 | |
| Danaher Corp. | 2,500,000 | 673,275,000 | |
| IQVIA Holdings, Inc. (a) | 650,000 | 163,507,500 | |
| QIAGEN NV (Germany) | 650,000 | 29,796,610 | |
| Sartorius Stedim Biotech | 144,000 | 29,288,678 | |
| Thermo Fisher Scientific, Inc. | 820,000 | 504,357,400 | |
| West Pharmaceutical Services, Inc. | 280,000 | 87,816,400 | |
| 1,712,176,482 | |||
| TOTAL COMMON STOCKS (Cost $2,715,321,727) | 5,167,478,997 | ||
| Convertible Preferred Stocks - 2.4% | |||
| Shares | Value ($) | ||
| Biotechnology - 0.8% | |||
| Biotechnology - 0.8% | |||
| Asimov, Inc. Series B (a)(b)(c) | 97,985 | 4,143,786 | |
| Caris Life Sciences, Inc. Series D (a)(b)(c) | 2,803,935 | 8,916,513 | |
| Element Biosciences, Inc. Series B (a)(b)(c) | 2,385,223 | 18,270,808 | |
| ElevateBio LLC Series C (a)(b)(c) | 214,700 | 704,216 | |
| Inscripta, Inc. Series D (a)(b)(c) | 3,938,731 | 9,374,180 | |
| 41,409,503 | |||
| Financial Services - 0.3% | |||
| Specialized Finance - 0.3% | |||
| Saluda Medical, Inc. Series D (a)(b)(c) | 1,567,904 | 14,126,815 | |
| Health Care Equipment & Supplies - 0.2% | |||
| Health Care Supplies - 0.2% | |||
| Kardium, Inc. Series D6 (a)(b)(c) | 13,783,189 | 9,786,064 | |
| Health Care Providers & Services - 0.2% | |||
| Health Care Services - 0.2% | |||
| Conformal Medical, Inc.: | |||
| Series C (a)(b)(c) | 2,605,625 | 9,901,375 | |
| Series D (a)(b)(c) | 525,299 | 2,348,087 | |
| dMed Biopharmaceutical Co. Ltd. Series C (a)(b)(c) | 309,255 | 1,549,368 | |
| 13,798,830 | |||
| Health Care Technology - 0.5% | |||
| Health Care Technology - 0.5% | |||
| Aledade, Inc.: | |||
| Series B1 (a)(b)(c) | 175,232 | 6,933,930 | |
| Series E1 (a)(b)(c) | 58,567 | 2,317,496 | |
| DNA Script: | |||
| Series B (a)(b)(c) | 59 | 5,134 | |
| Series C (a)(b)(c) | 28,249 | 9,176,515 | |
| Omada Health, Inc. Series E (a)(b)(c) | 2,182,939 | 8,338,827 | |
| 26,771,902 | |||
| Pharmaceuticals - 0.0% | |||
| Pharmaceuticals - 0.0% | |||
| Galvanize Therapeutics Series B (a)(b)(c) | 3,641,139 | 3,094,968 | |
| Textiles, Apparel & Luxury Goods - 0.4% | |||
| Textiles - 0.4% | |||
| Freenome, Inc.: | |||
| Series C (a)(b)(c) | 2,268,156 | 13,223,349 | |
| Series D (a)(b)(c) | 1,325,855 | 8,246,818 | |
| 21,470,167 | |||
| TOTAL CONVERTIBLE PREFERRED STOCKS (Cost $192,448,987) | 130,458,249 | ||
| Convertible Bonds - 0.1% | |||
Principal Amount (g) | Value ($) | ||
| Pharmaceuticals - 0.1% | |||
| Pharmaceuticals - 0.1% | |||
Galvanize Therapeutics 6% 2/28/27 (b)(c) (Cost $2,433,800) | 2,433,800 | 2,572,283 | |
| Preferred Securities - 0.3% | |||
Principal Amount (g) | Value ($) | ||
| Health Care Equipment & Supplies - 0.3% | |||
| Health Care Supplies - 0.3% | |||
Kardium, Inc. 0% (b)(c)(h) (Cost $19,551,861) | 19,551,861 | 13,666,751 | |
| Money Market Funds - 1.1% | |||
| Shares | Value ($) | ||
| Fidelity Cash Central Fund 5.39% (i) | 29,975,631 | 29,981,626 | |
| Fidelity Securities Lending Cash Central Fund 5.39% (i)(j) | 29,679,370 | 29,682,338 | |
| TOTAL MONEY MARKET FUNDS (Cost $59,663,964) | 59,663,964 | ||
| TOTAL INVESTMENT IN SECURITIES - 100.4% (Cost $2,989,420,339) | 5,373,840,244 |
NET OTHER ASSETS (LIABILITIES) - (0.4)% | (20,894,690) |
| NET ASSETS - 100.0% | 5,352,945,554 |
| (a) | Non-income producing |
| (b) | Restricted securities (including private placements) - Investment in securities not registered under the Securities Act of 1933 (excluding 144A issues). At the end of the period, the value of restricted securities (excluding 144A issues) amounted to $147,527,915 or 2.8% of net assets. |
| (c) | Level 3 security |
| (d) | Security or a portion of the security is on loan at period end. |
| (e) | Affiliated company |
| (f) | Security exempt from registration under Rule 144A of the Securities Act of 1933. These securities may be resold in transactions exempt from registration, normally to qualified institutional buyers. At the end of the period, the value of these securities amounted to $9,171,226 or 0.2% of net assets. |
| (g) | Amount is stated in United States dollars unless otherwise noted. |
| (h) | Security is perpetual in nature with no stated maturity date. |
| (i) | Affiliated fund that is generally available only to investment companies and other accounts managed by Fidelity Investments. The rate quoted is the annualized seven-day yield of the fund at period end. A complete unaudited listing of the fund's holdings as of its most recent quarter end is available upon request. In addition, each Fidelity Central Fund's financial statements are available on the SEC's website or upon request. |
| (j) | Investment made with cash collateral received from securities on loan. |
| Additional information on each restricted holding is as follows: | ||
| Security | Acquisition Date | Acquisition Cost ($) |
| Aledade, Inc. Series B1 | 5/07/21 | 6,709,756 |
| Aledade, Inc. Series E1 | 5/20/22 | 2,917,480 |
| Asimov, Inc. Series B | 10/29/21 | 9,081,318 |
| Caris Life Sciences, Inc. Series D | 5/11/21 | 22,711,874 |
| Conformal Medical, Inc. Series C | 7/24/20 | 9,554,996 |
| Conformal Medical, Inc. Series D | 5/26/23 | 2,668,340 |
| dMed Biopharmaceutical Co. Ltd. Series C | 12/01/20 | 4,392,395 |
| DNA Script | 12/17/21 | 4,714,776 |
| DNA Script Series B | 12/17/21 | 47,244 |
| DNA Script Series C | 10/01/21 | 24,572,393 |
| Element Biosciences, Inc. Series B | 12/13/19 | 12,500,000 |
| ElevateBio LLC Series C | 3/09/21 | 900,667 |
| Freenome, Inc. Series C | 8/14/20 | 14,999,996 |
| Freenome, Inc. Series D | 11/22/21 | 9,999,996 |
| Galvanize Therapeutics Series B | 3/29/22 | 6,303,849 |
| Galvanize Therapeutics 6% 2/28/27 | 2/28/24 | 2,433,800 |
| Inscripta, Inc. Series D | 11/13/20 | 18,000,001 |
| Kardium, Inc. Series D6 | 12/30/20 | 14,001,515 |
| Kardium, Inc. 0% | 12/30/20 | 19,551,861 |
| Omada Health, Inc. Series E | 12/22/21 | 13,087,156 |
| Saluda Medical, Inc. warrants 1/20/27 | 1/20/22 | 0 |
| Saluda Medical, Inc. Series D | 1/20/22 | 20,000,011 |
| Affiliate | Value, beginning of period ($) | Purchases ($) | Sales Proceeds ($) | Dividend Income ($) | Realized Gain (loss) ($) | Change in Unrealized appreciation (depreciation) ($) | Value, end of period ($) | % ownership, end of period |
| Fidelity Cash Central Fund 5.39% | 18,516,986 | 526,056,739 | 514,591,752 | 437,499 | (347) | - | 29,981,626 | 0.1% |
| Fidelity Securities Lending Cash Central Fund 5.39% | 149,430,952 | 330,059,157 | 449,807,771 | 38,518 | - | - | 29,682,338 | 0.1% |
| Total | 167,947,938 | 856,115,896 | 964,399,523 | 476,017 | (347) | - | 59,663,964 | |
| Affiliate | Value, beginning of period ($) | Purchases ($) | Sales Proceeds ($) | Dividend Income ($) | Realized Gain (loss) ($) | Change in Unrealized appreciation (depreciation) ($) | Value, end of period ($) |
| Outset Medical, Inc. | 8,820,000 | 1,911,671 | - | - | - | (8,982,671) | 1,749,000 |
| Total | 8,820,000 | 1,911,671 | - | - | - | (8,982,671) | 1,749,000 |
The following is a summary of the inputs used, as of August 31, 2024, involving the Fund's assets and liabilities carried at fair value. The inputs or methodology used for valuing securities may not be an indication of the risk associated with investing in those securities. For more information on valuation inputs, and their aggregation into the levels used below, please refer to the Investment Valuation section in the accompanying Notes to Financial Statements.
| Valuation Inputs at Reporting Date: | ||||
| Description | Total ($) | Level 1 ($) | Level 2 ($) | Level 3 ($) |
Investments in Securities: | ||||
| Common Stocks | 5,167,478,997 | 5,166,537,050 | - | 941,947 |
| Convertible Preferred Stocks | 130,458,249 | - | - | 130,458,249 |
| Convertible Bonds | 2,572,283 | - | - | 2,572,283 |
| Preferred Securities | 13,666,751 | - | - | 13,666,751 |
| Money Market Funds | 59,663,964 | 59,663,964 | - | - |
| Total Investments in Securities: | 5,373,840,244 | 5,226,201,014 | - | 147,639,230 |
| Investments in Securities: | |||
| Convertible Preferred Stocks | |||
| Beginning Balance | $ | 169,510,494 | |
| Net Realized Gain (Loss) on Investment Securities | - | ||
| Net Unrealized Gain (Loss) on Investment Securities | (39,052,245) | ||
| Cost of Purchases | - | ||
| Proceeds of Sales | - | ||
| Amortization/Accretion | - | ||
| Transfers into Level 3 | - | ||
| Transfers out of Level 3 | - | ||
| Ending Balance | $ | 130,458,249 | |
| The change in unrealized gain (loss) for the period attributable to Level 3 securities held at August 31, 2024 | $ | (39,052,243) | |
| Other Investments in Securities | |||
| Beginning Balance | $ | 18,634,694 | |
| Net Realized Gain (Loss) on Investment Securities | - | ||
| Net Unrealized Gain (Loss) on Investment Securities | (1,453,713) | ||
| Cost of Purchases | - | ||
| Proceeds of Sales | - | ||
| Amortization/Accretion | - | ||
| Transfers into Level 3 | - | ||
| Transfers out of Level 3 | - | ||
| Ending Balance | $ | 17,180,981 | |
| The change in unrealized gain (loss) for the period attributable to Level 3 securities held at August 31, 2024 | $ | (1,453,713) | |
| The information used in the above reconciliation represents fiscal year to date activity for any Investments in Securities identified as using Level 3 inputs at either the beginning or the end of the current fiscal period. Cost of purchases and proceeds of sales may include securities received and/or delivered through in-kind transactions, corporate actions or exchanges. Transfers into Level 3 were attributable to a lack of observable market data resulting from decreases in market activity, decreases in liquidity, security restructurings or corporate actions. Transfers out of Level 3 were attributable to observable market data becoming available for those securities. Transfers in or out of Level 3 represent the beginning value of any Security or Instrument where a change in the pricing level occurred from the beginning to the end of the period. Realized and unrealized gains (losses) disclosed in the reconciliation are included in Net Gain (Loss) on the Fund's Statement of Operations. | |||
| Statement of Assets and Liabilities | ||||
| As of August 31, 2024 (Unaudited) | ||||
| Assets | ||||
| Investment in securities, at value (including securities loaned of $28,657,727) - See accompanying schedule: | ||||
Unaffiliated issuers (cost $2,906,499,061) | $ | 5,312,427,280 | ||
Fidelity Central Funds (cost $59,663,964) | 59,663,964 | |||
Other affiliated issuers (cost $23,257,314) | 1,749,000 | |||
| Total Investment in Securities (cost $2,989,420,339) | $ | 5,373,840,244 | ||
| Receivable for investments sold | 15,734,096 | |||
| Receivable for fund shares sold | 1,979,359 | |||
| Dividends receivable | 446,525 | |||
| Interest receivable | 74,014 | |||
| Distributions receivable from Fidelity Central Funds | 74,973 | |||
| Prepaid expenses | 10,363 | |||
| Other receivables | 291,400 | |||
Total assets | 5,392,450,974 | |||
| Liabilities | ||||
| Payable for investments purchased | $ | 2,677,620 | ||
| Payable for fund shares redeemed | 4,032,199 | |||
| Accrued management fee | 2,704,007 | |||
| Other payables and accrued expenses | 417,821 | |||
| Collateral on securities loaned | 29,673,773 | |||
| Total liabilities | 39,505,420 | |||
| Net Assets | $ | 5,352,945,554 | ||
| Net Assets consist of: | ||||
| Paid in capital | $ | 2,667,958,414 | ||
| Total accumulated earnings (loss) | 2,684,987,140 | |||
| Net Assets | $ | 5,352,945,554 | ||
Net Asset Value, offering price and redemption price per share ($5,352,945,554 ÷ 79,923,686 shares) | $ | 66.98 | ||
| Statement of Operations | ||||
Six months ended August 31, 2024 (Unaudited) | ||||
| Investment Income | ||||
| Dividends | $ | 6,888,318 | ||
| Interest | 74,264 | |||
| Income from Fidelity Central Funds (including $38,518 from security lending) | 476,017 | |||
| Total income | 7,438,599 | |||
| Expenses | ||||
| Management fee | $ | 17,187,310 | ||
| Custodian fees and expenses | 24,855 | |||
| Independent trustees' fees and expenses | 11,899 | |||
| Registration fees | 18,114 | |||
| Audit fees | 28,825 | |||
| Legal | 1,995 | |||
| Interest | 10,928 | |||
| Miscellaneous | 104,771 | |||
| Total expenses before reductions | 17,388,697 | |||
| Expense reductions | (120,445) | |||
| Total expenses after reductions | 17,268,252 | |||
| Net Investment income (loss) | (9,829,653) | |||
| Realized and Unrealized Gain (Loss) | ||||
| Net realized gain (loss) on: | ||||
| Investment Securities: | ||||
| Unaffiliated issuers | 329,040,764 | |||
| Fidelity Central Funds | (347) | |||
| Foreign currency transactions | 125,427 | |||
| Total net realized gain (loss) | 329,165,844 | |||
| Change in net unrealized appreciation (depreciation) on: | ||||
| Investment Securities: | ||||
| Unaffiliated issuers | (128,446,659) | |||
| Affiliated issuers | (8,982,671) | |||
| Assets and liabilities in foreign currencies | 13,547 | |||
| Total change in net unrealized appreciation (depreciation) | (137,415,783) | |||
| Net gain (loss) | 191,750,061 | |||
| Net increase (decrease) in net assets resulting from operations | $ | 181,920,408 | ||
| Statement of Changes in Net Assets | ||||
Six months ended August 31, 2024 (Unaudited) | Year ended February 29, 2024 | |||
| Increase (Decrease) in Net Assets | ||||
| Operations | ||||
| Net investment income (loss) | $ | (9,829,653) | $ | (25,332,939) |
| Net realized gain (loss) | 329,165,844 | 445,977,093 | ||
| Change in net unrealized appreciation (depreciation) | (137,415,783) | (75,000,073) | ||
| Net increase (decrease) in net assets resulting from operations | 181,920,408 | 345,644,081 | ||
| Distributions to shareholders | (114,084,139) | - | ||
| Share transactions | ||||
| Proceeds from sales of shares | 75,904,693 | 313,528,922 | ||
| Reinvestment of distributions | 104,856,750 | - | ||
| Cost of shares redeemed | (758,770,939) | (1,707,538,891) | ||
Net increase (decrease) in net assets resulting from share transactions | (578,009,496) | (1,394,009,969) | ||
| Total increase (decrease) in net assets | (510,173,227) | (1,048,365,888) | ||
| Net Assets | ||||
| Beginning of period | 5,863,118,781 | 6,911,484,669 | ||
| End of period | $ | 5,352,945,554 | $ | 5,863,118,781 |
| Other Information | ||||
| Shares | ||||
| Sold | 1,177,508 | 5,030,213 | ||
| Issued in reinvestment of distributions | 1,635,321 | - | ||
| Redeemed | (11,825,612) | (28,227,475) | ||
| Net increase (decrease) | (9,012,783) | (23,197,262) | ||
Medical Technology and Devices Portfolio |
Six months ended (Unaudited) August 31, 2024 | Years ended February 28, 2024 A | 2023 | 2022 | 2021 | 2020 A | |||||||
Selected Per-Share Data | ||||||||||||
| Net asset value, beginning of period | $ | 65.92 | $ | 61.64 | $ | 70.83 | $ | 74.99 | $ | 55.88 | $ | 52.92 |
| Income from Investment Operations | ||||||||||||
Net investment income (loss) B,C | (.12) | (.25) | (.24) | (.37) | (.24) | (.08) | ||||||
| Net realized and unrealized gain (loss) | 2.50 | 4.53 | (7.84) | 2.97 | 24.19 | 4.10 | ||||||
| Total from investment operations | 2.38 | 4.28 | (8.08) | 2.60 | 23.95 | 4.02 | ||||||
| Distributions from net realized gain | (1.32) | - | (1.11) | (6.76) | (4.84) | (1.06) | ||||||
| Total distributions | (1.32) | - | (1.11) | (6.76) | (4.84) | (1.06) | ||||||
| Net asset value, end of period | $ | 66.98 | $ | 65.92 | $ | 61.64 | $ | 70.83 | $ | 74.99 | $ | 55.88 |
Total Return D,E | 3.69 % | 6.94% | (11.64)% | 2.95% | 44.20% | 7.46% | ||||||
Ratios to Average Net Assets B,F,G | ||||||||||||
| Expenses before reductions | .64% H | .70% | .70% | .68% | .70% | .71% | ||||||
| Expenses net of fee waivers, if any | .63 % H | .70% | .70% | .68% | .70% | .71% | ||||||
| Expenses net of all reductions | .63% H | .70% | .70% | .68% | .70% | .71% | ||||||
| Net investment income (loss) | (.36)% H | (.40)% | (.38)% | (.46)% | (.36)% | (.15)% | ||||||
| Supplemental Data | ||||||||||||
| Net assets, end of period (000 omitted) | $ | 5,352,946 | $ | 5,863,119 | $ | 6,911,485 | $ | 8,905,834 | $ | 8,673,299 | $ | 6,058,766 |
Portfolio turnover rate I | 34 % H | 42% | 37% | 32% | 58% | 35% |
| Common Stocks - 96.2% | |||
| Shares | Value ($) | ||
| Biotechnology - 20.3% | |||
| Biotechnology - 20.3% | |||
| Alnylam Pharmaceuticals, Inc. (a) | 14,671 | 3,853,925 | |
| Annexon, Inc. (a) | 291,889 | 1,663,767 | |
| Arcellx, Inc. (a) | 41,100 | 2,825,214 | |
| Arcus Biosciences, Inc. (a) | 520,300 | 8,907,536 | |
| ArriVent Biopharma, Inc. | 151,600 | 4,052,268 | |
| Ascendis Pharma A/S sponsored ADR (a) | 36,100 | 4,998,045 | |
| Avidity Biosciences, Inc. (a) | 820,100 | 36,084,400 | |
| Beam Therapeutics, Inc. (a)(b) | 177,800 | 4,743,704 | |
| Biogen, Inc. (a) | 77,100 | 15,786,996 | |
| BioNTech SE ADR (a) | 145,405 | 12,827,629 | |
| bluebird bio, Inc. (a)(b) | 2,226,000 | 1,249,899 | |
| Blueprint Medicines Corp. (a) | 229,400 | 21,916,876 | |
| CRISPR Therapeutics AG (a)(b) | 53,000 | 2,529,160 | |
| Cytokinetics, Inc. (a) | 23,100 | 1,318,548 | |
| Dyne Therapeutics, Inc. (a) | 925,800 | 42,670,122 | |
| Galapagos NV sponsored ADR (a) | 36,900 | 1,074,528 | |
| Generation Bio Co. (a)(b) | 715,276 | 1,888,329 | |
| Gilead Sciences, Inc. | 777,500 | 61,422,500 | |
| Insmed, Inc. (a) | 101,200 | 7,738,764 | |
| Intellia Therapeutics, Inc. (a) | 172,900 | 3,879,876 | |
| Leap Therapeutics, Inc. warrants 1/31/26 (a) | 60,600 | 72 | |
| Legend Biotech Corp. ADR (a) | 834,200 | 48,008,210 | |
| Merus BV (a) | 108,000 | 5,506,920 | |
| Moderna, Inc. (a) | 443,700 | 34,342,380 | |
| Monte Rosa Therapeutics, Inc. (a) | 796,400 | 4,913,788 | |
| NewAmsterdam Pharma Co. NV (a)(b) | 330,200 | 5,421,884 | |
| Prothena Corp. PLC (a) | 75,800 | 1,688,066 | |
| PTC Therapeutics, Inc. (a) | 260,900 | 9,214,988 | |
| Sarepta Therapeutics, Inc. (a) | 176,500 | 23,965,170 | |
| Spyre Therapeutics, Inc. (a) | 148,742 | 4,276,333 | |
| Xenon Pharmaceuticals, Inc. (a) | 226,000 | 9,116,840 | |
| 387,886,737 | |||
| Consumer Staples Distribution & Retail - 0.0% | |||
| Drug Retail - 0.0% | |||
| MedAvail Holdings, Inc. (a) | 66 | 0 | |
| Health Care Equipment & Supplies - 0.9% | |||
| Health Care Equipment - 0.9% | |||
| Ion Beam Applications SA (b) | 478,300 | 6,355,128 | |
| Nyxoah SA (a)(b) | 298,200 | 2,412,894 | |
| Nyxoah SA (a)(b) | 157,311 | 1,258,488 | |
| Pulmonx Corp. (a)(b) | 864,000 | 6,324,480 | |
| 16,350,990 | |||
| Health Care Providers & Services - 0.2% | |||
| Health Care Services - 0.2% | |||
| agilon health, Inc. (a) | 1,141,429 | 4,657,030 | |
| Life Sciences Tools & Services - 1.0% | |||
| Life Sciences Tools & Services - 1.0% | |||
| Gerresheimer AG | 170,900 | 19,552,481 | |
| Pharmaceuticals - 73.8% | |||
| Pharmaceuticals - 73.8% | |||
| Agomab Therapeutics SA warrants 10/10/33 (a)(c)(d) | 10 | 0 | |
| Arvinas Holding Co. LLC (a) | 26,300 | 688,008 | |
| AstraZeneca PLC sponsored ADR | 1,919,600 | 168,195,352 | |
| Axsome Therapeutics, Inc. (a)(b) | 58,400 | 5,189,424 | |
| Bristol-Myers Squibb Co. | 1,897,900 | 94,800,105 | |
| Catalent, Inc. (a) | 228,900 | 13,953,744 | |
| Edgewise Therapeutics, Inc. (a) | 346,900 | 6,504,375 | |
| Elanco Animal Health, Inc. (a) | 1,581,000 | 24,458,070 | |
| Eli Lilly & Co. | 477,361 | 458,276,107 | |
| Financiere de Tubize SA | 70,400 | 9,416,239 | |
| Fulcrum Therapeutics, Inc. (a)(b) | 683,600 | 5,844,780 | |
| Galderma Group AG | 92,240 | 8,930,477 | |
| GSK PLC sponsored ADR | 1,954,860 | 85,837,903 | |
| Harmony Biosciences Holdings, Inc. (a) | 130,677 | 4,701,758 | |
| Merck & Co., Inc. | 681,136 | 80,680,559 | |
| Merck KGaA | 146,300 | 28,438,466 | |
| Novo Nordisk A/S Series B sponsored ADR | 1,833,400 | 255,135,944 | |
| Ocular Therapeutix, Inc. (a)(b) | 427,500 | 3,770,550 | |
| Royalty Pharma PLC Class A | 1,192,000 | 34,603,760 | |
| Sandoz Group AG ADR (b) | 4,979 | 219,176 | |
| Structure Therapeutics, Inc. ADR (a) | 54,000 | 2,059,020 | |
| UCB SA | 502,000 | 90,838,898 | |
| Zoetis, Inc. Class A | 172,100 | 31,578,629 | |
| 1,414,121,344 | |||
| TOTAL COMMON STOCKS (Cost $1,212,410,863) | 1,842,568,582 | ||
| Convertible Preferred Stocks - 0.4% | |||
| Shares | Value ($) | ||
| Biotechnology - 0.1% | |||
| Biotechnology - 0.1% | |||
| Castle Creek Biosciences, Inc.: | |||
| Series C (a)(c)(d) | 200 | 51,214 | |
| Series D1 (a)(c)(d) | 6,308 | 1,446,487 | |
| Series D2 (a)(c)(d) | 85 | 17,447 | |
| 1,515,148 | |||
| Financial Services - 0.1% | |||
| Diversified Financial Services - 0.1% | |||
| Paragon Biosciences Emalex Capital, Inc.: | |||
| Series C (a)(c)(d) | 158,879 | 1,982,810 | |
| Series D1 (a)(c)(d) | 14,400 | 180,288 | |
| Series D2 (a)(c)(d) | 22,477 | 267,926 | |
| 2,431,024 | |||
| Pharmaceuticals - 0.1% | |||
| Pharmaceuticals - 0.1% | |||
| Agomab Therapeutics SA Series C (c)(d) | 7,729 | 2,041,673 | |
| Software - 0.1% | |||
| Systems Software - 0.1% | |||
| Evozyne, Inc.: | |||
| Series A (a)(c)(d) | 5,900 | 106,731 | |
| Series B (c)(d) | 56,643 | 1,024,105 | |
| 1,130,836 | |||
| TOTAL CONVERTIBLE PREFERRED STOCKS (Cost $6,200,752) | 7,118,681 | ||
| Convertible Bonds - 0.0% | |||
Principal Amount (e) | Value ($) | ||
| Software - 0.0% | |||
| Systems Software - 0.0% | |||
Evozyne, Inc. 6% 9/13/28 pay-in-kind (c)(d) (Cost $921,287) | 921,287 | 1,033,684 | |
| Money Market Funds - 3.9% | |||
| Shares | Value ($) | ||
| Fidelity Cash Central Fund 5.39% (f) | 57,807,149 | 57,818,710 | |
| Fidelity Securities Lending Cash Central Fund 5.39% (f)(g) | 16,801,725 | 16,803,405 | |
| TOTAL MONEY MARKET FUNDS (Cost $74,622,115) | 74,622,115 | ||
| TOTAL INVESTMENT IN SECURITIES - 100.5% (Cost $1,294,155,017) | 1,925,343,062 |
NET OTHER ASSETS (LIABILITIES) - (0.5)% | (10,505,012) |
| NET ASSETS - 100.0% | 1,914,838,050 |
| (a) | Non-income producing |
| (b) | Security or a portion of the security is on loan at period end. |
| (c) | Restricted securities (including private placements) - Investment in securities not registered under the Securities Act of 1933 (excluding 144A issues). At the end of the period, the value of restricted securities (excluding 144A issues) amounted to $8,152,365 or 0.4% of net assets. |
| (d) | Level 3 security |
| (e) | Amount is stated in United States dollars unless otherwise noted. |
| (f) | Affiliated fund that is generally available only to investment companies and other accounts managed by Fidelity Investments. The rate quoted is the annualized seven-day yield of the fund at period end. A complete unaudited listing of the fund's holdings as of its most recent quarter end is available upon request. In addition, each Fidelity Central Fund's financial statements are available on the SEC's website or upon request. |
| (g) | Investment made with cash collateral received from securities on loan. |
| Additional information on each restricted holding is as follows: | ||
| Security | Acquisition Date | Acquisition Cost ($) |
| Agomab Therapeutics SA warrants 10/10/33 | 10/03/23 | 0 |
| Agomab Therapeutics SA Series C | 10/03/23 | 1,687,596 |
| Castle Creek Biosciences, Inc. Series C | 12/09/19 | 82,370 |
| Castle Creek Biosciences, Inc. Series D1 | 4/19/22 | 1,356,409 |
| Castle Creek Biosciences, Inc. Series D2 | 6/28/21 | 14,700 |
| Evozyne, Inc. Series A | 4/09/21 | 132,573 |
| Evozyne, Inc. Series B | 9/14/23 | 877,400 |
| Evozyne, Inc. 6% 9/13/28 pay-in-kind | 9/14/23 - 6/30/24 | 921,287 |
| Paragon Biosciences Emalex Capital, Inc. Series C | 2/26/21 | 1,700,005 |
| Paragon Biosciences Emalex Capital, Inc. Series D1 | 10/21/22 | 155,952 |
| Paragon Biosciences Emalex Capital, Inc. Series D2 | 5/18/22 | 193,747 |
| Affiliate | Value, beginning of period ($) | Purchases ($) | Sales Proceeds ($) | Dividend Income ($) | Realized Gain (loss) ($) | Change in Unrealized appreciation (depreciation) ($) | Value, end of period ($) | % ownership, end of period |
| Fidelity Cash Central Fund 5.39% | 14,130,101 | 370,454,482 | 326,766,031 | 550,120 | 158 | - | 57,818,710 | 0.1% |
| Fidelity Securities Lending Cash Central Fund 5.39% | 43,199,783 | 165,094,386 | 191,490,764 | 276,837 | - | - | 16,803,405 | 0.1% |
| Total | 57,329,884 | 535,548,868 | 518,256,795 | 826,957 | 158 | - | 74,622,115 | |
The following is a summary of the inputs used, as of August 31, 2024, involving the Fund's assets and liabilities carried at fair value. The inputs or methodology used for valuing securities may not be an indication of the risk associated with investing in those securities. For more information on valuation inputs, and their aggregation into the levels used below, please refer to the Investment Valuation section in the accompanying Notes to Financial Statements.
| Valuation Inputs at Reporting Date: | ||||
| Description | Total ($) | Level 1 ($) | Level 2 ($) | Level 3 ($) |
Investments in Securities: | ||||
| Common Stocks | 1,842,568,582 | 1,842,568,510 | 72 | - |
| Convertible Preferred Stocks | 7,118,681 | - | - | 7,118,681 |
| Convertible Bonds | 1,033,684 | - | - | 1,033,684 |
| Money Market Funds | 74,622,115 | 74,622,115 | - | - |
| Total Investments in Securities: | 1,925,343,062 | 1,917,190,625 | 72 | 8,152,365 |
| Statement of Assets and Liabilities | ||||
| As of August 31, 2024 (Unaudited) | ||||
| Assets | ||||
| Investment in securities, at value (including securities loaned of $15,670,027) - See accompanying schedule: | ||||
Unaffiliated issuers (cost $1,219,532,902) | $ | 1,850,720,947 | ||
Fidelity Central Funds (cost $74,622,115) | 74,622,115 | |||
| Total Investment in Securities (cost $1,294,155,017) | $ | 1,925,343,062 | ||
| Foreign currency held at value (cost $12,485) | 12,485 | |||
| Receivable for fund shares sold | 3,521,135 | |||
| Dividends receivable | 2,658,969 | |||
| Reclaims receivable | 2,273,460 | |||
| Interest receivable | 9,668 | |||
| Distributions receivable from Fidelity Central Funds | 190,352 | |||
| Prepaid expenses | 2,911 | |||
| Other receivables | 188,464 | |||
Total assets | 1,934,200,506 | |||
| Liabilities | ||||
| Payable for investments purchased | $ | 288,104 | ||
| Payable for fund shares redeemed | 1,050,909 | |||
| Accrued management fee | 963,234 | |||
| Other payables and accrued expenses | 257,512 | |||
| Collateral on securities loaned | 16,802,697 | |||
| Total liabilities | 19,362,456 | |||
| Net Assets | $ | 1,914,838,050 | ||
| Net Assets consist of: | ||||
| Paid in capital | $ | 1,289,006,452 | ||
| Total accumulated earnings (loss) | 625,831,598 | |||
| Net Assets | $ | 1,914,838,050 | ||
Net Asset Value, offering price and redemption price per share ($1,914,838,050 ÷ 60,629,162 shares) | $ | 31.58 | ||
| Statement of Operations | ||||
Six months ended August 31, 2024 (Unaudited) | ||||
| Investment Income | ||||
| Dividends | $ | 11,078,540 | ||
| Foreign Tax Reclaims | 576,339 | |||
| Interest | 12,750 | |||
| Income from Fidelity Central Funds (including $276,837 from security lending) | 826,957 | |||
| Income before foreign taxes withheld | $ | 12,494,586 | ||
| Less foreign taxes withheld | (1,168,509) | |||
| Total income | 11,326,077 | |||
| Expenses | ||||
| Management fee | $ | 4,904,149 | ||
| Custodian fees and expenses | 28,114 | |||
| Independent trustees' fees and expenses | 2,727 | |||
| Registration fees | 111,211 | |||
| Audit fees | 28,445 | |||
| Legal | 1,903 | |||
| Miscellaneous | 29,076 | |||
| Total expenses before reductions | 5,105,625 | |||
| Expense reductions | (20,618) | |||
| Total expenses after reductions | 5,085,007 | |||
| Net Investment income (loss) | 6,241,070 | |||
| Realized and Unrealized Gain (Loss) | ||||
| Net realized gain (loss) on: | ||||
| Investment Securities: | ||||
| Unaffiliated issuers | (1,512,777) | |||
| Fidelity Central Funds | 158 | |||
| Foreign currency transactions | (18,536) | |||
| Total net realized gain (loss) | (1,531,155) | |||
| Change in net unrealized appreciation (depreciation) on: | ||||
| Investment Securities: | ||||
| Unaffiliated issuers | 252,450,810 | |||
| Assets and liabilities in foreign currencies | 53,109 | |||
| Total change in net unrealized appreciation (depreciation) | 252,503,919 | |||
| Net gain (loss) | 250,972,764 | |||
| Net increase (decrease) in net assets resulting from operations | $ | 257,213,834 | ||
| Statement of Changes in Net Assets | ||||
Six months ended August 31, 2024 (Unaudited) | Year ended February 29, 2024 | |||
| Increase (Decrease) in Net Assets | ||||
| Operations | ||||
| Net investment income (loss) | $ | 6,241,070 | $ | 7,478,391 |
| Net realized gain (loss) | (1,531,155) | 29,394,060 | ||
| Change in net unrealized appreciation (depreciation) | 252,503,919 | 219,936,230 | ||
| Net increase (decrease) in net assets resulting from operations | 257,213,834 | 256,808,681 | ||
| Distributions to shareholders | (10,989,056) | (66,635,724) | ||
| Share transactions | ||||
| Proceeds from sales of shares | 763,888,333 | 272,144,354 | ||
| Reinvestment of distributions | 10,273,882 | 62,149,467 | ||
| Cost of shares redeemed | (185,828,906) | (205,365,814) | ||
Net increase (decrease) in net assets resulting from share transactions | 588,333,309 | 128,928,007 | ||
| Total increase (decrease) in net assets | 834,558,087 | 319,100,964 | ||
| Net Assets | ||||
| Beginning of period | 1,080,279,963 | 761,178,999 | ||
| End of period | $ | 1,914,838,050 | $ | 1,080,279,963 |
| Other Information | ||||
| Shares | ||||
| Sold | 26,648,084 | 11,175,456 | ||
| Issued in reinvestment of distributions | 386,818 | 2,733,902 | ||
| Redeemed | (6,498,707) | (8,784,018) | ||
| Net increase (decrease) | 20,536,195 | 5,125,340 | ||
Pharmaceuticals Portfolio |
Six months ended (Unaudited) August 31, 2024 | Years ended February 28, 2024 A | 2023 | 2022 | 2021 | 2020 A | |||||||
Selected Per-Share Data | ||||||||||||
| Net asset value, beginning of period | $ | 26.94 | $ | 21.77 | $ | 22.53 | $ | 23.92 | $ | 21.71 | $ | 21.07 |
| Income from Investment Operations | ||||||||||||
Net investment income (loss) B,C | .12 | .21 | .23 | .27 | .27 | .29 | ||||||
| Net realized and unrealized gain (loss) | 4.75 | 6.87 | .19 | .97 | 4.04 | 2.29 | ||||||
| Total from investment operations | 4.87 | 7.08 | .42 | 1.24 | 4.31 | 2.58 | ||||||
| Distributions from net investment income | (.05) | (.15) | (.30) | (.28) | (.31) | (.31) | ||||||
| Distributions from net realized gain | (.17) | (1.76) | (.88) | (2.35) | (1.79) | (1.64) | ||||||
| Total distributions | (.23) D | (1.91) | (1.18) | (2.63) | (2.10) | (1.94) D | ||||||
| Net asset value, end of period | $ | 31.58 | $ | 26.94 | $ | 21.77 | $ | 22.53 | $ | 23.92 | $ | 21.71 |
Total Return E,F | 18.23 % | 34.35% | 1.60% | 5.15% | 20.46% | 12.06% | ||||||
Ratios to Average Net Assets C,G,H | ||||||||||||
| Expenses before reductions | .68% I | .74% | .76% | .75% | .77% | .78% | ||||||
| Expenses net of fee waivers, if any | .68 % I | .74% | .76% | .75% | .77% | .78% | ||||||
| Expenses net of all reductions | .68% I | .74% | .76% | .75% | .76% | .77% | ||||||
| Net investment income (loss) | .83% I | .88% | .99% | 1.10% | 1.13% | 1.36% | ||||||
| Supplemental Data | ||||||||||||
| Net assets, end of period (000 omitted) | $ | 1,914,838 | $ | 1,080,280 | $ | 761,179 | $ | 934,748 | $ | 833,380 | $ | 764,285 |
Portfolio turnover rate J | 14 % I | 44% | 45% | 29% | 32% | 52% |
| Fidelity Central Fund | Investment Manager | Investment Objective | Investment Practices | Expense RatioA |
| Fidelity Money Market Central Funds | Fidelity Management & Research Company LLC (FMR) | Each fund seeks to obtain a high level of current income consistent with the preservation of capital and liquidity. | Short-term Investments | Less than .005% |
| Asset Type | Fair Value | Valuation Technique(s) | Unobservable Input | Amount or Range/Weighted Average | Impact to Valuation from an Increase in InputA |
| Equities | $102,332,686 | Recovery Value | Recovery Value | $0.00 | Increase |
| Market Approach | Transaction price | $0.00 - $60.73 / $37.18 | Increase | ||
| Discount rate | 10.0% - 40.0% / 33.7% | Decrease | |||
| Market comparable | Enterprise value/Revenue multiple (EV/R) | 15.0 | Increase | ||
| Discounted cash flow | Discount rate | 4.3% - 12.6% / 9.7% | Decrease | ||
| Probability rate | 0.0% - 100.0% / 50.8% | Increase | |||
| Term | 0.2 - 6.7 / 3.2 | Increase | |||
| Black scholes | Discount rate | 3.9% | Increase | ||
| Volatility | 75.0% - 80.0% / 77.4% | Increase | |||
| Term | 2.0 - 3.0 / 2.8 | Increase | |||
| Asset Type | Fair Value | Valuation Technique(s) | Unobservable Input | Amount or Range/Weighted Average | Impact to Valuation from an Increase in InputA |
| Equities | $122,986,736 | Market Approach | Transaction price | $1.20 - $33.33 / $13.02 | Increase |
| Discount rate | 10.0% - 70.0% / 23.7% | Decrease | |||
| Premium rate | 10.0% | Increase | |||
| Market comparable | Enterprise value/Revenue multiple (EV/R) | 2.00 - 15.00 / 4.50 | Increase | ||
| Black scholes | Discount rate | 3.7% - 4.1% / 3.8% | Increase | ||
| Volatility | 45.0% - 90.0% / 66.6% | Increase | |||
| Term | 1.5 - 5.0 / 3.1 | Increase | |||
| Corporate Bonds | $5,868,552 | Market Approach | Transaction price | $100.00 | Increase |
| Discount rate | 23.5% | Decrease | |||
| Profitability rate | 0.0% - 33.3% / 16.7% | Increase | |||
| Market comparable | Enterprise value/Revenue multiple (EV/R) | 7.0 | Increase | ||
| Discount rate | 25.0% | Decrease | |||
| Profitability rate | 0.0% - 25.0% / 13.8% | Increase | |||
| Black scholes | Discount rate | 4.4% | Increase | ||
| Volatility | 55.0% | Increase | |||
| Term | 1.0 | Increase | |||
| Preferred Securities | $12,246,532 | Market Approach | Transaction price | $100.00 | Increase |
| Discount rate | 36.1% | Decrease | |||
| Profitability rate | 0.0% - 50.0% / 25.0% | Increase | |||
| Black scholes | Discount rate | 3.8% | Increase | ||
| Volatility | 70.0% | Increase | |||
| Term | 2.3 | Increase | |||
| Asset Type | Fair Value | Valuation Technique(s) | Unobservable Input | Amount or Range/Weighted Average | Impact to Valuation from an Increase in InputA |
| Equities | $131,400,196 | Market Approach | Transaction price | $0.61 - $8.83 / $6.42 | Increase |
| Discount rate | 5.0% - 70.0% / 24.9% | Decrease | |||
| Market comparable | Enterprise value/Revenue multiple (EV/R) | 2.5 - 15.0 / 6.4 | Increase | ||
| Black scholes | Discount rate | 3.7% - 4.1% / 3.8% | Increase | ||
| Volatility | 55.0% - 80.0% / 71.3% | Increase | |||
| Term | 1.5 - 4.0 / 2.8 | Increase | |||
| Corporate Bonds | $2,572,283 | Market comparable | Enterprise value/Revenue multiple (EV/R) | 7.0 | Increase |
| Discount rate | 25.0% | Decrease | |||
| Profitability rate | 0.0% - 25.0% / 13.8% | Increase | |||
| Black scholes | Discount rate | 4.4% | Increase | ||
| Volatility | 55.0% | Increase | |||
| Term | 1.0 | Increase | |||
| Preferred Securities | $13,666,751 | Market Approach | Transaction price | $100.00 | Increase |
| Discount rate | 5.0% | Decrease | |||
| Black scholes | Discount rate | 3.7% | Increase | ||
| Volatility | 70.0% | Increase | |||
| Term | 3.0 | Increase | |||
| Biotechnology Portfolio | $1,380,583 |
| Health Care Portfolio | 904,543 |
| Health Care Services Portfolio | 101,979 |
| Medical Technology and Devices Portfolio | 291,400 |
| Pharmaceuticals Portfolio | 188,464 |
| Tax cost ($) | Gross unrealized appreciation ($) | Gross unrealized depreciation ($) | Net unrealized appreciation (depreciation)($) | |
| Biotechnology Portfolio | 3,231,791,722 | 2,318,665,029 | (263,578,859) | 2,055,086,170 |
| Health Care Portfolio | 4,591,413,843 | 3,632,822,813 | (360,910,286) | 3,271,912,527 |
| Health Care Services Portfolio | 916,513,944 | 633,445,833 | (90,487,613) | 542,958,220 |
Medical Technology and Devices Portfolio | 3,007,295,535 | 2,637,612,782 | (271,068,073) | 2,366,544,709 |
| Pharmaceuticals Portfolio | 1,299,690,061 | 690,195,104 | (64,542,103) | 625,653,001 |
| Short-term ($) | Long-term ($) | Total capital loss carryforward ($) | |
| Biotechnology Portfolio | (413,076,732) | (-) | (413,076,732) |
Capital losses ($) | Ordinary losses ($) | |||
| Health Care Portfolio | (-) | (1,458,063) | ||
Medical Technology and Devices Portfolio | (-) | (4,981,744) | ||
| Pharmaceuticals Portfolio | (3,384,865) | (-) |
| $ Amount | % of Net Assets | |
| Biotechnology Portfolio | 46,517,719 | .93 |
| Health Care Portfolio | 4,249,965 | .05 |
| Health Care Services Portfolio | 625,358 | .04 |
| Purchases ($) | Sales ($) | |
| Biotechnology Portfolio | 741,943,268 | 1,069,021,159 |
| Health Care Portfolio | 1,330,790,285 | 1,996,459,892 |
| Health Care Services Portfolio | 468,009,497 | 646,536,037 |
| Medical Technology and Devices Portfolio | 924,735,049 | 1,629,334,483 |
| Pharmaceuticals Portfolio | 635,361,087 | 105,333,418 |
| Shares | Total net realized gain or loss ($) | Total Proceeds ($) | |
| Biotechnology Portfolio | 10,305,851 | 82,617,211 | 154,175,532 |
| Maximum Management Fee Rate % | |
| Biotechnology Portfolio | .67 |
| Health Care Portfolio | .65 |
| Health Care Services Portfolio | .69 |
| Medical Technology and Devices Portfolio | .66 |
| Pharmaceuticals Portfolio | .70 |
| Total Management Fee Rate % | |
| Biotechnology Portfolio | .63 |
| Health Care Portfolio | .62 |
| Health Care Services Portfolio | .66 |
| Medical Technology and Devices Portfolio | .63 |
| Pharmaceuticals Portfolio | .65 |
| Amount ($) | |
| Biotechnology Portfolio | 60,055 |
| Health Care Portfolio | 22,615 |
| Health Care Services Portfolio | 9,963 |
| Medical Technology and Devices Portfolio | 16,843 |
| Pharmaceuticals Portfolio | 9,856 |
| Borrower or Lender | Average Loan Balance ($) | Weighted Average Interest Rate | Interest Expense ($) | |
| Health Care Portfolio | Borrower | 5,331,829 | 5.57% | 28,510 |
Medical Technology and Devices Portfolio | Borrower | 5,431,077 | 5.57% | 10,928 |
| Purchases ($) | Sales ($) | Realized Gain (Loss)($) | |
| Biotechnology Portfolio | 24,040,608 | 75,020,563 | 9,469,138 |
| Health Care Portfolio | 124,774,472 | 189,716,441 | 43,245,712 |
| Health Care Services Portfolio | 25,386,904 | 59,098,100 | 3,218,577 |
| Medical Technology and Devices Portfolio | 40,022,511 | 105,668,369 | 30,763,189 |
| Pharmaceuticals Portfolio | 80,406,527 | 4,844,242 | 1,358,397 |
| Amount ($) | |
| Biotechnology Portfolio | 36,218 |
| Amount ($) | |
| Biotechnology Portfolio | 4,121 |
| Health Care Portfolio | 6,758 |
| Health Care Services Portfolio | 1,308 |
| Medical Technology and Devices Portfolio | 5,040 |
| Pharmaceuticals Portfolio | 1,056 |
| Total Security Lending Fees Paid to NFS ($) | Security Lending Income From Securities Loaned to NFS ($) | Value of Securities Loaned to NFS at Period End ($) | |
| Biotechnology Portfolio | 356,781 | 40,327 | 258,171 |
| Health Care Portfolio | 26,602 | 2,598 | 20,400 |
| Health Care Services Portfolio | 7,896 | 20 | - |
| Medical Technology and Devices Portfolio | 3,967 | 20 | - |
| Pharmaceuticals Portfolio | 29,725 | 7 | 8,448 |
| Average Loan Balance ($) | Weighted Average Interest Rate | Interest Expense ($) | |
| Health Care Portfolio | 4,263,000 | 5.83% | 1,381 |
| Custodian credits ($) | |||
| Biotechnology Portfolio | 3,021 | ||
| Health Care Services Portfolio | 407 |
| Amount ($) | |
| Biotechnology Portfolio | 97,188 |
| Health Care Portfolio | 162,450 |
| Health Care Services Portfolio | 31,981 |
| Medical Technology and Devices Portfolio | 120,445 |
| Pharmaceuticals Portfolio | 20,618 |
| A special meeting of shareholders was held on July 16, 2024. The results of votes taken among shareholders on the proposal before them are reported below. Each vote reported represents one dollar of net asset value held on the record date for the meeting. | ||
| Proposal 1 | ||
| To elect a Board of Trustees. | ||
# of Votes | % of Votes | |
| Bettina Doulton | ||
| Affirmative | 50,178,154,296.75 | 92.38 |
| Withheld | 4,136,551,415.53 | 7.62 |
| TOTAL | 54,314,705,712.27 | 100.00 |
| Robert A. Lawrence | ||
| Affirmative | 50,131,321,830.27 | 92.30 |
| Withheld | 4,183,383,882.00 | 7.70 |
| TOTAL | 54,314,705,712.27 | 100.00 |
| Vijay C. Advani | ||
| Affirmative | 50,021,870,319.77 | 92.10 |
| Withheld | 4,292,835,392.50 | 7.90 |
| TOTAL | 54,314,705,712.27 | 100.00 |
| Thomas P. Bostick | ||
| Affirmative | 50,057,248,681.17 | 92.16 |
| Withheld | 4,257,457,031.10 | 7.84 |
| TOTAL | 54,314,705,712.27 | 100.00 |
| Donald F. Donahue | ||
| Affirmative | 49,998,023,290.27 | 92.05 |
| Withheld | 4,316,682,422.00 | 7.95 |
| TOTAL | 54,314,705,712.27 | 100.00 |
| Vicki L. Fuller | ||
| Affirmative | 50,146,578,363.15 | 92.33 |
| Withheld | 4,168,127,349.12 | 7.67 |
| TOTAL | 54,314,705,712.27 | 100.00 |
| Patricia L. Kampling | ||
| Affirmative | 50,227,895,949.71 | 92.48 |
| Withheld | 4,086,809,762.56 | 7.52 |
| TOTAL | 54,314,705,712.27 | 100.00 |
| Thomas A. Kennedy | ||
| Affirmative | 50,080,160,698.34 | 92.20 |
| Withheld | 4,234,545,013.93 | 7.80 |
| TOTAL | 54,314,705,712.27 | 100.00 |
| Oscar Munoz | ||
| Affirmative | 49,879,616,445.58 | 91.83 |
| Withheld | 4,435,089,266.69 | 8.17 |
| TOTAL | 54,314,705,712.27 | 100.00 |
| Karen B. Peetz | ||
| Affirmative | 50,078,105,799.58 | 92.20 |
| Withheld | 4,236,599,912.69 | 7.80 |
| TOTAL | 54,314,705,712.27 | 100.00 |
| David M. Thomas | ||
| Affirmative | 50,013,939,190.36 | 92.08 |
| Withheld | 4,300,766,521.91 | 7.92 |
| TOTAL | 54,314,705,712.27 | 100.00 |
| Susan Tomasky | ||
| Affirmative | 50,109,134,188.50 | 92.26 |
| Withheld | 4,205,571,523.77 | 7.74 |
| TOTAL | 54,314,705,712.27 | 100.00 |
| Michael E. Wiley | ||
| Affirmative | 50,016,526,096.47 | 92.09 |
| Withheld | 4,298,179,615.80 | 7.91 |
| TOTAL | 54,314,705,712.27 | 100.00 |
| Proposal 1 reflects trust-wide proposal and voting results. | ||
 |


Contents
| Common Stocks - 99.4% | |||
| Shares | Value ($) | ||
| Automobile Components - 10.9% | |||
| Automotive Parts & Equipment - 10.9% | |||
| Aptiv PLC (a) | 49,517 | 3,541,951 | |
| Autoliv, Inc. | 19,414 | 1,989,353 | |
| BorgWarner, Inc. | 42,779 | 1,457,481 | |
| Gentex Corp. | 17,658 | 553,225 | |
| Lear Corp. | 4,915 | 573,335 | |
| Novem Group SA | 15,177 | 72,811 | |
| 8,188,156 | |||
| Automobiles - 53.7% | |||
| Automobile Manufacturers - 53.7% | |||
| Ferrari NV | 12,243 | 6,082,200 | |
| Ford Motor Co. | 203,290 | 2,274,815 | |
| General Motors Co. | 123,227 | 6,134,240 | |
| Honda Motor Co. Ltd. sponsored ADR | 101,299 | 3,337,802 | |
| Li Auto, Inc. ADR (a)(b) | 160,777 | 3,128,720 | |
| NIO, Inc. sponsored ADR (a)(b) | 74,259 | 300,006 | |
| Rivian Automotive, Inc. Class A (a)(b) | 111,926 | 1,581,514 | |
| Stellantis NV (b) | 121,548 | 2,039,575 | |
| Tesla, Inc. (a) | 39,638 | 8,486,892 | |
| Toyota Motor Corp. sponsored ADR | 35,516 | 6,740,937 | |
| XPeng, Inc. ADR (a)(b) | 20,415 | 164,341 | |
| 40,271,042 | |||
| Commercial Services & Supplies - 6.3% | |||
| Diversified Support Services - 6.3% | |||
| ACV Auctions, Inc. Class A (a) | 70,232 | 1,314,041 | |
| Copart, Inc. (a) | 64,064 | 3,392,829 | |
| 4,706,870 | |||
| Consumer Staples Distribution & Retail - 0.3% | |||
| Food Retail - 0.3% | |||
| Maplebear, Inc. (NASDAQ) | 5,765 | 206,906 | |
| Distributors - 4.5% | |||
| Distributors - 4.5% | |||
| Genuine Parts Co. | 16,691 | 2,391,153 | |
| LKQ Corp. | 23,609 | 981,898 | |
| 3,373,051 | |||
| Ground Transportation - 1.9% | |||
| Passenger Ground Transportation - 1.9% | |||
| Uber Technologies, Inc. (a) | 19,747 | 1,444,098 | |
| Specialty Retail - 21.1% | |||
| Automotive Retail - 21.1% | |||
| Advance Auto Parts, Inc. | 10,091 | 457,223 | |
| AutoNation, Inc. (a) | 6,121 | 1,089,416 | |
| AutoZone, Inc. (a) | 1,092 | 3,474,176 | |
| Carvana Co. Class A (a) | 17,356 | 2,614,161 | |
| Group 1 Automotive, Inc. | 1,263 | 475,848 | |
| Lithia Motors, Inc. Class A (sub. vtg.) | 3,197 | 962,553 | |
| O'Reilly Automotive, Inc. (a) | 5,992 | 6,770,780 | |
| 15,844,157 | |||
| Trading Companies & Distributors - 0.7% | |||
| Trading Companies & Distributors - 0.7% | |||
| Rush Enterprises, Inc. Class A | 10,428 | 549,556 | |
| TOTAL COMMON STOCKS (Cost $40,921,938) | 74,583,836 | ||
| Convertible Preferred Stocks - 0.0% | |||
| Shares | Value ($) | ||
| Electronic Equipment, Instruments & Components - 0.0% | |||
| Electronic Components - 0.0% | |||
CelLink Corp. Series D (a)(c)(d) (Cost $77,048) | 3,700 | 25,197 | |
| Money Market Funds - 8.8% | |||
| Shares | Value ($) | ||
| Fidelity Cash Central Fund 5.39% (e) | 180,075 | 180,111 | |
| Fidelity Securities Lending Cash Central Fund 5.39% (e)(f) | 6,401,295 | 6,401,935 | |
| TOTAL MONEY MARKET FUNDS (Cost $6,582,046) | 6,582,046 | ||
| TOTAL INVESTMENT IN SECURITIES - 108.2% (Cost $47,581,032) | 81,191,079 |
NET OTHER ASSETS (LIABILITIES) - (8.2)% | (6,136,784) |
| NET ASSETS - 100.0% | 75,054,295 |
| (a) | Non-income producing |
| (b) | Security or a portion of the security is on loan at period end. |
| (c) | Restricted securities (including private placements) - Investment in securities not registered under the Securities Act of 1933 (excluding 144A issues). At the end of the period, the value of restricted securities (excluding 144A issues) amounted to $25,197 or 0.0% of net assets. |
| (d) | Level 3 security |
| (e) | Affiliated fund that is generally available only to investment companies and other accounts managed by Fidelity Investments. The rate quoted is the annualized seven-day yield of the fund at period end. A complete unaudited listing of the fund's holdings as of its most recent quarter end is available upon request. In addition, each Fidelity Central Fund's financial statements are available on the SEC's website or upon request. |
| (f) | Investment made with cash collateral received from securities on loan. |
| Additional information on each restricted holding is as follows: | ||
| Security | Acquisition Date | Acquisition Cost ($) |
| CelLink Corp. Series D | 1/20/22 | 77,048 |
| Affiliate | Value, beginning of period ($) | Purchases ($) | Sales Proceeds ($) | Dividend Income ($) | Realized Gain (loss) ($) | Change in Unrealized appreciation (depreciation) ($) | Value, end of period ($) | % ownership, end of period |
| Fidelity Cash Central Fund 5.39% | - | 7,421,118 | 7,241,040 | 3,107 | 33 | - | 180,111 | 0.0% |
| Fidelity Securities Lending Cash Central Fund 5.39% | 18,677,977 | 130,539,084 | 142,815,126 | 45,624 | - | - | 6,401,935 | 0.0% |
| Total | 18,677,977 | 137,960,202 | 150,056,166 | 48,731 | 33 | - | 6,582,046 | |
| Valuation Inputs at Reporting Date: | ||||
| Description | Total ($) | Level 1 ($) | Level 2 ($) | Level 3 ($) |
Investments in Securities: | ||||
| Common Stocks | 74,583,836 | 74,583,836 | - | - |
| Convertible Preferred Stocks | 25,197 | - | - | 25,197 |
| Money Market Funds | 6,582,046 | 6,582,046 | - | - |
| Total Investments in Securities: | 81,191,079 | 81,165,882 | - | 25,197 |
| Statement of Assets and Liabilities | ||||
| As of August 31, 2024 (Unaudited) | ||||
| Assets | ||||
| Investment in securities, at value (including securities loaned of $6,184,003) - See accompanying schedule: | ||||
Unaffiliated issuers (cost $40,998,986) | $ | 74,609,033 | ||
Fidelity Central Funds (cost $6,582,046) | 6,582,046 | |||
| Total Investment in Securities (cost $47,581,032) | $ | 81,191,079 | ||
| Receivable for investments sold | 324,150 | |||
| Receivable for fund shares sold | 3,445 | |||
| Dividends receivable | 41,420 | |||
| Distributions receivable from Fidelity Central Funds | 1,831 | |||
| Prepaid expenses | 154 | |||
| Other receivables | 2,181 | |||
Total assets | 81,564,260 | |||
| Liabilities | ||||
| Payable for fund shares redeemed | $ | 38,166 | ||
| Accrued management fee | 40,998 | |||
| Other payables and accrued expenses | 29,276 | |||
| Collateral on securities loaned | 6,401,525 | |||
| Total liabilities | 6,509,965 | |||
| Net Assets | $ | 75,054,295 | ||
| Net Assets consist of: | ||||
| Paid in capital | $ | 49,533,355 | ||
| Total accumulated earnings (loss) | 25,520,940 | |||
| Net Assets | $ | 75,054,295 | ||
Net Asset Value, offering price and redemption price per share ($75,054,295 ÷ 1,416,409 shares) | $ | 52.99 | ||
| Statement of Operations | ||||
Six months ended August 31, 2024 (Unaudited) | ||||
| Investment Income | ||||
| Dividends | $ | 779,634 | ||
| Income from Fidelity Central Funds (including $45,624 from security lending) | 48,731 | |||
| Total income | 828,365 | |||
| Expenses | ||||
| Management fee | $ | 285,758 | ||
| Custodian fees and expenses | 12,161 | |||
| Independent trustees' fees and expenses | 192 | |||
| Registration fees | 18,200 | |||
| Audit fees | 21,096 | |||
| Legal | 1,302 | |||
| Miscellaneous | 4,349 | |||
| Total expenses before reductions | 343,058 | |||
| Expense reductions | (1,990) | |||
| Total expenses after reductions | 341,068 | |||
| Net Investment income (loss) | 487,297 | |||
| Realized and Unrealized Gain (Loss) | ||||
| Net realized gain (loss) on: | ||||
| Investment Securities: | ||||
| Unaffiliated issuers | 2,741,215 | |||
| Fidelity Central Funds | 33 | |||
| Foreign currency transactions | (1,658) | |||
| Total net realized gain (loss) | 2,739,590 | |||
| Change in net unrealized appreciation (depreciation) on: | ||||
| Investment Securities: | ||||
| Unaffiliated issuers | (8,992,157) | |||
| Assets and liabilities in foreign currencies | 133 | |||
| Total change in net unrealized appreciation (depreciation) | (8,992,024) | |||
| Net gain (loss) | (6,252,434) | |||
| Net increase (decrease) in net assets resulting from operations | $ | (5,765,137) | ||
| Statement of Changes in Net Assets | ||||
Six months ended August 31, 2024 (Unaudited) | Year ended February 29, 2024 | |||
| Increase (Decrease) in Net Assets | ||||
| Operations | ||||
| Net investment income (loss) | $ | 487,297 | $ | 936,094 |
| Net realized gain (loss) | 2,739,590 | 3,177,049 | ||
| Change in net unrealized appreciation (depreciation) | (8,992,024) | 14,599,782 | ||
| Net increase (decrease) in net assets resulting from operations | (5,765,137) | 18,712,925 | ||
| Distributions to shareholders | - | (934,081) | ||
| Share transactions | ||||
| Proceeds from sales of shares | 5,309,024 | 62,471,091 | ||
| Reinvestment of distributions | - | 852,504 | ||
| Cost of shares redeemed | (23,030,227) | (89,040,975) | ||
Net increase (decrease) in net assets resulting from share transactions | (17,721,203) | (25,717,380) | ||
| Total increase (decrease) in net assets | (23,486,340) | (7,938,536) | ||
| Net Assets | ||||
| Beginning of period | 98,540,635 | 106,479,171 | ||
| End of period | $ | 75,054,295 | $ | 98,540,635 |
| Other Information | ||||
| Shares | ||||
| Sold | 98,027 | 1,216,841 | ||
| Issued in reinvestment of distributions | - | 16,302 | ||
| Redeemed | (438,562) | (1,791,277) | ||
| Net increase (decrease) | (340,535) | (558,134) | ||
Automotive Portfolio |
Six months ended (Unaudited) August 31, 2024 | Years ended February 28, 2024 A | 2023 | 2022 | 2021 | 2020 A | |||||||
Selected Per-Share Data | ||||||||||||
| Net asset value, beginning of period | $ | 56.09 | $ | 45.99 | $ | 56.56 | $ | 54.21 | $ | 34.91 | $ | 33.29 |
| Income from Investment Operations | ||||||||||||
Net investment income (loss) B,C | .30 | .41 | .34 D | .23 E | .05 F | .46 G | ||||||
| Net realized and unrealized gain (loss) | (3.40) | 10.14 | (9.86) | 3.82 | 23.73 | 2.67 H | ||||||
| Total from investment operations | (3.10) | 10.55 | (9.52) | 4.05 | 23.78 | 3.13 | ||||||
| Distributions from net investment income | - | (.45) | (.28) | (.29) | (.01) | (.49) I | ||||||
| Distributions from net realized gain | - | - | (.77) | (1.40) | (4.47) | (1.02) I | ||||||
| Total distributions | - | (.45) | (1.05) | (1.70) J | (4.48) | (1.51) | ||||||
| Net asset value, end of period | $ | 52.99 | $ | 56.09 | $ | 45.99 | $ | 56.56 | $ | 54.21 | $ | 34.91 |
Total Return K,L | (5.53) % | 23.02% | (16.92)% | 7.20% | 78.19% | 9.14% H | ||||||
Ratios to Average Net Assets C,M,N | ||||||||||||
| Expenses before reductions | .81% O | .88% | .89% | .80% | .88% | 1.00% | ||||||
| Expenses net of fee waivers, if any | .81 % O | .87% | .88% | .80% | .88% | 1.00% | ||||||
| Expenses net of all reductions | .81% O | .87% | .88% | .80% | .87% | .99% | ||||||
| Net investment income (loss) | 1.15% O | .83% | .73% D | .37% E | .10% F | 1.33% G | ||||||
| Supplemental Data | ||||||||||||
| Net assets, end of period (000 omitted) | $ | 75,054 | $ | 98,541 | $ | 106,479 | $ | 165,176 | $ | 198,225 | $ | 36,480 |
Portfolio turnover rate P | 64 % O | 60% | 54% | 69% | 56% | 45% |
| Common Stocks - 98.9% | |||
| Shares | Value ($) | ||
| Broadline Retail - 5.3% | |||
| Broadline Retail - 5.3% | |||
| Amazon.com, Inc. (a) | 405,200 | 72,328,200 | |
| PDD Holdings, Inc. ADR (a) | 112,300 | 10,793,153 | |
| 83,121,353 | |||
| Consumer Staples Distribution & Retail - 0.0% | |||
| Food Retail - 0.0% | |||
| Maplebear, Inc. (NASDAQ) | 2,700 | 96,903 | |
| Diversified Telecommunication Services - 7.9% | |||
| Alternative Carriers - 3.1% | |||
| GCI Liberty, Inc. Class A (Escrow) (b)(c) | 158,132 | 2 | |
| Liberty Global Ltd. Class C (d) | 1,012,000 | 19,906,040 | |
| Liberty Latin America Ltd. Class C (a)(d) | 3,036,486 | 28,755,522 | |
| 48,661,564 | |||
| Integrated Telecommunication Services - 4.8% | |||
| AT&T, Inc. | 3,754,200 | 74,708,580 | |
TOTAL DIVERSIFIED TELECOMMUNICATION SERVICES | 123,370,144 | ||
| Entertainment - 22.6% | |||
| Interactive Home Entertainment - 4.9% | |||
| Capcom Co. Ltd. | 342,900 | 7,442,518 | |
| Roblox Corp. Class A (a) | 501,400 | 22,056,586 | |
| Sea Ltd. ADR Class A (a) | 246,800 | 19,326,908 | |
| Skillz, Inc. (a)(d) | 1,330 | 7,847 | |
| Take-Two Interactive Software, Inc. (a) | 112,500 | 18,192,375 | |
| Ubisoft Entertainment SA (a) | 539,000 | 10,241,984 | |
| 77,268,218 | |||
| Movies & Entertainment - 17.7% | |||
| Atlanta Braves Holdings, Inc. Class C, (a) | 8,052 | 345,270 | |
| Liberty Media Corp. Liberty Formula One Class A | 505,462 | 35,695,726 | |
| Liberty Media Corp. Liberty Live Series A | 12,132 | 480,427 | |
| Lions Gate Entertainment Corp.: | |||
| Class A (a)(d) | 34,500 | 268,065 | |
| Class B (a) | 819,034 | 5,667,715 | |
| Lionsgate Studios Corp. | 84,400 | 579,828 | |
| Lionsgate Studios Corp. (b) | 199,404 | 1,369,905 | |
| Live Nation Entertainment, Inc. (a) | 52,600 | 5,137,442 | |
| Marcus Corp. (d) | 447,500 | 6,332,125 | |
| Netflix, Inc. (a) | 102,200 | 71,677,970 | |
| Roku, Inc. Class A (a) | 293,800 | 19,910,826 | |
| Spotify Technology SA (a) | 55,600 | 19,064,128 | |
| The Walt Disney Co. | 801,071 | 72,400,797 | |
| TKO Group Holdings, Inc. | 232,700 | 27,512,121 | |
| Warner Music Group Corp. Class A (d) | 335,600 | 9,601,516 | |
| 276,043,861 | |||
TOTAL ENTERTAINMENT | 353,312,079 | ||
| Ground Transportation - 2.5% | |||
| Passenger Ground Transportation - 2.5% | |||
| Uber Technologies, Inc. (a) | 534,900 | 39,117,237 | |
| Interactive Media & Services - 52.5% | |||
| Interactive Media & Services - 52.5% | |||
| Alphabet, Inc. Class A | 2,156,800 | 352,377,984 | |
| Angi, Inc. Class A, (a)(d) | 3,447,200 | 9,307,440 | |
| Bumble, Inc. Class A (a) | 1,161,200 | 7,791,652 | |
| Match Group, Inc. (a) | 435,070 | 16,188,955 | |
| Meta Platforms, Inc. Class A | 743,400 | 387,541,855 | |
| Pinterest, Inc. Class A (a) | 643,300 | 20,611,332 | |
| Reddit, Inc.: | |||
| Class A | 10,700 | 642,321 | |
| Class B (a) | 58,000 | 3,481,740 | |
| Snap, Inc. Class A (a) | 2,414,200 | 22,548,628 | |
| 820,491,907 | |||
| IT Services - 0.0% | |||
| Internet Services & Infrastructure - 0.0% | |||
| X Holdings Corp. Class A (a)(b)(c) | 17,240 | 367,040 | |
| Media - 8.1% | |||
| Advertising - 0.1% | |||
| Ibotta, Inc. (d) | 700 | 40,033 | |
| S4 Capital PLC (a)(d) | 929,800 | 678,935 | |
| 718,968 | |||
| Broadcasting - 0.2% | |||
| Paramount Global Class B (d) | 338,500 | 3,544,095 | |
| Cable & Satellite - 7.8% | |||
| Altice U.S.A., Inc. Class A (a)(d) | 6,329,211 | 11,645,748 | |
| Charter Communications, Inc. Class A (a) | 117,000 | 40,662,180 | |
| Comcast Corp. Class A | 893,500 | 35,355,795 | |
| Liberty Broadband Corp. Class A (a) | 560,923 | 34,356,534 | |
| 122,020,257 | |||
TOTAL MEDIA | 126,283,320 | ||
| Software - 0.0% | |||
| Application Software - 0.0% | |||
| Klaviyo, Inc. Class A (d) | 2,700 | 84,942 | |
| TOTAL COMMON STOCKS (Cost $1,025,286,419) | 1,546,244,925 | ||
| Money Market Funds - 4.2% | |||
| Shares | Value ($) | ||
| Fidelity Cash Central Fund 5.39% (e) | 20,112,780 | 20,116,803 | |
| Fidelity Securities Lending Cash Central Fund 5.39% (e)(f) | 45,875,325 | 45,879,912 | |
| TOTAL MONEY MARKET FUNDS (Cost $65,996,715) | 65,996,715 | ||
| TOTAL INVESTMENT IN SECURITIES - 103.1% (Cost $1,091,283,134) | 1,612,241,640 |
NET OTHER ASSETS (LIABILITIES) - (3.1)% | (48,006,414) |
| NET ASSETS - 100.0% | 1,564,235,226 |
| (a) | Non-income producing |
| (b) | Restricted securities (including private placements) - Investment in securities not registered under the Securities Act of 1933 (excluding 144A issues). At the end of the period, the value of restricted securities (excluding 144A issues) amounted to $1,736,947 or 0.1% of net assets. |
| (c) | Level 3 security |
| (d) | Security or a portion of the security is on loan at period end. |
| (e) | Affiliated fund that is generally available only to investment companies and other accounts managed by Fidelity Investments. The rate quoted is the annualized seven-day yield of the fund at period end. A complete unaudited listing of the fund's holdings as of its most recent quarter end is available upon request. In addition, each Fidelity Central Fund's financial statements are available on the SEC's website or upon request. |
| (f) | Investment made with cash collateral received from securities on loan. |
| Additional information on each restricted holding is as follows: | ||
| Security | Acquisition Date | Acquisition Cost ($) |
| GCI Liberty, Inc. Class A (Escrow) | 5/23/23 | 0 |
| Lionsgate Studios Corp. | 12/22/23 | 1,920,261 |
| X Holdings Corp. Class A | 10/27/21 | 1,266,192 |
| Affiliate | Value, beginning of period ($) | Purchases ($) | Sales Proceeds ($) | Dividend Income ($) | Realized Gain (loss) ($) | Change in Unrealized appreciation (depreciation) ($) | Value, end of period ($) | % ownership, end of period |
| Fidelity Cash Central Fund 5.39% | 52,326,536 | 259,974,376 | 292,188,734 | 365,648 | 4,625 | - | 20,116,803 | 0.0% |
| Fidelity Securities Lending Cash Central Fund 5.39% | 24,398,716 | 164,795,526 | 143,314,330 | 17,221 | - | - | 45,879,912 | 0.2% |
| Total | 76,725,252 | 424,769,902 | 435,503,064 | 382,869 | 4,625 | - | 65,996,715 | |
| Valuation Inputs at Reporting Date: | ||||
| Description | Total ($) | Level 1 ($) | Level 2 ($) | Level 3 ($) |
Investments in Securities: | ||||
| Common Stocks | 1,546,244,925 | 1,545,877,883 | - | 367,042 |
| Money Market Funds | 65,996,715 | 65,996,715 | - | - |
| Total Investments in Securities: | 1,612,241,640 | 1,611,874,598 | - | 367,042 |
| Statement of Assets and Liabilities | ||||
| As of August 31, 2024 (Unaudited) | ||||
| Assets | ||||
| Investment in securities, at value (including securities loaned of $44,481,742) - See accompanying schedule: | ||||
Unaffiliated issuers (cost $1,025,286,419) | $ | 1,546,244,925 | ||
Fidelity Central Funds (cost $65,996,715) | 65,996,715 | |||
| Total Investment in Securities (cost $1,091,283,134) | $ | 1,612,241,640 | ||
| Receivable for fund shares sold | 315,324 | |||
| Dividends receivable | 91,732 | |||
| Distributions receivable from Fidelity Central Funds | 48,308 | |||
| Prepaid expenses | 2,740 | |||
Total assets | 1,612,699,744 | |||
| Liabilities | ||||
| Payable for fund shares redeemed | $ | 1,661,206 | ||
| Accrued management fee | 838,231 | |||
| Distribution and service plan fees payable | 29,063 | |||
| Other payables and accrued expenses | 57,000 | |||
| Collateral on securities loaned | 45,879,018 | |||
| Total liabilities | 48,464,518 | |||
| Net Assets | $ | 1,564,235,226 | ||
| Net Assets consist of: | ||||
| Paid in capital | $ | 1,026,122,666 | ||
| Total accumulated earnings (loss) | 538,112,560 | |||
| Net Assets | $ | 1,564,235,226 | ||
| Net Asset Value and Maximum Offering Price | ||||
| Class A : | ||||
Net Asset Value and redemption price per share ($64,776,445 ÷ 654,711 shares)(a) | $ | 98.94 | ||
| Maximum offering price per share (100/94.25 of $98.94) | $ | 104.98 | ||
| Class M : | ||||
Net Asset Value and redemption price per share ($10,584,855 ÷ 108,258 shares)(a) | $ | 97.77 | ||
| Maximum offering price per share (100/96.50 of $97.77) | $ | 101.32 | ||
| Class C : | ||||
Net Asset Value and offering price per share ($13,707,067 ÷ 144,060 shares)(a) | $ | 95.15 | ||
| Communication Services : | ||||
Net Asset Value, offering price and redemption price per share ($1,333,096,253 ÷ 13,270,321 shares) | $ | 100.46 | ||
| Class I : | ||||
Net Asset Value, offering price and redemption price per share ($59,466,899 ÷ 592,107 shares) | $ | 100.43 | ||
| Class Z : | ||||
Net Asset Value, offering price and redemption price per share ($82,603,707 ÷ 816,865 shares) | $ | 101.12 | ||
(a)Redemption price per share is equal to net asset value less any applicable contingent deferred sales charge. | ||||
| Statement of Operations | ||||
Six months ended August 31, 2024 (Unaudited) | ||||
| Investment Income | ||||
| Dividends | $ | 4,412,379 | ||
| Income from Fidelity Central Funds (including $17,221 from security lending) | 382,869 | |||
| Total income | 4,795,248 | |||
| Expenses | ||||
| Management fee | $ | 5,118,394 | ||
| Distribution and service plan fees | 171,114 | |||
| Custodian fees and expenses | 6,686 | |||
| Independent trustees' fees and expenses | 3,221 | |||
| Registration fees | 68,520 | |||
| Audit fees | 30,929 | |||
| Legal | 372 | |||
| Interest | 25,999 | |||
| Miscellaneous | 31,520 | |||
| Total expenses before reductions | 5,456,755 | |||
| Expense reductions | (30,884) | |||
| Total expenses after reductions | 5,425,871 | |||
| Net Investment income (loss) | (630,623) | |||
| Realized and Unrealized Gain (Loss) | ||||
| Net realized gain (loss) on: | ||||
| Investment Securities: | ||||
| Unaffiliated issuers | 36,479,271 | |||
| Fidelity Central Funds | 4,625 | |||
| Foreign currency transactions | (2,705) | |||
| Total net realized gain (loss) | 36,481,191 | |||
| Change in net unrealized appreciation (depreciation) on: | ||||
| Investment Securities: | ||||
| Unaffiliated issuers | 78,386,111 | |||
| Unfunded commitments | 113,461 | |||
| Total change in net unrealized appreciation (depreciation) | 78,499,572 | |||
| Net gain (loss) | 114,980,763 | |||
| Net increase (decrease) in net assets resulting from operations | $ | 114,350,140 | ||
| Statement of Changes in Net Assets | ||||
Six months ended August 31, 2024 (Unaudited) | Year ended February 29, 2024 | |||
| Increase (Decrease) in Net Assets | ||||
| Operations | ||||
| Net investment income (loss) | $ | (630,623) | $ | (2,769,920) |
| Net realized gain (loss) | 36,481,191 | 84,949,756 | ||
| Change in net unrealized appreciation (depreciation) | 78,499,572 | 369,931,130 | ||
| Net increase (decrease) in net assets resulting from operations | 114,350,140 | 452,110,966 | ||
| Distributions to shareholders | (40,220,650) | - | ||
| Share transactions - net increase (decrease) | (26,141,282) | 302,888,039 | ||
| Total increase (decrease) in net assets | 47,988,208 | 754,999,005 | ||
| Net Assets | ||||
| Beginning of period | 1,516,247,018 | 761,248,013 | ||
| End of period | $ | 1,564,235,226 | $ | 1,516,247,018 |
Fidelity Advisor® Communication Services Fund Class A |
Six months ended (Unaudited) August 31, 2024 | Years ended February 28, 2024 A | 2023 | 2022 | 2021 | 2020 A | |||||||
Selected Per-Share Data | ||||||||||||
| Net asset value, beginning of period | $ | 94.42 | $ | 62.24 | $ | 78.37 | $ | 87.31 | $ | 60.63 | $ | 74.85 |
| Income from Investment Operations | ||||||||||||
Net investment income (loss) B,C | (.17) | (.40) D | (.48) | (.60) | (.59) | (.30) | ||||||
| Net realized and unrealized gain (loss) | 7.28 | 32.58 | (15.65) | (3.18) | 30.37 | 8.77 | ||||||
| Total from investment operations | 7.11 | 32.18 | (16.13) | (3.78) | 29.78 | 8.47 | ||||||
| Distributions from net realized gain | (2.59) | - | - | (5.16) | (3.10) | (22.69) | ||||||
| Total distributions | (2.59) | - | - | (5.16) | (3.10) | (22.69) | ||||||
| Net asset value, end of period | $ | 98.94 | $ | 94.42 | $ | 62.24 | $ | 78.37 | $ | 87.31 | $ | 60.63 |
Total Return E,F,G | 7.64 % | 51.70% | (20.58)% | (5.05)% | 50.81% | 11.90% | ||||||
Ratios to Average Net Assets C,H,I | ||||||||||||
| Expenses before reductions | .97% J | 1.05% | 1.07% | 1.03% | 1.08% | 1.07% | ||||||
| Expenses net of fee waivers, if any | .96 % J | 1.04% | 1.07% | 1.03% | 1.08% | 1.07% | ||||||
| Expenses net of all reductions | .96% J | 1.04% | 1.07% | 1.03% | 1.07% | 1.06% | ||||||
| Net investment income (loss) | (.35)% J | (.51)% D | (.74)% | (.65)% | (.81)% | (.47)% | ||||||
| Supplemental Data | ||||||||||||
| Net assets, end of period (000 omitted) | $ | 64,776 | $ | 56,157 | $ | 24,285 | $ | 33,679 | $ | 22,962 | $ | 9,947 |
Portfolio turnover rate K | 39 % J | 45% L | 45% | 57% | 63% | 73% |
Fidelity Advisor® Communication Services Fund Class M |
Six months ended (Unaudited) August 31, 2024 | Years ended February 28, 2024 A | 2023 | 2022 | 2021 | 2020 A | |||||||
Selected Per-Share Data | ||||||||||||
| Net asset value, beginning of period | $ | 93.45 | $ | 61.75 | $ | 77.94 | $ | 86.94 | $ | 60.52 | $ | 74.82 |
| Income from Investment Operations | ||||||||||||
Net investment income (loss) B,C | (.29) | (.59) D | (.63) | (.82) | (.77) | (.48) | ||||||
| Net realized and unrealized gain (loss) | 7.20 | 32.29 | (15.56) | (3.15) | 30.29 | 8.75 | ||||||
| Total from investment operations | 6.91 | 31.70 | (16.19) | (3.97) | 29.52 | 8.27 | ||||||
| Distributions from net realized gain | (2.59) | - | - | (5.03) | (3.10) | (22.57) | ||||||
| Total distributions | (2.59) | - | - | (5.03) | (3.10) | (22.57) | ||||||
| Net asset value, end of period | $ | 97.77 | $ | 93.45 | $ | 61.75 | $ | 77.94 | $ | 86.94 | $ | 60.52 |
Total Return E,F,G | 7.50 % | 51.34% | (20.77)% | (5.28)% | 50.47% | 11.58% | ||||||
Ratios to Average Net Assets C,H,I | ||||||||||||
| Expenses before reductions | 1.22% J | 1.30% | 1.31% | 1.27% | 1.32% | 1.35% | ||||||
| Expenses net of fee waivers, if any | 1.21 % J | 1.29% | 1.31% | 1.27% | 1.32% | 1.35% | ||||||
| Expenses net of all reductions | 1.21% J | 1.29% | 1.31% | 1.27% | 1.32% | 1.34% | ||||||
| Net investment income (loss) | (.60)% J | (.76)% D | (.98)% | (.88)% | (1.06)% | (.75)% | ||||||
| Supplemental Data | ||||||||||||
| Net assets, end of period (000 omitted) | $ | 10,585 | $ | 9,725 | $ | 3,499 | $ | 5,817 | $ | 5,386 | $ | 2,264 |
Portfolio turnover rate K | 39 % J | 45% L | 45% | 57% | 63% | 73% |
Fidelity Advisor® Communication Services Fund Class C |
Six months ended (Unaudited) August 31, 2024 | Years ended February 28, 2024 A | 2023 | 2022 | 2021 | 2020 A | |||||||
Selected Per-Share Data | ||||||||||||
| Net asset value, beginning of period | $ | 91.23 | $ | 60.57 | $ | 76.81 | $ | 86.05 | $ | 60.20 | $ | 74.76 |
| Income from Investment Operations | ||||||||||||
Net investment income (loss) B,C | (.52) | (.93) D | (.90) | (1.27) | (1.12) | (.81) | ||||||
| Net realized and unrealized gain (loss) | 7.03 | 31.59 | (15.34) | (3.07) | 30.07 | 8.74 | ||||||
| Total from investment operations | 6.51 | 30.66 | (16.24) | (4.34) | 28.95 | 7.93 | ||||||
| Distributions from net realized gain | (2.59) | - | - | (4.90) | (3.10) | (22.49) | ||||||
| Total distributions | (2.59) | - | - | (4.90) | (3.10) | (22.49) | ||||||
| Net asset value, end of period | $ | 95.15 | $ | 91.23 | $ | 60.57 | $ | 76.81 | $ | 86.05 | $ | 60.20 |
Total Return E,F,G | 7.24 % | 50.62% | (21.14)% | (5.76)% | 49.77% | 11.01% | ||||||
Ratios to Average Net Assets C,H,I | ||||||||||||
| Expenses before reductions | 1.72% J | 1.77% | 1.78% | 1.78% | 1.80% | 1.86% | ||||||
| Expenses net of fee waivers, if any | 1.71 % J | 1.77% | 1.78% | 1.78% | 1.80% | 1.86% | ||||||
| Expenses net of all reductions | 1.71% J | 1.77% | 1.78% | 1.78% | 1.79% | 1.85% | ||||||
| Net investment income (loss) | (1.10)% J | (1.24)% D | (1.45)% | (1.39)% | (1.53)% | (1.26)% | ||||||
| Supplemental Data | ||||||||||||
| Net assets, end of period (000 omitted) | $ | 13,707 | $ | 13,074 | $ | 7,478 | $ | 8,938 | $ | 6,856 | $ | 1,982 |
Portfolio turnover rate K | 39 % J | 45% L | 45% | 57% | 63% | 73% |
Communication Services Portfolio |
Six months ended (Unaudited) August 31, 2024 | Years ended February 28, 2024 A | 2023 | 2022 | 2021 | 2020 A | |||||||
Selected Per-Share Data | ||||||||||||
| Net asset value, beginning of period | $ | 95.69 | $ | 62.90 | $ | 78.98 | $ | 87.88 | $ | 60.82 | $ | 74.88 |
| Income from Investment Operations | ||||||||||||
Net investment income (loss) B,C | (.03) | (.18) D | (.30) | (.34) | (.36) | (.12) | ||||||
| Net realized and unrealized gain (loss) | 4.80 | 32.97 | (15.78) | (3.22) | 30.52 | 8.79 | ||||||
| Total from investment operations | 4.77 | 32.79 | (16.08) | (3.56) | 30.16 | 8.67 | ||||||
| Distributions from net realized gain | - | - | - | (5.34) | (3.10) | (22.73) | ||||||
| Total distributions | - | - | - | (5.34) | (3.10) | (22.73) | ||||||
| Net asset value, end of period | $ | 100.46 | $ | 95.69 | $ | 62.90 | $ | 78.98 | $ | 87.88 | $ | 60.82 |
Total Return E,F | 7.80 % | 52.13% | (20.36)% | (4.79)% | 51.29% | 12.22% | ||||||
Ratios to Average Net Assets C,G,H | ||||||||||||
| Expenses before reductions | .67% I | .77% | .80% | .75% | .77% | .78% | ||||||
| Expenses net of fee waivers, if any | .67 % I | .76% | .79% | .74% | .77% | .78% | ||||||
| Expenses net of all reductions | .67% I | .76% | .79% | .74% | .76% | .77% | ||||||
| Net investment income (loss) | (.06)% I | (.23)% D | (.47)% | (.36)% | (.51)% | (.18)% | ||||||
| Supplemental Data | ||||||||||||
| Net assets, end of period (000 omitted) | $ | 1,333,096 | $ | 1,359,432 | $ | 710,710 | $ | 958,304 | $ | 859,871 | $ | 577,157 |
Portfolio turnover rate J | 39 % I | 45% K | 45% | 57% | 63% | 73% |
Fidelity Advisor® Communication Services Fund Class I |
Six months ended (Unaudited) August 31, 2024 | Years ended February 28, 2024 A | 2023 | 2022 | 2021 | 2020 A | |||||||
Selected Per-Share Data | ||||||||||||
| Net asset value, beginning of period | $ | 95.69 | $ | 62.89 | $ | 78.93 | $ | 87.86 | $ | 60.80 | $ | 74.89 |
| Income from Investment Operations | ||||||||||||
Net investment income (loss) B,C | (.05) | (.17) D | (.28) | (.34) | (.39) | (.11) | ||||||
| Net realized and unrealized gain (loss) | 7.38 | 32.97 | (15.76) | (3.22) | 30.55 | 8.78 | ||||||
| Total from investment operations | 7.33 | 32.80 | (16.04) | (3.56) | 30.16 | 8.67 | ||||||
| Distributions from net realized gain | (2.59) | - | - | (5.37) | (3.10) | (22.76) | ||||||
| Total distributions | (2.59) | - | - | (5.37) | (3.10) | (22.76) | ||||||
| Net asset value, end of period | $ | 100.43 | $ | 95.69 | $ | 62.89 | $ | 78.93 | $ | 87.86 | $ | 60.80 |
Total Return E,F | 7.77 % | 52.15% | (20.32)% | (4.79)% | 51.31% | 12.22% | ||||||
Ratios to Average Net Assets C,G,H | ||||||||||||
| Expenses before reductions | .71% I | .76% | .76% | .75% | .78% | .77% | ||||||
| Expenses net of fee waivers, if any | .71 % I | .75% | .75% | .75% | .77% | .77% | ||||||
| Expenses net of all reductions | .71% I | .75% | .75% | .75% | .77% | .76% | ||||||
| Net investment income (loss) | (.09)% I | (.22)% D | (.43)% | (.37)% | (.51)% | (.17)% | ||||||
| Supplemental Data | ||||||||||||
| Net assets, end of period (000 omitted) | $ | 59,467 | $ | 43,534 | $ | 11,961 | $ | 32,089 | $ | 26,521 | $ | 2,493 |
Portfolio turnover rate J | 39 % I | 45% K | 45% | 57% | 63% | 73% |
Fidelity Advisor® Communication Services Fund Class Z |
Six months ended (Unaudited) August 31, 2024 | Years ended February 28, 2024 A | 2023 | 2022 | 2021 | 2020 A | |||||||
Selected Per-Share Data | ||||||||||||
| Net asset value, beginning of period | $ | 96.26 | $ | 63.18 | $ | 79.20 | $ | 88.04 | $ | 60.85 | $ | 74.89 |
| Income from Investment Operations | ||||||||||||
Net investment income (loss) B,C | .02 | (.07) D | (.19) | (.22) | (.28) | (.03) | ||||||
| Net realized and unrealized gain (loss) | 7.43 | 33.15 | (15.83) | (3.23) | 30.57 | 8.80 | ||||||
| Total from investment operations | 7.45 | 33.08 | (16.02) | (3.45) | 30.29 | 8.77 | ||||||
| Distributions from net realized gain | (2.59) | - | - | (5.39) | (3.10) | (22.81) | ||||||
| Total distributions | (2.59) | - | - | (5.39) | (3.10) | (22.81) | ||||||
| Net asset value, end of period | $ | 101.12 | $ | 96.26 | $ | 63.18 | $ | 79.20 | $ | 88.04 | $ | 60.85 |
Total Return E,F | 7.85 % | 52.36% | (20.23)% | (4.65)% | 51.48% | 12.38% | ||||||
Ratios to Average Net Assets C,G,H | ||||||||||||
| Expenses before reductions | .58% I | .62% | .62% | .62% | .64% | .65% | ||||||
| Expenses net of fee waivers, if any | .58 % I | .61% | .62% | .61% | .64% | .65% | ||||||
| Expenses net of all reductions | .58% I | .61% | .62% | .61% | .63% | .64% | ||||||
| Net investment income (loss) | .03% I | (.08)% D | (.29)% | (.23)% | (.38)% | (.05)% | ||||||
| Supplemental Data | ||||||||||||
| Net assets, end of period (000 omitted) | $ | 82,604 | $ | 34,325 | $ | 3,314 | $ | 6,477 | $ | 3,817 | $ | 1,833 |
Portfolio turnover rate J | 39 % I | 45% K | 45% | 57% | 63% | 73% |
| Common Stocks - 99.5% | |||
| Shares | Value ($) | ||
| Building Products - 22.3% | |||
| Building Products - 22.3% | |||
| AAON, Inc. | 77,840 | 7,434,498 | |
| American Woodmark Corp. (a) | 20,780 | 1,862,096 | |
| Apogee Enterprises, Inc. | 37,000 | 2,470,860 | |
| Armstrong World Industries, Inc. | 43,300 | 5,488,708 | |
| Builders FirstSource, Inc. (a) | 110,865 | 19,290,510 | |
| Carlisle Companies, Inc. | 38,440 | 16,290,872 | |
| Carrier Global Corp. | 287,960 | 20,957,729 | |
| Fortune Brands Innovations, Inc. | 139,970 | 11,115,018 | |
| Johnson Controls International PLC | 512,131 | 37,308,743 | |
| Simpson Manufacturing Co. Ltd. | 48,980 | 8,966,279 | |
| The AZEK Co., Inc. Class A, (a) | 210,230 | 8,962,105 | |
| Trane Technologies PLC | 110,940 | 40,122,560 | |
| UFP Industries, Inc. | 13,056 | 1,588,524 | |
| 181,858,502 | |||
| Chemicals - 0.3% | |||
| Specialty Chemicals - 0.3% | |||
| Sherwin-Williams Co. | 6,320 | 2,334,418 | |
| Construction & Engineering - 9.0% | |||
| Construction & Engineering - 9.0% | |||
| AECOM | 122,230 | 12,240,112 | |
| Comfort Systems U.S.A., Inc. | 17,600 | 6,221,952 | |
| EMCOR Group, Inc. | 29,700 | 11,673,882 | |
| Fluor Corp. (a) | 107,040 | 5,359,493 | |
| Quanta Services, Inc. | 78,699 | 21,652,456 | |
| Willscot Holdings Corp. (a) | 417,270 | 16,081,586 | |
| 73,229,481 | |||
| Construction Materials - 8.7% | |||
| Construction Materials - 8.7% | |||
| CRH PLC | 348,920 | 31,671,468 | |
| Eagle Materials, Inc. | 28,910 | 7,451,553 | |
| Martin Marietta Materials, Inc. | 47,120 | 25,169,619 | |
| Vulcan Materials Co. | 26,676 | 6,541,222 | |
| 70,833,862 | |||
| Equity Real Estate Investment Trusts (REITs) - 10.7% | |||
| Multi-Family Residential REITs - 5.9% | |||
| Elme Communities (SBI) | 737,540 | 13,024,956 | |
| Equity Residential (SBI) | 68,300 | 5,114,304 | |
| Essex Property Trust, Inc. | 44,480 | 13,423,619 | |
| Mid-America Apartment Communities, Inc. | 100,790 | 16,365,272 | |
| 47,928,151 | |||
| Single-Family Residential REITs - 4.8% | |||
| Invitation Homes, Inc. | 616,580 | 22,714,807 | |
| Sun Communities, Inc. | 125,950 | 17,033,478 | |
| 39,748,285 | |||
TOTAL EQUITY REAL ESTATE INVESTMENT TRUSTS (REITS) | 87,676,436 | ||
| Ground Transportation - 0.2% | |||
| Cargo Ground Transportation - 0.2% | |||
| U-Haul Holding Co. Class N | 25,900 | 1,770,265 | |
| Household Durables - 14.4% | |||
| Home Furnishings - 1.7% | |||
| Tempur Sealy International, Inc. | 266,850 | 13,990,946 | |
| Homebuilding - 12.6% | |||
| Beazer Homes U.S.A., Inc. (a) | 57,200 | 1,789,216 | |
| Blu Investments LLC (a)(b)(c) | 11,990,913 | 3,717 | |
| D.R. Horton, Inc. | 65,776 | 12,415,878 | |
| KB Home | 91,990 | 7,700,483 | |
| Lennar Corp. Class A | 37,210 | 6,774,453 | |
| Meritage Homes Corp. | 25,500 | 5,050,785 | |
| NVR, Inc. (a) | 1,386 | 12,713,030 | |
| PulteGroup, Inc. | 175,125 | 23,055,206 | |
| Toll Brothers, Inc. | 109,020 | 15,706,511 | |
| TopBuild Corp. (a) | 44,470 | 17,477,599 | |
| 102,686,878 | |||
| Household Appliances - 0.1% | |||
| Whirlpool Corp. (d) | 10,390 | 1,042,013 | |
TOTAL HOUSEHOLD DURABLES | 117,719,837 | ||
| Real Estate Management & Development - 0.3% | |||
| Diversified Real Estate Activities - 0.1% | |||
| The RMR Group, Inc. Class A | 37,460 | 954,855 | |
| Real Estate Services - 0.2% | |||
| Cushman & Wakefield PLC (a) | 107,785 | 1,401,205 | |
TOTAL REAL ESTATE MANAGEMENT & DEVELOPMENT | 2,356,060 | ||
| Specialty Retail - 33.2% | |||
| Home Improvement Retail - 32.2% | |||
| Floor & Decor Holdings, Inc. Class A (a)(d) | 136,170 | 15,310,955 | |
| Lowe's Companies, Inc. | 432,385 | 107,447,673 | |
| The Home Depot, Inc. | 379,190 | 139,731,515 | |
| 262,490,143 | |||
| Homefurnishing Retail - 1.0% | |||
| Williams-Sonoma, Inc. | 62,260 | 8,363,386 | |
TOTAL SPECIALTY RETAIL | 270,853,529 | ||
| Trading Companies & Distributors - 0.4% | |||
| Trading Companies & Distributors - 0.4% | |||
| Watsco, Inc. | 6,500 | 3,090,230 | |
| TOTAL COMMON STOCKS (Cost $464,228,528) | 811,722,620 | ||
| Money Market Funds - 1.2% | |||
| Shares | Value ($) | ||
| Fidelity Cash Central Fund 5.39% (e) | 4,168,043 | 4,168,877 | |
| Fidelity Securities Lending Cash Central Fund 5.39% (e)(f) | 5,349,790 | 5,350,325 | |
| TOTAL MONEY MARKET FUNDS (Cost $9,519,202) | 9,519,202 | ||
| TOTAL INVESTMENT IN SECURITIES - 100.7% (Cost $473,747,730) | 821,241,822 |
NET OTHER ASSETS (LIABILITIES) - (0.7)% | (5,971,080) |
| NET ASSETS - 100.0% | 815,270,742 |
| (a) | Non-income producing |
| (b) | Restricted securities (including private placements) - Investment in securities not registered under the Securities Act of 1933 (excluding 144A issues). At the end of the period, the value of restricted securities (excluding 144A issues) amounted to $3,717 or 0.0% of net assets. |
| (c) | Level 3 security |
| (d) | Security or a portion of the security is on loan at period end. |
| (e) | Affiliated fund that is generally available only to investment companies and other accounts managed by Fidelity Investments. The rate quoted is the annualized seven-day yield of the fund at period end. A complete unaudited listing of the fund's holdings as of its most recent quarter end is available upon request. In addition, each Fidelity Central Fund's financial statements are available on the SEC's website or upon request. |
| (f) | Investment made with cash collateral received from securities on loan. |
| Additional information on each restricted holding is as follows: | ||
| Security | Acquisition Date | Acquisition Cost ($) |
| Blu Investments LLC | 5/21/20 | 20,739 |
| Affiliate | Value, beginning of period ($) | Purchases ($) | Sales Proceeds ($) | Dividend Income ($) | Realized Gain (loss) ($) | Change in Unrealized appreciation (depreciation) ($) | Value, end of period ($) | % ownership, end of period |
| Fidelity Cash Central Fund 5.39% | 5,003,395 | 80,842,743 | 81,677,823 | 107,504 | 562 | - | 4,168,877 | 0.0% |
| Fidelity Securities Lending Cash Central Fund 5.39% | 18,901,475 | 100,465,478 | 114,016,628 | 5,320 | - | - | 5,350,325 | 0.0% |
| Total | 23,904,870 | 181,308,221 | 195,694,451 | 112,824 | 562 | - | 9,519,202 | |
| Valuation Inputs at Reporting Date: | ||||
| Description | Total ($) | Level 1 ($) | Level 2 ($) | Level 3 ($) |
Investments in Securities: | ||||
| Common Stocks | 811,722,620 | 811,718,903 | - | 3,717 |
| Money Market Funds | 9,519,202 | 9,519,202 | - | - |
| Total Investments in Securities: | 821,241,822 | 821,238,105 | - | 3,717 |
| Statement of Assets and Liabilities | ||||
| As of August 31, 2024 (Unaudited) | ||||
| Assets | ||||
| Investment in securities, at value (including securities loaned of $5,283,219) - See accompanying schedule: | ||||
Unaffiliated issuers (cost $464,228,528) | $ | 811,722,620 | ||
Fidelity Central Funds (cost $9,519,202) | 9,519,202 | |||
| Total Investment in Securities (cost $473,747,730) | $ | 821,241,822 | ||
| Receivable for investments sold | 1,281,138 | |||
| Receivable for fund shares sold | 675,675 | |||
| Dividends receivable | 1,089,208 | |||
| Distributions receivable from Fidelity Central Funds | 12,361 | |||
| Prepaid expenses | 1,335 | |||
Total assets | 824,301,539 | |||
| Liabilities | ||||
| Payable for investments purchased | $ | 2,845,900 | ||
| Payable for fund shares redeemed | 357,315 | |||
| Accrued management fee | 435,857 | |||
| Other payables and accrued expenses | 41,400 | |||
| Collateral on securities loaned | 5,350,325 | |||
| Total liabilities | 9,030,797 | |||
| Net Assets | $ | 815,270,742 | ||
| Net Assets consist of: | ||||
| Paid in capital | $ | 448,027,976 | ||
| Total accumulated earnings (loss) | 367,242,766 | |||
| Net Assets | $ | 815,270,742 | ||
Net Asset Value, offering price and redemption price per share ($815,270,742 ÷ 6,553,569 shares) | $ | 124.40 | ||
| Statement of Operations | ||||
Six months ended August 31, 2024 (Unaudited) | ||||
| Investment Income | ||||
| Dividends | $ | 6,422,307 | ||
| Income from Fidelity Central Funds (including $5,320 from security lending) | 112,824 | |||
| Total income | 6,535,131 | |||
| Expenses | ||||
| Management fee | $ | 2,593,960 | ||
| Custodian fees and expenses | 5,532 | |||
| Independent trustees' fees and expenses | 1,581 | |||
| Registration fees | 37,206 | |||
| Audit fees | 20,160 | |||
| Legal | 184 | |||
| Miscellaneous | 18,556 | |||
| Total expenses before reductions | 2,677,179 | |||
| Expense reductions | (14,399) | |||
| Total expenses after reductions | 2,662,780 | |||
| Net Investment income (loss) | 3,872,351 | |||
| Realized and Unrealized Gain (Loss) | ||||
| Net realized gain (loss) on: | ||||
| Investment Securities: | ||||
| Unaffiliated issuers | 17,889,531 | |||
| Fidelity Central Funds | 562 | |||
| Total net realized gain (loss) | 17,890,093 | |||
| Change in net unrealized appreciation (depreciation) on investment securities | 39,617,387 | |||
| Net gain (loss) | 57,507,480 | |||
| Net increase (decrease) in net assets resulting from operations | $ | 61,379,831 | ||
| Statement of Changes in Net Assets | ||||
Six months ended August 31, 2024 (Unaudited) | Year ended February 29, 2024 | |||
| Increase (Decrease) in Net Assets | ||||
| Operations | ||||
| Net investment income (loss) | $ | 3,872,351 | $ | 5,419,345 |
| Net realized gain (loss) | 17,890,093 | 21,744,771 | ||
| Change in net unrealized appreciation (depreciation) | 39,617,387 | 140,302,275 | ||
| Net increase (decrease) in net assets resulting from operations | 61,379,831 | 167,466,391 | ||
| Distributions to shareholders | (7,431,325) | (5,426,559) | ||
| Share transactions | ||||
| Proceeds from sales of shares | 139,060,779 | 282,431,549 | ||
| Reinvestment of distributions | 6,816,021 | 4,899,398 | ||
| Cost of shares redeemed | (126,985,502) | (205,636,762) | ||
Net increase (decrease) in net assets resulting from share transactions | 18,891,298 | 81,694,185 | ||
| Total increase (decrease) in net assets | 72,839,804 | 243,734,017 | ||
| Net Assets | ||||
| Beginning of period | 742,430,938 | 498,696,921 | ||
| End of period | $ | 815,270,742 | $ | 742,430,938 |
| Other Information | ||||
| Shares | ||||
| Sold | 1,186,752 | 2,864,855 | ||
| Issued in reinvestment of distributions | 59,963 | 45,759 | ||
| Redeemed | (1,105,323) | (2,134,851) | ||
| Net increase (decrease) | 141,392 | 775,763 | ||
Construction and Housing Portfolio |
Six months ended (Unaudited) August 31, 2024 | Years ended February 28, 2024 A | 2023 | 2022 | 2021 | 2020 A | |||||||
Selected Per-Share Data | ||||||||||||
| Net asset value, beginning of period | $ | 115.78 | $ | 88.48 | $ | 89.80 | $ | 77.53 | $ | 58.56 | $ | 54.22 |
| Income from Investment Operations | ||||||||||||
Net investment income (loss) B,C | .58 | .90 | .76 | .57 | .59 | .53 | ||||||
| Net realized and unrealized gain (loss) | 9.15 | 27.28 | (1.42) | 17.59 | 21.82 | 8.71 | ||||||
| Total from investment operations | 9.73 | 28.18 | (.66) | 18.16 | 22.41 | 9.24 | ||||||
| Distributions from net investment income | - | (.88) | (.66) | (.53) | (.61) | (.60) | ||||||
| Distributions from net realized gain | (1.11) | - | - | (5.36) | (2.83) | (4.31) | ||||||
| Total distributions | (1.11) | (.88) | (.66) | (5.89) | (3.44) | (4.90) D | ||||||
| Net asset value, end of period | $ | 124.40 | $ | 115.78 | $ | 88.48 | $ | 89.80 | $ | 77.53 | $ | 58.56 |
Total Return E,F | 8.49 % | 31.93% | (.70)% | 22.95% | 41.70% | 17.10% | ||||||
Ratios to Average Net Assets B,G,H | ||||||||||||
| Expenses before reductions | .69% I | .77% | .77% | .75% | .78% | .79% | ||||||
| Expenses net of fee waivers, if any | .69 % I | .76% | .76% | .75% | .78% | .79% | ||||||
| Expenses net of all reductions | .69% I | .76% | .76% | .75% | .77% | .79% | ||||||
| Net investment income (loss) | 1.01% I | .93% | .90% | .60% | .94% | .88% | ||||||
| Supplemental Data | ||||||||||||
| Net assets, end of period (000 omitted) | $ | 815,271 | $ | 742,431 | $ | 498,697 | $ | 713,338 | $ | 343,461 | $ | 318,905 |
Portfolio turnover rate J | 31 % I | 27% | 20% | 70% | 93% | 161% |
| Common Stocks - 99.7% | |||
| Shares | Value ($) | ||
| Automobile Components - 2.7% | |||
| Automotive Parts & Equipment - 2.7% | |||
| Aptiv PLC (a) | 145,420 | 10,401,893 | |
| Magna International, Inc. (b) | 61,720 | 2,594,092 | |
| 12,995,985 | |||
| Automobiles - 11.7% | |||
| Automobile Manufacturers - 11.7% | |||
| General Motors Co. | 165,450 | 8,236,101 | |
| Tesla, Inc. (a) | 220,106 | 47,126,896 | |
| 55,362,997 | |||
| Broadline Retail - 26.0% | |||
| Broadline Retail - 26.0% | |||
| Amazon.com, Inc. (a) | 630,235 | 112,496,947 | |
| Etsy, Inc. (a) | 41,700 | 2,297,253 | |
| MercadoLibre, Inc. (a) | 2,175 | 4,484,111 | |
| Ollie's Bargain Outlet Holdings, Inc. (a) | 35,482 | 3,177,768 | |
| 122,456,079 | |||
| Building Products - 0.8% | |||
| Building Products - 0.8% | |||
| The AZEK Co., Inc. Class A, (a) | 84,926 | 3,620,395 | |
| Commercial Services & Supplies - 0.2% | |||
| Diversified Support Services - 0.2% | |||
| Vestis Corp. | 75,177 | 1,057,740 | |
| Consumer Staples Distribution & Retail - 1.0% | |||
| Consumer Staples Merchandise Retail - 0.4% | |||
| Dollar Tree, Inc. (a) | 23,660 | 1,999,033 | |
| Food Distributors - 0.6% | |||
| Performance Food Group Co. (a) | 34,398 | 2,567,467 | |
TOTAL CONSUMER STAPLES DISTRIBUTION & RETAIL | 4,566,500 | ||
| Food Products - 0.5% | |||
| Packaged Foods & Meats - 0.5% | |||
| Lamb Weston Holdings, Inc. | 36,800 | 2,278,656 | |
| Hotels, Restaurants & Leisure - 19.3% | |||
| Casinos & Gaming - 2.8% | |||
| Caesars Entertainment, Inc. (a) | 77,158 | 2,904,227 | |
| Churchill Downs, Inc. | 27,752 | 3,856,695 | |
| Penn Entertainment, Inc. (a) | 79,174 | 1,474,220 | |
| Red Rock Resorts, Inc. | 87,760 | 5,114,653 | |
| 13,349,795 | |||
| Hotels, Resorts & Cruise Lines - 7.7% | |||
| Booking Holdings, Inc. | 2,484 | 9,710,527 | |
| Hilton Worldwide Holdings, Inc. | 64,061 | 14,070,358 | |
| Marriott International, Inc. Class A | 32,189 | 7,554,436 | |
| Royal Caribbean Cruises Ltd. | 28,440 | 4,681,793 | |
| 36,017,114 | |||
| Restaurants - 8.8% | |||
| Aramark | 70,034 | 2,565,345 | |
| Brinker International, Inc. (a) | 22,610 | 1,617,067 | |
| Chipotle Mexican Grill, Inc. (a) | 141,740 | 7,948,779 | |
| Domino's Pizza, Inc. | 18,744 | 7,763,952 | |
| McDonald's Corp. | 42,535 | 12,278,153 | |
| Restaurant Brands International, Inc. | 61,200 | 4,251,962 | |
| Starbucks Corp. | 54,290 | 5,134,205 | |
| 41,559,463 | |||
TOTAL HOTELS, RESTAURANTS & LEISURE | 90,926,372 | ||
| Household Durables - 5.4% | |||
| Home Furnishings - 2.0% | |||
| Tempur Sealy International, Inc. | 177,967 | 9,330,810 | |
| Homebuilding - 3.4% | |||
| KB Home | 39,470 | 3,304,034 | |
| PulteGroup, Inc. | 51,270 | 6,749,696 | |
| TopBuild Corp. (a) | 15,100 | 5,934,602 | |
| 15,988,332 | |||
TOTAL HOUSEHOLD DURABLES | 25,319,142 | ||
| Specialty Retail - 23.9% | |||
| Apparel Retail - 5.0% | |||
| Aritzia, Inc. (a) | 96,000 | 3,283,939 | |
| Burlington Stores, Inc. (a) | 10,617 | 2,847,904 | |
| TJX Companies, Inc. | 149,797 | 17,566,694 | |
| 23,698,537 | |||
| Automotive Retail - 1.7% | |||
| Advance Auto Parts, Inc. | 18,400 | 833,704 | |
| Group 1 Automotive, Inc. | 8,300 | 3,127,108 | |
| O'Reilly Automotive, Inc. (a) | 3,445 | 3,892,747 | |
| 7,853,559 | |||
| Home Improvement Retail - 11.0% | |||
| Floor & Decor Holdings, Inc. Class A (a)(b) | 59,737 | 6,716,828 | |
| Lowe's Companies, Inc. | 89,171 | 22,158,994 | |
| The Home Depot, Inc. | 61,751 | 22,755,244 | |
| 51,631,066 | |||
| Homefurnishing Retail - 1.5% | |||
| Wayfair LLC Class A (a) | 16,831 | 716,159 | |
| Williams-Sonoma, Inc. | 47,800 | 6,420,974 | |
| 7,137,133 | |||
| Other Specialty Retail - 4.7% | |||
| Academy Sports & Outdoors, Inc. | 101,200 | 5,614,576 | |
| Dick's Sporting Goods, Inc. | 45,877 | 10,871,014 | |
| Five Below, Inc. (a) | 23,800 | 1,795,234 | |
| JD Sports Fashion PLC | 1,115,500 | 2,020,948 | |
| Sally Beauty Holdings, Inc. (a) | 158,149 | 2,063,844 | |
| 22,365,616 | |||
TOTAL SPECIALTY RETAIL | 112,685,911 | ||
| Textiles, Apparel & Luxury Goods - 8.2% | |||
| Apparel, Accessories & Luxury Goods - 3.9% | |||
| Capri Holdings Ltd. (a) | 46,400 | 1,657,408 | |
| lululemon athletica, Inc. (a) | 14,950 | 3,879,077 | |
| LVMH Moet Hennessy Louis Vuitton SE | 2,433 | 1,810,923 | |
| PVH Corp. | 47,608 | 4,698,434 | |
| Tapestry, Inc. | 107,768 | 4,415,255 | |
| VF Corp. (b) | 119,040 | 2,167,718 | |
| 18,628,815 | |||
| Footwear - 4.3% | |||
| Deckers Outdoor Corp. (a) | 7,077 | 6,788,895 | |
| NIKE, Inc. Class B | 127,932 | 10,659,294 | |
| On Holding AG (a)(b) | 26,893 | 1,263,433 | |
| Skechers U.S.A., Inc. Class A (sub. vtg.) (a) | 22,400 | 1,533,952 | |
| 20,245,574 | |||
TOTAL TEXTILES, APPAREL & LUXURY GOODS | 38,874,389 | ||
| TOTAL COMMON STOCKS (Cost $252,516,806) | 470,144,166 | ||
| Money Market Funds - 3.0% | |||
| Shares | Value ($) | ||
| Fidelity Cash Central Fund 5.39% (c) | 1,631,958 | 1,632,284 | |
| Fidelity Securities Lending Cash Central Fund 5.39% (c)(d) | 12,848,679 | 12,849,964 | |
| TOTAL MONEY MARKET FUNDS (Cost $14,482,248) | 14,482,248 | ||
| TOTAL INVESTMENT IN SECURITIES - 102.7% (Cost $266,999,054) | 484,626,414 |
NET OTHER ASSETS (LIABILITIES) - (2.7)% | (12,966,830) |
| NET ASSETS - 100.0% | 471,659,584 |
| (a) | Non-income producing |
| (b) | Security or a portion of the security is on loan at period end. |
| (c) | Affiliated fund that is generally available only to investment companies and other accounts managed by Fidelity Investments. The rate quoted is the annualized seven-day yield of the fund at period end. A complete unaudited listing of the fund's holdings as of its most recent quarter end is available upon request. In addition, each Fidelity Central Fund's financial statements are available on the SEC's website or upon request. |
| (d) | Investment made with cash collateral received from securities on loan. |
| Affiliate | Value, beginning of period ($) | Purchases ($) | Sales Proceeds ($) | Dividend Income ($) | Realized Gain (loss) ($) | Change in Unrealized appreciation (depreciation) ($) | Value, end of period ($) | % ownership, end of period |
| Fidelity Cash Central Fund 5.39% | 626,349 | 45,861,720 | 44,856,149 | 24,174 | 364 | - | 1,632,284 | 0.0% |
| Fidelity Securities Lending Cash Central Fund 5.39% | 12,432,064 | 96,038,500 | 95,620,600 | 5,028 | - | - | 12,849,964 | 0.1% |
| Total | 13,058,413 | 141,900,220 | 140,476,749 | 29,202 | 364 | - | 14,482,248 | |
| Valuation Inputs at Reporting Date: | ||||
| Description | Total ($) | Level 1 ($) | Level 2 ($) | Level 3 ($) |
Investments in Securities: | ||||
| Common Stocks | 470,144,166 | 468,333,243 | 1,810,923 | - |
| Money Market Funds | 14,482,248 | 14,482,248 | - | - |
| Total Investments in Securities: | 484,626,414 | 482,815,491 | 1,810,923 | - |
| Statement of Assets and Liabilities | ||||
| As of August 31, 2024 (Unaudited) | ||||
| Assets | ||||
| Investment in securities, at value (including securities loaned of $12,647,913) - See accompanying schedule: | ||||
Unaffiliated issuers (cost $252,516,806) | $ | 470,144,166 | ||
Fidelity Central Funds (cost $14,482,248) | 14,482,248 | |||
| Total Investment in Securities (cost $266,999,054) | $ | 484,626,414 | ||
| Cash | 44,633 | |||
| Receivable for investments sold | 4,713,752 | |||
| Receivable for fund shares sold | 85,328 | |||
| Dividends receivable | 254,073 | |||
| Distributions receivable from Fidelity Central Funds | 5,621 | |||
| Prepaid expenses | 1,225 | |||
| Other receivables | 14,871 | |||
Total assets | 489,745,917 | |||
| Liabilities | ||||
| Payable for investments purchased | $ | 4,760,947 | ||
| Payable for fund shares redeemed | 189,248 | |||
| Accrued management fee | 255,865 | |||
| Other payables and accrued expenses | 34,598 | |||
| Collateral on securities loaned | 12,845,675 | |||
| Total liabilities | 18,086,333 | |||
| Net Assets | $ | 471,659,584 | ||
| Net Assets consist of: | ||||
| Paid in capital | $ | 222,411,382 | ||
| Total accumulated earnings (loss) | 249,248,202 | |||
| Net Assets | $ | 471,659,584 | ||
Net Asset Value, offering price and redemption price per share ($471,659,584 ÷ 7,645,754 shares) | $ | 61.69 | ||
| Statement of Operations | ||||
Six months ended August 31, 2024 (Unaudited) | ||||
| Investment Income | ||||
| Dividends | $ | 1,921,138 | ||
| Income from Fidelity Central Funds (including $5,028 from security lending) | 29,202 | |||
| Total income | 1,950,340 | |||
| Expenses | ||||
| Management fee | $ | 1,670,735 | ||
| Custodian fees and expenses | 8,514 | |||
| Independent trustees' fees and expenses | 1,088 | |||
| Registration fees | 22,763 | |||
| Audit fees | 21,004 | |||
| Legal | 761 | |||
| Interest | 5,010 | |||
| Miscellaneous | 9,724 | |||
| Total expenses before reductions | 1,739,599 | |||
| Expense reductions | (11,040) | |||
| Total expenses after reductions | 1,728,559 | |||
| Net Investment income (loss) | 221,781 | |||
| Realized and Unrealized Gain (Loss) | ||||
| Net realized gain (loss) on: | ||||
| Investment Securities: | ||||
| Unaffiliated issuers | 32,010,343 | |||
| Fidelity Central Funds | 364 | |||
| Foreign currency transactions | (379) | |||
| Total net realized gain (loss) | 32,010,328 | |||
| Change in net unrealized appreciation (depreciation) on: | ||||
| Investment Securities: | ||||
| Unaffiliated issuers | (29,895,399) | |||
| Assets and liabilities in foreign currencies | (386) | |||
| Total change in net unrealized appreciation (depreciation) | (29,895,785) | |||
| Net gain (loss) | 2,114,543 | |||
| Net increase (decrease) in net assets resulting from operations | $ | 2,336,324 | ||
| Statement of Changes in Net Assets | ||||
Six months ended August 31, 2024 (Unaudited) | Year ended February 29, 2024 | |||
| Increase (Decrease) in Net Assets | ||||
| Operations | ||||
| Net investment income (loss) | $ | 221,781 | $ | 244,258 |
| Net realized gain (loss) | 32,010,328 | 15,874,554 | ||
| Change in net unrealized appreciation (depreciation) | (29,895,785) | 121,150,975 | ||
| Net increase (decrease) in net assets resulting from operations | 2,336,324 | 137,269,787 | ||
| Distributions to shareholders | (6,774,899) | (11,238,228) | ||
| Share transactions | ||||
| Proceeds from sales of shares | 24,931,886 | 143,615,966 | ||
| Reinvestment of distributions | 6,338,179 | 10,508,748 | ||
| Cost of shares redeemed | (110,494,810) | (149,624,716) | ||
Net increase (decrease) in net assets resulting from share transactions | (79,224,745) | 4,499,998 | ||
| Total increase (decrease) in net assets | (83,663,320) | 130,531,557 | ||
| Net Assets | ||||
| Beginning of period | 555,322,904 | 424,791,347 | ||
| End of period | $ | 471,659,584 | $ | 555,322,904 |
| Other Information | ||||
| Shares | ||||
| Sold | 411,514 | 2,643,490 | ||
| Issued in reinvestment of distributions | 107,118 | 199,520 | ||
| Redeemed | (1,829,867) | (2,822,396) | ||
| Net increase (decrease) | (1,311,235) | 20,614 | ||
Consumer Discretionary Portfolio |
Six months ended (Unaudited) August 31, 2024 | Years ended February 28, 2024 A | 2023 | 2022 | 2021 | 2020 A | |||||||
Selected Per-Share Data | ||||||||||||
| Net asset value, beginning of period | $ | 62.00 | $ | 47.54 | $ | 63.23 | $ | 68.01 | $ | 45.58 | $ | 44.31 |
| Income from Investment Operations | ||||||||||||
Net investment income (loss) B,C | .03 | .03 | .01 | (.16) | (.03) | .11 | ||||||
| Net realized and unrealized gain (loss) | .45 | 15.70 | (9.85) | 1.92 | 23.23 | 2.26 | ||||||
| Total from investment operations | .48 | 15.73 | (9.84) | 1.76 | 23.20 | 2.37 | ||||||
| Distributions from net investment income | - | (.02) | (.02) | - | - | (.11) | ||||||
| Distributions from net realized gain | (.79) | (1.25) | (5.83) | (6.54) | (.77) | (.99) | ||||||
| Total distributions | (.79) | (1.27) | (5.85) | (6.54) | (.77) | (1.10) | ||||||
| Net asset value, end of period | $ | 61.69 | $ | 62.00 | $ | 47.54 | $ | 63.23 | $ | 68.01 | $ | 45.58 |
Total Return D,E | .82 % | 33.59% | (16.87)% | 1.88% | 50.96% | 5.30% | ||||||
Ratios to Average Net Assets B,F,G | ||||||||||||
| Expenses before reductions | .70% H | .75% | .76% | .73% | .76% | .76% | ||||||
| Expenses net of fee waivers, if any | .70 % H | .74% | .76% | .73% | .76% | .76% | ||||||
| Expenses net of all reductions | .70% H | .74% | .76% | .73% | .75% | .76% | ||||||
| Net investment income (loss) | .09% H | .05% | .02% | (.22)% | (.06)% | .23% | ||||||
| Supplemental Data | ||||||||||||
| Net assets, end of period (000 omitted) | $ | 471,660 | $ | 555,323 | $ | 424,791 | $ | 418,675 | $ | 583,938 | $ | 402,403 |
Portfolio turnover rate I | 23 % H | 33% | 46% | 38% | 55% | 41% J |
| Common Stocks - 99.8% | |||
| Shares | Value ($) | ||
| Consumer Staples Distribution & Retail - 1.4% | |||
| Food Distributors - 1.4% | |||
| U.S. Foods Holding Corp. (a) | 149,900 | 8,875,579 | |
| Diversified Consumer Services - 1.2% | |||
| Specialized Consumer Services - 1.2% | |||
| European Wax Center, Inc. Class A (a)(b) | 156,600 | 1,080,540 | |
| Service Corp. International (b) | 82,000 | 6,418,140 | |
| 7,498,680 | |||
| Entertainment - 0.6% | |||
| Movies & Entertainment - 0.6% | |||
| TKO Group Holdings, Inc. | 30,800 | 3,641,484 | |
| Financial Services - 0.2% | |||
| Transaction & Payment Processing Services - 0.2% | |||
| Toast, Inc. (a) | 57,000 | 1,417,020 | |
| Food Products - 0.5% | |||
| Packaged Foods & Meats - 0.5% | |||
| Lamb Weston Holdings, Inc. | 52,400 | 3,244,608 | |
| Hotels, Restaurants & Leisure - 94.8% | |||
| Casinos & Gaming - 11.4% | |||
| Caesars Entertainment, Inc. (a) | 265,149 | 9,980,208 | |
| Churchill Downs, Inc. | 94,996 | 13,201,594 | |
| Draftkings Holdings, Inc. Class A (a) | 94,300 | 3,253,350 | |
| Flutter Entertainment PLC (a) | 52,700 | 11,212,167 | |
| Flutter Entertainment PLC (a) | 6,700 | 1,423,147 | |
| Las Vegas Sands Corp. | 317,900 | 12,394,921 | |
| Penn Entertainment, Inc. (a) | 134,800 | 2,509,976 | |
| Red Rock Resorts, Inc. | 245,400 | 14,301,912 | |
| Wynn Resorts Ltd. | 48,300 | 3,713,304 | |
| 71,990,579 | |||
| Hotels, Resorts & Cruise Lines - 36.5% | |||
| Airbnb, Inc. Class A (a) | 255,900 | 30,019,629 | |
| Booking Holdings, Inc. | 17,561 | 68,649,988 | |
| Carnival Corp. (a) | 961,600 | 15,866,400 | |
| Hilton Worldwide Holdings, Inc. | 232,532 | 51,073,328 | |
| Marriott International, Inc. Class A | 156,825 | 36,805,259 | |
| Royal Caribbean Cruises Ltd. | 166,500 | 27,409,230 | |
| Viking Holdings Ltd. | 7,200 | 241,560 | |
| 230,065,394 | |||
| Leisure Facilities - 1.3% | |||
| Planet Fitness, Inc. (a) | 79,044 | 6,419,163 | |
| Vail Resorts, Inc. | 10,082 | 1,831,899 | |
| 8,251,062 | |||
| Restaurants - 45.6% | |||
| Aramark | 331,000 | 12,124,530 | |
| Brinker International, Inc. (a) | 87,900 | 6,286,608 | |
| Chipotle Mexican Grill, Inc. (a) | 544,550 | 30,538,364 | |
| Darden Restaurants, Inc. (b) | 10,500 | 1,660,575 | |
| Domino's Pizza, Inc. | 35,842 | 14,846,115 | |
| Doordash, Inc. (a) | 47,000 | 6,049,370 | |
| Dutch Bros, Inc. Class A (a) | 385,486 | 11,950,066 | |
| First Watch Restaurant Group, Inc. (a)(b) | 135,700 | 2,240,407 | |
| McDonald's Corp. | 353,661 | 102,087,787 | |
| Restaurant Brands International, Inc. | 255,274 | 17,735,543 | |
| Starbucks Corp. | 591,256 | 55,915,080 | |
| Wingstop, Inc. | 6,300 | 2,432,493 | |
| Yum! Brands, Inc. | 175,700 | 23,705,444 | |
| 287,572,382 | |||
TOTAL HOTELS, RESTAURANTS & LEISURE | 597,879,417 | ||
| Leisure Products - 1.1% | |||
| Leisure Products - 1.1% | |||
| BRP, Inc. | 93,000 | 6,744,941 | |
| TOTAL COMMON STOCKS (Cost $370,368,043) | 629,301,729 | ||
| Money Market Funds - 1.6% | |||
| Shares | Value ($) | ||
| Fidelity Cash Central Fund 5.39% (c) | 1,783,690 | 1,784,047 | |
| Fidelity Securities Lending Cash Central Fund 5.39% (c)(d) | 8,130,237 | 8,131,050 | |
| TOTAL MONEY MARKET FUNDS (Cost $9,915,097) | 9,915,097 | ||
| TOTAL INVESTMENT IN SECURITIES - 101.4% (Cost $380,283,140) | 639,216,826 |
NET OTHER ASSETS (LIABILITIES) - (1.4)% | (8,631,206) |
| NET ASSETS - 100.0% | 630,585,620 |
| (a) | Non-income producing |
| (b) | Security or a portion of the security is on loan at period end. |
| (c) | Affiliated fund that is generally available only to investment companies and other accounts managed by Fidelity Investments. The rate quoted is the annualized seven-day yield of the fund at period end. A complete unaudited listing of the fund's holdings as of its most recent quarter end is available upon request. In addition, each Fidelity Central Fund's financial statements are available on the SEC's website or upon request. |
| (d) | Investment made with cash collateral received from securities on loan. |
| Affiliate | Value, beginning of period ($) | Purchases ($) | Sales Proceeds ($) | Dividend Income ($) | Realized Gain (loss) ($) | Change in Unrealized appreciation (depreciation) ($) | Value, end of period ($) | % ownership, end of period |
| Fidelity Cash Central Fund 5.39% | 5,328,603 | 30,339,183 | 33,883,821 | 30,941 | 82 | - | 1,784,047 | 0.0% |
| Fidelity Securities Lending Cash Central Fund 5.39% | 7,464,044 | 173,558,287 | 172,891,281 | 16,923 | - | - | 8,131,050 | 0.0% |
| Total | 12,792,647 | 203,897,470 | 206,775,102 | 47,864 | 82 | - | 9,915,097 | |
| Valuation Inputs at Reporting Date: | ||||
| Description | Total ($) | Level 1 ($) | Level 2 ($) | Level 3 ($) |
Investments in Securities: | ||||
| Common Stocks | 629,301,729 | 629,301,729 | - | - |
| Money Market Funds | 9,915,097 | 9,915,097 | - | - |
| Total Investments in Securities: | 639,216,826 | 639,216,826 | - | - |
| Statement of Assets and Liabilities | ||||
| As of August 31, 2024 (Unaudited) | ||||
| Assets | ||||
| Investment in securities, at value (including securities loaned of $7,895,006) - See accompanying schedule: | ||||
Unaffiliated issuers (cost $370,368,043) | $ | 629,301,729 | ||
Fidelity Central Funds (cost $9,915,097) | 9,915,097 | |||
| Total Investment in Securities (cost $380,283,140) | $ | 639,216,826 | ||
| Foreign currency held at value (cost $540) | 542 | |||
| Receivable for investments sold | 697,574 | |||
| Receivable for fund shares sold | 34,230 | |||
| Dividends receivable | 279,403 | |||
| Distributions receivable from Fidelity Central Funds | 7,987 | |||
| Prepaid expenses | 1,286 | |||
Total assets | 640,237,848 | |||
| Liabilities | ||||
| Payable for investments purchased | $ | 313,096 | ||
| Payable for fund shares redeemed | 829,879 | |||
| Accrued management fee | 341,808 | |||
| Other payables and accrued expenses | 36,395 | |||
| Collateral on securities loaned | 8,131,050 | |||
| Total liabilities | 9,652,228 | |||
| Net Assets | $ | 630,585,620 | ||
| Net Assets consist of: | ||||
| Paid in capital | $ | 347,104,807 | ||
| Total accumulated earnings (loss) | 283,480,813 | |||
| Net Assets | $ | 630,585,620 | ||
Net Asset Value, offering price and redemption price per share ($630,585,620 ÷ 32,201,612 shares) | $ | 19.58 | ||
| Statement of Operations | ||||
Six months ended August 31, 2024 (Unaudited) | ||||
| Investment Income | ||||
| Dividends | $ | 3,185,069 | ||
| Income from Fidelity Central Funds (including $16,923 from security lending) | 47,864 | |||
| Total income | 3,232,933 | |||
| Expenses | ||||
| Management fee | $ | 2,162,439 | ||
| Custodian fees and expenses | 7,314 | |||
| Independent trustees' fees and expenses | 1,380 | |||
| Registration fees | 22,743 | |||
| Audit fees | 20,611 | |||
| Legal | 160 | |||
| Miscellaneous | 11,789 | |||
| Total expenses before reductions | 2,226,436 | |||
| Expense reductions | (13,686) | |||
| Total expenses after reductions | 2,212,750 | |||
| Net Investment income (loss) | 1,020,183 | |||
| Realized and Unrealized Gain (Loss) | ||||
| Net realized gain (loss) on: | ||||
| Investment Securities: | ||||
| Unaffiliated issuers | 27,261,745 | |||
| Fidelity Central Funds | 82 | |||
| Foreign currency transactions | 3,011 | |||
| Total net realized gain (loss) | 27,264,838 | |||
| Change in net unrealized appreciation (depreciation) on: | ||||
| Investment Securities: | ||||
| Unaffiliated issuers | (9,725,397) | |||
| Assets and liabilities in foreign currencies | 258 | |||
| Total change in net unrealized appreciation (depreciation) | (9,725,139) | |||
| Net gain (loss) | 17,539,699 | |||
| Net increase (decrease) in net assets resulting from operations | $ | 18,559,882 | ||
| Statement of Changes in Net Assets | ||||
Six months ended August 31, 2024 (Unaudited) | Year ended February 29, 2024 | |||
| Increase (Decrease) in Net Assets | ||||
| Operations | ||||
| Net investment income (loss) | $ | 1,020,183 | $ | 3,167,060 |
| Net realized gain (loss) | 27,264,838 | 13,485,965 | ||
| Change in net unrealized appreciation (depreciation) | (9,725,139) | 113,946,785 | ||
| Net increase (decrease) in net assets resulting from operations | 18,559,882 | 130,599,810 | ||
| Distributions to shareholders | (8,285,415) | (10,718,757) | ||
| Share transactions | ||||
| Proceeds from sales of shares | 16,650,624 | 132,223,221 | ||
| Reinvestment of distributions | 7,579,347 | 9,852,039 | ||
| Cost of shares redeemed | (80,616,058) | (148,639,749) | ||
Net increase (decrease) in net assets resulting from share transactions | (56,386,087) | (6,564,489) | ||
| Total increase (decrease) in net assets | (46,111,620) | 113,316,564 | ||
| Net Assets | ||||
| Beginning of period | 676,697,240 | 563,380,676 | ||
| End of period | $ | 630,585,620 | $ | 676,697,240 |
| Other Information | ||||
| Shares | ||||
| Sold | 876,316 | 7,794,705 | ||
| Issued in reinvestment of distributions | 405,747 | 558,619 | ||
| Redeemed | (4,243,929) | (8,732,561) | ||
| Net increase (decrease) | (2,961,866) | (379,237) | ||
Leisure Portfolio |
Six months ended (Unaudited) August 31, 2024 | Years ended February 28, 2024 A | 2023 | 2022 | 2021 | 2020 A | |||||||
Selected Per-Share Data | ||||||||||||
| Net asset value, beginning of period | $ | 19.24 | $ | 15.85 | $ | 16.38 | $ | 18.94 | $ | 13.89 | $ | 14.53 |
| Income from Investment Operations | ||||||||||||
Net investment income (loss) B,C | .03 | .09 | .07 | .01 | .07 | .12 | ||||||
| Net realized and unrealized gain (loss) | .55 | 3.60 | (.12) | 1.41 | 5.40 | .25 | ||||||
| Total from investment operations | .58 | 3.69 | (.05) | 1.42 | 5.47 | .37 | ||||||
| Distributions from net investment income | (.03) | (.07) | (.05) | (.02) | (.08) | (.11) | ||||||
| Distributions from net realized gain | (.21) | (.23) | (.42) | (3.96) | (.34) | (.89) | ||||||
| Total distributions | (.24) | (.30) | (.48) D | (3.98) | (.42) | (1.01) D | ||||||
| Net asset value, end of period | $ | 19.58 | $ | 19.24 | $ | 15.85 | $ | 16.38 | $ | 18.94 | $ | 13.89 |
Total Return E,F | 3.09 % | 23.47% | (.22)% | 7.53% | 41.30% | 1.76% | ||||||
Ratios to Average Net Assets C,G,H | ||||||||||||
| Expenses before reductions | .69% I | .73% | .74% | .73% | .77% | .76% | ||||||
| Expenses net of fee waivers, if any | .69 % I | .73% | .74% | .73% | .77% | .75% | ||||||
| Expenses net of all reductions | .69% I | .73% | .74% | .73% | .76% | .75% | ||||||
| Net investment income (loss) | .32% I | .51% | .45% | .05% | .48% | .79% | ||||||
| Supplemental Data | ||||||||||||
| Net assets, end of period (000 omitted) | $ | 630,586 | $ | 676,697 | $ | 563,381 | $ | 646,800 | $ | 653,709 | $ | 431,146 |
Portfolio turnover rate J | 42 % I | 39% | 46% | 79% | 72% | 53% |
| Common Stocks - 99.8% | |||
| Shares | Value ($) | ||
| Automobile Components - 0.3% | |||
| Automotive Parts & Equipment - 0.3% | |||
| Aptiv PLC (a) | 115,000 | 8,225,950 | |
| Broadline Retail - 30.1% | |||
| Broadline Retail - 30.1% | |||
| Amazon.com, Inc. (a) | 4,072,000 | 726,851,999 | |
| Dollarama, Inc. | 92,800 | 9,399,473 | |
| Etsy, Inc. (a) | 755,160 | 41,601,764 | |
| MercadoLibre, Inc. (a) | 22,900 | 47,212,014 | |
| Ollie's Bargain Outlet Holdings, Inc. (a) | 490,007 | 43,885,027 | |
| 868,950,277 | |||
| Consumer Staples Distribution & Retail - 17.7% | |||
| Consumer Staples Merchandise Retail - 14.8% | |||
| BJ's Wholesale Club Holdings, Inc. (a) | 948,900 | 75,874,044 | |
| Costco Wholesale Corp. | 90,000 | 80,314,200 | |
| Dollar Tree, Inc. (a) | 489,000 | 41,315,610 | |
| Target Corp. | 197,600 | 30,355,312 | |
| Walmart, Inc. | 2,560,700 | 197,762,861 | |
| 425,622,027 | |||
| Food Retail - 2.9% | |||
| Albertsons Companies, Inc. | 1,675,200 | 32,867,424 | |
| Alimentation Couche-Tard, Inc. (multi-vtg.) | 498,300 | 28,445,234 | |
| Maplebear, Inc. (NASDAQ) (b) | 223,800 | 8,032,182 | |
| Sprouts Farmers Market LLC (a) | 148,900 | 15,493,045 | |
| 84,837,885 | |||
TOTAL CONSUMER STAPLES DISTRIBUTION & RETAIL | 510,459,912 | ||
| Hotels, Restaurants & Leisure - 0.5% | |||
| Hotels, Resorts & Cruise Lines - 0.5% | |||
| Hilton Worldwide Holdings, Inc. | 67,500 | 14,825,700 | |
| Household Durables - 0.9% | |||
| Household Appliances - 0.9% | |||
| SharkNinja, Inc. | 277,200 | 26,561,304 | |
| Interactive Media & Services - 1.3% | |||
| Interactive Media & Services - 1.3% | |||
| Pinterest, Inc. Class A (a)(b) | 1,163,000 | 37,262,520 | |
| Specialty Retail - 36.5% | |||
| Apparel Retail - 8.8% | |||
| American Eagle Outfitters, Inc. | 643,200 | 13,237,056 | |
| Aritzia, Inc. (a) | 2,165,600 | 74,080,184 | |
| Ross Stores, Inc. | 215,400 | 32,441,394 | |
| TJX Companies, Inc. | 1,143,432 | 134,090,271 | |
| 253,848,905 | |||
| Automotive Retail - 7.3% | |||
| Carvana Co. Class A (a) | 36,700 | 5,527,754 | |
| Lithia Motors, Inc. Class A (sub. vtg.) (b) | 120,100 | 36,159,708 | |
| Murphy U.S.A., Inc. | 78,406 | 40,742,110 | |
| O'Reilly Automotive, Inc. (a) | 94,700 | 107,008,159 | |
| Valvoline, Inc. (a)(b) | 528,700 | 22,311,140 | |
| 211,748,871 | |||
| Home Improvement Retail - 14.1% | |||
| Lowe's Companies, Inc. | 762,000 | 189,357,000 | |
| The Home Depot, Inc. | 587,400 | 216,456,900 | |
| 405,813,900 | |||
| Homefurnishing Retail - 1.1% | |||
| RH (a) | 102,700 | 26,054,990 | |
| Wayfair LLC Class A (a) | 119,781 | 5,096,682 | |
| 31,151,672 | |||
| Other Specialty Retail - 5.2% | |||
| Academy Sports & Outdoors, Inc. | 306,250 | 16,990,750 | |
| Dick's Sporting Goods, Inc. (b) | 289,500 | 68,599,920 | |
| Five Below, Inc. (a) | 450,600 | 33,988,758 | |
| JD Sports Fashion PLC | 16,023,200 | 29,029,189 | |
| 148,608,617 | |||
TOTAL SPECIALTY RETAIL | 1,051,171,965 | ||
| Textiles, Apparel & Luxury Goods - 12.5% | |||
| Apparel, Accessories & Luxury Goods - 5.6% | |||
| adidas AG | 87,100 | 22,337,039 | |
| Capri Holdings Ltd. (a) | 394,700 | 14,098,684 | |
| Gildan Activewear, Inc. | 476,800 | 21,730,461 | |
| LVMH Moet Hennessy Louis Vuitton SE | 40,400 | 30,070,396 | |
| PVH Corp. | 335,800 | 33,140,102 | |
| Tapestry, Inc. | 965,100 | 39,540,147 | |
| 160,916,829 | |||
| Footwear - 6.9% | |||
| Deckers Outdoor Corp. (a) | 80,200 | 76,935,058 | |
| NIKE, Inc. Class B | 1,459,200 | 121,580,544 | |
| 198,515,602 | |||
TOTAL TEXTILES, APPAREL & LUXURY GOODS | 359,432,431 | ||
| TOTAL COMMON STOCKS (Cost $1,431,550,347) | 2,876,890,059 | ||
| Money Market Funds - 0.4% | |||
| Shares | Value ($) | ||
| Fidelity Cash Central Fund 5.39% (c) | 6,395,279 | 6,396,558 | |
| Fidelity Securities Lending Cash Central Fund 5.39% (c)(d) | 6,087,195 | 6,087,804 | |
| TOTAL MONEY MARKET FUNDS (Cost $12,484,362) | 12,484,362 | ||
| TOTAL INVESTMENT IN SECURITIES - 100.2% (Cost $1,444,034,709) | 2,889,374,421 |
NET OTHER ASSETS (LIABILITIES) - (0.2)% | (5,912,490) |
| NET ASSETS - 100.0% | 2,883,461,931 |
| (a) | Non-income producing |
| (b) | Security or a portion of the security is on loan at period end. |
| (c) | Affiliated fund that is generally available only to investment companies and other accounts managed by Fidelity Investments. The rate quoted is the annualized seven-day yield of the fund at period end. A complete unaudited listing of the fund's holdings as of its most recent quarter end is available upon request. In addition, each Fidelity Central Fund's financial statements are available on the SEC's website or upon request. |
| (d) | Investment made with cash collateral received from securities on loan. |
| Affiliate | Value, beginning of period ($) | Purchases ($) | Sales Proceeds ($) | Dividend Income ($) | Realized Gain (loss) ($) | Change in Unrealized appreciation (depreciation) ($) | Value, end of period ($) | % ownership, end of period |
| Fidelity Cash Central Fund 5.39% | 5,903,685 | 259,546,864 | 259,054,623 | 470,559 | 632 | - | 6,396,558 | 0.0% |
| Fidelity Securities Lending Cash Central Fund 5.39% | 51,153,922 | 348,271,757 | 393,337,875 | 26,823 | - | - | 6,087,804 | 0.0% |
| Total | 57,057,607 | 607,818,621 | 652,392,498 | 497,382 | 632 | - | 12,484,362 | |
| Valuation Inputs at Reporting Date: | ||||
| Description | Total ($) | Level 1 ($) | Level 2 ($) | Level 3 ($) |
Investments in Securities: | ||||
| Common Stocks | 2,876,890,059 | 2,846,819,663 | 30,070,396 | - |
| Money Market Funds | 12,484,362 | 12,484,362 | - | - |
| Total Investments in Securities: | 2,889,374,421 | 2,859,304,025 | 30,070,396 | - |
| Statement of Assets and Liabilities | ||||
| As of August 31, 2024 (Unaudited) | ||||
| Assets | ||||
| Investment in securities, at value (including securities loaned of $5,929,831) - See accompanying schedule: | ||||
Unaffiliated issuers (cost $1,431,550,347) | $ | 2,876,890,059 | ||
Fidelity Central Funds (cost $12,484,362) | 12,484,362 | |||
| Total Investment in Securities (cost $1,444,034,709) | $ | 2,889,374,421 | ||
| Receivable for fund shares sold | 255,251 | |||
| Dividends receivable | 2,703,838 | |||
| Distributions receivable from Fidelity Central Funds | 177,405 | |||
| Prepaid expenses | 5,809 | |||
Total assets | 2,892,516,724 | |||
| Liabilities | ||||
| Payable for fund shares redeemed | $ | 1,415,077 | ||
| Accrued management fee | 1,480,360 | |||
| Other payables and accrued expenses | 75,886 | |||
| Collateral on securities loaned | 6,083,470 | |||
| Total liabilities | 9,054,793 | |||
| Net Assets | $ | 2,883,461,931 | ||
| Net Assets consist of: | ||||
| Paid in capital | $ | 1,311,356,031 | ||
| Total accumulated earnings (loss) | 1,572,105,900 | |||
| Net Assets | $ | 2,883,461,931 | ||
Net Asset Value, offering price and redemption price per share ($2,883,461,931 ÷ 146,215,520 shares) | $ | 19.72 | ||
| Statement of Operations | ||||
Six months ended August 31, 2024 (Unaudited) | ||||
| Investment Income | ||||
| Dividends | $ | 13,359,539 | ||
| Interest | 369 | |||
| Income from Fidelity Central Funds (including $26,823 from security lending) | 497,382 | |||
| Total income | 13,857,290 | |||
| Expenses | ||||
| Management fee | $ | 9,384,243 | ||
| Custodian fees and expenses | 19,645 | |||
| Independent trustees' fees and expenses | 6,281 | |||
| Registration fees | 24,794 | |||
| Audit fees | 22,520 | |||
| Legal | 727 | |||
| Interest | 32,297 | |||
| Miscellaneous | 53,491 | |||
| Total expenses before reductions | 9,543,998 | |||
| Expense reductions | (61,280) | |||
| Total expenses after reductions | 9,482,718 | |||
| Net Investment income (loss) | 4,374,572 | |||
| Realized and Unrealized Gain (Loss) | ||||
| Net realized gain (loss) on: | ||||
| Investment Securities: | ||||
| Unaffiliated issuers | 124,440,477 | |||
| Fidelity Central Funds | 632 | |||
| Foreign currency transactions | (11,907) | |||
| Total net realized gain (loss) | 124,429,202 | |||
| Change in net unrealized appreciation (depreciation) on: | ||||
| Investment Securities: | ||||
| Unaffiliated issuers | (89,747,927) | |||
| Assets and liabilities in foreign currencies | 2,130 | |||
| Total change in net unrealized appreciation (depreciation) | (89,745,797) | |||
| Net gain (loss) | 34,683,405 | |||
| Net increase (decrease) in net assets resulting from operations | $ | 39,057,977 | ||
| Statement of Changes in Net Assets | ||||
Six months ended August 31, 2024 (Unaudited) | Year ended February 29, 2024 | |||
| Increase (Decrease) in Net Assets | ||||
| Operations | ||||
| Net investment income (loss) | $ | 4,374,572 | $ | 7,884,589 |
| Net realized gain (loss) | 124,429,202 | 409,111,819 | ||
| Change in net unrealized appreciation (depreciation) | (89,745,797) | 396,248,537 | ||
| Net increase (decrease) in net assets resulting from operations | 39,057,977 | 813,244,945 | ||
| Distributions to shareholders | (191,151,987) | (201,789,393) | ||
| Share transactions | ||||
| Proceeds from sales of shares | 63,254,473 | 128,364,813 | ||
| Reinvestment of distributions | 177,522,761 | 187,029,758 | ||
| Cost of shares redeemed | (283,938,736) | (622,223,066) | ||
Net increase (decrease) in net assets resulting from share transactions | (43,161,502) | (306,828,495) | ||
| Total increase (decrease) in net assets | (195,255,512) | 304,627,057 | ||
| Net Assets | ||||
| Beginning of period | 3,078,717,443 | 2,774,090,386 | ||
| End of period | $ | 2,883,461,931 | $ | 3,078,717,443 |
| Other Information | ||||
| Shares | ||||
| Sold | 3,189,255 | 7,015,849 | ||
| Issued in reinvestment of distributions | 9,299,254 | 10,002,332 | ||
| Redeemed | (14,498,319) | (34,394,310) | ||
| Net increase (decrease) | (2,009,810) | (17,376,129) | ||
Retailing Portfolio |
Six months ended (Unaudited) August 31, 2024 | Years ended February 28, 2024 A | 2023 | 2022 | 2021 | 2020 A | |||||||
Selected Per-Share Data | ||||||||||||
| Net asset value, beginning of period | $ | 20.77 | $ | 16.75 | $ | 19.92 | $ | 23.50 | $ | 15.71 | $ | 15.01 |
| Income from Investment Operations | ||||||||||||
Net investment income (loss) B,C | .03 | .05 | .05 | (.02) | (.01) | .04 | ||||||
| Net realized and unrealized gain (loss) | .22 | 5.36 | (2.76) | .11 | 9.35 | 1.02 | ||||||
| Total from investment operations | .25 | 5.41 | (2.71) | .09 | 9.34 | 1.06 | ||||||
| Distributions from net investment income | - | (.06) | (.06) | - | - | (.05) | ||||||
| Distributions from net realized gain | (1.30) | (1.33) | (.41) | (3.67) | (1.55) | (.31) | ||||||
| Total distributions | (1.30) | (1.39) | (.46) D | (3.67) | (1.55) | (.36) | ||||||
| Net asset value, end of period | $ | 19.72 | $ | 20.77 | $ | 16.75 | $ | 19.92 | $ | 23.50 | $ | 15.71 |
Total Return E,F | 1.43 % | 33.23% | (13.86)% | (1.23)% | 59.90% | 7.02% | ||||||
Ratios to Average Net Assets B,G,H | ||||||||||||
| Expenses before reductions | .65% I | .72% | .72% | .70% | .73% | .74% | ||||||
| Expenses net of fee waivers, if any | .64 % I | .71% | .72% | .70% | .73% | .74% | ||||||
| Expenses net of all reductions | .64% I | .71% | .72% | .70% | .73% | .74% | ||||||
| Net investment income (loss) | .30% I | .28% | .31% | (.07)% | (.07)% | .26% | ||||||
| Supplemental Data | ||||||||||||
| Net assets, end of period (000 omitted) | $ | 2,883,462 | $ | 3,078,717 | $ | 2,774,090 | $ | 3,704,191 | $ | 4,055,939 | $ | 2,698,998 |
Portfolio turnover rate J | 29 % I | 49% | 32% | 33% | 46% | 17% |
| Fidelity Central Fund | Investment Manager | Investment Objective | Investment Practices | Expense RatioA |
| Fidelity Money Market Central Funds | Fidelity Management & Research Company LLC (FMR) | Each fund seeks to obtain a high level of current income consistent with the preservation of capital and liquidity. | Short-term Investments | Less than .005% |
| Tax cost ($) | Gross unrealized appreciation ($) | Gross unrealized depreciation ($) | Net unrealized appreciation (depreciation)($) | |
| Automotive Portfolio | 47,770,313 | 35,706,543 | (2,285,777) | 33,420,766 |
| Communication Services Portfolio | 1,102,142,551 | 606,165,259 | (96,066,170) | 510,099,089 |
| Construction and Housing Portfolio | 476,532,991 | 353,835,439 | (9,126,608) | 344,708,831 |
| Consumer Discretionary Portfolio | 267,787,316 | 229,089,275 | (12,250,177) | 216,839,098 |
| Leisure Portfolio | 383,674,424 | 266,705,136 | (11,162,734) | 255,542,402 |
| Retailing Portfolio | 1,444,317,531 | 1,549,036,445 | (103,979,555) | 1,445,056,890 |
| Short-term ($) | Long-term ($) | Total capital loss carryforward ($) | |
| Automotive Portfolio | (10,193,715) | (100,246) | (10,293,961) |
| Capital losses | Ordinary losses | |
| Communication Services Portfolio | $- | $(2,672) |
| Consumer Discretionary Portfolio | - | (38,541) |
| Leisure Portfolio | (229,130) | - |
| Retailing Portfolio | - | (1,058,220) |
| Purchases ($) | Sales ($) | |
| Automotive Portfolio | 27,088,358 | 44,525,956 |
| Communication Services Portfolio | 303,700,470 | 302,527,232 |
| Construction and Housing Portfolio | 137,158,213 | 119,410,791 |
| Consumer Discretionary Portfolio | 56,974,510 | 140,985,388 |
| Leisure Portfolio | 137,141,247 | 196,704,759 |
| Retailing Portfolio | 423,702,239 | 599,313,861 |
| Shares | Total net realized gain or loss ($) | Total Proceeds ($) | |
| Communication Services Portfolio | 363,454 | 17,676,083 | 29,268,956 |
| Maximum Management Fee Rate % | |
| Automotive Portfolio | .72 |
| Communication Services Portfolio | |
| Class A | .72 |
| Class M | .72 |
| Class C | .71 |
| Communication Services | .71 |
| Class I | .69 |
| Class Z | .56 |
| Construction and Housing Portfolio | .70 |
| Consumer Discretionary Portfolio | .68 |
| Leisure Portfolio | .68 |
| Retailing Portfolio | .68 |
| Total Management Fee Rate % | |
| Automotive Portfolio | .67 |
| Communication Services Portfolio | |
| Class A | .70 |
| Class M | .70 |
| Class C | .70 |
| Communication Services | .65 |
| Class I | .69 |
| Class Z | .56 |
| Construction and Housing Portfolio | .67 |
| Consumer Discretionary Portfolio | .67 |
| Leisure Portfolio | .67 |
| Retailing Portfolio | .64 |
| Distribution Fee | Service Fee | Total Fees ($) | Retained by FDC ($) | |
| Communication Services Portfolio | ||||
| Class A | - % | .25% | 77,079 | - |
| Class M | .25% | .25% | 25,696 | - |
| Class C | .75% | .25% | 68,339 | 12,452 |
| 171,114 | 12,452 |
| Retained by FDC ($) | |
| Communication Services Portfolio | |
| Class A | 15,611 |
| Class M | 867 |
Class C A | 29 |
16,507 | |
| Amount ($) | |
| Automotive Portfolio | 1,011 |
| Communication Services Portfolio | 7,151 |
| Construction and Housing Portfolio | 1,516 |
| Consumer Discretionary Portfolio | 1,199 |
| Leisure Portfolio | 2,544 |
| Retailing Portfolio | 8,692 |
| Borrower or Lender | Average Loan Balance ($) | Weighted Average Interest Rate | Interest Expense ($) | |
| Communication Services Portfolio | Borrower | 23,375,429 | 5.57% | 25,317 |
| Consumer Discretionary Portfolio | Borrower | 6,476,600 | 5.57% | 5,010 |
| Retailing Portfolio | Borrower | 7,346,464 | 5.57% | 31,839 |
| Purchases ($) | Sales ($) | Realized Gain (Loss)($) | |
| Automotive Portfolio | 1,426,634 | 117,842 | 22,567 |
| Communication Services Portfolio | 7,746,583 | 34,577,997 | 3,352,937 |
| Construction and Housing Portfolio | 5,944,403 | 11,216,457 | 644,098 |
| Consumer Discretionary Portfolio | 5,853,088 | 4,819,401 | 1,302,979 |
| Leisure Portfolio | 4,841,394 | 11,922,121 | 1,923,963 |
| Retailing Portfolio | 20,231,053 | 53,286,743 | 4,208,109 |
| Amount ($) | |
| Automotive Portfolio | 82 |
| Communication Services Portfolio | 1,315 |
| Construction and Housing Portfolio | 649 |
| Consumer Discretionary Portfolio | 458 |
| Leisure Portfolio | 578 |
| Retailing Portfolio | 2,615 |
| Total Security Lending Fees Paid to NFS ($) | Security Lending Income From Securities Loaned to NFS ($) | Value of Securities Loaned to NFS at Period End ($) | |
| Automotive Portfolio | 4,788 | - | - |
| Communication Services Portfolio | 1,734 | 49 | - |
| Construction and Housing Portfolio | 554 | 1 | - |
| Consumer Discretionary Portfolio | 524 | - | - |
| Leisure Portfolio | 1,776 | 1 | - |
| Retailing Portfolio | 2,788 | 1 | - |
| Average Loan Balance ($) | Weighted Average Interest Rate | Interest Expense ($) | |
| Communication Services Portfolio | 4,211,000 | 5.83% | 682 |
| Retailing Portfolio | 2,829,000 | 5.83% | 458 |
| Custodian credits ($) | |
| Communication Services Portfolio | 553 |
| Amount ($) | |
| Automotive Portfolio | 1,990 |
| Construction and Housing Portfolio | 14,399 |
| Consumer Discretionary Portfolio | 11,040 |
| Leisure Portfolio | 13,686 |
| Retailing Portfolio | 61,280 |
| Fund-Level Amount ($) | |
| Communication Services Portfolio | 30,331 |
Six months ended August 31, 2024 | Year ended February 29, 2024 | |
| Communication Services Portfolio | ||
| Distributions to shareholders | ||
| Class A | $1,548,051 | $ - |
| Class M | 268,042 | - |
| Class C | 370,566 | - |
| Communication Services | 35,800,577 | - |
| Class I | 1,334,867 | - |
| Class Z | 898,547 | - |
Total | $40,220,650 | $ - |
| Shares | Shares | Dollars | Dollars | |
Six months ended August 31, 2024 | Year ended February 29, 2024 | Six months ended August 31, 2024 | Year ended February 29, 2024 | |
| Communication Services Portfolio | ||||
| Class A | ||||
| Shares sold | 106,035 | 317,300 | $10,340,369 | $24,925,001 |
| Reinvestment of distributions | 16,183 | - | 1,538,667 | - |
| Shares redeemed | (62,258) | (112,735) | (6,023,189) | (8,858,369) |
| Net increase (decrease) | 59,960 | 204,565 | $5,855,847 | $16,066,632 |
| Class M | ||||
| Shares sold | 12,103 | 80,572 | $1,168,726 | $6,303,994 |
| Reinvestment of distributions | 2,845 | - | 267,524 | - |
| Shares redeemed | (10,757) | (33,170) | (1,020,460) | (2,739,823) |
| Net increase (decrease) | 4,191 | 47,402 | $415,790 | $3,564,171 |
| Class C | ||||
| Shares sold | 10,385 | 48,612 | $968,950 | $3,667,088 |
| Reinvestment of distributions | 3,674 | - | 336,861 | - |
| Shares redeemed | (13,302) | (28,772) | (1,250,928) | (2,122,323) |
| Net increase (decrease) | 757 | 19,840 | $54,883 | $1,544,765 |
| Communication Services | ||||
| Shares sold | 1,218,740 | 6,986,402 | $120,942,125 | $562,879,038 |
| Reinvestment of distributions | 344,407 | - | 33,207,701 | - |
| Shares redeemed | (2,499,479) | (4,078,788) | (246,148,280) | (326,562,337) |
| Net increase (decrease) | (936,332) | 2,907,614 | $(91,998,454) | $236,316,701 |
| Class I | ||||
| Shares sold | 194,169 | 398,197 | $19,240,202 | $31,583,310 |
| Reinvestment of distributions | 13,766 | - | 1,327,330 | - |
| Shares redeemed | (70,799) | (133,425) | (6,962,137) | (10,868,462) |
| Net increase (decrease) | 137,136 | 264,772 | $13,605,395 | $20,714,848 |
| Class Z | ||||
| Shares sold | 540,368 | 357,479 | $53,946,722 | $29,101,658 |
| Reinvestment of distributions | 3,601 | - | 349,439 | - |
| Shares redeemed | (83,672) | (53,367) | (8,370,904) | (4,420,736) |
| Net increase (decrease) | 460,297 | 304,112 | $45,925,257 | $24,680,922 |
| A special meeting of shareholders was held on July 16, 2024. The results of votes taken among shareholders on the proposal before them are reported below. Each vote reported represents one dollar of net asset value held on the record date for the meeting. | ||
| Proposal 1 | ||
| To elect a Board of Trustees. | ||
# of Votes | % of Votes | |
| Bettina Doulton | ||
| Affirmative | 50,178,154,296.75 | 92.38 |
| Withheld | 4,136,551,415.53 | 7.62 |
| TOTAL | 54,314,705,712.27 | 100.00 |
| Robert A. Lawrence | ||
| Affirmative | 50,131,321,830.27 | 92.30 |
| Withheld | 4,183,383,882.00 | 7.70 |
| TOTAL | 54,314,705,712.27 | 100.00 |
| Vijay C. Advani | ||
| Affirmative | 50,021,870,319.77 | 92.10 |
| Withheld | 4,292,835,392.50 | 7.90 |
| TOTAL | 54,314,705,712.27 | 100.00 |
| Thomas P. Bostick | ||
| Affirmative | 50,057,248,681.17 | 92.16 |
| Withheld | 4,257,457,031.10 | 7.84 |
| TOTAL | 54,314,705,712.27 | 100.00 |
| Donald F. Donahue | ||
| Affirmative | 49,998,023,290.27 | 92.05 |
| Withheld | 4,316,682,422.00 | 7.95 |
| TOTAL | 54,314,705,712.27 | 100.00 |
| Vicki L. Fuller | ||
| Affirmative | 50,146,578,363.15 | 92.33 |
| Withheld | 4,168,127,349.12 | 7.67 |
| TOTAL | 54,314,705,712.27 | 100.00 |
| Patricia L. Kampling | ||
| Affirmative | 50,227,895,949.71 | 92.48 |
| Withheld | 4,086,809,762.56 | 7.52 |
| TOTAL | 54,314,705,712.27 | 100.00 |
| Thomas A. Kennedy | ||
| Affirmative | 50,080,160,698.34 | 92.20 |
| Withheld | 4,234,545,013.93 | 7.80 |
| TOTAL | 54,314,705,712.27 | 100.00 |
| Oscar Munoz | ||
| Affirmative | 49,879,616,445.58 | 91.83 |
| Withheld | 4,435,089,266.69 | 8.17 |
| TOTAL | 54,314,705,712.27 | 100.00 |
| Karen B. Peetz | ||
| Affirmative | 50,078,105,799.58 | 92.20 |
| Withheld | 4,236,599,912.69 | 7.80 |
| TOTAL | 54,314,705,712.27 | 100.00 |
| David M. Thomas | ||
| Affirmative | 50,013,939,190.36 | 92.08 |
| Withheld | 4,300,766,521.91 | 7.92 |
| TOTAL | 54,314,705,712.27 | 100.00 |
| Susan Tomasky | ||
| Affirmative | 50,109,134,188.50 | 92.26 |
| Withheld | 4,205,571,523.77 | 7.74 |
| TOTAL | 54,314,705,712.27 | 100.00 |
| Michael E. Wiley | ||
| Affirmative | 50,016,526,096.47 | 92.09 |
| Withheld | 4,298,179,615.80 | 7.91 |
| TOTAL | 54,314,705,712.27 | 100.00 |
| Proposal 1 reflects trust-wide proposal and voting results. | ||
 |


Contents
| Common Stocks - 99.8% | |||
| Shares | Value ($) | ||
| Aerospace & Defense - 1.1% | |||
| Aerospace & Defense - 1.1% | |||
| General Electric Co. | 13,810 | 2,411,502 | |
| Woodward, Inc. | 21,350 | 3,557,978 | |
| 5,969,480 | |||
| Automobiles - 9.4% | |||
| Automobile Manufacturers - 9.4% | |||
| Rivian Automotive, Inc. Class A (a)(b) | 256,820 | 3,628,867 | |
| Tesla, Inc. (a) | 227,940 | 48,804,233 | |
| 52,433,100 | |||
| Building Products - 6.0% | |||
| Building Products - 6.0% | |||
| Advanced Drain Systems, Inc. | 15,930 | 2,497,187 | |
| Builders FirstSource, Inc. (a) | 32,040 | 5,574,960 | |
| Fortune Brands Innovations, Inc. | 47,850 | 3,799,769 | |
| The AZEK Co., Inc. Class A, (a) | 100,060 | 4,265,558 | |
| Trane Technologies PLC | 48,080 | 17,388,613 | |
| 33,526,087 | |||
| Chemicals - 9.0% | |||
| Commodity Chemicals - 0.3% | |||
| PureCycle Technologies, Inc. (a)(b) | 225,910 | 1,378,051 | |
| Diversified Chemicals - 0.5% | |||
| The Chemours Co. LLC | 149,670 | 2,909,585 | |
| Industrial Gases - 7.1% | |||
| Linde PLC | 83,100 | 39,742,575 | |
| Specialty Chemicals - 1.1% | |||
| Aspen Aerogels, Inc. (a) | 150,152 | 4,307,861 | |
| Eastman Chemical Co. | 18,610 | 1,905,106 | |
| 6,212,967 | |||
TOTAL CHEMICALS | 50,243,178 | ||
| Commercial Services & Supplies - 5.1% | |||
| Environmental & Facilities Services - 5.1% | |||
| Clean Harbors, Inc. (a) | 18,190 | 4,472,921 | |
| Republic Services, Inc. | 85,370 | 17,774,888 | |
| Tetra Tech, Inc. | 22,600 | 5,372,924 | |
| Veralto Corp. | 8,416 | 946,211 | |
| 28,566,944 | |||
| Communications Equipment - 2.8% | |||
| Communications Equipment - 2.8% | |||
| Arista Networks, Inc. (a) | 44,300 | 15,654,734 | |
| Construction & Engineering - 1.8% | |||
| Construction & Engineering - 1.8% | |||
| AECOM | 48,610 | 4,867,805 | |
| Quanta Services, Inc. | 19,680 | 5,414,558 | |
| 10,282,363 | |||
| Containers & Packaging - 1.7% | |||
| Metal, Glass & Plastic Containers - 1.7% | |||
| Ball Corp. | 152,350 | 9,721,454 | |
| Electric Utilities - 4.4% | |||
| Electric Utilities - 4.4% | |||
| Kansai Electric Power Co., Inc. | 257,130 | 4,546,693 | |
| PG&E Corp. | 625,560 | 12,323,532 | |
| Southern Co. | 90,620 | 7,829,568 | |
| 24,699,793 | |||
| Electrical Equipment - 8.0% | |||
| Electrical Components & Equipment - 6.1% | |||
| Array Technologies, Inc. (a) | 138,450 | 929,000 | |
| Eaton Corp. PLC | 68,200 | 20,932,626 | |
| Fluence Energy, Inc. Class A (a)(b) | 97,980 | 1,799,893 | |
| Nextracker, Inc. Class A (a) | 70,340 | 2,860,728 | |
| Sungrow Power Supply Co. Ltd. (A Shares) | 54,880 | 595,954 | |
| Sunrun, Inc. (a)(b) | 176,890 | 3,629,783 | |
| Vertiv Holdings Co. | 38,820 | 3,223,225 | |
| 33,971,209 | |||
| Heavy Electrical Equipment - 1.9% | |||
| Bloom Energy Corp. Class A (a)(b) | 98,140 | 1,168,847 | |
| GE Vernova LLC | 24,990 | 5,022,990 | |
| Vestas Wind Systems A/S (a) | 194,740 | 4,449,416 | |
| 10,641,253 | |||
TOTAL ELECTRICAL EQUIPMENT | 44,612,462 | ||
| Electronic Equipment, Instruments & Components - 0.9% | |||
| Electronic Components - 0.9% | |||
| Coherent Corp. (a) | 64,160 | 5,001,272 | |
| Energy Equipment & Services - 0.9% | |||
| Oil & Gas Equipment & Services - 0.9% | |||
| Baker Hughes Co. Class A | 138,630 | 4,875,617 | |
| Equity Real Estate Investment Trusts (REITs) - 4.3% | |||
| Industrial REITs - 4.3% | |||
| Prologis, Inc. | 185,980 | 23,771,964 | |
| Ground Transportation - 4.7% | |||
| Rail Transportation - 4.7% | |||
| Union Pacific Corp. | 101,710 | 26,046,914 | |
| Household Durables - 1.5% | |||
| Homebuilding - 1.5% | |||
| KB Home | 23,530 | 1,969,696 | |
| TopBuild Corp. (a) | 15,650 | 6,150,763 | |
| 8,120,459 | |||
| Independent Power and Renewable Electricity Producers - 2.9% | |||
| Independent Power Producers & Energy Traders - 1.9% | |||
| RWE AG | 83,410 | 3,008,532 | |
| The AES Corp. | 254,780 | 4,364,381 | |
| Vistra Corp. | 36,570 | 3,124,175 | |
| 10,497,088 | |||
| Renewable Electricity - 1.0% | |||
| Sunnova Energy International, Inc. (a)(b) | 526,440 | 5,848,748 | |
TOTAL INDEPENDENT POWER AND RENEWABLE ELECTRICITY PRODUCERS | 16,345,836 | ||
| IT Services - 6.8% | |||
| IT Consulting & Other Services - 6.8% | |||
| Amdocs Ltd. | 59,450 | 5,170,367 | |
| IBM Corp. | 162,620 | 32,870,381 | |
| 38,040,748 | |||
| Life Sciences Tools & Services - 2.6% | |||
| Life Sciences Tools & Services - 2.6% | |||
| Agilent Technologies, Inc. | 20,180 | 2,884,126 | |
| Danaher Corp. | 42,320 | 11,397,199 | |
| 14,281,325 | |||
| Machinery - 4.4% | |||
| Agricultural & Farm Machinery - 0.6% | |||
| Deere & Co. | 9,290 | 3,583,525 | |
| Construction Machinery & Heavy Transportation Equipment - 2.7% | |||
| Cummins, Inc. | 40,482 | 12,664,794 | |
| Westinghouse Air Brake Tech Co. | 12,570 | 2,131,495 | |
| 14,796,289 | |||
| Industrial Machinery & Supplies & Components - 1.1% | |||
| Parker Hannifin Corp. | 9,930 | 5,959,986 | |
TOTAL MACHINERY | 24,339,800 | ||
| Metals & Mining - 1.1% | |||
| Steel - 1.1% | |||
| ATI, Inc. (a) | 48,440 | 3,094,347 | |
| Carpenter Technology Corp. | 11,560 | 1,673,541 | |
| Commercial Metals Co. | 28,470 | 1,525,707 | |
| 6,293,595 | |||
| Oil, Gas & Consumable Fuels - 0.3% | |||
| Coal & Consumable Fuels - 0.3% | |||
| Cameco Corp. | 37,900 | 1,547,836 | |
| Professional Services - 1.4% | |||
| Research & Consulting Services - 1.4% | |||
| KBR, Inc. | 111,400 | 7,726,704 | |
| Semiconductors & Semiconductor Equipment - 7.9% | |||
| Semiconductor Materials & Equipment - 1.4% | |||
| AEHR Test Systems (a)(b) | 90,900 | 1,382,589 | |
| Enphase Energy, Inc. (a) | 40,460 | 4,897,278 | |
| SolarEdge Technologies, Inc. (a)(b) | 58,040 | 1,412,113 | |
| 7,691,980 | |||
| Semiconductors - 6.5% | |||
| Allegro MicroSystems LLC (a) | 59,900 | 1,469,347 | |
| First Solar, Inc. (a) | 41,020 | 9,326,717 | |
| NXP Semiconductors NV | 51,390 | 13,174,340 | |
| ON Semiconductor Corp. (a) | 76,550 | 5,960,949 | |
| Universal Display Corp. | 29,420 | 5,699,242 | |
| Wolfspeed, Inc. (a)(b) | 55,350 | 539,663 | |
| 36,170,258 | |||
TOTAL SEMICONDUCTORS & SEMICONDUCTOR EQUIPMENT | 43,862,238 | ||
| Software - 10.8% | |||
| Systems Software - 10.8% | |||
| Microsoft Corp. | 143,560 | 59,884,615 | |
| TOTAL COMMON STOCKS (Cost $386,779,484) | 555,848,518 | ||
| Convertible Preferred Stocks - 0.0% | |||
| Shares | Value ($) | ||
| Electronic Equipment, Instruments & Components - 0.0% | |||
| Electronic Components - 0.0% | |||
CelLink Corp. Series D (a)(c)(d) (Cost $295,699) | 14,200 | 96,702 | |
| Money Market Funds - 3.4% | |||
| Shares | Value ($) | ||
Fidelity Securities Lending Cash Central Fund 5.39% (e)(f) (Cost $18,630,600) | 18,628,737 | 18,630,600 | |
| TOTAL INVESTMENT IN SECURITIES - 103.2% (Cost $405,705,783) | 574,575,820 |
NET OTHER ASSETS (LIABILITIES) - (3.2)% | (17,656,146) |
| NET ASSETS - 100.0% | 556,919,674 |
| (a) | Non-income producing |
| (b) | Security or a portion of the security is on loan at period end. |
| (c) | Restricted securities (including private placements) - Investment in securities not registered under the Securities Act of 1933 (excluding 144A issues). At the end of the period, the value of restricted securities (excluding 144A issues) amounted to $96,702 or 0.0% of net assets. |
| (d) | Level 3 security |
| (e) | Affiliated fund that is generally available only to investment companies and other accounts managed by Fidelity Investments. The rate quoted is the annualized seven-day yield of the fund at period end. A complete unaudited listing of the fund's holdings as of its most recent quarter end is available upon request. In addition, each Fidelity Central Fund's financial statements are available on the SEC's website or upon request. |
| (f) | Investment made with cash collateral received from securities on loan. |
| Additional information on each restricted holding is as follows: | ||
| Security | Acquisition Date | Acquisition Cost ($) |
| CelLink Corp. Series D | 1/20/22 | 295,699 |
| Affiliate | Value, beginning of period ($) | Purchases ($) | Sales Proceeds ($) | Dividend Income ($) | Realized Gain (loss) ($) | Change in Unrealized appreciation (depreciation) ($) | Value, end of period ($) | % ownership, end of period |
| Fidelity Cash Central Fund 5.39% | 144,254 | 42,307,169 | 42,451,170 | 28,743 | (253) | - | - | 0.0% |
| Fidelity Securities Lending Cash Central Fund 5.39% | 8,819,875 | 64,747,571 | 54,936,846 | 107,711 | - | - | 18,630,600 | 0.1% |
| Total | 8,964,129 | 107,054,740 | 97,388,016 | 136,454 | (253) | - | 18,630,600 | |
| Valuation Inputs at Reporting Date: | ||||
| Description | Total ($) | Level 1 ($) | Level 2 ($) | Level 3 ($) |
Investments in Securities: | ||||
| Common Stocks | 555,848,518 | 551,399,102 | 4,449,416 | - |
| Convertible Preferred Stocks | 96,702 | - | - | 96,702 |
| Money Market Funds | 18,630,600 | 18,630,600 | - | - |
| Total Investments in Securities: | 574,575,820 | 570,029,702 | 4,449,416 | 96,702 |
| Statement of Assets and Liabilities | ||||
| As of August 31, 2024 (Unaudited) | ||||
| Assets | ||||
| Investment in securities, at value (including securities loaned of $18,348,673) - See accompanying schedule: | ||||
Unaffiliated issuers (cost $387,075,183) | $ | 555,945,220 | ||
Fidelity Central Funds (cost $18,630,600) | 18,630,600 | |||
| Total Investment in Securities (cost $405,705,783) | $ | 574,575,820 | ||
| Foreign currency held at value (cost $5,478) | 5,438 | |||
| Receivable for investments sold | 576,217 | |||
| Receivable for fund shares sold | 160,312 | |||
| Dividends receivable | 854,215 | |||
| Distributions receivable from Fidelity Central Funds | 12,720 | |||
| Prepaid expenses | 927 | |||
Total assets | 576,185,649 | |||
| Liabilities | ||||
| Payable to custodian bank | $ | 66,124 | ||
| Payable for fund shares redeemed | 227,877 | |||
| Accrued management fee | 300,574 | |||
| Other payables and accrued expenses | 40,800 | |||
| Collateral on securities loaned | 18,630,600 | |||
| Total liabilities | 19,265,975 | |||
| Net Assets | $ | 556,919,674 | ||
| Net Assets consist of: | ||||
| Paid in capital | $ | 473,208,869 | ||
| Total accumulated earnings (loss) | 83,710,805 | |||
| Net Assets | $ | 556,919,674 | ||
Net Asset Value, offering price and redemption price per share ($556,919,674 ÷ 14,617,563 shares) | $ | 38.10 | ||
| Statement of Operations | ||||
Six months ended August 31, 2024 (Unaudited) | ||||
| Investment Income | ||||
| Dividends | $ | 3,228,518 | ||
| Income from Fidelity Central Funds (including $107,711 from security lending) | 136,454 | |||
| Total income | 3,364,972 | |||
| Expenses | ||||
| Management fee | $ | 1,799,003 | ||
| Custodian fees and expenses | 8,356 | |||
| Independent trustees' fees and expenses | 1,112 | |||
| Registration fees | 22,805 | |||
| Audit fees | 33,024 | |||
| Legal | 889 | |||
| Miscellaneous | 16,987 | |||
| Total expenses before reductions | 1,882,176 | |||
| Expense reductions | (10,568) | |||
| Total expenses after reductions | 1,871,608 | |||
| Net Investment income (loss) | 1,493,364 | |||
| Realized and Unrealized Gain (Loss) | ||||
| Net realized gain (loss) on: | ||||
| Investment Securities: | ||||
| Unaffiliated issuers | 30,096,267 | |||
| Fidelity Central Funds | (253) | |||
| Foreign currency transactions | (5,431) | |||
| Total net realized gain (loss) | 30,090,583 | |||
| Change in net unrealized appreciation (depreciation) on: | ||||
| Investment Securities: | ||||
| Unaffiliated issuers | 22,155,356 | |||
| Assets and liabilities in foreign currencies | 3,556 | |||
| Total change in net unrealized appreciation (depreciation) | 22,158,912 | |||
| Net gain (loss) | 52,249,495 | |||
| Net increase (decrease) in net assets resulting from operations | $ | 53,742,859 | ||
| Statement of Changes in Net Assets | ||||
Six months ended August 31, 2024 (Unaudited) | Year ended February 29, 2024 | |||
| Increase (Decrease) in Net Assets | ||||
| Operations | ||||
| Net investment income (loss) | $ | 1,493,364 | $ | 2,913,215 |
| Net realized gain (loss) | 30,090,583 | 12,126,714 | ||
| Change in net unrealized appreciation (depreciation) | 22,158,912 | 91,351,520 | ||
| Net increase (decrease) in net assets resulting from operations | 53,742,859 | 106,391,449 | ||
| Distributions to shareholders | (150,494) | (2,019,768) | ||
| Share transactions | ||||
| Proceeds from sales of shares | 42,792,010 | 82,337,401 | ||
| Reinvestment of distributions | 139,009 | 1,855,046 | ||
| Cost of shares redeemed | (63,380,261) | (137,391,407) | ||
Net increase (decrease) in net assets resulting from share transactions | (20,449,242) | (53,198,960) | ||
| Total increase (decrease) in net assets | 33,143,123 | 51,172,721 | ||
| Net Assets | ||||
| Beginning of period | 523,776,551 | 472,603,830 | ||
| End of period | $ | 556,919,674 | $ | 523,776,551 |
| Other Information | ||||
| Shares | ||||
| Sold | 1,190,273 | 2,685,092 | ||
| Issued in reinvestment of distributions | 4,028 | 56,695 | ||
| Redeemed | (1,772,781) | (4,514,624) | ||
| Net increase (decrease) | (578,480) | (1,772,837) | ||
Fidelity® Environment and Alternative Energy Fund |
Six months ended (Unaudited) August 31, 2024 | Years ended February 28, 2024 A | 2023 | 2022 | 2021 | 2020 A | |||||||
Selected Per-Share Data | ||||||||||||
| Net asset value, beginning of period | $ | 34.47 | $ | 27.85 | $ | 30.97 | $ | 30.16 | $ | 23.80 | $ | 24.92 |
| Income from Investment Operations | ||||||||||||
Net investment income (loss) B,C | .10 | .18 | .15 | .11 | .24 | .27 | ||||||
| Net realized and unrealized gain (loss) | 3.54 | 6.57 | (3.09) | 3.46 | 8.02 | (.81) | ||||||
| Total from investment operations | 3.64 | 6.75 | (2.94) | 3.57 | 8.26 | (.54) | ||||||
| Distributions from net investment income | (.01) | (.13) | (.18) | (.10) | (.26) | (.23) | ||||||
| Distributions from net realized gain | - | - | - | (2.66) | (1.64) | (.35) | ||||||
| Total distributions | (.01) | (.13) | (.18) | (2.76) | (1.90) | (.58) | ||||||
| Net asset value, end of period | $ | 38.10 | $ | 34.47 | $ | 27.85 | $ | 30.97 | $ | 30.16 | $ | 23.80 |
Total Return D,E | 10.56 % | 24.26% | (9.46)% | 11.02% | 38.97% | (2.35)% | ||||||
Ratios to Average Net Assets C,F,G | ||||||||||||
| Expenses before reductions | .70% H | .81% | .79% | .79% | .85% | .85% | ||||||
| Expenses net of fee waivers, if any | .70 % H | .80% | .79% | .79% | .85% | .85% | ||||||
| Expenses net of all reductions | .70% H | .80% | .79% | .79% | .85% | .85% | ||||||
| Net investment income (loss) | .56% H | .60% | .52% | .33% | .95% | 1.08% | ||||||
| Supplemental Data | ||||||||||||
| Net assets, end of period (000 omitted) | $ | 556,920 | $ | 523,777 | $ | 472,604 | $ | 755,742 | $ | 373,982 | $ | 181,456 |
Portfolio turnover rate I | 36 % H | 35% | 34% | 89% | 28% | 49% |
| Common Stocks - 99.3% | |||
| Shares | Value ($) | ||
| Containers & Packaging - 6.3% | |||
| Metal, Glass & Plastic Containers - 3.9% | |||
| Aptargroup, Inc. | 73,400 | 11,244,146 | |
| Crown Holdings, Inc. | 89,500 | 8,091,695 | |
| Greif, Inc. Class A | 92,000 | 5,751,840 | |
| 25,087,681 | |||
| Paper & Plastic Packaging Products & Materials - 2.4% | |||
| Avery Dennison Corp. | 54,100 | 12,002,085 | |
| International Paper Co. | 75,000 | 3,631,500 | |
| 15,633,585 | |||
TOTAL CONTAINERS & PACKAGING | 40,721,266 | ||
| Energy Equipment & Services - 4.9% | |||
| Oil & Gas Equipment & Services - 4.9% | |||
| Expro Group Holdings NV (a) | 470,000 | 9,334,200 | |
| TechnipFMC PLC | 425,100 | 11,409,684 | |
| Weatherford International PLC | 104,264 | 10,941,464 | |
| 31,685,348 | |||
| Metals & Mining - 18.0% | |||
| Copper - 5.5% | |||
| Capstone Copper Corp. (a) | 307,400 | 2,205,734 | |
| First Quantum Minerals Ltd. | 1,266,700 | 15,950,654 | |
| Freeport-McMoRan, Inc. | 399,800 | 17,703,144 | |
| 35,859,532 | |||
| Diversified Metals & Mining - 4.2% | |||
| Altius Minerals Corp. | 124,200 | 2,239,498 | |
| Ivanhoe Mines Ltd. (a)(b) | 1,092,300 | 14,565,081 | |
| Teck Resources Ltd. Class B | 217,000 | 10,394,300 | |
| 27,198,879 | |||
| Gold - 7.4% | |||
| Agnico Eagle Mines Ltd. (United States) | 211,000 | 17,190,170 | |
| Alamos Gold, Inc. Class A | 208,600 | 4,021,808 | |
| Franco-Nevada Corp. | 75,900 | 9,268,062 | |
| Newmont Corp. | 138,000 | 7,367,820 | |
| Wheaton Precious Metals Corp. | 169,350 | 10,467,524 | |
| 48,315,384 | |||
| Silver - 0.9% | |||
| Hecla Mining Co. | 942,700 | 5,590,211 | |
TOTAL METALS & MINING | 116,964,006 | ||
| Oil, Gas & Consumable Fuels - 70.1% | |||
| Integrated Oil & Gas - 44.4% | |||
| Exxon Mobil Corp. | 1,237,259 | 145,922,327 | |
| Galp Energia SGPS SA | 1,493,600 | 30,973,237 | |
| Imperial Oil Ltd. (b) | 756,800 | 56,999,369 | |
| Shell PLC ADR | 750,300 | 53,766,498 | |
| 287,661,431 | |||
| Oil & Gas Exploration & Production - 15.0% | |||
| Africa Oil Corp. | 7,982,100 | 12,201,333 | |
| Athabasca Oil Corp. (a) | 5,056,500 | 20,336,311 | |
| Greenfire Resources Ltd. | 400,400 | 2,958,956 | |
| Hess Corp. | 116,400 | 16,070,184 | |
| Kosmos Energy Ltd. (a)(b) | 1,509,000 | 7,348,830 | |
| MEG Energy Corp. | 1,828,539 | 36,417,458 | |
| Sintana Energy, Inc. (a) | 2,685,800 | 2,212,175 | |
| 97,545,247 | |||
| Oil & Gas Refining & Marketing - 8.9% | |||
| PBF Energy, Inc. Class A | 125,200 | 4,264,312 | |
| Phillips 66 Co. | 155,016 | 21,750,295 | |
| Valero Energy Corp. | 214,500 | 31,473,585 | |
| 57,488,192 | |||
| Oil & Gas Storage & Transportation - 1.8% | |||
| Cheniere Energy, Inc. | 26,600 | 4,927,916 | |
| Energy Transfer LP | 428,900 | 6,905,290 | |
| 11,833,206 | |||
TOTAL OIL, GAS & CONSUMABLE FUELS | 454,528,076 | ||
| TOTAL COMMON STOCKS (Cost $428,287,320) | 643,898,696 | ||
| Money Market Funds - 4.1% | |||
| Shares | Value ($) | ||
| Fidelity Cash Central Fund 5.39% (c) | 2,391,518 | 2,391,997 | |
| Fidelity Securities Lending Cash Central Fund 5.39% (c)(d) | 24,263,719 | 24,266,145 | |
| TOTAL MONEY MARKET FUNDS (Cost $26,658,142) | 26,658,142 | ||
| TOTAL INVESTMENT IN SECURITIES - 103.4% (Cost $454,945,462) | 670,556,838 |
NET OTHER ASSETS (LIABILITIES) - (3.4)% | (22,330,034) |
| NET ASSETS - 100.0% | 648,226,804 |
| (a) | Non-income producing |
| (b) | Security or a portion of the security is on loan at period end. |
| (c) | Affiliated fund that is generally available only to investment companies and other accounts managed by Fidelity Investments. The rate quoted is the annualized seven-day yield of the fund at period end. A complete unaudited listing of the fund's holdings as of its most recent quarter end is available upon request. In addition, each Fidelity Central Fund's financial statements are available on the SEC's website or upon request. |
| (d) | Investment made with cash collateral received from securities on loan. |
| Affiliate | Value, beginning of period ($) | Purchases ($) | Sales Proceeds ($) | Dividend Income ($) | Realized Gain (loss) ($) | Change in Unrealized appreciation (depreciation) ($) | Value, end of period ($) | % ownership, end of period |
| Fidelity Cash Central Fund 5.39% | 7,576,529 | 77,534,512 | 82,719,319 | 117,996 | 275 | - | 2,391,997 | 0.0% |
| Fidelity Securities Lending Cash Central Fund 5.39% | 23,963,865 | 158,593,277 | 158,290,997 | 27,082 | - | - | 24,266,145 | 0.1% |
| Total | 31,540,394 | 236,127,789 | 241,010,316 | 145,078 | 275 | - | 26,658,142 | |
| Valuation Inputs at Reporting Date: | ||||
| Description | Total ($) | Level 1 ($) | Level 2 ($) | Level 3 ($) |
Investments in Securities: | ||||
| Common Stocks | 643,898,696 | 643,898,696 | - | - |
| Money Market Funds | 26,658,142 | 26,658,142 | - | - |
| Total Investments in Securities: | 670,556,838 | 670,556,838 | - | - |
| Statement of Assets and Liabilities | ||||
| As of August 31, 2024 (Unaudited) | ||||
| Assets | ||||
| Investment in securities, at value (including securities loaned of $22,879,763) - See accompanying schedule: | ||||
Unaffiliated issuers (cost $428,287,320) | $ | 643,898,696 | ||
Fidelity Central Funds (cost $26,658,142) | 26,658,142 | |||
| Total Investment in Securities (cost $454,945,462) | $ | 670,556,838 | ||
| Foreign currency held at value (cost $6) | 6 | |||
| Receivable for investments sold | 440,320 | |||
| Receivable for fund shares sold | 329,660 | |||
| Dividends receivable | 2,310,994 | |||
| Distributions receivable from Fidelity Central Funds | 20,436 | |||
| Prepaid expenses | 1,537 | |||
| Other receivables | 106,306 | |||
Total assets | 673,766,097 | |||
| Liabilities | ||||
| Payable for investments purchased | $ | 385,600 | ||
| Payable for fund shares redeemed | 375,792 | |||
| Accrued management fee | 357,448 | |||
| Other payables and accrued expenses | 154,308 | |||
| Collateral on securities loaned | 24,266,145 | |||
| Total liabilities | 25,539,293 | |||
| Net Assets | $ | 648,226,804 | ||
| Net Assets consist of: | ||||
| Paid in capital | $ | 607,789,985 | ||
| Total accumulated earnings (loss) | 40,436,819 | |||
| Net Assets | $ | 648,226,804 | ||
Net Asset Value, offering price and redemption price per share ($648,226,804 ÷ 13,859,244 shares) | $ | 46.77 | ||
| Statement of Operations | ||||
Six months ended August 31, 2024 (Unaudited) | ||||
| Investment Income | ||||
| Dividends | $ | 7,895,532 | ||
| Income from Fidelity Central Funds (including $27,082 from security lending) | 145,078 | |||
| Total income | 8,040,610 | |||
| Expenses | ||||
| Management fee | $ | 2,204,522 | ||
| Custodian fees and expenses | 14,160 | |||
| Independent trustees' fees and expenses | 1,350 | |||
| Registration fees | 27,282 | |||
| Audit fees | 27,737 | |||
| Legal | 864 | |||
| Miscellaneous | 17,770 | |||
| Total expenses before reductions | 2,293,685 | |||
| Expense reductions | (11,985) | |||
| Total expenses after reductions | 2,281,700 | |||
| Net Investment income (loss) | 5,758,910 | |||
| Realized and Unrealized Gain (Loss) | ||||
| Net realized gain (loss) on: | ||||
| Investment Securities: | ||||
| Unaffiliated issuers | 34,851,466 | |||
| Fidelity Central Funds | 275 | |||
| Foreign currency transactions | (1,661) | |||
| Total net realized gain (loss) | 34,850,080 | |||
| Change in net unrealized appreciation (depreciation) on: | ||||
| Investment Securities: | ||||
| Unaffiliated issuers | 25,862,430 | |||
| Assets and liabilities in foreign currencies | (401) | |||
| Total change in net unrealized appreciation (depreciation) | 25,862,029 | |||
| Net gain (loss) | 60,712,109 | |||
| Net increase (decrease) in net assets resulting from operations | $ | 66,471,019 | ||
| Statement of Changes in Net Assets | ||||
Six months ended August 31, 2024 (Unaudited) | Year ended February 29, 2024 | |||
| Increase (Decrease) in Net Assets | ||||
| Operations | ||||
| Net investment income (loss) | $ | 5,758,910 | $ | 10,597,230 |
| Net realized gain (loss) | 34,850,080 | 57,563,145 | ||
| Change in net unrealized appreciation (depreciation) | 25,862,029 | (41,700,396) | ||
| Net increase (decrease) in net assets resulting from operations | 66,471,019 | 26,459,979 | ||
| Distributions to shareholders | - | (10,079,753) | ||
| Share transactions | ||||
| Proceeds from sales of shares | 100,708,791 | 175,332,712 | ||
| Reinvestment of distributions | - | 9,365,908 | ||
| Cost of shares redeemed | (107,195,476) | (425,265,456) | ||
Net increase (decrease) in net assets resulting from share transactions | (6,486,685) | (240,566,836) | ||
| Total increase (decrease) in net assets | 59,984,334 | (224,186,610) | ||
| Net Assets | ||||
| Beginning of period | 588,242,470 | 812,429,080 | ||
| End of period | $ | 648,226,804 | $ | 588,242,470 |
| Other Information | ||||
| Shares | ||||
| Sold | 2,150,867 | 4,251,604 | ||
| Issued in reinvestment of distributions | - | 228,353 | ||
| Redeemed | (2,317,953) | (10,775,156) | ||
| Net increase (decrease) | (167,086) | (6,295,199) | ||
Fidelity® Natural Resources Fund |
Six months ended (Unaudited) August 31, 2024 | Years ended February 28, 2024 A | 2023 | 2022 | 2021 | 2020 A | |||||||
Selected Per-Share Data | ||||||||||||
| Net asset value, beginning of period | $ | 41.94 | $ | 39.98 | $ | 34.22 | $ | 23.21 | $ | 20.59 | $ | 25.55 |
| Income from Investment Operations | ||||||||||||
Net investment income (loss) B,C | .41 | .65 | .83 | .51 | .30 | .30 | ||||||
| Net realized and unrealized gain (loss) | 4.42 | 1.96 | 5.87 | 10.91 | 2.69 | (4.88) | ||||||
| Total from investment operations | 4.83 | 2.61 | 6.70 | 11.42 | 2.99 | (4.58) | ||||||
| Distributions from net investment income | - | (.65) | (.94) | (.41) | (.37) | (.30) | ||||||
| Distributions from net realized gain | - | - | - | - | - | (.08) | ||||||
| Total distributions | - | (.65) | (.94) | (.41) | (.37) | (.38) | ||||||
| Net asset value, end of period | $ | 46.77 | $ | 41.94 | $ | 39.98 | $ | 34.22 | $ | 23.21 | $ | 20.59 |
Total Return D,E | 11.52 % | 6.57% | 19.78% | 49.71% | 14.76% | (18.25)% | ||||||
Ratios to Average Net Assets C,F,G | ||||||||||||
| Expenses before reductions | .70% H | .77% | .77% | .82% | .89% | .84% | ||||||
| Expenses net of fee waivers, if any | .70 % H | .76% | .77% | .81% | .89% | .84% | ||||||
| Expenses net of all reductions | .70% H | .76% | .77% | .81% | .88% | .84% | ||||||
| Net investment income (loss) | 1.76% H | 1.60% | 2.21% | 1.84% | 1.62% | 1.18% | ||||||
| Supplemental Data | ||||||||||||
| Net assets, end of period (000 omitted) | $ | 648,227 | $ | 588,242 | $ | 812,429 | $ | 598,034 | $ | 292,887 | $ | 315,533 |
Portfolio turnover rate I | 56 % H | 50% | 74% | 98% | 90% | 8% |
| Fidelity Central Fund | Investment Manager | Investment Objective | Investment Practices | Expense RatioA |
| Fidelity Money Market Central Funds | Fidelity Management & Research Company LLC (FMR) | Each fund seeks to obtain a high level of current income consistent with the preservation of capital and liquidity. | Short-term Investments | Less than .005% |
| Fidelity Natural Resources Fund | 106,306 |
| Tax cost ($) | Gross unrealized appreciation ($) | Gross unrealized depreciation ($) | Net unrealized appreciation (depreciation)($) | |
Fidelity Environment and Alternative Energy Fund | 406,493,761 | 179,444,511 | (11,362,452) | 168,082,059 |
| Fidelity Natural Resources Fund | 455,452,748 | 224,940,678 | (9,836,588) | 215,104,090 |
| Short-term ($) | Long-term ($) | Total capital loss carryforward ($) | |
Fidelity Environment and Alternative Energy Fund | (92,561,271) | (23,013,764) | (115,575,035) |
| Fidelity Natural Resources Fund | (109,009,339) | (104,002,974) | (213,012,313) |
| Purchases ($) | Sales ($) | |
| Fidelity Environment and Alternative Energy Fund | 96,947,165 | 114,517,746 |
| Fidelity Natural Resources Fund | 180,095,777 | 181,670,611 |
| Maximum Management Fee Rate % | |
| Fidelity Environment and Alternative Energy Fund | .72 |
| Fidelity Natural Resources Fund | .71 |
| Total Management Fee Rate % | |
| Fidelity Environment and Alternative Energy Fund | .67 |
| Fidelity Natural Resources Fund | .67 |
| Amount ($) | |
| Fidelity Environment and Alternative Energy Fund | 2,145 |
| Fidelity Natural Resources Fund | 5,516 |
| Purchases ($) | Sales ($) | Realized Gain (Loss)($) | |
| Fidelity Environment and Alternative Energy Fund | 2,487,759 | 9,011,528 | 2,789,622 |
| Fidelity Natural Resources Fund | 3,816,852 | 13,289,676 | 2,930,624 |
| Amount ($) | |
| Fidelity Environment and Alternative Energy Fund | 458 |
| Fidelity Natural Resources Fund | 553 |
| Total Security Lending Fees Paid to NFS ($) | Security Lending Income From Securities Loaned to NFS ($) | Value of Securities Loaned to NFS at Period End ($) | |
| Fidelity Environment and Alternative Energy Fund | 11,406 | 3,549 | - |
| Fidelity Natural Resources Fund | 2,972 | - | - |
| Amount ($) | |
| Fidelity Environment and Alternative Energy Fund | 10,568 |
| Fidelity Natural Resources Fund | 11,985 |
| A special meeting of shareholders was held on July 16, 2024. The results of votes taken among shareholders on the proposal before them are reported below. Each vote reported represents one dollar of net asset value held on the record date for the meeting. | ||
| Proposal 1 | ||
| To elect a Board of Trustees. | ||
# of Votes | % of Votes | |
| Bettina Doulton | ||
| Affirmative | 50,178,154,296.75 | 92.38 |
| Withheld | 4,136,551,415.53 | 7.62 |
| TOTAL | 54,314,705,712.27 | 100.00 |
| Robert A. Lawrence | ||
| Affirmative | 50,131,321,830.27 | 92.30 |
| Withheld | 4,183,383,882.00 | 7.70 |
| TOTAL | 54,314,705,712.27 | 100.00 |
| Vijay C. Advani | ||
| Affirmative | 50,021,870,319.77 | 92.10 |
| Withheld | 4,292,835,392.50 | 7.90 |
| TOTAL | 54,314,705,712.27 | 100.00 |
| Thomas P. Bostick | ||
| Affirmative | 50,057,248,681.17 | 92.16 |
| Withheld | 4,257,457,031.10 | 7.84 |
| TOTAL | 54,314,705,712.27 | 100.00 |
| Donald F. Donahue | ||
| Affirmative | 49,998,023,290.27 | 92.05 |
| Withheld | 4,316,682,422.00 | 7.95 |
| TOTAL | 54,314,705,712.27 | 100.00 |
| Vicki L. Fuller | ||
| Affirmative | 50,146,578,363.15 | 92.33 |
| Withheld | 4,168,127,349.12 | 7.67 |
| TOTAL | 54,314,705,712.27 | 100.00 |
| Patricia L. Kampling | ||
| Affirmative | 50,227,895,949.71 | 92.48 |
| Withheld | 4,086,809,762.56 | 7.52 |
| TOTAL | 54,314,705,712.27 | 100.00 |
| Thomas A. Kennedy | ||
| Affirmative | 50,080,160,698.34 | 92.20 |
| Withheld | 4,234,545,013.93 | 7.80 |
| TOTAL | 54,314,705,712.27 | 100.00 |
| Oscar Munoz | ||
| Affirmative | 49,879,616,445.58 | 91.83 |
| Withheld | 4,435,089,266.69 | 8.17 |
| TOTAL | 54,314,705,712.27 | 100.00 |
| Karen B. Peetz | ||
| Affirmative | 50,078,105,799.58 | 92.20 |
| Withheld | 4,236,599,912.69 | 7.80 |
| TOTAL | 54,314,705,712.27 | 100.00 |
| David M. Thomas | ||
| Affirmative | 50,013,939,190.36 | 92.08 |
| Withheld | 4,300,766,521.91 | 7.92 |
| TOTAL | 54,314,705,712.27 | 100.00 |
| Susan Tomasky | ||
| Affirmative | 50,109,134,188.50 | 92.26 |
| Withheld | 4,205,571,523.77 | 7.74 |
| TOTAL | 54,314,705,712.27 | 100.00 |
| Michael E. Wiley | ||
| Affirmative | 50,016,526,096.47 | 92.09 |
| Withheld | 4,298,179,615.80 | 7.91 |
| TOTAL | 54,314,705,712.27 | 100.00 |
| Proposal 1 reflects trust-wide proposal and voting results. | ||
 |


Contents
| Common Stocks - 98.6% | |||
| Shares | Value ($) | ||
| Energy Equipment & Services - 15.7% | |||
| Oil & Gas Drilling - 3.3% | |||
| Noble Corp. PLC | 282,800 | 10,788,820 | |
| Odfjell Drilling Ltd. | 1,485,118 | 7,449,640 | |
| Patterson-UTI Energy, Inc. | 197,112 | 1,815,402 | |
| Shelf Drilling Ltd. (a)(b)(c) | 1,347,589 | 2,127,040 | |
| Valaris Ltd. (a) | 790,800 | 48,286,248 | |
| 70,467,150 | |||
| Oil & Gas Equipment & Services - 12.4% | |||
| Halliburton Co. | 596,300 | 18,538,967 | |
| Liberty Energy, Inc. Class A | 573,500 | 11,808,365 | |
| National Energy Services Reunited Corp. (a) | 3,888,920 | 37,916,970 | |
| Oceaneering International, Inc. (a) | 560,630 | 15,131,404 | |
| Schlumberger Ltd. | 2,462,469 | 108,324,011 | |
| Subsea 7 SA | 119,300 | 2,128,258 | |
| TechnipFMC PLC | 2,444,472 | 65,609,628 | |
| Tidewater, Inc. (a) | 57,800 | 5,126,860 | |
| Vallourec SA (a) | 192,800 | 3,087,059 | |
| 267,671,522 | |||
TOTAL ENERGY EQUIPMENT & SERVICES | 338,138,672 | ||
| Independent Power and Renewable Electricity Producers - 1.6% | |||
| Independent Power Producers & Energy Traders - 1.6% | |||
| Vistra Corp. | 413,300 | 35,308,219 | |
| Machinery - 0.8% | |||
| Industrial Machinery & Supplies & Components - 0.8% | |||
| Chart Industries, Inc. (a)(b) | 143,200 | 17,527,680 | |
| Oil, Gas & Consumable Fuels - 80.5% | |||
| Integrated Oil & Gas - 42.2% | |||
| Cenovus Energy, Inc. (Canada) | 6,862,406 | 127,252,273 | |
| Chevron Corp. | 722,817 | 106,940,775 | |
| Exxon Mobil Corp. | 4,554,172 | 537,119,047 | |
| Imperial Oil Ltd. | 388,200 | 29,237,784 | |
| Occidental Petroleum Corp. | 1,382,515 | 78,775,705 | |
| Occidental Petroleum Corp. warrants 8/3/27 (a) | 99,550 | 3,486,241 | |
| Suncor Energy, Inc. | 720,600 | 29,227,170 | |
| 912,038,995 | |||
| Oil & Gas Exploration & Production - 20.3% | |||
| Antero Resources Corp. (a) | 964,400 | 26,029,156 | |
| Canadian Natural Resources Ltd. | 2,869,460 | 103,863,955 | |
| Chord Energy Corp. | 78,652 | 11,674,316 | |
| ConocoPhillips Co. | 583,266 | 66,369,838 | |
| Devon Energy Corp. | 81,900 | 3,667,482 | |
| Diamondback Energy, Inc. | 365,500 | 71,312,705 | |
| EOG Resources, Inc. | 83,664 | 10,777,596 | |
| Hess Corp. | 408,100 | 56,342,286 | |
| Northern Oil & Gas, Inc. | 123,860 | 4,927,151 | |
| Ovintiv, Inc. | 987,900 | 42,311,757 | |
| Permian Resource Corp. Class A | 745,400 | 10,614,496 | |
| Range Resources Corp. | 763,200 | 22,804,416 | |
| SM Energy Co. | 183,300 | 8,363,979 | |
| 439,059,133 | |||
| Oil & Gas Refining & Marketing - 9.7% | |||
| Marathon Petroleum Corp. | 599,392 | 106,164,311 | |
| Phillips 66 Co. | 174,673 | 24,508,369 | |
| Valero Energy Corp. | 529,900 | 77,752,227 | |
| 208,424,907 | |||
| Oil & Gas Storage & Transportation - 8.3% | |||
| Cheniere Energy, Inc. | 508,012 | 94,114,303 | |
| Energy Transfer LP | 4,304,800 | 69,307,280 | |
| Golar LNG Ltd. | 83,533 | 2,780,814 | |
| Targa Resources Corp. | 79,400 | 11,663,860 | |
| 177,866,257 | |||
TOTAL OIL, GAS & CONSUMABLE FUELS | 1,737,389,292 | ||
| TOTAL COMMON STOCKS (Cost $1,169,146,738) | 2,128,363,863 | ||
| Money Market Funds - 0.9% | |||
| Shares | Value ($) | ||
| Fidelity Cash Central Fund 5.39% (d) | 1,488,016 | 1,488,313 | |
| Fidelity Securities Lending Cash Central Fund 5.39% (d)(e) | 17,925,966 | 17,927,759 | |
| TOTAL MONEY MARKET FUNDS (Cost $19,416,072) | 19,416,072 | ||
| TOTAL INVESTMENT IN SECURITIES - 99.5% (Cost $1,188,562,810) | 2,147,779,935 |
NET OTHER ASSETS (LIABILITIES) - 0.5% | 11,839,741 |
| NET ASSETS - 100.0% | 2,159,619,676 |
| (a) | Non-income producing |
| (b) | Security or a portion of the security is on loan at period end. |
| (c) | Security exempt from registration under Rule 144A of the Securities Act of 1933. These securities may be resold in transactions exempt from registration, normally to qualified institutional buyers. At the end of the period, the value of these securities amounted to $2,127,040 or 0.1% of net assets. |
| (d) | Affiliated fund that is generally available only to investment companies and other accounts managed by Fidelity Investments. The rate quoted is the annualized seven-day yield of the fund at period end. A complete unaudited listing of the fund's holdings as of its most recent quarter end is available upon request. In addition, each Fidelity Central Fund's financial statements are available on the SEC's website or upon request. |
| (e) | Investment made with cash collateral received from securities on loan. |
| Affiliate | Value, beginning of period ($) | Purchases ($) | Sales Proceeds ($) | Dividend Income ($) | Realized Gain (loss) ($) | Change in Unrealized appreciation (depreciation) ($) | Value, end of period ($) | % ownership, end of period |
| Fidelity Cash Central Fund 5.39% | 392,136 | 119,667,369 | 118,571,436 | 128,347 | 244 | - | 1,488,313 | 0.0% |
| Fidelity Securities Lending Cash Central Fund 5.39% | 29,770,054 | 515,825,467 | 527,667,762 | 35,421 | - | - | 17,927,759 | 0.1% |
| Total | 30,162,190 | 635,492,836 | 646,239,198 | 163,768 | 244 | - | 19,416,072 | |
| Valuation Inputs at Reporting Date: | ||||
| Description | Total ($) | Level 1 ($) | Level 2 ($) | Level 3 ($) |
Investments in Securities: | ||||
| Common Stocks | 2,128,363,863 | 2,128,363,863 | - | - |
| Money Market Funds | 19,416,072 | 19,416,072 | - | - |
| Total Investments in Securities: | 2,147,779,935 | 2,147,779,935 | - | - |
| Statement of Assets and Liabilities | ||||
| As of August 31, 2024 (Unaudited) | ||||
| Assets | ||||
| Investment in securities, at value (including securities loaned of $17,309,226) - See accompanying schedule: | ||||
Unaffiliated issuers (cost $1,169,146,738) | $ | 2,128,363,863 | ||
Fidelity Central Funds (cost $19,416,072) | 19,416,072 | |||
| Total Investment in Securities (cost $1,188,562,810) | $ | 2,147,779,935 | ||
| Receivable for investments sold | 21,717,217 | |||
| Receivable for fund shares sold | 2,616,534 | |||
| Dividends receivable | 7,929,325 | |||
| Distributions receivable from Fidelity Central Funds | 17,561 | |||
| Prepaid expenses | 4,412 | |||
| Other receivables | 489,858 | |||
Total assets | 2,180,554,842 | |||
| Liabilities | ||||
| Payable for fund shares redeemed | $ | 1,349,314 | ||
| Accrued management fee | 1,141,055 | |||
| Other payables and accrued expenses | 517,646 | |||
| Collateral on securities loaned | 17,927,151 | |||
| Total liabilities | 20,935,166 | |||
| Net Assets | $ | 2,159,619,676 | ||
| Net Assets consist of: | ||||
| Paid in capital | $ | 2,055,851,052 | ||
| Total accumulated earnings (loss) | 103,768,624 | |||
| Net Assets | $ | 2,159,619,676 | ||
Net Asset Value, offering price and redemption price per share ($2,159,619,676 ÷ 35,279,714 shares) | $ | 61.21 | ||
| Statement of Operations | ||||
Six months ended August 31, 2024 (Unaudited) | ||||
| Investment Income | ||||
| Dividends | $ | 29,335,314 | ||
| Income from Fidelity Central Funds (including $35,421 from security lending) | 163,768 | |||
| Total income | 29,499,082 | |||
| Expenses | ||||
| Management fee | $ | 7,303,942 | ||
| Custodian fees and expenses | 28,171 | |||
| Independent trustees' fees and expenses | 4,770 | |||
| Registration fees | 60,644 | |||
| Audit fees | 38,708 | |||
| Legal | 4,404 | |||
| Interest | 31,294 | |||
| Miscellaneous | 53,893 | |||
| Total expenses before reductions | 7,525,826 | |||
| Expense reductions | (43,233) | |||
| Total expenses after reductions | 7,482,593 | |||
| Net Investment income (loss) | 22,016,489 | |||
| Realized and Unrealized Gain (Loss) | ||||
| Net realized gain (loss) on: | ||||
| Investment Securities: | ||||
| Unaffiliated issuers | 83,940,609 | |||
| Fidelity Central Funds | 244 | |||
| Foreign currency transactions | 9,451 | |||
| Total net realized gain (loss) | 83,950,304 | |||
| Change in net unrealized appreciation (depreciation) on: | ||||
| Investment Securities: | ||||
| Unaffiliated issuers | 31,381,455 | |||
| Assets and liabilities in foreign currencies | 9 | |||
| Total change in net unrealized appreciation (depreciation) | 31,381,464 | |||
| Net gain (loss) | 115,331,768 | |||
| Net increase (decrease) in net assets resulting from operations | $ | 137,348,257 | ||
| Statement of Changes in Net Assets | ||||
Six months ended August 31, 2024 (Unaudited) | Year ended February 29, 2024 | |||
| Increase (Decrease) in Net Assets | ||||
| Operations | ||||
| Net investment income (loss) | $ | 22,016,489 | $ | 47,706,355 |
| Net realized gain (loss) | 83,950,304 | 257,847,130 | ||
| Change in net unrealized appreciation (depreciation) | 31,381,464 | (191,126,185) | ||
| Net increase (decrease) in net assets resulting from operations | 137,348,257 | 114,427,300 | ||
| Distributions to shareholders | (2,439,681) | (42,949,687) | ||
| Share transactions | ||||
| Proceeds from sales of shares | 336,857,915 | 545,563,294 | ||
| Reinvestment of distributions | 2,247,605 | 39,788,327 | ||
| Cost of shares redeemed | (445,956,575) | (1,365,976,841) | ||
Net increase (decrease) in net assets resulting from share transactions | (106,851,055) | (780,625,220) | ||
| Total increase (decrease) in net assets | 28,057,521 | (709,147,607) | ||
| Net Assets | ||||
| Beginning of period | 2,131,562,155 | 2,840,709,762 | ||
| End of period | $ | 2,159,619,676 | $ | 2,131,562,155 |
| Other Information | ||||
| Shares | ||||
| Sold | 5,334,901 | 9,594,074 | ||
| Issued in reinvestment of distributions | 34,462 | 711,141 | ||
| Redeemed | (7,176,642) | (24,924,355) | ||
| Net increase (decrease) | (1,807,279) | (14,619,140) | ||
Energy Portfolio |
Six months ended (Unaudited) August 31, 2024 | Years ended February 28, 2024 A | 2023 | 2022 | 2021 | 2020 A | |||||||
Selected Per-Share Data | ||||||||||||
| Net asset value, beginning of period | $ | 57.47 | $ | 54.94 | $ | 45.24 | $ | 29.25 | $ | 26.79 | $ | 37.50 |
| Income from Investment Operations | ||||||||||||
Net investment income (loss) B,C | .60 | 1.12 | 1.46 | .96 | .99 D | .71 | ||||||
| Net realized and unrealized gain (loss) | 3.21 | 2.51 | 9.64 | 15.82 | 2.27 | (10.76) | ||||||
| Total from investment operations | 3.81 | 3.63 | 11.10 | 16.78 | 3.26 | (10.05) | ||||||
| Distributions from net investment income | (.07) | (1.10) | (1.40) | (.79) | (.80) | (.64) | ||||||
| Distributions from net realized gain | - | - | - | - | - | (.02) | ||||||
| Total distributions | (.07) | (1.10) | (1.40) | (.79) | (.80) | (.66) | ||||||
| Net asset value, end of period | $ | 61.21 | $ | 57.47 | $ | 54.94 | $ | 45.24 | $ | 29.25 | $ | 26.79 |
Total Return E,F | 6.61 % | 6.66% | 24.63% | 58.37% | 13.03% | (27.24)% | ||||||
Ratios to Average Net Assets C,G,H | ||||||||||||
| Expenses before reductions | .66% I | .74% | .73% | .77% | .85% | .81% | ||||||
| Expenses net of fee waivers, if any | .66 % I | .73% | .73% | .77% | .85% | .81% | ||||||
| Expenses net of all reductions | .66% I | .73% | .73% | .77% | .84% | .80% | ||||||
| Net investment income (loss) | 1.93% I | 2.00% | 2.75% | 2.79% | 4.50% D | 2.00% | ||||||
| Supplemental Data | ||||||||||||
| Net assets, end of period (000 omitted) | $ | 2,159,620 | $ | 2,131,562 | $ | 2,840,710 | $ | 2,407,641 | $ | 980,644 | $ | 676,312 |
Portfolio turnover rate J | 19 % I | 17% | 43% | 56% K | 31% | 79% |
| Fidelity Central Fund | Investment Manager | Investment Objective | Investment Practices | Expense RatioA |
| Fidelity Money Market Central Funds | Fidelity Management & Research Company LLC (FMR) | Each fund seeks to obtain a high level of current income consistent with the preservation of capital and liquidity. | Short-term Investments | Less than .005% |
| Energy Portfolio | $436,405 |
| Gross unrealized appreciation | $978,232,705 |
| Gross unrealized depreciation | (22,595,564) |
| Net unrealized appreciation (depreciation) | $955,637,141 |
| Tax cost | $1,192,142,794 |
Short-term | $(484,417,665) |
Long-term | (467,923,776) |
| Total capital loss carryforward | $(952,341,441) |
| Purchases ($) | Sales ($) | |
| Energy Portfolio | 213,656,890 | 326,670,838 |
| Maximum Management Fee Rate % | |
| Energy Portfolio | .70 |
| Total Management Fee Rate % | |
| Energy Portfolio | .64 |
| Amount ($) | |
| Energy Portfolio | 8,104 |
| Borrower or Lender | Average Loan Balance ($) | Weighted Average Interest Rate | Interest Expense ($) | |
| Energy Portfolio | Borrower | 4,265,289 | 5.57% | 29,686 |
| Purchases ($) | Sales ($) | Realized Gain (Loss)($) | |
| Energy Portfolio | 18,705,813 | 18,090,720 | 3,628,020 |
| Amount ($) | |
| Energy Portfolio | 1,962 |
| Total Security Lending Fees Paid to NFS ($) | Security Lending Income From Securities Loaned to NFS ($) | Value of Securities Loaned to NFS at Period End ($) | |
| Energy Portfolio | 3,751 | - | - |
| Average Loan Balance ($) | Weighted Average Interest Rate | Interest Expense ($) | |
| Energy Portfolio | 993,000 | 5.83% | 1,608 |
| A special meeting of shareholders was held on July 16, 2024. The results of votes taken among shareholders on the proposal before them are reported below. Each vote reported represents one dollar of net asset value held on the record date for the meeting. | ||
| Proposal 1 | ||
| To elect a Board of Trustees. | ||
# of Votes | % of Votes | |
| Bettina Doulton | ||
| Affirmative | 50,178,154,296.75 | 92.38 |
| Withheld | 4,136,551,415.53 | 7.62 |
| TOTAL | 54,314,705,712.27 | 100.00 |
| Robert A. Lawrence | ||
| Affirmative | 50,131,321,830.27 | 92.30 |
| Withheld | 4,183,383,882.00 | 7.70 |
| TOTAL | 54,314,705,712.27 | 100.00 |
| Vijay C. Advani | ||
| Affirmative | 50,021,870,319.77 | 92.10 |
| Withheld | 4,292,835,392.50 | 7.90 |
| TOTAL | 54,314,705,712.27 | 100.00 |
| Thomas P. Bostick | ||
| Affirmative | 50,057,248,681.17 | 92.16 |
| Withheld | 4,257,457,031.10 | 7.84 |
| TOTAL | 54,314,705,712.27 | 100.00 |
| Donald F. Donahue | ||
| Affirmative | 49,998,023,290.27 | 92.05 |
| Withheld | 4,316,682,422.00 | 7.95 |
| TOTAL | 54,314,705,712.27 | 100.00 |
| Vicki L. Fuller | ||
| Affirmative | 50,146,578,363.15 | 92.33 |
| Withheld | 4,168,127,349.12 | 7.67 |
| TOTAL | 54,314,705,712.27 | 100.00 |
| Patricia L. Kampling | ||
| Affirmative | 50,227,895,949.71 | 92.48 |
| Withheld | 4,086,809,762.56 | 7.52 |
| TOTAL | 54,314,705,712.27 | 100.00 |
| Thomas A. Kennedy | ||
| Affirmative | 50,080,160,698.34 | 92.20 |
| Withheld | 4,234,545,013.93 | 7.80 |
| TOTAL | 54,314,705,712.27 | 100.00 |
| Oscar Munoz | ||
| Affirmative | 49,879,616,445.58 | 91.83 |
| Withheld | 4,435,089,266.69 | 8.17 |
| TOTAL | 54,314,705,712.27 | 100.00 |
| Karen B. Peetz | ||
| Affirmative | 50,078,105,799.58 | 92.20 |
| Withheld | 4,236,599,912.69 | 7.80 |
| TOTAL | 54,314,705,712.27 | 100.00 |
| David M. Thomas | ||
| Affirmative | 50,013,939,190.36 | 92.08 |
| Withheld | 4,300,766,521.91 | 7.92 |
| TOTAL | 54,314,705,712.27 | 100.00 |
| Susan Tomasky | ||
| Affirmative | 50,109,134,188.50 | 92.26 |
| Withheld | 4,205,571,523.77 | 7.74 |
| TOTAL | 54,314,705,712.27 | 100.00 |
| Michael E. Wiley | ||
| Affirmative | 50,016,526,096.47 | 92.09 |
| Withheld | 4,298,179,615.80 | 7.91 |
| TOTAL | 54,314,705,712.27 | 100.00 |
| Proposal 1 reflects trust-wide proposal and voting results. | ||
 |


Contents
| Common Stocks - 98.9% | |||
| Shares | Value ($) | ||
| Electric Utilities - 62.1% | |||
| Electric Utilities - 62.1% | |||
| American Electric Power Co., Inc. | 836,127 | 83,846,816 | |
| Constellation Energy Corp. | 375,522 | 73,865,177 | |
| Edison International | 1,055,321 | 91,844,587 | |
| Entergy Corp. | 618,263 | 74,618,161 | |
| Evergy, Inc. | 98,100 | 5,801,634 | |
| Eversource Energy | 1,027,299 | 69,373,501 | |
| FirstEnergy Corp. | 1,463,245 | 64,265,720 | |
| Hawaiian Electric Industries, Inc. (a) | 707,685 | 7,593,460 | |
| NextEra Energy, Inc. | 2,474,950 | 199,258,229 | |
| NRG Energy, Inc. | 399,518 | 33,963,025 | |
| PG&E Corp. | 4,848,492 | 95,515,292 | |
| Pinnacle West Capital Corp. (a) | 157,065 | 13,746,329 | |
| PPL Corp. | 1,737,706 | 55,450,198 | |
| Southern Co. | 518,695 | 44,815,248 | |
| Xcel Energy, Inc. | 684,179 | 41,892,280 | |
| 955,849,657 | |||
| Gas Utilities - 2.1% | |||
| Gas Utilities - 2.1% | |||
| Southwest Gas Holdings, Inc. | 190,859 | 13,879,266 | |
| UGI Corp. | 739,177 | 18,412,899 | |
| 32,292,165 | |||
| Independent Power and Renewable Electricity Producers - 9.5% | |||
| Independent Power Producers & Energy Traders - 7.4% | |||
| Talen Energy Corp. (b) | 194,400 | 29,084,184 | |
| The AES Corp. | 1,435,133 | 24,583,828 | |
| Vistra Corp. | 696,164 | 59,473,291 | |
| 113,141,303 | |||
| Renewable Electricity - 2.1% | |||
| Clearway Energy, Inc. Class A | 166,124 | 4,463,752 | |
| NextEra Energy Partners LP | 1,118,569 | 28,020,153 | |
| 32,483,905 | |||
TOTAL INDEPENDENT POWER AND RENEWABLE ELECTRICITY PRODUCERS | 145,625,208 | ||
| Multi-Utilities - 25.2% | |||
| Multi-Utilities - 25.2% | |||
| Ameren Corp. | 487,395 | 40,214,961 | |
| CenterPoint Energy, Inc. | 1,659,001 | 45,290,727 | |
| Consolidated Edison, Inc. | 293,431 | 29,800,852 | |
| Dominion Energy, Inc. | 636,700 | 35,591,530 | |
| NiSource, Inc. | 1,424,976 | 47,109,707 | |
| Public Service Enterprise Group, Inc. | 1,002,108 | 80,920,221 | |
| Sempra | 1,333,008 | 109,546,597 | |
| 388,474,595 | |||
| TOTAL COMMON STOCKS (Cost $1,118,213,148) | 1,522,241,625 | ||
| Money Market Funds - 2.1% | |||
| Shares | Value ($) | ||
| Fidelity Cash Central Fund 5.39% (c) | 13,134,035 | 13,136,662 | |
| Fidelity Securities Lending Cash Central Fund 5.39% (c)(d) | 18,170,833 | 18,172,650 | |
| TOTAL MONEY MARKET FUNDS (Cost $31,309,312) | 31,309,312 | ||
| TOTAL INVESTMENT IN SECURITIES - 101.0% (Cost $1,149,522,460) | 1,553,550,937 |
NET OTHER ASSETS (LIABILITIES) - (1.0)% | (14,794,288) |
| NET ASSETS - 100.0% | 1,538,756,649 |
| (a) | Security or a portion of the security is on loan at period end. |
| (b) | Non-income producing |
| (c) | Affiliated fund that is generally available only to investment companies and other accounts managed by Fidelity Investments. The rate quoted is the annualized seven-day yield of the fund at period end. A complete unaudited listing of the fund's holdings as of its most recent quarter end is available upon request. In addition, each Fidelity Central Fund's financial statements are available on the SEC's website or upon request. |
| (d) | Investment made with cash collateral received from securities on loan. |
| Affiliate | Value, beginning of period ($) | Purchases ($) | Sales Proceeds ($) | Dividend Income ($) | Realized Gain (loss) ($) | Change in Unrealized appreciation (depreciation) ($) | Value, end of period ($) | % ownership, end of period |
| Fidelity Cash Central Fund 5.39% | 4,516,166 | 255,630,998 | 247,009,890 | 505,920 | (612) | - | 13,136,662 | 0.0% |
| Fidelity Securities Lending Cash Central Fund 5.39% | 43,358,278 | 208,029,481 | 233,215,109 | 9,665 | - | - | 18,172,650 | 0.1% |
| Total | 47,874,444 | 463,660,479 | 480,224,999 | 515,585 | (612) | - | 31,309,312 | |
| Valuation Inputs at Reporting Date: | ||||
| Description | Total ($) | Level 1 ($) | Level 2 ($) | Level 3 ($) |
Investments in Securities: | ||||
| Common Stocks | 1,522,241,625 | 1,522,241,625 | - | - |
| Money Market Funds | 31,309,312 | 31,309,312 | - | - |
| Total Investments in Securities: | 1,553,550,937 | 1,553,550,937 | - | - |
| Statement of Assets and Liabilities | ||||
| As of August 31, 2024 (Unaudited) | ||||
| Assets | ||||
| Investment in securities, at value (including securities loaned of $17,701,662) - See accompanying schedule: | ||||
Unaffiliated issuers (cost $1,118,213,148) | $ | 1,522,241,625 | ||
Fidelity Central Funds (cost $31,309,312) | 31,309,312 | |||
| Total Investment in Securities (cost $1,149,522,460) | $ | 1,553,550,937 | ||
| Receivable for investments sold | 195,062 | |||
| Receivable for fund shares sold | 3,056,741 | |||
| Dividends receivable | 5,228,082 | |||
| Distributions receivable from Fidelity Central Funds | 61,529 | |||
| Prepaid expenses | 2,493 | |||
Total assets | 1,562,094,844 | |||
| Liabilities | ||||
| Payable for investments purchased | $ | 3,222,781 | ||
| Payable for fund shares redeemed | 1,093,659 | |||
| Accrued management fee | 799,416 | |||
| Other payables and accrued expenses | 49,689 | |||
| Collateral on securities loaned | 18,172,650 | |||
| Total liabilities | 23,338,195 | |||
| Net Assets | $ | 1,538,756,649 | ||
| Net Assets consist of: | ||||
| Paid in capital | $ | 1,118,246,044 | ||
| Total accumulated earnings (loss) | 420,510,605 | |||
| Net Assets | $ | 1,538,756,649 | ||
Net Asset Value, offering price and redemption price per share ($1,538,756,649 ÷ 12,990,479 shares) | $ | 118.45 | ||
| Statement of Operations | ||||
Six months ended August 31, 2024 (Unaudited) | ||||
| Investment Income | ||||
| Dividends | $ | 21,763,963 | ||
| Income from Fidelity Central Funds (including $9,665 from security lending) | 515,585 | |||
| Total income | 22,279,548 | |||
| Expenses | ||||
| Management fee | $ | 4,391,019 | ||
| Custodian fees and expenses | 5,955 | |||
| Independent trustees' fees and expenses | 2,651 | |||
| Registration fees | 47,489 | |||
| Audit fees | 23,279 | |||
| Legal | 307 | |||
| Miscellaneous | 27,947 | |||
| Total expenses before reductions | 4,498,647 | |||
| Expense reductions | (23,566) | |||
| Total expenses after reductions | 4,475,081 | |||
| Net Investment income (loss) | 17,804,467 | |||
| Realized and Unrealized Gain (Loss) | ||||
| Net realized gain (loss) on: | ||||
| Investment Securities: | ||||
| Unaffiliated issuers | 18,760,906 | |||
| Fidelity Central Funds | (612) | |||
| Foreign currency transactions | 6,800 | |||
| Total net realized gain (loss) | 18,767,094 | |||
| Change in net unrealized appreciation (depreciation) on: | ||||
| Investment Securities: | ||||
| Unaffiliated issuers | 243,950,525 | |||
| Assets and liabilities in foreign currencies | 666 | |||
| Total change in net unrealized appreciation (depreciation) | 243,951,191 | |||
| Net gain (loss) | 262,718,285 | |||
| Net increase (decrease) in net assets resulting from operations | $ | 280,522,752 | ||
| Statement of Changes in Net Assets | ||||
Six months ended August 31, 2024 (Unaudited) | Year ended February 29, 2024 | |||
| Increase (Decrease) in Net Assets | ||||
| Operations | ||||
| Net investment income (loss) | $ | 17,804,467 | $ | 28,798,168 |
| Net realized gain (loss) | 18,767,094 | 38,799,103 | ||
| Change in net unrealized appreciation (depreciation) | 243,951,191 | 4,858,933 | ||
| Net increase (decrease) in net assets resulting from operations | 280,522,752 | 72,456,204 | ||
| Distributions to shareholders | (51,939,004) | (46,638,898) | ||
| Share transactions | ||||
| Proceeds from sales of shares | 294,686,051 | 299,175,604 | ||
| Reinvestment of distributions | 47,008,999 | 42,202,004 | ||
| Cost of shares redeemed | (189,555,680) | (561,927,330) | ||
Net increase (decrease) in net assets resulting from share transactions | 152,139,370 | (220,549,722) | ||
| Total increase (decrease) in net assets | 380,723,118 | (194,732,416) | ||
| Net Assets | ||||
| Beginning of period | 1,158,033,531 | 1,352,765,947 | ||
| End of period | $ | 1,538,756,649 | $ | 1,158,033,531 |
| Other Information | ||||
| Shares | ||||
| Sold | 2,648,189 | 3,004,338 | ||
| Issued in reinvestment of distributions | 453,193 | 425,669 | ||
| Redeemed | (1,743,355) | (5,699,536) | ||
| Net increase (decrease) | 1,358,027 | (2,269,529) | ||
Utilities Portfolio |
Six months ended (Unaudited) August 31, 2024 | Years ended February 28, 2024 A | 2023 | 2022 | 2021 | 2020 A | |||||||
Selected Per-Share Data | ||||||||||||
| Net asset value, beginning of period | $ | 99.55 | $ | 97.31 | $ | 100.38 | $ | 86.55 | $ | 91.20 | $ | 85.32 |
| Income from Investment Operations | ||||||||||||
Net investment income (loss) B,C | 1.46 | 2.21 | 1.82 | 1.92 | 1.61 | 2.09 | ||||||
| Net realized and unrealized gain (loss) | 21.88 | 3.57 | .04 | 14.72 | (1.81) | 5.99 | ||||||
| Total from investment operations | 23.34 | 5.78 | 1.86 | 16.64 | (.20) | 8.08 | ||||||
| Distributions from net investment income | (1.11) | (2.13) | (1.75) | (1.71) | (2.12) | (1.94) | ||||||
| Distributions from net realized gain | (3.33) | (1.42) | (3.18) | (1.10) | (2.34) | (.26) | ||||||
| Total distributions | (4.44) | (3.54) D | (4.93) | (2.81) | (4.45) D | (2.20) | ||||||
| Net asset value, end of period | $ | 118.45 | $ | 99.55 | $ | 97.31 | $ | 100.38 | $ | 86.55 | $ | 91.20 |
Total Return E,F | 24.11 % | 6.01% | 1.46% | 19.19% | (.05)% | 9.34% | ||||||
Ratios to Average Net Assets C,G,H | ||||||||||||
| Expenses before reductions | .68% I | .74% | .74% | .74% | .76% | .75% | ||||||
| Expenses net of fee waivers, if any | .67 % I | .73% | .74% | .73% | .76% | .75% | ||||||
| Expenses net of all reductions | .67% I | .73% | .74% | .73% | .75% | .74% | ||||||
| Net investment income (loss) | 2.67% I | 2.23% | 1.74% | 1.96% | 1.88% | 2.25% | ||||||
| Supplemental Data | ||||||||||||
| Net assets, end of period (000 omitted) | $ | 1,538,757 | $ | 1,158,034 | $ | 1,352,766 | $ | 1,072,056 | $ | 896,285 | $ | 1,247,009 |
Portfolio turnover rate J | 55 % I | 83% | 53% | 37% | 64% | 65% K |
| Fidelity Central Fund | Investment Manager | Investment Objective | Investment Practices | Expense RatioA |
| Fidelity Money Market Central Funds | Fidelity Management & Research Company LLC (FMR) | Each fund seeks to obtain a high level of current income consistent with the preservation of capital and liquidity. | Short-term Investments | Less than .005% |
| Gross unrealized appreciation | $421,922,292 |
| Gross unrealized depreciation | (24,445,553) |
| Net unrealized appreciation (depreciation) | $397,476,739 |
| Tax cost | $1,156,074,198 |
| Purchases ($) | Sales ($) | |
| Utilities Portfolio | 500,215,930 | 362,526,968 |
| Maximum Management Fee Rate % | |
| Utilities Portfolio | .69 |
| Total Management Fee Rate % | |
| Utilities Portfolio | .66 |
| Amount ($) | |
| Utilities Portfolio | 7,699 |
| Purchases ($) | Sales ($) | Realized Gain (Loss)($) | |
| Utilities Portfolio | 8,094,599 | 24,687,029 | (614,327) |
| Amount ($) | |
| Utilities Portfolio | 1,081 |
| Total Security Lending Fees Paid to NFS ($) | Security Lending Income From Securities Loaned to NFS ($) | Value of Securities Loaned to NFS at Period End ($) | |
| Utilities Portfolio | 1,003 | - | - |
| A special meeting of shareholders was held on July 16, 2024. The results of votes taken among shareholders on the proposal before them are reported below. Each vote reported represents one dollar of net asset value held on the record date for the meeting. | ||
| Proposal 1 | ||
| To elect a Board of Trustees. | ||
# of Votes | % of Votes | |
| Bettina Doulton | ||
| Affirmative | 50,178,154,296.75 | 92.38 |
| Withheld | 4,136,551,415.53 | 7.62 |
| TOTAL | 54,314,705,712.27 | 100.00 |
| Robert A. Lawrence | ||
| Affirmative | 50,131,321,830.27 | 92.30 |
| Withheld | 4,183,383,882.00 | 7.70 |
| TOTAL | 54,314,705,712.27 | 100.00 |
| Vijay C. Advani | ||
| Affirmative | 50,021,870,319.77 | 92.10 |
| Withheld | 4,292,835,392.50 | 7.90 |
| TOTAL | 54,314,705,712.27 | 100.00 |
| Thomas P. Bostick | ||
| Affirmative | 50,057,248,681.17 | 92.16 |
| Withheld | 4,257,457,031.10 | 7.84 |
| TOTAL | 54,314,705,712.27 | 100.00 |
| Donald F. Donahue | ||
| Affirmative | 49,998,023,290.27 | 92.05 |
| Withheld | 4,316,682,422.00 | 7.95 |
| TOTAL | 54,314,705,712.27 | 100.00 |
| Vicki L. Fuller | ||
| Affirmative | 50,146,578,363.15 | 92.33 |
| Withheld | 4,168,127,349.12 | 7.67 |
| TOTAL | 54,314,705,712.27 | 100.00 |
| Patricia L. Kampling | ||
| Affirmative | 50,227,895,949.71 | 92.48 |
| Withheld | 4,086,809,762.56 | 7.52 |
| TOTAL | 54,314,705,712.27 | 100.00 |
| Thomas A. Kennedy | ||
| Affirmative | 50,080,160,698.34 | 92.20 |
| Withheld | 4,234,545,013.93 | 7.80 |
| TOTAL | 54,314,705,712.27 | 100.00 |
| Oscar Munoz | ||
| Affirmative | 49,879,616,445.58 | 91.83 |
| Withheld | 4,435,089,266.69 | 8.17 |
| TOTAL | 54,314,705,712.27 | 100.00 |
| Karen B. Peetz | ||
| Affirmative | 50,078,105,799.58 | 92.20 |
| Withheld | 4,236,599,912.69 | 7.80 |
| TOTAL | 54,314,705,712.27 | 100.00 |
| David M. Thomas | ||
| Affirmative | 50,013,939,190.36 | 92.08 |
| Withheld | 4,300,766,521.91 | 7.92 |
| TOTAL | 54,314,705,712.27 | 100.00 |
| Susan Tomasky | ||
| Affirmative | 50,109,134,188.50 | 92.26 |
| Withheld | 4,205,571,523.77 | 7.74 |
| TOTAL | 54,314,705,712.27 | 100.00 |
| Michael E. Wiley | ||
| Affirmative | 50,016,526,096.47 | 92.09 |
| Withheld | 4,298,179,615.80 | 7.91 |
| TOTAL | 54,314,705,712.27 | 100.00 |
| Proposal 1 reflects trust-wide proposal and voting results. | ||
 |
Item 8.
Changes in and Disagreements with Accountants for Open-End Management Investment Companies
See Item 7.
Item 9.
Proxy Disclosures for Open-End Management Investment Companies
See Item 7.
Item 10.
Remuneration Paid to Directors, Officers, and Others of Open-End Management Investment Companies
See Item 7.
Item 11.
Statement Regarding Basis for Approval of Investment Advisory Contract
See Item 7.
Item 12.
Disclosure of Proxy Voting Policies and Procedures for Closed-End Management Investment Companies
Not applicable.
Item 13.
Portfolio Managers of Closed-End Management Investment Companies
Not applicable.
Item 14.
Purchases of Equity Securities by Closed-End Management Investment Company and Affiliated Purchasers
Not applicable.
Item 15.
Submission of Matters to a Vote of Security Holders
There were no material changes to the procedures by which shareholders may recommend nominees to the Fidelity Select Portfolios’s Board of Trustees.
Item 16.
Controls and Procedures
(a)(i) The President and Treasurer and the Chief Financial Officer have concluded that the Fidelity Select Portfolios’s (the “Trust”) disclosure controls and procedures (as defined in Rule 30a-3(c) under the Investment Company Act) provide reasonable assurances that material information relating to the Trust is made known to them by the appropriate persons, based on their evaluation of these controls and procedures as of a date within 90 days of the filing date of this report.
(a)(ii) There was no change in the Trust’s internal control over financial reporting (as defined in Rule 30a-3(d) under the Investment Company Act) that occurred during the period covered by this report that has materially affected, or is reasonably likely to materially affect, the Trust’s internal control over financial reporting.
Item 17.
Disclosure of Securities Lending Activities for Closed-End Management Investment Companies
Not applicable.
Item 18.
Recovery of Erroneously Awarded Compensation
(a)
Not applicable.
(b)
Not applicable.
Item 19.
Exhibits
(a) | (1) | Not applicable. |
(a) | (2) | |
(a) | (3) | Not applicable. |
(b) |
SIGNATURES
Pursuant to the requirements of the Securities Exchange Act of 1934 and the Investment Company Act of 1940, the registrant has duly caused this report to be signed on its behalf by the undersigned, thereunto duly authorized.
Fidelity Select Portfolios
By: | /s/Stacie M. Smith |
Stacie M. Smith | |
President and Treasurer (Principal Executive Officer) | |
Date: | October 23, 2024 |
Pursuant to the requirements of the Securities Exchange Act of 1934 and the Investment Company Act of 1940, this report has been signed below by the following persons on behalf of the registrant and in the capacities and on the dates indicated.
By: | /s/Stacie M. Smith |
Stacie M. Smith | |
President and Treasurer (Principal Executive Officer) | |
Date: | October 23, 2024 |
By: | /s/John J. Burke III |
John J. Burke III | |
Chief Financial Officer (Principal Financial Officer) | |
Date: | October 23, 2024 |